Prehistoric avian, mammalian and H.sapiens footprint-tracks ...
627
Prehistoric avian, mammalian and H.sapiens footprint-tracks from intertidal sediments as evidence of human palaeoecology PhD in Archaeology Department of Archaeology Kirsten Barr August 2018
-
Upload
khangminh22 -
Category
Documents
-
view
0 -
download
0
Transcript of Prehistoric avian, mammalian and H.sapiens footprint-tracks ...
Prehistoric avian, mammalian and
H.sapiens footprint-tracks from
intertidal sediments as evidence of
human palaeoecology
PhD in Archaeology
Department of Archaeology
Kirsten Barr
August 2018


Declaration:
I confirm that this is my own work and the use of all material from other sources has been
properly and fully acknowledged
Kirsten Barr

Abstract
Footprint-tracks can provide information about the footprint maker, including the
species, age, sex, and height. Combined with other datasets, this can contribute to our
interpretation of animal exploitation, population dynamics, seasonality and site usage.
The study focuses on the Late Mesolithic intertidal site of Goldcliff East, Severn
Estuary.
The formation of human footprints upon clayey silt sediment was studied. 177
participants were involved, aged between 3 and 72 years old. The relationship between
footprint length, footprint width, age, sex, stature and weight was explored. The
formation and identifying features of the footprints of 21 species of bird were also
investigated.
856 Mesolithic footprint-tracks were recorded between 2001-2017. 342 were human,
270 bird and 67 mammal. A further 177 were possibly human, poorly eroded mammal
or localised sediment disturbance. Eight species of bird were identified in this
assemblage; 46% were common crane (Grus grus). The footprint-track trails of nine
people were identified and combined with a further 12 from Scales’ (2006) study.
Stature equations suggest that the average height of an adult was 166.5cm. Sex could
only be determined as male in footprint-track trails with footprints over 30cm. It was
not possible to identify a difference in foot length between adult females and children
over 10 years old.
Footprints from Site M, N and S were made by humans walking north-east, and south-
west, taking them towards and away from Goldcliff Island and a palaeochannel. 29% of
the footprint-track trails were made by children. Archaeological and ethnographic
evidence is presented alongside the footprint data, with the conclusion that Site N was
used as a ‘pathway’ by children and possibly adult females to walk to a fishing area.
Some of these children may have been aged 4 years or younger, suggesting that children
played an active role in their society.


This thesis is dedicated to my grandparents Michael Milne, David Barr, Sylvia
Barr and Patricia Milne

Acknowledgements
I am grateful to my funding body the South West and Wales Doctoral Training
Partnership who awarded me funding from the Arts and Humanities Research Council.
Without them I would never have been able to pursue this academic path. I thank my
supervisor Professor Martin Bell for all his feedback and guidance and his help during
fieldwork.
I give thanks to the Living Levels Landscape Partnership who I worked with for two
months during my research period, and learned about the ongoing struggles in nature
conservation, which is where I discovered the importance of archaeologists and nature
conservationists working together.
I am grateful to Damon Bridge of the RSPB, not only did he provide photographs of
different birds and their habitats, he was also happy to help identify footprints. I also
give thanks to all staff at the Wildfowl and Wetland Trust, Slimbridge, for their help in
getting a variety of birds to make footprints, especially the help of Mark Roberts.
I am extremely grateful to every person who volunteered to take part within the
footprint experiment, and who were all happy to get covered in mud. I also give thanks
to my sister, Sian Barr, who illustrated all the footprint information sheets.
My heartfelt thanks go to my parents Michelle Sarjeant and Simon Barr for always
encouraging me to learn more about the world. My step-dad Richard Sarjeant has also
been a constant source of support and help, from financial and emotional support to
getting stuck in with random (and sometimes slightly gory) fieldwork.
Most importantly I would like to thank my partner Matthew Ranscombe for his
continuous support throughout all my studies. Matt has taxied me to and from
fieldwork, assisted with fieldwork, been my ‘glamourous assistant’ at open day events,
got into bizarre and slightly scary situations involving retrieving animal footprints and
he has read everything I have written and made suggestions about my chapters. Thank
you, Matt, I couldn’t have done it without you.

i
Contents
Contents………………………………………………………………………………….i
List of Figures…………………………………………………………………………..ix
List of Tables…………………………………………………………………………xix
Part One: Introduction to ichnology and the Mesolithic site on the Severn Estuary
Chapter 1: Introduction to thesis…………………………………………………….1
1.1 Introduction…………………………………………………………………………1
1.2 Key questions……………………………………………………………………….1
1.3 Key aims…………………………………………………………………………….2
1.4 Structure of the thesis……………………………………………………………….2
Chapter 2: The significance of footprint-tracks……………………………………..4
2.1 Ichnology……………………………………………………………………………4
2.1.1 Palaeoichnology………………………………………………………………….11
2.1.2 Laetoli: The rise of ichnological interest………………………………………...12
2.1.3 Palaeolithic Ichnology……………………………………………………………14
2.1.4 Mesolithic Ichnology…………………………………………………………….18
2.1.5 Ichnology from the Early Farmers……………………………………………….19
2.1.6 Bronze Age Ichnology…………………………………………………………...26
2.1.7 Other iconological sites…………………………………………………………..29
2.1.8 American Cave Sites……………………………………………………………..29
2.1.9 Footprints on Roman Tiles……………………………………………………….30
2.1.10 Conclusion of footprints in archaeology………………………………………..31
2.2 Physical Anthropology……………………………………………………………..32
2.2.1 Anatomical Structure of Homo sapiens feet……………………………………..32
2.2.2 Stature……………………………………………………………………………36
2.2.3 Gait……………………………………………………………………………….41
2.2.4 Weight……………………………………………………………………………42
2.2.5 Sex………………………………………………………………………………..42
2.2.6 Footprint Characteristics…………………………………………………………43
2.2.7 Forensic Science………………………………………………………………….43
2.3 Prehistoric Homo sapiens bones from Britain……………………………………..45
2.4 Mammalian bones from Mesolithic Britain………………………………………..47
2.5 Prehistoric avian bones…………………………………………………………….48
ii
2.6 Summary…………………………………………………………………………...55
Chapter 3: Later Quaternary Stratigraphy of the Severn Estuary Levels………..60
3.1 Introduction………………………………………………………………………...60
3.2 Banded Sediments………………………………………………………………….66
3.3 Footprint-track sites in the Severn Estuary………………………………………...69
3.3.1 Magor Pill………………………………………………………………………...71
3.3.2 Cold Harbour Pill………………………………………………………………...72
3.3.3 Redwick…………………………………………………………………………..73
3.3.4 Porton…………………………………………………………………………….77
3.3.5 Uskmouth………………………………………………………………………...79
3.3.6 Goldcliff………………………………………………………………………….80
3.3.7 Goldcliff West……………………………………………………………………81
3.3.8 Goldcliff East…………………………………………………………………….84
3.3.8.1 Site J……………………………………………………………………………86
3.3.8.2 Site A…………………………………………………………………………...88
3.3.8.3 Site B…………………………………………………………………………...89
3.3.8.4 Site D…………………………………………………………………………...90
3.3.8.5 Mesolithic footprint-tracks from Sites C, E and H…………………………….91
3.4 Summary…………………………………………………………………………...93
Part Two: Methods of recording and analysis
Chapter 4: Anatomy of the foot, footprint terminology and methodologies
developed for footprint recording……………………………………………………97
4.1 Introduction………………………………………………………………………...97
4.2 Human footprint identification criteria and measurement recording……………..100
4.3 Anatomical structure of avian feet and footprint identification and recording…...103
4.4 Anatomical features of mammal feet and footprint identification recording……..107
4.4.1 Cloven Hoof…………………………………………………………………….107
4.4.2 Horses…………………………………………………………………………...110
4.4.3 Paws and Claws…………………………………………………………………110
4.5 Formation of a footprint…………………………………………………………..112
4.6 Footprint Terminology……………………………………………………………114
4.7 Field Recording Methods…………………………………………………………118
4.7.1 Preparing for fieldwork…………………………………………………………118
4.7.2 Cleaning………………………………………………………………………...119
4.7.3 Planning, photography, measurements and descriptions……………………….119
iii
4.7.4 Multi-image photogrammetry in the intertidal zone……………………………120
4.7.5 Laser scanner……………………………………………………………………121
4.7.6 Casting…………………………………………………………………………..121
4.7.7 Block-lifting…………………………………………………………………….122
4.7.8 Sediment samples……………………………………………………………….122
4.7.9 Optically stimulated luminescence dating……………………………………...123
4.8 Post-excavation methodology…………………………………………………….124
4.8.1 Digitisation of tracings………………………………………………………….124
4.8.2 Block-lift analysis………………………………………………………………125
4.8.3 Footprint-track recording form…………………………………………………125
4.8.4 Multi-image photogrammetry process………………………………………….126
4.8.5 Laser scanning models………………………………………………………….127
4.9 Comparison of techniques developed for intertidal footprint-track recording:
multi-image photogrammetry versus laser scanning………………………………….128
4.10 Summary………………………………………………………………………...129
Part Three: Results and Analysis
Chapter 5: Inferring the age, sex and stature of an individual by utilising
experimental footprint data………………………………………………………...132
5.1 Introduction……………………………………………………………………….132
5.2 Method……………………………………………………………………………134
5.3 Results…………………………………………………………………………….140
5.3.1 Relationship between heights and weights……………………………………..142
5.3.2 Relationship between age, sex and footprint length……………………………150
5.3.3 Relationship between height and footprint size………………………………...158
5.3.4 Height, weight and footprint width relationship………………………………..163
5.3.5 Running…………………………………………………………………………166
5.3.6 Gait estimations utilising footprint data………………………………………...167
5.4 Discussion………………………………………………………………………...169
5.4.1 Age estimation utilising footprint length……………………………………….169
5.4.2 Stature Estimation………………………………………………………………170
5.5 Limitations………………………………………………………………………..173
5.6 Conclusion………………………………………………………………………...174
Chapter 6: Mesolithic human footprint-tracks from Goldcliff East: age, sex
and stature estimates and an interpretation of results……………………………175
6.1 Introduction……………………………………………………………………….175
6.2 Method……………………………………………………………………………175
iv
6.3 Previous work on the Goldcliff East footprint-tracks…………………………….178
6.4 Are they human?.....................................................................................................179
6.5 Results of Site C/E footprint-track evidence……………………………………...183
6.5.1 Description: footprint-tracks 2015:88 and 2015:89…………………………….186
6.5.2 Description: footprint-track 2015:106 and 2015:107…………………………...187
6.5.3 Description: footprint-track 2015: 114 and 115………………………………...188
6.5.4 Description: footprint-track 2015:116, 117, 118, 119, 120, 122, 123…………..188
6.5.5 Description: footprint-track 2015:127…………………………………………..193
6.5.6 Description: footprint-track 2015:126.2………………………………………...194
6.5.7 Description: footprint-track 2015:131…………………………………………..194
6.5.8 Description: footprint-track 2016:71……………………………………………194
6.5.9 Analysis of Site C/E footprint-tracks…………………………………………...195
6.5.10 Age and sex of individuals who made footprint-tracks in Site C/E…………...197
6.5.11 Stature estimates……………………………………………………………….201
6.5.12 Speed of movement……………………………………………………………202
6.5.13 Direction of movement………………………………………………………..203
6.6 Site M footprint-tracks……………………………………………………………204
6.6.1 Brief analysis of 2010-2014 fieldwork results from Site M……………………206
6.6.2 Analysis of Site M footprint-tracks 2014-2016………………………………...211
6.6.3 Description: footprint-tracks 2014:308, 309, and 310………………………….212
6.6.4 Description: footprint-tracks 2015:12, 13, 14 and 15…………………………..215
6.6.5 Description: footprint-track 2015:53 and 2015:54………………………….…..219
6.6.6 Description: footprint-track 2015:160 and 163…………………………………220
6.6.7 Description: footprint-track 2016:67……………………………………………220
6.6.8 Analysis of Site M footprint-track data…………………………………………221
6.6.9 Age and sex of individuals who made footprint-tracks at Site M………………222
6.6.10 Stature estimates……………………………………………………………….224
6.6.11 Speed of movement……………………………………………………………225
6.6.12 Site M direction of movement…………………………………………………226
6.7 Site N footprint-tracks…………………………………………………………….227
6.7.1 Brief analysis of 2010-2014 fieldwork results from Site N…………………….228
6.7.2 Analysis of footprint-tracks recorded at Site N 2014-2016…………………….231
6.7.3 Description: footprint-track 2015: 6, 7, 8……………………………………….234
6.7.4 Description: footprint-tracks 2015:17, 18, 20…………………………………..236
6.7.5 Description: footprint-tracks 2015: 42, 43, 44, 45……………………………...240
v
6.7.6 Description: footprint-track 2016:27 2016:28…………………………….……241
6.7.7 Description: footprint-tracks 2016: 15, 16, 17, 18, 19, 20, 21, 22, 23, 24,
25,26, 29 and 31………………………………………………………………………241
6.7.8 Description: footprint-track trail 2016:50 to 57………………………………...249
6.7.9 Analysis of Site N footprint-tracks……………………………………………..258
6.7.10 Age and sex of individuals at Site N…………………………………………..259
6.7.11 Stature estimates……………………………………………………………….263
6.7.12 Speed of movement Site N…………………………………………………….265
6.7.13 Site N direction of movement…………………………………………………266
6.8 Site R footprint-tracks…………………………………………………………….269
6.8.1 Description of footprint-tracks: 2016:73, 2016:74, 2016:75, 2016:77,
2016:82, 2016:83, 2016:100………………………………………………………….271
6.8.2 Analysis of Site R footprint-tracks……………………………………………...275
6.8.3 Age and sex of individuals who made the footprint-tracks at Site R…………...277
6.8.4 Stature estimates for Site R footprint-tracks……………………………………278
6.8.5 Speed of movement of individual on Site R……………………………………279
6.8.6 Site R direction of movement…………………………………………………..280
6.9 Site S footprint-tracks…………………………………………………………….280
6.9.1 Description of Site S footprints-tracks: 2016:102, 2016:103, 2016:104,
2016:105, 2016:107, 2016:108, 2017:10, 2017:11 and 2017:12……………………..282
6.9.2 Analysis of Site S footprint-tracks……………………………………………...285
6.9.3 Age and sex of the individuals at Site S………………………………………...286
6.9.4 Stature estimates for individuals on Site S……………………………………...288
6.9.5 Speed of movement in Site S…………………………………………………...288
6.9.6 Site S direction of movement…………………………………………………...289
6.10 Footprint-tracks recorded at Goldcliff East before 2014………………………..290
6.11 Discussion……………………………………………………………………….296
6.11.1 Height and sex…………………………………………………………………296
6.11.2 The Role of children at Goldcliff East………………………………………...296
6.11.3 Direction of movement, banded laminations and seasonality…………………300
6.11.4 Speed of movement of adults………………………………………………….301
6.12 Conclusion……………………………………………………………………….303
Chapter 7: Mesolithic avian footprint-tracks on the Severn Estuary……………304
7.1 Introduction……………………………………………………………………….304
7.1.1 The importance of common crane in Wales: prehistory to present…………….304
7.1.2 An extinct crane species or exploitation of Europe by the Sarus crane?.............306
vi
7.1.3 Evidence of white stork in Britain……………………………………………...307
7.2 Method……………………………………………………………………………308
7.3 Archaeological avian remains within proximity to the Severn Estuary…………..311
7.4 Experimental results………………………………………………………………312
7.5 Mesolithic bird footprint-tracks from Goldcliff East……………………………..324
7.5.1 Site C/E…………………………………………………………………………326
7.5.2 Site M…………………………………………………………………………...346
7.5.3 Site N..…………………………………………………………………………..352
7.5.4 Site O……………………………………………………………………………358
7.6 Discussion: The effectiveness of experimental work and species interpretation…363
7.6.1 The species present within prehistory…………………………………………..364
7.6.2 Common crane………………………………………………………………….365
7.6.3 White stork……………………………………………………………………...367
7.6.4 Grey heron………………………………………………………………………368
7.6.5 Oystercatcher……………………………………………………………………369
7.6.6 Other Coastal Birds……………………………………………………………..369
7.6.7 Unidentifiable…………………………………………………………………..370
7.7 The importance of the archaeological data to species reintroduction…………….371
7.8 Conclusion………………………………………………………………………...372
Chapter 8: Sediment composition of footprint-track Site C/E, M, N, R and S….373
8.1 Introduction……………………………………………………………………….373
8.2 Samples…………………………………………………………………………...375
8.3 Analytical methods……………………………………………………………….376
8.3.1 Particle size range………………………………………………………………376
8.4 Results………………………………………………………………………….…377
8.4.1 Site C/E…………………………………………………………………………377
8.4.2 Site M…………………………………………………………………………...384
8.4.3 Site N……………………………………………………………………………386
8.4.4 Site R……………………………………………………………………………388
8.4.5 Site S……………………………………………………………………………391
8.5 Discussion………………………………………………………………………...393
8.6 Banded laminations and seasonality of the footprint sites………………………..395
8.7 Summary………………………………………………………………………….398

vii
Part Four:
Chapter 9: The paleoecology of Mesolithic Goldcliff East: footprint-tracks
and other archaeological data………………………………………………………400
9.1 Introduction……………………………………………………………………….400
9.2 Vegetation succession at Goldcliff East…………………………………………..400
9.3 Footprint-track assemblage at Goldcliff East……………………………………..403
9.4 Wildfowl………………………………………………………………………….404
9.4.1 Seasonality of avian footprint-track evidence…………………………………..414
9.5 The faunal record inferred from mammal bones and footprint-tracks……………418
9.5.1 Red deer and roe deer…………………………………………………………...421
9.5.2 Auroch…………………………………………………………………………..428
9.5.3 Wild boar………………………………………………………………………..430
9.5.4 Otter, wolf or domesticated dog………………………………………………...430
9.5.5 Summary of mammals………………………………………………………….433
9.6 Fish and marine resources………………………………………………………...434
9.7 Human footprint-tracks…………………………………………………………...439
9.7.1 The people of Goldcliff and other prehistoric hunter-gatherers………………...441
9.7.2 Hunter-gatherer activities……………………………………………………….451
9.7.3 Children and their behaviours…………………………………………………..454
9.8 Seasonality of the evidence……………………………………………………….462
9.9 Conclusion of the palaeoecology at Goldcliff East……………………………….464
Chapter 10: Public Engagement and Impact on the Gwent Levels, Wales……...467
10.1 Introduction……………………………………………………………………...467
10.2 Public Archaeology……………………………………………………………...470
10.3 Professional placement for archaeological public outreach……………………..472
10.4 Method…………………………………………………………………………..472
10.5 Results…………………………………………………………………………...473
10.5.1 Good Levels/Bad Levels………………………………………………………478
10.6 Where to go from here…………………………………………………………..479
10.7 Conclusions……………………………………………………………………...481
Chapter 11: Conclusions and recommendations for future work………………..482
11.1 Conclusions……………………………………………………………………...482
11.1.1 Experimental work with human footprints………………..…………………..482
11.1.2 Limitations of previous work and necessary improvements……………….….484
11.1.3 Footprint formation and recording of footprint-tracks in the intertidal zone….484
viii
11.1.4 Mammals and birds……………………………………………………………485
11.1.5 Goldcliff East Palaeoecology………………………………………………….487
11.2 Further work and recommendations……………………………………………..490
Appendices…………………………………………………………………………...493
Appendix 1……………………………………………………………………………493
Appendix 1.1 CITiZAN Guide……………………………………………………….493
Appendix 1.2 OSL Report…………………………………………………………….495
Appendix 1.3 Footprint recording form………………………………………………504
Appendix 2……………………………………………………………………………505
Appendix 2.1 Letter from University of Reading Ethics Committee regarding
favourable opinion of the footprint experiment involving humans…………………..505
Appendix 2.2 DBS check for Kirsten Barr…………………………………………...506
Appendix 2.3 Consent forms for footprint experiment……………………………….507
Appendix 2.3.1 Consent forms for adults and children over 16 consenting for
themselves…………………………………………………………………………….507
Appendix 2.3.2 Consent forms for adults consenting for their children for the
footprint experiment…………………………………………………………………..508
Appendix 2.4 Information sheets for footprint experiment…………………………..509
Appendix 2.4.1 Information sheet for children under 7 years old……………………509
Appendix 2.4.2 Information sheet for children aged between 7 and 11 years old…..513
Appendix 2.4.3 Information sheet for children aged between 12 and 15 years old…518
Appendix 2.4.4 Information sheet for those over 16 years old consenting for
themselves…………………………………………………………………………….520
Appendix 2.4.5 Information sheet for adults consenting for their children…………..522
Appendix 3……………………………………………………………………………525
Appendix 3.1 Footprint catalogue of all possible footprints recorded at Goldcliff
East between 2007-2017……………………………………………………………...525
Appendix 3.2 Plan of footprint sites R, M, S and O………………………………….543
Appendix 4……………………………………………………………………………544
Appendix 4.1 Extract from ‘Involve RSPB volunteering newsletter, issue 07 winter
2016’………………………………………………………………………………….544
Appendix 4.2 Prehistoric Heritage Trail Guide………………………………………545
Bibliography…………………………………………………………………………556
ix
List of Figures
2.1 Laetoli footprint-tracks S1 and S2 recorded using Structure for Motion
technique (Masao et al. 2016)………………………………………………………….14
2.2 Multi-image photogrammetry model of a footprint-track from Happisburgh
(image by Sarah Duffy)………………………………………………………………...15
2.3 Human footprint-track trail at Low Hauxley made upon intertidal peat
(Eadie and Waddington 2013; Figure 7)……………………………………………….19
2.4 Example of a well-preserved human footprint-track trail at Formby
(photograph courtesy of Gordon Roberts)……………………………………………..22
2.5 Left and right footprint-tracks from Formby Point. The deformed
appearance of the footprint may be due to ectrodactyly (split foot malformation).
(Photograph courtesy of Gordon Roberts)……………………………………………..22
2.6 Footprint-tracks of a crane, probably more than one bird
(Photograph courtesy of Gordon Roberts)……………………………………………..23
2.7 Footprint-track trail at Formby of an adult human intercepting the tracks
of a red deer, possibly indicating hunting activity
(Photograph courtesy of Gordon Roberts)……………………………………………..23
2.8 A child stood barefoot next to probable Neolithic child footprint-tracks
preserved in intertidal peat at Lydstep
(Phototograph by Dyfed Archaeological Trust)……………………………………….25
2.9 Femern Bælt Tunnel footprint-track, recorded by scouring out a rough outline.
This recording technique is an example of the need of a universal method for
prehistoric intertidal footprint-track recording
(Photograph Museum Lolland-Falster)………………………………………………...26
2.10 Anatomical drawing of bones in the right foot…………………………………...34
2.11 Descriptive scheme of the parts of a human foot (Allen et al. 2003)………….....34
2.12 Appearance (A) and Fusion (F) times of the ossification centres of the foot
(after: Scheuer & Black 2004, Figure 11.41)…………………………………………..36
3.1 Schematic geomorphology and stratigraphy from the Severn Estuary showing
the Wentlooge formation (Allen 2000)………………………………………………...62
3.2 Simplified sediment sequence of the Severn Estuary
(graphics S. Lucas; Bell 2013, Figure 1.4)…………………………………………….62
3.3 Example of the clayey silt interspersed with peat seen in the Wentlooge
Formation………………………………………………………………………………63
3.4 Lower Wentlooge Formation banded estuarine silt sediment cliff in section,
at Site C/E (photograph courtesy of T. Walker)………………………………………67
3.5 Schematic representation of the stratigraphic contexts of banded silts in the
Severn Estuary Levels (Allen 2004, Figure 2)…………………………………………68
3.6 Banded sediment demonstrating the coarse-grained winter sediment as
opposed to the fine-grained summer sediments, in plan view………………………....68
3.7 Map of the Severn Estuary and the site of Mesolithic, Bronze Age and
Neolithic footprint-tracks found in close proximity to Goldcliff.
(Graphic M. Matthews and adapted by author)………………………………………..70
3.8 Map of the Prehistoric sites near Goldcliff
(graphic M. Matthews and adapted by author; Bell 2013, Figure 2.1)………………...71
3.9 Palaeochannel at Cold Harbour Pill containing a wooden structure which was
possibly for fishing. Scale 0.3m (Bell et al. 2000, Figure 16.20)……………………...73
3.10 Laminated surface trampled by deer, likely red deer, and auroch/cattle
on the lower Wentlooge formation, Redwick. Scale 0.2m (Allen 1997)………………75
x
3.11 Bronze Age buildings at Redwick flanked by curvilinear depression
footprint-tracks, scale 2 m (photograph by E. Sacre; Barr and Bell 2016)…………….75
3.12. Trampled surface at Redwick where ungulate footprints were recorded
(photograph E. Sacre; Barr and Bell 2016, Figure 4)………………………………….76
3.13 Multi-image photogrammetry model made of footprint-tracks 2015:10 and
2015:11. The model is relatively poor quality due to missing data……………………78
3.14 Standard photograph of footprint-track 2015:10 and 2015:11……………………78
3.15 Geology of Goldcliff ‘island’ (a) geological map (b) contours and
composition of the sub-Holocene surface between Goldcliff and Goldcliff Pill
(Allen 2000, Figure 2.1)………………………………………………………………..80
3.16 Map of Goldcliff West showing main sites investigated from 1987 to 1994
(drawing by B Taylor; Bell 2000, Figure 1.3)…………………………………………83
3.17 Map of Goldcliff East showing the main sites investigated during 2001-2003
(graphic S. Buckeley; Bell 2007, Figure 2.3)………………………………………….85
3.18 Site J, the east/west stratigraphic sequence on north face of 2003 excavation
(graphic J. Bezant and S. Buckley; Bell 2007, Figure 6.9)…………………………….88
3.19 Plan of Site C showing footprint-tracks exposed on laminated bands, recorded
between 2001-2004 (drawing M. Bell and R. Scales; Bell 2007, Figure 4.3)…………94
3.20 Excavation of Site C, in 2003 (photo E. Sacre; Bell 2007, Figure 12.9)…………95
3.21 Plan of Goldcliff East, Site E and H footprint-tracks in banded sediments,
exposed between 2002 and 2003 (drawing M. Bell and R. Scales; Bell 2007)………..96
4.1 LiDAR models of the succession of tracks making up the footprint trail
from Fumanya, Barcelona (Bates et al. 2008)…………………………………………99
4.2 Vertical image of Area A at Happisburgh, model produced by
photogrammetric survey (Ashton et al. 2014)…………………………………………99
4.3 Matrix of variables relevant to the conservation of hominin/human footprint
sites with emphasis on soft sediment sites (Bennett et al. 2013)……………………..100
4.4 Specific morphology in a human footprint-track that indicates that it was
made by humans (photographed by M. Bell, annotated by author)………………… 101
4.5 Method of measuring the length and width of a footprint utilised within this
experiment…………………………………………………………………………….102
4.6 Descriptive scheme of trails (Allen et al. 2003; Figure 2)………………………..103
4.7 Descriptive schemes for avian footprint identification
(Allen et al. 2003)…………………………………………………………………….105
4.8 Avian footprint identification and required measurements for recording
(Drawing by J.R.L. Allen, annotated by author)……………………………………...105
4.9 Trail morphology from a variety of avian species walking and hopping
(Brown et al. 1987)…………………………………………………………………...106
4.10 Descriptive schemes for cloven hoofed animals (Allen et al. 2003)……………108
4.11 The different identifiable features seen within cloven hoofed animal
footprints, and approximate sizes of the prints (not to scale; Buillion 2014)………...109
4.12 Descriptive scheme for horse footprint (Allen et al. 2003; Figure 6)…………...110
4.13 Descriptive scheme of dog footprint features (Allen et al. 2003; Figure 6)…….111
4.14 The different identifiable features seen within footprints of animals with
paws/claws, and approximate sizes of the footprints, not to scale. (Buillion 2014)….112
4.15 Processes acting during footprint formation (Marty et al. 2009).
Note that they use the terminology ‘true track’ instead of ‘footprint’………………..114
4.16 Vertical section of a footprint-track made by a toe-toed track maker and
description of the different features that make a footprint-track
(Allen et al. 2003; Figure 5a)…………………………………………………………116
xi
4.17 Example of how an overtrace and undertrace footprint-track is formed,
vertical section of a footprint-track made by a two-toed trackmaker
(Allen et al. 2003; Figure 5c)…………………………………………………………117
4.18 Vertical section of a footprint-track (Allen et al. 2003; Figure 5b)……………..117
4.19 Dating methods used for fossil footprint-tracks and the time range for these
techniques (Bennett and Morse 2014, Figure 2.7), each measurement of 10
represents 10,000 years……………………………………………………………….124
4.20 (A) Contour maps (1 mm interval) for unregistered mean tracks for habitually
unshod modern feet (Daasanach, northern Kenya), Laetoli G1 Trail and G3 Trail.
(B). Contoured maps for registered mean tracks for habitually unshod modern feet
(Daasanach), Laetoli G1 Trail and G3 Trail (Bennet et al. 2016; Figure 4)………….127
5.1 Footprint tray filled with estuarine silty clay……………………………………..138
5.2 a) female adult walking, b) male adult walking, c) male adult from
b running, d) 3-year-old male walking, e) 4-year-old female walking……………….139
5.3 Box and whisker graph showing a visual representation of Table 5.1,
the whiskers show the first quartile and third quartile, the X shows the mean
value of the data………………………………………………………………………141
5.4 Heights and weights of adult males and females…………………………………143
5.5 Heights and weights of every individual in the experiment from aged 3 to
71 years old…………………………………………………………………………...144
5.6 Heights compared to weights of male and female children aged between
3 to 16 years. Female R2= 0.8164, male R2 = 0.7902, indicating that females have
a slightly more positive relationship between height and weight…………………….145
5.7 Heights compared to weights of 3-year-old males and females………………….146
5.8 Heights compared to weights of male and female 4-year-olds…………………...147
5.9 Heights compared to weights of children aged between 3 and 4, males and
females………………………………………………………………………………..147
5.10 Heights and weights of children 5 to 8 years old………………………………..148
5.11 Heights compared to weights in male and female children aged between
9 and 15 years old………………………………………………………………...…..149
5.12 Representation of the data from Table 5.4, the whiskers show the
first quartile and third quartile, the X shows the mean value of the data…………….153
5.13 Age and sex of children aged 3 to 6 years old, plotted against footprint
length. The whiskers show the first quartile and third quartile of the results,
the X shows the mean value of the data………………………………………………154
5.14 Age and sex of children aged 7 to 9, against footprint length, the whiskers
show the first quartile and third quartile of the data, the X shows the mean
value of the results……………………………………………………………………155
5.15 Age, sex and footprint side of children aged 10 to 12 years old,
and footprint length, the whiskers show the first quartile and third quartile,
the X shows the mean value of the data………………………………………………156
5.16 Age and sex of children from 13 to 15 years, against footprint length,
the whiskers show the first quartile and third quartile, the X shows the mean
value of the data………………………………………………………………………157
5.17 Height compared to footprint length of adult males…………………………….159
5.18 Height compared to footprint length of adult females…………………………..160
5.19 Height compared to footprint length of male children aged 3-15 years old…….161
5.20 Height compared to footprint length of female children………………………...162
5.21 Width of footprint compared against weight of adult males and females……….164
5.22 Footprint width compared against the height of adult males and females………165
xii
5.23 The walking footprint dimensions compared against running footprint
dimensions of males and females……………………………………………………..166
5.24 Regression relationship between the speed, stride and footprint length,
(Dingwall et al. 2013)………………………………………………………………...168
6.1 Photograph of low tide at Goldcliff East demonstrating the challenging
terrain of the intertidal zone, taken from the sea wall………………………………...177
6.2 Map of the Mesolithic footprint-track sites and relationship to other
occupation areas. Graphics by J. Foster and added to by writer……………………...179
6.3 (top left) Footprint of Person 13 (6215), scale 10cm (photo E. Sacre),
(top right) footprint of Person 13 (6204) (photo M. Bell), (bottom left)
footprint trail, small divisions 1cm (photo E. Sacre), (bottom right) footprint
of Person 6 (6160a), small divisions 1cm (photo E. Sacre). Footprint-tracks
recorded by Scales (2006, 2007)…………………………………………………...…181
6.4 Multi-directional hillshade models of Mesolithic human footprint-tracks from
Goldcliff East Site N (top left to right) footprint-track 2016:17, 2016:16,
2015:7, (Bottom left to right) footprint-track 2015:18, 2015:6, 2015:7……………...182
6.5 (left) tide reducing from the sandbank covering Site C/E, and (above)
Site C/E with a small lamination of exposure. Footprint-track 2015:116 had
just been cast in dental alginate and the alginate was about to be wrapped in
cling film for protection………………………………………………………………183
6.6 Photograph of footprint-tracks 2015:88 (top right) and 2015:89 (bottom left).
Note the change in direction and difficult recording conditions. Scale 0.3m………...186
6.7 Footprint-track 2015:106. Note North arrow was being used as a scale bar
[small divisions 1cm] and is not representative of direction of north………………...187
6.8 Footprint-track 2015:107, with evidence of hallux impression and toe nail
drag……………………………………………………………………………………188
6.9 (top) Footprint-track area generated in Agisoft Photoscan Pro, utilising
multi-image photogrammetry point cloud, (bottom) footprint-tracks within this
area traced to provide clarity………………………………………………………….190
6.10 (top) Solid colour model of footprint-track area, (bottom) Digital elevation
model of the area, note that the scale bar does not give the actual OD height of
this trail, which is -3.6m OD………………………………………………………….191
6.11 Footprint-track 2015:116 (right), 2015:117 (left) and 2015:119 (centre)……….192
6.12 Footprint-track 2015:117 (right) and 2015:118 (left)…………………………...192
6.13 Footprint-track 2015:127and avian footprint-track 127.1……………………….193
6.14 Footprint-track 2016:71 multiple laminations above 2016: 72, an
oystercatcher footprint-track, scale cm divisions……………………………………..195
6.15 Scatter diagram of footprint-track lengths and widths from Site C/E…………...196
6.16 Scatter diagram comparing lengths and widths of Site C/E Mesolithic
data against modern human footprints………………………………………………..196
6.17 Direction of movement of the human footprint-tracks recorded during
2014-2016 from Site C/E……………………………………………………………..204
6.18 Site M topography. Photograph was taken looking southwards towards
the retreating tide……………………………………………………………………...205
6.19 Professor Martin Bell using buckets of water from the retreating tide to
attempt to wash the sand and mud off Site M5 laminations………………………….205
6.20 Plan of Site M, 2011-2015. Plan made by J.Foster and M.Bell and digitised
by author………………………………………………………………………………210
6.21 Footprint-track 2014:308………………………………………………………..213
6.22 Footprint-track 2014:309………………………………………………………..214
xiii
6.23 Footprint-track 2014:310………………………………………………………..214
6.24 Footprint-track 2015:12…………………………………………………………216
6.25 Point cloud model of footprint-track 2015:12…………………………………...216
6.26 The outline of footprint-track 2015:12…………………………………………..217
6.27 Footprint-track 2015:13…………………………………………………………217
6.28 Footprint-track 2015:14…………………………………………………………218
6.29 Footprint-track 2015:15…………………………………………………………218
6.30 Footprint-track 2015:53…………………………………………………………219
6.31 Footprint-track 2015:54…………………………………………………………220
6.32 Metric measurements from Site M footprint-tracks……………………………..221
6.33 Metric footprint-track dimensions from Site M compared against modern
experimental data……………………………………………………………………..222
6.35 Site N topography, demonstrating the closeness of the site to a large body
of water as it is low in the tide table…………………………………………………..228
6.36 Plan of the footprint-track tracings made during 2011 fieldwork, with
inclusion of the nearest footprint-track trail 2015:50-56. Plan made by M.Bell
and J.Foster…………………………………………………………………………...230
6.37 Footprint-track 2015:6 (right) and 2015:7(left)…………………………………235
6.38 (a) Multi-image photogrammetry point cloud model of footprint-track 2015:6
and 2015:7, (b) digitised outline of the footprint-tracks, (c) multi-directional
hillshade model, (d) digital elevation model………………………………….………236
6.39 (1) Multi-image photogrammetry point cloud model of footprint-tracks,
from left to right, 2015:17, 2015:18 and 2015:20, (2) digitised outline of the
footprint-tracks, (3) solid mesh of the model to enable the area to be viewed
without interruption from shadow or colour……………………………………….…237
6.40 Digital elevation model of footprint-tracks, left to right, 2015: 17, 2015:18
and 2015:20. ………………………………………………………………………….238
6.41 Footprint-track 2015:17, scale 30cm…………………………………………….239
6.42 Footprint-track 2015:18…………………………………………………………239
6.43 Footprint-track 2015:20. Scale 30cm……………………………………………240
6.44 Footprint-track 2015:42. Scale 1cm divisions…………………………………..241
6.45 Example of the difficulty of getting a detailed picture of an area containing
multiple footprint-tracks, and demonstrating how they relate to one another………..243
6.46 (top) Multi-image photogrammetry model of footprint-tracks 2016: 15, 16,
17, 18, 19, 20, 21, 22, 23, 24, 25,26, 27, 29 and 31, (bottom) digitised outline of
the footprints. This area is a good representation of the concentration of poor
quality footprint-tracks in Site N……………………………………………………...244
6.47 (top) Solid colour model of footprint-tracks 2016: 15, 16, 17, 18, 19, 20, 21,
22, 23, 24, 25,26, 29 and 31, without shadows and colour variation in the sediments
the footprint-tracks are difficult to see. (bottom) digital elevation model of the
footprint-track area……………………………………………………………………245
6.48 Plan of footprint-track 2016:15-25 and 2016:31 from Site N. Plan by M.Bell
and J.Foster…………………………………………………………………………...246
6.49 Footprint-tracks 2016:16 (left) and 2016:17(right). Scale 10mm divisions…….247
6.50 Footprint-track 2016:18, toes are only 5cm from a grey heron footprint……….247
6.51 Footprint-track 2016:18, the right foot of a human, 2016:30 is a grey heron
footprint, and 2016:25 and 2016:20 which may be human footprint-tracks but
may also be ungulate………………………………………………………………….248
6.52 (1) Multi-image photogrammetry model of footprint-track 2016: 53 to 57,
the encroaching tide prevented the full trail being recorded. Footprint-track
xiv
2016:57 on left to 2016:53 on right (2) digitised outline of the footprint-tracks,
(3) solid model of the area, showing that light and colour play a part when
attempting to locate undertrace and overtrace footprint-tracks……………………….251
6.53 Digital elevation model of footprint-track trail………………………………….252
6.54 Plan of footprint-track trail 2016:50-56. Plan by M.Bell and J.Foster………….253
6.55 Footprint-track 2016:50…………………………………………………………254
6.56 Footprint-track 2016:51. Scale 10cm divisions…………………………………254
6.57 Footprint-track 2016:52. Scale 10cm divisions…………………………………255
6.58 Footprint-track 2016:53. Scale 10cm divisions…………………………………255
6.59 Footprint-track 2016:54. Scale 10cm divisions…………………………………256
6.60 Footprint-track 2016:55. Scale 10cm divisions…………………………………256
6.61 Footprint-track 2016:56. Scale 10cm divisions…………………………………257
6.62 Footprint-track 2016:57. Scale 10cm divisions…………………………………257
6.63 Metric dimensions of footprint-tracks from Site N……………………………...258
6.64 Metric dimensions of footprint-track from Site N plotted against modern
human footprint data………………………………………………………………….259
6.65 Plan showing the extent of the footprints in Site N and their direction of
movement. Site recorded between 2011-2016. Plan by M.Bell and J.Foster………...268
6.66 Small exposed lamination of Site R, being recorded by the author utilising
multi-image photogrammetry and ground control points…………………………….270
6.67 Multi-image photogrammetry model of the footprint-track trail from Site R,
from two different angles, with (bottom) the footprint-tracks numbered and
outlines digitised, as well as approximate location of OSL sample 2016:111………..273
6.68 (top) Solid colour model of the area, (bottom) digital elevation model of
Site R, note that scale is not the OD height of the area, which is -4.17 and
-4.35m OD…………………………………………………………………………….274
6.69 Footprint-track 2016:73 (bottom right) and 2016:75 (top left)………………….275
6.70 Scatter diagram representing metric dimensions of footprint-tracks
from Site R……………………………………………………………………………276
6.71 Metric dimensions of prehistoric footprint-tracks from Site R plotted
against modern footprint data…………………………………………………………276
6.72 Direction of movement of Site R footprint-tracks………………………………280
6.73 example of the dipping gully, slopped laminations and constant water flow
experienced whilst recording Site S…………………………………………………..281
6.74 Human footprint-track 2016:102………………………………………………...283
6.75 Footprint-track 2016:107, scale is mm…………………………………………..284
6.76 Footprint-tracks 2017:10, 2017:11 and 2017:12, scale 30cm…………………...284
6.77 Scatter diagram plotting metric dimensions of Site S footprint-tracks………….285
6.78 Metric dimensions of footprint-tracks from Site S plotted against modern
footprint dimensions…………………………………………………………………..286
6.79 Direction of movement of Site S individuals……………………………………290
6.80 Combination of the footprint-tracks trail data from Scales (2006) and
the current study, to demonstrate the percentage of children and adults at
Goldcliff East…………………………………………………………………………295
6.81 (a-e) Pie chart representation of the approximate ages of the people who
made the footprint-tracks in the different areas, recorded 2010-2017, (f) the
percentage of children and adults from all footprint-tracks recorded 2010-2017…….299
xv
7.1 Place names in the UK related to common crane………………………………...306
7.2 Example of the plastic tray ‘footprint trap’ filled with clayey silt sediment
left in enclosures at WWT for bird species to walk upon…………………………….311
7.3 Average footprint lengths and widths of the 21 species from 8 different
families as seen in Table 7.1………………………………………………………….318
7.4 a) Grey heron, b) common shelduck, c) lesser black-backed gull,
d) pink-footed goose, e) carrion crow, f) oystercatcher, g) common crane,
h) barnacle goose, i) European white-fronted goose, j) tundra bean goose,
k) Bewick’s swan, l) pintail…………………………………………………………..319
7.5 Multi-image photogrammetry models generated in Agisoft Photoscan Pro.
(a,b,c) Footprints of common crane, as well as multiple unknown duck species,
made on mud that pooled on top of grass. (d,e,f) Pink-footed goose footprints
made in clayey silt in the ‘footprint trap’. a and d are the models, b and e are solid
colour models and c and f are digital elevation models………………………………321
7.6 Multi-image photogrammetry models generated in Agisoft Photoscan pro.
(1,2,3) Footprints of common crane, shelduck and other possible species made
in the clayey silt ‘footprint trap’, recorded at the WWT. (4,5,6) Grey heron
footprints made upon sandy mud at Goldcliff East, Severn Estuary. 1 and 4 are
the full models, 2 and 6 are the solid colour models and 3 and 5 are the digital
elevation models……………………………………………………………………....322
7.7 Shelduck footprints. 1) made on estuarine sandy silt, 2) made on mud
within the WWT shelduck enclosure, 3) made by modern shelduck on the
estuarine clayey silt in the footprint trap……………………………………………...323
7.8 Digitisation of small footprints near Site C, Scales (2006)…………………….…325
7.9 Mesolithic avian footprint-tracks from Site C/E………………………………….327
7.10 Lengths and widths of footprints from 21 species from 8 different families
(Table 7.1), plotted against Mesolithic avian footprint-tracks from Site C/E………...332
7.11 Footprint-track area 2015:87. Top (left) standard photograph of footprints,
(right) multi-image photogrammetry model of the footprints generated in
Agisoft Photoscan Pro. Bottom (left) solid colour of the model, (right) digital
elevation model of the model…………………………………………………………334
7.12 (left) Multi-image photogrammetry model of Mesolithic footprint-tracks
2015:87, (right) common crane footprints made by modern birds in mud on top
of grass, recorded at WWT…………………………………………………………...335
7.13 Tracing of modern crane footprints, walking in mud…………………………...335
7.14 Tracing of possible crane footprint-track 2015 87, recorded in Site C/E……….336
7.15 Digitalisation of common crane footprints from Site C Scales (2006)………….336
7.16 (top) Modern crane walking in estuarine clay footprint trap. (bottom) the
same image as the top, but with the prints digitally traced for visual clarity…………337
7.17 (top) Mesolithic crane (2015:127.1) made on a clayey silt banded
lamination. (Bottom) outline of footprint 2015:127.1 is traced for clarity…………...338
7.18 Footprint-track 2014:300 and 2014:301…………………………………………339
7.19 Tracing of footprint-track 2014:300 and 2014:301……………………………...340
7.20 Tracing of white stork footprint from Brown et al……………………………...340
7.21 Footprint 2016:72, identified as an oystercatcher made at Site C/E…………….341
7.22 Footprints recorded by Scales (2006), possible Grey heron, Site E……………..343
7.23 Grey heron footprint (2015:55.2) picked out on the lamination by
finely divided organic matter…………………………………………………………344
7.24 Grey heron footprint (2015:55.2) picked out on the lamination by
finely divided organic matter and drawn around to highlight its morphology……….344

xvi
7.25 Eurasian bittern footprint made in a sand footprint trap used by the
RSPB to record species diversity. Scale bar in inches (photograph courtesy
of David Baskett, RSPB Minsmere Nature Reserve volunteer)……………………...345
7.26 Avian footprint-tracks from Site M compared against lengths and widths
of 21 species within 8 families recorded from modern birds (Table 7.1)…………….348
7.27 (top left) unidentified webbed species (2015:53.a), (top right) grey heron
(2015:b), (bottom) small waders (2015:a and 2015:c)……………………………..…349
7.28 Tracings made in Site M, from footprints 2015:a. Scale bar 8cm………………350
7.29 Tracings made from modern dunlin footprints. Note the long central
toe shared by all prints, this can also be seen in the Mesolithic footprint-tracks
and is indicative of small waders. Scale bar 8cm……………………………………..350
7.30 Digitalised tracing from footprint-track 2015:b, recorded from photograph
at Site M. Scale bar 8cm……………………………………………………………...351
7.31 Digitalised tracings from modern heron footprints made in thick wet sand…….351
7.32 Lengths and widths of Site N footprint-tracks compared against modern
analogues……………………………………………………………………………...354
7.33 (a) Multi-image photogrammetry model generated in Agisoft Photoscan Pro.
(b) The same model as (a) but shown in a solid colour. (c) Orthomosaic model
of footprint-tracks 2015:16.1 and 2015:16.2. (d) Orthomosaic model of 2015:19
footprint trail………………………………………………………………………….355
7.34 footprints 2015:19 grey heron trail. Scale 7.5cm………………………………..357
7.35 Grey heron trail made on sandy estuarine mud and in an area covered by
a small amount of water, note the poor preservation in the wetter sediment…………357
7.36 Lengths and widths of avian footprint-tracks from Site O, compared against
modern avian analogues………………………………………………………………360
7.37 Digitised tracing of footprints 2011.208.1 – 208.4, scale bar 10cm…………….362
7.38 Digitised traced footprints 2011:98.1-4, scale bar 10cm………………………..362
7.39 Remains of a modern common crane nest (image courtesy of Damon Bridge,
RSPB)…………………………………………………………………………………366
7.40 An area trampled by modern common crane, common shelduck, mallard
and greylag goose at the Wildfowl and Wetlands Trust, Slimbridge………………...366
7.41 Female crane ‘Gibbles’, the first common crane to lay eggs in Wales in at
least 500 years, image from the Great Crane Project…………………………………372
8.1 The modern Severn Estuary as a system (Dark and Allen 2005)………………...374
8.2 Example of banded laminations in section. Scale 1cm divisions…………………375
8.3 Particle size range utilised by the GRADISTAT Grain size statistics
programme (Blott and Pye 2001)……………………………………………………..377
8.4 SCC Trigon of sediment particle size from the human footprint-tracks from
Site C/E. All human footprint-tracks within this area were overtraces/undertraces
with the exception of 2015:116 which may have been a true footprint……………...381
8.5 SCC Trigon of sediment particle size from avian footprints from Site C/E.
2015:87, 2016:70 and 2015:130 were common crane, 2015:129 was an
oystercatcher and 2015:113 was a small wader………………………………………382
8.6 Common crane footprints (2016:70) made on a (very slightly) clayey silt
lamination. Scale in mm……………………………………………………………....384
8.7 SCC trigon showing sediment from probable human footprint-tracks at
Site M…………………………………………………………………………………386
8.8 SCC trigon showing the results of sediment composition from laminations
walked on by grey heron s (2015:16) and a human footprint-track (2015:18)
at Site N……………………………………………………………………………….388
xvii
8.9 Consolidated laminations at Site R……………………………………………….389
8.10 SCC trigon demonstrating sediment types from Site R human
footprint-tracks……………………………………………………………………….391
8.11 SCC trigon showing sediment size of samples from Site S human
footprint-track 2016:103……………………………………………………………...393
8.12 Grain size characteristics from Goldcliff monolith, (A-E) representative
grain-size distribution, (F) Clay-silt-sand ratios, (G) Frequency distribution of
values for mean diameter (Allen 2004)……………………………………………….394
8.13 Patterns of asymmetry between recessive and protrusive laminae……………...395
8.14 Exposed erosion cliffs of laminated sediments at Site C/E where common
crane footprints (2015:70) were recorded…………………………………………….397
8.15 Laminated sediments cut by erosion gullies at Site M…………………………..397
8.16 Laminated sediments and the covering gravel at Site N………………………...398
9.1 Goldcliff East, Site C. Plan of the trails of Person 11 and Person 12 and the
avian footprints (Scales 2006)………………………………………………………...409
9.2 Çatalhöyük crane wing (after Russel and McGowan 2003)……………………...411
9.3 An imagined crane dance at Çatalhöyük, image by J.Swogger
(Russell and McGowan 2003, Figure 9.4)……………………………………………411
9.4 Çatalhöyük wall paining of two crane stood below a fragmentary boar and
above a pair of onagers (picture courtesy of Picture of Records,
Çatalhöyük by James Mellart)………………………………………………………..412
9.5 Göbekli Tepe pillar 33, with engravings of crane. Identified through the
long necks, legs and tail feathers though the legs are bent, and more human in
appearance than crane (Schmidt 2012)……………………………………………….412
9.6 Dunlin, Grey Plover and Common Shelduck feeding on the mudflats at
Goldcliff East during the winter (image courtesy of M. Cath, Royal Society for
the Protection of Birds)……………………………………………………………….414
9.7 Pie chart demonstrating the differences in seasonality of the Goldcliff Island
avian species…………………………………………………………………………..416
9.8 Pie chart showing the percentages of the seasonality of 25 small wader
species currently found in the British Isles (RSPB)………………………………..…417
9.9 Common crane footprint area 2015:87 at Site C/E, made on fine-grained
sediment. Scale 1cm divisions………………………………………………………..417
9.10 Percentages of species from number of bones identifiable to species
recorded at different Mesolithic sites…………………………………………………419
9.11 Laminations trampled by ungulates at Uskmouth, photographed by M. Bell
in 1994………………………………………………………………………………...422
9.12 Adult red deer footprint-track, and probable juvenile footprint-track from
Uskmouth. Scale in cm……………………………………………………………….423
9.13 Large red stag footprint-track recorded at Uskmouth. Scale in cm……………..423
9.14 Uskmouth deer footprint-tracks plotted against measurements for red deer
and roe deer found in footprint tracking literature……………………………………424
9.15 Yearly cycle of modern red deer behaviour (The Deer Initiative 2008a)……….424
9.16 Evidence of a trampled Mesolithic old land surface at Seaton Carew, Durham,
where ungulates, likely red deer, had been running (Rowe 2015)……………………426
9.17 Dimensions of auroch footprint-tracks from Neolithic/Bronze Age site
of Peterstone compared against those from Goldcliff East to demonstrate range
of size…………………………………………………………………………………429
9.18 Otter feeding at the Newport Wetlands (image by David Brooks)……………...431
xviii
9.19 (left) Plaster of Paris cast of modern otter footprint. Scale in cm.
(right) photograph of mammal footprint from Site C (photographed by Eddie
Sacre). Scale 5cm divisions…………………………………………………………...432
9.20 (left) modern otter footprint morphology (by author) compared against
(right) footprint morphology of Site C Mesolithic mammal footprint-track (Scales
2006). Not to scale……………………………………………………………………432
9.21 Results of excavation and post-excavation analysis of Lake Flixton and Star
Carr (Robson et al. 2016, Table 1)……………………………………………………436
9.22 Neolithic fish trap at Seaton Carew, Durham (Rowe 2015)…………………….438
9.23 Footprints recorded at Yenikapı, 88 of the best footprints were casts and
several were made by feet that were shod (Today Zaman 02.04.2012)………………440
9.24 A leather shoe discovered at Areni-1 cave, Vayots province, Armenia
(Pinhasi et al. 2010)…………………………………………………………………..441
9.25 Map of Southwest Britain, showing the location of the Mendip sites,
specifically Aveline’s Hole. The location of Goldcliff East was added by the
author to demonstrate the distance between sites (Schulting and Wysocki 2002,
drawn by L. Mulqueeny)……………………………………………………………...444
9.26 Summary graph of published carbon isotope values from British and Irish
Mesolithic sites before 4000BC (Milner 2009b, Figure 1)…………………………...447
9.27 Percentages of population demographic of adults compared to children
(a) Mesolithic Goldcliff East (b) modern Canadian Inuit population (Statistics
Canada 2011a) (c) modern Australian aborigines’ population (Australian Bureau
of Statistics 2012)……………………………………………………………………..456
9.28 Efe children playing whilst learning about subsistence strategy
(Image by P.I. Henry, after Jones 2005)……………………………………………...461
9.29 Hazda children cooking their meal, they hunt and gather approximately half
the calories that they consume (Ember 2014)………………………………………...461
10.1 Proposed route of M4 relief road (The Welsh Government 2014)……………...469
10.2 Proposed site of the Cardiff Tidal lagoon. The Gwent levels is represented
by the purple denomination on the map. A large proportion of this (approximately
one third) will fall in the Cardiff lagoon flood area (Cotswolds archaeology 2015)…469
10.3 Multiple perspective model (Grima 2016)………………………………………472
10.4 Approximate area that incorporates the RSPB Newport wetlands nature
reserve (map by Natural Resource Wales)……………………………………………475
10.5 Explanation of social class categories listed in Table 10.2, as provided by
Natural Resource Wales………………………………………………………………477
10.6 Public engagement activity involving the prehistoric ‘Bone Booth’ run
by the writer, which was hosted at the RSPB Newport Wetlands reserve as an
activity for a Girl Guides Jamboree involving over 800 children in 2016
(photograph courtesy of Gavin Jones)………………………………………………..480

xix
List of Tables
2.1 List of world-wide footprint-track sites……………………………………………..5
2.2 A small sample of literature providing regression equations to estimate stature,
including the sample size and additional data such as age and sex……………………37
2.3 Male stature estimates and average foot length from a variety of population
studies…………………………………………………………………………………..40
2.4 Female stature estimates and average foot length from a variety of population
studies…………………………………………………………………………………..41
2.5 Preliminary classification of the Jaguar Cave individuals by Louise Robbins
(Robbins et al. 1981). Stature is given in inches (Watson et al. 2005; Table 3)………44
2.6 Total number of bones identifiable from large mammal species from different
Mesolithic sites…………………………………………………………………………48
2.7 Species of avian remains from South West Britain from a variety of sites and
time periods. View above key for the sites represented by the site number and the
time period of the finds. This list draws heavily on Harrison (1987). X indicates
their presence…………………………………………………………………………..53
2.8 Avian species that have been seen on the Severn Estuary since 1952,
including the season they can be seen and their rarity (data gathered from
Severnside birds systematic list). X indicates their presence………………………….56
3.1 Geological sequence of sediment formation from Severn Estuary, including
contexts where footprint-tracks have been recorded. Table compiled from the
work of Bell (2007, Table 2.1) and Allen (1997)……………………………………...64
3.2 Summary of overall differences between coarse and fine bands
(Dark and Allen 2005, Table 6)………………………………………………………..69
3.3 Species and ages of footprints made at Redwick, recorded by Bell (2013) from
1999-2001 (Barr and Bell 2016, Table 2)……………………………………………..76
3.4 The species and ages of footprint-tracks recorded from middle Wentlooge peat
at Goldcliff East, data gathered in 2011 and 2012 by the author………………………85
4.1 Table based on the work of Bennet et al. (2013; Table 1) and Bennet and Morse
(2014; Table 2.1) investigating the advantages and disadvantages of recording
footprint-tracks using multi-image photogrammetry and optical laser scanner.
Author has edited the contents of the table to make it relevant to recording at
Goldcliff East…………………………………………………………………………130
5.1 The heights of all participants including the mean and standard deviation………141
5.2 Ages and UK shoe sizes of males in the experiment, shoe sizes were
determined from asking the volunteers their shoe size……………………………….150
5.3 Ages and UK shoe size of females in the experiment, shoe sizes were
determined from asking the volunteers their shoe sizes………………………………151
5.4 Footprint lengths of males and female adults, including the mean and standard
deviation………………………………………………………………………………152
5.5 Mean heights and footprint lengths of males and females………………………..158
5.6 Results of experimental footprints estimated speeds using
Dingwall et al. 2013 regression equation……………………………………………..168
5.7 Age estimation utilising footprint length…………………………………………169
5.8 Sex estimation utilising footprint length………………………………………….169
5.9 Regression equation establishing heights for adult males and females,
y=height, x=footprint length, to be used on footprints larger than 20cm………….....171
5.10 Regression equation establishing heights for children, y=height,
x=footprint length, to be used on children with footprint lengths under 20cm………171
5.11 Regression equations most like this study for male left feet…………………….172
xx
5.12 Regression equations most like this study for male right feet…………………..173
6.1 Footprint-tracks from Site C/E recorded on multiple laminations………………..185
6.2 Modified version of Table 5.7, demonstrating the relationship between
footprint length, age and shoe size……………………………………………………198
6.3 The percentage of average footprint length, data from 19 modern children
aged between 10 to 15 years old, compared to 57 adult female and 29 adult male…..199
6.4 Estimated age, footprint-track length and UK shoe size of prehistoric
footprint-tracks from Site C/E………………………………………………………...200
6.5 Estimated sex of individuals from Site C/E………………………………………201
6.6 Estimated heights of prehistoric individuals from Site C/E………………………202
6.7 Speed of movement estimated utilising footprint-track trails from Site C/E,
calculated using equations rom Figure 5.25 (Dingwall et al. 2013)………………….202
6.8 Data from footprint-tracks from Site M, recorded 2010-2014……………………207
6.9 Speed of movement of individual 2010:1-5………………………………………211
6.10 Data of footprint-tracks from Site M 2014-2016………………………………..212
6.11 Age range, footprint-track length and probable shoe size of Site M
footprint-tracks………………………………………………………………………..223
6.12 Sex identification of the Site M footprint-tracks………………………………...224
6.13 Stature estimates of individuals recorded in Site M……………………………..225
6.14 Speed of movement estimated for Site M footprints…………………………....226
6.15 Footprint-track data from Site N………………………………………………...231
6.16 Age estimates from human footprint-tracks in Site N…………………………..261
6.17 Sex estimates from Site N footprint-tracks……………………………………...262
6.18 Stature estimates from footprint-tracks from Site N…………………………….264
6.19 Speed of movement of Site N individuals……………………………………….266
6.20 Data of footprint-tracks recorded from Site R…………………………………..271
6.21 Estimated age range from Site R footprint-tracks……………………………….277
6.22 Sex estimates from Site R footprint results……………………………………...278
6.23 Stature estimates of individuals who made footprints in Site R………………...279
6.24 Speed of movement of individuals in Site R…………………………………….279
6.25 Data of the Site S footprints……………………………………………………..282
6.26 Possible age ranges of the individuals who made the footprint-tracks from
Site S………………………………………………………………………………….287
6.27 Possible sex of the individuals in Site S…………………………………………287
6.28 Estimated heights of the individuals in Site S…………………………………...288
6.29 Estimated speed of movement of the individuals from Site S…………………..289
6.30 Summary of 21 identifiable human footprint-track trails, including age,
height and shoe size, adult (14+), sub-adult (age 11-14), child (age 7-11),
young child (age 3-6). Walk speed is steps per minute (Scales 2007)……………….292
6.31 Reanalysis of the age and sex of footprint-tracks from Scales (2007)………….293
6.32 Summary of the footprint-track trails of Mesolithic humans recorded
during 2010-2017. Adults are aged 10+ due to similar sizes in pubescent children
and adults……………………………………………………………………………..294
7.1 Experimental results of a variety of contemporary wetland bird footprints
and the features that can be used for identification…………………………………..314
7.2 Angle between toe II and toe IV of the different species from experimental
work compared against footprint-track literature…………………………………….316
7.3 Metric dimensions from avian footprint-tracks recorded on Site C/E……………328
7.4 Metric dimensions of avian footprints recorded on Site M……………………….347
7.5 Metric dimensions of avian footprints recorded at Site N………………………..353
xxi
7.6 Metric dimensions from avian footprints recorded at Site O……………………..359
7.7 Mesolithic avian species identification at Goldcliff East, footprint-tracks
recorded during Scales (2006) fieldwork, from fieldwork during 2010-2011 and
recorded by the author, 2014-2016…………………………………………………...364
8.1 Percentage of clay, silt and sand from the sediment samples from Site C/E……..379
8.2 Percentages of clay, silt and sand from sediments recorded from human
footprint-tracks at Site M…………………………………………………………......385
8.3 Percentages of clay, silt and sand from sediments recorded from Site N………...387
8.4 Percentages of clay, silt and sand from sediment recorded in Site R…………….390
8.5 Percentages of clay, silt and sand from Site S samples…………………………..392
9.1 Number of footprint-tracks from different species recorded at Goldcliff East
by Scales during 2001-2004, during sporadic fieldwork undertaken by professor
Martin Bell in 2005-2009 and 2010-2014, and footprint-tracks recorded by
the writer during the fieldwork period 2014-2017……………………………………404
9.2 Avian species present in environs of Goldcliff Island, evidenced by skeletal
remains and footprint-tracks (Scales 2007, Table 13.2), additions by author………...406
9.3 Bird taxa from the graves at Yuzhniy Oleniy Ostrov, Lake Onega, Western
Russia (Mannermaa et al. 2008)……………………………………………………...407
9.4 The species present in environs of Goldcliff Island and the season the
species were likely in the area………………………………………………………..416
9.5 Species within the environs of Goldcliff Island (Coard 2000; Scales 2007),
additions by author……………………………………………………………………418
9.6 Evidence of fish remains at Goldcliff East (Ingrem 2007, Table 13.3)…………..436
9.7 Stature estimates of prehistoric humans from sites in Britain and Europe……….445
9.8 Reanalysis of estimated stature of individuals at Goldcliff East, originally
recorded by Scales (2006)…………………………………………………………….448
9.9 Age, sex, and stature estimates of individuals who made footprint-track trails
at Goldcliff East. The footprint-track size, number of footprints in the trail and
likely seasonality are also included…………………………………………………...449
9.10 Reanalysis of the footprint-track data from Uskmouth and Magor Pill
(Aldhouse-Green et al. 1992)…………………………………………………………451
10.1 RSPB Newport Wetlands Visitor Survey 2008-2016…………………………...474
10.2 Natural Resource Wales Visitor Survey 2015, the survey demonstrates
the percentages from visitors at the Newport wetlands compared to the
percentages of the visitor demographic of the rest of welsh reserves……………...…476

1
Chapter 1
1.1 Introduction
The foot is an amazing mechanism, allowing us to walk, run, dance and jump. The foot also
leaves a physical record of our presence on the landscape that we have walked upon, in the form
of a footprint. When out walking in woodland you may see signs of dogs chasing rabbits or
children chasing birds, on a sandy beach you may see the footprints of children playing. These
footprints all tell a story, they are a snapshot of one moment. This is true of footprints made
during prehistory as well as those that we see today, and it is the formation of a footprint, and
what it can tell us about the maker, that this study is interested in.
Footprints at archaeological sites were once seen as curiosities, barely mentioned in site reports,
and undergoing very little analysis. In recent years archaeologists and forensic scientists have
begun to appreciate the worth of a footprint, with research suggesting a person’s footprint size
can reveal their height, weight, sex, age, gait and speed of movement. Footprints can also
suggest something about the habitat or season, with avian and mammalian footprints enabling
the identification of species, and inferences to be made about group composition, behaviours
and seasonality. The focus of this study will be the Late Mesolithic footprint-tracks from
Goldcliff East, Severn Estuary, Wales.
Although footprints are now considered to be an informative archaeological source, there is still
a discrepancy in how the data is analysed and reported. Footprints are often considered as two-
dimensional artefacts when in reality they are three-dimensional. Human footprints are assigned
far greater importance than mammalian and avian footprints; avian footprints in particular are
still neglected within archaeology. This study seeks to rectify the lack of consideration given to
avian footprints whilst also emphasising the importance of human footprints as a way to
understand the invisible people of the past, primarily children.
1.2 Key questions
- Which techniques are most effective at accurately recording footprints in the intertidal
zone?
- Can experimental work create a dataset that contributes to the interpretation of
prehistoric footprint data and their formation processes?
- Can patterns of movement be established from prehistoric footprints?
- What can footprints tell us about the life of a hunter-gatherer?
- Do children’s footprints make up a large percentage of the archaeological assemblage?
2
- Does the footprint data suggest the seasonality of either human activity or animal/bird
presence on the site?
1.3 Key aims
- To identify prehistoric species present on the intertidal zones via footprints and faunal
remains
- To develop methods to quickly and accurately record footprint-tracks, specifically
whilst working in the short tidal window in the low intertidal zone
- To undertake experimental work exploring the formation of footprints on estuarine
substrate, the variations in size that may occur from one individual depending on
sediment conditions and walking/running speed and to what extent the age of an
individual can be established from footprint evidence
- To analyse patterns of movement to determine if humans appeared to be walking in the
same direction, which may indicate a settlement area or a concentration of resources
- To determine if the patterns of movement on given sites change over time
- To determine the percentage of children present on study sites and what they may have
been doing in this environment
1.4 Structure of the thesis
Part 1 will introduce the study of ichnology and consider the literature currently available
regarding the study of footprints in both archaeological and modern settings. An introduction to
the study area of the Severn Estuary with reference to the later Quaternary stratigraphy is also
presented, with specific references to footprint sites found on the intertidal zone, and a focus on
the main Mesolithic footprint-track site of interest, Goldcliff East.
Part 2 focuses on the methodologies adopted and developed in this research. Focus is given to
the criteria required for identifying and recording human footprint-tracks. The anatomical
structure of avian and mammalian feet, and the ways to identify and record these is also
addressed. The chapter then addresses the formation of a footprint-track and specific footprint-
track terminology that will be used throughout the study. Field recording methods and post-
excavation methodology is provided. The chapter ends on a discussion of the advantages and
disadvantages of utilising two techniques to record prehistoric footprint-tracks on the intertidal
zone: optical laser scanning and multi-image photogrammetry.
Part 3 provides the results of this study, in the form of 4 chapters. Chapter 5 deals with an
experiment which collected modern human footprint data from footprint trails made in clayey
silt sediment. The purpose of this chapter was to understand to what extent a persons age, sex
3
and stature can be established from their footprint trail. The findings of this chapter are then
applied to Chapter 6, the results of the Late Mesolithic footprint-tracks from Goldcliff East. In
this chapter the ratio of children to adult is established, as well as the statures, ages and speed of
movement. Occasionally a male can be identified. Chapter 7 addresses both experimental work
regarding the formation of avian footprint-tracks, and how this knowledge can be applied to the
Goldcliff East footprint assemblage. The species of bird present at Mesolithic Goldcliff is
presented, with reference to changes in migration behaviour and seasonality. Chapter 8 deals
with the particle size of the laminated bands walked upon by humans and birds, and the
seasonal implications of this data.
Part 4 provides a detailed discussion in Chapter 9, dealing with the avian, mammalian and
human footprint-tracks at Goldcliff, and what they suggest about seasonality, population
demographic, and the role of children in hunter-gatherer society. Chapter 10 provides a
discussion regarding public engagement and impact on the Gwent Levels, Wales, with
particular emphasis on the need for different sectors to collaborate to ensure the survival of
intertidal archaeological sites. Chapter 11 ends the thesis by providing conclusions regarding
the initial aims and questions posed in Chapter 1, as well as a consideration of the limitations of
this study and suggestions for future research.
4
Chapter 2
The Significance of Footprint-tracks
Footprint Introduction
‘there was exactly the very print of a foot, toes, heel, and every part of a foot; how it came
thither, I knew not, nor could in the least imagine’
Daniel Defoe, 1719, Robinson Crusoe
Throughout history humans have used footprints to understand the world around them. Folklore
surrounding the phenomena of fossil footprints can be found across the globe, and attributed to
giants, fairies, saints, ‘cavemen’ and gods (Mayor and Sarjeant 2001). Fiction is also inundated
with reference to footprints; from Defoe’s ‘Robinson Crusoe’ to Sir A.C. Doyle’s ‘Sherlock
Holmes’, footprints add a level of intrigue and mystery. Footprints can also be an indication of
achievement, when we think of the success of the 1960’s NASA moon landing the human
achievement was not just the act of landing on the moon, rather it was the creation of footprints
on the moon as a sign that humans had achieved this feat.
2.1 Ichnology
Ichnology is the study of animal traces and derives from the Greek word for track, Ichnos.
These are the marks that have been left by an organism in sediment. Ichnology includes a wide
variety of trace fossils including footprints, claw marks, tooth marks, burrows and coprolites to
name a few. In this study it is the trace fossils of footprints that are of interest.
The study of footprint-tracks is still considered ‘new’ and because of this it is sometimes
underappreciated as archaeological evidence. Footprint-tracks from humans, mammals and
birds have been found at sites across the globe. This chapter will discuss some of these
footprint-track sites and the key findings and contributions these sites have made, specifically to
the study of population demographics. The sites discussed are just a sample due to the large
number of sites with footprint-track evidence. At the time of writing, the author is aware of 91
footprint-track sites (Table 2.1). The table is not a comprehensive list of sites; there may be
many more unreported sites or reports that have not been widely published. 71 (77%) of the
sites in Table 2.1 have been discovered in the past 30 years. Although animal and avian
footprint-tracks are found during many different geological periods, hominin sites are by far the

5
most reported. 71 (77%) of these sites have evidence of human footprint-tracks. 49 (54%)
footprint-track sites are from Europe, 29 (32%) of which are from the UK. Research at these
sites has been focused on mammals as well as humans, demonstrating that Europe is leading the
world in palaeoichnological research. Footprint-tracks are of interest as they are a record of
human behaviour, such as human ecology, population demographic, subsistence strategies,
seasonality and social behaviours.
Footprints are also studied by physical anthropologists. A portion of this chapter will discuss
the anatomy of a foot, as well as previous investigations into what footprints can tell us about
the person who made them, specifically their stature, weight, gait, sex and any deformities to
the foot. The application of these techniques within forensic science is also considered, with
emphasis on the work by Louise Robins, who worked with both archaeological and forensic
footprints.
The chapter will end on a review of the Mesolithic skeletal evidence, as well as evidence of
avian bones and mammal bones from prehistoric Britain. It is essential to consider the bone
remains from humans and animals when dealing with footprint-tracks as these two sources are
complementary.
Site Age Species of footprint-
track maker
Key references
Pliocene
Laetoli,
Tanzania
3.66ma Human and a large
variety of mammals and
bird
Leakey & Hay 1979
Lower
Pleistocene
Lowermost Bed
II, Olduvai
Gorge, Tanzania
1.75ma Hippopotamus Ashley 2003
Ileret, Kenya 1.5ma Human Bennet et al. 2009; Dingwall et al.
2013
Koobi Fora,
Kenya
1.4ma Human and large
mammal -
hippopotamus
Behrensmeyer & Laporte 1981;
Bennet et al. 2009
Happisburgh,
UK
0.78-1.0ma Human Ashton et al. 2014

6
Gombre II-2,
Melka Kunture,
Ethiopia
0.7ma Human, ungulate,
mammal, bird
Altamura et al. 2018
Mid Pleistocene
Swanscombe,
UK
c 420ka BP Mammal - elephant,
rhinoceros, cervid and
bovid
Davis and Walker 1996
Terra Amata,
France
c 400ka BP Human De Lumley 1966; Miskovski 1967
Roccamonifina,
Italy
345ka BP Human Mietto et al. 2003; Avanzini et al.
2008
Late Pleistocene
Nahoon point,
South Africa
c 124±4ka BP Human, bird, mammal Roberts 2008; Mountain 1966
Langebaan,
South Africa
c 120ka BP Human Roberts 2008; Roberts & Berger
1997
Vartop cave,
Romania
62ka BP Human Onac et al. 2005
Theopetra cave,
Greece
48ka BP Human Facorellis et al. 2001; Bennet and
Morse 2014
Toluquilla,
Valsequillo,
Mexico
c 40ka BP Human, dog, big cat,
ungulate such as small
deer, camels and bovids
Huddart et al. 2008
Ciur-Izbuc cave,
Romania
36.5ka BP Human Webb et al. 2014
Chauvet cave,
France
c 26ka BP Human, bear and wolf Clottes 2003; Harrington 1999;
Garcia 1999
Willandra,
Australia
23-19ka BP Human, avian, kangaroo Webb et al. 2006
Chusang, Tibet 20ka BP Human Zhang and Li 2002
Lascaux, France 17ka BP Human Barriere & Sahly 1964; Renfrew
and Morley 2009
Ojo Guarena,
Burgos, Spain
15.6ka BP Human Marcos 2001
MonteVerde II,
Chile
c 14.6ka BP Human, mammal,
shorebird
Dillehay 1989, 1997; Meltzer et
al. 1997
Tana della
Basura, Italy
12ka BP Human and bear Chiapella 1952; Pales 1955, 1960

7
Fontanet cave,
France
13-14ka BP Human and dog Delteil et al. 1972; Clottes 1975;
Bahn & Vertut 1988
Niaux, France 12.8ka BP Human Breuil and Cartailhac 1907; Pales
1976; Clottes 1984
El Abadiya,
Egypt
12.4ka BP Wild cattle and
hartebeest
Vermeersch et al. 2000
Buenos Aires
Provine,
Argentina
12ka BP Human, bear, ungulate,
cervids, rodent, birds
Aramayo & Bianco 2009
Pehuen,
Pampean Plain,
Argentina
12ka BP Human, large and
medium sized mammals
and shore birds
Bayón et al. 2011
Engare Sero,
Tanzinia
5760 ±30 BP -
19.1±3.1ka
Human Richmond et al. 2011; Liutkus-
Pierce et al. 2016
Calvert Island,
British Columbia
11.2ka BP Human McLaren et al. 2018
Lake Bogoria,
Kenya
Late Pleistocene,
uncertain date
Human Scott et al. 2008
Holocene
Europe
Grotte de
Cabrerets, Pech
Merle, France
10ka BP Human Begouen 1927; Vallois 1931
Demirköprü,
Turkey
9ka BP Human Barnaby 1975; Ozansoy 1969;
Westaway et al. 2004
Grotte Ald'ene,
France
8.2ka -7.79ka BP Human Casteret 1948; Ambert et al. 2000
Druridge Bay,
UK
7ka BP Human, red deer, auroch Waddington 2010
Istanbul metro,
Turkey
6500-6000 BC Human Polat 2013
Low Hauxley,
UK
6296-6160 BP Human, red deer, auroch Eadie & Waddington 2013
Lydstep II, UK 6150±120BP -
5300±100BP
Human and mammal Murphy et al. 2014; Jones 2010
Goldcliff East,
UK
c 5500-5200 cal
BC
Human, deer, auroch,
bird
Bell 1995; Scales 2006, 2007
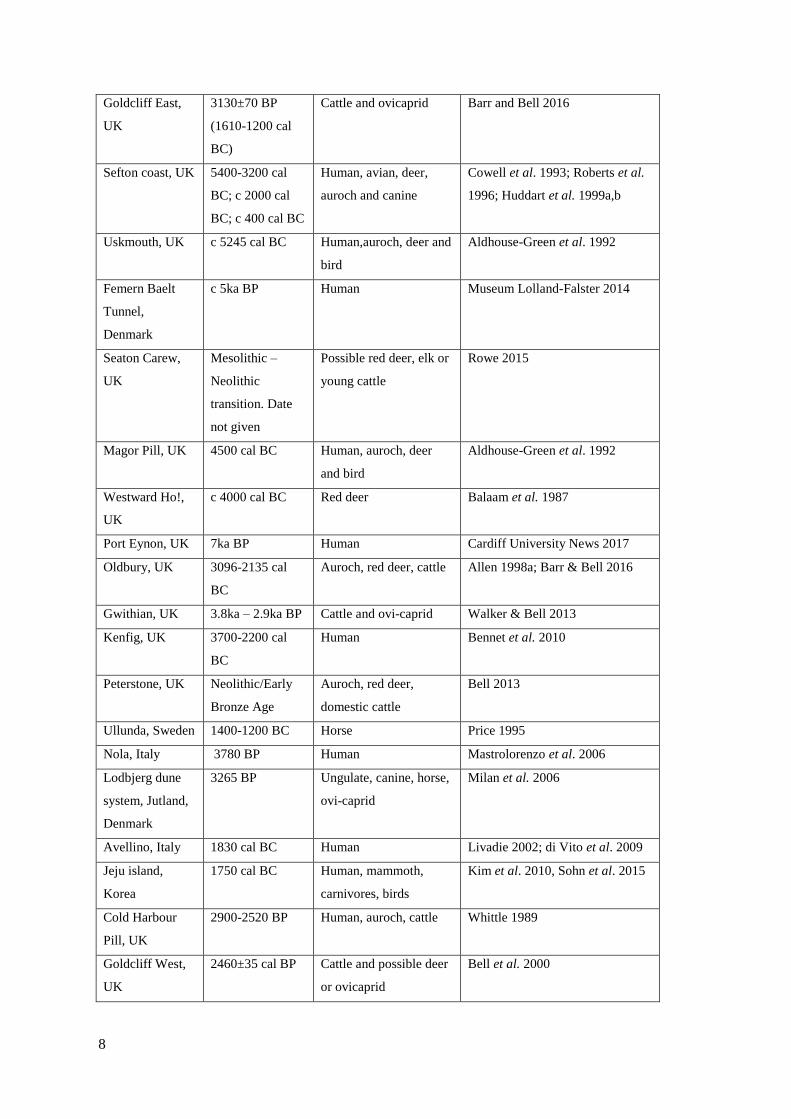
8
Goldcliff East,
UK
3130±70 BP
(1610-1200 cal
BC)
Cattle and ovicaprid
Barr and Bell 2016
Sefton coast, UK 5400-3200 cal
BC; c 2000 cal
BC; c 400 cal BC
Human, avian, deer,
auroch and canine
Cowell et al. 1993; Roberts et al.
1996; Huddart et al. 1999a,b
Uskmouth, UK c 5245 cal BC Human,auroch, deer and
bird
Aldhouse-Green et al. 1992
Femern Baelt
Tunnel,
Denmark
c 5ka BP Human Museum Lolland-Falster 2014
Seaton Carew,
UK
Mesolithic –
Neolithic
transition. Date
not given
Possible red deer, elk or
young cattle
Rowe 2015
Magor Pill, UK 4500 cal BC Human, auroch, deer
and bird
Aldhouse-Green et al. 1992
Westward Ho!,
UK
c 4000 cal BC Red deer Balaam et al. 1987
Port Eynon, UK 7ka BP Human Cardiff University News 2017
Oldbury, UK 3096-2135 cal
BC
Auroch, red deer, cattle Allen 1998a; Barr & Bell 2016
Gwithian, UK 3.8ka – 2.9ka BP Cattle and ovi-caprid Walker & Bell 2013
Kenfig, UK 3700-2200 cal
BC
Human Bennet et al. 2010
Peterstone, UK Neolithic/Early
Bronze Age
Auroch, red deer,
domestic cattle
Bell 2013
Ullunda, Sweden 1400-1200 BC Horse Price 1995
Nola, Italy 3780 BP Human Mastrolorenzo et al. 2006
Lodbjerg dune
system, Jutland,
Denmark
3265 BP Ungulate, canine, horse,
ovi-caprid
Milan et al. 2006
Avellino, Italy 1830 cal BC Human Livadie 2002; di Vito et al. 2009
Jeju island,
Korea
1750 cal BC Human, mammoth,
carnivores, birds
Kim et al. 2010, Sohn et al. 2015
Cold Harbour
Pill, UK
2900-2520 BP Human, auroch, cattle Whittle 1989
Goldcliff West,
UK
2460±35 cal BP Cattle and possible deer
or ovicaprid
Bell et al. 2000
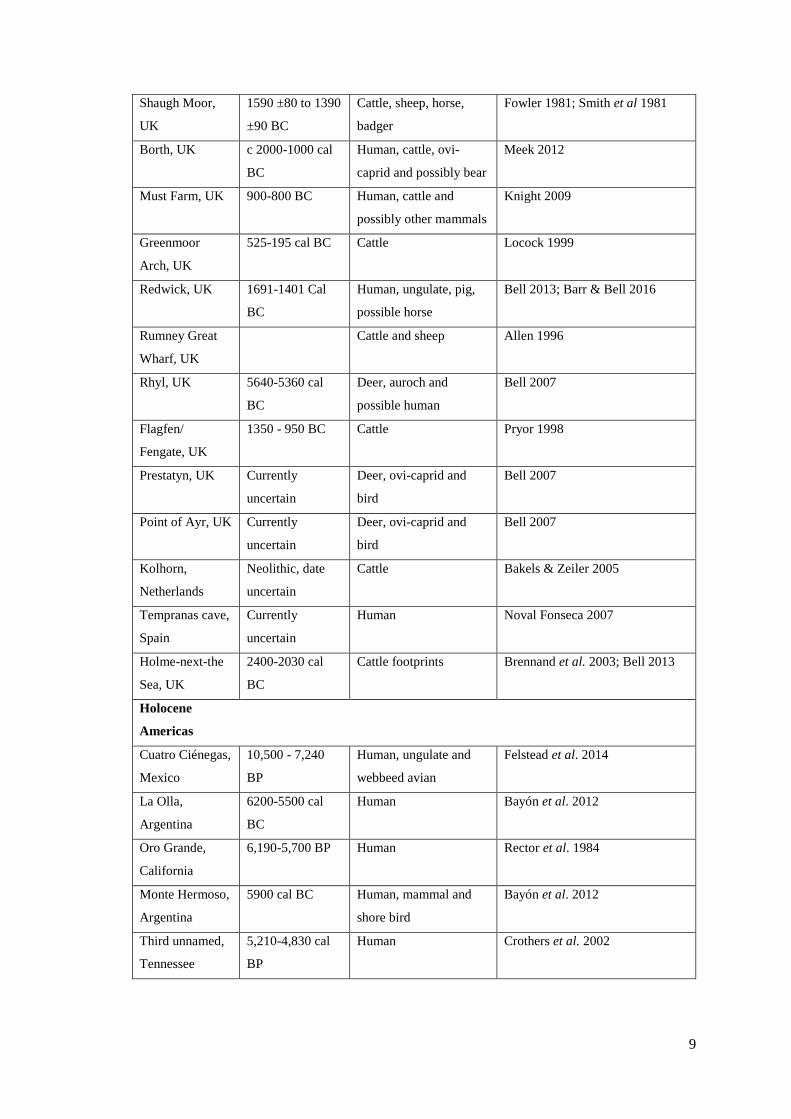
9
Shaugh Moor,
UK
1590 ±80 to 1390
±90 BC
Cattle, sheep, horse,
badger
Fowler 1981; Smith et al 1981
Borth, UK c 2000-1000 cal
BC
Human, cattle, ovi-
caprid and possibly bear
Meek 2012
Must Farm, UK 900-800 BC Human, cattle and
possibly other mammals
Knight 2009
Greenmoor
Arch, UK
525-195 cal BC Cattle Locock 1999
Redwick, UK 1691-1401 Cal
BC
Human, ungulate, pig,
possible horse
Bell 2013; Barr & Bell 2016
Rumney Great
Wharf, UK
Cattle and sheep Allen 1996
Rhyl, UK 5640-5360 cal
BC
Deer, auroch and
possible human
Bell 2007
Flagfen/
Fengate, UK
1350 - 950 BC Cattle Pryor 1998
Prestatyn, UK Currently
uncertain
Deer, ovi-caprid and
bird
Bell 2007
Point of Ayr, UK Currently
uncertain
Deer, ovi-caprid and
bird
Bell 2007
Kolhorn,
Netherlands
Neolithic, date
uncertain
Cattle Bakels & Zeiler 2005
Tempranas cave,
Spain
Currently
uncertain
Human Noval Fonseca 2007
Holme-next-the
Sea, UK
2400-2030 cal
BC
Cattle footprints Brennand et al. 2003; Bell 2013
Holocene
Americas
Cuatro Ciénegas,
Mexico
10,500 - 7,240
BP
Human, ungulate and
webbeed avian
Felstead et al. 2014
La Olla,
Argentina
6200-5500 cal
BC
Human Bayón et al. 2012
Oro Grande,
California
6,190-5,700 BP Human Rector et al. 1984
Monte Hermoso,
Argentina
5900 cal BC Human, mammal and
shore bird
Bayón et al. 2012
Third unnamed,
Tennessee
5,210-4,830 cal
BP
Human Crothers et al. 2002
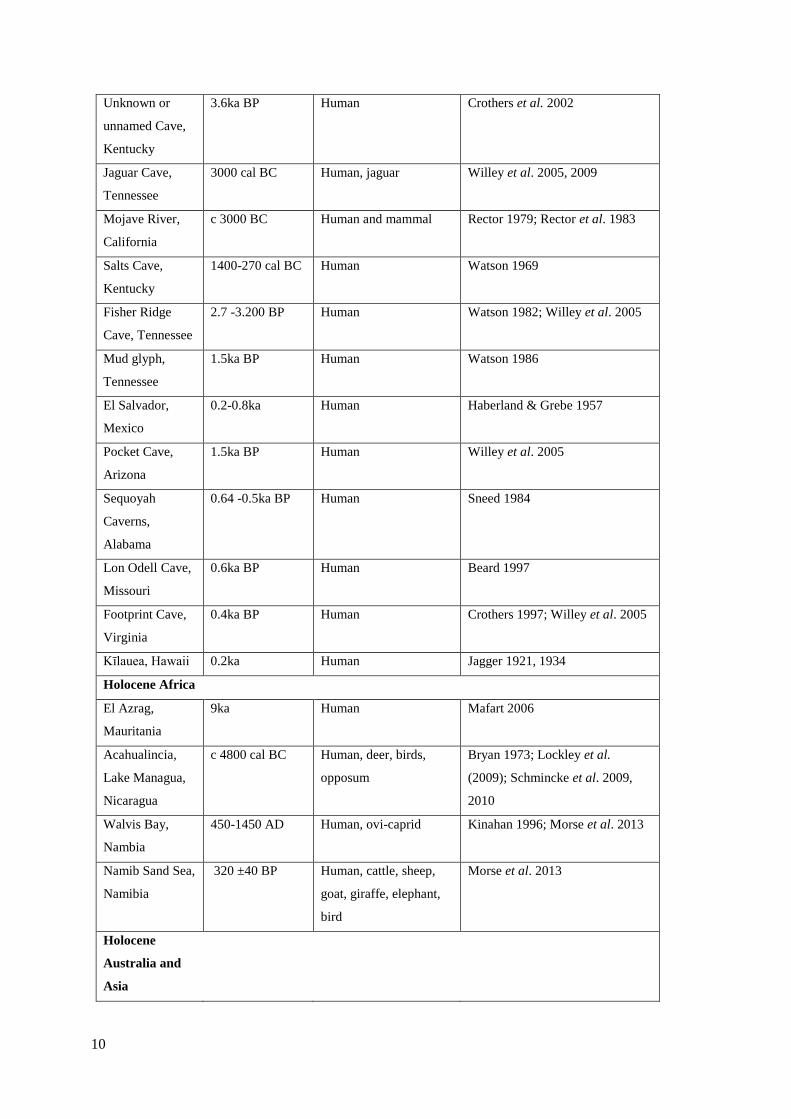
10
Unknown or
unnamed Cave,
Kentucky
3.6ka BP Human Crothers et al. 2002
Jaguar Cave,
Tennessee
3000 cal BC Human, jaguar Willey et al. 2005, 2009
Mojave River,
California
c 3000 BC Human and mammal Rector 1979; Rector et al. 1983
Salts Cave,
Kentucky
1400-270 cal BC Human Watson 1969
Fisher Ridge
Cave, Tennessee
2.7 -3.200 BP Human Watson 1982; Willey et al. 2005
Mud glyph,
Tennessee
1.5ka BP Human Watson 1986
El Salvador,
Mexico
0.2-0.8ka Human Haberland & Grebe 1957
Pocket Cave,
Arizona
1.5ka BP Human Willey et al. 2005
Sequoyah
Caverns,
Alabama
0.64 -0.5ka BP Human Sneed 1984
Lon Odell Cave,
Missouri
0.6ka BP Human Beard 1997
Footprint Cave,
Virginia
0.4ka BP Human Crothers 1997; Willey et al. 2005
Kīlauea, Hawaii 0.2ka Human Jagger 1921, 1934
Holocene Africa
El Azrag,
Mauritania
9ka Human Mafart 2006
Acahualincia,
Lake Managua,
Nicaragua
c 4800 cal BC Human, deer, birds,
opposum
Bryan 1973; Lockley et al.
(2009); Schmincke et al. 2009,
2010
Walvis Bay,
Nambia
450-1450 AD Human, ovi-caprid Kinahan 1996; Morse et al. 2013
Namib Sand Sea,
Namibia
320 ±40 BP Human, cattle, sheep,
goat, giraffe, elephant,
bird
Morse et al. 2013
Holocene
Australia and
Asia
11
Fowlers Bay,
Australia
6ka BP Human, kangaroo,
wallaby, emu
Belperio & Fotheringham 1990
Gunma, Japan 0.8 -1.6ka BP Horse Inoue & Sakaguchi 1997
Table 2.1. List of world-wide footprint-track sites.
The above list is not definitive as there may be many more sites that have not been reported on,
especially regarding mammalian and avian footprint-tracks. Dating footprint-tracks is
notoriously difficult and not always attempted, so often footprint dates have to be assumed
utilising associated archaeology or geology. Within this study calibrated dates are included
when they are available; when they were not included in the original publication the laboratory
number for the sample is included. This decision was made as the calibration curve is updated
every few years, and the writer did not want to quote dates that did not correspond directly with
the calibrated dates from the original research.
2.1.1 Palaeoichnology
The first published account of ichnology detailed preserved vertebrate footprints, investigated
by Reverend Henry Duncan in 1827 (Pemberton et al. 2008). The footprints that he found, the
Corncockle Muir footprints, were discovered in Scotland and underwent various different
taxonomic classifications as experts argued about what the footprint-tracks represented. In 1842
Richard Owen classified the prints as Testudo duncani, incorrectly believing that they were a
spoor of turtles. Reverend Buckland performed a neoichnological study, observing the tracks
created by modern crocodiles and tortoises and the prints that they created, the conclusion being
that the marks found on the sandstone of Scotland were created by the feet of ancient tortoises
(Pemberton et al. 2008). Reverend Buckland’s neoichnological study was the start of this form
of experimental ichnology, where modern animals were used as an analogue in understanding
the footprints of the past. Although two-hundred years have passed since then, this technique is
still highly relevant.
Since 1970 the discipline of ichnology has expanded, with hundreds of footprints being
reported. This does not mean that before this time people were not finding these imprints, they
may simply have been ignoring or misinterpreting them. In 1802 three-toed footprints about 12
inches in length were discovered in Massachusetts (Rose 2005). Local scholars were
encouraged to identify the makers of the marks; it was decided that they had been made by
‘Noahs raven’. This was actually one of the first recorded cases of a dinosaur footprint being
discovered, the prints being made not by a bird but by a large crocodile-like reptile. Cases
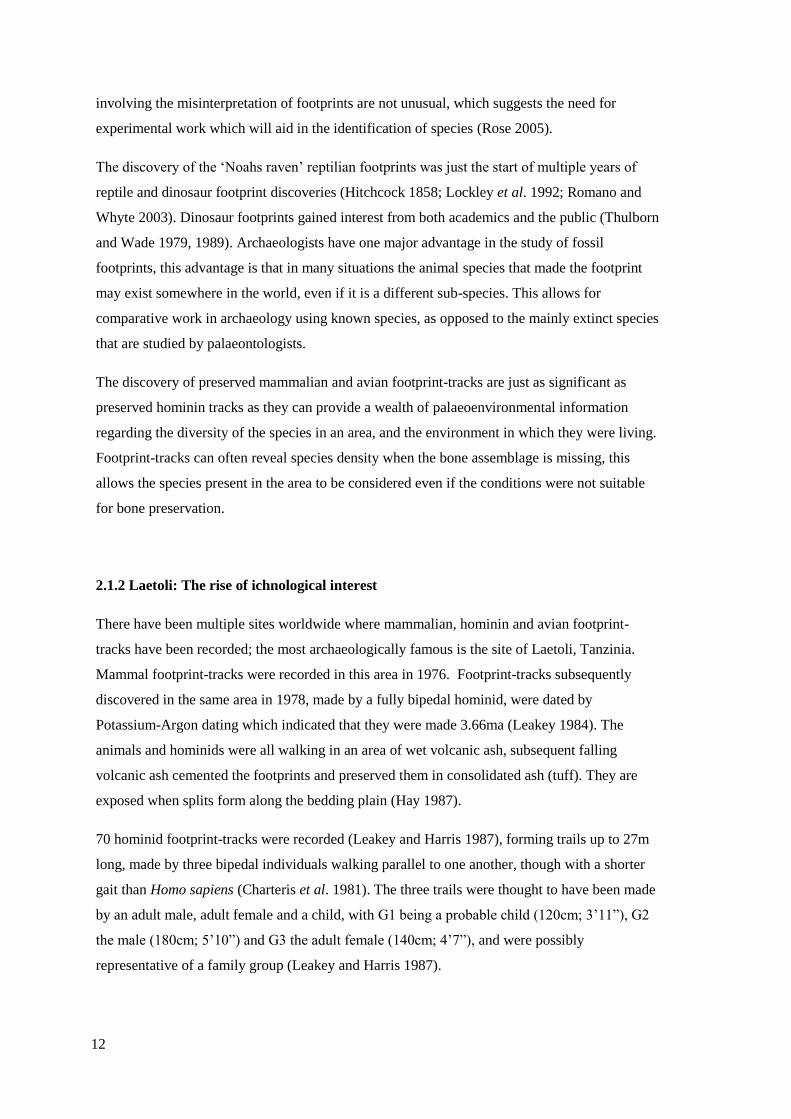
12
involving the misinterpretation of footprints are not unusual, which suggests the need for
experimental work which will aid in the identification of species (Rose 2005).
The discovery of the ‘Noahs raven’ reptilian footprints was just the start of multiple years of
reptile and dinosaur footprint discoveries (Hitchcock 1858; Lockley et al. 1992; Romano and
Whyte 2003). Dinosaur footprints gained interest from both academics and the public (Thulborn
and Wade 1979, 1989). Archaeologists have one major advantage in the study of fossil
footprints, this advantage is that in many situations the animal species that made the footprint
may exist somewhere in the world, even if it is a different sub-species. This allows for
comparative work in archaeology using known species, as opposed to the mainly extinct species
that are studied by palaeontologists.
The discovery of preserved mammalian and avian footprint-tracks are just as significant as
preserved hominin tracks as they can provide a wealth of palaeoenvironmental information
regarding the diversity of the species in an area, and the environment in which they were living.
Footprint-tracks can often reveal species density when the bone assemblage is missing, this
allows the species present in the area to be considered even if the conditions were not suitable
for bone preservation.
2.1.2 Laetoli: The rise of ichnological interest
There have been multiple sites worldwide where mammalian, hominin and avian footprint-
tracks have been recorded; the most archaeologically famous is the site of Laetoli, Tanzinia.
Mammal footprint-tracks were recorded in this area in 1976. Footprint-tracks subsequently
discovered in the same area in 1978, made by a fully bipedal hominid, were dated by
Potassium-Argon dating which indicated that they were made 3.66ma (Leakey 1984). The
animals and hominids were all walking in an area of wet volcanic ash, subsequent falling
volcanic ash cemented the footprints and preserved them in consolidated ash (tuff). They are
exposed when splits form along the bedding plain (Hay 1987).
70 hominid footprint-tracks were recorded (Leakey and Harris 1987), forming trails up to 27m
long, made by three bipedal individuals walking parallel to one another, though with a shorter
gait than Homo sapiens (Charteris et al. 1981). The three trails were thought to have been made
by an adult male, adult female and a child, with G1 being a probable child (120cm; 3’11”), G2
the male (180cm; 5’10”) and G3 the adult female (140cm; 4’7”), and were possibly
representative of a family group (Leakey and Harris 1987).

13
Approximately 150m away from the trails made by G1, G2 and G3, a new site (Site S) revealed
two further footprint-track trails made by two bipedal individuals (S1 and S2), S1 is thought to
be male (168cm; 5’6”), and S2 female (149cm; 4’10”) (Masao et al. 2016). The footprint-tracks
correspond to the same footprint-tuff G1-G3 were preserved in and were also parallel to them,
which suggests that they were contemporaneous.
Extensive research has been performed investigating the human bipedal biomechanics, and the
possibility that the footprints from Laetoli were created by apes with bent-knee-bent-hip bipedal
stances, or the Homo sapiens method of walking with extended limb biomechanics (Raichlen et
al. 2010). Bent-knee-bent-hip gaits have a much deeper toe depth in comparison to the extended
limb gait of humans. The Laetoli prints demonstrate very shallow toe depths, suggesting they
were made by straight legged individuals rather than those that walked with bent-knee-bent-hip,
indicating that by the Plio-Pleistocene hominids had evolved to walk with extended limbs
(Raichlen et al. 2010). The Laetoli footprint-tracks are generally thought to have been made by
Australopithecus afarensis.
As well as hominin footprint-tracks, 529 mammal and bird footprint-tracks were recorded at
Site S, with bovid dominating the record. The bird and mammal footprint-track record from
Laetoli suggests a palaeoenvironment with dry bushland, woodland, open grassland and riverine
forest, with the large amount of bovid suggestive of rainy season migration (Masao et al. 2016).
Due to erosion and the risk of physical removal of the prints, the area had to be re-covered
fairly soon after the 1970’s excavation. Casts of the footprints were taken before this occurred
for further study, so the analysis of Laetoli footprints in subsequent years has been from the
casts rather than the original footprint-tracks. It is important to be aware of this when
considering the Laetoli data, as it is possible that some casts may not accurately capture the
footprint dimensions appropriately. To provide further information for all those who would be
unable to access the footprints, researchers also created three-dimensional contour mapping by
performing very basic photogrammetry on the casts (Raichlen et al. 2010). Recent work by
Masao et al. (2016) has created accurate multi-image photogrammetry records directly from the
Site S footprint-tracks (Figure 2.1).
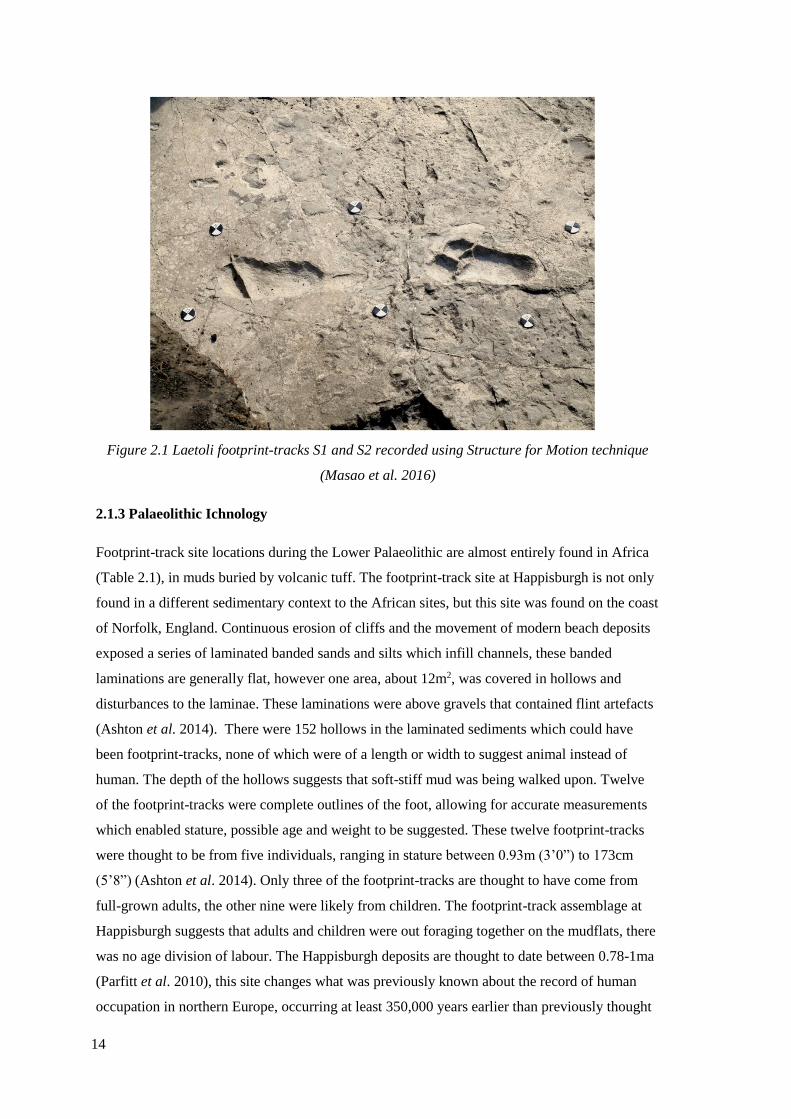
14
Figure 2.1 Laetoli footprint-tracks S1 and S2 recorded using Structure for Motion technique
(Masao et al. 2016)
2.1.3 Palaeolithic Ichnology
Footprint-track site locations during the Lower Palaeolithic are almost entirely found in Africa
(Table 2.1), in muds buried by volcanic tuff. The footprint-track site at Happisburgh is not only
found in a different sedimentary context to the African sites, but this site was found on the coast
of Norfolk, England. Continuous erosion of cliffs and the movement of modern beach deposits
exposed a series of laminated banded sands and silts which infill channels, these banded
laminations are generally flat, however one area, about 12m2, was covered in hollows and
disturbances to the laminae. These laminations were above gravels that contained flint artefacts
(Ashton et al. 2014). There were 152 hollows in the laminated sediments which could have
been footprint-tracks, none of which were of a length or width to suggest animal instead of
human. The depth of the hollows suggests that soft-stiff mud was being walked upon. Twelve
of the footprint-tracks were complete outlines of the foot, allowing for accurate measurements
which enabled stature, possible age and weight to be suggested. These twelve footprint-tracks
were thought to be from five individuals, ranging in stature between 0.93m (3’0”) to 173cm
(5’8”) (Ashton et al. 2014). Only three of the footprint-tracks are thought to have come from
full-grown adults, the other nine were likely from children. The footprint-track assemblage at
Happisburgh suggests that adults and children were out foraging together on the mudflats, there
was no age division of labour. The Happisburgh deposits are thought to date between 0.78-1ma
(Parfitt et al. 2010), this site changes what was previously known about the record of human
occupation in northern Europe, occurring at least 350,000 years earlier than previously thought
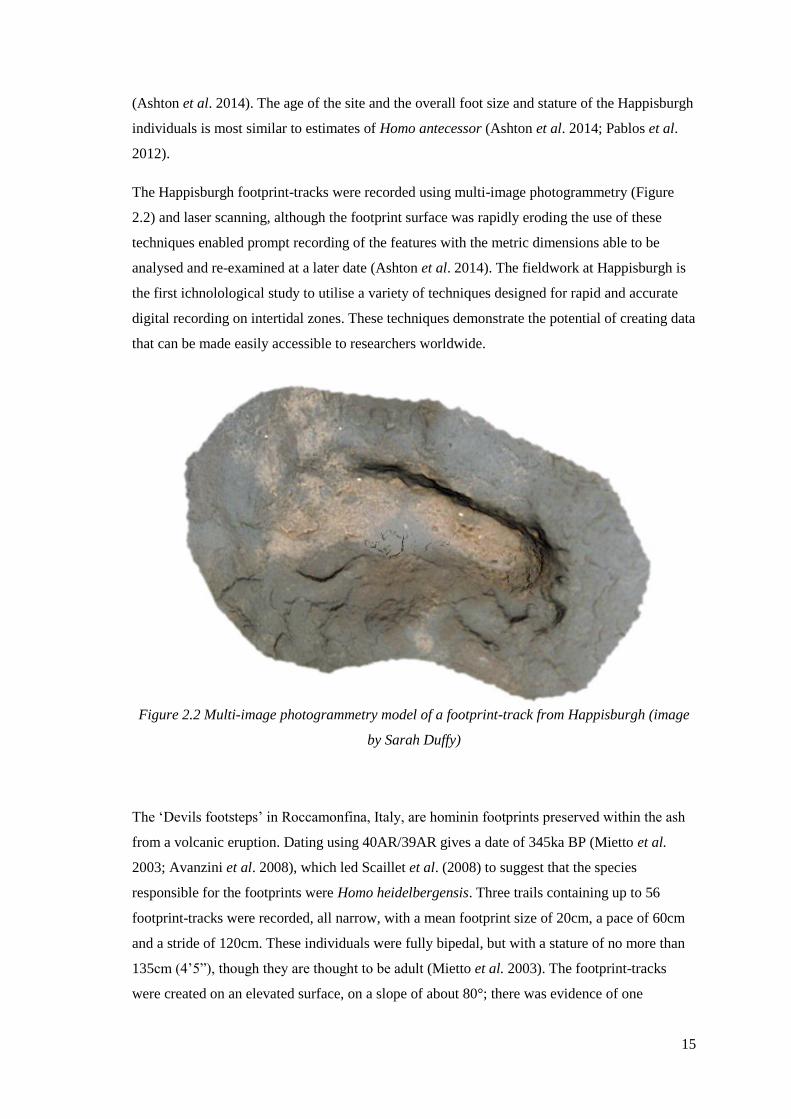
15
(Ashton et al. 2014). The age of the site and the overall foot size and stature of the Happisburgh
individuals is most similar to estimates of Homo antecessor (Ashton et al. 2014; Pablos et al.
2012).
The Happisburgh footprint-tracks were recorded using multi-image photogrammetry (Figure
2.2) and laser scanning, although the footprint surface was rapidly eroding the use of these
techniques enabled prompt recording of the features with the metric dimensions able to be
analysed and re-examined at a later date (Ashton et al. 2014). The fieldwork at Happisburgh is
the first ichnolological study to utilise a variety of techniques designed for rapid and accurate
digital recording on intertidal zones. These techniques demonstrate the potential of creating data
that can be made easily accessible to researchers worldwide.
Figure 2.2 Multi-image photogrammetry model of a footprint-track from Happisburgh (image
by Sarah Duffy)
The ‘Devils footsteps’ in Roccamonfina, Italy, are hominin footprints preserved within the ash
from a volcanic eruption. Dating using 40AR/39AR gives a date of 345ka BP (Mietto et al.
2003; Avanzini et al. 2008), which led Scaillet et al. (2008) to suggest that the species
responsible for the footprints were Homo heidelbergensis. Three trails containing up to 56
footprint-tracks were recorded, all narrow, with a mean footprint size of 20cm, a pace of 60cm
and a stride of 120cm. These individuals were fully bipedal, but with a stature of no more than
135cm (4’5”), though they are thought to be adult (Mietto et al. 2003). The footprint-tracks
were created on an elevated surface, on a slope of about 80°; there was evidence of one
16
individual slipping on this elevation, as there were handprints on the surface as well as
footprints. The slope may affect the appearance of the footprints as opposed to footprints
created on a flat surface, which could lead to a misinterpretation of stature data if relying upon
the gait alone. Plans, photographs and diagrams were made to record these footprints, although
there is little detail about the precise method utilised for recording.
Many footprint-tracks from the Palaeolithic are difficult to date due to poor preservation, or not
being dated or recorded thoroughly when first discovered, resulting in loss of data. Ciur-Izbuc
Cave, Romania, is an example of this; the footprint-tracks were first discovered in 1965. They
were made in clay/silt sediment on the cave floor, the sediments were possibly transported there
through water flow such as flooding (Webb et al. 2014). There were approximately 400 human
footprint-tracks in the Ciur-Izbuc cave, excavators marked 230 of these with metal flags
inserted into the soft sediment by the footprint-tracks. Although recording began it was never
fully completed; Rişcutia and Rişcutia (1970) published information about 188 of the footprint-
tracks that had been measured and cast, however the subsequent data about the remaining 212
footprint-tracks was lost (Webb et al. 2014). Archaeologists returned in 2012 to attempt to
carry on recording, although by this point vast amounts of data had been lost due to people
entering the cave and walking upon the footprint-tracks. Webb et al. (2014) radiocarbon dated
the site from bear bone fragments to 36.5ka cal BP (Poz54805), and created stature estimates
for the individuals recorded by Rişcutia and Rişcutia (1970), with one tall male evident (188cm,
6’2”). It is thought that six or seven individuals made the footprints in this cave and would have
been in the cave less than 10 minutes as there are very few footprint-tracks compared to the size
of the cave. This may indicate the entrance to the cave collapsed soon after the footprint-tracks
were made (Webb et al. 2014).
Children are prominent in the footprint-track record, which is significant as they are often
invisible within archaeological datasets. The site of Gombore II-2, Melka Kunture, Ethiopia is
rich in archaeological data, with evidence of butchery and flint knapping activities (Chavaillon
and Piperno 2004), as well as preserved footprint-tracks (Altamura et al. 2018). The footprint-
tracks were made upon silty substrate at the edge of a water source; this body of water would
have periodically flooded the footprint area, depositing fine-grained sediment upon which new
footprint-tracks were then made. The site was then preserved by an ash flow surge dated to
0.7ma (Morgan et al. 2012). Footprint-tracks were made by a variety of species including
gazelle, hippopotamus, and birds (Altamura et al. 2018). 11 possible human footprint-tracks
were recorded in this area, two were adults over 18 years old, the rest were children all
estimated to be aged three or younger, with three footprint-tracks thought to belong to infants
under 12 months old. Altamura et al. (2018) tentatively suggest that the footprint-track evidence
17
at this site indicate that children were present during knapping and butchery activities and may
even have handled the tools so that they could learn important skills.
Theopetra Cave, Greece, dated 48ka BP, contained footprint-track evidence of children, made
in clay at the bottom of the cave. The footprint-tracks were made by four juveniles aged
between four and seven years old (Facorellis et al. 2001), indicating that these children may
have had a specific purpose in these liminal areas, either due to their small size and ability to
get further into a cave to get at specific resources, for ritual reasons, or to play. Fontanet cave,
France contains cave art near the front of the cave dated to 13-14ka BP, and further back into
the cave are foot, knee and handprints made by a child who appeared to have been chasing a
puppy or a fox across the clay floor (Delteil et al. 1972; Clottes 1975; Bahn & Vertut 1988).
The abundance of juvenile footprint-tracks is seen throughout the Palaeolithic, from a variety of
different contexts. The children of prehistory appear to have been involved in activities, being
given responsibilities from a young age as well as being allowed to play.
The increase in the recognition and recordings of Palaeolithic footprint-track sites has resulted
in the utilisation of unconventional methods to better understand prehistoric individuals. At
Willandra Lakes, Australia, Webb et al. (2006) recorded 123 human footprint-tracks made by
approximately eight individuals from a group of children, sub-adults and adults. Subsequently
approximately 700 footprint-tracks from a variety of species have been recorded, 400 of which
have been identified as humans who formed 23 trails (Webb et al. 2006; Webb 2007). The
footprint-tracks were exposed in laminated calcareous silts, on a 700m2 hardpan ‘pavement’
near the shoreline of a lake basin, they had been buried and preserved by Aeolian sand. The
footprint-tracks were dated by Optically Stimulated Luminescence to 23-19ka BP (Webb et al.
2006; Webb 2007). Although these footprints are from the Palaeolithic, the advantages of a site
such as Willandra Lakes is that Australian Aborigines still live near the area; they are generally
unshod and so their anatomy has not been altered artificially by shoes. A large study involving
measuring the footprints of 478 central Australian Aborigines was performed by Campbell et al.
(1936). With these dimensions Webb et al. (2006) interpreted the prehistoric data and were able
to make suggestions about the presence of children and adults, and the statures of individuals.
One individual, T1, had an estimated stature of 1.98±0.15m (6’5”), another individual, T8, had
an estimated stature of 1.94±0.15m (6’4”) and had a pace that suggested they were running at
approximately 20 km/hr (Webb et al. 2006). The lakes were most likely being utilised by the
hominins to hunt terrestrial game such as kangaroo, lake birds, to fish and to gather food (Webb
et al. 2006).
The Willandra Lakes evidence demonstrates the importance of experimental work with modern
human footprints, enabling footprints to be assigned stature using scientific methods rather than
18
assumptions. Although Webb et al. (2006) provide a thorough analysis of the footprint-tracks,
they do not specify the way in which they recorded the footprints or any exclusion factors, such
as excluding measurements from indistinct shapes. They also work on the assumption that the
foot to stature correlation is universal among humans, whereas the correlation does in fact seem
to be influenced by geographical origins among H.sapiens (Chapter 2, Table 2.2).
2.1.4 Mesolithic Ichnology
Mesolithic footprint-tracks are predominately recorded in Europe, with intertidal zones in
Britain being the main sites for this ichnological research (Table 2.1). At Low Hauxley and
Druridge, Northumberland, footprint-tracks from Mesolithic adult and juvenile H.sapiens, and
cloven-hoofed animals such as auroch and red deer have been recorded on exposed intertidal
peat beds overlain with sand (Eadie and Waddington 2013). At Low Hauxley the peat where
there have been 269 possible footprint-tracks identified was dated to 6296 ±34 BP (OxA-22735;
5330–5210 cal BC; Eadie and Waddington 2013). This peat was located below a Bronze Age
cemetery.
90 of the footprint-tracks were identified as possible human, and 88 possible animal footprint-
tracks. A further 91 depressions were identified as disturbance to the peat but were too
indistinct to identify. The human footprint-tracks are relatively short, the smallest is 8cm in
length, and the longest 22cm, indicating children and possibly adult females made the footprint-
tracks, small adult males may have made some of the larger footprints. It is suggested that due
to the lack of toe impressions preserved and the ‘smooth’ edges of the footprint-tracks that these
individuals were shod (Figure 2.3; Eadie and Waddington 2013). This may be the case,
however it is also conceivable that the peat had experienced erosion and any anatomical detail
has been smoothed, or that the surface was relatively soft when originally walked upon
preventing detailed preservation. The footprint-tracks are noted as being ‘smudged’ and having
evidence of ‘dragging’, which again may be caused by a taphonomic process or is evidence that
the supposed footprint-tracks seen in the peat are not from the actual footprint level. Figure 2.3
is the image provided of the human footprint-tracks from this site, the author would argue that
although it is possible that these individuals were all shod, the smooth appearance of the peat
and the edges of the footprint-tracks is more suggestive of erosion of the peat rather than
evidence of footwear. Cloven footprint-tracks were mainly from red deer, though wild boar and
auroch were also present within the assemblage (Eadie and Waddington 2013). There has not
been a huge amount of research dedicated to these footprint-tracks, they are only briefly
addressed in the site report and there is no information regarding how they were recorded.
Although mentioned briefly, the recognition of footprint-tracks at this site is important. The
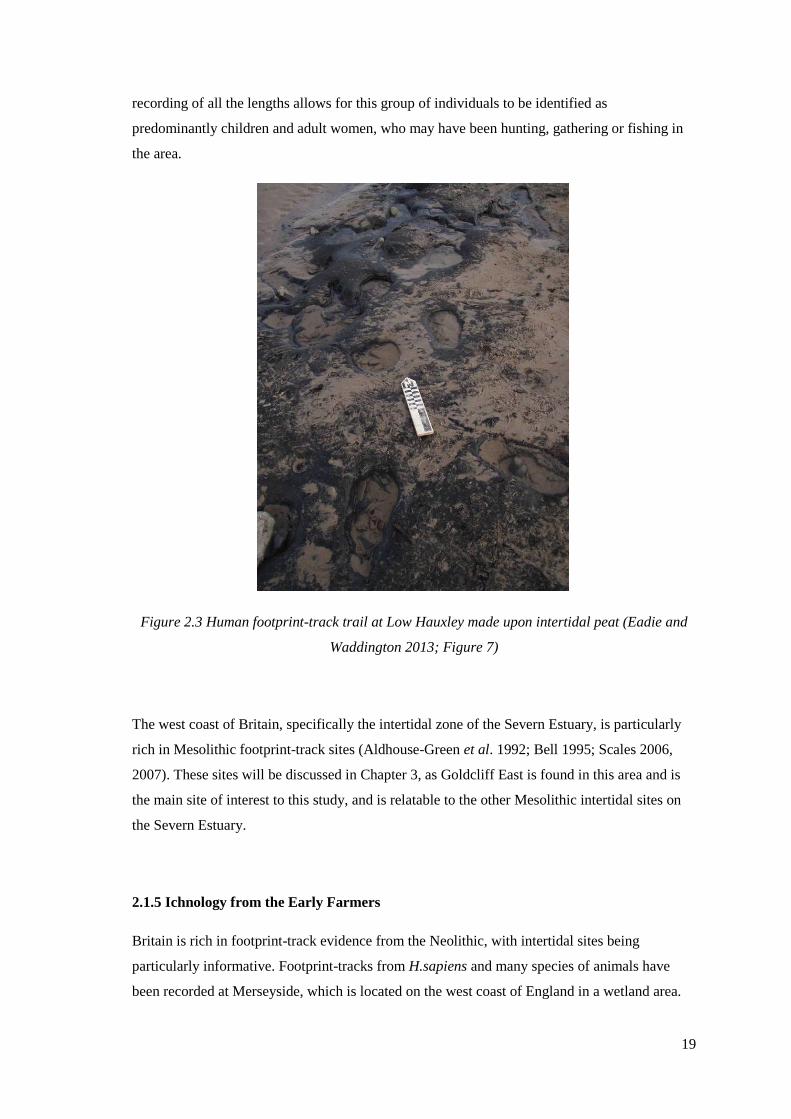
19
recording of all the lengths allows for this group of individuals to be identified as
predominantly children and adult women, who may have been hunting, gathering or fishing in
the area.
Figure 2.3 Human footprint-track trail at Low Hauxley made upon intertidal peat (Eadie and
Waddington 2013; Figure 7)
The west coast of Britain, specifically the intertidal zone of the Severn Estuary, is particularly
rich in Mesolithic footprint-track sites (Aldhouse-Green et al. 1992; Bell 1995; Scales 2006,
2007). These sites will be discussed in Chapter 3, as Goldcliff East is found in this area and is
the main site of interest to this study, and is relatable to the other Mesolithic intertidal sites on
the Severn Estuary.
2.1.5 Ichnology from the Early Farmers
Britain is rich in footprint-track evidence from the Neolithic, with intertidal sites being
particularly informative. Footprint-tracks from H.sapiens and many species of animals have
been recorded at Merseyside, which is located on the west coast of England in a wetland area.
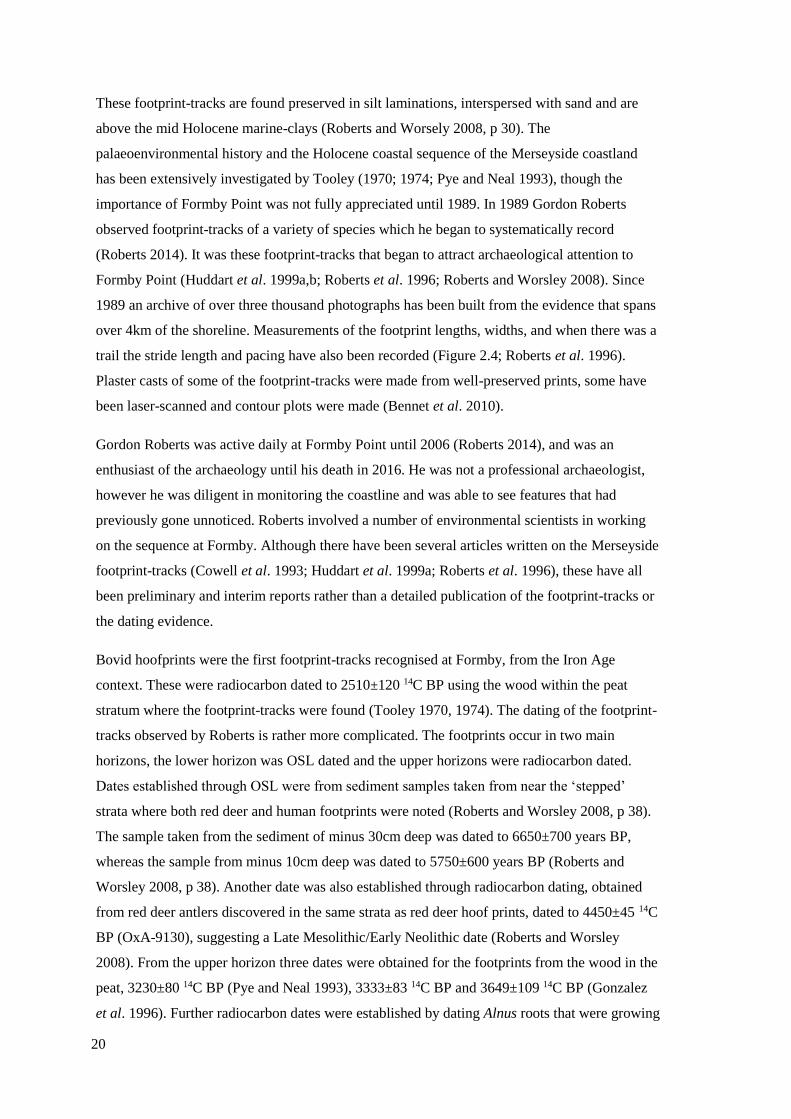
20
These footprint-tracks are found preserved in silt laminations, interspersed with sand and are
above the mid Holocene marine-clays (Roberts and Worsely 2008, p 30). The
palaeoenvironmental history and the Holocene coastal sequence of the Merseyside coastland
has been extensively investigated by Tooley (1970; 1974; Pye and Neal 1993), though the
importance of Formby Point was not fully appreciated until 1989. In 1989 Gordon Roberts
observed footprint-tracks of a variety of species which he began to systematically record
(Roberts 2014). It was these footprint-tracks that began to attract archaeological attention to
Formby Point (Huddart et al. 1999a,b; Roberts et al. 1996; Roberts and Worsley 2008). Since
1989 an archive of over three thousand photographs has been built from the evidence that spans
over 4km of the shoreline. Measurements of the footprint lengths, widths, and when there was a
trail the stride length and pacing have also been recorded (Figure 2.4; Roberts et al. 1996).
Plaster casts of some of the footprint-tracks were made from well-preserved prints, some have
been laser-scanned and contour plots were made (Bennet et al. 2010).
Gordon Roberts was active daily at Formby Point until 2006 (Roberts 2014), and was an
enthusiast of the archaeology until his death in 2016. He was not a professional archaeologist,
however he was diligent in monitoring the coastline and was able to see features that had
previously gone unnoticed. Roberts involved a number of environmental scientists in working
on the sequence at Formby. Although there have been several articles written on the Merseyside
footprint-tracks (Cowell et al. 1993; Huddart et al. 1999a; Roberts et al. 1996), these have all
been preliminary and interim reports rather than a detailed publication of the footprint-tracks or
the dating evidence.
Bovid hoofprints were the first footprint-tracks recognised at Formby, from the Iron Age
context. These were radiocarbon dated to 2510±120 14C BP using the wood within the peat
stratum where the footprint-tracks were found (Tooley 1970, 1974). The dating of the footprint-
tracks observed by Roberts is rather more complicated. The footprints occur in two main
horizons, the lower horizon was OSL dated and the upper horizons were radiocarbon dated.
Dates established through OSL were from sediment samples taken from near the ‘stepped’
strata where both red deer and human footprints were noted (Roberts and Worsley 2008, p 38).
The sample taken from the sediment of minus 30cm deep was dated to 6650±700 years BP,
whereas the sample from minus 10cm deep was dated to 5750±600 years BP (Roberts and
Worsley 2008, p 38). Another date was also established through radiocarbon dating, obtained
from red deer antlers discovered in the same strata as red deer hoof prints, dated to 4450±45 14C
BP (OxA-9130), suggesting a Late Mesolithic/Early Neolithic date (Roberts and Worsley
2008). From the upper horizon three dates were obtained for the footprints from the wood in the
peat, 3230±80 14C BP (Pye and Neal 1993), 3333±83 14C BP and 3649±109 14C BP (Gonzalez
et al. 1996). Further radiocarbon dates were established by dating Alnus roots that were growing
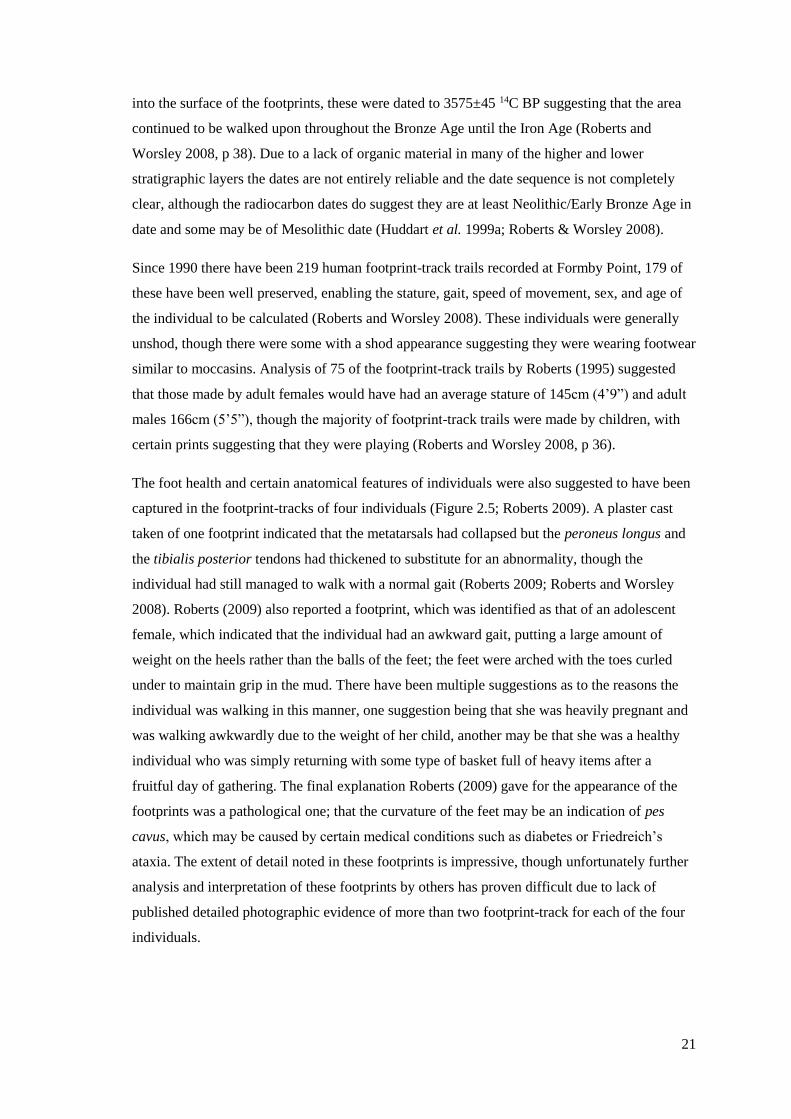
21
into the surface of the footprints, these were dated to 3575±45 14C BP suggesting that the area
continued to be walked upon throughout the Bronze Age until the Iron Age (Roberts and
Worsley 2008, p 38). Due to a lack of organic material in many of the higher and lower
stratigraphic layers the dates are not entirely reliable and the date sequence is not completely
clear, although the radiocarbon dates do suggest they are at least Neolithic/Early Bronze Age in
date and some may be of Mesolithic date (Huddart et al. 1999a; Roberts & Worsley 2008).
Since 1990 there have been 219 human footprint-track trails recorded at Formby Point, 179 of
these have been well preserved, enabling the stature, gait, speed of movement, sex, and age of
the individual to be calculated (Roberts and Worsley 2008). These individuals were generally
unshod, though there were some with a shod appearance suggesting they were wearing footwear
similar to moccasins. Analysis of 75 of the footprint-track trails by Roberts (1995) suggested
that those made by adult females would have had an average stature of 145cm (4’9”) and adult
males 166cm (5’5”), though the majority of footprint-track trails were made by children, with
certain prints suggesting that they were playing (Roberts and Worsley 2008, p 36).
The foot health and certain anatomical features of individuals were also suggested to have been
captured in the footprint-tracks of four individuals (Figure 2.5; Roberts 2009). A plaster cast
taken of one footprint indicated that the metatarsals had collapsed but the peroneus longus and
the tibialis posterior tendons had thickened to substitute for an abnormality, though the
individual had still managed to walk with a normal gait (Roberts 2009; Roberts and Worsley
2008). Roberts (2009) also reported a footprint, which was identified as that of an adolescent
female, which indicated that the individual had an awkward gait, putting a large amount of
weight on the heels rather than the balls of the feet; the feet were arched with the toes curled
under to maintain grip in the mud. There have been multiple suggestions as to the reasons the
individual was walking in this manner, one suggestion being that she was heavily pregnant and
was walking awkwardly due to the weight of her child, another may be that she was a healthy
individual who was simply returning with some type of basket full of heavy items after a
fruitful day of gathering. The final explanation Roberts (2009) gave for the appearance of the
footprints was a pathological one; that the curvature of the feet may be an indication of pes
cavus, which may be caused by certain medical conditions such as diabetes or Friedreich’s
ataxia. The extent of detail noted in these footprints is impressive, though unfortunately further
analysis and interpretation of these footprints by others has proven difficult due to lack of
published detailed photographic evidence of more than two footprint-track for each of the four
individuals.
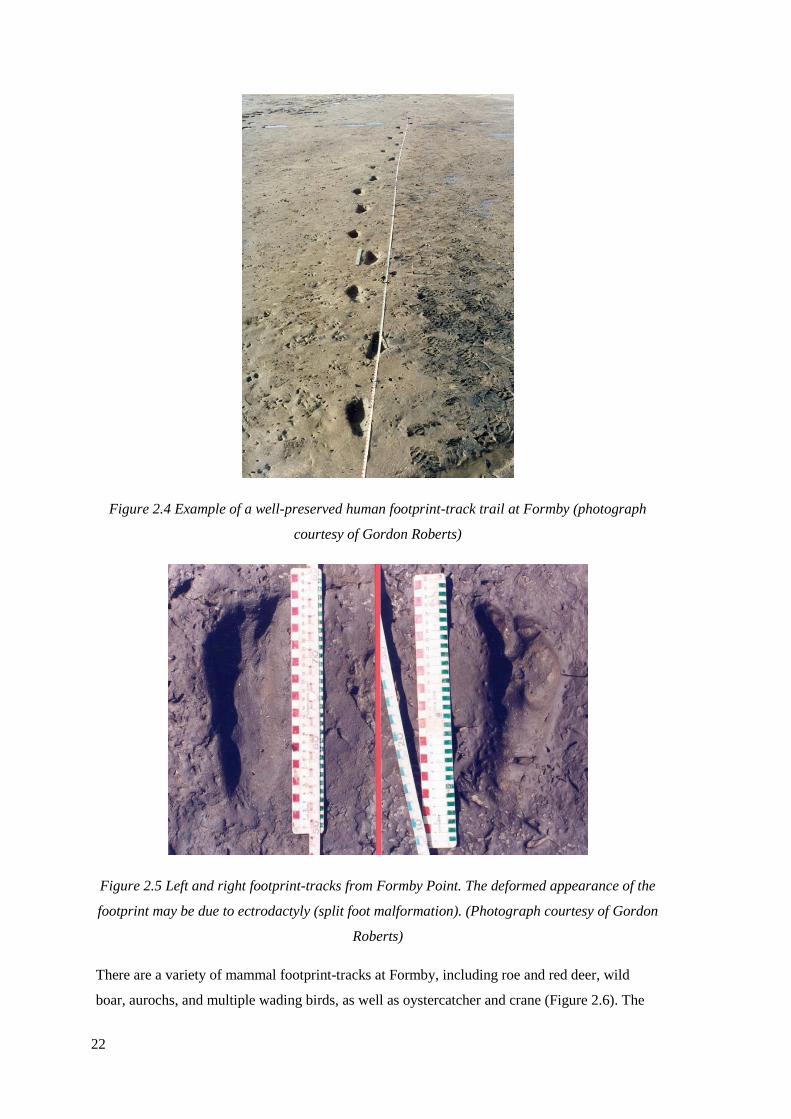
22
Figure 2.4 Example of a well-preserved human footprint-track trail at Formby (photograph
courtesy of Gordon Roberts)
Figure 2.5 Left and right footprint-tracks from Formby Point. The deformed appearance of the
footprint may be due to ectrodactyly (split foot malformation). (Photograph courtesy of Gordon
Roberts)
There are a variety of mammal footprint-tracks at Formby, including roe and red deer, wild
boar, aurochs, and multiple wading birds, as well as oystercatcher and crane (Figure 2.6). The
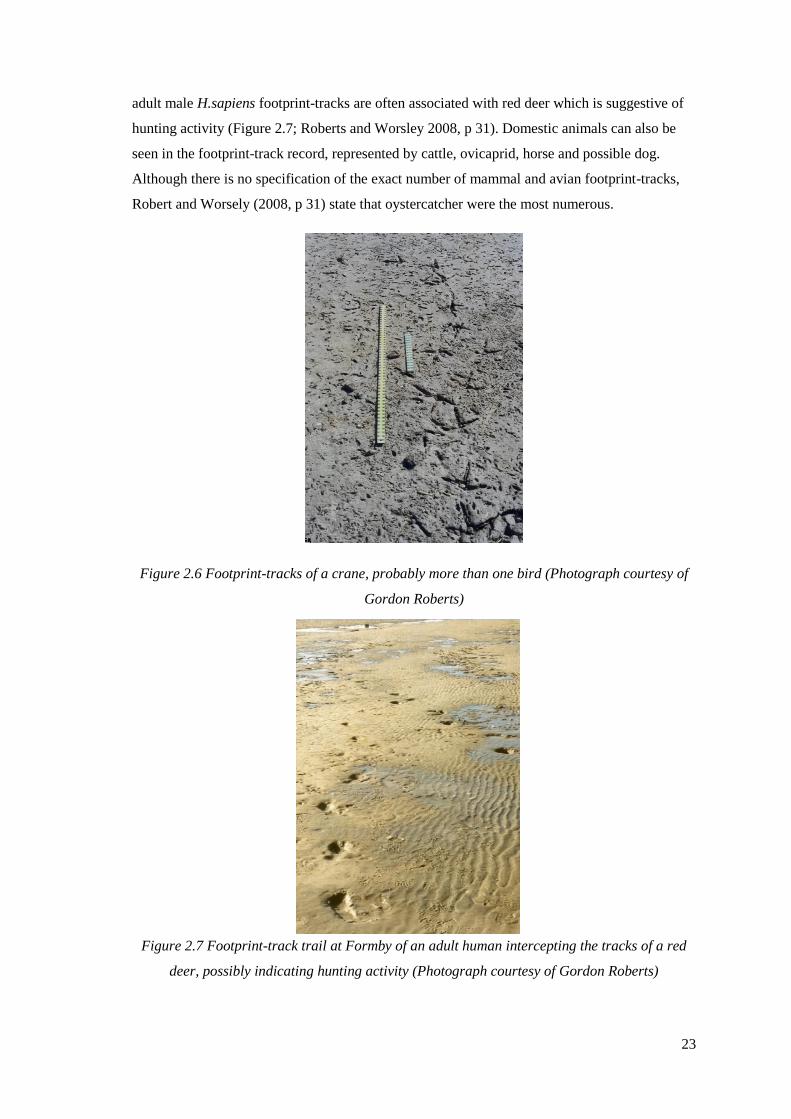
23
adult male H.sapiens footprint-tracks are often associated with red deer which is suggestive of
hunting activity (Figure 2.7; Roberts and Worsley 2008, p 31). Domestic animals can also be
seen in the footprint-track record, represented by cattle, ovicaprid, horse and possible dog.
Although there is no specification of the exact number of mammal and avian footprint-tracks,
Robert and Worsely (2008, p 31) state that oystercatcher were the most numerous.
Figure 2.6 Footprint-tracks of a crane, probably more than one bird (Photograph courtesy of
Gordon Roberts)
Figure 2.7 Footprint-track trail at Formby of an adult human intercepting the tracks of a red
deer, possibly indicating hunting activity (Photograph courtesy of Gordon Roberts)
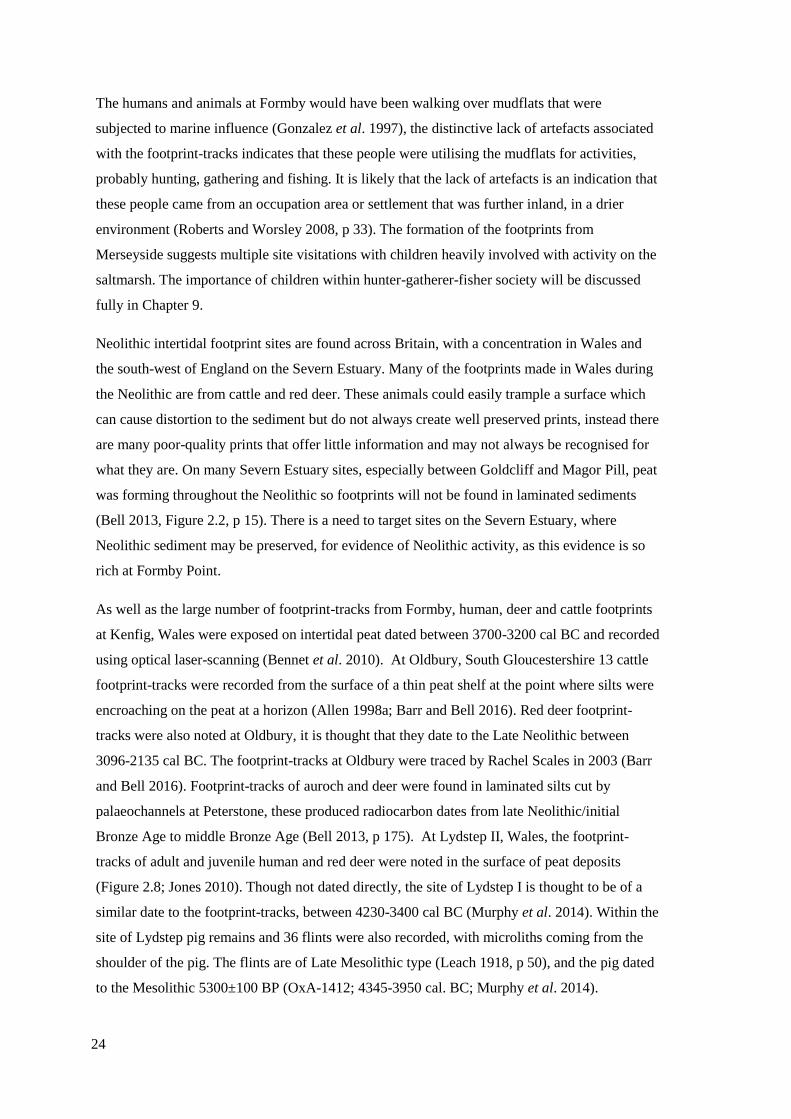
24
The humans and animals at Formby would have been walking over mudflats that were
subjected to marine influence (Gonzalez et al. 1997), the distinctive lack of artefacts associated
with the footprint-tracks indicates that these people were utilising the mudflats for activities,
probably hunting, gathering and fishing. It is likely that the lack of artefacts is an indication that
these people came from an occupation area or settlement that was further inland, in a drier
environment (Roberts and Worsley 2008, p 33). The formation of the footprints from
Merseyside suggests multiple site visitations with children heavily involved with activity on the
saltmarsh. The importance of children within hunter-gatherer-fisher society will be discussed
fully in Chapter 9.
Neolithic intertidal footprint sites are found across Britain, with a concentration in Wales and
the south-west of England on the Severn Estuary. Many of the footprints made in Wales during
the Neolithic are from cattle and red deer. These animals could easily trample a surface which
can cause distortion to the sediment but do not always create well preserved prints, instead there
are many poor-quality prints that offer little information and may not always be recognised for
what they are. On many Severn Estuary sites, especially between Goldcliff and Magor Pill, peat
was forming throughout the Neolithic so footprints will not be found in laminated sediments
(Bell 2013, Figure 2.2, p 15). There is a need to target sites on the Severn Estuary, where
Neolithic sediment may be preserved, for evidence of Neolithic activity, as this evidence is so
rich at Formby Point.
As well as the large number of footprint-tracks from Formby, human, deer and cattle footprints
at Kenfig, Wales were exposed on intertidal peat dated between 3700-3200 cal BC and recorded
using optical laser-scanning (Bennet et al. 2010). At Oldbury, South Gloucestershire 13 cattle
footprint-tracks were recorded from the surface of a thin peat shelf at the point where silts were
encroaching on the peat at a horizon (Allen 1998a; Barr and Bell 2016). Red deer footprint-
tracks were also noted at Oldbury, it is thought that they date to the Late Neolithic between
3096-2135 cal BC. The footprint-tracks at Oldbury were traced by Rachel Scales in 2003 (Barr
and Bell 2016). Footprint-tracks of auroch and deer were found in laminated silts cut by
palaeochannels at Peterstone, these produced radiocarbon dates from late Neolithic/initial
Bronze Age to middle Bronze Age (Bell 2013, p 175). At Lydstep II, Wales, the footprint-
tracks of adult and juvenile human and red deer were noted in the surface of peat deposits
(Figure 2.8; Jones 2010). Though not dated directly, the site of Lydstep I is thought to be of a
similar date to the footprint-tracks, between 4230-3400 cal BC (Murphy et al. 2014). Within the
site of Lydstep pig remains and 36 flints were also recorded, with microliths coming from the
shoulder of the pig. The flints are of Late Mesolithic type (Leach 1918, p 50), and the pig dated
to the Mesolithic 5300±100 BP (OxA-1412; 4345-3950 cal. BC; Murphy et al. 2014).
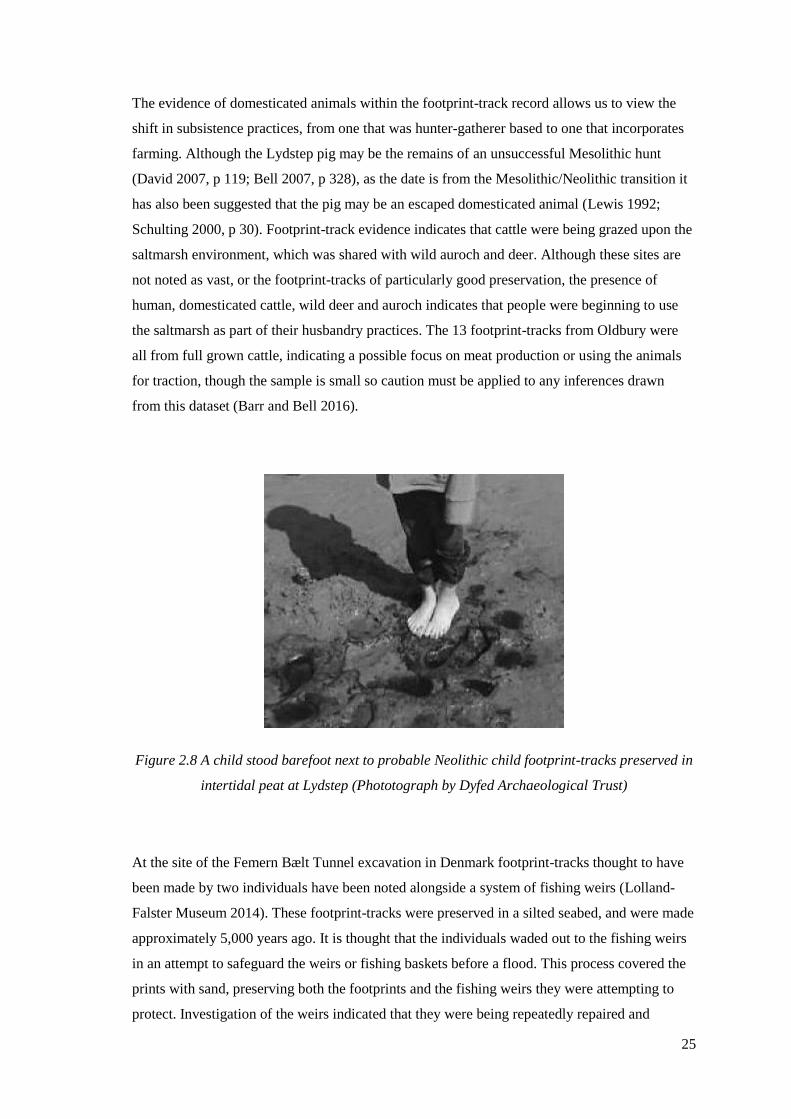
25
The evidence of domesticated animals within the footprint-track record allows us to view the
shift in subsistence practices, from one that was hunter-gatherer based to one that incorporates
farming. Although the Lydstep pig may be the remains of an unsuccessful Mesolithic hunt
(David 2007, p 119; Bell 2007, p 328), as the date is from the Mesolithic/Neolithic transition it
has also been suggested that the pig may be an escaped domesticated animal (Lewis 1992;
Schulting 2000, p 30). Footprint-track evidence indicates that cattle were being grazed upon the
saltmarsh environment, which was shared with wild auroch and deer. Although these sites are
not noted as vast, or the footprint-tracks of particularly good preservation, the presence of
human, domesticated cattle, wild deer and auroch indicates that people were beginning to use
the saltmarsh as part of their husbandry practices. The 13 footprint-tracks from Oldbury were
all from full grown cattle, indicating a possible focus on meat production or using the animals
for traction, though the sample is small so caution must be applied to any inferences drawn
from this dataset (Barr and Bell 2016).
Figure 2.8 A child stood barefoot next to probable Neolithic child footprint-tracks preserved in
intertidal peat at Lydstep (Phototograph by Dyfed Archaeological Trust)
At the site of the Femern Bælt Tunnel excavation in Denmark footprint-tracks thought to have
been made by two individuals have been noted alongside a system of fishing weirs (Lolland-
Falster Museum 2014). These footprint-tracks were preserved in a silted seabed, and were made
approximately 5,000 years ago. It is thought that the individuals waded out to the fishing weirs
in an attempt to safeguard the weirs or fishing baskets before a flood. This process covered the
prints with sand, preserving both the footprints and the fishing weirs they were attempting to
protect. Investigation of the weirs indicated that they were being repeatedly repaired and
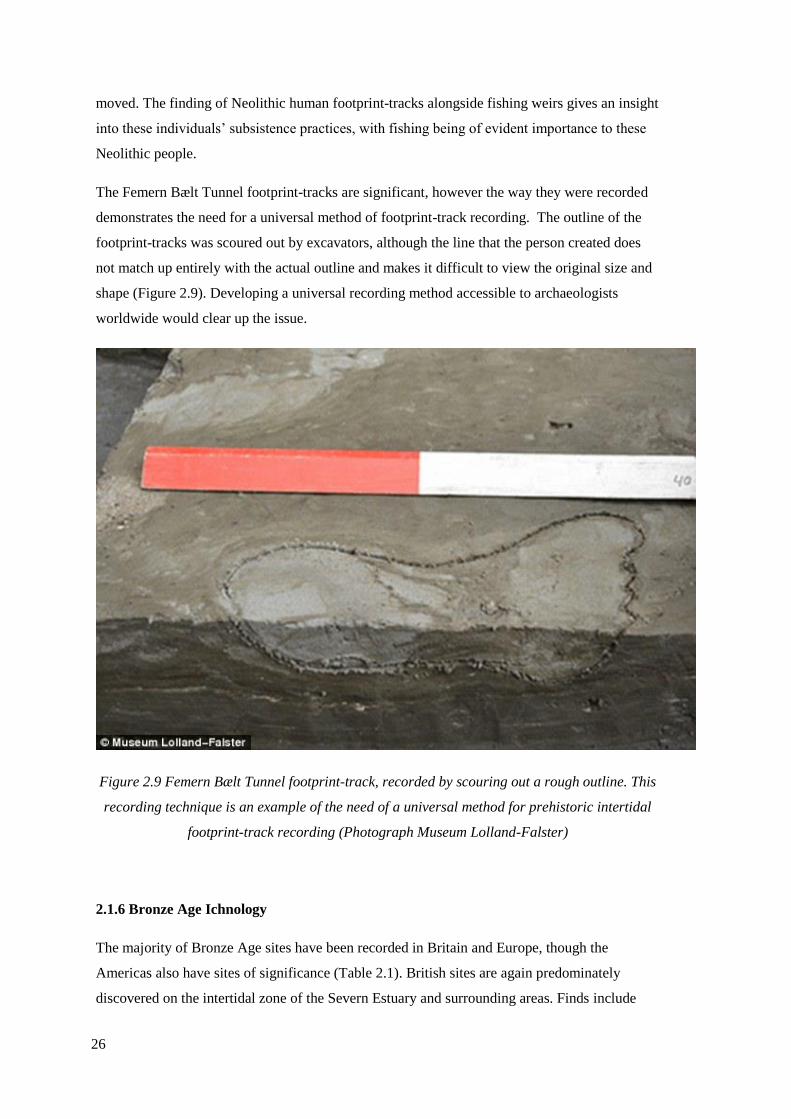
26
moved. The finding of Neolithic human footprint-tracks alongside fishing weirs gives an insight
into these individuals’ subsistence practices, with fishing being of evident importance to these
Neolithic people.
The Femern Bælt Tunnel footprint-tracks are significant, however the way they were recorded
demonstrates the need for a universal method of footprint-track recording. The outline of the
footprint-tracks was scoured out by excavators, although the line that the person created does
not match up entirely with the actual outline and makes it difficult to view the original size and
shape (Figure 2.9). Developing a universal recording method accessible to archaeologists
worldwide would clear up the issue.
Figure 2.9 Femern Bælt Tunnel footprint-track, recorded by scouring out a rough outline. This
recording technique is an example of the need of a universal method for prehistoric intertidal
footprint-track recording (Photograph Museum Lolland-Falster)
2.1.6 Bronze Age Ichnology
The majority of Bronze Age sites have been recorded in Britain and Europe, though the
Americas also have sites of significance (Table 2.1). British sites are again predominately
discovered on the intertidal zone of the Severn Estuary and surrounding areas. Finds include
27
cattle and sheep footprint-tracks found at Rumney Great Wharf from within soft muds that had
formed within palaeochannels from the Upper Wentlooge Formation (Allen 1996), and cattle
and ovi-caprid footprint-tracks from silts between the Fourth and Fifth peats at Cold Harbour
Pill (Bell 2013, p 154). Charcoal from Cold Harbour Pill was radiocarbon dated by Whittle
(1989, Figure 7) to 2900 ±60 BP (Car-991; 1289-920 cal BC). The footprint-tracks were made
between this date and the date provided by radiocarbon dating a post, 2520 ±60 BP (Swan-241;
800-416 cal BC; Bell 2013, Table 8.1, p 154). The Bronze Age footprint-tracks are often
primarily that of domesticated livestock (Table 2.1), and can indicate husbandry practices
undertaken by the people who lived in the area.
The site of Goldcliff East on the Bronze Age peat shelf has preserved the footprint-tracks of
domesticated cattle and ovi-caprid. 25 footprint-tracks were recorded, 12 from ovi-caprid, six
from bovids, and seven that were too poorly preserved to accurately identify (Barr 2012; Barr
and Bell 2016). The footprints were made on the surface of the middle Wentlooge peat where
reed peat is dated 3130±70BP (CAR-644; 1610-1200 cal BC; Bell 2007). They were on the
edge of a silt filled palaeochannel, the footprints were made in peat and then filled by blue-grey
silt (Barr and Bell 2016). Nine of the footprint-tracks were very small; comparison with modern
analogues has suggested these were made by neonatal animals, though there was also evidence
of adults and possible large males (Barr and Bell 2016). The herd and flock composition of this
small footprint-track sample suggests that this was a breeding herd and flock, evidenced by the
footprint-tracks made by neonates and females; this composition is indicative of dairy
production as the juvenile animals would have stimulated lactation in the adult females (Balasse
and Tresset 2002; Copley et al. 2005a,b; O’Connor 2000). If we assume that the cattle and
ovicaprids of prehistory birth during the spring period then we can also infer that these animals
were present on site during the spring/summer months (Barr 2012; Barr and Bell 2016). The
tidal regime would have prevented the saltmarsh environment of Goldcliff from being exploited
year-round, as during winter the tide is higher, this tidal inundation constantly replenishes
minerals and organic material meaning that the saltmarshes provide especially good grazing
when accessible (Bell 2013). It would also have been a spatially extensive grazing resource in
the past. The evidence suggests a community exploiting the environment for safe and healthy
grazing of their breeding livestock, with the saltmarshes preventing foot rot and liver disease,
problems which arise from livestock grazing on damp pastures (Fulford et al. 1994). This would
result in the provision of milk, meat, traction and wool for the saltmarsh farmers (Barr and Bell
2016).
Evidence for the exploitation of intertidal wetlands is also indicated by the human and
domesticated animal footprint-tracks made in peat at Redwick, Gwent, Wales. The peat is on
the surface of the middle Wentlooge peat where raised bog is covered by thin sedge peat, the
28
top of this peat is dated 1691-1401 Cal BC (Beta-181453; 3250±70BP; Bell 2013, Table 8.1),
and there is a transition to saltmarsh silts in this area. The footprints were in peat and filled with
silt in curvilinear depressions around slight peat hummocks; these footprints occurred around
buildings and in palaeochannels, the buildings were dated to 1500-1000 cal BC (Bell 2013,
Table 8.1). There were 243 footprint-tracks recorded at Redwick, from around buildings and in
palaeochannels. The assemblage was dominated by Bos, making up 71% of the assemblage,
ovicaprid make up a further 16%. Four domesticated pig footprint-tracks were also recorded,
along with one possible horse, and ten mostly poorly preserved human footprint-tracks (Bell
2013, Table 7.1, p 151). Of the ten human footprint-tracks, one was well preserved and
considered to be likely to have come from a five/six year old, five were from children under 11
years old, and two were adults. Two others were too indistinct to assign age.
Further investigation of the footprint-tracks at Redwick was undertaken by Barr and Bell
(2016), where they reassessed the data and possible footprint-tracks that may have been
considered too small or indistinct to have been included in Bell’s (2013) interpretation.
Reanalysis of a possible 290 footprint-tracks suggested an assemblage containing ovicaprid
(22%), bovid (45%), red deer (<1%), pig (<2%), human (3%), and 28% too poor to enable
identification of species. 20 of the ovicaprid footprint-tracks were made by animals aged three
months and under, 15 of which were under a month of age. 24 of the bovid footprint-tracks
were made by individuals aged under two months. This assemblage again suggests a dairying
community, as there is a large percentage of both young and mature animals (Barr and Bell
2016). The footprint-tracks of human children may indicate the engagement of juveniles within
specific activities, such as raising livestock or assisting with milking.
Like the footprints found at the Femern Bælt Tunnel excavation in Denmark (Lolland-Falster
Museum 2014), the footprints at Redwick were recorded in association with artefacts, including
buildings. These buildings and associated artefacts demonstrate the behaviour of Bronze Age
people and the way they were interacting between animals and the landscape (Bell 2013).
Animals were being kept in buildings with partitions, interpreted as animal stalls. The rearing of
animals was occurring in the same area in which the Bronze Age people were living, indicating
a close relationship between humans and animals. The structures were not permanent, with Bell
(2013) suggesting that people were moving seasonally with their herds or flocks, and were far
less sedentary than previously thought. Prehistoric footprint-track research often deals primarily
with just the footprints themselves; however, Bell (2013) has demonstrated the strength that this
form of archaeological data can bring to the interpretation of a site as a whole.
Although there are many coastal sites in Wales that are important to footprint-track research,
there are other areas in Britain where footprint-tracks have been recorded, although in many
29
cases not in the same volume or detail that are found in Wales. This is likely to be due to
differences in preservation at these sites and differences in the extent of study in this area, so
archaeologists are perhaps not always trained to spot a footprint-track in sediment. Excavation
at Gwithian, Cornwall (3,800 to 2,900 BP) revealed Bronze Age cattle and ovicaprid footprint-
tracks (Walker and Bell 2013), and at Shaugh Moor, Bronze Age cattle, ovi-caprid, deer and
badger footprints were recorded (Smith et al. 1981). The Shaugh Moor footprint-tracks were
from a ditch of a Bronze Age reeve system (1590 ±80 BC to 1390 ±90 BC), and provide
evidence for animal husbandry in the associated reeve (Fowler 1981; Smith et al. 1981).
The discovery and significance of this form of archaeological data is often treated as an
afterthought; the footprint-tracks from Shaugh Moor for example were never fully analysed or
published, perhaps because researchers at the time did not know what to do with them.
2.1.7 Other iconological sites
The only recorded ichnological site in Japan is from the site of Shiroi, Gunma, from the Late
Kofun period, around the 6th century AD (Inoue and Sakaguchi 1997). Excavation of the site
covered 50,000m2, with around 40,000 horse hoofprints preserved in this area. The site is
located on a river terrace; the horse hoofprints were made on the land surface and then
preserved when a volcano erupted, covering the site in between 50cm and 120cm of volcanic
pumice. At the site there was also evidence of farmland, though this was not in use when the
volcano erupted. The hoofprints from Shiroi allowed ancient horse species in Japan to be better
understood, with the size of some of the prints indicating that foals younger than one years old
were at the site. A medium sized breed of horse, a Mongolian type or similar, made all of the
footprint-tracks; these footprint-tracks therefore assisted in establishing the origin of Japanese
horses and the route humans may have taken to get them (Inoue and Sakaguchi 1997). The
footprint-track evidence from Shiroi suggests that at the time of the volcanic eruption the area
was being used to graze medium-sized horses, some of which were raising foals, and so needed
the safety of a pastureland to nurse their young.
2.1.8 American Cave Sites
Footprint-tracks from the American Late Archaic Period, approximately 4,500 years ago, are
found in a variety of cave sites (Table 2.1). Jaguar Cave, Tennessee, contained a clay cave floor
with 274 human footprint-tracks, made by approximately nine individuals who were male, with
some possible females (Watson et al. 2005; Willey et al. 2005; 2009). Carbon found on the
30
roof, caused by the use of torches within the cave was radiocarbon dated to c3000 cal BC
(Watson et al. 2005). As well as human footprint-tracks found within the cave there is evidence
of jaguars (Panthera onca). Between 35,000 and 10,000 years ago jaguars became trapped
within the cave and created multiple footprint-tracks, skeletal remains from this species were
also in the cave and is the caves namesake (Watson et al. 2005). Further fragmented skeletal
remains were also discovered in the cave from a variety of species including mastodon
(mammut americanum), dire wolf (Canis dirus), horse (Equus), tapir (Tapirus) and camel
(Camelops), indicating these animals may have lived in the cave, or their remains were dragged
in by other animals (Watson et al. 2005). This site is of importance because it has been
extensively studied over multiple years. Footprint-tracks preserved in cave sites have an
advantage over open-air sites as they are not subject to the elements and temperatures generally
do not fluctuate, preventing damage and erosion. Watson et al. (2005) focused upon the
methods of recording footprint-tracks, as many of the footprints are in hard to access areas. The
continuous recording over multiple years and reduced threat of erosion has resulted in strong
archaeological results, with the sex and stature of the nine individuals determined from
footprint-track trails (Watson et al. 2005).
2.1.9 Footprints on Roman Tiles
Roman brick and tiles presented ideal situations to capture footprints, as when walked upon a
wet tile or brick substrate creates an excellent surface for the preservation of footprints. These
footprints may assist in an understanding of life in the area, such as if domesticated or wild
animals were most prevalent. Roman sites within Britain often exhibit footprints preserved in
this manner (Brodribb 1979; Cram 1984; Elliot 1991; Wall 1985), although the detail of these
prints is often lacking in reports and does not include thorough analysis. Cram and Fulford
(1979) carried out a more detailed analysis of footprints found upon the tiles at Silchester
Roman Town; this footprint material indicated a variety of species including sheep/goat, dog,
horse and human, suggesting a town where animals were used for husbandry purposes, and had
access to areas where tiles were made. Reanalysis of the Silchester tiles from the forum-
basilica, Insula IX and the collection held by Reading Museum was undertaken by Sara Machin
as part of her doctoral thesis regarding the ceramic building material of Silchester (S. Machin
per comms. 21/02/2018). The dating of this material was considered difficult due to the lack of
material from dateable structures, however the fabrics of the Nero stamped tiles give a terminus
post quem date of AD54, which is early in the Roman occupation of Britain. A total of 394
footprints were identified on the tiles; 82 ungulates, as well as 282 other animals including
human, cat, weasel and dog. 30 avian footprints were also identified, from species including
31
heron, crane, crow, owl and chicken. The ungulate assemblage contained a large amount of
neonate and juvenile cattle and ovicaprid; eight were calves aged four months and under, and
eight were ovicaprid aged five months or under. Adults were also in the assemblage, indicating
the breeding of animals was occurring near to the tilery (Grant 2004, p 380), so dairy
production may have been a focus.
It must be remembered that just because a tile has a footprint on it, this does not automatically
reflect the species preference or behaviours of individuals in the sites in which they are found.
Ceramics and tiles are portable objects and could easily have been made in a different town or
country and do not directly imply that the footprint maker was present at the site of interest.
Tiles/bricks are therefore not a reliable source of footprint-track information for the
identification of species preference.
As of the Roman period, footprints on tiles and other surfaces become far more common on
archaeological sites, however they are omitted from this study due to the vast amount of
material which will not be relevant to this report.
2.1.10 Conclusion of footprints in archaeology
This section has discussed a variety of footprint-track sites from across the world, from a range
of contexts, to illustrate the widespread nature of this fascinating evidence. There is no
methodology used universally for footprint-track recording, or for the interpretation of the data,
and at each site there are lessons to be learnt from the way in which footprint-tracks were
recorded.
The main goal within human footprint-track research tends to be to expand our knowledge of
the people who made them. The stature, sex, age, gait, direction of travel and speed of
movement are all of interest. As archaeologists we view each footprint-track trail individually
so that we can learn something about the track-maker, but we must also consider their footprint-
tracks in relation to those made by other humans and animals, as well as other archaeology.
Bell’s (2013) work on the site of Redwick, Wales demonstrated the importance of considering
footprint-tracks within a site as a whole, as this may indicate specific behaviours or an age or
sex based division of labour.
There is usually at least one juvenile footprint-track found in association with multiple other
footprint-tracks at sites, indicating the importance of the young within human populations.
Identifying children from footprint-tracks allows us to form an understanding of the activities
and behaviours of a community, so it is essential to attempt to discover the ages of individuals
32
through footprint analysis. Many footprint-tracks made by children in prehistory are from very
young individuals, some possibly as young as one year old (Altamura et al. 2018), which
suggests that children were active members of the community from a young age.
The age of mammals as established from footprint-track evidence is generally not dealt with in
the literature, though species are often mentioned. This gap in the literature needs to be
addressed as seasonality and animal husbandry may be understood by the appearance of
juveniles or specific species. The same lack of thorough analysis is true for avian footprint-
tracks, with species and numbers of footprint-tracks not often given.
There is a comparatively sparse footprint-track data from the Iron Age (Table 2.1), there may be
a multitude of reasons for this. One reason may be that the sites favoured for habitation during
the Iron Age may not have provided the correct environment or sediment for track preservation,
or it may be that as Iron Age sites are so rich in archaeological data, footprints may be found
and recorded but not mentioned in detail during the write-up of the site. It may also be that the
footprint-tracks are not even recognised as archaeologically important or recorded. At the site of
Goldcliff West, Wales, Bell et al. (2000, p 118) identified cattle footprints that were identified
in association with Iron Age Building’s 6 and 2. These footprints were identified during the
recording of the buildings, and also retrospectively. The archaeologists who identified these
footprints had knowledge of ichnology so was likely more aware of what to look for.
Footprints may not always be discovered in plan; in an excavation it is reasonable to assume
that it is just as likely to discover a footprint in section. There has not yet been a study into the
ability to recognise and identify footprint-tracks in section. The failure to recognise footprint-
tracks will result in the loss of this data, with footprint-track sites still being relatively rare it is
especially important during any fieldwork to consider that a turbated area may be the result of
animal trampling, and should be recorded thoroughly (Chapter 4).
2.2 Physical Anthropology
2.2.1 Anatomical Structure of Homo sapiens feet
This section will review the anatomical structure of Homo sapiens feet, the way that they
function and growth and development. For the anatomical structure of bird and mammal feet
see Chapter 4.
The human foot is extremely complex, with 26 bones and 33 joints (Figure 2.10). Its function is
to provide support, mobility and balance for the body. The complexity of the foot is enhanced
33
further when considering the large amount of layered muscles present (McMinn et al. 1993).
There are three structural components to the foot, the forefoot, midfoot and hindfoot. The five
toes are composed of phalanges and their connecting long bones called metatarsals. The hallux,
often referred to as the big toe, or first toe, articulates with the head of the first
metatarsophalangeal joint, the tip of the hallux is large and bulbous (McMinn et al. 1993). The
other toes shall be referred to as toe two, three, four and five, two being the toe next to the
hallux and five being the smallest, lateral toe. All have three bones and two joints; the
metatarsal phalangeal joint connects the metatarsals and phalanges to the ball of the foot. These
toes make up the forefoot, which bears half of the body’s weight on the ball of the foot, shifting
and correcting the balance as required (White and Folkens 2005, p 262). The midfoot is the
shock absorber for the foot, and is made up of five tarsal bones which create the arch of the
foot. These bones connect to the forefoot and hindfoot by muscles and the plantar fascia
ligament (McMinn et al. 1993). The curving arch of the foot, which is developed during
childhood (Scheuer and Black 2004, p 404), occurs between the heel and ball; the arch is a
defining characteristic as it indicates which side of the body the limb that made the footprint
came from, the toes also indicate this. Connected to the midfoot by muscles and ligaments is the
hindfoot, this is composed of three joints that link the midfoot to the talus (ankle). The
calcaneus, or heel bone, is the largest bone in the foot that joins the talus, forming the subtalar
joint (McMinn et al. 1993). The bottom of the heel bone is protected from damage by a thick
layer of fat tissue. The top of the talus connects to the distal ends of the tibia and fibula, forming
a hinge to allow the foot to have rotational movement (White and Folkens 2005, p 292).
The human foot has many unique characteristics which enable identification; the foot is much
longer than it is wide, with a swollen ball, prominent heel, strong curving arch and five toes, the
first of which is very large. These characteristics aid in identifying a hominin footprint when it
is poorly preserved (Figure 2.11).
The feet of prehistoric humans, many of which were constantly unshod, may retain the outline
of the neonatal foot, as they have not been deformed by restrictive or ill-fitting footwear.
Leather shoes for example greatly restrict the spread of the toes, and if worn throughout
childhood will result in a far narrower foot than somebody who is habitually unshod (Tuttle et
al. 1990; Musiba et al. 1997; Roberts 2004). The appearance of a constantly unshod foot has
certain characteristics, such as the toes fanning out from the midfoot; the medial longitudinal
arch of the foot is also greatly strengthened in people who are constantly unshod (Tuttle 2008).
These characteristics are important to be aware of, as it is possible that many prehistoric
populations went unshod.
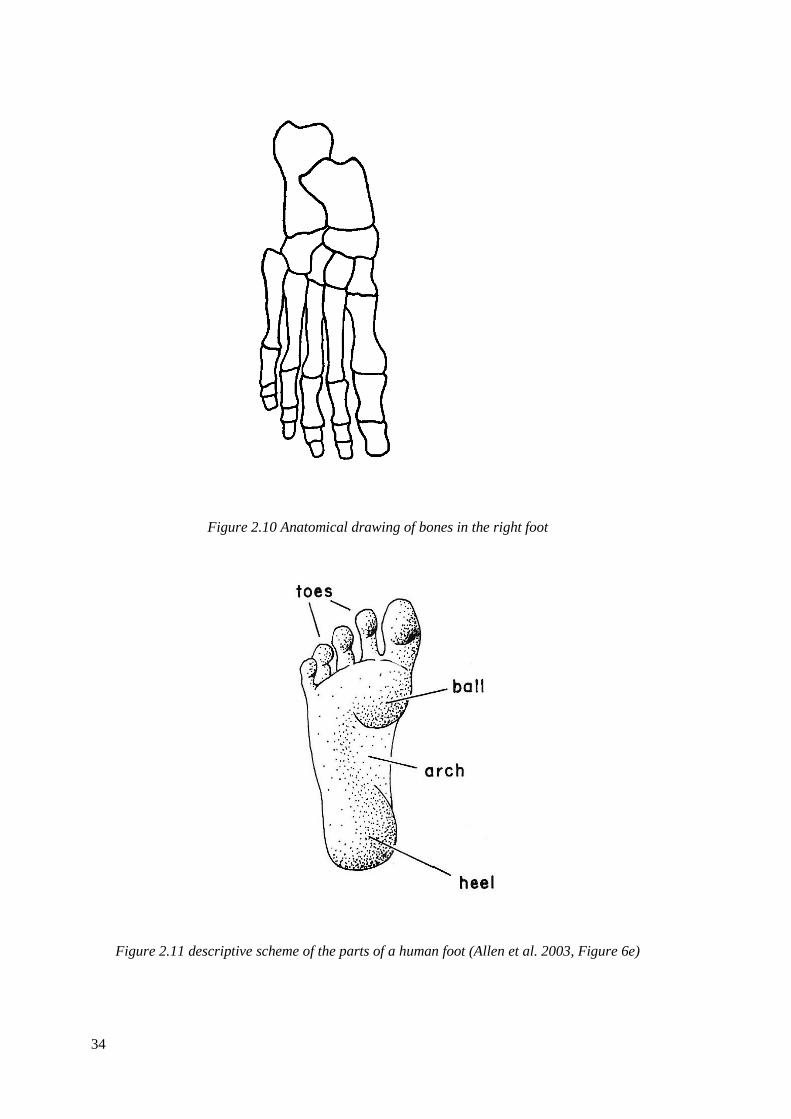
34
Figure 2.10 Anatomical drawing of bones in the right foot
Figure 2.11 descriptive scheme of the parts of a human foot (Allen et al. 2003, Figure 6e)
35
Another key consideration is growth rate (Figure 2.12). A neonate will have a foot that is long
and slender with no evidence of longitudinal arches. The foot of a neonate is approximately
8cm in length, and 34% of its adult size (Scheuer and Black 2004, p 403). Between the ages of
12 and 18 months old the foot will have achieved half the length of its overall mature size and
by two years the longitudinal arches will have descended. From two until five years there is a
significant decrease in growth rate. The sexes experience a slight difference in growth rate;
from five to twelve years in females and five to fourteen years in males, the foot experiences
growth of approximately 0.9cm per year in length. The rate of growth then decreases again,
with females experiencing decreased growth after 12 years of age, and males at 14 years. 95%
of mature length will be achieved by the female foot by the age of 12-13 years, and by 15 years
in males (Scheuer and Black 2004, p 404). Females will usually have achieved their maximum
growth by the age of 14 years, with males slightly older at 16 years; this coincides in both sexes
with the end of epiphyseal growth. The stages of growth of the human foot may assist in the
identification of the ages present in prehistoric samples, there is also evidently a problem with
regards to maturity. A sub-adult will have achieved their maximum foot length by 14 years if
female, this size will then remain unchanged later in life so determining which is made by a
sub-adult and which is made by a mature adult will be virtually impossible.
Changes to foot morphology can easily occur, as the bones are physiologically plastic. An
example for this is China’s historical practice of binding young girls’ feet, which occurred
between the ages of four and eight years old (Klenerman and Wood 2006). By approximately
14 years of age the child’s feet would have reached full maturity, if binding had occurred
constantly over the possible ten years, the effects of binding would create permanent
deformities in the foot and would have hugely influenced the gait of the individual, these
deformities were further worsened if the child’s feet were not only bound but also broken. Foot
binding in children takes advantage of the increased plasticity of children’s bones compared to
that of adults.
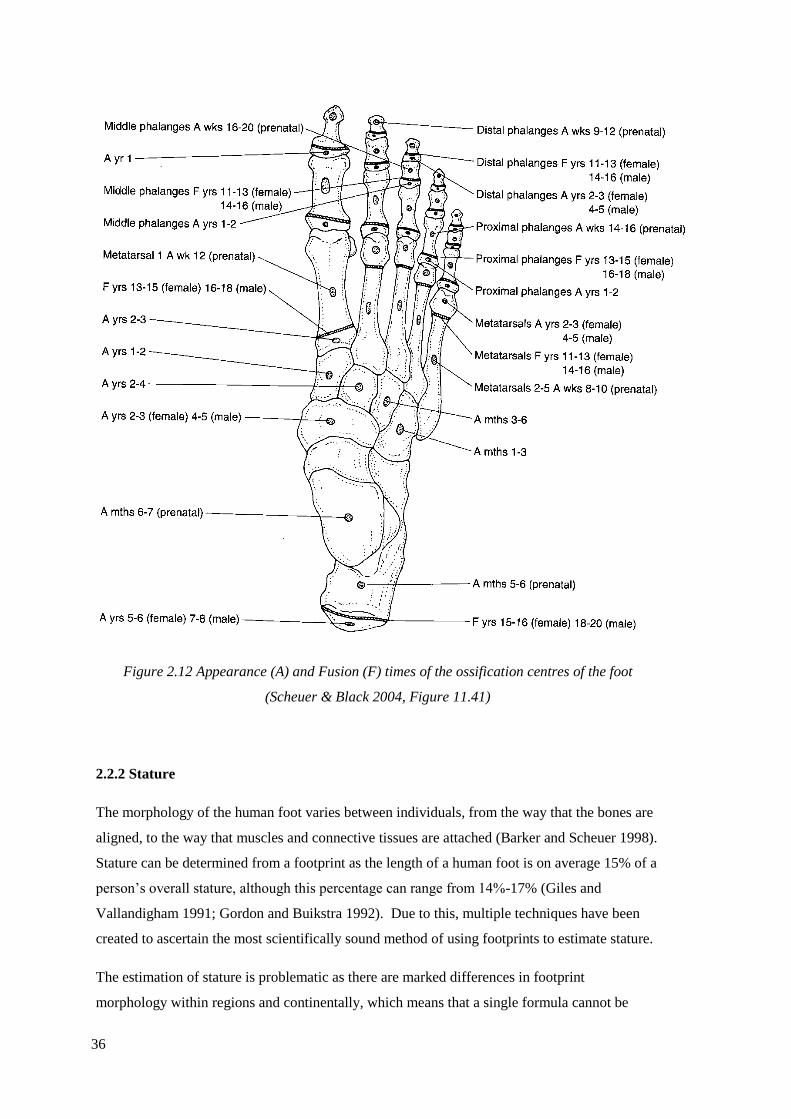
36
Figure 2.12 Appearance (A) and Fusion (F) times of the ossification centres of the foot
(Scheuer & Black 2004, Figure 11.41)
2.2.2 Stature
The morphology of the human foot varies between individuals, from the way that the bones are
aligned, to the way that muscles and connective tissues are attached (Barker and Scheuer 1998).
Stature can be determined from a footprint as the length of a human foot is on average 15% of a
person’s overall stature, although this percentage can range from 14%-17% (Giles and
Vallandigham 1991; Gordon and Buikstra 1992). Due to this, multiple techniques have been
created to ascertain the most scientifically sound method of using footprints to estimate stature.
The estimation of stature is problematic as there are marked differences in footprint
morphology within regions and continentally, which means that a single formula cannot be
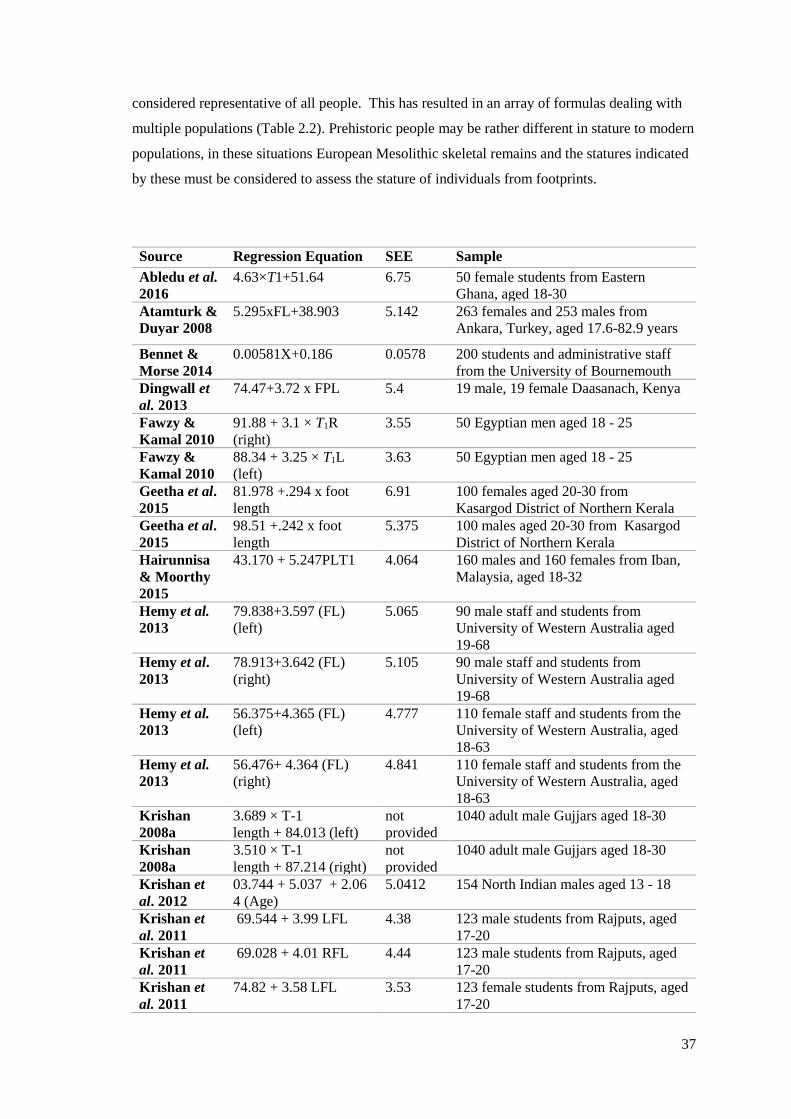
37
considered representative of all people. This has resulted in an array of formulas dealing with
multiple populations (Table 2.2). Prehistoric people may be rather different in stature to modern
populations, in these situations European Mesolithic skeletal remains and the statures indicated
by these must be considered to assess the stature of individuals from footprints.
Source Regression Equation SEE Sample
Abledu et al.
2016
4.63×T1+51.64 6.75 50 female students from Eastern
Ghana, aged 18-30
Atamturk &
Duyar 2008
5.295xFL+38.903 5.142 263 females and 253 males from
Ankara, Turkey, aged 17.6-82.9 years
Bennet &
Morse 2014
0.00581X+0.186 0.0578 200 students and administrative staff
from the University of Bournemouth
Dingwall et
al. 2013
74.47+3.72 x FPL 5.4 19 male, 19 female Daasanach, Kenya
Fawzy &
Kamal 2010
91.88 + 3.1 × T1R
(right)
3.55 50 Egyptian men aged 18 - 25
Fawzy &
Kamal 2010
88.34 + 3.25 × T1L
(left)
3.63 50 Egyptian men aged 18 - 25
Geetha et al.
2015
81.978 +.294 x foot
length
6.91 100 females aged 20-30 from
Kasargod District of Northern Kerala
Geetha et al.
2015
98.51 +.242 x foot
length
5.375 100 males aged 20-30 from Kasargod
District of Northern Kerala
Hairunnisa
& Moorthy
2015
43.170 + 5.247PLT1 4.064 160 males and 160 females from Iban,
Malaysia, aged 18-32
Hemy et al.
2013
79.838+3.597 (FL)
(left)
5.065 90 male staff and students from
University of Western Australia aged
19-68
Hemy et al.
2013
78.913+3.642 (FL)
(right)
5.105 90 male staff and students from
University of Western Australia aged
19-68
Hemy et al.
2013
56.375+4.365 (FL)
(left)
4.777 110 female staff and students from the
University of Western Australia, aged
18-63
Hemy et al.
2013
56.476+ 4.364 (FL)
(right)
4.841 110 female staff and students from the
University of Western Australia, aged
18-63
Krishan
2008a
3.689 × T-1
length + 84.013 (left)
not
provided
1040 adult male Gujjars aged 18-30
Krishan
2008a
3.510 × T-1
length + 87.214 (right)
not
provided
1040 adult male Gujjars aged 18-30
Krishan et
al. 2012
03.744 + 5.037 + 2.06
4 (Age)
5.0412 154 North Indian males aged 13 - 18
Krishan et
al. 2011
69.544 + 3.99 LFL 4.38 123 male students from Rajputs, aged
17-20
Krishan et
al. 2011
69.028 + 4.01 RFL 4.44 123 male students from Rajputs, aged
17-20
Krishan et
al. 2011
74.82 + 3.58 LFL 3.53 123 female students from Rajputs, aged
17-20
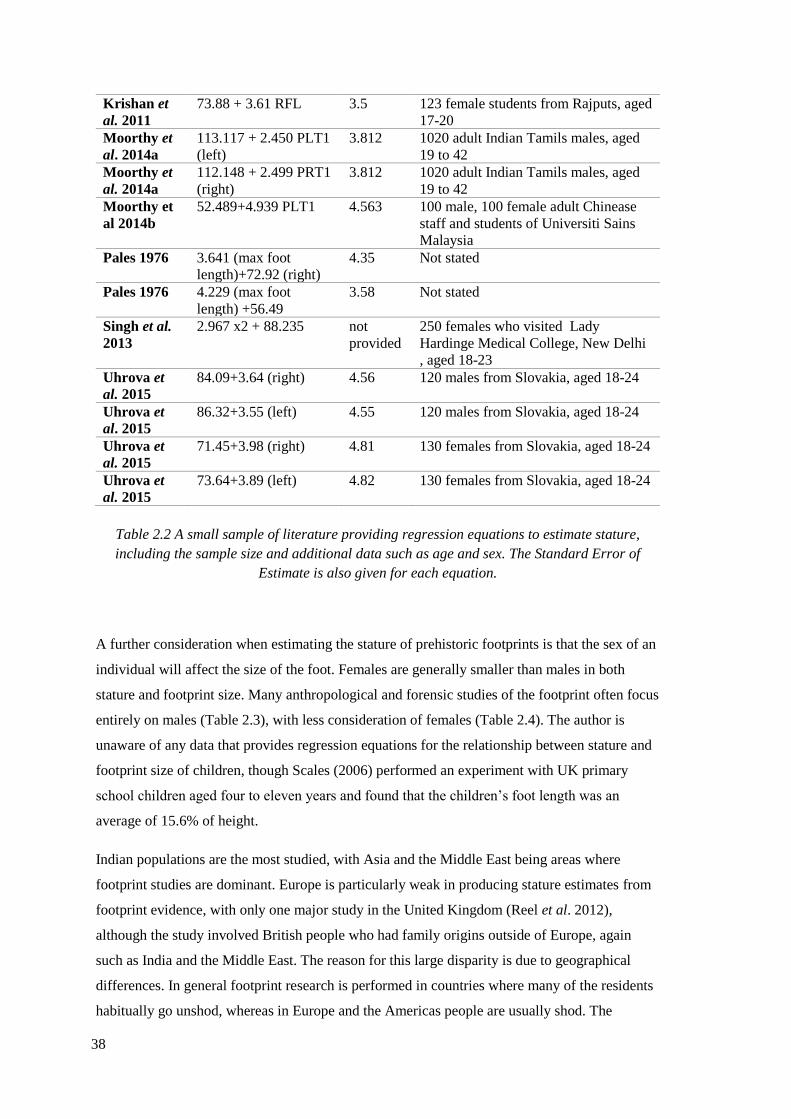
38
Krishan et
al. 2011
73.88 + 3.61 RFL 3.5 123 female students from Rajputs, aged
17-20
Moorthy et
al. 2014a
113.117 + 2.450 PLT1
(left)
3.812 1020 adult Indian Tamils males, aged
19 to 42
Moorthy et
al. 2014a
112.148 + 2.499 PRT1
(right)
3.812 1020 adult Indian Tamils males, aged
19 to 42
Moorthy et
al 2014b
52.489+4.939 PLT1 4.563 100 male, 100 female adult Chinease
staff and students of Universiti Sains
Malaysia
Pales 1976 3.641 (max foot
length)+72.92 (right)
4.35 Not stated
Pales 1976 4.229 (max foot
length) +56.49
3.58 Not stated
Singh et al.
2013
2.967 x2 + 88.235 not
provided
250 females who visited Lady
Hardinge Medical College, New Delhi
, aged 18-23
Uhrova et
al. 2015
84.09+3.64 (right) 4.56 120 males from Slovakia, aged 18-24
Uhrova et
al. 2015
86.32+3.55 (left) 4.55 120 males from Slovakia, aged 18-24
Uhrova et
al. 2015
71.45+3.98 (right) 4.81 130 females from Slovakia, aged 18-24
Uhrova et
al. 2015
73.64+3.89 (left) 4.82 130 females from Slovakia, aged 18-24
Table 2.2 A small sample of literature providing regression equations to estimate stature,
including the sample size and additional data such as age and sex. The Standard Error of
Estimate is also given for each equation.
A further consideration when estimating the stature of prehistoric footprints is that the sex of an
individual will affect the size of the foot. Females are generally smaller than males in both
stature and footprint size. Many anthropological and forensic studies of the footprint often focus
entirely on males (Table 2.3), with less consideration of females (Table 2.4). The author is
unaware of any data that provides regression equations for the relationship between stature and
footprint size of children, though Scales (2006) performed an experiment with UK primary
school children aged four to eleven years and found that the children’s foot length was an
average of 15.6% of height.
Indian populations are the most studied, with Asia and the Middle East being areas where
footprint studies are dominant. Europe is particularly weak in producing stature estimates from
footprint evidence, with only one major study in the United Kingdom (Reel et al. 2012),
although the study involved British people who had family origins outside of Europe, again
such as India and the Middle East. The reason for this large disparity is due to geographical
differences. In general footprint research is performed in countries where many of the residents
habitually go unshod, whereas in Europe and the Americas people are usually shod. The

39
development of stature estimates from a footprint primarily has a forensic focus, therefore areas
where people are likely to leave footprints when committing a crime are more in need of certain
forensic techniques than countries where people are generally shod when committing crimes,
footprint research in these countries are not as necessary forensically speaking. This is also the
reason behind the lack of stature estimates for children from their footprint-tracks, as they are
generally not investigated for criminal activity, so there has been no need to develop techniques
to identify children. This may be true forensically, however archaeologically there is a need to
develop stature estimates from children’s footprints, as so many are being discovered.
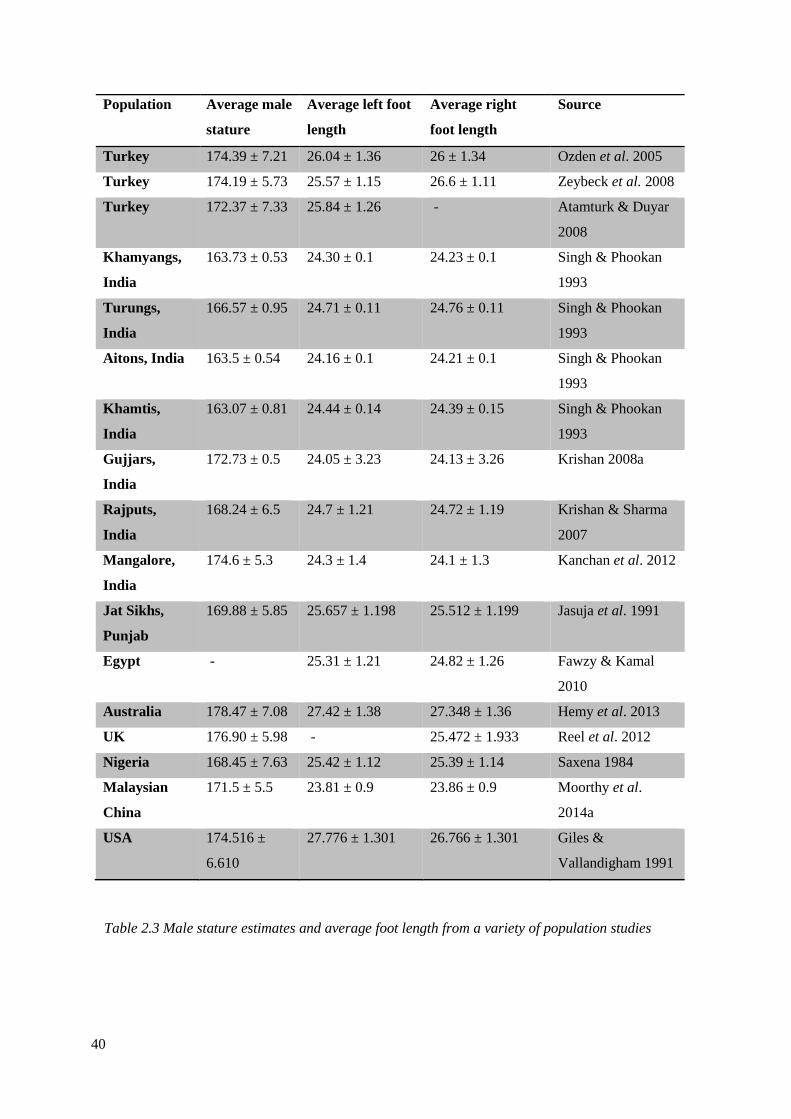
40
Population Average male
stature
Average left foot
length
Average right
foot length
Source
Turkey 174.39 ± 7.21 26.04 ± 1.36 26 ± 1.34 Ozden et al. 2005
Turkey 174.19 ± 5.73 25.57 ± 1.15 26.6 ± 1.11 Zeybeck et al. 2008
Turkey 172.37 ± 7.33 25.84 ± 1.26 - Atamturk & Duyar
2008
Khamyangs,
India
163.73 ± 0.53 24.30 ± 0.1 24.23 ± 0.1 Singh & Phookan
1993
Turungs,
India
166.57 ± 0.95 24.71 ± 0.11 24.76 ± 0.11 Singh & Phookan
1993
Aitons, India 163.5 ± 0.54 24.16 ± 0.1 24.21 ± 0.1 Singh & Phookan
1993
Khamtis,
India
163.07 ± 0.81 24.44 ± 0.14 24.39 ± 0.15 Singh & Phookan
1993
Gujjars,
India
172.73 ± 0.5 24.05 ± 3.23 24.13 ± 3.26 Krishan 2008a
Rajputs,
India
168.24 ± 6.5 24.7 ± 1.21 24.72 ± 1.19 Krishan & Sharma
2007
Mangalore,
India
174.6 ± 5.3 24.3 ± 1.4 24.1 ± 1.3 Kanchan et al. 2012
Jat Sikhs,
Punjab
169.88 ± 5.85 25.657 ± 1.198 25.512 ± 1.199 Jasuja et al. 1991
Egypt - 25.31 ± 1.21 24.82 ± 1.26 Fawzy & Kamal
2010
Australia 178.47 ± 7.08 27.42 ± 1.38 27.348 ± 1.36 Hemy et al. 2013
UK 176.90 ± 5.98 - 25.472 ± 1.933 Reel et al. 2012
Nigeria 168.45 ± 7.63 25.42 ± 1.12 25.39 ± 1.14 Saxena 1984
Malaysian
China
171.5 ± 5.5 23.81 ± 0.9 23.86 ± 0.9 Moorthy et al.
2014a
USA 174.516 ±
6.610
27.776 ± 1.301 26.766 ± 1.301 Giles &
Vallandigham 1991
Table 2.3 Male stature estimates and average foot length from a variety of population studies
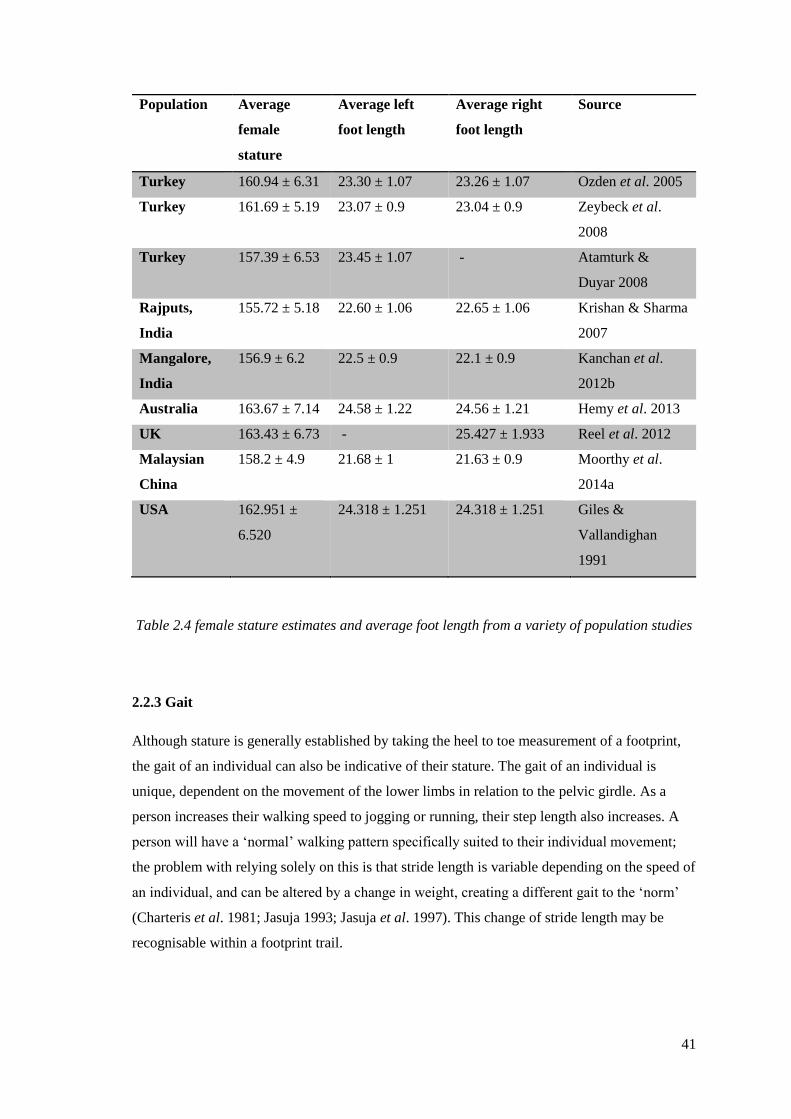
41
Population Average
female
stature
Average left
foot length
Average right
foot length
Source
Turkey 160.94 ± 6.31 23.30 ± 1.07 23.26 ± 1.07 Ozden et al. 2005
Turkey 161.69 ± 5.19 23.07 ± 0.9 23.04 ± 0.9 Zeybeck et al.
2008
Turkey 157.39 ± 6.53 23.45 ± 1.07 - Atamturk &
Duyar 2008
Rajputs,
India
155.72 ± 5.18 22.60 ± 1.06 22.65 ± 1.06 Krishan & Sharma
2007
Mangalore,
India
156.9 ± 6.2 22.5 ± 0.9 22.1 ± 0.9 Kanchan et al.
2012b
Australia 163.67 ± 7.14 24.58 ± 1.22 24.56 ± 1.21 Hemy et al. 2013
UK 163.43 ± 6.73 - 25.427 ± 1.933 Reel et al. 2012
Malaysian
China
158.2 ± 4.9 21.68 ± 1 21.63 ± 0.9 Moorthy et al.
2014a
USA 162.951 ±
6.520
24.318 ± 1.251 24.318 ± 1.251 Giles &
Vallandighan
1991
Table 2.4 female stature estimates and average foot length from a variety of population studies
2.2.3 Gait
Although stature is generally established by taking the heel to toe measurement of a footprint,
the gait of an individual can also be indicative of their stature. The gait of an individual is
unique, dependent on the movement of the lower limbs in relation to the pelvic girdle. As a
person increases their walking speed to jogging or running, their step length also increases. A
person will have a ‘normal’ walking pattern specifically suited to their individual movement;
the problem with relying solely on this is that stride length is variable depending on the speed of
an individual, and can be altered by a change in weight, creating a different gait to the ‘norm’
(Charteris et al. 1981; Jasuja 1993; Jasuja et al. 1997). This change of stride length may be
recognisable within a footprint trail.
42
2.2.4 Weight
The weight of an individual can affect the appearance of footprints; this can be utilized to make
inferences about the overall size of an individual or indicate if the person was carrying a load.
Robbins (1986) proposed that body weight could be predicted from a person’s footprint;
building upon Robbins’ experiment, Krishan (2008b) established that a person holding 5kg of
weight in each hand would exhibit no variation in footprint size, however with 20kg in each
hand, the length and the breadth of the footprint greatly increases (Krishan 2008b). This is
particularly important to note, as it suggests that large weight held in the hands can significantly
change the footprint outline (Atamturk and Duyar 2008). If a person was carrying something
they may have the appearance of wider feet, this would have nothing to do with the persons
actual body weight as suggested by Robbins (1986) but rather the amount of weight being
directly exerted onto the body.
2.2.5 Sex
It has been suggested that it is possible to establish the sex of an individual through the
appearance and morphology of the footprint (Robbins 1985); the accurate scientific application
of these methods is ambiguous (Zeybeck et al. 2008). Multiple experiments have revealed that
differences in foot length within a single community are clear, with variations caused by
climate, nutrition, pathology and overall health (Saxena 1984; Jasuja et al. 1991; Gordon and
Buikstra 1992; Krishan et al. 2007). Singh and Phookan (1993) studied the males from four
different ethnic groups and found that these groups did exhibit a high correlation between
stature, foot size and sex. Ozden et al. (2005) established an insignificant relation between the
stature and foot breadth of females; this is expected, as in multiple studies it is the foot length
that is significant, and the width of a foot is influenced by multiple factors, such as restrictive
footwear, nutrition, genetics and climate, unrelated with either stature or sex (Jasuja et al. 1991;
Gordon and Buikstra 1992; Krishan 2007). A formula was developed by Zeybeck et al. (2008)
to estimate the stature and sex of an individual via footprint marks, with over 90% accuracy.
The sample size was relatively small, involving 238 individuals who were attending school or
university in Turkey. This suggests that although it may be possible to establish the sex of an
individual from a specific population, this is not always the case. It is important to consider that
very large footprints will most likely be male, but small footprints are not necessarily female;
these could be small adult males or juveniles of either sex.

43
2.2.6 Footprint Characteristics
A footprint may also reveal pathological information or defining characteristics, such as corns,
pits or creases. Flatfoot, for example, is a condition where the instep region of the plantar
surface is in more contact with the ground than a normal foot, this is caused by the collapse or
absence of the arch of the foot; the degree of flat-footedness is variable and unique to each
sufferer. If an individual with flatfoot has created a footprint-track it should be relatively
straightforward to accurately identify the footprints created by that one individual (Krishan
2007).
The presence and size of phalanges can also assist in the identification of an individual. When a
footprint is created it is normally the phalanx from the hallux that leaves an impression, with the
phalanges from the second to fifth toe not always creating any impression (Krishan 2007). The
use of forensic podiatry in a criminal investigation can result in reliable results. Archaeologists
can utilise the techniques created for forensic podiatry when analysing prehistoric footprint-
tracks to understand the foot health of individuals, as the methods are easily transferable if
detail is preserved, and obvious pathologies can be noticed in footprint trails.
2.2.7 Forensic Science
Louise Robbins (1985, 1986) was considered a ‘footprint expert’ in Canada and America and
was heavily involved in analysing not only forensic footprints, but also footprint-tracks
discovered on many archaeological sites, including Laetoli and American cave sites. Robbins
(1978, 1985) claimed that she could accurately identify someone’s stature, weight, sex and even
ethnicity from a footprint.
Robbins was involved in analysing footprint-tracks from sites such as Mammoth cave in
Kentucky (Watson 1969; Robbins 1974), and Jaguar Cave, Tennessee (Watson et al. 2005).
Robbins analysed 202 footprint-track impressions from Jaguar Cave and established from the
morphologies that these were made by nine individuals. She was then able to calculate age, sex
and stature of the people who made the footprint-tracks (Table 2.5). Full analysis of Jaguar
Cave was published once Robbins had died, with several other techniques used with Robbins’
theories to estimate the stature of the individuals as accurately as possible (Giles and
Vallandigham 1991; Jasuja et al. 1991; Singh and Pookham 1993).
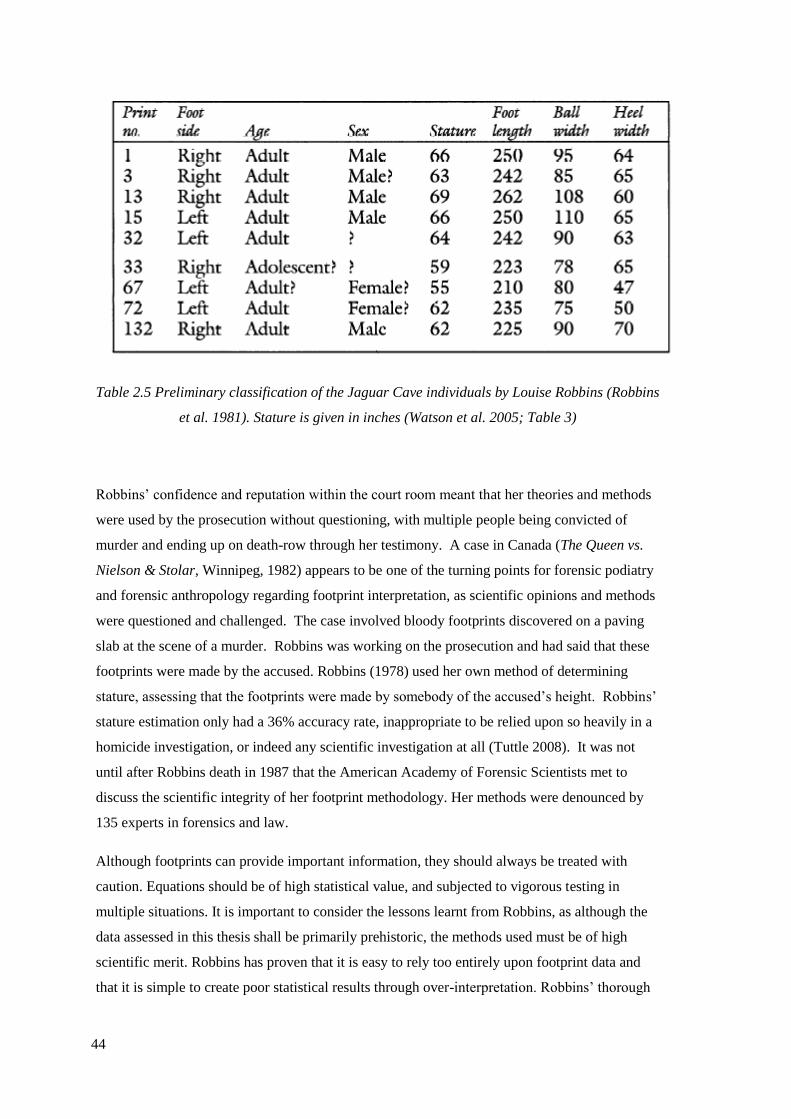
44
Table 2.5 Preliminary classification of the Jaguar Cave individuals by Louise Robbins (Robbins
et al. 1981). Stature is given in inches (Watson et al. 2005; Table 3)
Robbins’ confidence and reputation within the court room meant that her theories and methods
were used by the prosecution without questioning, with multiple people being convicted of
murder and ending up on death-row through her testimony. A case in Canada (The Queen vs.
Nielson & Stolar, Winnipeg, 1982) appears to be one of the turning points for forensic podiatry
and forensic anthropology regarding footprint interpretation, as scientific opinions and methods
were questioned and challenged. The case involved bloody footprints discovered on a paving
slab at the scene of a murder. Robbins was working on the prosecution and had said that these
footprints were made by the accused. Robbins (1978) used her own method of determining
stature, assessing that the footprints were made by somebody of the accused’s height. Robbins’
stature estimation only had a 36% accuracy rate, inappropriate to be relied upon so heavily in a
homicide investigation, or indeed any scientific investigation at all (Tuttle 2008). It was not
until after Robbins death in 1987 that the American Academy of Forensic Scientists met to
discuss the scientific integrity of her footprint methodology. Her methods were denounced by
135 experts in forensics and law.
Although footprints can provide important information, they should always be treated with
caution. Equations should be of high statistical value, and subjected to vigorous testing in
multiple situations. It is important to consider the lessons learnt from Robbins, as although the
data assessed in this thesis shall be primarily prehistoric, the methods used must be of high
scientific merit. Robbins has proven that it is easy to rely too entirely upon footprint data and
that it is simple to create poor statistical results through over-interpretation. Robbins’ thorough
45
recording and analysis of prehistoric footprint-tracks has sadly lost its value among researchers
due to the lack of integrity of her modern forensic work (Tuttle 2008).
Bennet and Morse (2014) provide extensive analysis of the worth of footprint-tracks, both
within prehistory and in forensic settings, whilst also considering the limits of inferences from a
footprint-track. They place emphasis on solid scientific recording and analysis, with a focus
upon Palaeolithic human footprints and the anatomical evolution of humans. This approach to
footprint-tracks analysis is more appropriate as it avoids over-interpreting prehistoric footprint-
track data. Footprints should be analysed in a critical and questioning approach, rather than
relying on an unchallenged ‘expert’ view or method. A further way to avoid over-interpreting
prehistoric footprints is to consider other sources, such as bone and environmental data, to avoid
creating scientifically unsound interpretations.
2.3 Prehistoric Homo sapiens bones from Britain
The following sections will present data from the skeletal remains of Mesolithic humans and
mammals. The bones from species of bird found throughout prehistory will also be discussed.
As bones are complementary to footprints it is important to understand the information we
already have available within the skeletal record, as this data can strengthen our analysis of
footprints.
Human bones have been found in a variety of Mesolithic contexts across Britain. The Mendip
Hills and southwest England have multiple remains of potential Mesolithic date. Aveline’s
Hole, Somerset, contained the remains of approximately 50 individuals; although originally
assigned an Upper Palaeolithic age, further radiocarbon dating suggested that the individuals
were from the Early Mesolithic, dated 9115±110 BP (BM-471; 8460 cal BC) to 8740 ±100 BP
(OxA-1070; 8140cal BC; Schulting and Wysocki 2002; Schulting 2005). Badgers Hole,
Somerset, contained remains from two young people (Oakley 1971), dated 9360±100 (OxA-
1459) to 9060±130 (OxA-679; Hedges et al. 1989, 1991). Gough’s cave, Somerset, also
contained Mesolithic skeletal remains of ‘Cheddar man’ of similar date to the aforementioned
sites, 9100±100BP (OxA-814) to 9080±150 (BM-525; Hedges et al. 1989). These similarities
may be suggestive of the general use of the caves of Somerset, primarily for burial. Totty Pot,
Somerset, contained 60 skeletal elements, from six or seven humans. One of the individuals
may have been as young as two years old, a further child was aged three to six, and an older
child of about 10 was also part of the assemblage. As well as children there were three or four
adults. AMS dating on the remains indicated that two individuals were Mesolithic in date,
8245±45 (OxA-16457; 7445-7080 cal BC) to 8180±70 (BM-2973; 7450-7050 cal BC), there
46
were also Neolithic and Bronze Age individuals (Schulting et al. 2010). Somerset is rich in
prehistoric archaeology; across the River Severn in Wales prehistoric people were also
prominent.
Throughout Wales there are a variety of cave sites where prehistoric remains have been
recovered ranging from Palaeolithic to Iron Age. Foxhole cave, Gower peninsula, Glamorgan
contained the remains of at least six humans, dated 6785±50 uncal BC (OxA-8316; 5730-5560
cal BC; Schulting 2005; Schulting et al. 2013). There are five sites on Caldey Island,
Pembrokeshire that contain skeletal remains of prehistoric humans, in particular the site of Ogof
yr ychen contained skeletal remains of at least five individuals, dated between 8760±55 BP
(OxA-10616; 7170 cal BC) to 7020±100 (OxA-2574; 5640 cal BC; Schulting and Richards
2002b). These sites may represent intentional burial or may be the result of ‘sediment traps’
(Davies 1989; Schulting and Richards 2002b). The presence of multiple Mesolithic ‘burial’
sites in Wales, as well as the occurrence of human footprint-tracks, suggests a landscape that
was being fully exploited by the people of prehistory, actively used in life and for their dead.
In Oronsay, Western Scotland, bones have been preserved well, an uncommon occurrence in
the Hebrides. These bones are often found within the context of middens rather than caves. The
remains at Cnoc Coig, Oronsay, Argyllshire, were from at least six individuals, potentially
more, whilst Priory midden, Oronsay, Argyllshire, contained one hand phalanx (Mellars 1987).
The Cnoc Coig midden remains were radiocarbon dated (Bronk Ramsey et al. 2000), providing
three Mesolithic dates, 5740±65 (OxA-8004), 5495±55 (OxA-8014) and 5615±45 (OxA-8019).
The hand phalanx was indirectly dated by charcoal discovered within the shell midden, which
was radiocarbon dated to 5870±50 BP (Q-3001; Mellars 1987). Midden deposits are not
uncommon and appear throughout history and prehistory, particularly during the Mesolithic
where it seems that people exploited the sea for their subsistence (Smith 1992).
These sites are just a small selection of prehistoric sites across Britain; access to prehistoric
skeletal remains enables the prehistoric human diet to be understood, and in cases where the
necessary bones are preserved, the stature, age and sex (Chapter 9, Table 9.7). It is important to
understand the stature of people from different time periods, as shorter people may be the norm
during certain periods and may be easily mistaken for children, so it is necessary to understand
the population specifics. To estimate stature certain bones do need to be recovered in a well-
preserved state; human bones from the Mesolithic are a relatively uncommon find as it is, even
more uncommon is the preservation of the long bones required for stature estimates.
47
2.4 Mammalian bones from Mesolithic Britain
During prehistory there were a variety of changes in the composition of the fauna of Britain.
Palaeolithic fauna were generally large, with animals such as mammoth, rhinoceros, oxen, wild
horse, reindeer, giant deer and red deer. The warmer environment of the Mesolithic resulted in
denser forested areas, meaning that the habitat was not as well suited to larger mammals that
were adapted to live on tundra. The Mesolithic site of Star Carr, Yorkshire, dated 9670 ±100BP
(OxA-4577; 9300-8700 cal BC) to 9060 ±220BP (OxA-4450; 8800-7500 cal BC; Dark et al.
2006), was abundant in faunal remains including worked bone and antler (Clark 1954). The
bones of red deer, elk, and auroch occurred frequently in the Star Carr material (Table 2.6;
Clark 1954; Legge and Rowley-Conwy 1998). The early Mesolithic sites at Thatcham, near
Newbury, Berkshire, radiocarbon dated 9200±90 BP (OxA-2848; 8636-8261 cal BC; Hedges et
al. 1994), contained bones from red and roe deer, there was also wild pig bones (Carter 2001).
Interestingly unlike Star Carr very few auroch remains were found at this site (King 1962).
Although the percentages of Mesolithic fauna represented within an assemblage differs, with
sites often omitting certain taxa, red deer, roe deer, auroch and wild pig bones occur
continuously from early until late Mesolithic. Red deer bones make up over a third of all large
mammal bones recorded from nine British Mesolithic sites (Table 2.6), indicating a possible
preference for this mammal, or that they were a dominant species during the Mesolithic period.
Familiarity with common British Mesolithic species enables more accurate identification of
footprint-tracks as each species has identifiable footprint characteristics.
After the Mesolithic, the domestication of many animals occurred, shown in prehistoric
assemblages more abundant in domestic cattle, domestic pig, and sheep/goat, rather than large
fauna such as auroch. Southern Britain has the greatest number of both Neolithic and early
Bronze Age animal bone assemblages (Serjeantson 2011). Central Britain contains less than 20
assemblages (Albarella and Pirnie 2008), with even fewer assemblages in Northern England
(Dobney ND). Other than the domestic animals, the fauna of Britain would still have been fairly
similar to the Mesolithic, apart from the notable extinctions of the large species, such as the
extinction of elk and horse during the early Mesolithic, and aurochs in the middle Bronze Age.
It is important to understand the fauna that may have been present at a footprint site, to allow
the footprints to be appropriately analysed.
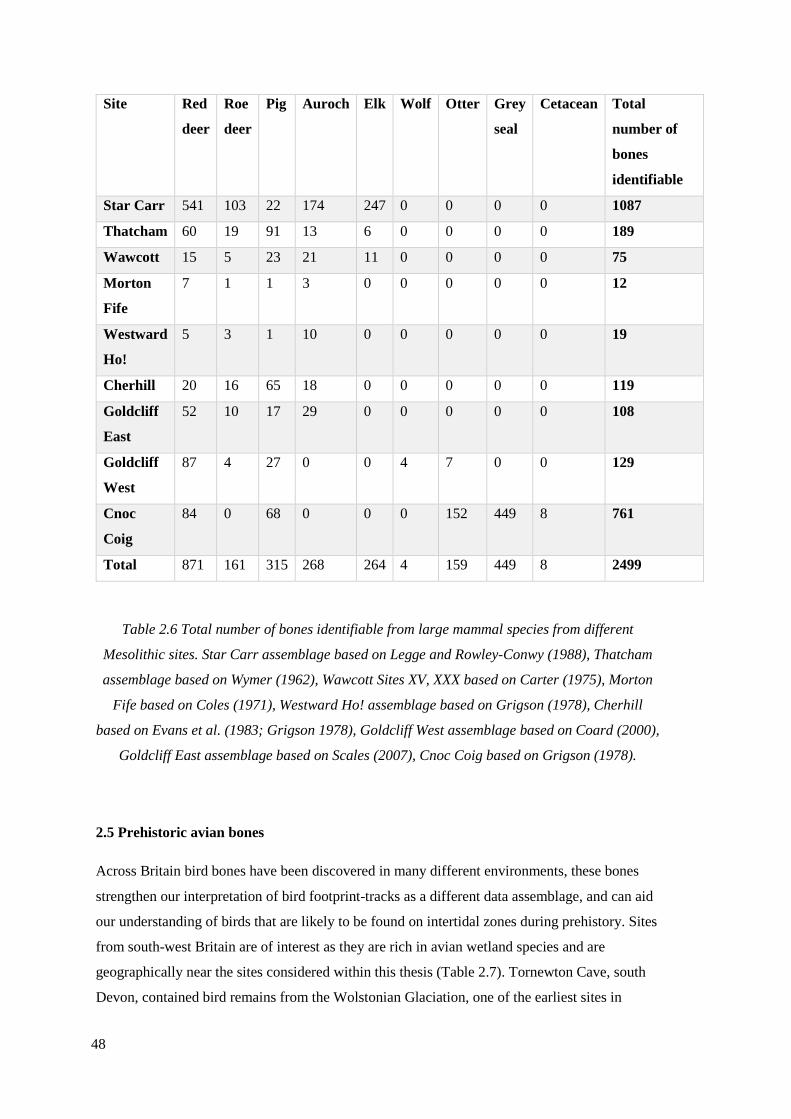
48
Site Red
deer
Roe
deer
Pig Auroch Elk Wolf Otter Grey
seal
Cetacean Total
number of
bones
identifiable
Star Carr 541 103 22 174 247 0 0 0 0 1087
Thatcham 60 19 91 13 6 0 0 0 0 189
Wawcott 15 5 23 21 11 0 0 0 0 75
Morton
Fife
7 1 1 3 0 0 0 0 0 12
Westward
Ho!
5 3 1 10 0 0 0 0 0 19
Cherhill 20 16 65 18 0 0 0 0 0 119
Goldcliff
East
52 10 17 29 0 0 0 0 0 108
Goldcliff
West
87 4 27 0 0 4 7 0 0 129
Cnoc
Coig
84 0 68 0 0 0 152 449 8 761
Total 871 161 315 268 264 4 159 449 8 2499
Table 2.6 Total number of bones identifiable from large mammal species from different
Mesolithic sites. Star Carr assemblage based on Legge and Rowley-Conwy (1988), Thatcham
assemblage based on Wymer (1962), Wawcott Sites XV, XXX based on Carter (1975), Morton
Fife based on Coles (1971), Westward Ho! assemblage based on Grigson (1978), Cherhill
based on Evans et al. (1983; Grigson 1978), Goldcliff West assemblage based on Coard (2000),
Goldcliff East assemblage based on Scales (2007), Cnoc Coig based on Grigson (1978).
2.5 Prehistoric avian bones
Across Britain bird bones have been discovered in many different environments, these bones
strengthen our interpretation of bird footprint-tracks as a different data assemblage, and can aid
our understanding of birds that are likely to be found on intertidal zones during prehistory. Sites
from south-west Britain are of interest as they are rich in avian wetland species and are
geographically near the sites considered within this thesis (Table 2.7). Tornewton Cave, south
Devon, contained bird remains from the Wolstonian Glaciation, one of the earliest sites in
49
Britain where bird remains have been recovered (Harrison 1980a; Sutcliffe and Zeuner 1962;
Sutcliffe and Kowalski 1976). The stratum stages were named after the fauna most frequently
discovered, with the Wolverine (Gulo gulo) stratum being the earliest stage, followed by the
Brown Bear (Ursus arctos) and Otter (Cyrnaonyx antiqua) stratum. The Wolverine stratum
exhibited palaeoenvironmental evidence in the soil and stalagmites, indicating a period of
extreme cold, whereas the Brown Bear stratum displayed evidence of a warmer environment,
similar to the Ipswichian glaciation (Harrison 1987a). Interestingly the Otter stratum displayed
environmental evidence and faunal species that seemed to be from both the Wolstonian and
Ipswichian glaciation. All three stratum contained remains of white stork (Ciconia ciconia).
This is of particular significance as, assuming the stork were governed by the same distribution
factors that affect them today, primarily temperature and summer migration, it would suggest
that during these periods there was a continental climate, potentially with summer temperature
highs of c.16.7◦c (Harrison 1980a; Sutcliffe and Zeuner 1962; Sutcliffe and Kowalski 1976).
Within the cave there were other bird remains that indicated a wetland environment at certain
stages; the remains of brent goose (Branta bernicla) and goosander (Mergus merganser) were
found in the Otter strata, the latter was also found in the Wolverine strata. Common shelduck
(Tadorna tadorna), a current resident of the British Isles, was recovered from all strata
(Harrison 1987a). It is thought that these bird remains are likely to have ended up in the cave
through predation; the remains therefore present an assemblage bias in exhibiting the species
that could be most easily caught or were most favoured, however these species do provide
valuable information about possible prehistoric birds that may be found elsewhere.
Tornewton cave contained a further stratum from the Ipswichian interglacial, this stratum
mainly contained Spotted Hyena (Crocuta crocuta) remains, indicating a warm climate. Many
of the remains found in the Hyena stratum were similar to the strata below such as brent goose,
common shelduck, and ruddy shelduck (Tadorna ferruginea) (Lydekker 1891). Wigeon (Anas
Penelope) were also recovered, again indicating a wetland environment (Harrison 1987a).
Bacon Hole, a cave in the Gower Peninsula, south Wales, contained a variety of faunal remains;
although the majority are from mammals, birds were recovered. Two bird species were using
the cave to roost, shown through bones with incomplete ossification and hence juvenile in age
(Harrison 1977; Stringer 1975, 1977; Stringer et al. 1986). The species represented are razorbill
(Alca torda) and cory’s shearwater (Calonectris diomedea). The cave also contained evidence
of other birds, two of which are species that still inhabit wetland and intertidal zones, dunlin
(Calidris alpina) and turnstone (Arenaria interpres). Towards the end of the Ipswichian
interglacial period, a time of cooling, the remains of bean goose (Anser fabalis) and golden
plover (Pluvialias apricaria) were also recovered from the strata (Harrison 1987a). These birds
need open areas and grassland to survive rather than woodland, so assumptions can be made
50
about the surrounding environment. Minchin Hole, a cave also in the Gower Peninsula, south
Wales, had remains from the wetland species of razorbill and dunlin, however in comparison to
Bacon Hole, this cave was lacking in diversity (Sutcliffe and Bowen 1973; Sutcliffe 1981;
Sutcliffe and Currant 1984).
There have also been a variety of species found within the Devensian glaciation contexts, these
species were generally arctic or tundra breeding-types indicating the colder environment.
Bewick’s swan (Cygnus bewickii) remains were recovered from Cat’s Hole, a cave again found
on the Gower peninsula (Allen and Rutter 1948), and white-fronted goose (Anser albifrons)
remains were recovered from Kent’s Cavern, south Devon, and Soldier’s Hole, Somerset. The
remains of greylag goose (Anser anser) were also found at Soldier’s Hole (Kennard 1945;
Campbell and Simpson 1971; Parry 1929, 1931; Bramwell 1960). Further evidence for wetland
birds was discovered at Tornewton Cave in the Reindeer stratum, these birds were teal (Anas
crecca). The environmental evidence in this area suggests a temperate zone in the southern
borders of Britain, however the remains of common shelduck from Brixham Cave, south
Devon, is indicative of mild conditions (Prestwich 1874). There are multiple caves within the
south-west with evidence for a variety of wetland bird species, many of which are seen in
Britain today.
The end of the Devensian glaciation period consists of sites which exhibit the remains of a bird
species which were adapted to the cold, but also adapted to grazing on grassland that was
becoming readily available. Whooper swan bones (Cygnus Cygnus) recovered in Gough’s
Cave, Somerset, are an example of a migratory bird that still returns to the estuaries and
wetlands of Britain in the winter (Jacobi 1986; Harrison 1980b, 1986). Mallard (Anas
platyrhynchos), teal and wigeon have also been recovered from Soldier’s Hole; these avian
species are a common sight across Britain today. Other bird remains include barnacle goose
(Branta leucopsis) from Chelm’s Combe, Somerset, and smew (Mergus albellus) from Bridged
Pot cave shelter, Somerset. Smew and barnacle geese are migratory birds, wintering in Britain.
Smew currently return almost exclusively to the Severn Estuary and surrounding areas such as
Somerset, the remains of smew were found in Somerset, indicating that this preference has
remained unchanged (Balch 1928; Harrison 1987a).
The Holocene period in Britain is represented by a multitude of sites with a variety of avian
species, many of which could have lived in estuarine or wetland environments. Port Eyon Cave,
on the Gower Peninsula, south Wales, is a particularly important site as it contains faunal
remains from between c.9,000-6,000 BP (Harrison 1987a). This site contained waterfowl and
seabird remains, such as white-fronted goose, barnacle goose, mallard, wigeon and common
shelduck, which are suggested to have been deposited by a large predatory bird. Very few
51
wading birds have been found at Port Eyon Cave; though turnstone, golden plover (Pluvialis
apricaria) and grey plover (Pluvialis squatarola) have been recorded. These birds are still
common wetland waders in the Severn Estuary. The remains of bones with incomplete
ossification, juvenile in age, have also been recovered at this site for great black-backed gull
(Larus marinus), guillemot (Uria aalge), little auk (Alle alle), puffin (Fratercula arctica) and
razorbill (Alca torda); these birds are also still found in Britain and many are migratory,
spending time in Britain during either the summer or winter.
A further important site that contains a variety of avian remains is Glastonbury Lake
Settlement, with an approximate date of 150 BC-50 AD (Andrews 1899; Bulleid and Gray
1911-1917; Harrison 1980b). The bones of Dalmatian pelican (Pelecanus crispus) have been
recovered in this settlement, these birds nest in marshy areas and keep to marsh and estuarine
areas, avoiding humans where possible. The remains of these birds suggest that during this
period the species was migrating to Britain; they no-longer do, choosing other warmer areas in
Europe. The remains of mallard, wigeon, pochard (Aythya ferina), bittern (Botaurus stellaris),
and tufted duck (Aythya fuligula) were also recorded. Common crane (Grus grus) remains were
recovered at Glastonbury Lake Settlement, Meare Lake Settlement, Somerset and Woodbury
Settlement, Devon (Harrison 1980a). A larger crane species was also discovered at the
aforementioned lake settlements in Somerset.
The range of wetland and wading avian remains found across the south-west of Britain is vast,
revealing a change in species as the climate and environment also changed. There are species
that suggest that migratory patterns and behaviours of certain species have changed; when
attempting to determine Mesolithic species from footprint-track evidence modern birds of the
British Isles, birds from across the world and birds that are now extinct must all be considered.

52
Key to Table 2.7
Wolstonian 200000-120000BP
Tornewton Cave, south Devon (Site1)
Ipswichian 120000-110000BP
Bacon Hole, Gower Peninsula, Wales (Site 2)
Minchin Hole, Gower Peninsula, Wales (Site 3)
Tornewton Cave, south Devon (Site 4)
Devensian 100000-11000BP
Soldier’s Hole, Cheddar Gorge, Somerset (Site 5)
Tornewton Cave, south Devon (Site 6)
Kent’s Cavern, Devon (Site 7)
Cat’s Hole, Gower Peninsula, Wales (Site 8)
Brixham Cave, Brixham, Devon (Site 9)
Gough’s Cave, Cheddar Gorge, Somerset (Site 10)
Chelm’s Combe Rock Shelter, Cheddar, Somerset (Site 11)
Bridged pot cave shelter, Ebbor Gorge, Somerset (Site 12)
Mesolithic 10000-5500BP
Port Eyon Cave, Gower Peninsula, Wales (Site 13)
Neolithic 5500-4000BP
Hazelton North, Gloustershire (Site 14)
Durrington Walls (Site 15)
Mount Pleasant (Site 16)
Bronze Age 4000-3200BP
Twyford Down (Site 17)
Iron Age 3200BP-43AD
Glastonbury Lake Settlement, Somerset (Site 18)
Meare Lake Settlement, Somerset (Site 19)
Woodbury Settlement, Devon (Site 20)
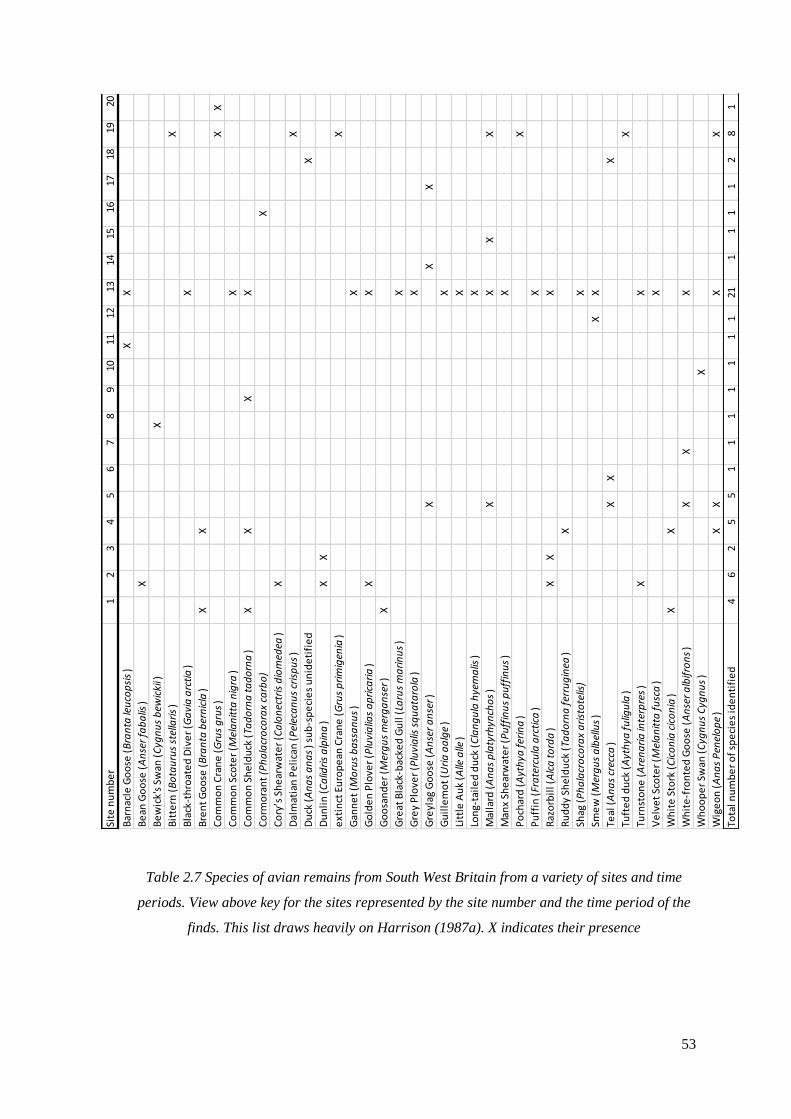
53
Table 2.7 Species of avian remains from South West Britain from a variety of sites and time
periods. View above key for the sites represented by the site number and the time period of the
finds. This list draws heavily on Harrison (1987a). X indicates their presence
Site
nu
mb
er
12
34
56
78
910
1112
1314
1516
1718
1920
Bar
nac
le G
oo
se (
Bra
nta
leu
cop
sis
)X
X
Be
an G
oo
se (
An
ser
fab
alis
)X
Be
wic
k's
Swan
(C
ygn
us
bew
icki
i)X
Bit
tern
(B
ota
uru
s st
ella
ris
)X
Bla
ck-t
hro
ate
d D
ive
r (G
avi
a a
rcti
a)
X
Bre
nt
Go
ose
(B
ran
ta b
ern
icla
)X
X
Co
mm
on
Cra
ne
(G
rus
gru
s)
XX
Co
mm
on
Sco
ter
(Mel
an
itta
nig
ra)
X
Co
mm
on
Sh
eld
uck
(Ta
do
rna
ta
do
rna
)X
XX
X
Co
rmo
ran
t (P
ha
lacr
oco
rax
carb
o)
X
Co
ry’s
Sh
ear
wat
er
(Ca
lon
ectr
is d
iom
edea
)X
Dal
mat
ian
Pe
lica
n (
Pel
eca
nu
s cr
isp
us
)X
Du
ck (
An
as
an
as
) su
b-s
pe
cie
s u
nid
eti
fie
dX
Du
nli
n (
Ca
lidri
s a
lpin
a)
XX
ext
inct
Eu
rop
ean
Cra
ne
(G
rus
pri
mig
enia
)X
Gan
ne
t (M
oru
s b
ass
an
us
)X
Go
lde
n P
love
r (P
luvi
alia
s a
pri
cari
a)
XX
Go
osa
nd
er
(Mer
gu
s m
erg
an
ser)
X
Gre
at B
lack
-bac
ked
Gu
ll (
Laru
s m
ari
nu
s)
X
Gre
y P
love
r (P
luvi
alis
sq
ua
taro
la)
X
Gre
ylag
Go
ose
(A
nse
r a
nse
r)X
XX
Gu
ille
mo
t (U
ria
aa
lge
)X
Litt
le A
uk
(Alle
alle
)X
Lon
g-ta
ile
d d
uck
(C
lan
gu
la h
yem
alis
)X
Mal
lard
(A
na
s p
laty
rhyn
cho
s)
XX
XX
Man
x Sh
ear
wat
er
(Pu
ffin
us
pu
ffin
us
)X
Po
char
d (
Ayt
hya
fer
ina
)X
Pu
ffin
(Fr
ate
rcu
la a
rcti
ca)
X
Raz
orb
ill (
Alc
a t
ord
a)
XX
X
Ru
dd
y Sh
eld
uck
(Ta
do
rna
fer
rug
inea
)X
Shag
(P
ha
lacr
oco
rax
ari
sto
telis
)X
Sme
w (
Mer
gu
s a
lbel
lus
)X
X
Teal
(A
na
s cr
ecca
)X
XX
Tuft
ed
du
ck (
Ayt
hya
fu
ligu
la)
X
Turn
sto
ne
(A
ren
ari
a in
terp
res
)X
X
Ve
lve
t Sc
ote
r (M
ela
nit
ta f
usc
a)
X
Wh
ite
Sto
rk (
Cic
on
ia c
ico
nia
)X
X
Wh
ite
-fro
nte
d G
oo
se (
An
ser
alb
ifro
ns
)X
XX
Wh
oo
pe
r Sw
an (
Cyg
nu
s C
ygn
us
)X
Wig
eo
n (
An
as
Pen
elo
pe
)X
XX
X
Tota
l nu
mb
er
of
spe
cie
s id
en
tifi
ed
46
25
51
11
11
11
211
11
12
81
54
As well as understanding the possible species of the past it is also important to understand the
present bird species that visit the Severn Estuary and Great Britain, as migration behaviours and
residents of Britain may have changed since prehistory. Table 2.8 records the avian species that
have been noted on the Severn Estuary since 1952 (Severn Side Birds 2018), the seasons that
they are present and in certain cases, their rarity. By understanding the large range of birds that
may frequent the intertidal zone, and comparing it to the avian skeletal record of nearby
prehistoric sites (Table 2.7) a picture of the prehistoric birds that visited the Severn Estuary
begins to be established. Mesolithic Port Eyon is contemporary in date to Goldcliff and
approximately 70 miles from Goldcliff Island. A consideration of the species within this area
may assist in understanding the birds that may have been present on the Severn Estuary during
the Mesolithic period. Of the 21 avian species from Port Eyon, 12 are currently still found on
the Severn Estuary. Three of the 12 are year-round residents and the other nine visit the Severn
Estuary during different seasons throughout the year. Four of the species represented in the
bones at Port Eyon are from birds that are seen on the Severn Estuary, but are considered rare.
Barnacle goose and little auk can be seen during the winter, and razorbill during the summer;
less than 100 of these birds are noted each year. Great-blacked gull were not on the Severn
Estuary bird list (Severn Side Birds 2018), however the RSPB note that one or two pairs may be
sighted there each year. The final five species are all birds that have not been sighted on the
Severn Estuary since 1952, but they are still seen in other areas of Britain. Black-throated divers
are residents of the British coastline and can be seen at Port Eyon (Hume 2002), there is also a
summer migratory population that can be found across the coastlines of Britain. Gannet are also
not listed on the Severn Estuary bird list; they are a relatively rare bird due to their small
breeding populations, some of which are in Pembrokeshire. Long-tailed duck still winter on
British coastlines, especially at Orkney, though they do not winter on the Severn Estuary.
Puffins are residents of north Scotland, though summer breeders fly to west Wales and Ireland.
Velvet Scoters are also found in small numbers in winter on the British coastlines (Hume 2002).
Within footprint-track studies, a consideration of the species in prehistory and the environments
and habitats these species require can be a useful resource when establishing a footprint-track
maker. Avian footprint-tracks are often overlooked or only briefly mentioned in site reports, full
analysis would enhance our understanding of Mesolithic birds, as the bone record is not
extensive.

55
2.6 Summary
The Mesolithic period in Britain is relatively sparse in terms of sites that contain human, bird
and mammal bones, though those we do have are informative and assist in our understanding of
the species. This information can complement footprint-track data and assist in the way we
interpret a site. A brief discussion of the bird bones in prehistoric Britain was presented within
this chapter to assist in understanding why certain species were focused upon during the
experiment in Chapter 7. The bones of Mesolithic humans and animals are also of importance in
using as a complimentary dataset when observing the prehistoric footprints.
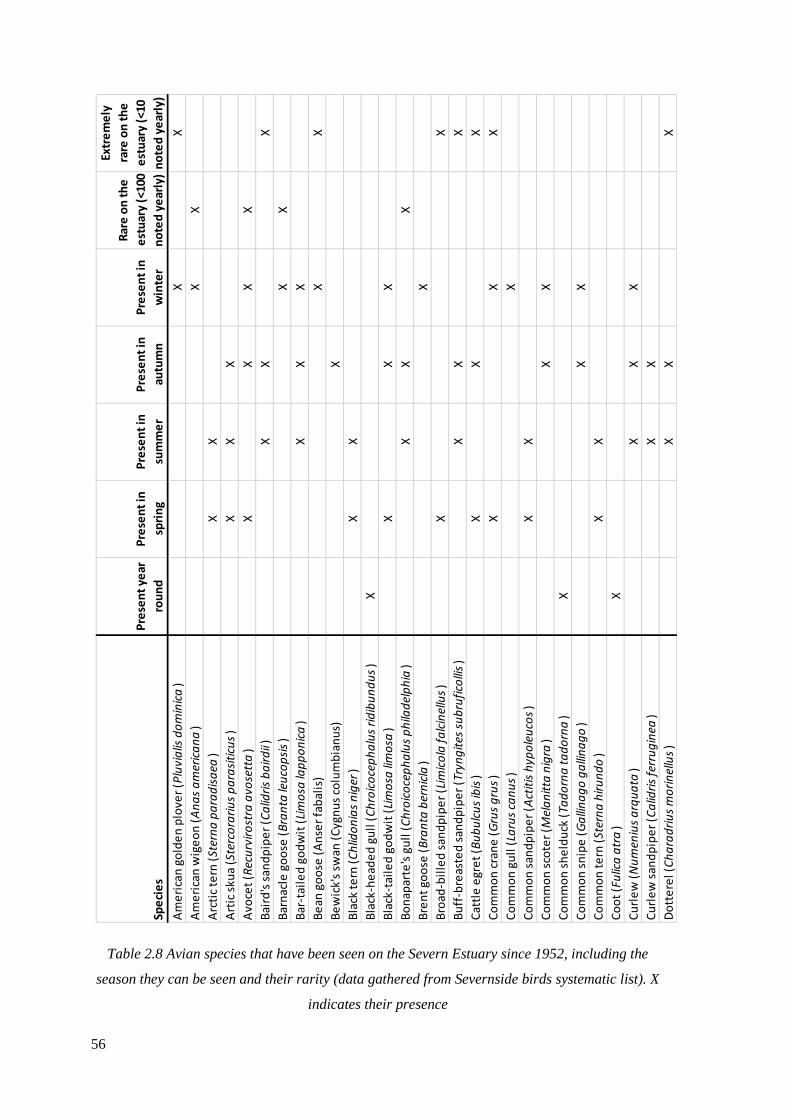
56
Table 2.8 Avian species that have been seen on the Severn Estuary since 1952, including the
season they can be seen and their rarity (data gathered from Severnside birds systematic list). X
indicates their presence
Spe
cie
s
Pre
sen
t ye
ar
rou
nd
Pre
sen
t in
spri
ng
Pre
sen
t in
sum
me
r
Pre
sen
t in
autu
mn
Pre
sen
t in
win
ter
Rar
e o
n t
he
est
uar
y (<
100
no
ted
ye
arly
)
Extr
em
ely
rare
on
th
e
est
uar
y (<
10
no
ted
ye
arly
)
Am
eri
can
go
lde
n p
love
r (P
luvi
alis
do
min
ica
)X
X
Am
eri
can
wig
eo
n (
An
as
am
eric
an
a)
XX
Arc
tic
tern
(St
ern
a p
ara
dis
aea
)X
X
Art
ic s
kua
(Ste
rco
rari
us
pa
rasi
ticu
s)
XX
X
Avo
cet
(Rec
urv
iro
stra
avo
sett
a)
XX
XX
Bai
rd's
san
dp
ipe
r (C
alid
ris
ba
ird
ii)
XX
X
Bar
nac
le g
oo
se (
Bra
nta
leu
cop
sis
)X
X
Bar
-tai
led
go
dw
it (
Lim
osa
lap
po
nic
a)
XX
X
Be
an g
oo
se (
An
ser
fab
alis
)X
X
Be
wic
k's
swan
(C
ygn
us
colu
mb
ian
us)
X
Bla
ck t
ern
(C
hlid
on
ias
nig
er)
XX
Bla
ck-h
ead
ed
gu
ll (
Ch
roic
oce
ph
alu
s ri
dib
un
du
s)
X
Bla
ck-t
aile
d g
od
wit
(Li
mo
sa li
mo
sa)
XX
X
Bo
nap
arte
's g
ull
(C
hro
ico
cep
ha
lus
ph
ilad
elp
hia
)X
XX
Bre
nt
goo
se (
Bra
nta
ber
nic
la)
X
Bro
ad-b
ille
d s
and
pip
er
(Lim
ico
la f
alc
inel
lus
)X
X
Bu
ff-b
reas
ted
san
dp
ipe
r (T
ryn
git
es s
ub
rufi
colli
s)
XX
X
Cat
tle
egr
et
(Bu
bu
lcu
s ib
is)
XX
X
Co
mm
on
cra
ne
(G
rus
gru
s)
XX
X
Co
mm
on
gu
ll (
Laru
s ca
nu
s)
X
Co
mm
on
san
dp
ipe
r (A
ctit
is h
ypo
leu
cos
)X
X
Co
mm
on
sco
ter
(Mel
an
itta
nig
ra)
XX
Co
mm
on
sh
eld
uck
(Ta
do
rna
ta
do
rna
)X
Co
mm
on
sn
ipe
(G
alli
na
go
ga
llin
ag
o)
XX
Co
mm
on
te
rn (
Ster
na
hir
un
do
)X
X
Co
ot
(Fu
lica
atr
a)
X
Cu
rle
w (
Nu
men
ius
arq
ua
ta)
XX
X
Cu
rle
w s
and
pip
er
(Ca
lidri
s fe
rru
gin
ea)
XX
Do
tte
rel (
Ch
ara
dri
us
mo
rin
ellu
s)
XX
X
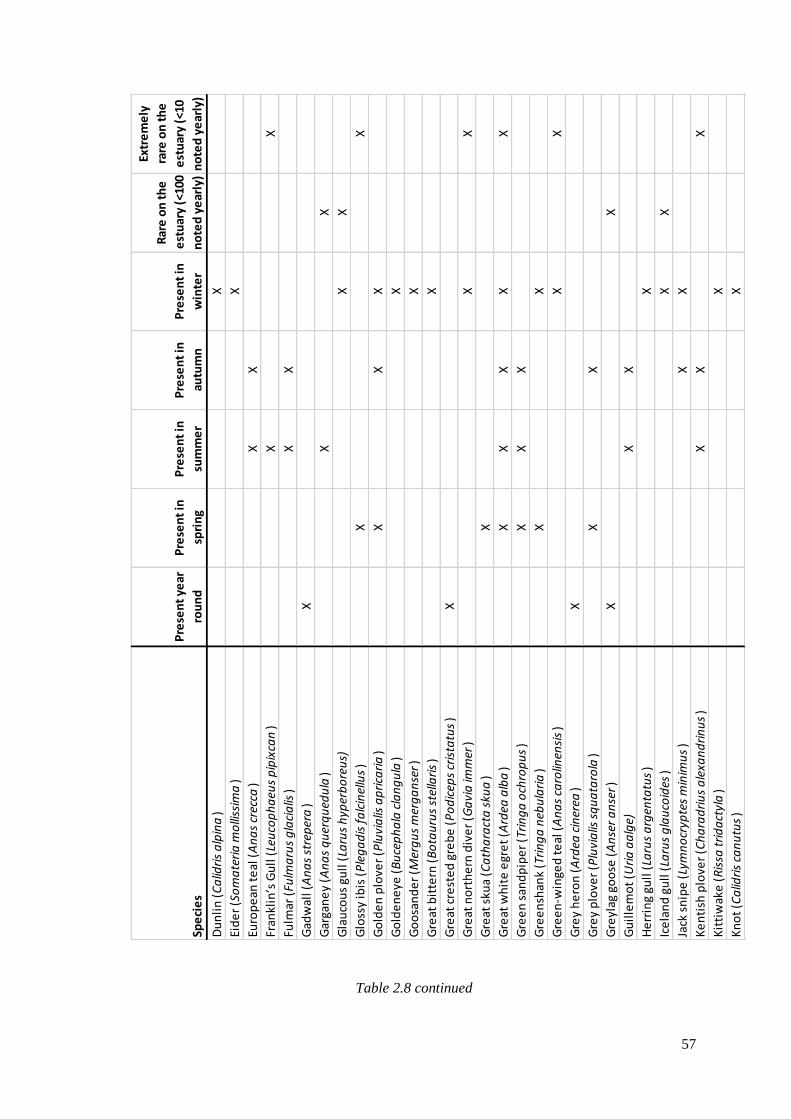
57
Table 2.8 continued
Spe
cie
s
Pre
sen
t ye
ar
rou
nd
Pre
sen
t in
spri
ng
Pre
sen
t in
sum
me
r
Pre
sen
t in
autu
mn
Pre
sen
t in
win
ter
Rar
e o
n t
he
est
uar
y (<
100
no
ted
ye
arly
)
Extr
em
ely
rare
on
th
e
est
uar
y (<
10
no
ted
ye
arly
)
Du
nli
n (
Ca
lidri
s a
lpin
a)
X
Eid
er
(So
ma
teri
a m
olli
ssim
a)
X
Euro
pe
an t
eal
(A
na
s cr
ecca
)X
X
Fran
klin
’s G
ull
(Le
uco
ph
aeu
s p
ipix
can
)X
X
Fulm
ar (
Fulm
aru
s g
laci
alis
)X
X
Gad
wal
l (A
na
s st
rep
era
)X
Gar
gan
ey
(An
as
qu
erq
ued
ula
)X
X
Gla
uco
us
gull
(La
rus
hyp
erb
ore
us)
XX
Glo
ssy
ibis
(P
leg
ad
is f
alc
inel
lus
)X
X
Go
lde
n p
love
r (P
luvi
alis
ap
rica
ria
)X
XX
Go
lde
ne
ye (
Bu
cep
ha
la c
lan
gu
la)
X
Go
osa
nd
er
(Mer
gu
s m
erg
an
ser)
X
Gre
at b
itte
rn (
Bo
tau
rus
stel
lari
s)
X
Gre
at c
rest
ed
gre
be
(P
od
icep
s cr
ista
tus
)X
Gre
at n
ort
he
rn d
ive
r (G
avi
a im
mer
)X
X
Gre
at s
kua
(Ca
tha
ract
a s
kua
)X
Gre
at w
hit
e e
gre
t (A
rdea
alb
a)
XX
XX
X
Gre
en
san
dp
ipe
r (T
rin
ga
och
rop
us
)X
XX
Gre
en
shan
k (T
rin
ga
neb
ula
ria
)X
X
Gre
en
-win
ged
te
al (
An
as
caro
linen
sis
)X
X
Gre
y h
ero
n (
Ard
ea c
iner
ea)
X
Gre
y p
love
r (P
luvi
alis
sq
ua
taro
la)
XX
Gre
ylag
go
ose
(A
nse
r a
nse
r)X
X
Gu
ille
mo
t (U
ria
aa
lge)
XX
He
rrin
g gu
ll (
Laru
s a
rgen
tatu
s)
X
Ice
lan
d g
ull
(La
rus
gla
uco
ides
)X
X
Jack
sn
ipe
(Ly
mn
ocr
ypte
s m
inim
us
)X
X
Ke
nti
sh p
love
r (C
ha
rad
riu
s a
lexa
nd
rin
us
)X
XX
Kit
tiw
ake
(R
issa
tri
da
ctyl
a)
X
Kn
ot
(Ca
lidri
s ca
nu
tus
)X
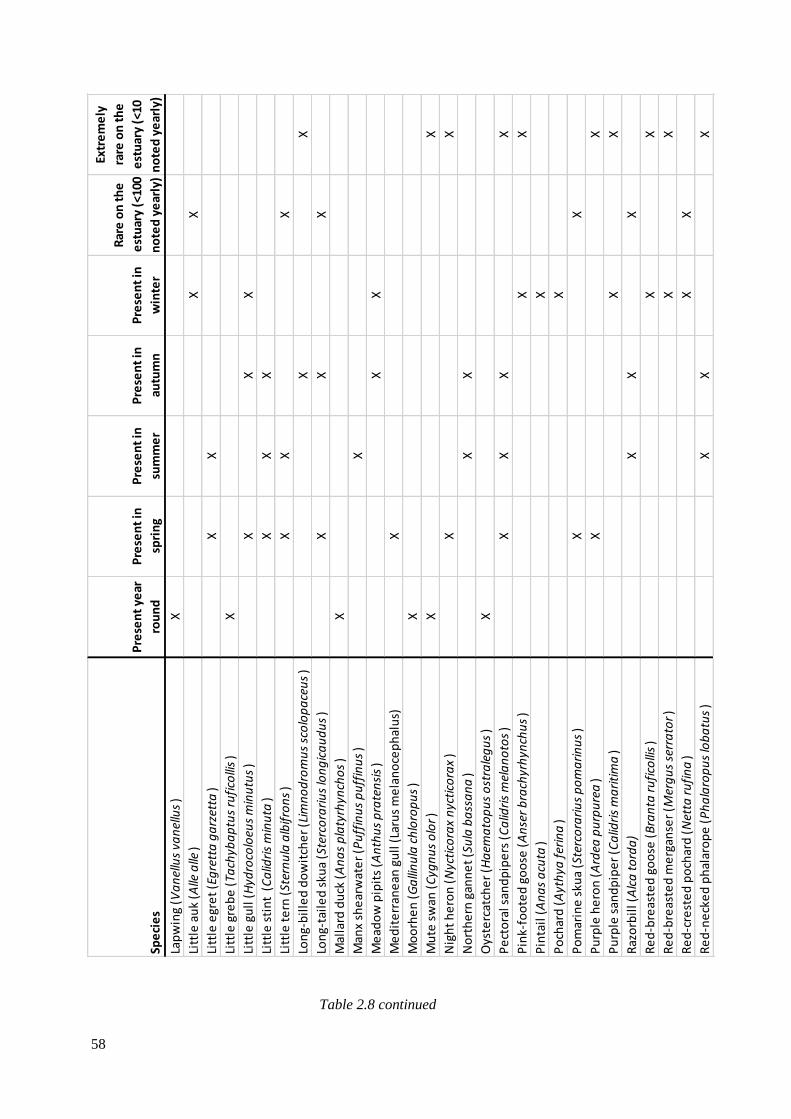
58
Table 2.8 continued
Spe
cie
s
Pre
sen
t ye
ar
rou
nd
Pre
sen
t in
spri
ng
Pre
sen
t in
sum
me
r
Pre
sen
t in
autu
mn
Pre
sen
t in
win
ter
Rar
e o
n t
he
est
uar
y (<
100
no
ted
ye
arly
)
Extr
em
ely
rare
on
th
e
est
uar
y (<
10
no
ted
ye
arly
)
Lap
win
g (V
an
ellu
s va
nel
lus
)X
Litt
le a
uk
(Alle
alle
)X
X
Litt
le e
gre
t (E
gre
tta
ga
rzet
ta)
XX
Litt
le g
reb
e (
Tach
yba
ptu
s ru
fico
llis
)X
Litt
le g
ull
(H
ydro
colo
eus
min
utu
s)
XX
X
Litt
le s
tin
t (
Ca
lidri
s m
inu
ta)
XX
X
Litt
le t
ern
(St
ern
ula
alb
ifro
ns
)X
XX
Lon
g-b
ille
d d
ow
itch
er
(Lim
no
dro
mu
s sc
olo
pa
ceu
s)
XX
Lon
g-ta
ile
d s
kua
(Ste
rco
rari
us
lon
gic
au
du
s)
XX
X
Mal
lard
du
ck (
An
as
pla
tyrh
ynch
os
)X
Man
x sh
ear
wat
er
(Pu
ffin
us
pu
ffin
us
)X
Me
ado
w p
ipit
s (A
nth
us
pra
ten
sis
)X
X
Me
dit
err
ane
an g
ull
(La
rus
me
lan
oce
ph
alu
s)X
Mo
orh
en
(G
alli
nu
la c
hlo
rop
us
)X
Mu
te s
wan
(C
ygn
us
olo
r)X
X
Nig
ht
he
ron
(N
ycti
cora
x n
ycti
cora
x)
XX
No
rth
ern
gan
ne
t (S
ula
ba
ssa
na
)X
X
Oys
terc
atch
er
(Ha
ema
top
us
ost
rale
gu
s)
X
Pe
cto
ral s
and
pip
ers
(C
alid
ris
mel
an
oto
s)
XX
XX
Pin
k-fo
ote
d g
oo
se (
An
ser
bra
chyr
hyn
chu
s)
XX
Pin
tail
(A
na
s a
cuta
)X
Po
char
d (
Ayt
hya
fer
ina
)X
Po
mar
ine
sku
a (S
terc
ora
riu
s p
om
ari
nu
s)
XX
Pu
rple
he
ron
(A
rdea
pu
rpu
rea
)X
X
Pu
rple
san
dp
ipe
r (C
alid
ris
ma
riti
ma
)X
X
Raz
orb
ill (
Alc
a t
ord
a)
XX
X
Re
d-b
reas
ted
go
ose
(B
ran
ta r
ufi
colli
s)
XX
Re
d-b
reas
ted
me
rgan
ser
(Mer
gu
s se
rra
tor)
XX
Re
d-c
rest
ed
po
char
d (
Net
ta r
ufi
na
)X
X
Re
d-n
eck
ed
ph
alar
op
e (
Ph
ala
rop
us
lob
atu
s)
XX
X
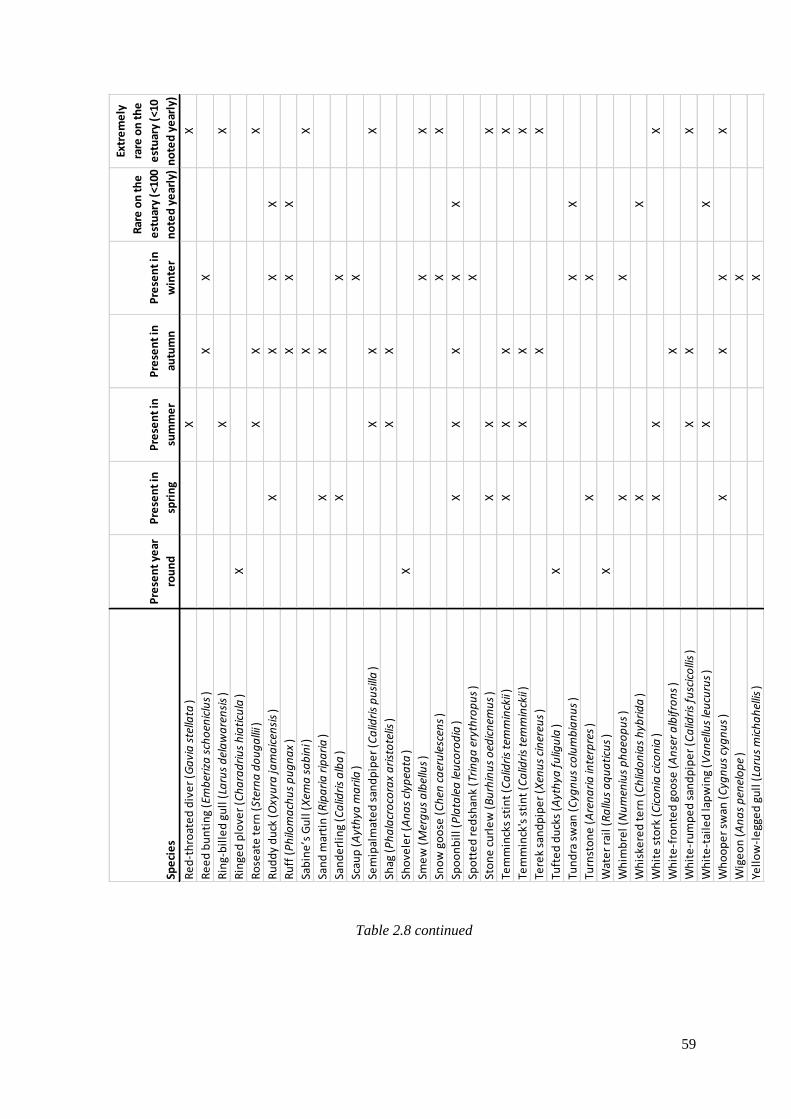
59
Table 2.8 continued
Spe
cie
s
Pre
sen
t ye
ar
rou
nd
Pre
sen
t in
spri
ng
Pre
sen
t in
sum
me
r
Pre
sen
t in
autu
mn
Pre
sen
t in
win
ter
Rar
e o
n t
he
est
uar
y (<
100
no
ted
ye
arly
)
Extr
em
ely
rare
on
th
e
est
uar
y (<
10
no
ted
ye
arly
)
Re
d-t
hro
ate
d d
ive
r (G
avi
a s
tella
ta)
XX
Re
ed
bu
nti
ng
(Em
ber
iza
sch
oen
iclu
s)
XX
Rin
g-b
ille
d g
ull
(La
rus
del
aw
are
nsi
s)
XX
Rin
ged
plo
ver
(Ch
ara
dri
us
hia
ticu
la)
X
Ro
seat
e t
ern
(St
ern
a d
ou
ga
llii)
XX
X
Ru
dd
y d
uck
(O
xyu
ra ja
ma
icen
sis
)X
XX
X
Ru
ff (
Ph
ilom
ach
us
pu
gn
ax
)X
XX
Sab
ine
’s G
ull
(X
ema
sa
bin
i)X
X
San
d m
arti
n (
Rip
ari
a r
ipa
ria
)X
X
San
de
rlin
g (C
alid
ris
alb
a)
XX
Scau
p (
Ayt
hya
ma
rila
)X
Sem
ipal
mat
ed
san
dp
ipe
r (C
alid
ris
pu
silla
)X
XX
Shag
(P
ha
lacr
oco
rax
ari
sto
telis
)X
X
Sho
vele
r (A
na
s cl
ypea
ta)
X
Sme
w (
Mer
gu
s a
lbel
lus
)X
X
Sno
w g
oo
se (
Ch
en c
aer
ule
scen
s)
XX
Spo
on
bil
l (P
lata
lea
leu
coro
dia
)X
XX
XX
Spo
tte
d r
ed
shan
k (T
rin
ga
ery
thro
pu
s)
X
Sto
ne
cu
rle
w (
Bu
rhin
us
oed
icn
emu
s)
XX
X
Tem
min
cks
stin
t (C
alid
ris
tem
min
ckii
)X
XX
X
Tem
min
ck's
sti
nt
(Ca
lidri
s te
mm
inck
ii)
XX
X
Tere
k sa
nd
pip
er
(Xen
us
cin
ereu
s)
XX
Tuft
ed
du
cks
(Ayt
hya
fu
ligu
la)
X
Tun
dra
sw
an (
Cyg
nu
s co
lum
bia
nu
s)
XX
Turn
sto
ne
(A
ren
ari
a in
terp
res
)X
X
Wat
er
rail
(R
allu
s a
qu
ati
cus
)X
Wh
imb
rel (
Nu
men
ius
ph
aeo
pu
s)
XX
Wh
iske
red
te
rn (
Ch
lido
nia
s h
ybri
da
)X
X
Wh
ite
sto
rk (
Cic
on
ia c
ico
nia
)X
XX
Wh
ite
-fro
nte
d g
oo
se (
An
ser
alb
ifro
ns
)X
Wh
ite
-ru
mp
ed
san
dp
ipe
r (C
alid
ris
fusc
ico
llis
)X
XX
Wh
ite
-tai
led
lap
win
g (V
an
ellu
s le
ucu
rus
)X
X
Wh
oo
pe
r sw
an (
Cyg
nu
s cy
gn
us
)X
XX
X
Wig
eo
n (
An
as
pen
elo
pe
)X
Yell
ow
-le
gge
d g
ull
(La
rus
mic
ha
hel
lis)
X
60
Chapter 3
Later Quaternary Stratigraphy of the Severn Estuary Levels
3.1 Introduction
The Severn Estuary is located on the south-west coast of Britain, which is rich in sites of high
archaeological and palaeoenviromental importance, and is a Site of Special Scientific Interest, a
Special Protection Area, and a Special Area of Conservation. The Severn River is the longest
river in Great Britain, with the second highest tidal range in the world, reaching a maximum of
14.8m at Avonmouth (Admiralty Tide Tables 2015). This tidal range has created an ecosystem
unique to the United Kingdom, with mud and sand flats, estuaries, saltmarsh pastures and
lagoons providing a habitat for a variety of birds, mammals and fish (The Wildlife Trust, Avon
2017).
The preservation of palaeoenvironmental evidence is rich in intertidal areas (Davidson 2002).
Changes to sea levels over time has enabled excellent preservation, with a variety of
archaeology preserved in the waterlogged environments of the Flandrian sediments. These
sediments form part of a complex sequence of sediment formation through terrestrial regression
and marine transgression during the Late Quaternary (Allen 1997, 2001a). Fluctuating sea
levels through multiple time periods have resulted in a variety of terrestrial, riverine and
estuarine land surfaces, enhanced by the twice daily rising and falling tide, the biweekly spring
tide cycle, the equinox cycles and tides related to astronomical events, floods and storms (Bell
and Neumann 1997).
The embanked shore of the estuary of today differs from that of prehistory. During the last
Ipswichian interglacial period sea levels were higher than they currently are, possibly 5-10m
above current sea level, with gravels and sands deposited upon the Pre-Ipswichian dissected
bedrock (Jones 2002a). The following glaciation (Devensian) resulted in a significant drop in
sea levels, approximately 120m below present sea level, exposing a greater land mass (Murphy
2002).
At the end of the glaciation (9500 cal BC) sea levels were at most 35m below present levels
(Murphy 2002), sea levels rose again in Britain, as melting of the ice (glacio-eustasy) occurred
(Tooley 1974). The amount of water released by glacio-eustasy resulted in a large amount of
water entering the oceans, submerging low-lying coastland, peat beds and forests (Jones
2002b). The sequence of the Holocene stratigraphy formed over the last 8000 years (Figure 3.1;
Table 3.1), has at its base basal peat that overlays a Holocene soil above Pleistocene bedrock
(Allen 2000b).
61
The Holocene prehistoric sediment sequence found upon the Severn Estuary is the Wentlooge
Formation, named after the Wentlooge Level in Gwent (Allen and Rae 1987). The sediments in
the Wentlooge Series are predominantly uniform grey clayey silts (Rippon 1997). The
Wentlooge Formation is found beneath the Severn Levels, with Holocene sediments covering
an area of c.840km2, and 10-15m in total thickness (Allen 2005). Evidence of footprint-tracks
can be found in these Holocene sediments.
Due to rapid periods of sea level rise experienced during the Holocene, the basal gravel and
peats were overlain with lower estuarine silts, clays, and with sand in certain areas. These
estuarine silt layers represent marine phases extending further inland, whereas the alternating
peat phases contain the remains of reed marshes, fen carr, woodland and raised bog. These
extended further out to areas that are now covered by water, with different phases representing
climate and sea level changes (Nayling 2002).
The number of peat sequences varies, although as many as five peat bed sequences may occur
(Allen 2000b), with the development of the peat occurring from 6770 ±70 BP (Beta-60761;
5740-5490 cal BC; Bell 2007, Table 2.1). The thickest Holocene peat is a clearly defined
feature of the intertidal zone, formed from reed peat overlain by wood peat and raised bog
during the middle Wentlooge (Figure 3.2 and Figure 3.3). Peat provides archaeologists with
excellent dating opportunities; when footprint-tracks are recorded on this surface dates can be
ascertained for these.
The Upper Wentlooge estuarine silts and peats are late Holocene in date and many meters thick,
with sea levels fluctuating between approximately five meters of the current tidal height (Allen
2000b; Nayling 2002; Tooley 1974). The Wentlooge Formation represents the remains of a
wetland environment, consisting of salt marshes and intertidal silt mudflats during the marine
phase, and reed marshes, woodland and peat bogs in the terrestrial phase.
Other silt formation stages occur above the Wentlooge Formation, on areas of the Severn
Estuary where there is still an active saltmarsh. These are the Rumney, Northwick and Awre
Formations and represent areas of saltmarsh retreat and advancement during the last millennia
(Allen and Rae 1987; Allen 1987; 1997; Allen 2001a). The Rumney Formation is split into
lower (medieval) and upper (early modern) and underlies the highest saltmarsh, whilst the Awre
Formation is late 19th century in date and underlies the salt marshes at an intermediate level.
The Northwick Formation is mid-20th century in date and is found beneath the lowest lying
saltmarsh (Allen 2001a).
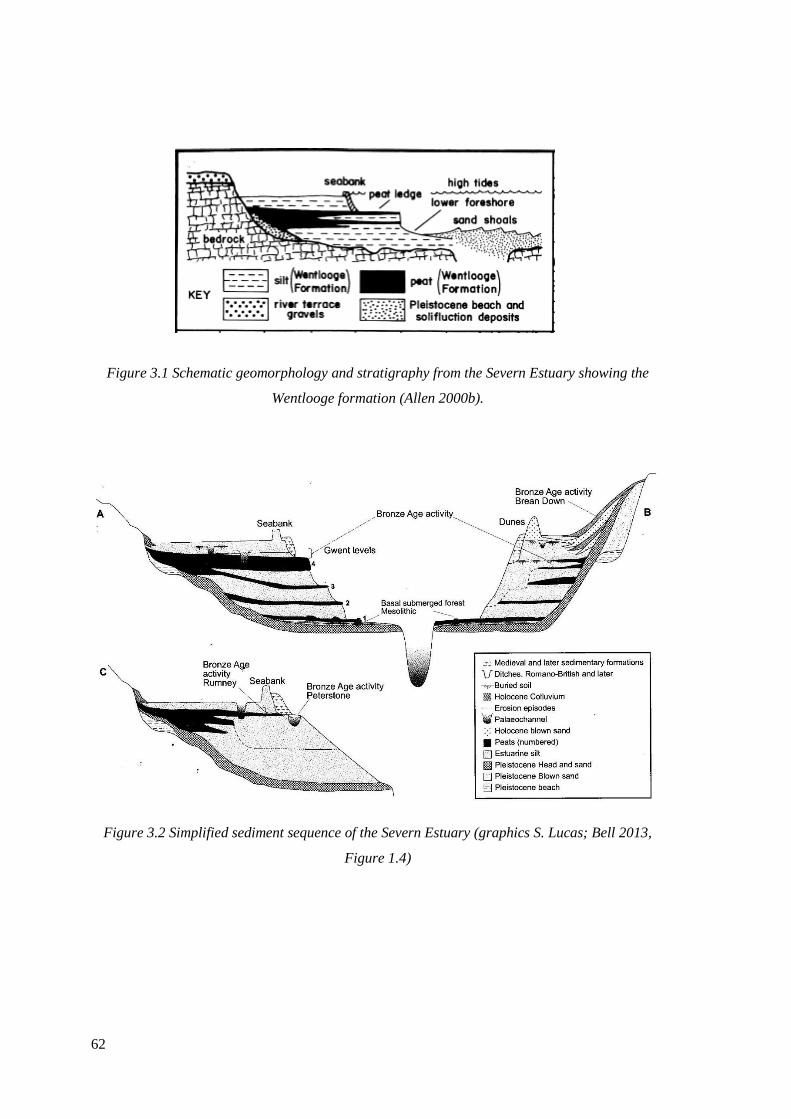
62
Figure 3.1 Schematic geomorphology and stratigraphy from the Severn Estuary showing the
Wentlooge formation (Allen 2000b).
Figure 3.2 Simplified sediment sequence of the Severn Estuary (graphics S. Lucas; Bell 2013,
Figure 1.4)
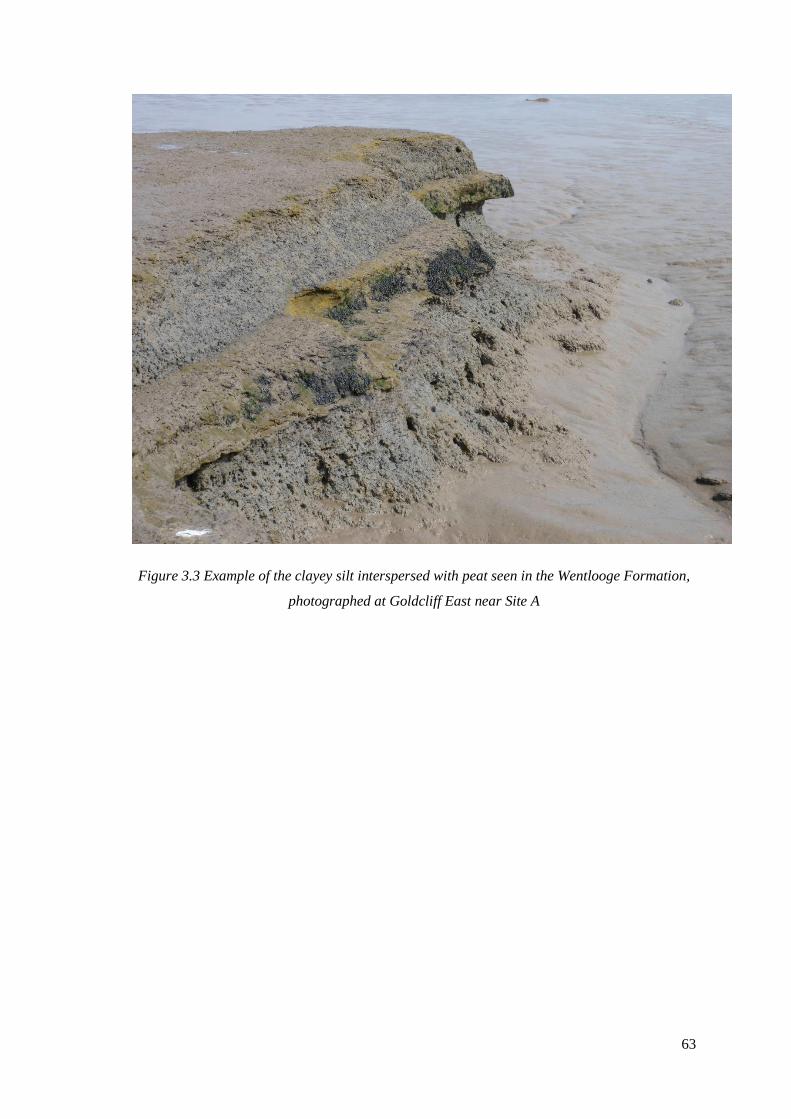
63
Figure 3.3 Example of the clayey silt interspersed with peat seen in the Wentlooge Formation,
photographed at Goldcliff East near Site A
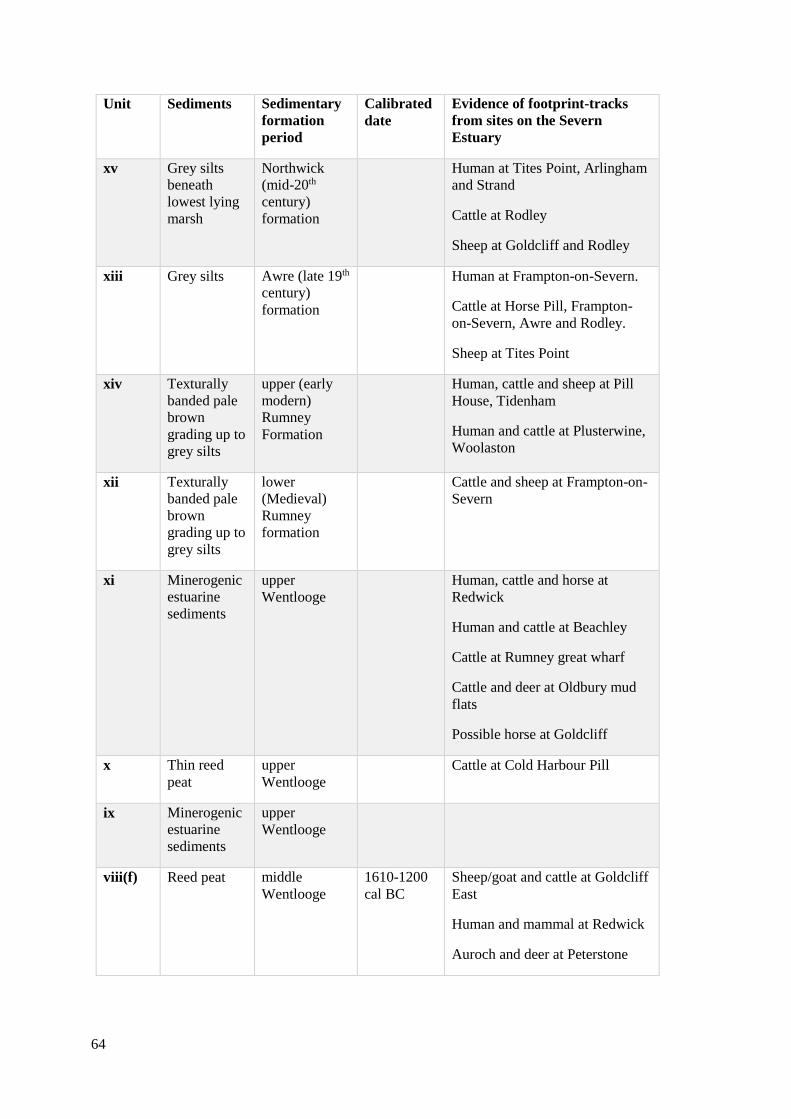
64
Unit Sediments Sedimentary
formation
period
Calibrated
date
Evidence of footprint-tracks
from sites on the Severn
Estuary
xv Grey silts
beneath
lowest lying
marsh
Northwick
(mid-20th
century)
formation
Human at Tites Point, Arlingham
and Strand
Cattle at Rodley
Sheep at Goldcliff and Rodley
xiii Grey silts Awre (late 19th
century)
formation
Human at Frampton-on-Severn.
Cattle at Horse Pill, Frampton-
on-Severn, Awre and Rodley.
Sheep at Tites Point
xiv Texturally
banded pale
brown
grading up to
grey silts
upper (early
modern)
Rumney
Formation
Human, cattle and sheep at Pill
House, Tidenham
Human and cattle at Plusterwine,
Woolaston
xii Texturally
banded pale
brown
grading up to
grey silts
lower
(Medieval)
Rumney
formation
Cattle and sheep at Frampton-on-
Severn
xi Minerogenic
estuarine
sediments
upper
Wentlooge
Human, cattle and horse at
Redwick
Human and cattle at Beachley
Cattle at Rumney great wharf
Cattle and deer at Oldbury mud
flats
Possible horse at Goldcliff
x Thin reed
peat
upper
Wentlooge
Cattle at Cold Harbour Pill
ix Minerogenic
estuarine
sediments
upper
Wentlooge
viii(f) Reed peat middle
Wentlooge
1610-1200
cal BC
Sheep/goat and cattle at Goldcliff
East
Human and mammal at Redwick
Auroch and deer at Peterstone

65
viii (e) Raised bog
peat
middle
Wentlooge
3970-3650
to 1940-
1530 cal
BC
Neolithic human, cattle and deer
at Oldbury flats
viii (d) Reed and
sedge peat
middle
Wentlooge
4350-3990
to 3970-
3650 cal
BC
viii (c) Upper
Submerged
Oak Forest
middle
Wentlooge
viii (b) Alder carr-
woodland
middle
Wentlooge
viii (a) Reed peat middle
Wentlooge
5050-4610
to 4910-
4500 cal
BC
Human and dog/ wolf at Magor
vii Minerogenic
estuarine
sediments,
banded
lower
Wentlooge
10,000 BP –
c 4600 Cal
BC
Mammal, bird and human at
Goldcliff East
Human and ungulate at
Uskmouth
Auroch, deer, wolf/ dog and bird
at Magor Pill
Auroch and deer at Redwick
vi Thin peat
containing
some trees of
Lower
Submerged
Forest
Mid-Holocene
v ( c) Thin
estuarine
sediment
Mid-Holocene
v (b) Lower
Submerged
Oak Forest
Mid-Holocene 6179-5826
±4 BC
v (a) Old Land
Surface
Mid-Holocene 5490-5330
cal BC
Ungulate footprint-tracks at Site
J, Goldcliff East
iv Stony Head
containing
Trias Red
Marl
Devensian
66
iii Sandy
pebbly Head
containing
Lias
limestone
Devensian
ii Sandy
pebbly
Ipswichian
beach
cemented as
sandrock
locally
Ipswichian
i Bottom
Table 3.1 Geological sequence of sediment formation from the Severn Estuary, outlining the
main Pleistocene and Holocene sedimentary units, including contexts where footprint-tracks
have been recorded. Table compiled from the work of Bell (2007, Table 2.1) and Allen (1997).
The mid-Holocene sediments represent dry land sediments at Goldcliff Island, whereas the
lower Wentlooge sediments represent the sediment sequence within the wetland and estuarine
environment across the Severn Estuary.
3.2 Banded Sediments
Estuarine sediments of the lower Wentlooge Formation are characterised by banding of silts
exposed on the margins of the estuary (Figure 3.4; Bell et al. 2003). The banding occurs in three
stratigraphic contexts. The unbroken deposition of silt and sand creates banded layers which
form a sequence of ‘couplets’, these occur in the lower and middle Wentlooge Formation, with
the banding only occurring upon the middle and upper parts of the silt beds (Allen 2004). A
further context for banded silts is seen in palaeochannels, where many of the former tidal creeks
are infilled with silts. The third context for banded sediments occurs when silts are accumulated
above erosion surfaces after regime change. A further fourth context may occur in minor
settings and is caused when sediment is laterally added to a landmass, which can be seen at the
Holocene deposits at Goldcliff, where there are silt deposits that are gently dipped (Figure 3.5).
Prehistoric footprint-tracks can be found on banded silts between the basal mid-Holocene and
middle Wentlooge peats. The banded laminae have been observed to be on a submillimetre to
millimetre scale (Allen 2004), and are visually distinctive, with the fine textured clayey silt
overlain by sandy silt (Figure 3.6). Textural models studying sediment deposition on a modern
estuarine environment suggest that seasonally changing windiness and temperature of the water
effect the deposition of the silts, which can vary in grain-size and thickness of the laminated
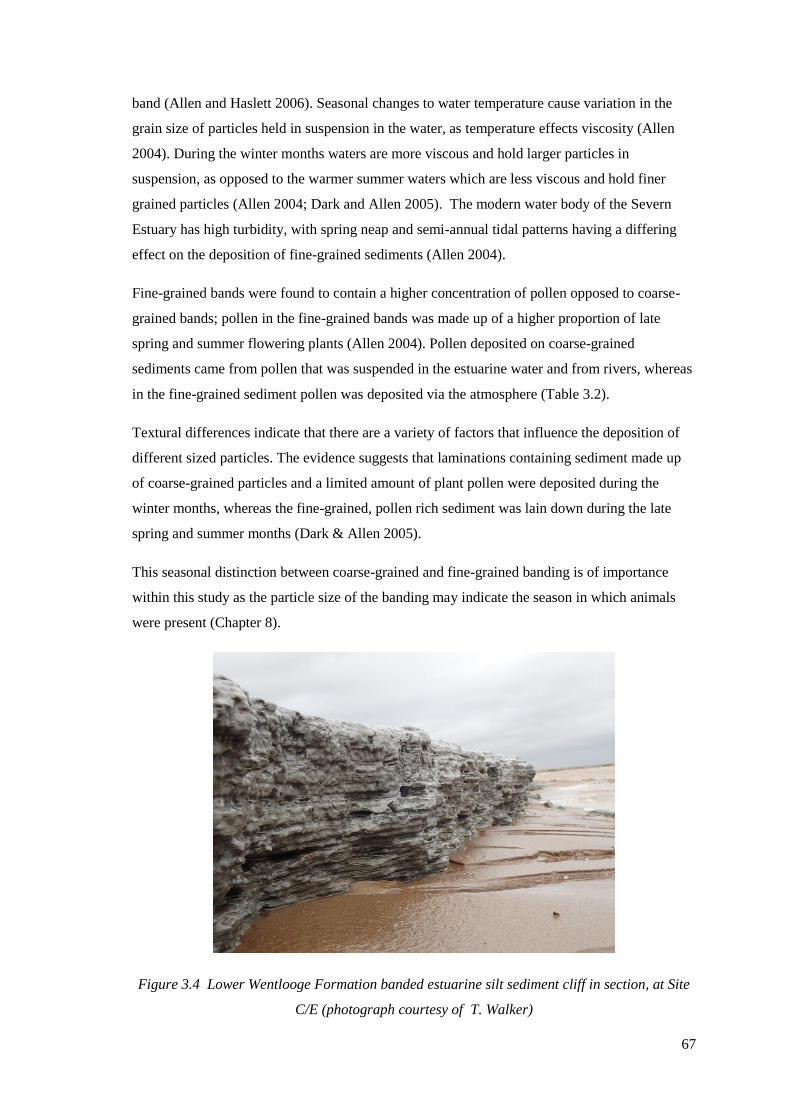
67
band (Allen and Haslett 2006). Seasonal changes to water temperature cause variation in the
grain size of particles held in suspension in the water, as temperature effects viscosity (Allen
2004). During the winter months waters are more viscous and hold larger particles in
suspension, as opposed to the warmer summer waters which are less viscous and hold finer
grained particles (Allen 2004; Dark and Allen 2005). The modern water body of the Severn
Estuary has high turbidity, with spring neap and semi-annual tidal patterns having a differing
effect on the deposition of fine-grained sediments (Allen 2004).
Fine-grained bands were found to contain a higher concentration of pollen opposed to coarse-
grained bands; pollen in the fine-grained bands was made up of a higher proportion of late
spring and summer flowering plants (Allen 2004). Pollen deposited on coarse-grained
sediments came from pollen that was suspended in the estuarine water and from rivers, whereas
in the fine-grained sediment pollen was deposited via the atmosphere (Table 3.2).
Textural differences indicate that there are a variety of factors that influence the deposition of
different sized particles. The evidence suggests that laminations containing sediment made up
of coarse-grained particles and a limited amount of plant pollen were deposited during the
winter months, whereas the fine-grained, pollen rich sediment was lain down during the late
spring and summer months (Dark & Allen 2005).
This seasonal distinction between coarse-grained and fine-grained banding is of importance
within this study as the particle size of the banding may indicate the season in which animals
were present (Chapter 8).
Figure 3.4 Lower Wentlooge Formation banded estuarine silt sediment cliff in section, at Site
C/E (photograph courtesy of T. Walker)
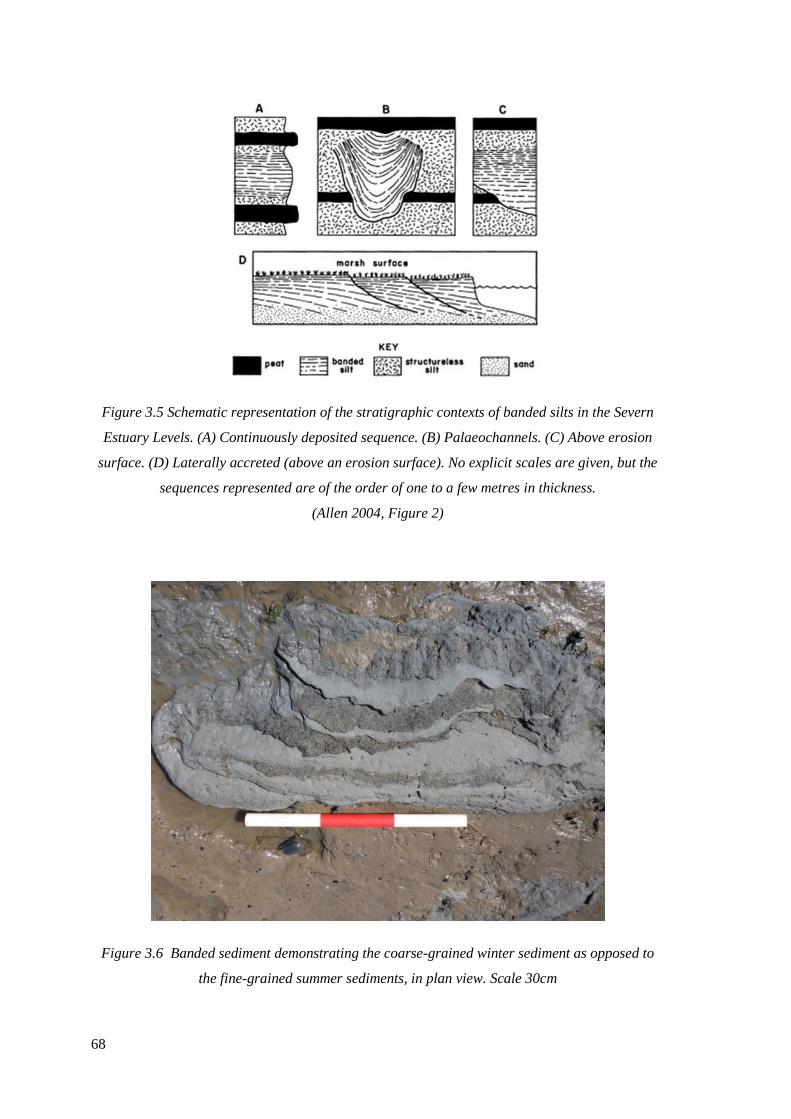
68
Figure 3.5 Schematic representation of the stratigraphic contexts of banded silts in the Severn
Estuary Levels. (A) Continuously deposited sequence. (B) Palaeochannels. (C) Above erosion
surface. (D) Laterally accreted (above an erosion surface). No explicit scales are given, but the
sequences represented are of the order of one to a few metres in thickness.
(Allen 2004, Figure 2)
Figure 3.6 Banded sediment demonstrating the coarse-grained winter sediment as opposed to
the fine-grained summer sediments, in plan view. Scale 30cm
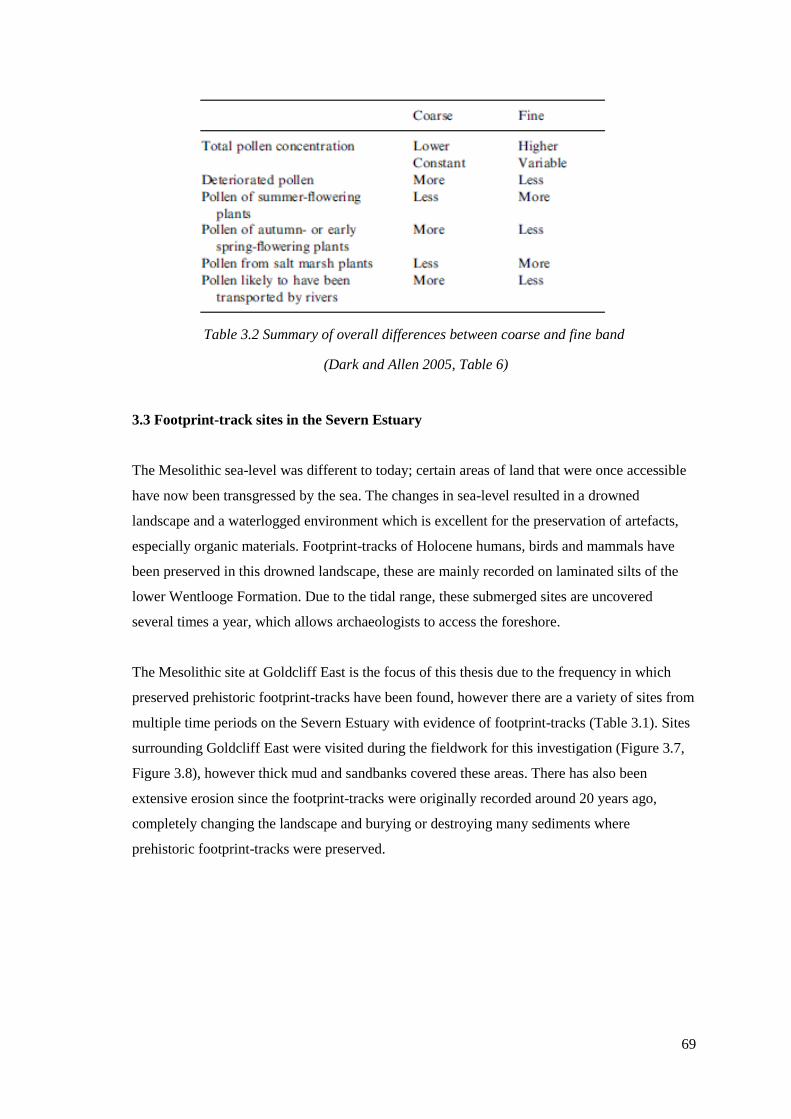
69
Table 3.2 Summary of overall differences between coarse and fine band
(Dark and Allen 2005, Table 6)
3.3 Footprint-track sites in the Severn Estuary
The Mesolithic sea-level was different to today; certain areas of land that were once accessible
have now been transgressed by the sea. The changes in sea-level resulted in a drowned
landscape and a waterlogged environment which is excellent for the preservation of artefacts,
especially organic materials. Footprint-tracks of Holocene humans, birds and mammals have
been preserved in this drowned landscape, these are mainly recorded on laminated silts of the
lower Wentlooge Formation. Due to the tidal range, these submerged sites are uncovered
several times a year, which allows archaeologists to access the foreshore.
The Mesolithic site at Goldcliff East is the focus of this thesis due to the frequency in which
preserved prehistoric footprint-tracks have been found, however there are a variety of sites from
multiple time periods on the Severn Estuary with evidence of footprint-tracks (Table 3.1). Sites
surrounding Goldcliff East were visited during the fieldwork for this investigation (Figure 3.7,
Figure 3.8), however thick mud and sandbanks covered these areas. There has also been
extensive erosion since the footprint-tracks were originally recorded around 20 years ago,
completely changing the landscape and burying or destroying many sediments where
prehistoric footprint-tracks were preserved.
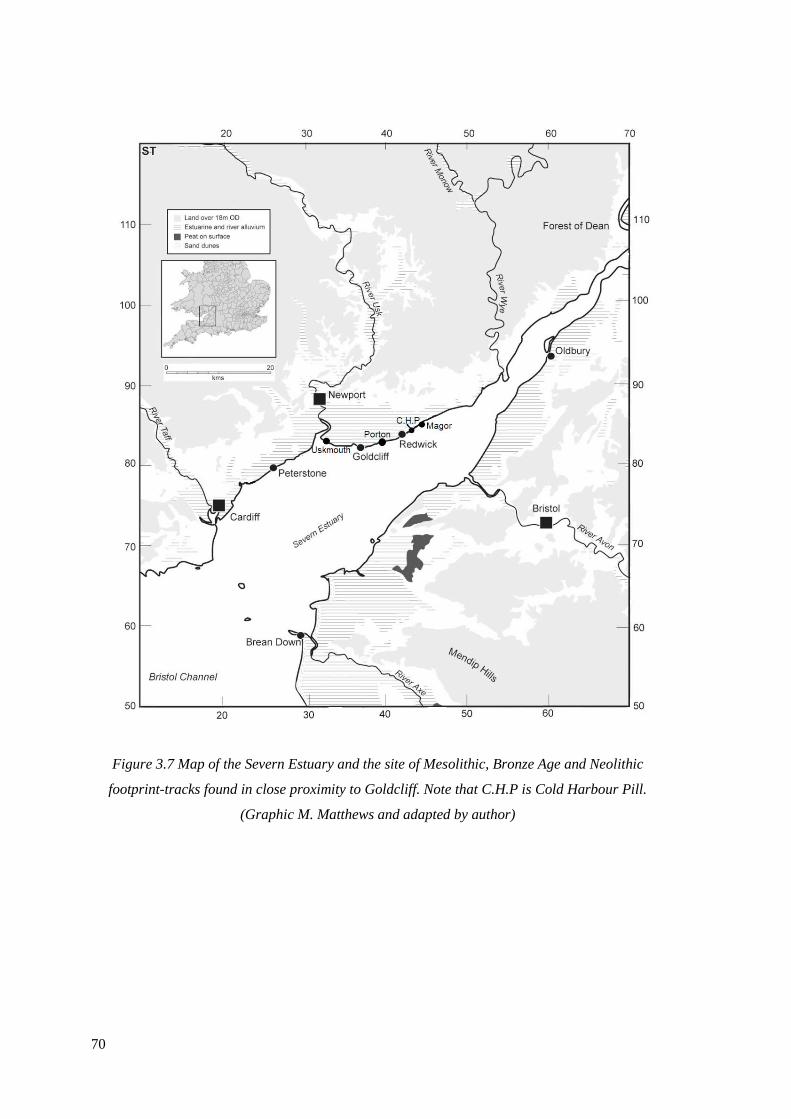
70
Figure 3.7 Map of the Severn Estuary and the site of Mesolithic, Bronze Age and Neolithic
footprint-tracks found in close proximity to Goldcliff. Note that C.H.P is Cold Harbour Pill.
(Graphic M. Matthews and adapted by author)
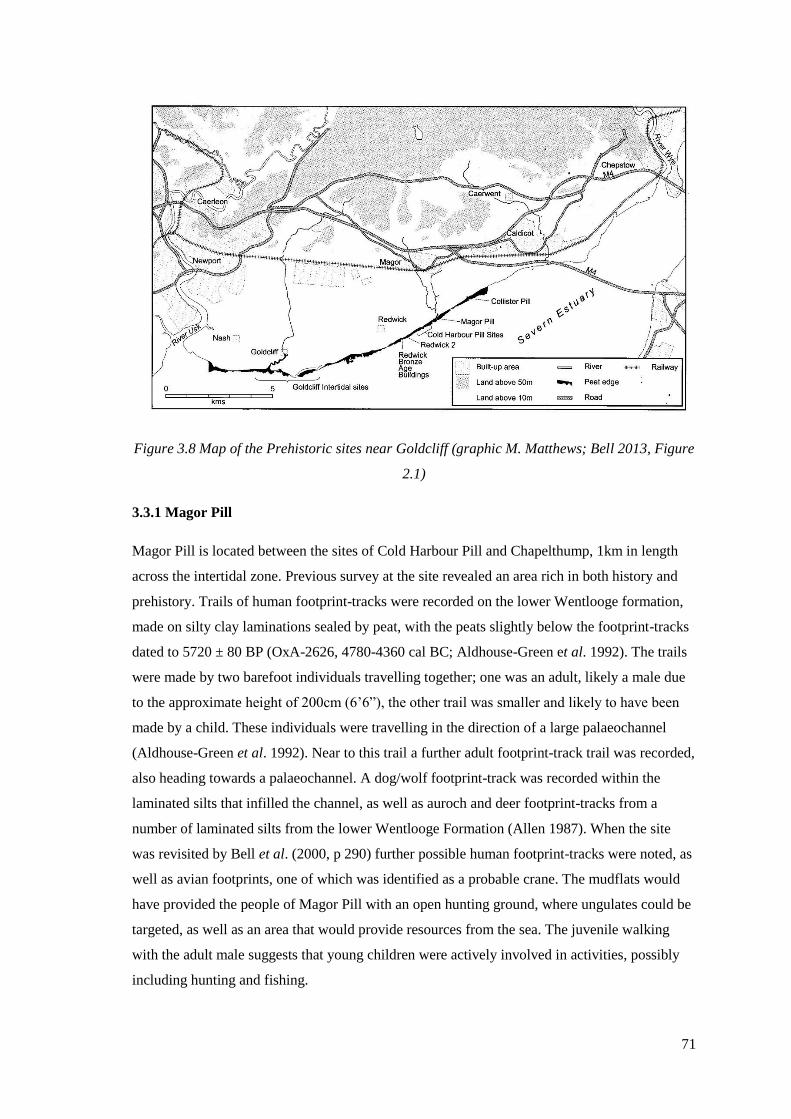
71
Figure 3.8 Map of the Prehistoric sites near Goldcliff (graphic M. Matthews; Bell 2013, Figure
2.1)
3.3.1 Magor Pill
Magor Pill is located between the sites of Cold Harbour Pill and Chapelthump, 1km in length
across the intertidal zone. Previous survey at the site revealed an area rich in both history and
prehistory. Trails of human footprint-tracks were recorded on the lower Wentlooge formation,
made on silty clay laminations sealed by peat, with the peats slightly below the footprint-tracks
dated to 5720 ± 80 BP (OxA-2626, 4780-4360 cal BC; Aldhouse-Green et al. 1992). The trails
were made by two barefoot individuals travelling together; one was an adult, likely a male due
to the approximate height of 200cm (6’6”), the other trail was smaller and likely to have been
made by a child. These individuals were travelling in the direction of a large palaeochannel
(Aldhouse-Green et al. 1992). Near to this trail a further adult footprint-track trail was recorded,
also heading towards a palaeochannel. A dog/wolf footprint-track was recorded within the
laminated silts that infilled the channel, as well as auroch and deer footprint-tracks from a
number of laminated silts from the lower Wentlooge Formation (Allen 1987). When the site
was revisited by Bell et al. (2000, p 290) further possible human footprint-tracks were noted, as
well as avian footprints, one of which was identified as a probable crane. The mudflats would
have provided the people of Magor Pill with an open hunting ground, where ungulates could be
targeted, as well as an area that would provide resources from the sea. The juvenile walking
with the adult male suggests that young children were actively involved in activities, possibly
including hunting and fishing.

72
As well as footprint-tracks, several artefacts were recorded at Magor. An unstratified Neolithic
polished rhyolite axe was found on muds near the middle Wentlooge peats (Green 1989). A
possible hearth was discovered on raised bog peat, approximately 150m east of Magor Pill’s
eastern palaeochannel; a brushwood trackway was also in this area, these were likely Bronze
Age in date due to being on the peat surface, though they may have been Iron Age (Neumann
2000, p 307). Iron Age finds were recorded in the upper part of the fill in a channel at Magor,
and include Iron Age pottery such as a bucket-shaped pot which was dated to the 3rd-1st century
BC (Whittle et al.1989), and Late Iron Age calcite tempered ware from other areas of Magor
Pill (Allen 1998b). Further finds in the channel upper silt recorded by Whittle et al. (1989)
include animal bones and a wooden peg. Pottery from the Roman and Medieval period was also
recorded at Magor, as was a medieval boat and medieval-modern fishtraps (Bell and Neumann
1997, p 5; Nayling 1998). This site demonstrates how intertidal zones provide a palimpsest of
archaeology due to the exploitation of wetland environments.
Although previously rich in data, during this study the site was covered by a large sand bank
with little exposure of laminated silts or peats.
3.3.2 Cold Harbour Pill
The site of Cold Harbour Pill is relatively small, covering c.400m of the intertidal zone, and is
situated between Redwick and Magor. Cold Harbour Pill has evidence of prehistoric footprint-
tracks, with a possible cattle hoofprint documented by Whittle et al. (1989) on the middle
Wentlooge Formation. Further cattle footprint-tracks were recorded from peat on the bank of a
palaeochannel which had a consolidated grey clay fill, the footprint-tracks were marked out by
areas of grey clay on the peat. Further investigation of the palaeochannel found a line of round
wood verticals and a woven structure which is thought to be from a fishing structure (Figure
3.9), possibly a fence-like structure which contained woven baskets (Neumann 2000, p 309).
The wooden structure was radiocarbon dated to 2520 ± 60 BP (SWAN-241, 790-530 cal BC;
Neumann 2000, p 306), meaning the cattle footprint-tracks and the wooden structure were early
Iron Age in date.
A trackway was reported by Locock (1998) and was found on the peaty clay layer above the
main peat shelf, with the peat sealed by a second thinner peat layer (Neumann 2000, p 289).
Within the raised peat bog at Cold Harbour Pill, found within a depression, two concentrated
areas of charcoal were observed, radiocarbon dated to 2900 ± 60 BP (Car-991, 1300-920 cal
BC; Whittle et al. 1989). Associated with the charcoal were fragments of pottery, pointed stakes

73
and fire-cracked flints. Another area containing charcoal was located 360m west of Cold
Harbour Pill, and was also found to contain evidence of stakes (Neumann 2000, p 300).
During this study there were no footprint-tracks or any other archaeological data discovered at
Cold Harbour Pill, though this was likely due to mud and a large sandbank covering most of the
area.
Figure 3.9 Palaeochannel at Cold Harbour Pill containing a wooden structure which was
possibly for fishing. Scale 0.3m (Bell et al. 2000, Figure 16.20)
3.3.3 Redwick
Redwick is a site in the intertidal zone of approximately 700m in length. This area has been
studied thoroughly and exhibits archaeological evidence from a variety of time periods. On the
lower Wentlooge Formation the footprint-tracks of adults and juveniles were recorded on
laminated silts, as were those of deer and cattle, which were likely auroch (Figure 3.10). On the
middle Wentlooge Formation cattle footprint-tracks were recorded within heavily trampled
muds within a paleochannel (Allen 1997). Further footprint-tracks are on the surface of middle
Wentlooge peat, are filled with silt and are around peat hummocks where four Bronze Age
rectangular buildings have been recorded, these have been dated to 1500-100 cal BC (Bell
2013, p 155). Evidence for the exploitation of intertidal wetlands is indicated by the human and
domesticated animal footprint-tracks made upon the peat shelf; these occur in curvilinear
depressions around the buildings (Figure 3.11 and Figure 3.12).
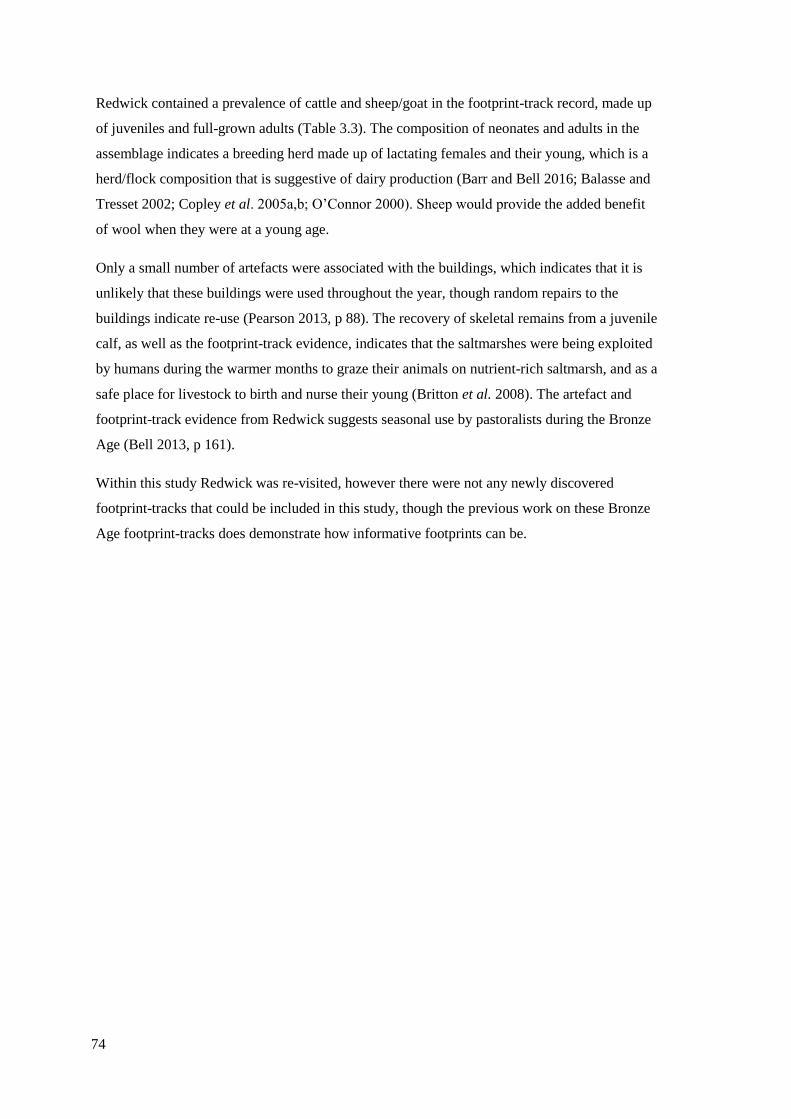
74
Redwick contained a prevalence of cattle and sheep/goat in the footprint-track record, made up
of juveniles and full-grown adults (Table 3.3). The composition of neonates and adults in the
assemblage indicates a breeding herd made up of lactating females and their young, which is a
herd/flock composition that is suggestive of dairy production (Barr and Bell 2016; Balasse and
Tresset 2002; Copley et al. 2005a,b; O’Connor 2000). Sheep would provide the added benefit
of wool when they were at a young age.
Only a small number of artefacts were associated with the buildings, which indicates that it is
unlikely that these buildings were used throughout the year, though random repairs to the
buildings indicate re-use (Pearson 2013, p 88). The recovery of skeletal remains from a juvenile
calf, as well as the footprint-track evidence, indicates that the saltmarshes were being exploited
by humans during the warmer months to graze their animals on nutrient-rich saltmarsh, and as a
safe place for livestock to birth and nurse their young (Britton et al. 2008). The artefact and
footprint-track evidence from Redwick suggests seasonal use by pastoralists during the Bronze
Age (Bell 2013, p 161).
Within this study Redwick was re-visited, however there were not any newly discovered
footprint-tracks that could be included in this study, though the previous work on these Bronze
Age footprint-tracks does demonstrate how informative footprints can be.
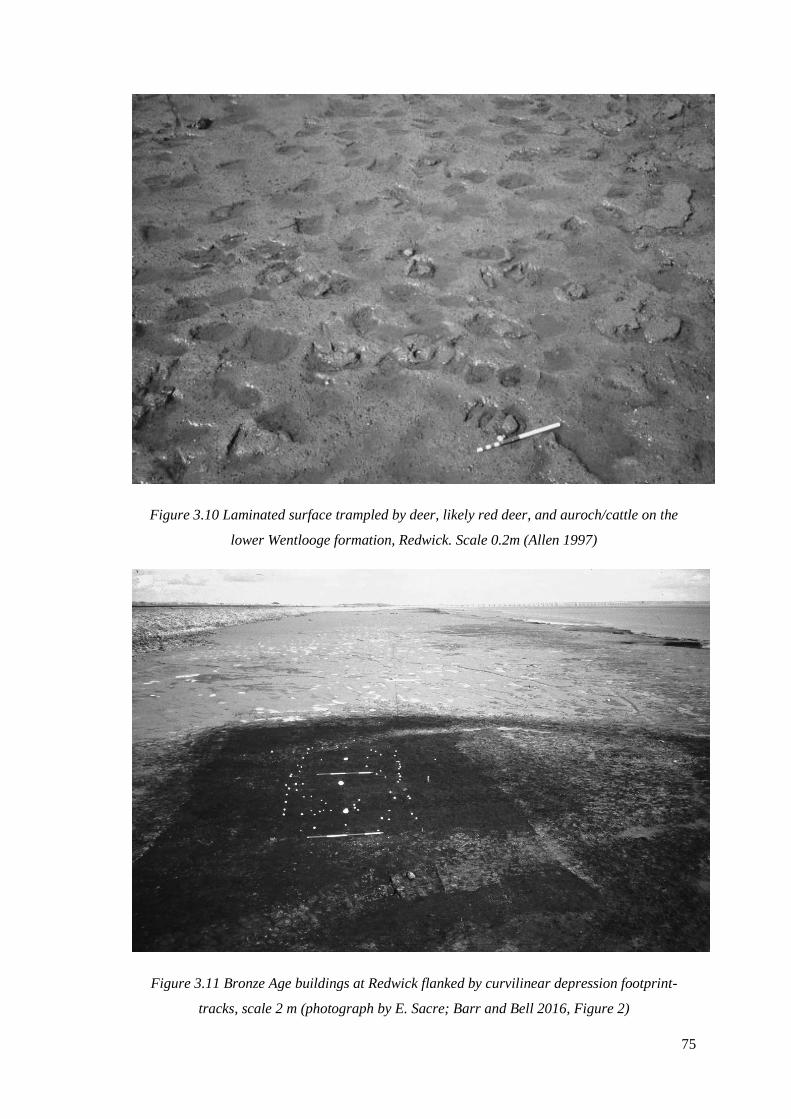
75
Figure 3.10 Laminated surface trampled by deer, likely red deer, and auroch/cattle on the
lower Wentlooge formation, Redwick. Scale 0.2m (Allen 1997)
Figure 3.11 Bronze Age buildings at Redwick flanked by curvilinear depression footprint-
tracks, scale 2 m (photograph by E. Sacre; Barr and Bell 2016, Figure 2)
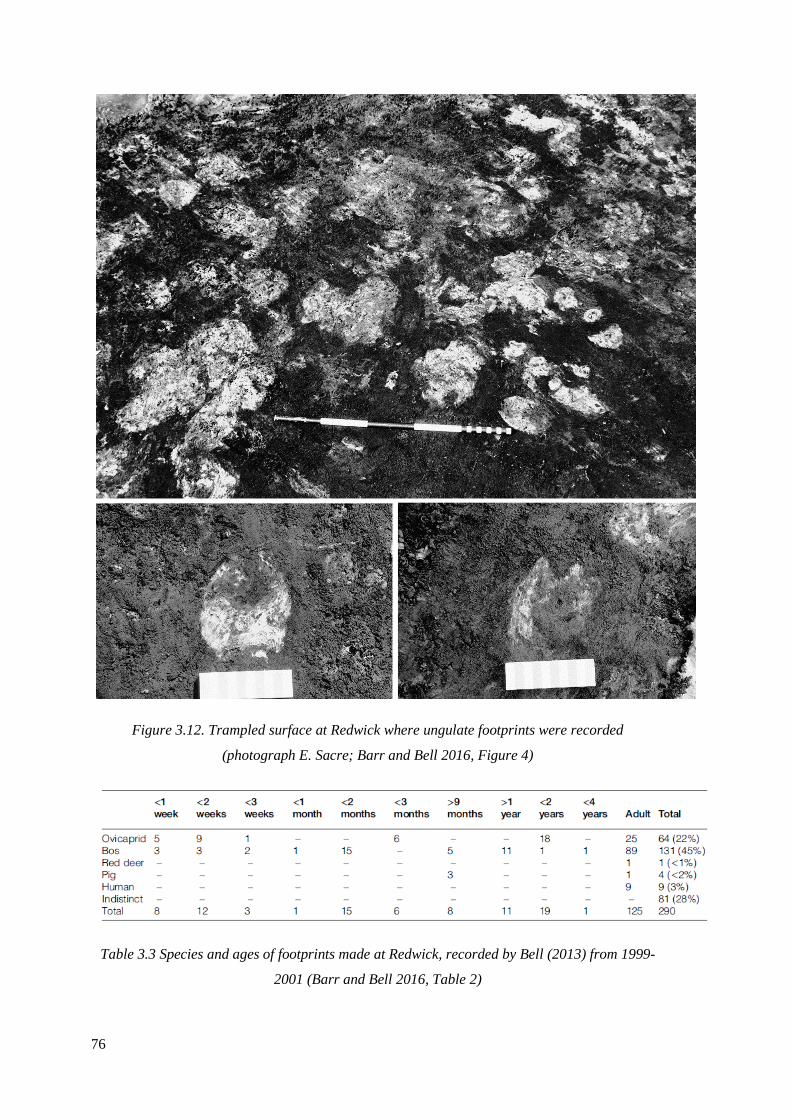
76
Figure 3.12. Trampled surface at Redwick where ungulate footprints were recorded
(photograph E. Sacre; Barr and Bell 2016, Figure 4)
Table 3.3 Species and ages of footprints made at Redwick, recorded by Bell (2013) from 1999-
2001 (Barr and Bell 2016, Table 2)
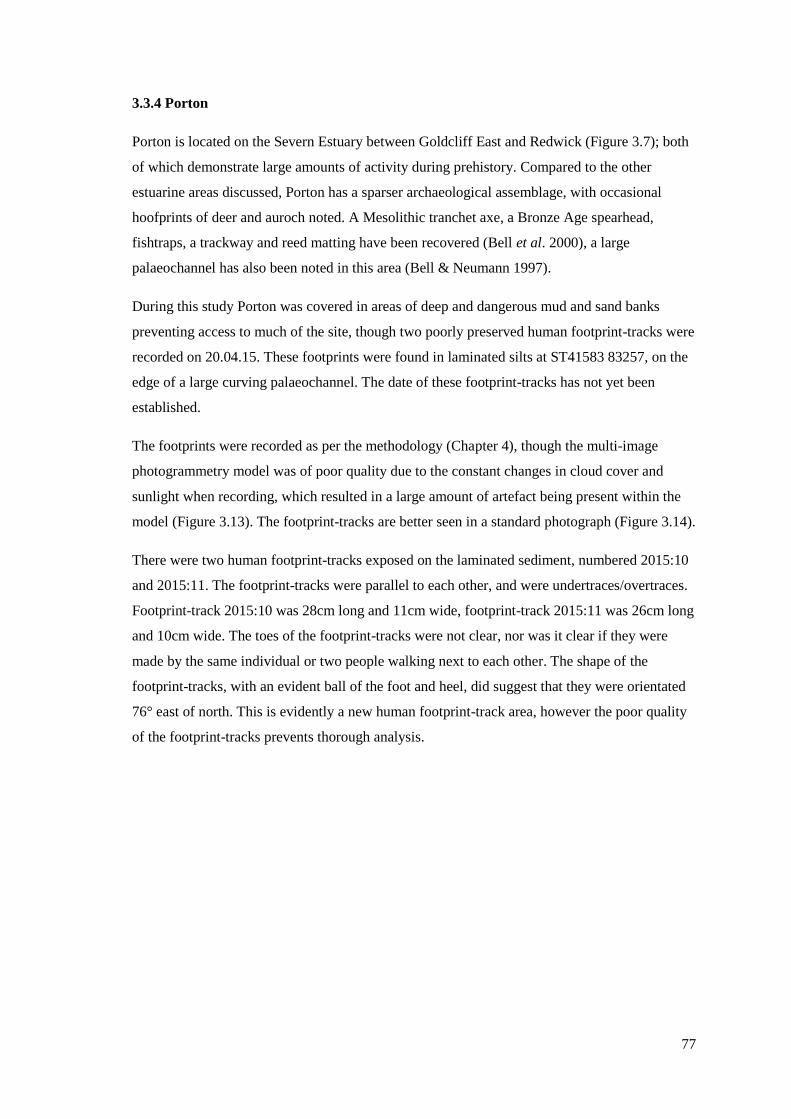
77
3.3.4 Porton
Porton is located on the Severn Estuary between Goldcliff East and Redwick (Figure 3.7); both
of which demonstrate large amounts of activity during prehistory. Compared to the other
estuarine areas discussed, Porton has a sparser archaeological assemblage, with occasional
hoofprints of deer and auroch noted. A Mesolithic tranchet axe, a Bronze Age spearhead,
fishtraps, a trackway and reed matting have been recovered (Bell et al. 2000), a large
palaeochannel has also been noted in this area (Bell & Neumann 1997).
During this study Porton was covered in areas of deep and dangerous mud and sand banks
preventing access to much of the site, though two poorly preserved human footprint-tracks were
recorded on 20.04.15. These footprints were found in laminated silts at ST41583 83257, on the
edge of a large curving palaeochannel. The date of these footprint-tracks has not yet been
established.
The footprints were recorded as per the methodology (Chapter 4), though the multi-image
photogrammetry model was of poor quality due to the constant changes in cloud cover and
sunlight when recording, which resulted in a large amount of artefact being present within the
model (Figure 3.13). The footprint-tracks are better seen in a standard photograph (Figure 3.14).
There were two human footprint-tracks exposed on the laminated sediment, numbered 2015:10
and 2015:11. The footprint-tracks were parallel to each other, and were undertraces/overtraces.
Footprint-track 2015:10 was 28cm long and 11cm wide, footprint-track 2015:11 was 26cm long
and 10cm wide. The toes of the footprint-tracks were not clear, nor was it clear if they were
made by the same individual or two people walking next to each other. The shape of the
footprint-tracks, with an evident ball of the foot and heel, did suggest that they were orientated
76° east of north. This is evidently a new human footprint-track area, however the poor quality
of the footprint-tracks prevents thorough analysis.

78
Figure 3.13 Multi-image photogrammetry model made of footprint-tracks 2015:10 and
2015:11. The model is relatively poor quality due to missing data
Figure 3.14 Standard photograph of footprint-track 2015:10 and 2015:11
79
3.3.5 Uskmouth
The intertidal site of Uskmouth is located on mudflats within the Newport wetlands, near the
RSPB Newport Wetlands visitor centre, Newport, Wales, immediately east of the mouth of the
River Usk. Approximately 2km long, in this area there has previously been a variety of
archaeology recorded. Perhaps the most significant of the Uskmouth finds is three human
footprint-track trails made by two probable adults and a child, all of whom were unshod, and
were recorded on the lower Wentlooge Formation from minerogenic sediments (Aldhouse-
Green et al. 1992). The lowermost peat overlaying the footprint-tracks was dated to 6140±100
BP (OxA-3307, 5240-4940 Cal BC; Aldhouse-Green et al. 1992). An antler mattock was found
near to the footprint-tracks, and radiocarbon dated to 6180±80 BP (OxA-4574, 5260-500 Cal
BC; Aldhouse-Green and Housley 1993). The footprint-track trails were travelling in a direction
that was diagonal to the current shoreline. One of the footprint-tracks was block-lifted so that
the silt could be examined by X-raying thin slices, and the shaft of the footprint was found to be
40-60mm deep, indicating that when the footprints were formed the silt was relatively firm.
Probable auroch footprint-tracks were recorded from the silts of the lower Wentlooge
formation, as were deer, which were found to be more plentiful than auroch footprint-tracks.
The deer footprint-tracks were found on silts at a variety of laminated levels, and were well-
formed, indicating that the sediment was likely firm and dry when walked upon (Allen 1997).
The appearance of human and animal footprint-tracks from the minerogenic lower Wentlooge
Formation sediments indicates that the Mesolithic people of Uskmouth were exploiting the
saltmarshes (Aldhouse-Green et al. 1992). Footprint-track evidence also suggests deer were
abundant and possibly being hunted. The antler mattock found in association to the footprint-
tracks may have been dropped by individuals as they were hunting or gathering on the
saltmarshes.
From the middle Wentlooge Formation a complete articulated aurochsen skeleton was
recovered from marine clay (4660±70 BP, Car-1096, 3640-3130 Cal BC; Whittle and Green
1988), though it is thought that this animal did not die because of human activity (Neumann
2000, p 290).
Uskmouth was visited during this study, however mud and a large sandbank had been deposited
making the discovery of footprint-tracks incredibly difficult. Although large areas of
laminations were clearly trampled by ungulates and a small number of deer footprint-tracks
were recorded this site had poor exposure.
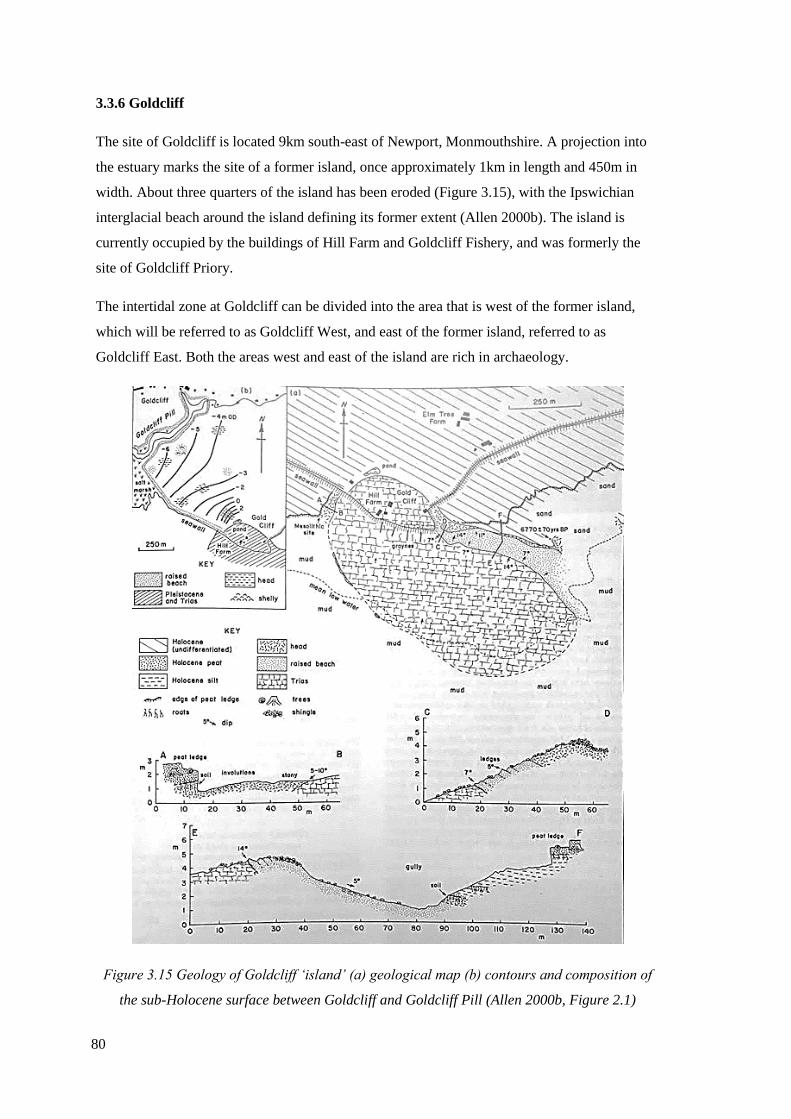
80
3.3.6 Goldcliff
The site of Goldcliff is located 9km south-east of Newport, Monmouthshire. A projection into
the estuary marks the site of a former island, once approximately 1km in length and 450m in
width. About three quarters of the island has been eroded (Figure 3.15), with the Ipswichian
interglacial beach around the island defining its former extent (Allen 2000b). The island is
currently occupied by the buildings of Hill Farm and Goldcliff Fishery, and was formerly the
site of Goldcliff Priory.
The intertidal zone at Goldcliff can be divided into the area that is west of the former island,
which will be referred to as Goldcliff West, and east of the former island, referred to as
Goldcliff East. Both the areas west and east of the island are rich in archaeology.
Figure 3.15 Geology of Goldcliff ‘island’ (a) geological map (b) contours and composition of
the sub-Holocene surface between Goldcliff and Goldcliff Pill (Allen 2000b, Figure 2.1)
81
3.3.7 Goldcliff West
The first prehistoric evidence from Goldcliff West was discovered in 1987 by Derek Upton and
Bob Trett, who observed a layer of charcoal, as well as flint flakes below the lower peat shelf of
the lower Wentlooge Formation (Parkhouse 1991, p 14). Further recording of this site in 1989
was carried out by Malcom Lillie (Bell 2000, p 33). Excavation between 1992-1994 found a
Mesolithic site within 10-20m of the edge of the bedrock from the original projection of
Goldcliff Island and demonstrated that this site, which shall now be referred to as Site W, was
on an old land surface (Figure 3.16). A radiocarbon date for this site comes from a cut deer
bone (6760±80 BP, 5750-5470 Cal BC; Barton and Bell 2000, p 58). An area of the Mesolithic
land surface at Site W had a concentration of charcoal which was possibly the remains of an
unlined flat hearth (Barton and Bell 2000, p 61). The charcoal was radiocarbon dated to
6430±80 BP (GU-2759; 5440-5280 cal BC; Bell 2000, p 33), meaning the Mesolithic activity at
this site ranged from c 5600 Cal BC to 5200 Cal BC (Barton and Bell 2000, p 58).
1650 artefacts were recorded at Site W, many were flint debitage and unidentifiable bone
fragments. A limited amount of geological raw material was found within the assemblages;
flint, chert, tuff and quartz, which took the form of flakes, blades, bladelets, chips, cores,
rejuvenation flakes, retouched tools, axes, adzes and unidentified waste, these were regarded as
late-Mesolithic types (Allen 2000b). The Mesolithic faunal assemblage from Goldcliff West
was dominated by red deer remains (63%), 20% of skeletal remains were that of pig, 5% were
otter, 3% roe deer, 3% wolf, 2% bird, 2% microvertebrates and 1% fish (Coard 2000, Table
4.2). The size of eel and smelt from this assemblage indicate they were netted during the
autumn/winter months (Ingrem 2000, p 54). Winter seasonality was also suggested by ageing
wild pig mandibles, where it was thought that they died aged 6-7 months, indicating that they
were killed during the winter period if assuming that they were born in the late spring/early
summer (Coard 2000, p 52). It was suggested that Site W was an impermanent settlement that
was only used for a short amount of time, possibly during the winter or spring (Barton and Bell
2000, p 63).
The middle Wentlooge formation at Goldcliff West contained evidence of two stratified human
skulls. The skulls, Goldcliff 1214 (3095±40 BP, OxA-7744; 1450-1260 Cal BC; Bell 2000, p
67) and Goldcliff 1990 find 497, were analysed and Goldcliff 1214 was found to be that of an
adult, whereas Goldcliff 1990 find 497 was an adolescent or a young adult. To the west an
almost clean clayey silt surface between the peat shelf and Site W was observed, where there
were traces of a small wooden structure (Bell et al. 2000, p 74). The structure was made up of
two planks with holes in them, as well as roundwood and brushwood. The structure extended
1.65m in length, and radiocarbon dating on a piece of cut roundwood (3443) dated the artefact
82
to 2720±70 BP (CAR-1434; 1040-790 cal BC; Bell et al. 2000, p 76). This suggests that the
boat planks were from the Bronze Age and had been reused to possibly create a small trackway
to assist in walking across a palaeochannel, or to provide a base to support boats being hauled
up from larger palaeochannels (Bell et al. 2000, p 82).
To the west of Goldcliff Pill, eight rectangular structures with probable reed flooring were
discovered on intertidal peats. Of these eight, five were well preserved and appeared to have
been roofed buildings (Bell et al. 2000, p 83). Radiocarbon dating of one of the post 127 (2120±
90 BP; GU-2912), wattle 919 (2100± 60 BP; CAR-1346; 360 cal BC- 20 cal AD), and the reed
layer (2200±70 BP; CAR-1347; 400-100 cal BC), suggest the structures were Iron Age (Bell et
al. 2000, p 92). Trackways were found in association to the buildings, with some leading
towards the buildings and others leading out into the estuary, possibly for fishing, fowling or
boat landing purposes. The trackways on the peat shelf were radiocarbon dated to between 400
cal BC and 100 cal BC (Bell et al. 2000, Figure 10.21). On the edge of a palaeochannel by
Building 6 and 8 there was extensive evidence of animal trampling between the peat edge and
the overlying upper Wentlooge clay. The area contained footprint-tracks that were clearly cattle,
with cattle head biting lice and dung beetles also present in the palaeochannel (Bell et al. 2000,
p 281; Smith et al. 2000, p 259).
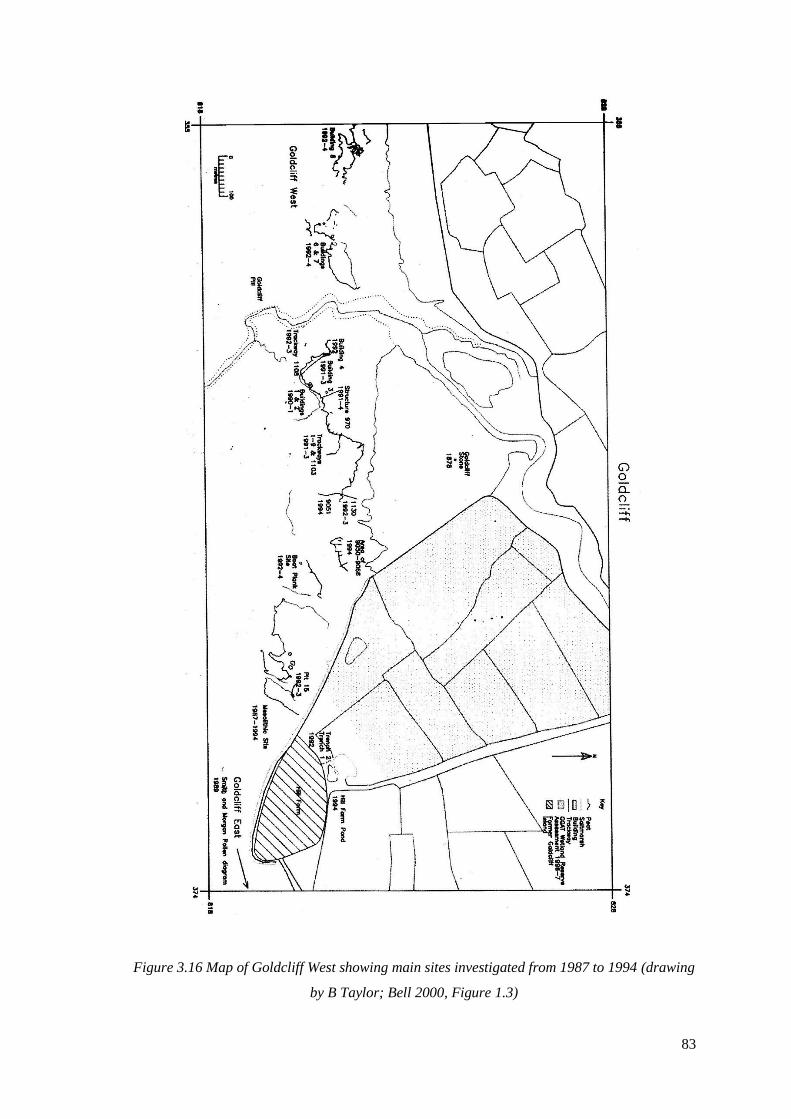
83
Figure 3.16 Map of Goldcliff West showing main sites investigated from 1987 to 1994 (drawing
by B Taylor; Bell 2000, Figure 1.3)
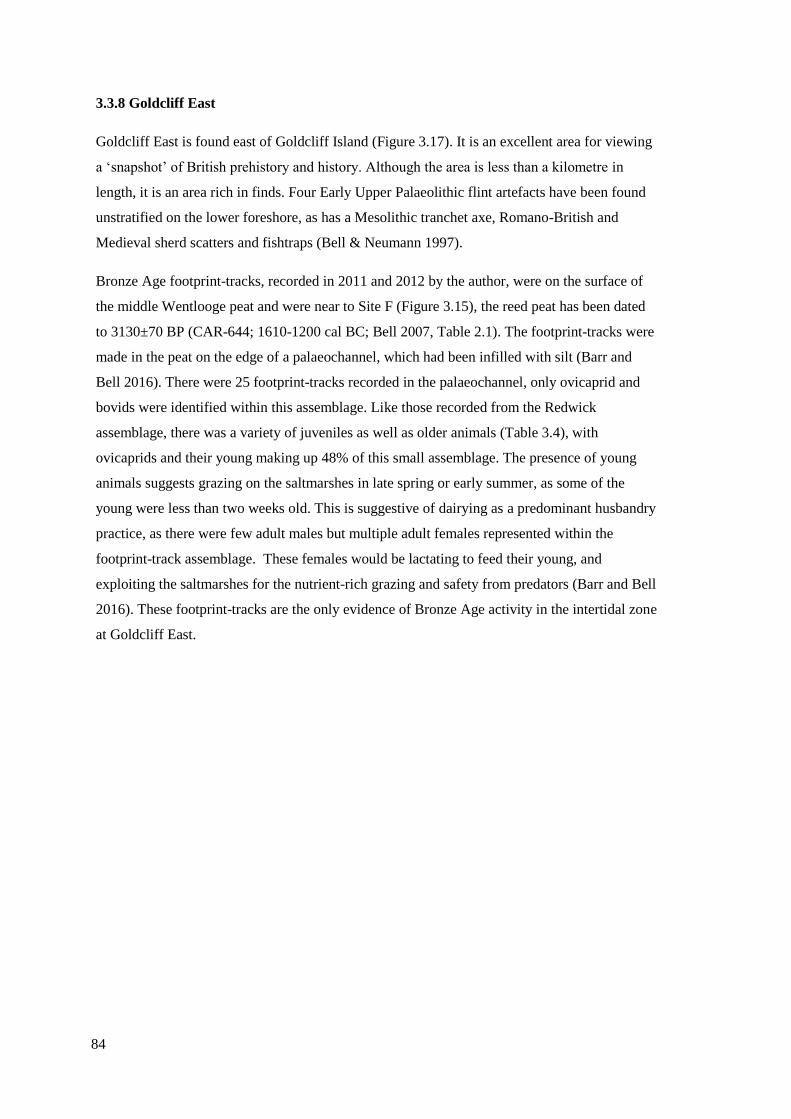
84
3.3.8 Goldcliff East
Goldcliff East is found east of Goldcliff Island (Figure 3.17). It is an excellent area for viewing
a ‘snapshot’ of British prehistory and history. Although the area is less than a kilometre in
length, it is an area rich in finds. Four Early Upper Palaeolithic flint artefacts have been found
unstratified on the lower foreshore, as has a Mesolithic tranchet axe, Romano-British and
Medieval sherd scatters and fishtraps (Bell & Neumann 1997).
Bronze Age footprint-tracks, recorded in 2011 and 2012 by the author, were on the surface of
the middle Wentlooge peat and were near to Site F (Figure 3.15), the reed peat has been dated
to 3130±70 BP (CAR-644; 1610-1200 cal BC; Bell 2007, Table 2.1). The footprint-tracks were
made in the peat on the edge of a palaeochannel, which had been infilled with silt (Barr and
Bell 2016). There were 25 footprint-tracks recorded in the palaeochannel, only ovicaprid and
bovids were identified within this assemblage. Like those recorded from the Redwick
assemblage, there was a variety of juveniles as well as older animals (Table 3.4), with
ovicaprids and their young making up 48% of this small assemblage. The presence of young
animals suggests grazing on the saltmarshes in late spring or early summer, as some of the
young were less than two weeks old. This is suggestive of dairying as a predominant husbandry
practice, as there were few adult males but multiple adult females represented within the
footprint-track assemblage. These females would be lactating to feed their young, and
exploiting the saltmarshes for the nutrient-rich grazing and safety from predators (Barr and Bell
2016). These footprint-tracks are the only evidence of Bronze Age activity in the intertidal zone
at Goldcliff East.
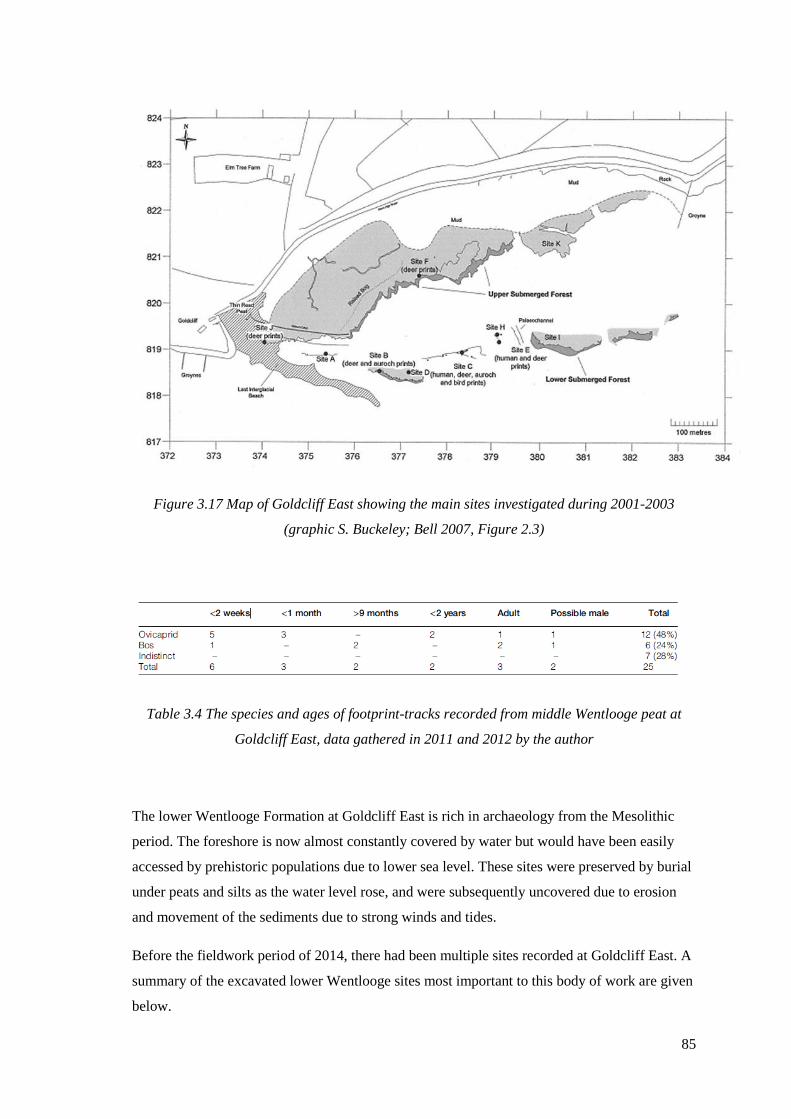
85
Figure 3.17 Map of Goldcliff East showing the main sites investigated during 2001-2003
(graphic S. Buckeley; Bell 2007, Figure 2.3)
Table 3.4 The species and ages of footprint-tracks recorded from middle Wentlooge peat at
Goldcliff East, data gathered in 2011 and 2012 by the author
The lower Wentlooge Formation at Goldcliff East is rich in archaeology from the Mesolithic
period. The foreshore is now almost constantly covered by water but would have been easily
accessed by prehistoric populations due to lower sea level. These sites were preserved by burial
under peats and silts as the water level rose, and were subsequently uncovered due to erosion
and movement of the sediments due to strong winds and tides.
Before the fieldwork period of 2014, there had been multiple sites recorded at Goldcliff East. A
summary of the excavated lower Wentlooge sites most important to this body of work are given
below.
86
3.3.8.1 Site J
An Old Land Surface, developed on the Pleistocene Head, contained many of the Mesolithic
activity sites at Goldcliff East. One of these is Site J, which is exposed at c.1.5m OD (Bell
2007, p 65). Site J is 120m west of Site A (Figure 3.17), on the most western point of the Upper
Peat and Submerged Forest. It is much higher in the tidal frame than the other Mesolithic sites
which meant that excavation could occur during the neap and the spring tides. Excavation
showed that Site J lay at the interface between a wetland environment and the island edge,
which resulted in environmental and organic artefacts being preserved next to dryland (Bell
2007, 63).
The Mesolithic activity area in the Old Land Surface (Context 328) was sealed by the peat
sequence (Figure 3.18), and provided two wood artefacts that were successfully radiocarbon
dated to 5934±39 BP (OxA-15549, 4940-4710 Cal BC; Bell 2007, Table 8.2) and 5930±37 BP
(OxA-15550, 4910-4710 Cal BC; Bell 2007, Table 8.2). This is when most activity was
occurring at this site, though it may have started earlier and finished later on a smaller scale
(Bell 2007, p 74). Dates have been obtained from the peat sequence sealing the Mesolithic
activity area, including reed peat from the bottom of Pit J, radiocarbon dated to 5730±33 BP
(OxA-13934, 4690-4490 Cal BC; Bell 2007, Table 8.2), and peat dated to 5061±21 BP (OxA-
12355, 3950-3790 Cal BC; Bell 2007, Table 8.2). The later date was from peat at 1.77m OD
and was the latest dated peat. The radiocarbon dates throughout the peat sequence showed that
the wood peat took approximately 900 years to form (Bell 2007, p 72). Wiggle match dating on
a tree ring from the Upper Submerged Forest showed that the forest died at about 4239±16 Cal
BC (Bell 2007, Table 8.2), this indicates that over about 1000 years Site J went from a dryland
site which was replaced by saltmarsh and then succeeded by peat.
Due to the sealed Mesolithic land surface, artefacts from Site J have been plentiful and well-
dated, with lithics, bone, charcoal, worked wood, shell and heat-fractured stone within the
assemblage. In the north-west of Site J there was evidence of animal butchery and skin
processing of red deer and auroch. 32 bones of red deer were recorded, the elements indicated
that complete red deer carcasses were being processed in this area (Scales 2007b, p 160).
Auroch were also being butchered but their horns and skins were taken from Site J to another
area, there were 25 auroch bones recorded from this area (Scales 2007b, p 161). The bones of
wild pig and roe deer were also found on the Old Land Surface, though in a smaller amount, 11
wild pig and six roe deer. The bones of red deer had evidence of scraping and fine cut marks.
There was also a bone (7595) that was used as an awl and evidence of bone scrapers (Bell 2007,
p 135), indicating probable use in butchery and hide processing.
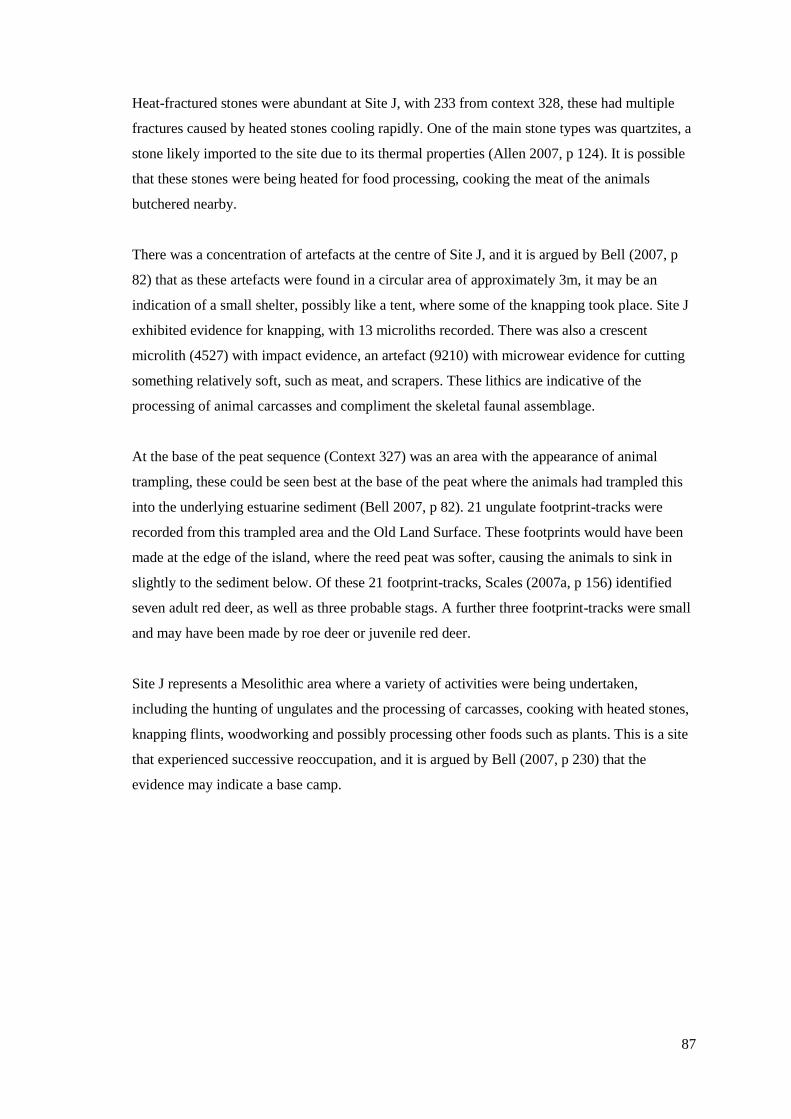
87
Heat-fractured stones were abundant at Site J, with 233 from context 328, these had multiple
fractures caused by heated stones cooling rapidly. One of the main stone types was quartzites, a
stone likely imported to the site due to its thermal properties (Allen 2007, p 124). It is possible
that these stones were being heated for food processing, cooking the meat of the animals
butchered nearby.
There was a concentration of artefacts at the centre of Site J, and it is argued by Bell (2007, p
82) that as these artefacts were found in a circular area of approximately 3m, it may be an
indication of a small shelter, possibly like a tent, where some of the knapping took place. Site J
exhibited evidence for knapping, with 13 microliths recorded. There was also a crescent
microlith (4527) with impact evidence, an artefact (9210) with microwear evidence for cutting
something relatively soft, such as meat, and scrapers. These lithics are indicative of the
processing of animal carcasses and compliment the skeletal faunal assemblage.
At the base of the peat sequence (Context 327) was an area with the appearance of animal
trampling, these could be seen best at the base of the peat where the animals had trampled this
into the underlying estuarine sediment (Bell 2007, p 82). 21 ungulate footprint-tracks were
recorded from this trampled area and the Old Land Surface. These footprints would have been
made at the edge of the island, where the reed peat was softer, causing the animals to sink in
slightly to the sediment below. Of these 21 footprint-tracks, Scales (2007a, p 156) identified
seven adult red deer, as well as three probable stags. A further three footprint-tracks were small
and may have been made by roe deer or juvenile red deer.
Site J represents a Mesolithic area where a variety of activities were being undertaken,
including the hunting of ungulates and the processing of carcasses, cooking with heated stones,
knapping flints, woodworking and possibly processing other foods such as plants. This is a site
that experienced successive reoccupation, and it is argued by Bell (2007, p 230) that the
evidence may indicate a base camp.
88
Figure 3.18 Site J, the east/west stratigraphic sequence on north face of 2003 excavation
(graphic J. Bezant and S. Buckley; Bell 2007, Figure 6.9)
3.3.8.2 Site A
Site A is 120m west of Site B and 120m east of the present projection of Goldcliff Island, it is
80m north of the Ipswichian beach that marks the extent of the former island and is
approximately 20m south of the Upper Peat Shelf (Bell 2007, p 57). This site was originally
recorded in 2001, uncovered due to an area that had been washed clean of mud by the tide,
containing a charcoal-rich band in the sediment which was observed to contain worked lithics
and bone. A 1m2 pit was excavated to investigate the stratigraphy and the occupation surface
was found to be between -2.4 and -2.5m OD. The area dips to the south at 5°, as does the Old
Land Surface. This 5° slope is thought to be the sediment dipping away from the edge of the
former island (Bell 2007, p 57). Site A had only one artefact that could provide dating evidence,
a charred hazelnut, which was dated to 6629±38 BP (OxA-13928; 5630-5480 cal BC; Bell
2007, p 58). Site A is 1.05m above Site B, with activity at this site occurring between 100-300
years after the latest activity that took place on Site B and Site D (Bell 2007, p 58).
There were relatively limited organic artefacts and pollen preserved at Site A, this is thought to
be due to activity taking place decades before the site was buried by estuarine sediments.
Lithics were found throughout Site A, mainly struck flints, cores and retouched flint types. 70
microliths were found, with over half of these broken (Barton 2007). The area that had the
densest amount of lithic scatter had very few large bones, most of the bones were recorded west
89
of the concentration of lithics. 13 of the bones were deer, five had cut-marks, and two of these
were near the lithic concentration. The results of sieving indicated that the highest concentration
of calcined bones was from the same area as the lithic concentration (Bell 2007, p 61). The
bone assemblage indicated that red deer made up half of the skeletal remains, three bones were
from auroch, six from wild pig and three from roe deer (Scales 2007b, p 160). Fish bones were
found in a high concentration at Site A, with 502 identified specimens from 12 different species
(Ingrem 2007, Table 13.3). As well as fishbones, fish scales were found via sieving, and were
in a concentrated area (Bell 2007, p 61).
An ungulate footprint-track, similar in size to red deer, was recorded at Site A and was made on
the estuarine sediment of the lower Wentlooge Formation (Scales 2007a, p 155). It had splayed
toes which indicated that the animal was running. The silt that the ungulate footprint-track was
made in contained a small amount of charcoal but no other artefacts. The silt sediment unit was
north of the site, sealed by the Upper Peat and the Submerged Forest, meaning that the ungulate
footprint-track was made during the Mesolithic.
The activities represented by the artefacts indicate that Site A was an area used for flint
knapping, cooking, fish processing and drying fish. Mammal bones were found at this site, as
well as the splayed footprint-tracks of red deer. Food preparation is implied by the quantity of
calcined fish bones, which may suggest smoking or cooking activities, as well as other bone
evidence; food consumption was also indicated by charred hazelnut. It is possible that the
activities of Site A were centred around a hearth, evidenced by the charcoal and calcined bones.
Bell (2007, p 62) suggests that the artefacts are dense in certain areas but areas of activity end
abruptly due to a physical barrier preventing the artefact dispersal, possibly the wall of a shelter,
though no post holes or stakeholes were recorded.
3.3.8.3 Site B
Site B is located on the western exposure of the Lower Peat at c-3.5m OD and was first
recorded in 2001, where it was observed that artefacts such as calcined bones, could be seen on
the eroding peat surface. Mesolithic activity on this site took place on dry land close to the
advancing shoreline (Bell 2007, p 37).
There were a total of 45 lithic pieces recorded at Site B, with two microliths, one with a notched
piece, flint flakes and a core. A scraper, a hammerstone and a retouched piece were also found
(Bell 2007, p 42). This assemblage indicates that knapping may have taken place on a very
small scale. It was found that every tool and micro-debitage came from the minerogenic
sediment rather than the peat, except for one microlith and three pieces of heat-fractured micro-
90
debitage. Notable finds from the Old Land Surface included a shaped sandstone plaque which
had been used as a pounder, a boulder used as a hammerstone and heat-fractured stones (Bell
2007, p 42). An axe/adze was found on unstratified on the gravel bank 5.7m west of Site B
(Barton 2007, p 113).
There were 65 bone fragments recorded within the peat. Sieving of context 320 revealed a
further 270 fragments, as well as four fish bones (Bell 2007, p 42). Of the bone assemblage,
seven fragments were identified as red deer, one auroch, and one roe deer (Scales 2007b, p
160). Charcoal was abundant and corresponded with calcined bones, it is thought that at the
time of the peat, the area may have been used for the preparation of red deer carcasses, with the
scraper indicating hides were being processed (Bell 2007, p 42). Charred hazelnuts were found
at Site B, as was one piece of worked wood, which had the appearance of the rounded end of a
spatula. The charred hazelnuts were recorded from the minerogenic soil and were dated to
7002±35 BP (OxA-13927; 5990-5790 cal BC; Bell 2007, p 45).
Context 319, on the surface of the peat, was cleaned, and small oval depressions were observed,
all 8cm or smaller. Two of these had the appearance of ungulate footprint-tracks, likely to be
from red deer due to the size. Further excavation of Site B uncovered four more red deer
footprint-tracks on the peat, as well as an auroch. Two red deer footprint-tracks were recorded
at the base of the overlying estuarine sediment, and a red deer footprint-track was found at the
interface between the estuarine sediment and the peat (Scales 2007a, p 154).
The artefacts at Site B indicate a focus on butchery, cooking and hide processing and limited
flint knapping. The footprint-track evidence of red deer may suggest the animals were being
hunted within the area before being butchered. Finds were relatively few and indicate an area
that was not the focus of a large amount of activity over a long period, this was a site used
briefly for a small amount of activity (Bell 2007, p 45).
3.3.8.4 Site D
Site D is 50m east of Site B and is on the westerly exposure of the Lower Submerged Forest,
with the peat surface at -4m OD. The base of the peat was dated to 6790±38BP (OxA-12359;
5740-5630 cal BC; Bell 2007, p 47), and the top of the peat was dated to 6726±33 BP (OxA-
12358; 5720-5560 cal BC; Bell 2007, p 47). There have been a small number of artefacts
recorded at Site D; charcoal, a flint flake and one debitage chip. There were also four fragments
of heat-fractured stone, a fragment of charred hazelnut and human intestinal parasites (Bell
2007 pp 45-47; Dark 2007, p 170). One ungulate footprint-track was recorded at Site D, likely
91
that of a deer (Bell 2007, p 47). It is thought that Site D represents an area that was at the side-
line of a main activity area, and the appearance of human intestinal parasites may suggest that
this area was being used away from camp as a place to defecate. The small number of artefacts
may have been deposited in the area by humans or mammals moving them unintentionally; the
deer footprint compliments this theory (Bell 2007, p 47).
3.3.8.5 Mesolithic footprint-tracks from Sites C, E and H
During 2001-2004 footprint-tracks were discovered upon laminated banded sediments, these
were assigned the site identification of Site C, Site E and Site H. These sites were low in the
tidal frame at -3.1m to -4.4m OD (Bell 2007, p 48). The footprint-tracks were preserved in
estuarine sediments which overlay the Lower Peat at Sites B, D and I, when the Submerged
Forest and Lower Peat was inundated c 5650 cal BC (Bell 2007, p 49). The estuarine sediment
was then sealed by the formation of the Upper Peat and Submerged Forest, which formed
c 4700 cal BC. The Lower peat is divided into two by erosion of a later palaeochannel which is
240m wide (Figure 3.15) Within this there are a number of other intersecting channels
representing various stages in the migration of the palaeochannel. The footprints recorded on
Sites C, E and H are in the laminated sediments which fill this channel. The footprints recorded
in the present thesis on sites M, N, O, R and S and the wood structure at Site T are all within
this palaeochannel feature. The palaeochannel is capped by the main peat and is of later
Mesolithic date.
Within the banded laminated estuarine sediments there was little artefactual evidence, though
unstratified lithics and an antler mattock-hammer were recorded near the footprint sites. No flint
artefacts have been recorded in the banded laminations (Bell 2007, p 53). At Site E, 15m east of
a footprint area a wood artefact (13302) was found stratified within the banded sediments
c.20cm below the footprint-tracks (Bell 2007, p 50). Some pieces of probably worked
roundwood (Context 332) were found in one of the palaeochannels (Bell 2007, Figure 4.2).
During 2001-2004 extensive laminated banded sediment areas were exposed, and footprint-
tracks could be observed upon these laminations, this was named Site C. The main area of Site
C is 35m by 11m and consists of a series of low cliffs running north-east to south-west,
exposing the laminated bands (Bell 2007, p 52). This area was recorded during 2001, footprint-
tracks were present on a variety of laminations, and they had to be recorded rapidly as they
were found 11 days before the end of fieldwork. They were recorded via planning and only
footprint-tracks that had been exposed were recorded, rather than excavating any of the area
(Bell et al. 2001). The footprint-tracks in this area were poorly preserved and partly eroded but
92
were thought to have been lain down over a period of about 16 years, evidenced from the
laminations they were on (Bell 2007, p 52). During fieldwork in 2001 there were 61 footprint-
tracks recorded, 35 from humans, 13 from birds and 18 from red deer (Bell et al. 2002).
Rachel Scales became involved in the footprint-track recording at Goldcliff East in 2002-2004.
During this fieldwork several new areas in Site C were exposed (Figure 3.19 and Figure 3.20).
10-14m south of the 2001 footprint-track site, at -4.09 to -4.2m OD 24 footprint-tracks were
recorded. These were made by a child and a bird (Bell 2007, p 52). Two further human
footprint-tracks were recorded on a lamination approximately 4m north of this site. To the west
of the 2001 footprint-track area, at -3.6m OD there was further exposure, with 32 large avian
footprint-tracks recorded over a 3m by 1.5m area. 8m north of these avian footprint-tracks, but
on the same lamination, at 3.3m OD, large avian footprint-tracks were noted. Three child
footprint-tracks, as well as the tracks of auroch were exposed, as were the footprint-tracks of a
small bird. Three laminations above these were two further human footprint-tracks, and one
lamination above these was a poorly preserved footprint-track of a human (Bell 2007, p 52).
Scales revisited the area of the 2001 investigation and found further human and bird footprint-
tracks; 177 human footprint-tracks, mostly from children, were recorded from a single
lamination. In 2004 a further two footprint-tracks made by children, and 27 avian footprint-
tracks, were all recorded from laminations near the large assemblage of footprint-tracks.
A further area of interest, Site E, was exposed 50m east of Site C, on an east/west erosion cliff.
The erosion cliff exposed footprint-tracks in the laminations. Finger-tip excavation was
attempted in this area to see if the footprint-track trails could be followed, this involved gently
peeling away laminations using only the fingertips (Scales 2006). An area 6m by 3.5m was
successfully excavated with fingertip excavation (6113), where it was evident that at least four
prehistoric humans had walked across the sediment at -3.9m OD, making 33 footprint-tracks
(Figure 3.21). There were also four deer prints in this area (Bell 2007, p 55). Fingertip
excavation also uncovered seven human footprint-tracks and six deer from Area 6161.
16m north of Site E a further laminated surface was exposed between -3.14 and 3.38m OD, here
a trail of 16 human footprint-tracks was observed. This site was named Site H, and the
footprint-tracks were recorded via tracing (Bell 2007, p 55).
93
3.4 Summary
A further Mesolithic activity site, B2, has been identified since the work of Bell (2007). It is
evident from the number of sites at Goldcliff East that during the Mesolithic this was an often-
exploited area.
The work of Bell (2007) and Scales (2006) demonstrates that the minerogenic estuarine
sediments of the Lower Wentlooge have preserved the footprint-tracks of humans, mammals
and birds. Footprint-track evidence provides archaeologists with the opportunity to make
suggestions about age composition and the activities being undertaken in a specific area. The
stratigraphy of the Severn Estuary is complex, however it is this complex pattern of terrestrial
regression and marine transgression during the Late Quaternary that has resulted in the
preservation of organic material and artefacts, as well as the preservation of human, mammalian
and avian footprint-tracks from a variety of different contexts and a range of prehistoric and
historic periods. The sediments of the Severn Estuary need to be monitored as more finds and
sites are likely to be exposed through erosion.
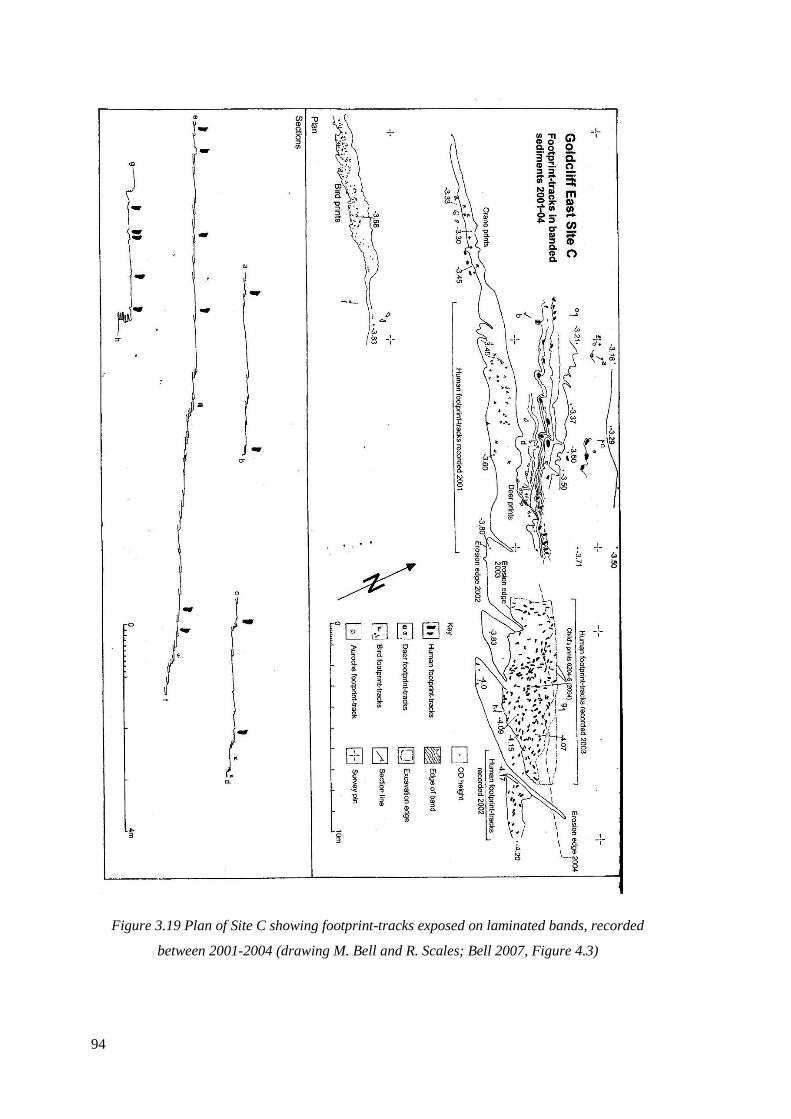
94
Figure 3.19 Plan of Site C showing footprint-tracks exposed on laminated bands, recorded
between 2001-2004 (drawing M. Bell and R. Scales; Bell 2007, Figure 4.3)

95
Figure 3.20 Excavation of Site C, in 2003 (photo E. Sacre; Bell 2007, Figure 12.9)
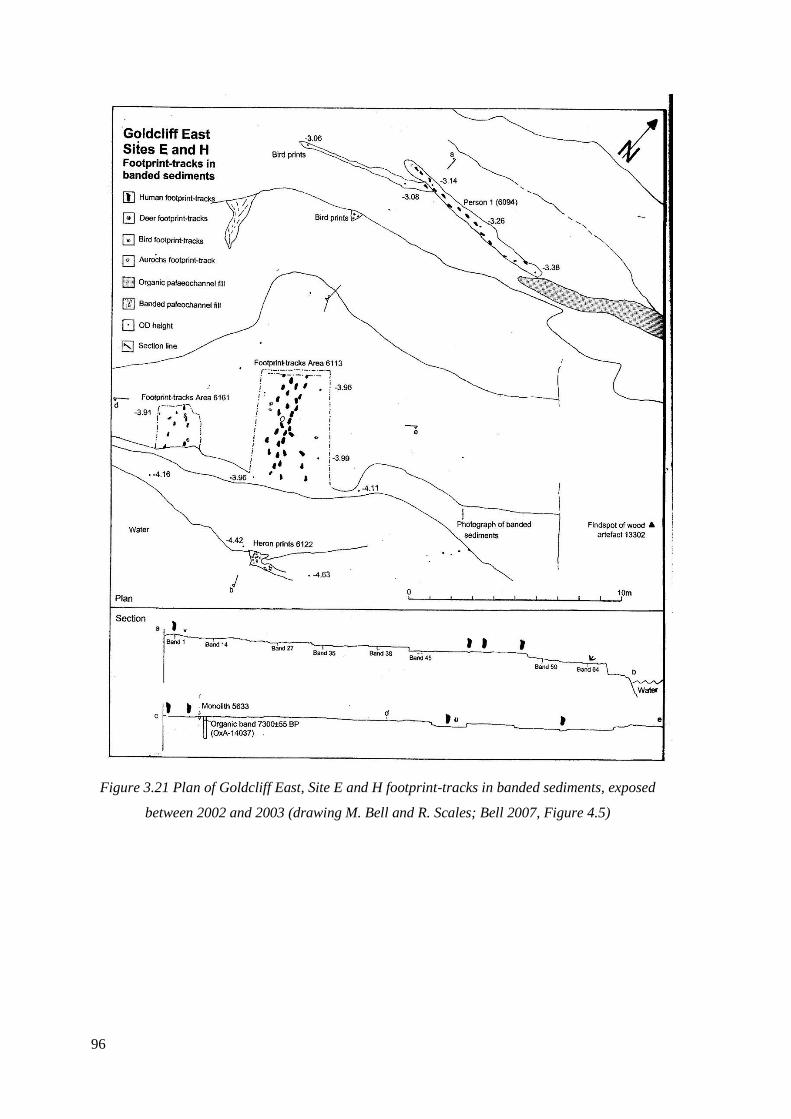
96
Figure 3.21 Plan of Goldcliff East, Site E and H footprint-tracks in banded sediments, exposed
between 2002 and 2003 (drawing M. Bell and R. Scales; Bell 2007, Figure 4.5)
97
Chapter 4
Anatomy of the foot, footprint terminology and methodologies developed for footprint
recording
4.1 Introduction
The methods developed by both archaeologists and palaeontologists for the recording of
footprint-tracks are important to consider when dealing with footprints found in liminal areas,
such as intertidal zones. Archaeologists have borrowed many recording techniques developed
for the recording of dinosaur footprints (Thulborn and Wade 1979, 1989), as many of these sites
are in remote, difficult to access areas, a problem also encountered by intertidal archaeologists.
To address these problems palaeoichnologists have created techniques to safely record the
footprints without damaging them. Bates et al. (2008a,b) experimented with creating three-
dimensional geometric models using Light Detection and Ranging (LiDAR), creating point-
clouds from these scans (Figure 4.1), with the conclusion that LiDAR can record accurately and
rapidly with very little use of complicated software. Three-dimensional models of dinosaur
footprints have also been experimented with by Bates et al. (2006) using long-range active
sensors. Short-range scanners were experimented with by Adams et al. (2009) and Wilson et al.
(2009). Photogrammetric recording of dinosaur footprint-tracks was explored by Matthews and
Breithaupt (2001) and Remondino et al. (2010). These palaeontological techniques have been
tested and refined by archaeologists, ensuring that they can also be utilised for the more delicate
task of recording smaller footprint-tracks.
Traditional photogrammetric recording of footprint-tracks was applied at Laetoli, this technique
involved hard-copy images that were overlapped, and then contour maps were generated from
the data (Day and Wickens 1980). It was not until recently, however, that technology has
allowed for high-quality three-dimensional recording of footprint-tracks. Bennet et al. (2013)
experimented with both high-resolution optical laser-scanners and digital photogrammetry, and
created a range of methodologies for these different approaches.
Laser scanning technology is beginning to be used regularly when recording prehistoric
footprints, with Raichlen et al.’s (2010) experiment indicating that the gait and weight of an
individual can be well represented by the morphology and depressions of the footprint, which
can be easily picked up by laser scanning equipment. At the site of Valsequillo, Mexico,
possible footprint-tracks were scanned with a close-quarter optical laser (Gonzalez et al. 2006),
though these have since been rejected as human footprint-tracks (Morse et al. 2010). Casts of
footprints from sites such as Laetoli have also been scanned, to allow the data to be digitally
available to researchers (Raichlen et al. 2010; Meldrum et al. 2011).
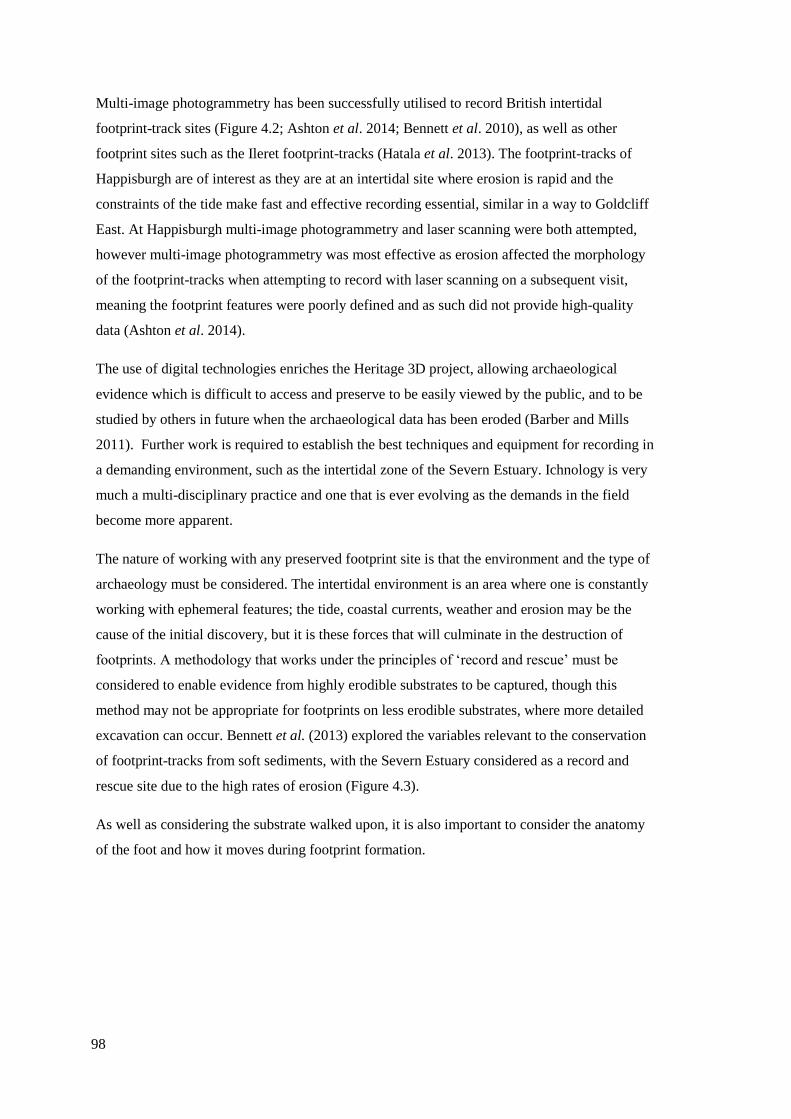
98
Multi-image photogrammetry has been successfully utilised to record British intertidal
footprint-track sites (Figure 4.2; Ashton et al. 2014; Bennett et al. 2010), as well as other
footprint sites such as the Ileret footprint-tracks (Hatala et al. 2013). The footprint-tracks of
Happisburgh are of interest as they are at an intertidal site where erosion is rapid and the
constraints of the tide make fast and effective recording essential, similar in a way to Goldcliff
East. At Happisburgh multi-image photogrammetry and laser scanning were both attempted,
however multi-image photogrammetry was most effective as erosion affected the morphology
of the footprint-tracks when attempting to record with laser scanning on a subsequent visit,
meaning the footprint features were poorly defined and as such did not provide high-quality
data (Ashton et al. 2014).
The use of digital technologies enriches the Heritage 3D project, allowing archaeological
evidence which is difficult to access and preserve to be easily viewed by the public, and to be
studied by others in future when the archaeological data has been eroded (Barber and Mills
2011). Further work is required to establish the best techniques and equipment for recording in
a demanding environment, such as the intertidal zone of the Severn Estuary. Ichnology is very
much a multi-disciplinary practice and one that is ever evolving as the demands in the field
become more apparent.
The nature of working with any preserved footprint site is that the environment and the type of
archaeology must be considered. The intertidal environment is an area where one is constantly
working with ephemeral features; the tide, coastal currents, weather and erosion may be the
cause of the initial discovery, but it is these forces that will culminate in the destruction of
footprints. A methodology that works under the principles of ‘record and rescue’ must be
considered to enable evidence from highly erodible substrates to be captured, though this
method may not be appropriate for footprints on less erodible substrates, where more detailed
excavation can occur. Bennett et al. (2013) explored the variables relevant to the conservation
of footprint-tracks from soft sediments, with the Severn Estuary considered as a record and
rescue site due to the high rates of erosion (Figure 4.3).
As well as considering the substrate walked upon, it is also important to consider the anatomy
of the foot and how it moves during footprint formation.
99
Figure 4.1. LiDAR models of the succession of tracks making up the footprint trail from
Fumanya, Barcelona (Bates et al. 2008)
Figure 4.2 Vertical image of Area A at Happisburgh, model produced by photogrammetric
survey (Ashton et al. 2014)
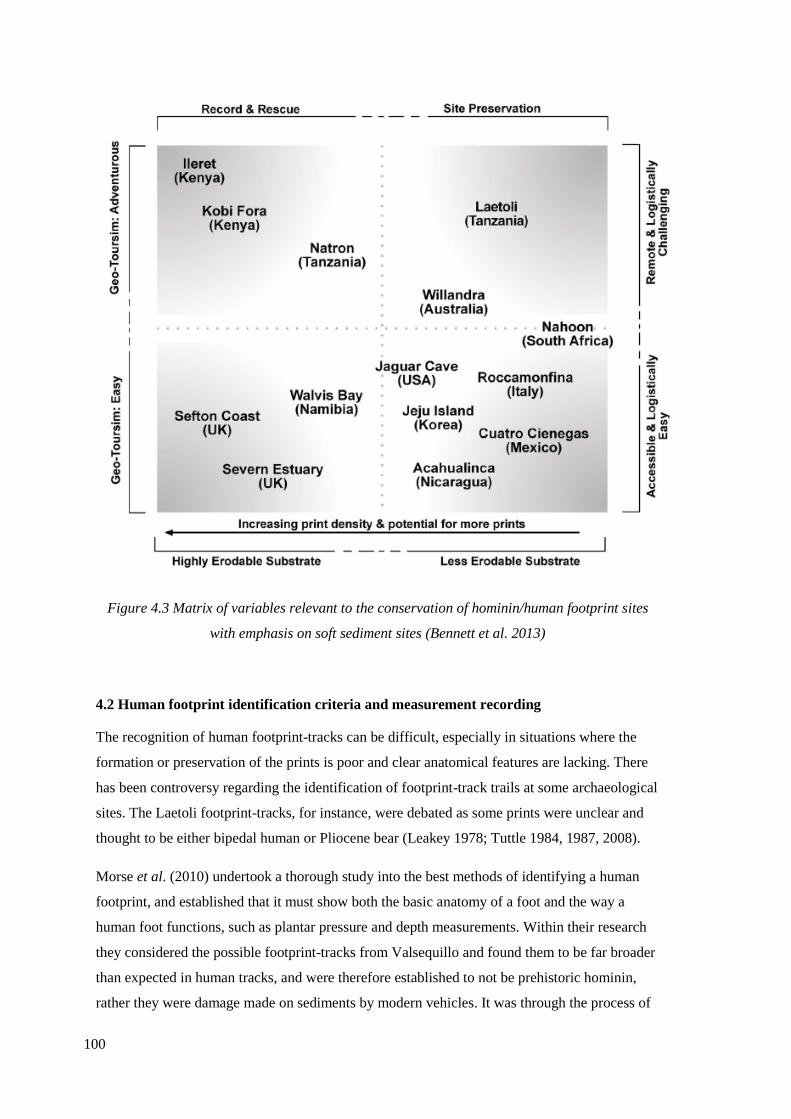
100
Figure 4.3 Matrix of variables relevant to the conservation of hominin/human footprint sites
with emphasis on soft sediment sites (Bennett et al. 2013)
4.2 Human footprint identification criteria and measurement recording
The recognition of human footprint-tracks can be difficult, especially in situations where the
formation or preservation of the prints is poor and clear anatomical features are lacking. There
has been controversy regarding the identification of footprint-track trails at some archaeological
sites. The Laetoli footprint-tracks, for instance, were debated as some prints were unclear and
thought to be either bipedal human or Pliocene bear (Leakey 1978; Tuttle 1984, 1987, 2008).
Morse et al. (2010) undertook a thorough study into the best methods of identifying a human
footprint, and established that it must show both the basic anatomy of a foot and the way a
human foot functions, such as plantar pressure and depth measurements. Within their research
they considered the possible footprint-tracks from Valsequillo and found them to be far broader
than expected in human tracks, and were therefore established to not be prehistoric hominin,
rather they were damage made on sediments by modern vehicles. It was through the process of
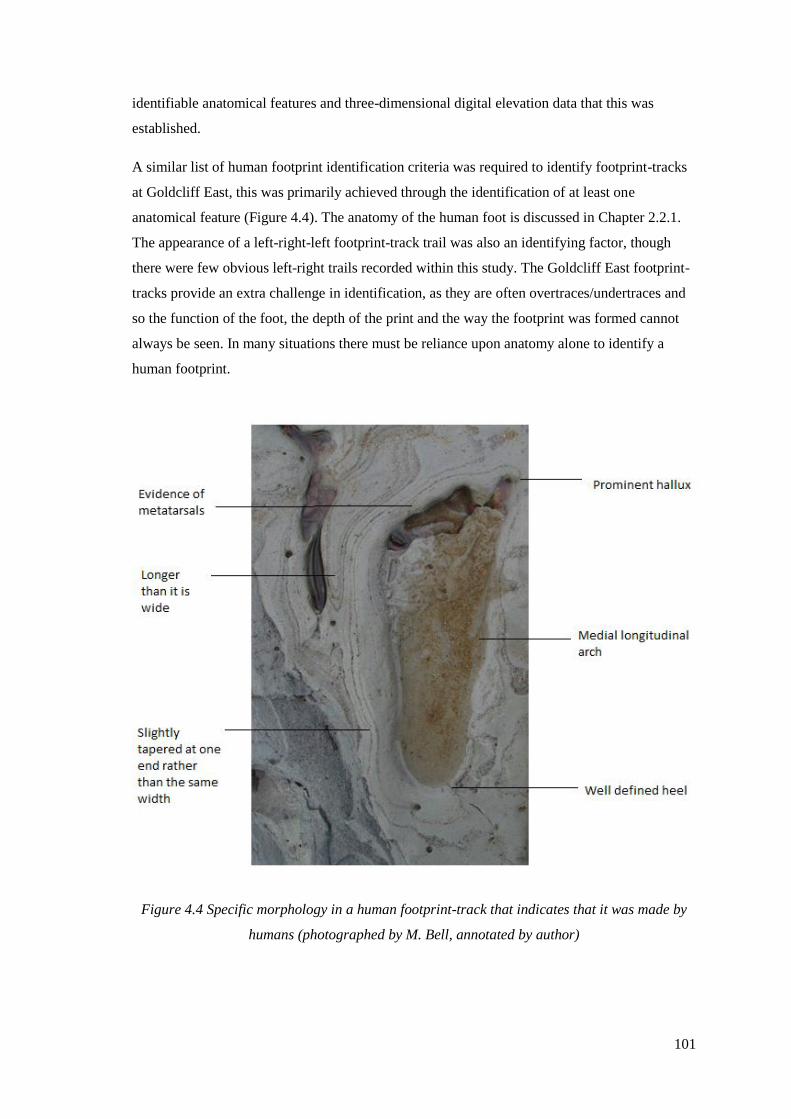
101
identifiable anatomical features and three-dimensional digital elevation data that this was
established.
A similar list of human footprint identification criteria was required to identify footprint-tracks
at Goldcliff East, this was primarily achieved through the identification of at least one
anatomical feature (Figure 4.4). The anatomy of the human foot is discussed in Chapter 2.2.1.
The appearance of a left-right-left footprint-track trail was also an identifying factor, though
there were few obvious left-right trails recorded within this study. The Goldcliff East footprint-
tracks provide an extra challenge in identification, as they are often overtraces/undertraces and
so the function of the foot, the depth of the print and the way the footprint was formed cannot
always be seen. In many situations there must be reliance upon anatomy alone to identify a
human footprint.
Figure 4.4 Specific morphology in a human footprint-track that indicates that it was made by
humans (photographed by M. Bell, annotated by author)
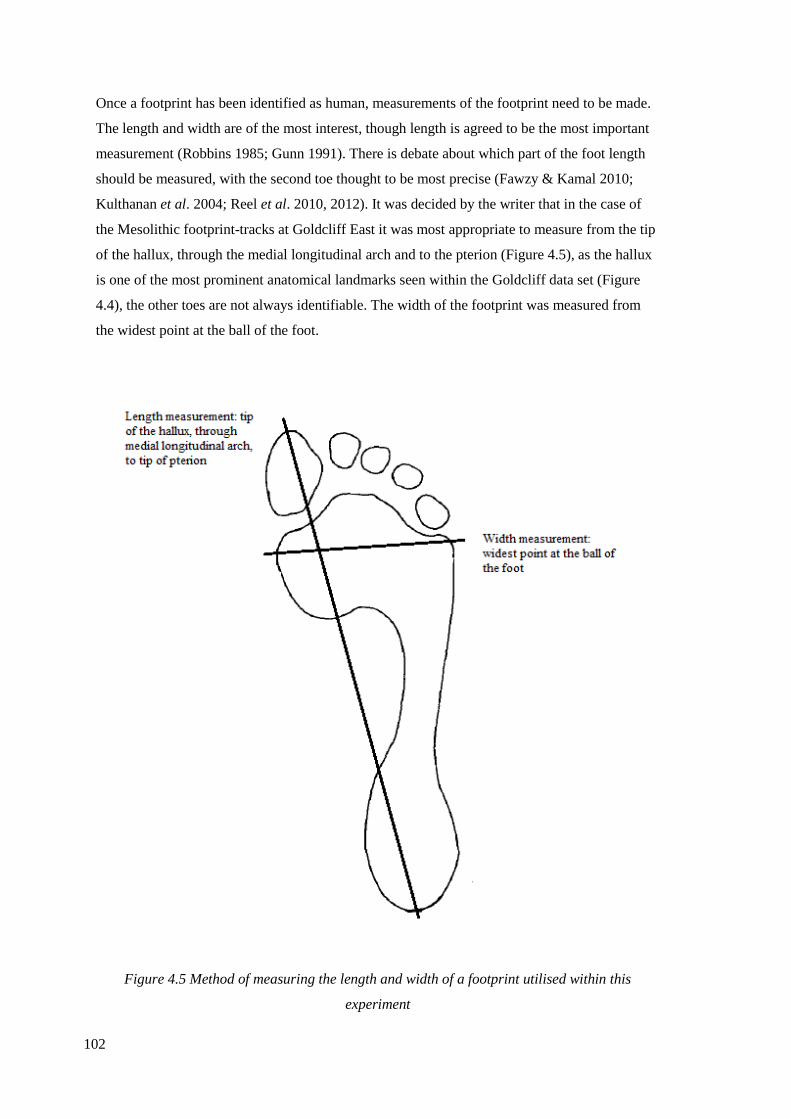
102
Once a footprint has been identified as human, measurements of the footprint need to be made.
The length and width are of the most interest, though length is agreed to be the most important
measurement (Robbins 1985; Gunn 1991). There is debate about which part of the foot length
should be measured, with the second toe thought to be most precise (Fawzy & Kamal 2010;
Kulthanan et al. 2004; Reel et al. 2010, 2012). It was decided by the writer that in the case of
the Mesolithic footprint-tracks at Goldcliff East it was most appropriate to measure from the tip
of the hallux, through the medial longitudinal arch and to the pterion (Figure 4.5), as the hallux
is one of the most prominent anatomical landmarks seen within the Goldcliff data set (Figure
4.4), the other toes are not always identifiable. The width of the footprint was measured from
the widest point at the ball of the foot.
Figure 4.5 Method of measuring the length and width of a footprint utilised within this
experiment
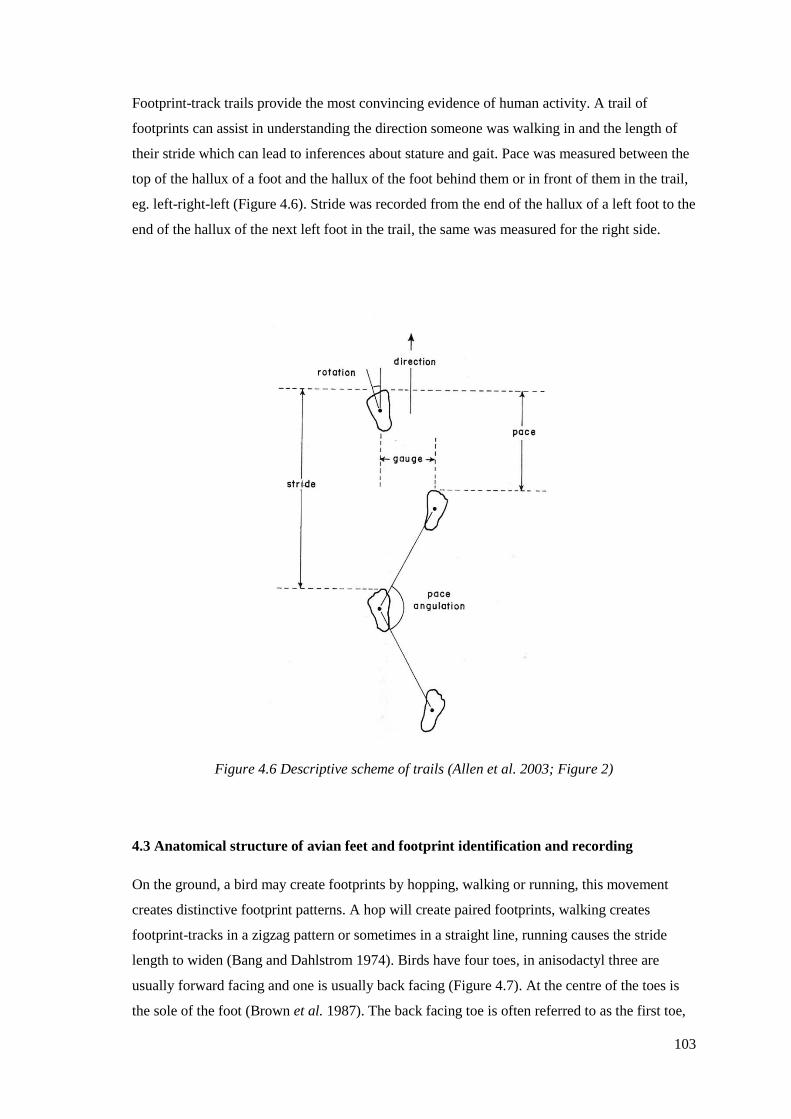
103
Footprint-track trails provide the most convincing evidence of human activity. A trail of
footprints can assist in understanding the direction someone was walking in and the length of
their stride which can lead to inferences about stature and gait. Pace was measured between the
top of the hallux of a foot and the hallux of the foot behind them or in front of them in the trail,
eg. left-right-left (Figure 4.6). Stride was recorded from the end of the hallux of a left foot to the
end of the hallux of the next left foot in the trail, the same was measured for the right side.
Figure 4.6 Descriptive scheme of trails (Allen et al. 2003; Figure 2)
4.3 Anatomical structure of avian feet and footprint identification and recording
On the ground, a bird may create footprints by hopping, walking or running, this movement
creates distinctive footprint patterns. A hop will create paired footprints, walking creates
footprint-tracks in a zigzag pattern or sometimes in a straight line, running causes the stride
length to widen (Bang and Dahlstrom 1974). Birds have four toes, in anisodactyl three are
usually forward facing and one is usually back facing (Figure 4.7). At the centre of the toes is
the sole of the foot (Brown et al. 1987). The back facing toe is often referred to as the first toe,
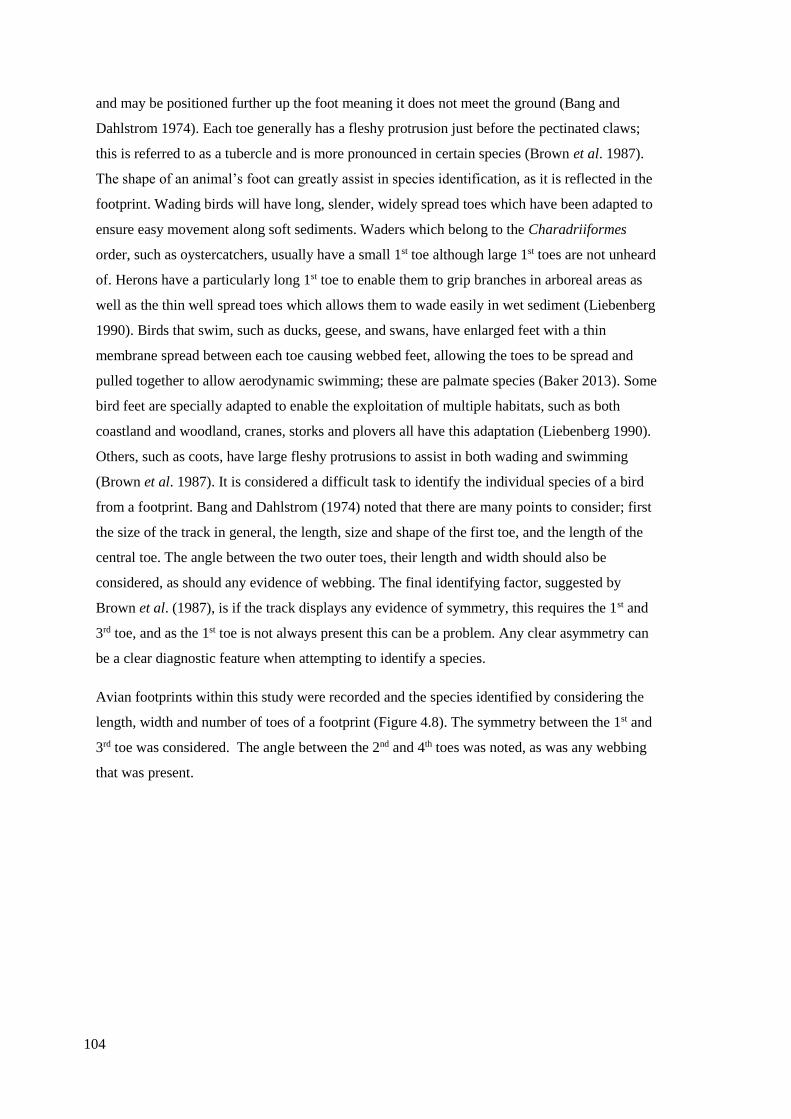
104
and may be positioned further up the foot meaning it does not meet the ground (Bang and
Dahlstrom 1974). Each toe generally has a fleshy protrusion just before the pectinated claws;
this is referred to as a tubercle and is more pronounced in certain species (Brown et al. 1987).
The shape of an animal’s foot can greatly assist in species identification, as it is reflected in the
footprint. Wading birds will have long, slender, widely spread toes which have been adapted to
ensure easy movement along soft sediments. Waders which belong to the Charadriiformes
order, such as oystercatchers, usually have a small 1st toe although large 1st toes are not unheard
of. Herons have a particularly long 1st toe to enable them to grip branches in arboreal areas as
well as the thin well spread toes which allows them to wade easily in wet sediment (Liebenberg
1990). Birds that swim, such as ducks, geese, and swans, have enlarged feet with a thin
membrane spread between each toe causing webbed feet, allowing the toes to be spread and
pulled together to allow aerodynamic swimming; these are palmate species (Baker 2013). Some
bird feet are specially adapted to enable the exploitation of multiple habitats, such as both
coastland and woodland, cranes, storks and plovers all have this adaptation (Liebenberg 1990).
Others, such as coots, have large fleshy protrusions to assist in both wading and swimming
(Brown et al. 1987). It is considered a difficult task to identify the individual species of a bird
from a footprint. Bang and Dahlstrom (1974) noted that there are many points to consider; first
the size of the track in general, the length, size and shape of the first toe, and the length of the
central toe. The angle between the two outer toes, their length and width should also be
considered, as should any evidence of webbing. The final identifying factor, suggested by
Brown et al. (1987), is if the track displays any evidence of symmetry, this requires the 1st and
3rd toe, and as the 1st toe is not always present this can be a problem. Any clear asymmetry can
be a clear diagnostic feature when attempting to identify a species.
Avian footprints within this study were recorded and the species identified by considering the
length, width and number of toes of a footprint (Figure 4.8). The symmetry between the 1st and
3rd toe was considered. The angle between the 2nd and 4th toes was noted, as was any webbing
that was present.
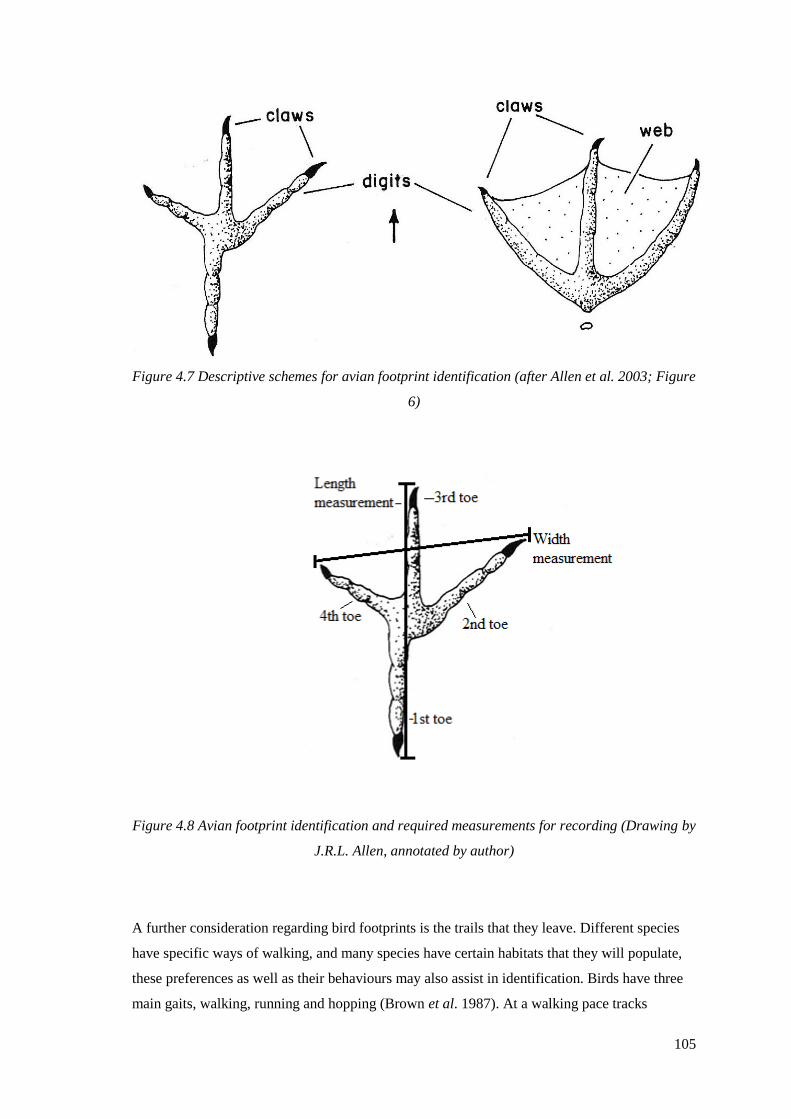
105
Figure 4.7 Descriptive schemes for avian footprint identification (after Allen et al. 2003; Figure
6)
Figure 4.8 Avian footprint identification and required measurements for recording (Drawing by
J.R.L. Allen, annotated by author)
A further consideration regarding bird footprints is the trails that they leave. Different species
have specific ways of walking, and many species have certain habitats that they will populate,
these preferences as well as their behaviours may also assist in identification. Birds have three
main gaits, walking, running and hopping (Brown et al. 1987). At a walking pace tracks
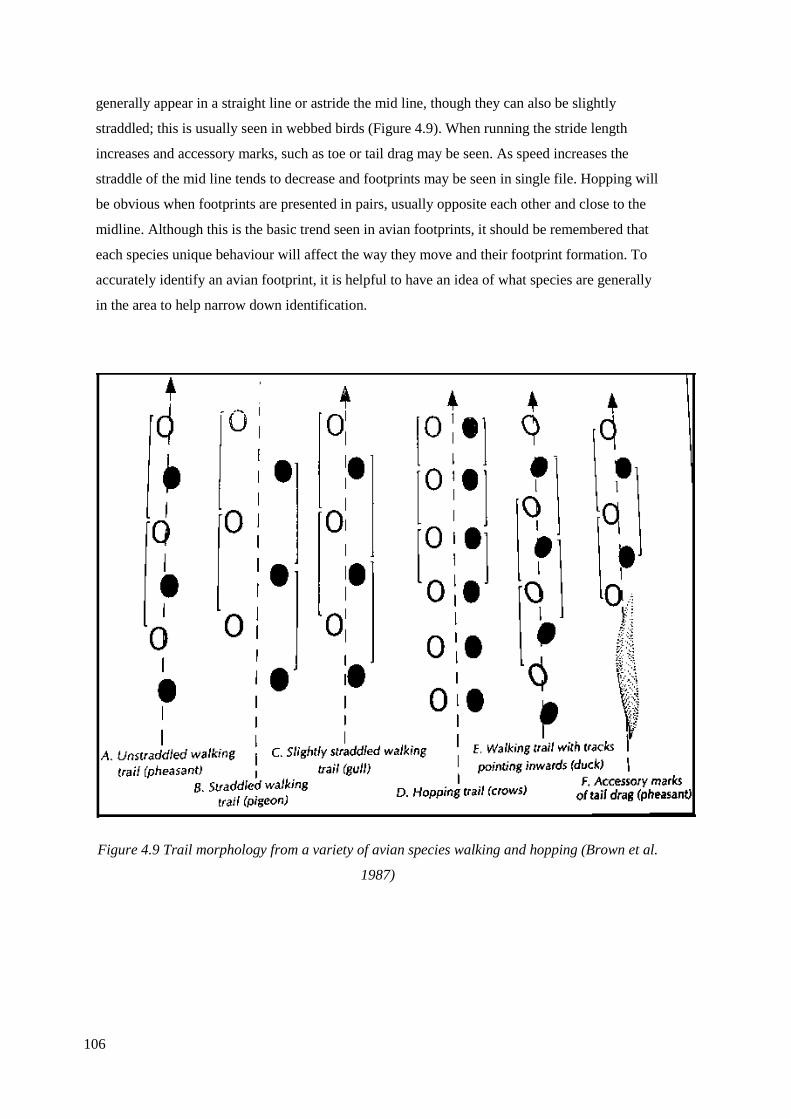
106
generally appear in a straight line or astride the mid line, though they can also be slightly
straddled; this is usually seen in webbed birds (Figure 4.9). When running the stride length
increases and accessory marks, such as toe or tail drag may be seen. As speed increases the
straddle of the mid line tends to decrease and footprints may be seen in single file. Hopping will
be obvious when footprints are presented in pairs, usually opposite each other and close to the
midline. Although this is the basic trend seen in avian footprints, it should be remembered that
each species unique behaviour will affect the way they move and their footprint formation. To
accurately identify an avian footprint, it is helpful to have an idea of what species are generally
in the area to help narrow down identification.
Figure 4.9 Trail morphology from a variety of avian species walking and hopping (Brown et al.
1987)
107
4.4 Anatomical features of mammal feet and footprint identification recording
The following discussion of footprint morphology deals primarily with some of the mammal
species that would have been present in the British Isles throughout the Holocene, although the
approach shall draw upon worldwide work performed on animal tracks and tracking. The
measurements of all mammal footprints should consider the length and width; however the
overall morphology is more of an identifying feature than size alone. For all footprints the
length should be measured from the longest part of the foot and the width from the widest.
4.4.1 Cloven Hoof
Cloven hooves are very recognisable. The foot is made up of four toes, the third and fourth toes
are central and will be well-developed, the second and fifth toes (dew claws), will be smaller
and rounder, the second toe is positioned medially and the fifth toe is positioned laterally on the
body (Lawrence and Brown 1967). The first toe is no longer present in cloven hoofed animals
(Lawrence and Brown 1967). The location of the dew claw is species dependent; in species
such as cattle, deer, sheep and goat they will be positioned so high up the leg that they rarely
meet the ground, unless the sediment is extremely deep. In other situations, such as with pigs,
the dew claw may be seen in a footprint, which may aid in species identification (Bang and
Dahlstrom 1974). Toes three and four are generally symmetrical in shape, with different species
displaying different levels of symmetry. In most cases it will be these two toes that create the
recognisable footprint.
The cloven hoof is made of a wall (or plate) and a sole (Figure 4.10). The wall of the hoof
creates the smooth upper sides, extending slightly beyond the sole to form a sharp edge which
can be seen in the footprint. Often it may be the sharp wall edges that are the only part of the
foot that creates an imprint, especially upon hard ground (Bang and Dahlstrom 1974). The sole
is on the underside of the foot; behind the sole is the toe pad. The toe pad is again a feature that
is species specific, taking up certain proportions of the foot and specific shapes. In red deer, for
example, the toe pad will appear as a rounded depression, whereas in roe deer the toe pad
extends over almost the entire hoof, with only a small amount of sole (Lawrence and Brown
1967).
The shape and size of the footprint may also be an indication of the species, with tracks made
by the forefoot being larger than the hindfoot. This is due to the forefoot generally creating
splayed tracks, even if being created on hard substrate, whereas the hindfoot is less splayed
(Bang & Dahlstrom 1974). There are a variety of identifiable features that may be seen in the
footprint-track to aid in establishing the species (Figure 4.11).

108
Figure 4.10 Descriptive schemes for cloven hoofed animals (Allen et al. 2003; Figure 6)
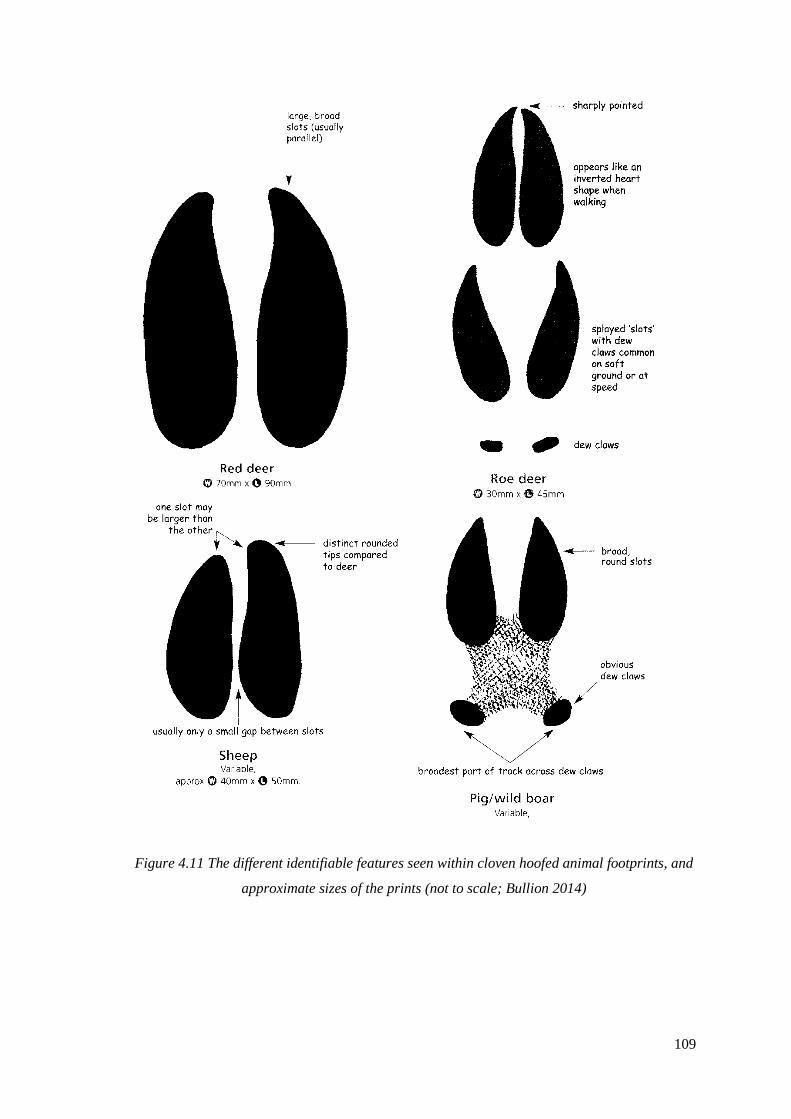
109
Figure 4.11 The different identifiable features seen within cloven hoofed animal footprints, and
approximate sizes of the prints (not to scale; Bullion 2014)
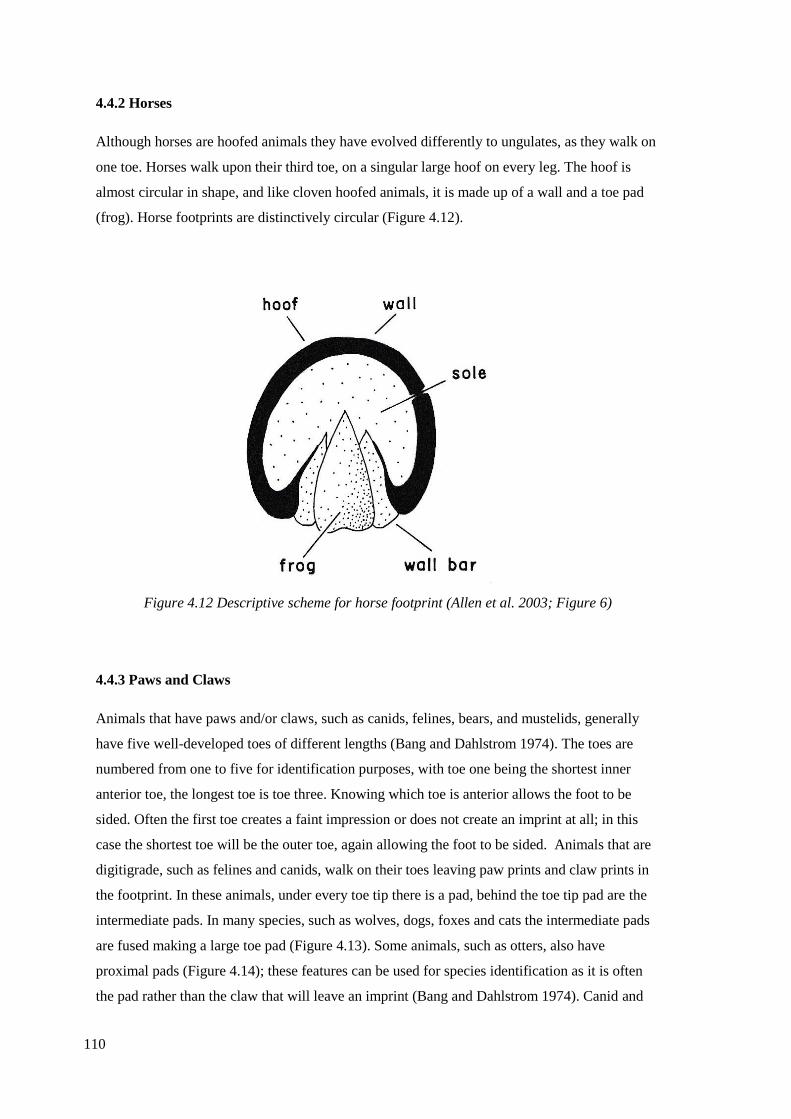
110
4.4.2 Horses
Although horses are hoofed animals they have evolved differently to ungulates, as they walk on
one toe. Horses walk upon their third toe, on a singular large hoof on every leg. The hoof is
almost circular in shape, and like cloven hoofed animals, it is made up of a wall and a toe pad
(frog). Horse footprints are distinctively circular (Figure 4.12).
Figure 4.12 Descriptive scheme for horse footprint (Allen et al. 2003; Figure 6)
4.4.3 Paws and Claws
Animals that have paws and/or claws, such as canids, felines, bears, and mustelids, generally
have five well-developed toes of different lengths (Bang and Dahlstrom 1974). The toes are
numbered from one to five for identification purposes, with toe one being the shortest inner
anterior toe, the longest toe is toe three. Knowing which toe is anterior allows the foot to be
sided. Often the first toe creates a faint impression or does not create an imprint at all; in this
case the shortest toe will be the outer toe, again allowing the foot to be sided. Animals that are
digitigrade, such as felines and canids, walk on their toes leaving paw prints and claw prints in
the footprint. In these animals, under every toe tip there is a pad, behind the toe tip pad are the
intermediate pads. In many species, such as wolves, dogs, foxes and cats the intermediate pads
are fused making a large toe pad (Figure 4.13). Some animals, such as otters, also have
proximal pads (Figure 4.14); these features can be used for species identification as it is often
the pad rather than the claw that will leave an imprint (Bang and Dahlstrom 1974). Canid and
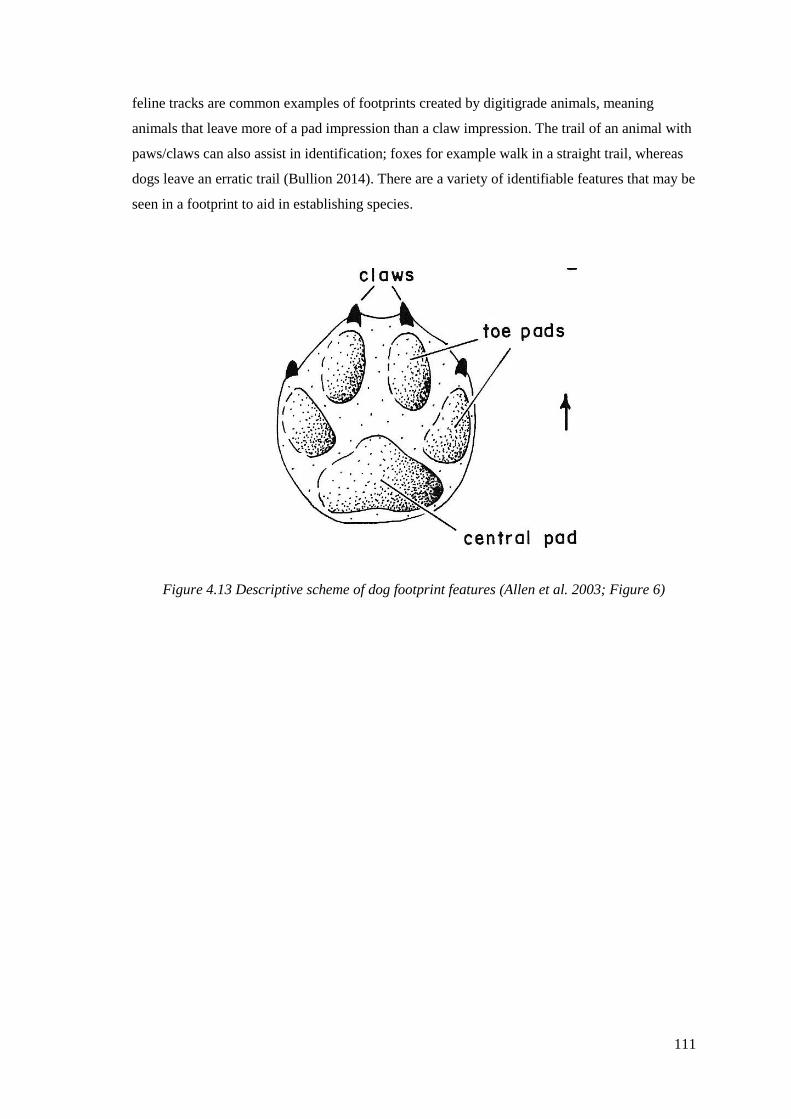
111
feline tracks are common examples of footprints created by digitigrade animals, meaning
animals that leave more of a pad impression than a claw impression. The trail of an animal with
paws/claws can also assist in identification; foxes for example walk in a straight trail, whereas
dogs leave an erratic trail (Bullion 2014). There are a variety of identifiable features that may be
seen in a footprint to aid in establishing species.
Figure 4.13 Descriptive scheme of dog footprint features (Allen et al. 2003; Figure 6)
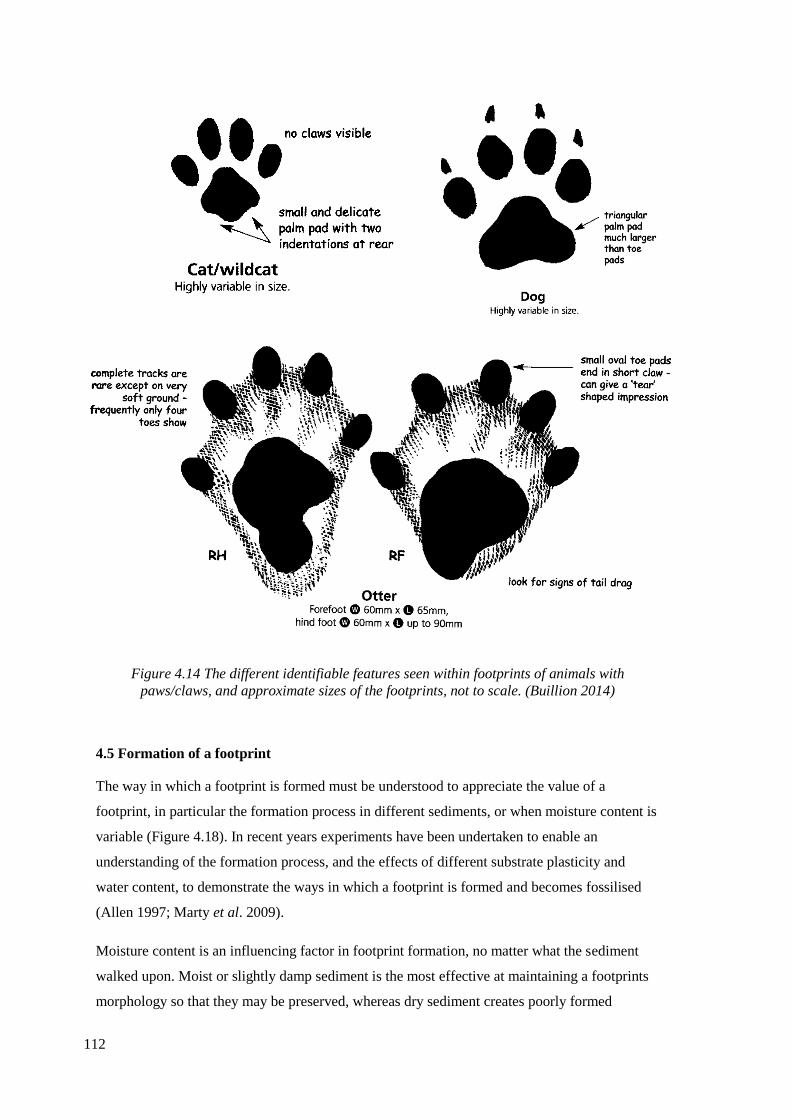
112
Figure 4.14 The different identifiable features seen within footprints of animals with
paws/claws, and approximate sizes of the footprints, not to scale. (Buillion 2014)
4.5 Formation of a footprint
The way in which a footprint is formed must be understood to appreciate the value of a
footprint, in particular the formation process in different sediments, or when moisture content is
variable (Figure 4.18). In recent years experiments have been undertaken to enable an
understanding of the formation process, and the effects of different substrate plasticity and
water content, to demonstrate the ways in which a footprint is formed and becomes fossilised
(Allen 1997; Marty et al. 2009).
Moisture content is an influencing factor in footprint formation, no matter what the sediment
walked upon. Moist or slightly damp sediment is the most effective at maintaining a footprints
morphology so that they may be preserved, whereas dry sediment creates poorly formed
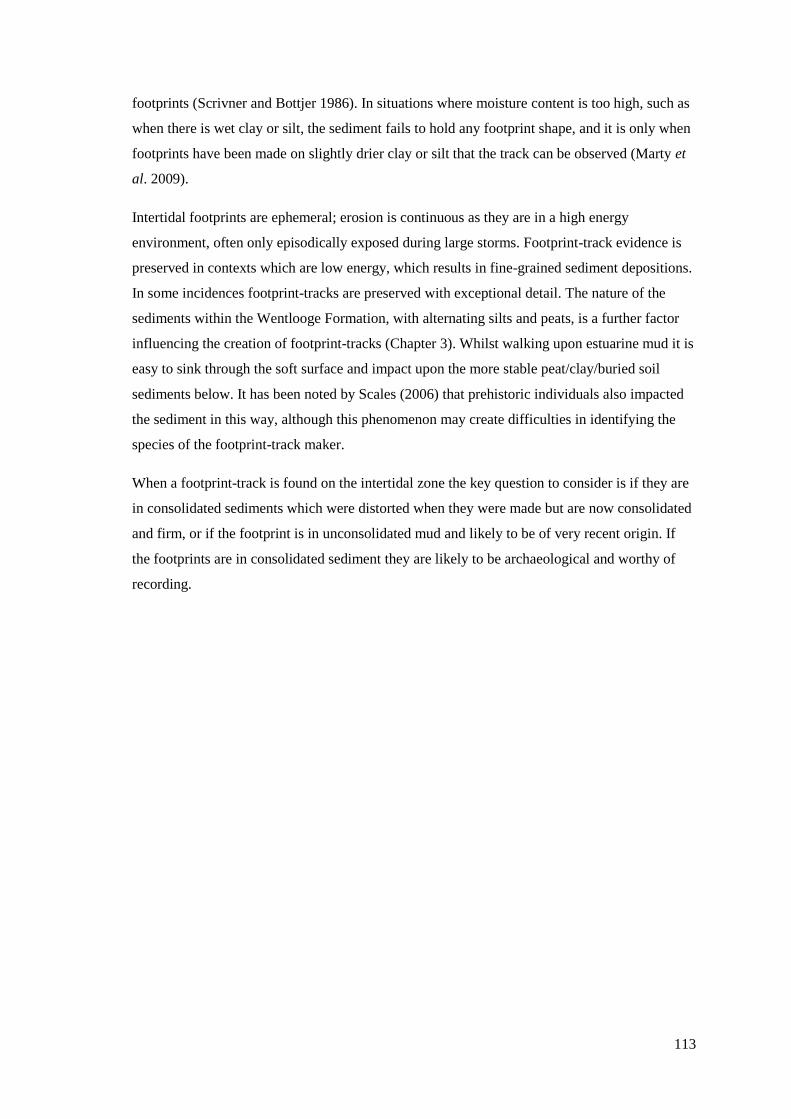
113
footprints (Scrivner and Bottjer 1986). In situations where moisture content is too high, such as
when there is wet clay or silt, the sediment fails to hold any footprint shape, and it is only when
footprints have been made on slightly drier clay or silt that the track can be observed (Marty et
al. 2009).
Intertidal footprints are ephemeral; erosion is continuous as they are in a high energy
environment, often only episodically exposed during large storms. Footprint-track evidence is
preserved in contexts which are low energy, which results in fine-grained sediment depositions.
In some incidences footprint-tracks are preserved with exceptional detail. The nature of the
sediments within the Wentlooge Formation, with alternating silts and peats, is a further factor
influencing the creation of footprint-tracks (Chapter 3). Whilst walking upon estuarine mud it is
easy to sink through the soft surface and impact upon the more stable peat/clay/buried soil
sediments below. It has been noted by Scales (2006) that prehistoric individuals also impacted
the sediment in this way, although this phenomenon may create difficulties in identifying the
species of the footprint-track maker.
When a footprint-track is found on the intertidal zone the key question to consider is if they are
in consolidated sediments which were distorted when they were made but are now consolidated
and firm, or if the footprint is in unconsolidated mud and likely to be of very recent origin. If
the footprints are in consolidated sediment they are likely to be archaeological and worthy of
recording.
114
Figure 4.15 Processes acting during footprint formation (Marty et al. 2009). Note that they use
the terminology ‘true track’ instead of ‘footprint’
4.6 Footprint Terminology
Allen (1997) created descriptive terms for the different parts of a footprint and extensively
studied footprint formation processes, with particular emphasis on the formation processes on
the Severn Estuary (Allen 1997; Allen et al. 2003). The terminolgy applied by Allen (1997) is
used within the current study. For a track to be created, the limb and foot cuts or deforms the
sediment, creating a vertical shaft (Figure 4.16), as it is put down and then withdrawn (Allen
1997). When walking the force applied through a limb is gradual, whereas when an animal is
running the force is far quicker and more violent (Leutscher 1960; Bang and Dahlstrom 1974).
These forces can be seen in the footprint and can assist in understanding the speed that the
animal was moving.
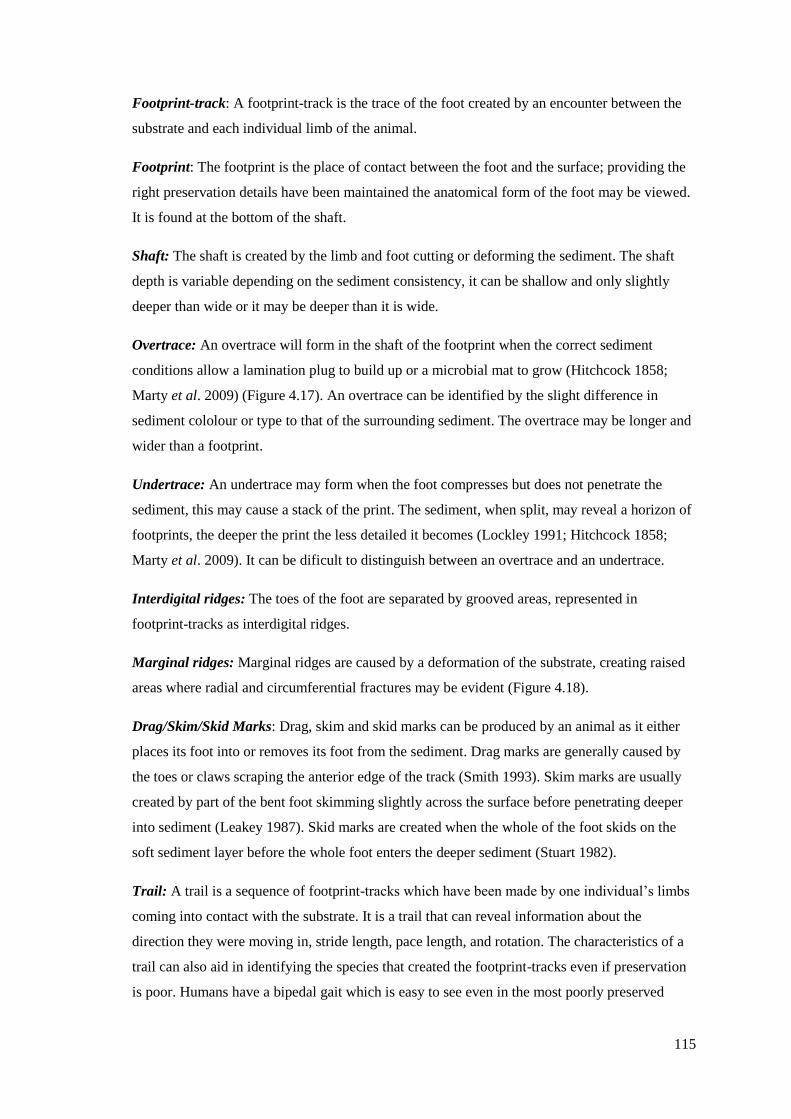
115
Footprint-track: A footprint-track is the trace of the foot created by an encounter between the
substrate and each individual limb of the animal.
Footprint: The footprint is the place of contact between the foot and the surface; providing the
right preservation details have been maintained the anatomical form of the foot may be viewed.
It is found at the bottom of the shaft.
Shaft: The shaft is created by the limb and foot cutting or deforming the sediment. The shaft
depth is variable depending on the sediment consistency, it can be shallow and only slightly
deeper than wide or it may be deeper than it is wide.
Overtrace: An overtrace will form in the shaft of the footprint when the correct sediment
conditions allow a lamination plug to build up or a microbial mat to grow (Hitchcock 1858;
Marty et al. 2009) (Figure 4.17). An overtrace can be identified by the slight difference in
sediment cololour or type to that of the surrounding sediment. The overtrace may be longer and
wider than a footprint.
Undertrace: An undertrace may form when the foot compresses but does not penetrate the
sediment, this may cause a stack of the print. The sediment, when split, may reveal a horizon of
footprints, the deeper the print the less detailed it becomes (Lockley 1991; Hitchcock 1858;
Marty et al. 2009). It can be dificult to distinguish between an overtrace and an undertrace.
Interdigital ridges: The toes of the foot are separated by grooved areas, represented in
footprint-tracks as interdigital ridges.
Marginal ridges: Marginal ridges are caused by a deformation of the substrate, creating raised
areas where radial and circumferential fractures may be evident (Figure 4.18).
Drag/Skim/Skid Marks: Drag, skim and skid marks can be produced by an animal as it either
places its foot into or removes its foot from the sediment. Drag marks are generally caused by
the toes or claws scraping the anterior edge of the track (Smith 1993). Skim marks are usually
created by part of the bent foot skimming slightly across the surface before penetrating deeper
into sediment (Leakey 1987). Skid marks are created when the whole of the foot skids on the
soft sediment layer before the whole foot enters the deeper sediment (Stuart 1982).
Trail: A trail is a sequence of footprint-tracks which have been made by one individual’s limbs
coming into contact with the substrate. It is a trail that can reveal information about the
direction they were moving in, stride length, pace length, and rotation. The characteristics of a
trail can also aid in identifying the species that created the footprint-tracks even if preservation
is poor. Humans have a bipedal gait which is easy to see even in the most poorly preserved
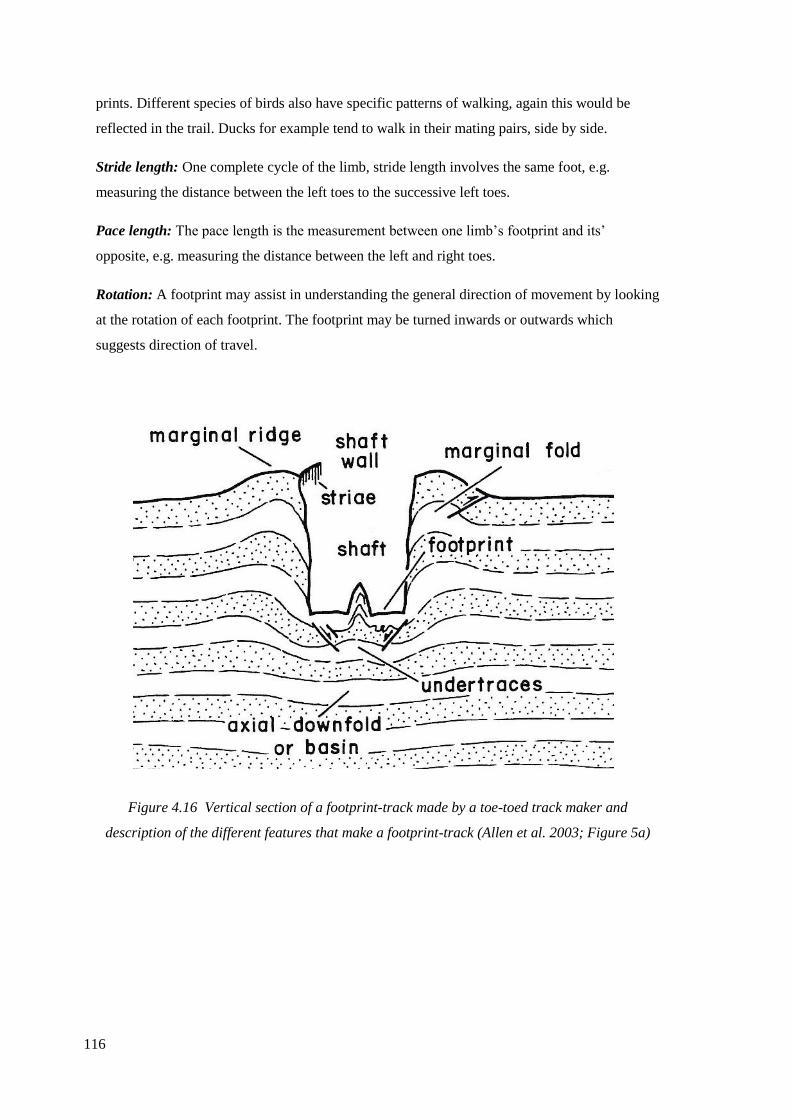
116
prints. Different species of birds also have specific patterns of walking, again this would be
reflected in the trail. Ducks for example tend to walk in their mating pairs, side by side.
Stride length: One complete cycle of the limb, stride length involves the same foot, e.g.
measuring the distance between the left toes to the successive left toes.
Pace length: The pace length is the measurement between one limb’s footprint and its’
opposite, e.g. measuring the distance between the left and right toes.
Rotation: A footprint may assist in understanding the general direction of movement by looking
at the rotation of each footprint. The footprint may be turned inwards or outwards which
suggests direction of travel.
Figure 4.16 Vertical section of a footprint-track made by a toe-toed track maker and
description of the different features that make a footprint-track (Allen et al. 2003; Figure 5a)
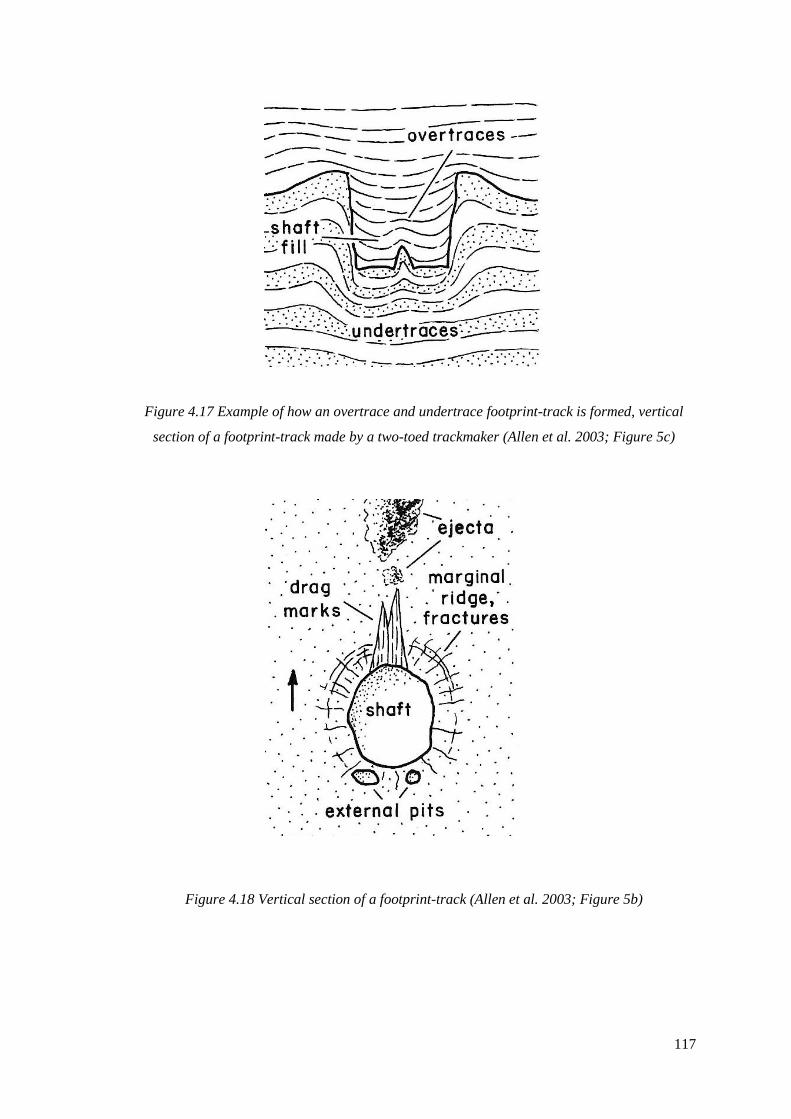
117
Figure 4.17 Example of how an overtrace and undertrace footprint-track is formed, vertical
section of a footprint-track made by a two-toed trackmaker (Allen et al. 2003; Figure 5c)
Figure 4.18 Vertical section of a footprint-track (Allen et al. 2003; Figure 5b)

118
4.7 Field Recording Methods
The methodology and footprint-track terminology established by Allen et al. (2003) and Scales
(2006) provided a base from which to work and adapt; this methodology was modified to
include thorough recording of mammalian and avian footprint-tracks, as well as modernised by
utilising Bennet et al’s (2013) methods for accurate recording.
In this methodological section the full range of techniques utilised during the fieldwork period
2014-2017 are outlined. The narrow tidal window, differences in preservation and the locations
of each footprint area meant that it was not possible to employ the full range of techniques in
every occasion. Each period of fieldwork had a clear set of objectives as to which techniques
were expected to be used and in what sequence. The priority was to ensure that any well-
preserved footprint-tracks were fully recorded in the time available and that the potential of new
technology for the rapid recording of footprint-tracks was developed. A guide to recording
prehistoric footprint-tracks from intertidal zones was written by the author and supplied to The
Coastal and Intertidal Zone Archaeological Network and is available online for anybody to
access (Appendix 1.1).
4.7.1 Preparing for fieldwork
In advance of coastal fieldwork, the tide table ‘Easy tide’ and ‘Admiralty Tide Tables’ were
consulted. ‘Easy tide’ is a government website which predicts tides for the week ahead, whilst
the ‘Admiralty Tide Tables’ provide a more approximate time for tides throughout the year.
The likely time of exposure of the area was established depending on the site location and its
OD height in relation to the tidal frame.
Before heading out onto a coastal site it is important to have a clear plan of action and a list of
delegated tasks that need to be achieved during exposure. It is important to have all equipment
with you, as every moment counts. Creating a list of all possible equipment that may be
required in any eventuality ensures that the footprint-track exposure is used to upmost
advantage. The footprint areas at Goldcliff are exposed during only a short tidal frame. The OD
height at which footprints occur range from about -3m OD (top of Site C) down to -5.31m (Site
S). The highest footprint sites will be exposed for about 2 hours at the best during spring tides
and the lowest (Site N and S) only for about 1.5 hours. Under average muddy conditions much
of this time will be spent locating footprints and washing off mud and sand before recording can
start.
A health and safety risk assessment was prepared for fieldwork.
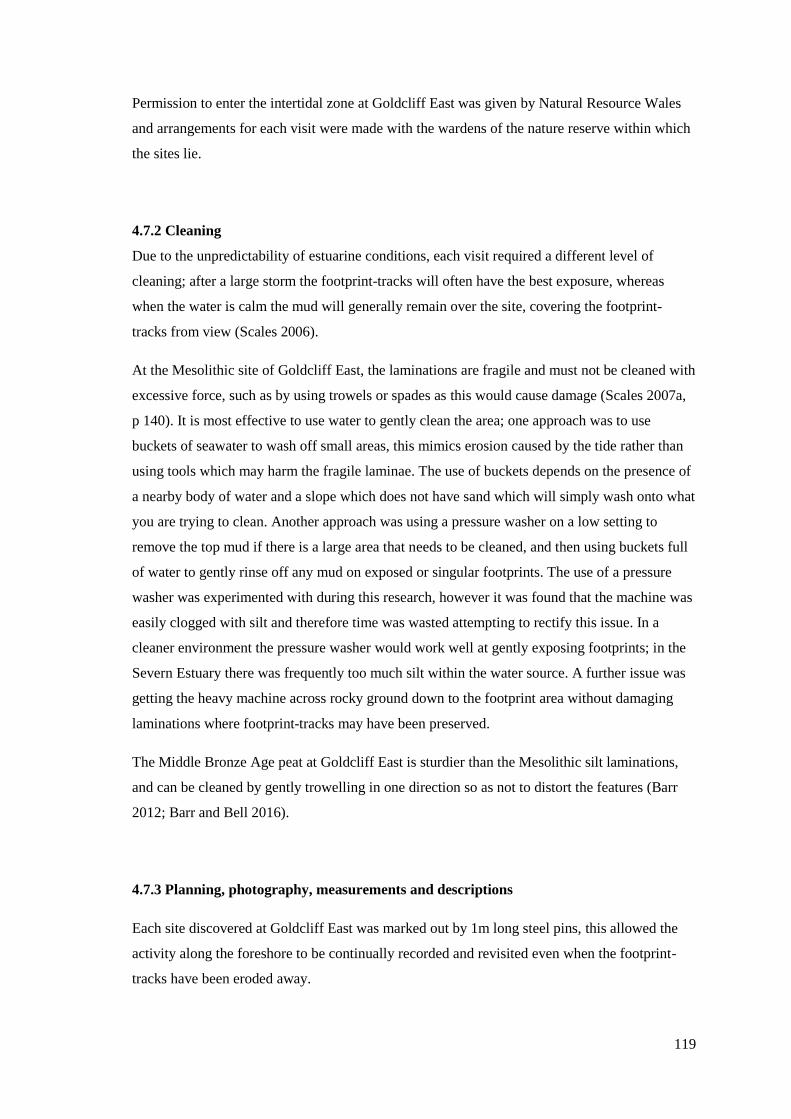
119
Permission to enter the intertidal zone at Goldcliff East was given by Natural Resource Wales
and arrangements for each visit were made with the wardens of the nature reserve within which
the sites lie.
4.7.2 Cleaning
Due to the unpredictability of estuarine conditions, each visit required a different level of
cleaning; after a large storm the footprint-tracks will often have the best exposure, whereas
when the water is calm the mud will generally remain over the site, covering the footprint-
tracks from view (Scales 2006).
At the Mesolithic site of Goldcliff East, the laminations are fragile and must not be cleaned with
excessive force, such as by using trowels or spades as this would cause damage (Scales 2007a,
p 140). It is most effective to use water to gently clean the area; one approach was to use
buckets of seawater to wash off small areas, this mimics erosion caused by the tide rather than
using tools which may harm the fragile laminae. The use of buckets depends on the presence of
a nearby body of water and a slope which does not have sand which will simply wash onto what
you are trying to clean. Another approach was using a pressure washer on a low setting to
remove the top mud if there is a large area that needs to be cleaned, and then using buckets full
of water to gently rinse off any mud on exposed or singular footprints. The use of a pressure
washer was experimented with during this research, however it was found that the machine was
easily clogged with silt and therefore time was wasted attempting to rectify this issue. In a
cleaner environment the pressure washer would work well at gently exposing footprints; in the
Severn Estuary there was frequently too much silt within the water source. A further issue was
getting the heavy machine across rocky ground down to the footprint area without damaging
laminations where footprint-tracks may have been preserved.
The Middle Bronze Age peat at Goldcliff East is sturdier than the Mesolithic silt laminations,
and can be cleaned by gently trowelling in one direction so as not to distort the features (Barr
2012; Barr and Bell 2016).
4.7.3 Planning, photography, measurements and descriptions
Each site discovered at Goldcliff East was marked out by 1m long steel pins, this allowed the
activity along the foreshore to be continually recorded and revisited even when the footprint-
tracks have been eroded away.
120
After cleaning, each footprint-track was assigned a footprint number and a waterproof tag with
the footprint number written on using a waterproof pen, the tag was then inserted into the
sediment next to the footprint. The footprint-track was then photographed using standard
photography. The photograph included the label with the footprint number, a scale bar and a
north point established with a compass. Recording with standard photography ensures that there
is still a digital document if time does not allow for appropriate recording.
The location of a footprint-track should be established using Differential Global Positioning
Systems (differential GPS), which works out the location using signals transmitted by satellites
obtained from terrestrial stations (Historic England 2015). This system can have 1cm accuracy
and is portable, which is an advantage on the intertidal zone. During the present research the
Differential GPS was not always available for use and on several visits the equipment did not
function correctly. Consequently, accurate Differential GPS data is only available for some
areas, although in most cases it was possible to revisit sites later and obtain accurate locational
information. The disadvantage of this technology is that it is expensive and generally owned by
specialist organisations such as universities. A handheld Global Positioning Systems (GPS) has
accuracy of about 3-6m, however it is relatively cheap technology so is a good substitute when
a differential GPS is unavailable.
A description of the footprint-tracks was recorded, which included the number in the area, the
possible species, evidence of trail, association to other footprint areas, association to certain
topography and any unusual features. The rotation of the footprint-track was recorded using a
handheld compass, to identify the direction of movement.
After the written description, the measurements of the footprint-track were then documented.
The full length and width were measured, though it was not always possible to discern all the
features. In human footprints, where possible, length of the foot was recorded from the tip of
the hallux, through the medial arch and to the pterion. The width was measured at the widest
point, from the forefoot.
A plan of the area was created using a planning grid square scaled at 1:20 or using the pins
inserted during previous investigations, a note of each footprint number was included in the
plan.
4.7.4 Multi-image photogrammetry in the intertidal zone
The use of multi-image photogrammetry in this experiment involved prepared targets set up on
the sediment near the footprint-tracks as ground control points (GCP). The GCP’s positions
121
were recorded using handheld GPS or differential GPS depending on availability. The distance
between each GCP was measured and a brief plan was created to enable the area to be analysed
if the differential GPS failed, which was a problem experienced multiple times during the
fieldwork period.
A 10cm scale was placed by the footprint for size reference. The images were taken by hand, as
the unstable and uneven sediments were not appropriate for mounting tripods and they caused
damage to the laminations. Taking the photographs by hand rather than using a tripod was a
time-effective method (Rüther et al. 2012). Multiple images of the footprint-tracks were taken,
at a different position for each image, using a fixed angle, full framed camera, with a fixed
angle lens (Bennet et al. 2013; De Reu et al. 2013), ensuring at least a third overlap of the frame
for each photograph and from as many angles as possible. The zoom and flash features were not
utilised, and all images were shot in RAW. This experiment utilised a Nikon D600 SLR camera
with a 50mm lens. This camera has 24.3 megapixels and a wide ISO sensitivity range of ISO
100 to 6400. Two 120gb memory cards were in the camera at one time and a spare was carried.
4.7.5 Laser scanner
A Faro Scanner Freestyle3D was utilised in this experiment. It is a small machine, weighing less
than 1kg (Faro technologies 2017), making it ideal to transport onto the intertidal zone. This
machine was designed to allow scanning in a variety of versatile sites and hard to access areas.
Ground control points were placed around the footprint-tracks; it was not necessary to measure
the distance between these as the scanner has accuracy of 1mm and is calibrated before each
recording. A surface tablet and Faro laser scanner software prompted the user through each
stage of the laser recording process.
Within the current study laser scanning was utilised during fieldwork on 18th May 2015,
however no data of quality was gathered due to issues with recording with this technology, this
will be discussed in Section 4.9.
4.7.6 Casting
Casting greatly compliments standard photography; where two-dimensional images can create
an issue in defining the morphology of the footprints, casts provide a physical replica of the
footprint that can be removed from the site and studied in a laboratory and perhaps later used
for museum display. Footprint-tracks of a good preservation quality were cast to gain a further
understanding as to the contours and morphology of the print. Dental alginate was used to cast
122
with as it was found to work well within the Severn Estuary environment (Scales 2006). Dental
alginate has a setting time of two minutes and most of the footprint-tracks were on the very
lowest area of the foreshore with the shortest exposure time. Footprint-tracks were fully
recorded using photography, measurements and photogrammetry before casting. The footprint
track was surrounded by a plastic frame to retain the alginate. The mixture was made up as
directed by each product’s specification, using fresh (not salt) water, which was poured into the
cleaned footprint-track once it has gained the correct consistency. Once dry the cast was lifted
out. Dental alginate is flexible and lifts out the footprint easily, though like all casting methods
it can still cause damage to the laminations. Dental alginate can only be stored for a short
period, once off-site the prints were recast in a longer lasting material, Plaster of Paris.
4.7.7 Block-lifting
The method of block-lifting footprint-tracks was taken from Scales (2006), and its effectiveness
experimented with during this study. A 30cm trench was dug around footprint-track 2014:308,
at Site M5a. An aluminium reinforced metal sheet was then used to cut into the sediment
underneath the block so that the sediment containing the footprint-track could be removed from
its original context. The block lifted was approximately 30cm deep. Before removal the
footprint was carefully bound round the edges using packing material and masking tape. This
was done with care so as not to crack the silt. The block-lifted sediment was then removed from
the laminations and carried off the intertidal zone.
4.7.8 Sediment samples
Sediment samples were taken from the same lamination as a random selection of footprint-
tracks. The focus was on the precise surface upon which the footprint itself had been made,
though samples were also taken from the lamination below. The exact walked upon lamination
was not always clear as most of the footprint-tracks were overtraces/undertraces rather than
obvious footprints. The sediment samples were taken in an intact block of about 5 grams, no
thicker than the lamination in question, and put into a sample bag. The bags were clearly
marked with the footprint number and its precise relation to the footprint (eg. surface of
footprint, sediment filling footprint, lamination under footprint). The sample was used for laser
granulometry to understand the particle sizes of the sediments. The method and results of this
analysis is discussed in Chapter 8.
123
4.7.9 Optically stimulated luminescence dating
There have been a range of methods and techniques developed for archaeological dating
(Walker 2005), many of which can be applied to date footprint-tracks (Figure 4.19). Pleistocene
footprint-tracks from contexts older than approximately 50ka BP are often dated via the
footprint’s relation to volcanic context, using Potassium-Argon, with the site of Laetoli being an
example of this (Leakey 1984). In contexts with bones or shells the footprint can be dated via
Uranium Series. From c. 50ka BP radiocarbon dating can be utilised to date footprint-tracks,
although this method provides an accurate date, the footprint-track horizon itself may not
contain material that can be radiocarbon dated, in these situations it is dated via its association
to stratified artefacts that provide the radiocarbon date. An example of this is seen at Formby
Point, where radiocarbon dates were obtained from red deer antlers discovered in the same
strata as red deer hoof prints, dated to 4450±45 14C BP (OxA-9130; Roberts and Worsley 2008).
Optically Stimulated Luminescence (OSL) is a technique that has been utilised to date several
footprint-track sites such as Willandra lakes (Webb et al. 2006; Webb 2007), and Formby Point
(Roberts and Worsley 2008, p 38), and provides dates based on the last time quartz in the
sediment was exposed to light, though the range in date is far larger than that provided by
radiocarbon dating (Preusser et al. 2008). The stratigraphic context of the site must be fully
understood for this method to be appropriate, as quartz or feldspar-rich minerogenic sediments
are required for this technique, and would need to be present in the footprint-track horizon for
accurate dating.
There is a distinctive lack of artefacts from the footprint-track horizons at Goldcliff East. Past
research has dated them in association with artefacts that have provided radiocarbon dates, such
as from plant remains in organic silts between the laminations of Site E (Bell 2007, p 50), and
radiocarbon dated to 7300±55 BP (OxA-14037; 6340-6030 cal BC; Bell 2007, p 223). Within
the current research OSL dating of the footprint-track horizons was also attempted to
compliment the radiocarbon dating from this site.
Samples for OSL sediments were taken from footprint-track 2014:310 from Site M5a, and from
Site R at Goldcliff East (Chapter 6, Figure 6.23 and 6.67). The samples were labelled and the
position of the samples was recorded using differential GPS. The samples were sent to the
University of Gloucestershire Luminescence dating laboratory where they were analysed
(Appendix 1.2).
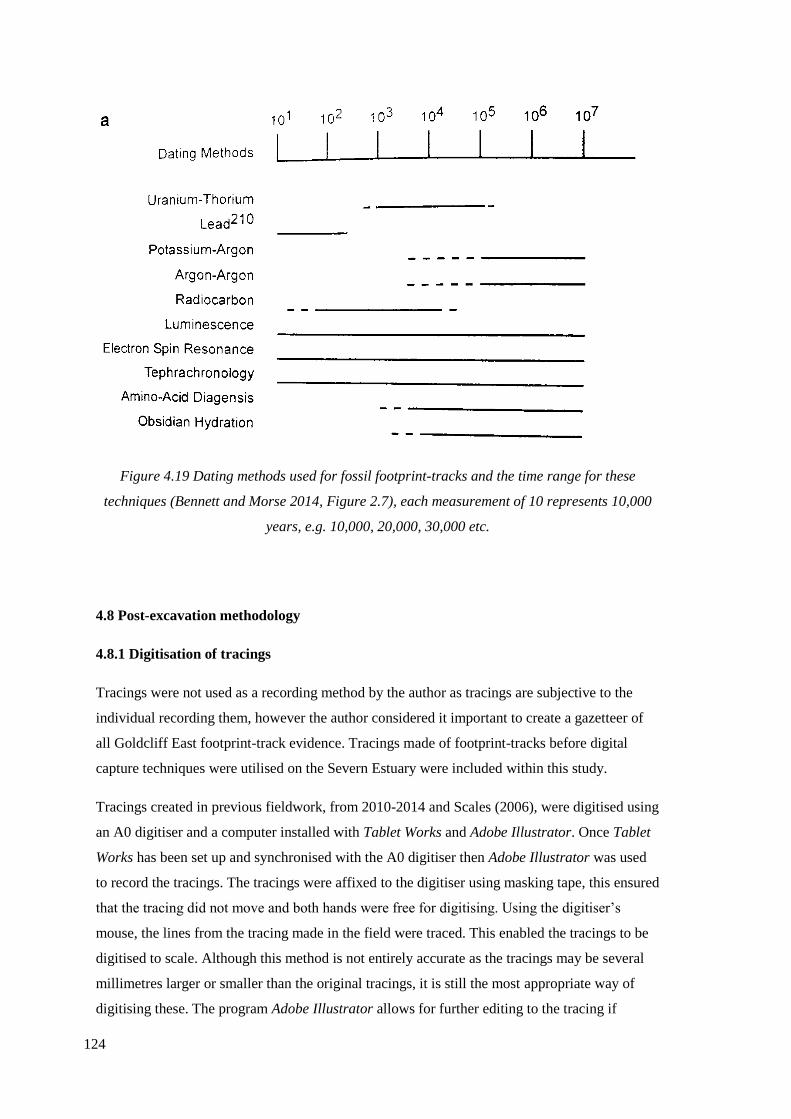
124
Figure 4.19 Dating methods used for fossil footprint-tracks and the time range for these
techniques (Bennett and Morse 2014, Figure 2.7), each measurement of 10 represents 10,000
years, e.g. 10,000, 20,000, 30,000 etc.
4.8 Post-excavation methodology
4.8.1 Digitisation of tracings
Tracings were not used as a recording method by the author as tracings are subjective to the
individual recording them, however the author considered it important to create a gazetteer of
all Goldcliff East footprint-track evidence. Tracings made of footprint-tracks before digital
capture techniques were utilised on the Severn Estuary were included within this study.
Tracings created in previous fieldwork, from 2010-2014 and Scales (2006), were digitised using
an A0 digitiser and a computer installed with Tablet Works and Adobe Illustrator. Once Tablet
Works has been set up and synchronised with the A0 digitiser then Adobe Illustrator was used
to record the tracings. The tracings were affixed to the digitiser using masking tape, this ensured
that the tracing did not move and both hands were free for digitising. Using the digitiser’s
mouse, the lines from the tracing made in the field were traced. This enabled the tracings to be
digitised to scale. Although this method is not entirely accurate as the tracings may be several
millimetres larger or smaller than the original tracings, it is still the most appropriate way of
digitising these. The program Adobe Illustrator allows for further editing to the tracing if
125
required and for lamination lines to be removed if necessary so that only the footprint-tracks
remain.
4.8.2 Block-lift analysis
If a block-lift has been taken from the silt lamination it is important to investigate the footprint
as soon as possible, as estuarine silt can crack easily, especially when dried out. Putting the
block-lift in the freezer until you are ready to investigate may help to delay the cracking process
although it is still likely to become cracked and crumbly. Immediately analysing the block-lift
within a day of removing from the site is the best procedure.
It can be difficult to immediately ascertain if a footprint-track is an overtrace or an undertrace
so micro-excavation can be attempted to establish this. The silt laminations in the block-lift will
be fragile and will be easy to peel away with the fingertips, this technique of fingertip
excavation was developed by Scales (2006). Small wooden tools are appropriate for use during
micro-excavation as they are less likely to smudge any features. Carefully, first using fingertips
and where necessary wooden tools, the laminations were peeled away and any noticeable
features recorded, including whether the footprint was an undertrace, or an overtrace of the
actual footprint.
The poorly preserved block-lifted footprint-track, 2014:308, did not reveal any underlying
features when block-lifted and micro-excavated. This technique was not attempted again due to
how destructive it was to the underlying laminations, and the time that was spent block-lifting
and carrying the sediment back from the foreshore for very little information.
4.8.3 Footprint-track recording form
The footprint-track recording forms are modelled upon those created by Scales (2006), updated
to include the different techniques used within the field (e.g. photogrammetry, casts, laser
scanning etc.). Each form notes the site and area, footprint-number, and possible species as well
as a variety of other considerations. Each footprint-track was recorded onto a footprint-track
recording form after each day of fieldwork. A copy of the recording form is included within
Appendix 1.3.
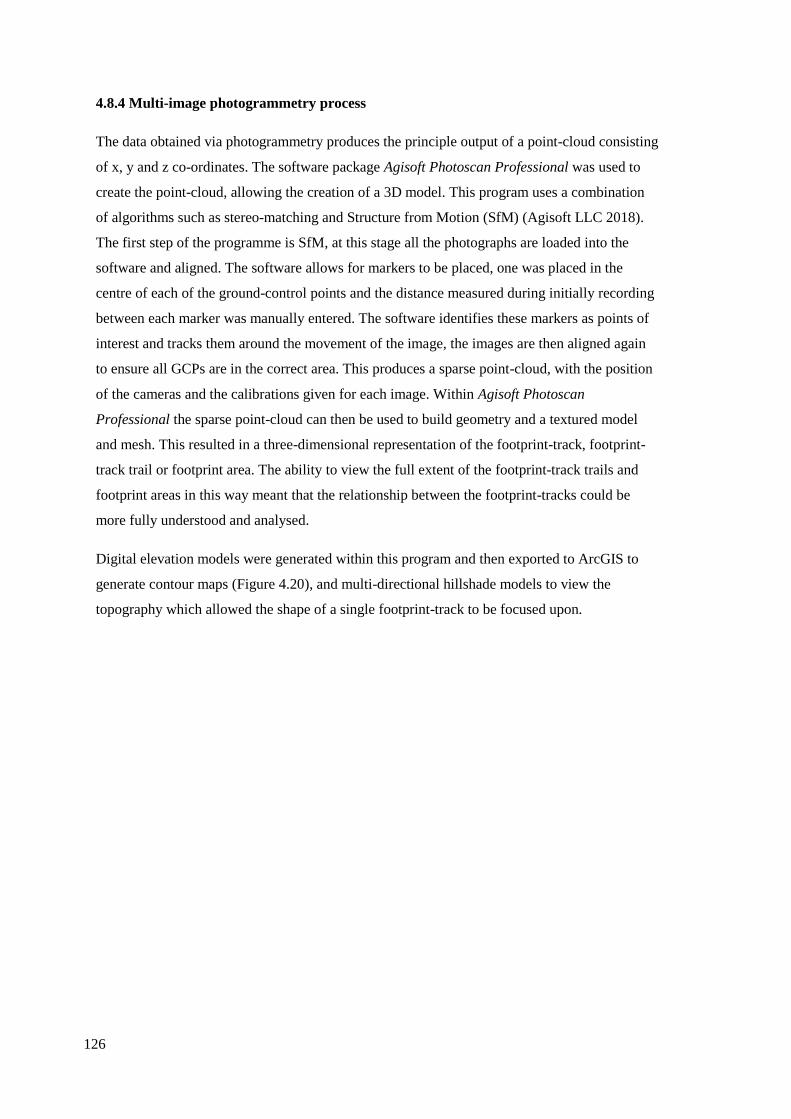
126
4.8.4 Multi-image photogrammetry process
The data obtained via photogrammetry produces the principle output of a point-cloud consisting
of x, y and z co-ordinates. The software package Agisoft Photoscan Professional was used to
create the point-cloud, allowing the creation of a 3D model. This program uses a combination
of algorithms such as stereo-matching and Structure from Motion (SfM) (Agisoft LLC 2018).
The first step of the programme is SfM, at this stage all the photographs are loaded into the
software and aligned. The software allows for markers to be placed, one was placed in the
centre of each of the ground-control points and the distance measured during initially recording
between each marker was manually entered. The software identifies these markers as points of
interest and tracks them around the movement of the image, the images are then aligned again
to ensure all GCPs are in the correct area. This produces a sparse point-cloud, with the position
of the cameras and the calibrations given for each image. Within Agisoft Photoscan
Professional the sparse point-cloud can then be used to build geometry and a textured model
and mesh. This resulted in a three-dimensional representation of the footprint-track, footprint-
track trail or footprint area. The ability to view the full extent of the footprint-track trails and
footprint areas in this way meant that the relationship between the footprint-tracks could be
more fully understood and analysed.
Digital elevation models were generated within this program and then exported to ArcGIS to
generate contour maps (Figure 4.20), and multi-directional hillshade models to view the
topography which allowed the shape of a single footprint-track to be focused upon.
127
Figure 4.20 (A) Contour maps (1 mm interval) for unregistered mean tracks for habitually
unshod modern feet (Daasanach, northern Kenya), Laetoli G1 Trail and G3 Trail. (B).
Contoured maps for registered mean tracks for habitually unshod modern feet (Daasanach),
Laetoli G1 Trail and G3 Trail (Bennet et al. 2016; Figure 4)
4.8.5 Laser scanning models
In a similar way to that of photogrammetry, a point-cloud built of x, y, z co-ordinates gathered
through laser scanning may be utilised to create a 3D model. A very simple and free to use
program that might be used for this is CloudCompare or Meshlab. These software packages
allow the three-dimensional files to be viewed, as well as options to alter the point-cloud to
show surfacing or geometry (Bennet and Morse 2014).
128
4.9 Comparison of techniques developed for intertidal footprint-track recording: multi-
image photogrammetry versus laser scanning
A comparison between the effectiveness of an optical laser scanner and multi-image
photogrammetry for footprint recording has been investigated thoroughly by Bennet et al.
(2013; Bennet and Morse 2014). Recording conditions were very different from those
experienced at Goldcliff East, so the comparison of techniques has been reassessed for use in
challenging recording environments in the intertidal zone (Table 4.1). The utilisation of laser
scanners on many footprint-track sites has been successful (Raichlen et al. 2010; Meldrum et al.
2011), however the use of a laser scanner on the intertidal zone very quickly became
problematic. Certain requirements such as the need to recalibrate after levels of inactivity,
which took a few minutes on each calibration, would not be an issue on many footprint sites,
however in the intertidal zone, where tidal windows are small and opportunities to access
certain areas are rare, these minutes for recalibration were problematic. The Faro Scanner
Freestyle3D was light, compact, and easily portable, however strong winds and bright sunlight
prevented any data being accurately captured with the handheld laser scanner during the
fieldwork. Due to the cost of hiring the laser scanning equipment and the uncertainty of being
able to guarantee appropriate weather on days when the tide table was sufficient, laser scanning
was not a technique that offered accurate, fast or reliable recording of footprints from areas
where the destruction of the footprint was imminent. This is not to say that in the future laser
scanning cannot be utilised or that other makes of laser scanners would not be effective, rather
at the time of writing the conditions for recording on the Severn Estuary require equipment that
is ruggedized, light and portable, can be used without a large power source or a tripod and is
able to work in a variety of weather conditions, which the Faro Scanner Freestyle3D could not.
Laser Scanners are improving all the time; new models would benefit from being tested on the
intertidal zone footprints to fully investigate if laser scanning in intertidal zones is practical and
effective.
Multi-image photogrammetry was found to be the most effective digital recording technique in
the challenging conditions of working within the intertidal zone. The cost of the hardware is
low as any make of digital camera can be used. In this research a Nikon D600 SLR camera,
with a 50mm lens and a 120megabite memory card was utilised, however the use of a camera
phone (Nokia Lumia 735 with a 6.7-megapixel camera) was also experimented with. The
camera phone did capture enough detail to create a point-cloud, though depth and texture were
not as detailed and there was often a large amount of artefact surrounding the edges of the
model, however in situations where someone only has a camera phone the models would still be
useful. Multi-image photogrammetry was excellent for recording in the intertidal zone of the
Severn Estuary, where bulky equipment is not practical and may damage the archaeology. To
129
perform this process all that was required was a camera, memory card, and a scale, though a
handheld GPS or a differential GPS is useful equipment to use alongside the recording, as are
GCPs. The ability to perform this technique without a tripod is also convenient as the land
surface is unstable and the laminations are soft and tripods can again cause damage. The
process is relatively quick to perform, though laying down the GCPs and measuring the
distances between each one can take time if the footprint-tracks are spread over a large area.
The size of the area can also affect the amount of GCPs that it is possible to lay down. Within
this study GCPs were generally set up in 50cm2 or 1m2, however this is not always possible
when a trail is on several laminated bands over several meters. The software used to process the
multiple images into models was Agisoft Photoscan. This is a costly package at approximately
£2700 for a stand-alone licence, though floating and educational licenses are also available for a
lower price.
4.10 Summary
There are many techniques used by ichnologists to record footprint-tracks, some of which are
more sophisticated than others. Within this research the use of multi-image photogrammetry
was found to be the most effective method to digitally capture the data,and allowed for the
footprint-tracks to be fully viewed again when they had been processed into a 3D point cloud
model. These models allowed for thorough analysis of the footprint-tracks and make it possible
for the footprint-tracks to be 3D-printed from the point cloud data so that they can be exhibited
in museums. Optical laser scanning is a technique that has been utilised to record footprint-track
sites (Bennet and Morse 2014), however the Faro handheld laser scanner utilised within this
experiment was unable to accurately record within the intertidal zone of the Severn Estuary, due
to issues caused by winds, sunlight and the need for re-calibration. A ruggedized laser scanner
may be more effective at recording in this environment. Although recording the footprint-tracks
digitally provides strong data, there is always the possibility of inadequate data capture, or
technical failure, so the writer would also suggest that traditional methods such as standard
photography, the physical recording of metric measurements, and casting in dental alginate
(when appropriate) should all remain methods that are utilised in intertidal footprint-track
recording.
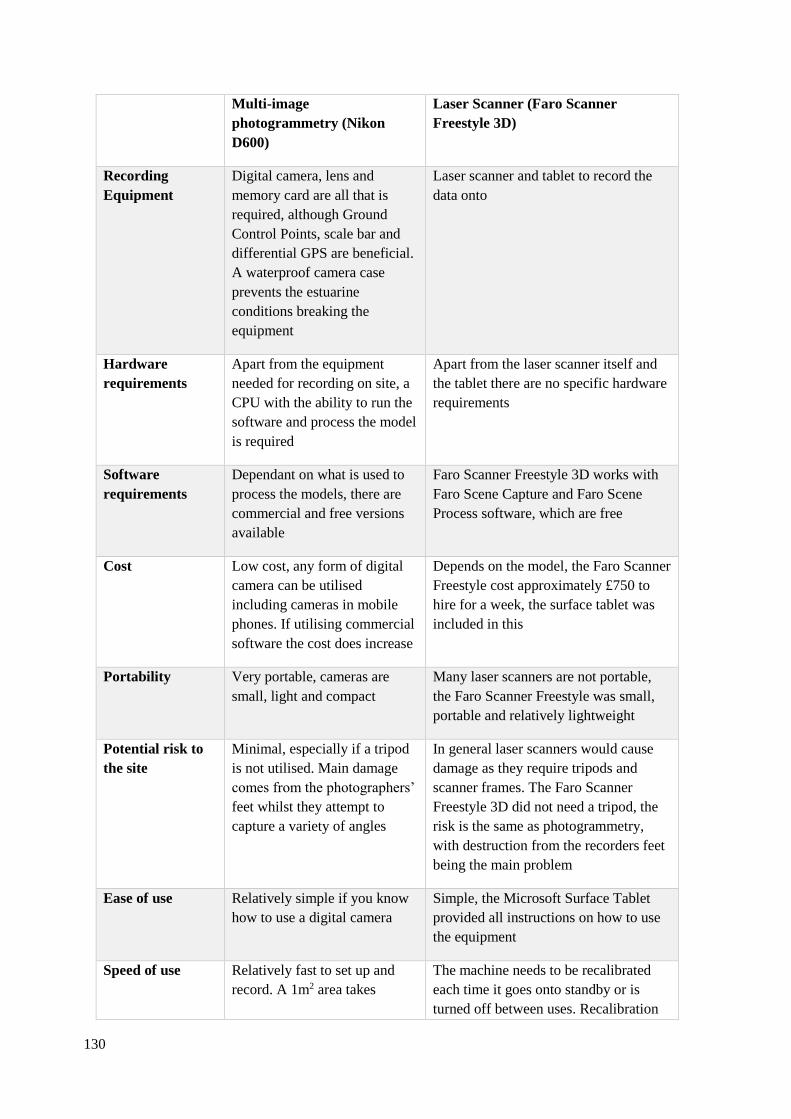
130
Multi-image
photogrammetry (Nikon
D600)
Laser Scanner (Faro Scanner
Freestyle 3D)
Recording
Equipment
Digital camera, lens and
memory card are all that is
required, although Ground
Control Points, scale bar and
differential GPS are beneficial.
A waterproof camera case
prevents the estuarine
conditions breaking the
equipment
Laser scanner and tablet to record the
data onto
Hardware
requirements
Apart from the equipment
needed for recording on site, a
CPU with the ability to run the
software and process the model
is required
Apart from the laser scanner itself and
the tablet there are no specific hardware
requirements
Software
requirements
Dependant on what is used to
process the models, there are
commercial and free versions
available
Faro Scanner Freestyle 3D works with
Faro Scene Capture and Faro Scene
Process software, which are free
Cost Low cost, any form of digital
camera can be utilised
including cameras in mobile
phones. If utilising commercial
software the cost does increase
Depends on the model, the Faro Scanner
Freestyle cost approximately £750 to
hire for a week, the surface tablet was
included in this
Portability Very portable, cameras are
small, light and compact
Many laser scanners are not portable,
the Faro Scanner Freestyle was small,
portable and relatively lightweight
Potential risk to
the site
Minimal, especially if a tripod
is not utilised. Main damage
comes from the photographers’
feet whilst they attempt to
capture a variety of angles
In general laser scanners would cause
damage as they require tripods and
scanner frames. The Faro Scanner
Freestyle 3D did not need a tripod, the
risk is the same as photogrammetry,
with destruction from the recorders feet
being the main problem
Ease of use Relatively simple if you know
how to use a digital camera
Simple, the Microsoft Surface Tablet
provided all instructions on how to use
the equipment
Speed of use Relatively fast to set up and
record. A 1m2 area takes
The machine needs to be recalibrated
each time it goes onto standby or is
turned off between uses. Recalibration
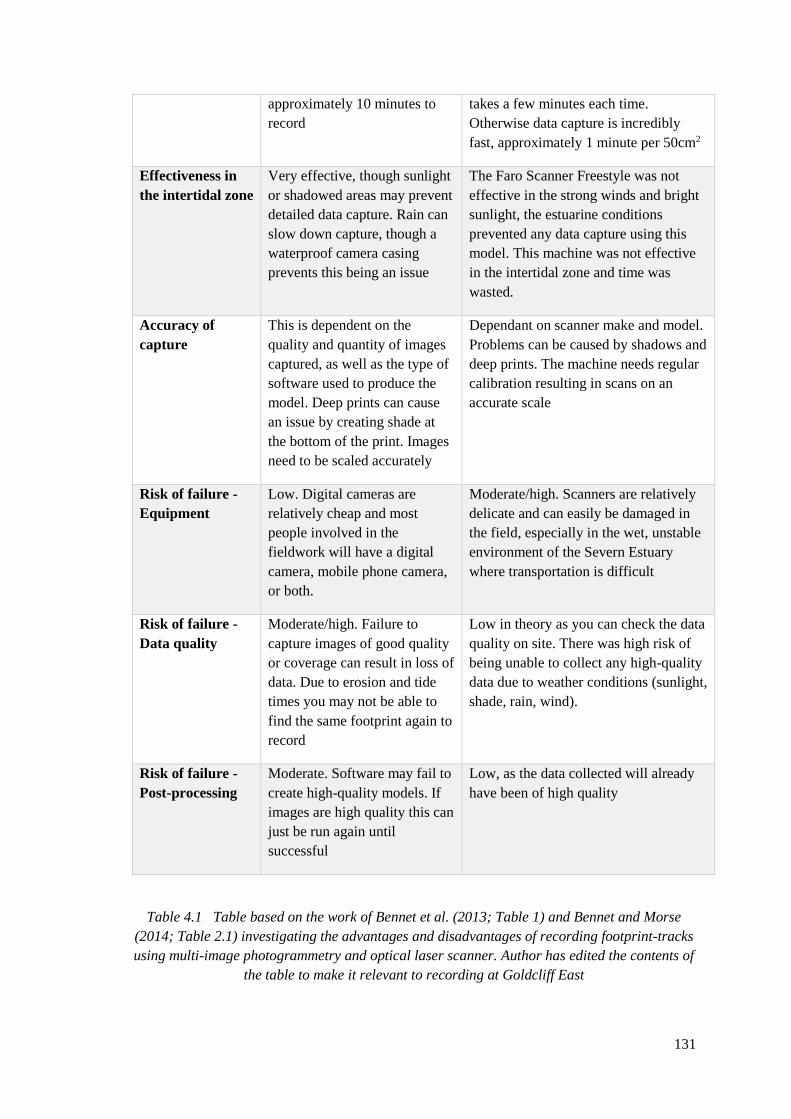
131
approximately 10 minutes to
record
takes a few minutes each time.
Otherwise data capture is incredibly
fast, approximately 1 minute per 50cm2
Effectiveness in
the intertidal zone
Very effective, though sunlight
or shadowed areas may prevent
detailed data capture. Rain can
slow down capture, though a
waterproof camera casing
prevents this being an issue
The Faro Scanner Freestyle was not
effective in the strong winds and bright
sunlight, the estuarine conditions
prevented any data capture using this
model. This machine was not effective
in the intertidal zone and time was
wasted.
Accuracy of
capture
This is dependent on the
quality and quantity of images
captured, as well as the type of
software used to produce the
model. Deep prints can cause
an issue by creating shade at
the bottom of the print. Images
need to be scaled accurately
Dependant on scanner make and model.
Problems can be caused by shadows and
deep prints. The machine needs regular
calibration resulting in scans on an
accurate scale
Risk of failure -
Equipment
Low. Digital cameras are
relatively cheap and most
people involved in the
fieldwork will have a digital
camera, mobile phone camera,
or both.
Moderate/high. Scanners are relatively
delicate and can easily be damaged in
the field, especially in the wet, unstable
environment of the Severn Estuary
where transportation is difficult
Risk of failure -
Data quality
Moderate/high. Failure to
capture images of good quality
or coverage can result in loss of
data. Due to erosion and tide
times you may not be able to
find the same footprint again to
record
Low in theory as you can check the data
quality on site. There was high risk of
being unable to collect any high-quality
data due to weather conditions (sunlight,
shade, rain, wind).
Risk of failure -
Post-processing
Moderate. Software may fail to
create high-quality models. If
images are high quality this can
just be run again until
successful
Low, as the data collected will already
have been of high quality
Table 4.1 Table based on the work of Bennet et al. (2013; Table 1) and Bennet and Morse
(2014; Table 2.1) investigating the advantages and disadvantages of recording footprint-tracks
using multi-image photogrammetry and optical laser scanner. Author has edited the contents of
the table to make it relevant to recording at Goldcliff East
132
Chapter 5
Inferring the age, sex and stature of an individual by utilising experimental
footprint data
5.1 Introduction
The foot, a biological mechanism made of 26 bones, layers of sinew and muscles, can perform a
variety of movements and enables us to control our speed and movement without a second of
thought. This chapter will explore the question of the relationship between a person’s height,
weight and footprint length and the determination of age and sex utilising experimental
footprint data. The understanding of this relationship is important within archaeological
footprint research, where a footprint may be the only evidence of an individual or a community.
Through understanding the footprint, we can then build a picture up of the society who made
them, their social demographic and the activities they may have partaken in.
The height of an individual has a more positive relationship to foot size compared to other parts
of the body, such as hand width (Krishan et al. 2010). It is generally agreed that an individual’s
foot length is between 14 to 16% of a person’s stature (Toppinard 1877; Barker and Scheuer
1998). This concept has encouraged forensic scientists to investigate the potential in identifying
an individual by utilising footprint evidence (Atamturk 2010; Fawzy & Kamal 2010; Giles and
Vallandigham 1991, Jasuja 1991), with multiple regression equations created to estimate the
stature of an individual from a footprint (Chapter 2, Table 2.2). Forensically this technique was
utilised to identify criminals, disaster victims, and victims of crime (Bennet and Morse 2014),
however anthropologists and archaeologists have also become interested in the potential of this
form of evidence.
The bones and morphology of the foot change over time as a person grows and reaches maturity
(Anderson 1956; Atamturk 2010; Hill 1958), it is in these differences in growth that the age of a
person may be determined. Footprint studies tend to produce regression equations based on a
specific sample, these datasets range in sample size from 38 people (Dingwall et al. 2013) to
over 1000 (Krishan 2008a,b; Moorthy et al. 2014).
Regression equations to establish stature will be determined from this dataset and presented
against those of other studies to observe the differences between studies that have focused on
the morphology of the foot represented in the footprint, compared to the appearance of a
footprint made in a sediment context.
Studies in forensic science have focused mainly upon the male sex, though studies into female
footprints are becoming more frequent (Chapter 2, Table 2.2). Children are rarely considered
133
due to the forensic purpose of most studies, though there have been a select number of studies
involving children aged one and over (Anderson 1956; Bertsch et al. 2004; Bosch et al. 2010;
Chen et al. 2011; Dowling et al. 2001; Grivas et al. 2008; Scales 2006).
There is merit in footprint data generated within forensic studies, however there are limitations
when utilising these techniques within archaeology. Studies generally focus on males or
females of a specific race or ethnicity or age range, University students or members of the
military (Chapter 2, Table 2.2). These groups will not be representative of an entire population;
members of the American military, for example, are generally in excellent health, aged between
18 and 40, and the sample used are all male and primarily Black or White (Robbins 1986). If
applied to someone of Indian heritage, for example, the results for this equation would not be
appropriate due to the morphological differences between different ethnicities and races
(Krishan 2008a). A further consideration is general health and nutrition and any other socio-
economic factors that may play a part in the growth of an individual.
The diet and lifestyle contrast between Mesolithic hunter-gatherers and modern populations
may cause a difference in foot structure, and therefore the footprint. Nutritional stress can
significantly affect the development of a juveniles’ body, which in turn can affect the timing of
puberty and the age of menarche. The delayed onset of puberty is thought to be an evolutionary
response to deal with poor childhood weight gain and nutrition, preventing the child from
experiencing the growth spurt of puberty until the body has the nutrients needed (Gluckman and
Hanson 2006; Stearns 1992). Prehistoric humans are likely to have come under periods of food
shortage or malnutrition due to the hunter-gatherer way of life, these stresses may have had an
influence on the growth of the individual. An indicator of nutritional stress can be seen within
the bones themselves; transverse lines of increased bone density (Harris lines) appear on long
bones and are a sign of arrested development during a growth period (Harris 1933). These lines
do not form unless an individual is otherwise well nourished most of the time, so are indicators
of periods of shortage rather than long periods of slow starvation (Murchison et al. 1984; Symes
1984).
There are a host of illnesses children may suffer with if they are constantly lacking in nutrients,
many of these stresses leave signs within children’s bones, Harris lines are not the only
indicator. Rickets, for example, occurs when there is a lack of vitamin D, calcium and
phosphorus within a person’s diet, vitamin D precursors are found in foods such as oily fish and
eggs (Pai and Shaw 2011). In samples with juvenile remains, rickets is one of the most
identifiable diseases. One of the earliest potential cases of rickets within archaeology was
remains from a mid-Holocene assemblage in Southern Africa, radiocarbon dated to 4820 ± 90
BP (TO-9531), and believed to be from a child aged between 3.5 and 5 months old (Pfeiffer and

134
Crowder 2004). Changes in bone growth or delayed growth may be an indicator of nutritional
stress. If an individual has delayed puberty until this stress is over then they may not fully
correspond with modern footprint growth data, though it should be remembered that modern
humans are just as likely to experience nutritional stress as hunter-gatherers. Vitamin D
deficiency rickets is still a disease affecting children in the United Kingdom (Mughal 2012).
The footprints of a child with rickets would not express their true stature or gait, as the weight
bearing bones would be curved. Forensic podiatry is also a concern when evaluating a footprint,
as there are a variety of issues related to the foot that may lead to a footprint with an unnatural
appearance.
Past populations may have had different biomechanics, have varying statures or walked with a
different gait to modern humans (Masao 2016). Levels of physical activity may also have
influenced the shape and size of the foot, as well as if the individual was shod habitually. It has
been reported that being habitually shod can change the structure and function of the foot, as
well as the gait of an individual; walking barefoot results in a reduced stride length as opposed
to shod individuals (Franklin et al. 2015). Initial vertical impact force between the foot and the
surface walked upon is also reduced, and an even distribution of pressure is seen in unshod
individuals. The habitual use of footwear has also been found to influence the width of a foot.
Those who are habitably barefoot have wider feet (D’Aoȗt et al. 2009), if a prehistoric
population was habitually unshod their feet would therefore be expected to be wider.
Archaeological evidence suggests hominins may have started wearing protective footwear as
early as 30,000 years ago (Trinkaus and Shang 2008), we therefore cannot assume that because
an individual was unshod when they created a footprint that they were continuously unshod,
they may in fact have just removed their footwear.
In terms of the influence of daily activity on the body, specifically the foot, the use of
pedometers has broadened the understanding of the average daily activity levels of a population.
Americans were found to walk an average of 5117 steps per day, Australians averaged 9695
steps per day, the Swiss averaged 9650 steps per day and the Japanese averaged 7168 steps per
day (Bassett et al. 2010). In contrast, pedometers were attached to members of the Hazda
population, who were found to undertake about 135 minutes of moderate to vigorous physical
activity a day (Pontzer et al 2012), which is not as active as is perhaps expected of a hunter-
gatherer group, though far more active than an average American. Contrarily, The Old Order
Amish community undertake more exercise as a farming community than the Hazda hunter-
gatherers. Amish men in a farming community took an average of 18,425 steps a day, with
women doing about 14,196. Men performed an average of 7.5 hours a day of moderate to
vigorous physical activity, and a further 1.5 hours a day of walking. Women took part in an
average of 6 hours per day of moderate to vigorous activity and just under an hour of walking
135
per day. Although clearly a very active community, 25% of men and 27% of women were
overweight, with a body mass index between 25 and 30 (Bassett et al. 2004).
Considering the level of exercise among the Hazda people it is unlikely that the population were
doing so much physical activity when unshod that their feet would have become much more
muscular than a shod individual, as they were only engaging in 2.3 hours of moderate to
vigorous physical activity a day, some of which may not have included the feet, e.g. chopping
wood. Although they undertake more exercise than the average American, it is not vastly
different to many communities worldwide; farming communities for instance are more active
than the Hazda hunter-gatherers. This being the case, we can expect habitually unshod
individuals to have wider feet, with a more even pressure distribution and a slightly shorter gait
than shod individuals, however the foot may not be vastly more muscular in hunter-gatherers
than other populations.
The differences in ethnicity and similar geographical populations has been explored within the
forensic literature, though there are very few populations that can be an analogue to an ancient
population. Campbell et al. (1936) investigated the relationship between the body and the
footprints of 478 central Australian Aborigines. These footprints represented a population of
people who were still partaking in a hunter-gatherer way of life which was perhaps like those
who lived in the same area 20,000 years ago, thus making them an excellent footprint analogue.
This dataset allowed the prehistoric footprints at Willandra Lakes to be analysed using an
appropriate analogue (Webb et al. 2006). A smaller study was conducted by Dingwall et al.
(2013) on 38 adult Daasanach individuals who lived near Lake Turkana, Kenya, where each
volunteer was asked to walk and run along a 15m long trackway. Midway along the trackway a
pit was dug, and sediment taken directly from the layer where prehistoric footprints at Illeret,
Kenya, had been found. This provided a direct sedimentary analogue between the prehistoric
footprints and modern Daasanach people, enabling the stature of the prehistoric people to be
estimated (Dingwall et al. 2013).
Unfortunately, most of the world has a ‘modernised’ lifestyle and groups such as Aborigines are
few and far between. Europe is lacking an indigenous hunter-gatherer population; therefore,
footprints studied in these areas should be inclusive to provide a better range of results which
may accurately represent a now non-existent population. In these situations, skeletal remains
may assist in determining the average stature of a population, which can be applied to footprints
to fully understand body metrics. Within Britain, skeletal remains from the Mesolithic period
are scarce, and even within Europe Mesolithic skeletal remains are still relatively uncommon,
though there are some bones that can be utilised for stature measurements (Schulting and
Wysocki 2002; Schulting et al. 2010; Waldron 1989). These suggest that Mesolithic H.sapiens
136
were similar in stature to humans of today, and so our footprints may be utilised to understand
past populations, though we must be cautious and not over interpret the data.
5.2 Method
The purpose of this experiment was to establish if there is any relationship between a person’s
height, age, sex and footprint size when creating footprints on silty clay sediments. This
relationship can then be applied to footprint-tracks found within archaeological contexts in
similar sediments, such as Mesolithic footprint-tracks found at Goldcliff East, Severn Estuary.
Ethical approval for this experiment was granted by the University of Reading Ethics
Committee in 2015 (Appendix 2.1), allowing children as young as three to take part in the
experiment. The writer underwent a Disclosure and Barring Services check to allow them to
work with children (Appendix 2.2).
177 male and female participants volunteered for this experiment, aged between 3 to 72 years.
Most volunteers were White European (94%), though there was also Filipino (0.5%), Filipino
White American (0.5%), Black British (2%), and Indian British (3%). White European were
dominant by coincidence, due to the locations in which the study was performed. The ways in
which ethnicity effects the size and shape of a footprint was not explored within this experiment
as it was not considered to be relevant.
Of the 177 people who volunteered to take part in this study, 89 adults aged above 16 years old
were involved. Of the 89 adults, 30 were male aged between 19 and 71, 59 were female aged
17 to 70. A total of 88 people aged between three and 16 years were studied for estimations of
stature utilising footprint data. Of these 46 were female and 42 were male, although two males
and one female withdrew from the study before any data except age and sex could be
established. This sample size is relatively small; however it is large enough to allow general
trends to be observed. Children aged between three to six years were one of the main focuses of
this study, as there have been very few studies regarding this age group before (Anderson et al.
1956; Scales 2006). Of all the children, 19 were three years of age, 15 were four, seven were
five, and nine were six years old. A further 38 volunteers were aged between seven and 16
years old.
Children younger than three were not considered, as before this age a child is still a ‘toddler’
and has a gait that does not resemble that of an adult. They tend to walk on their toes and have a
gait that is broad and short, their legs also are more rotated than an adult (Anderson et al. 1956).
Due to these factors the relationship between their footprint length and height would not be
expressed in the same way as children above this age.
137
Volunteers were a mixture of students and staff, as well as their relatives, from the University of
Reading (19%), and children and child carers from childminding groups and parent and toddler
groups from Reading and the surrounding areas (62%). A final group was a large childminding
group from Waterlooville, Hampshire (19%).
Only those with good foot health were involved in this study. Volunteers suffering from
infections such as Athletes foot were not asked to take part in the footprint experiment, though
people with recent foot breaks, a child suffering with Plantar Fasciitis, several women
suffering with hallux valgus, a child with a missing toe and a seven months’ pregnant woman
were included within this study.
Within forensics, footprints are often recorded using ink and measurements recorded from
specific landmarks (Kanchan et al. 2012; Krishan 2008a,b; Moorthy et al. 2014; Robbins 1985).
A further recording technique utilising geometric morphometrics has been established as
creating accurate reliable results with landmarks. This technique uses a laser foot scanner
(Domjanic et al. 2013), however this method is not appropriate when attempting to understand
the formation of footprints made within silty clay sediments, such as prehistoric footprints
found on intertidal zones. Sediment is malleable and is often lacking in clear landmarks, unlike
that of a static or two-dimensional ink footprint or those made on firmer sediments. This study
utilised sediments taken directly from banded clay silt laminations near areas where Mesolithic
footprint-tracks have been found. These laminations were obtained from an area where it was
unlikely that prehistoric footprints would survive, due to the high levels of erosion and churned
up sediments. In a similar approach to Dingwall et al. (2013), volunteers walked barefoot on
these sediments. An aluminium tray, 2m in length and 1m in width, was made for this
experiment (Figure 5.1). To enable footprints from a variety of people to be recorded this tray
was made this size so that it was easily portable.
The tray was placed within a shallow depression with the same dimensions as the tray,
providing a tight fit and preventing the tray from moving. The edges of the tray were level with
the rest of the ground surface, removing the need for a step to enter the footprint tray, which
would have altered gait. Estuarine sediment was added to the footprint area, this sediment was
compressed as much as possible using a plastic plastering trowel, so that the whole of the tray
was evenly filled by the sediment. After recording, the sediment had to be compressed and
spread across the tray. Constantly spreading and compressing the sediment prevented footprints
remaining preserved under the surface of the clay, which would alter the footprint data.
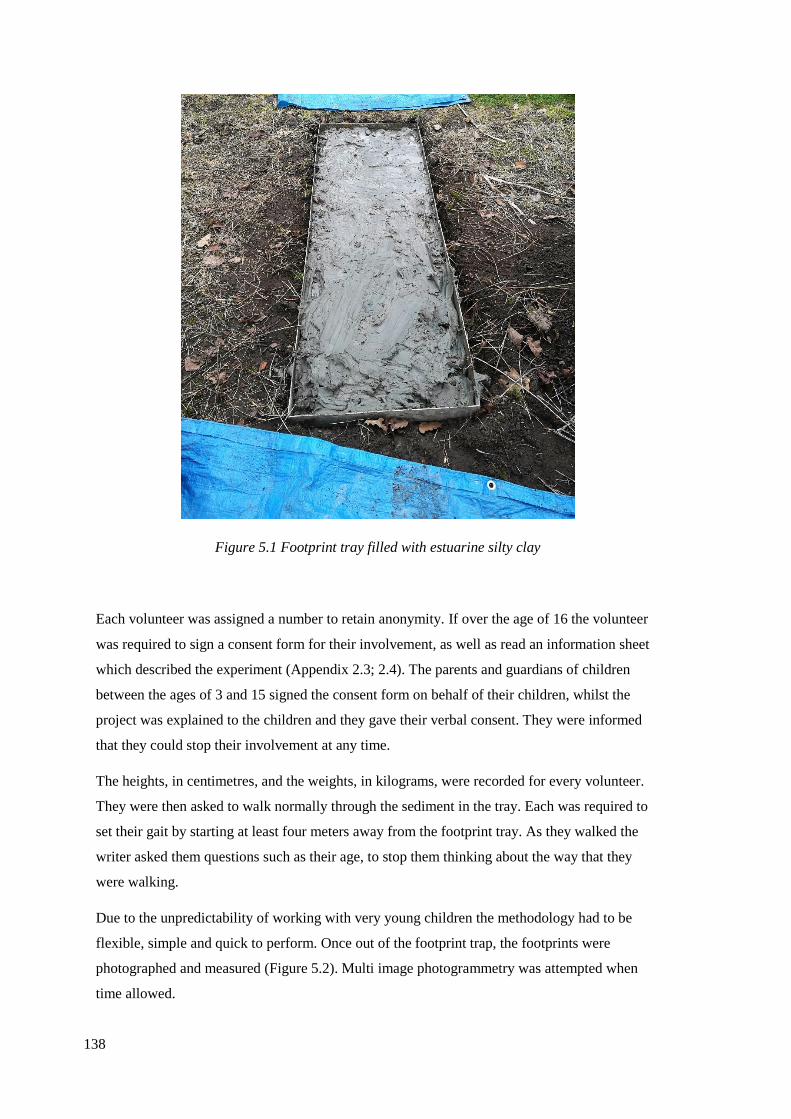
138
Figure 5.1 Footprint tray filled with estuarine silty clay
Each volunteer was assigned a number to retain anonymity. If over the age of 16 the volunteer
was required to sign a consent form for their involvement, as well as read an information sheet
which described the experiment (Appendix 2.3; 2.4). The parents and guardians of children
between the ages of 3 and 15 signed the consent form on behalf of their children, whilst the
project was explained to the children and they gave their verbal consent. They were informed
that they could stop their involvement at any time.
The heights, in centimetres, and the weights, in kilograms, were recorded for every volunteer.
They were then asked to walk normally through the sediment in the tray. Each was required to
set their gait by starting at least four meters away from the footprint tray. As they walked the
writer asked them questions such as their age, to stop them thinking about the way that they
were walking.
Due to the unpredictability of working with very young children the methodology had to be
flexible, simple and quick to perform. Once out of the footprint trap, the footprints were
photographed and measured (Figure 5.2). Multi image photogrammetry was attempted when
time allowed.
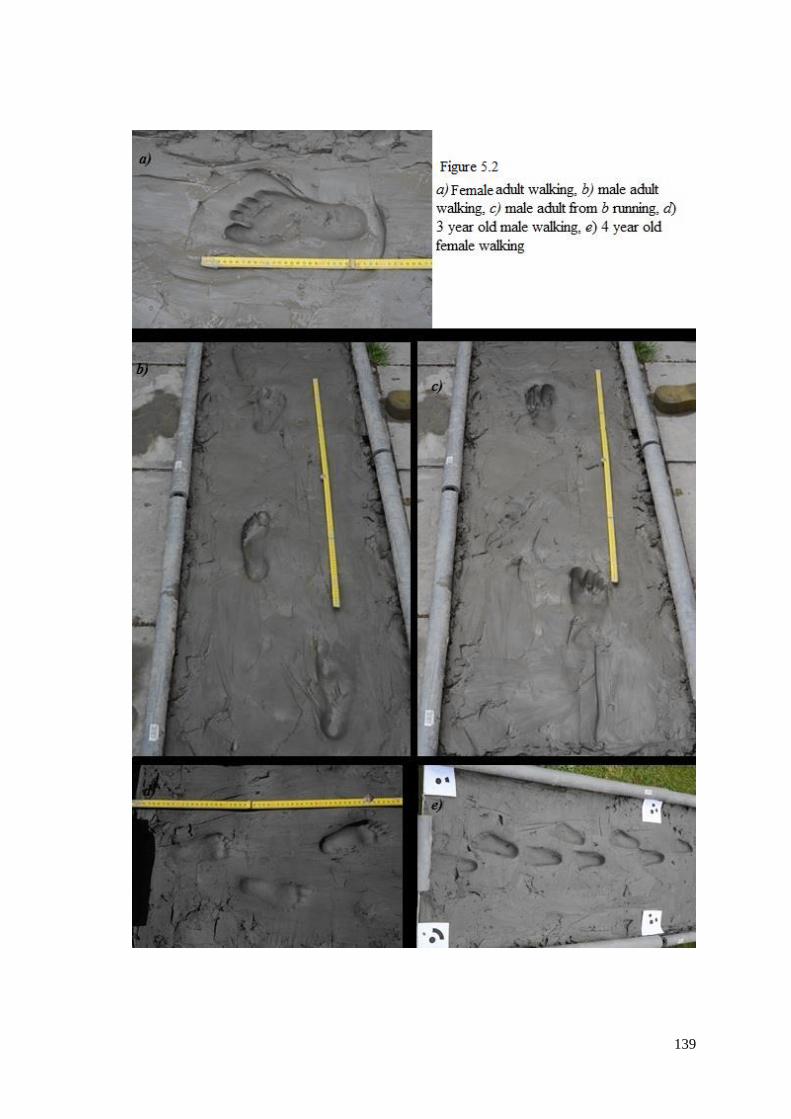
139
140
Measurements of length were taken from the end of the hallux to the most posterior part of the
heel (pterion), passing through the medial longitudinal arch (Chapter 4, Figure 4.5). Width of
the footprint was measured from the widest point, at the ball of the foot.
The stride and pace of an individual’s footprint trail were also recorded to attempt to understand
gait (Chapter 4, Figure 4.6). Pace was recorded between the top of the hallux of each footprint,
e.g. left hallux to right hallux to left hallux. The stride was recorded from the end of the hallux
of the left foot to the following left hallux, the same was repeated for the right foot.
The footprint measurements were recorded by the author, who then measured a second time to
ensure a correct measurement. This eliminated incorrect measurements, where multiple
individuals may have been measuring slightly different points of the foot, leading to
discrepancies within the data.
The results were then analysed in Microsoft Excel and in Statistical Package for the Social
Sciences software (SPSS), where linear regression equations were established. The results of
this data will be presented below to establish whether footprints made in a clayey silt sediment,
rather than ink tracing, can provide any evidence of the relationship between a person’s
footprint and their age, sex, height and weight.
5.3 Results
A key aim of this study was to establish if it was possible to identify footprints that have been
made by individuals of different sexes. Table 5.1 shows the ranges of footprint sizes for males
and females, both adult and children, as well as the mean value and standard deviation of
population. Figure 5.3 shows a box plot for graphical representation of the ranges within the
data of Table 5.1. The box plot demonstrates that within this dataset males were on average
taller than females. There were two obvious exceptions to this, two male individuals who both
had a stature of 155.4cm, volunteer 108 and volunteer 137. These individuals were both White
British males, volunteer 108 was 47 years old, 61.4kg and with UK size 10 feet, volunteer 137
was 43, 109kg and with UK size 8 feet. These individuals were both short men, being 20cm
shorter than the average British male height of 175.3cm (Office for National Statistics 2010)
even in comparison to the women within this study, the shortest woman being only 4cm shorter,
and 6cm shorter than the average height of British women (Office for National Statistics 2010).
In both cases the foot sizes of the shortest males were still larger than the tallest woman’s shoe
size, wearing a UK size 7.
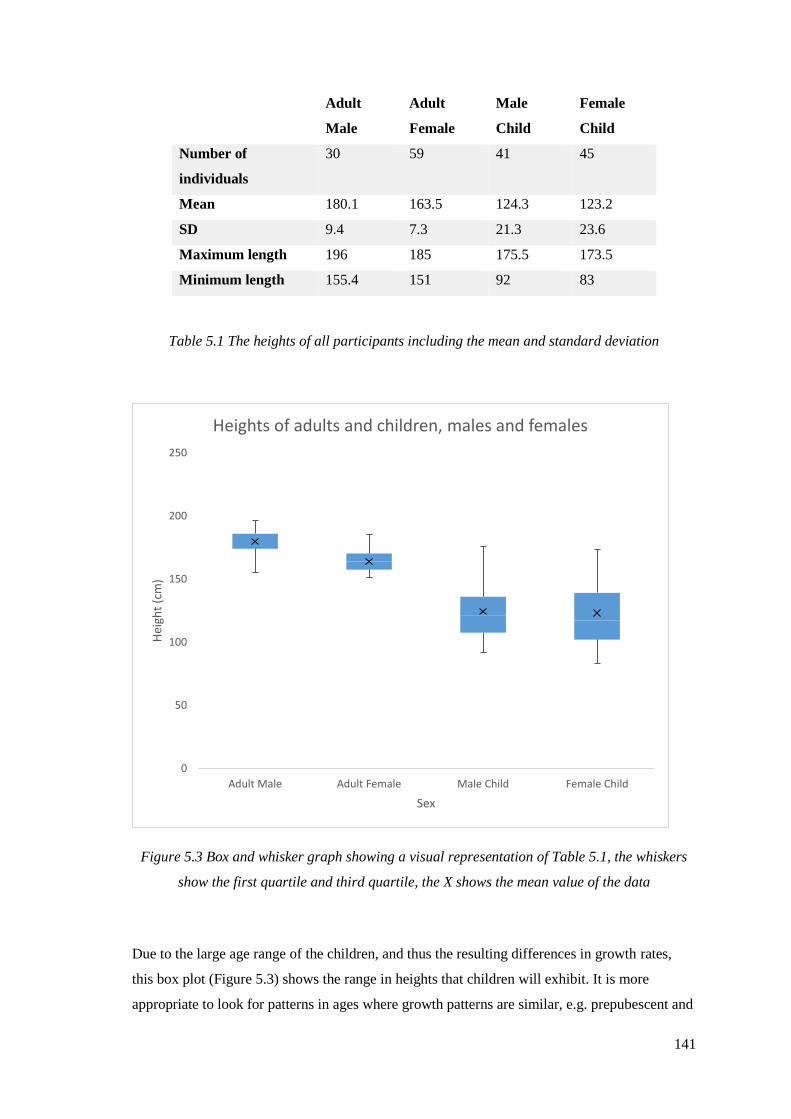
141
Adult
Male
Adult
Female
Male
Child
Female
Child
Number of
individuals
30 59 41 45
Mean 180.1 163.5 124.3 123.2
SD 9.4 7.3 21.3 23.6
Maximum length 196 185 175.5 173.5
Minimum length 155.4 151 92 83
Table 5.1 The heights of all participants including the mean and standard deviation
Figure 5.3 Box and whisker graph showing a visual representation of Table 5.1, the whiskers
show the first quartile and third quartile, the X shows the mean value of the data
Due to the large age range of the children, and thus the resulting differences in growth rates,
this box plot (Figure 5.3) shows the range in heights that children will exhibit. It is more
appropriate to look for patterns in ages where growth patterns are similar, e.g. prepubescent and
0
50
100
150
200
250
Adult Male Adult Female Male Child Female Child
Hei
ght
(cm
)
Sex
Heights of adults and children, males and females
142
pubescent, rather than attempting to group all children together. An adolescent may be similar
in height to an adult, a three-year-old will not be.
5.3.1 Relationship between heights and weights
Homo sapiens are less sexually dimorphic than other members of the ape family (Frayer and
Wolpoff 1985). Generally, males are taller and heavier than females, though there is often a
sizable overlap between males and females, as demonstrated in Figure 5.4. The shortest female
was Volunteer 158, a White English individual who was 151cm tall and 40 years old. The
tallest female, Volunteer 2, was also White English and was 19 years old and 185 cm tall.
Volunteer 137 was the shortest male in this experiment, a 47-year-old White English male who
was 155.4cm tall. Volunteer 6 was the tallest male, 20 years old, White English and measuring
196cm tall. The range in height for male and female is therefore problematic. Weight also
seems to have no clear pattern in relation to height, though women are heavier for their height
than men. 37 (63%) of the adult females in this experiment had given birth in the past, this may
have affected the weights of these individuals due to the stresses on the body caused by
pregnancy. British women are advised to gain an extra 15-25% of their current body weight
during pregnancy, women from the Sub-Saharan African Maasai tribe gain around 11% extra
weight during pregnancy (Brady et al. 2008). When walking or resting the metabolic cost is the
same among Hazda hunter-gatherers and western groups, meaning they will burn calories at the
same rate, it is therefore the lifestyle (such as diet and exercise) of the individual which will
cause the postpartum weight loss (Pontzer et al. 2012). Breastfeeding may also influence
postpartum weight loss. A study by Rooney and Schauberger (2002) observed the weight of 540
women throughout pregnancy and six months postpartum and found that women who had
breastfed exclusively for at least 3 months had a lower body mass index than those who did not
breastfeed. The women who breastfed also had a lower body mass index when re-examined 10
years later, which suggests that the initial postpartum weight loss is important for overall health
and changes to the body. In a society where females breastfeed for a limited time, or where
babies are bottle fed, the mothers may therefore struggle with losing the weight gained
throughout pregnancy. In Britain, for instance, only 17% of mothers exclusively breastfeed for
three months, by six months postpartum only 1% of mothers exclusively breastfeed (NHS
Digital 2010), in contrast the !Kung of the Kalahari desert tribe breastfeed their babies until four
or even five years old (Konner 1977), meaning the tribal women are more likely to have lower
body mass indexes after pregnancy.
The population mean height of a female in this experiment was 164.4cm and population mean
weight was 69.9kg. Female weights ranged between 47.4 kg and 107.3kg. The population
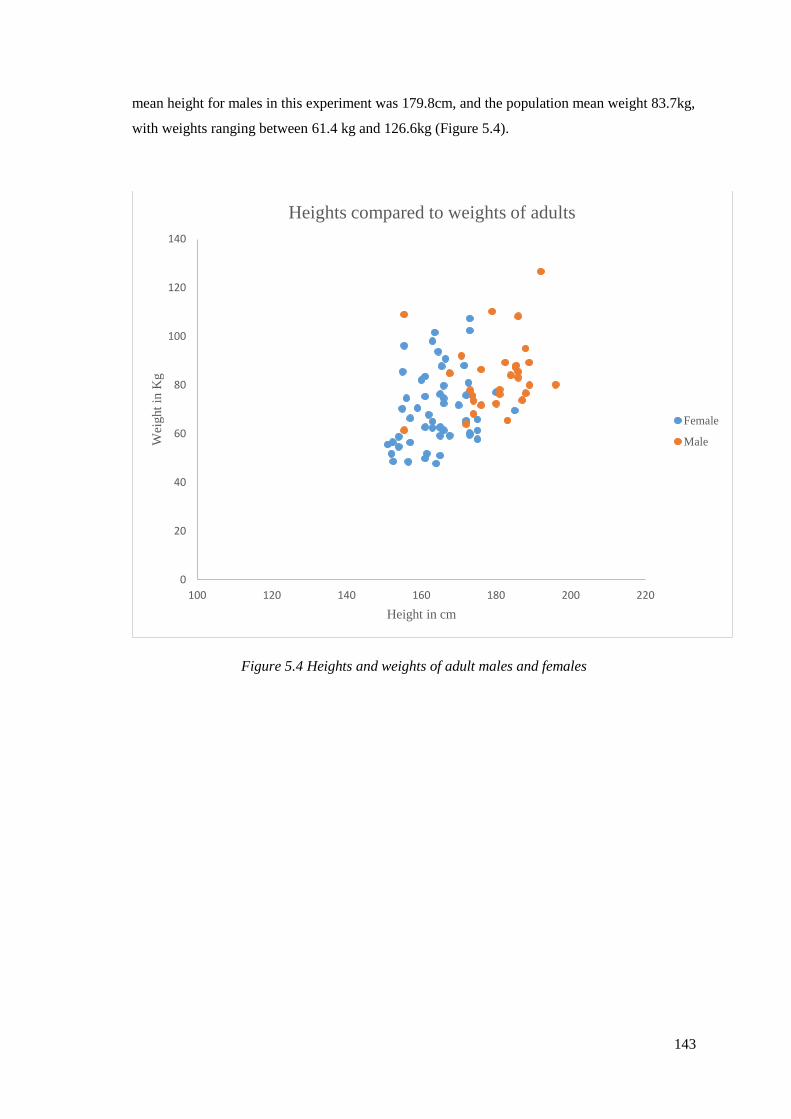
143
mean height for males in this experiment was 179.8cm, and the population mean weight 83.7kg,
with weights ranging between 61.4 kg and 126.6kg (Figure 5.4).
Figure 5.4 Heights and weights of adult males and females
0
20
40
60
80
100
120
140
100 120 140 160 180 200 220
Wei
ght
in K
g
Height in cm
Heights compared to weights of adults
Female
Male
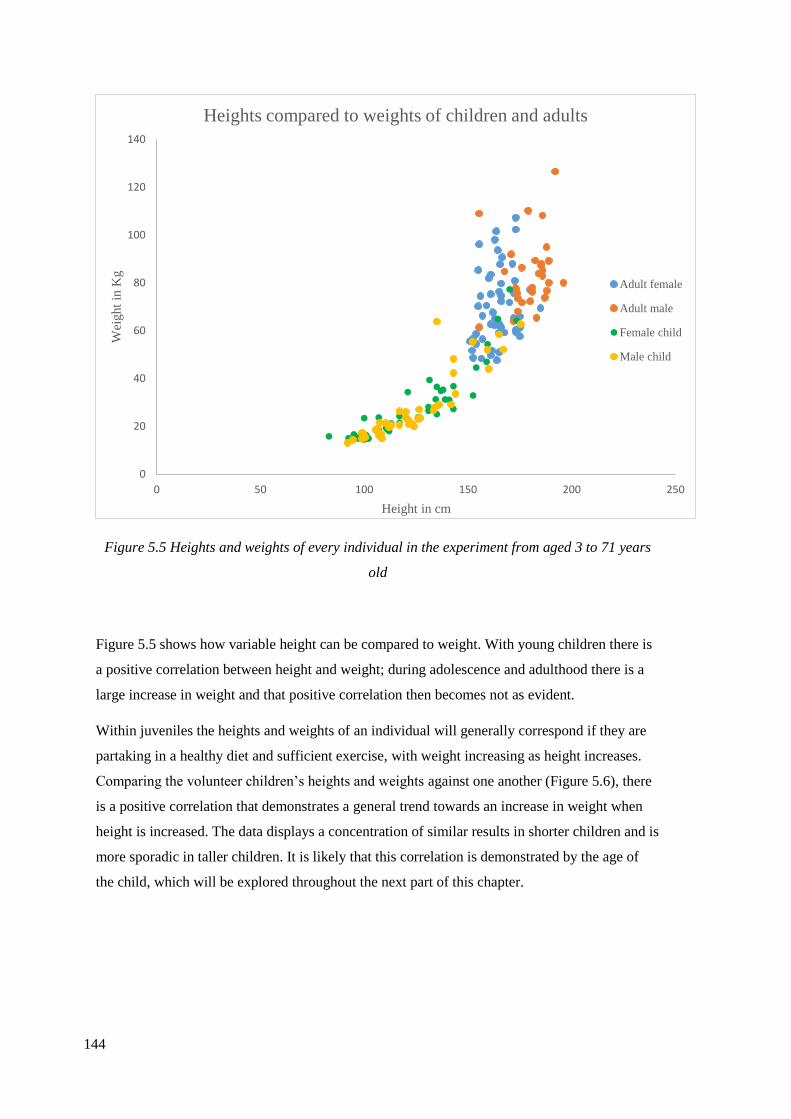
144
Figure 5.5 Heights and weights of every individual in the experiment from aged 3 to 71 years
old
Figure 5.5 shows how variable height can be compared to weight. With young children there is
a positive correlation between height and weight; during adolescence and adulthood there is a
large increase in weight and that positive correlation then becomes not as evident.
Within juveniles the heights and weights of an individual will generally correspond if they are
partaking in a healthy diet and sufficient exercise, with weight increasing as height increases.
Comparing the volunteer children’s heights and weights against one another (Figure 5.6), there
is a positive correlation that demonstrates a general trend towards an increase in weight when
height is increased. The data displays a concentration of similar results in shorter children and is
more sporadic in taller children. It is likely that this correlation is demonstrated by the age of
the child, which will be explored throughout the next part of this chapter.
0
20
40
60
80
100
120
140
0 50 100 150 200 250
Wei
ght
in K
g
Height in cm
Heights compared to weights of children and adults
Adult female
Adult male
Female child
Male child
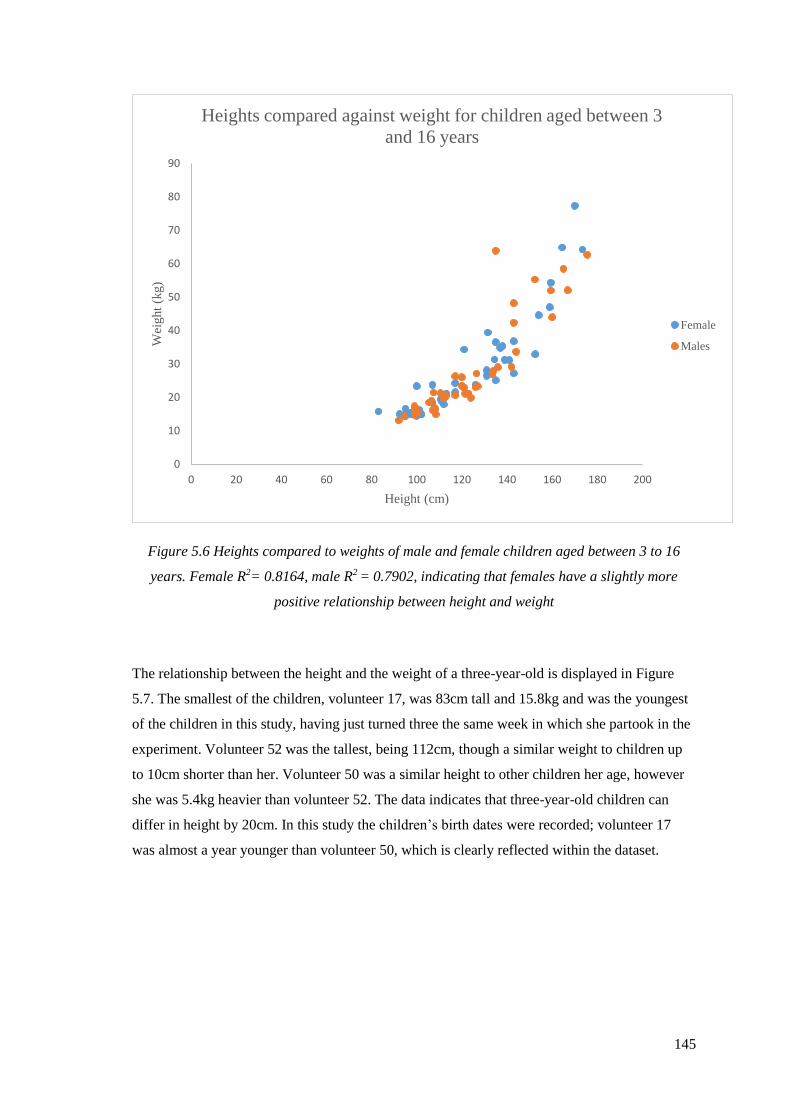
145
Figure 5.6 Heights compared to weights of male and female children aged between 3 to 16
years. Female R2= 0.8164, male R2 = 0.7902, indicating that females have a slightly more
positive relationship between height and weight
The relationship between the height and the weight of a three-year-old is displayed in Figure
5.7. The smallest of the children, volunteer 17, was 83cm tall and 15.8kg and was the youngest
of the children in this study, having just turned three the same week in which she partook in the
experiment. Volunteer 52 was the tallest, being 112cm, though a similar weight to children up
to 10cm shorter than her. Volunteer 50 was a similar height to other children her age, however
she was 5.4kg heavier than volunteer 52. The data indicates that three-year-old children can
differ in height by 20cm. In this study the children’s birth dates were recorded; volunteer 17
was almost a year younger than volunteer 50, which is clearly reflected within the dataset.
0
10
20
30
40
50
60
70
80
90
0 20 40 60 80 100 120 140 160 180 200
Wei
ght
(kg)
Height (cm)
Heights compared against weight for children aged between 3
and 16 years
Female
Males
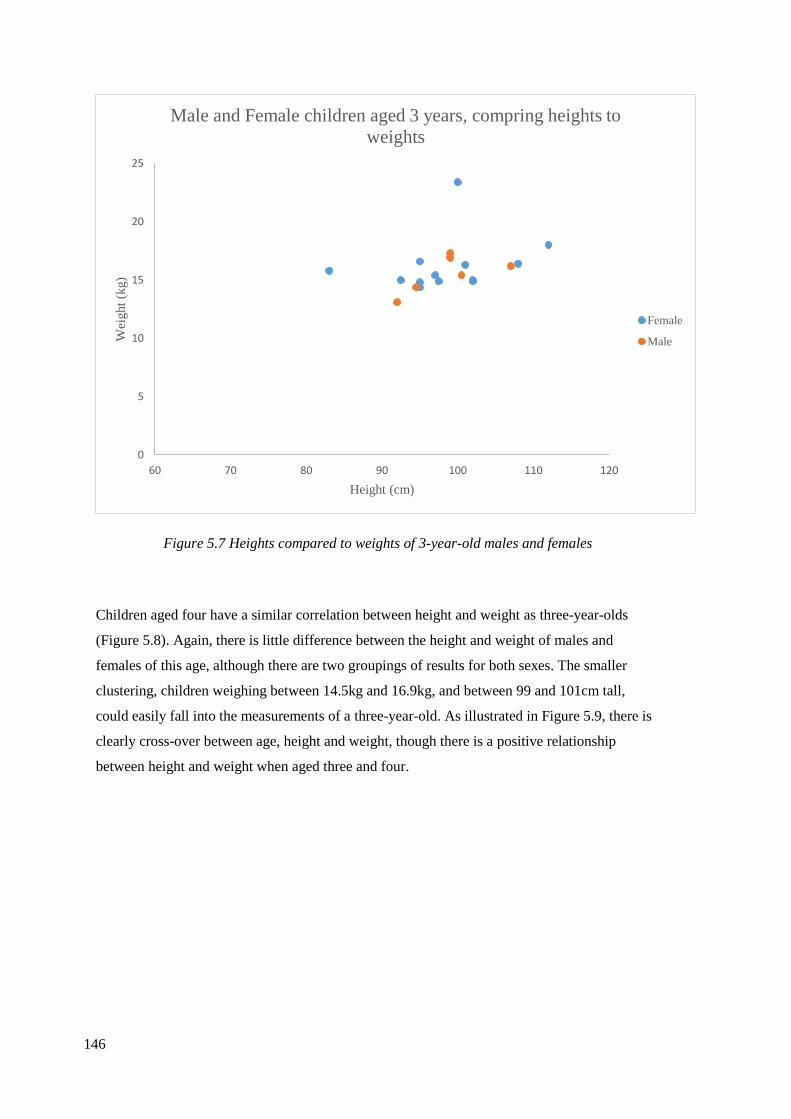
146
Figure 5.7 Heights compared to weights of 3-year-old males and females
Children aged four have a similar correlation between height and weight as three-year-olds
(Figure 5.8). Again, there is little difference between the height and weight of males and
females of this age, although there are two groupings of results for both sexes. The smaller
clustering, children weighing between 14.5kg and 16.9kg, and between 99 and 101cm tall,
could easily fall into the measurements of a three-year-old. As illustrated in Figure 5.9, there is
clearly cross-over between age, height and weight, though there is a positive relationship
between height and weight when aged three and four.
0
5
10
15
20
25
60 70 80 90 100 110 120
Wei
ght
(kg)
Height (cm)
Male and Female children aged 3 years, compring heights to
weights
Female
Male
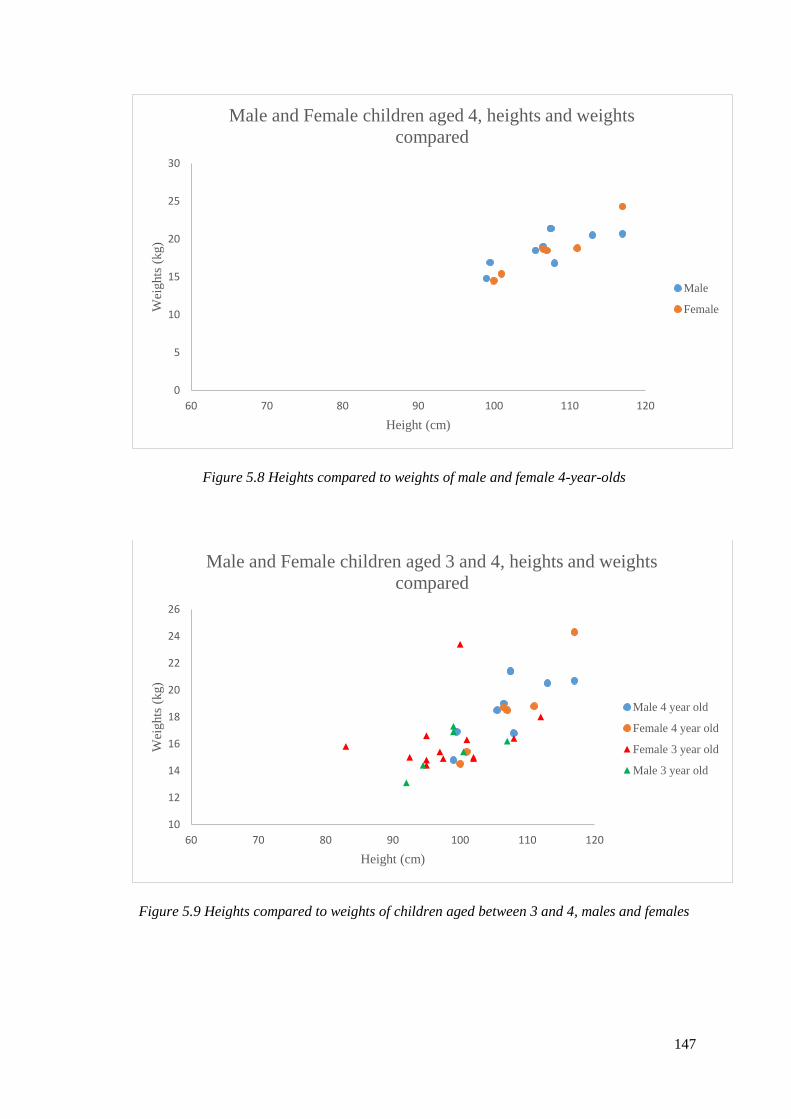
147
Figure 5.8 Heights compared to weights of male and female 4-year-olds
Figure 5.9 Heights compared to weights of children aged between 3 and 4, males and females
0
5
10
15
20
25
30
60 70 80 90 100 110 120
Wei
ghts
(kg)
Height (cm)
Male and Female children aged 4, heights and weights
compared
Male
Female
10
12
14
16
18
20
22
24
26
60 70 80 90 100 110 120
Wei
ghts
(kg)
Height (cm)
Male and Female children aged 3 and 4, heights and weights
compared
Male 4 year old
Female 4 year old
Female 3 year old
Male 3 year old
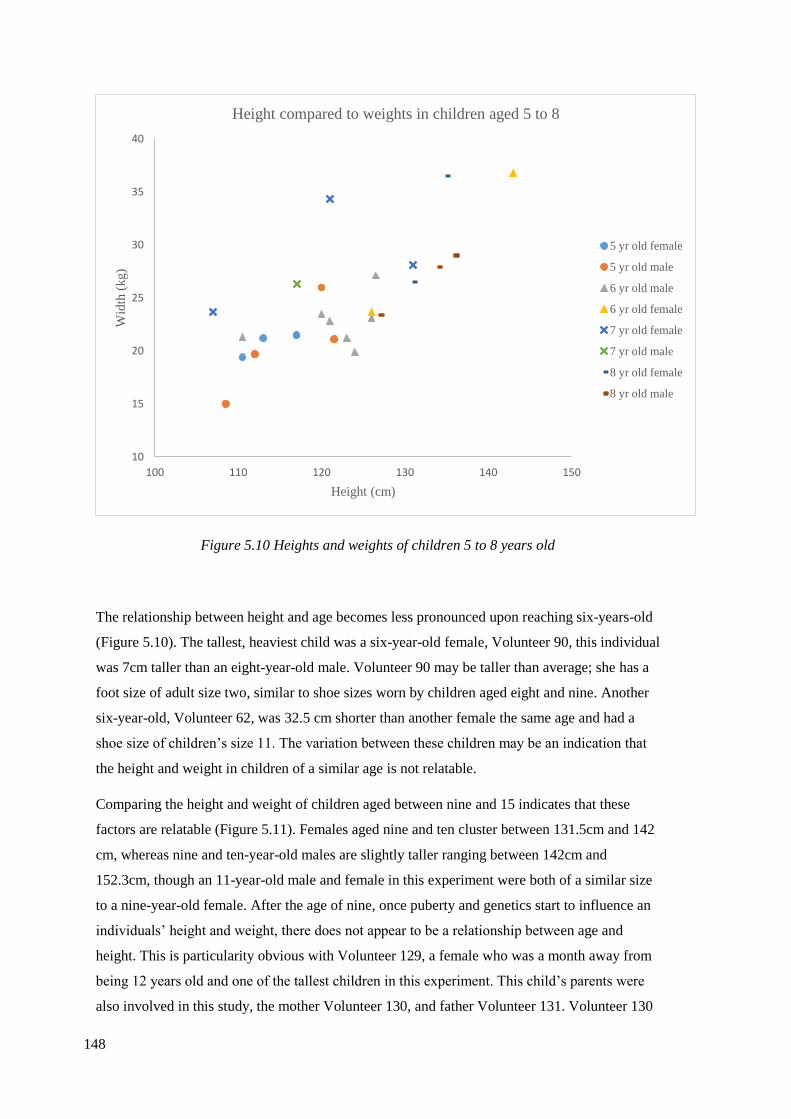
148
Figure 5.10 Heights and weights of children 5 to 8 years old
The relationship between height and age becomes less pronounced upon reaching six-years-old
(Figure 5.10). The tallest, heaviest child was a six-year-old female, Volunteer 90, this individual
was 7cm taller than an eight-year-old male. Volunteer 90 may be taller than average; she has a
foot size of adult size two, similar to shoe sizes worn by children aged eight and nine. Another
six-year-old, Volunteer 62, was 32.5 cm shorter than another female the same age and had a
shoe size of children’s size 11. The variation between these children may be an indication that
the height and weight in children of a similar age is not relatable.
Comparing the height and weight of children aged between nine and 15 indicates that these
factors are relatable (Figure 5.11). Females aged nine and ten cluster between 131.5cm and 142
cm, whereas nine and ten-year-old males are slightly taller ranging between 142cm and
152.3cm, though an 11-year-old male and female in this experiment were both of a similar size
to a nine-year-old female. After the age of nine, once puberty and genetics start to influence an
individuals’ height and weight, there does not appear to be a relationship between age and
height. This is particularity obvious with Volunteer 129, a female who was a month away from
being 12 years old and one of the tallest children in this experiment. This child’s parents were
also involved in this study, the mother Volunteer 130, and father Volunteer 131. Volunteer 130
10
15
20
25
30
35
40
100 110 120 130 140 150
Wid
th (
kg)
Height (cm)
Height compared to weights in children aged 5 to 8
5 yr old female
5 yr old male
6 yr old male
6 yr old female
7 yr old female
7 yr old male
8 yr old female
8 yr old male
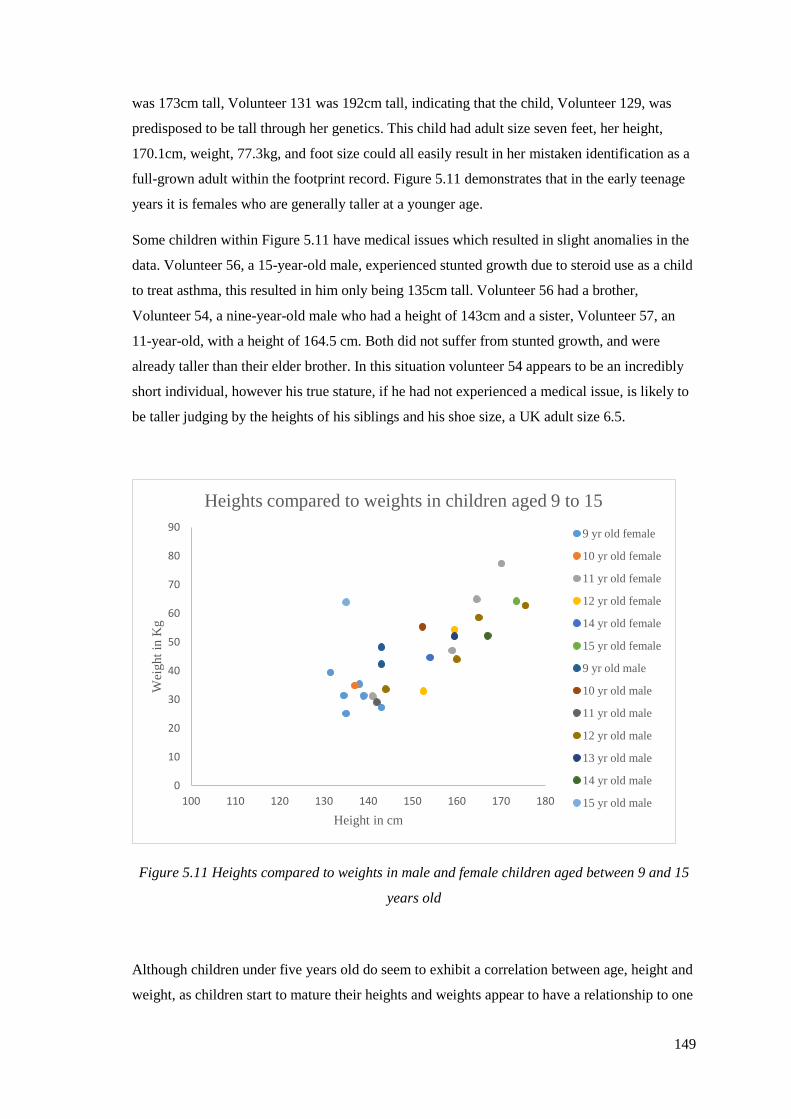
149
was 173cm tall, Volunteer 131 was 192cm tall, indicating that the child, Volunteer 129, was
predisposed to be tall through her genetics. This child had adult size seven feet, her height,
170.1cm, weight, 77.3kg, and foot size could all easily result in her mistaken identification as a
full-grown adult within the footprint record. Figure 5.11 demonstrates that in the early teenage
years it is females who are generally taller at a younger age.
Some children within Figure 5.11 have medical issues which resulted in slight anomalies in the
data. Volunteer 56, a 15-year-old male, experienced stunted growth due to steroid use as a child
to treat asthma, this resulted in him only being 135cm tall. Volunteer 56 had a brother,
Volunteer 54, a nine-year-old male who had a height of 143cm and a sister, Volunteer 57, an
11-year-old, with a height of 164.5 cm. Both did not suffer from stunted growth, and were
already taller than their elder brother. In this situation volunteer 54 appears to be an incredibly
short individual, however his true stature, if he had not experienced a medical issue, is likely to
be taller judging by the heights of his siblings and his shoe size, a UK adult size 6.5.
Figure 5.11 Heights compared to weights in male and female children aged between 9 and 15
years old
Although children under five years old do seem to exhibit a correlation between age, height and
weight, as children start to mature their heights and weights appear to have a relationship to one
0
10
20
30
40
50
60
70
80
90
100 110 120 130 140 150 160 170 180
Wei
ght
in K
g
Height in cm
Heights compared to weights in children aged 9 to 15
9 yr old female
10 yr old female
11 yr old female
12 yr old female
14 yr old female
15 yr old female
9 yr old male
10 yr old male
11 yr old male
12 yr old male
13 yr old male
14 yr old male
15 yr old male
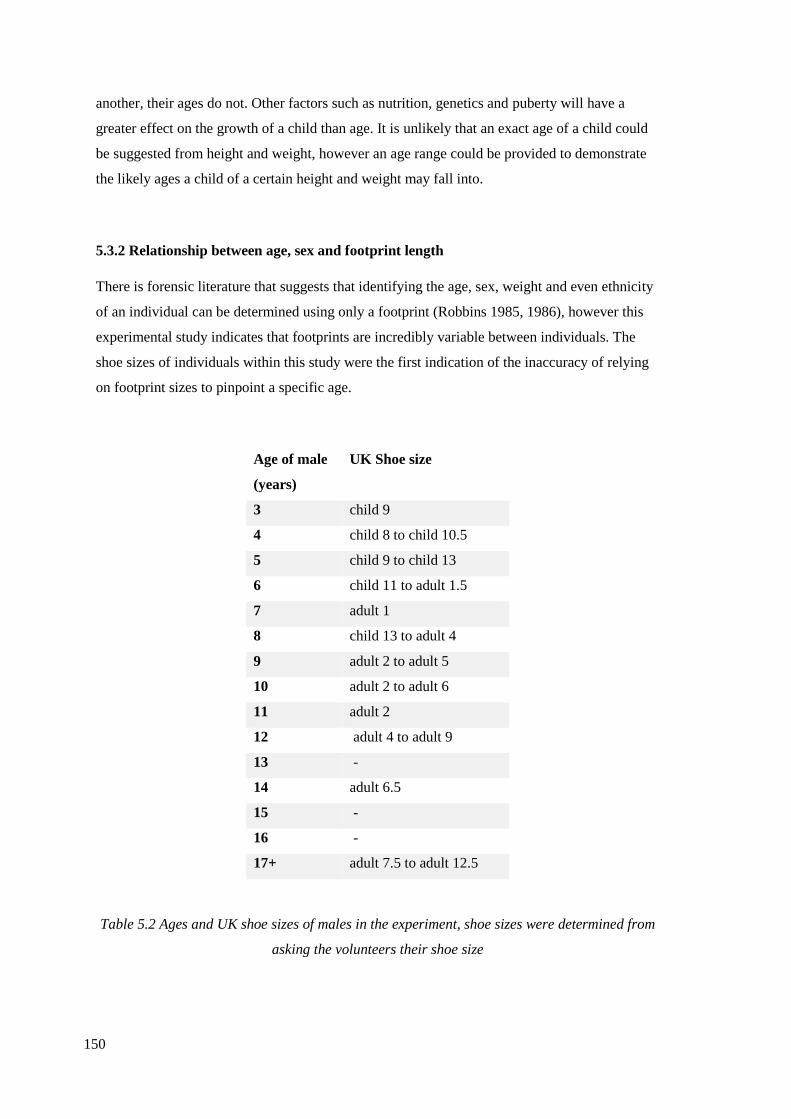
150
another, their ages do not. Other factors such as nutrition, genetics and puberty will have a
greater effect on the growth of a child than age. It is unlikely that an exact age of a child could
be suggested from height and weight, however an age range could be provided to demonstrate
the likely ages a child of a certain height and weight may fall into.
5.3.2 Relationship between age, sex and footprint length
There is forensic literature that suggests that identifying the age, sex, weight and even ethnicity
of an individual can be determined using only a footprint (Robbins 1985, 1986), however this
experimental study indicates that footprints are incredibly variable between individuals. The
shoe sizes of individuals within this study were the first indication of the inaccuracy of relying
on footprint sizes to pinpoint a specific age.
Age of male
(years)
UK Shoe size
3 child 9
4 child 8 to child 10.5
5 child 9 to child 13
6 child 11 to adult 1.5
7 adult 1
8 child 13 to adult 4
9 adult 2 to adult 5
10 adult 2 to adult 6
11 adult 2
12 adult 4 to adult 9
13 -
14 adult 6.5
15 -
16 -
17+ adult 7.5 to adult 12.5
Table 5.2 Ages and UK shoe sizes of males in the experiment, shoe sizes were determined from
asking the volunteers their shoe size
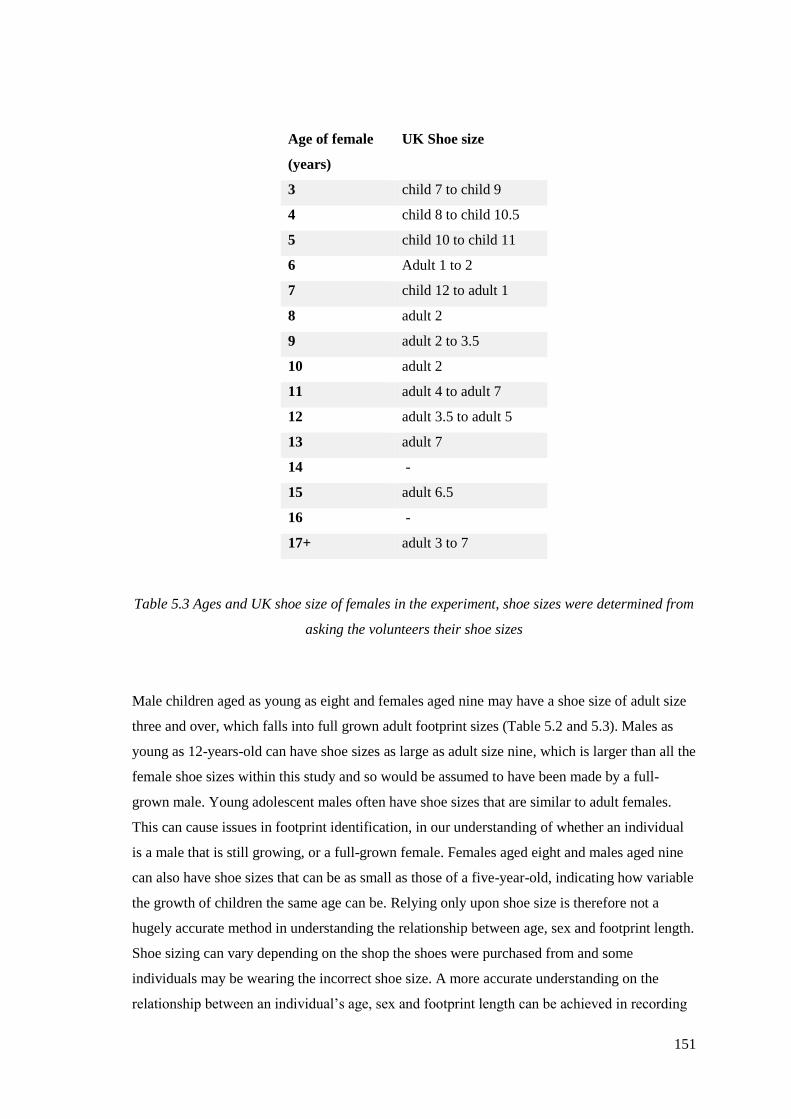
151
Age of female
(years)
UK Shoe size
3 child 7 to child 9
4 child 8 to child 10.5
5 child 10 to child 11
6 Adult 1 to 2
7 child 12 to adult 1
8 adult 2
9 adult 2 to 3.5
10 adult 2
11 adult 4 to adult 7
12 adult 3.5 to adult 5
13 adult 7
14 -
15 adult 6.5
16 -
17+ adult 3 to 7
Table 5.3 Ages and UK shoe size of females in the experiment, shoe sizes were determined from
asking the volunteers their shoe sizes
Male children aged as young as eight and females aged nine may have a shoe size of adult size
three and over, which falls into full grown adult footprint sizes (Table 5.2 and 5.3). Males as
young as 12-years-old can have shoe sizes as large as adult size nine, which is larger than all the
female shoe sizes within this study and so would be assumed to have been made by a full-
grown male. Young adolescent males often have shoe sizes that are similar to adult females.
This can cause issues in footprint identification, in our understanding of whether an individual
is a male that is still growing, or a full-grown female. Females aged eight and males aged nine
can also have shoe sizes that can be as small as those of a five-year-old, indicating how variable
the growth of children the same age can be. Relying only upon shoe size is therefore not a
hugely accurate method in understanding the relationship between age, sex and footprint length.
Shoe sizing can vary depending on the shop the shoes were purchased from and some
individuals may be wearing the incorrect shoe size. A more accurate understanding on the
relationship between an individual’s age, sex and footprint length can be achieved in recording
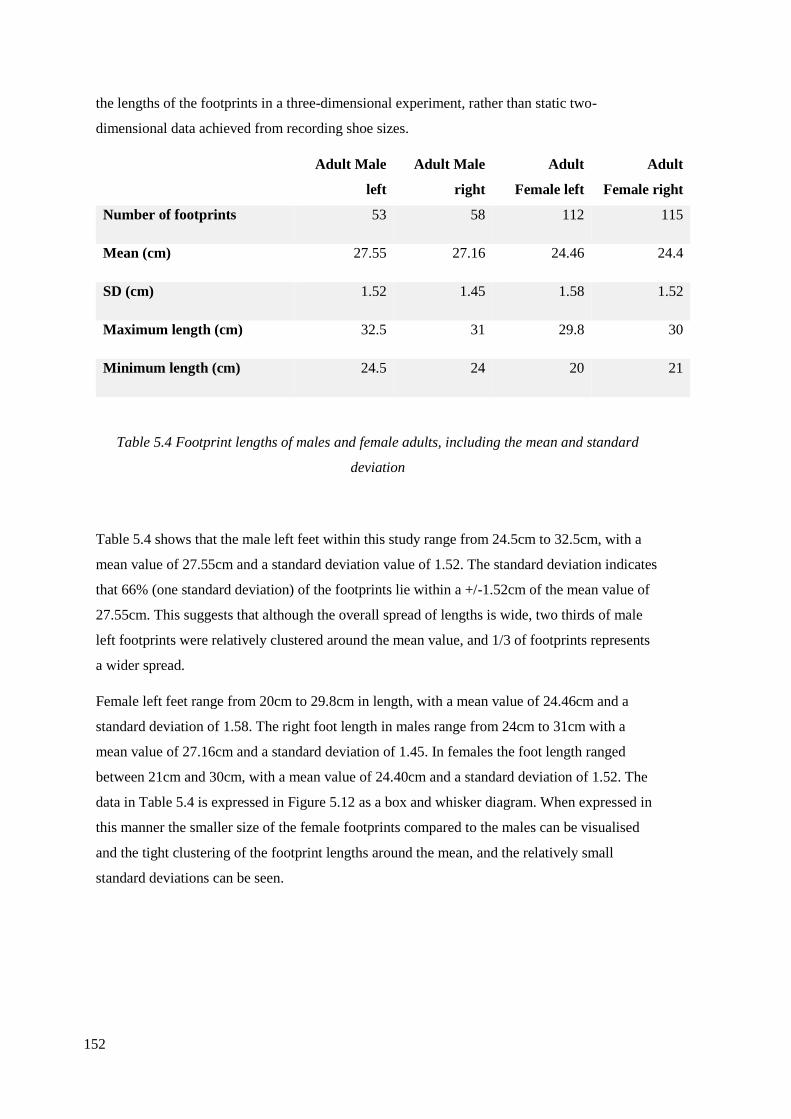
152
the lengths of the footprints in a three-dimensional experiment, rather than static two-
dimensional data achieved from recording shoe sizes.
Adult Male
left
Adult Male
right
Adult
Female left
Adult
Female right
Number of footprints 53 58 112 115
Mean (cm) 27.55 27.16 24.46 24.4
SD (cm) 1.52 1.45 1.58 1.52
Maximum length (cm) 32.5 31 29.8 30
Minimum length (cm) 24.5 24 20 21
Table 5.4 Footprint lengths of males and female adults, including the mean and standard
deviation
Table 5.4 shows that the male left feet within this study range from 24.5cm to 32.5cm, with a
mean value of 27.55cm and a standard deviation value of 1.52. The standard deviation indicates
that 66% (one standard deviation) of the footprints lie within a +/-1.52cm of the mean value of
27.55cm. This suggests that although the overall spread of lengths is wide, two thirds of male
left footprints were relatively clustered around the mean value, and 1/3 of footprints represents
a wider spread.
Female left feet range from 20cm to 29.8cm in length, with a mean value of 24.46cm and a
standard deviation of 1.58. The right foot length in males range from 24cm to 31cm with a
mean value of 27.16cm and a standard deviation of 1.45. In females the foot length ranged
between 21cm and 30cm, with a mean value of 24.40cm and a standard deviation of 1.52. The
data in Table 5.4 is expressed in Figure 5.12 as a box and whisker diagram. When expressed in
this manner the smaller size of the female footprints compared to the males can be visualised
and the tight clustering of the footprint lengths around the mean, and the relatively small
standard deviations can be seen.
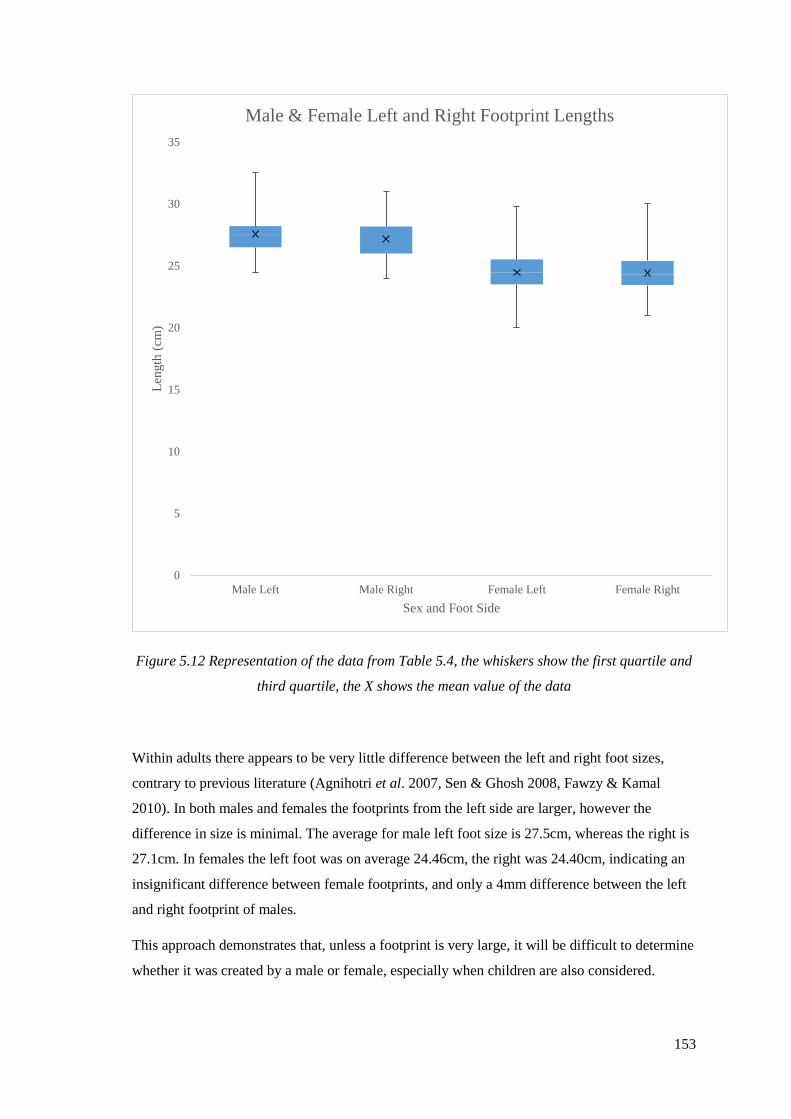
153
Figure 5.12 Representation of the data from Table 5.4, the whiskers show the first quartile and
third quartile, the X shows the mean value of the data
Within adults there appears to be very little difference between the left and right foot sizes,
contrary to previous literature (Agnihotri et al. 2007, Sen & Ghosh 2008, Fawzy & Kamal
2010). In both males and females the footprints from the left side are larger, however the
difference in size is minimal. The average for male left foot size is 27.5cm, whereas the right is
27.1cm. In females the left foot was on average 24.46cm, the right was 24.40cm, indicating an
insignificant difference between female footprints, and only a 4mm difference between the left
and right footprint of males.
This approach demonstrates that, unless a footprint is very large, it will be difficult to determine
whether it was created by a male or female, especially when children are also considered.
0
5
10
15
20
25
30
35
Male Left Male Right Female Left Female Right
Len
gth
(cm
)
Sex and Foot Side
Male & Female Left and Right Footprint Lengths
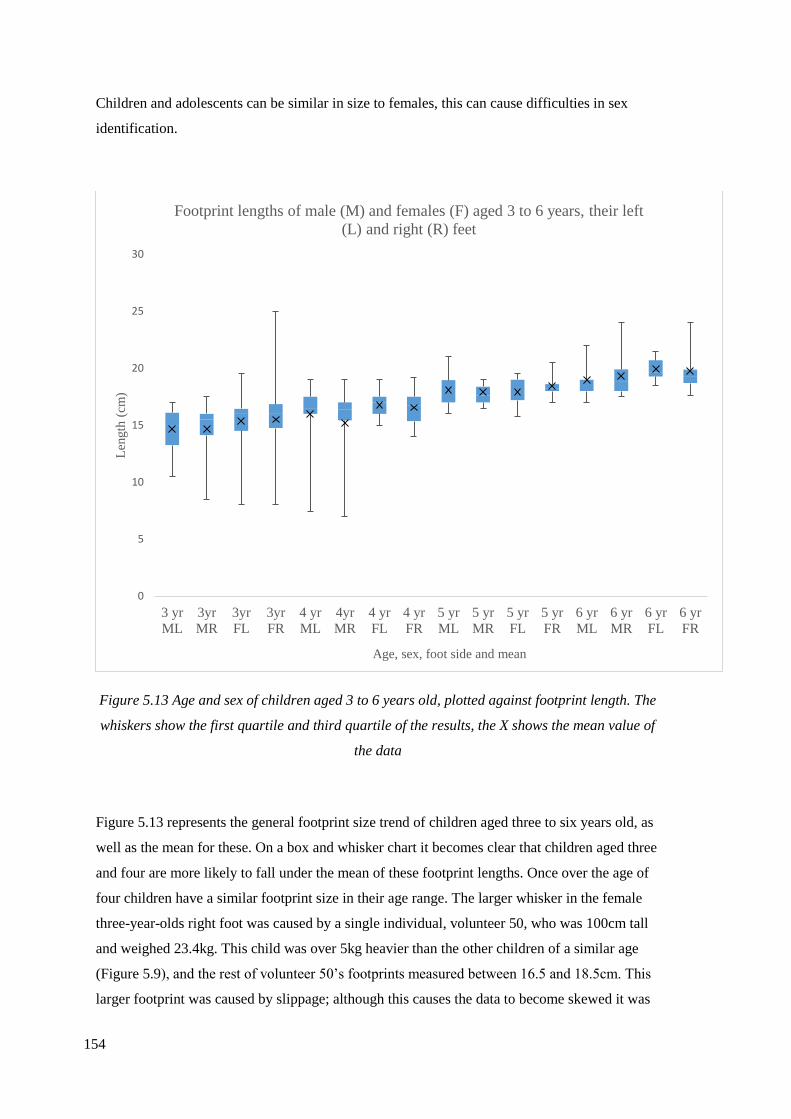
154
Children and adolescents can be similar in size to females, this can cause difficulties in sex
identification.
Figure 5.13 Age and sex of children aged 3 to 6 years old, plotted against footprint length. The
whiskers show the first quartile and third quartile of the results, the X shows the mean value of
the data
Figure 5.13 represents the general footprint size trend of children aged three to six years old, as
well as the mean for these. On a box and whisker chart it becomes clear that children aged three
and four are more likely to fall under the mean of these footprint lengths. Once over the age of
four children have a similar footprint size in their age range. The larger whisker in the female
three-year-olds right foot was caused by a single individual, volunteer 50, who was 100cm tall
and weighed 23.4kg. This child was over 5kg heavier than the other children of a similar age
(Figure 5.9), and the rest of volunteer 50’s footprints measured between 16.5 and 18.5cm. This
larger footprint was caused by slippage; although this causes the data to become skewed it was
0
5
10
15
20
25
30
3 yr
ML
3yr
MR
3yr
FL
3yr
FR
4 yr
ML
4yr
MR
4 yr
FL
4 yr
FR
5 yr
ML
5 yr
MR
5 yr
FL
5 yr
FR
6 yr
ML
6 yr
MR
6 yr
FL
6 yr
FR
Len
gth
(cm
)
Age, sex, foot side and mean
Footprint lengths of male (M) and females (F) aged 3 to 6 years, their left
(L) and right (R) feet
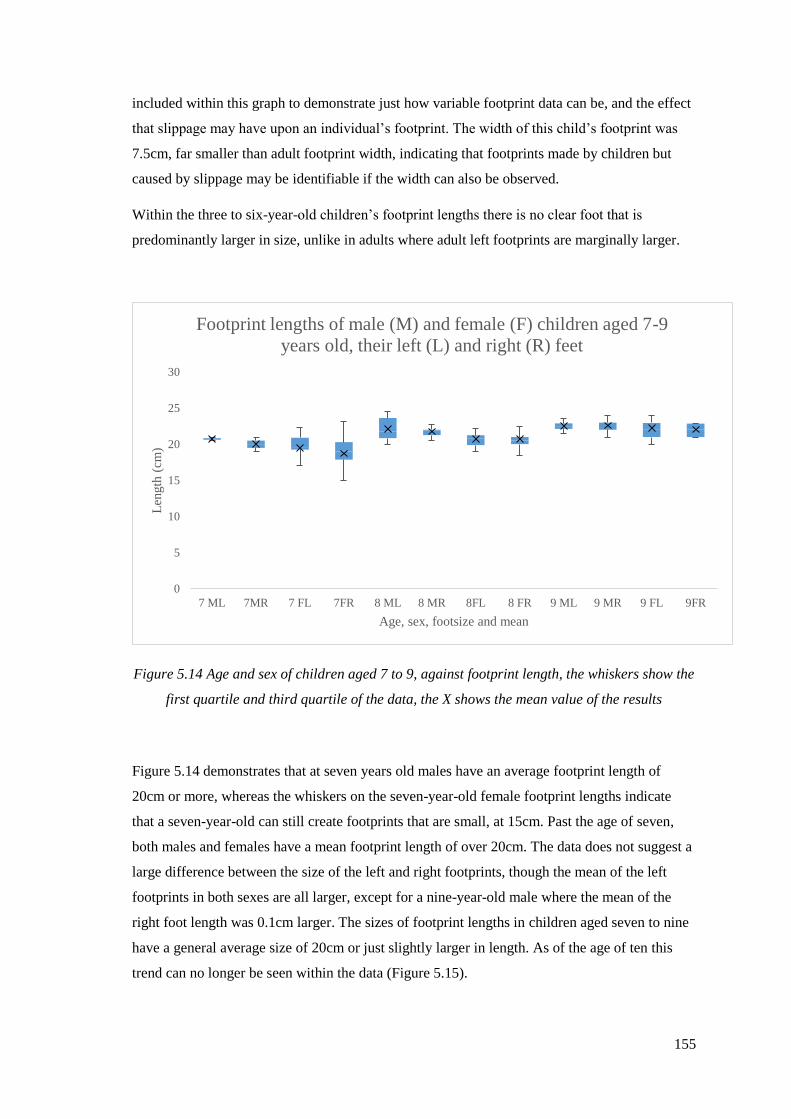
155
included within this graph to demonstrate just how variable footprint data can be, and the effect
that slippage may have upon an individual’s footprint. The width of this child’s footprint was
7.5cm, far smaller than adult footprint width, indicating that footprints made by children but
caused by slippage may be identifiable if the width can also be observed.
Within the three to six-year-old children’s footprint lengths there is no clear foot that is
predominantly larger in size, unlike in adults where adult left footprints are marginally larger.
Figure 5.14 Age and sex of children aged 7 to 9, against footprint length, the whiskers show the
first quartile and third quartile of the data, the X shows the mean value of the results
Figure 5.14 demonstrates that at seven years old males have an average footprint length of
20cm or more, whereas the whiskers on the seven-year-old female footprint lengths indicate
that a seven-year-old can still create footprints that are small, at 15cm. Past the age of seven,
both males and females have a mean footprint length of over 20cm. The data does not suggest a
large difference between the size of the left and right footprints, though the mean of the left
footprints in both sexes are all larger, except for a nine-year-old male where the mean of the
right foot length was 0.1cm larger. The sizes of footprint lengths in children aged seven to nine
have a general average size of 20cm or just slightly larger in length. As of the age of ten this
trend can no longer be seen within the data (Figure 5.15).
0
5
10
15
20
25
30
7 ML 7MR 7 FL 7FR 8 ML 8 MR 8FL 8 FR 9 ML 9 MR 9 FL 9FR
Len
gth
(cm
)
Age, sex, footsize and mean
Footprint lengths of male (M) and female (F) children aged 7-9
years old, their left (L) and right (R) feet

156
Figure 5.15 Age, sex and footprint side of children aged 10 to 12 years old, and footprint
length, the whiskers show the first quartile and third quartile, the X shows the mean value of the
data
Figure 5.16 indicates an increase in the average footprint length for both male and female
children as of the age of ten. The smallest footprint was created by a ten-year-old female and
was 19.5cm in length. This footprint was made by volunteer 169, who was 131cm in height and
28.1kg, falling within the weight and height positive correlation as seen in Figure 5.6,
suggesting a relatively standard height and weight for her age. This child had relatively small
footprints, at the largest 20.1cm in length. She wore a size one shoe which indicates that she had
relatively small feet for her age and height. This data suggests that footprints over 20cm will
have been made by an individual over the age of seven years, though there will be incidences
where children have smaller than average feet for their age, making the age of ten and below a
more accurate age estimation from footprint length. Above the age of 11 children begin to
produce footprints larger than 25cm, these dimensions are comfortably within the lengths of
many adult females. Again, there seems to be little evidence of a left or right footprint being
predominately larger.
0
5
10
15
20
25
30
10 ML 10 MR 10 FL 10 FR 11 ML 11MR 11 FL 11FR 12 ML 12 MR 12 FL 12 FR
Len
gth
(cm
)
Age, sex, footsize and mean
Footprint lengths of male (M) and female (F) children aged 10-
12 years old, their left (L) and right (R) feet
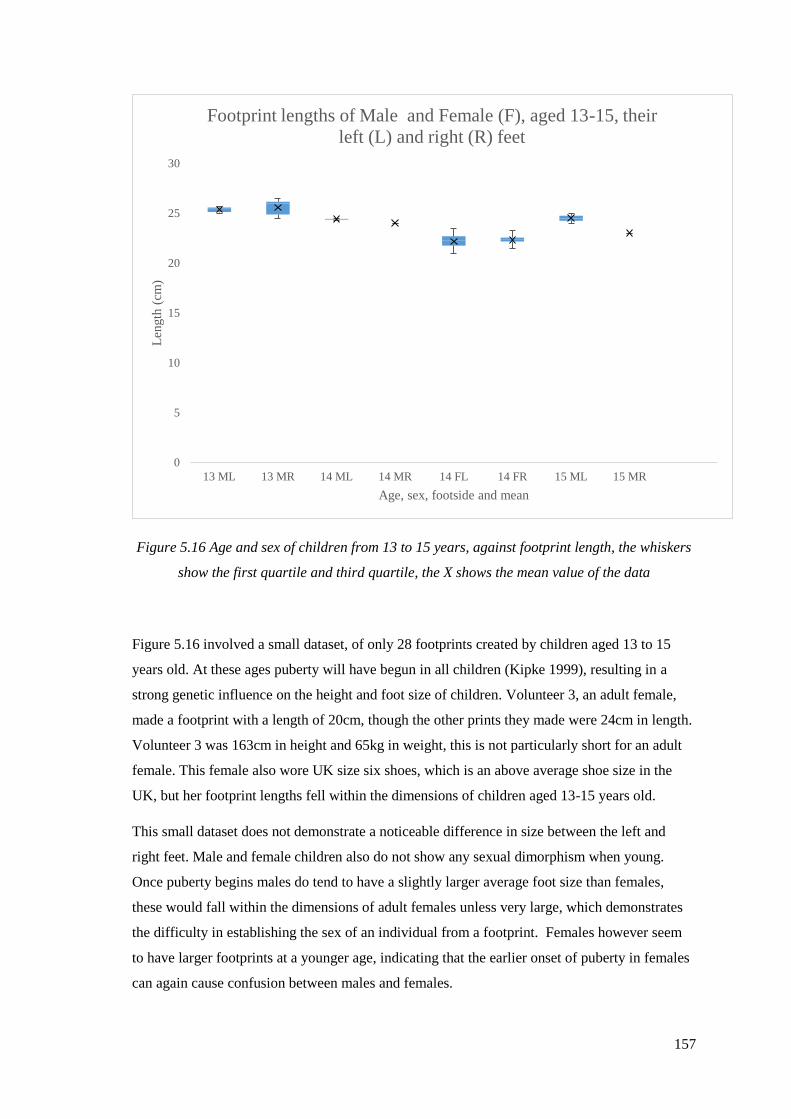
157
Figure 5.16 Age and sex of children from 13 to 15 years, against footprint length, the whiskers
show the first quartile and third quartile, the X shows the mean value of the data
Figure 5.16 involved a small dataset, of only 28 footprints created by children aged 13 to 15
years old. At these ages puberty will have begun in all children (Kipke 1999), resulting in a
strong genetic influence on the height and foot size of children. Volunteer 3, an adult female,
made a footprint with a length of 20cm, though the other prints they made were 24cm in length.
Volunteer 3 was 163cm in height and 65kg in weight, this is not particularly short for an adult
female. This female also wore UK size six shoes, which is an above average shoe size in the
UK, but her footprint lengths fell within the dimensions of children aged 13-15 years old.
This small dataset does not demonstrate a noticeable difference in size between the left and
right feet. Male and female children also do not show any sexual dimorphism when young.
Once puberty begins males do tend to have a slightly larger average foot size than females,
these would fall within the dimensions of adult females unless very large, which demonstrates
the difficulty in establishing the sex of an individual from a footprint. Females however seem
to have larger footprints at a younger age, indicating that the earlier onset of puberty in females
can again cause confusion between males and females.
0
5
10
15
20
25
30
13 ML 13 MR 14 ML 14 MR 14 FL 14 FR 15 ML 15 MR
Len
gth
(cm
)
Age, sex, footside and mean
Footprint lengths of Male and Female (F), aged 13-15, their
left (L) and right (R) feet
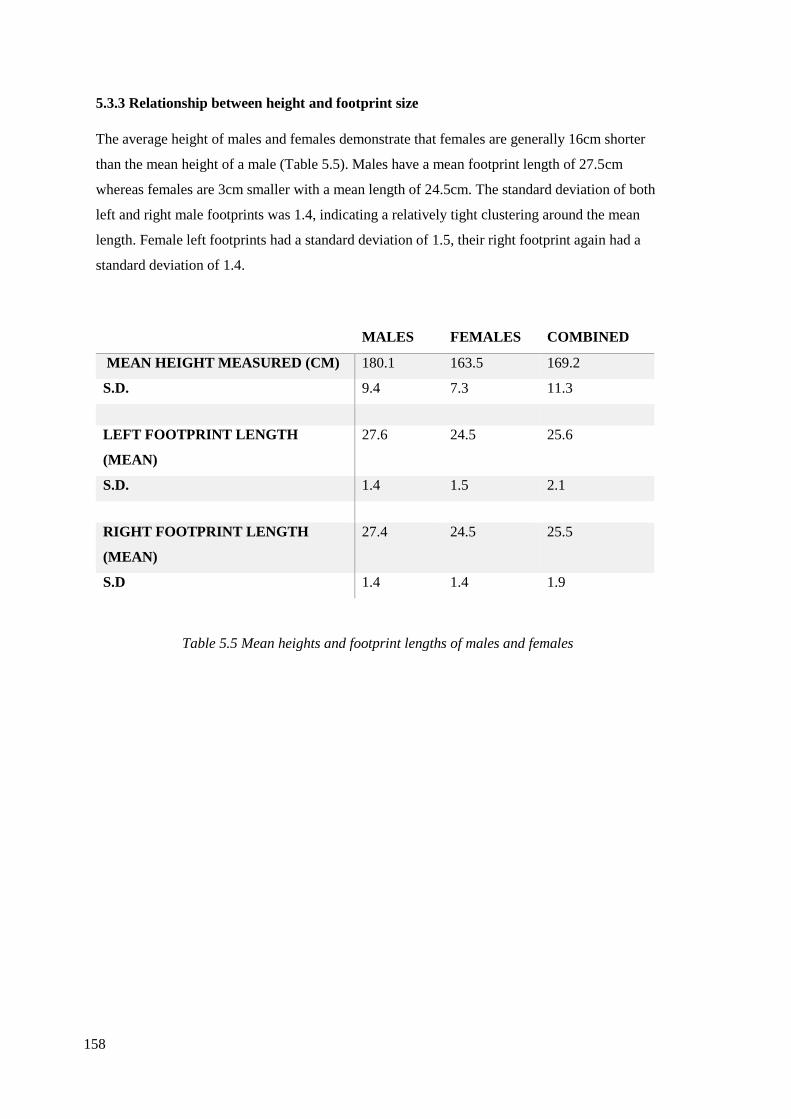
158
5.3.3 Relationship between height and footprint size
The average height of males and females demonstrate that females are generally 16cm shorter
than the mean height of a male (Table 5.5). Males have a mean footprint length of 27.5cm
whereas females are 3cm smaller with a mean length of 24.5cm. The standard deviation of both
left and right male footprints was 1.4, indicating a relatively tight clustering around the mean
length. Female left footprints had a standard deviation of 1.5, their right footprint again had a
standard deviation of 1.4.
MALES FEMALES COMBINED
MEAN HEIGHT MEASURED (CM) 180.1 163.5 169.2
S.D. 9.4 7.3 11.3
LEFT FOOTPRINT LENGTH
(MEAN)
27.6 24.5 25.6
S.D. 1.4 1.5 2.1
RIGHT FOOTPRINT LENGTH
(MEAN)
27.4 24.5 25.5
S.D 1.4 1.4 1.9
Table 5.5 Mean heights and footprint lengths of males and females
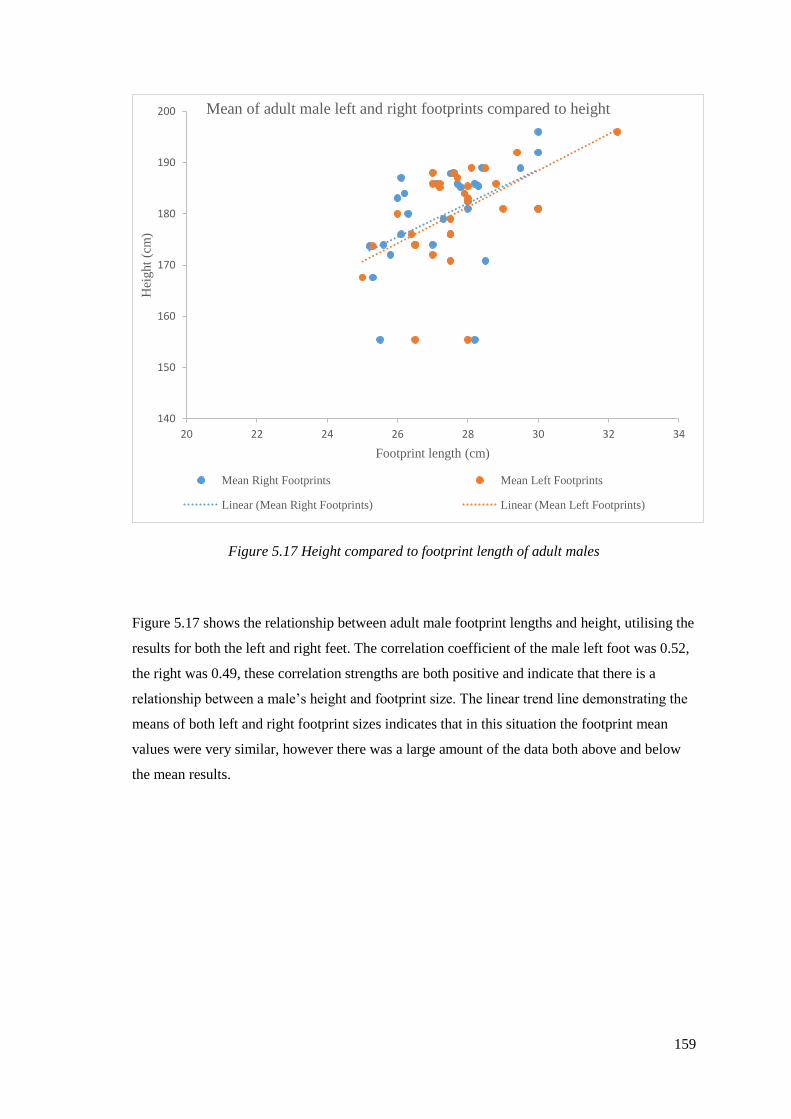
159
Figure 5.17 Height compared to footprint length of adult males
Figure 5.17 shows the relationship between adult male footprint lengths and height, utilising the
results for both the left and right feet. The correlation coefficient of the male left foot was 0.52,
the right was 0.49, these correlation strengths are both positive and indicate that there is a
relationship between a male’s height and footprint size. The linear trend line demonstrating the
means of both left and right footprint sizes indicates that in this situation the footprint mean
values were very similar, however there was a large amount of the data both above and below
the mean results.
140
150
160
170
180
190
200
20 22 24 26 28 30 32 34
Hei
ght
(cm
)
Footprint length (cm)
Mean of adult male left and right footprints compared to height
Mean Right Footprints Mean Left Footprints
Linear (Mean Right Footprints) Linear (Mean Left Footprints)
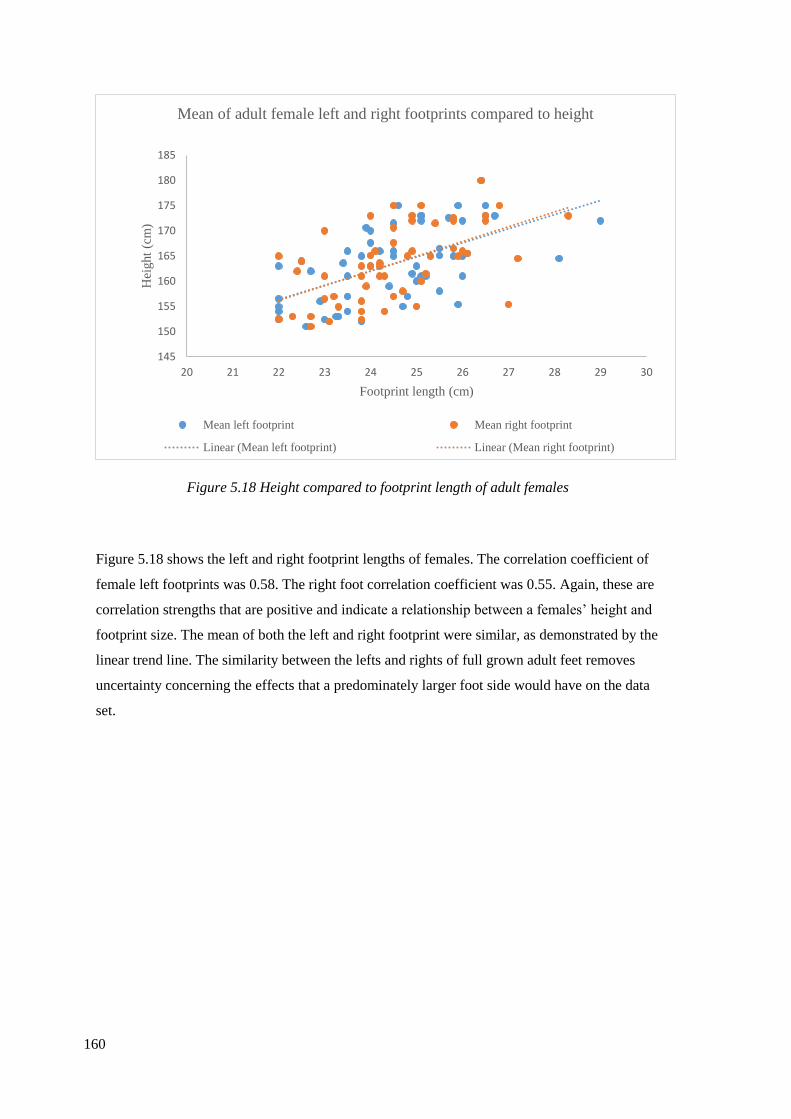
160
Figure 5.18 Height compared to footprint length of adult females
Figure 5.18 shows the left and right footprint lengths of females. The correlation coefficient of
female left footprints was 0.58. The right foot correlation coefficient was 0.55. Again, these are
correlation strengths that are positive and indicate a relationship between a females’ height and
footprint size. The mean of both the left and right footprint were similar, as demonstrated by the
linear trend line. The similarity between the lefts and rights of full grown adult feet removes
uncertainty concerning the effects that a predominately larger foot side would have on the data
set.
145
150
155
160
165
170
175
180
185
20 21 22 23 24 25 26 27 28 29 30
Hei
ght
(cm
)
Footprint length (cm)
Mean of adult female left and right footprints compared to height
Mean left footprint Mean right footprint
Linear (Mean left footprint) Linear (Mean right footprint)
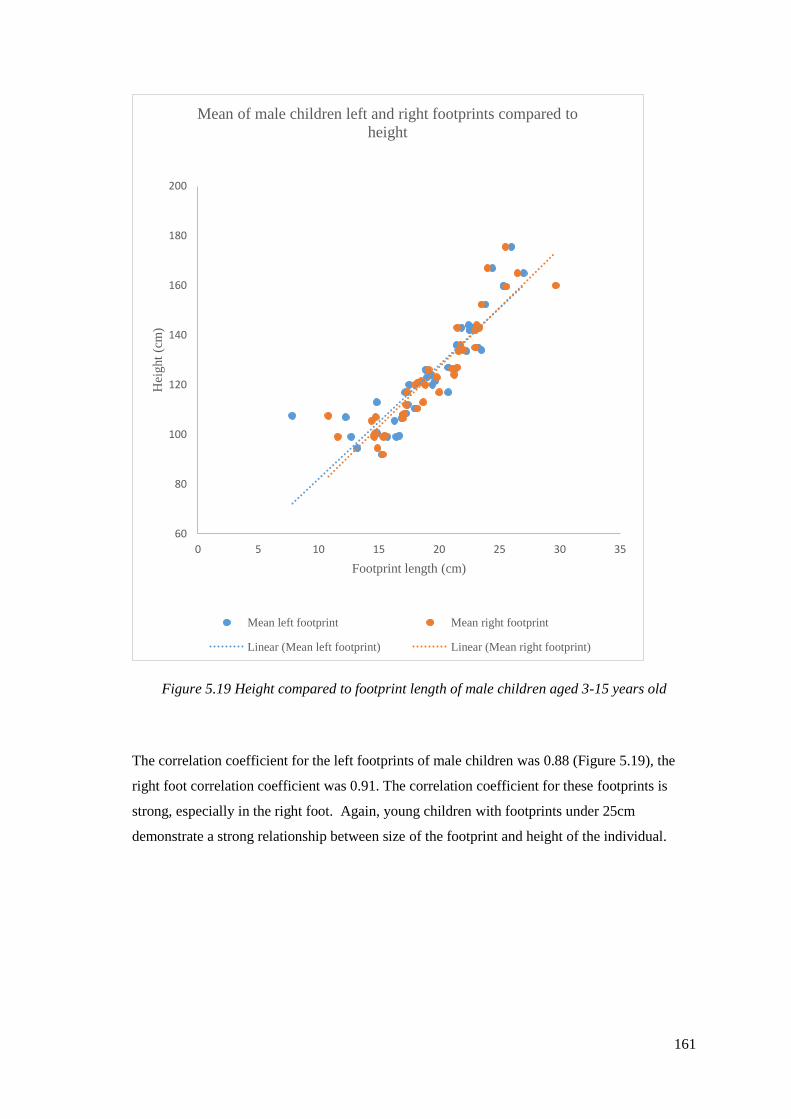
161
Figure 5.19 Height compared to footprint length of male children aged 3-15 years old
The correlation coefficient for the left footprints of male children was 0.88 (Figure 5.19), the
right foot correlation coefficient was 0.91. The correlation coefficient for these footprints is
strong, especially in the right foot. Again, young children with footprints under 25cm
demonstrate a strong relationship between size of the footprint and height of the individual.
60
80
100
120
140
160
180
200
0 5 10 15 20 25 30 35
Hei
ght
(cm
)
Footprint length (cm)
Mean of male children left and right footprints compared to
height
Mean left footprint Mean right footprint
Linear (Mean left footprint) Linear (Mean right footprint)

162
Figure 5.20 Height compared to footprint length of female children aged 3-15 years old
The correlation coefficient of the left footprint of female children was 0.91 (Figure 5.20), the
right footprint coefficient was 0.91. Female children have a very strong correlation coefficient
in both feet; if a child’s footprint is recorded it can evidently be a good indicator of their height.
Children shorter than 150cm do appear to have a stronger correlation between their height and
footprint length. A further consideration is if there is also a relationship between weight and
footprint size.
60
80
100
120
140
160
180
200
0 5 10 15 20 25 30 35
Hei
ght
(cm
)
Footprint length (cm)
Mean of female children left and right footprints compared to
height
Mean left footprint Mean right footprint
Linear (Mean left footprint) Linear (Mean right footprint)

163
5.3.4 Height, weight and footprint width relationship
It has been suggested that the width of an individual’s footprint may be indicative of weight and
sex (Dingwall et al. 2013, Fawzy and Kamal 2010, Hemy et al. 2013). In this study female
footprints ranged in width from 6.7cm to 12.3cm (Figure 5.21), and weights varied from 47.7kg
to 107.3kg, whilst male footprints ranged in width from 8cm to 23cm, with weights ranging
from 61.4kg to 126.6kg.
The heaviest individual was volunteer 131, a 50-year-old White English male, who was 192cm
tall, and made footprints with a width of 11cm. This individual was over 16kg heavier than the
second heaviest individual, volunteer 7 who was a 20-year-old White English male, 179cm tall
and weighing 110.2 kg. This individual had a foot width of 13.25cm, 2.25 cm wider than
volunteer 131 who was 16kg heavier. The average width of the male footprints within this
experiment was 10.9cm in left feet and 11.3cm in right feet. This indicates that, although
heavier than all individuals within this study, volunteer 131 had a footprint width of average
size. Females had a mean left foot width of 9.8cm and right foot width of 9.9cm. These widths
indicate a very slight difference in footprint size in males compared to females, with males
being slightly wider on average than females. The variations in results and the minimal mean
difference in width between males and females suggests that unless the footprint was very wide,
and long in length, it is unlikely to be able to identify a male or female footprint with any
scientific accuracy when utilising the widths of a footprint.
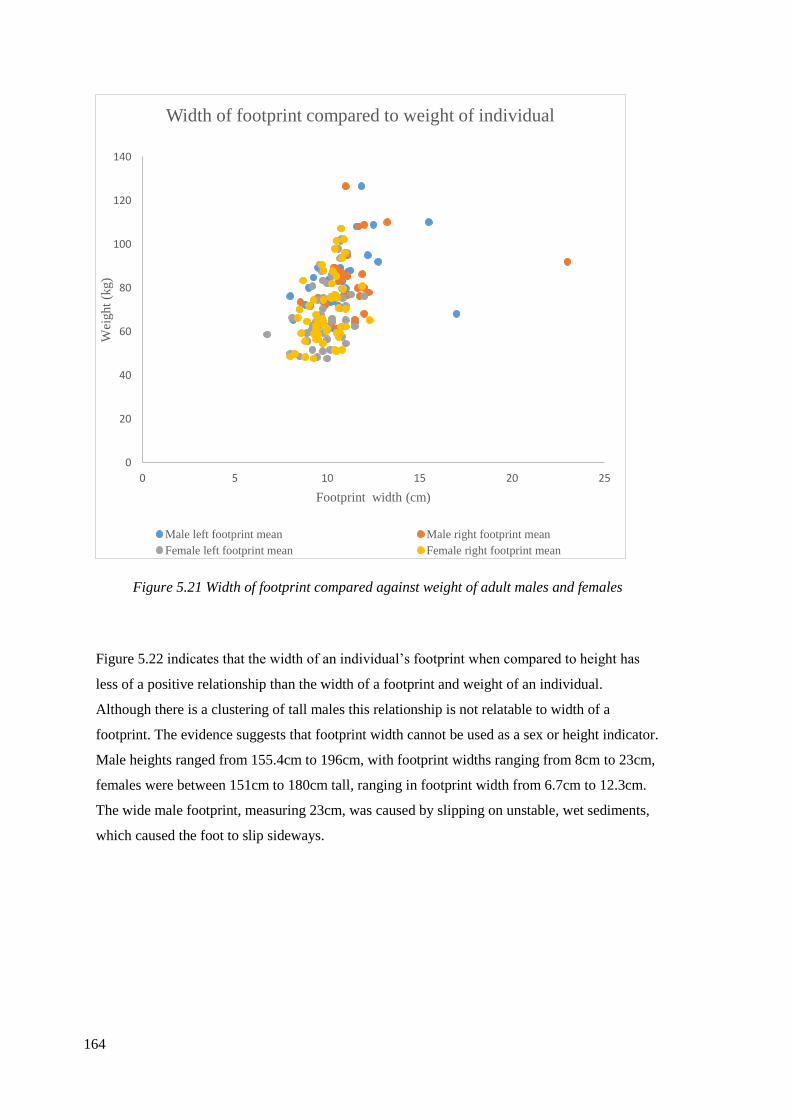
164
Figure 5.21 Width of footprint compared against weight of adult males and females
Figure 5.22 indicates that the width of an individual’s footprint when compared to height has
less of a positive relationship than the width of a footprint and weight of an individual.
Although there is a clustering of tall males this relationship is not relatable to width of a
footprint. The evidence suggests that footprint width cannot be used as a sex or height indicator.
Male heights ranged from 155.4cm to 196cm, with footprint widths ranging from 8cm to 23cm,
females were between 151cm to 180cm tall, ranging in footprint width from 6.7cm to 12.3cm.
The wide male footprint, measuring 23cm, was caused by slipping on unstable, wet sediments,
which caused the foot to slip sideways.
0
20
40
60
80
100
120
140
0 5 10 15 20 25
Wei
ght
(kg)
Footprint width (cm)
Width of footprint compared to weight of individual
Male left footprint mean Male right footprint mean
Female left footprint mean Female right footprint mean
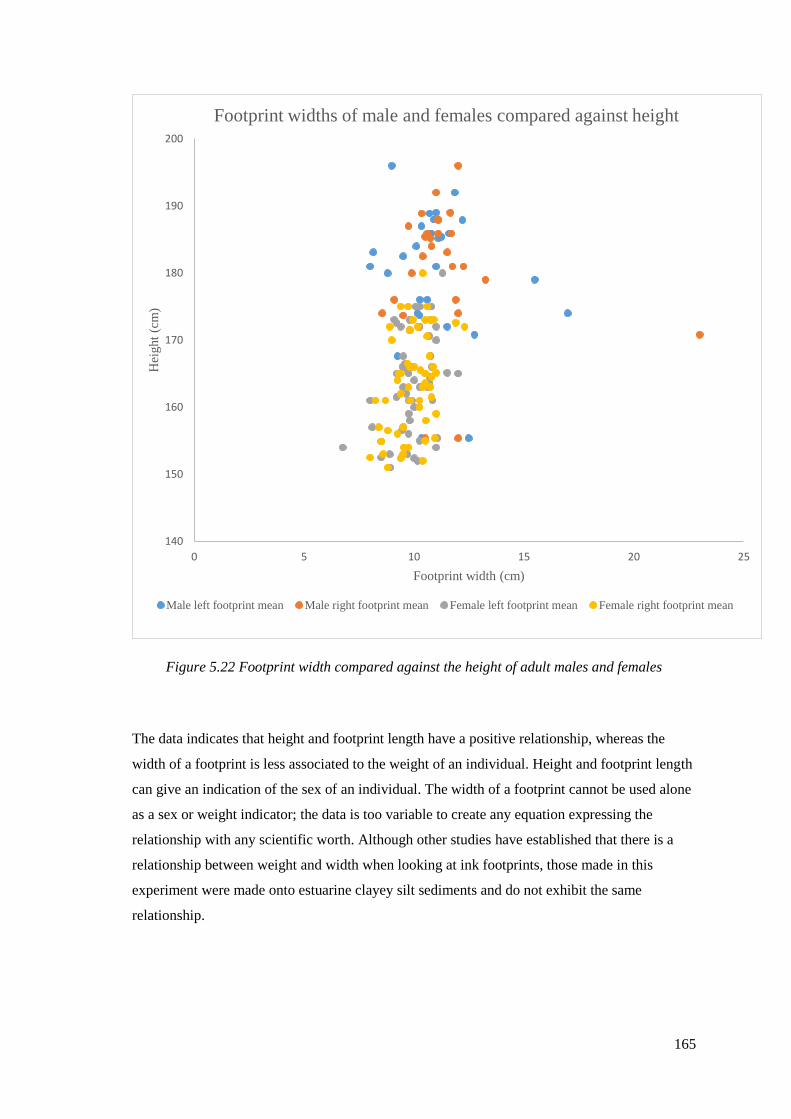
165
Figure 5.22 Footprint width compared against the height of adult males and females
The data indicates that height and footprint length have a positive relationship, whereas the
width of a footprint is less associated to the weight of an individual. Height and footprint length
can give an indication of the sex of an individual. The width of a footprint cannot be used alone
as a sex or weight indicator; the data is too variable to create any equation expressing the
relationship with any scientific worth. Although other studies have established that there is a
relationship between weight and width when looking at ink footprints, those made in this
experiment were made onto estuarine clayey silt sediments and do not exhibit the same
relationship.
140
150
160
170
180
190
200
0 5 10 15 20 25
Hei
ght
(cm
)
Footprint width (cm)
Footprint widths of male and females compared against height
Male left footprint mean Male right footprint mean Female left footprint mean Female right footprint mean
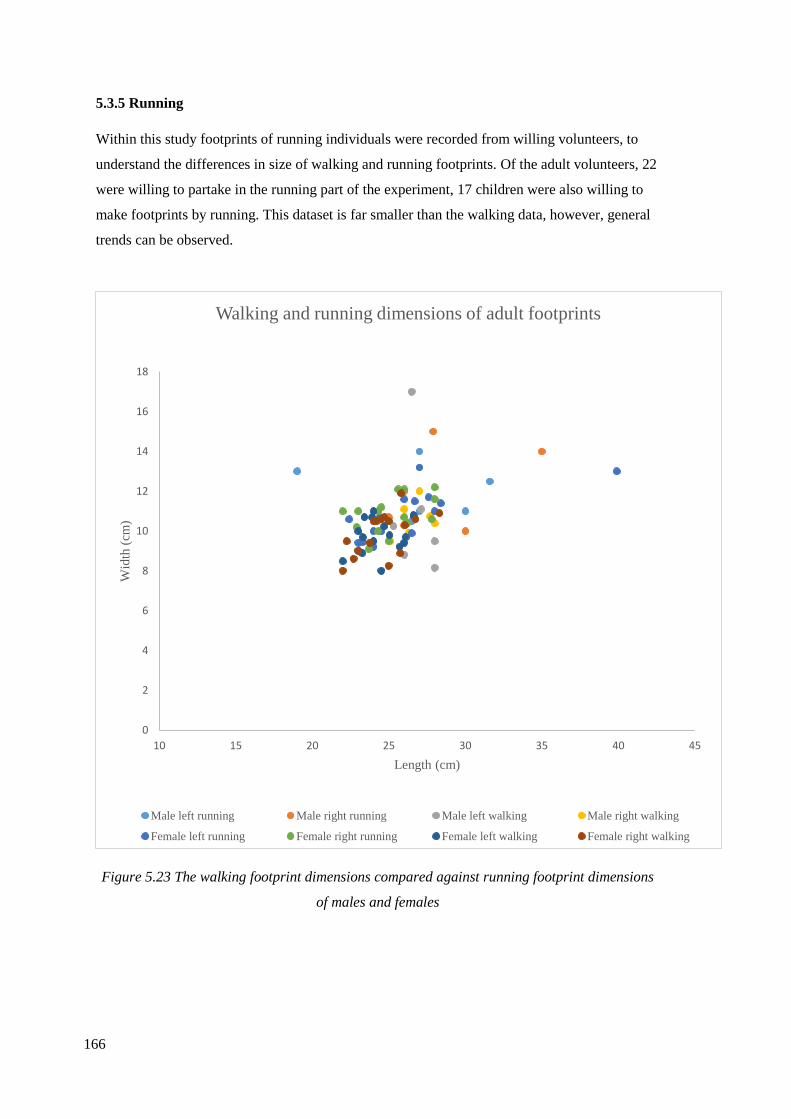
166
5.3.5 Running
Within this study footprints of running individuals were recorded from willing volunteers, to
understand the differences in size of walking and running footprints. Of the adult volunteers, 22
were willing to partake in the running part of the experiment, 17 children were also willing to
make footprints by running. This dataset is far smaller than the walking data, however, general
trends can be observed.
Figure 5.23 The walking footprint dimensions compared against running footprint dimensions
of males and females
0
2
4
6
8
10
12
14
16
18
10 15 20 25 30 35 40 45
Wid
th (
cm)
Length (cm)
Walking and running dimensions of adult footprints
Male left running Male right running Male left walking Male right walking
Female left running Female right running Female left walking Female right walking
167
The range in male running footprint sizes was 19cm to 35cm in length and 10.3cm to 15cm in
width. Footprints made by walking ranged from 25.1cm to 28cm in length, with widths ranging
from 8.1cm to 17cm. Female running footprints ranged from 22cm to 39.9cm in length and 9cm
to 13.2cm in width. Female walking footprint sizes ranged from 22 to 25.8cm with widths
ranging from 8cm to 11.9cm. This small dataset suggests that running may cause the footprint
to become longer and wider, though very slightly so (Figure 5.23). It is only when viewing a
trail of footprints, where the pace and stride is seen, can any real understanding of the speed an
individual was travelling be established.
5.3.6 Gait estimations utilising footprint data
A further use for footprint-tracks may be in establishing the travelling speed of an individual.
An increase in stride length can be considered to indicate an increase in speed (Bennet and
Morse 2014, p 154), the gait of an individual can also be utilised as an identification factor. An
individual who is 165cm will have a shorter stride length than an individual who is 185cm, this
will be the pattern in both walking and running. If walking together, the shorter person would
have to take more strides than the taller individual, as well as speeding up their pace to keep up,
this would be reflected within the footprint record.
Alexander (1976, 1984) theorised that the speed of a verterbrate had a relationship with the
strides taken, and that there could be an equation to express this to establish gait, as gait is
expressed by stride length. Alexander (1984) collected footprint data from a beach-based
experiment involving children and adults, and developed a statistical power law which could
then be used to estimate the speed of an individual:
λ/h ∼= 2.3 [v2 /(gh)]0.3
Within this equation, v represents the locomotory speed, g is the the accelerator of freefall and h
is the height between the hip and the ground. Λ represents the relative stride length.
Absolute speed is then calculated with a function of λ and h:
v = 0.25 g0.5 λ1.67 h −1.17.
When a vertebrae transitions between walking to running the λ/h ratio will exceed 2.0
(Alexander 1976).
This statistical power law was then adapted by Dingwall et al. (2013) and applied to the
Daasanach population (Figure 5.24). These equations were tested on the experimental footprint
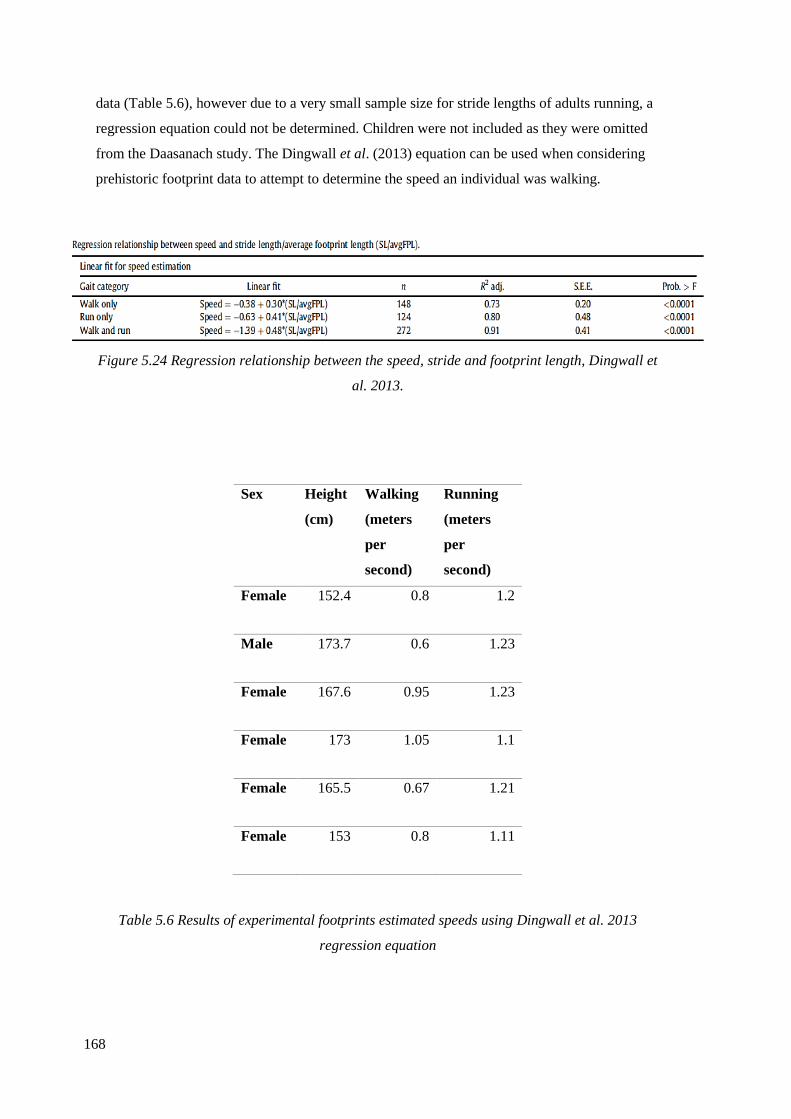
168
data (Table 5.6), however due to a very small sample size for stride lengths of adults running, a
regression equation could not be determined. Children were not included as they were omitted
from the Daasanach study. The Dingwall et al. (2013) equation can be used when considering
prehistoric footprint data to attempt to determine the speed an individual was walking.
Figure 5.24 Regression relationship between the speed, stride and footprint length, Dingwall et
al. 2013.
Sex Height
(cm)
Walking
(meters
per
second)
Running
(meters
per
second)
Female 152.4 0.8 1.2
Male 173.7 0.6 1.23
Female 167.6 0.95 1.23
Female 173 1.05 1.1
Female 165.5 0.67 1.21
Female 153 0.8 1.11
Table 5.6 Results of experimental footprints estimated speeds using Dingwall et al. 2013
regression equation
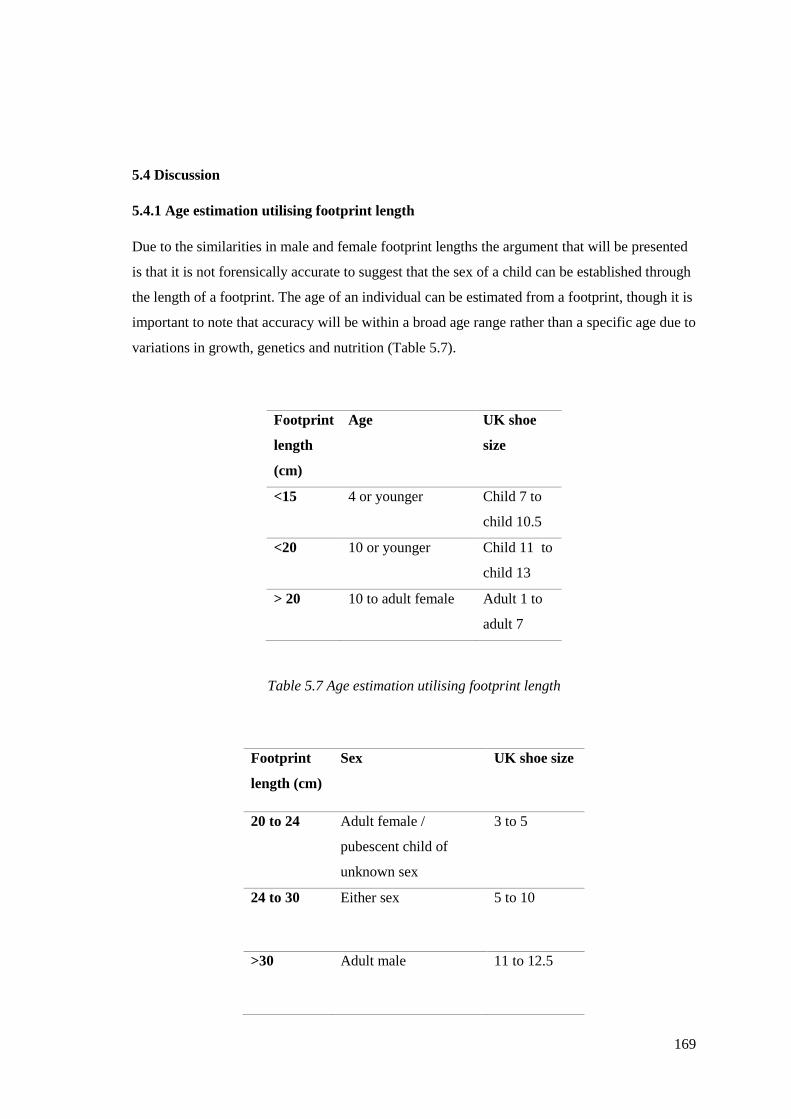
169
5.4 Discussion
5.4.1 Age estimation utilising footprint length
Due to the similarities in male and female footprint lengths the argument that will be presented
is that it is not forensically accurate to suggest that the sex of a child can be established through
the length of a footprint. The age of an individual can be estimated from a footprint, though it is
important to note that accuracy will be within a broad age range rather than a specific age due to
variations in growth, genetics and nutrition (Table 5.7).
Footprint
length
(cm)
Age UK shoe
size
<15 4 or younger Child 7 to
child 10.5
<20 10 or younger Child 11 to
child 13
> 20 10 to adult female Adult 1 to
adult 7
Table 5.7 Age estimation utilising footprint length
Footprint
length (cm)
Sex UK shoe size
20 to 24 Adult female /
pubescent child of
unknown sex
3 to 5
24 to 30 Either sex 5 to 10
>30 Adult male 11 to 12.5
170
Table 5.8 Sex estimation utilising footprint length
Table 5.8 shows the differences in foot size expressed in both sexes. It is evident that within the
footprint data there is a large overlap between males and females. In this experiment the largest
shoe size a female was wearing was a UK size seven, however these individuals often had
footprints similar in size to males who wore a UK size ten.
Individuals with footprints over 30cm or smaller than 15cm will be the easiest to identify, in all
other cases there is a relative amount of overlap. Footprints that were 20cm or less belong to
children aged under ten, which will be an indication of children from within the archaeological
footprint-track record.
Footprints can also be used to establish an individual’s stature. Understanding the stature of an
individual can also give an indication as to the maturity, so the likelihood of an individual being
tall and near to full grown, or being a relatively young child.
5.4.2 Stature Estimation
One of the aims of this study was to understand the relationship between an individual’s height
and footprint length. By carrying out the experiment within the same sediment as those created
by a prehistoric population it means that the footprint formation in the substrate would be
similar. Using other regression equations would produce less accurate results as the formation
of a footprint is partially influenced by the substrate, moisture content and plasticity of the
sediment being walked upon.
Table 5.9 provides the regression equations created by the writer for both female and male left
and right footprints made within this study. These equations assist in determining the stature of
an individual. All of the equations were calculated by the writer using the lengths of each
footprint from the modern human data set and calculating the relationship between the
footprints (independantvariable) to the stature of the person (dependant variable).
A complication can arise in archaeological datasets as the sex of an individual is unknown. In
these situations, a footprint trail may assist in identifying the gait, which may indicate a male or
female, and then those specific equations can be utilised. Footprints can be indistinct, where the
left or right foot and the sex is not identifiable, a combined regression equation can be used to
estimate the stature.

171
Sex and footprint side Regression equation Standard error of estimate
Male Left y=82.48 + 3.53x 8.3
Male Right y=89.24 + 3.31x 8.5
Female Left y= 95.05 + 2.78x 6.0
Female Right y= 92.4 + 2.90x 6.18
Combined y= 60.3 + 4.3x 7.3
Table 5.9 Regression equation establishing heights for adult males and females, y=height,
x=footprint length, to be used on footprints larger than 20cm.
This research has demonstrated that identifying the sex of children from a footprint is not
accurate, there is too much variation in children of both genders to establish sex by utilising the
footprint, however identifying the stature of a child from a footprint is possible. This research
took into consideration children aged ten and younger, as after this point many children were of
a similar height to adults and produced results with adult dimensions. Only if a footprint is
under 20cm, indicating a prepubescent child, should these equations be utilised (Table 5.10).
Footprint side Regression equation Standard error of estimate
Child left y = 41.32 + 4.13x 9.14
Child right y = 36.22 + 4.42x 8.12
Combined y= 38.82 + 4.27x 8.59
Table 5.10 Regression equation establishing heights for children, y=height, x=footprint length,
to be used on children with footprint lengths under 20cm.
Other studies have created stature equations with a standard error that is less than those
determined in this experiment (Chapter 2, Table 2.2), however this experiment was observing
the results of three-dimensional footprint-tracks rather than footprints made on flat surfaces
with ink. Ink would provide results that more accurately demonstrate the morphology of a foot.
This is not specifically essential in this study; it is not the foot itself that this study was
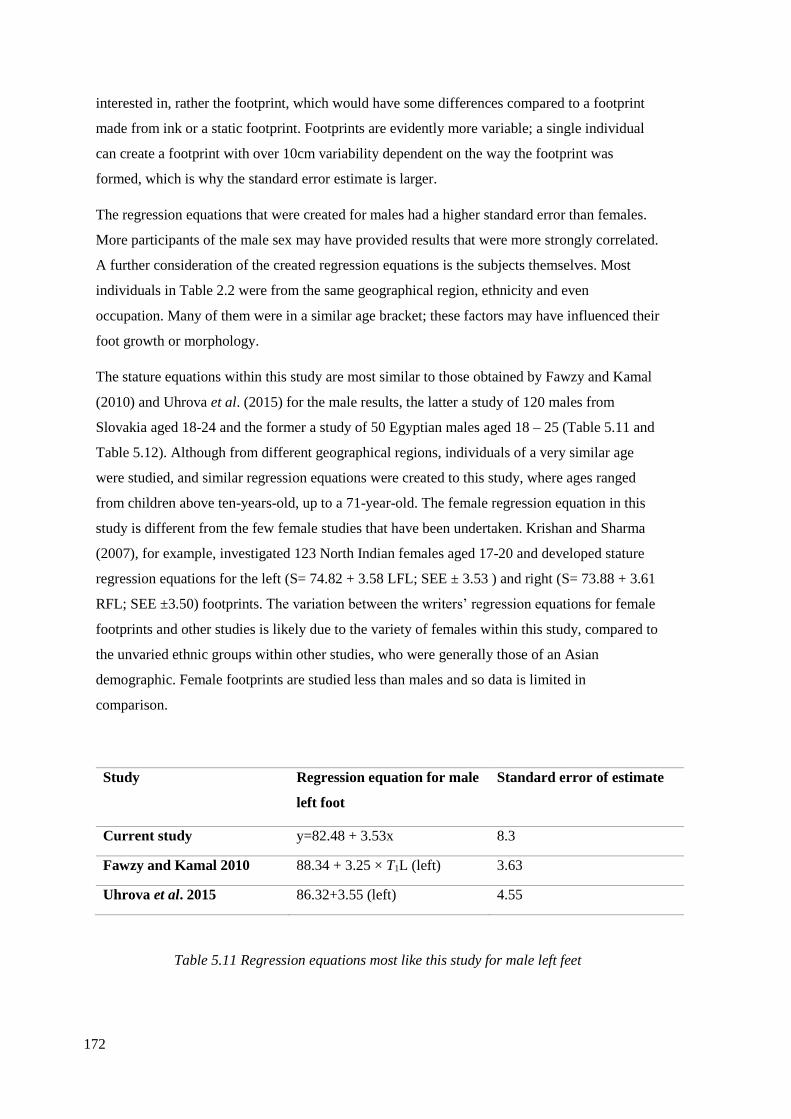
172
interested in, rather the footprint, which would have some differences compared to a footprint
made from ink or a static footprint. Footprints are evidently more variable; a single individual
can create a footprint with over 10cm variability dependent on the way the footprint was
formed, which is why the standard error estimate is larger.
The regression equations that were created for males had a higher standard error than females.
More participants of the male sex may have provided results that were more strongly correlated.
A further consideration of the created regression equations is the subjects themselves. Most
individuals in Table 2.2 were from the same geographical region, ethnicity and even
occupation. Many of them were in a similar age bracket; these factors may have influenced their
foot growth or morphology.
The stature equations within this study are most similar to those obtained by Fawzy and Kamal
(2010) and Uhrova et al. (2015) for the male results, the latter a study of 120 males from
Slovakia aged 18-24 and the former a study of 50 Egyptian males aged 18 – 25 (Table 5.11 and
Table 5.12). Although from different geographical regions, individuals of a very similar age
were studied, and similar regression equations were created to this study, where ages ranged
from children above ten-years-old, up to a 71-year-old. The female regression equation in this
study is different from the few female studies that have been undertaken. Krishan and Sharma
(2007), for example, investigated 123 North Indian females aged 17-20 and developed stature
regression equations for the left (S= 74.82 + 3.58 LFL; SEE ± 3.53 ) and right (S= 73.88 + 3.61
RFL; SEE ±3.50) footprints. The variation between the writers’ regression equations for female
footprints and other studies is likely due to the variety of females within this study, compared to
the unvaried ethnic groups within other studies, who were generally those of an Asian
demographic. Female footprints are studied less than males and so data is limited in
comparison.
Study Regression equation for male
left foot
Standard error of estimate
Current study y=82.48 + 3.53x 8.3
Fawzy and Kamal 2010 88.34 + 3.25 × T1L (left) 3.63
Uhrova et al. 2015 86.32+3.55 (left) 4.55
Table 5.11 Regression equations most like this study for male left feet
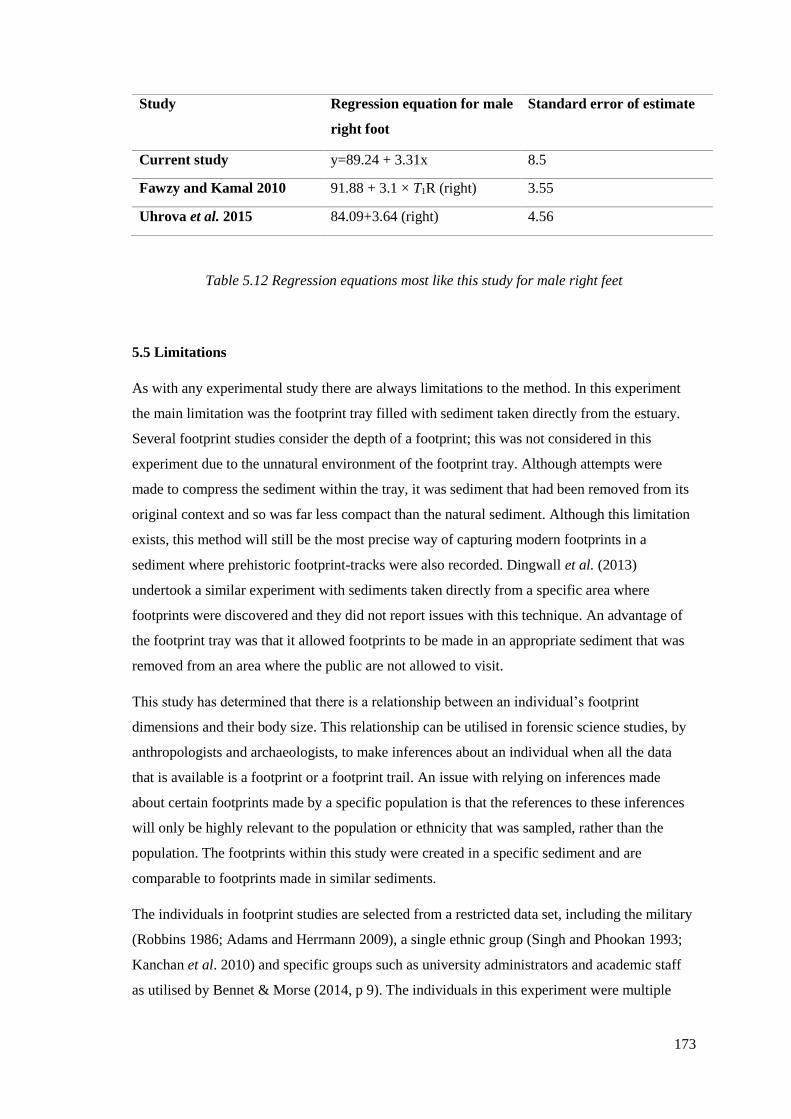
173
Study Regression equation for male
right foot
Standard error of estimate
Current study y=89.24 + 3.31x 8.5
Fawzy and Kamal 2010 91.88 + 3.1 × T1R (right) 3.55
Uhrova et al. 2015 84.09+3.64 (right) 4.56
Table 5.12 Regression equations most like this study for male right feet
5.5 Limitations
As with any experimental study there are always limitations to the method. In this experiment
the main limitation was the footprint tray filled with sediment taken directly from the estuary.
Several footprint studies consider the depth of a footprint; this was not considered in this
experiment due to the unnatural environment of the footprint tray. Although attempts were
made to compress the sediment within the tray, it was sediment that had been removed from its
original context and so was far less compact than the natural sediment. Although this limitation
exists, this method will still be the most precise way of capturing modern footprints in a
sediment where prehistoric footprint-tracks were also recorded. Dingwall et al. (2013)
undertook a similar experiment with sediments taken directly from a specific area where
footprints were discovered and they did not report issues with this technique. An advantage of
the footprint tray was that it allowed footprints to be made in an appropriate sediment that was
removed from an area where the public are not allowed to visit.
This study has determined that there is a relationship between an individual’s footprint
dimensions and their body size. This relationship can be utilised in forensic science studies, by
anthropologists and archaeologists, to make inferences about an individual when all the data
that is available is a footprint or a footprint trail. An issue with relying on inferences made
about certain footprints made by a specific population is that the references to these inferences
will only be highly relevant to the population or ethnicity that was sampled, rather than the
population. The footprints within this study were created in a specific sediment and are
comparable to footprints made in similar sediments.
The individuals in footprint studies are selected from a restricted data set, including the military
(Robbins 1986; Adams and Herrmann 2009), a single ethnic group (Singh and Phookan 1993;
Kanchan et al. 2010) and specific groups such as university administrators and academic staff
as utilised by Bennet & Morse (2014, p 9). The individuals in this experiment were multiple

174
groups of volunteers, students and staff from the University of Reading, children and child
carers from groups in Reading, Berkshire, and the surrounding areas, and children and child
carers from a large childminding group in Waterlooville, Hampshire. This provided a more
varied range of individuals but they are not representative of a population, the adult females for
example were primarily mothers, a bias that would have been caused by the interaction with
childminding and child care groups, rather than being representative of the female population.
5.6 Conclusion
This study supports the hypothesis that there is a relationship between a person’s height and
footprint length in footprints made in clayey silt estuarine sediments, though there is not a clear
relationship between footprints and weights of an individual. Footprints can give an indication
of whether an individual was a juvenile or fully-grown adult, and if the full-grown person was
male or female. The results indicate that the accuracy of stature regression equations are less
than static footprints or those made in ink, however they still provide a strong equation which
can be applied to prehistoric footprints made in similar sediments.
Female and juvenile footprints are still understudied within the forensic community, especially
within Europe, and the discipline would benefit greatly from studies that are not just performed
in a university setting, but with individuals from a variety of social backgrounds.
175
Chapter 6
Mesolithic human footprint-tracks from Goldcliff East: age, sex and stature estimates and
an interpretation of results
6.1 Introduction
Fossil footprint-track sites have been extensively analysed and interpreted, with research
utilising footprint-track evidence to identify an individual’s activities and health related
conditions (Roberts and Worsely 2008). These interpretations can be strengthened by analysing
ethnographic studies, to attempt to understand hunter-gatherer behaviour.
The site of Willandra Lakes, Australia, is of note as aborigines are still inhabiting this area,
possibly engaging in some of the same behaviours as their prehistoric ancestors. Campbell et al.
(1936) recorded data from 478 central Australian aborigines, recording the foot length and
stature of these individuals. From this data Webb et al. (2006; 2007) created equations that
could then be applied to the prehistoric Willandra Lake footprints and determined stature, age
and speed of movement. In areas where there are no longer indigenous populations, ichnologists
must rely upon ethnographic examples from across the globe to help interpret footprint-tracks.
It must be remembered that these behaviours are likely influenced greatly by environment,
habitat, availability of resources, predators, temperature and weather. These factors would also
have influenced the hunter-gatherer’s way of life.
The utilisation of modern hunter-gatherer datasets does have limitations and it is important to
not over-interpret the prehistoric data using modern hunter-gatherer data as an exact
comparison; these people are not a group of ‘pristine survivals from the Stone Age’ (Finlayson
and Warren 2010, p 28). Modern indigenous populations have adapted to living on the fringes
of agricultural and industrial land and will often trade resources and work directly in farming
activities, a very different way of life to that of prehistoric hunter-gatherers (Finlayson and
Warren 2010, p 41). They are therefore not a direct comparison, but can assist our
interpretations of archaeological evidence in providing an analogue of the different ways that
hunter-gatherers may perform the same activity.
Mesolithic footprint-tracks have been found preserved at the site of Goldcliff East on the Severn
Estuary, Wales in a variety of sizes.
6.2 Method
The purpose of the fieldwork on the Severn Estuary was to record prehistoric footprint-tracks
and determine the species of the footprint maker. If identified as Homo sapiens, then the
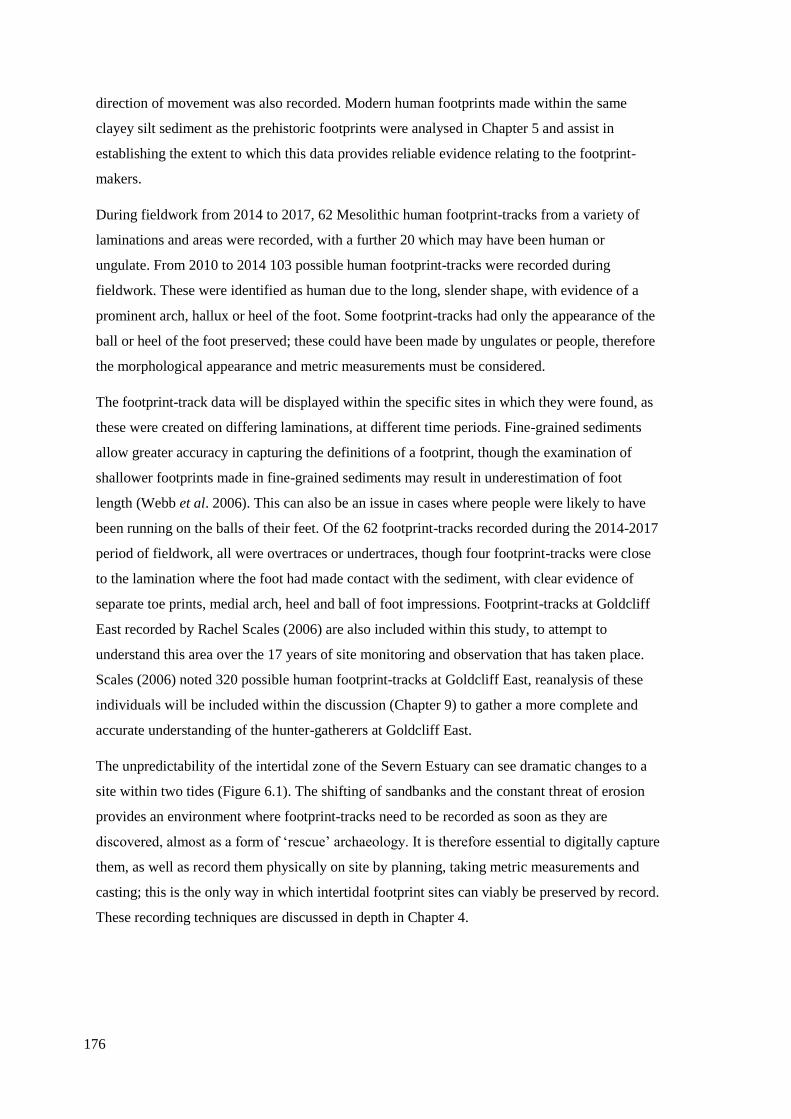
176
direction of movement was also recorded. Modern human footprints made within the same
clayey silt sediment as the prehistoric footprints were analysed in Chapter 5 and assist in
establishing the extent to which this data provides reliable evidence relating to the footprint-
makers.
During fieldwork from 2014 to 2017, 62 Mesolithic human footprint-tracks from a variety of
laminations and areas were recorded, with a further 20 which may have been human or
ungulate. From 2010 to 2014 103 possible human footprint-tracks were recorded during
fieldwork. These were identified as human due to the long, slender shape, with evidence of a
prominent arch, hallux or heel of the foot. Some footprint-tracks had only the appearance of the
ball or heel of the foot preserved; these could have been made by ungulates or people, therefore
the morphological appearance and metric measurements must be considered.
The footprint-track data will be displayed within the specific sites in which they were found, as
these were created on differing laminations, at different time periods. Fine-grained sediments
allow greater accuracy in capturing the definitions of a footprint, though the examination of
shallower footprints made in fine-grained sediments may result in underestimation of foot
length (Webb et al. 2006). This can also be an issue in cases where people were likely to have
been running on the balls of their feet. Of the 62 footprint-tracks recorded during the 2014-2017
period of fieldwork, all were overtraces or undertraces, though four footprint-tracks were close
to the lamination where the foot had made contact with the sediment, with clear evidence of
separate toe prints, medial arch, heel and ball of foot impressions. Footprint-tracks at Goldcliff
East recorded by Rachel Scales (2006) are also included within this study, to attempt to
understand this area over the 17 years of site monitoring and observation that has taken place.
Scales (2006) noted 320 possible human footprint-tracks at Goldcliff East, reanalysis of these
individuals will be included within the discussion (Chapter 9) to gather a more complete and
accurate understanding of the hunter-gatherers at Goldcliff East.
The unpredictability of the intertidal zone of the Severn Estuary can see dramatic changes to a
site within two tides (Figure 6.1). The shifting of sandbanks and the constant threat of erosion
provides an environment where footprint-tracks need to be recorded as soon as they are
discovered, almost as a form of ‘rescue’ archaeology. It is therefore essential to digitally capture
them, as well as record them physically on site by planning, taking metric measurements and
casting; this is the only way in which intertidal footprint sites can viably be preserved by record.
These recording techniques are discussed in depth in Chapter 4.
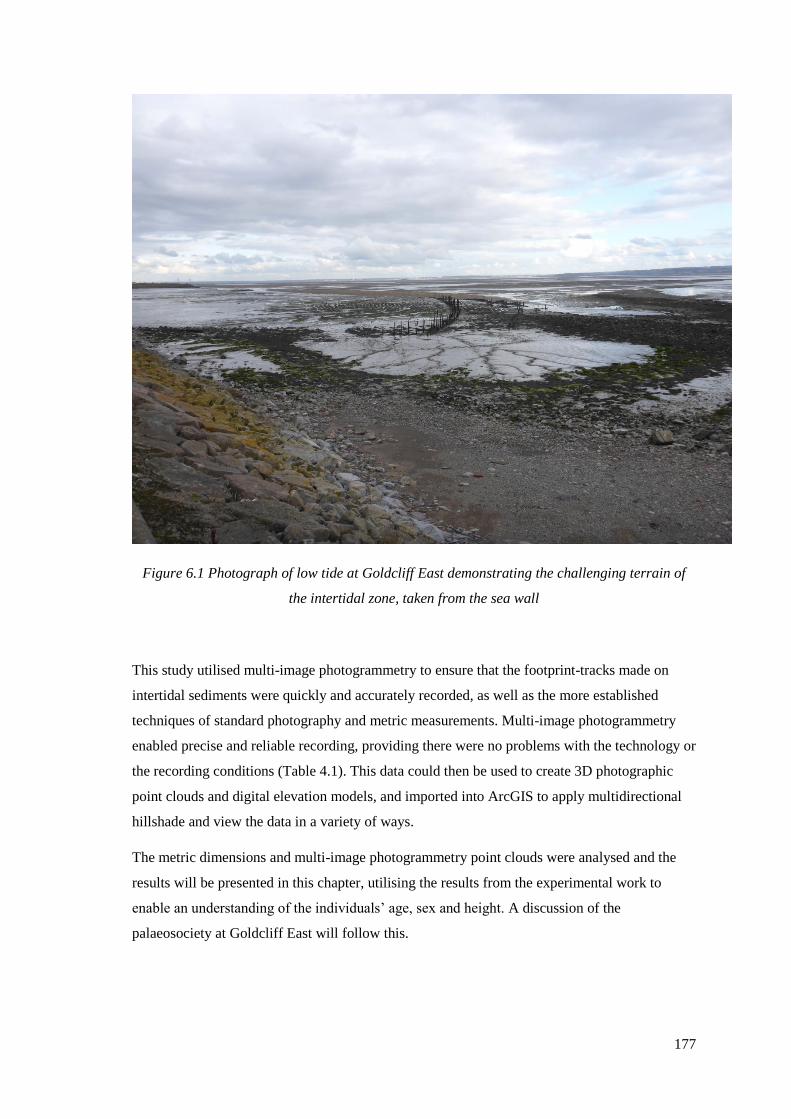
177
Figure 6.1 Photograph of low tide at Goldcliff East demonstrating the challenging terrain of
the intertidal zone, taken from the sea wall
This study utilised multi-image photogrammetry to ensure that the footprint-tracks made on
intertidal sediments were quickly and accurately recorded, as well as the more established
techniques of standard photography and metric measurements. Multi-image photogrammetry
enabled precise and reliable recording, providing there were no problems with the technology or
the recording conditions (Table 4.1). This data could then be used to create 3D photographic
point clouds and digital elevation models, and imported into ArcGIS to apply multidirectional
hillshade and view the data in a variety of ways.
The metric dimensions and multi-image photogrammetry point clouds were analysed and the
results will be presented in this chapter, utilising the results from the experimental work to
enable an understanding of the individuals’ age, sex and height. A discussion of the
palaeosociety at Goldcliff East will follow this.
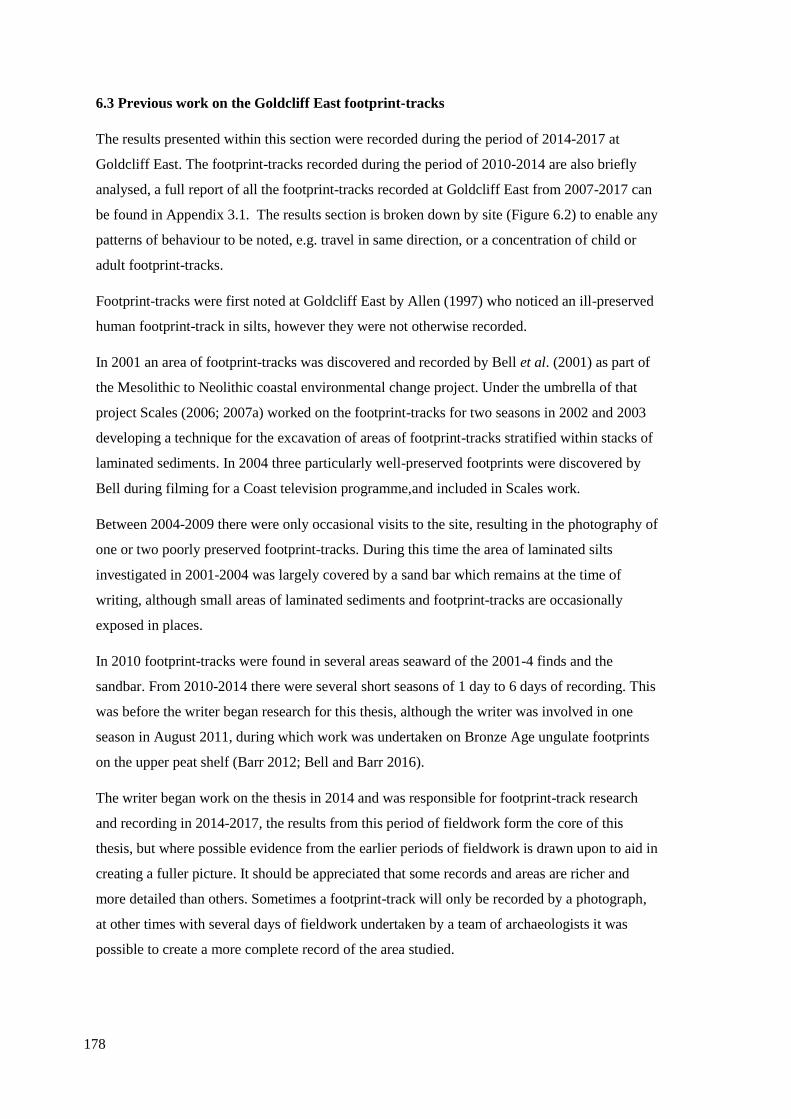
178
6.3 Previous work on the Goldcliff East footprint-tracks
The results presented within this section were recorded during the period of 2014-2017 at
Goldcliff East. The footprint-tracks recorded during the period of 2010-2014 are also briefly
analysed, a full report of all the footprint-tracks recorded at Goldcliff East from 2007-2017 can
be found in Appendix 3.1. The results section is broken down by site (Figure 6.2) to enable any
patterns of behaviour to be noted, e.g. travel in same direction, or a concentration of child or
adult footprint-tracks.
Footprint-tracks were first noted at Goldcliff East by Allen (1997) who noticed an ill-preserved
human footprint-track in silts, however they were not otherwise recorded.
In 2001 an area of footprint-tracks was discovered and recorded by Bell et al. (2001) as part of
the Mesolithic to Neolithic coastal environmental change project. Under the umbrella of that
project Scales (2006; 2007a) worked on the footprint-tracks for two seasons in 2002 and 2003
developing a technique for the excavation of areas of footprint-tracks stratified within stacks of
laminated sediments. In 2004 three particularly well-preserved footprints were discovered by
Bell during filming for a Coast television programme,and included in Scales work.
Between 2004-2009 there were only occasional visits to the site, resulting in the photography of
one or two poorly preserved footprint-tracks. During this time the area of laminated silts
investigated in 2001-2004 was largely covered by a sand bar which remains at the time of
writing, although small areas of laminated sediments and footprint-tracks are occasionally
exposed in places.
In 2010 footprint-tracks were found in several areas seaward of the 2001-4 finds and the
sandbar. From 2010-2014 there were several short seasons of 1 day to 6 days of recording. This
was before the writer began research for this thesis, although the writer was involved in one
season in August 2011, during which work was undertaken on Bronze Age ungulate footprints
on the upper peat shelf (Barr 2012; Bell and Barr 2016).
The writer began work on the thesis in 2014 and was responsible for footprint-track research
and recording in 2014-2017, the results from this period of fieldwork form the core of this
thesis, but where possible evidence from the earlier periods of fieldwork is drawn upon to aid in
creating a fuller picture. It should be appreciated that some records and areas are richer and
more detailed than others. Sometimes a footprint-track will only be recorded by a photograph,
at other times with several days of fieldwork undertaken by a team of archaeologists it was
possible to create a more complete record of the area studied.
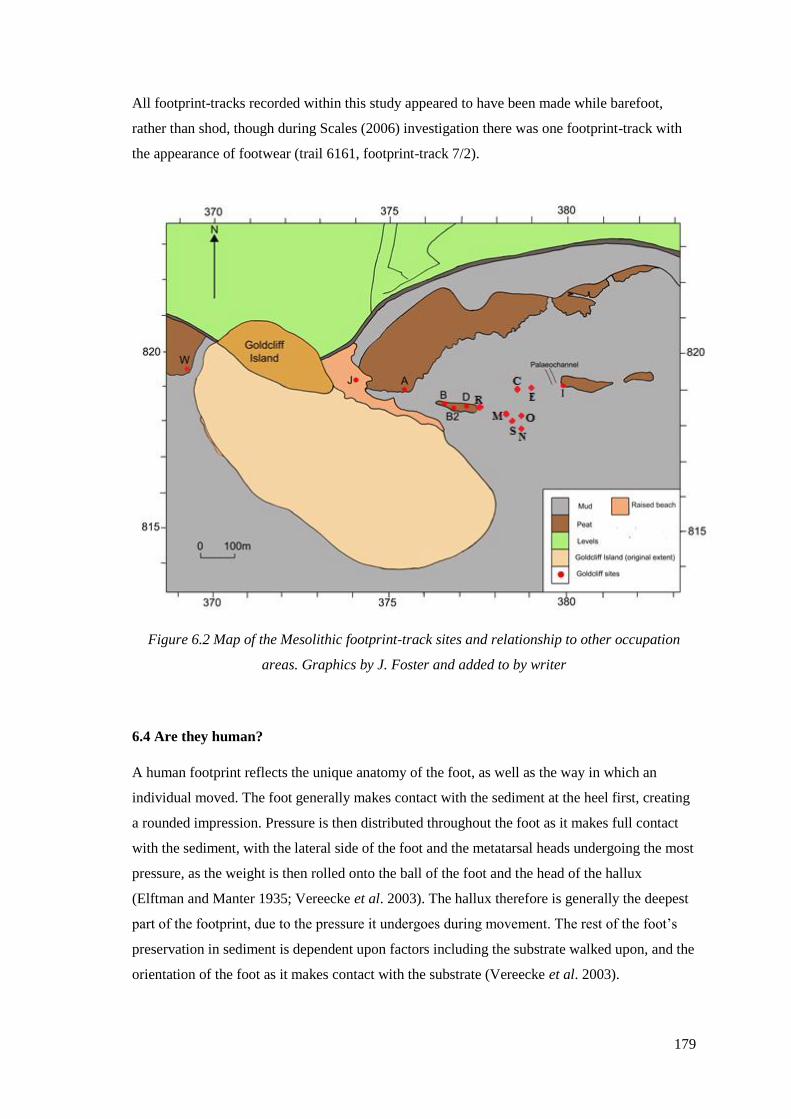
179
All footprint-tracks recorded within this study appeared to have been made while barefoot,
rather than shod, though during Scales (2006) investigation there was one footprint-track with
the appearance of footwear (trail 6161, footprint-track 7/2).
Figure 6.2 Map of the Mesolithic footprint-track sites and relationship to other occupation
areas. Graphics by J. Foster and added to by writer
6.4 Are they human?
A human footprint reflects the unique anatomy of the foot, as well as the way in which an
individual moved. The foot generally makes contact with the sediment at the heel first, creating
a rounded impression. Pressure is then distributed throughout the foot as it makes full contact
with the sediment, with the lateral side of the foot and the metatarsal heads undergoing the most
pressure, as the weight is then rolled onto the ball of the foot and the head of the hallux
(Elftman and Manter 1935; Vereecke et al. 2003). The hallux therefore is generally the deepest
part of the footprint, due to the pressure it undergoes during movement. The rest of the foot’s
preservation in sediment is dependent upon factors including the substrate walked upon, and the
orientation of the foot as it makes contact with the substrate (Vereecke et al. 2003).
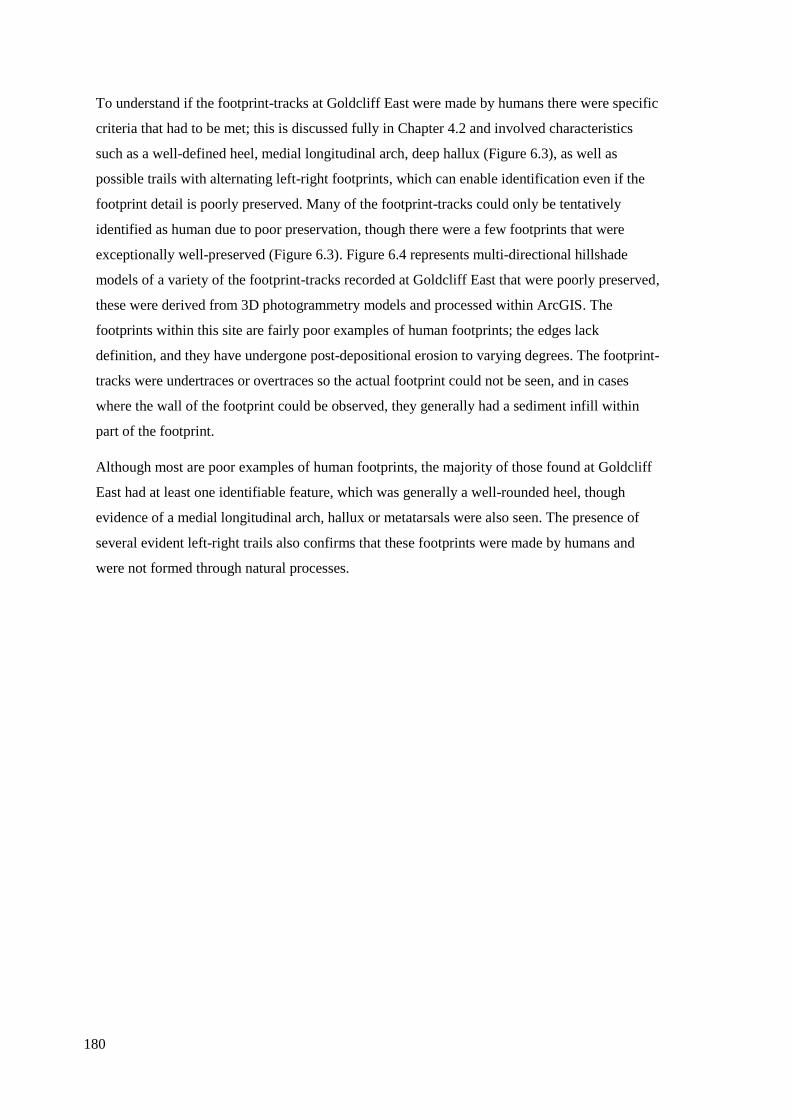
180
To understand if the footprint-tracks at Goldcliff East were made by humans there were specific
criteria that had to be met; this is discussed fully in Chapter 4.2 and involved characteristics
such as a well-defined heel, medial longitudinal arch, deep hallux (Figure 6.3), as well as
possible trails with alternating left-right footprints, which can enable identification even if the
footprint detail is poorly preserved. Many of the footprint-tracks could only be tentatively
identified as human due to poor preservation, though there were a few footprints that were
exceptionally well-preserved (Figure 6.3). Figure 6.4 represents multi-directional hillshade
models of a variety of the footprint-tracks recorded at Goldcliff East that were poorly preserved,
these were derived from 3D photogrammetry models and processed within ArcGIS. The
footprints within this site are fairly poor examples of human footprints; the edges lack
definition, and they have undergone post-depositional erosion to varying degrees. The footprint-
tracks were undertraces or overtraces so the actual footprint could not be seen, and in cases
where the wall of the footprint could be observed, they generally had a sediment infill within
part of the footprint.
Although most are poor examples of human footprints, the majority of those found at Goldcliff
East had at least one identifiable feature, which was generally a well-rounded heel, though
evidence of a medial longitudinal arch, hallux or metatarsals were also seen. The presence of
several evident left-right trails also confirms that these footprints were made by humans and
were not formed through natural processes.
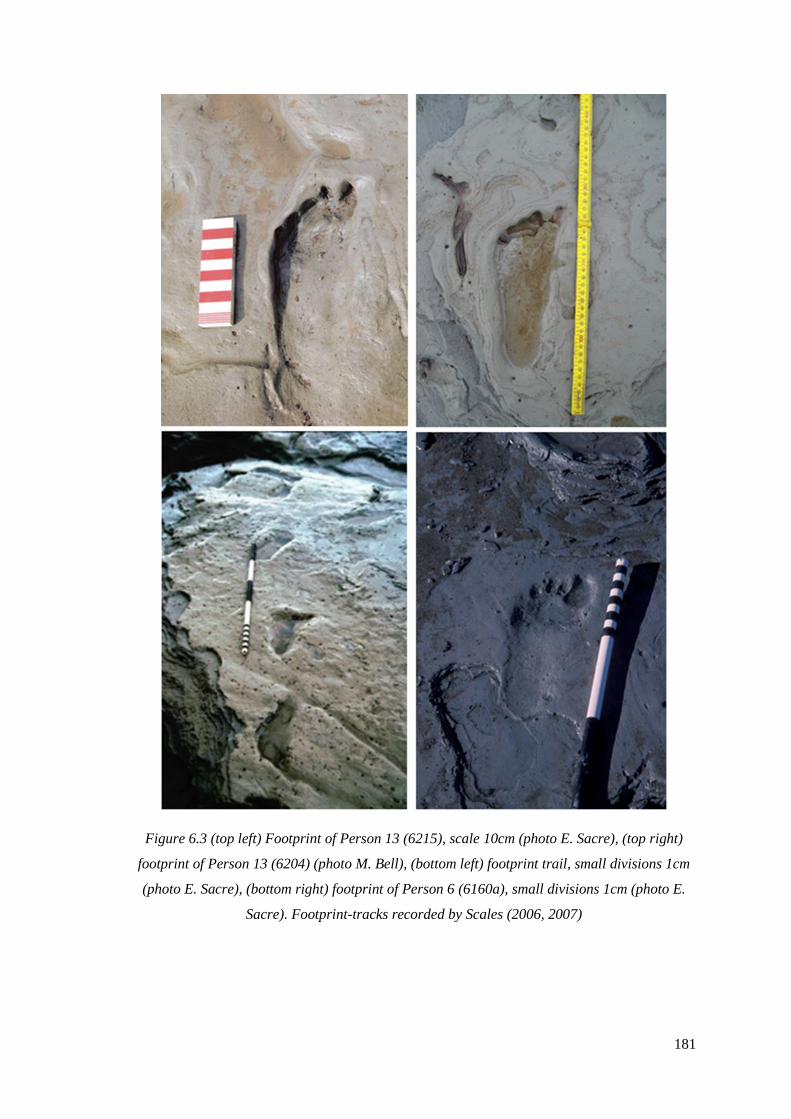
181
Figure 6.3 (top left) Footprint of Person 13 (6215), scale 10cm (photo E. Sacre), (top right)
footprint of Person 13 (6204) (photo M. Bell), (bottom left) footprint trail, small divisions 1cm
(photo E. Sacre), (bottom right) footprint of Person 6 (6160a), small divisions 1cm (photo E.
Sacre). Footprint-tracks recorded by Scales (2006, 2007)
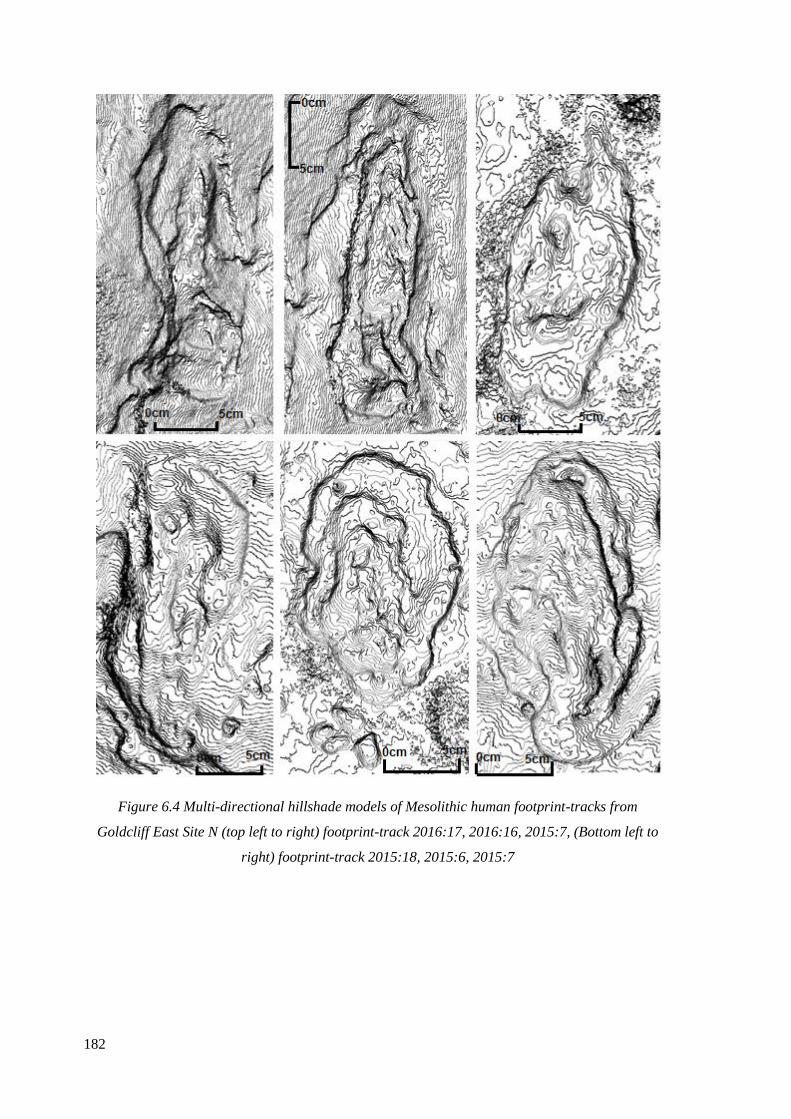
182
Figure 6.4 Multi-directional hillshade models of Mesolithic human footprint-tracks from
Goldcliff East Site N (top left to right) footprint-track 2016:17, 2016:16, 2015:7, (Bottom left to
right) footprint-track 2015:18, 2015:6, 2015:7
183
6.5 Resuts of Site C/E footprint-track evidence
Site C/E footprint-tracks were exposed in small areas mostly on an eroding low cliff through
laminated sediments, this was the northerly (landward) of the Mesolithic footprint-track sites
(Figure 6.5). Site C and E were extensively studied by Scales (2006), Site C was located on
laminations between -3.6m and -4.2m OD, and Site E was at -3.9m OD (Bell 2007, Figure 4.5).
During the current research a large sandbank covered these sites, and exposed areas of banded
laminated sediments was small, with footprint-tracks recorded in areas that were near to the
previous footprint-tracks recorded at C and E but not in the exact location. Site C/E was the
highest footprint-track area and so was exposed for the longest period. The retreating tide
provided a clean body of water to clean the footprint-tracks, and due to the laminated cliffs the
water was easily accessible if one was on site as the tide retreated. The moving sandbank
caused issues in finding and recording footprints, with areas being buried by over 15cm of sand
within 24 hours of initial discovery. Although water was accessible to wash areas off, the
thickness of the sand often prevented any recording, sometimes as Figure 6.5 shows it was
possible to clear sand back to increase the area of footprint-track exposure.
Figure 6.5, (left) tide reducing from the
sandbank covering Site C/E, and (above) Site
C/E with a small lamination of exposure.
Footprint-track 2015:116 had just been cast in
dental alginate and the alginate was about to
be wrapped in cling film for protection
Site C/E had an interesting mix of avian and
human footprint-tracks found on multiple laminations. This was one of the main areas

184
investigated by Scales (2006) in 2002-4. Subsequently between 2014-2016, 18 human footprint-
tracks were recorded (Table 6.1). Many of these were relatively well preserved, with anatomical
features evident such as indentations from the toes, heel and arch of the foot. The footprint-
tracks ranged in length from 17cm to 30cm, and in width from 5cm to 14cm. These footprint-
tracks were created across multiple laminations indicating that they were lain down over several
years, and were all within 30 meters of each other.
Footprint-
track
number
Site Length
(cm)
Width
(cm)
Identifying features? Left or
Right?
Direction of
movement
2015:88 C/E 20 8.5 Prominent hallux Right 82° east
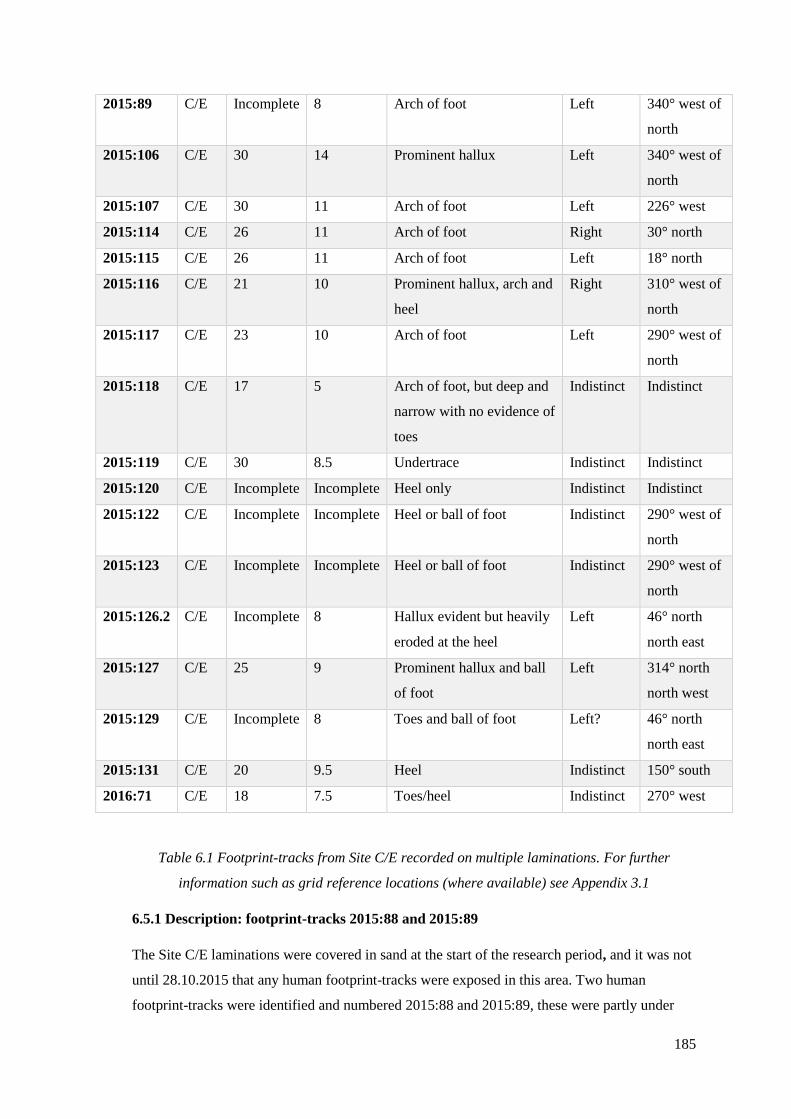
185
2015:89 C/E Incomplete 8 Arch of foot Left 340° west of
north
2015:106 C/E 30 14 Prominent hallux Left 340° west of
north
2015:107 C/E 30 11 Arch of foot Left 226° west
2015:114 C/E 26 11 Arch of foot Right 30° north
2015:115 C/E 26 11 Arch of foot Left 18° north
2015:116 C/E 21 10 Prominent hallux, arch and
heel
Right 310° west of
north
2015:117 C/E 23 10 Arch of foot Left 290° west of
north
2015:118 C/E 17 5 Arch of foot, but deep and
narrow with no evidence of
toes
Indistinct Indistinct
2015:119 C/E 30 8.5 Undertrace Indistinct Indistinct
2015:120 C/E Incomplete Incomplete Heel only Indistinct Indistinct
2015:122 C/E Incomplete Incomplete Heel or ball of foot Indistinct 290° west of
north
2015:123 C/E Incomplete Incomplete Heel or ball of foot Indistinct 290° west of
north
2015:126.2 C/E Incomplete 8 Hallux evident but heavily
eroded at the heel
Left 46° north
north east
2015:127 C/E 25 9 Prominent hallux and ball
of foot
Left 314° north
north west
2015:129 C/E Incomplete 8 Toes and ball of foot Left? 46° north
north east
2015:131 C/E 20 9.5 Heel Indistinct 150° south
2016:71 C/E 18 7.5 Toes/heel Indistinct 270° west
Table 6.1 Footprint-tracks from Site C/E recorded on multiple laminations. For further
information such as grid reference locations (where available) see Appendix 3.1
6.5.1 Description: footprint-tracks 2015:88 and 2015:89
The Site C/E laminations were covered in sand at the start of the research period, and it was not
until 28.10.2015 that any human footprint-tracks were exposed in this area. Two human
footprint-tracks were identified and numbered 2015:88 and 2015:89, these were partly under
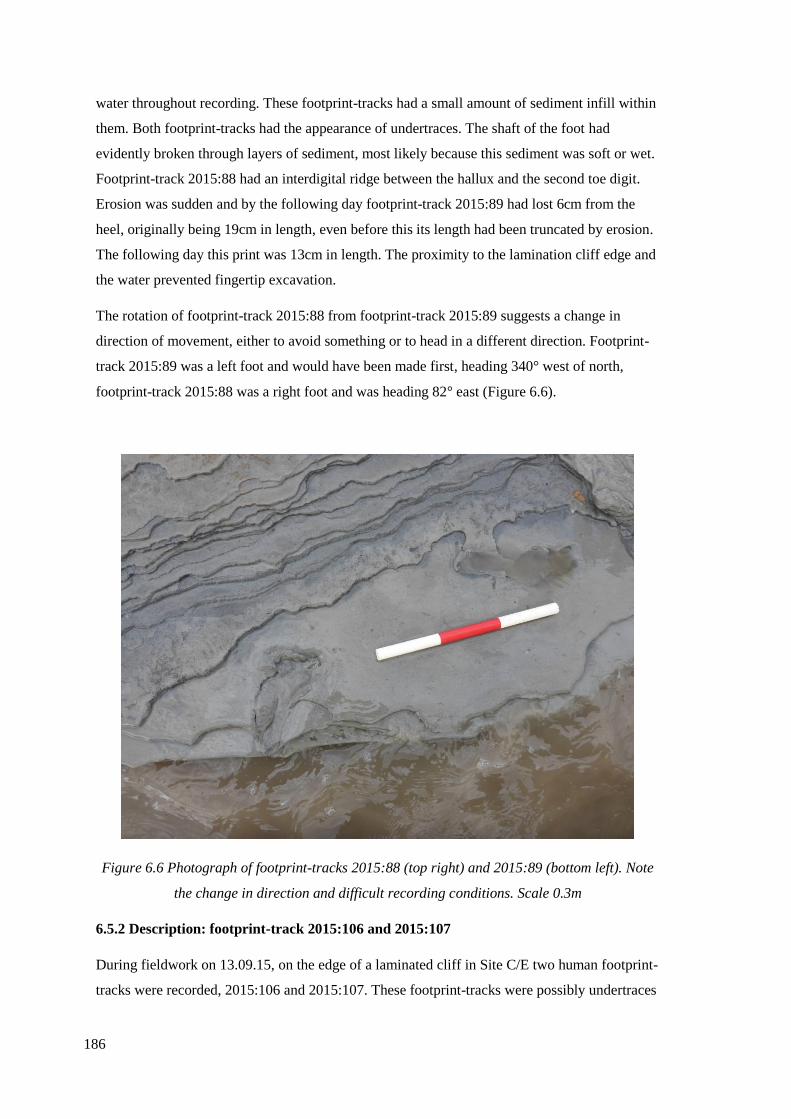
186
water throughout recording. These footprint-tracks had a small amount of sediment infill within
them. Both footprint-tracks had the appearance of undertraces. The shaft of the foot had
evidently broken through layers of sediment, most likely because this sediment was soft or wet.
Footprint-track 2015:88 had an interdigital ridge between the hallux and the second toe digit.
Erosion was sudden and by the following day footprint-track 2015:89 had lost 6cm from the
heel, originally being 19cm in length, even before this its length had been truncated by erosion.
The following day this print was 13cm in length. The proximity to the lamination cliff edge and
the water prevented fingertip excavation.
The rotation of footprint-track 2015:88 from footprint-track 2015:89 suggests a change in
direction of movement, either to avoid something or to head in a different direction. Footprint-
track 2015:89 was a left foot and would have been made first, heading 340° west of north,
footprint-track 2015:88 was a right foot and was heading 82° east (Figure 6.6).
Figure 6.6 Photograph of footprint-tracks 2015:88 (top right) and 2015:89 (bottom left). Note
the change in direction and difficult recording conditions. Scale 0.3m
6.5.2 Description: footprint-track 2015:106 and 2015:107
During fieldwork on 13.09.15, on the edge of a laminated cliff in Site C/E two human footprint-
tracks were recorded, 2015:106 and 2015:107. These footprint-tracks were possibly undertraces
187
as the toes were not preserved in detail. Footprint-track 2015:106 was a left footprint, with a
deep hallux imprint and slight interdigital ridges between all digits (Figure 6.7). This individual
was heading 340° west of north. Footprint-track 2015:107 was also a left footprint, with an
interdigital ridge between the hallux and the second digit (Figure 6.8). Individual 2015:107 was
orientated 226° west towards Goldcliff Island. It is possible that the same individual made both
footprint-tracks, they were on the same lamination, were the same length (30cm), over 10cm in
width and had prominent features (hallux, heel, arch, ball of the foot). The detail preserved in
the footprint-tracks suggests that the sediment was relatively firm, though both footprint-tracks
had evidence of toenail drag from the hallux which again suggests they were made by the same
person.
Figure 6.7 Footprint-track 2015:106. Note North arrow was being used as a scale bar [small
divisions 1cm] and is not representative of direction of north

188
Figure 6.8 Footprint-track 2015:107, with evidence of hallux impression and toe nail drag
6.5.3 Description: footprint-track 2015: 114 and 115
Fieldwork during 28.9.2015 revealed poorly preserved human footprint-tracks on a clean
lamination; these were numbered 2015:114 and 2015:115. The encroaching tide prevented
anything but measurements and standard photographs of these footprint-tracks being recorded,
the photographs were of poor quality however the measurements were informative and allowed
pace to be established. The footprint-tracks were identified as human due to their shape, the
appearance of a foot arch and possible toes indicate that 2015:114 was probably a right and
2015:115 was a left. These footprint-tracks were made on the same lamination, and were the
same size; 26cm in length, 11cm in width. Footprint-track 2015:114 was heading 30° north and
2015:115 was heading 18° north, the similarities in these footprint-tracks suggest that the same
individual made them.
6.5.4 Description: footprint-track 2015:116, 117, 118, 119, 120, 122, 123
Eight footprint-tracks were found on the same lamination, on 28.09.15, these were within a 3m2
area surrounded by mobile sand, some of which could be cleared away to reveal footprint-
tracks. Footprint-tracks 2015:116, 117, 118, 119, 122 and 123 were on the same lamination,
2015:120 was on a thin lamination above (approximately 3mm). This area was recorded by
189
utilising multi-image photogrammetry, enabling point clouds and digital elevation models to be
generated (Figure 6.9 and 6.10).
Footprint-track 2015:116 was a right footprint, with a heel and arch and an interdigital ridge
between the hallux and second digit (Figure 6.11), sediment slightly infilled this footprint-track.
Once fingertip excavation had been performed it was evident that this footprint-track was either
the footprint itself or a slight undertrace, as there was not any further evidence of interdigital
ridges.
Footprint-track 2015:117 was a left footprint, the heel of this footprint and an interdigital ridge
between the hallux and first digit was preserved. This probable undertrace was less well-
preserved/well-formed than 2015:116. The heel of the foot was prominent in this footprint-track
and there was possibly slight drag or skid from the heel before the foot made full contact with
the sediment. Footprint-track 2015:116’s direction of movement was 310° west of north, whilst
2015:117 was orientated west of north 290°.
The other footprint-tracks in this area were less obviously human. Footprint-track 2015:118 was
a very deep impression. It was long and very slender, with a small suggestion of toe
indentations, though there were no interdigital ridges (Figure 6.12). This footprint-track was
deep, approximately 4cm, the slenderness of the print may indicate that this is the shaft of the
print rather than the actual footprint. Due to this it was unclear if this was a left or right
footprint, though this footprint-track was likely heading 330° west of north.
Footprint-track 2015:119 was identified due to the localised disturbance in the lamination,
however there were not enough identifying features visible to accurately identify as human, or
indeed any other animal. Footprint-track 2015:120 was an undertrace, could only be seen in
certain light, and was one thin lamination band above 2015:116. The direction of movement
was established due to the shape of the undertrace, where the heel was identified, though the
left/right foot side was not. This individual was heading 270° west.
Two further human footprint-tracks were identified in this area, though again they were very
poorly preserved and were more of a disturbance to the lamination than a clear footprint-track,
possibly overtraces. These footprint-tracks were assigned the identification number 2015:122
and 2015:123. They were tentatively identified as human due to the shape and probable heel.
They were heading 290° west of north. These were identified the day after the other footprint-
tracks had been recorded and as such are not included within the point cloud model. They were
both to the west of the point cloud model.
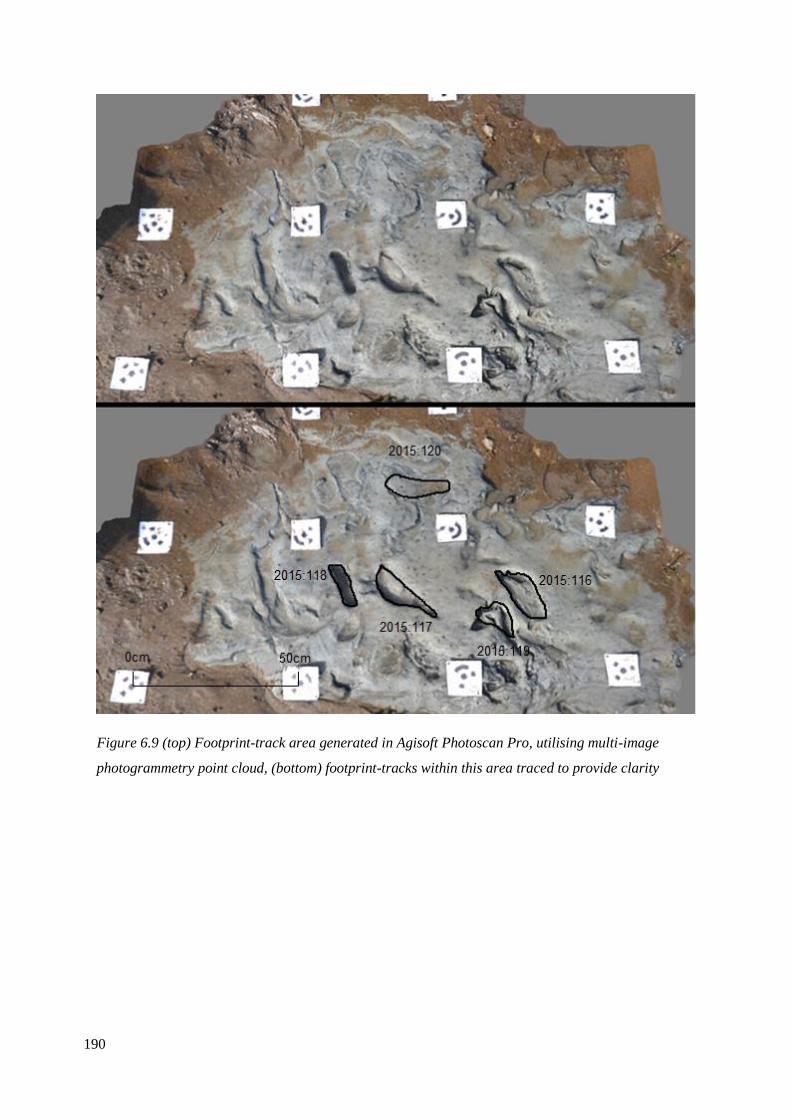
190
Figure 6.9 (top) Footprint-track area generated in Agisoft Photoscan Pro, utilising multi-image
photogrammetry point cloud, (bottom) footprint-tracks within this area traced to provide clarity
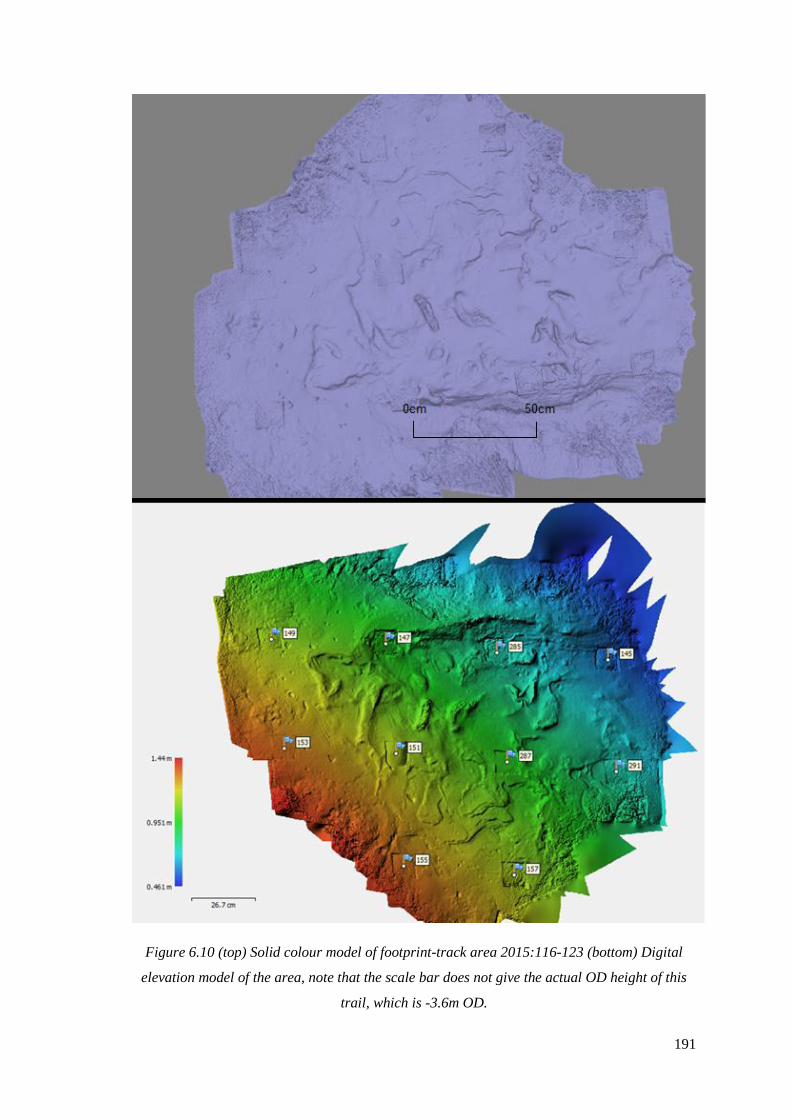
191
Figure 6.10 (top) Solid colour model of footprint-track area 2015:116-123 (bottom) Digital
elevation model of the area, note that the scale bar does not give the actual OD height of this
trail, which is -3.6m OD.
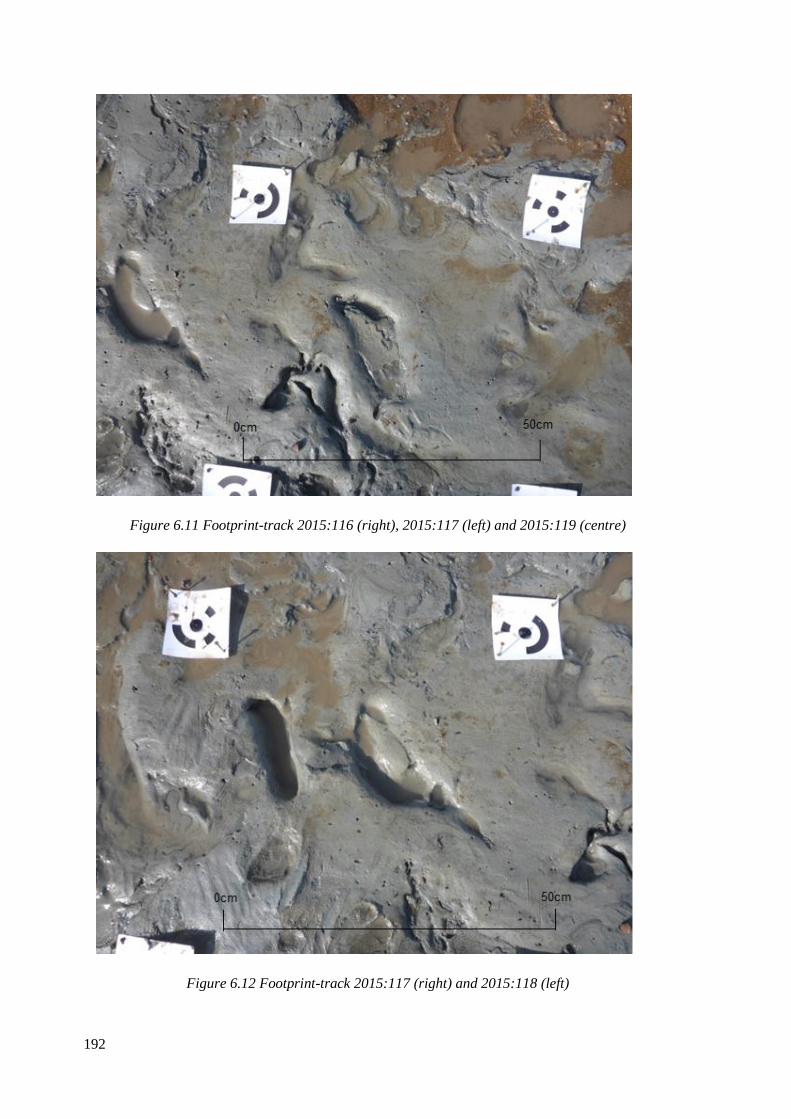
192
Figure 6.11 Footprint-track 2015:116 (right), 2015:117 (left) and 2015:119 (centre)
Figure 6.12 Footprint-track 2015:117 (right) and 2015:118 (left)
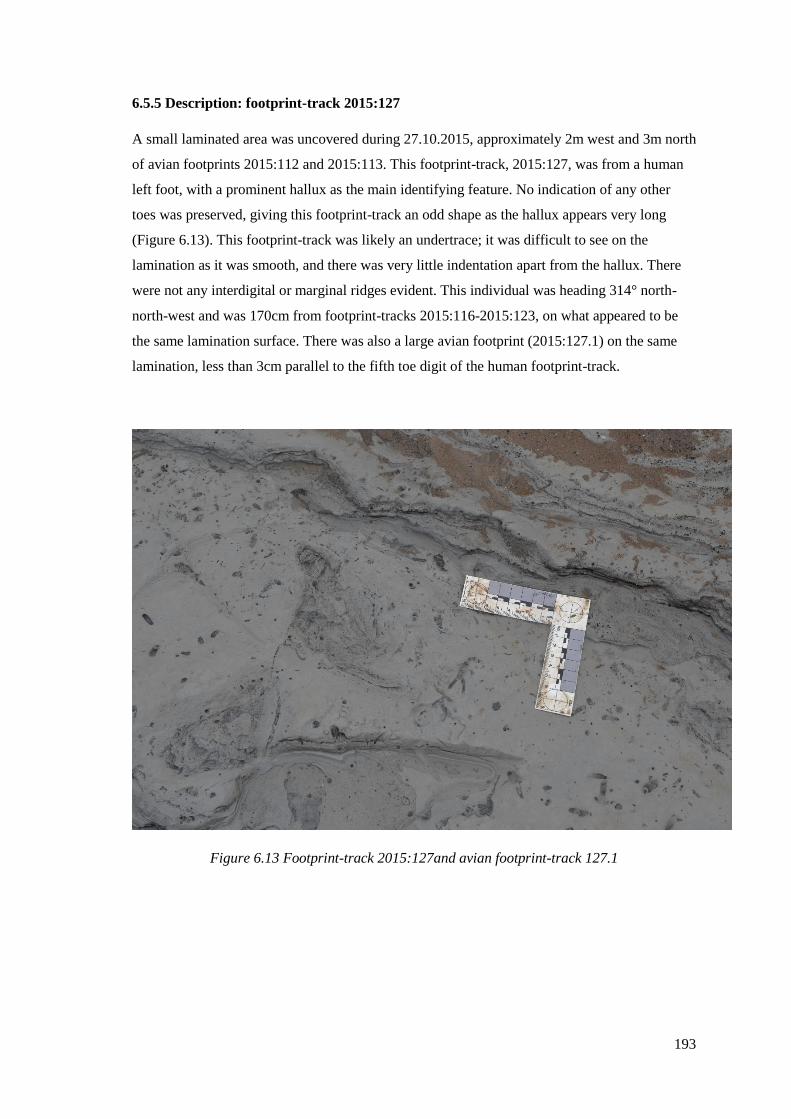
193
6.5.5 Description: footprint-track 2015:127
A small laminated area was uncovered during 27.10.2015, approximately 2m west and 3m north
of avian footprints 2015:112 and 2015:113. This footprint-track, 2015:127, was from a human
left foot, with a prominent hallux as the main identifying feature. No indication of any other
toes was preserved, giving this footprint-track an odd shape as the hallux appears very long
(Figure 6.13). This footprint-track was likely an undertrace; it was difficult to see on the
lamination as it was smooth, and there was very little indentation apart from the hallux. There
were not any interdigital or marginal ridges evident. This individual was heading 314° north-
north-west and was 170cm from footprint-tracks 2015:116-2015:123, on what appeared to be
the same lamination surface. There was also a large avian footprint (2015:127.1) on the same
lamination, less than 3cm parallel to the fifth toe digit of the human footprint-track.
Figure 6.13 Footprint-track 2015:127and avian footprint-track 127.1
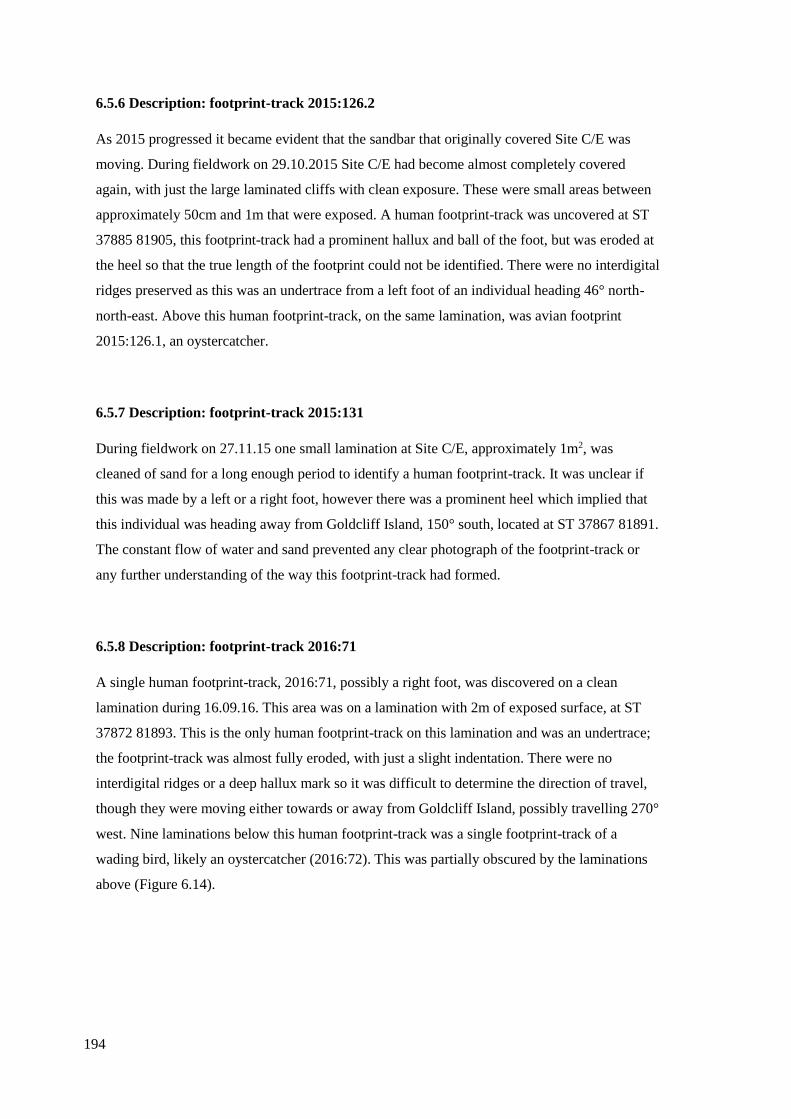
194
6.5.6 Description: footprint-track 2015:126.2
As 2015 progressed it became evident that the sandbar that originally covered Site C/E was
moving. During fieldwork on 29.10.2015 Site C/E had become almost completely covered
again, with just the large laminated cliffs with clean exposure. These were small areas between
approximately 50cm and 1m that were exposed. A human footprint-track was uncovered at ST
37885 81905, this footprint-track had a prominent hallux and ball of the foot, but was eroded at
the heel so that the true length of the footprint could not be identified. There were no interdigital
ridges preserved as this was an undertrace from a left foot of an individual heading 46° north-
north-east. Above this human footprint-track, on the same lamination, was avian footprint
2015:126.1, an oystercatcher.
6.5.7 Description: footprint-track 2015:131
During fieldwork on 27.11.15 one small lamination at Site C/E, approximately 1m2, was
cleaned of sand for a long enough period to identify a human footprint-track. It was unclear if
this was made by a left or a right foot, however there was a prominent heel which implied that
this individual was heading away from Goldcliff Island, 150° south, located at ST 37867 81891.
The constant flow of water and sand prevented any clear photograph of the footprint-track or
any further understanding of the way this footprint-track had formed.
6.5.8 Description: footprint-track 2016:71
A single human footprint-track, 2016:71, possibly a right foot, was discovered on a clean
lamination during 16.09.16. This area was on a lamination with 2m of exposed surface, at ST
37872 81893. This is the only human footprint-track on this lamination and was an undertrace;
the footprint-track was almost fully eroded, with just a slight indentation. There were no
interdigital ridges or a deep hallux mark so it was difficult to determine the direction of travel,
though they were moving either towards or away from Goldcliff Island, possibly travelling 270°
west. Nine laminations below this human footprint-track was a single footprint-track of a
wading bird, likely an oystercatcher (2016:72). This was partially obscured by the laminations
above (Figure 6.14).
195
Figure 6.14 Footprint-track 2016:71 multiple laminations above 2016:72, an oystercatcher
footprint-track, scale cm divisions
6.5.9 Analysis of Site C/E footprint-tracks
The experimental footprint research results (Chapter 5) enabled the footprint-tracks in Site C/E
to be explored, with inferences made about age, sex, and stature. The most important part of
analysis was in confirming that the footprint-tracks were human. Figure 6.15 demonstrates the
lengths and widths of the human footprint-tracks recorded at Site C/E. Figure 6.16 displays
these footprint-tracks against those recorded during the human footprint experiment. By
comparing the lengths and widths of the footprints it is evident that the footprint-tracks from
Site C/E were similar in size to both modern children and adults.
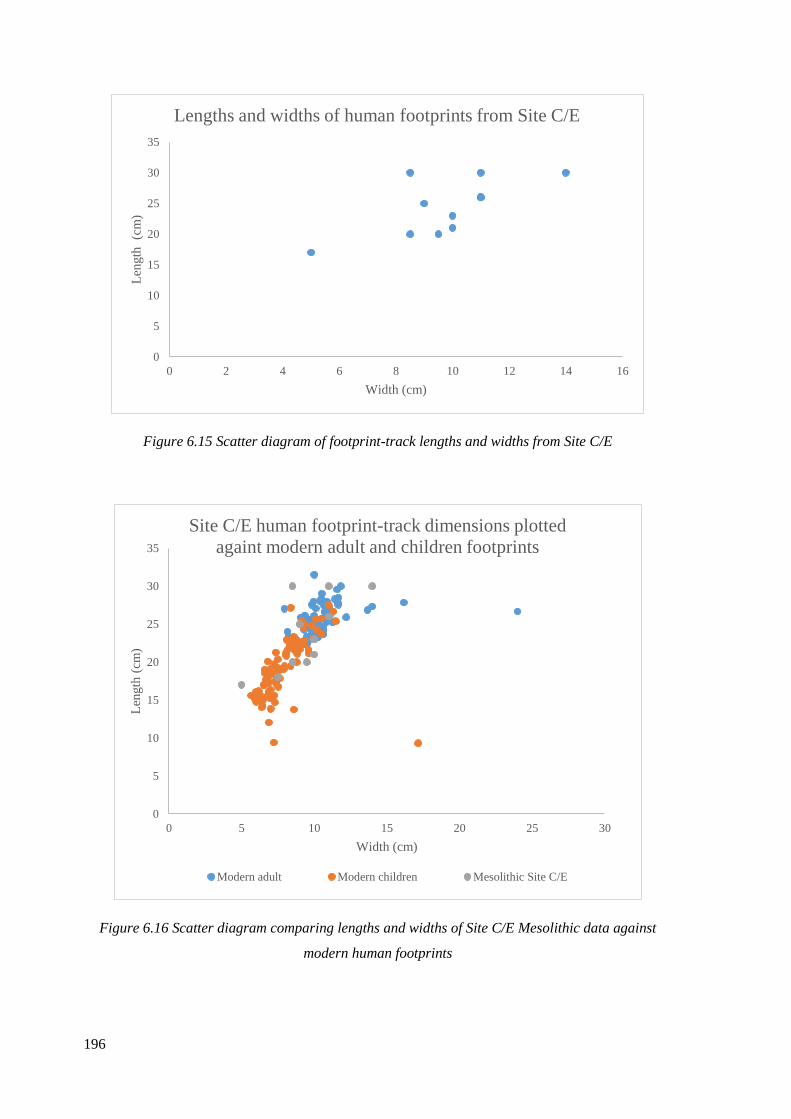
196
Figure 6.15 Scatter diagram of footprint-track lengths and widths from Site C/E
Figure 6.16 Scatter diagram comparing lengths and widths of Site C/E Mesolithic data against
modern human footprints
0
5
10
15
20
25
30
35
0 2 4 6 8 10 12 14 16
Len
gth
(c
m)
Width (cm)
Lengths and widths of human footprints from Site C/E
0
5
10
15
20
25
30
35
0 5 10 15 20 25 30
Len
gth
(cm
)
Width (cm)
Site C/E human footprint-track dimensions plotted
againt modern adult and children footprints
Modern adult Modern children Mesolithic Site C/E
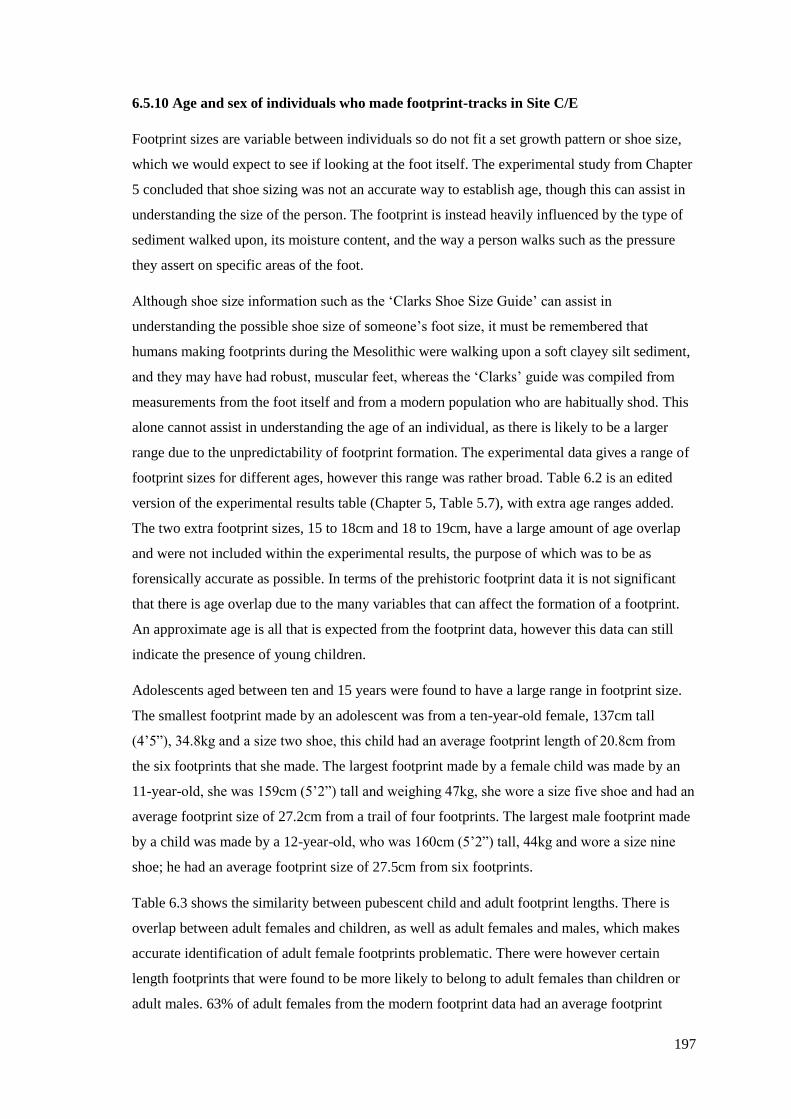
197
6.5.10 Age and sex of individuals who made footprint-tracks in Site C/E
Footprint sizes are variable between individuals so do not fit a set growth pattern or shoe size,
which we would expect to see if looking at the foot itself. The experimental study from Chapter
5 concluded that shoe sizing was not an accurate way to establish age, though this can assist in
understanding the size of the person. The footprint is instead heavily influenced by the type of
sediment walked upon, its moisture content, and the way a person walks such as the pressure
they assert on specific areas of the foot.
Although shoe size information such as the ‘Clarks Shoe Size Guide’ can assist in
understanding the possible shoe size of someone’s foot size, it must be remembered that
humans making footprints during the Mesolithic were walking upon a soft clayey silt sediment,
and they may have had robust, muscular feet, whereas the ‘Clarks’ guide was compiled from
measurements from the foot itself and from a modern population who are habitually shod. This
alone cannot assist in understanding the age of an individual, as there is likely to be a larger
range due to the unpredictability of footprint formation. The experimental data gives a range of
footprint sizes for different ages, however this range was rather broad. Table 6.2 is an edited
version of the experimental results table (Chapter 5, Table 5.7), with extra age ranges added.
The two extra footprint sizes, 15 to 18cm and 18 to 19cm, have a large amount of age overlap
and were not included within the experimental results, the purpose of which was to be as
forensically accurate as possible. In terms of the prehistoric footprint data it is not significant
that there is age overlap due to the many variables that can affect the formation of a footprint.
An approximate age is all that is expected from the footprint data, however this data can still
indicate the presence of young children.
Adolescents aged between ten and 15 years were found to have a large range in footprint size.
The smallest footprint made by an adolescent was from a ten-year-old female, 137cm tall
(4’5”), 34.8kg and a size two shoe, this child had an average footprint length of 20.8cm from
the six footprints that she made. The largest footprint made by a female child was made by an
11-year-old, she was 159cm (5’2”) tall and weighing 47kg, she wore a size five shoe and had an
average footprint size of 27.2cm from a trail of four footprints. The largest male footprint made
by a child was made by a 12-year-old, who was 160cm (5’2”) tall, 44kg and wore a size nine
shoe; he had an average footprint size of 27.5cm from six footprints.
Table 6.3 shows the similarity between pubescent child and adult footprint lengths. There is
overlap between adult females and children, as well as adult females and males, which makes
accurate identification of adult female footprints problematic. There were however certain
length footprints that were found to be more likely to belong to adult females than children or
adult males. 63% of adult females from the modern footprint data had an average footprint
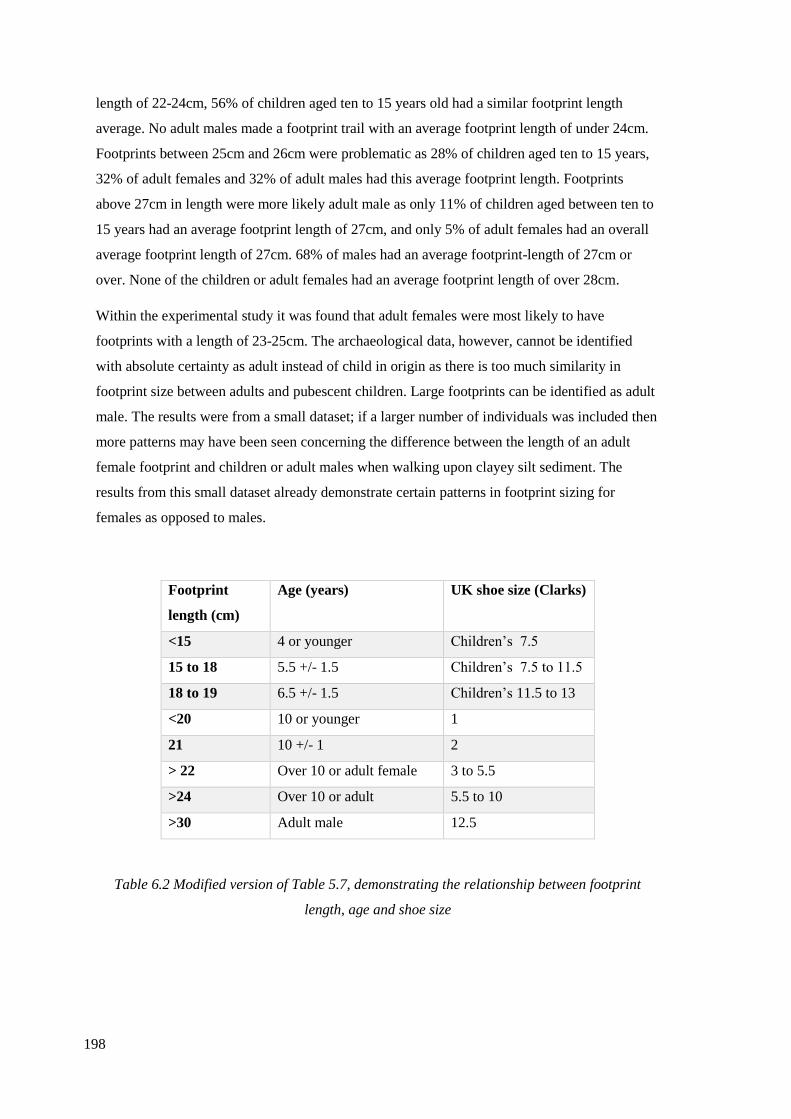
198
length of 22-24cm, 56% of children aged ten to 15 years old had a similar footprint length
average. No adult males made a footprint trail with an average footprint length of under 24cm.
Footprints between 25cm and 26cm were problematic as 28% of children aged ten to 15 years,
32% of adult females and 32% of adult males had this average footprint length. Footprints
above 27cm in length were more likely adult male as only 11% of children aged between ten to
15 years had an average footprint length of 27cm, and only 5% of adult females had an overall
average footprint length of 27cm. 68% of males had an average footprint-length of 27cm or
over. None of the children or adult females had an average footprint length of over 28cm.
Within the experimental study it was found that adult females were most likely to have
footprints with a length of 23-25cm. The archaeological data, however, cannot be identified
with absolute certainty as adult instead of child in origin as there is too much similarity in
footprint size between adults and pubescent children. Large footprints can be identified as adult
male. The results were from a small dataset; if a larger number of individuals was included then
more patterns may have been seen concerning the difference between the length of an adult
female footprint and children or adult males when walking upon clayey silt sediment. The
results from this small dataset already demonstrate certain patterns in footprint sizing for
females as opposed to males.
Footprint
length (cm)
Age (years) UK shoe size (Clarks)
<15 4 or younger Children’s 7.5
15 to 18 5.5 +/- 1.5 Children’s 7.5 to 11.5
18 to 19 6.5 +/- 1.5 Children’s 11.5 to 13
<20 10 or younger 1
21 10 +/- 1 2
> 22 Over 10 or adult female 3 to 5.5
>24 Over 10 or adult 5.5 to 10
>30 Adult male 12.5
Table 6.2 Modified version of Table 5.7, demonstrating the relationship between footprint
length, age and shoe size
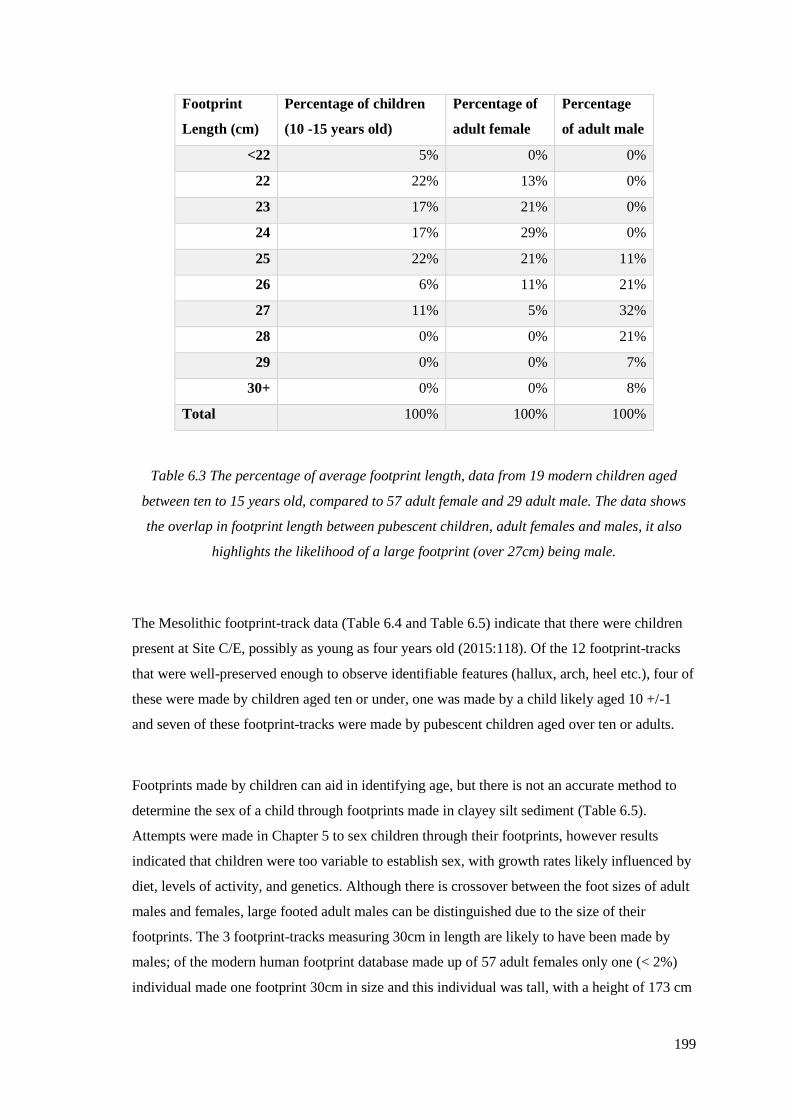
199
Footprint
Length (cm)
Percentage of children
(10 -15 years old)
Percentage of
adult female
Percentage
of adult male
<22 5% 0% 0%
22 22% 13% 0%
23 17% 21% 0%
24 17% 29% 0%
25 22% 21% 11%
26 6% 11% 21%
27 11% 5% 32%
28 0% 0% 21%
29 0% 0% 7%
30+ 0% 0% 8%
Total 100% 100% 100%
Table 6.3 The percentage of average footprint length, data from 19 modern children aged
between ten to 15 years old, compared to 57 adult female and 29 adult male. The data shows
the overlap in footprint length between pubescent children, adult females and males, it also
highlights the likelihood of a large footprint (over 27cm) being male.
The Mesolithic footprint-track data (Table 6.4 and Table 6.5) indicate that there were children
present at Site C/E, possibly as young as four years old (2015:118). Of the 12 footprint-tracks
that were well-preserved enough to observe identifiable features (hallux, arch, heel etc.), four of
these were made by children aged ten or under, one was made by a child likely aged 10 +/-1
and seven of these footprint-tracks were made by pubescent children aged over ten or adults.
Footprints made by children can aid in identifying age, but there is not an accurate method to
determine the sex of a child through footprints made in clayey silt sediment (Table 6.5).
Attempts were made in Chapter 5 to sex children through their footprints, however results
indicated that children were too variable to establish sex, with growth rates likely influenced by
diet, levels of activity, and genetics. Although there is crossover between the foot sizes of adult
males and females, large footed adult males can be distinguished due to the size of their
footprints. The 3 footprint-tracks measuring 30cm in length are likely to have been made by
males; of the modern human footprint database made up of 57 adult females only one (< 2%)
individual made one footprint 30cm in size and this individual was tall, with a height of 173 cm

200
(5’8”) and wore a size eight shoe. This individual made three other footprints which were
between 26.5cm and 26.8cm in length, suggesting slippage occurred.
Footprint-
track
number
Probable age range
(years)
Footprint-track length
(cm)
UK Shoe Size
(Clarks)
2015:88 10 or younger 20 1
2015:106 Adult 30 12.5
2015:107 Adult 30 12.5
2015:114 Adult 26 8
2015:115 Adult 26 8
2015:116 10 +/- 1 21 2
2015:117 10 + or adult female 23 4.5
2015:118 5.5 +/- 1.5 17 Children’s 10.5
2015:119 Adult 30 12.5
2015:127 10 to adult 25 6.5
2015:131 10 or younger 20 1
2016:71 6 +/- 1.5 18 Children’s 11.5
Table 6.4 Estimated age, footprint-track length and UK shoe size of prehistoric footprint-tracks
from Site C/E
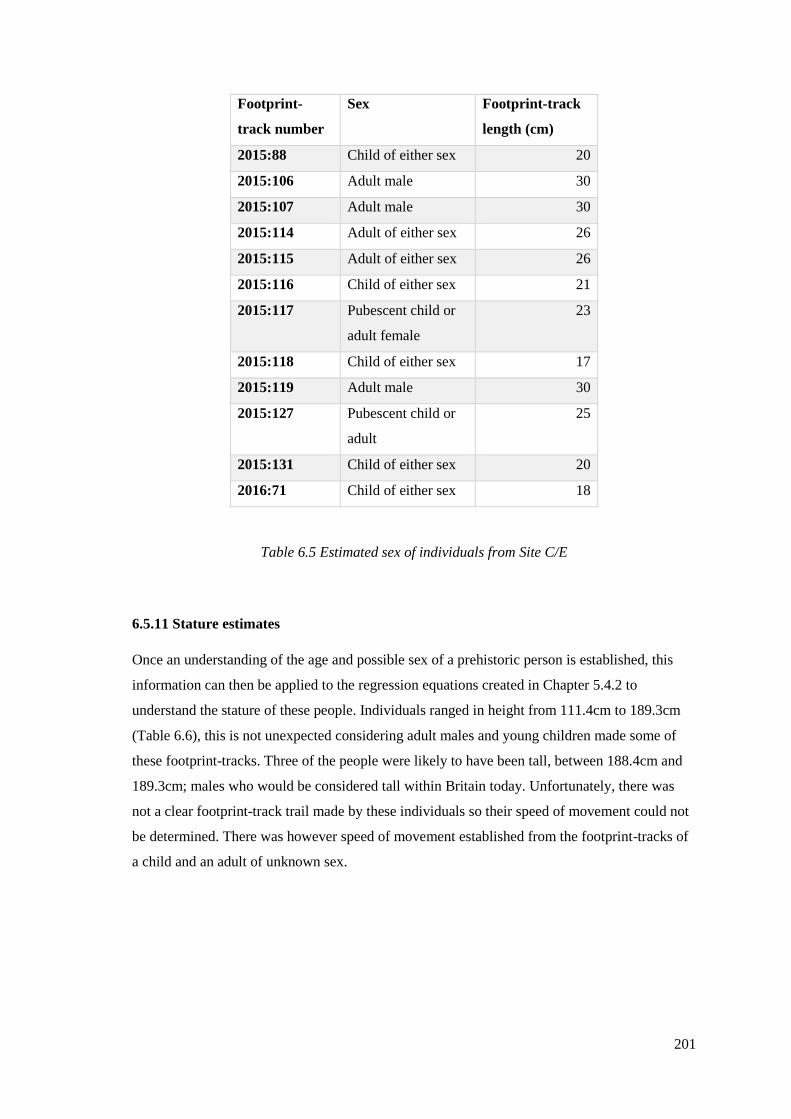
201
Footprint-
track number
Sex Footprint-track
length (cm)
2015:88 Child of either sex 20
2015:106 Adult male 30
2015:107 Adult male 30
2015:114 Adult of either sex 26
2015:115 Adult of either sex 26
2015:116 Child of either sex 21
2015:117 Pubescent child or
adult female
23
2015:118 Child of either sex 17
2015:119 Adult male 30
2015:127 Pubescent child or
adult
25
2015:131 Child of either sex 20
2016:71 Child of either sex 18
Table 6.5 Estimated sex of individuals from Site C/E
6.5.11 Stature estimates
Once an understanding of the age and possible sex of a prehistoric person is established, this
information can then be applied to the regression equations created in Chapter 5.4.2 to
understand the stature of these people. Individuals ranged in height from 111.4cm to 189.3cm
(Table 6.6), this is not unexpected considering adult males and young children made some of
these footprint-tracks. Three of the people were likely to have been tall, between 188.4cm and
189.3cm; males who would be considered tall within Britain today. Unfortunately, there was
not a clear footprint-track trail made by these individuals so their speed of movement could not
be determined. There was however speed of movement established from the footprint-tracks of
a child and an adult of unknown sex.
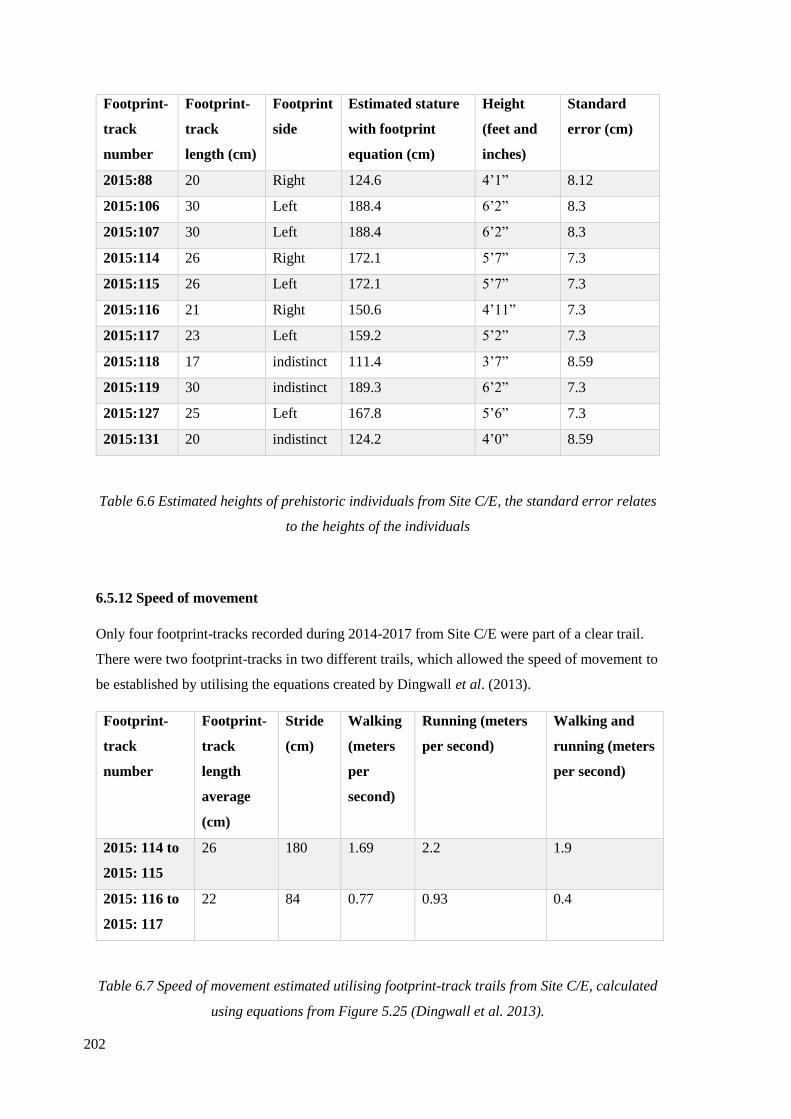
202
Footprint-
track
number
Footprint-
track
length (cm)
Footprint
side
Estimated stature
with footprint
equation (cm)
Height
(feet and
inches)
Standard
error (cm)
2015:88 20 Right 124.6 4’1” 8.12
2015:106 30 Left 188.4 6’2” 8.3
2015:107 30 Left 188.4 6’2” 8.3
2015:114 26 Right 172.1 5’7” 7.3
2015:115 26 Left 172.1 5’7” 7.3
2015:116 21 Right 150.6 4’11” 7.3
2015:117 23 Left 159.2 5’2” 7.3
2015:118 17 indistinct 111.4 3’7” 8.59
2015:119 30 indistinct 189.3 6’2” 7.3
2015:127 25 Left 167.8 5’6” 7.3
2015:131 20 indistinct 124.2 4’0” 8.59
Table 6.6 Estimated heights of prehistoric individuals from Site C/E, the standard error relates
to the heights of the individuals
6.5.12 Speed of movement
Only four footprint-tracks recorded during 2014-2017 from Site C/E were part of a clear trail.
There were two footprint-tracks in two different trails, which allowed the speed of movement to
be established by utilising the equations created by Dingwall et al. (2013).
Footprint-
track
number
Footprint-
track
length
average
(cm)
Stride
(cm)
Walking
(meters
per
second)
Running (meters
per second)
Walking and
running (meters
per second)
2015: 114 to
2015: 115
26 180 1.69 2.2 1.9
2015: 116 to
2015: 117
22 84 0.77 0.93 0.4
Table 6.7 Speed of movement estimated utilising footprint-track trails from Site C/E, calculated
using equations from Figure 5.25 (Dingwall et al. 2013).

203
Table 6.7 shows the estimated speed for two individuals. It is likely that the person who made
footprint-tracks 2015:114 and 2015:115 was jogging or walking at a very quick pace. They
were approximately 172.1cm (5’7”) tall and may have been either sex. The arch of the foot was
the most prominent feature in these footprint-tracks. When habitually unshod people run, it is
often on the forefoot or midfoot rather than the hindfoot (Perl et al. 2012) however these
footprint-tracks displayed evidence of the arch of the foot, which suggests that the individual
modified their movement due to the substrate they were stepping on, or that they were walking
at a very quick pace. They would have been travelling at approximately 8km per hour (5mph);
an average person at a relative walking pace travels approximately 5 to 6km per hour (3 to
4mph). It is unlikely that they were running due to the depth and footprint-track appearance,
though they may have been slowly jogging on unstable sediment.
The hunter-gatherer who made footprint-tracks 2015:116 and 2015:117 was probably a
pubescent child or a small adult female, with stature ranging between 150.6cm to 159.2cm
(between 4’11” and 5’2”). They were not running or moving quickly, in keeping this pace they
would travel only 3km per hour (2mph). This is also indicated by the deep hallux marks; when
running it is unlikely that a person will curl their toes. This individual was walking at a very
slow pace, the deep hallux marks, prominent heel and arch of the foot may suggest that they
were carrying something heavy. They may also have been walking slowly due to the sediment,
perhaps this was wet or soft resulting in a slower pace to remain stable.
6.5.13 Direction of movement
Figure 6.17 shows the location of the footprint-tracks recorded on Site C/E. During fieldwork
the orientation of the footprint-tracks was noted to identify the direction in which the footprint-
tracks were heading. The most common direction of movement was seen in nine (50%)
footprint-tracks heading west/north-west, between 226° west and 340° west of north, towards
Goldcliff Island. A further two (11%) footprint-tracks were orientated north, at 18° and 30°,
three (17%) were heading east-north-east away from Goldcliff Island, at between 42° and 82°,
and one (5%) was orientated south-east at 150°; this would take this person out towards the sea.
Although identifiable as human footprint-tracks, three (17%) were poorly preserved and so the
direction of movement for these could not be accurately established. The footprint-tracks
recorded at Site C/E were moving in a northerly direction, rather than to the south, with only
one footprint-track identified as orientated in a southerly direction.
The direction of movement of the footprint-tracks may provide an insight into specific
resources the people were exploiting, or the different areas of activity. This may also provide an
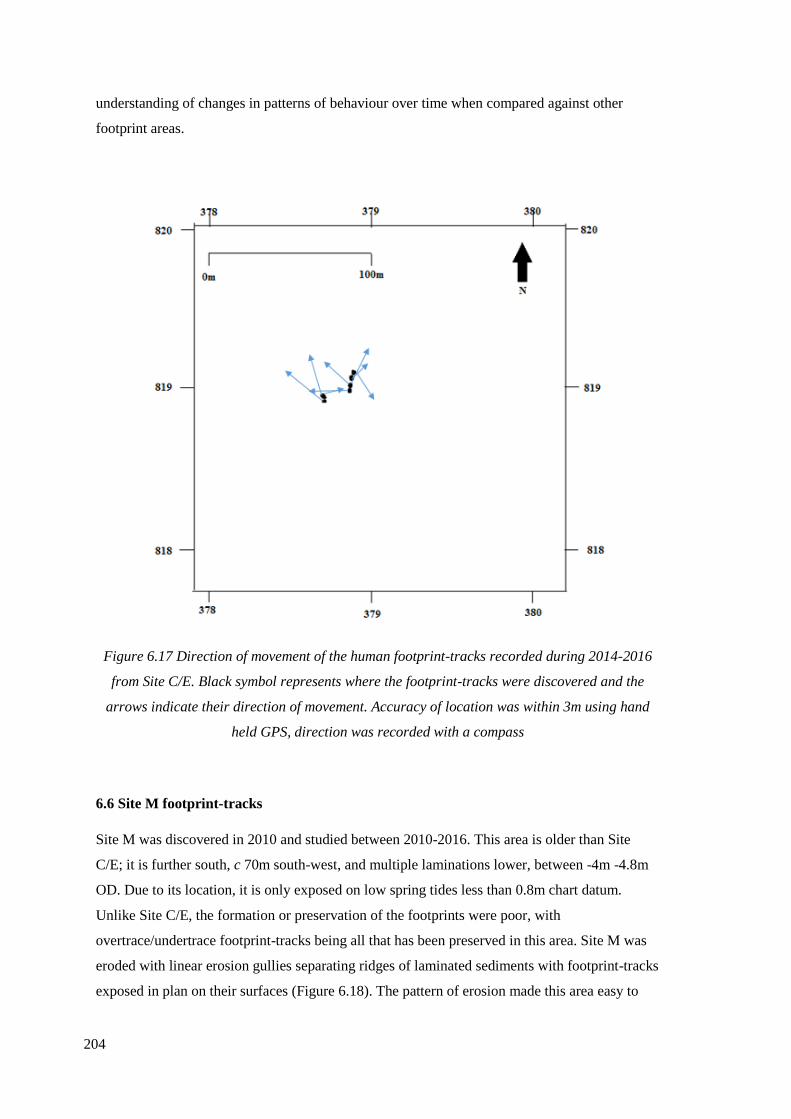
204
understanding of changes in patterns of behaviour over time when compared against other
footprint areas.
Figure 6.17 Direction of movement of the human footprint-tracks recorded during 2014-2016
from Site C/E. Black symbol represents where the footprint-tracks were discovered and the
arrows indicate their direction of movement. Accuracy of location was within 3m using hand
held GPS, direction was recorded with a compass
6.6 Site M footprint-tracks
Site M was discovered in 2010 and studied between 2010-2016. This area is older than Site
C/E; it is further south, c 70m south-west, and multiple laminations lower, between -4m -4.8m
OD. Due to its location, it is only exposed on low spring tides less than 0.8m chart datum.
Unlike Site C/E, the formation or preservation of the footprints were poor, with
overtrace/undertrace footprint-tracks being all that has been preserved in this area. Site M was
eroded with linear erosion gullies separating ridges of laminated sediments with footprint-tracks
exposed in plan on their surfaces (Figure 6.18). The pattern of erosion made this area easy to
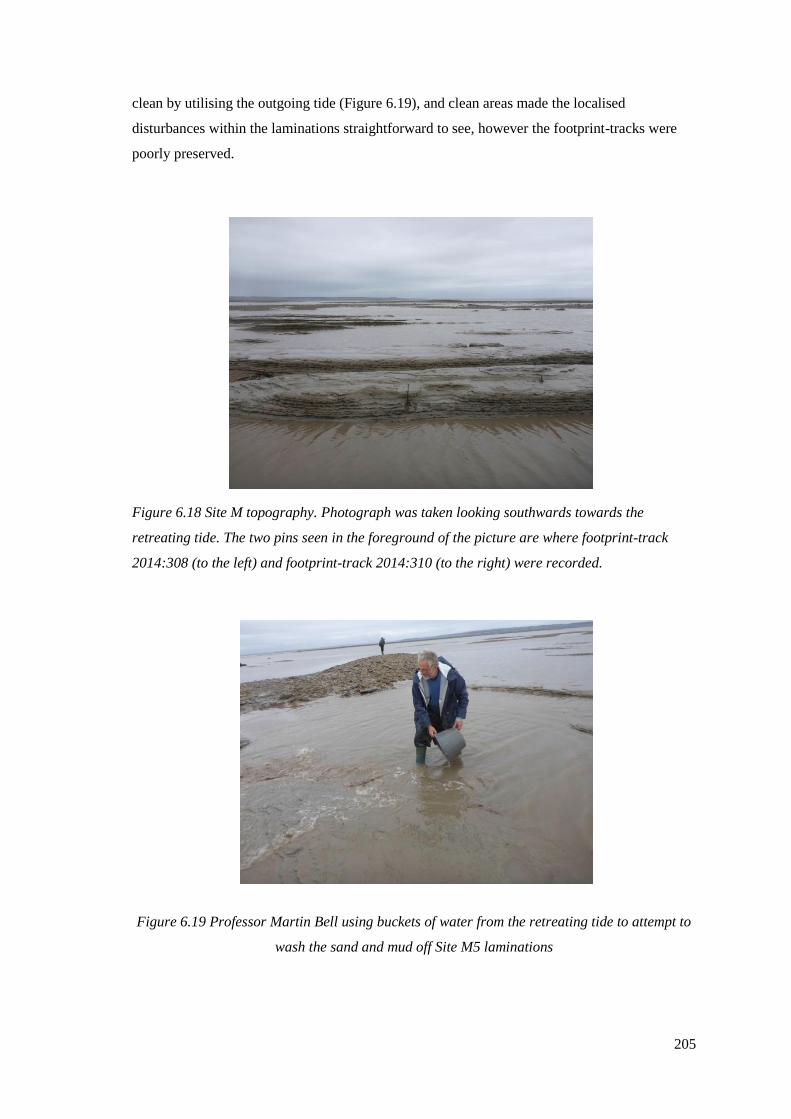
205
clean by utilising the outgoing tide (Figure 6.19), and clean areas made the localised
disturbances within the laminations straightforward to see, however the footprint-tracks were
poorly preserved.
Figure 6.18 Site M topography. Photograph was taken looking southwards towards the
retreating tide. The two pins seen in the foreground of the picture are where footprint-track
2014:308 (to the left) and footprint-track 2014:310 (to the right) were recorded.
Figure 6.19 Professor Martin Bell using buckets of water from the retreating tide to attempt to
wash the sand and mud off Site M5 laminations
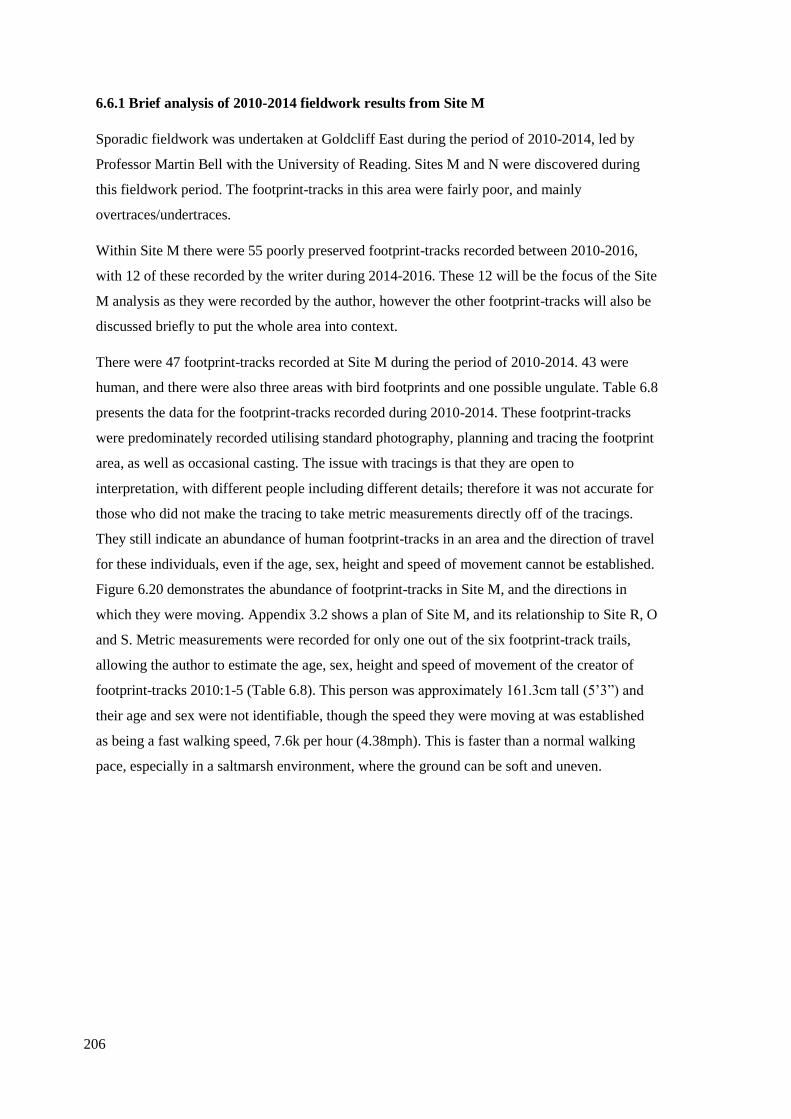
206
6.6.1 Brief analysis of 2010-2014 fieldwork results from Site M
Sporadic fieldwork was undertaken at Goldcliff East during the period of 2010-2014, led by
Professor Martin Bell with the University of Reading. Sites M and N were discovered during
this fieldwork period. The footprint-tracks in this area were fairly poor, and mainly
overtraces/undertraces.
Within Site M there were 55 poorly preserved footprint-tracks recorded between 2010-2016,
with 12 of these recorded by the writer during 2014-2016. These 12 will be the focus of the Site
M analysis as they were recorded by the author, however the other footprint-tracks will also be
discussed briefly to put the whole area into context.
There were 47 footprint-tracks recorded at Site M during the period of 2010-2014. 43 were
human, and there were also three areas with bird footprints and one possible ungulate. Table 6.8
presents the data for the footprint-tracks recorded during 2010-2014. These footprint-tracks
were predominately recorded utilising standard photography, planning and tracing the footprint
area, as well as occasional casting. The issue with tracings is that they are open to
interpretation, with different people including different details; therefore it was not accurate for
those who did not make the tracing to take metric measurements directly off of the tracings.
They still indicate an abundance of human footprint-tracks in an area and the direction of travel
for these individuals, even if the age, sex, height and speed of movement cannot be established.
Figure 6.20 demonstrates the abundance of footprint-tracks in Site M, and the directions in
which they were moving. Appendix 3.2 shows a plan of Site M, and its relationship to Site R, O
and S. Metric measurements were recorded for only one out of the six footprint-track trails,
allowing the author to estimate the age, sex, height and speed of movement of the creator of
footprint-tracks 2010:1-5 (Table 6.8). This person was approximately 161.3cm tall (5’3”) and
their age and sex were not identifiable, though the speed they were moving at was established
as being a fast walking speed, 7.6k per hour (4.38mph). This is faster than a normal walking
pace, especially in a saltmarsh environment, where the ground can be soft and uneven.

207
Footprint-
track
number
Footprint-
track
length
(cm)
Pace
length
(cm)
Stride
length
(cm)
Direction
of
movement
Part of
clear
trail
Number
of
footprints
in trail
Trail
number
2010:1 28 - - 233° west
south west
yes 5 1
2010:2 23 28 - 233° west
south west
yes 5 1
2010:3 36 14 - 233° west
south west
yes 5 1
2010:4 23 32 60 233° west
south west
yes 5 1
2010:5 20 26 40 233° west
south west
yes 5 1
2010:21 21 - - 235° south
west
no - -
2010:22 27 - - 235° south
west
no - -
2010:23 24 - - 235° south
west
no - -
2010:24 21 - - 235° south
west
no - -
2010:25 21 - - 235° south
west
no - -
2010:26 23 - - 235° south
west
no - -
2010:27 26 - - 235° south
west
no - -
2010:28 10 (heel
only)
- - 235° south
west
no - -
2010:29 12 (heel
only)
- - 235° south
west
no - -
2010:30 20 - - 235° south
west
no - -
2010:31 - - - 235° south
west
no - -

208
2010:46 - - - 270° west no - -
2010:48 16 - - 245° west
south west
yes 6 2
2010:49 - - - 232° south
west
yes 6 2
2010:50 22 - - 232° south
west
yes 6 2
2010:51 22 - - 238° south
west
yes 6 2
2010:52 28 - - 238° south
west
yes 6 2
2011:138 - - - 180° south no - -
2011:139 - - - 268° west no - -
2011:150 - - - 250° west
south west
yes 6 2
2011:151 - - - 195° south no - -
2011:152 - - - 190° south no - -
2011:153 - - - 250° west
south west
yes 2 3
2011:154 - - - 250° west
south west
yes 2 3
2011:155 - - - 240° west
south west
no - -
2011:156
probable
ungulate
- - - - - - -
2011:157 - - - 185° south no - -
2011:158 - - - 266° west no - -
2011:159 - - - 210° south
south west
yes 2 4
2011:160 - - - 210° south
south west
yes 2 4
2011:162 - - - 230° south
west
no 2 5
2011:163 - - - 230° south
west
no 2 5

209
2011:160a - - - 240° west
south west
yes 6 6
2011:161 - - - 240° west
south west
yes 6 6
2011:162 - - - 240° west
south west
yes 6 6
2011:163 - - - 240° west
south west
yes 6 6
2011:164 - - - 240° west
south west
yes 6 6
2011:165 - - - 240° west
south west
yes 6 6
Table 6.8 Data from footprint-tracks from Site M, recorded 2010-2014. Missing data is due to a
lack of complementary metric measurement data to accompany the tracings
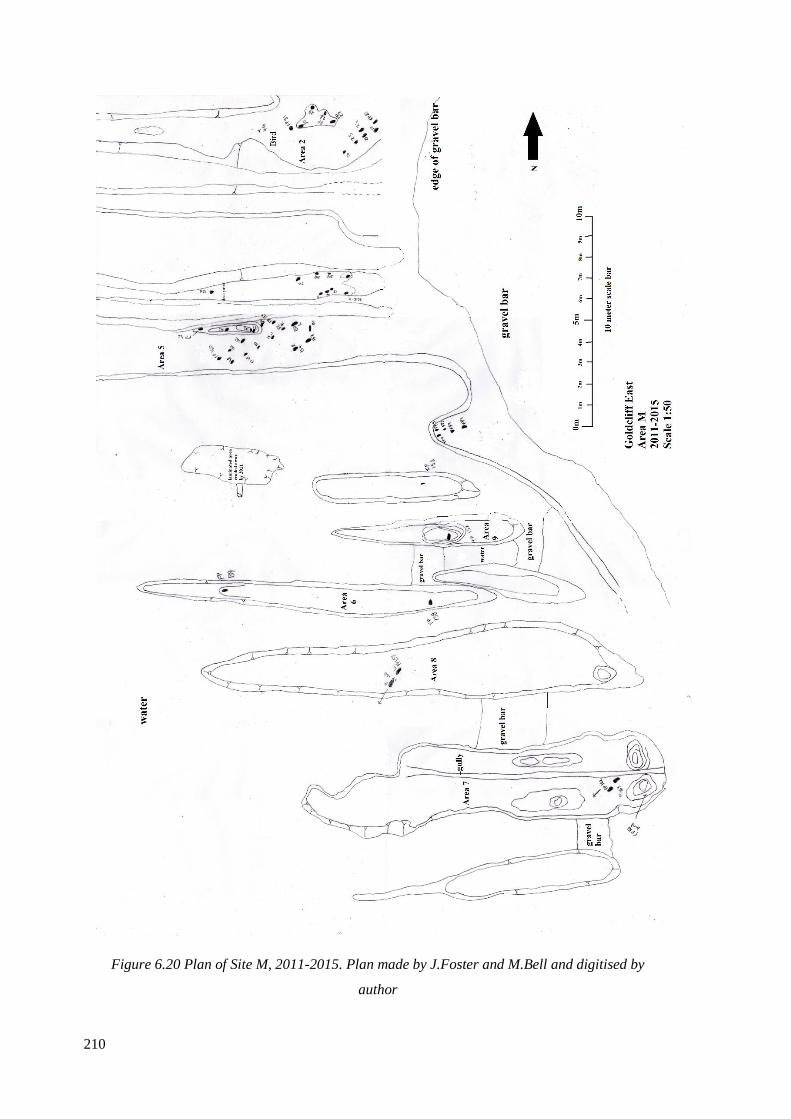
210
Figure 6.20 Plan of Site M, 2011-2015. Plan made by J.Foster and M.Bell and digitised by
author
211
Footprint-
track
number
Age
range
(years)
Average
height
(cm)
Average
height
(feet
and
inches)
Foot
length
average
(cm)
British
shoe
size
Walk
speed
(meters
per
second)
Run
speed
(meters
per
second)
Direction
of
movement
No. of
footprint-
tracks in
trail
2010:1-5 Adult 161.3 5’3” 26 8 1.96 1.92 233° west
south west
5
Table 6.9 Speed of movement of individual 2010:1-5
6.6.2 Analysis of Site M footprint-tracks 2014-2016
Although all Site M footprint-tracks were overtraces or undertraces, several had clear features
of the foot still evident, such as heel or hallux, which meant they could be identified as human.
Others were in clear trails formed by an obvious left-right-left-right human gait, enabling
identification even when morphological features were lacking. The footprint-tracks ranged in
length from 13cm to 33cm and 8cm to 14cm in width (Table 6.10). The footprint-tracks were all
made on similar lamination layers and were within less than 37m of one another.
212
Footprint-
track number
Site Length
(cm)
Width
(cm)
Identifying
features?
Left or
Right?
Direction of
movement
2014:308 M 22 10 Overtrace Right 230° south west
2014:309 M 17.5 11 Overtrace, either a
human heel or animal
Indistinct 230° south west
2014:310 M 18 10.5 Overtrace Left 230° south west
2015:12 M 25 16 Overtrace Indistinct 220° south west
2015:13 M 13 8 Overtrace, heel or
animal print
Indistinct 220° south west
2015:14 M 23 9 Overtrace Indistinct 220° south west
2015:15 M 18 10 Overtrace Indistinct 220° south west
2015:53 M 23.4 16 Overtrace, arch
evident
Left 320° north north
west
2015:54 M 33 14 Overtrace, arch
evident
Right 320° north north
west
2015:160 M 25 11 Overtrace Left 230° south west
2015:163 M 23.5 8.5 Overtrace, clear
hallux
Left 230° south west
2016:67 M 22 10.5 Overtrace Right? Possibly heading
towards island,
230° south west
Table 6.10 Data of footprint-tracks from Site M 2014-2016
6.6.3 Description: footprint-tracks 2014:308, 309, and 310
During fieldwork in November 2014, three human footprint-tracks were recorded at Site M5a
(Figure 6.20). The footprint-tracks were assigned numbers 2014:308, 2014:309 and 2014:310.
They were on a similar lamination and orientated 230° south-west towards Goldcliff island.
These footprint-tracks were all overtraces/undertraces. 2014:308 was the most convincing of the
three footprint-tracks (Figure 6.21). Although an overtrace/undertrace it was evidently a right
footprint-track, the heel was slightly more eroded that the rest of the footprint, and the arch of
the footprint was also evident. There were not any interdigital ridges. Footprint-track 2014:308
was block-lifted in the field and taken back to the laboratory for micro-excavation. Footprint-
track 2014:309 was an incomplete footprint-track, indicating either the ball and the toes or the
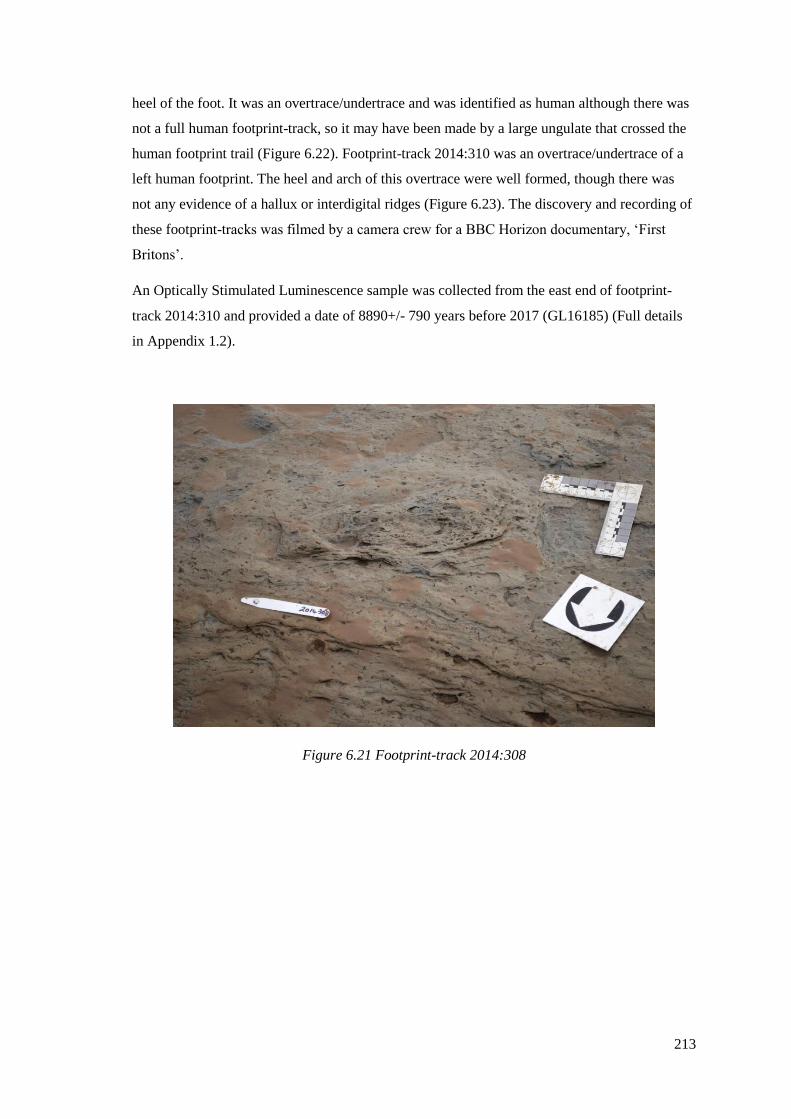
213
heel of the foot. It was an overtrace/undertrace and was identified as human although there was
not a full human footprint-track, so it may have been made by a large ungulate that crossed the
human footprint trail (Figure 6.22). Footprint-track 2014:310 was an overtrace/undertrace of a
left human footprint. The heel and arch of this overtrace were well formed, though there was
not any evidence of a hallux or interdigital ridges (Figure 6.23). The discovery and recording of
these footprint-tracks was filmed by a camera crew for a BBC Horizon documentary, ‘First
Britons’.
An Optically Stimulated Luminescence sample was collected from the east end of footprint-
track 2014:310 and provided a date of 8890+/- 790 years before 2017 (GL16185) (Full details
in Appendix 1.2).
Figure 6.21 Footprint-track 2014:308
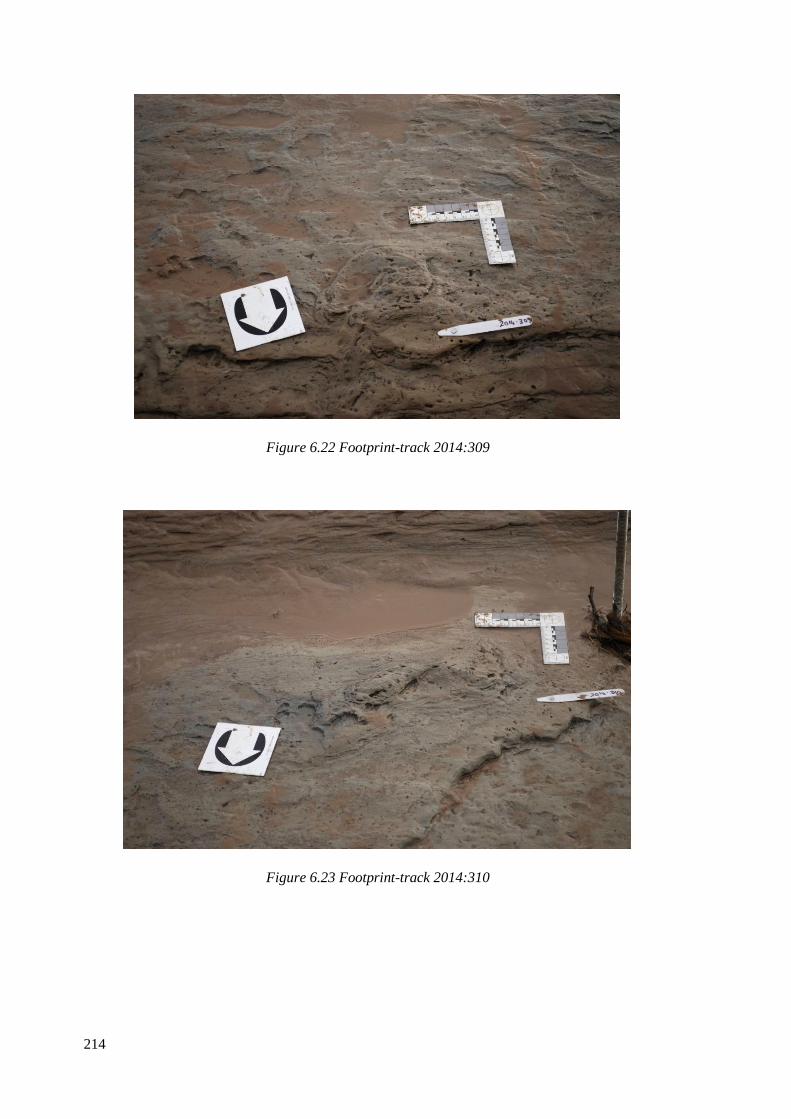
214
Figure 6.22 Footprint-track 2014:309
Figure 6.23 Footprint-track 2014:310
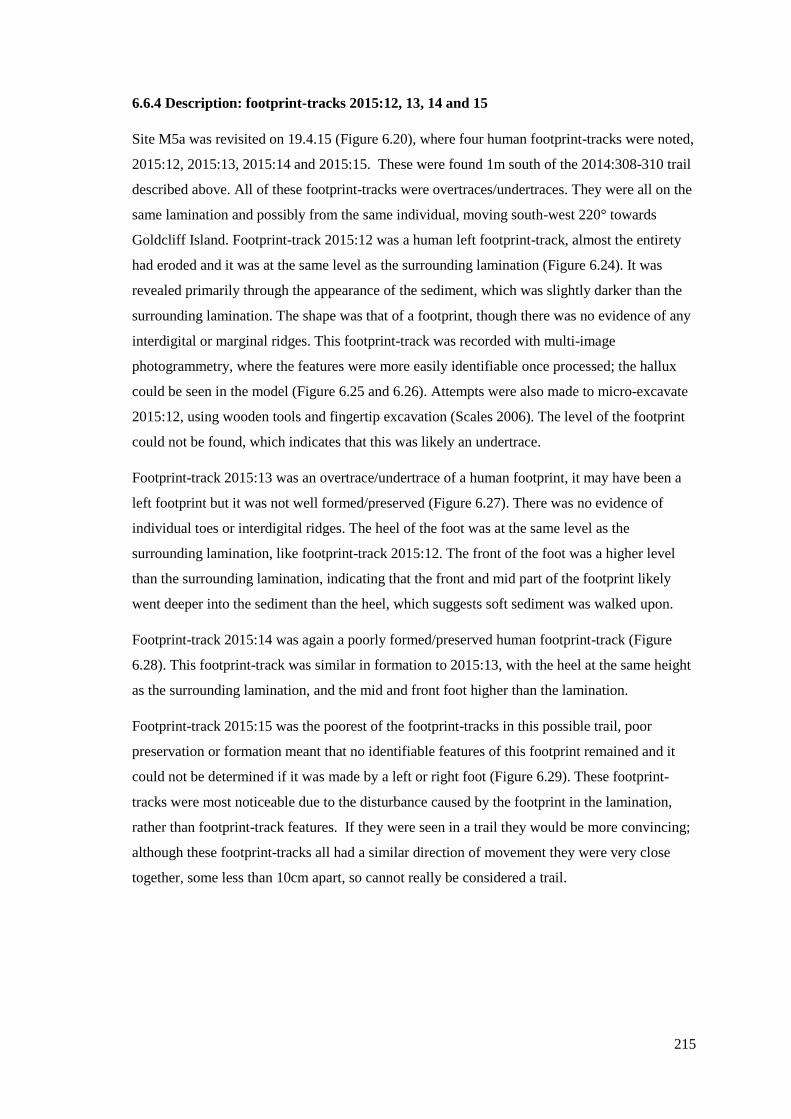
215
6.6.4 Description: footprint-tracks 2015:12, 13, 14 and 15
Site M5a was revisited on 19.4.15 (Figure 6.20), where four human footprint-tracks were noted,
2015:12, 2015:13, 2015:14 and 2015:15. These were found 1m south of the 2014:308-310 trail
described above. All of these footprint-tracks were overtraces/undertraces. They were all on the
same lamination and possibly from the same individual, moving south-west 220° towards
Goldcliff Island. Footprint-track 2015:12 was a human left footprint-track, almost the entirety
had eroded and it was at the same level as the surrounding lamination (Figure 6.24). It was
revealed primarily through the appearance of the sediment, which was slightly darker than the
surrounding lamination. The shape was that of a footprint, though there was no evidence of any
interdigital or marginal ridges. This footprint-track was recorded with multi-image
photogrammetry, where the features were more easily identifiable once processed; the hallux
could be seen in the model (Figure 6.25 and 6.26). Attempts were also made to micro-excavate
2015:12, using wooden tools and fingertip excavation (Scales 2006). The level of the footprint
could not be found, which indicates that this was likely an undertrace.
Footprint-track 2015:13 was an overtrace/undertrace of a human footprint, it may have been a
left footprint but it was not well formed/preserved (Figure 6.27). There was no evidence of
individual toes or interdigital ridges. The heel of the foot was at the same level as the
surrounding lamination, like footprint-track 2015:12. The front of the foot was a higher level
than the surrounding lamination, indicating that the front and mid part of the footprint likely
went deeper into the sediment than the heel, which suggests soft sediment was walked upon.
Footprint-track 2015:14 was again a poorly formed/preserved human footprint-track (Figure
6.28). This footprint-track was similar in formation to 2015:13, with the heel at the same height
as the surrounding lamination, and the mid and front foot higher than the lamination.
Footprint-track 2015:15 was the poorest of the footprint-tracks in this possible trail, poor
preservation or formation meant that no identifiable features of this footprint remained and it
could not be determined if it was made by a left or right foot (Figure 6.29). These footprint-
tracks were most noticeable due to the disturbance caused by the footprint in the lamination,
rather than footprint-track features. If they were seen in a trail they would be more convincing;
although these footprint-tracks all had a similar direction of movement they were very close
together, some less than 10cm apart, so cannot really be considered a trail.
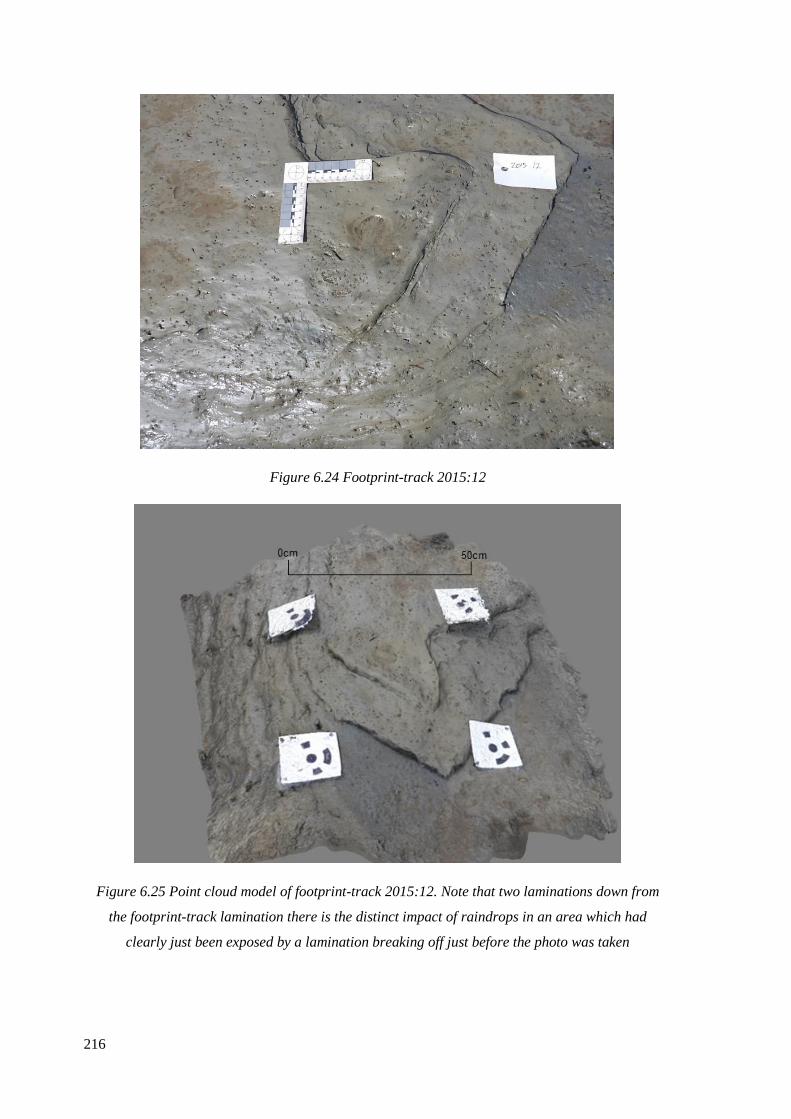
216
Figure 6.24 Footprint-track 2015:12
Figure 6.25 Point cloud model of footprint-track 2015:12. Note that two laminations down from
the footprint-track lamination there is the distinct impact of raindrops in an area which had
clearly just been exposed by a lamination breaking off just before the photo was taken
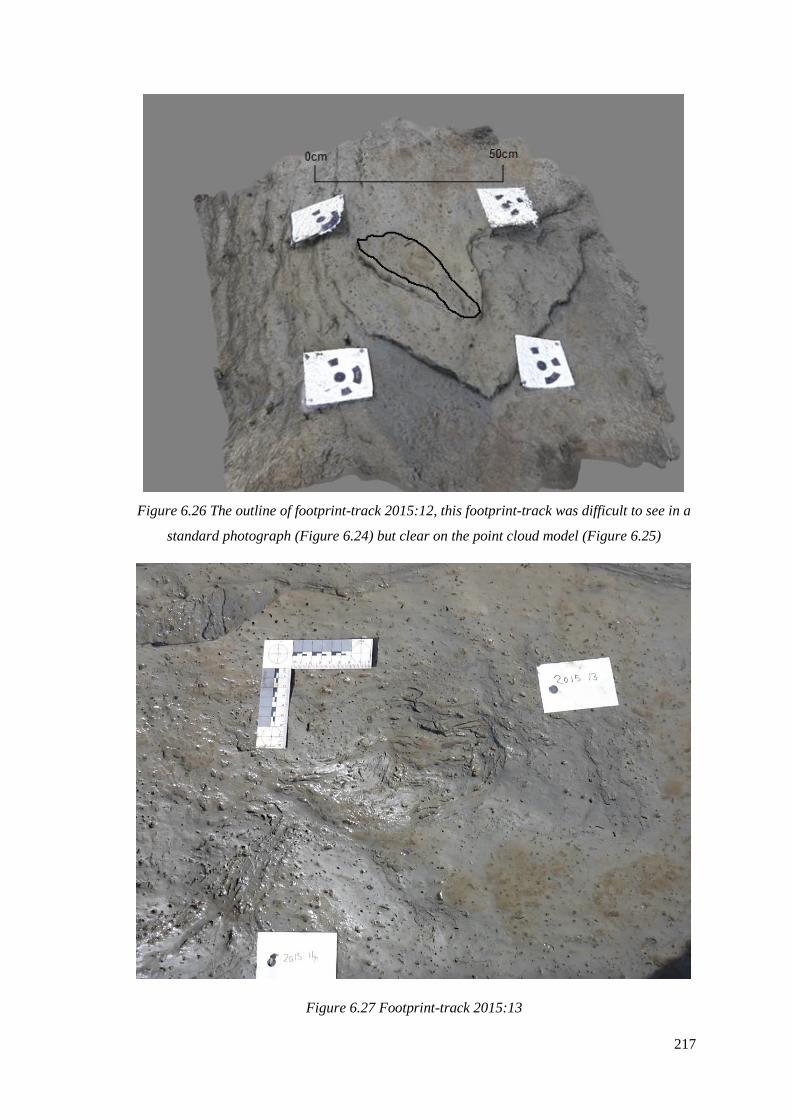
217
Figure 6.26 The outline of footprint-track 2015:12, this footprint-track was difficult to see in a
standard photograph (Figure 6.24) but clear on the point cloud model (Figure 6.25)
Figure 6.27 Footprint-track 2015:13
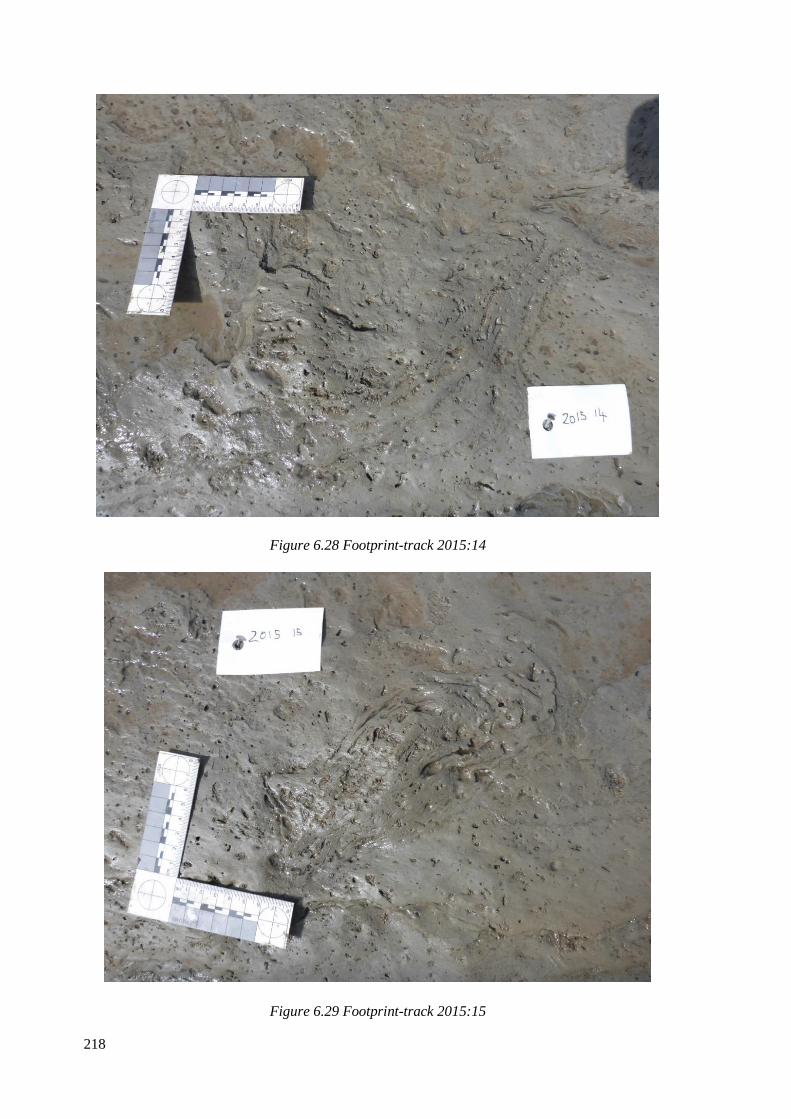
218
Figure 6.28 Footprint-track 2015:14
Figure 6.29 Footprint-track 2015:15
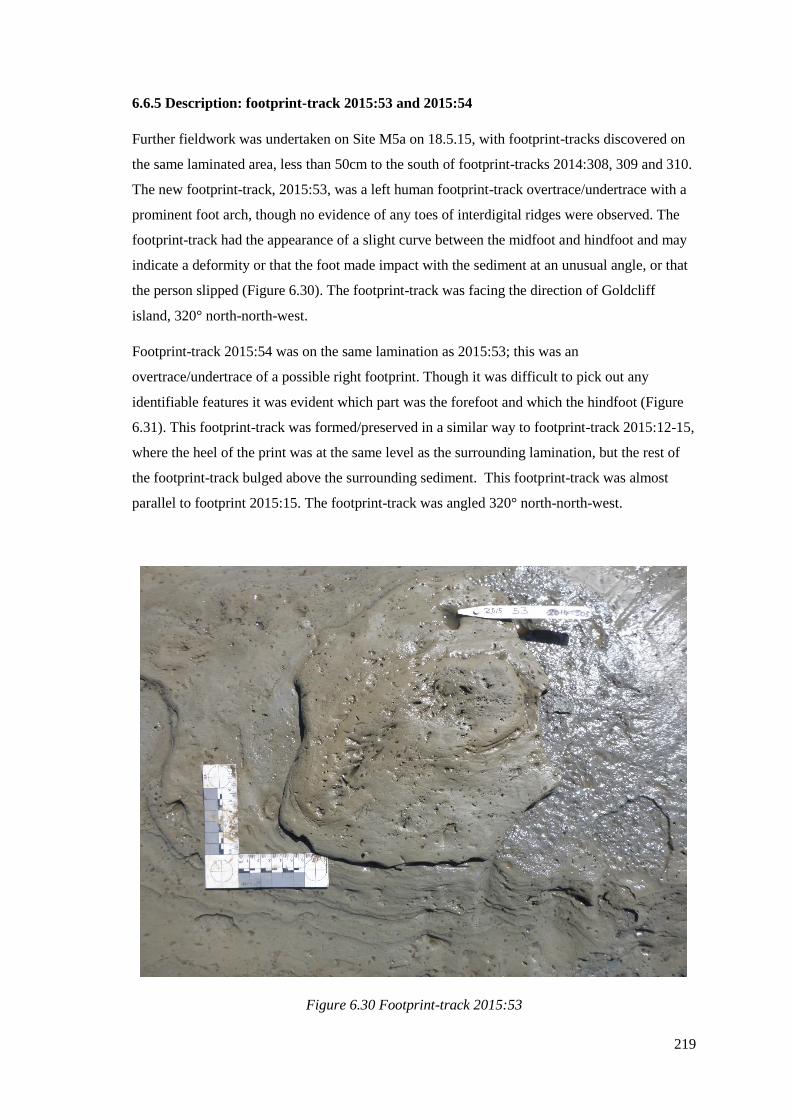
219
6.6.5 Description: footprint-track 2015:53 and 2015:54
Further fieldwork was undertaken on Site M5a on 18.5.15, with footprint-tracks discovered on
the same laminated area, less than 50cm to the south of footprint-tracks 2014:308, 309 and 310.
The new footprint-track, 2015:53, was a left human footprint-track overtrace/undertrace with a
prominent foot arch, though no evidence of any toes of interdigital ridges were observed. The
footprint-track had the appearance of a slight curve between the midfoot and hindfoot and may
indicate a deformity or that the foot made impact with the sediment at an unusual angle, or that
the person slipped (Figure 6.30). The footprint-track was facing the direction of Goldcliff
island, 320° north-north-west.
Footprint-track 2015:54 was on the same lamination as 2015:53; this was an
overtrace/undertrace of a possible right footprint. Though it was difficult to pick out any
identifiable features it was evident which part was the forefoot and which the hindfoot (Figure
6.31). This footprint-track was formed/preserved in a similar way to footprint-track 2015:12-15,
where the heel of the print was at the same level as the surrounding lamination, but the rest of
the footprint-track bulged above the surrounding sediment. This footprint-track was almost
parallel to footprint 2015:15. The footprint-track was angled 320° north-north-west.
Figure 6.30 Footprint-track 2015:53
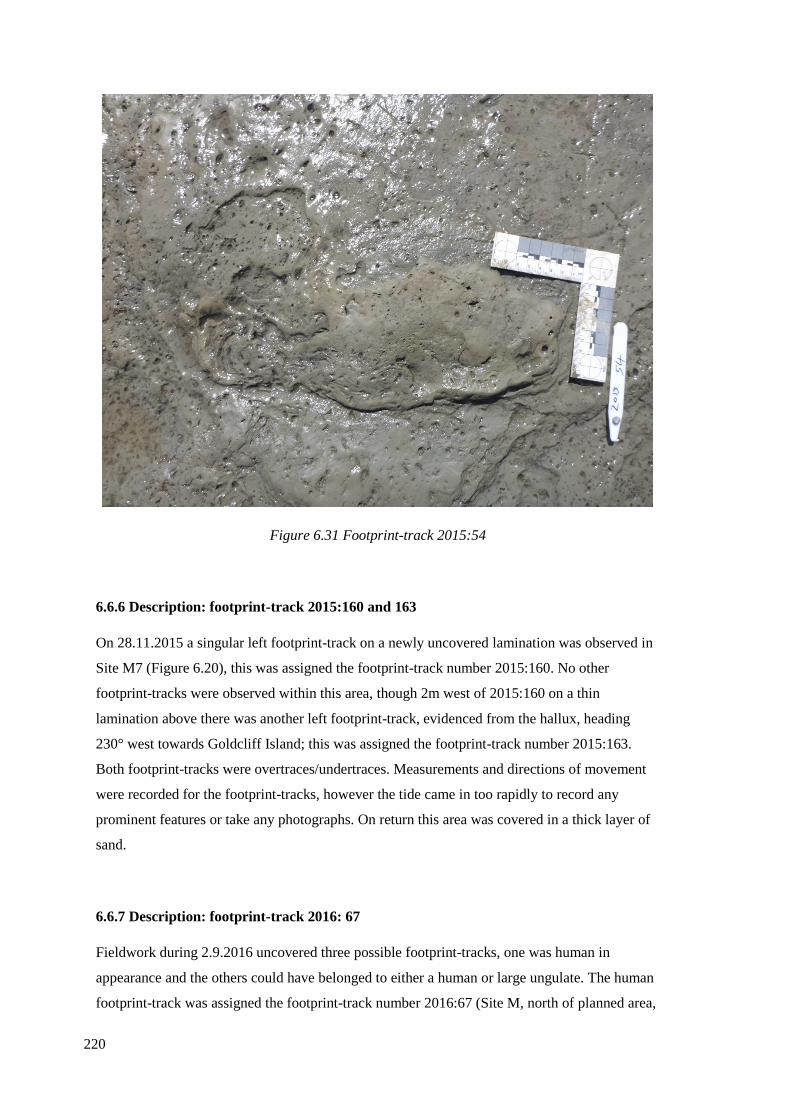
220
Figure 6.31 Footprint-track 2015:54
6.6.6 Description: footprint-track 2015:160 and 163
On 28.11.2015 a singular left footprint-track on a newly uncovered lamination was observed in
Site M7 (Figure 6.20), this was assigned the footprint-track number 2015:160. No other
footprint-tracks were observed within this area, though 2m west of 2015:160 on a thin
lamination above there was another left footprint-track, evidenced from the hallux, heading
230° west towards Goldcliff Island; this was assigned the footprint-track number 2015:163.
Both footprint-tracks were overtraces/undertraces. Measurements and directions of movement
were recorded for the footprint-tracks, however the tide came in too rapidly to record any
prominent features or take any photographs. On return this area was covered in a thick layer of
sand.
6.6.7 Description: footprint-track 2016: 67
Fieldwork during 2.9.2016 uncovered three possible footprint-tracks, one was human in
appearance and the others could have belonged to either a human or large ungulate. The human
footprint-track was assigned the footprint-track number 2016:67 (Site M, north of planned area,
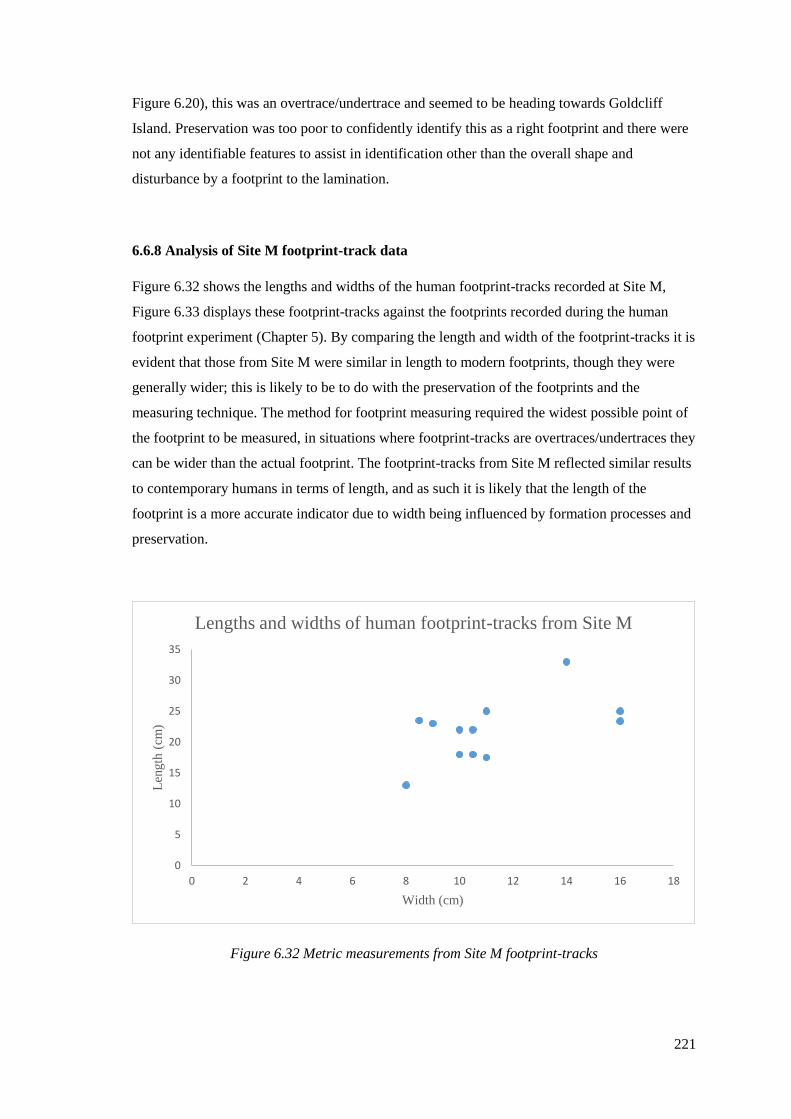
221
Figure 6.20), this was an overtrace/undertrace and seemed to be heading towards Goldcliff
Island. Preservation was too poor to confidently identify this as a right footprint and there were
not any identifiable features to assist in identification other than the overall shape and
disturbance by a footprint to the lamination.
6.6.8 Analysis of Site M footprint-track data
Figure 6.32 shows the lengths and widths of the human footprint-tracks recorded at Site M,
Figure 6.33 displays these footprint-tracks against the footprints recorded during the human
footprint experiment (Chapter 5). By comparing the length and width of the footprint-tracks it is
evident that those from Site M were similar in length to modern footprints, though they were
generally wider; this is likely to be to do with the preservation of the footprints and the
measuring technique. The method for footprint measuring required the widest possible point of
the footprint to be measured, in situations where footprint-tracks are overtraces/undertraces they
can be wider than the actual footprint. The footprint-tracks from Site M reflected similar results
to contemporary humans in terms of length, and as such it is likely that the length of the
footprint is a more accurate indicator due to width being influenced by formation processes and
preservation.
Figure 6.32 Metric measurements from Site M footprint-tracks
0
5
10
15
20
25
30
35
0 2 4 6 8 10 12 14 16 18
Len
gth
(cm
)
Width (cm)
Lengths and widths of human footprint-tracks from Site M
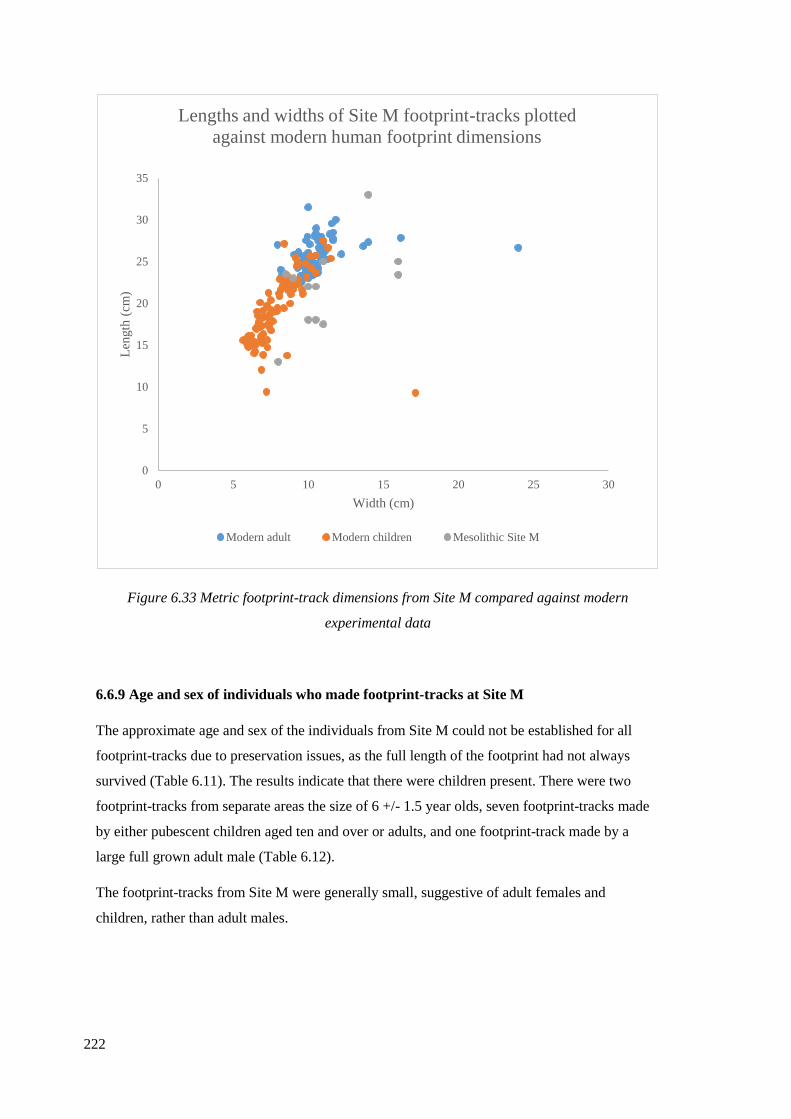
222
Figure 6.33 Metric footprint-track dimensions from Site M compared against modern
experimental data
6.6.9 Age and sex of individuals who made footprint-tracks at Site M
The approximate age and sex of the individuals from Site M could not be established for all
footprint-tracks due to preservation issues, as the full length of the footprint had not always
survived (Table 6.11). The results indicate that there were children present. There were two
footprint-tracks from separate areas the size of 6 +/- 1.5 year olds, seven footprint-tracks made
by either pubescent children aged ten and over or adults, and one footprint-track made by a
large full grown adult male (Table 6.12).
The footprint-tracks from Site M were generally small, suggestive of adult females and
children, rather than adult males.
0
5
10
15
20
25
30
35
0 5 10 15 20 25 30
Len
gth
(cm
)
Width (cm)
Lengths and widths of Site M footprint-tracks plotted
against modern human footprint dimensions
Modern adult Modern children Mesolithic Site M
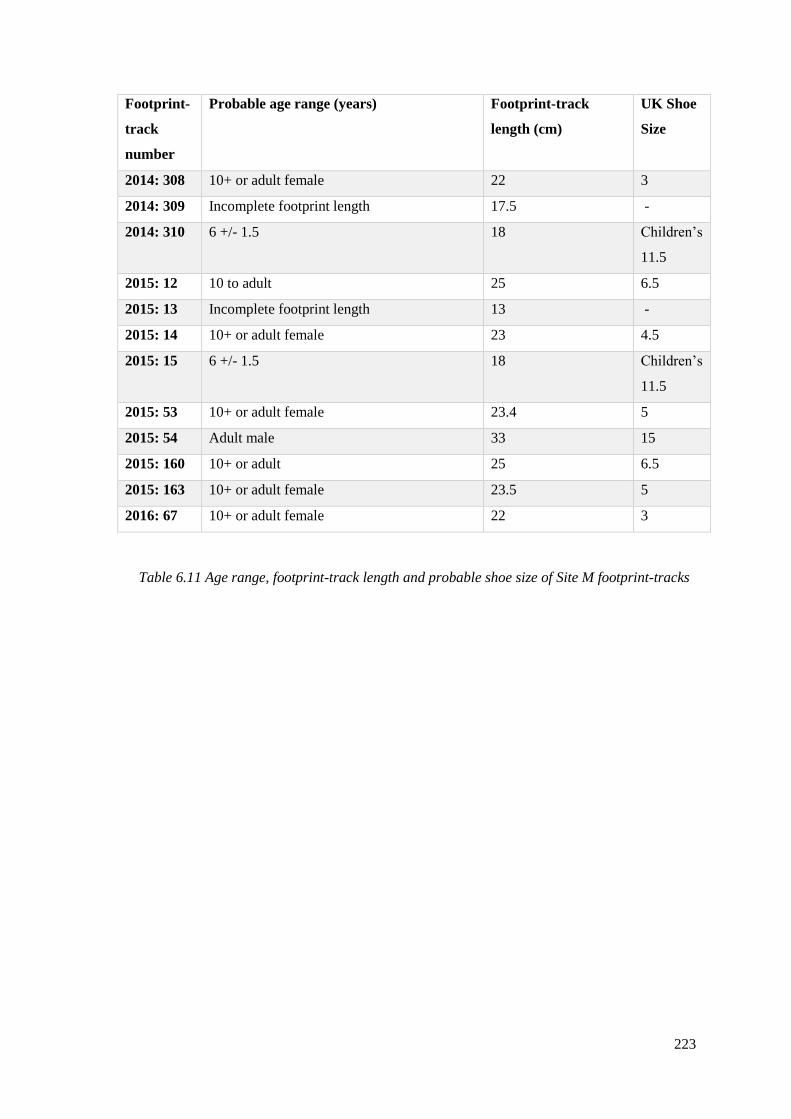
223
Footprint-
track
number
Probable age range (years) Footprint-track
length (cm)
UK Shoe
Size
2014: 308 10+ or adult female 22 3
2014: 309 Incomplete footprint length 17.5 -
2014: 310 6 +/- 1.5 18 Children’s
11.5
2015: 12 10 to adult 25 6.5
2015: 13 Incomplete footprint length 13 -
2015: 14 10+ or adult female 23 4.5
2015: 15 6 +/- 1.5 18 Children’s
11.5
2015: 53 10+ or adult female 23.4 5
2015: 54 Adult male 33 15
2015: 160 10+ or adult 25 6.5
2015: 163 10+ or adult female 23.5 5
2016: 67 10+ or adult female 22 3
Table 6.11 Age range, footprint-track length and probable shoe size of Site M footprint-tracks
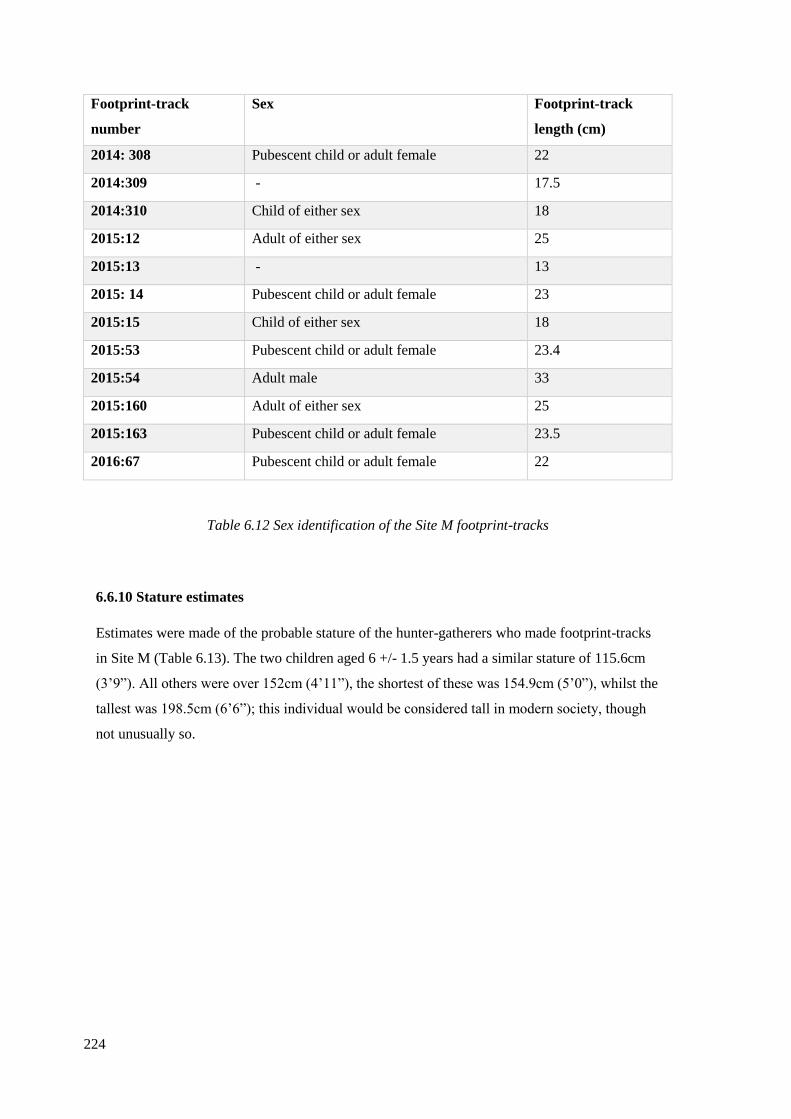
224
Footprint-track
number
Sex Footprint-track
length (cm)
2014: 308 Pubescent child or adult female 22
2014:309 - 17.5
2014:310 Child of either sex 18
2015:12 Adult of either sex 25
2015:13 - 13
2015: 14 Pubescent child or adult female 23
2015:15 Child of either sex 18
2015:53 Pubescent child or adult female 23.4
2015:54 Adult male 33
2015:160 Adult of either sex 25
2015:163 Pubescent child or adult female 23.5
2016:67 Pubescent child or adult female 22
Table 6.12 Sex identification of the Site M footprint-tracks
6.6.10 Stature estimates
Estimates were made of the probable stature of the hunter-gatherers who made footprint-tracks
in Site M (Table 6.13). The two children aged 6 +/- 1.5 years had a similar stature of 115.6cm
(3’9”). All others were over 152cm (4’11”), the shortest of these was 154.9cm (5’0”), whilst the
tallest was 198.5cm (6’6”); this individual would be considered tall in modern society, though
not unusually so.
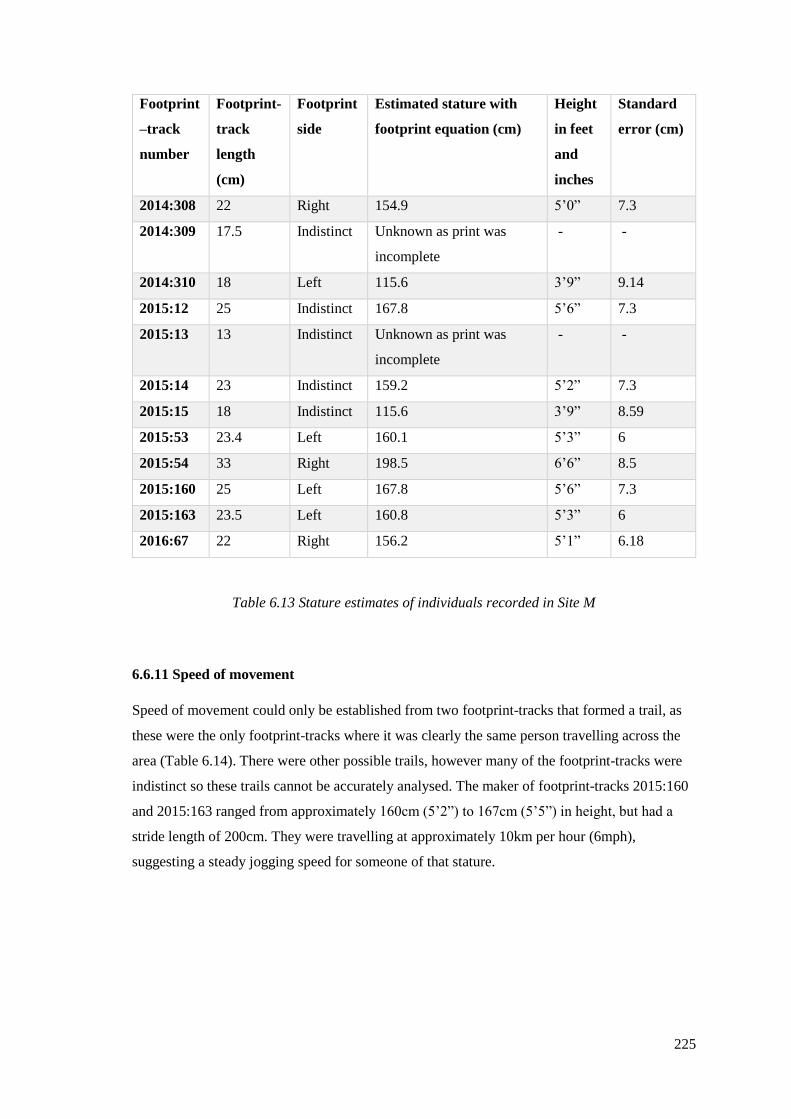
225
Footprint
–track
number
Footprint-
track
length
(cm)
Footprint
side
Estimated stature with
footprint equation (cm)
Height
in feet
and
inches
Standard
error (cm)
2014:308 22 Right 154.9 5’0” 7.3
2014:309 17.5 Indistinct Unknown as print was
incomplete
- -
2014:310 18 Left 115.6 3’9” 9.14
2015:12 25 Indistinct 167.8 5’6” 7.3
2015:13 13 Indistinct Unknown as print was
incomplete
- -
2015:14 23 Indistinct 159.2 5’2” 7.3
2015:15 18 Indistinct 115.6 3’9” 8.59
2015:53 23.4 Left 160.1 5’3” 6
2015:54 33 Right 198.5 6’6” 8.5
2015:160 25 Left 167.8 5’6” 7.3
2015:163 23.5 Left 160.8 5’3” 6
2016:67 22 Right 156.2 5’1” 6.18
Table 6.13 Stature estimates of individuals recorded in Site M
6.6.11 Speed of movement
Speed of movement could only be established from two footprint-tracks that formed a trail, as
these were the only footprint-tracks where it was clearly the same person travelling across the
area (Table 6.14). There were other possible trails, however many of the footprint-tracks were
indistinct so these trails cannot be accurately analysed. The maker of footprint-tracks 2015:160
and 2015:163 ranged from approximately 160cm (5’2”) to 167cm (5’5”) in height, but had a
stride length of 200cm. They were travelling at approximately 10km per hour (6mph),
suggesting a steady jogging speed for someone of that stature.
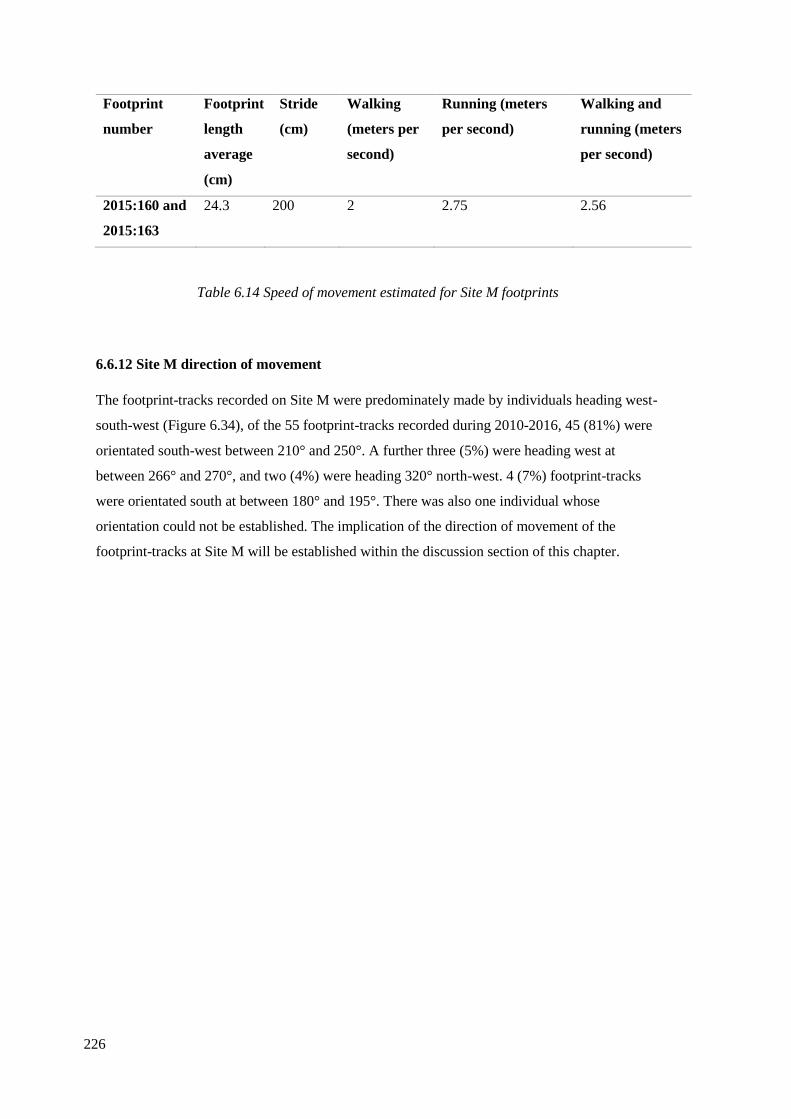
226
Footprint
number
Footprint
length
average
(cm)
Stride
(cm)
Walking
(meters per
second)
Running (meters
per second)
Walking and
running (meters
per second)
2015:160 and
2015:163
24.3 200 2 2.75 2.56
Table 6.14 Speed of movement estimated for Site M footprints
6.6.12 Site M direction of movement
The footprint-tracks recorded on Site M were predominately made by individuals heading west-
south-west (Figure 6.34), of the 55 footprint-tracks recorded during 2010-2016, 45 (81%) were
orientated south-west between 210° and 250°. A further three (5%) were heading west at
between 266° and 270°, and two (4%) were heading 320° north-west. 4 (7%) footprint-tracks
were orientated south at between 180° and 195°. There was also one individual whose
orientation could not be established. The implication of the direction of movement of the
footprint-tracks at Site M will be established within the discussion section of this chapter.
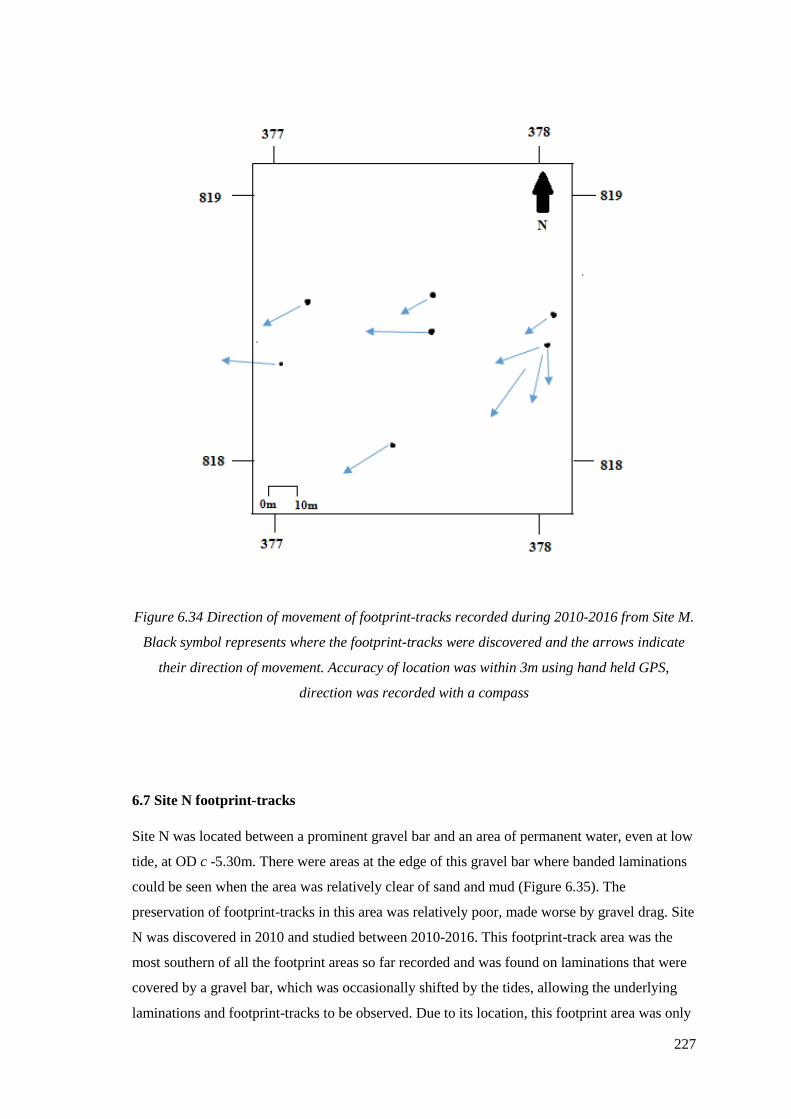
227
Figure 6.34 Direction of movement of footprint-tracks recorded during 2010-2016 from Site M.
Black symbol represents where the footprint-tracks were discovered and the arrows indicate
their direction of movement. Accuracy of location was within 3m using hand held GPS,
direction was recorded with a compass
6.7 Site N footprint-tracks
Site N was located between a prominent gravel bar and an area of permanent water, even at low
tide, at OD c -5.30m. There were areas at the edge of this gravel bar where banded laminations
could be seen when the area was relatively clear of sand and mud (Figure 6.35). The
preservation of footprint-tracks in this area was relatively poor, made worse by gravel drag. Site
N was discovered in 2010 and studied between 2010-2016. This footprint-track area was the
most southern of all the footprint areas so far recorded and was found on laminations that were
covered by a gravel bar, which was occasionally shifted by the tides, allowing the underlying
laminations and footprint-tracks to be observed. Due to its location, this footprint area was only
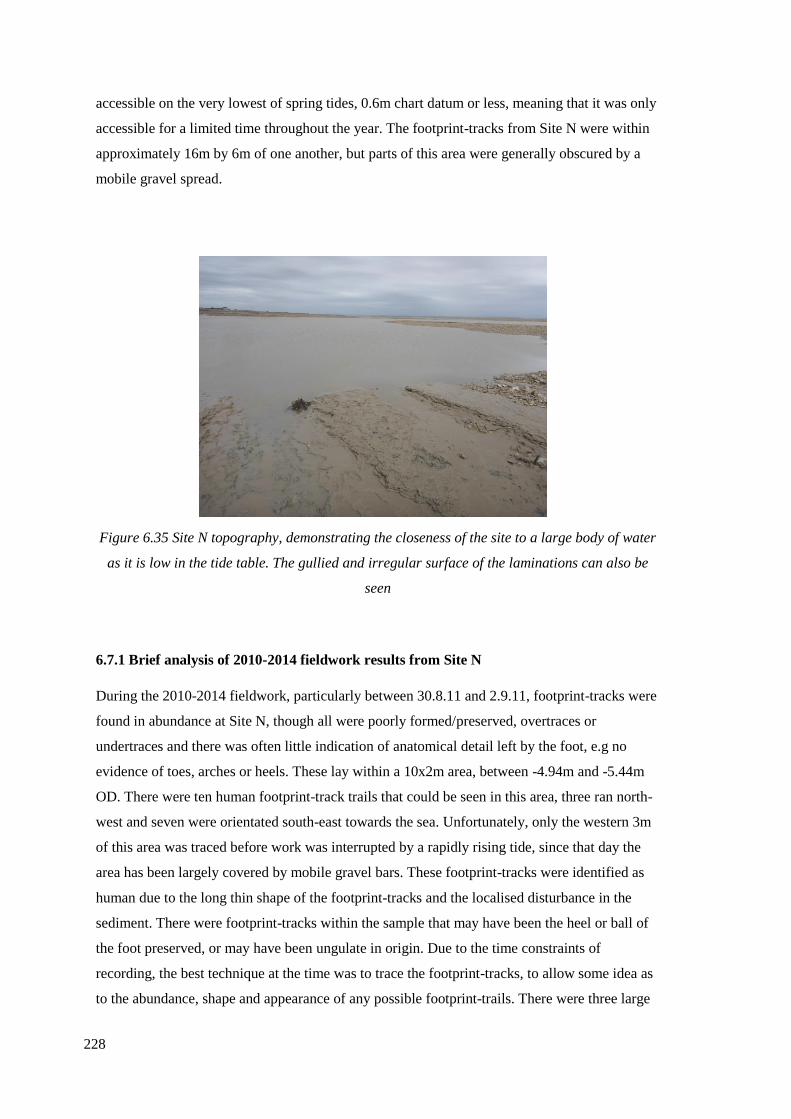
228
accessible on the very lowest of spring tides, 0.6m chart datum or less, meaning that it was only
accessible for a limited time throughout the year. The footprint-tracks from Site N were within
approximately 16m by 6m of one another, but parts of this area were generally obscured by a
mobile gravel spread.
Figure 6.35 Site N topography, demonstrating the closeness of the site to a large body of water
as it is low in the tide table. The gullied and irregular surface of the laminations can also be
seen
6.7.1 Brief analysis of 2010-2014 fieldwork results from Site N
During the 2010-2014 fieldwork, particularly between 30.8.11 and 2.9.11, footprint-tracks were
found in abundance at Site N, though all were poorly formed/preserved, overtraces or
undertraces and there was often little indication of anatomical detail left by the foot, e.g no
evidence of toes, arches or heels. These lay within a 10x2m area, between -4.94m and -5.44m
OD. There were ten human footprint-track trails that could be seen in this area, three ran north-
west and seven were orientated south-east towards the sea. Unfortunately, only the western 3m
of this area was traced before work was interrupted by a rapidly rising tide, since that day the
area has been largely covered by mobile gravel bars. These footprint-tracks were identified as
human due to the long thin shape of the footprint-tracks and the localised disturbance in the
sediment. There were footprint-tracks within the sample that may have been the heel or ball of
the foot preserved, or may have been ungulate in origin. Due to the time constraints of
recording, the best technique at the time was to trace the footprint-tracks, to allow some idea as
to the abundance, shape and appearance of any possible footprint-trails. There were three large
229
tracings made from this footprint-track area, containing 68 possible footprint-tracks. The issue
with tracings is that they are subjective. The writer did not make the tracings as they were
recorded before the thesis research started, so only basic analysis of these footprint-tracks has
been attempted. The exact metric dimensions of the footprint-tracks are unknown and the
tracings were varied in quality, making it inaccurate to take metric measurements off a two-
dimensional tracing. Despite this, these tracings are informative about the direction of
movement of these individuals, whether human or ungulate. A plan of this footprint-track area,
and its association to footprint-track trail 2016:50-56 can be seen in Figure 6.36. All seemingly
headed in an east/south-east or north-west direction, which is similar to the footprint-tracks
recorded during the 2014-2017 fieldwork. The similar direction of movement suggests these
individuals were visiting a static resource on the same axis of movement, crossing Site N
repeatedly, they were travelling in the direction of a palaeochannel.
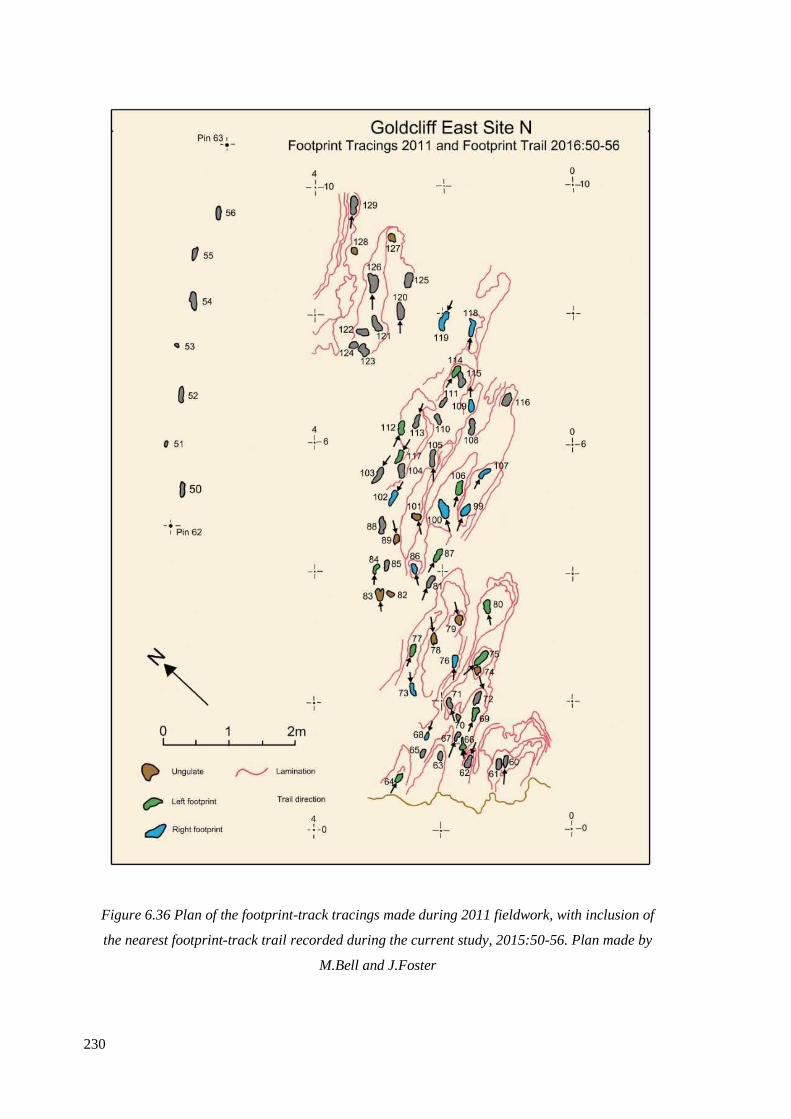
230
Figure 6.36 Plan of the footprint-track tracings made during 2011 fieldwork, with inclusion of
the nearest footprint-track trail recorded during the current study, 2015:50-56. Plan made by
M.Bell and J.Foster
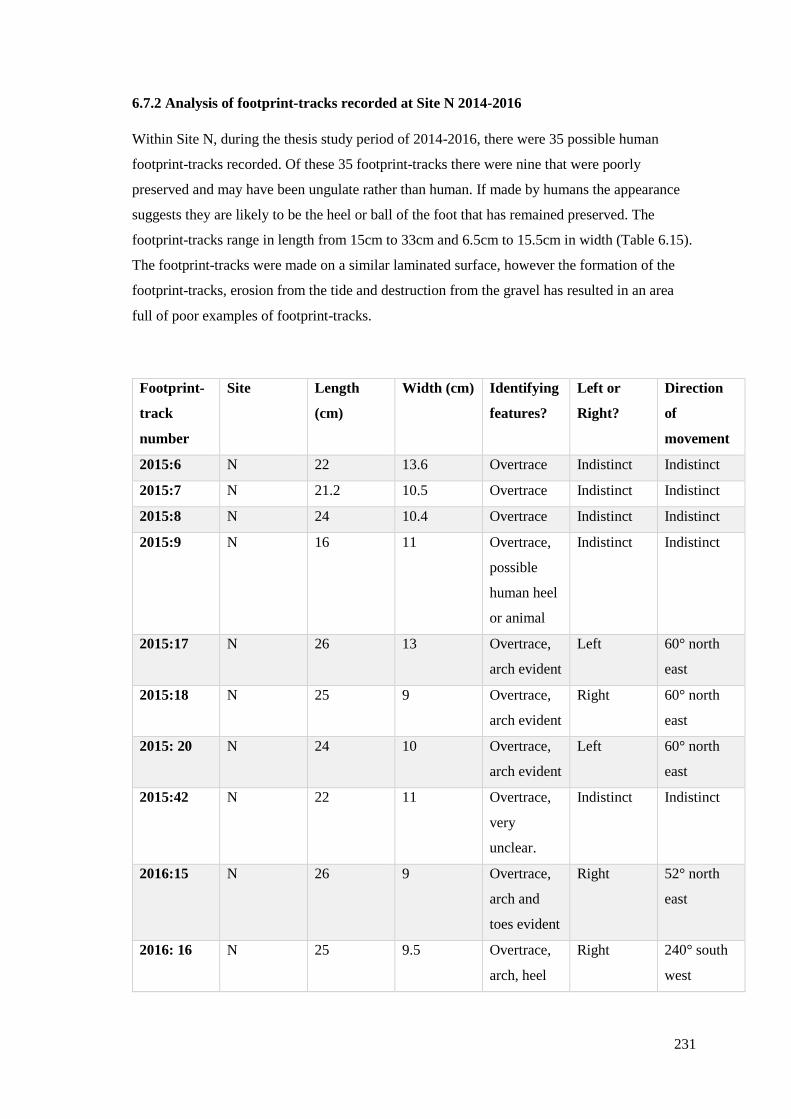
231
6.7.2 Analysis of footprint-tracks recorded at Site N 2014-2016
Within Site N, during the thesis study period of 2014-2016, there were 35 possible human
footprint-tracks recorded. Of these 35 footprint-tracks there were nine that were poorly
preserved and may have been ungulate rather than human. If made by humans the appearance
suggests they are likely to be the heel or ball of the foot that has remained preserved. The
footprint-tracks range in length from 15cm to 33cm and 6.5cm to 15.5cm in width (Table 6.15).
The footprint-tracks were made on a similar laminated surface, however the formation of the
footprint-tracks, erosion from the tide and destruction from the gravel has resulted in an area
full of poor examples of footprint-tracks.
Footprint-
track
number
Site Length
(cm)
Width (cm) Identifying
features?
Left or
Right?
Direction
of
movement
2015:6 N 22 13.6 Overtrace Indistinct Indistinct
2015:7 N 21.2 10.5 Overtrace Indistinct Indistinct
2015:8 N 24 10.4 Overtrace Indistinct Indistinct
2015:9 N
16 11 Overtrace,
possible
human heel
or animal
Indistinct Indistinct
2015:17 N
26 13 Overtrace,
arch evident
Left 60° north
east
2015:18 N
25 9 Overtrace,
arch evident
Right 60° north
east
2015: 20 N 24 10 Overtrace,
arch evident
Left 60° north
east
2015:42 N 22 11 Overtrace,
very
unclear.
Indistinct Indistinct
2016:15 N
26 9 Overtrace,
arch and
toes evident
Right 52° north
east
2016: 16 N
25 9.5 Overtrace,
arch, heel
Right 240° south
west
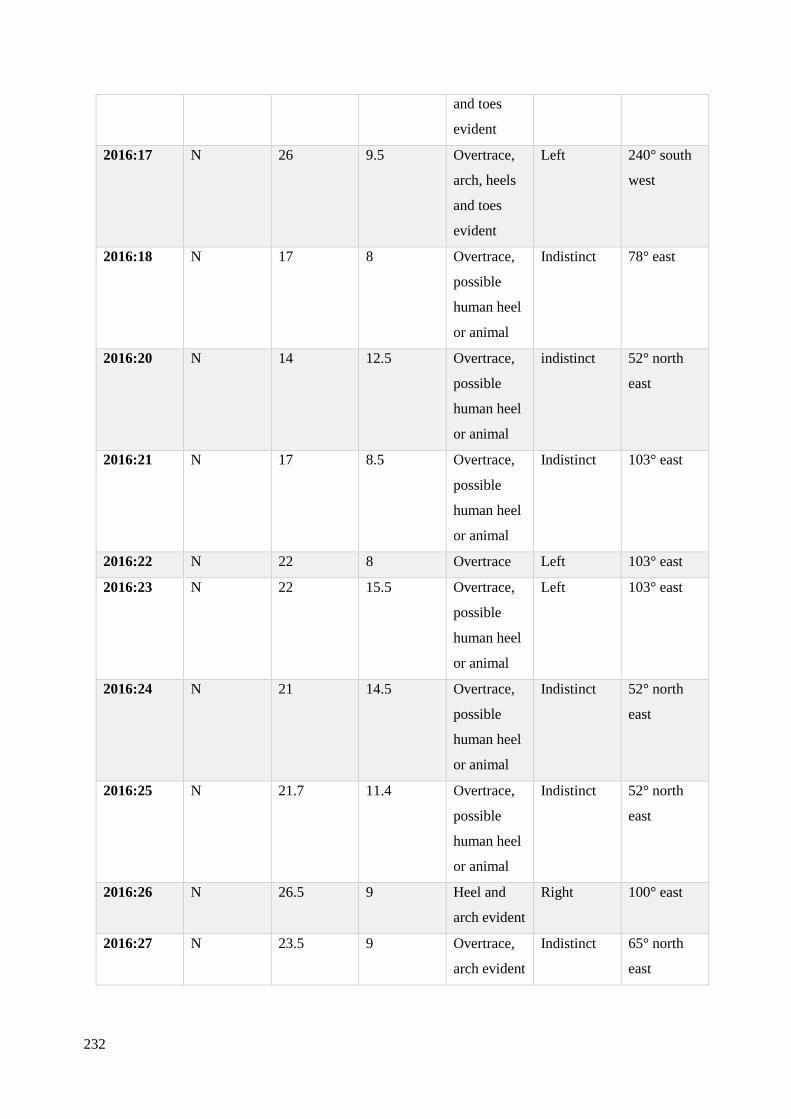
232
and toes
evident
2016:17 N
26 9.5 Overtrace,
arch, heels
and toes
evident
Left 240° south
west
2016:18 N
17 8 Overtrace,
possible
human heel
or animal
Indistinct 78° east
2016:20 N
14 12.5 Overtrace,
possible
human heel
or animal
indistinct 52° north
east
2016:21 N
17 8.5 Overtrace,
possible
human heel
or animal
Indistinct 103° east
2016:22 N 22 8 Overtrace Left 103° east
2016:23 N
22 15.5 Overtrace,
possible
human heel
or animal
Left 103° east
2016:24 N
21 14.5 Overtrace,
possible
human heel
or animal
Indistinct 52° north
east
2016:25 N
21.7 11.4 Overtrace,
possible
human heel
or animal
Indistinct 52° north
east
2016:26 N
26.5 9 Heel and
arch evident
Right 100° east
2016:27 N
23.5 9 Overtrace,
arch evident
Indistinct 65° north
east
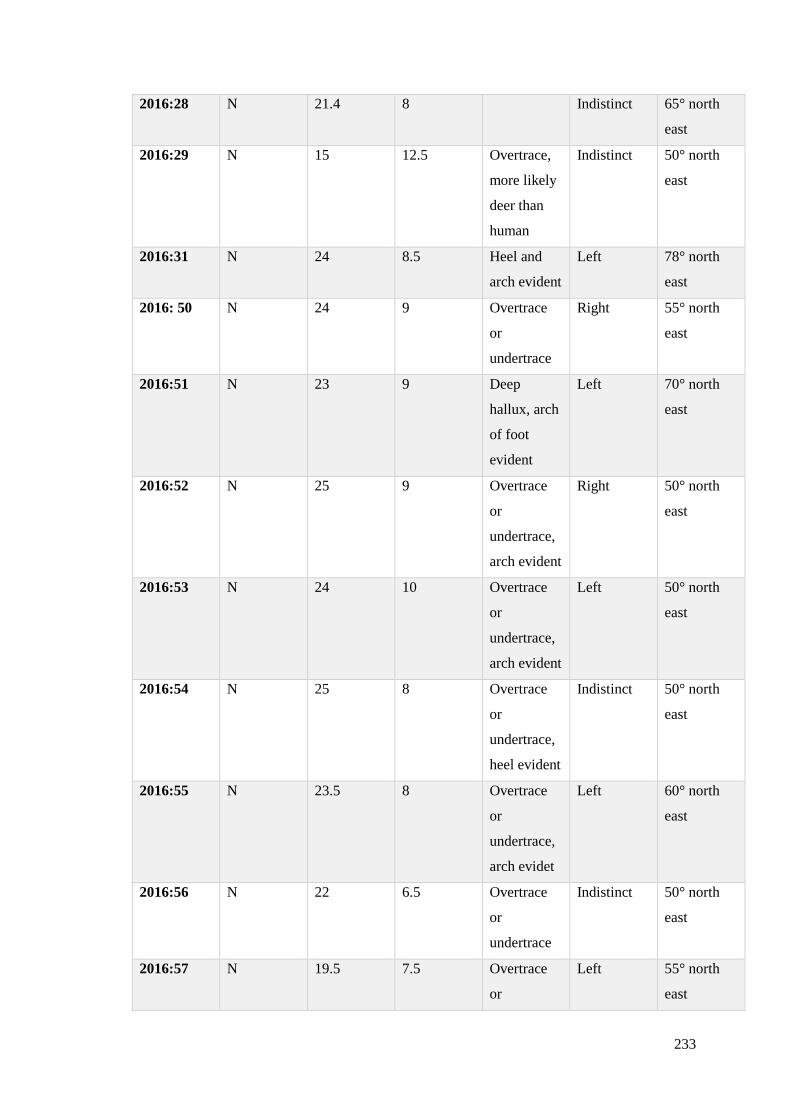
233
2016:28 N
21.4 8
Indistinct 65° north
east
2016:29 N 15 12.5 Overtrace,
more likely
deer than
human
Indistinct 50° north
east
2016:31 N
24 8.5 Heel and
arch evident
Left 78° north
east
2016: 50 N
24 9 Overtrace
or
undertrace
Right 55° north
east
2016:51 N
23 9 Deep
hallux, arch
of foot
evident
Left 70° north
east
2016:52 N
25 9 Overtrace
or
undertrace,
arch evident
Right 50° north
east
2016:53 N
24 10 Overtrace
or
undertrace,
arch evident
Left 50° north
east
2016:54 N 25 8 Overtrace
or
undertrace,
heel evident
Indistinct 50° north
east
2016:55 N 23.5 8 Overtrace
or
undertrace,
arch evidet
Left 60° north
east
2016:56 N
22 6.5 Overtrace
or
undertrace
Indistinct 50° north
east
2016:57 N 19.5 7.5 Overtrace
or
Left 55° north
east
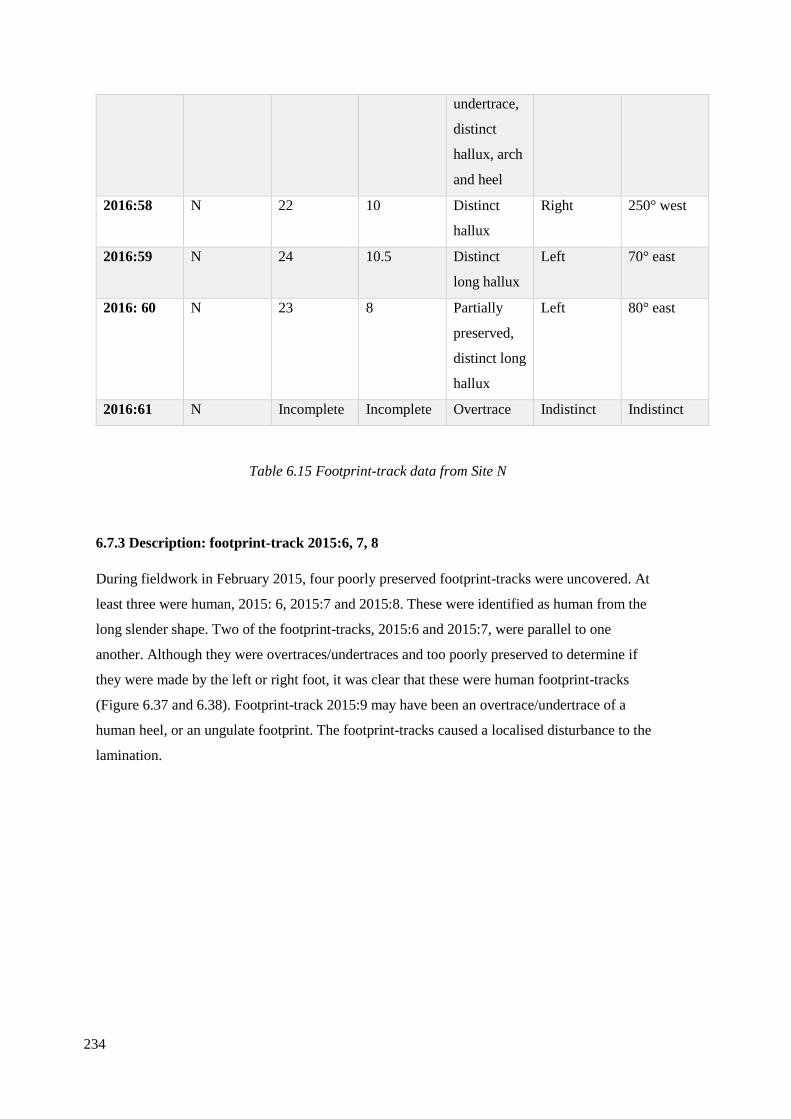
234
undertrace,
distinct
hallux, arch
and heel
2016:58 N
22 10 Distinct
hallux
Right 250° west
2016:59 N
24 10.5 Distinct
long hallux
Left 70° east
2016: 60 N 23 8 Partially
preserved,
distinct long
hallux
Left 80° east
2016:61 N Incomplete Incomplete Overtrace Indistinct Indistinct
Table 6.15 Footprint-track data from Site N
6.7.3 Description: footprint-track 2015:6, 7, 8
During fieldwork in February 2015, four poorly preserved footprint-tracks were uncovered. At
least three were human, 2015: 6, 2015:7 and 2015:8. These were identified as human from the
long slender shape. Two of the footprint-tracks, 2015:6 and 2015:7, were parallel to one
another. Although they were overtraces/undertraces and too poorly preserved to determine if
they were made by the left or right foot, it was clear that these were human footprint-tracks
(Figure 6.37 and 6.38). Footprint-track 2015:9 may have been an overtrace/undertrace of a
human heel, or an ungulate footprint. The footprint-tracks caused a localised disturbance to the
lamination.
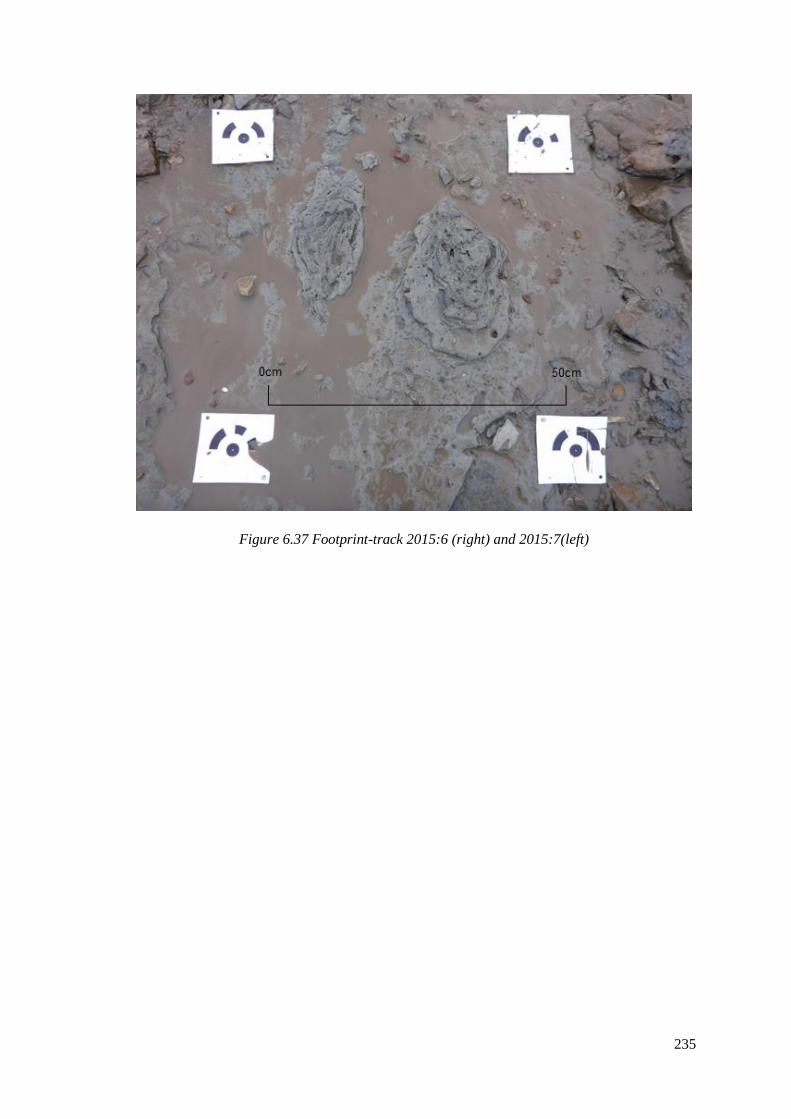
235
Figure 6.37 Footprint-track 2015:6 (right) and 2015:7(left)
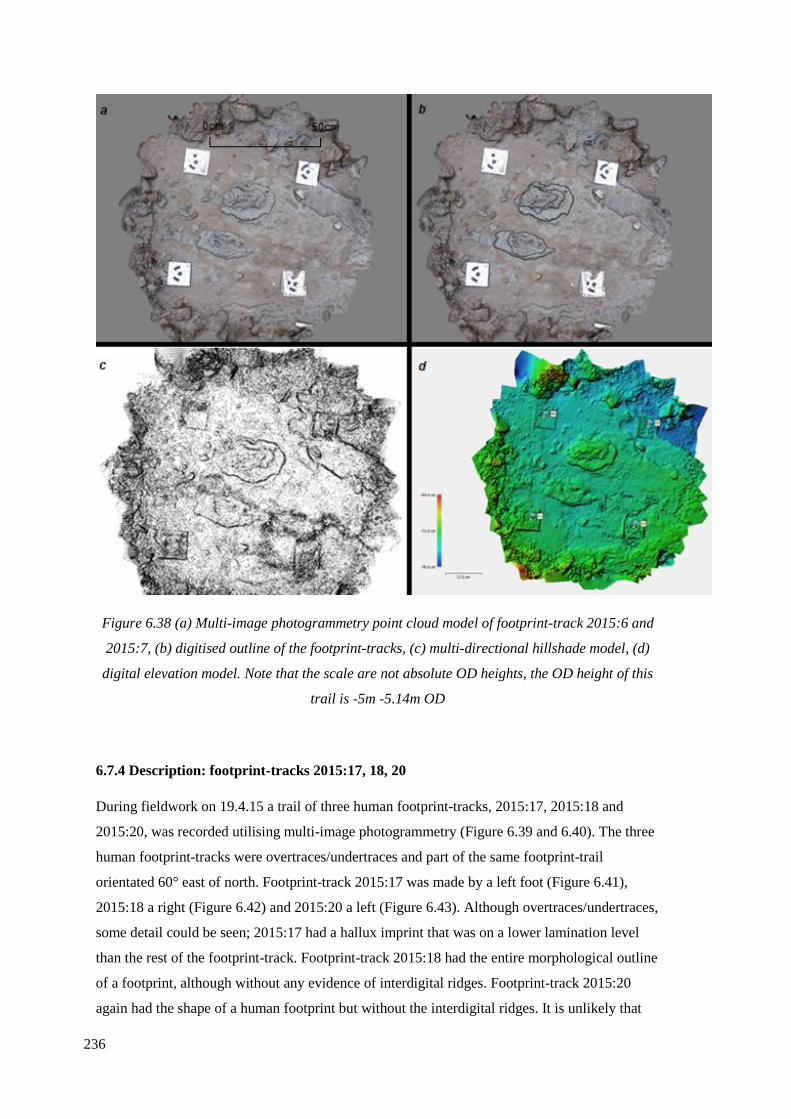
236
Figure 6.38 (a) Multi-image photogrammetry point cloud model of footprint-track 2015:6 and
2015:7, (b) digitised outline of the footprint-tracks, (c) multi-directional hillshade model, (d)
digital elevation model. Note that the scale are not absolute OD heights, the OD height of this
trail is -5m -5.14m OD
6.7.4 Description: footprint-tracks 2015:17, 18, 20
During fieldwork on 19.4.15 a trail of three human footprint-tracks, 2015:17, 2015:18 and
2015:20, was recorded utilising multi-image photogrammetry (Figure 6.39 and 6.40). The three
human footprint-tracks were overtraces/undertraces and part of the same footprint-trail
orientated 60° east of north. Footprint-track 2015:17 was made by a left foot (Figure 6.41),
2015:18 a right (Figure 6.42) and 2015:20 a left (Figure 6.43). Although overtraces/undertraces,
some detail could be seen; 2015:17 had a hallux imprint that was on a lower lamination level
than the rest of the footprint-track. Footprint-track 2015:18 had the entire morphological outline
of a footprint, although without any evidence of interdigital ridges. Footprint-track 2015:20
again had the shape of a human footprint but without the interdigital ridges. It is unlikely that
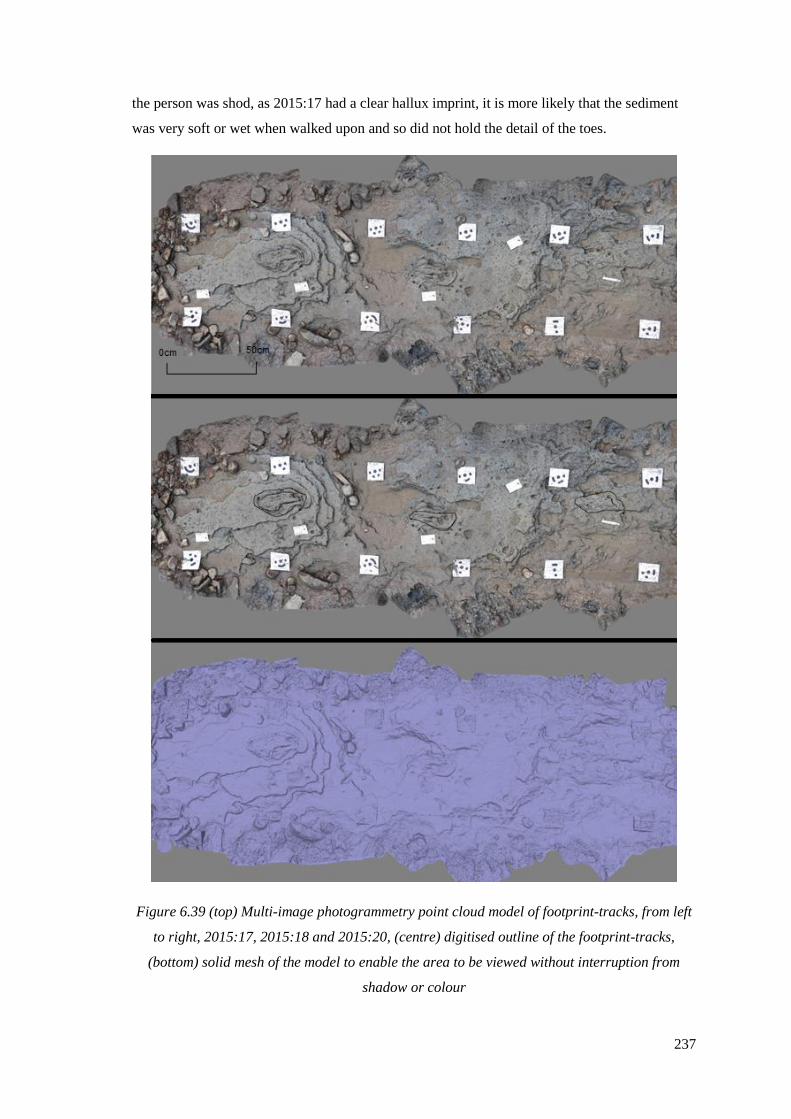
237
the person was shod, as 2015:17 had a clear hallux imprint, it is more likely that the sediment
was very soft or wet when walked upon and so did not hold the detail of the toes.
Figure 6.39 (top) Multi-image photogrammetry point cloud model of footprint-tracks, from left
to right, 2015:17, 2015:18 and 2015:20, (centre) digitised outline of the footprint-tracks,
(bottom) solid mesh of the model to enable the area to be viewed without interruption from
shadow or colour
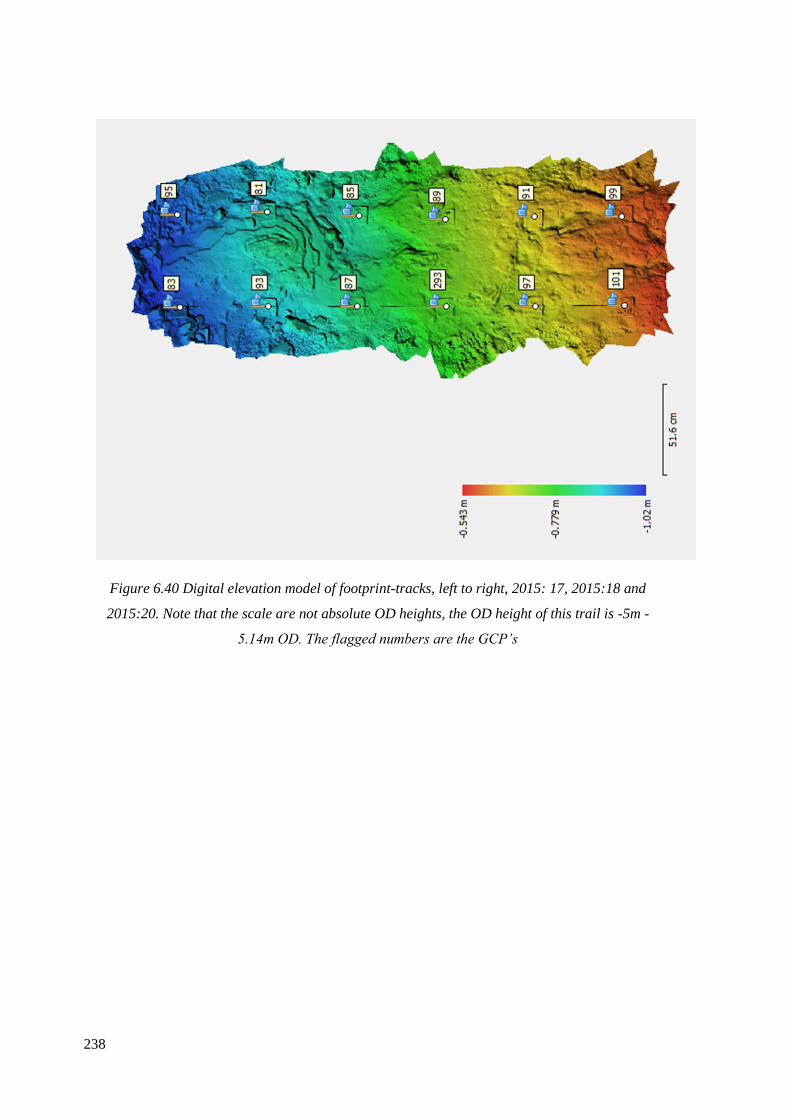
238
Figure 6.40 Digital elevation model of footprint-tracks, left to right, 2015: 17, 2015:18 and
2015:20. Note that the scale are not absolute OD heights, the OD height of this trail is -5m -
5.14m OD. The flagged numbers are the GCP’s
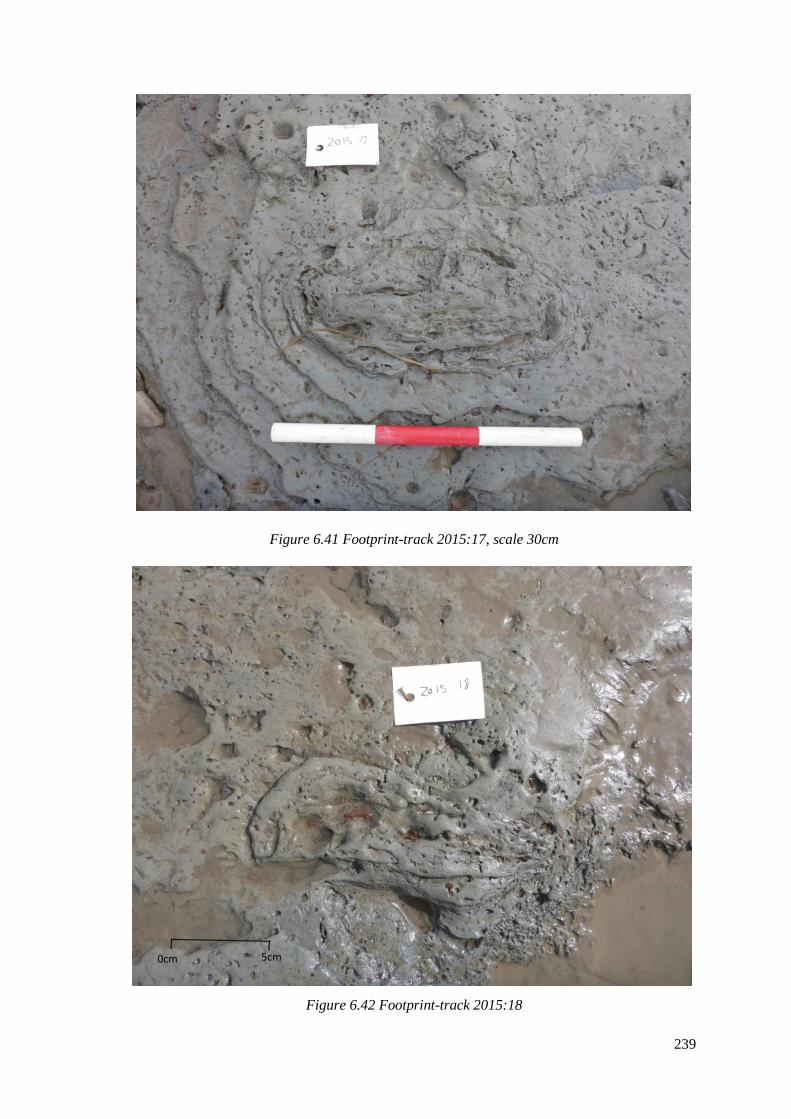
239
Figure 6.41 Footprint-track 2015:17, scale 30cm
Figure 6.42 Footprint-track 2015:18
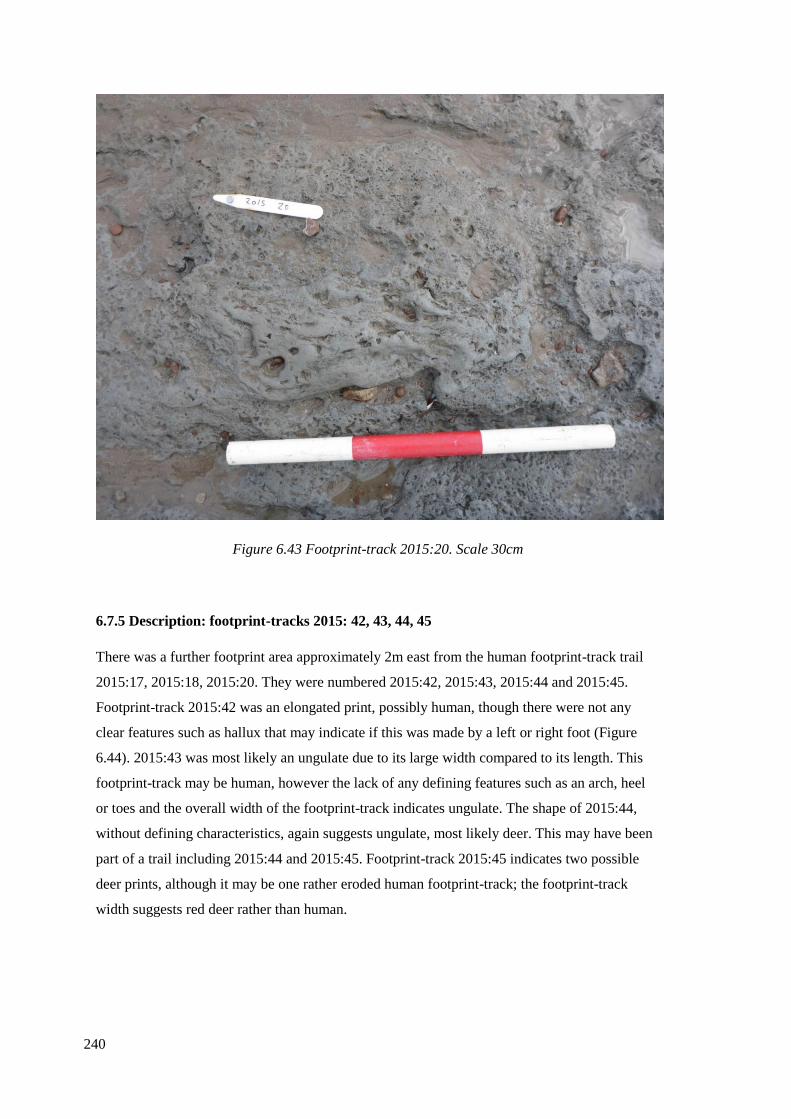
240
Figure 6.43 Footprint-track 2015:20. Scale 30cm
6.7.5 Description: footprint-tracks 2015: 42, 43, 44, 45
There was a further footprint area approximately 2m east from the human footprint-track trail
2015:17, 2015:18, 2015:20. They were numbered 2015:42, 2015:43, 2015:44 and 2015:45.
Footprint-track 2015:42 was an elongated print, possibly human, though there were not any
clear features such as hallux that may indicate if this was made by a left or right foot (Figure
6.44). 2015:43 was most likely an ungulate due to its large width compared to its length. This
footprint-track may be human, however the lack of any defining features such as an arch, heel
or toes and the overall width of the footprint-track indicates ungulate. The shape of 2015:44,
without defining characteristics, again suggests ungulate, most likely deer. This may have been
part of a trail including 2015:44 and 2015:45. Footprint-track 2015:45 indicates two possible
deer prints, although it may be one rather eroded human footprint-track; the footprint-track
width suggests red deer rather than human.
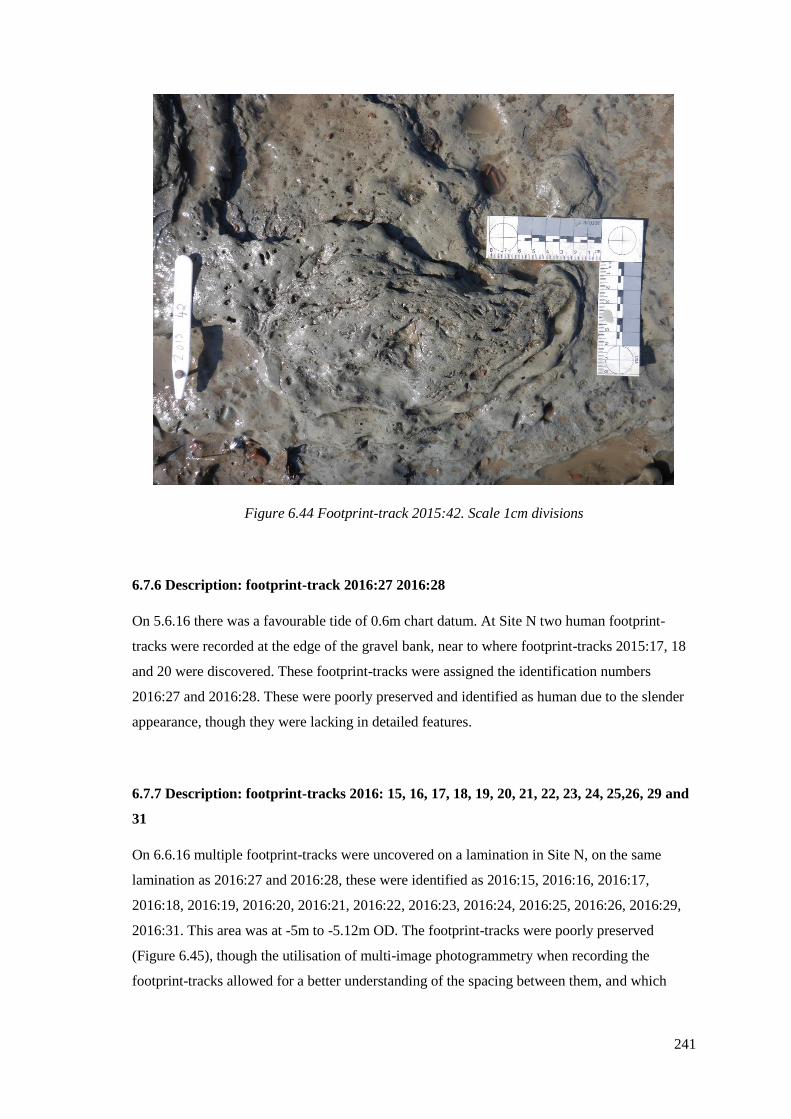
241
Figure 6.44 Footprint-track 2015:42. Scale 1cm divisions
6.7.6 Description: footprint-track 2016:27 2016:28
On 5.6.16 there was a favourable tide of 0.6m chart datum. At Site N two human footprint-
tracks were recorded at the edge of the gravel bank, near to where footprint-tracks 2015:17, 18
and 20 were discovered. These footprint-tracks were assigned the identification numbers
2016:27 and 2016:28. These were poorly preserved and identified as human due to the slender
appearance, though they were lacking in detailed features.
6.7.7 Description: footprint-tracks 2016: 15, 16, 17, 18, 19, 20, 21, 22, 23, 24, 25,26, 29 and
31
On 6.6.16 multiple footprint-tracks were uncovered on a lamination in Site N, on the same
lamination as 2016:27 and 2016:28, these were identified as 2016:15, 2016:16, 2016:17,
2016:18, 2016:19, 2016:20, 2016:21, 2016:22, 2016:23, 2016:24, 2016:25, 2016:26, 2016:29,
2016:31. This area was at -5m to -5.12m OD. The footprint-tracks were poorly preserved
(Figure 6.45), though the utilisation of multi-image photogrammetry when recording the
footprint-tracks allowed for a better understanding of the spacing between them, and which
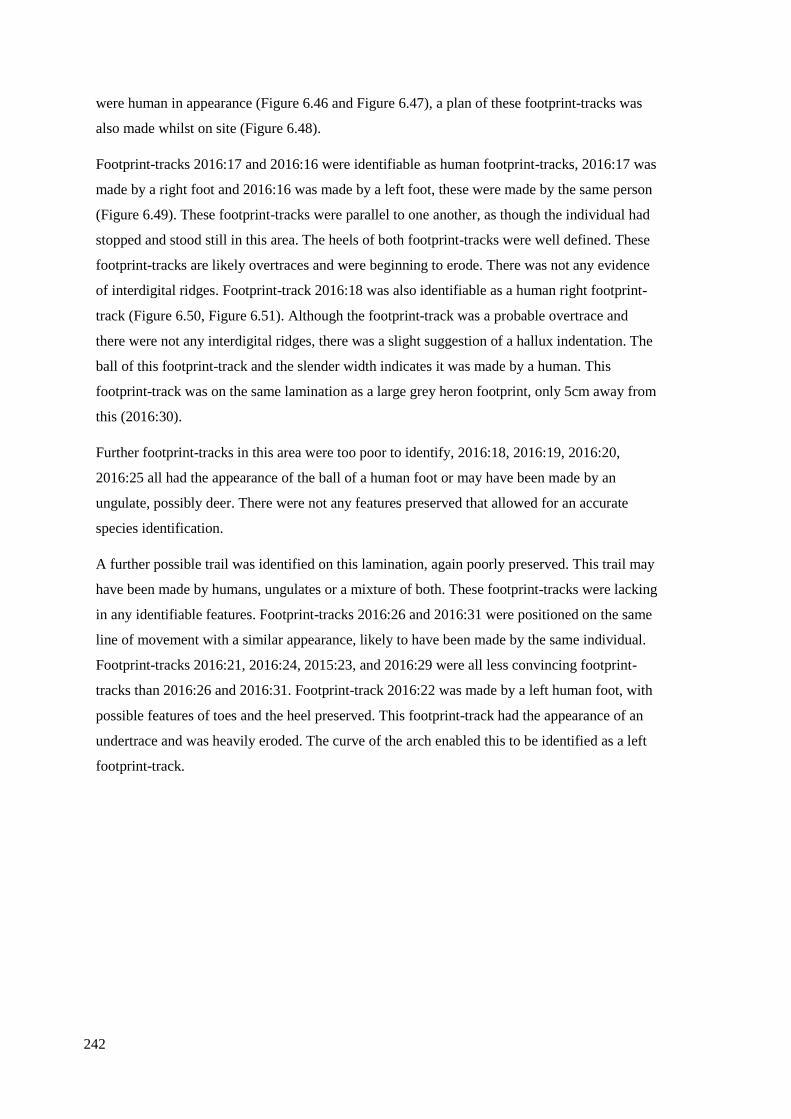
242
were human in appearance (Figure 6.46 and Figure 6.47), a plan of these footprint-tracks was
also made whilst on site (Figure 6.48).
Footprint-tracks 2016:17 and 2016:16 were identifiable as human footprint-tracks, 2016:17 was
made by a right foot and 2016:16 was made by a left foot, these were made by the same person
(Figure 6.49). These footprint-tracks were parallel to one another, as though the individual had
stopped and stood still in this area. The heels of both footprint-tracks were well defined. These
footprint-tracks are likely overtraces and were beginning to erode. There was not any evidence
of interdigital ridges. Footprint-track 2016:18 was also identifiable as a human right footprint-
track (Figure 6.50, Figure 6.51). Although the footprint-track was a probable overtrace and
there were not any interdigital ridges, there was a slight suggestion of a hallux indentation. The
ball of this footprint-track and the slender width indicates it was made by a human. This
footprint-track was on the same lamination as a large grey heron footprint, only 5cm away from
this (2016:30).
Further footprint-tracks in this area were too poor to identify, 2016:18, 2016:19, 2016:20,
2016:25 all had the appearance of the ball of a human foot or may have been made by an
ungulate, possibly deer. There were not any features preserved that allowed for an accurate
species identification.
A further possible trail was identified on this lamination, again poorly preserved. This trail may
have been made by humans, ungulates or a mixture of both. These footprint-tracks were lacking
in any identifiable features. Footprint-tracks 2016:26 and 2016:31 were positioned on the same
line of movement with a similar appearance, likely to have been made by the same individual.
Footprint-tracks 2016:21, 2016:24, 2015:23, and 2016:29 were all less convincing footprint-
tracks than 2016:26 and 2016:31. Footprint-track 2016:22 was made by a left human foot, with
possible features of toes and the heel preserved. This footprint-track had the appearance of an
undertrace and was heavily eroded. The curve of the arch enabled this to be identified as a left
footprint-track.
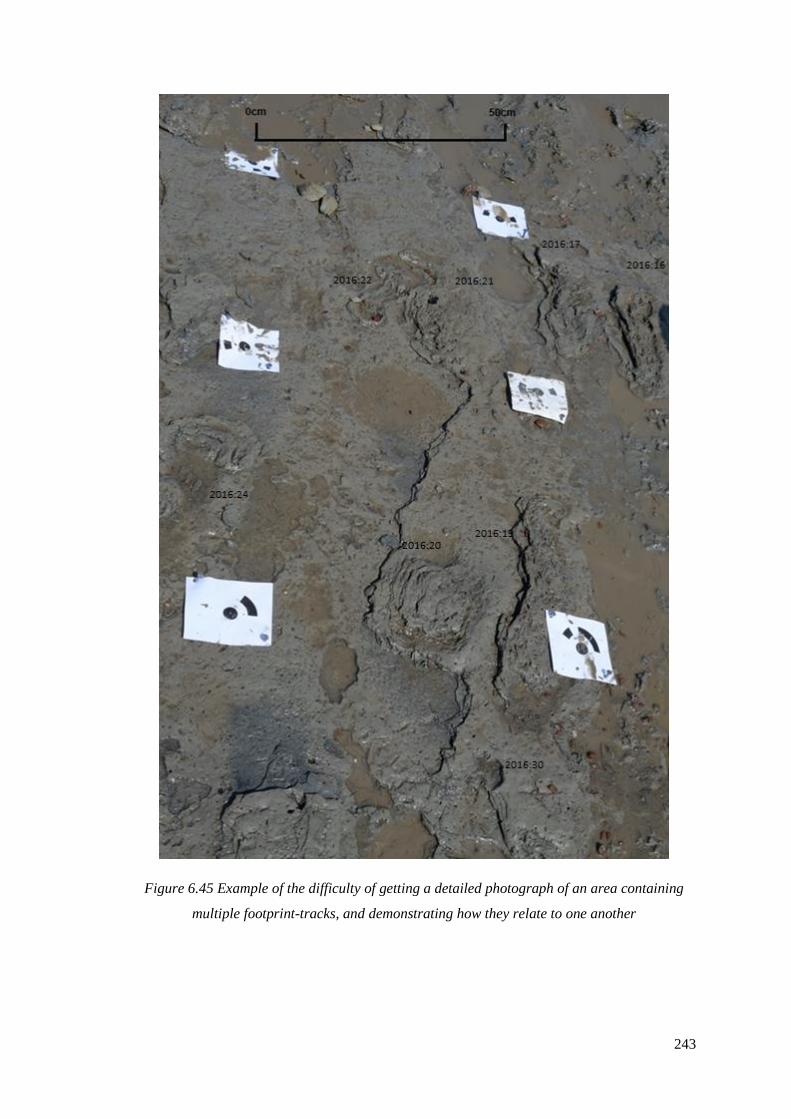
243
Figure 6.45 Example of the difficulty of getting a detailed photograph of an area containing
multiple footprint-tracks, and demonstrating how they relate to one another
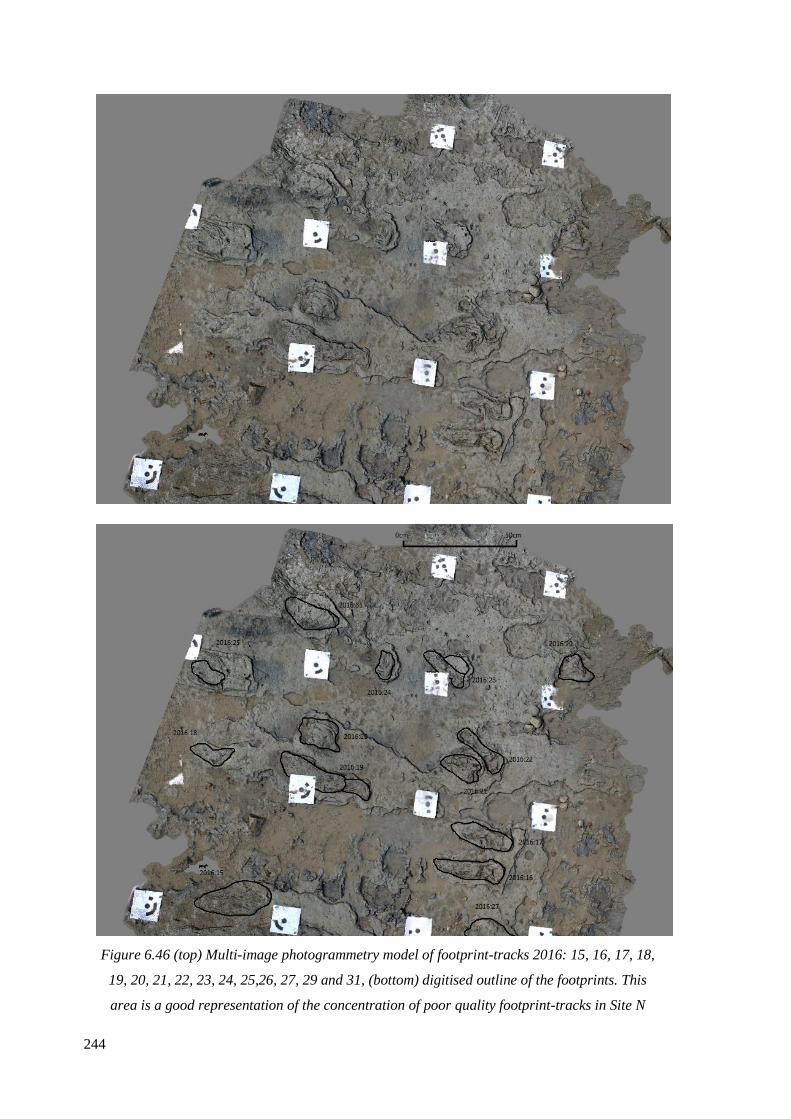
244
Figure 6.46 (top) Multi-image photogrammetry model of footprint-tracks 2016: 15, 16, 17, 18,
19, 20, 21, 22, 23, 24, 25,26, 27, 29 and 31, (bottom) digitised outline of the footprints. This
area is a good representation of the concentration of poor quality footprint-tracks in Site N
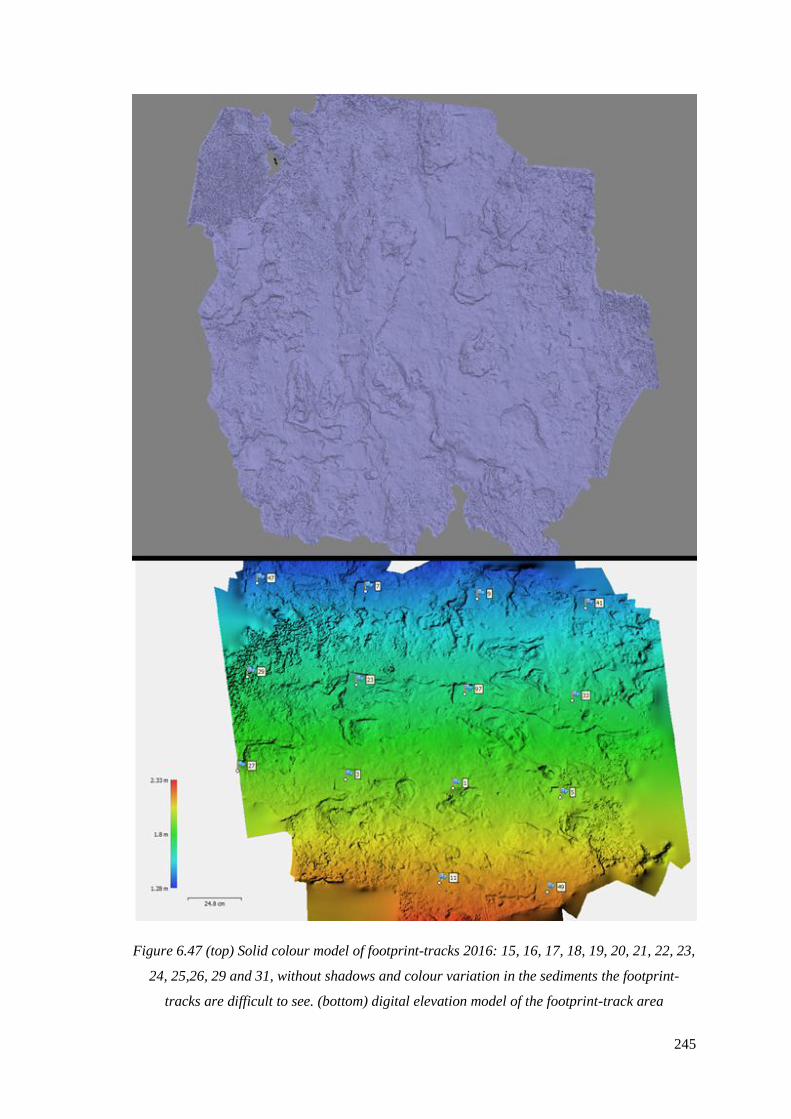
245
Figure 6.47 (top) Solid colour model of footprint-tracks 2016: 15, 16, 17, 18, 19, 20, 21, 22, 23,
24, 25,26, 29 and 31, without shadows and colour variation in the sediments the footprint-
tracks are difficult to see. (bottom) digital elevation model of the footprint-track area
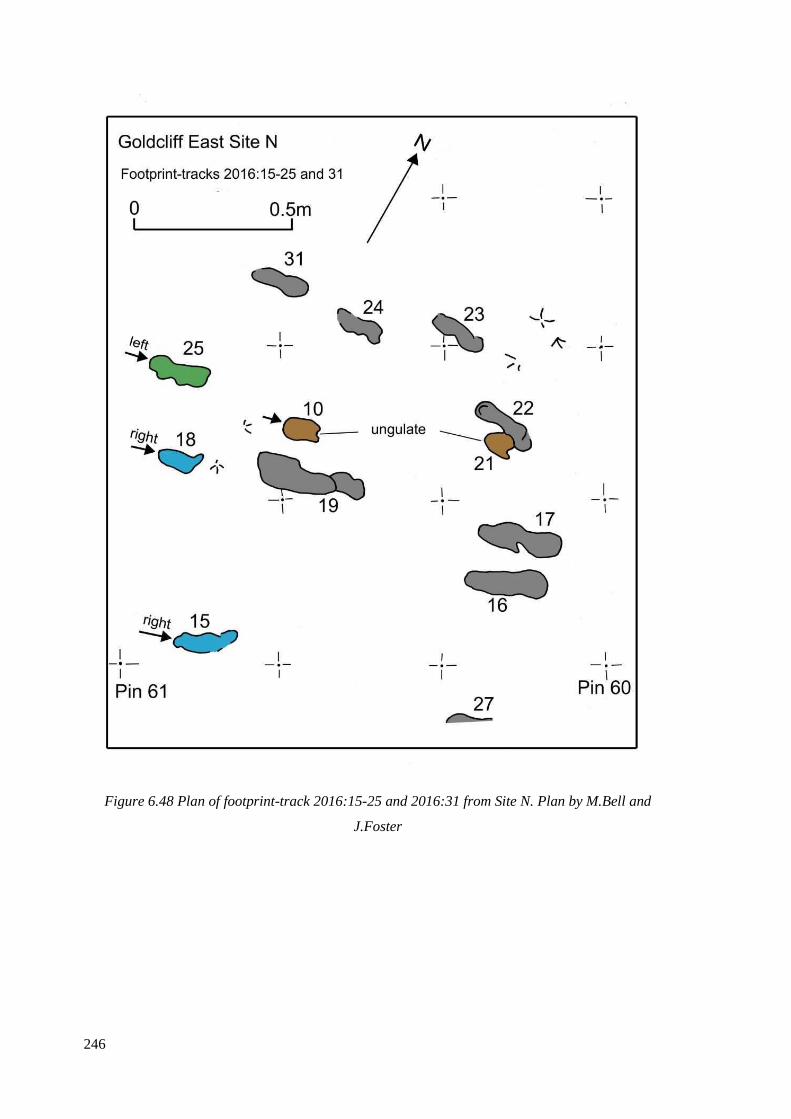
246
Figure 6.48 Plan of footprint-track 2016:15-25 and 2016:31 from Site N. Plan by M.Bell and
J.Foster
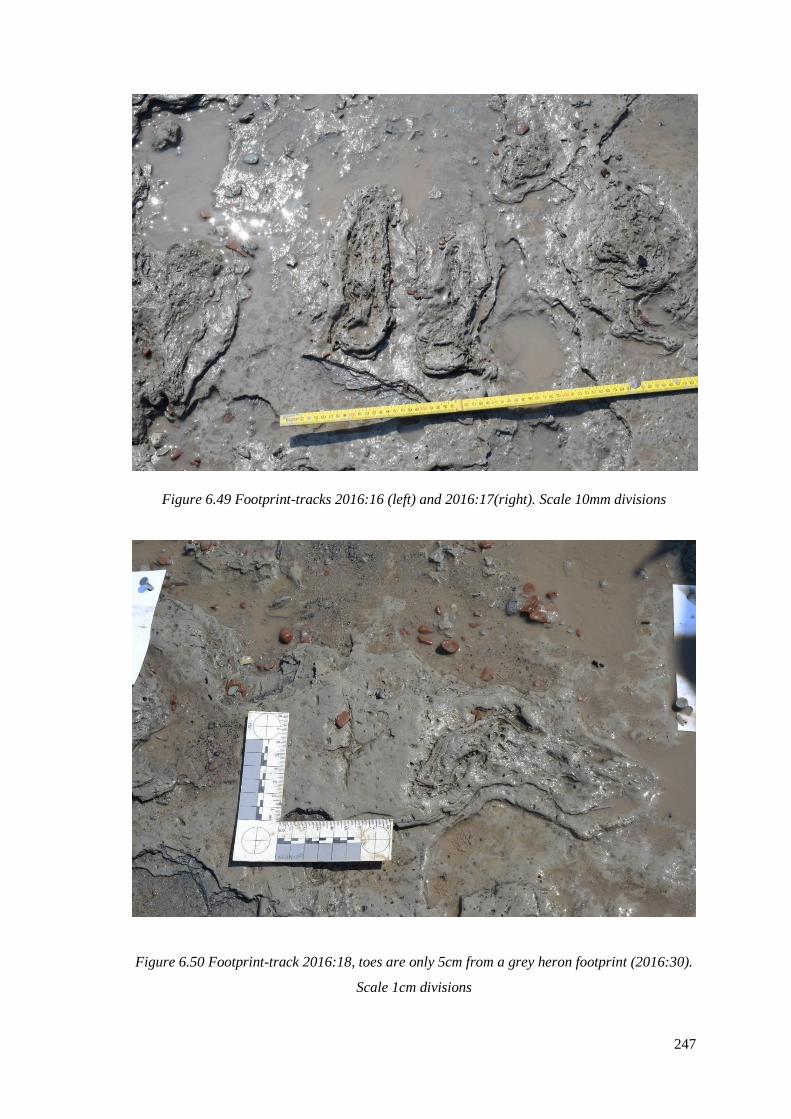
247
Figure 6.49 Footprint-tracks 2016:16 (left) and 2016:17(right). Scale 10mm divisions
Figure 6.50 Footprint-track 2016:18, toes are only 5cm from a grey heron footprint (2016:30).
Scale 1cm divisions
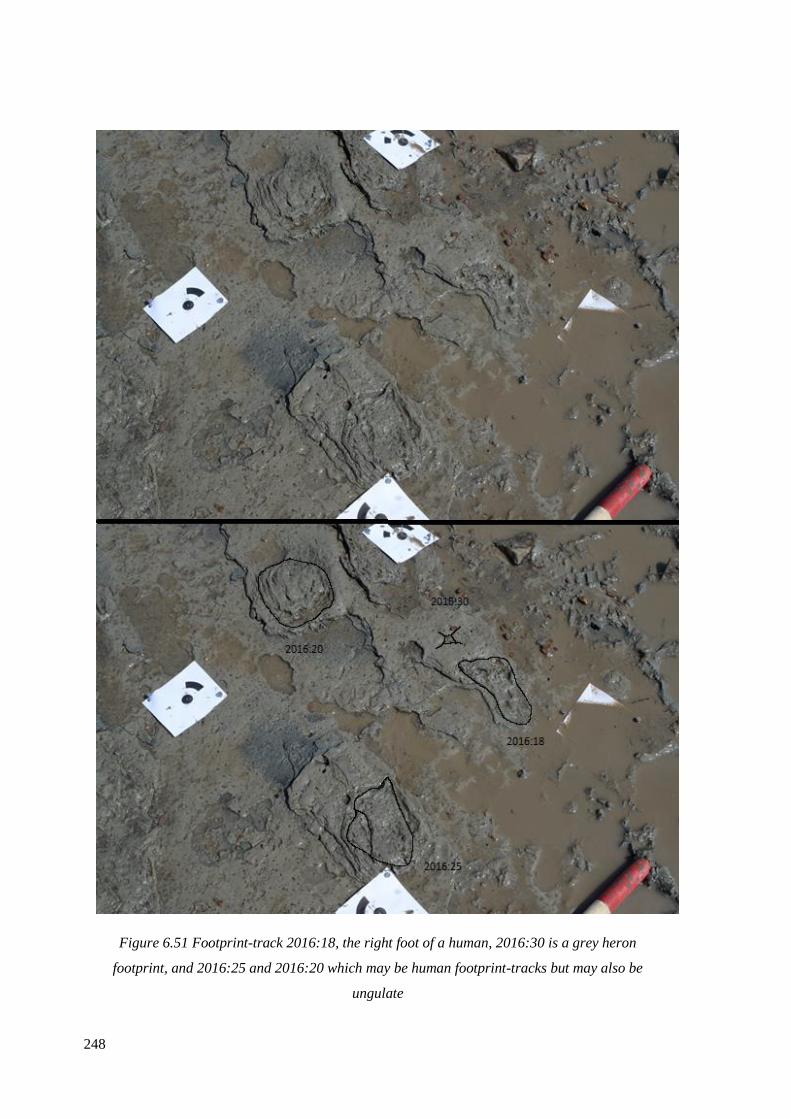
248
Figure 6.51 Footprint-track 2016:18, the right foot of a human, 2016:30 is a grey heron
footprint, and 2016:25 and 2016:20 which may be human footprint-tracks but may also be
ungulate
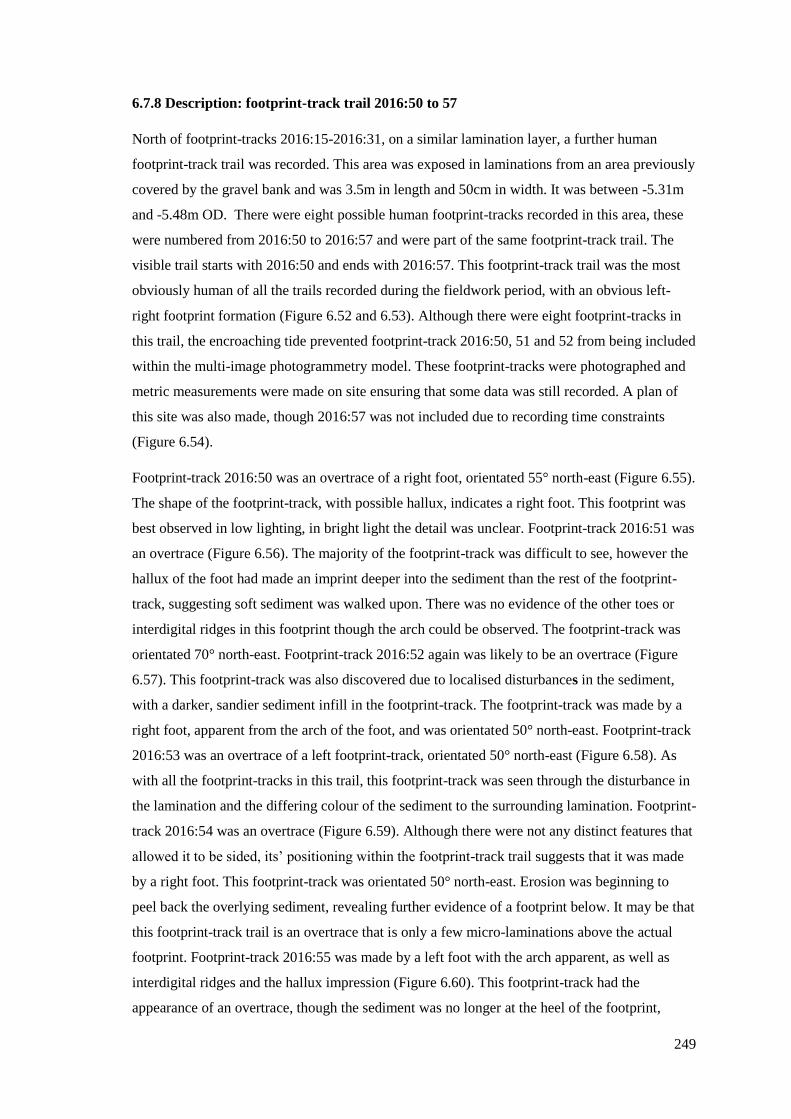
249
6.7.8 Description: footprint-track trail 2016:50 to 57
North of footprint-tracks 2016:15-2016:31, on a similar lamination layer, a further human
footprint-track trail was recorded. This area was exposed in laminations from an area previously
covered by the gravel bank and was 3.5m in length and 50cm in width. It was between -5.31m
and -5.48m OD. There were eight possible human footprint-tracks recorded in this area, these
were numbered from 2016:50 to 2016:57 and were part of the same footprint-track trail. The
visible trail starts with 2016:50 and ends with 2016:57. This footprint-track trail was the most
obviously human of all the trails recorded during the fieldwork period, with an obvious left-
right footprint formation (Figure 6.52 and 6.53). Although there were eight footprint-tracks in
this trail, the encroaching tide prevented footprint-track 2016:50, 51 and 52 from being included
within the multi-image photogrammetry model. These footprint-tracks were photographed and
metric measurements were made on site ensuring that some data was still recorded. A plan of
this site was also made, though 2016:57 was not included due to recording time constraints
(Figure 6.54).
Footprint-track 2016:50 was an overtrace of a right foot, orientated 55° north-east (Figure 6.55).
The shape of the footprint-track, with possible hallux, indicates a right foot. This footprint was
best observed in low lighting, in bright light the detail was unclear. Footprint-track 2016:51 was
an overtrace (Figure 6.56). The majority of the footprint-track was difficult to see, however the
hallux of the foot had made an imprint deeper into the sediment than the rest of the footprint-
track, suggesting soft sediment was walked upon. There was no evidence of the other toes or
interdigital ridges in this footprint though the arch could be observed. The footprint-track was
orientated 70° north-east. Footprint-track 2016:52 again was likely to be an overtrace (Figure
6.57). This footprint-track was also discovered due to localised disturbances in the sediment,
with a darker, sandier sediment infill in the footprint-track. The footprint-track was made by a
right foot, apparent from the arch of the foot, and was orientated 50° north-east. Footprint-track
2016:53 was an overtrace of a left footprint-track, orientated 50° north-east (Figure 6.58). As
with all the footprint-tracks in this trail, this footprint-track was seen through the disturbance in
the lamination and the differing colour of the sediment to the surrounding lamination. Footprint-
track 2016:54 was an overtrace (Figure 6.59). Although there were not any distinct features that
allowed it to be sided, its’ positioning within the footprint-track trail suggests that it was made
by a right foot. This footprint-track was orientated 50° north-east. Erosion was beginning to
peel back the overlying sediment, revealing further evidence of a footprint below. It may be that
this footprint-track trail is an overtrace that is only a few micro-laminations above the actual
footprint. Footprint-track 2016:55 was made by a left foot with the arch apparent, as well as
interdigital ridges and the hallux impression (Figure 6.60). This footprint-track had the
appearance of an overtrace, though the sediment was no longer at the heel of the footprint,

250
either due to erosion, or the way that the foot made contact with the sediment when the footprint
was made. The orientation of this footprint was 60° north-east. Footprint-track 2016:56 was a
poorly preserved footprint-track which prevented its’ identification as a left or right footprint
(Figure 6.61). The positioning within the trail suggests a right footprint. There was not any
evidence of toes, though the heel imprint was evident. The footprint-track was orientated 50°
north-east. Footprint-track 2016:57 was the last footprint-track found within this trail. It was an
overtrace of a left footprint, orientated 55° north-east. This footprint-track had a prominent
arch, hallux and heel (Figure 6.62).
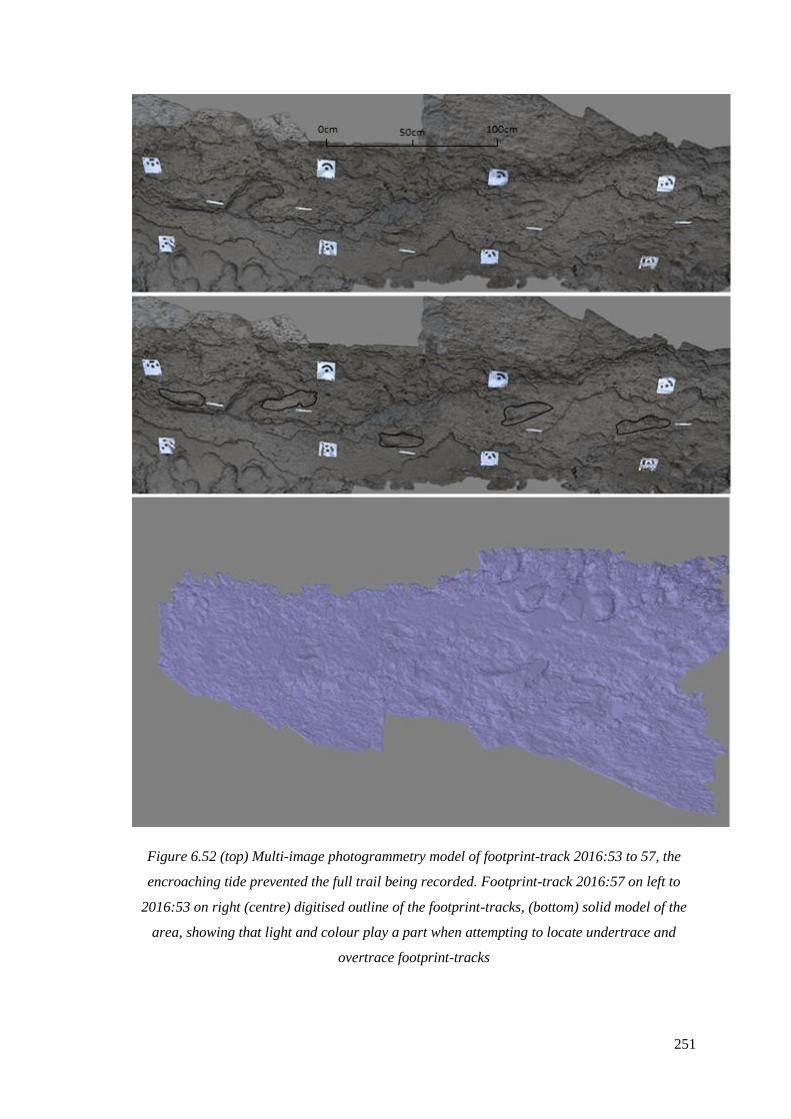
251
Figure 6.52 (top) Multi-image photogrammetry model of footprint-track 2016:53 to 57, the
encroaching tide prevented the full trail being recorded. Footprint-track 2016:57 on left to
2016:53 on right (centre) digitised outline of the footprint-tracks, (bottom) solid model of the
area, showing that light and colour play a part when attempting to locate undertrace and
overtrace footprint-tracks
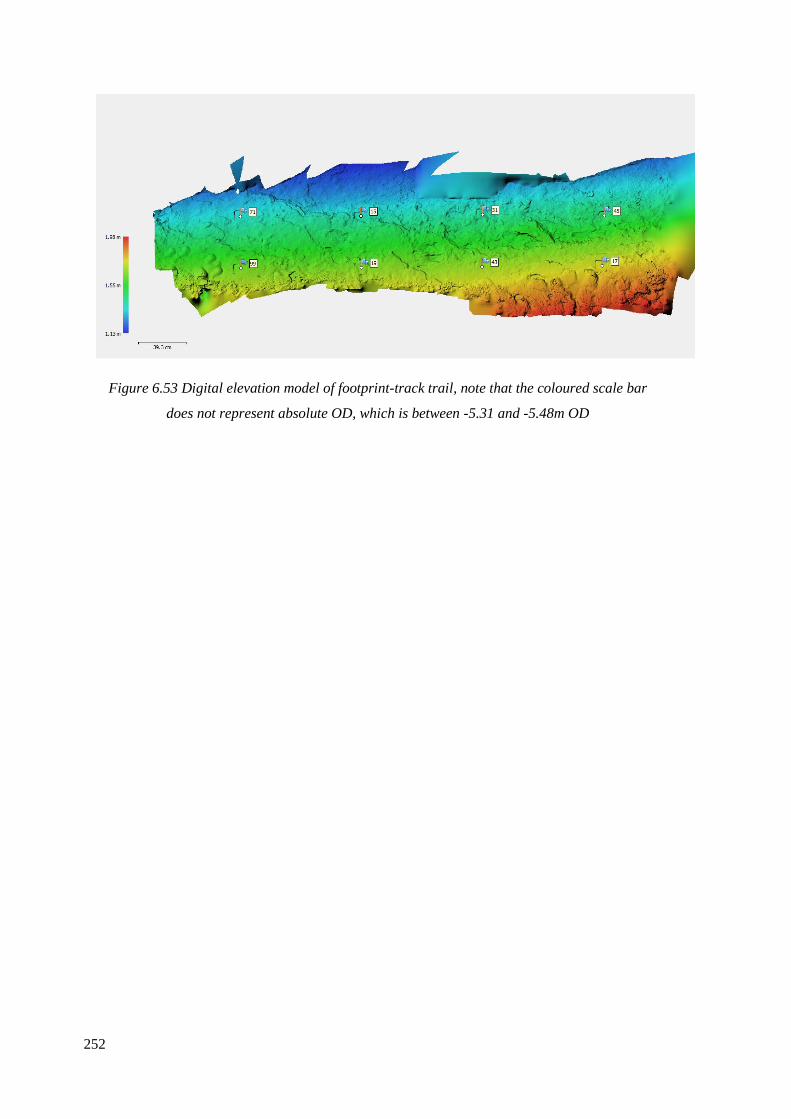
252
Figure 6.53 Digital elevation model of footprint-track trail, note that the coloured scale bar
does not represent absolute OD, which is between -5.31 and -5.48m OD
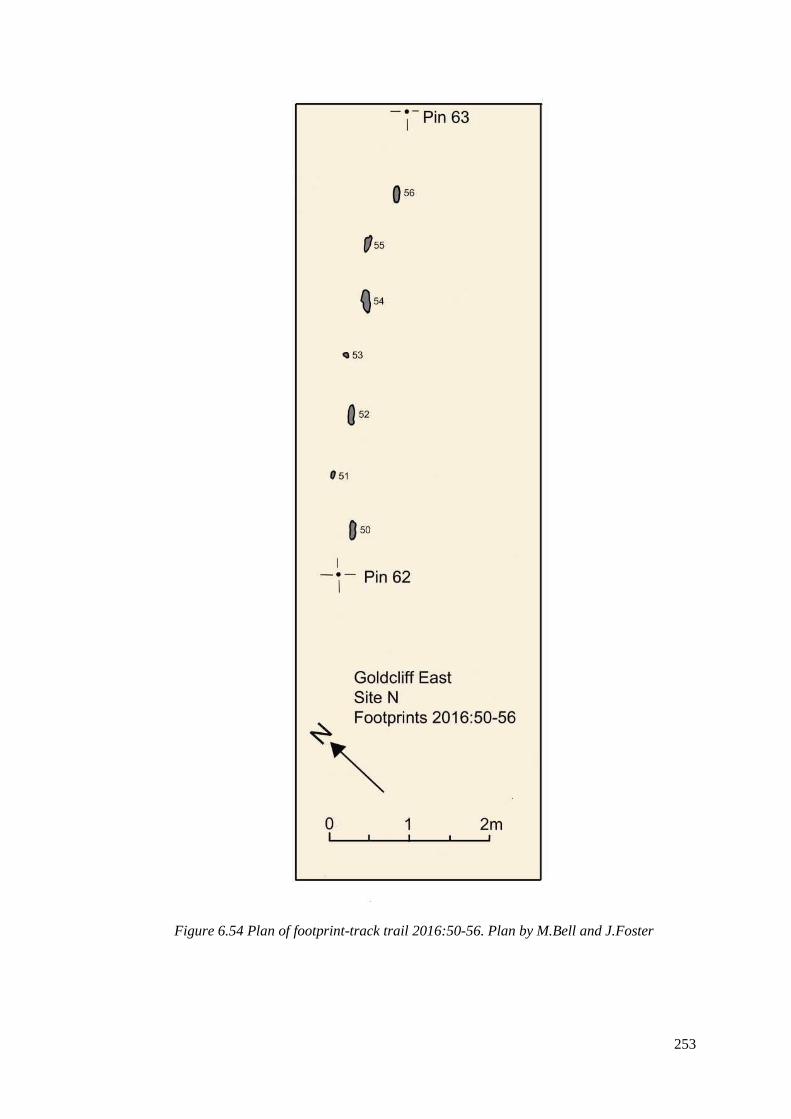
253
Figure 6.54 Plan of footprint-track trail 2016:50-56. Plan by M.Bell and J.Foster
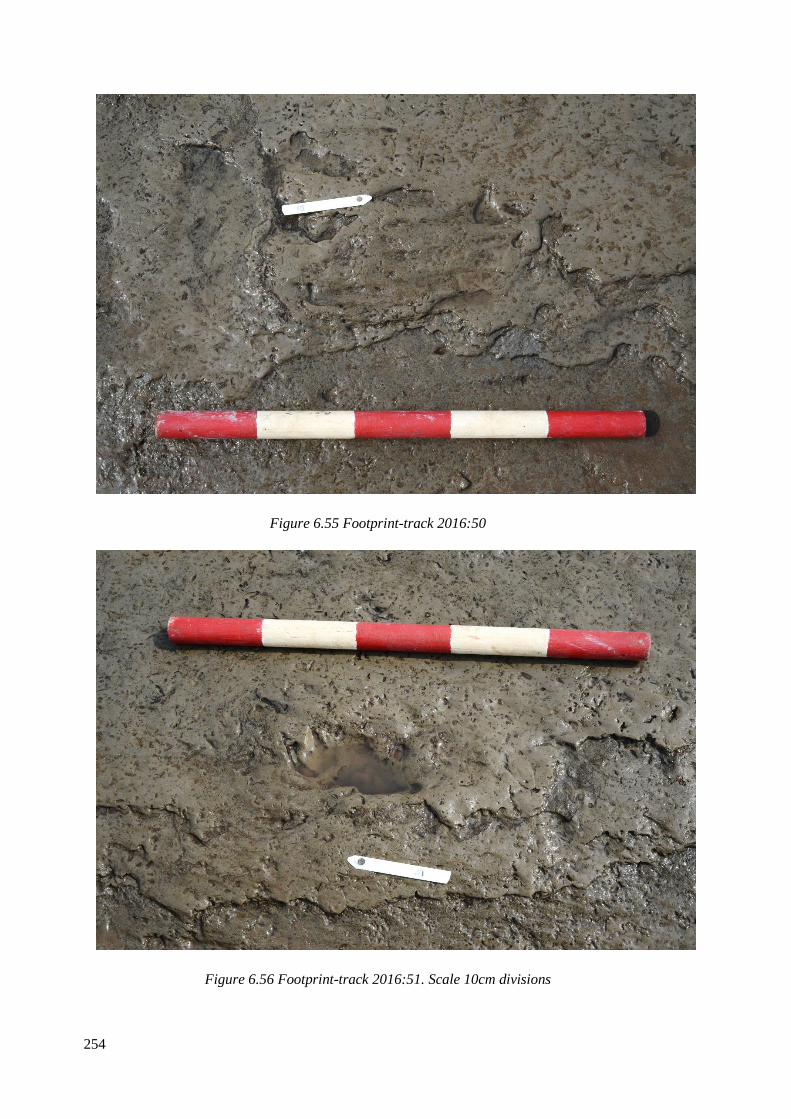
254
Figure 6.55 Footprint-track 2016:50
Figure 6.56 Footprint-track 2016:51. Scale 10cm divisions
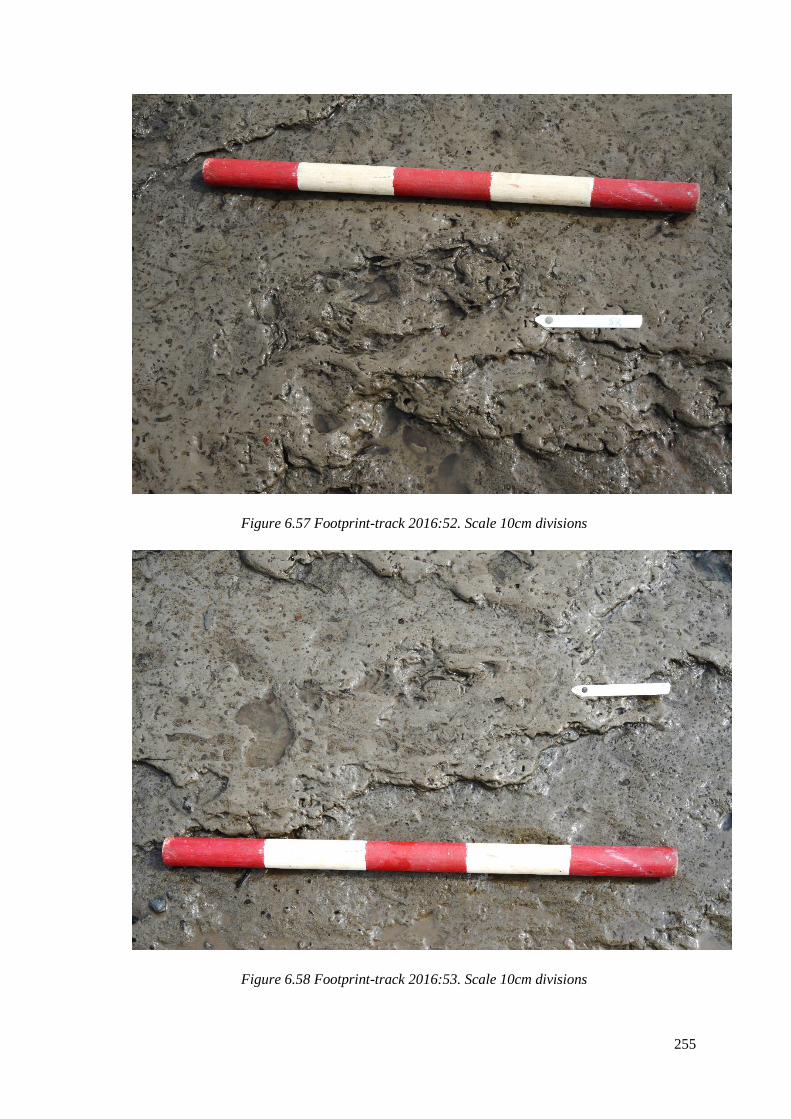
255
Figure 6.57 Footprint-track 2016:52. Scale 10cm divisions
Figure 6.58 Footprint-track 2016:53. Scale 10cm divisions

256
Figure 6.59 Footprint-track 2016:54. Scale 10cm divisions
Figure 6.60 Footprint-track 2016:55. Scale 10cm divisions

257
Figure 6.61 Footprint-track 2016:56. Scale 10cm divisions
Figure 6.62 Footprint-track 2016:57. Scale 10cm divisions
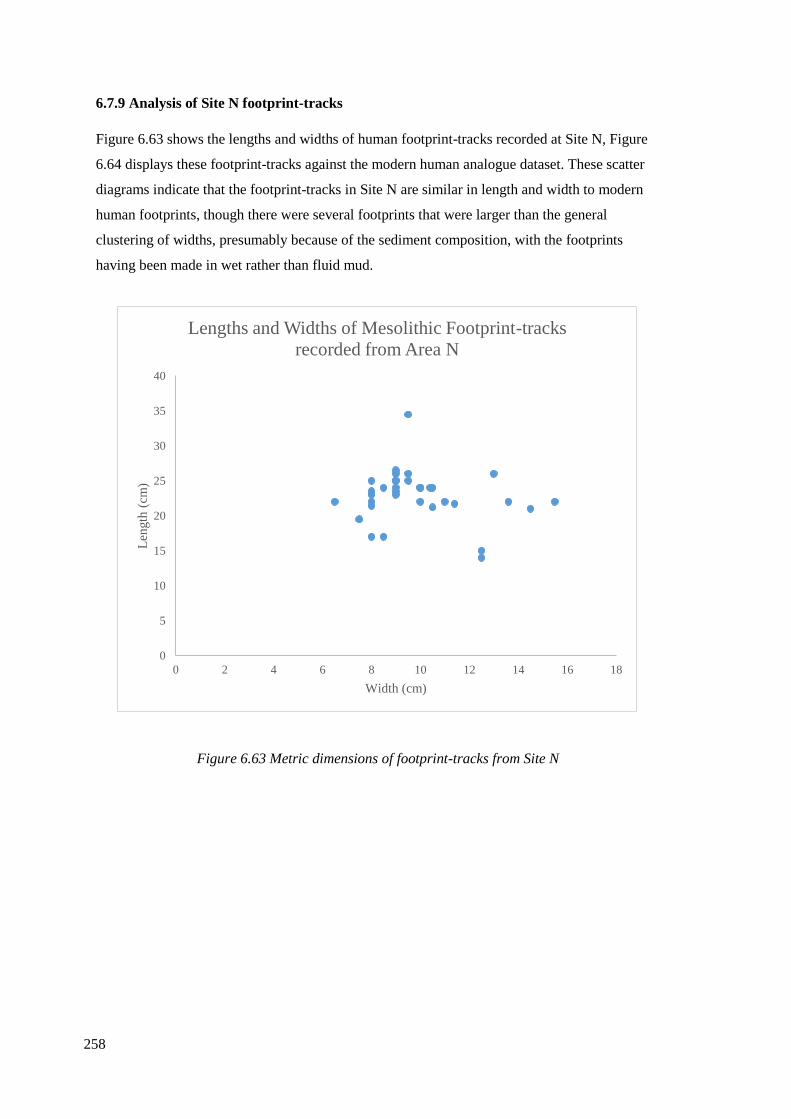
258
6.7.9 Analysis of Site N footprint-tracks
Figure 6.63 shows the lengths and widths of human footprint-tracks recorded at Site N, Figure
6.64 displays these footprint-tracks against the modern human analogue dataset. These scatter
diagrams indicate that the footprint-tracks in Site N are similar in length and width to modern
human footprints, though there were several footprints that were larger than the general
clustering of widths, presumably because of the sediment composition, with the footprints
having been made in wet rather than fluid mud.
Figure 6.63 Metric dimensions of footprint-tracks from Site N
0
5
10
15
20
25
30
35
40
0 2 4 6 8 10 12 14 16 18
Len
gth
(cm
)
Width (cm)
Lengths and Widths of Mesolithic Footprint-tracks
recorded from Area N
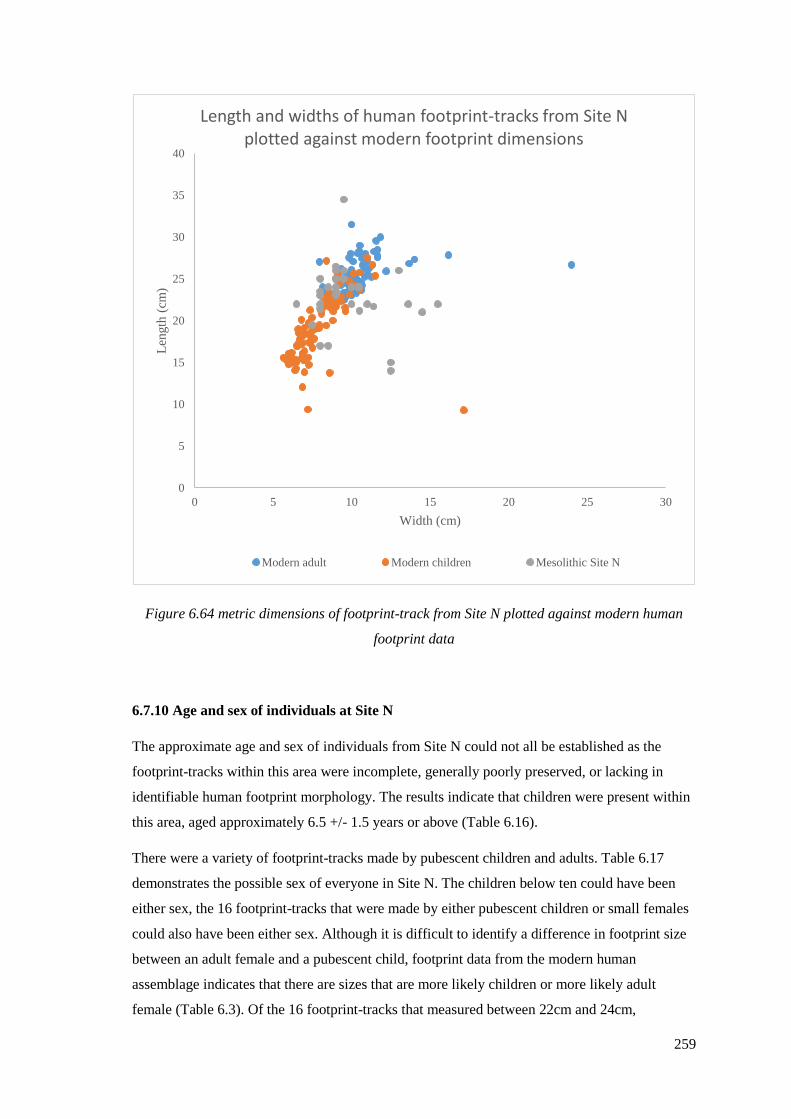
259
Figure 6.64 metric dimensions of footprint-track from Site N plotted against modern human
footprint data
6.7.10 Age and sex of individuals at Site N
The approximate age and sex of individuals from Site N could not all be established as the
footprint-tracks within this area were incomplete, generally poorly preserved, or lacking in
identifiable human footprint morphology. The results indicate that children were present within
this area, aged approximately 6.5 +/- 1.5 years or above (Table 6.16).
There were a variety of footprint-tracks made by pubescent children and adults. Table 6.17
demonstrates the possible sex of everyone in Site N. The children below ten could have been
either sex, the 16 footprint-tracks that were made by either pubescent children or small females
could also have been either sex. Although it is difficult to identify a difference in footprint size
between an adult female and a pubescent child, footprint data from the modern human
assemblage indicates that there are sizes that are more likely children or more likely adult
female (Table 6.3). Of the 16 footprint-tracks that measured between 22cm and 24cm,
0
5
10
15
20
25
30
35
40
0 5 10 15 20 25 30
Len
gth
(cm
)
Width (cm)
Length and widths of human footprint-tracks from Site N plotted against modern footprint dimensions
Modern adult Modern children Mesolithic Site N

260
indicating a child or adult female, six of the footprint-tracks were 22cm in length. Only 13% of
adult females from the modern data assemblage had footprint-tracks this small, which indicates
these are more likely to have been made by children. Four of the footprint-tracks had a length of
23cm, this is where most cross-over between children and adult female sizing occurs, with 17%
of children (ten to 15 years) displaying this length of footprint, and 21% of modern adult
females also sharing this footprint length. The final six of the footprint-tracks measuring 24cm
are slightly more likely to have been made by adult females; 29% of modern adult females had
this footprint length, as opposed to 17% of children aged between ten and 15 years. In
determining if females were present in this area, it is likely that at least six of the 16 footprint-
tracks were adult females, there is also the possibility that the footprint-tracks measuring 25cm
and 26cm were made by adult females. 21% of adult females from the modern data had
footprints measuring 25cm, though 22% of children aged 10-15 years also had this foot length.
Only 11% of modern adult males had a footprint length as small as 25cm, indicating that the
four footprint-tracks of this size were more likely made by children or adult females. Four
further Mesolithic footprint-tracks were 26cm in length; the largest footprint-track recorded
from Site N was 26.5cm, the size of these footprints indicate that they could have been made by
pubescent children or adults of both sexes. Only 11% of modern children aged ten to 15 years
had a footprint length of 27+cm, and 5% of adult females made footprints 27+cm. In
comparison, 68% of modern male footprints were sized 27cm and above, indicating that
although it is possible for children and adult females to make large footprint-tracks, it is far
more likely that large footprint-tracks were made by males. Within Site N the lack of large
footprint-tracks suggests that large adult males were unlikely to have been in this area, and that
adult females, pubescent children and young children were all walking within an area 16m by
6m, the footprint-tracks made within this area were made on multiple laminations, indicating a
pathway being used repeatedly by children and possibly adult females over multiple visits.
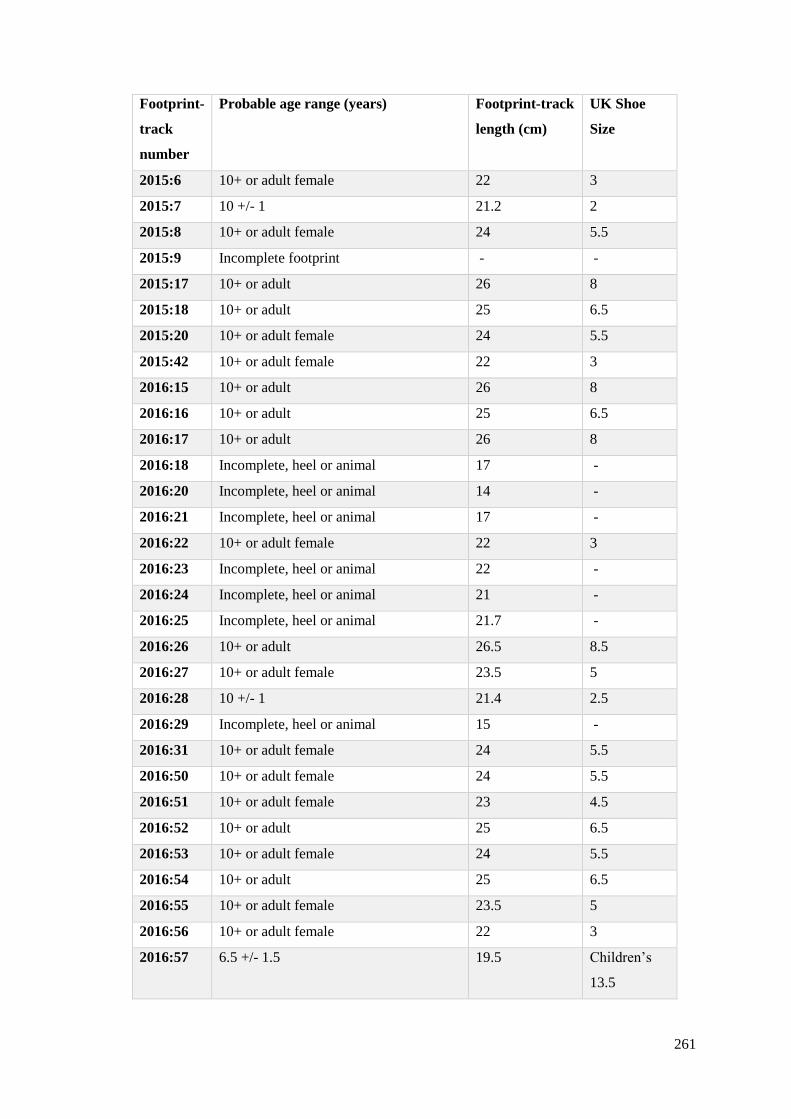
261
Footprint-
track
number
Probable age range (years) Footprint-track
length (cm)
UK Shoe
Size
2015:6 10+ or adult female 22 3
2015:7 10 +/- 1 21.2 2
2015:8 10+ or adult female 24 5.5
2015:9 Incomplete footprint - -
2015:17 10+ or adult 26 8
2015:18 10+ or adult 25 6.5
2015:20 10+ or adult female 24 5.5
2015:42 10+ or adult female 22 3
2016:15 10+ or adult 26 8
2016:16 10+ or adult 25 6.5
2016:17 10+ or adult 26 8
2016:18 Incomplete, heel or animal 17 -
2016:20 Incomplete, heel or animal 14 -
2016:21 Incomplete, heel or animal 17 -
2016:22 10+ or adult female 22 3
2016:23 Incomplete, heel or animal 22 -
2016:24 Incomplete, heel or animal 21 -
2016:25 Incomplete, heel or animal 21.7 -
2016:26 10+ or adult 26.5 8.5
2016:27 10+ or adult female 23.5 5
2016:28 10 +/- 1 21.4 2.5
2016:29 Incomplete, heel or animal 15 -
2016:31 10+ or adult female 24 5.5
2016:50 10+ or adult female 24 5.5
2016:51 10+ or adult female 23 4.5
2016:52 10+ or adult 25 6.5
2016:53 10+ or adult female 24 5.5
2016:54 10+ or adult 25 6.5
2016:55 10+ or adult female 23.5 5
2016:56 10+ or adult female 22 3
2016:57 6.5 +/- 1.5 19.5 Children’s
13.5
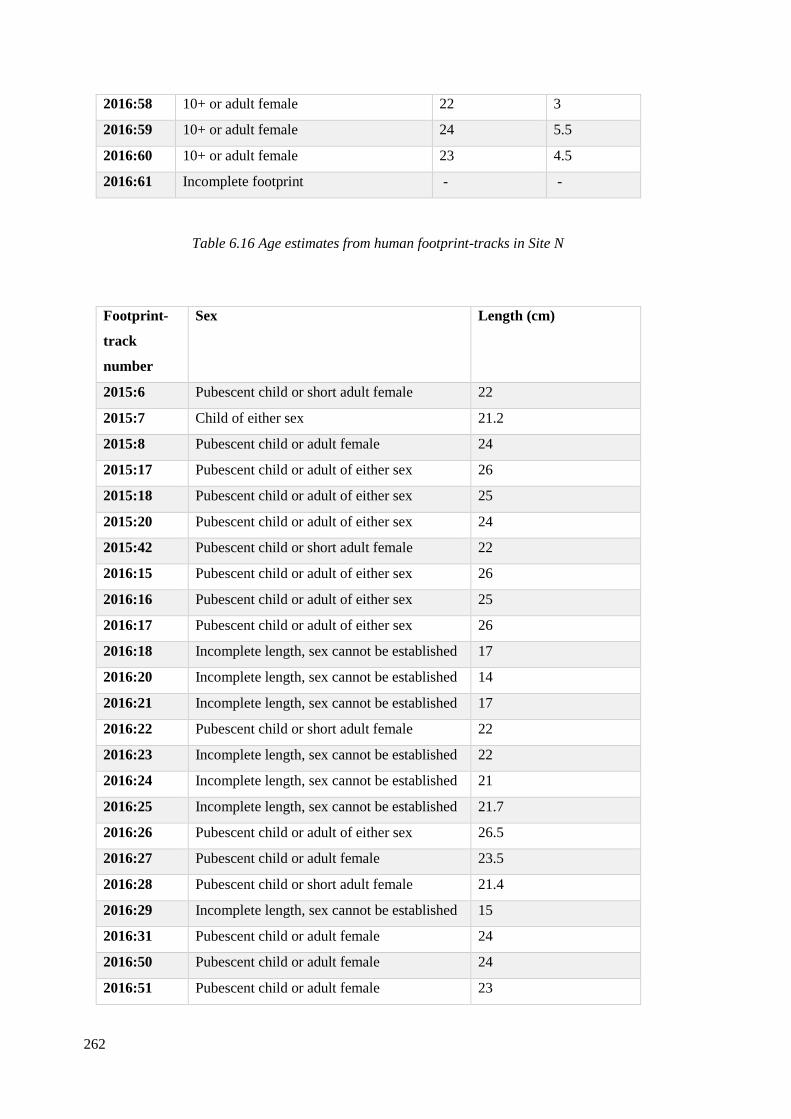
262
2016:58 10+ or adult female 22 3
2016:59 10+ or adult female 24 5.5
2016:60 10+ or adult female 23 4.5
2016:61 Incomplete footprint - -
Table 6.16 Age estimates from human footprint-tracks in Site N
Footprint-
track
number
Sex Length (cm)
2015:6 Pubescent child or short adult female 22
2015:7 Child of either sex 21.2
2015:8 Pubescent child or adult female 24
2015:17 Pubescent child or adult of either sex 26
2015:18 Pubescent child or adult of either sex 25
2015:20 Pubescent child or adult of either sex 24
2015:42 Pubescent child or short adult female 22
2016:15 Pubescent child or adult of either sex 26
2016:16 Pubescent child or adult of either sex 25
2016:17 Pubescent child or adult of either sex 26
2016:18 Incomplete length, sex cannot be established 17
2016:20 Incomplete length, sex cannot be established 14
2016:21 Incomplete length, sex cannot be established 17
2016:22 Pubescent child or short adult female 22
2016:23 Incomplete length, sex cannot be established 22
2016:24 Incomplete length, sex cannot be established 21
2016:25 Incomplete length, sex cannot be established 21.7
2016:26 Pubescent child or adult of either sex 26.5
2016:27 Pubescent child or adult female 23.5
2016:28 Pubescent child or short adult female 21.4
2016:29 Incomplete length, sex cannot be established 15
2016:31 Pubescent child or adult female 24
2016:50 Pubescent child or adult female 24
2016:51 Pubescent child or adult female 23
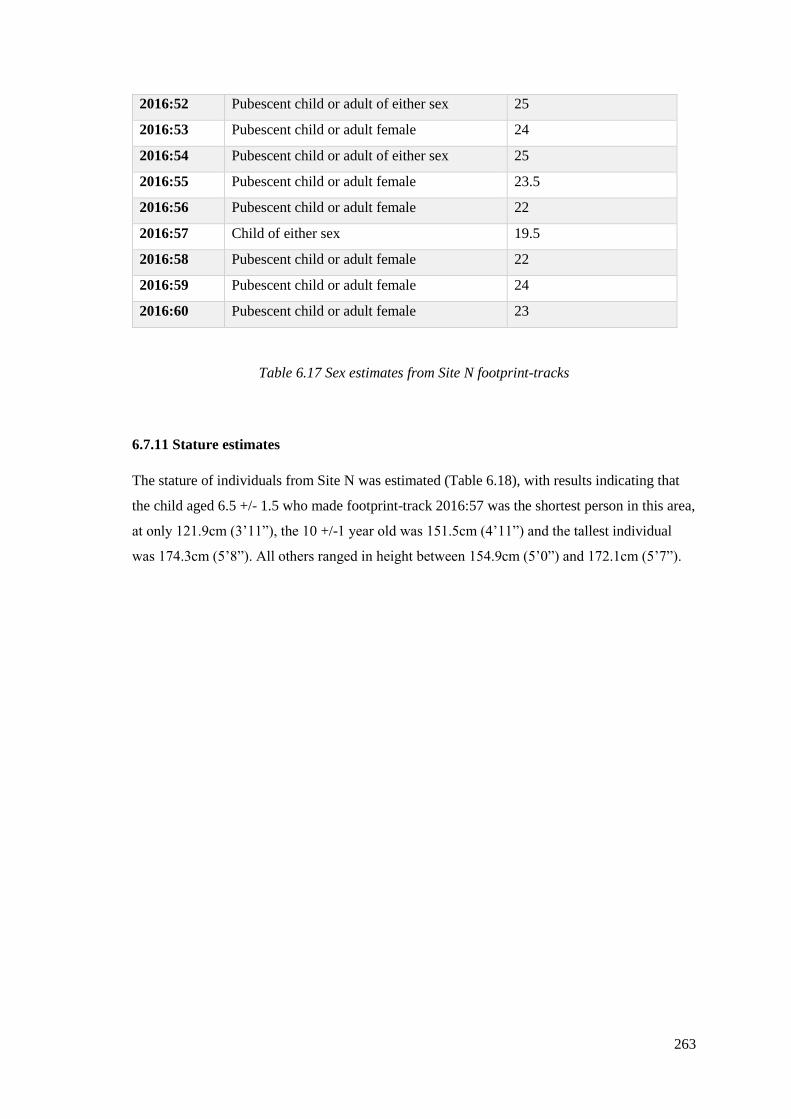
263
2016:52 Pubescent child or adult of either sex 25
2016:53 Pubescent child or adult female 24
2016:54 Pubescent child or adult of either sex 25
2016:55 Pubescent child or adult female 23.5
2016:56 Pubescent child or adult female 22
2016:57 Child of either sex 19.5
2016:58 Pubescent child or adult female 22
2016:59 Pubescent child or adult female 24
2016:60 Pubescent child or adult female 23
Table 6.17 Sex estimates from Site N footprint-tracks
6.7.11 Stature estimates
The stature of individuals from Site N was estimated (Table 6.18), with results indicating that
the child aged 6.5 +/- 1.5 who made footprint-track 2016:57 was the shortest person in this area,
at only 121.9cm (3’11”), the 10 +/-1 year old was 151.5cm (4’11”) and the tallest individual
was 174.3cm (5’8”). All others ranged in height between 154.9cm (5’0”) and 172.1cm (5’7”).
264
Footprint
-track
number
Footprint
-track
length
(cm)
Footprint
side
Estimated stature
(cm)
Height (feet
and inches)
Standard
error
2015:6 22 Indistinct 154.9 5’0” 7.3
2015:7 21.2 Indistinct 151.5 4’11” 7.3
2015:8 24 Indistinct 163.5 5’4” 7.3
2015:17 26 Left 172.1 5’7” 7.3
2015:18 25 Right 167.8 5’6” 7.3
2015:20 24 Left 161.7 5’3” 6
2015:42 22 Indistinct 154.9 5’0” 7.3
2016:15 26 Right 172.1 5’7” 7.3
2016:16 25 Right 167.8 5’6” 7.3
2016:17 26 Left 172.1 5’7” 7.3
2016:26 26.5 Right 174.3 5’8” 7.3
2016:27 23.5 Indistinct 161.4 5’3” 7.3
2016:28 21.4 Indistinct 152.3 4’11” 7.3
2016:31 24 Left 162.2 5’3” 6
2016:50 24 Right 162 5’3” 6.18
2016:51 23 Left 158.9 5’2” 6
2016:52 25 Right 167.8 5’5” 7.3
2016:53 24 Left 161.8 5’3” 6
2016:54 25 Indistinct 167.8 5’6” 7.3
2016:55 23.5 Left 160.4 5’3” 6
2016:56 22 Indistinct 154.9 5’0” 7.3
2016:57 19.5 Left 121.9 3’11” 9.14
2016:58 22 Right 156.2 5’1” 6.18
2016:59 24 Left 164.5 5’4” 6
2016:60 23 Left 158.9 5’2” 6
Table 6.18 Stature estimates from footprint-tracks from Site N
265
6.7.12 Speed of movement Site N
The footprint-tracks recorded at Site N were the poorest in terms of clear footprints, however
some of the best human footprint-track trails were discovered here during the fieldwork period
of 2014 to 2016. There were two trails recorded in this area, one involved three footprint-tracks,
2015:17, 2015:18 and 2015:20, the other was a trail of eight footprint-tracks. These footprint-
tracks were orientated in the same direction upon the same lamination, and had a clear left-right
foot pacing, as well as the long and slender footprint morphology expected to be seen in a
human footprint.
The individual who made the trail of footprint-tracks 2015:17, 2015:18 and 2015:20 had a
footprint-track length ranging between 24cm and 26cm, with a stature between 161.7cm (5’3”)
and 172.1cm (5’7”). This person had a stride of 170cm, walking at 1.66 meters per second,
which equates to 6km per hour (4mph), an average walking speed for someone of that height
(Table 6.19). If running they would have been travelling at 2.15 meters per second, meaning
they would have been traveling at 8k per hour (5mph), a slow jogging pace. This person created
footprint-tracks with a clear arch and heel, making it unlikely that they were running at a fast
pace, given the estimated speed of travel it is more likely they were walking quickly along the
foreshore.
The eight footprint-tracks from trail 2016:50 to 2016:57 were better preserved than many of the
other footprint-tracks in this area. This trail was made by a bipedal individual, with the arches
and heels of the feet evident, and a deep hallux imprint in one of the footprint-tracks. The
estimated speed was calculated for each of the stride lengths (left to left, right to right) and then
an average of these results was calculated to give an accurate understanding of the speed of
movement. Although made by the same individual, the stride length varied between 130cm and
157cm; this meant that there was a slight difference in the speed estimates for each separate
footprint. The combined average indicated a stride length of 147.6cm, meaning that they would
have been travelling at 1.46 meters per second when walking, which equates to a walking speed
of 5k per hour (3 miles per hour). This is a relatively average walking pace. If the individual
was running they would have been covering 1.89 meters per second, which would equate to 7k
per hour (4 miles per hour). This is an unrealistic speed to run as it would be an incredibly slow
speed considering that the individual had an estimated stature between 154.9cm (5’0”) and
167.8cm (5’6”). This person was walking in an eastern direction. The footprint-tracks were
relatively slender, between 6.5cm and 10cm, making it unlikely that they were carrying a heavy
load.

266
Footprint-
track
number
Footprint-
track length
average (cm)
Stride (cm) Walking (meters
per second)
Running
(meters
per
second)
Walking
and
running
(meters
per
second)
2015:17 to
2015:20
25 170 1.66 2.15 1.87
2016:50 to
2016:52
24.5 152 1.48 1.9 1.58
2016:51 to
2016:53
23.5 155 1.59 2.07 1.77
2016:52 to
2016:54
25 157 1.5 1.94 1.62
2016:53 to
2016:55
23.7 144 1.44 1.86 1.52
2016:54 to
2016:56
23 130 1.31 1.68 1.32
Average
2016:50 to
2016:56
23.9 147.6 1.46 1.89 1.56
Table 6.19 Speed of movement of Site N individuals
6.7.13 Site N direction of movement
Analysis of the footprint-tracks (2014-2017) recorded in Site N indicates a similar direction of
movement to Site M, travelling in a north-east and south-west direction (Figure 6.65). The
footprint-tracks recorded between 2011-2014 were not included with this analysis as orientation
of each footprint-track was not recorded during the fieldwork, though the plan from the tracings
made onsite suggest that these individuals were moving east towards the sea and west, away
from the sea and towards Goldcliff Island (Figure 6.65). The 2011-2017 footprint-tracks were
on a similar axis suggesting that they were walking towards and away from a palaeochannel, at
right-angles. The footprint-tracks were found on several laminations, implying that this small
area was visited multiple times, over a period of several years.

267
In this area, of the 35 footprint-tracks recorded during 2014-2016, 26 were orientated north-
east, between 50° and 103°, three footprint-tracks were orientated south-west, between 240° and
250°, and six footprint-tracks were not clear enough to establish orientation. 29 of the footprint-
tracks were orientated on the same axis as the recently found wood structure of a possible fish
trap (Site T) which lies on this axis between Site N and the edge of the island. Site N seems to
be a distinct axis of movement, covering a ‘pathway’ 16m by 6m. The dip of the laminated
sediments at Site N suggests that, although this is on the same axis as Site T, it is likely to be
later in date and therefore the footprint-tracks probably relate to another fish trap covered by the
area of water east of Site N. It is likely that this ‘pathway’ led to a fish trap from when the
channel migrated further east, Site L is a site further east and very fragmentary traces of a wood
structure possibly representing fragments of a fish trap was found within this palaeochannel
(Bell 2007, p 50).
These people were walking at a steady pace and in a similar direction which suggests
engagement in some routine activity at a static place; the fish trap evidence is consistent with
this. Those concerned with looking after the hypothetical fish trap appear to have been children
and women without the definite involvement of adult males.
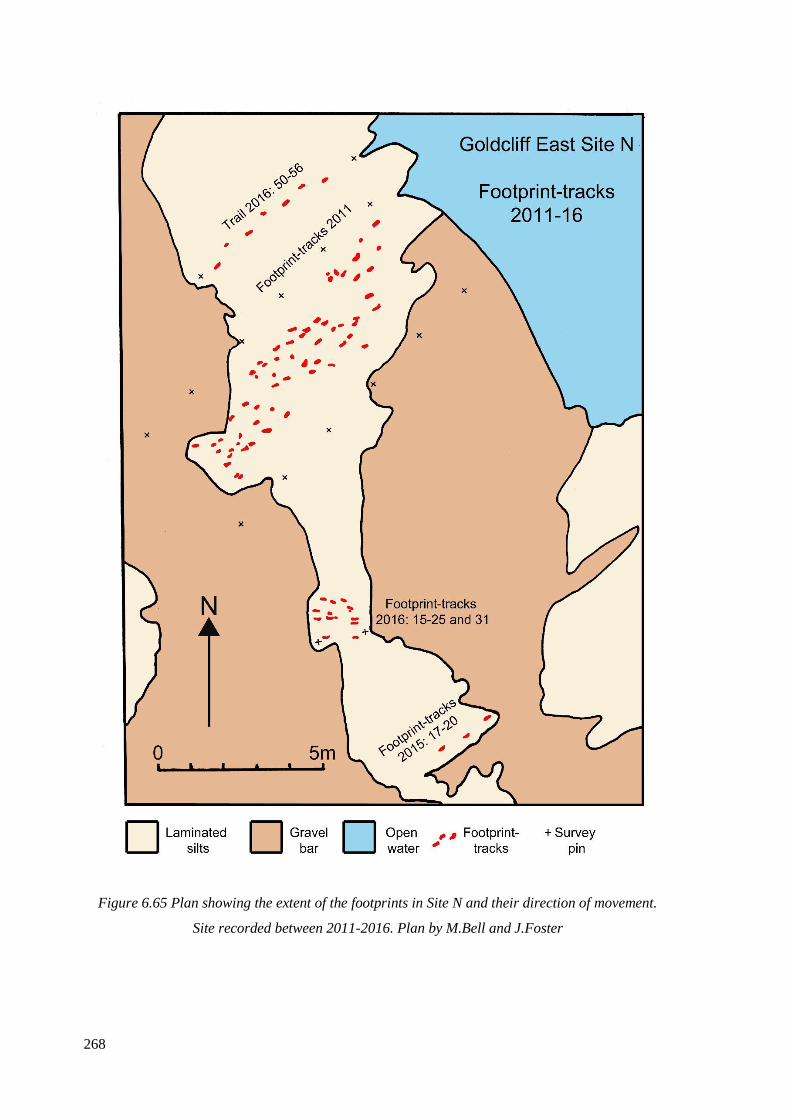
268
Figure 6.65 Plan showing the extent of the footprints in Site N and their direction of movement.
Site recorded between 2011-2016. Plan by M.Bell and J.Foster
269
6.8 Site R footprint-tracks
Site R was discovered on 16.9.16, 9.5m east of the edge of a palaeochannel where it cuts the
Lower Peat shelf (Figure 6.66). It is the most western of the Mesolithic human footprint areas
so far recorded at Goldcliff East and was briefly exposed on laminated silts between -4.17 and -
4.35m OD which are generally covered by sands and gravels. The footprint-tracks at Site R
were on consolidated banded sediments exposed in plan.
Within this area eight footprint-tracks were recorded, three formed a trail of human footprint-
tracks. There was also a singular human footprint-track that was not part of the trail, this was
determined by observing its orientation, size and positioning. The final four footprint-tracks
were possibly human heel prints, though the shape is more suggestive of ungulates.
The footprint-tracks ranged in length from 14cm to 26cm in length, and 7.5cm to 12cm in
width. The footprint-tracks that were not accurately identified were still included in these results
as they could possibly be human heel prints (Table 6.20).

270
Figure 6.66 Small exposed lamination of Site R, being recorded by the author utilising multi-
image photogrammetry and ground control points (photograph by M. Bell)

271
Footprint
-track
number
Site Length
(cm)
Width
(cm)
Identifying features? Left or
Right?
Direction
of
movement
2016:73 R 20.5 12 Overtrace/undertrace
hallux and heel evident
Left 295° west
2016:74 R 19.5 10.5 Partially preserved
human, or animal
Indistinct Indistinct
2016:75 R 26 12 Overtrace/undertrace
hallux and heel evident
Right 295° west
2016:76 R 24.5 10.2 Partially preserved
human or animal
Indistinct Indistinct
2016:77 R 14 10 Partially preserved
human, or animal
Indistinct Indistinct
2016:82 R 17 7.5 Clear hallux Left 270° west
2016:83 R - 12 Disturbed area,
indistinct footprint
indistinct Indistinct
2016: 100 R 23.2 11 Overtrace/undertrace
hallux and heel evident
Left 295° west
Table 6.20 Data of footprint-tracks recorded from Site R
6.8.1 Description of footprint-tracks: 2016:73, 2016:74, 2016:75, 2016:77, 2016:82,
2016:83, 2016:100
This trail was first recorded in September 2016 and subsequent footprint-tracks were noted as
part of the same trail in November 2016. Eight footprint-tracks were noted on banded
laminations, with the appearance of overtraces/undertraces (Figure 6.67 and 6.68). Footprint-
track 2016:100 was not included in this multi-image point cloud model as it was identified on
subsequent fieldwork a month after the original trail was recorded, and the encroaching tide
prevented a further model being created. Measurements, photographs and the orientation of
footprint-track 2016:100 were recorded, as was the distance between 2016:100, 2016:73 and
2016:75, which formed a trail. Footprint-track 2016:100 was recorded north-west of footprint-
track 2016:76.
Footprint-track 2016:73, 2016:75 and 2016:100 formed a left-right-left human footprint-track
trail, they were orientated 295° west towards the present day Goldcliff Fishery, and the
272
excavated Site B (Bell 2007, Chapter 3). Footprint-track 2016:73 was made by a left foot, with
indication of interdigital ridges between the hallux and second toe. Footprint-track 2016:75 was
made by a right foot, the prominent feature of this footprint-track was the wide ball of the foot
(Figure 6.69). Footprint-track 2016:100 was a left foot, with evidence of a hallux and heel
mark.
Footprint-track 2016:82 was a human footprint-track, with a hallux mark visible, meaning it
was identifiable as being made by a left foot. This footprint-track was also an
overtrace/undertrace and was not part of the human footprint-track trail of 2016:73, 2016:75
and 2016:100. It was a far smaller footprint-track, only 17cm in length, and orientated towards
Goldcliff Island at 270° west.
Footprint-track 2016:74 had the appearance of an animal footprint rather than a human; it was
rounded and wide rather than long and slender. Three further footprint-tracks, 2016:76, 2016:77
and 2016:83 were observed. These footprint-tracks may have been partially preserved human
footprints or mammal footprints, as again they were wider than they were long and had no
distinctive features. When a point cloud model had been generated from the photographs,
footprint 2016:74 was seen to have the distinctive cleaves of an ungulate, it is therefore possible
that these four footprints represent part of a trail made by a deer that had crossed paths with the
human footprint trail at 140°, the large size and shape of the footprint-tracks suggest red deer.
Sample 2016:111, was collected from the eastern end of this trail, 20cm to the south-east of
footprint-track 2016:73 (Figure 6.67). This sample was Optically Stimulated Luminescence
dated to 6620+/-610 years before 2017 (GL16184) (Appendix 1.2).
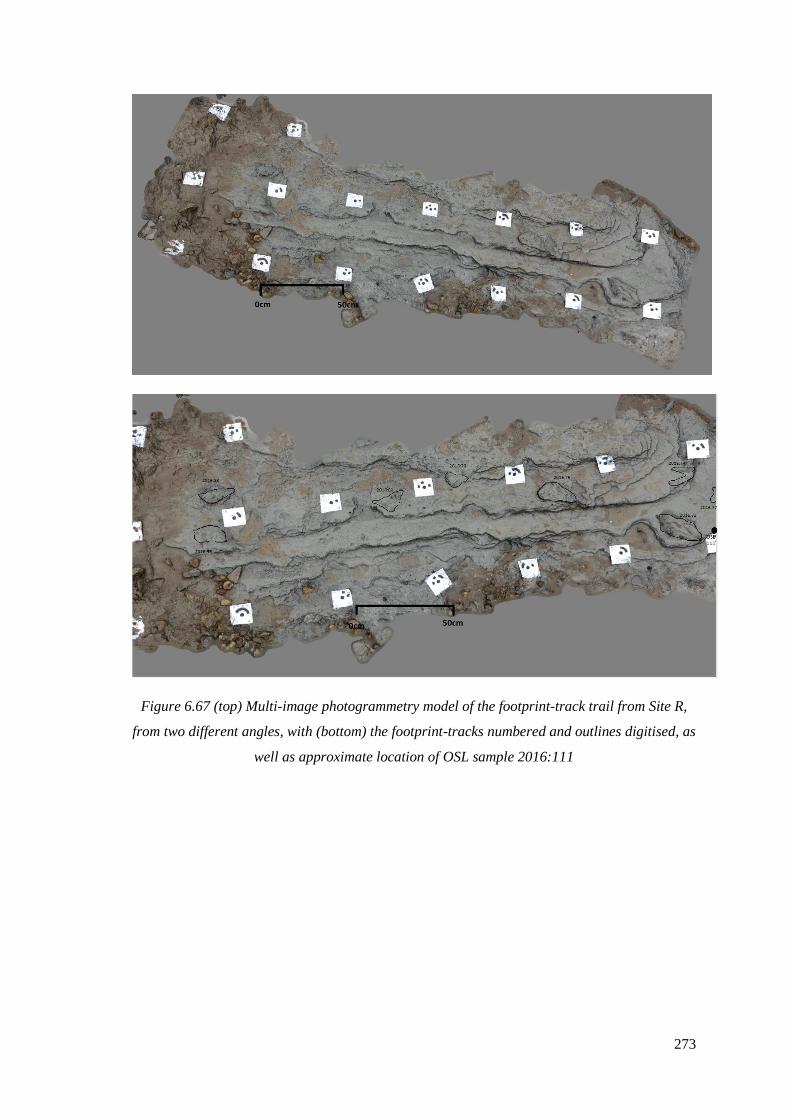
273
Figure 6.67 (top) Multi-image photogrammetry model of the footprint-track trail from Site R,
from two different angles, with (bottom) the footprint-tracks numbered and outlines digitised, as
well as approximate location of OSL sample 2016:111
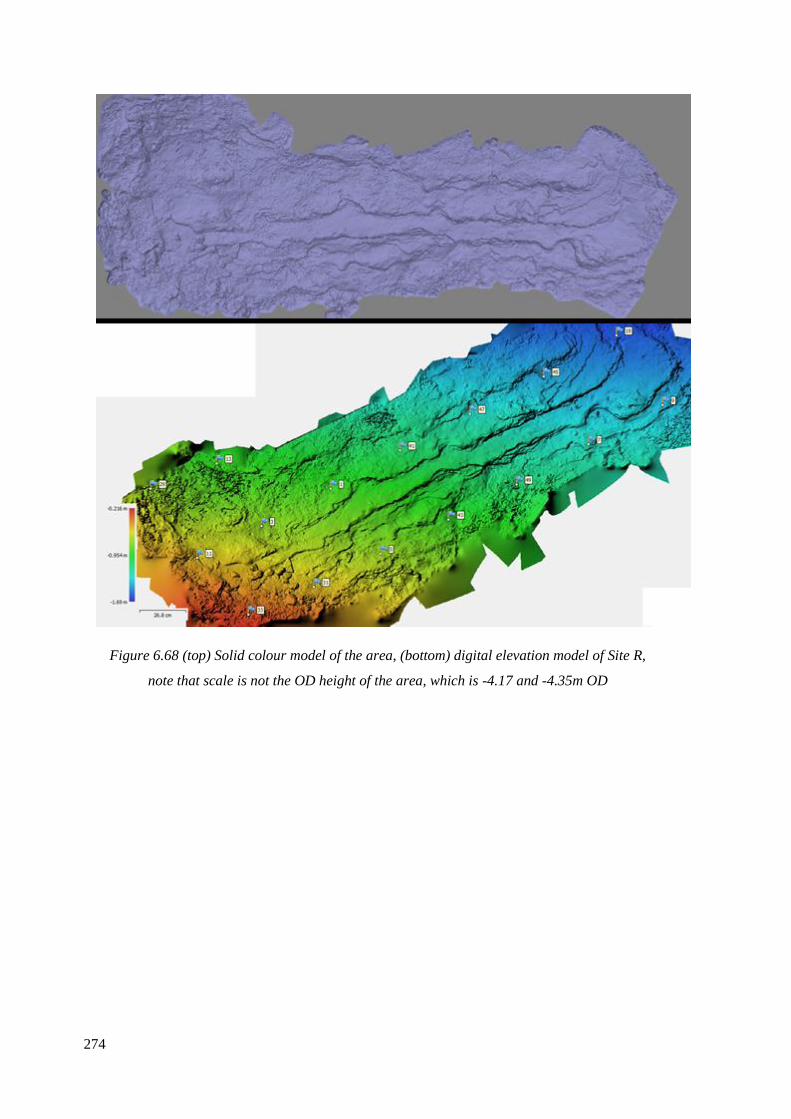
274
Figure 6.68 (top) Solid colour model of the area, (bottom) digital elevation model of Site R,
note that scale is not the OD height of the area, which is -4.17 and -4.35m OD
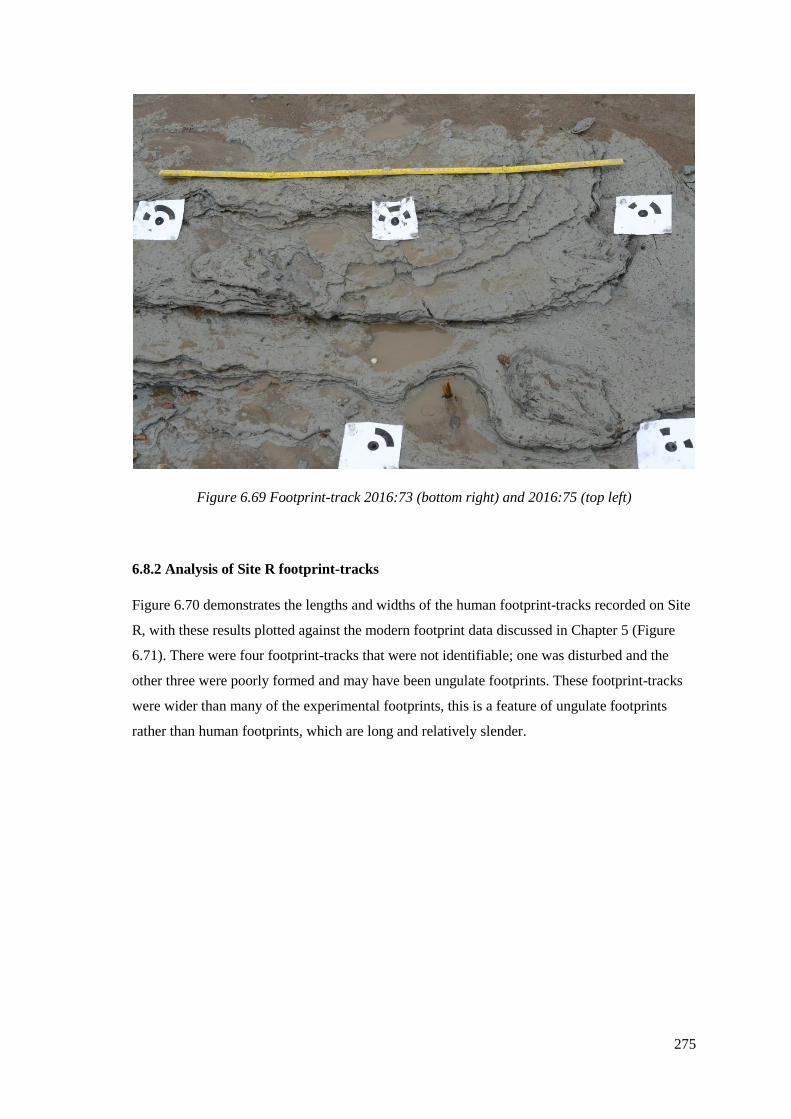
275
Figure 6.69 Footprint-track 2016:73 (bottom right) and 2016:75 (top left)
6.8.2 Analysis of Site R footprint-tracks
Figure 6.70 demonstrates the lengths and widths of the human footprint-tracks recorded on Site
R, with these results plotted against the modern footprint data discussed in Chapter 5 (Figure
6.71). There were four footprint-tracks that were not identifiable; one was disturbed and the
other three were poorly formed and may have been ungulate footprints. These footprint-tracks
were wider than many of the experimental footprints, this is a feature of ungulate footprints
rather than human footprints, which are long and relatively slender.
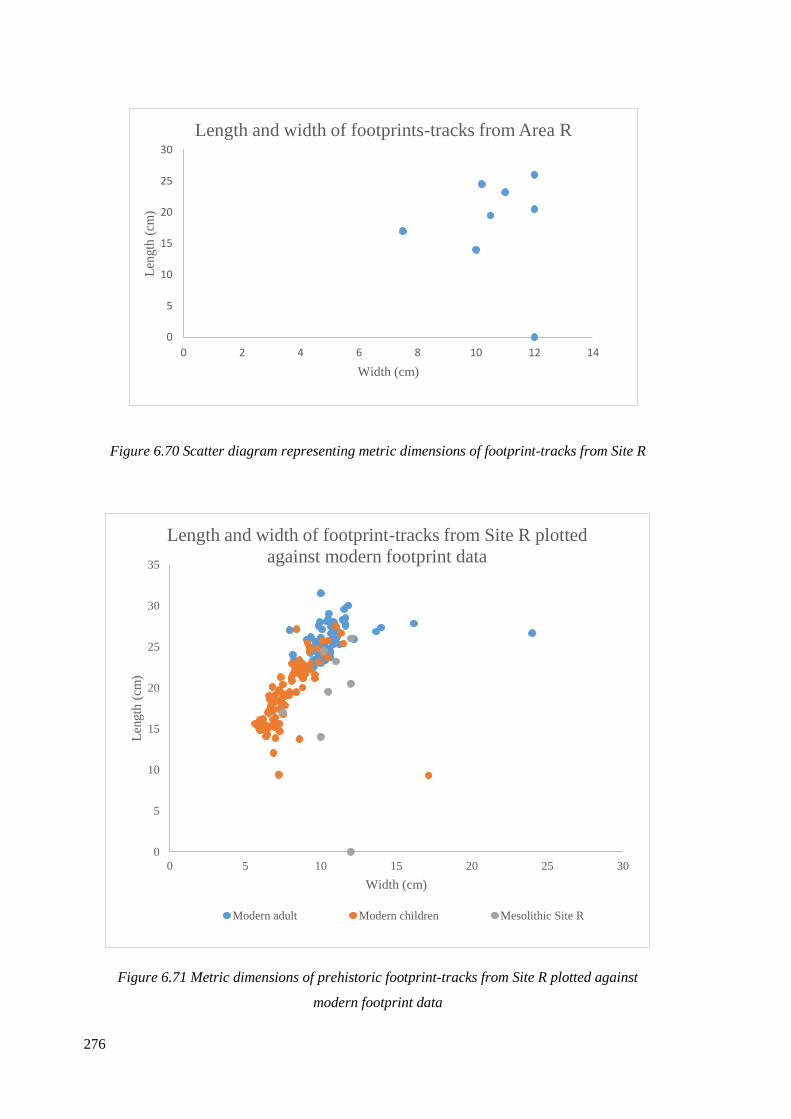
276
Figure 6.70 Scatter diagram representing metric dimensions of footprint-tracks from Site R
Figure 6.71 Metric dimensions of prehistoric footprint-tracks from Site R plotted against
modern footprint data
0
5
10
15
20
25
30
35
0 5 10 15 20 25 30
Len
gth
(cm
)
Width (cm)
Length and width of footprint-tracks from Site R plotted
against modern footprint data
Modern adult Modern children Mesolithic Site R
0
5
10
15
20
25
30
0 2 4 6 8 10 12 14
Len
gth
(cm
)
Width (cm)
Length and width of footprints-tracks from Area R

277
6.8.3 Age and sex of individuals who made the footprint-tracks at Site R
Of the eight footprint-tracks preserved at Site R, only four of these had a morphological
appearance which could accurately identify them as human footprints. The age and sex of these
individuals is presented in Table 6.21 and Table 6.22. Three of the footprint-tracks, 2016:73,
2016:75 and 2016:100, formed a clear trail heading in a north-western direction. This individual
created footprint-tracks that ranged in size from 20.5cm to 26cm, making an age and sex
estimate problematic. At the youngest, this person would be 10 +/- 1 years old, though they may
have been an adolescent or a full-grown adult. The variability in a single individual’s footprints
is exemplified by this footprint-track trail. It must be remembered that these footprint-tracks
were overtraces/undertraces so their lengths may be slightly over represented and as the
photographs show they were quite eroded.
On the same lamination as this footprint-track trail the singular footprint-track 2016:82 was
recorded. This individual was a young child, aged 5.5 +/- 1.5 years of undetermined sex.
Footprint –track
number
Probable age range (years) Footprint-track length
(cm)
UK shoe
size
2016:73 10 +/- 1 20.5 1
2016:74 Incomplete 19.5 -
2016:75 Pubescent child over 10 or
adult
26 8
2016:76 Incomplete 24.5 -
2016:77 Incomplete 14 -
2016:82 5.5 +/- 1.5 17 Children’s
10.5
2016:83 Incomplete - -
2016:100 Pubescent child over 10 or
adult
23.2 4.5
Table 6.21 Estimated age range from Site R footprint-tracks
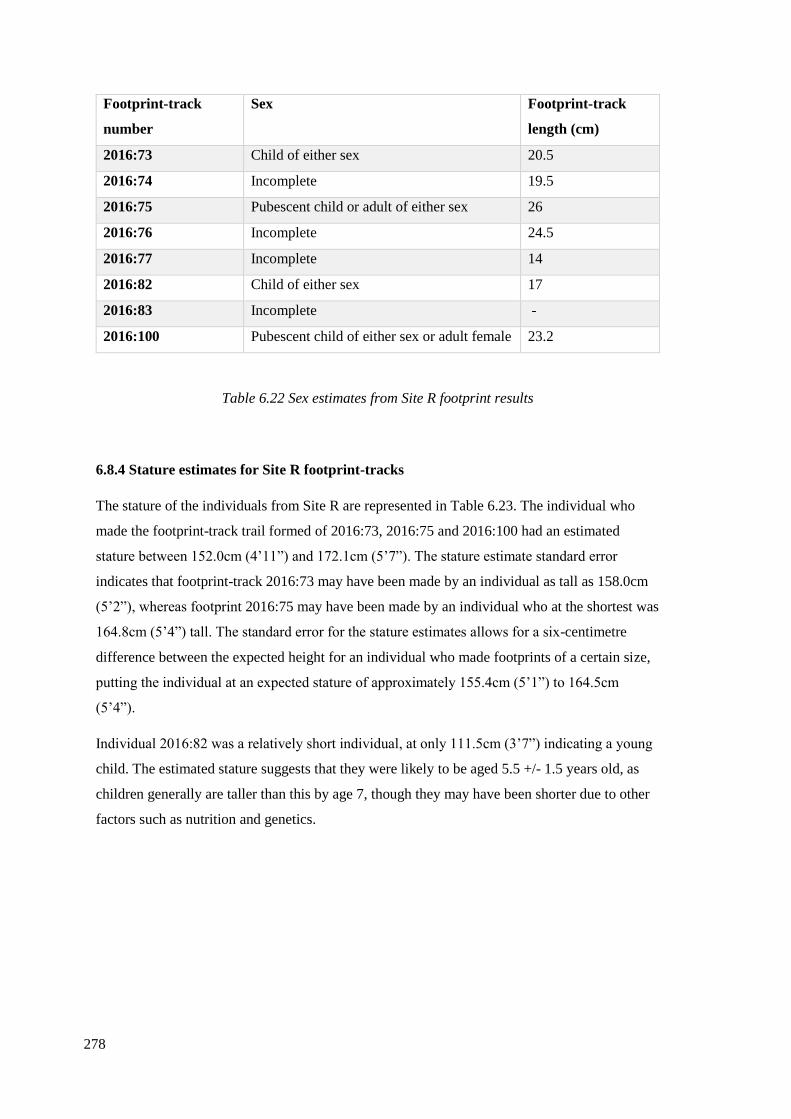
278
Footprint-track
number
Sex Footprint-track
length (cm)
2016:73 Child of either sex 20.5
2016:74 Incomplete 19.5
2016:75 Pubescent child or adult of either sex 26
2016:76 Incomplete 24.5
2016:77 Incomplete 14
2016:82 Child of either sex 17
2016:83 Incomplete -
2016:100 Pubescent child of either sex or adult female 23.2
Table 6.22 Sex estimates from Site R footprint results
6.8.4 Stature estimates for Site R footprint-tracks
The stature of the individuals from Site R are represented in Table 6.23. The individual who
made the footprint-track trail formed of 2016:73, 2016:75 and 2016:100 had an estimated
stature between 152.0cm (4’11”) and 172.1cm (5’7”). The stature estimate standard error
indicates that footprint-track 2016:73 may have been made by an individual as tall as 158.0cm
(5’2”), whereas footprint 2016:75 may have been made by an individual who at the shortest was
164.8cm (5’4”) tall. The standard error for the stature estimates allows for a six-centimetre
difference between the expected height for an individual who made footprints of a certain size,
putting the individual at an expected stature of approximately 155.4cm (5’1”) to 164.5cm
(5’4”).
Individual 2016:82 was a relatively short individual, at only 111.5cm (3’7”) indicating a young
child. The estimated stature suggests that they were likely to be aged 5.5 +/- 1.5 years old, as
children generally are taller than this by age 7, though they may have been shorter due to other
factors such as nutrition and genetics.
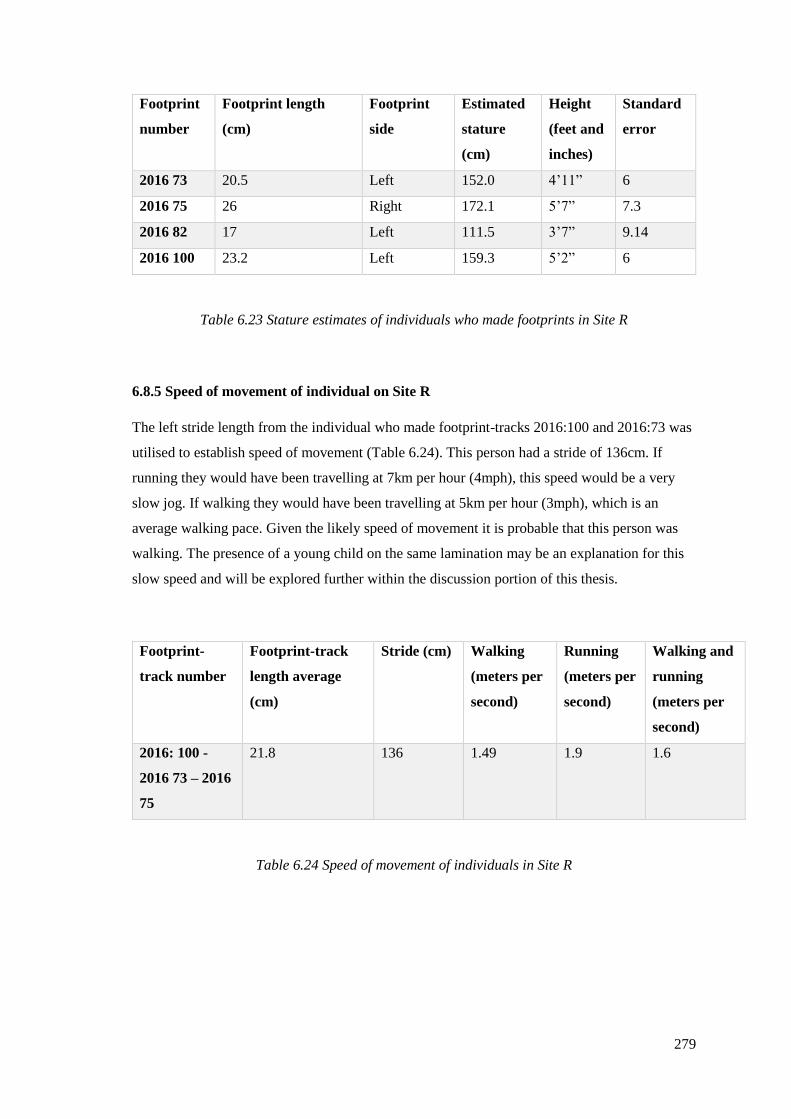
279
Footprint
number
Footprint length
(cm)
Footprint
side
Estimated
stature
(cm)
Height
(feet and
inches)
Standard
error
2016 73 20.5 Left 152.0 4’11” 6
2016 75 26 Right 172.1 5’7” 7.3
2016 82 17 Left 111.5 3’7” 9.14
2016 100 23.2 Left 159.3 5’2” 6
Table 6.23 Stature estimates of individuals who made footprints in Site R
6.8.5 Speed of movement of individual on Site R
The left stride length from the individual who made footprint-tracks 2016:100 and 2016:73 was
utilised to establish speed of movement (Table 6.24). This person had a stride of 136cm. If
running they would have been travelling at 7km per hour (4mph), this speed would be a very
slow jog. If walking they would have been travelling at 5km per hour (3mph), which is an
average walking pace. Given the likely speed of movement it is probable that this person was
walking. The presence of a young child on the same lamination may be an explanation for this
slow speed and will be explored further within the discussion portion of this thesis.
Footprint-
track number
Footprint-track
length average
(cm)
Stride (cm) Walking
(meters per
second)
Running
(meters per
second)
Walking and
running
(meters per
second)
2016: 100 -
2016 73 – 2016
75
21.8 136 1.49 1.9 1.6
Table 6.24 Speed of movement of individuals in Site R
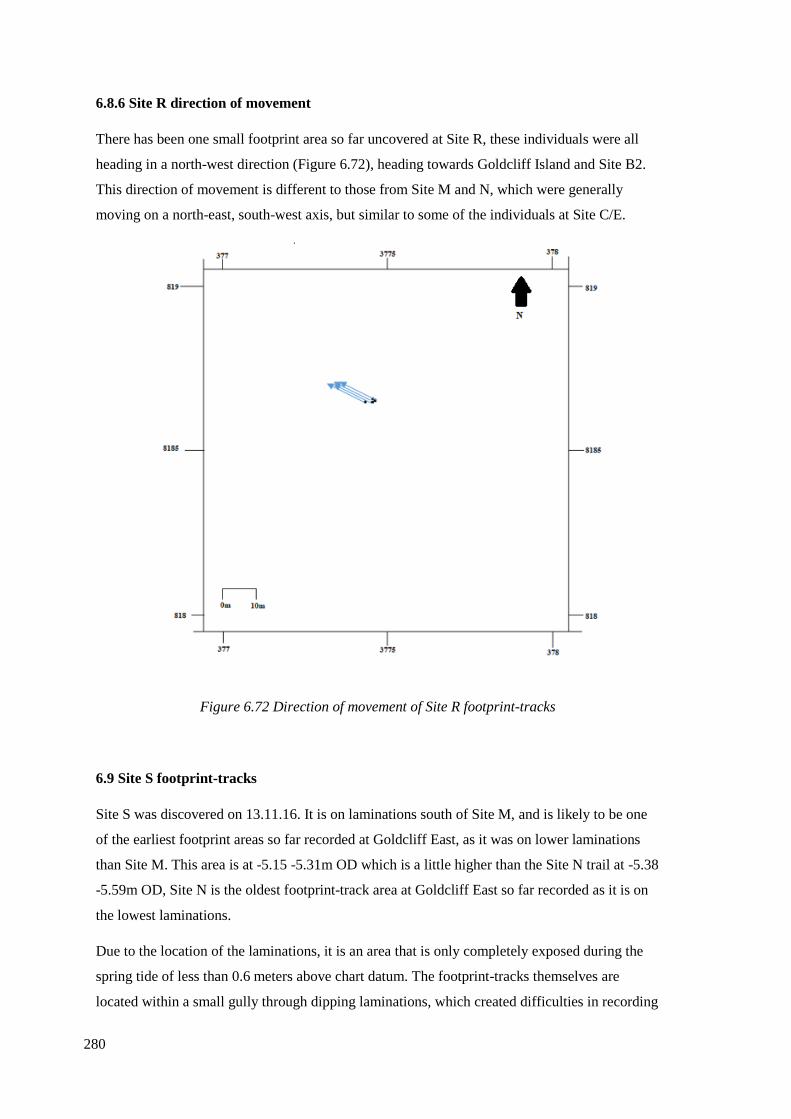
280
6.8.6 Site R direction of movement
There has been one small footprint area so far uncovered at Site R, these individuals were all
heading in a north-west direction (Figure 6.72), heading towards Goldcliff Island and Site B2.
This direction of movement is different to those from Site M and N, which were generally
moving on a north-east, south-west axis, but similar to some of the individuals at Site C/E.
Figure 6.72 Direction of movement of Site R footprint-tracks
6.9 Site S footprint-tracks
Site S was discovered on 13.11.16. It is on laminations south of Site M, and is likely to be one
of the earliest footprint areas so far recorded at Goldcliff East, as it was on lower laminations
than Site M. This area is at -5.15 -5.31m OD which is a little higher than the Site N trail at -5.38
-5.59m OD, Site N is the oldest footprint-track area at Goldcliff East so far recorded as it is on
the lowest laminations.
Due to the location of the laminations, it is an area that is only completely exposed during the
spring tide of less than 0.6 meters above chart datum. The footprint-tracks themselves are
located within a small gully through dipping laminations, which created difficulties in recording
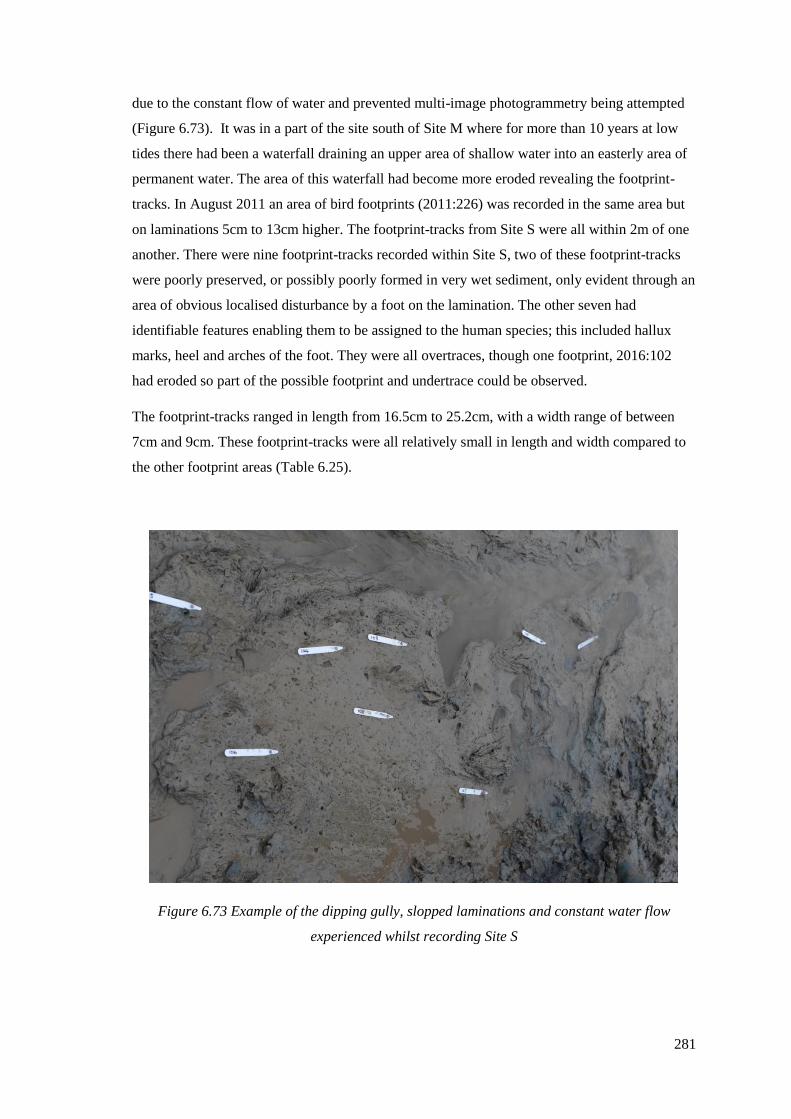
281
due to the constant flow of water and prevented multi-image photogrammetry being attempted
(Figure 6.73). It was in a part of the site south of Site M where for more than 10 years at low
tides there had been a waterfall draining an upper area of shallow water into an easterly area of
permanent water. The area of this waterfall had become more eroded revealing the footprint-
tracks. In August 2011 an area of bird footprints (2011:226) was recorded in the same area but
on laminations 5cm to 13cm higher. The footprint-tracks from Site S were all within 2m of one
another. There were nine footprint-tracks recorded within Site S, two of these footprint-tracks
were poorly preserved, or possibly poorly formed in very wet sediment, only evident through an
area of obvious localised disturbance by a foot on the lamination. The other seven had
identifiable features enabling them to be assigned to the human species; this included hallux
marks, heel and arches of the foot. They were all overtraces, though one footprint, 2016:102
had eroded so part of the possible footprint and undertrace could be observed.
The footprint-tracks ranged in length from 16.5cm to 25.2cm, with a width range of between
7cm and 9cm. These footprint-tracks were all relatively small in length and width compared to
the other footprint areas (Table 6.25).
Figure 6.73 Example of the dipping gully, slopped laminations and constant water flow
experienced whilst recording Site S
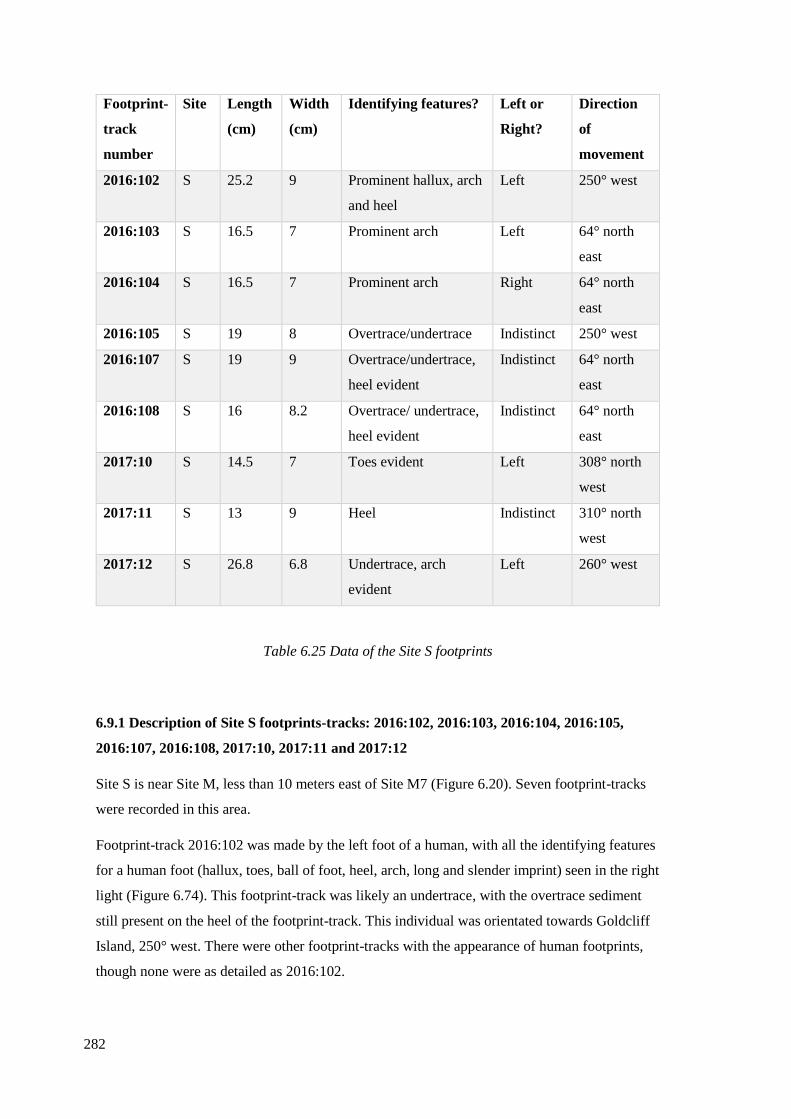
282
Footprint-
track
number
Site Length
(cm)
Width
(cm)
Identifying features? Left or
Right?
Direction
of
movement
2016:102 S 25.2 9 Prominent hallux, arch
and heel
Left 250° west
2016:103 S 16.5 7 Prominent arch Left 64° north
east
2016:104 S 16.5 7 Prominent arch Right 64° north
east
2016:105 S 19 8 Overtrace/undertrace Indistinct 250° west
2016:107 S 19 9 Overtrace/undertrace,
heel evident
Indistinct 64° north
east
2016:108 S 16 8.2 Overtrace/ undertrace,
heel evident
Indistinct 64° north
east
2017:10 S 14.5 7 Toes evident Left 308° north
west
2017:11 S 13 9 Heel Indistinct 310° north
west
2017:12 S 26.8 6.8 Undertrace, arch
evident
Left 260° west
Table 6.25 Data of the Site S footprints
6.9.1 Description of Site S footprints-tracks: 2016:102, 2016:103, 2016:104, 2016:105,
2016:107, 2016:108, 2017:10, 2017:11 and 2017:12
Site S is near Site M, less than 10 meters east of Site M7 (Figure 6.20). Seven footprint-tracks
were recorded in this area.
Footprint-track 2016:102 was made by the left foot of a human, with all the identifying features
for a human foot (hallux, toes, ball of foot, heel, arch, long and slender imprint) seen in the right
light (Figure 6.74). This footprint-track was likely an undertrace, with the overtrace sediment
still present on the heel of the footprint-track. This individual was orientated towards Goldcliff
Island, 250° west. There were other footprint-tracks with the appearance of human footprints,
though none were as detailed as 2016:102.
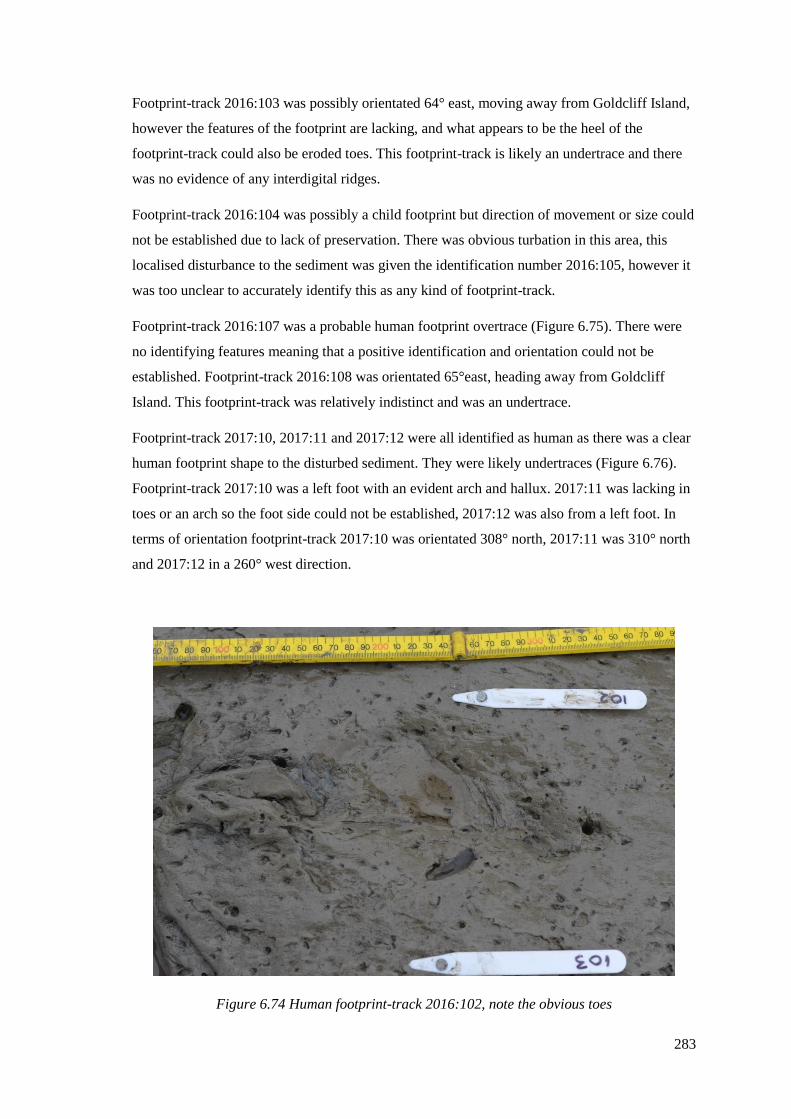
283
Footprint-track 2016:103 was possibly orientated 64° east, moving away from Goldcliff Island,
however the features of the footprint are lacking, and what appears to be the heel of the
footprint-track could also be eroded toes. This footprint-track is likely an undertrace and there
was no evidence of any interdigital ridges.
Footprint-track 2016:104 was possibly a child footprint but direction of movement or size could
not be established due to lack of preservation. There was obvious turbation in this area, this
localised disturbance to the sediment was given the identification number 2016:105, however it
was too unclear to accurately identify this as any kind of footprint-track.
Footprint-track 2016:107 was a probable human footprint overtrace (Figure 6.75). There were
no identifying features meaning that a positive identification and orientation could not be
established. Footprint-track 2016:108 was orientated 65°east, heading away from Goldcliff
Island. This footprint-track was relatively indistinct and was an undertrace.
Footprint-track 2017:10, 2017:11 and 2017:12 were all identified as human as there was a clear
human footprint shape to the disturbed sediment. They were likely undertraces (Figure 6.76).
Footprint-track 2017:10 was a left foot with an evident arch and hallux. 2017:11 was lacking in
toes or an arch so the foot side could not be established, 2017:12 was also from a left foot. In
terms of orientation footprint-track 2017:10 was orientated 308° north, 2017:11 was 310° north
and 2017:12 in a 260° west direction.
Figure 6.74 Human footprint-track 2016:102, note the obvious toes
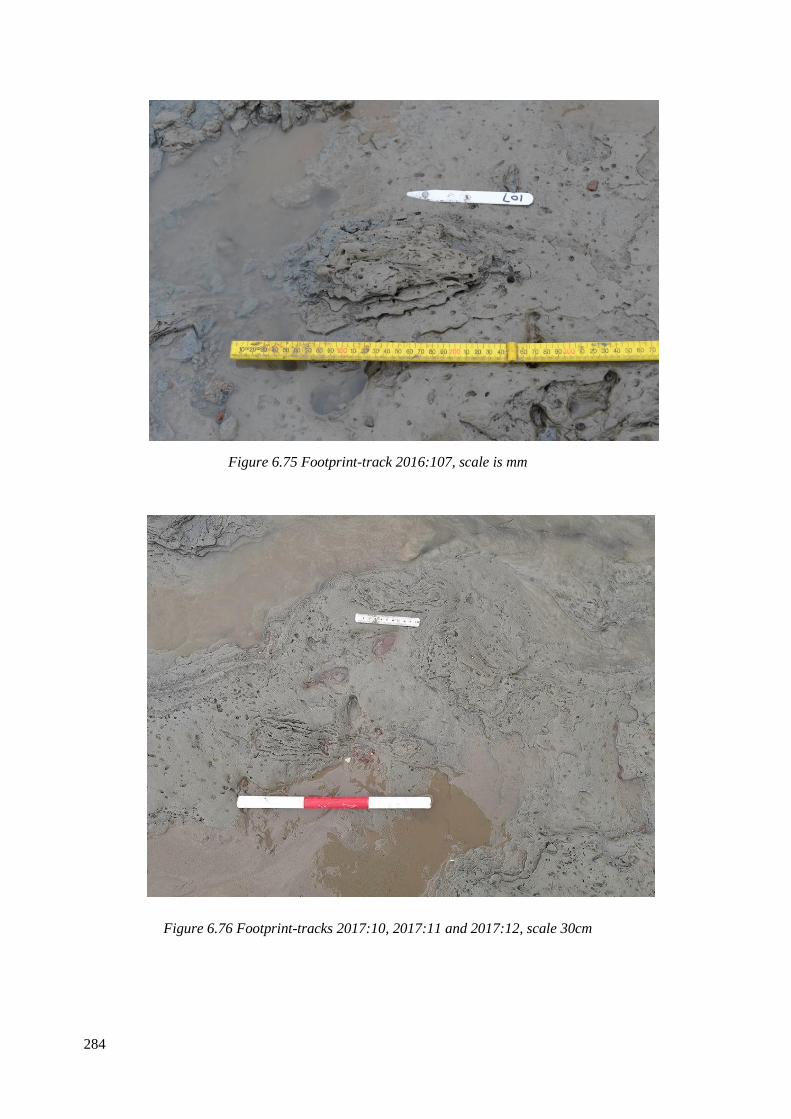
284
Figure 6.75 Footprint-track 2016:107, scale is mm
Figure 6.76 Footprint-tracks 2017:10, 2017:11 and 2017:12, scale 30cm
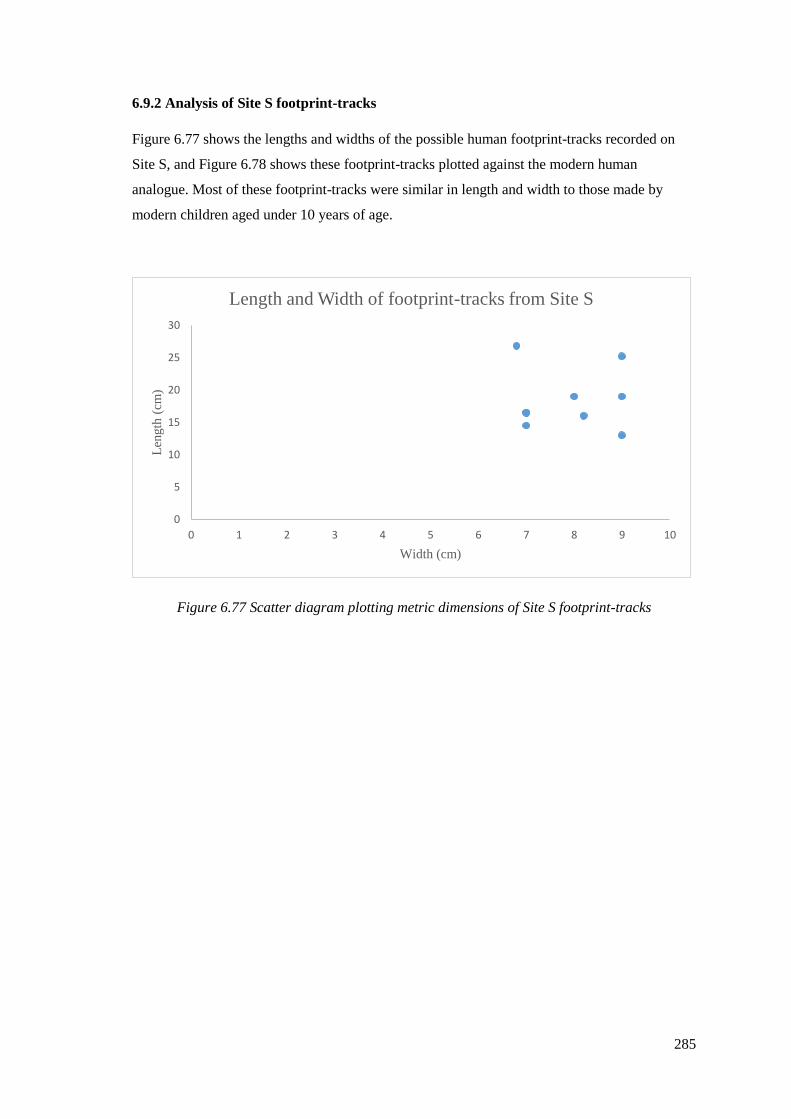
285
6.9.2 Analysis of Site S footprint-tracks
Figure 6.77 shows the lengths and widths of the possible human footprint-tracks recorded on
Site S, and Figure 6.78 shows these footprint-tracks plotted against the modern human
analogue. Most of these footprint-tracks were similar in length and width to those made by
modern children aged under 10 years of age.
Figure 6.77 Scatter diagram plotting metric dimensions of Site S footprint-tracks
0
5
10
15
20
25
30
0 1 2 3 4 5 6 7 8 9 10
Len
gth
(cm
)
Width (cm)
Length and Width of footprint-tracks from Site S

286
Figure 6.78 Metric dimensions of footprint-tracks from Site S plotted against modern footprint
dimensions
6.9.3 Age and sex of the individuals at Site S
There were nine footprint-tracks recorded in Site S, although some were not clear, often with
only a foot arch or heel evident. Two of the footprint-tracks, 2016:103 and 2016:108, were part
of a trail. This area was investigated but there were not any further footprint-track trails
identified, though there were other singular footprint-tracks. This individual was heading east
away from Goldcliff Island. Within Site S the smallest footprint-tracks found during the 2014-
2017 fieldwork were recorded. Two of the footprint-tracks, 2017:10 and 2017:11, were made by
very young individuals, aged four or younger (Table 6.26). A further three footprint-tracks were
made by children aged 5.5 +/- 1.5 years, and two individuals were aged 6.5 +/-1.5 years. There
were a further two footprint-tracks, 2016:102 and 2017:12 that were made by larger individuals,
either full grown adults or pubescent children. Due to the nature of the footprints, mainly
belonging to children, sex could not be established, though 2017:12 may have been an adult
male due to its large size (Table 6.27).
0
5
10
15
20
25
30
35
0 5 10 15 20 25 30
Len
gth
(cm
)
Width (cm)
Length and width of footprint-tracks from Site S plotted
against modern footprint data
Modern adult Modern children Mesolithic Site S
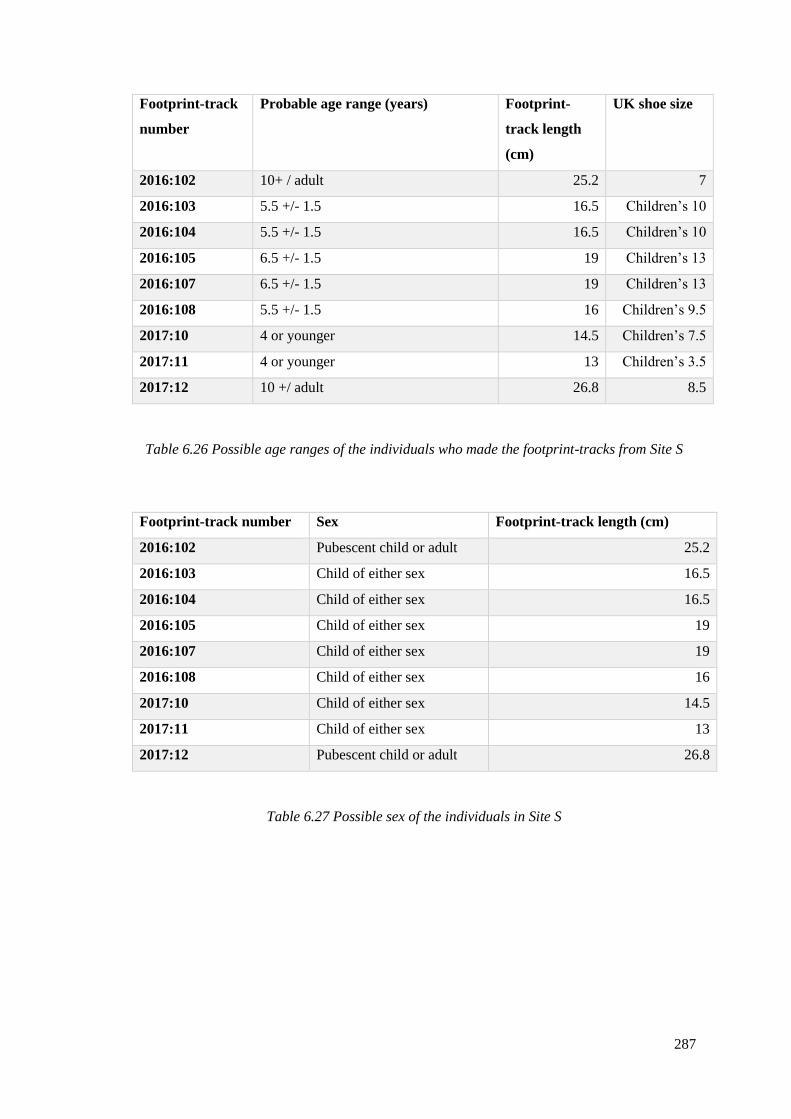
287
Footprint-track
number
Probable age range (years) Footprint-
track length
(cm)
UK shoe size
2016:102 10+ / adult 25.2 7
2016:103 5.5 +/- 1.5 16.5 Children’s 10
2016:104 5.5 +/- 1.5 16.5 Children’s 10
2016:105 6.5 +/- 1.5 19 Children’s 13
2016:107 6.5 +/- 1.5 19 Children’s 13
2016:108 5.5 +/- 1.5 16 Children’s 9.5
2017:10 4 or younger 14.5 Children’s 7.5
2017:11 4 or younger 13 Children’s 3.5
2017:12 10 +/ adult 26.8 8.5
Table 6.26 Possible age ranges of the individuals who made the footprint-tracks from Site S
Footprint-track number Sex Footprint-track length (cm)
2016:102 Pubescent child or adult 25.2
2016:103 Child of either sex 16.5
2016:104 Child of either sex 16.5
2016:105 Child of either sex 19
2016:107 Child of either sex 19
2016:108 Child of either sex 16
2017:10 Child of either sex 14.5
2017:11 Child of either sex 13
2017:12 Pubescent child or adult 26.8
Table 6.27 Possible sex of the individuals in Site S
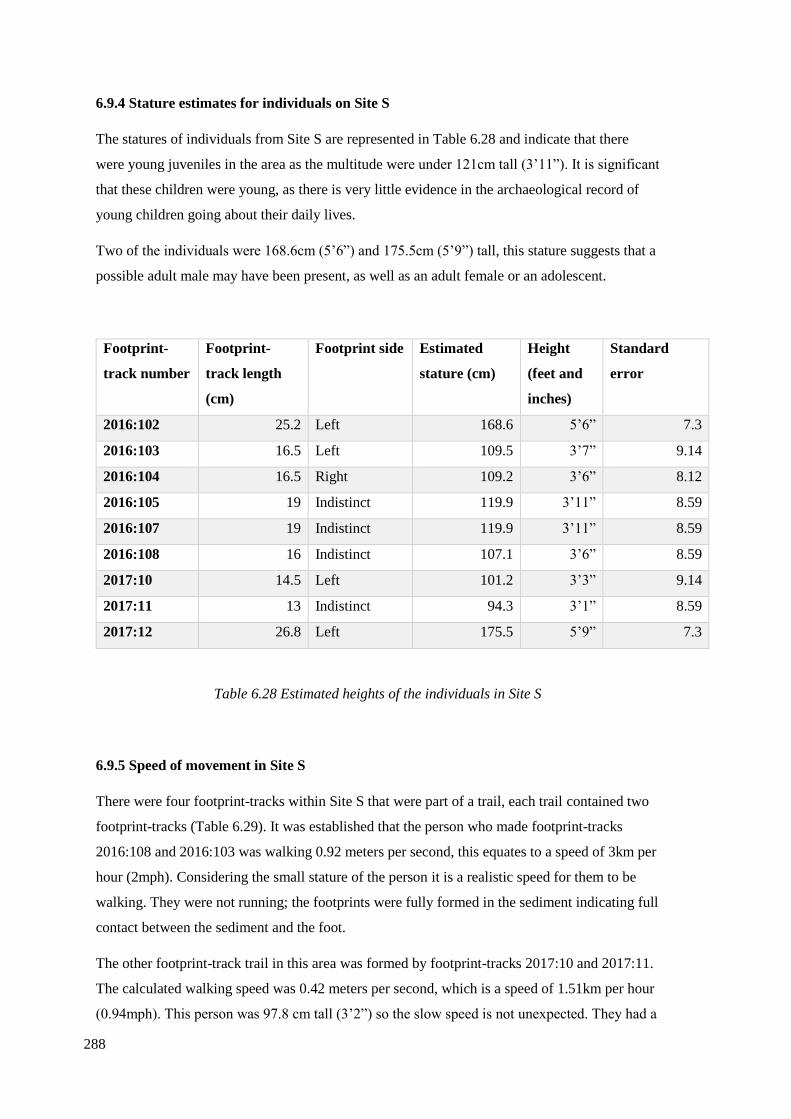
288
6.9.4 Stature estimates for individuals on Site S
The statures of individuals from Site S are represented in Table 6.28 and indicate that there
were young juveniles in the area as the multitude were under 121cm tall (3’11”). It is significant
that these children were young, as there is very little evidence in the archaeological record of
young children going about their daily lives.
Two of the individuals were 168.6cm (5’6”) and 175.5cm (5’9”) tall, this stature suggests that a
possible adult male may have been present, as well as an adult female or an adolescent.
Footprint-
track number
Footprint-
track length
(cm)
Footprint side Estimated
stature (cm)
Height
(feet and
inches)
Standard
error
2016:102 25.2 Left 168.6 5’6” 7.3
2016:103 16.5 Left 109.5 3’7” 9.14
2016:104 16.5 Right 109.2 3’6” 8.12
2016:105 19 Indistinct 119.9 3’11” 8.59
2016:107 19 Indistinct 119.9 3’11” 8.59
2016:108 16 Indistinct 107.1 3’6” 8.59
2017:10 14.5 Left 101.2 3’3” 9.14
2017:11 13 Indistinct 94.3 3’1” 8.59
2017:12 26.8 Left 175.5 5’9” 7.3
Table 6.28 Estimated heights of the individuals in Site S
6.9.5 Speed of movement in Site S
There were four footprint-tracks within Site S that were part of a trail, each trail contained two
footprint-tracks (Table 6.29). It was established that the person who made footprint-tracks
2016:108 and 2016:103 was walking 0.92 meters per second, this equates to a speed of 3km per
hour (2mph). Considering the small stature of the person it is a realistic speed for them to be
walking. They were not running; the footprints were fully formed in the sediment indicating full
contact between the sediment and the foot.
The other footprint-track trail in this area was formed by footprint-tracks 2017:10 and 2017:11.
The calculated walking speed was 0.42 meters per second, which is a speed of 1.51km per hour
(0.94mph). This person was 97.8 cm tall (3’2”) so the slow speed is not unexpected. They had a
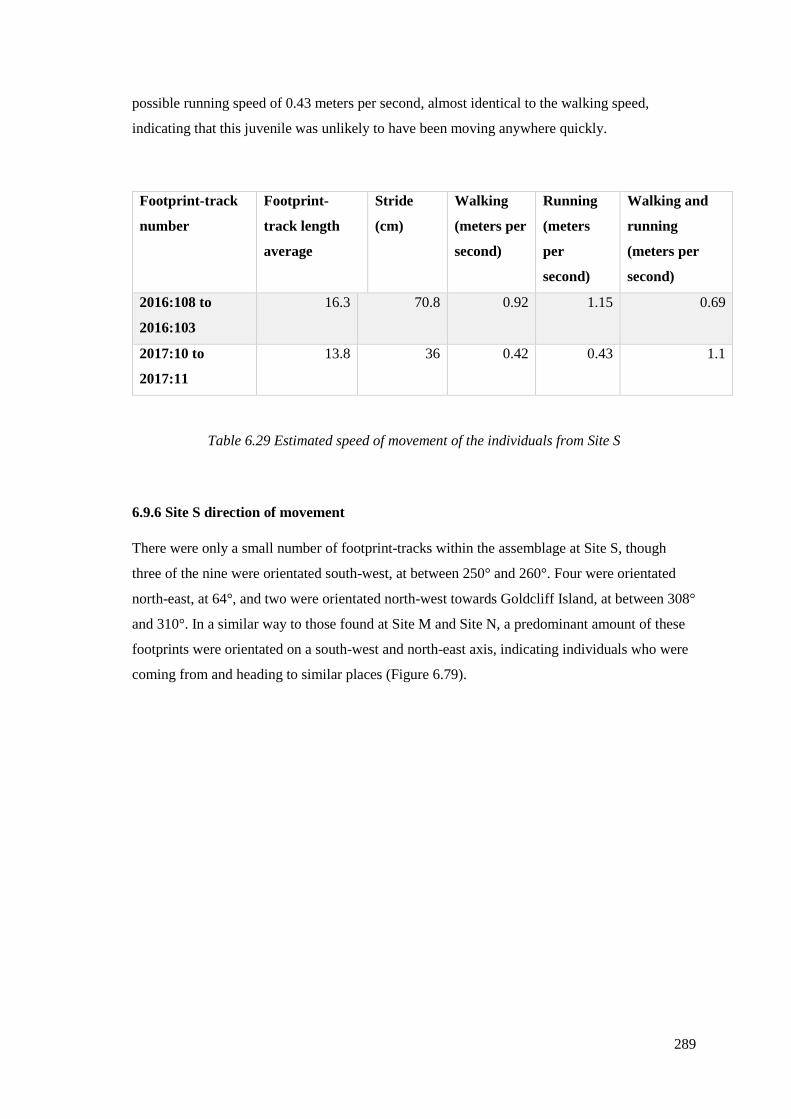
289
possible running speed of 0.43 meters per second, almost identical to the walking speed,
indicating that this juvenile was unlikely to have been moving anywhere quickly.
Footprint-track
number
Footprint-
track length
average
Stride
(cm)
Walking
(meters per
second)
Running
(meters
per
second)
Walking and
running
(meters per
second)
2016:108 to
2016:103
16.3 70.8 0.92 1.15 0.69
2017:10 to
2017:11
13.8 36 0.42 0.43 1.1
Table 6.29 Estimated speed of movement of the individuals from Site S
6.9.6 Site S direction of movement
There were only a small number of footprint-tracks within the assemblage at Site S, though
three of the nine were orientated south-west, at between 250° and 260°. Four were orientated
north-east, at 64°, and two were orientated north-west towards Goldcliff Island, at between 308°
and 310°. In a similar way to those found at Site M and Site N, a predominant amount of these
footprints were orientated on a south-west and north-east axis, indicating individuals who were
coming from and heading to similar places (Figure 6.79).

290
Figure 6.79 Direction of movement of Site S individuals
6.10 Footprint-tracks recorded at Goldcliff East before 2014
A thorough study was conducted on the human footprint-tracks recorded in 2001-2004 by
Rachel Scales (2006). A summary of the human age, sex, height, weight and shoe size is
provided in Table 6.30.
Scales (2006) collected age and footprint size data from 254 present day school children aged
between four and eleven years old. The technique utilised to record metric data of a foot was to
trace the left and right foot of each child onto paper, to achieve a footprint parameter. The
experimental research in this study demonstrated that footprints made in sediment rather than in
a two-dimensional circumstance are more variable, which is important when applying to
footprints made in a similar sediment. Research within Chapter 5 of this thesis suggests that
aging an individual above ten years from footprints made in clayey silt sediment is complex due
to the footprint formation process. Scales (2006) had noted in her research that a person aged
291
14+ will have adult sized footprints, the current research has demonstrated that aged 10+ needs
to be considered adult instead, due to differences in growth among individuals. There can be a
large variation in footprints made in clayey silt sediment, which is influenced further by the
moisture content, so a precise age such as those provided by Scales must be treated with
caution.
Reanalysis of Scales’ (2006, 2007a) footprint data (Table 6.31), applying the principle of
children aged ten years old and above as having the potential to have adult sized footprints did
not change any of Scales findings significantly. Scales identified two adults within her dataset,
these individuals were also identified as adults within the current research. Person 6 was
identified by Scales (2006, 2007a) as being a child aged between 8½ and nine years old, the
current research identifies this individual as aged 10 +/- 1 year, similar to Scales (2006, 2007a)
findings. Person 11 also had a similar age estimate, Scales estimated this child to be aged
between four and five depending on the sex, the current research identified this child to be aged
5.5 +/- 1.5 years, regardless of sex. Five of the individuals from Scales (2006, 2007a) research
were possibly adolescents as she suggested, though they also could have been adult females.
Person 3, Person 5, and Person 7 were estimated by Scales to be aged between 13½ to 16
depending on the sex. Reanalysis of the data within this study suggests that although these may
have been made by either adults or children, the footprint-tracks made by Person 5 and Person 7
were above 26cm and more likely to be made by adults than children, though they could also
have been large children. Person 3 may have been a child aged 10+ or an adult of either sex.
Table 6.32 presents the information gathered within this study in a similar way to Scales
summary; this allows the full range of the 17 years of footprint-track research at Goldcliff East
to be viewed. Seven of the 21 people identified by Scales (2006, 2007a) provided insufficient
footprint-track trail data so were not included within the final analysis of Goldcliff East
footprint areas. There were nine footprint-track trails recorded during the current study. Of the
22 footprint-track trails recorded throughout research at Goldcliff East, four (18%) trails were
made by children (Figure 6.80), one was possibly younger than four years old, two were aged
5.5 +/- 1.5 years, and one was 6 +/- 1.5 years. Three (14%) further footprint-track trails were
identified as 10 +/- 1 years old. The assemblage at Goldcliff East also had a very high
proportion of children aged 10+/ adult females, nine (41%) trails fell into this range indicating
that pubescent children and/ or adult females were within this area in a relatively high amount.
Six (27%) trails were a size that could be either children aged 10+, adult females or adult males,
four of these were above 26cm in length so possibly from small adult males, or large females/
children. There were not any footprint-track trails made at Goldcliff East that were made by
large adult males, though there were singular footprint-tracks that may have been.
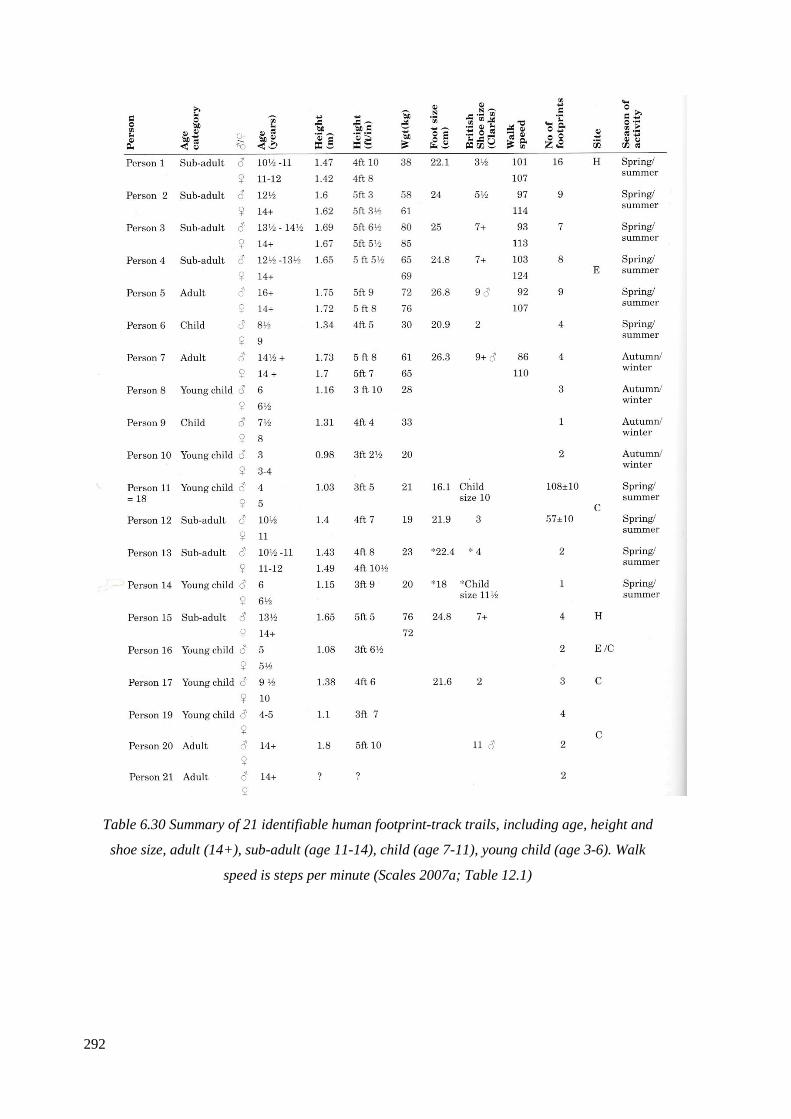
292
Table 6.30 Summary of 21 identifiable human footprint-track trails, including age, height and
shoe size, adult (14+), sub-adult (age 11-14), child (age 7-11), young child (age 3-6). Walk
speed is steps per minute (Scales 2007a; Table 12.1)
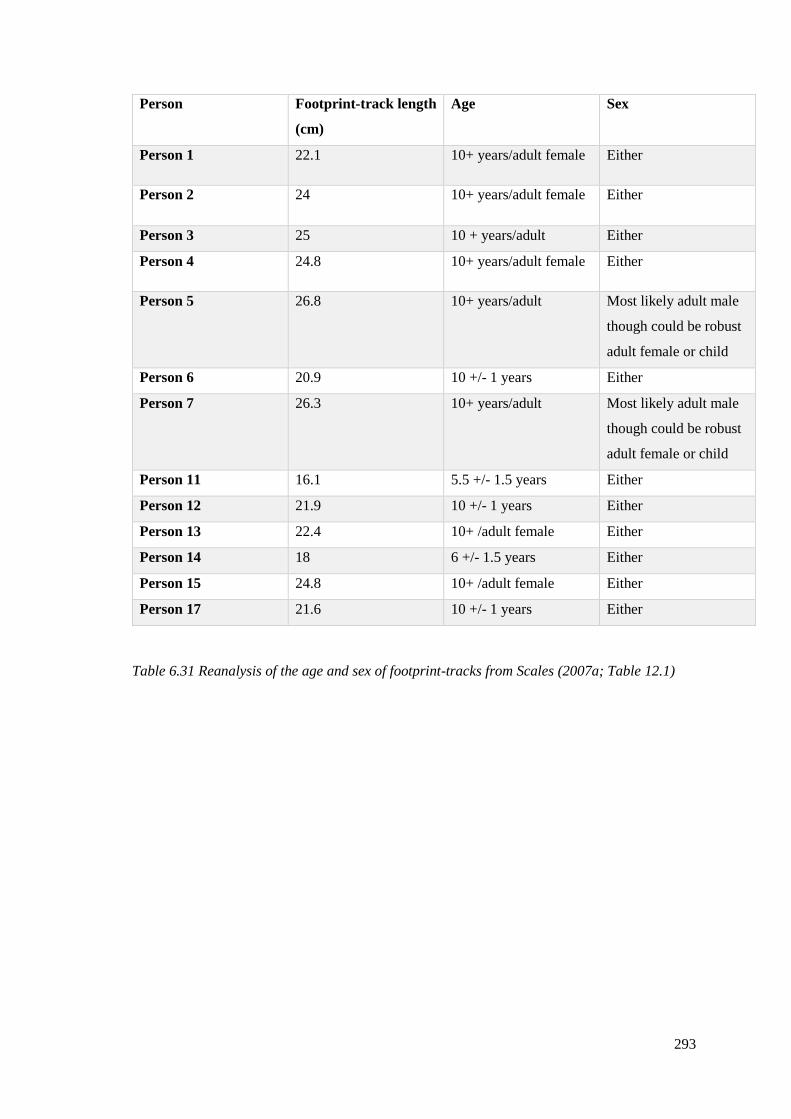
293
Person Footprint-track length
(cm)
Age Sex
Person 1 22.1 10+ years/adult female Either
Person 2 24 10+ years/adult female Either
Person 3 25 10 + years/adult Either
Person 4 24.8 10+ years/adult female Either
Person 5
26.8 10+ years/adult Most likely adult male
though could be robust
adult female or child
Person 6 20.9 10 +/- 1 years Either
Person 7
26.3 10+ years/adult Most likely adult male
though could be robust
adult female or child
Person 11 16.1 5.5 +/- 1.5 years Either
Person 12 21.9 10 +/- 1 years Either
Person 13 22.4 10+ /adult female Either
Person 14 18 6 +/- 1.5 years Either
Person 15 24.8 10+ /adult female Either
Person 17 21.6 10 +/- 1 years Either
Table 6.31 Reanalysis of the age and sex of footprint-tracks from Scales (2007a; Table 12.1)

294
Fo
otp
rin
t-tr
ack
nu
mb
er
Ag
e ra
ng
e (y
ears
)
Av
era
ge
Hei
gh
t (c
m)
Av
era
ge
Hei
gh
t (f
oo
t)
Fo
otp
rin
t-tr
ack
av
erag
e
len
gth
(cm
)
Bri
tish
sh
oe
size
Wa
lk s
pee
d (
met
ers
per
seco
nd
)
Ru
n s
pee
d (
met
ers
per
seco
nd
)
Dir
ecti
on
of
mov
emen
t
No
of
foo
tpri
nts
in
tra
il
Sit
e
Sea
son
ali
ty o
f u
se
2015:114 to
2015:115
Adult 172.1 5.6 26 8 1.69 2.2 30°
north/
18°
north
2 C/E Spring/
Summer
2015:116 to
2015:117
10+ /
adult
female
154.9 5 22 3 0.77 0.93 310°
west of
north/
290°
west of
north
2 C/E Spring/
Summer
2010:1 to
2010:5
Adult 161.3 5.2 26 8 1.96 1.92 233°
west
south
west
5 M -
2015:160
and
2015:163
10+/
adult
female
164 5.3 24.3 5.5/6 2 2.75 230°
south
west
2 M Spring/
Summer
2015:17 to
2015:20
10+/
adult
167.2 5.4 25 6.5 1.66 2.15 60°
north
east
3 N Autumn/
Winter
2016:50 to
2016:56
10+/
adult
female
161.9 5.3 23.9 5/5.5 1.46 1.89 Between
50° and
70°
north
east
7 N Autumn/
Winter
2016:73,
2016:75,
2016:100
10+ /
adult
female
161.1 5.2 23.2 4.5 1.49 1.9 295°
west
north
west
3 R Spring/
Summer
2016 108
and
2016:103
5.5 +/-
1.5
108.3 3.5 16.3 Children’s
10
0.92 1.15 64° east 2 S Spring/
Summer
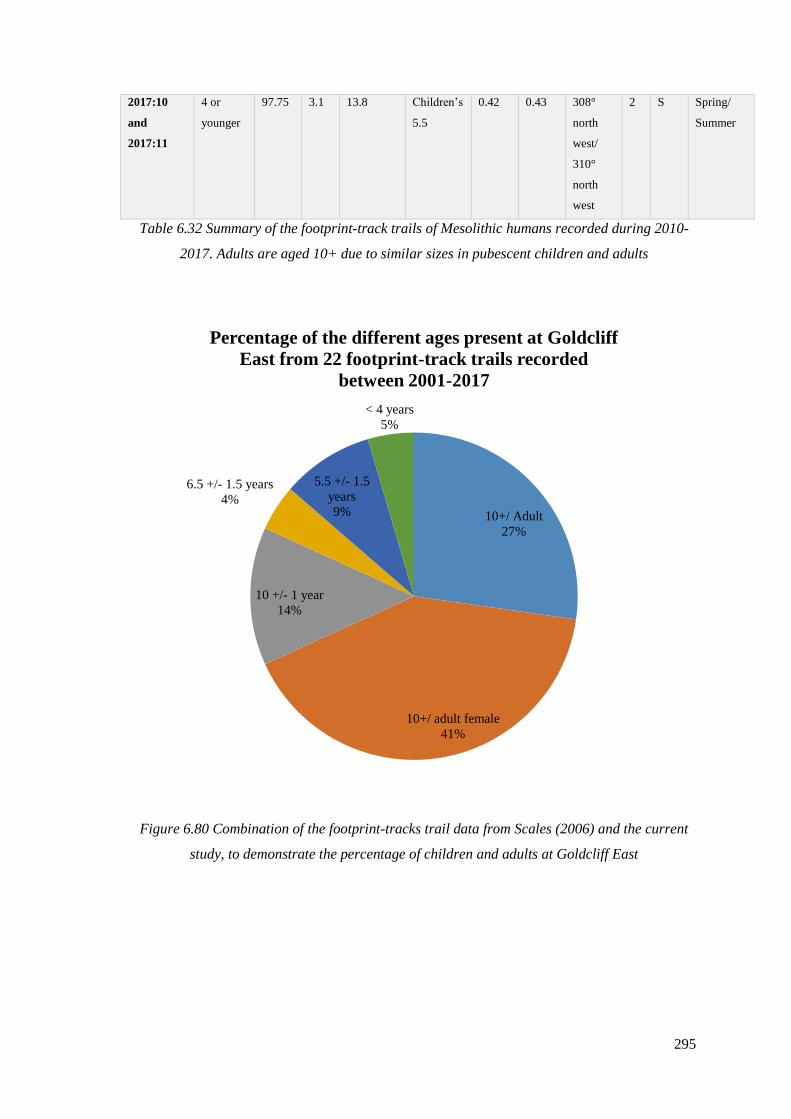
295
2017:10
and
2017:11
4 or
younger
97.75 3.1 13.8 Children’s
5.5
0.42 0.43 308°
north
west/
310°
north
west
2 S Spring/
Summer
Table 6.32 Summary of the footprint-track trails of Mesolithic humans recorded during 2010-
2017. Adults are aged 10+ due to similar sizes in pubescent children and adults
Figure 6.80 Combination of the footprint-tracks trail data from Scales (2006) and the current
study, to demonstrate the percentage of children and adults at Goldcliff East
10+/ Adult
27%
10+/ adult female
41%
10 +/- 1 year
14%
6.5 +/- 1.5 years
4%
5.5 +/- 1.5
years
9%
< 4 years
5%
Percentage of the different ages present at Goldcliff
East from 22 footprint-track trails recorded
between 2001-2017
296
6.11 Discussion
The Mesolithic footprint-tracks from Goldcliff East provide an intriguing insight into the daily
lives and activities of this hunter-gatherer population. Often the Mesolithic individuals of
Britain are invisible; there are few Mesolithic skeletal remains resulting in there being very little
sense of demographic diversity. The population and social demographics that can be established
from footprint-tracks are therefore incredibly important. Footprint-tracks provide evidence of an
active community, going about their daily lives and engaging in their social relationships.
6.11.1 Height and sex
The footprint-tracks made at Goldcliff East were made by people who ranged in height, from a
young juvenile under four years old with an approximate height of 97.5cm (3’2”) to an adult
male with an estimated height of 198.5cm (6’6”). The average height of those aged over ten
years old was 166.5cm (5’5”). Due to the large overlap between possible male and female
footprint sizes (Table 6.3), as well as the issue caused by pubescent children who were still
growing, an average height was not determined for males and females. It is evident that there
were tall individuals within the population; at least four of the footprint-tracks were likely made
by individuals taller than 182cm (5’11”).
6.11.2 The Role of children at Goldcliff East
The two separate studies of the footprint-tracks at Goldcliff East have defined child footprint
sizes differently. Within the current research children are considered to be aged ten years old or
under, with a footprint length less than 22cm, due to the number of adult females who also
made footprints between 22cm and 25cm when walking on clayey silt sediment. 63% of
modern females within this study had footprint-tracks an average of between 22cm and 24cm in
length, 56% of children aged between ten and 15 years old also fell into these measurements,
plus a further 5% of individuals aged ten to 15 years old who made footprints with an average
length under 22cm. Scales (2006) defined children as under 14 years of age, with a footprint-
track size below 25cm. There is therefore the possibility that some of Scales’ (2006) results
identifying sub-adults may have also been made by adult females. 320 possible human
footprint-tracks were recorded by Scales (2006), and were thought to have been made by
between 18 and 21 individuals. 159 of the 320 footprint-tracks were made in a trail by two
individuals, Person 11 and Person 12. Person 11 had an average footprint-track length of
16.1cm and Person 12 had an average footprint-track length of 21.9cm. Of the remaining 161
possible human footprint-tracks, Scales (2006) identified a further 58 as likely to be human,

297
with 6 footprint-tracks less than 22cm, 13 between 22cm and 24.9cm, 22 between 25cm and
29.9cm and 17 over the length of 30cm. Of the total 320 footprint-tracks recorded by Scales
(2006), her data suggests that 56% of the footprint-tracks were made by children under 14 years
old. It is clear that the footprint-tracks trails made by Person 11 and 12 created a skewed
representation towards a high proportion of young children, making up half of Scales entire
footprint-track database.
The current research argues that 52% of Scales (2006) footprint-track data has the metric
dimensions of children, not 56%. In addition to this, a further 61 possible human footprint-
tracks were recorded in the current study, with 30% thought to be children aged under ten years
old. Overall, there have been 381 possible human footprint-tracks recorded at Goldcliff East
between 2001 and 2017, 183 (48%) of which are similar in length to children, as defined by the
author, as the footprints were a length of less than 22cm.
Previous research (Scales 2006; 2007a) has suggested that there were a high percentage of
children along the area of Goldcliff East that is now part of the intertidal zone; the current
research also suggests this. Smaller footprint-tracks were observed less often in a footprint-track
trail during this study, with trails generally made by footprint-tracks 20cm or larger, which may
be related to a preservation bias, though this was evidently not the same experience for Scales’
(2006) research, as half of her footprint-tracks were made by two trails of footprints made by
children (Person 11 and Person 12).
Archaeological reconstructions of hunter-gatherers generally depicts an image of adult males
performing activities such as flint knapping and hunting, and women gathering and child
rearing. Footprint-tracks can provide evidence of population composition and reveal individuals
who are almost completely hidden in the prehistoric archaeological record, the children. Within
this record we have actual evidence of different parts of the community engaging in activities.
In every footprint area recorded between 2014-2016 at least 20% of the footprints were made
by children aged ten years or younger (Figure 6.81). The only exception to this was Site M,
where 18% of those recorded belonged to young people. The highest percentage of footprint-
tracks with the metric dimensions of children was found in Site S, where 78% of the footprint-
tracks were made by individuals aged ten or under.
During the research period 2014-2017 there were no child footprint-track trails discovered
which were made of more than three footprints, so a comment cannot be made about their
activity (eg. playing or prey stalking), however juvenile footprint-tracks trails recorded by
Scales (2006) indicates children were moving in a way that indicated mud larking or play.
There can however be an inference made about the individuals at Site N; 69% of footprint-
tracks recorded from Site N between 2014-2017 were made by children and adult females. The

298
other 31% may have been made by small adult males, adult females or children aged above ten
years old. The footprint-tracks within this area were all orientated on an axis which would take
them towards places where wood structures have been found in palaeochannels, these are
possibly remains of fish traps (Site T and Site L). This may indicate that these children were not
just using the saltmarsh environment to play or learn as indicated by Scales (2006), but were
actively participating in fishing activity, which would require them to check the traps at least
twice a day at low tide.

299
Figure 6.81, (a-e) Pie chart representation of the approximate ages of the people who made the
footprint-tracks in the different areas, recorded 2010-2017, (f) the percentage of children and
adults from all footprint-tracks recorded 2010-2017
<10
9%
Adult male
28%
10 +/- 1
9%
10+ / adult
female
9%
10+/ adult
27%
5.5+/- 1.5
9%6.5 +/- 1.5
9%
(a) Site C/E percentage of ages (years)
from 12 footprint-tracks
6.5 +/- 1.5
18%
10+/ adult
27%10+/ adult
female
46%
Adult
male
9%
(b) Site M percentage of ages (years) from 10
footprint-tracks
10 +/- 1
25%
10+/ adult
50%
5.5 +/- 1.5
25%
(d) Site R percentage of ages (years)
from 4 footprint-tracks
10+ / adult
female
58%
10 +/- 1
7%
10+ / adult
31%
6.5 +/- 1.5
4%
(c) Site N percentage of ages (years)
from 26 footprint-tracks
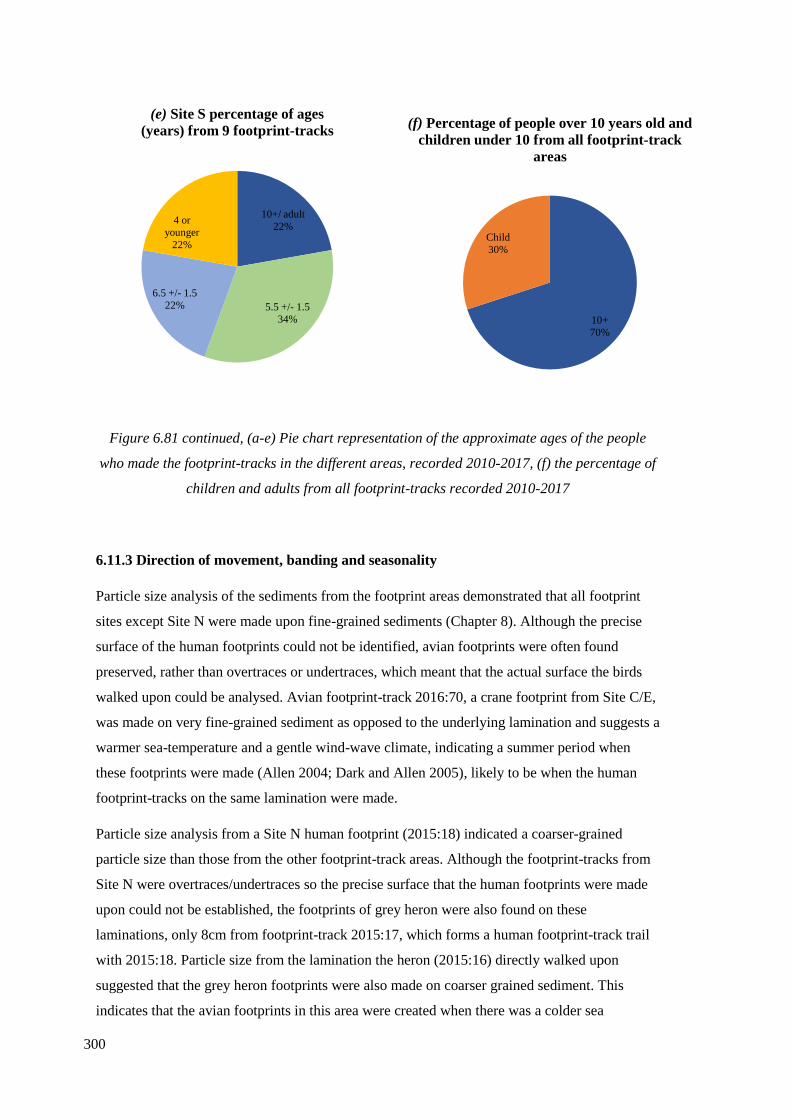
300
Figure 6.81 continued, (a-e) Pie chart representation of the approximate ages of the people
who made the footprint-tracks in the different areas, recorded 2010-2017, (f) the percentage of
children and adults from all footprint-tracks recorded 2010-2017
6.11.3 Direction of movement, banding and seasonality
Particle size analysis of the sediments from the footprint areas demonstrated that all footprint
sites except Site N were made upon fine-grained sediments (Chapter 8). Although the precise
surface of the human footprints could not be identified, avian footprints were often found
preserved, rather than overtraces or undertraces, which meant that the actual surface the birds
walked upon could be analysed. Avian footprint-track 2016:70, a crane footprint from Site C/E,
was made on very fine-grained sediment as opposed to the underlying lamination and suggests a
warmer sea-temperature and a gentle wind-wave climate, indicating a summer period when
these footprints were made (Allen 2004; Dark and Allen 2005), likely to be when the human
footprint-tracks on the same lamination were made.
Particle size analysis from a Site N human footprint (2015:18) indicated a coarser-grained
particle size than those from the other footprint-track areas. Although the footprint-tracks from
Site N were overtraces/undertraces so the precise surface that the human footprints were made
upon could not be established, the footprints of grey heron were also found on these
laminations, only 8cm from footprint-track 2015:17, which forms a human footprint-track trail
with 2015:18. Particle size from the lamination the heron (2015:16) directly walked upon
suggested that the grey heron footprints were also made on coarser grained sediment. This
indicates that the avian footprints in this area were created when there was a colder sea
10+
70%
Child
30%
(f) Percentage of people over 10 years old and
children under 10 from all footprint-track
areas
10+/ adult
22%
5.5 +/- 1.5
34%
6.5 +/- 1.5
22%
4 or
younger
22%
(e) Site S percentage of ages
(years) from 9 footprint-tracks
301
temperature and a harsher wind-wave climate, most likely during the autumn and winter months
(Allen 2004; Dark and Allen 2005), though as the human footprint-tracks are
overtraces/undertraces it cannot be established if these footprint-tracks were also made in the
winter period.
There were similarities in the direction of movement from the individuals at both Site C/E and
R. There were a high proportion (28%) heading in a north-west direction, however there were
also a high proportion heading west (24%), as well as 28% of footprint-tracks where the
direction of movement was unclear. The final 20% of footprint-tracks were heading north (8%),
north-east (4%), east (4%) and south (4%).
The footprint-tracks made on the lower laminated sites (M, N and S), had an evident direction
of movement, with 26% of individuals heading in a north-east direction, and a further 4% of
footprint-tracks orientated in an east direction away from Goldcliff Island. 4% of footprint-
tracks were orientated south and a further 50% of footprint-tracks heading south-west towards
Goldcliff Island, to the same area the east and north-east footprints were heading away from.
Only 3% of individuals were directed to the west-north-west, and 7% were heading north-west.
Within these areas 6% of the footprint-tracks had an indistinct direction of movement. Within
these footprint areas half of the footprint-tracks recorded were heading in a south-west
direction, towards Goldcliff Island. Although the actual orientation for each footprint-track
recorded between 2010-2014 is unknown, evidence from the tracing indicates that all footprint-
tracks were moving in a north-west and south-east direction, at right-angles with a
palaeochannel (Figure 6.65; Appendix 3.2).
The direction of movement suggests these individuals were all heading to a specific static area.
Areas of activity have been recorded at Goldcliff Island (Bell 2007), and there was a wooden
structure (Site T) recorded during this study on the same axis as the footprint-tracks from Site
N. A further 26% of footprint-tracks were orientated in a north-east direction, away from
Goldcliff Island, likely to be heading out from the areas of activity where they had been based.
Sites M, N and S are on different laminations and suggest that these footprint-tracks were lain
down on successive laminations over multiple years, with individuals returning to a similar
area, year after year.
6.11.4 Speed of movement of adults
Most footprint-tracks from Goldcliff East (2014-2017) were made by people who were moving
at a leisurely pace, not indicative of hunting or stalking. Only two of the eight footprint-track
trails indicated a person moving at speed, one was from Site C/E, the other was from Site M.
302
The hunter-gatherer from Site M who made footprints 2015:160 to 2015:163 was moving at the
fastest speed, at approximately 10km per hour (6mph), the hallux of footprint 2015:163 was
visible in this trail. This speed of travel suggests a steady jogging pace, though there were only
three footprint-tracks in this trail so a clear idea of pace of movement is difficult to establish.
Another individual was moving at a slightly slower pace and made footprint-track 2015:114 and
2015:115, travelling 8km per hour (5mph). The prominent arches of the footprints indicate that
this person was either walking quickly or had modified their running technique due to the soft
substrate they were moving upon.
All other footprint-tracks recorded during 2014-2017 suggest individuals who were walking at a
slow pace, so were unlikely to have been engaged in a hunting activity as there was no
footprint-track evidence to suggest individuals were moving quickly, or any evidence of
stalking (Bird and Bliege Bird 2005). The footprint-track trails from Site N suggested all
individuals were walking at a relatively normal walking speed, 2015:17, 2015:18 and 2015:20
were averaging 6km per hour (4mph), and 2016:50-56 were slightly slower at 5km per hour
(3mph). These individuals were between 161.7cm (5’3”) and 172.1cm (5’7”), and 154.9cm
(5’0”) to 167.8cm (5’6”), indicating that neither of the footprint makers would be considered
short by today’s standards. It may be that these individuals were walking slowly due to the wet,
soft, substrate they had to walk across, or that they were carrying something, which would
explain the short stride lengths.
The footprint-track trail in Site R indicates another person who was walking slowly, on this
same lamination there was evidence of both a human child and a large ungulate, possibly red
deer. The footprint-track trail was made by an adolescent or a full-grown adult of either sex,
with a height between 152.0cm (4’11”) and 172.1cm (5’7”), heading north-west 295°. The
singular child footprint-track was heading 270° north-west, in a similar direction. The ungulate
footprint-tracks were indistinct and may even have been poorly formed or poorly preserved
human footprint-tracks, so cannot be utilised for the interpretation of this area, though there was
one obvious red deer footprint-track that crossed the human footprint-track trail at 140°. The
human footprint-tracks from Site R had evidence of toes, heels and arches indicating that they
were walking at an average pace, 7km per hour (4mph) and were not just on the balls of their
feet, so this trail is not indicative of animal stalking. The human and deer were travelling in
different directions so it is unlikely this deer was being hunted by the human. The presence of a
footprint-track made by a child aged 5.5 +/- 1.5 years old may suggest that these individuals
had gone to the same place together, heading from the south-east direction, so possibly
returning from hunting or gathering by the sea.
303
6.12 Conclusion
The Mesolithic footprints at Goldcliff East provide archaeologists with an interesting snapshot
of the lives of these hunter-gatherers. One of the most important aspects of this site is the
prevalence of juveniles. The prehistoric footprint-tracks at Goldcliff East indicate that young
children were present in the intertidal zone, as were adolescent children, adult females and to a
lesser extent, adult males. Site C/E and M are the only areas where there were footprint-tracks
that were clearly male. Though smaller footprint-tracks could also have been made by males, it
does indicate that children and adult females were predominant within this site.
The potential fish trap discovered on the same axis as the footprint-tracks from Site N adds a
new dimension to this data. Site N was a small area (16m x 6m) that was walked over multiple
times, always heading in a similar direction, indicating that these individuals were walking to
perform a routine activity at a static place. These individuals were children and possibly adult
female, suggesting this was an activity that only certain members of Goldcliff East society were
performing.

304
Chapter 7
Mesolithic avian footprint-tracks on the Severn Estuary
7.1 Introduction
This chapter will present and analyse Mesolithic avian footprint-tracks recorded at Goldcliff
East, Severn Estuary. Within the field of archaeology bird footprints are rarely thoroughly
analysed or even fully reported. They are often viewed as a curiosity, with hominin footprint-
tracks gaining the most interest. This results section will demonstrate that avian footprint-tracks
can provide useful information regarding the species present on a site, rather than relying
completely on skeletal remains of birds, which are often sparse in wetland areas. Modern
wetland avian data will be used as an analogue to facilitate prehistoric species identification. A
consideration of nationwide and localised extinction assists in our understanding of whether a
species was once native to an area or if it is invasive. This is particularly relevant regarding
birds, where slight changes to climate or habitat can greatly affect a species, their migratory
behaviours and competitive balance (Ahola et al. 2007; Both et al. 2010; Robinson et al. 2009).
A variety of coastal birds depend on unique habitats found in Britain, either as a year-round
home, a breeding area, or a stop during migration. The presence of birds can be an environment
or habitat indicator. Prehistoric birds would have had specific habitat needs; evidence of their
presence may give an indication of the environment and habitat of an area, as well as
availability of resources.
There are a number of avian species that may have been exploiting the wetland and mudflats of
the Severn Estuary during prehistory, some of which may no-longer migrate to or exploit this
area.
7.1.1 The importance of common crane in Wales: prehistory to present
The common crane (Grus grus) is a large, long-necked, migratory bird. They require quiet,
secluded wetland areas to breed. The common crane no longer flocks to Britain to breed during
its migration, this is thought to be due to historic over-hunting, drainage of wetlands and
destruction of their habitat. Although it is no-longer considered a breeder in Britain, a small
population has been recorded migrating to East Anglia each summer since the 1970’s (Buxton
and Durdin 2011).
Cranes are ingrained in our history, with certain British towns, villages and even fields named
in reference to this species (Figure 7.1). A survey in 1938 recognised place names around
Britain which are associated with cranes. A place named Corndon Hill, which means ‘Hill
305
frequented by Cranes’, in Montgomeryshire was included in the report. Though there has not
been any crane skeletal remains found in this area the name suggests that at some point cranes
were frequenting this hill, perhaps to gain access to a shallow body of water. Their presence
appears to have been used by humans to recognise this hill from the surrounding landscape
features (Charles 1938), perhaps suggesting a large number of crane or that they were frequent
visitors.
It is thought that the numbers of crane living on the Welsh side of the Severn Estuary dropped
dramatically due to Roman overhunting. At the Roman fortress of Caerleon, Newport, which
was active from around 75AD for approximately 200 years (Gardner and Guest 2010), bones of
common crane were recovered from the bottom of a well. The bones had cut marks suggesting
that these birds were being eaten (Hamilton-Dyer 1993). This is the latest archaeological
evidence for common crane so far reported in Wales.
During King Henry III’s reign, a Christmas feast list from 1251 indicated that the King was
eating a variety of birds, including 115 common cranes. During the Christmas feast of 1387
King Richard II exploited an even greater range of birds, however there were only 12 common
cranes included in the feast (Hobusch 1980). There were a supposed 204 common cranes eaten
at a feast in 1465 to celebrate George Neville becoming the Archbishop of York (Gurney 1921).
By the reign of King Henry VIII (1509-1547) crane were rare throughout Britain (Rackham
1986), with sightings mainly recorded in East Anglia. A statute was introduced by King Henry
VIII in 1534, making the removal of crane eggs between the months of March and June illegal,
with penalties including a fine of 20 silver pennies for every crane egg taken, and even
imprisonment (Gurney 1921). This statute is thought to be the first legislation in Europe to
protect the common crane, with a very heavy penalty for those not doing so.
The evidence for common crane in Wales is sparse when compared to England. It is likely that,
by the Medieval period, common crane were almost completely extinct in Wales, as there have
been no recorded sightings or faunal remains discovered from this period or afterwards. It may
be that the Romans were primarily responsible for this extinction due to over-hunting, drainage
and land reclamation. It is therefore likely that our understanding has been affected by recorded
historic sightings, which only began during the medieval period, with a primarily English focus.
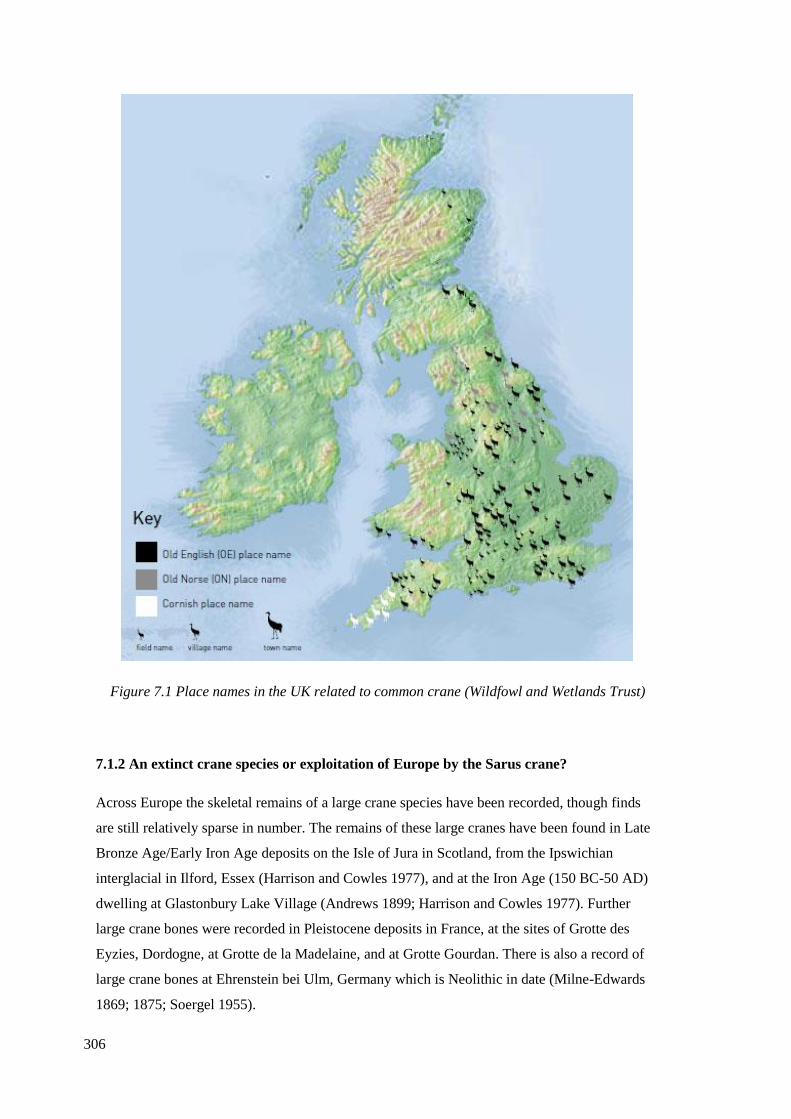
306
Figure 7.1 Place names in the UK related to common crane (Wildfowl and Wetlands Trust)
7.1.2 An extinct crane species or exploitation of Europe by the Sarus crane?
Across Europe the skeletal remains of a large crane species have been recorded, though finds
are still relatively sparse in number. The remains of these large cranes have been found in Late
Bronze Age/Early Iron Age deposits on the Isle of Jura in Scotland, from the Ipswichian
interglacial in Ilford, Essex (Harrison and Cowles 1977), and at the Iron Age (150 BC-50 AD)
dwelling at Glastonbury Lake Village (Andrews 1899; Harrison and Cowles 1977). Further
large crane bones were recorded in Pleistocene deposits in France, at the sites of Grotte des
Eyzies, Dordogne, at Grotte de la Madelaine, and at Grotte Gourdan. There is also a record of
large crane bones at Ehrenstein bei Ulm, Germany which is Neolithic in date (Milne-Edwards
1869; 1875; Soergel 1955).
307
The large crane species that appears sporadically across Europe is thought to be either an
extinct giant crane, which has been named Grus primigenia, or the remains of the sarus crane
(Grus antigone), a species which is currently found in Asia and Australia (Harrison and Cowles
1977; Northcote and Mourer-Chauviré 1985; Lydekker 1891). This large species of crane is
important to note when examining prehistoric crane footprint-tracks; due to changing habitats,
environments and human behaviour such as hunting, there were multiple avian species living
during prehistory that may have been markedly different to their descendants today, or are now
extinct. Modern sarus cranes are a non-migratory species that do not share their territory with
common crane. Their presence in Britain may suggest a large shift in their behaviour from
migratory to non-migratory, that they were once non-migratory residents of Europe, or that their
habitat needs were once supported by Europe’s environment, and they were possibly
outcompeted by common crane. The other explanation is that the remains are in fact from an
extinct species, Grus primigenia, the behaviours of which we know nothing about.
7.1.3 Evidence of white stork in Britain
White stork (Ciconia ciconia) are large, long-legged, wetland breeders. They prefer a slightly
warmer climate and are more often seen nesting on the roofs of houses and chimneys in Europe
(Cramp & Simmons 1977; Tryjanowski et al. 2009) or feeding at the edge of a watering hole in
Africa than visiting the damp environment of modern Britain. The habitat and climate of Britain
during prehistory may however have fulfilled the needs of this species.
White stork bones have been recorded in two Pleistocene cave deposits, both found at Creswell
Crags, Worksop (Jenkinson and Bramwell 1984; Jenkinson 1984). Evidence of white stork
during the Holocene has been found at two Bronze Age sites in the form of skeletal evidence, at
Jarlshof, Sumburgh, Shetland and at Nornour, Isles of Scilly (Platt 1933, 1956; Turk 1971;
1978). Possible white stork bone evidence was also found at two Iron Age sites, Dragonby, in
Linconshire and Harston Mill, in Cambridgeshire (Harman 1996). White stork bones were
recorded at Silchester Roman town (Newton 1905; Maltby 1984), and at the Saxon site at
Westminster Abbey (West 1994). In Oxford white stork bones have been recorded at the
Medieval site of St Ebbes (Wilson et al. 1989), there are also written records of white stork
breeding in Edinburgh during the fifteenth century (Yalden & Albarella 2009). The
archaeological presence of white stork throughout these periods suggests this species was
existent in Britain, though it may have been uncommon. This species was recorded mainly in
southern and eastern Britain during the Holocene period, perhaps due to their preference for
warmer climates, and it may be that the breeding pair in Edinburgh were blown off course of
their migratory route.
308
Common crane and white stork are just two prominent wetland birds; by understanding their
presence within archaeology, as well as other species, we may also begin to understand the
palaeoecology of Mesolithic coastal sites.
7.2 Method
To understand the prehistoric avian footprint-track evidence it is important to consider the
species that were likely to be frequenting the Severn Estuary. Both prehistoric faunal evidence
and evidence from contemporary coastal birds was considered (Chapter 2, Table 2.7 and Table
2.8). The ways in which each footprint was recorded, measured and analysed are described
fully in Chapter 4.3. The techniques of recording archaeological and contemporary avian
footprints was dependant on the recording situation, and included multi-image photogrammetry,
standard photography, measuring the lengths and widths of a print, measuring the angle
between toe II and toe IV, and looking for the presence of 1st toe, webbing and claw marks.
Each bird species will have adapted specifically to their environment. These bodily adaptations
can affect the way in which a bird walks, which can be used as a further identifying factor for a
species. The position of the pelvic girdle determines the location of a bird’s legs, this location is
due to the specific needs of the species (Baker 2013, p 28). Animals with legs positioned in the
centre of the body, such as plovers, will have a stable centre of gravity, creating a footprint from
an evenly distributed weight. Birds with their legs positioned towards the back of their torso are
more likely to have a heavy tread, especially at the metatarsal pads. The Anatidae family
(ducks, geese, swans) have legs that are positioned further back on their bodies, resulting in
very pronounced metatarsal pad marks in their footprints. This positioning indicates that these
birds are capable of swimming or standing on branches (Baker 2013, p 28). Families such as
Charadriidae, Haematopodidae and Gruidae (plovers, lapwigs, oystercatcher, common crane),
have developed central or slightly forward positioning of the legs, allowing steady footing when
walking in their preferred environment and in an upright position, with the ability to hunt and
strike their prey.
Birds from the Anatidae (ducks, geese and swan), Ardeidae (heron, egret, bittern), and Gruidae
(crane) families were observed to all have specific walking behaviour which makes trails clear
to see. Anatidae tend to walk in pairs with their feet turned slightly inwards, creating a waddle,
and Gruidae will often walk in pairs, weaving in and out of each other’s paths. This can cause
difficulties in identification when these birds are in the same area over a prolonged period,
causing trampling. Small flocking birds such as those from the Scolopacidae family (turnstone,
dunlin, little stint) will weave in and out of one another whilst feeding, making identifying trails
309
and individuals extremely difficult, though when a single bird has wandered from the group a
stride and pace can be established.
The identification of bird feet via the extent of webbing can assist in identifying species (Baker
2013, p 29). The most common webbed foot is known as palmate, this is where the 2nd to 4th
toe are connected by webbing; birds such as ducks, geese and gull have this type of webbing.
Totipalmate is where all four toes are connected by webbing to enable strong swimming; birds
such as pelican have this type of webbing. If a bird has partial webbing near the base of toes 2-4
they are semipalmate, and have adapted this feature to enable both swimming and walking upon
soft surfaces; sandpipers and plovers have this webbed feature. The final webbing that can be
apparent in footprint data is when a bird is lobate, this is where the foot has lobes of skin; coots
have the most prominent lobate webbing.
In Britain, changes to habitats can cause localised extinctions of certain species. The skeletal
remains of avians found in archaeological assemblages must also be considered to understand
the changes in British bird species over time, these were explored fully in Chapter 2.5.
This study considered the footprint morphology and formation of 21 bird species, with the
footprint database developed to assist in the identification of prehistoric footprint-tracks. Out of
the 21 species, five were geese, two were swan, two from the heron and egret family, one from
the crane family, one corvid, one gull, one oystercatcher, one from the plover family, three from
the duck family, and three were small waders. All the geese and swan recorded in this study
were resident breeders at the Wildfowl and Wetlands Trust (WWT), Slimbridge, except for
some migratory greylag geese that exploit the WWT for its resources yearly. All the small
waders, heron, egret, gull, corvid, oystercatcher and plover were wild birds from the intertidal
zone of the Severn Estuary. The duck species were primarily recorded at the WWT, though
common shelduck footprints were also recorded at Goldcliff East. The Eurasian bittern footprint
was recorded by a volunteer at the RSPB Minsmere nature reserve, from a wild bird.
Avian footprint tracking literature (Bang and Dahlstrom 1974; Brown et al. 1987) was also
referenced to enable a thorough understanding of the footprints of birds not included within this
study, as well as the differences within the literature and the experimental database.
The prehistoric bird footprint length, width, toe angles, presence of first toe, webbing or claw
marks were compared to the writers’ contemporary avian footprint database for identification.
This database contains 1558 photographs of 329 modern bird footprints made at Goldcliff East,
the Wildfowl and Wetlands Trust (WWT) and the RSPB Minsmere nature reserve, and relates
to 21 avian species recorded. The database also contains eight multi-image photogrammetry
models of at least eight different species. The footprints made by modern birds at Goldcliff East
310
were made naturally upon estuarine sands and mud. Binoculars and the RSPB field guide were
used to directly identify the birds (Hume 2014), the footprints were then recorded The Eurasian
bittern footprints recorded at Minsmere had walked upon a sand footprint ‘trap’, and was then
identified by the RSPB.
The footprints recorded at the WWT were recorded from 04.01.2016 to 07.01.2016 and from
11.01.2016 to 14.01.2016. The footprints were made on mud and sand around the reserve, and
also in the estuarine clayey silt ‘footprint trap’. This ‘footprint trap’ was a large plastic seed tray
measuring 1.5m in length and 60cm in width. Four of these were left for several days in
different enclosures, so that the birds became accustomed to them. The trays were placed into
the enclosures of bird species which appear in bone assemblages at a variety of prehistoric sites
(Table 2.7). 11 of the 21species recorded during this experiment were from the Wildfowl and
Wetland Trust, Slimbridge.
It was not practical to dig a pit in the bird enclosures to stop the tray moving which was the
method used for the human experiment (Chapter 5.2). Instead wood chips from the enclosures
were tightly packed around the tray (Figure 7.2). This caused the least disruption to the birds
and meant that they did not need to step over the side of the tray. Estuarine sediment was then
added to the ‘footprint trap’, this sediment was compressed as much as possible using a plastic
plastering trowel,and spread evenly. After recording, the sediment was compressed and spread
across the tray again to remove traces of previous footprints.
In enclosures where there were multiple bird species it was not always possible to ascertain
which species made footprints in the trap. A further method was therefore used to ensure certain
species at the WWT were recorded. With the assistance of staff members these species were
caught and placed in a cage. The staff members habitually capture the birds and feed the birds
treats in these cages so the birds were all calm when caged. The ‘footprint trap’ was then
prepared outside of the cage, and the bird was released, walking over the trap. This provided
excellent data, as the gait of the bird could be observed, as well as any medical issues. The
European white-fronted goose, for example, was a 14-year-old arthritic female, so may have
altered her gait to lessen joint pain.
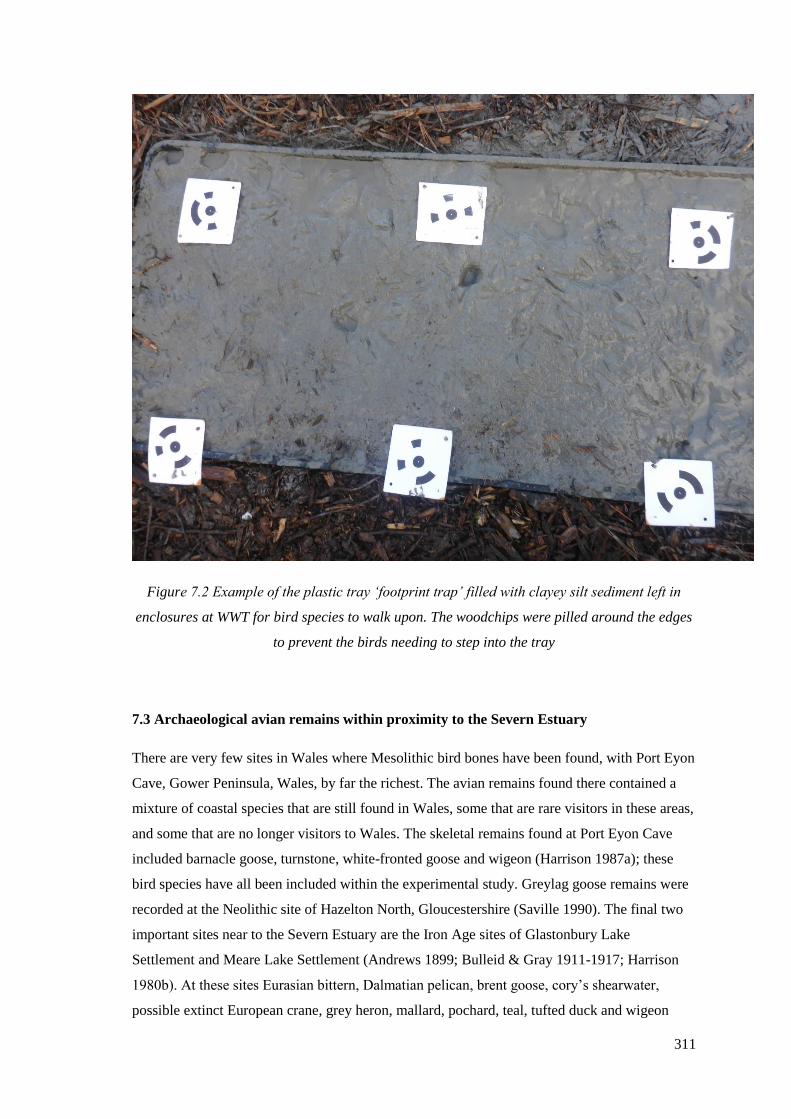
311
Figure 7.2 Example of the plastic tray ‘footprint trap’ filled with clayey silt sediment left in
enclosures at WWT for bird species to walk upon. The woodchips were pilled around the edges
to prevent the birds needing to step into the tray
7.3 Archaeological avian remains within proximity to the Severn Estuary
There are very few sites in Wales where Mesolithic bird bones have been found, with Port Eyon
Cave, Gower Peninsula, Wales, by far the richest. The avian remains found there contained a
mixture of coastal species that are still found in Wales, some that are rare visitors in these areas,
and some that are no longer visitors to Wales. The skeletal remains found at Port Eyon Cave
included barnacle goose, turnstone, white-fronted goose and wigeon (Harrison 1987a); these
bird species have all been included within the experimental study. Greylag goose remains were
recorded at the Neolithic site of Hazelton North, Gloucestershire (Saville 1990). The final two
important sites near to the Severn Estuary are the Iron Age sites of Glastonbury Lake
Settlement and Meare Lake Settlement (Andrews 1899; Bulleid & Gray 1911-1917; Harrison
1980b). At these sites Eurasian bittern, Dalmatian pelican, brent goose, cory’s shearwater,
possible extinct European crane, grey heron, mallard, pochard, teal, tufted duck and wigeon
312
have all been recorded (Harrison 1987a). Many of these birds were included in the experiment;
however, it was not possible to gather footprint data for several species. Dalmatian pelican, for
example, are not a common visitor to the British Isles. Others are migrant seabirds and so are
difficult to record as they spend very little time on the land.
There have been very few Mesolithic bird bones recorded at Goldcliff East, perhaps due to poor
preservation, so these cannot be relied upon to assist in identification. Within Site A, context
315, there were three small bone fragments; these were not able to be identified (Scales 2007b,
p 164, Table 13.2). Two further bones, possibly from mallard duck (Anas platyrhynchos) were
recorded at Site W.
7.4 Experimental results
The results in Table 7.1 indicate the similarities in the metric dimensions of certain species and
the importance of including information on identifiable features, with the presence of first toe
and webbing being of most assistance in the identification process. Figure 7.3 demonstrates that
species from different families may have similar metric dimensions but may appear
morphologically different. The pace and stride of species is also useful in understanding gait,
and thus may assist in differentiating two species of a similar size, as gait can help to indicate
the leg placement on the body.
A further identifying feature of a species is the angle between the second and fourth toe (Table
7.2). Although toe angle is generally used as an identifying factor, there are a lot of
discrepancies within the literature, and within this experiment it was found that the sediment
walked upon affected the angle of the toe, one species could produce a large variety of toe
angles. For example, in this experiment the toe angle of 26 crane footprints were measured from
three adult cranes, the angle was found to range between 100-175°. Footprint tracking literature
identifies common crane as a species that has a toe angle that is larger than 120° and can be
almost 180° (Table 7.2). If relying solely upon toe angle there would be some crane footprints
that would not be classed as this species, it is therefore important to consider all aspects of the
foot when identifying species.
Birds from the same family tend to share specific morphology, which can be seen in their
footprints. Those from the Anatidae family generally have feet almost as wide as they are long,
with evidence of webbing and the second and fourth toes curving slightly inwards (Figure 7.4,
b-d, h-i). A member of the Corvidae family will have a very long but narrow foot (Figure 7.4e),

313
whereas those from the Gruidae and Ardeidae families will have very large footprints, in both
length and width, with toes widely spread (Figure 7.4 a, f, g).
Figures 7.5 and 7.6 show the multi-image photogrammetry models generated from some of the
modern bird footprints, three of the models were made from footprints of birds at the WWT
Slimbridge, and one model was from a wild grey heron walking across mud at Goldcliff East.
These models demonstrate the benefit of recording using photogrammetry. Colour and lighting
can cause shadows which prevent footprints being seen in detail, creating a solid colour model
means that this area can then be studied without this distraction.
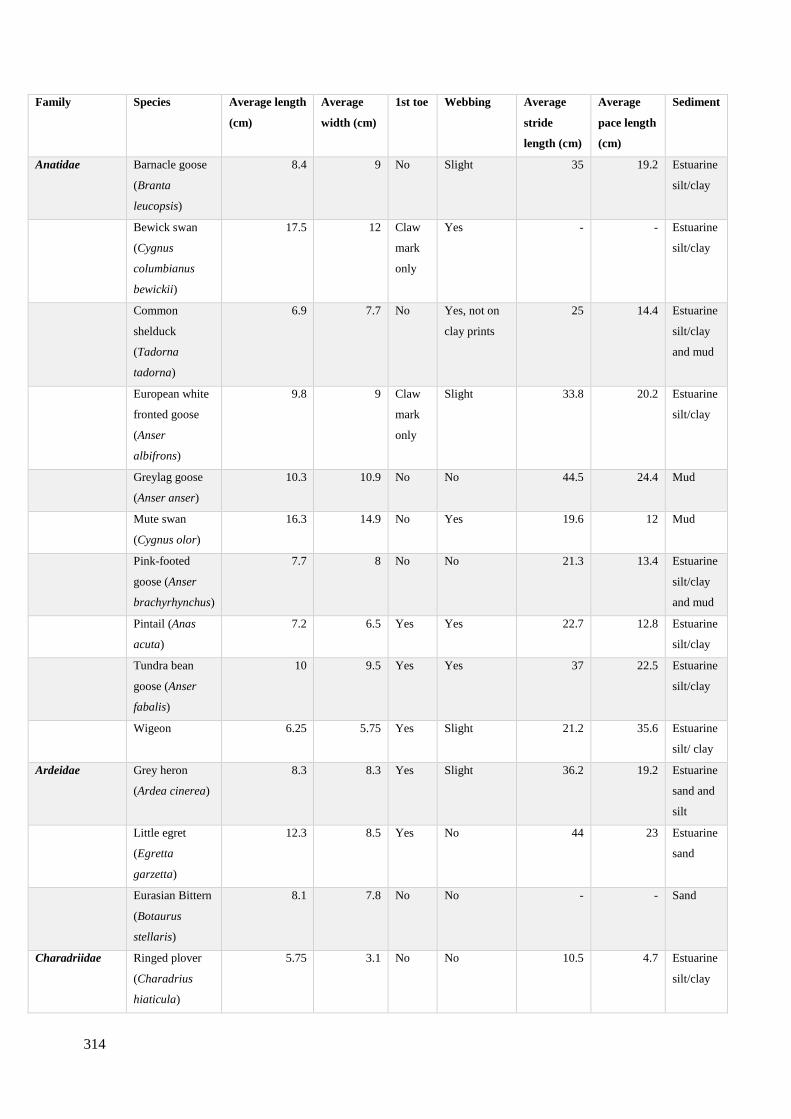
314
Family Species Average length
(cm)
Average
width (cm)
1st toe Webbing Average
stride
length (cm)
Average
pace length
(cm)
Sediment
Anatidae Barnacle goose
(Branta
leucopsis)
8.4 9 No Slight 35 19.2 Estuarine
silt/clay
Bewick swan
(Cygnus
columbianus
bewickii)
17.5 12 Claw
mark
only
Yes - - Estuarine
silt/clay
Common
shelduck
(Tadorna
tadorna)
6.9 7.7 No Yes, not on
clay prints
25 14.4 Estuarine
silt/clay
and mud
European white
fronted goose
(Anser
albifrons)
9.8 9 Claw
mark
only
Slight 33.8 20.2 Estuarine
silt/clay
Greylag goose
(Anser anser)
10.3 10.9 No No 44.5 24.4 Mud
Mute swan
(Cygnus olor)
16.3 14.9 No Yes 19.6 12 Mud
Pink-footed
goose (Anser
brachyrhynchus)
7.7 8 No No 21.3 13.4 Estuarine
silt/clay
and mud
Pintail (Anas
acuta)
7.2 6.5 Yes Yes 22.7 12.8 Estuarine
silt/clay
Tundra bean
goose (Anser
fabalis)
10 9.5 Yes Yes 37 22.5 Estuarine
silt/clay
Wigeon 6.25 5.75 Yes Slight 21.2 35.6 Estuarine
silt/ clay
Ardeidae Grey heron
(Ardea cinerea)
8.3 8.3 Yes Slight 36.2 19.2 Estuarine
sand and
silt
Little egret
(Egretta
garzetta)
12.3 8.5 Yes No 44 23 Estuarine
sand
Eurasian Bittern
(Botaurus
stellaris)
8.1 7.8 No No - - Sand
Charadriidae Ringed plover
(Charadrius
hiaticula)
5.75 3.1 No No 10.5 4.7 Estuarine
silt/clay
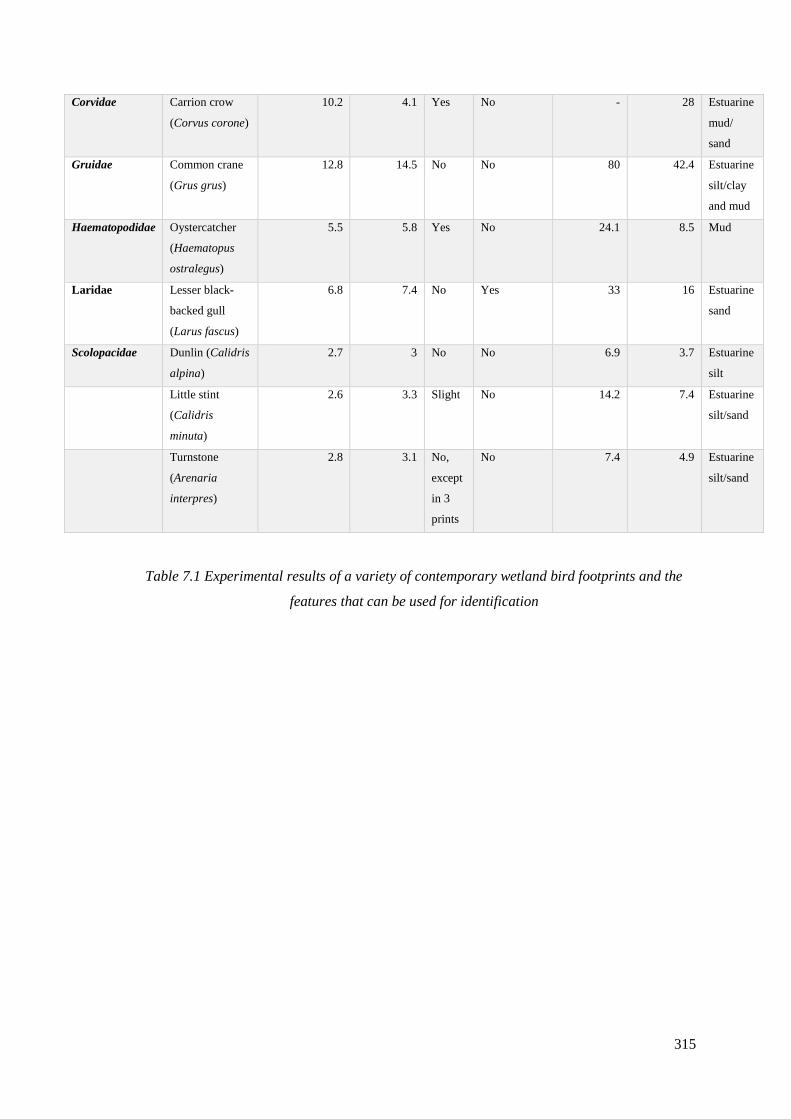
315
Corvidae Carrion crow
(Corvus corone)
10.2 4.1 Yes No - 28 Estuarine
mud/
sand
Gruidae Common crane
(Grus grus)
12.8 14.5 No No 80 42.4 Estuarine
silt/clay
and mud
Haematopodidae Oystercatcher
(Haematopus
ostralegus)
5.5 5.8 Yes No 24.1 8.5 Mud
Laridae Lesser black-
backed gull
(Larus fascus)
6.8 7.4 No Yes 33 16 Estuarine
sand
Scolopacidae Dunlin (Calidris
alpina)
2.7 3 No No 6.9 3.7 Estuarine
silt
Little stint
(Calidris
minuta)
2.6 3.3 Slight No 14.2 7.4 Estuarine
silt/sand
Turnstone
(Arenaria
interpres)
2.8 3.1 No,
except
in 3
prints
No 7.4 4.9 Estuarine
silt/sand
Table 7.1 Experimental results of a variety of contemporary wetland bird footprints and the
features that can be used for identification
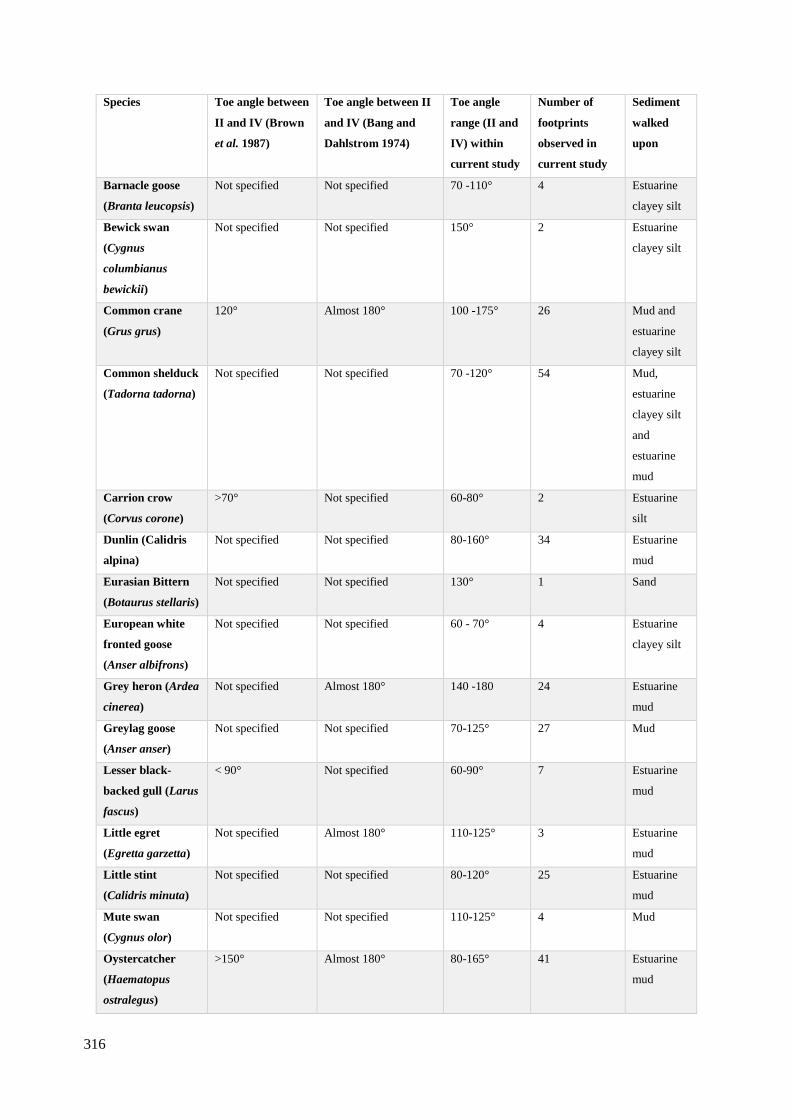
316
Species Toe angle between
II and IV (Brown
et al. 1987)
Toe angle between II
and IV (Bang and
Dahlstrom 1974)
Toe angle
range (II and
IV) within
current study
Number of
footprints
observed in
current study
Sediment
walked
upon
Barnacle goose
(Branta leucopsis)
Not specified Not specified 70 -110° 4 Estuarine
clayey silt
Bewick swan
(Cygnus
columbianus
bewickii)
Not specified Not specified 150° 2 Estuarine
clayey silt
Common crane
(Grus grus)
120° Almost 180° 100 -175° 26 Mud and
estuarine
clayey silt
Common shelduck
(Tadorna tadorna)
Not specified Not specified 70 -120° 54 Mud,
estuarine
clayey silt
and
estuarine
mud
Carrion crow
(Corvus corone)
>70° Not specified 60-80° 2 Estuarine
silt
Dunlin (Calidris
alpina)
Not specified Not specified 80-160° 34 Estuarine
mud
Eurasian Bittern
(Botaurus stellaris)
Not specified Not specified 130° 1 Sand
European white
fronted goose
(Anser albifrons)
Not specified Not specified 60 - 70° 4 Estuarine
clayey silt
Grey heron (Ardea
cinerea)
Not specified Almost 180° 140 -180 24 Estuarine
mud
Greylag goose
(Anser anser)
Not specified Not specified 70-125° 27 Mud
Lesser black-
backed gull (Larus
fascus)
< 90° Not specified 60-90° 7 Estuarine
mud
Little egret
(Egretta garzetta)
Not specified Almost 180° 110-125° 3 Estuarine
mud
Little stint
(Calidris minuta)
Not specified Not specified 80-120° 25 Estuarine
mud
Mute swan
(Cygnus olor)
Not specified Not specified 110-125° 4 Mud
Oystercatcher
(Haematopus
ostralegus)
>150° Almost 180° 80-165° 41 Estuarine
mud
317
Pink-footed goose
(Anser
brachyrhynchus)
Not specified Not specified 65 - 95° 40 Mud and
estuarine
clayey silt
Pintail (Anas
acuta)
Not specified Not specified 80 - 110° 8 Estuarine
clayey silt
Ringed plover
(Charadrius
hiaticula)
>120° Almost 180° 110- 160° 4 Estuarine
mud
Tundra bean
goose (Anser
fabalis)
Not specified Not specified 70 - 90° 3 Estuarine
clayey silt
Turnstone
(Arenaria
interpres)
Not specified Not specified 100-140° 12 Estuarine
mud
Wigeon (Anas
penelope)
Not specified Not specified 80 -100° 4 Estuarine
clayey silt
Table 7.2 Angle between toe II and toe IV of the different species from experimental work
compared against footprint-track literature

318
Figure 7.3 Average footprint lengths and widths of the 21 species from 8 different families as
seen in Table 7.1
0
2
4
6
8
10
12
14
16
0 2 4 6 8 10 12 14 16 18 20
WID
TH
IN
CM
LENGTH IN CM
AVERAGE LENGTHS AND WIDTHS OF 21 SPECIES
FROM 8 DIFFERENT FAMILIES
Anatidae Ardeidae Charadriidae Corvidae Gruidae Haematopodidae Laridae Scolopacidae
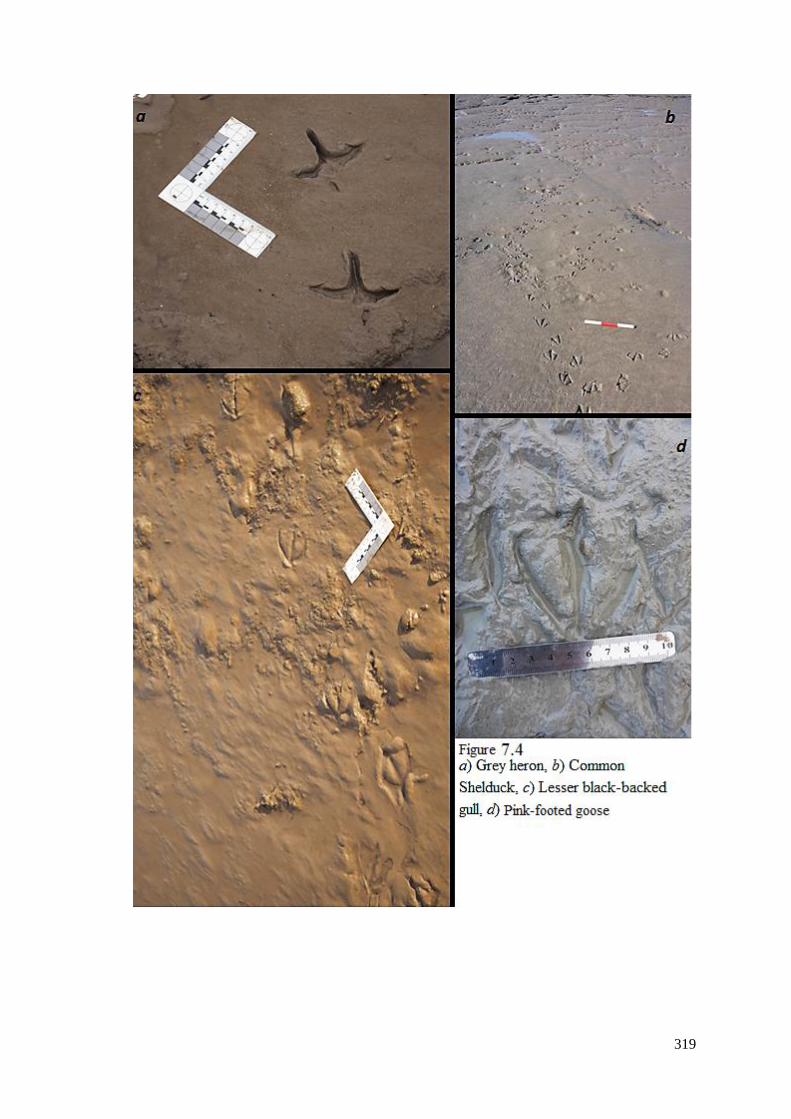
319
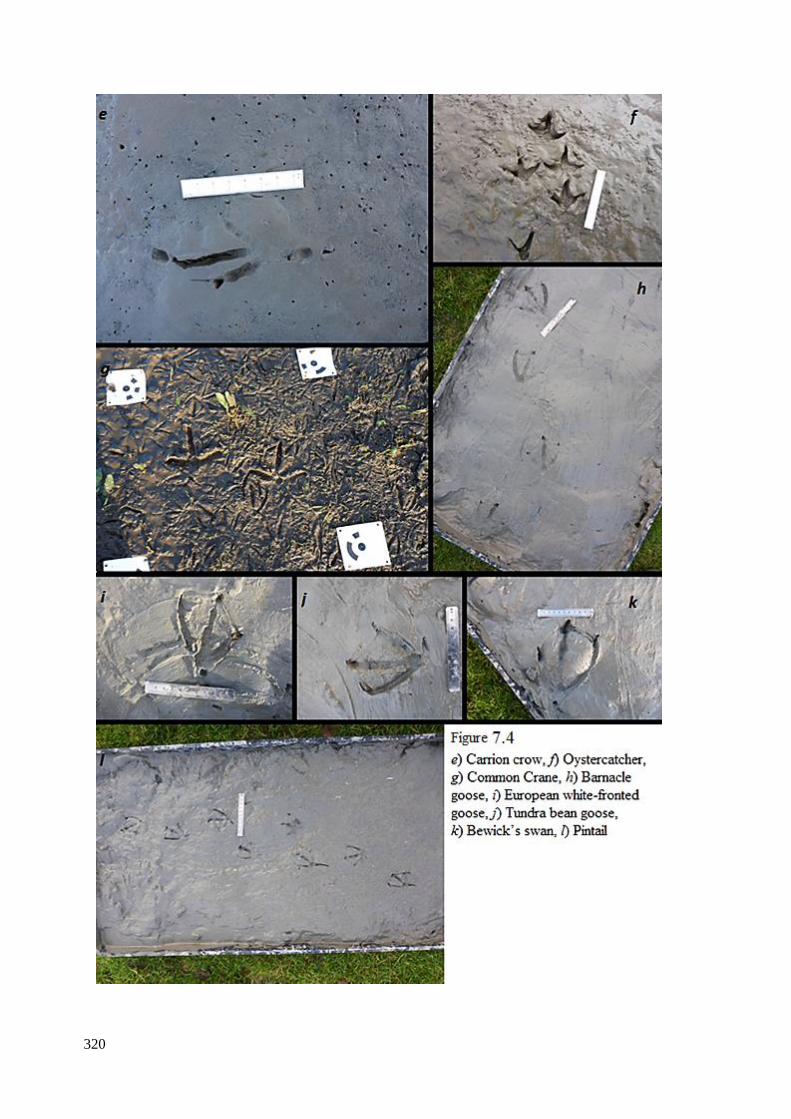
320
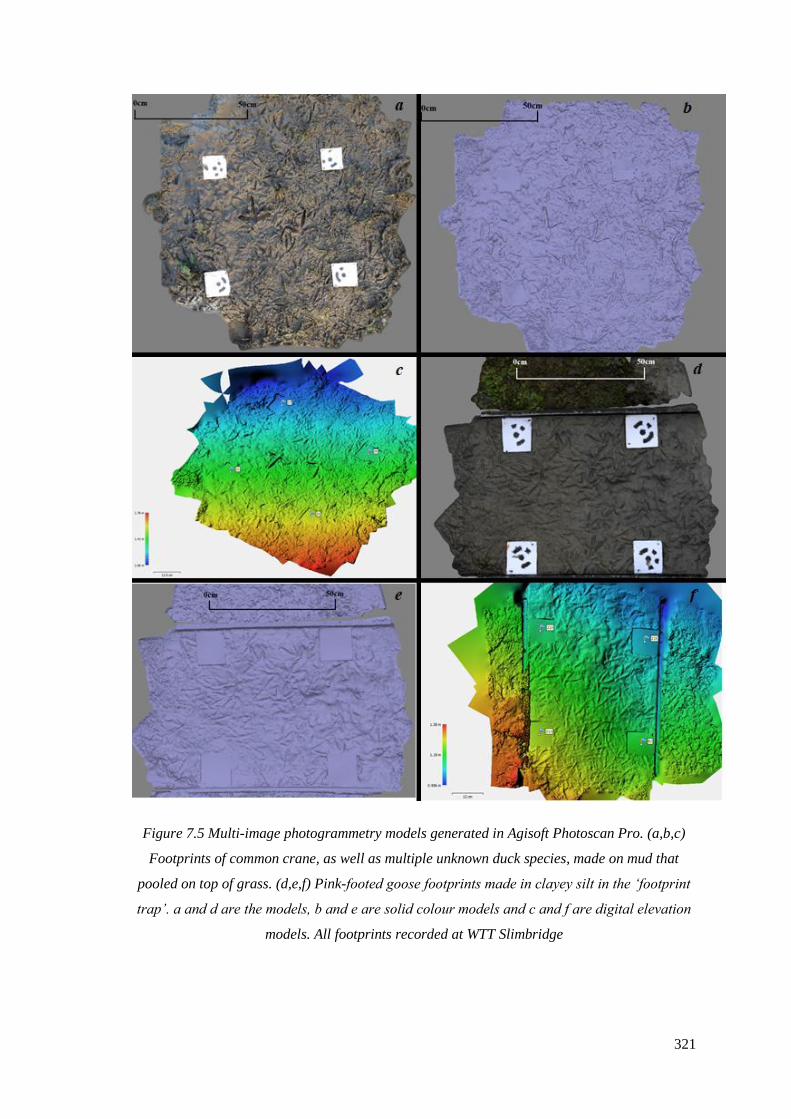
321
Figure 7.5 Multi-image photogrammetry models generated in Agisoft Photoscan Pro. (a,b,c)
Footprints of common crane, as well as multiple unknown duck species, made on mud that
pooled on top of grass. (d,e,f) Pink-footed goose footprints made in clayey silt in the ‘footprint
trap’. a and d are the models, b and e are solid colour models and c and f are digital elevation
models. All footprints recorded at WTT Slimbridge
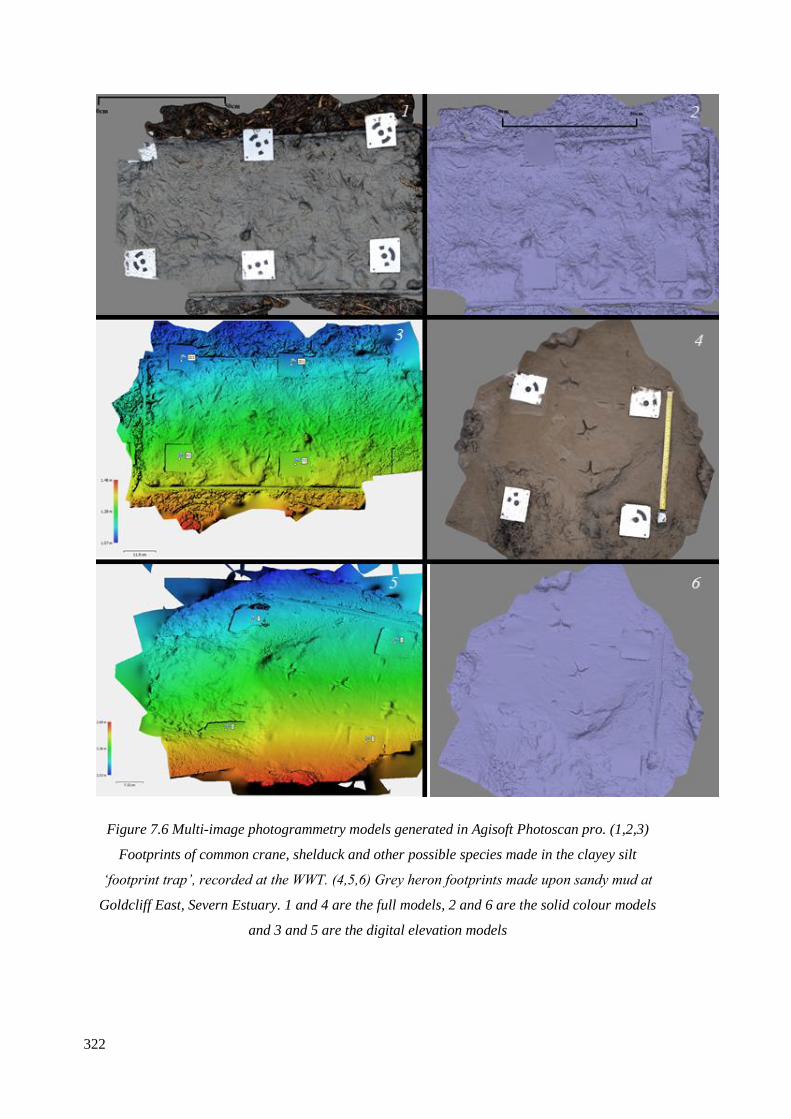
322
Figure 7.6 Multi-image photogrammetry models generated in Agisoft Photoscan pro. (1,2,3)
Footprints of common crane, shelduck and other possible species made in the clayey silt
‘footprint trap’, recorded at the WWT. (4,5,6) Grey heron footprints made upon sandy mud at
Goldcliff East, Severn Estuary. 1 and 4 are the full models, 2 and 6 are the solid colour models
and 3 and 5 are the digital elevation models
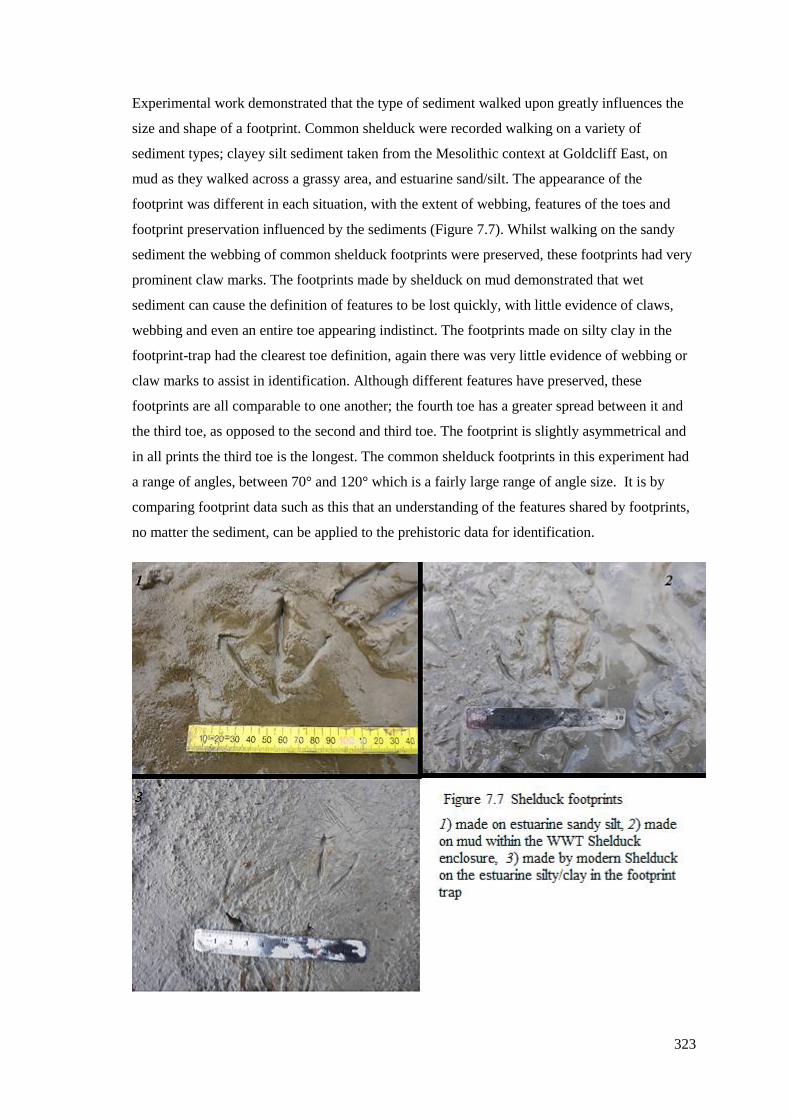
323
Experimental work demonstrated that the type of sediment walked upon greatly influences the
size and shape of a footprint. Common shelduck were recorded walking on a variety of
sediment types; clayey silt sediment taken from the Mesolithic context at Goldcliff East, on
mud as they walked across a grassy area, and estuarine sand/silt. The appearance of the
footprint was different in each situation, with the extent of webbing, features of the toes and
footprint preservation influenced by the sediments (Figure 7.7). Whilst walking on the sandy
sediment the webbing of common shelduck footprints were preserved, these footprints had very
prominent claw marks. The footprints made by shelduck on mud demonstrated that wet
sediment can cause the definition of features to be lost quickly, with little evidence of claws,
webbing and even an entire toe appearing indistinct. The footprints made on silty clay in the
footprint-trap had the clearest toe definition, again there was very little evidence of webbing or
claw marks to assist in identification. Although different features have preserved, these
footprints are all comparable to one another; the fourth toe has a greater spread between it and
the third toe, as opposed to the second and third toe. The footprint is slightly asymmetrical and
in all prints the third toe is the longest. The common shelduck footprints in this experiment had
a range of angles, between 70° and 120° which is a fairly large range of angle size. It is by
comparing footprint data such as this that an understanding of the features shared by footprints,
no matter the sediment, can be applied to the prehistoric data for identification.
324
7.5 Mesolithic bird footprint-tracks from Goldcliff East
There were 155 avian footprint-tracks recorded at Goldcliff East between 2001-2017. These
were all recorded on Mesolithic clayey silt banded laminations from five different areas, Site C,
E, M, N and O (Figure 6.2). Site C and E are on a higher lamination shelf than M, N and O and
are a little later in date but probably no more than a century or two given the height difference
and the fact that the sediments are annually laminated. Scales (2006) recorded a further 116
small bird footprint-tracks from a lamination between Site C and E. These footprints were
recorded via tracing but they were not analysed in detail in Scales (2006) work which was
focused on human footprint-tracks (Figure 7.8). Tracing can be unreliable as evidence as these
are subjective, though there were obviously many small birds in this area. The species cannot be
accurately identified, though from the small size and the amount of trampling in a small area it
is likely that these were made by a flocking bird such as a small wader, or multiple small wader
species.
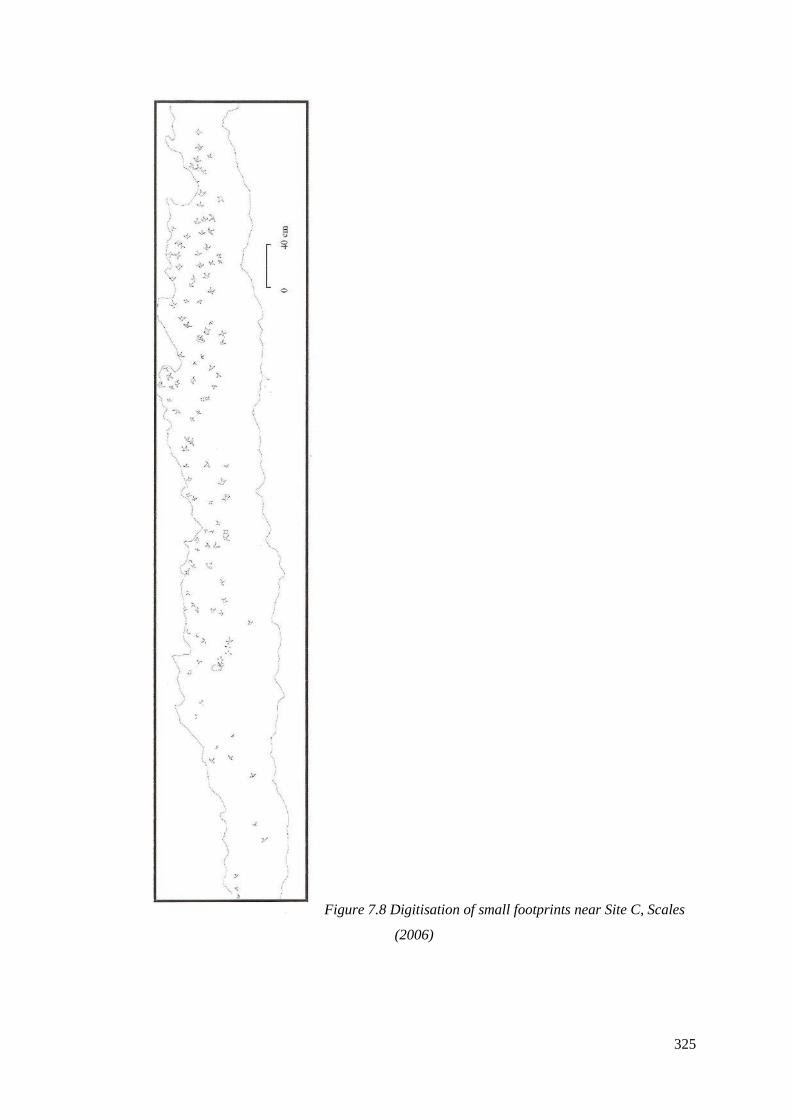
325
Figure 7.8 Digitisation of small footprints near Site C, Scales
(2006)

326
7.5.1 Site C/E
Although Site C and E were previously investigated by Scales (2006), within this study
footprint-tracks were found in areas around both sites rather than directly where finds were
previously recorded. It was therefore decided that the best method of recording was to refer to
Site C and E regarding Scales (2006) work, and to refer to Site C/E in terms of everything
recorded by the writer from 2014-2016, where the site boundaries were less clear. All of the
footprint-tracks at Site C/E were recorded on consolidated banded laminations, on laminated
cliffs exposed through erosion. The areas exposed on Site C/E during 2014-2017 were generally
small patches or strips of the banded sediments below the submarine sand dunes. Further
information regarding Site C/E is provided in Chapter 6.5.
The footprint-tracks preserved at Site C/E were the best examples of bird footprint-tracks at the
site of Goldcliff East. These footprints were generally much better preserved than the human
footprint-tracks during the period of study. Many were footprints as opposed to overtraces or
undertraces (Figure 7.9). Of the 99 bird footprint-tracks recorded at Site C/E, 53 were
considered to be large as they were 10cm or longer (Table 7.3). Within this area footprint-tracks
were found on multiple laminations, indicating an area used yearly by these bird species.
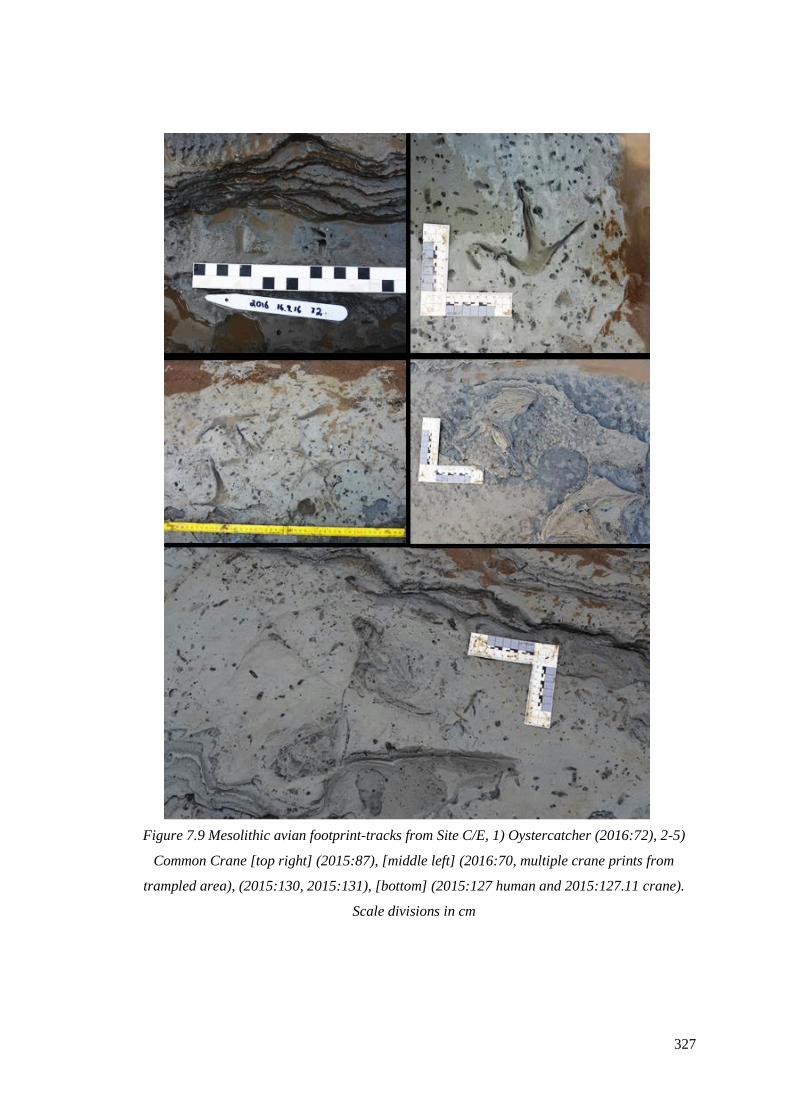
327
Figure 7.9 Mesolithic avian footprint-tracks from Site C/E, 1) Oystercatcher (2016:72), 2-5)
Common Crane [top right] (2015:87), [middle left] (2016:70, multiple crane prints from
trampled area), (2015:130, 2015:131), [bottom] (2015:127 human and 2015:127.11 crane).
Scale divisions in cm
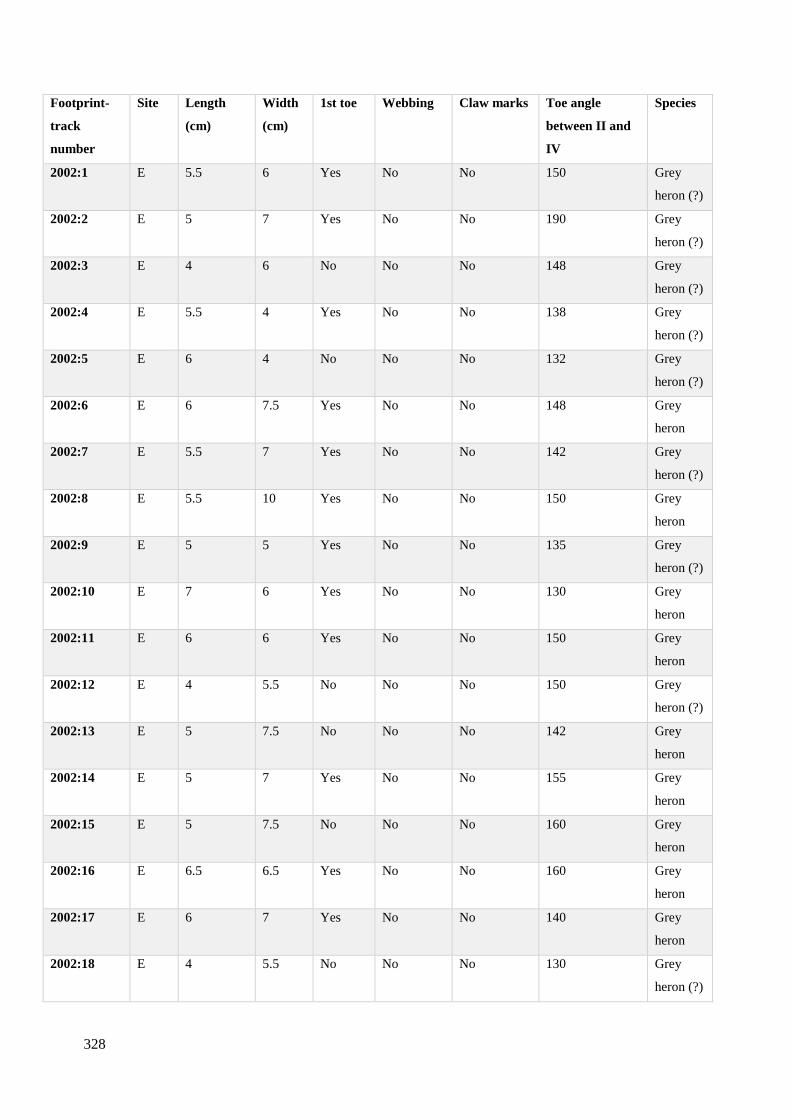
328
Footprint-
track
number
Site Length
(cm)
Width
(cm)
1st toe Webbing Claw marks Toe angle
between II and
IV
Species
2002:1 E 5.5 6 Yes No No 150 Grey
heron (?)
2002:2 E 5 7 Yes No No 190 Grey
heron (?)
2002:3 E 4 6 No No No 148 Grey
heron (?)
2002:4 E 5.5 4 Yes No No 138 Grey
heron (?)
2002:5 E 6 4 No No No 132 Grey
heron (?)
2002:6
E 6 7.5 Yes No No 148 Grey
heron
2002:7 E 5.5 7 Yes No No 142 Grey
heron (?)
2002:8
E 5.5 10 Yes No No 150 Grey
heron
2002:9 E 5 5 Yes No No 135 Grey
heron (?)
2002:10
E 7 6 Yes No No 130 Grey
heron
2002:11
E 6 6 Yes No No 150 Grey
heron
2002:12 E 4 5.5 No No No 150 Grey
heron (?)
2002:13
E 5 7.5 No No No 142 Grey
heron
2002:14
E 5 7 Yes No No 155 Grey
heron
2002:15
E 5 7.5 No No No 160 Grey
heron
2002:16
E 6.5 6.5 Yes No No 160 Grey
heron
2002:17
E 6 7 Yes No No 140 Grey
heron
2002:18
E 4 5.5 No No No 130 Grey
heron (?)
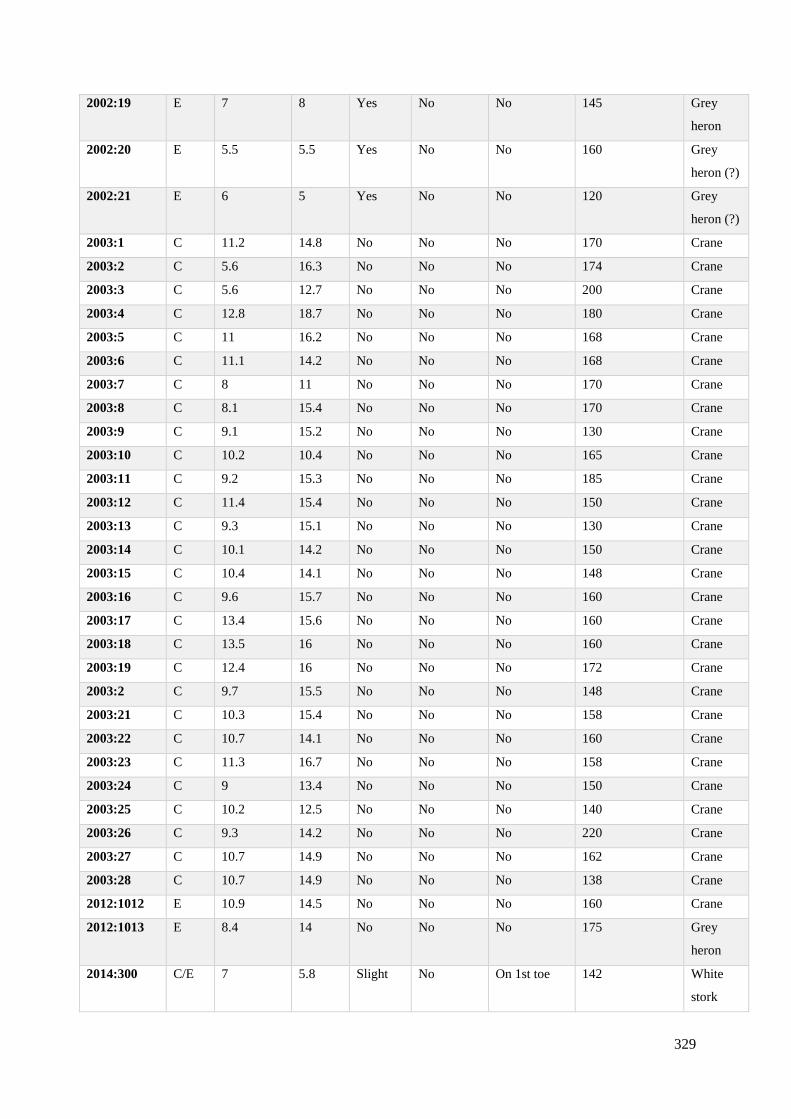
329
2002:19
E 7 8 Yes No No 145 Grey
heron
2002:20
E 5.5 5.5 Yes No No 160 Grey
heron (?)
2002:21 E 6 5 Yes No No 120 Grey
heron (?)
2003:1 C 11.2 14.8 No No No 170 Crane
2003:2 C 5.6 16.3 No No No 174 Crane
2003:3 C 5.6 12.7 No No No 200 Crane
2003:4 C 12.8 18.7 No No No 180 Crane
2003:5 C 11 16.2 No No No 168 Crane
2003:6 C 11.1 14.2 No No No 168 Crane
2003:7 C 8 11 No No No 170 Crane
2003:8 C 8.1 15.4 No No No 170 Crane
2003:9 C 9.1 15.2 No No No 130 Crane
2003:10 C 10.2 10.4 No No No 165 Crane
2003:11 C 9.2 15.3 No No No 185 Crane
2003:12 C 11.4 15.4 No No No 150 Crane
2003:13 C 9.3 15.1 No No No 130 Crane
2003:14 C 10.1 14.2 No No No 150 Crane
2003:15 C 10.4 14.1 No No No 148 Crane
2003:16 C 9.6 15.7 No No No 160 Crane
2003:17 C 13.4 15.6 No No No 160 Crane
2003:18 C 13.5 16 No No No 160 Crane
2003:19 C 12.4 16 No No No 172 Crane
2003:2 C 9.7 15.5 No No No 148 Crane
2003:21 C 10.3 15.4 No No No 158 Crane
2003:22 C 10.7 14.1 No No No 160 Crane
2003:23 C 11.3 16.7 No No No 158 Crane
2003:24 C 9 13.4 No No No 150 Crane
2003:25 C 10.2 12.5 No No No 140 Crane
2003:26 C 9.3 14.2 No No No 220 Crane
2003:27 C 10.7 14.9 No No No 162 Crane
2003:28 C 10.7 14.9 No No No 138 Crane
2012:1012 E 10.9 14.5 No No No 160 Crane
2012:1013 E 8.4 14 No No No 175 Grey
heron
2014:300
C/E 7 5.8 Slight No On 1st toe 142 White
stork

330
2014:301
C/E 5.5 5 Slight No On 1st toe 150 White
stork
2015:55.1 C/E 2.5 2.5 Yes No No 110 Small
wader
(Scolopa
cidae?)
2015:55.2
C/E 7 7 Yes Yes No 140 Grey
heron
2015:87.1 C/E 11 16 No No No 140 Crane
2015:87.2 C/E 12 17 No No No 138 Crane
2015:87.3 C/E 12 13 No No No 140 Crane
2015:90 C/E 12 13.6 No No No 168 Crane
2015:112 C/E 8.2 8 Yes No No 170 Grey
heron
2015:113
C/E 8.5 8.5 Yes Slight No 170 Grey
heron
2015:127.1 C/E 15.2 13.5 Yes No No 155 Crane
2015:127.2 C/E 17.5 17 No No No 150 Crane
2015:127.3 C/E 22 11 No No No 150 Crane
2015:127.4 C/E 20 12 No No No 150 Crane
2015:130.1 C/E 14 12.5 No No No 160 Crane
2015:130.2 C/E 14.3 19 No No No 162 Crane
2015:130.3 C/E 11.7 18 No No No 152 Crane
2015:126.1
C/E 6 7.5 No No No 125 Oyster-
catcher
2015:avian
C/E 6 7.5 Yes No No 140 Grey
heron
2015:129.1
C/E 9 5.6 No No No 130 Oyster-
catcher
2015:131
C/E 7.6 6.2 No No No 170 Oyster-
catcher
2015:132.1 C/E 14.4 12.5 No No No 168 Crane
2015:132.2 C/E 14 18.5 No No No 155 Crane
2015:132.3 C/E 12 18 No No No 140 Crane
2015:132.4 C/E 14 13 No No No 150 Crane
2015:148.1 C/E 12 16 No No No 175 Crane
2016:70.1 C/E 16.5 15 Slight No No 160 Crane
2016:70.2 C/E 15 15.4 Slight No No 160 Crane
2016:70.3 C/E 14.2 14.5 Slight No No 168 Crane
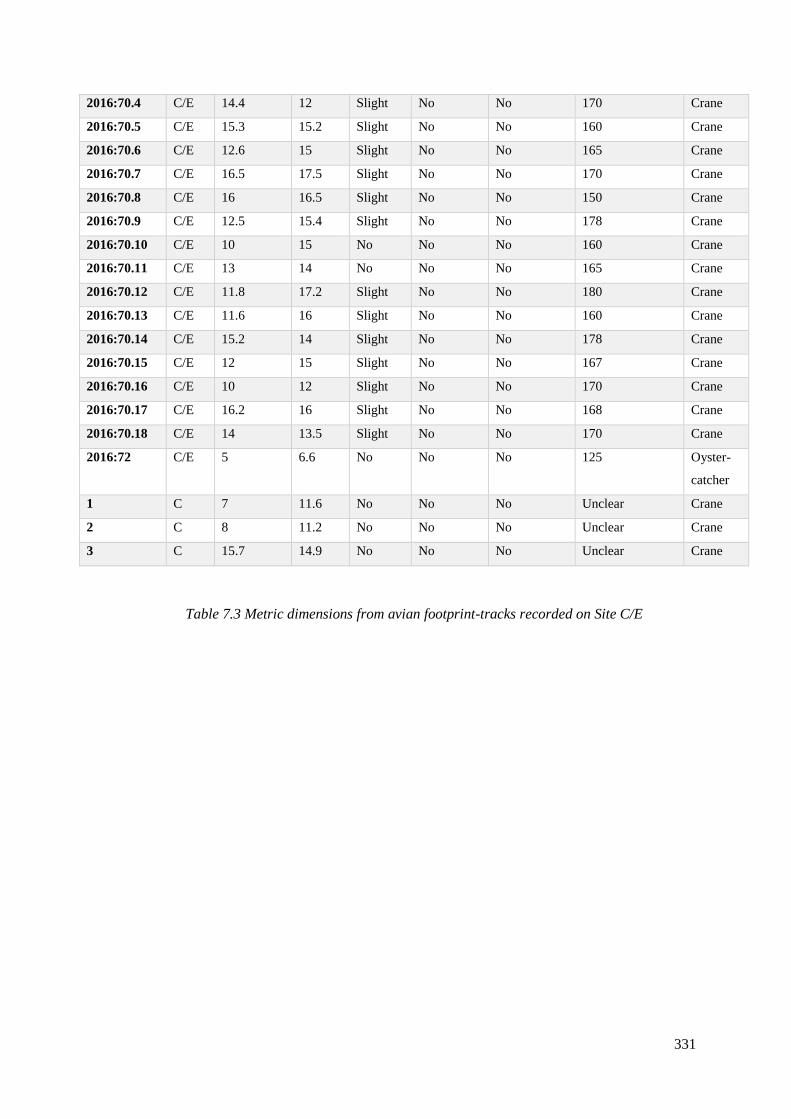
331
2016:70.4 C/E 14.4 12 Slight No No 170 Crane
2016:70.5 C/E 15.3 15.2 Slight No No 160 Crane
2016:70.6 C/E 12.6 15 Slight No No 165 Crane
2016:70.7 C/E 16.5 17.5 Slight No No 170 Crane
2016:70.8 C/E 16 16.5 Slight No No 150 Crane
2016:70.9 C/E 12.5 15.4 Slight No No 178 Crane
2016:70.10 C/E 10 15 No No No 160 Crane
2016:70.11 C/E 13 14 No No No 165 Crane
2016:70.12 C/E 11.8 17.2 Slight No No 180 Crane
2016:70.13 C/E 11.6 16 Slight No No 160 Crane
2016:70.14 C/E 15.2 14 Slight No No 178 Crane
2016:70.15 C/E 12 15 Slight No No 167 Crane
2016:70.16 C/E 10 12 Slight No No 170 Crane
2016:70.17 C/E 16.2 16 Slight No No 168 Crane
2016:70.18 C/E 14 13.5 Slight No No 170 Crane
2016:72
C/E 5 6.6 No No No 125 Oyster-
catcher
1 C 7 11.6 No No No Unclear Crane
2 C 8 11.2 No No No Unclear Crane
3 C 15.7 14.9 No No No Unclear Crane
Table 7.3 Metric dimensions from avian footprint-tracks recorded on Site C/E
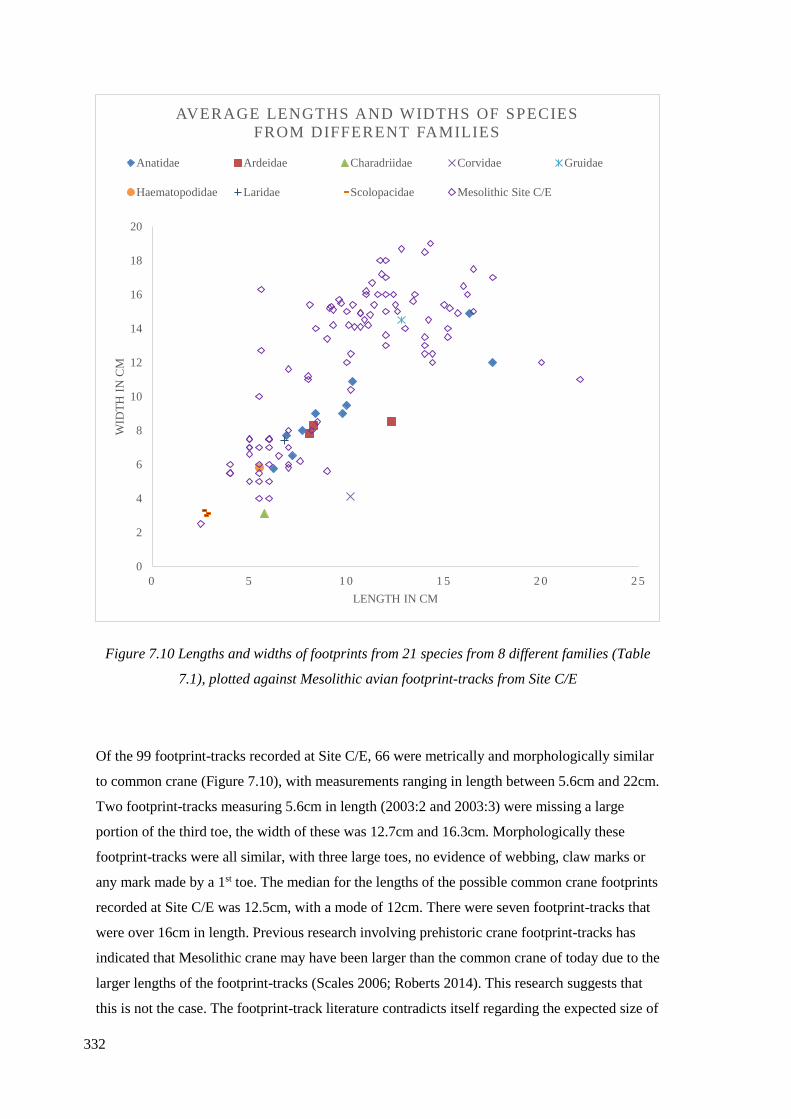
332
Figure 7.10 Lengths and widths of footprints from 21 species from 8 different families (Table
7.1), plotted against Mesolithic avian footprint-tracks from Site C/E
Of the 99 footprint-tracks recorded at Site C/E, 66 were metrically and morphologically similar
to common crane (Figure 7.10), with measurements ranging in length between 5.6cm and 22cm.
Two footprint-tracks measuring 5.6cm in length (2003:2 and 2003:3) were missing a large
portion of the third toe, the width of these was 12.7cm and 16.3cm. Morphologically these
footprint-tracks were all similar, with three large toes, no evidence of webbing, claw marks or
any mark made by a 1st toe. The median for the lengths of the possible common crane footprints
recorded at Site C/E was 12.5cm, with a mode of 12cm. There were seven footprint-tracks that
were over 16cm in length. Previous research involving prehistoric crane footprint-tracks has
indicated that Mesolithic crane may have been larger than the common crane of today due to the
larger lengths of the footprint-tracks (Scales 2006; Roberts 2014). This research suggests that
this is not the case. The footprint-track literature contradicts itself regarding the expected size of
0
2
4
6
8
10
12
14
16
18
20
0 5 1 0 1 5 2 0 2 5
WID
TH
IN
CM
LENGTH IN CM
AVERAGE LENGTHS AND WIDTHS OF SPECIES
FROM DIFFERENT FAMILIES
Anatidae Ardeidae Charadriidae Corvidae Gruidae
Haematopodidae Laridae Scolopacidae Mesolithic Site C/E
333
a common crane footprint. Certain texts describe the common crane footprint as similar in size
and length to a grey heron, approximately 8cm in length, although without a 1st toe (Bang and
Dahlstrom 1974). Others noted that the common crane footprint can be up to 16cm in length,
18cm in width and with a 3rd toe that can be as long as 11cm (Brown et al. 1987). If we accept
Brown et al.’s (1987) common crane metric measurements, along with the results of the
experimental research, where the average crane footprint-track was 12.8cm in length and
14.5cm in width, it is apparent that the birds found in Site C/E, all sharing the same shape and
features (Figure 7.9 2-5), are from the common crane species. Though there were seven
footprint-tracks that were morphologically similar to common crane, but longer than 16cm, so
these may have been particularly large common crane, or a larger crane species.
Footprint-tracks 2015:87(1-3) were some of the best preserved avian footprint-tracks recorded
during the fieldwork period. These were the actual footprint or a very slight undertrace, and had
not been infilled with silt. Figure 7.11 shows the quality of the footprints; there appeared to be
no evident trail, leading to the conclusion that one or several birds had walked across the
lamination multiple times. These footprint-tracks were recorded with multi-image
photogrammetry and could then be compared against models made of modern bird footprints
for a comparison. Figure 7.12 shows footprint-tracks 2015:87(1-3) compared to footprints made
by modern common crane in mud. These footprints are all clearly made by a large bird species
that does not leave a 1st toe impression, even when walking in wet mud substrate. Tracings of
modern common crane footprints demonstrate the general shape of this species’ footprint
(Figure 7.13), though the toe spread will be variable depending on sediment. Tracings of
Mesolithic avian footprints thought to be crane demonstrate that there are some features that are
slightly different (Figure 7.14, Figure 7.15). The width of the toes is narrower in modern crane;
this difference may be explained by the way in which the prehistoric footprints were preserved,
or the differences in the sediments walked upon.
Figure 7.16 is a footprint made by a modern crane walking upon estuarine sediment within the
footprint trap. The toes are less spread than the toes of the same bird walking upon a muddy
area (Figure 7.13), this print also has a very pronounced metatarsal pad. Figure 7.17, a
Mesolithic crane footprint-track, has a slightly wider toe spread than the modern footprint; this
footprint is the only preserved Mesolithic crane print to also exhibit a metatarsal pad
indentation. Experimental work found that when walking on softer sediment, common crane
will spread their toes wider to enable a safer footing. The footprints shown in Figure 7.13 had a
slightly wider toe spread than those seen in Figure 7.16, even though they were made by the
same bird. This, along with the evidence of a 1st toe, indicates that the sediment walked upon by
the prehistoric crane was either wet or soft.
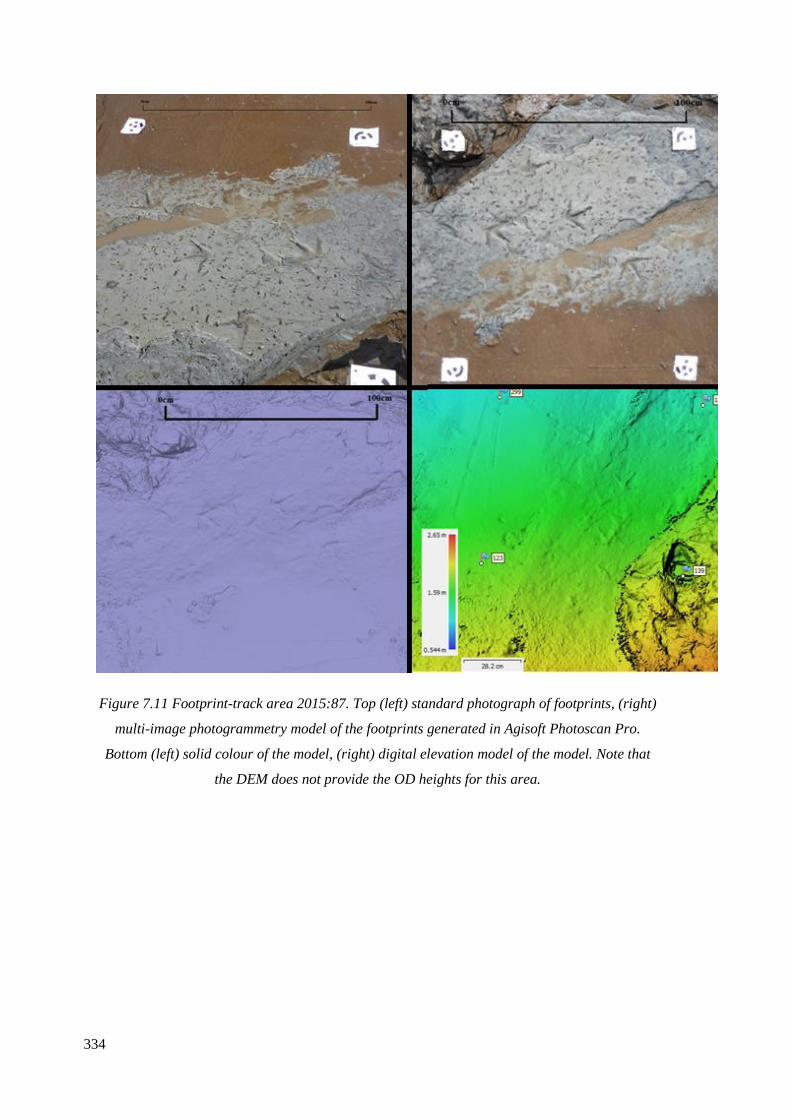
334
Figure 7.11 Footprint-track area 2015:87. Top (left) standard photograph of footprints, (right)
multi-image photogrammetry model of the footprints generated in Agisoft Photoscan Pro.
Bottom (left) solid colour of the model, (right) digital elevation model of the model. Note that
the DEM does not provide the OD heights for this area.
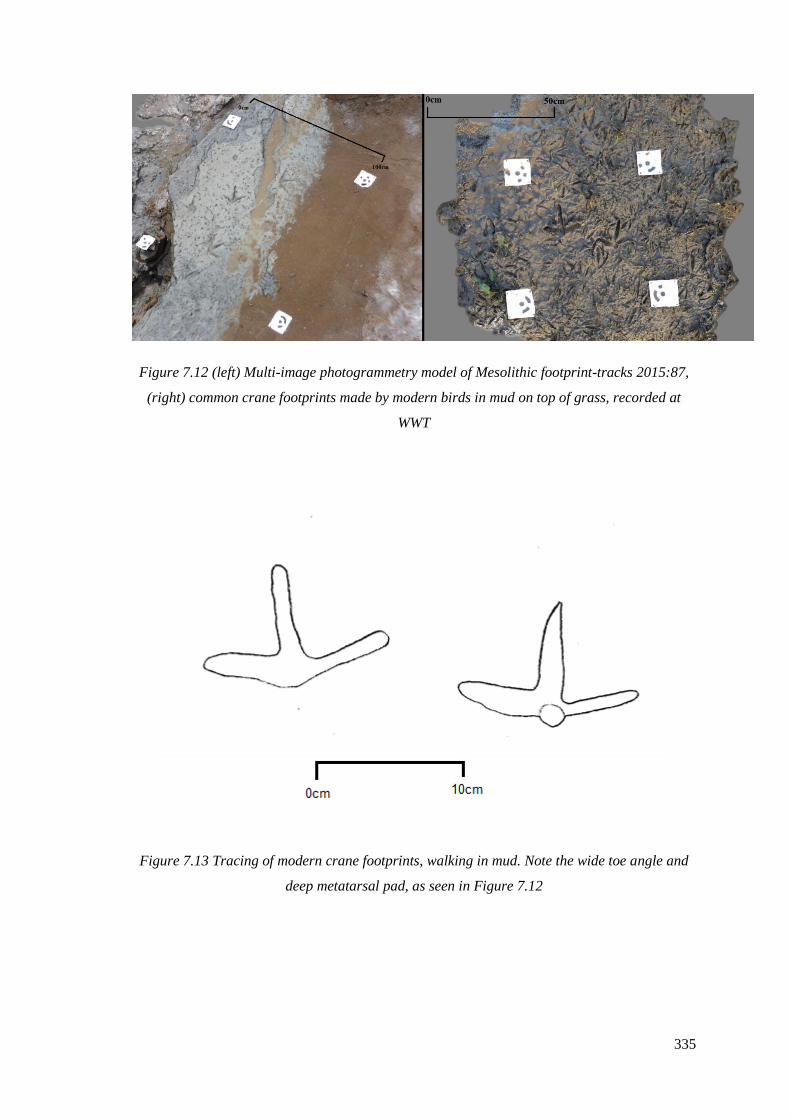
335
Figure 7.12 (left) Multi-image photogrammetry model of Mesolithic footprint-tracks 2015:87,
(right) common crane footprints made by modern birds in mud on top of grass, recorded at
WWT
Figure 7.13 Tracing of modern crane footprints, walking in mud. Note the wide toe angle and
deep metatarsal pad, as seen in Figure 7.12
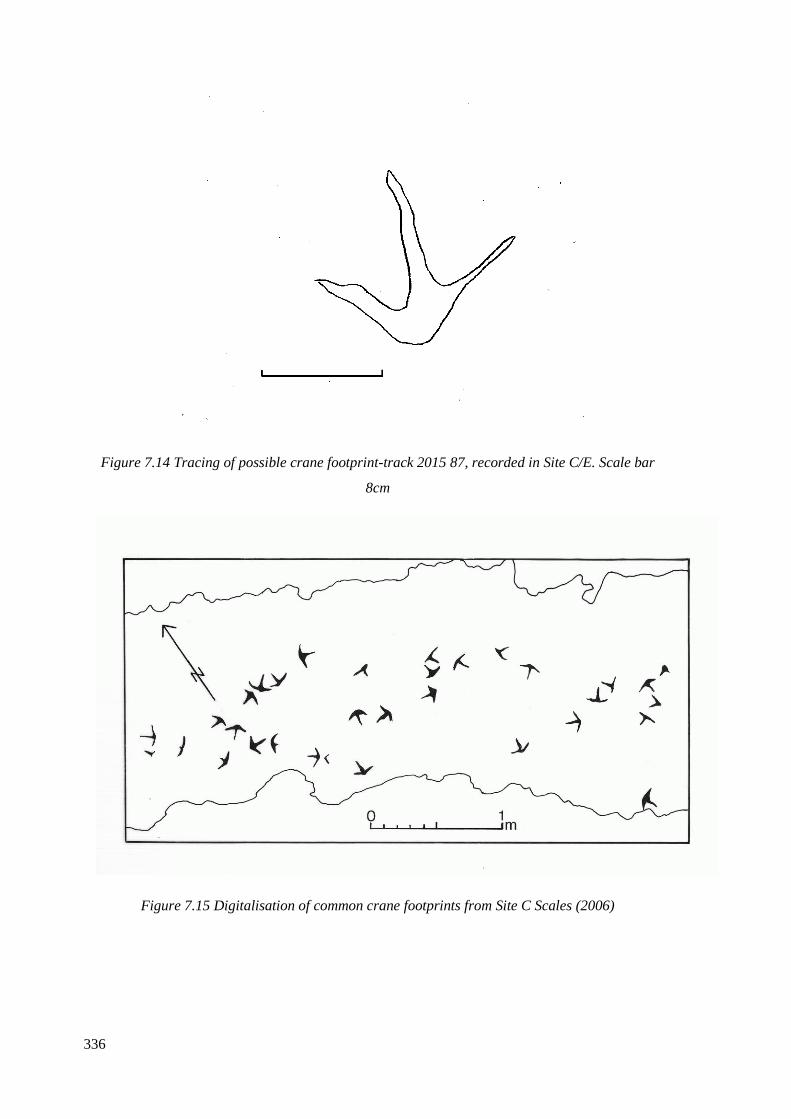
336
Figure 7.14 Tracing of possible crane footprint-track 2015 87, recorded in Site C/E. Scale bar
8cm
Figure 7.15 Digitalisation of common crane footprints from Site C Scales (2006)
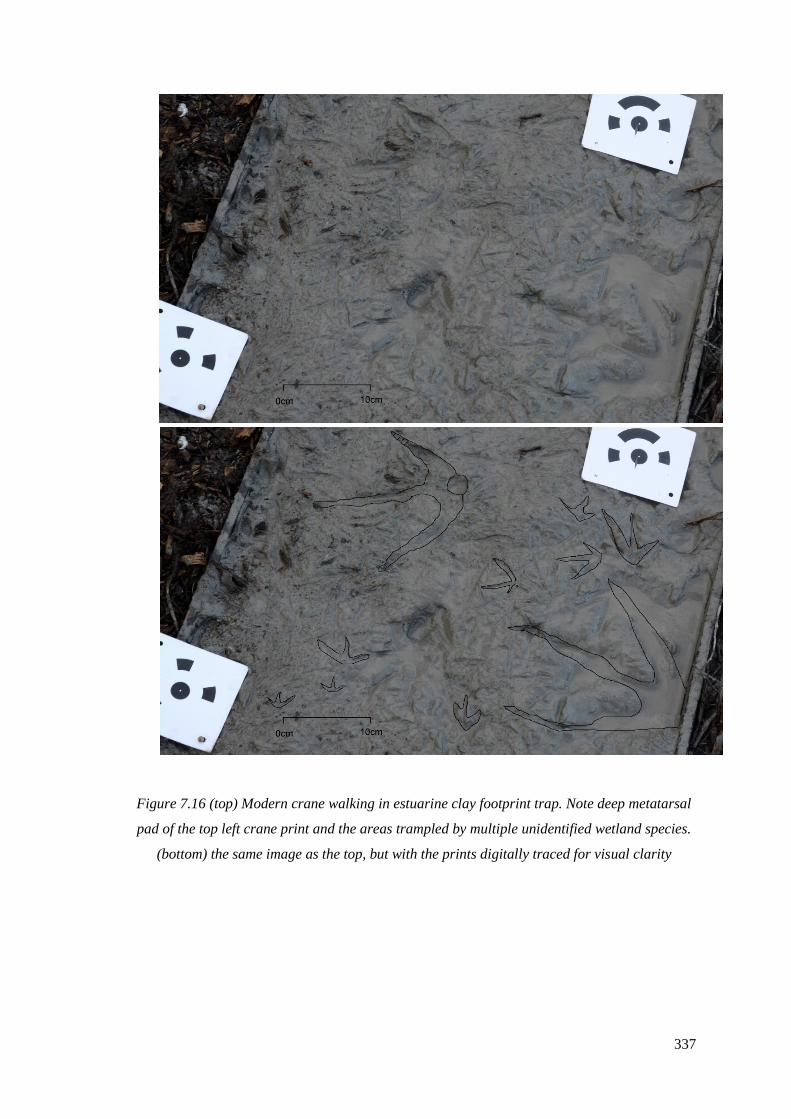
337
Figure 7.16 (top) Modern crane walking in estuarine clay footprint trap. Note deep metatarsal
pad of the top left crane print and the areas trampled by multiple unidentified wetland species.
(bottom) the same image as the top, but with the prints digitally traced for visual clarity
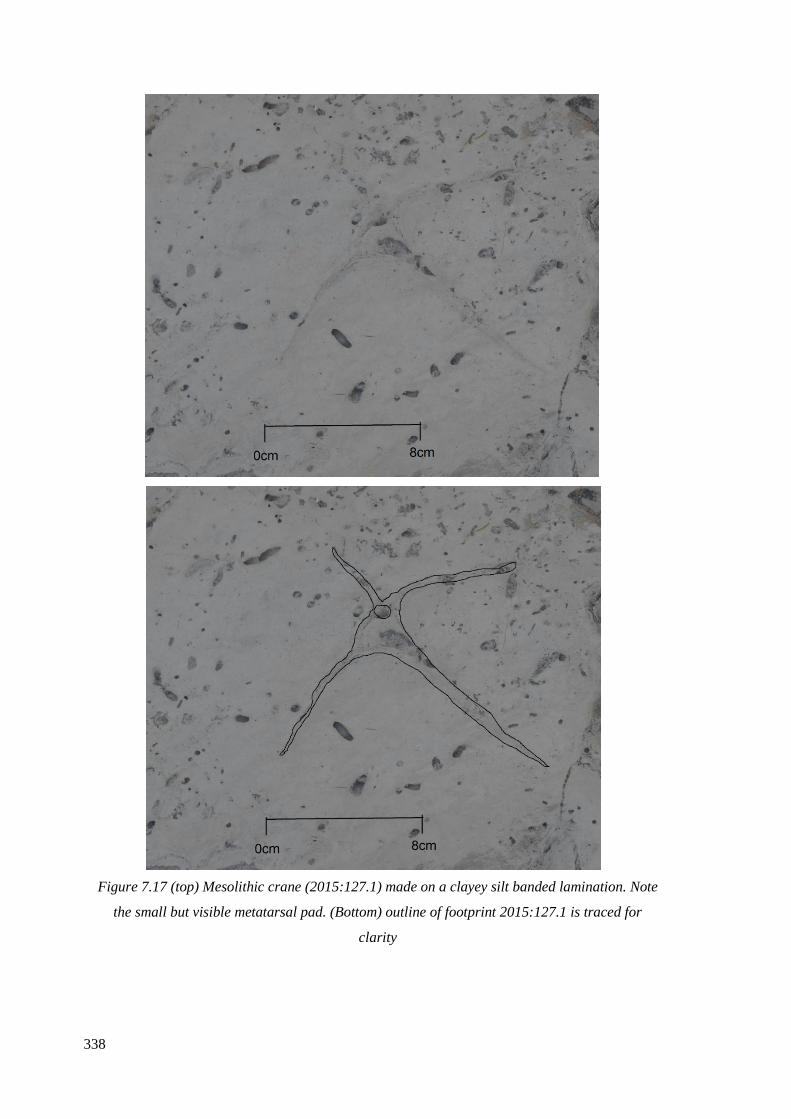
338
Figure 7.17 (top) Mesolithic crane (2015:127.1) made on a clayey silt banded lamination. Note
the small but visible metatarsal pad. (Bottom) outline of footprint 2015:127.1 is traced for
clarity
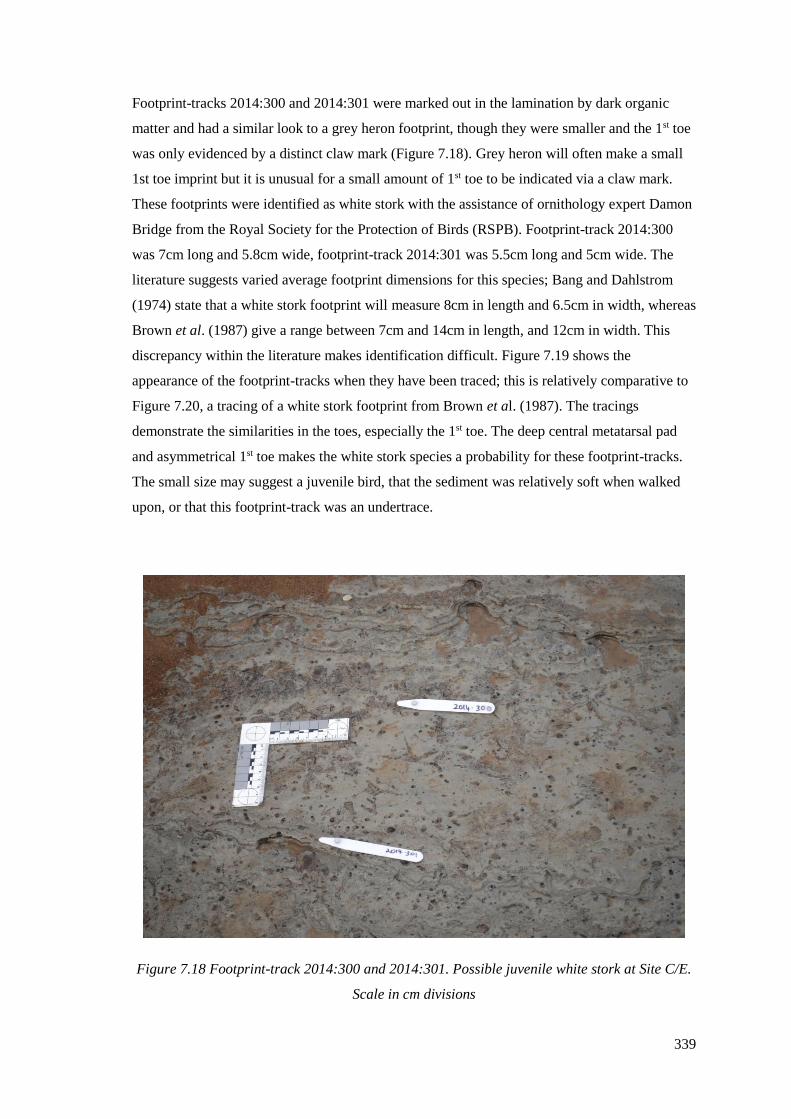
339
Footprint-tracks 2014:300 and 2014:301 were marked out in the lamination by dark organic
matter and had a similar look to a grey heron footprint, though they were smaller and the 1st toe
was only evidenced by a distinct claw mark (Figure 7.18). Grey heron will often make a small
1st toe imprint but it is unusual for a small amount of 1st toe to be indicated via a claw mark.
These footprints were identified as white stork with the assistance of ornithology expert Damon
Bridge from the Royal Society for the Protection of Birds (RSPB). Footprint-track 2014:300
was 7cm long and 5.8cm wide, footprint-track 2014:301 was 5.5cm long and 5cm wide. The
literature suggests varied average footprint dimensions for this species; Bang and Dahlstrom
(1974) state that a white stork footprint will measure 8cm in length and 6.5cm in width, whereas
Brown et al. (1987) give a range between 7cm and 14cm in length, and 12cm in width. This
discrepancy within the literature makes identification difficult. Figure 7.19 shows the
appearance of the footprint-tracks when they have been traced; this is relatively comparative to
Figure 7.20, a tracing of a white stork footprint from Brown et al. (1987). The tracings
demonstrate the similarities in the toes, especially the 1st toe. The deep central metatarsal pad
and asymmetrical 1st toe makes the white stork species a probability for these footprint-tracks.
The small size may suggest a juvenile bird, that the sediment was relatively soft when walked
upon, or that this footprint-track was an undertrace.
Figure 7.18 Footprint-track 2014:300 and 2014:301. Possible juvenile white stork at Site C/E.
Scale in cm divisions
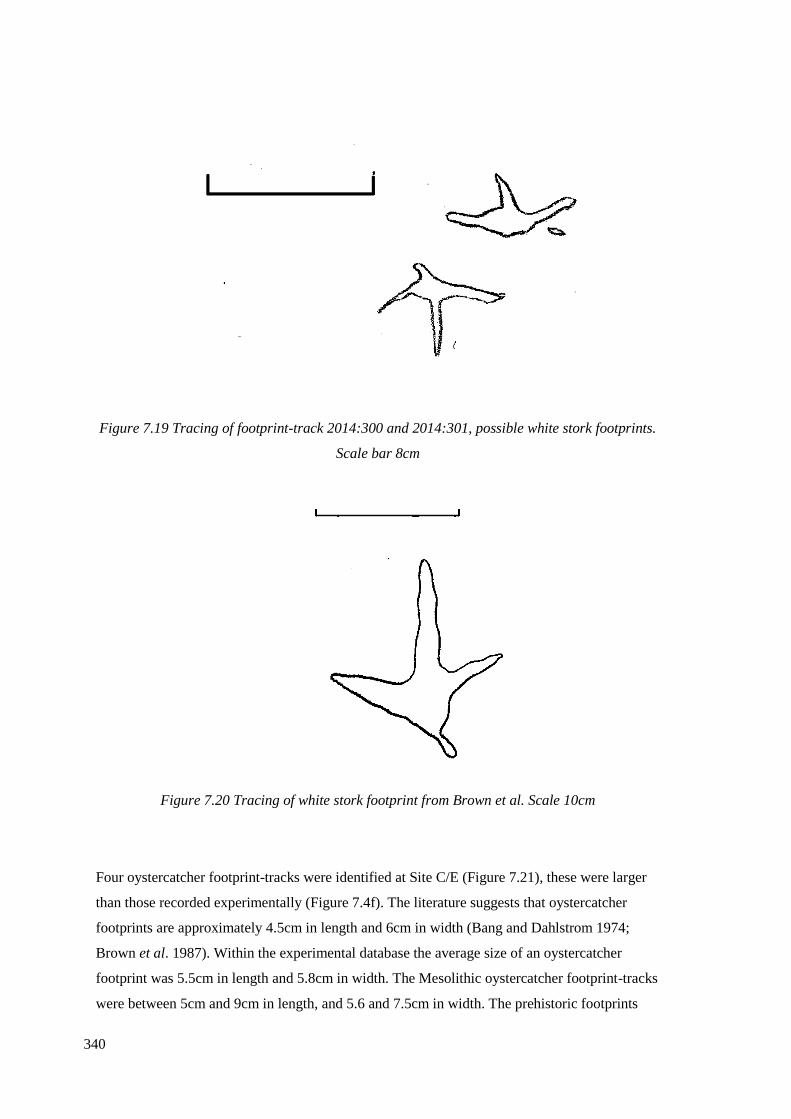
340
Figure 7.19 Tracing of footprint-track 2014:300 and 2014:301, possible white stork footprints.
Scale bar 8cm
Figure 7.20 Tracing of white stork footprint from Brown et al. Scale 10cm
Four oystercatcher footprint-tracks were identified at Site C/E (Figure 7.21), these were larger
than those recorded experimentally (Figure 7.4f). The literature suggests that oystercatcher
footprints are approximately 4.5cm in length and 6cm in width (Bang and Dahlstrom 1974;
Brown et al. 1987). Within the experimental database the average size of an oystercatcher
footprint was 5.5cm in length and 5.8cm in width. The Mesolithic oystercatcher footprint-tracks
were between 5cm and 9cm in length, and 5.6 and 7.5cm in width. The prehistoric footprints
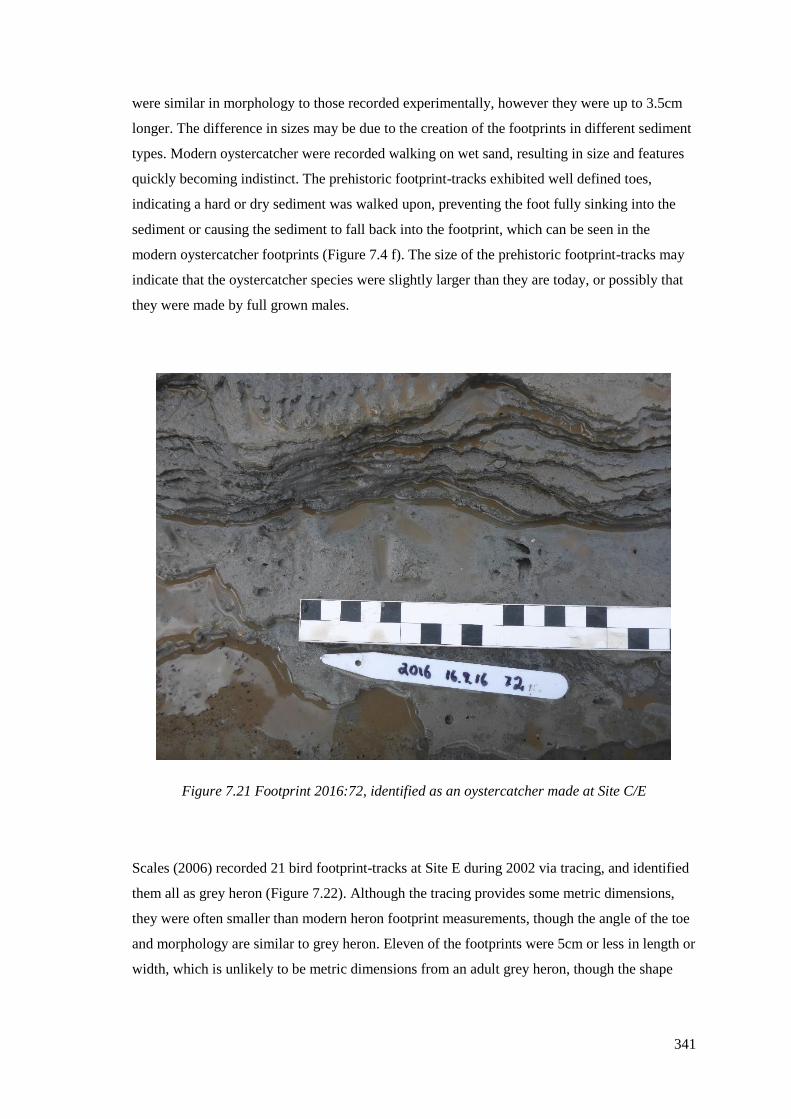
341
were similar in morphology to those recorded experimentally, however they were up to 3.5cm
longer. The difference in sizes may be due to the creation of the footprints in different sediment
types. Modern oystercatcher were recorded walking on wet sand, resulting in size and features
quickly becoming indistinct. The prehistoric footprint-tracks exhibited well defined toes,
indicating a hard or dry sediment was walked upon, preventing the foot fully sinking into the
sediment or causing the sediment to fall back into the footprint, which can be seen in the
modern oystercatcher footprints (Figure 7.4 f). The size of the prehistoric footprint-tracks may
indicate that the oystercatcher species were slightly larger than they are today, or possibly that
they were made by full grown males.
Figure 7.21 Footprint 2016:72, identified as an oystercatcher made at Site C/E
Scales (2006) recorded 21 bird footprint-tracks at Site E during 2002 via tracing, and identified
them all as grey heron (Figure 7.22). Although the tracing provides some metric dimensions,
they were often smaller than modern heron footprint measurements, though the angle of the toe
and morphology are similar to grey heron. Eleven of the footprints were 5cm or less in length or
width, which is unlikely to be metric dimensions from an adult grey heron, though the shape
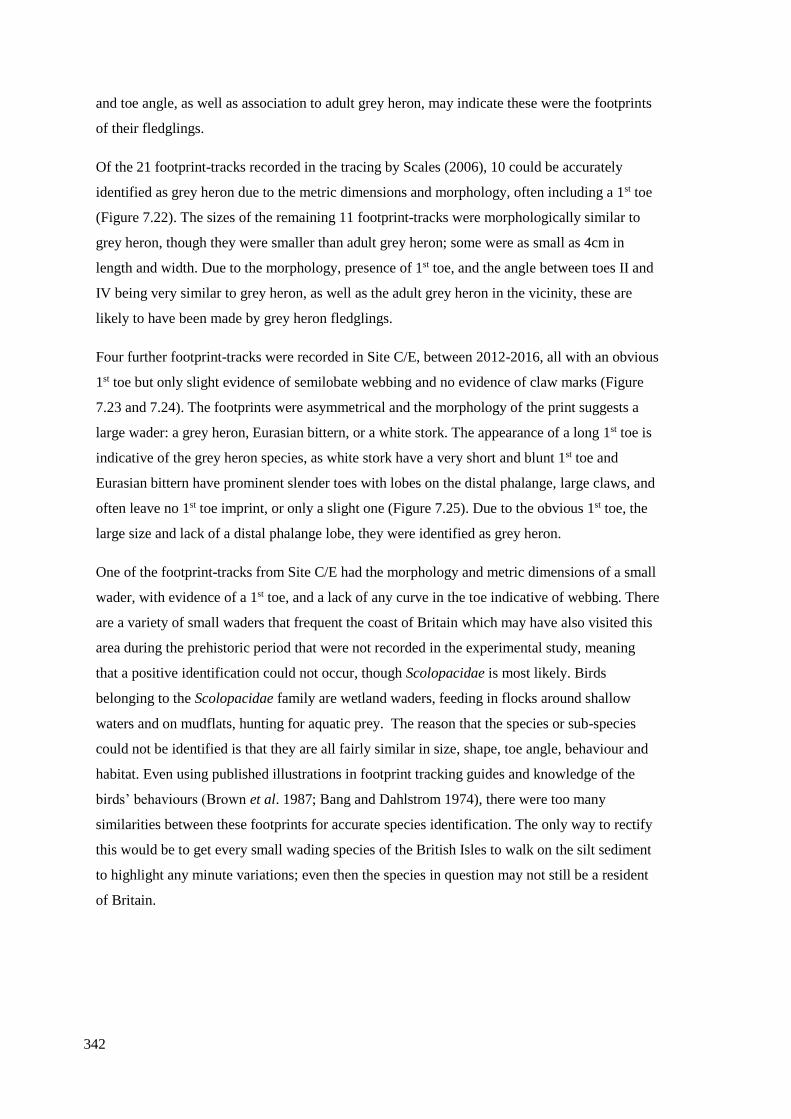
342
and toe angle, as well as association to adult grey heron, may indicate these were the footprints
of their fledglings.
Of the 21 footprint-tracks recorded in the tracing by Scales (2006), 10 could be accurately
identified as grey heron due to the metric dimensions and morphology, often including a 1st toe
(Figure 7.22). The sizes of the remaining 11 footprint-tracks were morphologically similar to
grey heron, though they were smaller than adult grey heron; some were as small as 4cm in
length and width. Due to the morphology, presence of 1st toe, and the angle between toes II and
IV being very similar to grey heron, as well as the adult grey heron in the vicinity, these are
likely to have been made by grey heron fledglings.
Four further footprint-tracks were recorded in Site C/E, between 2012-2016, all with an obvious
1st toe but only slight evidence of semilobate webbing and no evidence of claw marks (Figure
7.23 and 7.24). The footprints were asymmetrical and the morphology of the print suggests a
large wader: a grey heron, Eurasian bittern, or a white stork. The appearance of a long 1st toe is
indicative of the grey heron species, as white stork have a very short and blunt 1st toe and
Eurasian bittern have prominent slender toes with lobes on the distal phalange, large claws, and
often leave no 1st toe imprint, or only a slight one (Figure 7.25). Due to the obvious 1st toe, the
large size and lack of a distal phalange lobe, they were identified as grey heron.
One of the footprint-tracks from Site C/E had the morphology and metric dimensions of a small
wader, with evidence of a 1st toe, and a lack of any curve in the toe indicative of webbing. There
are a variety of small waders that frequent the coast of Britain which may have also visited this
area during the prehistoric period that were not recorded in the experimental study, meaning
that a positive identification could not occur, though Scolopacidae is most likely. Birds
belonging to the Scolopacidae family are wetland waders, feeding in flocks around shallow
waters and on mudflats, hunting for aquatic prey. The reason that the species or sub-species
could not be identified is that they are all fairly similar in size, shape, toe angle, behaviour and
habitat. Even using published illustrations in footprint tracking guides and knowledge of the
birds’ behaviours (Brown et al. 1987; Bang and Dahlstrom 1974), there were too many
similarities between these footprints for accurate species identification. The only way to rectify
this would be to get every small wading species of the British Isles to walk on the silt sediment
to highlight any minute variations; even then the species in question may not still be a resident
of Britain.

343
Figure 7.22 Footprints recorded by Scales (2006), possible Grey heron, Site E
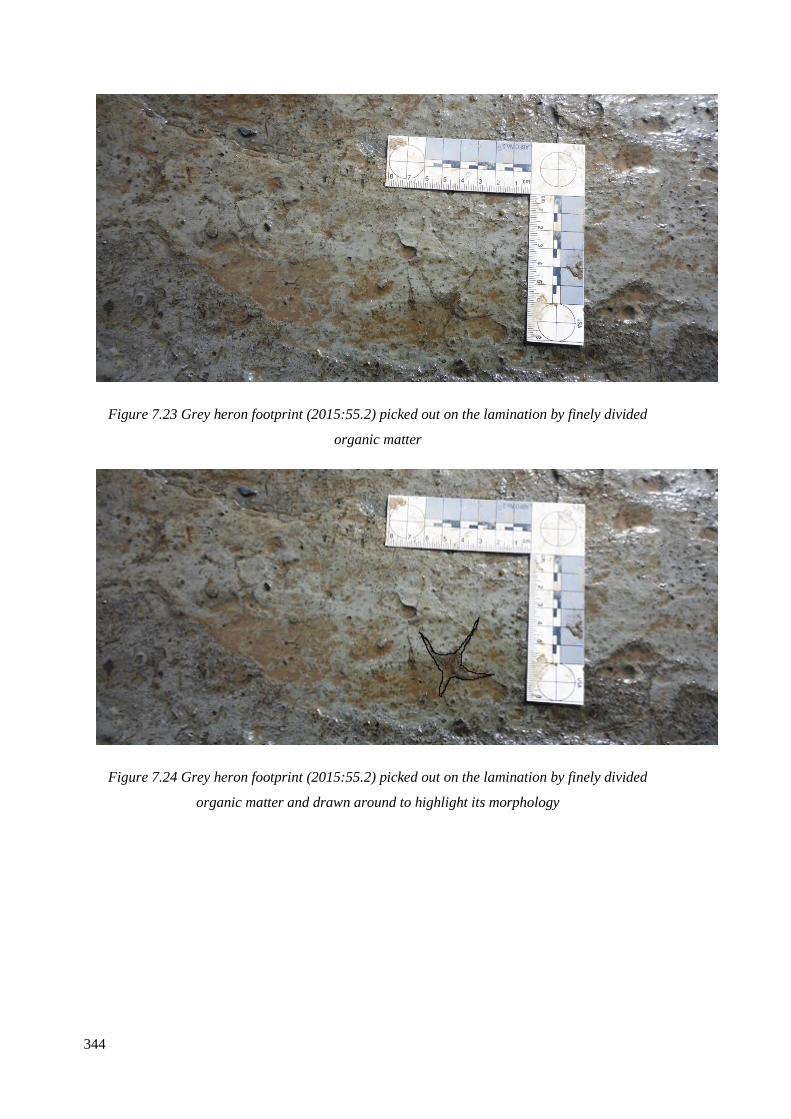
344
Figure 7.23 Grey heron footprint (2015:55.2) picked out on the lamination by finely divided
organic matter
Figure 7.24 Grey heron footprint (2015:55.2) picked out on the lamination by finely divided
organic matter and drawn around to highlight its morphology
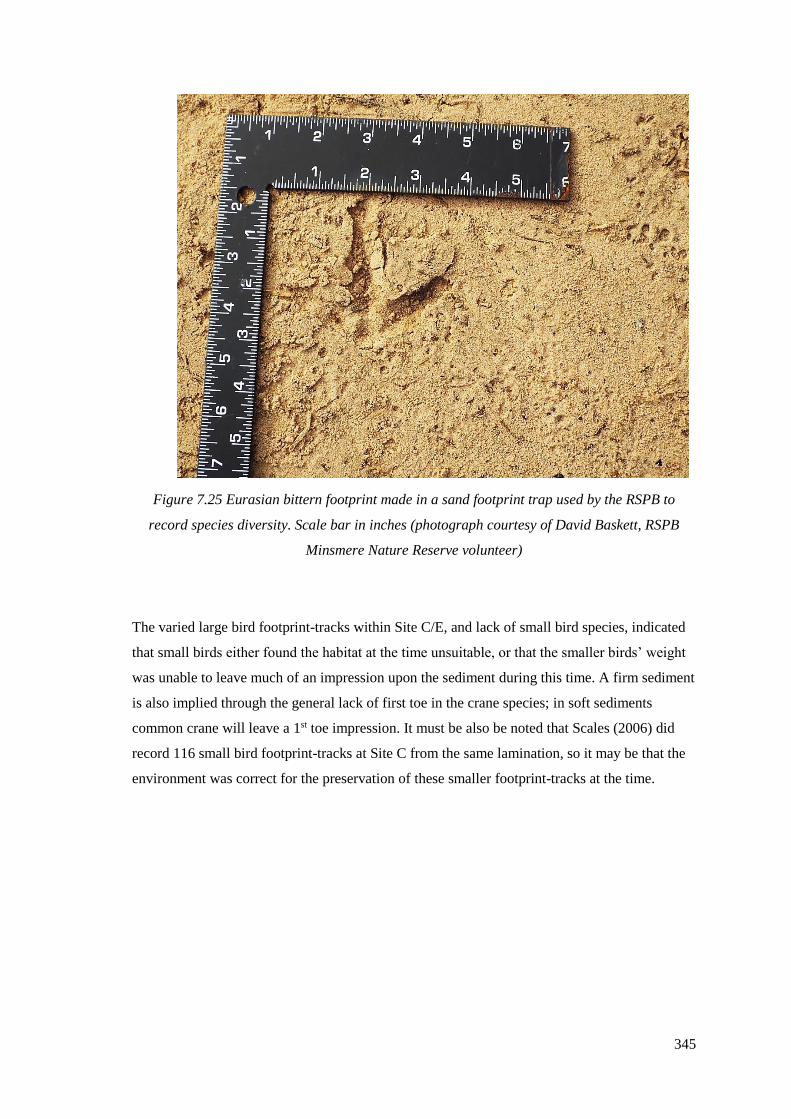
345
Figure 7.25 Eurasian bittern footprint made in a sand footprint trap used by the RSPB to
record species diversity. Scale bar in inches (photograph courtesy of David Baskett, RSPB
Minsmere Nature Reserve volunteer)
The varied large bird footprint-tracks within Site C/E, and lack of small bird species, indicated
that small birds either found the habitat at the time unsuitable, or that the smaller birds’ weight
was unable to leave much of an impression upon the sediment during this time. A firm sediment
is also implied through the general lack of first toe in the crane species; in soft sediments
common crane will leave a 1st toe impression. It must be also be noted that Scales (2006) did
record 116 small bird footprint-tracks at Site C from the same lamination, so it may be that the
environment was correct for the preservation of these smaller footprint-tracks at the time.
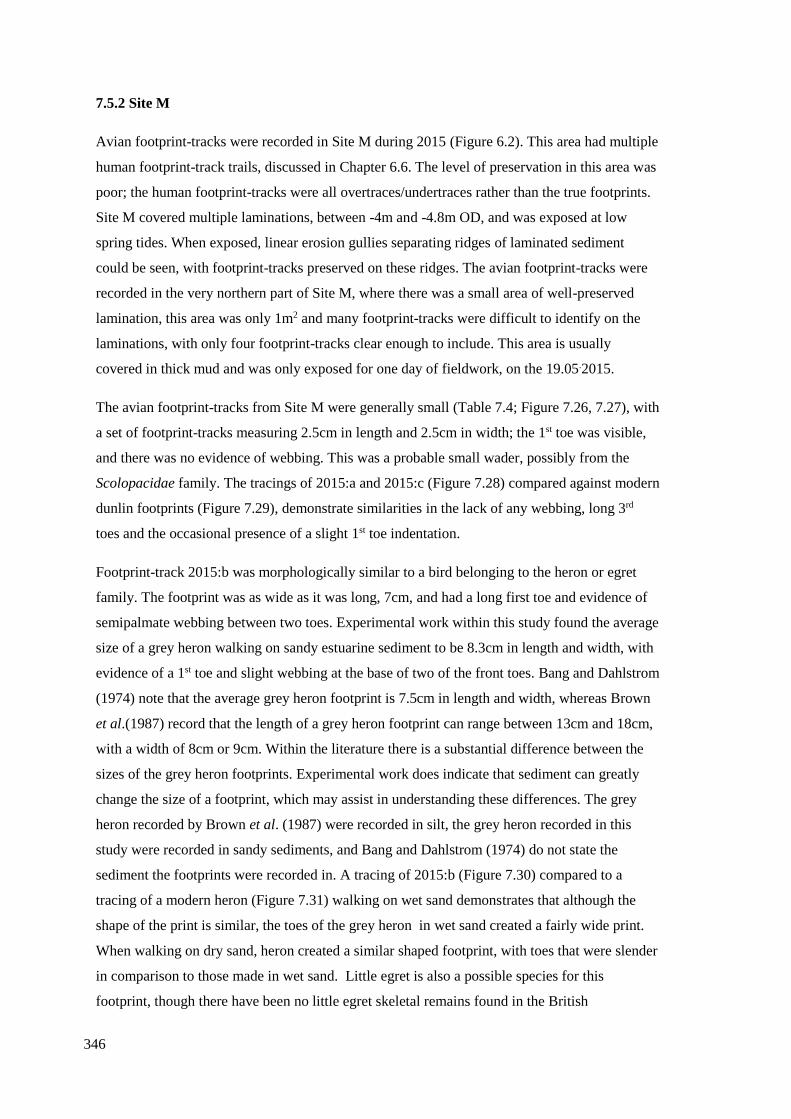
346
7.5.2 Site M
Avian footprint-tracks were recorded in Site M during 2015 (Figure 6.2). This area had multiple
human footprint-track trails, discussed in Chapter 6.6. The level of preservation in this area was
poor; the human footprint-tracks were all overtraces/undertraces rather than the true footprints.
Site M covered multiple laminations, between -4m and -4.8m OD, and was exposed at low
spring tides. When exposed, linear erosion gullies separating ridges of laminated sediment
could be seen, with footprint-tracks preserved on these ridges. The avian footprint-tracks were
recorded in the very northern part of Site M, where there was a small area of well-preserved
lamination, this area was only 1m2 and many footprint-tracks were difficult to identify on the
laminations, with only four footprint-tracks clear enough to include. This area is usually
covered in thick mud and was only exposed for one day of fieldwork, on the 19.05.2015.
The avian footprint-tracks from Site M were generally small (Table 7.4; Figure 7.26, 7.27), with
a set of footprint-tracks measuring 2.5cm in length and 2.5cm in width; the 1st toe was visible,
and there was no evidence of webbing. This was a probable small wader, possibly from the
Scolopacidae family. The tracings of 2015:a and 2015:c (Figure 7.28) compared against modern
dunlin footprints (Figure 7.29), demonstrate similarities in the lack of any webbing, long 3rd
toes and the occasional presence of a slight 1st toe indentation.
Footprint-track 2015:b was morphologically similar to a bird belonging to the heron or egret
family. The footprint was as wide as it was long, 7cm, and had a long first toe and evidence of
semipalmate webbing between two toes. Experimental work within this study found the average
size of a grey heron walking on sandy estuarine sediment to be 8.3cm in length and width, with
evidence of a 1st toe and slight webbing at the base of two of the front toes. Bang and Dahlstrom
(1974) note that the average grey heron footprint is 7.5cm in length and width, whereas Brown
et al.(1987) record that the length of a grey heron footprint can range between 13cm and 18cm,
with a width of 8cm or 9cm. Within the literature there is a substantial difference between the
sizes of the grey heron footprints. Experimental work does indicate that sediment can greatly
change the size of a footprint, which may assist in understanding these differences. The grey
heron recorded by Brown et al. (1987) were recorded in silt, the grey heron recorded in this
study were recorded in sandy sediments, and Bang and Dahlstrom (1974) do not state the
sediment the footprints were recorded in. A tracing of 2015:b (Figure 7.30) compared to a
tracing of a modern heron (Figure 7.31) walking on wet sand demonstrates that although the
shape of the print is similar, the toes of the grey heron in wet sand created a fairly wide print.
When walking on dry sand, heron created a similar shaped footprint, with toes that were slender
in comparison to those made in wet sand. Little egret is also a possible species for this
footprint, though there have been no little egret skeletal remains found in the British
347
archaeological record (Yalden & Albarella 2009, pg 90), and there have only been regular
sightings of this species in Britain since 1989 (Lock and Cook 1998), suggesting that it is
improbable that they were present in Britain during prehistory.
Footprint-track 2015:53.a was made by a web-footed species (Figure 7.27). The dimensions and
morphology suggest it comes from either the Laridae or the Anatidae family, though due to the
very small metatarsal pad, a feature not exhibited by either of these species, positive
identification was not possible. This footprint-track is currently unidentifiable until the
formation of web-footed birds on different sediments has been more thoroughly explored.
The poor preservation of laminations in Site M has resulted in only a small area with evidence
of bird activity. Within this small 1m2 area, there were at least two different species present at a
relatively similar time.
Footprint-
track
number
Site Length
of print
(cm)
Width
of
(cm)
1st
toe
visible
Webbing
visible
Claw
marks
Toe
angle
between
II and
IV
Species
2015:a M 2.5 2.5 Yes No No 110 Small wader
(Scolopacidae?)
2015:b M 7 7 Yes Yes No 142 Grey heron
2015:c M 2.5 2.5 Yes No No 110 Small wader
(Scolopacidae?)
2015:53.a M 5.3 5 No Yes No 130 Unidentified
Table 7.4 Metric dimensions of avian footprints recorded on Site M

348
Figure 7.26, Avian footprint-tracks from Site M compared against lengths and widths of 21
species within 8 families recorded from modern birds (Table 7.1)
0
2
4
6
8
10
12
14
16
0 2 4 6 8 10 12 14 16 18 20
WID
TH
IN
CM
LENGTH IN CM
AVERAGE LENGTHS AND WIDTHS OF SPECIES FROM
DIFFERENT FAMILIES
Anatidae Ardeidae Charadriidae Corvidae Gruidae
Haematopodidae Laridae Scolopacidae Mesolithic Site M
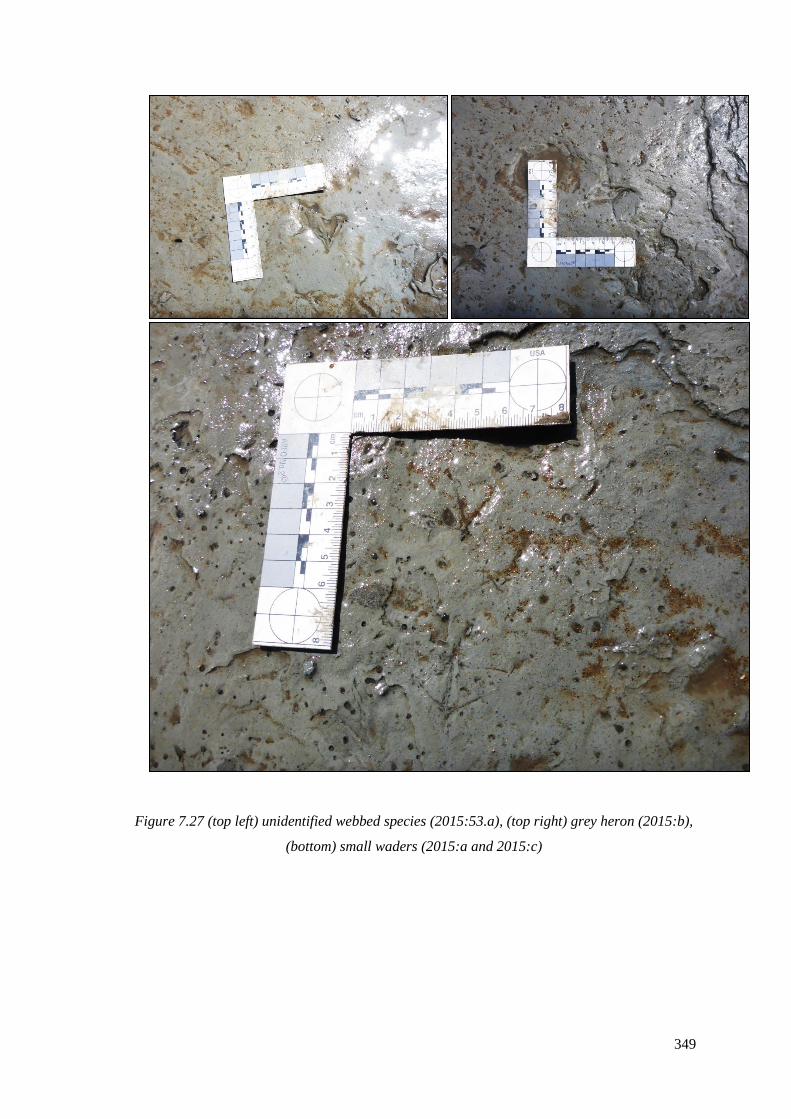
349
Figure 7.27 (top left) unidentified webbed species (2015:53.a), (top right) grey heron (2015:b),
(bottom) small waders (2015:a and 2015:c)

350
Figure 7.28 Tracings made in Site M, from footprints 2015:a. Scale bar 8cm
Figure 7.29 Tracings made from modern dunlin footprints. Note the long central toe shared by
all prints, this can also be seen in the Mesolithic footprint-tracks and is indicative of small
waders. Scale bar 8cm
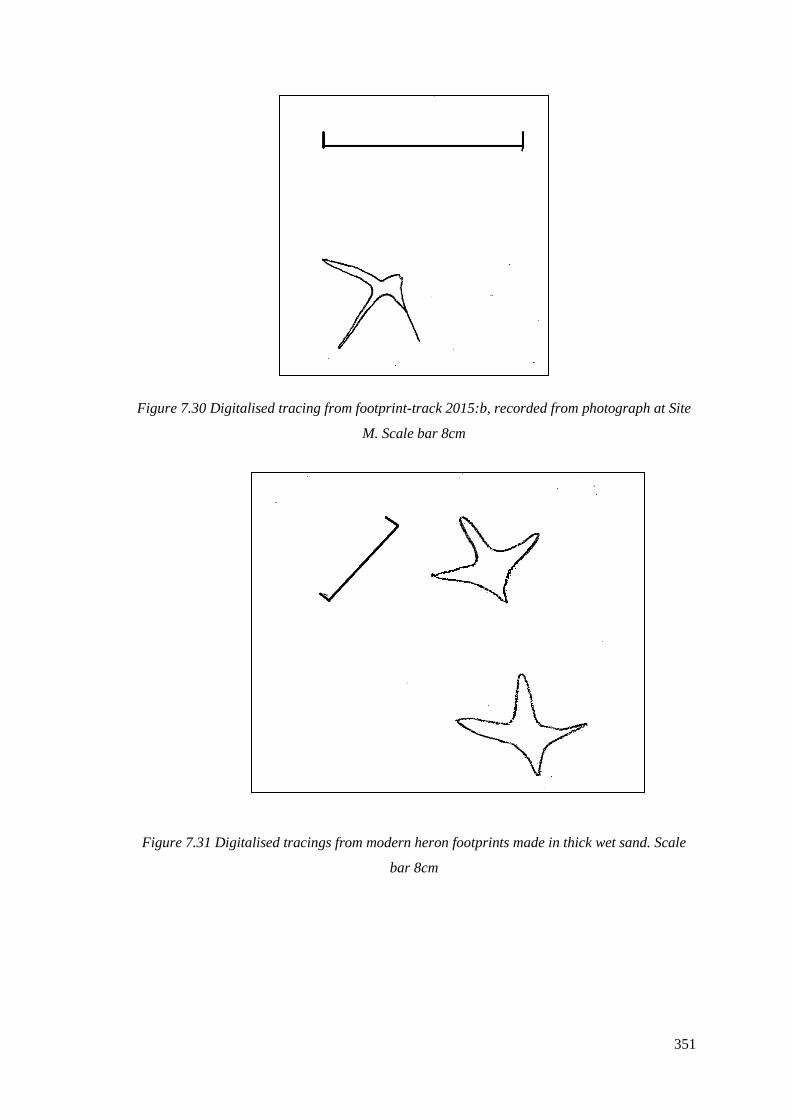
351
Figure 7.30 Digitalised tracing from footprint-track 2015:b, recorded from photograph at Site
M. Scale bar 8cm
Figure 7.31 Digitalised tracings from modern heron footprints made in thick wet sand. Scale
bar 8cm
352
7.5.3 Site N
Site N was located in laminated sediments between a prominent gravel bar and an area of
permanent open water, and is exposed at OD c -5.30m (Figure 6.2). This was the most southern
footprint site and was exposed for the least amount of time, when the tide was below 0.6m chart
datum at the lowest spring tides. At the edge of the gravel bar laminated sediment was
sometimes exposed, though these were poorly preserved due to the constantly shifting gravel
bank, resulting in damaged laminations caused by gravel drag. The footprints in this area were
primarily poorly preserved human footprint-tracks. The avian footprints recorded in this area
were more detailed and well preserved than the human footprint-tracks, though they were not of
the same quality as those from Site C/E.
Avian footprint-tracks 2014:302, 2014:303, 2014:304, 2014:305 and 2014:306 were recorded
on 23.11.2014, on a small laminated area exposed at Site N. They were on similar laminations
to the human footprint-tracks however they were not associated with any and were slightly to
the north of the main 16m by 6m footprint area at Site N, near to Site O. This area was less than
50cm2 and was covered with gravel throughout the rest of the fieldwork period.
Footprint-tracks 2015:16.1, 2015:16.2, and 2015:19 were made on the same laminations.
Footprint-track 2015:16.1 and 2015:16.2 created footprint-tracks at the same, or similar times in
the same area, and were between 10cm and 30cm away from human footprint-track 2015:17.
2015:19 was made approximately 30cm away from the toes of footprint-track 2015:18, and was
slightly more northerly.
Footprint-track 2016:15a was made in an area where multiple human and possible ungulate
footprint-tracks were recorded (2016: 15, 16, 17, 18, 19, 20, 21, 22, 23, 24, 25,26, 29 and 31),
and was less than 30cm directly in front of the toes of human footprint-track 2016:15.
Footprint-track 2016:30 was also recorded on this lamination, 5cm away from the toes of
human footprint 2016:18.
Site N appears to have been exploited by a variety of bird species (Table 7.5; Figure 7.32). All
footprint-tracks were made on the same laminations as human footprint-track trails, and they
were generally near to human footprint-tracks, this can be seen in Figure 7.33 where avian
footprint-track 2015:16.1 was within 10cm of a human footprint-track (2015:17).
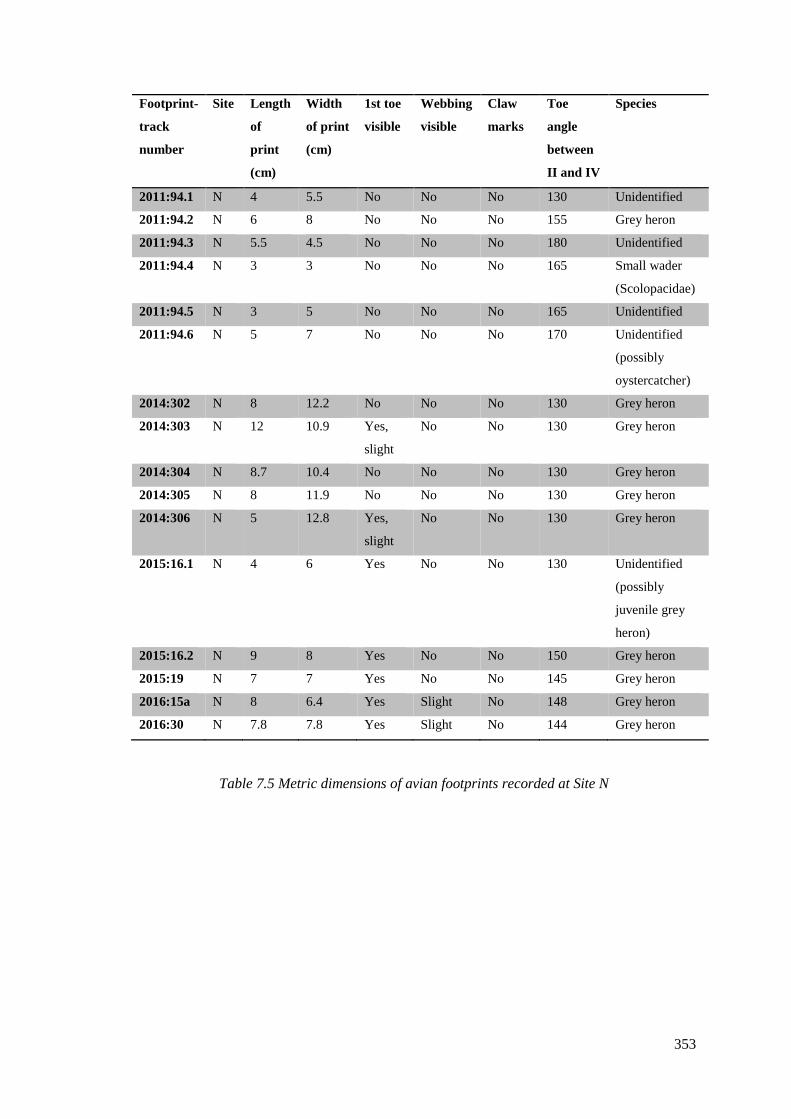
353
Footprint-
track
number
Site Length
of
(cm)
Width
of print
(cm)
1st toe
visible
Webbing
visible
Claw
marks
Toe
angle
between
II and IV
Species
2011:94.1 N 4 5.5 No No No 130 Unidentified
2011:94.2 N 6 8 No No No 155 Grey heron
2011:94.3 N 5.5 4.5 No No No 180 Unidentified
2011:94.4 N 3 3 No No No 165 Small wader
(Scolopacidae)
2011:94.5 N 3 5 No No No 165 Unidentified
2011:94.6 N 5 7 No No No 170 Unidentified
(possibly
oystercatcher)
2014:302 N 8 12.2 No No No 130 Grey heron
2014:303 N 12 10.9 Yes,
slight
No No 130 Grey heron
2014:304 N 8.7 10.4 No No No 130 Grey heron
2014:305 N 8 11.9 No No No 130 Grey heron
2014:306 N 5 12.8 Yes,
slight
No No 130 Grey heron
2015:16.1 N 4 6 Yes No No 130 Unidentified
(possibly
juvenile grey
heron)
2015:16.2 N 9 8 Yes No No 150 Grey heron
2015:19 N 7 7 Yes No No 145 Grey heron
2016:15a N 8 6.4 Yes Slight No 148 Grey heron
2016:30 N 7.8 7.8 Yes Slight No 144 Grey heron
Table 7.5 Metric dimensions of avian footprints recorded at Site N

354
Figure 7.32 Lengths and widths of Site N footprint-tracks compared against modern analogues
0
2
4
6
8
10
12
14
16
0 2 4 6 8 10 12 14 16 18 20
WID
TH
IN
CM
LENGTH IN CM
AVERAGE LENGTHS AND WIDTHS OF FOOTPRINTS
MADE BY SPECIES FROM DIFFERENT FAMILIES
COMPARED AGAINST MESOLITHIC SITE N DATA
Anatidae Ardeidae Charadriidae Corvidae Gruidae
Haematopodidae Laridae Scolopacidae Mesolithic Site N
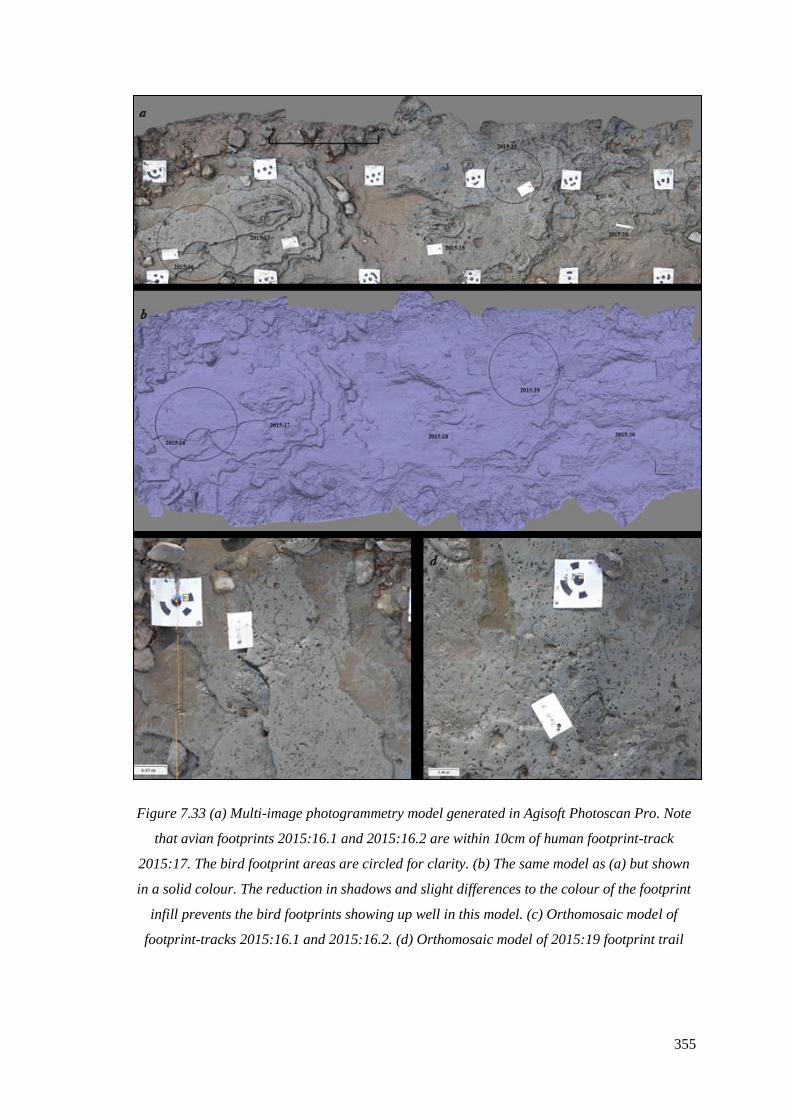
355
Figure 7.33 (a) Multi-image photogrammetry model generated in Agisoft Photoscan Pro. Note
that avian footprints 2015:16.1 and 2015:16.2 are within 10cm of human footprint-track
2015:17. The bird footprint areas are circled for clarity. (b) The same model as (a) but shown
in a solid colour. The reduction in shadows and slight differences to the colour of the footprint
infill prevents the bird footprints showing up well in this model. (c) Orthomosaic model of
footprint-tracks 2015:16.1 and 2015:16.2. (d) Orthomosaic model of 2015:19 footprint trail
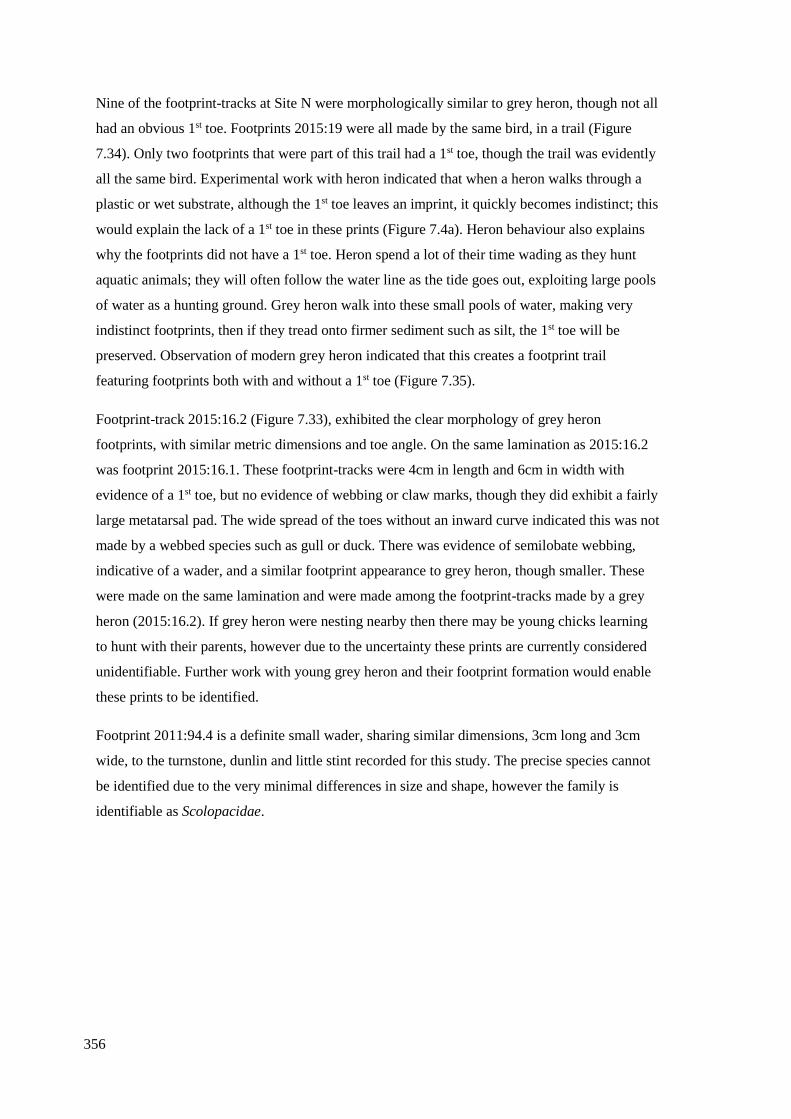
356
Nine of the footprint-tracks at Site N were morphologically similar to grey heron, though not all
had an obvious 1st toe. Footprints 2015:19 were all made by the same bird, in a trail (Figure
7.34). Only two footprints that were part of this trail had a 1st toe, though the trail was evidently
all the same bird. Experimental work with heron indicated that when a heron walks through a
plastic or wet substrate, although the 1st toe leaves an imprint, it quickly becomes indistinct; this
would explain the lack of a 1st toe in these prints (Figure 7.4a). Heron behaviour also explains
why the footprints did not have a 1st toe. Heron spend a lot of their time wading as they hunt
aquatic animals; they will often follow the water line as the tide goes out, exploiting large pools
of water as a hunting ground. Grey heron walk into these small pools of water, making very
indistinct footprints, then if they tread onto firmer sediment such as silt, the 1st toe will be
preserved. Observation of modern grey heron indicated that this creates a footprint trail
featuring footprints both with and without a 1st toe (Figure 7.35).
Footprint-track 2015:16.2 (Figure 7.33), exhibited the clear morphology of grey heron
footprints, with similar metric dimensions and toe angle. On the same lamination as 2015:16.2
was footprint 2015:16.1. These footprint-tracks were 4cm in length and 6cm in width with
evidence of a 1st toe, but no evidence of webbing or claw marks, though they did exhibit a fairly
large metatarsal pad. The wide spread of the toes without an inward curve indicated this was not
made by a webbed species such as gull or duck. There was evidence of semilobate webbing,
indicative of a wader, and a similar footprint appearance to grey heron, though smaller. These
were made on the same lamination and were made among the footprint-tracks made by a grey
heron (2015:16.2). If grey heron were nesting nearby then there may be young chicks learning
to hunt with their parents, however due to the uncertainty these prints are currently considered
unidentifiable. Further work with young grey heron and their footprint formation would enable
these prints to be identified.
Footprint 2011:94.4 is a definite small wader, sharing similar dimensions, 3cm long and 3cm
wide, to the turnstone, dunlin and little stint recorded for this study. The precise species cannot
be identified due to the very minimal differences in size and shape, however the family is
identifiable as Scolopacidae.
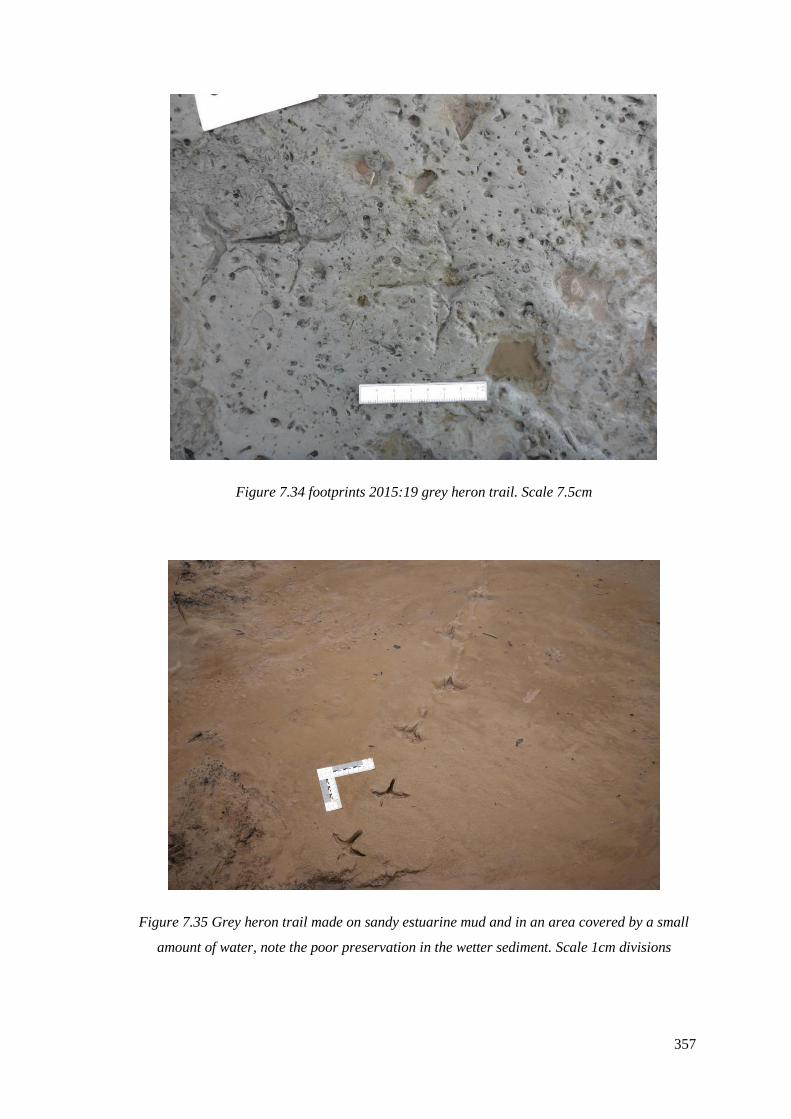
357
Figure 7.34 footprints 2015:19 grey heron trail. Scale 7.5cm
Figure 7.35 Grey heron trail made on sandy estuarine mud and in an area covered by a small
amount of water, note the poor preservation in the wetter sediment. Scale 1cm divisions
358
7.5.4 Site O
During fieldwork in 2011 Site O was discovered. Bird footprint-tracks were found on a small
laminated area, slightly north-east of Site N, since then these laminations have been covered up
by a gravel bank. At the time of discovery, they were recorded via photography and tracings.
There were 36 bird footprint-tracks recorded at Site O. The species of some were identifiable
due to their morphology and size (Table 7.6), however nine footprint-tracks were unidentifiable
due to a lack of clear photographs or observations of the footprints.
Footprint-tracks 2011:208.1 to 2011:208.4 had the metric dimensions and morphological
appearance of common crane (Figure 7.36). The presence of a 1st toe in two of these four
footprint-tracks indicated that the sediment was very soft, soft enough to cause the bird to sink
down slightly into the sediment, resulting in the preservation of the 1st toe in two of the prints.
This is also evident from the greater width of two of the footprints (2011:208.3 and
2011:208.4); in soft or slippery sediment birds will spread their toes to distribute their weight
over a larger area to prevent risk of slipping. The widths of these range from 15cm and 15.5cm
to 16cm and 17.5cm.
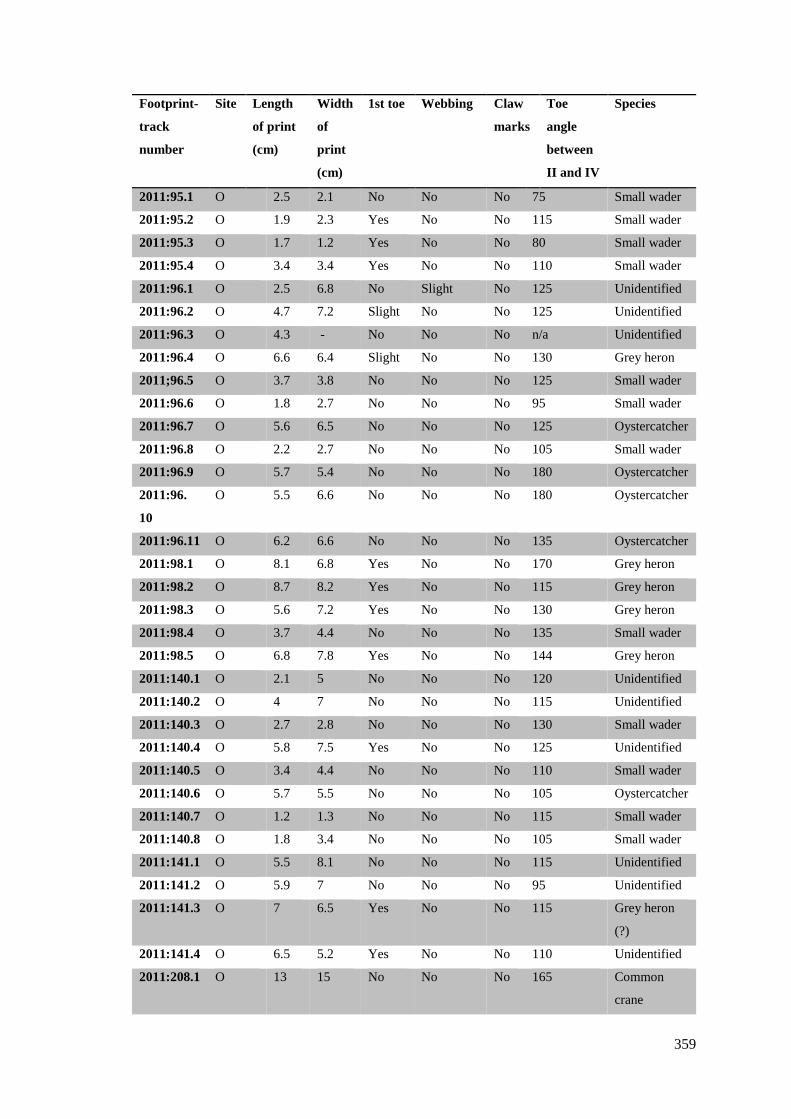
359
Footprint-
track
number
Site Length
of print
(cm)
Width
of
(cm)
1st toe Webbing Claw
marks
Toe
angle
between
II and IV
Species
2011:95.1 O 2.5 2.1 No No No 75 Small wader
2011:95.2 O 1.9 2.3 Yes No No 115 Small wader
2011:95.3 O 1.7 1.2 Yes No No 80 Small wader
2011:95.4 O 3.4 3.4 Yes No No 110 Small wader
2011:96.1 O 2.5 6.8 No Slight No 125 Unidentified
2011:96.2 O 4.7 7.2 Slight No No 125 Unidentified
2011:96.3 O 4.3 - No No No n/a Unidentified
2011:96.4 O 6.6 6.4 Slight No No 130 Grey heron
2011;96.5 O 3.7 3.8 No No No 125 Small wader
2011:96.6 O 1.8 2.7 No No No 95 Small wader
2011:96.7 O 5.6 6.5 No No No 125 Oystercatcher
2011:96.8 O 2.2 2.7 No No No 105 Small wader
2011:96.9 O 5.7 5.4 No No No 180 Oystercatcher
2011:96.
10
O 5.5 6.6 No No No 180 Oystercatcher
2011:96.11 O 6.2 6.6 No No No 135 Oystercatcher
2011:98.1 O 8.1 6.8 Yes No No 170 Grey heron
2011:98.2 O 8.7 8.2 Yes No No 115 Grey heron
2011:98.3 O 5.6 7.2 Yes No No 130 Grey heron
2011:98.4 O 3.7 4.4 No No No 135 Small wader
2011:98.5 O 6.8 7.8 Yes No No 144 Grey heron
2011:140.1 O 2.1 5 No No No 120 Unidentified
2011:140.2 O 4 7 No No No 115 Unidentified
2011:140.3 O 2.7 2.8 No No No 130 Small wader
2011:140.4 O 5.8 7.5 Yes No No 125 Unidentified
2011:140.5 O 3.4 4.4 No No No 110 Small wader
2011:140.6 O 5.7 5.5 No No No 105 Oystercatcher
2011:140.7 O 1.2 1.3 No No No 115 Small wader
2011:140.8 O 1.8 3.4 No No No 105 Small wader
2011:141.1 O 5.5 8.1 No No No 115 Unidentified
2011:141.2 O 5.9 7 No No No 95 Unidentified
2011:141.3 O 7 6.5 Yes No No 115 Grey heron
(?)
2011:141.4 O 6.5 5.2 Yes No No 110 Unidentified
2011:208.1 O 13 15 No No No 165 Common
crane
360
2011:208.2 O 14 15.5 No No No 165 Common
crane
2011:208.3 O 15.5 17.5 Yes No No 170 Common
crane
2011:208.4 O 14.5 16 Yes No No 145 Common
crane
Table 7.6 Metric dimensions from avian footprints recorded at Site O
Figure 7.36 Lengths and widths of avian footprint-tracks from Site O, compared against
modern avian analogues
0
2
4
6
8
10
12
14
16
18
20
0 2 4 6 8 1 0 1 2 1 4 1 6 1 8 2 0
WID
TH
IN
CM
LENGTH IN CM
AVERAGE LENGTHS AND WIDTHS OF FOOTPRINTS
FROM 21SPECIES FROM 8 DIFFERENT FAMILIES
COMPARED AGINST SITE O FOOTPRINT-TRACKS
Anatidae Ardeidae Charadriidae Corvidae Gruidae
Haematopodidae Laridae Scolopacidae Mesolithic Site O
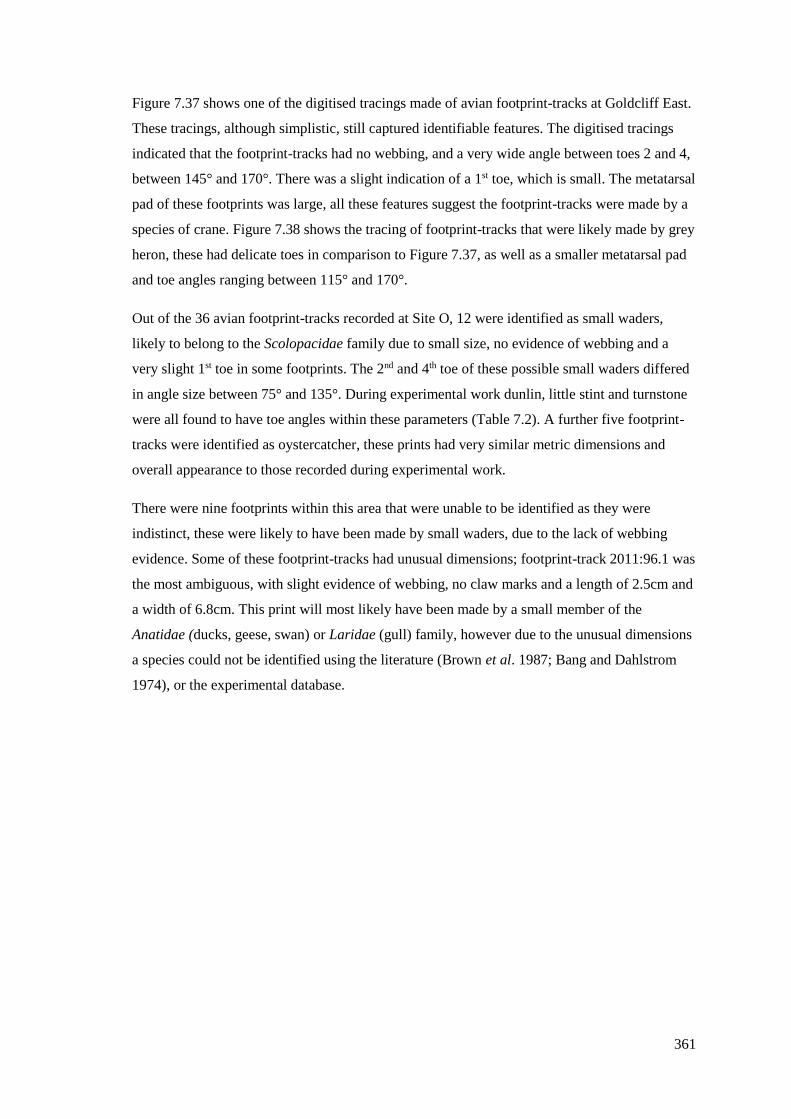
361
Figure 7.37 shows one of the digitised tracings made of avian footprint-tracks at Goldcliff East.
These tracings, although simplistic, still captured identifiable features. The digitised tracings
indicated that the footprint-tracks had no webbing, and a very wide angle between toes 2 and 4,
between 145° and 170°. There was a slight indication of a 1st toe, which is small. The metatarsal
pad of these footprints was large, all these features suggest the footprint-tracks were made by a
species of crane. Figure 7.38 shows the tracing of footprint-tracks that were likely made by grey
heron, these had delicate toes in comparison to Figure 7.37, as well as a smaller metatarsal pad
and toe angles ranging between 115° and 170°.
Out of the 36 avian footprint-tracks recorded at Site O, 12 were identified as small waders,
likely to belong to the Scolopacidae family due to small size, no evidence of webbing and a
very slight 1st toe in some footprints. The 2nd and 4th toe of these possible small waders differed
in angle size between 75° and 135°. During experimental work dunlin, little stint and turnstone
were all found to have toe angles within these parameters (Table 7.2). A further five footprint-
tracks were identified as oystercatcher, these prints had very similar metric dimensions and
overall appearance to those recorded during experimental work.
There were nine footprints within this area that were unable to be identified as they were
indistinct, these were likely to have been made by small waders, due to the lack of webbing
evidence. Some of these footprint-tracks had unusual dimensions; footprint-track 2011:96.1 was
the most ambiguous, with slight evidence of webbing, no claw marks and a length of 2.5cm and
a width of 6.8cm. This print will most likely have been made by a small member of the
Anatidae (ducks, geese, swan) or Laridae (gull) family, however due to the unusual dimensions
a species could not be identified using the literature (Brown et al. 1987; Bang and Dahlstrom
1974), or the experimental database.
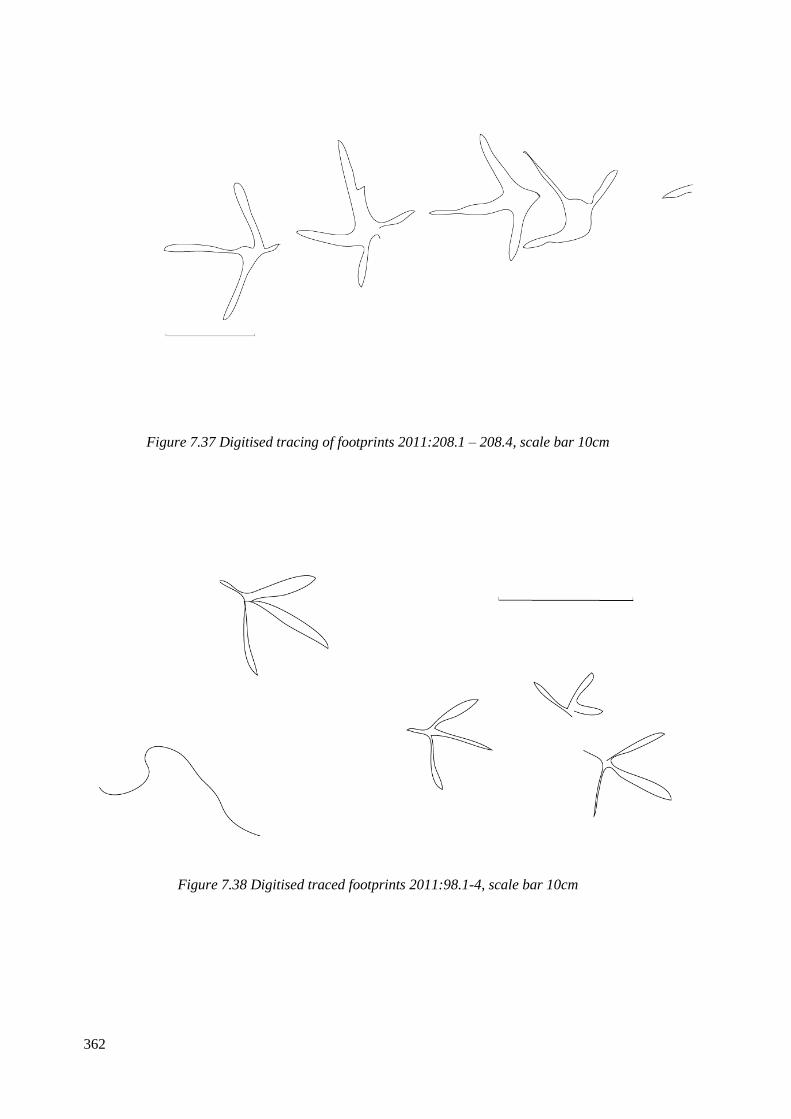
362
Figure 7.37 Digitised tracing of footprints 2011:208.1 – 208.4, scale bar 10cm
Figure 7.38 Digitised traced footprints 2011:98.1-4, scale bar 10cm

363
The sites at Goldcliff East provided Mesolithic birds with rich resources and hunting
opportunities, as the footprint-track evidence suggests a variety of species were present. Grey
heron were found at all the footprint sites discussed, indicating the prevalence of this species,
likely year-round. Avian footprint-tracks 5cm or longer were predominantly made by
oystercatcher, grey heron and common crane and were the most commonly recorded species at
all sites, apart from Site O. This is possibly due to a bias in recovery as the larger birds leave
bigger, deeper footprints which are easier to spot in the muddy conditions of the intertidal
environment. Site O had a slightly different species composition to the other sites, with 33% of
footprint-tracks within this area measuring 3.7cm in length or less, made by small wading birds.
The footprint-tracks at Site O were all on the same lamination; the larger avian footprint-tracks
were seen first, and then the extent of the smaller bird footprint-tracks was established. This
suggests that there are likely far more small bird footprint-tracks on the laminations than those
recorded, but they were not necessarily registered in terms of footprint traces.
7.6 Discussion: The effectiveness of experimental work and species interpretation
The utilisation of modern bird footprints and behaviours as a comparison to prehistoric data is
an appropriate method for establishing species, however there will be differences seen in the
modern bird footprints recorded. Many of the birds used in this experiment were from the
WWT, meaning that they were kept in enclosures with their wings clipped. The captive birds
suffered from calluses on their feet, generally seen on the central metatarsal pad. These calluses
develop on the bird’s feet because they were walking on unnatural surfaces such as concrete,
and is due to the birds spending more time being sedentary then they should, as their feeding
and breeding needs are met within the enclosures. This sedentary lifestyle can also cause weight
gain (M. Roberts, pers comm, 12/01/2014).
Captive birds are not the only creatures to suffer from overeating, wild birds are also affected
by human domestication of grass plants and the destruction of food sources such as fish. With
fields of crops and grains easily accessible to these animals, species such as geese will often eat
far more than they need to when grazing (Coleman & Boag 1987). Other food sources offered
to birds, such as feeding ducks bread, provides birds with a continuous source of sustenance
which is of low nutritional value and can interrupt the migratory instinct. Birds such as gulls
exploit human food waste; white stork are another species that exploit humans, using rubbish
dumps to nest in countries such as Spain and Germany, instead of migrating (Flack et al. 2016).
Due to human activity birds have altered their natural behaviours, enabling them to expend less
energy.
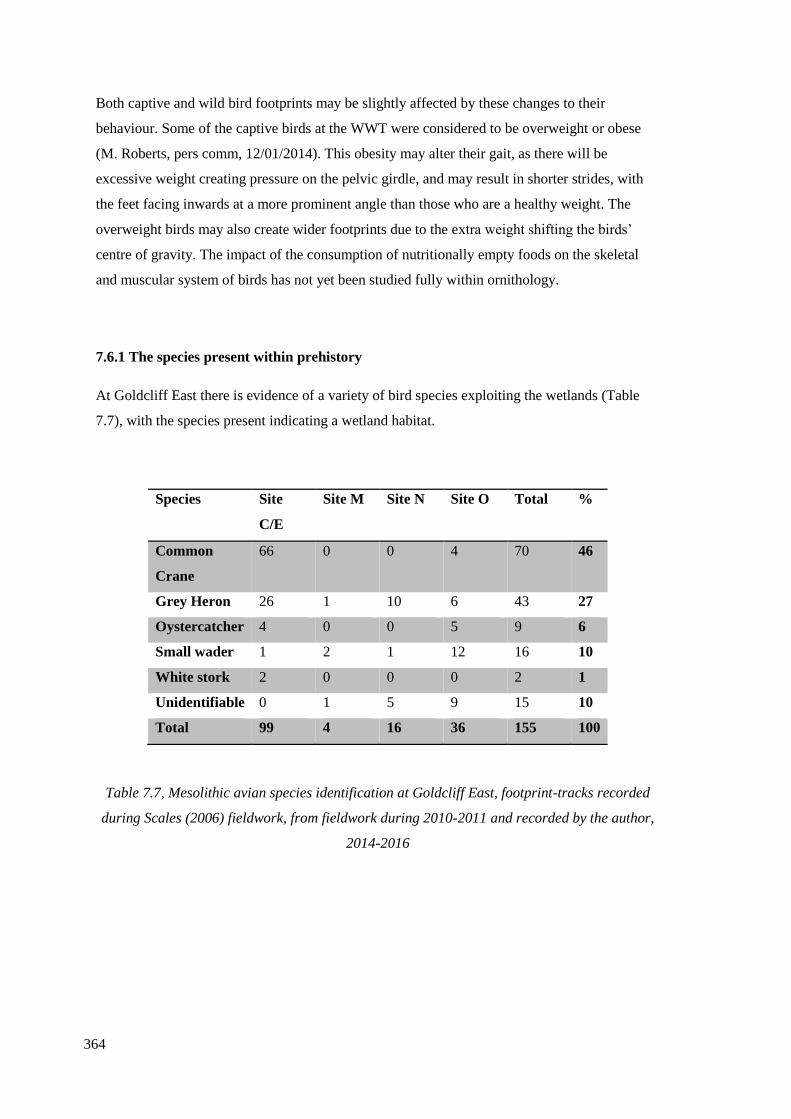
364
Both captive and wild bird footprints may be slightly affected by these changes to their
behaviour. Some of the captive birds at the WWT were considered to be overweight or obese
(M. Roberts, pers comm, 12/01/2014). This obesity may alter their gait, as there will be
excessive weight creating pressure on the pelvic girdle, and may result in shorter strides, with
the feet facing inwards at a more prominent angle than those who are a healthy weight. The
overweight birds may also create wider footprints due to the extra weight shifting the birds’
centre of gravity. The impact of the consumption of nutritionally empty foods on the skeletal
and muscular system of birds has not yet been studied fully within ornithology.
7.6.1 The species present within prehistory
At Goldcliff East there is evidence of a variety of bird species exploiting the wetlands (Table
7.7), with the species present indicating a wetland habitat.
Species Site
C/E
Site M Site N Site O Total %
Common
Crane
66 0 0 4 70 46
Grey Heron 26 1 10 6 43 27
Oystercatcher 4 0 0 5 9 6
Small wader 1 2 1 12 16 10
White stork 2 0 0 0 2 1
Unidentifiable 0 1 5 9 15 10
Total 99 4 16 36 155 100
Table 7.7, Mesolithic avian species identification at Goldcliff East, footprint-tracks recorded
during Scales (2006) fieldwork, from fieldwork during 2010-2011 and recorded by the author,
2014-2016
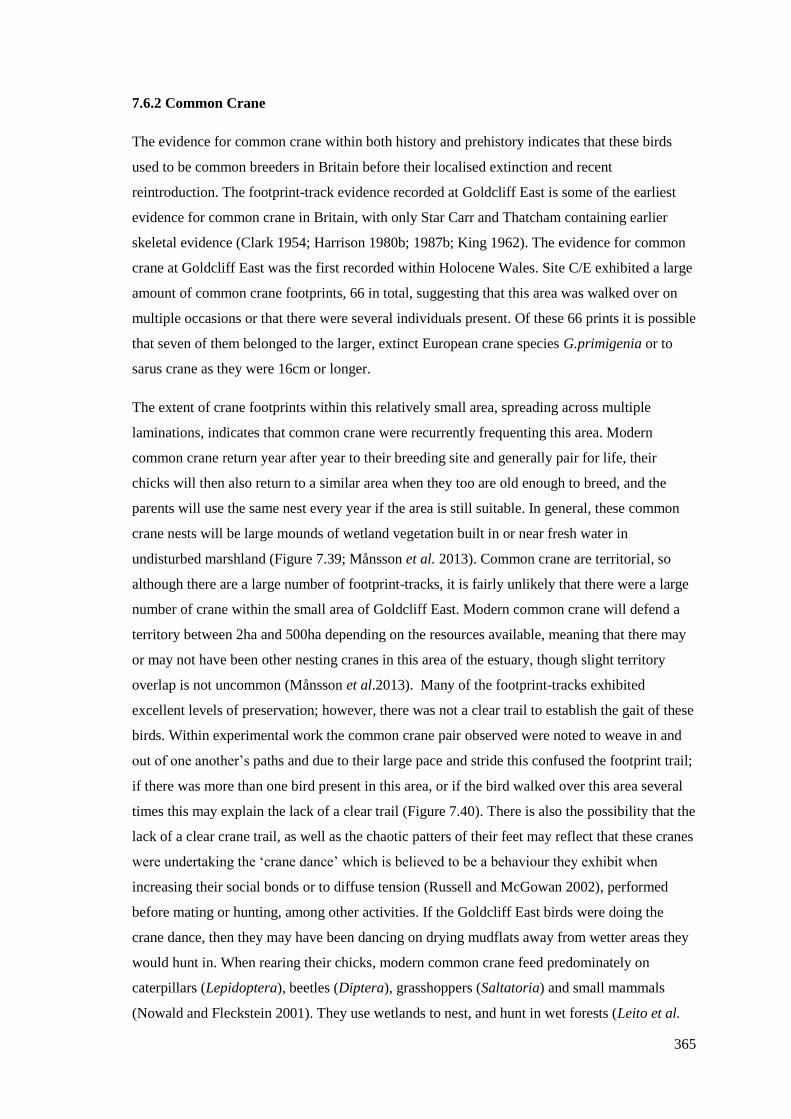
365
7.6.2 Common Crane
The evidence for common crane within both history and prehistory indicates that these birds
used to be common breeders in Britain before their localised extinction and recent
reintroduction. The footprint-track evidence recorded at Goldcliff East is some of the earliest
evidence for common crane in Britain, with only Star Carr and Thatcham containing earlier
skeletal evidence (Clark 1954; Harrison 1980b; 1987b; King 1962). The evidence for common
crane at Goldcliff East was the first recorded within Holocene Wales. Site C/E exhibited a large
amount of common crane footprints, 66 in total, suggesting that this area was walked over on
multiple occasions or that there were several individuals present. Of these 66 prints it is possible
that seven of them belonged to the larger, extinct European crane species G.primigenia or to
sarus crane as they were 16cm or longer.
The extent of crane footprints within this relatively small area, spreading across multiple
laminations, indicates that common crane were recurrently frequenting this area. Modern
common crane return year after year to their breeding site and generally pair for life, their
chicks will then also return to a similar area when they too are old enough to breed, and the
parents will use the same nest every year if the area is still suitable. In general, these common
crane nests will be large mounds of wetland vegetation built in or near fresh water in
undisturbed marshland (Figure 7.39; Månsson et al. 2013). Common crane are territorial, so
although there are a large number of footprint-tracks, it is fairly unlikely that there were a large
number of crane within the small area of Goldcliff East. Modern common crane will defend a
territory between 2ha and 500ha depending on the resources available, meaning that there may
or may not have been other nesting cranes in this area of the estuary, though slight territory
overlap is not uncommon (Månsson et al.2013). Many of the footprint-tracks exhibited
excellent levels of preservation; however, there was not a clear trail to establish the gait of these
birds. Within experimental work the common crane pair observed were noted to weave in and
out of one another’s paths and due to their large pace and stride this confused the footprint trail;
if there was more than one bird present in this area, or if the bird walked over this area several
times this may explain the lack of a clear trail (Figure 7.40). There is also the possibility that the
lack of a clear crane trail, as well as the chaotic patters of their feet may reflect that these cranes
were undertaking the ‘crane dance’ which is believed to be a behaviour they exhibit when
increasing their social bonds or to diffuse tension (Russell and McGowan 2002), performed
before mating or hunting, among other activities. If the Goldcliff East birds were doing the
crane dance, then they may have been dancing on drying mudflats away from wetter areas they
would hunt in. When rearing their chicks, modern common crane feed predominately on
caterpillars (Lepidoptera), beetles (Diptera), grasshoppers (Saltatoria) and small mammals
(Nowald and Fleckstein 2001). They use wetlands to nest, and hunt in wet forests (Leito et al.
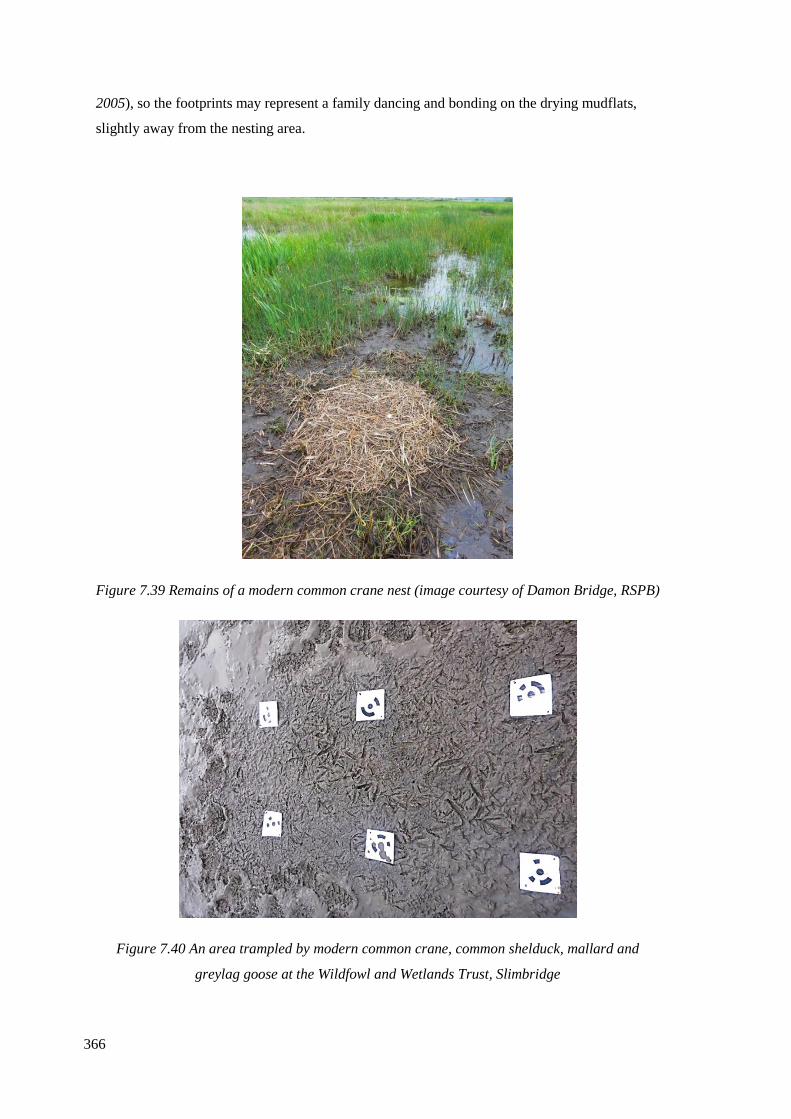
366
2005), so the footprints may represent a family dancing and bonding on the drying mudflats,
slightly away from the nesting area.
Figure 7.39 Remains of a modern common crane nest (image courtesy of Damon Bridge, RSPB)
Figure 7.40 An area trampled by modern common crane, common shelduck, mallard and
greylag goose at the Wildfowl and Wetlands Trust, Slimbridge
367
Common crane currently nest during May to July and then rear their young during the warm
summer months (Hume 2014), therefore the presence of common crane footprint-tracks over
multiple laminations suggests the birds were returning year after year to a favoured nesting site.
The common crane at Goldcliff East created footprint-tracks that had a complete length
between 8cm and 22cm. This 14cm difference in length may be indicative of two separate crane
species. It may also be due to chicks exploring an area with their parents while not fully grown,
or it may be due to the substrates walked upon.
There have not been any prehistoric crane skeletal remains recorded in this area, however there
have been a limited amount of avian skeletal remains discovered, which may indicate avian
remains were not preserved well within this area (Scales 2007b, p 164, Table 13.2). The
archaeological assemblage from the Severn Estuary is notably sparse in avian skeletal remains
compared to mammals. Although footprint-track evidence indicates that humans were sharing
the landscape with crane during the summer months, they may not have been hunting them.
Other areas, including Roman Caerleon, Newport (Hamilton-Dyer 1993) and Iron Age
Glastonbury Lake Village (Harrison 1987a) do have remains from this species and are relatively
near to Goldcliff East, though they are much later in date. This lack of skeletal remains does not
indicate a lack of birds within the area; the footprint-tracks indicate an area where wildfowl
were clearly present, it is likely that footprints over multiple laminations indicate repeat visits to
exploit the nesting environment to breed and raise their young during the summer months
(Chapter 8).
7.6.3 White stork
The appearance of possible juvenile white stork footprints at Goldcliff East was evidence of the
presence of this species in Britain during the Mesolithic. Possible skeletal evidence for
Mesolithic white stork was found at Star Carr, however it was a small fragment and argued to
be from common crane instead (Clark 1954; Harrison 1987b). The two footprint-tracks at
Goldcliff may be evidence that during the Mesolithic period this species was present in Britain
as far north as the Gwent Levels, Wales. Further skeletal evidence has been found of white
stork during different periods indicating that on occasion this species was frequenting Great
Britain (Chapter 2, Table 2.7).
The white stork footprints were recorded at Site C/E, near to where humans and other birds
such as common crane, grey heron and oystercatcher frequented. These laminations were later
in date than those from Site N, M and O and may have indicated that they were made when the
368
climate was mildly warmer or the habitat more favourable. Both white stork and common crane
require shallow water with access to grassland as their habitats.
The white stork footprints are further archaeological evidence for this species in Britain. The
small size of the prints may indicate that like the common crane, this species was utilising the
coasts of Britain to hatch and rear chicks. The bird that made the footprint-tracks did not have
the large metric dimensions of a full grown white stork. Stork breed in wetland environments,
with nesting currently occurring during April to June (Hume 2014), so the presence of a white
stork during spring or summer is not unlikely.
7.6.4 Grey heron
When grey heron nest they favour tall trees, 12m or more, ideally alder (Alnus glutinosa), oak
(Quercus robur) and willow (Salix alba), and as near to a water source or reed swamp as
possible to enable the incubation of eggs whilst being able to easily access fish (Cheshire and
Wirral Ornithological Society 2008). They are social nesters, nesting in large heronries, though
they will nest in reed beds if this area is more suitable. Grey heron are very early nesters, laying
their first eggs as early as January, with all eggs laid and chicks fledged by May (Hume 2014, p
97). They are year-round residents of the Severn Estuary and can usually be seen walking
across the intertidal zone, hunting, and waiting for the water to retreat further.
There was one set of unidentifiable footprint-tracks (2015:16.1) from Site N that looked like
they were made by grey heron, but were far smaller than the expected dimensions. They
measured 4cm long and 6cm wide, whereas adult grey heron footprints from the experiment
measured 8.3cm in length and width. The toe angle between the 2nd and 4th toe of footprint-track
2015:16.1 was 130°; grey heron have a toe angle between 140° and 180°, though these angles
change depending on the sediment walked upon. The morphology of these small footprint-
tracks leads to the conclusion that these may have been made by grey heron chicks, though this
cannot currently be proven due to lack of metric and morphological data about grey heron foot
growth.
Grey heron are large predatory birds, and are easily seen across a landscape. There was a human
footprint-trail as well as a singular human footprint located near the grey heron prints at Site N,
on the same laminations. This may indicate that humans were heading to similar areas as the
grey heron to fish.
The contrast in bird species, specifically heron and crane, between Site N and Site C/E is rather
striking given the contrasting quality of human footprint-tracks between the same areas
369
(Chapter 6). This may possibly be due to an environmental contrast. Herons tend to stand at the
very edge of shallow water as this is their main hunting environment. Common crane use the
wetland environment as a safe habitat to nest and raise their young, however when they have
chicks they do a lot of foraging in wet wooded areas (Leito et al. 2005), so their footprints may
be better preserved due to the mud being drier away from the water’s edge. A future study of
the foraminifera from the Site C/E and Site N footprint-track sediments may assist in
determining the environmental reason behind these contrasting site preferences of common
crane and grey heron.
7.6.5 Oystercatcher
Oystercatcher are a medium sized wading bird that live year-round in Britain. In the winter
months they can be seen on tidal estuaries and rocky shorelines, during the summer months they
spend more of their time inland, rearing their young along linear waterways (Simm 2016). They
will generally be seen in small groups eating at the water’s edge. At Goldcliff East, Site C/E
and O exhibited evidence of this species. The oystercatchers’ preferred food is cockles and they
are excellent at finding this food type. Oystercatchers may have been indicators of cockle beds
to Mesolithic hunter-gatherers, though at Goldcliff East there have not been any shell middens
recorded from human activity. There is however a distinctive natural cockle horizon which
occurs within the Mesolithic sequence, the cockle bed is present within c.50m of Site I (Allen
and Haslett 2002).
7.6.6 Other Coastal Birds
It is fairly difficult to establish the difference between certain species’ footprints; small waders
such as dunlin, turnstone and little stint for example are incredibly similar in size and
appearance. Geomorphemetrics was initially utilised in an attempt to establish any obvious
differences, however the variation in the appearance of features in a single individuals’
footprints indicated that this technique would be ineffective in this instance. A larger avian
footprint database, with more bird species, and multiple sediment types would provide a dataset
that could then be accurately analysed with geomorphmetrics. The current database contains 50
footprints, from three species of small wader, all from the Scolopacidae family, this is therefore
a relatively small data source.
In situations where there are no clear identifying features present a trail needs to be observed,
as species express different walking behaviours. This does not always help in archaeological
370
situations, where finding complete bird trails is unusual; in these instances smaller bird
footprints may only be identifiable as small waders instead of the explicit species. This does not
devalue these footprints; the presence of small waders indicates the habitat of the area. The
Scolopacidae family, for instance, indicates the proximity of surface water, which this family
require for feeding.
The archaeological avian skeletal record for small waders is relatively sparse. From the
Ipswichian period at Bacon Hole and Minchin Hole, Gower, the remains of dunlin, golden
plover and turnstone were recorded (Harrison 1987a). Within the Holocene period, remains of
golden plover, grey plover and turnstone were recorded at Port Eyon Cave, Gower (Harrison
1987a). Plovers are part of the Charadriidae family, with feet about twice as long as those from
the Scolopacidae family. The presence of turnstone within the Holocene archaeological record
and also the metric and morphological similarities between the prehistoric footprints and the
experimental data, suggests that turnstones may have made the small wader footprints at
Goldcliff. Turnstones are winter migrants, so their appearance would suggest they were in the
area between October and March. Though it is possible that other small wader species made
some of the footprints.
7.6.7 Unidentifiable
The experimental studies on modern bird footprints were relatively successful in identifying the
species of prehistoric birds, however some footprints could not be assigned a species due to
their formation, lack of detail when recording, or the variability of footprint preservation.
Others are currently unidentifiable as they do not accurately match with both the morphology
and metric size of the modern coastal birds used within this study, nor are their features similar
to any of those found in the footprint-track literature. Avian footprints have been understudied
in both archaeology and ornithology, meaning that there is a small amount of literature on bird
footprints available, often with differing identification specifications (Brown et al. 1987; Bang
and Dahlstrom 1974). When literature is available there is generally no indication of the
sediment the footprint was created on or the kind of behaviour (feeding, territorial displays and
hunting) which the animal was engaging in when the footprints were recorded, even though
these behaviours will affect the gait of the bird.
An extensive study of the appearance and formation of the footprints of birds that frequent
Britain would enable more of these unidentified prehistoric footprints to be assigned a species.
A rigorous footprint study may also help to identify very small differences in bird species, such
371
as small waders, which would then result in a comprehensive understanding of the environment
these prehistoric birds were living in.
7.7 The importance of the archaeological data to species reintroduction
Common crane are an important bird, ingrained in our history, with places named in reference
to them. They were also a status symbol for the wealthy, however very few people living in
Britain presently have seen a wild crane as they became locally extinct. Due to wetland
development the common crane and their habitats have suffered, possibly as early as the Roman
period. Archaeological and historical evidence indicates that common crane were locally extinct
throughout most of Britain by the Medieval period (Rackham 1986). The archaeological
evidence for common crane, such as the footprint-tracks from Goldcliff East and Formby Point,
led to a breeding programme at the Wildfowl and Wetlands Trust, Slimbridge (Bridge 2015), to
re-introduce common crane to Britain. This resulted in the eventual release of crane on the
Somerset levels once they reached adulthood. In August 2016 a pair of crane raised a fully-
fledged chick on the Gwent Levels, Wales (Figure 7.41). This is the first common crane to
breed in Wales for at least 500 years, though it is very possible that there might not have been a
breeding pair in Wales since the Roman period (Harrison 1987a; Racham 1986). This success
indicates the need for conservationists to be aware of the value of archaeology, which can lend
weight to the argument for the reintroduction of many extinct species to a variety of different
habitats.
Prehistoric avian footprint-tracks can be utilised in a similar way to skeletal remains for the
argument of reintroduction. Often habitats such as the wetlands, which would have been
teeming with wildfowl, have a very limited skeletal record. The footprint-tracks recorded at
Goldcliff East indicate that common crane were once a flourishing species in Wales, making
their reintroduction in England extremely positive. The Eurasian beaver was reintroduced to
Scotland successfully and has now been reintroduced in several places of the UK, including
Devon. This reintroduction was a result of the argument that the prehistoric and historic record
showed them to be natives (Coles 2006). There have been tentative suggestions that white stork
should be reintroduced into Britain as there has been great success in their introduction in
Europe (Carter et al. 2008). The white stork footprint evidence from the Mesolithic period, as
well as the skeletal remains from across Britain from multiple time periods (Chapter 2, Table
2.7), suggest that they may not have been migrating to Britain on mass, but that Britain is a
place that some of these birds used to frequent throughout prehistory and history. That being the
case there could be a firm argument made for the reintroduction of this species. Not only are we
able to use archaeological footprint-tracks to understand the past, but they can become an
argument to shape a species’ future.
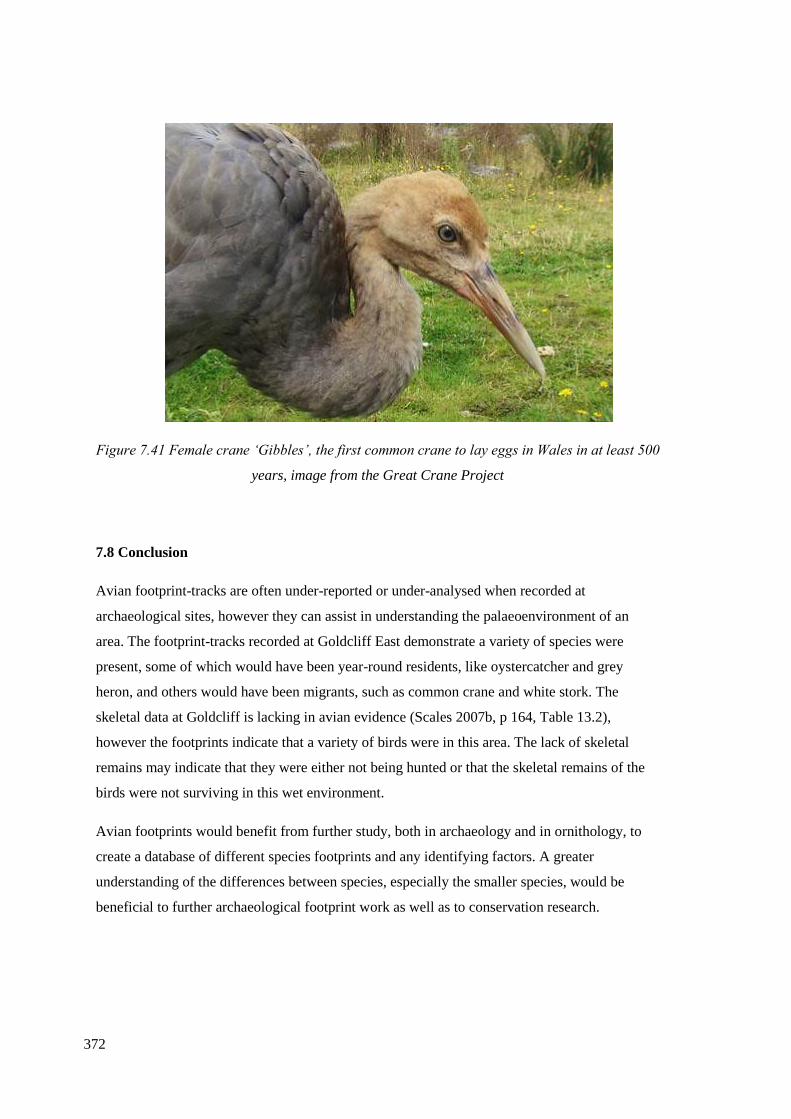
372
Figure 7.41 Female crane ‘Gibbles’, the first common crane to lay eggs in Wales in at least 500
years, image from the Great Crane Project
7.8 Conclusion
Avian footprint-tracks are often under-reported or under-analysed when recorded at
archaeological sites, however they can assist in understanding the palaeoenvironment of an
area. The footprint-tracks recorded at Goldcliff East demonstrate a variety of species were
present, some of which would have been year-round residents, like oystercatcher and grey
heron, and others would have been migrants, such as common crane and white stork. The
skeletal data at Goldcliff is lacking in avian evidence (Scales 2007b, p 164, Table 13.2),
however the footprints indicate that a variety of birds were in this area. The lack of skeletal
remains may indicate that they were either not being hunted or that the skeletal remains of the
birds were not surviving in this wet environment.
Avian footprints would benefit from further study, both in archaeology and in ornithology, to
create a database of different species footprints and any identifying factors. A greater
understanding of the differences between species, especially the smaller species, would be
beneficial to further archaeological footprint work as well as to conservation research.
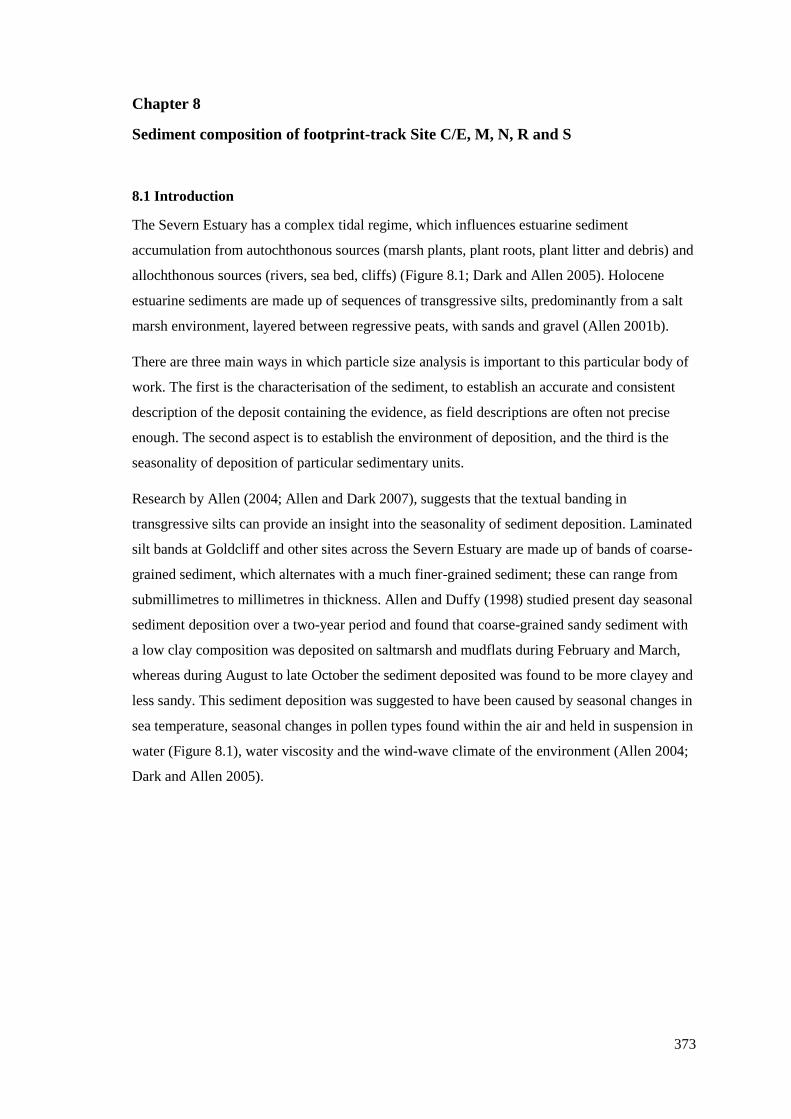
373
Chapter 8
Sediment composition of footprint-track Site C/E, M, N, R and S
8.1 Introduction
The Severn Estuary has a complex tidal regime, which influences estuarine sediment
accumulation from autochthonous sources (marsh plants, plant roots, plant litter and debris) and
allochthonous sources (rivers, sea bed, cliffs) (Figure 8.1; Dark and Allen 2005). Holocene
estuarine sediments are made up of sequences of transgressive silts, predominantly from a salt
marsh environment, layered between regressive peats, with sands and gravel (Allen 2001b).
There are three main ways in which particle size analysis is important to this particular body of
work. The first is the characterisation of the sediment, to establish an accurate and consistent
description of the deposit containing the evidence, as field descriptions are often not precise
enough. The second aspect is to establish the environment of deposition, and the third is the
seasonality of deposition of particular sedimentary units.
Research by Allen (2004; Allen and Dark 2007), suggests that the textual banding in
transgressive silts can provide an insight into the seasonality of sediment deposition. Laminated
silt bands at Goldcliff and other sites across the Severn Estuary are made up of bands of coarse-
grained sediment, which alternates with a much finer-grained sediment; these can range from
submillimetres to millimetres in thickness. Allen and Duffy (1998) studied present day seasonal
sediment deposition over a two-year period and found that coarse-grained sandy sediment with
a low clay composition was deposited on saltmarsh and mudflats during February and March,
whereas during August to late October the sediment deposited was found to be more clayey and
less sandy. This sediment deposition was suggested to have been caused by seasonal changes in
sea temperature, seasonal changes in pollen types found within the air and held in suspension in
water (Figure 8.1), water viscosity and the wind-wave climate of the environment (Allen 2004;
Dark and Allen 2005).
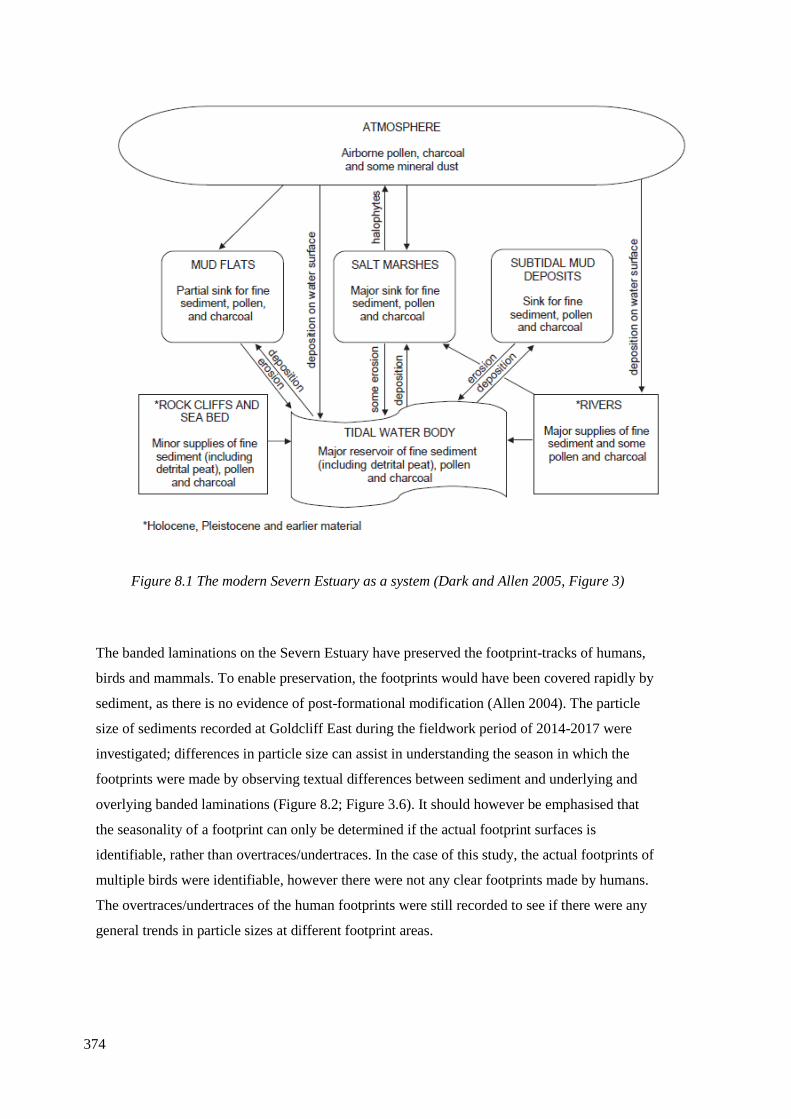
374
Figure 8.1 The modern Severn Estuary as a system (Dark and Allen 2005, Figure 3)
The banded laminations on the Severn Estuary have preserved the footprint-tracks of humans,
birds and mammals. To enable preservation, the footprints would have been covered rapidly by
sediment, as there is no evidence of post-formational modification (Allen 2004). The particle
size of sediments recorded at Goldcliff East during the fieldwork period of 2014-2017 were
investigated; differences in particle size can assist in understanding the season in which the
footprints were made by observing textual differences between sediment and underlying and
overlying banded laminations (Figure 8.2; Figure 3.6). It should however be emphasised that
the seasonality of a footprint can only be determined if the actual footprint surfaces is
identifiable, rather than overtraces/undertraces. In the case of this study, the actual footprints of
multiple birds were identifiable, however there were not any clear footprints made by humans.
The overtraces/undertraces of the human footprints were still recorded to see if there were any
general trends in particle sizes at different footprint areas.
375
Figure 8.2 Example of banded laminations in section, shown in a fallen block of sediment. Scale
1cm divisions
8.2 Samples
A total of 27 sediment samples were collected during 2014-2017. Of these, 15 were from Site
C/E, four were from Site M, four from Site N, two were from Site R and two were from Site S
(Chapter 6, Figure 6.2). Of the 15 samples collected from Site C/E, ten were recorded from the
lamination the footprint-track was found upon, and the other five were taken from the
lamination directly under the footprint-track. The samples were taken from both human and
avian footprint-tracks. From Site M two samples were recorded from the upper lamination,
though these were from overtraces/undertraces, and a further two were recorded from the
lamination below, these were from human footprint-tracks. Site N was also investigated; two
samples were collected from the footprint-track surface and two from the laminations
underneath, one of the footprint-tracks was human, the other was avian. Sediments from one
human footprint-track were collected in Site R, from the surface where overtraces were visible,
and from the underlying lamination. A sample from Site S was recorded from one footprint-
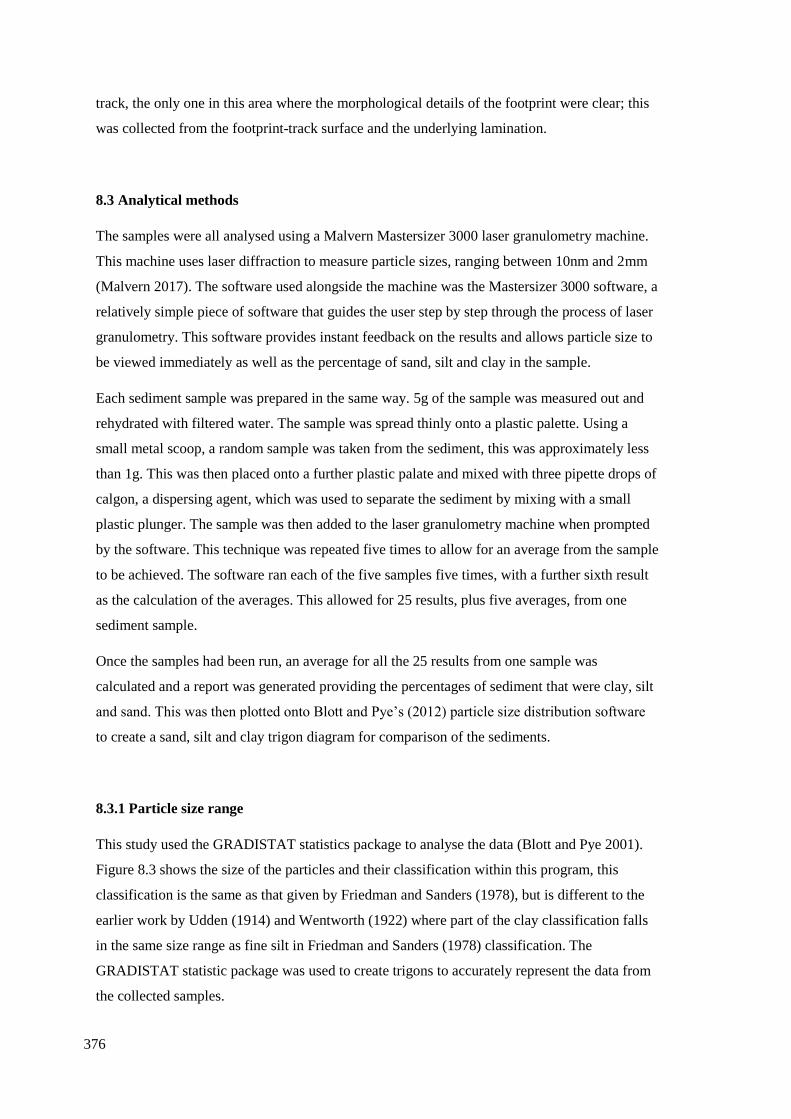
376
track, the only one in this area where the morphological details of the footprint were clear; this
was collected from the footprint-track surface and the underlying lamination.
8.3 Analytical methods
The samples were all analysed using a Malvern Mastersizer 3000 laser granulometry machine.
This machine uses laser diffraction to measure particle sizes, ranging between 10nm and 2mm
(Malvern 2017). The software used alongside the machine was the Mastersizer 3000 software, a
relatively simple piece of software that guides the user step by step through the process of laser
granulometry. This software provides instant feedback on the results and allows particle size to
be viewed immediately as well as the percentage of sand, silt and clay in the sample.
Each sediment sample was prepared in the same way. 5g of the sample was measured out and
rehydrated with filtered water. The sample was spread thinly onto a plastic palette. Using a
small metal scoop, a random sample was taken from the sediment, this was approximately less
than 1g. This was then placed onto a further plastic palate and mixed with three pipette drops of
calgon, a dispersing agent, which was used to separate the sediment by mixing with a small
plastic plunger. The sample was then added to the laser granulometry machine when prompted
by the software. This technique was repeated five times to allow for an average from the sample
to be achieved. The software ran each of the five samples five times, with a further sixth result
as the calculation of the averages. This allowed for 25 results, plus five averages, from one
sediment sample.
Once the samples had been run, an average for all the 25 results from one sample was
calculated and a report was generated providing the percentages of sediment that were clay, silt
and sand. This was then plotted onto Blott and Pye’s (2012) particle size distribution software
to create a sand, silt and clay trigon diagram for comparison of the sediments.
8.3.1 Particle size range
This study used the GRADISTAT statistics package to analyse the data (Blott and Pye 2001).
Figure 8.3 shows the size of the particles and their classification within this program, this
classification is the same as that given by Friedman and Sanders (1978), but is different to the
earlier work by Udden (1914) and Wentworth (1922) where part of the clay classification falls
in the same size range as fine silt in Friedman and Sanders (1978) classification. The
GRADISTAT statistic package was used to create trigons to accurately represent the data from
the collected samples.
377
Figure 8.3 Particle size range utilised by the GRADISTAT Grain size statistics programme
(Blott and Pye 2001)
8.4 Results
The results for sediment composition are presented within the different sites in which they were
found, with percentages of clay, silt and sand all included. This information is also conveyed on
sand, silt and clay trigons to understand the sediment texture and composition of each sample.
8.4.1 Site C/E
The bird footprint-tracks recorded at Site C/E were predominantly footprints rather than
overtraces/undertraces. This made obtaining particle sizes for this area most accurate as
378
sediments could be taken from the very lamination the footprints were made upon, as well as in
some cases the underlying sediments to compare the textural banding (Table 8.1). The human
footprint-tracks were less well preserved and were likely overtraces/undertraces, though one
footprint-track (2015:116; Figure 6.11) had the appearance of a true footprint, or was an
undertrace that was possibly a few millimetres lower than the actual footprint given its detailed
morphology. The sediment collected from the human footprint-tracks are plotted on one sand,
silt and clay trigon and the avian footprint sediment are plotted on the other. Figure 8.4 shows
the sediment composition of the laminations walked upon by humans. The composition of clay
within the sediments ranged from 2.29% to 24.02%, silt composition ranged from 60.98% to
80.96%, and sand composition ranged from 15% to 33.02%, indicating predominantly silt
sediments. Footprint 2016:116 comprised of the only sediment to be classified as slightly sandy
clayey silt. Two of the footprint-tracks recorded from the lamination surface upon which the
footprint was made, 2015:89 and 2015:106, were slightly sandy slightly clayey silt. The
sediment from the surface of footprint 2015:129 was a very slightly clayey slightly sandy silt,
whilst the underlying lamination for this print was composed of very slightly clayey sandy silt.
Although there is not a huge difference in sediment composition, it is evident that all the
samples recorded from the laminations where the footprint-tracks were visible were made of a
very fine sediment, with a higher silt and clay composition than the lamination under the
footprint-tracks, which was a slightly clayey sandy silt. This difference is small but may
indicate the footprints were being made during a time when the sediment being walked on had a
smaller particle size.
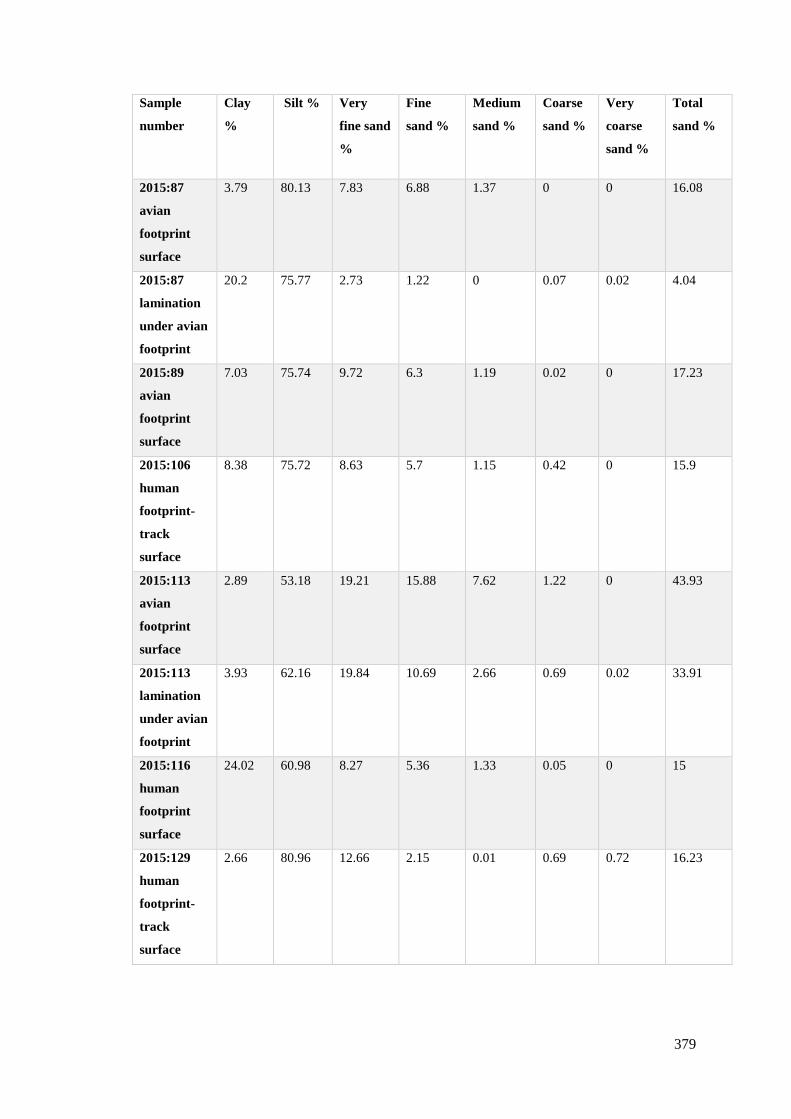
379
Sample
number
Clay
%
Silt % Very
fine sand
%
Fine
sand %
Medium
sand %
Coarse
sand %
Very
coarse
sand %
Total
sand %
2015:87
avian
footprint
surface
3.79 80.13 7.83 6.88 1.37 0 0 16.08
2015:87
lamination
under avian
footprint
20.2 75.77 2.73 1.22 0 0.07 0.02 4.04
2015:89
avian
footprint
surface
7.03 75.74 9.72 6.3 1.19 0.02 0 17.23
2015:106
human
footprint-
track
surface
8.38 75.72 8.63 5.7 1.15 0.42 0 15.9
2015:113
avian
footprint
surface
2.89 53.18 19.21 15.88 7.62 1.22 0 43.93
2015:113
lamination
under avian
footprint
3.93 62.16 19.84 10.69 2.66 0.69 0.02 33.91
2015:116
human
footprint
surface
24.02 60.98 8.27 5.36 1.33 0.05 0 15
2015:129
human
footprint-
track
surface
2.66 80.96 12.66 2.15 0.01 0.69 0.72 16.23

380
2015:129
lamination
under
human
footprint-
track
2.29 64.69 22.28 10.43 0.31 0 0 33.02
2015:129
heron
footprint
surface
22.38 51.87 10.44 7.92 1.92 3.42 1.64 25.35
2015:129
lamination
under
heron
footprint
11.17 62.57 14.69 10.88 0.68 0 0 26.26
2015:130
lamination
under
footprint
surface
2.97 49.56 23.13 21.27 2.98 0.1 0 47.47
2015:130
avian
footprint
surface
26.05 54.3 10.7 7.69 1.13 0.13 0 19.65
2016:70
avian
footprint
surface
40.03 54.35 2.19 2.5 0.52 0.3 0.09 5.59
2016:70
lamination
under avian
footprint
surface
16.6 53.88 10.3 17.71 1.51 0 0 29.52
Table 8.1 Percentage of clay, silt and sand from the sediment samples from Site C/E
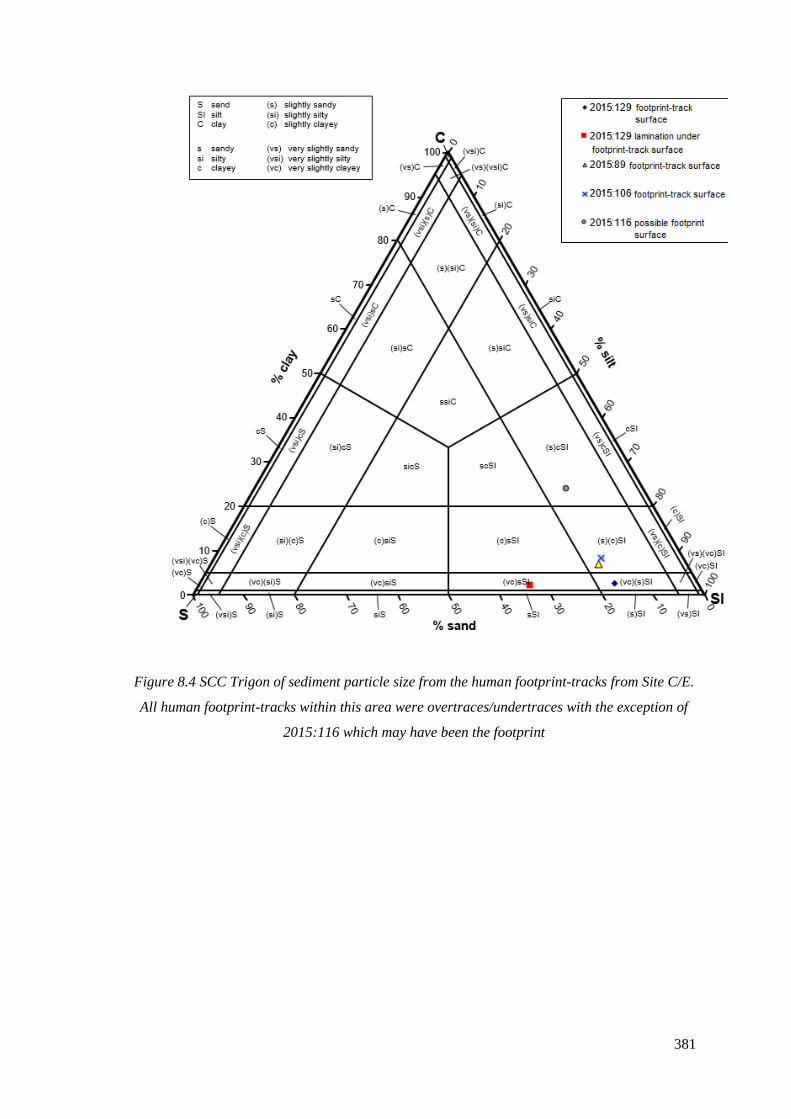
381
Figure 8.4 SCC Trigon of sediment particle size from the human footprint-tracks from Site C/E.
All human footprint-tracks within this area were overtraces/undertraces with the exception of
2015:116 which may have been the footprint

382
Figure 8.5 SCC Trigon of sediment particle size from avian footprints from Site C/E. 2015:87,
2016:70 and 2015:130 were common crane, 2015:129 was an oystercatcher and 2015:113 was
a small wader
The avian footprint-tracks displayed in the SCC trigon in Figure 8.5 demonstrate more clearly
than Figure 8.4 the difference in sediment composition between the laminations where the
footprints were made, and the laminations below. This is due to the preservation of the actual
footprints of the birds, as opposed to the undertraces/overtraces of human footprint-tracks. The
clay composition of the laminations ranged from 2.89% to 40.03%, the silt composition ranged
from 49.56% to 80.13%, and sand composition ranged from 4.4% to 47.47%. Two of the
2015:87 lamination under footprint
2015:87 footprint surface
2016:70 footprint surface
2016:70 lamination under footprint
2015:130 footprint surface
2015:129 footprint surface
2015:129 lamination under footprint
2015:113 footprint surface
2015:113 lamination under footprint
2015:130 lamination under footprint
% sand
30
20
10
0
40
50
60
70
80
90
100
(si)sC (s)siC
(si)cS (s)cSI
ssiC
sicS scSI
(vc)(s)SI(vc)sSI(vc)siS(vc)(si)S
(si)(c)S (c)siS (c)sSI (s)(c)SI
cSIcS
SIS (vs)SI
(vs)(vc)SI
(vc)SI
(s)SIsSI
(c)S
(vsi)(vc)S
(vc)S
(vsi)S (si)S siS
C
(s)(si)C
siCsC
(s)C (si)C
(vsi)C
(vs)C (vs)(vsi)C
SSIC
sandsiltclay
sandysiltyclayey
ssic
(s)(si)(c)
slightly sandyslightly siltyslightly clayey
(vs)(vsi)(vc)
very slightly sandyvery slightly siltyvery slightly clayey
383
samples recorded from the surface of footprint 2016:70 and 2015:130 were made on slightly
sandy clayey silt, though the surface of 2016:70 is on the border between a very slightly sandy
and slightly sandy particle size. Sediment collected from the footprint surface of 2015:129 was
made of sandy clayey silt, and sediments from under footprint 2015:129 and 2016:70 were
made of a slightly clayey sandy silt. Sediment collected from under footprint 2015:130 had a
much sandier composition than all other samples, being composed of very slightly clay sandy
silt, this sample consisted of 47.47% sand sized particles. There were a further two samples that
fell in the very slightly clayey sandy silt composition, from the surface of and below footprint
2015:113. Sediment from the surface of 2015:87 had a very slightly clayey slightly sandy
composition, whilst the lamination under this footprint had a slightly clayey silt composition.
The difference between the sediment composition of the footprint lamination and underlying
lamination of 2016:70 is most evident, with sand making up a far larger percentage in the
underlying lamination (29.52%) as opposed to the footprint surface only containing 5.59%
(Figure 8.6). The sediment recorded from 2015:130 also has some differences between the
sediment from the footprint-track surface and that underlying it. The sediment compositions of
2015:113 were very similar for the footprint surface and underlying lamination, both were made
on a very slightly clayey lamination, though unlike the other samples the footprint was made on
a sandier sediment than the underlying layer. 2015:87 was the only sample where the
underlying lamination contained a smaller particle size, only 4.04% of the sample was
composed of sand. The sample from the actual footprint still had a relatively silty composition,
with 16.08% sand sized particles. This was far siltier than all others, 80.13% of the sample was
composed of silt sized particles.
The sediment samples from Site C/E demonstrate the sediments were all silty, but the amount of
clay or sand in the composition varied. In general, those taken from the surface of the footprints
had a smaller particle size, of the nine samples collected from the footprint surface there was
only one, 2015:113, that fell within the very slightly clayey sandy sediment, all other sediments
recorded from the footprint surface had smaller particle sizes. This trend was not seen in the
sediment excavated from under the lamination, three of the six samples from under the
footprints were comprised of very slightly clay sandy sediment, with a further two comprised of
slightly clay sandy sediment, indicating that the laminations under the footprints generally have
a larger particle size. The lamination under footprint 2015:87 had a smaller particle size than the
footprint surface, indicating this footprint was likely made in different circumstances to the
others.
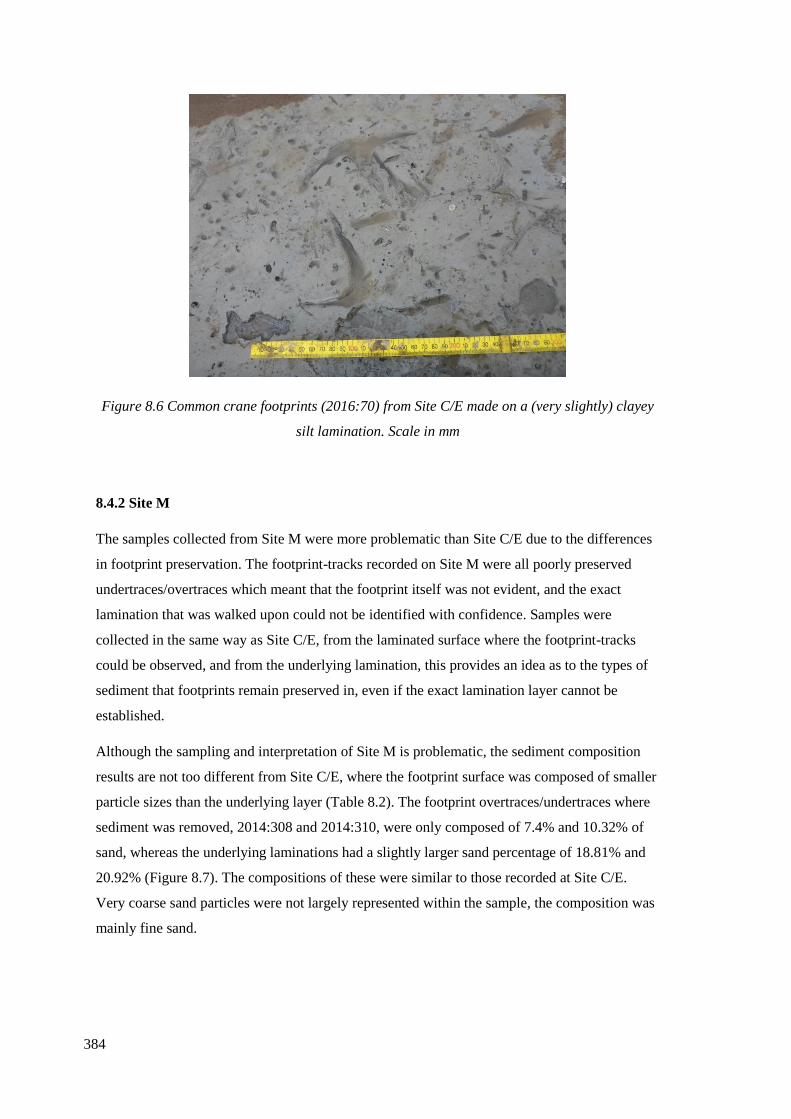
384
Figure 8.6 Common crane footprints (2016:70) from Site C/E made on a (very slightly) clayey
silt lamination. Scale in mm
8.4.2 Site M
The samples collected from Site M were more problematic than Site C/E due to the differences
in footprint preservation. The footprint-tracks recorded on Site M were all poorly preserved
undertraces/overtraces which meant that the footprint itself was not evident, and the exact
lamination that was walked upon could not be identified with confidence. Samples were
collected in the same way as Site C/E, from the laminated surface where the footprint-tracks
could be observed, and from the underlying lamination, this provides an idea as to the types of
sediment that footprints remain preserved in, even if the exact lamination layer cannot be
established.
Although the sampling and interpretation of Site M is problematic, the sediment composition
results are not too different from Site C/E, where the footprint surface was composed of smaller
particle sizes than the underlying layer (Table 8.2). The footprint overtraces/undertraces where
sediment was removed, 2014:308 and 2014:310, were only composed of 7.4% and 10.32% of
sand, whereas the underlying laminations had a slightly larger sand percentage of 18.81% and
20.92% (Figure 8.7). The compositions of these were similar to those recorded at Site C/E.
Very coarse sand particles were not largely represented within the sample, the composition was
mainly fine sand.
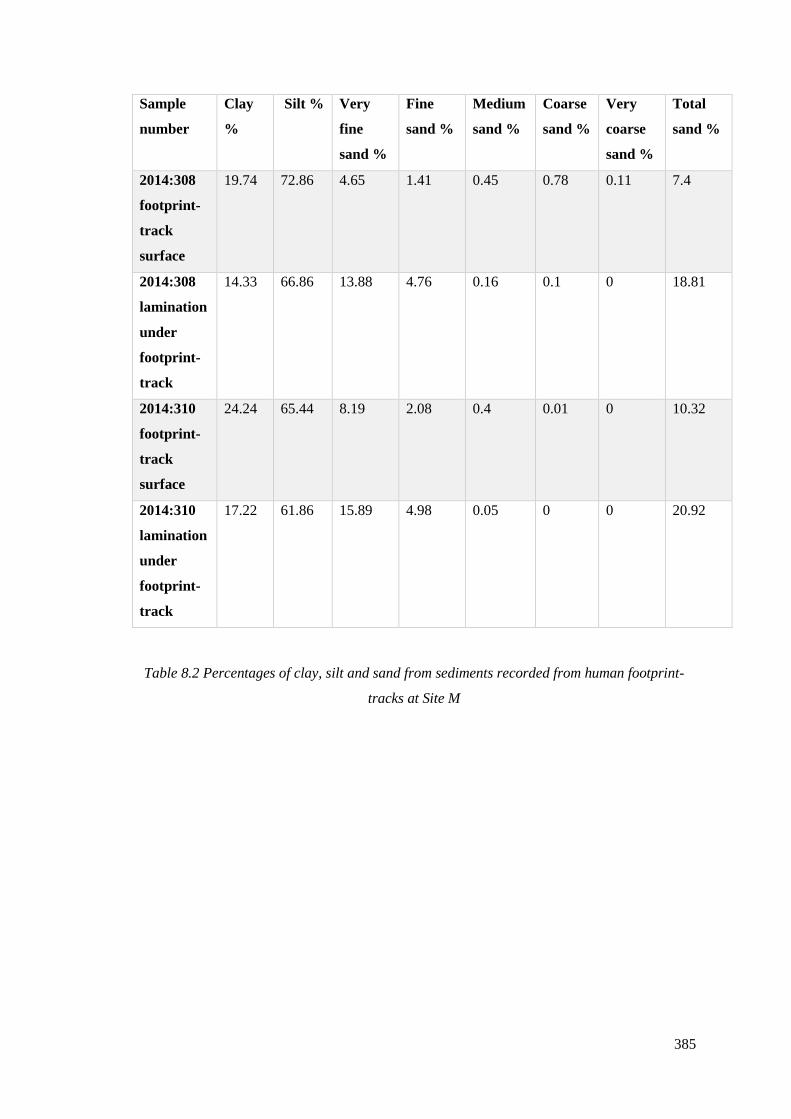
385
Sample
number
Clay
%
Silt % Very
fine
sand %
Fine
sand %
Medium
sand %
Coarse
sand %
Very
coarse
sand %
Total
sand %
2014:308
footprint-
track
surface
19.74 72.86 4.65 1.41 0.45 0.78 0.11 7.4
2014:308
lamination
under
footprint-
track
14.33 66.86 13.88 4.76 0.16 0.1 0 18.81
2014:310
footprint-
track
surface
24.24 65.44 8.19 2.08 0.4 0.01 0 10.32
2014:310
lamination
under
footprint-
track
17.22 61.86 15.89 4.98 0.05 0 0 20.92
Table 8.2 Percentages of clay, silt and sand from sediments recorded from human footprint-
tracks at Site M

386
Figure 8.7 SCC trigon showing sediment from probable human footprint-tracks at Site M
8.4.3 Site N
The samples from Site N were collected from the same laminations; a human footprint-track
trail containing footprints 2015:17, 2015:18 and 2015:20, and multiple bird footprints (2015:16
and 2015:19). The human footprint-tracks were overtraces/undertraces, whereas avian footprint
2015:16 was possibly an actual footprint. Samples were gathered from the top laminated surface
where the footprint-tracks were exposed, as well as the lamination underneath it.
% sand
30
20
10
0
40
50
60
70
80
90
100
(si)sC (s)siC
(si)cS (s)cSI
ssiC
sicS scSI
(vc)(s)SI(vc)sSI(vc)siS(vc)(si)S
(si)(c)S (c)siS (c)sSI (s)(c)SI
cSIcS
SIS (vs)SI
(vs)(vc)SI
(vc)SI
(s)SIsSI
(c)S
(vsi)(vc)S
(vc)S
(vsi)S (si)S siS
C
(s)(si)C
siCsC
(s)C (si)C
(vsi)C
(vs)C (vs)(vsi)C
SSIC
sandsiltclay
sandysiltyclayey
ssic
(s)(si)(c)
slightly sandyslightly siltyslightly clayey
(vs)(vsi)(vc)
very slightly sandyvery slightly siltyvery slightly clayey

387
Unlike Site C/E and Site M, the sediment from Site N indicated a larger particle size within the
walked-upon lamination, whereas the underlying laminatin had a smaller particle size (Table
8.3). The particle sizes of the underlying footprint-track laminations at Site N ranged from
slightly sandy clay silt to slightly sandy slightly clayey silt (Figure 8.8). The slightly clayey
sandy silt composition of the footprint surface at Site N was not a sediment composition seen in
any of the other footprint sites, indicating these prints were made at a different time, during
different conditions, perhaps from a different facet of the foreshore environment or at a time of
the year of higher energy conditions.
Sample
number
Clay % Silt
%
Very
fine
sand %
Fine
sand
%
Mediu
m sand
%
Coars
e sand
%
Very
coars
e
sand
%
Total
sand
%
2015:16
footprint
surface
6.73 62.67 19.85 8.98 1.68 0,9 0 30.6
2015:16
lamination
under
footprint
14.9 70.84 7.94 4.28 1.26 0.38 0.27 14.13
2015:18
footprint-
track surface
12.25 65.28 13.53 7.12 0.67 0.5 0.48 22.3
2015:18
lamination
under
footprint-
track
21.98 66.66 6.61 3.92 0.42 0.32 0.09 11.35
Table 8.3 Percentages of clay, silt and sand from sediments recorded from Site N
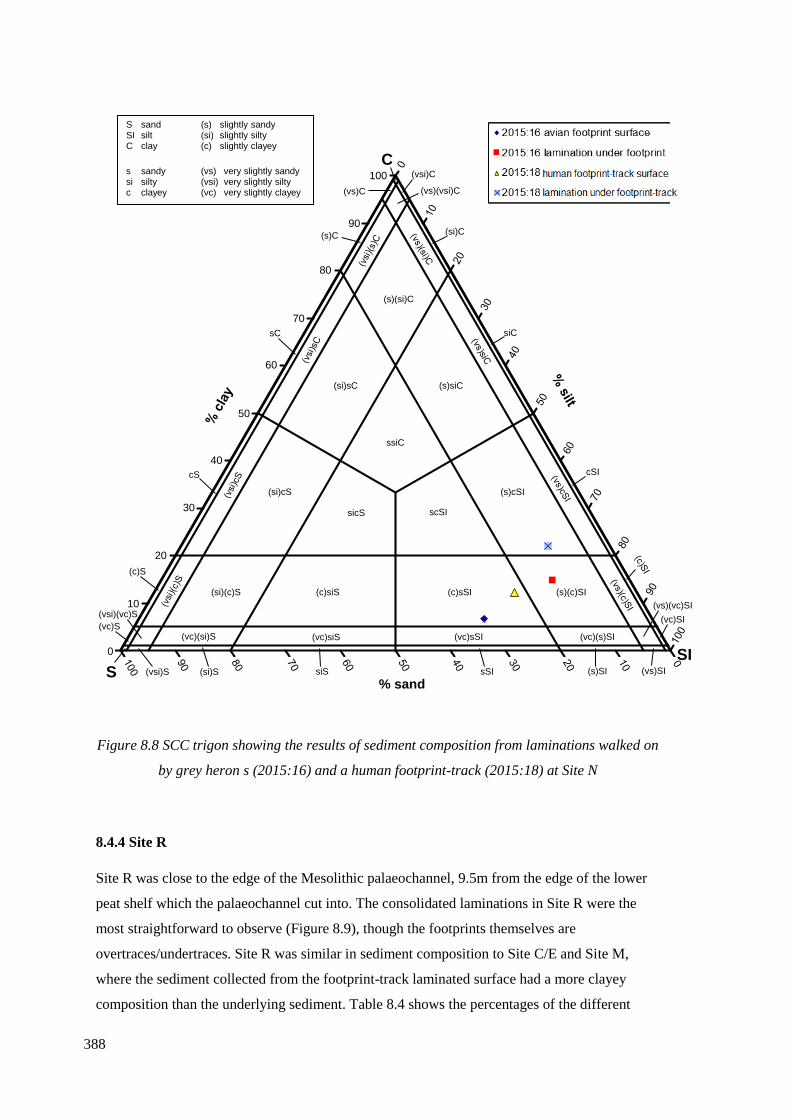
388
Figure 8.8 SCC trigon showing the results of sediment composition from laminations walked on
by grey heron s (2015:16) and a human footprint-track (2015:18) at Site N
8.4.4 Site R
Site R was close to the edge of the Mesolithic palaeochannel, 9.5m from the edge of the lower
peat shelf which the palaeochannel cut into. The consolidated laminations in Site R were the
most straightforward to observe (Figure 8.9), though the footprints themselves are
overtraces/undertraces. Site R was similar in sediment composition to Site C/E and Site M,
where the sediment collected from the footprint-track laminated surface had a more clayey
composition than the underlying sediment. Table 8.4 shows the percentages of the different
% sand
30
20
10
0
40
50
60
70
80
90
100
(si)sC (s)siC
(si)cS (s)cSI
ssiC
sicS scSI
(vc)(s)SI(vc)sSI(vc)siS(vc)(si)S
(si)(c)S (c)siS (c)sSI (s)(c)SI
cSIcS
SIS (vs)SI
(vs)(vc)SI
(vc)SI
(s)SIsSI
(c)S
(vsi)(vc)S
(vc)S
(vsi)S (si)S siS
C
(s)(si)C
siCsC
(s)C (si)C
(vsi)C
(vs)C (vs)(vsi)C
SSIC
sandsiltclay
sandysiltyclayey
ssic
(s)(si)(c)
slightly sandyslightly siltyslightly clayey
(vs)(vsi)(vc)
very slightly sandyvery slightly siltyvery slightly clayey
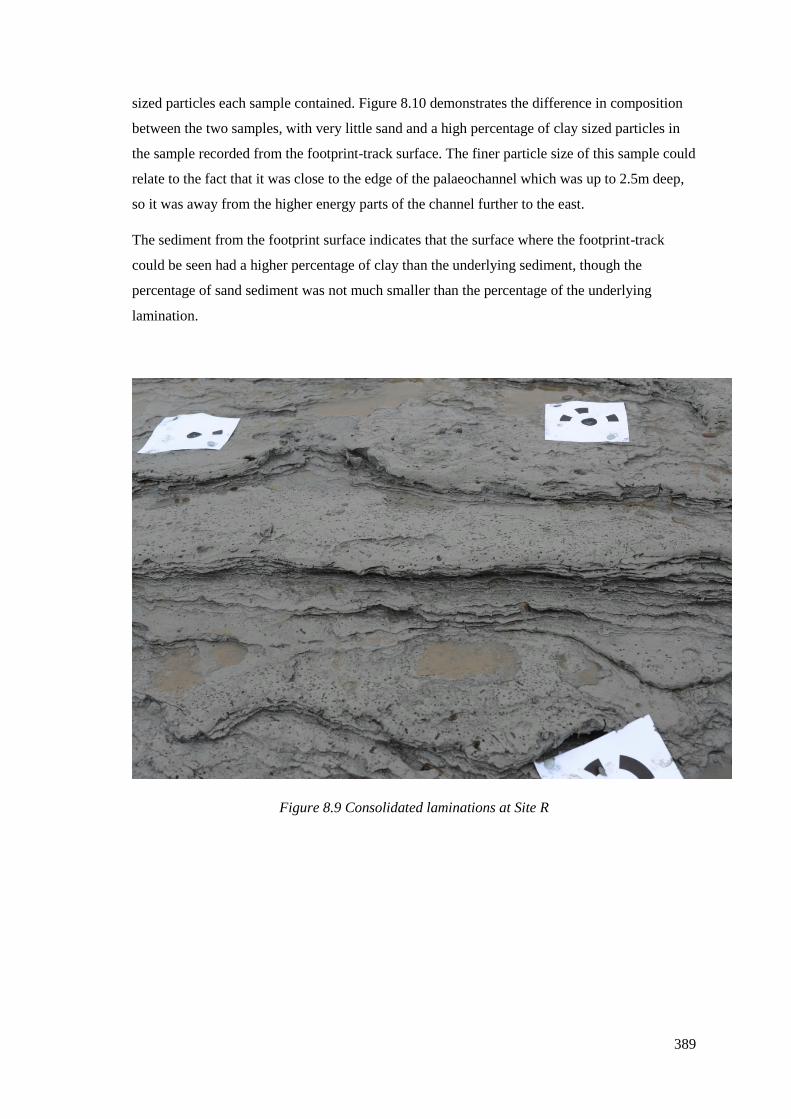
389
sized particles each sample contained. Figure 8.10 demonstrates the difference in composition
between the two samples, with very little sand and a high percentage of clay sized particles in
the sample recorded from the footprint-track surface. The finer particle size of this sample could
relate to the fact that it was close to the edge of the palaeochannel which was up to 2.5m deep,
so it was away from the higher energy parts of the channel further to the east.
The sediment from the footprint surface indicates that the surface where the footprint-track
could be seen had a higher percentage of clay than the underlying sediment, though the
percentage of sand sediment was not much smaller than the percentage of the underlying
lamination.
Figure 8.9 Consolidated laminations at Site R

390
Sample
number
Clay
%
Silt
%
Very
fine
sand
%
Fine
sand
%
Mediu
m sand
%
Coarse
sand
%
Very
coarse
sand
%
Total
sand %
2016:73
footprint-
track surface
22.58 67.8
5
5.82 3.53 0.2 0.02 0 9.57
2016:73
lamination
under
footprint-
track
8.54 79.7
9
7.74 3.69 0.1 0.02 0.08 11.63
Table 8.4 Percentages of clay, silt and sand from sediment recorded in Site R
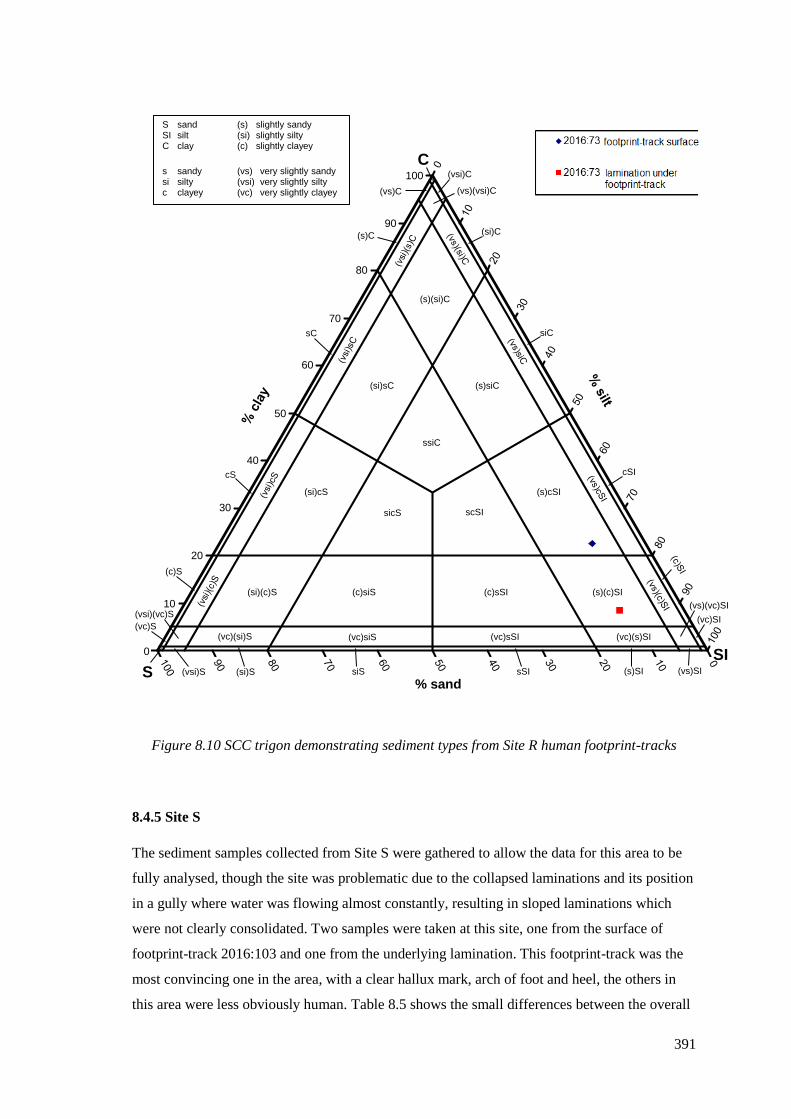
391
Figure 8.10 SCC trigon demonstrating sediment types from Site R human footprint-tracks
8.4.5 Site S
The sediment samples collected from Site S were gathered to allow the data for this area to be
fully analysed, though the site was problematic due to the collapsed laminations and its position
in a gully where water was flowing almost constantly, resulting in sloped laminations which
were not clearly consolidated. Two samples were taken at this site, one from the surface of
footprint-track 2016:103 and one from the underlying lamination. This footprint-track was the
most convincing one in the area, with a clear hallux mark, arch of foot and heel, the others in
this area were less obviously human. Table 8.5 shows the small differences between the overall
% sand
30
20
10
0
40
50
60
70
80
90
100
(si)sC (s)siC
(si)cS (s)cSI
ssiC
sicS scSI
(vc)(s)SI(vc)sSI(vc)siS(vc)(si)S
(si)(c)S (c)siS (c)sSI (s)(c)SI
cSIcS
SIS (vs)SI
(vs)(vc)SI
(vc)SI
(s)SIsSI
(c)S
(vsi)(vc)S
(vc)S
(vsi)S (si)S siS
C
(s)(si)C
siCsC
(s)C (si)C
(vsi)C
(vs)C (vs)(vsi)C
SSIC
sandsiltclay
sandysiltyclayey
ssic
(s)(si)(c)
slightly sandyslightly siltyslightly clayey
(vs)(vsi)(vc)
very slightly sandyvery slightly siltyvery slightly clayey
392
sediment composition, with Figure 8.11 providing a visual representation of this data, with both
samples composing of slightly sandy clayey silt.
Sample number Clay % Silt
%
Very
fine
sand
%
Fine
sand
%
Medium
sand %
Coarse
sand
%
Very
coarse
sand
%
Total
sand
%
2016:103
footprint-track
surface
22.41 59.81 11.32 6 0.46 0 0 17.78
2016:103
lamination under
footprint-track
29.48 57.68 6.93 4.98 0.55 0.36 0.02 12.84
Table 8.5 Percentages of clay, silt and sand from Site S samples

393
Figure 8.11 SCC trigon showing sediment size of samples from Site S human footprint-track
2016:103
8.5 Discussion
Within all the sediment sampled, silt was the main component, with only one sample, 2015:130,
which was collected from under the footprint surface, falling below 50% silt composition. This
high silt percentage is to be expected, previous work by Allen (2004) described the sediments as
sandy-clayey silts and this is generally seen in areas such as the Severn Estuary, where there has
been a transgressive marine environment (Figure 8.12). Allen (2004) sampled four complete
lamination bands at Goldcliff (G2-G5) as well as most of a fifth band (G1) and part of a sixth
% sand
30
20
10
0
40
50
60
70
80
90
100
(si)sC (s)siC
(si)cS (s)cSI
ssiC
sicS scSI
(vc)(s)SI(vc)sSI(vc)siS(vc)(si)S
(si)(c)S (c)siS (c)sSI (s)(c)SI
cSIcS
SIS (vs)SI
(vs)(vc)SI
(vc)SI
(s)SIsSI
(c)S
(vsi)(vc)S
(vc)S
(vsi)S (si)S siS
C
(s)(si)C
siCsC
(s)C (si)C
(vsi)C
(vs)C (vs)(vsi)C
SSIC
sandsiltclay
sandysiltyclayey
ssic
(s)(si)(c)
slightly sandyslightly siltyslightly clayey
(vs)(vsi)(vc)
very slightly sandyvery slightly siltyvery slightly clayey
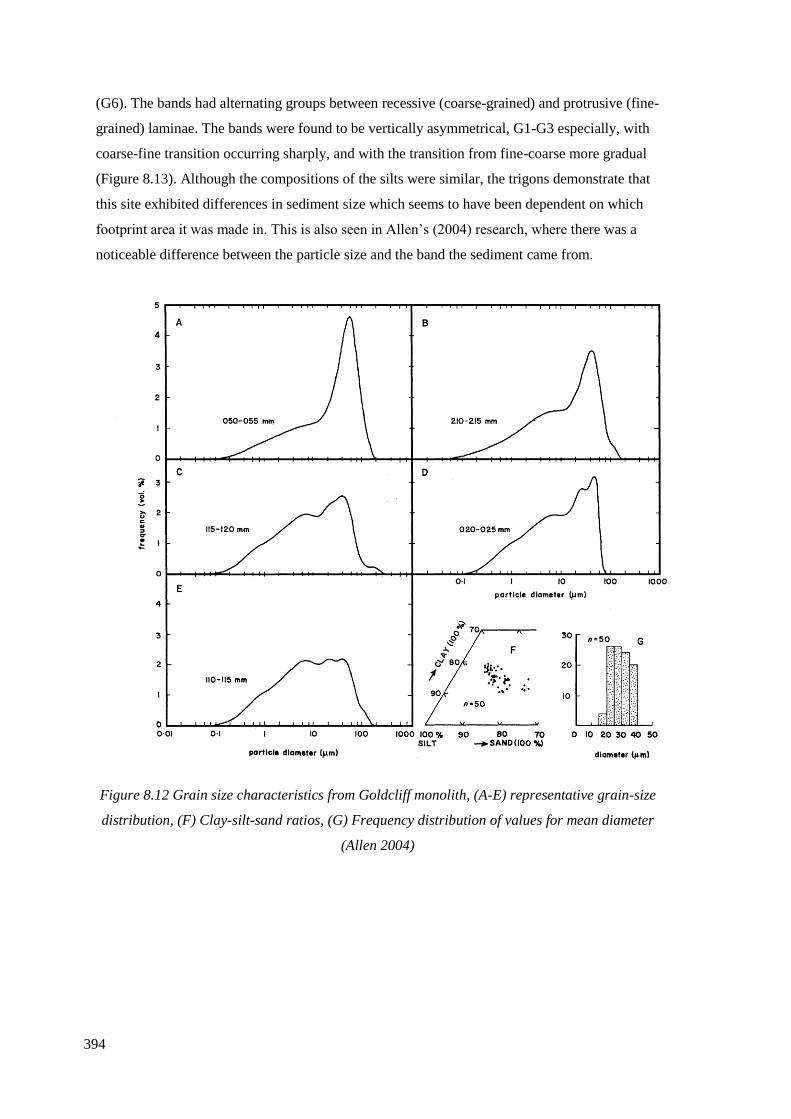
394
(G6). The bands had alternating groups between recessive (coarse-grained) and protrusive (fine-
grained) laminae. The bands were found to be vertically asymmetrical, G1-G3 especially, with
coarse-fine transition occurring sharply, and with the transition from fine-coarse more gradual
(Figure 8.13). Although the compositions of the silts were similar, the trigons demonstrate that
this site exhibited differences in sediment size which seems to have been dependent on which
footprint area it was made in. This is also seen in Allen’s (2004) research, where there was a
noticeable difference between the particle size and the band the sediment came from.
Figure 8.12 Grain size characteristics from Goldcliff monolith, (A-E) representative grain-size
distribution, (F) Clay-silt-sand ratios, (G) Frequency distribution of values for mean diameter
(Allen 2004)
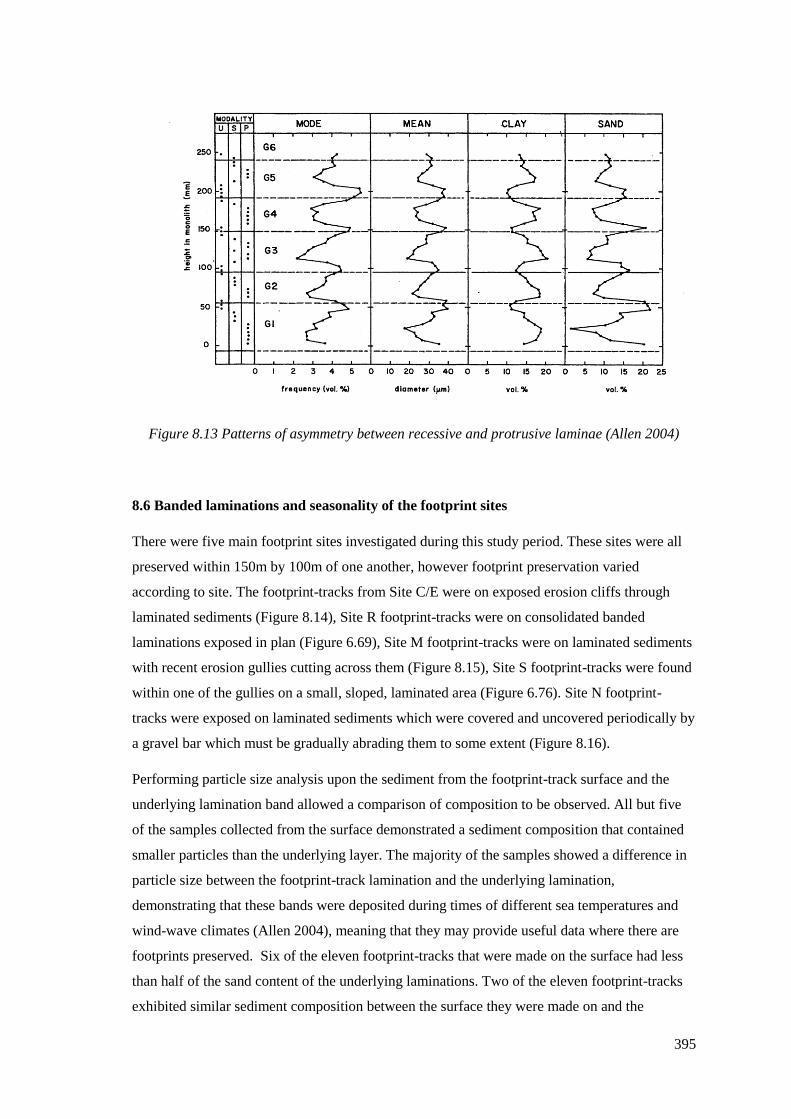
395
Figure 8.13 Patterns of asymmetry between recessive and protrusive laminae (Allen 2004)
8.6 Banded laminations and seasonality of the footprint sites
There were five main footprint sites investigated during this study period. These sites were all
preserved within 150m by 100m of one another, however footprint preservation varied
according to site. The footprint-tracks from Site C/E were on exposed erosion cliffs through
laminated sediments (Figure 8.14), Site R footprint-tracks were on consolidated banded
laminations exposed in plan (Figure 6.69), Site M footprint-tracks were on laminated sediments
with recent erosion gullies cutting across them (Figure 8.15), Site S footprint-tracks were found
within one of the gullies on a small, sloped, laminated area (Figure 6.76). Site N footprint-
tracks were exposed on laminated sediments which were covered and uncovered periodically by
a gravel bar which must be gradually abrading them to some extent (Figure 8.16).
Performing particle size analysis upon the sediment from the footprint-track surface and the
underlying lamination band allowed a comparison of composition to be observed. All but five
of the samples collected from the surface demonstrated a sediment composition that contained
smaller particles than the underlying layer. The majority of the samples showed a difference in
particle size between the footprint-track lamination and the underlying lamination,
demonstrating that these bands were deposited during times of different sea temperatures and
wind-wave climates (Allen 2004), meaning that they may provide useful data where there are
footprints preserved. Six of the eleven footprint-tracks that were made on the surface had less
than half of the sand content of the underlying laminations. Two of the eleven footprint-tracks
exhibited similar sediment composition between the surface they were made on and the
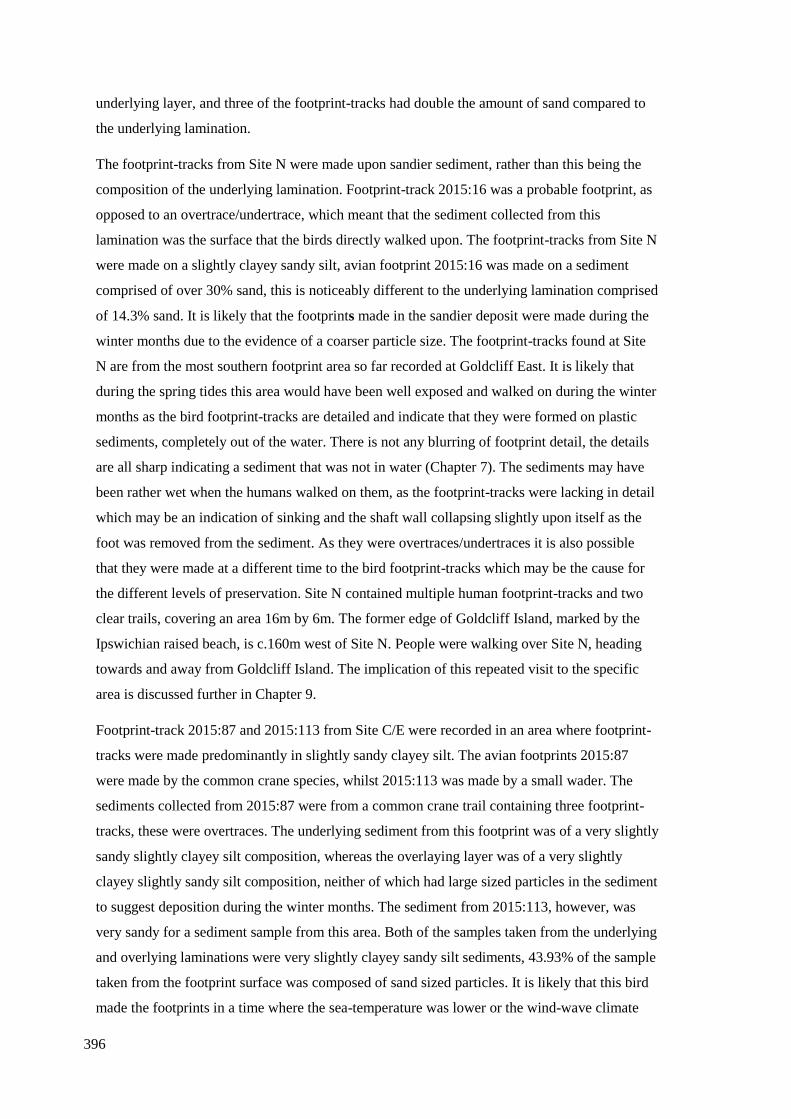
396
underlying layer, and three of the footprint-tracks had double the amount of sand compared to
the underlying lamination.
The footprint-tracks from Site N were made upon sandier sediment, rather than this being the
composition of the underlying lamination. Footprint-track 2015:16 was a probable footprint, as
opposed to an overtrace/undertrace, which meant that the sediment collected from this
lamination was the surface that the birds directly walked upon. The footprint-tracks from Site N
were made on a slightly clayey sandy silt, avian footprint 2015:16 was made on a sediment
comprised of over 30% sand, this is noticeably different to the underlying lamination comprised
of 14.3% sand. It is likely that the footprints made in the sandier deposit were made during the
winter months due to the evidence of a coarser particle size. The footprint-tracks found at Site
N are from the most southern footprint area so far recorded at Goldcliff East. It is likely that
during the spring tides this area would have been well exposed and walked on during the winter
months as the bird footprint-tracks are detailed and indicate that they were formed on plastic
sediments, completely out of the water. There is not any blurring of footprint detail, the details
are all sharp indicating a sediment that was not in water (Chapter 7). The sediments may have
been rather wet when the humans walked on them, as the footprint-tracks were lacking in detail
which may be an indication of sinking and the shaft wall collapsing slightly upon itself as the
foot was removed from the sediment. As they were overtraces/undertraces it is also possible
that they were made at a different time to the bird footprint-tracks which may be the cause for
the different levels of preservation. Site N contained multiple human footprint-tracks and two
clear trails, covering an area 16m by 6m. The former edge of Goldcliff Island, marked by the
Ipswichian raised beach, is c.160m west of Site N. People were walking over Site N, heading
towards and away from Goldcliff Island. The implication of this repeated visit to the specific
area is discussed further in Chapter 9.
Footprint-track 2015:87 and 2015:113 from Site C/E were recorded in an area where footprint-
tracks were made predominantly in slightly sandy clayey silt. The avian footprints 2015:87
were made by the common crane species, whilst 2015:113 was made by a small wader. The
sediments collected from 2015:87 were from a common crane trail containing three footprint-
tracks, these were overtraces. The underlying sediment from this footprint was of a very slightly
sandy slightly clayey silt composition, whereas the overlaying layer was of a very slightly
clayey slightly sandy silt composition, neither of which had large sized particles in the sediment
to suggest deposition during the winter months. The sediment from 2015:113, however, was
very sandy for a sediment sample from this area. Both of the samples taken from the underlying
and overlying laminations were very slightly clayey sandy silt sediments, 43.93% of the sample
taken from the footprint surface was composed of sand sized particles. It is likely that this bird
made the footprints in a time where the sea-temperature was lower or the wind-wave climate
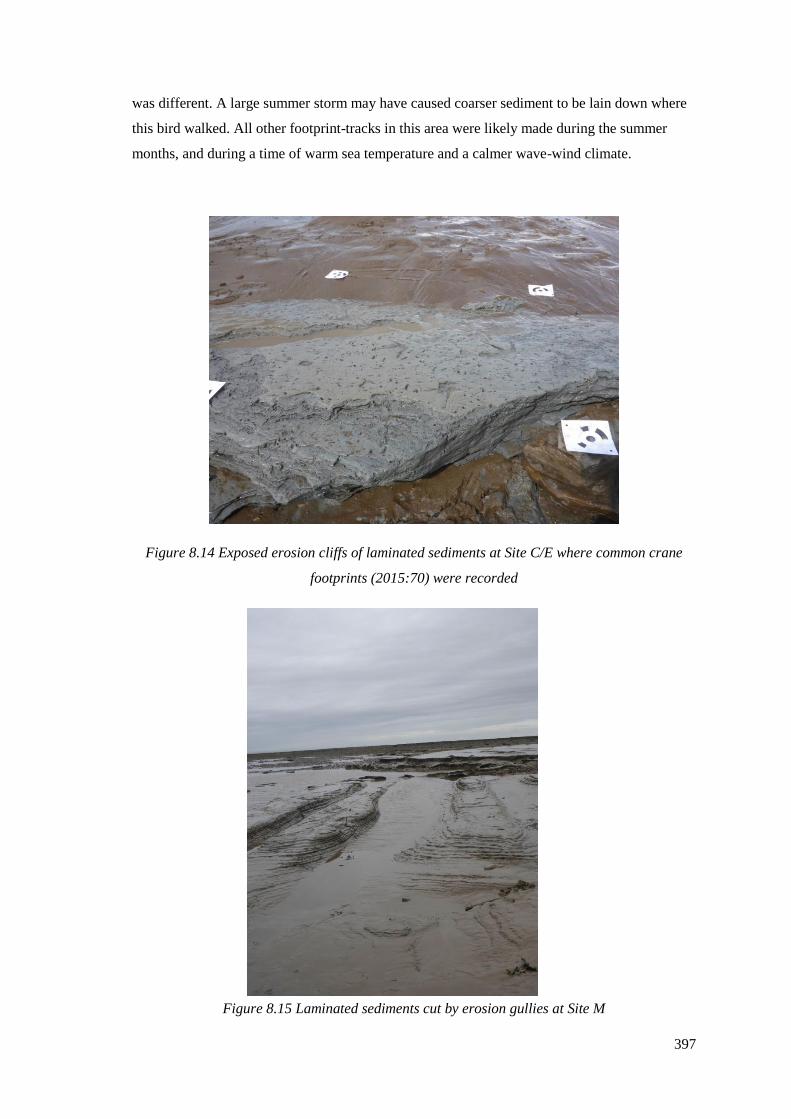
397
was different. A large summer storm may have caused coarser sediment to be lain down where
this bird walked. All other footprint-tracks in this area were likely made during the summer
months, and during a time of warm sea temperature and a calmer wave-wind climate.
Figure 8.14 Exposed erosion cliffs of laminated sediments at Site C/E where common crane
footprints (2015:70) were recorded
Figure 8.15 Laminated sediments cut by erosion gullies at Site M
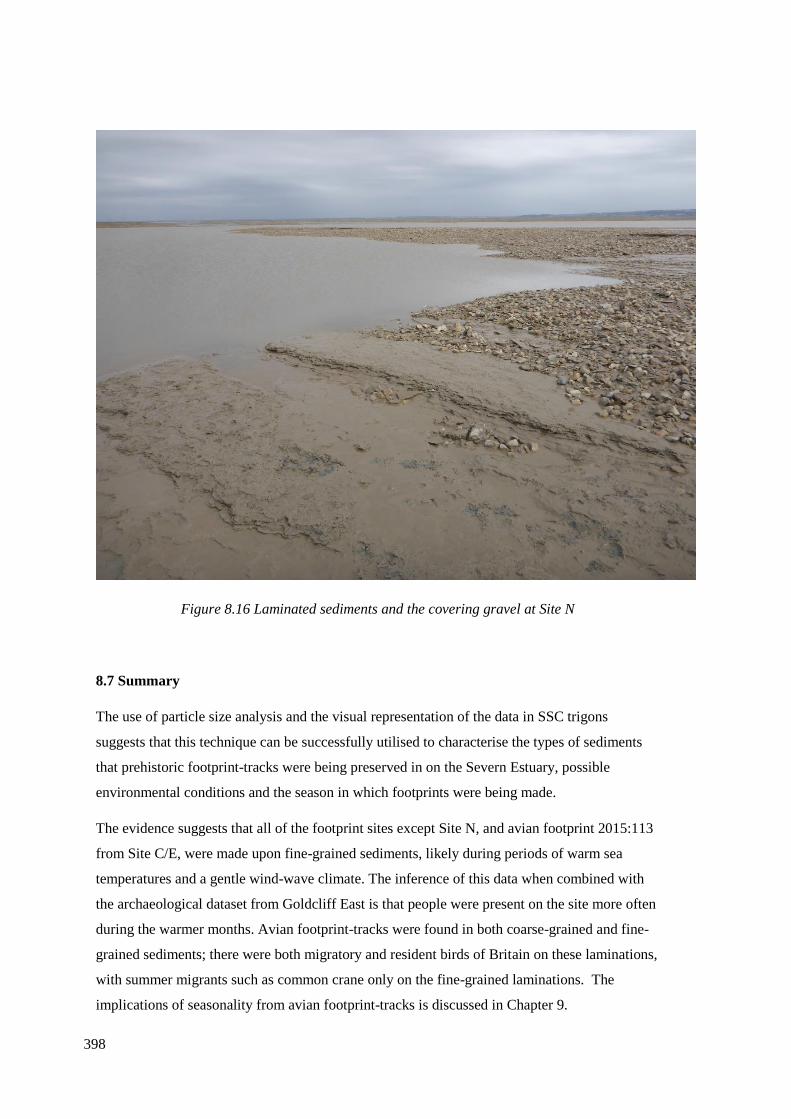
398
Figure 8.16 Laminated sediments and the covering gravel at Site N
8.7 Summary
The use of particle size analysis and the visual representation of the data in SSC trigons
suggests that this technique can be successfully utilised to characterise the types of sediments
that prehistoric footprint-tracks were being preserved in on the Severn Estuary, possible
environmental conditions and the season in which footprints were being made.
The evidence suggests that all of the footprint sites except Site N, and avian footprint 2015:113
from Site C/E, were made upon fine-grained sediments, likely during periods of warm sea
temperatures and a gentle wind-wave climate. The inference of this data when combined with
the archaeological dataset from Goldcliff East is that people were present on the site more often
during the warmer months. Avian footprint-tracks were found in both coarse-grained and fine-
grained sediments; there were both migratory and resident birds of Britain on these laminations,
with summer migrants such as common crane only on the fine-grained laminations. The
implications of seasonality from avian footprint-tracks is discussed in Chapter 9.

399
The footprint-tracks at Site N were made upon laminations with a coarser-grained particle size,
which was likely deposited during the colder winter months. Knowledge of the particle size of
the laminations walked upon, as well as of the species that formed the footprints, assists in our
interpretation of a site, such as in ascertaining the season in which certain activities were
occurring and site usage of the area.
400
Chapter 9
The paleoecology of Mesolithic Goldcliff East: footprint-tracks and other archaeological
data
9.1 Introduction
The extensive prehistoric human exploitation of saltmarsh wetland at Goldcliff East spans
throughout the Mesolithic, to the Iron Age and beyond. The saltmarsh environment provided a
habitat rich in nutrients, which would appeal to grazing animals, and was utilised during the
Bronze Age for sheep and cattle dairy husbandry (Barr and Bell 2016). During the Mesolithic,
hunter-gatherers were exploiting the area for resources, with data indicating seasonal activities.
By examining the environmental, skeletal and artefact data from previous research at Goldcliff,
alongside the footprint-track data, a more detailed understanding of the people who were in the
area and the activities they were undertaking can be gained.
9.2 Vegetation succession at Goldcliff East
Goldcliff was a rich environment; the ecology was heavily influenced by the sea, with sea level
fluctuations influencing the vegetation (Dark 2007, p 185). Pollen evidence at Goldcliff
indicates a dynamic wetland edge environment. The Mesolithic settlements were on the edge of
the former island and rose up the island edge with rising sea level and associated sedimentation.
The footprints correspond with successive settlements on the island and were made during
transgressive phases when saltmarsh sediments were accumulating. The vegetation succession
at Goldcliff is complex, and is dealt with thoroughly by Caseldine (2000), Timpany (2007), and
Dark (2007), however a very brief summary of the relevant succession is given below to
highlight the environmental changes at Goldcliff during the Mesolithic. Some of the resources
that may have been available and activities being undertaken by the footprint-track makers are
also discussed.
High representation of goosefoot pollen in the basal zone at Site W, as well as high levels of
wild grass pollen, indicate that both saltmarsh and reed swamp were developing in the wetland
environment and at the edge of the island. Radiocarbon dates from the site vary from 6760 ±80
BP (OxA-6683) to 6420 ±60 BP (SWAN-28; Caseldine 2000, p 214). At the edge of the island
there was a woodland of oak (Quercus), elm (Ulmus), lime (Tilia) and hazel (Corylus). Between
c.6400-5900 radiocarbon years BP marine inundation occurred (Caseldine 2000). Pollen values
were low and suggest a wild salt marsh and coastal grass habitat (Dickson 1988). It is during
this phase that the footprint-tracks from the Lower Wentlooge Formation were found on the
401
banded laminations made by individuals walking in the saltmarsh environment. At Uskmouth
the pollen and foraminifera from the fill of one of the Mesolithic footprint-tracks were analysed
(Caseldine 1992; Culver and Lundquist 1992), this footprint was made in clayey silt that
predates 6250±80 BP (OxA-2627) and results indicate that the environment was mudflats and
saltmarsh (Aldhouse-Green et al. 1992).
Following rapid sea level rise from the early Holocene, which facilitated saltmarsh development
and palaeochannel incision, sea level rise slowed by c.6000 radiocarbon years BP. This phase of
reduced marine influence resulted in an expansion of sedge and reed (Caseldine 2000, p 216). It
is still likely that there would have been some saltmarsh, however there would have been a
large area of reed swamp, sedge, and carr-woodland on the fringe between the saltmarsh and
dry land.
During the period of 5650-4900 radiocarbon years BP there was a rise in birch fen woodland
(Caseldine 2000). The carr-woodland that fringed the island began to decline, with alder
declining steadily. This carr-woodland decline is thought to have been brought on by a brief
marine phase before 5530±90 BP (CAR-657; Caseldine 2000; Smith and Morgan 1989). The
dry land island environment remained relatively unchanged, oak was still a dominant species,
however there began to be a decline in elm. By 4900±60 BP (CAR-1500; Caseldine 2000, p
218), after around 1000 years of carr-woodland, raised bog began to grow and replace the birch
fen woodland. The raised bog would have affected people’s ability to hunt, and animals’ ability
to graze, and there is very limited evidence of human activity in the wetland environment with
no human, bird or animal footprint-tracks recorded at this site during this time.
During the Mesolithic the woodland and saltmarshes would have provided a variety of
resources to both humans and animals such as roots, tubers, nuts, berries, bark, and reeds.
Submerged forests were found at Goldcliff East and other surrounding intertidal sites such as
Redwick and Magor (Timpany 2002, 2007). At Redwick there were as many as 100 trunks and
tree stumps from oak, believed to represent a dense oak woodland (Timpany 2005). Some of the
Holocene estuarine peats contained charcoal horizons indicating multiple episodes of vegetation
burning (Bell 2001). At Site W a charcoal spread was found in association with multiple
artefacts, dated to c. 6420±80 BP (GU-2759; Bell et al. 2000). A comparison of the pollen and
charcoal data from Goldcliff East Sites B and D, as well as the charcoal spread at Site W,
indicated that the burning of reed swamp and hazel woodland was occurring on the fringes of
Goldcliff Island, as well as possible burning in hearth and activity areas (Dark 2007, p 183). If
the people of Goldcliff were deliberately burning reedbeds before or during the flowering
season then this burning would have likely been occurring in summer/early autumn.
402
Possible deliberate burning of reedbeds has been reported at Star Carr (Mellars and Dark 1998),
where it is thought this was done to prevent plants from flowering and promote new reed
growth which would attract animals, such as red deer, to graze (Mellars 1976). At the site of
Neumark-Nord 2, Germany, there was possible evidence of strategic vegetation burning by
Neanderthals (Pop and Bakels 2015). It is debated whether the primary goal of this technique
was long term or short term (Bliege-Bird et al. 2008, 2013; Holdaway et al. 2013; Mooney et
al. 2011; Morton et al. 2011), however the new vegetation did create a mosaic of old and new
plant life which would appeal to game and other animals. It is difficult to distinguish if
Mesolithic burning episodes were deliberate or if they were natural occurrences such as wild
fires (Brown 1997), however burning at coastal sites is probably more likely to be deliberate, as
the area would have been very wet (Rackam 1986).
In an ethnographic study by Scherjon et al. (2015), it was found that the deliberate burning of
vegetation was a seasonal activity, to take advantage of the dry plants. It was often done by
women to flush prey out towards the male hunters, or to trap them in a certain area. Among the
hunter-gatherer Tiwi camp, Australia, grass burning is implemented to hunt kangaroos and to
encourage new vegetation growth to attract game, indicating that this tribe hunt with fire for an
immediate gain, the kangaroo meat, as well as the future gain of the new game and foraging
opportunities that will occur in this area. Although the burning at Goldcliff may have been an
accident, such as a hearth fire getting out of control, it may also have been a woodland clearing
strategy (Gale 2007, p 186).
Hazelnuts were heavily exploited during the Mesolithic period. Oak and hazel trees were both
growing at Goldcliff, so both types of nuts would have been available, however no evidence of
acorns was found, perhaps for preservation reasons. Hazelnuts can be eaten cooked or raw and
store well; acorns however require processing to remove the tannis so would be a complicated
food source (Driver 1953). In Britain sites such as Staffin Bay, Isle of Skye, contained evidence
of hazelnut exploitation, with charred hazelnut fragments radiocarbon dated to 6800-6600 cal
BC (Page 2016). At a further Mesolithic site, Broom Hill, Hampshire, there were hundreds of
thousands of charred hazelnuts which had been deposited in a large, circular depression (Mithen
1999). Hazelnuts also appear in multiple Mesolithic sites across Europe, as well as other sites
from prehistory, indicating that this was a popular, and common, food choice (Jessen 1924,
Regnell et al. 1995; Robinson & Harild 2002). Regnell (2012), studied the Mesolithic site
Tagerup, Scania, Sweden, as well as other sites along the West Coast Line Railway track
project, where it was found that hazelnut shells made up 81% of the plant remains from this
site, in comparison to the Neolithic site containing 21%, and the Bronze Age just 8%. Zvelebil
(1994) defines the Mesolithic hunter-gatherers’ exploitation of hazelnuts as ‘systematic and
intensive’.
403
At the site of Goldcliff East the evidence for hazelnut can be found at several of the Mesolithic
areas. At Site J there were 2794 hazelnut fragments recorded, and at Site A charred hazelnut
shells have been found (Dark 2007, p 181). Many of the hazelnuts from Site J were not charred,
but had been buried, presumably by squirrels, which gives another insight into the ecology of
the area. Hazelnuts have a high plant protein content, as well as dietary fibre, fat, essential
vitamins and amino-acids, so they would have been an appealing food source (Amaral et al.
2006). They would have been targeted by humans and mammals; deer and pig are very fond of
ripe hazelnuts, so many hazel trees may have attracted game to the area.
The charred remains of hazelnuts at Site A, B and J are possibly from food that was being
collected during the autumn months, however they do store well so any hazelnuts found on site
may have been from the year before (Dark 2007, p 183). Further seasonal and environmental
evidence is found in the charred and uncharred remains of soft fruit. Unlike hazelnuts, fruit
need to be consumed relatively quickly before they start to rot, and so are a seasonal indicator.
Several hundred uncharred seeds came from elder (Sambucus nigra), these trees have ripened
fruits during August and September. There was also evidence of sloe (Prunus spinosa) and two
possible dog wood stones from Site A, again these would have been available during late
August and September (Dark 2007, p 183). Site W also contained evidence of plant remains,
including charred seeds such as the seed of greater plantin (Plantago major), a fragment of
hazelnut and rush and grass species (Bell 2007, Table 18.3). The plant species burned in these
areas suggests a predominance of summer and autumn activity at Goldcliff, however evidence
throughout the sites from a variety of sources indicates activity at other times of the year (Bell
et al. 2007). These other seasonal indicators will be discussed throughout the rest of this chapter
which focuses on the Mesolithic footprint-tracks and what this information can tell us about the
palaeoecology of Goldcliff.
9.3 Footprint-track assemblage at Goldcliff East
The footprint assemblage at Goldcliff East is extremely rich, with 856 Late Mesolithic human,
birds and mammal footprint-tracks recorded over the past 16 years (Table 9.1). Over this period
recording techniques have developed, with the tracing of footprints being replaced with utilising
multi-image photogrammetry (Chapter 4). Multi-image photogrammetry allows for quick and
accurate recording. The advantage of this technique over tracing is that all details of the
footprint-track get recorded. This contrasts with tracing, where interpretation is fairly
subjective.
Recording the footprint-tracks using standard photography, planning, metric measurements,
direction of orientation and in certain situations casting, also compliment multi-image
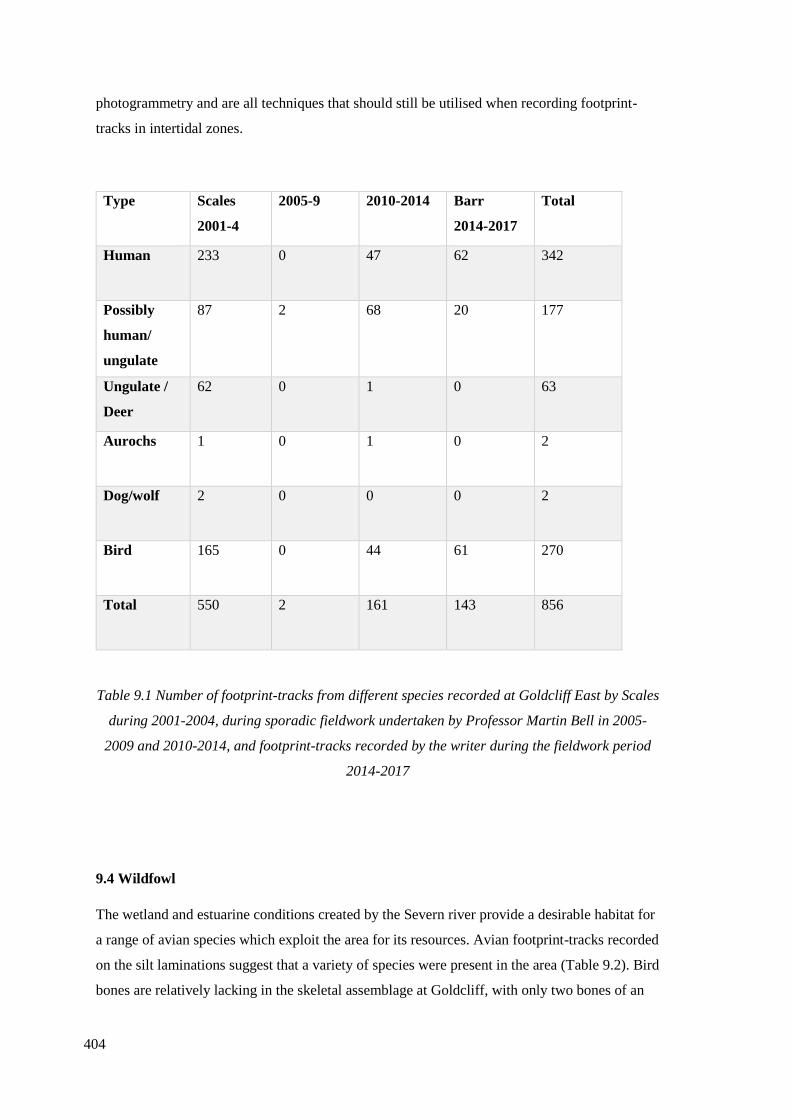
404
photogrammetry and are all techniques that should still be utilised when recording footprint-
tracks in intertidal zones.
Type Scales
2001-4
2005-9 2010-2014 Barr
2014-2017
Total
Human 233 0 47 62 342
Possibly
human/
ungulate
87 2 68 20 177
Ungulate /
Deer
62 0 1 0 63
Aurochs 1 0 1 0 2
Dog/wolf 2 0 0 0 2
Bird 165 0 44 61 270
Total 550 2 161 143 856
Table 9.1 Number of footprint-tracks from different species recorded at Goldcliff East by Scales
during 2001-2004, during sporadic fieldwork undertaken by Professor Martin Bell in 2005-
2009 and 2010-2014, and footprint-tracks recorded by the writer during the fieldwork period
2014-2017
9.4 Wildfowl
The wetland and estuarine conditions created by the Severn river provide a desirable habitat for
a range of avian species which exploit the area for its resources. Avian footprint-tracks recorded
on the silt laminations suggest that a variety of species were present in the area (Table 9.2). Bird
bones are relatively lacking in the skeletal assemblage at Goldcliff, with only two bones of an
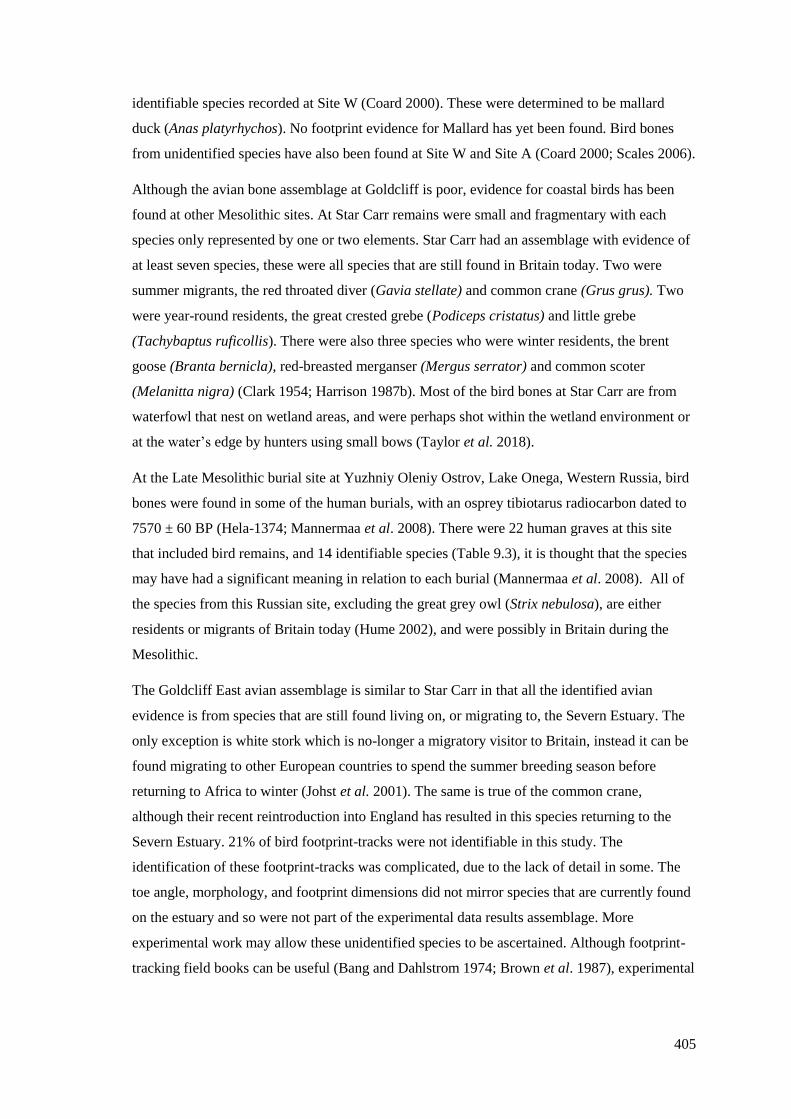
405
identifiable species recorded at Site W (Coard 2000). These were determined to be mallard
duck (Anas platyrhychos). No footprint evidence for Mallard has yet been found. Bird bones
from unidentified species have also been found at Site W and Site A (Coard 2000; Scales 2006).
Although the avian bone assemblage at Goldcliff is poor, evidence for coastal birds has been
found at other Mesolithic sites. At Star Carr remains were small and fragmentary with each
species only represented by one or two elements. Star Carr had an assemblage with evidence of
at least seven species, these were all species that are still found in Britain today. Two were
summer migrants, the red throated diver (Gavia stellate) and common crane (Grus grus). Two
were year-round residents, the great crested grebe (Podiceps cristatus) and little grebe
(Tachybaptus ruficollis). There were also three species who were winter residents, the brent
goose (Branta bernicla), red-breasted merganser (Mergus serrator) and common scoter
(Melanitta nigra) (Clark 1954; Harrison 1987b). Most of the bird bones at Star Carr are from
waterfowl that nest on wetland areas, and were perhaps shot within the wetland environment or
at the water’s edge by hunters using small bows (Taylor et al. 2018).
At the Late Mesolithic burial site at Yuzhniy Oleniy Ostrov, Lake Onega, Western Russia, bird
bones were found in some of the human burials, with an osprey tibiotarus radiocarbon dated to
7570 ± 60 BP (Hela-1374; Mannermaa et al. 2008). There were 22 human graves at this site
that included bird remains, and 14 identifiable species (Table 9.3), it is thought that the species
may have had a significant meaning in relation to each burial (Mannermaa et al. 2008). All of
the species from this Russian site, excluding the great grey owl (Strix nebulosa), are either
residents or migrants of Britain today (Hume 2002), and were possibly in Britain during the
Mesolithic.
The Goldcliff East avian assemblage is similar to Star Carr in that all the identified avian
evidence is from species that are still found living on, or migrating to, the Severn Estuary. The
only exception is white stork which is no-longer a migratory visitor to Britain, instead it can be
found migrating to other European countries to spend the summer breeding season before
returning to Africa to winter (Johst et al. 2001). The same is true of the common crane,
although their recent reintroduction into England has resulted in this species returning to the
Severn Estuary. 21% of bird footprint-tracks were not identifiable in this study. The
identification of these footprint-tracks was complicated, due to the lack of detail in some. The
toe angle, morphology, and footprint dimensions did not mirror species that are currently found
on the estuary and so were not part of the experimental data results assemblage. More
experimental work may allow these unidentified species to be ascertained. Although footprint-
tracking field books can be useful (Bang and Dahlstrom 1974; Brown et al. 1987), experimental
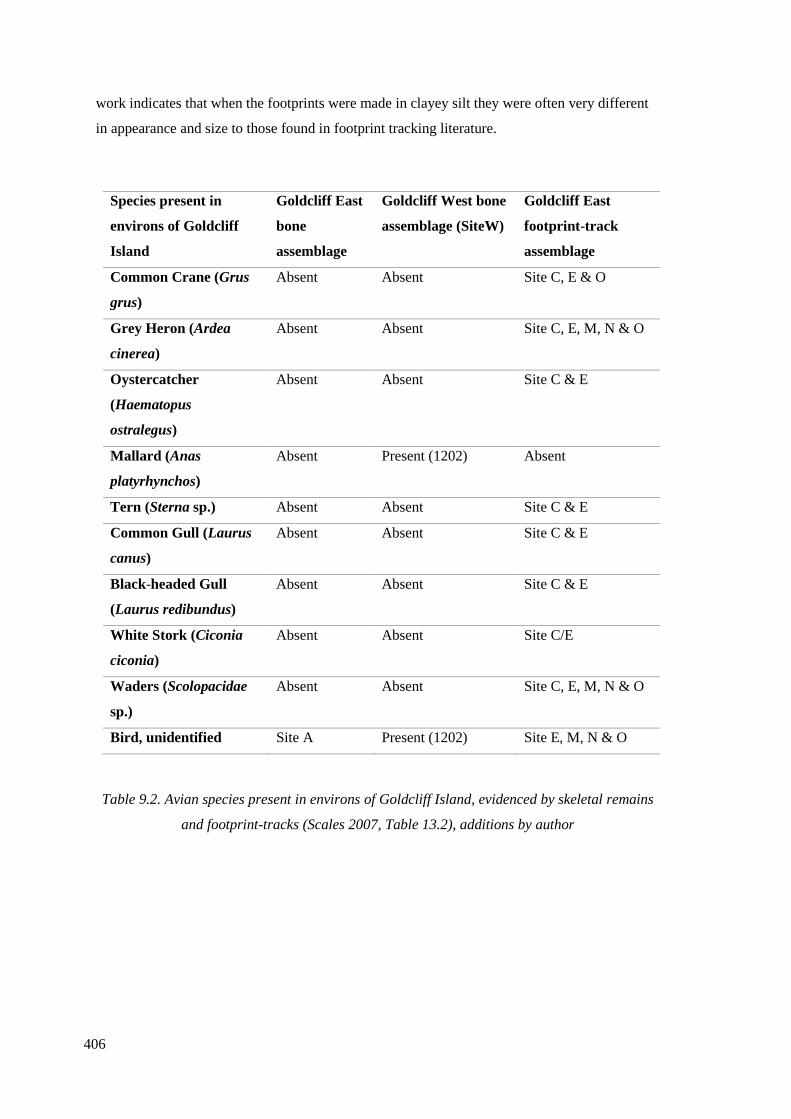
406
work indicates that when the footprints were made in clayey silt they were often very different
in appearance and size to those found in footprint tracking literature.
Species present in
environs of Goldcliff
Island
Goldcliff East
bone
assemblage
Goldcliff West bone
assemblage (SiteW)
Goldcliff East
footprint-track
assemblage
Common Crane (Grus
grus)
Absent Absent Site C, E & O
Grey Heron (Ardea
cinerea)
Absent Absent Site C, E, M, N & O
Oystercatcher
(Haematopus
ostralegus)
Absent Absent Site C & E
Mallard (Anas
platyrhynchos)
Absent Present (1202) Absent
Tern (Sterna sp.) Absent Absent Site C & E
Common Gull (Laurus
canus)
Absent Absent Site C & E
Black-headed Gull
(Laurus redibundus)
Absent Absent Site C & E
White Stork (Ciconia
ciconia)
Absent Absent Site C/E
Waders (Scolopacidae
sp.)
Absent Absent Site C, E, M, N & O
Bird, unidentified Site A Present (1202) Site E, M, N & O
Table 9.2. Avian species present in environs of Goldcliff Island, evidenced by skeletal remains
and footprint-tracks (Scales 2007, Table 13.2), additions by author
407
Table 9.3 Bird taxa from the graves at Yuzhniy Oleniy Ostrov, Lake Onega, Western Russia
(Mannermaa et al. 2008)
The majority of footprint-tracks made by birds were made by a crane species (46%). This avian
species was originally deemed to be larger than the common crane found in Britain today due to
the footprint size (Scales 2006, p 159), and was thought to possibly be from Grus primigenia.
Experimental research (Chapter 7) involving common crane walking on silt sediments suggests
that although the avian footprints were large, they were likely made by common crane. The
larger footprint-track size is caused by the way a footprint forms on silt sediment as opposed to
firmer sediment (Chapter 4), rather than the foot itself being larger. There were, however, seven
extremely large footprint-tracks that may have been made by a larger crane species, such as
Grus primigenia or sarus crane, though they could also have been from large male common
crane.
The common crane footprint-tracks from Site C/E at Goldcliff East indicated that the birds were
present during the breeding season, during the summer months. This was shown in the fine-
grained particle size of the clayey silt laminations being walked upon (Chapter 8), and indicated
that the common crane may have been breeding and raising their chicks near this area. Modern
common crane currently nest between May and June (Hume 2014), with chicks tending to be
fully fledged by August or September. There are not any crane chick footprints, which may
408
suggest that the adults were exploiting the wetland resources, but they had nested elsewhere.
They will also avoid allowing their chicks to graze in areas where there is livestock, as these
large animals disturb the invertebrates that crane prey upon (Buxton and Durdin 2011, p 92), so
the presence of crane footprint-tracks in areas where ungulate footprint-tracks are lacking may
suggest that ungulates were not often exploiting these areas.
The Mesolithic crane footprint-tracks recorded at Goldcliff East are in an area that would have
suited their habitat needs for breeding, as well as where there was a reduced risk of predators. In
Site C (Scales 2006), the footprint-tracks of Person 11 and Person 12 were recorded on the
same lamination as common crane footprint-tracks (Figure 9.1). These footprint-tracks were
generally small, with reanalysis within this study of the original data suggesting Person 11 was
aged 5.5 +/- 1.5 years, and Person 12 aged 10 +/- 1 years old. It was suggested by Scales (2006)
that the presence of human footprints on the same lamination as crane may indicate the activity
of wildfowling; eggs from common crane and meat of the young birds is reported to be the best
to eat, as adult meat is tough (Albarella 1997). During the egg incubation period common crane
are extremely territorial and will perform extensive distraction behaviour which can involve
physical attack, including bill-stabbing, kicking, and wing-beating (Moll 1963; Cramp and
Simmons 1980). Common crane can be up to 130cm tall, which would have been taller than
Person 11 who was approximately 107.5cm (3’6”) tall and around the same height as Person 12,
132.3cm (4’4”) tall. The birds would have fought viciously to protect their nest so are unlikely
to have run or flown away when chased. The child would have had to face a large opponent, as
well as injury, to get at most two eggs. It is therefore unlikely that these footprint-tracks
represent humans attempting to steal eggs from adult crane.
It is a possibility that the children may have been chasing young chicks once they had hatched
but before they were fully fledged, though the majority of the laminations with crane footprint-
tracks did not form a clear trail, and suggested time was spent in the area, rather than moving
anywhere at a run. There was also a lack of any juvenile common crane footprint-tracks, all
were large and adult in size. It was noted by Månsson et al. (2013) that common crane are most
active on wetlands and marshlands at around dusk, just before they roost. The human footprint-
tracks on the same lamination as the crane may be an indication that humans had been in the
same area during the day, perhaps exploiting similar resources that drew the crane to the area,
but were not hunting them. This may also provide an explanation as to why there were no crane
bones found at any of the Mesolithic sites, though it was noted that the other faunal remains
found at Goldcliff East were very fragmented, possibly due to ungulate trampling (Scales
2007b, p 163), which may have contributed to the lack of avian bones, as they are lightweight
and porous.
409
At Goldcliff there is a lack of distinct crane trails and they appear to make rather chaotic
patterns, which may indicate that these cranes were engaging in dance behaviour. Common
cranes perform this ‘dance’ by stiff-legged marching, pirouetting, bowing, beating their wings,
running and leaping; they generally perform this display in an almost circular formation and can
even be encouraged to dance if humans begin the display (Russell and McGowan 2003; Snow
et al. 1998). This dancing behaviour is not well-understood but thought to be a form of social
display, pair bonding and an attempt to ward off aggression (Russell and McGowan 2003).
Although we cannot know if the Goldcliff cranes were dancing with certainty because the areas
of footprint exposure are small, it is worth considering. Dancing behaviour of these cranes is
further indicated by how well formed the footprints were, which suggests that they were made
in drying mud instead of in shallow water.
Figure 9.1 Goldcliff East, Site C. Plan of the trails of Person 11 and Person 12 and the avian
footprints (Scales 2006)
Throughout differing time periods across the world there has been indication that crane species
were important, considered sacred, or the killing of the bird was taboo. Celtic mythology, for
example, considers eating crane flesh to be bad luck due to the reputation that they unman
warriors, stealing their will to fight (Ettlinger 1943). Other areas of the world deem the crane
species to be symbols of longevity, fertility and good fortune (Armstrong 1943; Balzer 1996;
Johnsgard 1983).
At the Neolithic site of Çatalhöyük, Turkey, the bones of crane only made up 2% of the
identified bird bones, indicating that these animals were not being extensively hunted (Russell
and McGowan 2005). A crane wing, complete from distal humerus to tip (Figure 9.2), was
found within a deposit also containing other ‘special’ items such as cattle horn core, wild goat
horn core and a dog head (Russell and McGowan 2003). This crane wing had marks on the
410
bone that did not indicate standard butchery, and is argued to have been part of a costume used
to perform the crane dance (Russell 2011). Humans from prehistory and ethnographic contexts
across the world have been found to replicate the crane dance (Figure 9.3), possibly to
strengthen relationships or to re-enact the origins of important stories (Garfinkel 2003; Russell
and McGowan 2003). Russell and McGowan (2003; Armstrong 1943) suggest that, although
evidence of cranes and the crane dance appear in different contexts across the globe, it is likely
that the mimicking of the crane dance and fascination with cranes arose independently within
the different societies.
Crane also appear in prehistoric artwork, the wall painting from Çatalhöyük being an example
of this (Figure 9.4), depicting two probable crane facing each other with their heads raised
(Mellart 1966). Other wall paintings at Çatalhöyük depict pairs of animals facing each other,
such as the onagers directly below the crane, and are thought to be symbolic paintings linked to
twins or mating pairs (Russell and McGowan 2003). Pillars with reliefs of animals, including
crane, were recorded at the Neolithic site of Göbekli Tepe, Turkey (Figure 9.5). These birds
have the appearance of crane in many ways, though the legs are bent, giving a human
appearance to the bird; possibly these carvings are a representation of masked humans partaking
in the crane dance (Schmidt 2012). Although the crane have legs that are human in appearance,
the feet are clearly that of a crane, with three toes evident. Schmidt (2012) suggests that this
image may not be representative of humans simply dressing as crane, but rather it captures the
humans physically transforming into the bird during the dance.
The importance of crane in some societies may provide a further explanation for the lack of
skeletal remains in Mesolithic sites, which may indicate that common crane were not being
hunted at Goldcliff East, possibly due to the birds themselves being viewed as important rather
than just dangerous and territorial.

411
Figure 9.2 Çatalhöyük crane wing (after Russel and McGowan 2003)
Figure 9.3 An imagined crane dance at Çatalhöyük, image by J.Swogger (Russell and
McGowan 2003, Figure 9.4)
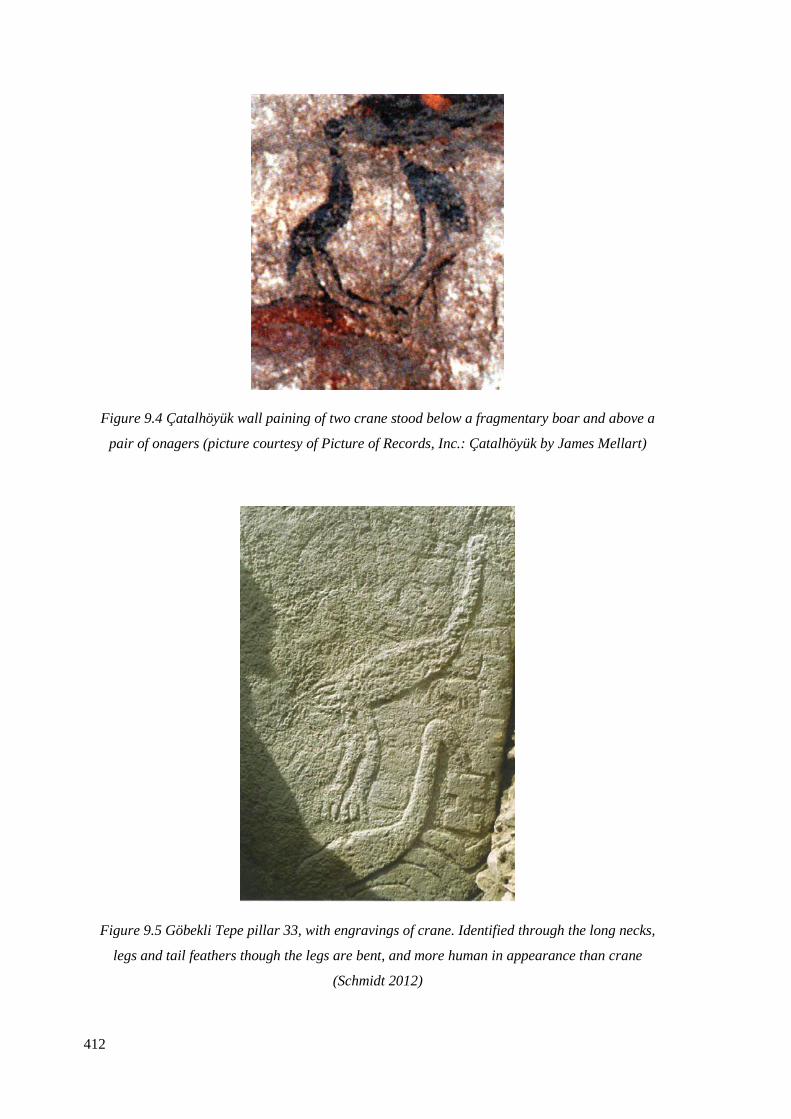
412
Figure 9.4 Çatalhöyük wall paining of two crane stood below a fragmentary boar and above a
pair of onagers (picture courtesy of Picture of Records, Inc.: Çatalhöyük by James Mellart)
Figure 9.5 Göbekli Tepe pillar 33, with engravings of crane. Identified through the long necks,
legs and tail feathers though the legs are bent, and more human in appearance than crane
(Schmidt 2012)
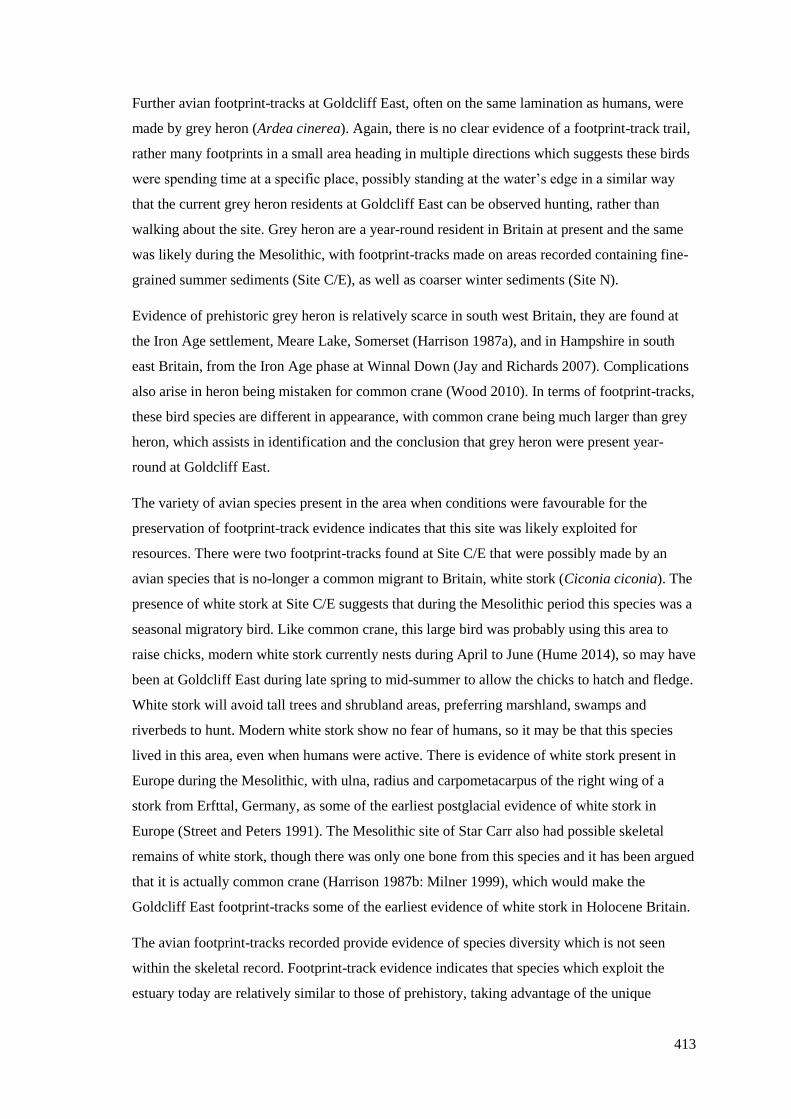
413
Further avian footprint-tracks at Goldcliff East, often on the same lamination as humans, were
made by grey heron (Ardea cinerea). Again, there is no clear evidence of a footprint-track trail,
rather many footprints in a small area heading in multiple directions which suggests these birds
were spending time at a specific place, possibly standing at the water’s edge in a similar way
that the current grey heron residents at Goldcliff East can be observed hunting, rather than
walking about the site. Grey heron are a year-round resident in Britain at present and the same
was likely during the Mesolithic, with footprint-tracks made on areas recorded containing fine-
grained summer sediments (Site C/E), as well as coarser winter sediments (Site N).
Evidence of prehistoric grey heron is relatively scarce in south west Britain, they are found at
the Iron Age settlement, Meare Lake, Somerset (Harrison 1987a), and in Hampshire in south
east Britain, from the Iron Age phase at Winnal Down (Jay and Richards 2007). Complications
also arise in heron being mistaken for common crane (Wood 2010). In terms of footprint-tracks,
these bird species are different in appearance, with common crane being much larger than grey
heron, which assists in identification and the conclusion that grey heron were present year-
round at Goldcliff East.
The variety of avian species present in the area when conditions were favourable for the
preservation of footprint-track evidence indicates that this site was likely exploited for
resources. There were two footprint-tracks found at Site C/E that were possibly made by an
avian species that is no-longer a common migrant to Britain, white stork (Ciconia ciconia). The
presence of white stork at Site C/E suggests that during the Mesolithic period this species was a
seasonal migratory bird. Like common crane, this large bird was probably using this area to
raise chicks, modern white stork currently nests during April to June (Hume 2014), so may have
been at Goldcliff East during late spring to mid-summer to allow the chicks to hatch and fledge.
White stork will avoid tall trees and shrubland areas, preferring marshland, swamps and
riverbeds to hunt. Modern white stork show no fear of humans, so it may be that this species
lived in this area, even when humans were active. There is evidence of white stork present in
Europe during the Mesolithic, with ulna, radius and carpometacarpus of the right wing of a
stork from Erfttal, Germany, as some of the earliest postglacial evidence of white stork in
Europe (Street and Peters 1991). The Mesolithic site of Star Carr also had possible skeletal
remains of white stork, though there was only one bone from this species and it has been argued
that it is actually common crane (Harrison 1987b: Milner 1999), which would make the
Goldcliff East footprint-tracks some of the earliest evidence of white stork in Holocene Britain.
The avian footprint-tracks recorded provide evidence of species diversity which is not seen
within the skeletal record. Footprint-track evidence indicates that species which exploit the
estuary today are relatively similar to those of prehistory, taking advantage of the unique
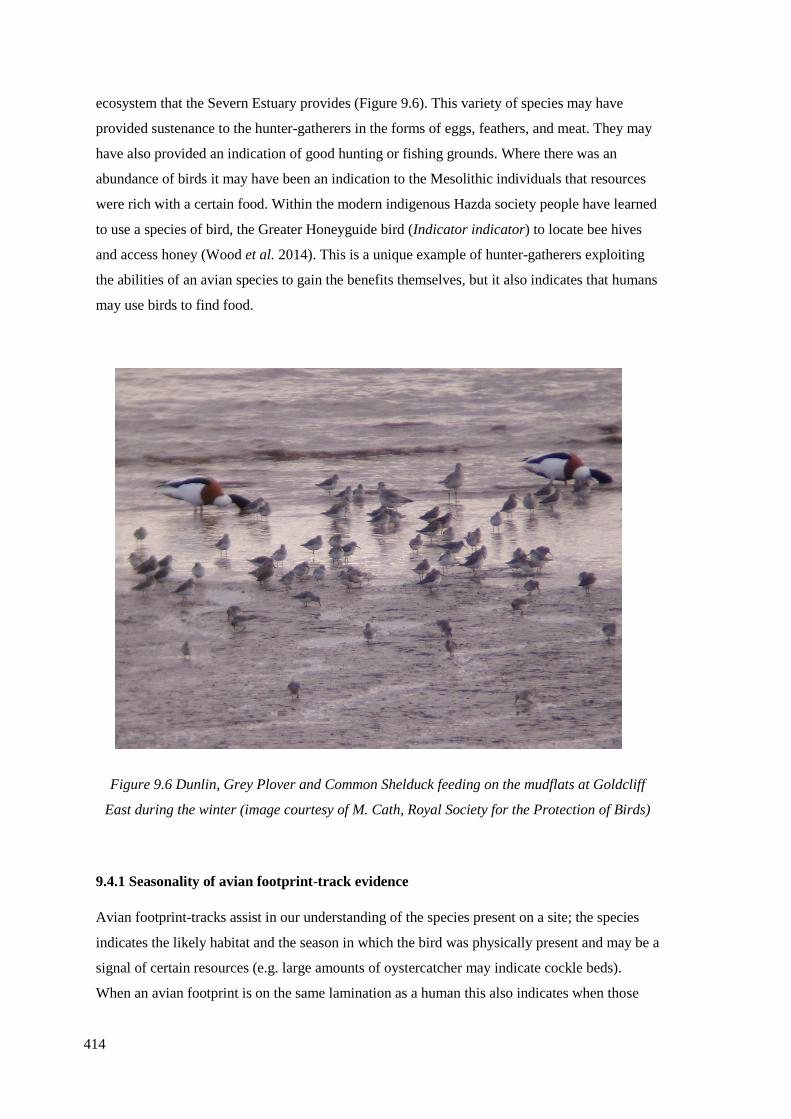
414
ecosystem that the Severn Estuary provides (Figure 9.6). This variety of species may have
provided sustenance to the hunter-gatherers in the forms of eggs, feathers, and meat. They may
have also provided an indication of good hunting or fishing grounds. Where there was an
abundance of birds it may have been an indication to the Mesolithic individuals that resources
were rich with a certain food. Within the modern indigenous Hazda society people have learned
to use a species of bird, the Greater Honeyguide bird (Indicator indicator) to locate bee hives
and access honey (Wood et al. 2014). This is a unique example of hunter-gatherers exploiting
the abilities of an avian species to gain the benefits themselves, but it also indicates that humans
may use birds to find food.
Figure 9.6 Dunlin, Grey Plover and Common Shelduck feeding on the mudflats at Goldcliff
East during the winter (image courtesy of M. Cath, Royal Society for the Protection of Birds)
9.4.1 Seasonality of avian footprint-track evidence
Avian footprint-tracks assist in our understanding of the species present on a site; the species
indicates the likely habitat and the season in which the bird was physically present and may be a
signal of certain resources (e.g. large amounts of oystercatcher may indicate cockle beds).
When an avian footprint is on the same lamination as a human this also indicates when those
415
humans were present within the area (Table 9.4). Figure 9.7 demonstrates that 40% of the
footprints recorded at Goldcliff were made by year-round residents of the Severn Estuary. A
further 20% of the species present on site were unidentifiable and therefore could not have their
seasonality established.
10% of the unidentified bird footprint-tracks were made by small waders. The difficulty that
arises with the identification of small waders is that presently in the British Isles alone there are
25 species of waders, many of which are similar in size and share habitats and behaviours.
There is also the possibility that the wader species present during prehistory are no longer in
Britain. Of the 25 wader species currently found in Britain, 52% are migratory, coming to the
Severn Estuary during the winter months (Figure 9.8). Although the winter period is when
around half the wader species are found, they are also found during the other seasons, including
12% of the species being year-round residents. The small wader species footprint-tracks can
therefore not be utilised to determine the season as there is too much variation, though they all
indicate that the area was a coastal wetland environment.
Of the four species who were not year-round residents, the footprint-tracks enabled seasonal
identification. Common crane, for instance, are a late spring to late summer passage migrant to
the British Isles, nesting between May and June (Hume 2014), with chicks becoming fully
fledged by August/September; the footprint-tracks from the Mesolithic laminations indicate the
crane were present during warmer periods as the particle sizes were fine-grained (Figure 9.9;
Chapter 8) which suggests that these birds may have come to Britain to nest.
Tern are a species that use the Severn Estuary as a passage to get to the end of their migratory
route, they do not stay for a long length of time. They are visitors that can be seen mainly
during autumn along the coastline (Hulme 2002). Arctic tern (Sterna paradisaea), for instance,
are not generally present within footprint databases as they are passage migrants that are often
not kept in British breeding programmes, so their footprint morphology could not be compared
to the prehistoric database making the species of tern identification problematic.
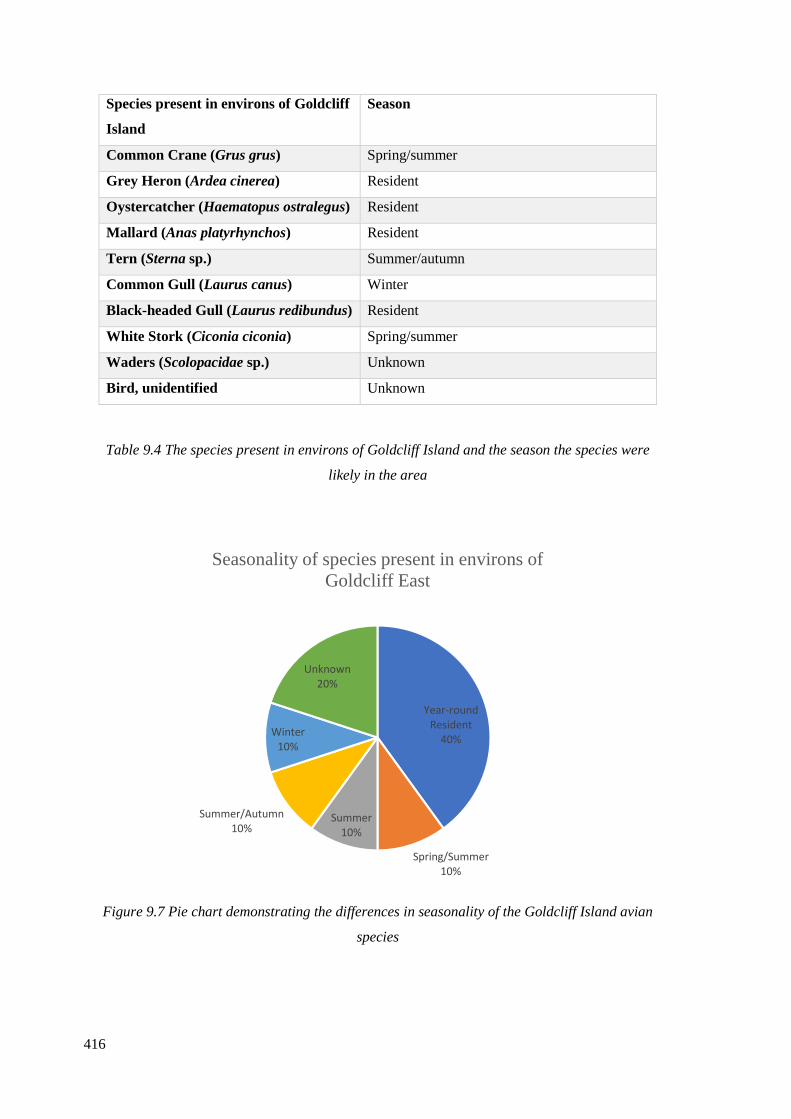
416
Species present in environs of Goldcliff
Island
Season
Common Crane (Grus grus) Spring/summer
Grey Heron (Ardea cinerea) Resident
Oystercatcher (Haematopus ostralegus) Resident
Mallard (Anas platyrhynchos) Resident
Tern (Sterna sp.) Summer/autumn
Common Gull (Laurus canus) Winter
Black-headed Gull (Laurus redibundus) Resident
White Stork (Ciconia ciconia) Spring/summer
Waders (Scolopacidae sp.) Unknown
Bird, unidentified Unknown
Table 9.4 The species present in environs of Goldcliff Island and the season the species were
likely in the area
Figure 9.7 Pie chart demonstrating the differences in seasonality of the Goldcliff Island avian
species
Year-round Resident
40%
Spring/Summer10%
Summer10%
Summer/Autumn10%
Winter10%
Unknown20%
Seasonality of species present in environs of
Goldcliff East
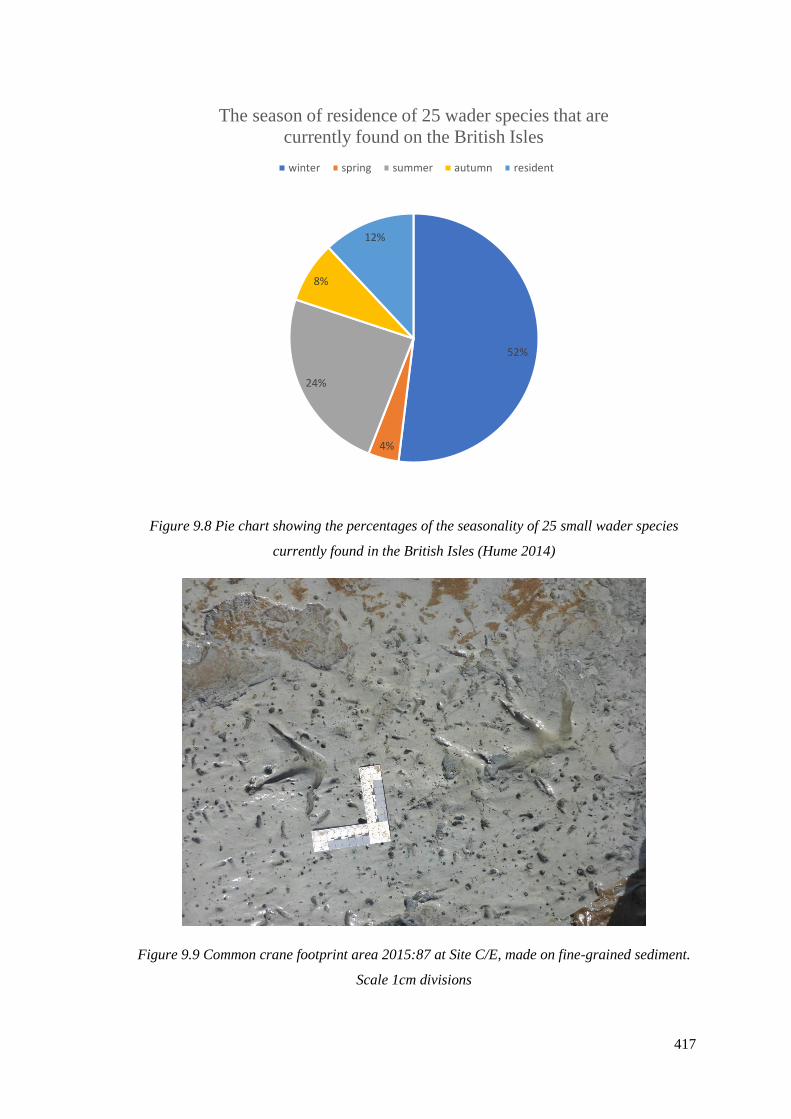
417
Figure 9.8 Pie chart showing the percentages of the seasonality of 25 small wader species
currently found in the British Isles (Hume 2014)
Figure 9.9 Common crane footprint area 2015:87 at Site C/E, made on fine-grained sediment.
Scale 1cm divisions
52%
4%
24%
8%
12%
The season of residence of 25 wader species that are
currently found on the British Isles
winter spring summer autumn resident
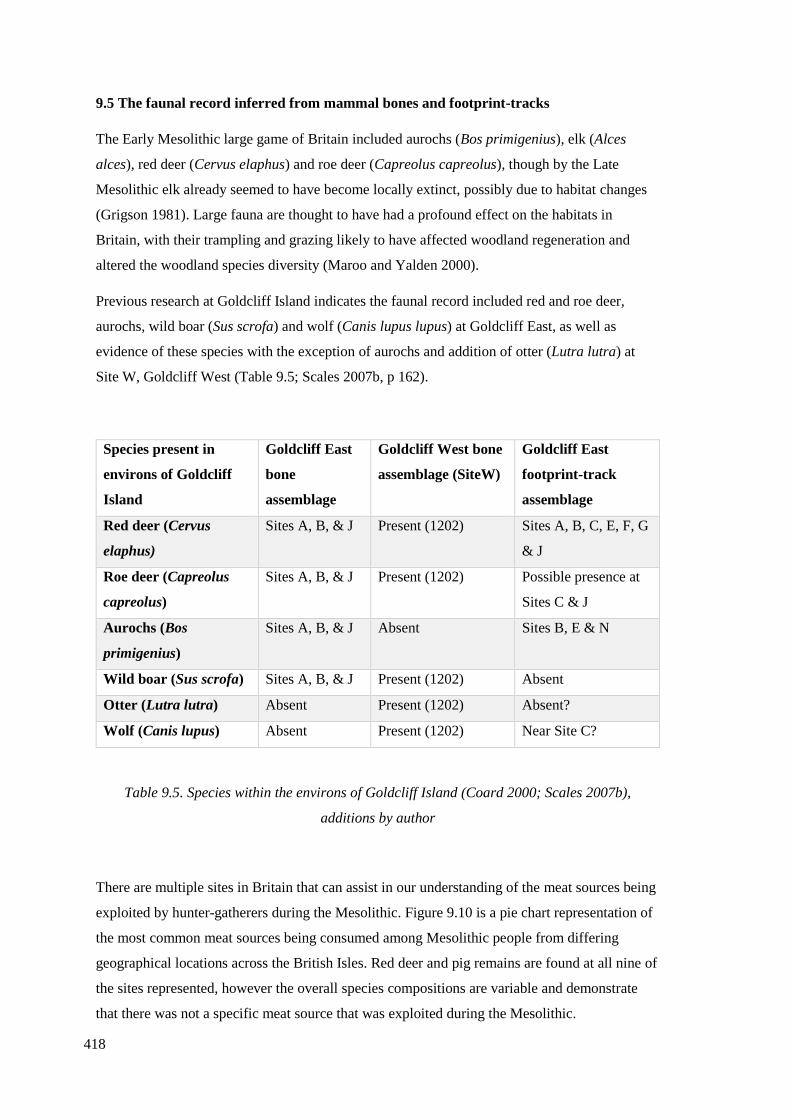
418
9.5 The faunal record inferred from mammal bones and footprint-tracks
The Early Mesolithic large game of Britain included aurochs (Bos primigenius), elk (Alces
alces), red deer (Cervus elaphus) and roe deer (Capreolus capreolus), though by the Late
Mesolithic elk already seemed to have become locally extinct, possibly due to habitat changes
(Grigson 1981). Large fauna are thought to have had a profound effect on the habitats in
Britain, with their trampling and grazing likely to have affected woodland regeneration and
altered the woodland species diversity (Maroo and Yalden 2000).
Previous research at Goldcliff Island indicates the faunal record included red and roe deer,
aurochs, wild boar (Sus scrofa) and wolf (Canis lupus lupus) at Goldcliff East, as well as
evidence of these species with the exception of aurochs and addition of otter (Lutra lutra) at
Site W, Goldcliff West (Table 9.5; Scales 2007b, p 162).
Species present in
environs of Goldcliff
Island
Goldcliff East
bone
assemblage
Goldcliff West bone
assemblage (SiteW)
Goldcliff East
footprint-track
assemblage
Red deer (Cervus
elaphus)
Sites A, B, & J Present (1202) Sites A, B, C, E, F, G
& J
Roe deer (Capreolus
capreolus)
Sites A, B, & J Present (1202) Possible presence at
Sites C & J
Aurochs (Bos
primigenius)
Sites A, B, & J Absent Sites B, E & N
Wild boar (Sus scrofa) Sites A, B, & J Present (1202) Absent
Otter (Lutra lutra) Absent Present (1202) Absent?
Wolf (Canis lupus) Absent Present (1202) Near Site C?
Table 9.5. Species within the environs of Goldcliff Island (Coard 2000; Scales 2007b),
additions by author
There are multiple sites in Britain that can assist in our understanding of the meat sources being
exploited by hunter-gatherers during the Mesolithic. Figure 9.10 is a pie chart representation of
the most common meat sources being consumed among Mesolithic people from differing
geographical locations across the British Isles. Red deer and pig remains are found at all nine of
the sites represented, however the overall species compositions are variable and demonstrate
that there was not a specific meat source that was exploited during the Mesolithic.
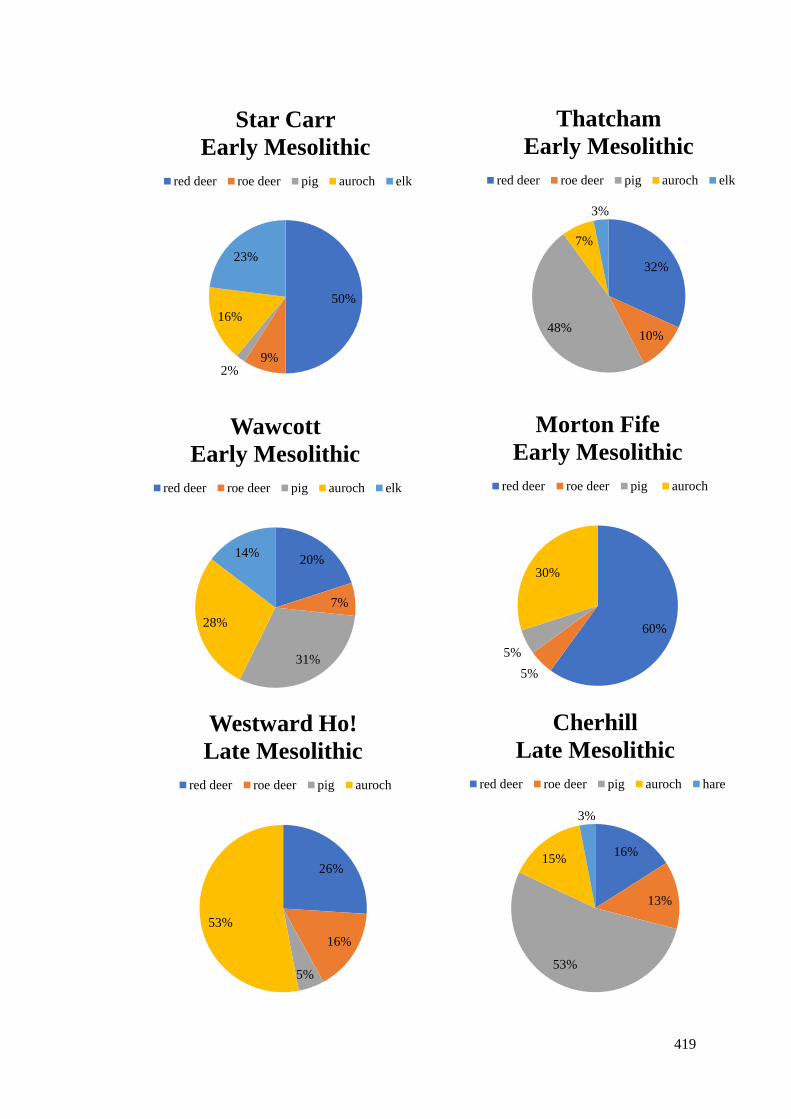
419
50%
9%2%
16%
23%
Star Carr
Early Mesolithic
red deer roe deer pig auroch elk
20%
7%
31%
28%
14%
Wawcott
Early Mesolithic
red deer roe deer pig auroch elk
60%
5%
5%
30%
Morton Fife
Early Mesolithic
red deer roe deer pig auroch
26%
16%
5%
53%
Westward Ho!
Late Mesolithic
red deer roe deer pig auroch
16%
13%
53%
15%
3%
Cherhill
Late Mesolithic
red deer roe deer pig auroch hare
32%
10%48%
7%
3%
Thatcham
Early Mesolithic
red deer roe deer pig auroch elk
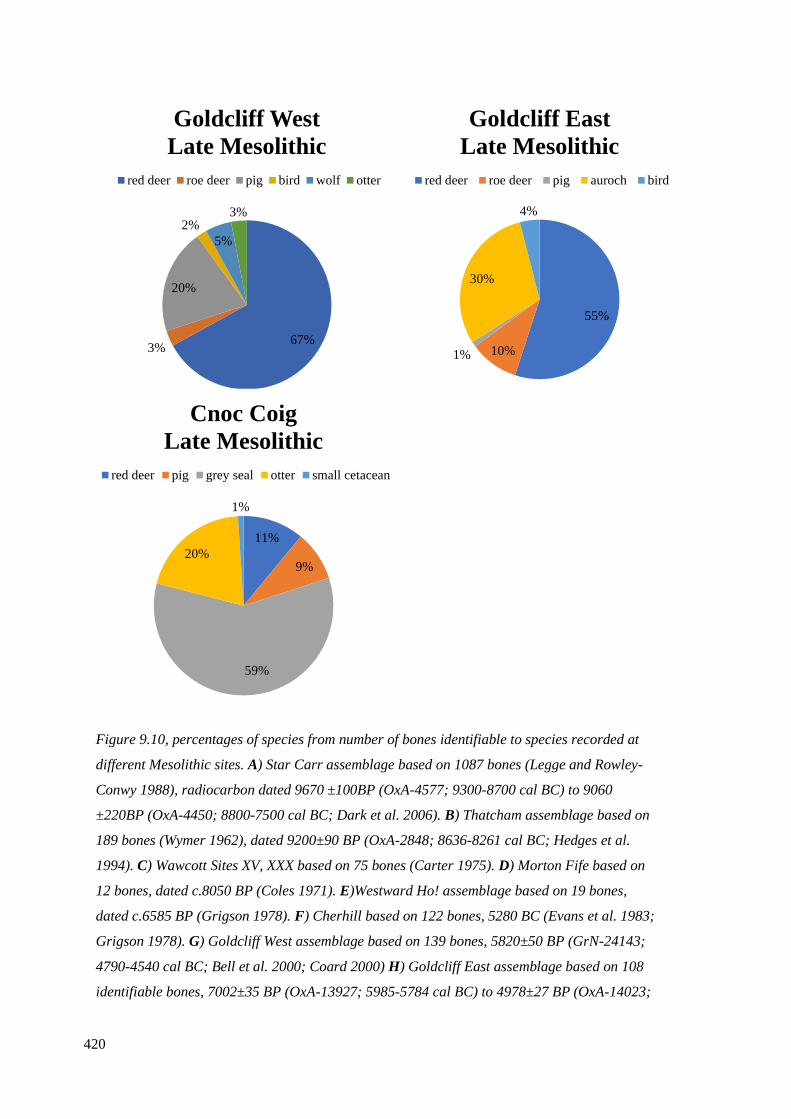
420
Figure 9.10, percentages of species from number of bones identifiable to species recorded at
different Mesolithic sites. A) Star Carr assemblage based on 1087 bones (Legge and Rowley-
Conwy 1988), radiocarbon dated 9670 ±100BP (OxA-4577; 9300-8700 cal BC) to 9060
±220BP (OxA-4450; 8800-7500 cal BC; Dark et al. 2006). B) Thatcham assemblage based on
189 bones (Wymer 1962), dated 9200±90 BP (OxA-2848; 8636-8261 cal BC; Hedges et al.
1994). C) Wawcott Sites XV, XXX based on 75 bones (Carter 1975). D) Morton Fife based on
12 bones, dated c.8050 BP (Coles 1971). E)Westward Ho! assemblage based on 19 bones,
dated c.6585 BP (Grigson 1978). F) Cherhill based on 122 bones, 5280 BC (Evans et al. 1983;
Grigson 1978). G) Goldcliff West assemblage based on 139 bones, 5820±50 BP (GrN-24143;
4790-4540 cal BC; Bell et al. 2000; Coard 2000) H) Goldcliff East assemblage based on 108
identifiable bones, 7002±35 BP (OxA-13927; 5985-5784 cal BC) to 4978±27 BP (OxA-14023;
67%3%
20%
2%
5%
3%
Goldcliff West
Late Mesolithic
red deer roe deer pig bird wolf otter
55%
10%1%
30%
4%
Goldcliff East
Late Mesolithic
red deer roe deer pig auroch bird
11%
9%
59%
20%
1%
Cnoc Coig
Late Mesolithic
red deer pig grey seal otter small cetacean
421
3910-3660 cal BC) (Bell 2007). I) Cnoc Coig based on assemblage of 761 bones, radiocarbon
dated c. 6000-5400 BP (Grigson 1978).
9.5.1 Red deer and roe deer
During the research period of 2014-2017 there were not any footprint-tracks found that were
convincingly made by mammals at Goldcliff East, though one footprint-track at Site R may
have been from red deer. The footprint areas recorded in this study were more eroded than those
studied by Scales (2006), and it may be that mammal footprint-tracks may have been mistaken
for heavily eroded or incomplete human footprint-tracks. Scales (2006) recorded 83 red deer
footprints and five roe deer during her research, although three of the roe deer may have been
red deer juveniles. There was also ungulate evidence recorded at Uskmouth by the writer
(Figure 9.11), a site approximately 4km west of Goldcliff East. Uskmouth was only visited on
one low tide, with ungulate footprint-tracks discovered on trampled clayey silt laminations
below a peat shelf, resulting in a number of unclear footprint-tracks. The most extensive
laminations were 5m in length and 2m in width, with a further trampled lamination
approximately 10cm under the top laminations, and again approximately 5m in length and
approximately 1m in width. From these two large trampled laminations, 11 footprint-tracks
were well-preserved enabling dimensions to be obtained (Figure 9.12 and 9.13).
Of the 11 recognisable ungulate footprint-tracks recorded from Uskmouth, all were made by a
deer species. Four of the footprint-tracks were between 5.5cm and 6cm in width and 6cm and
6.5cm in length, likely adult females. One footprint-track was similar in length to a full grown
red deer, likely a male, and five of the footprint-tracks were much larger than modern red deer
(9cm), ranging from 10cm and 12cm indicating full-grown stags. The final footprint-track was
either a roe deer or a juvenile red deer. The footprint-tracks that could be identified all had
closed toes, suggesting the animals were not moving quickly and likely grazing. The red deer
footprint-tracks made on the laminated sediments were often larger than those from footprint-
track field guides (Figure 9.14; Lawrence and Brown 1967; Bullion 2014; Baker 2013), which
may be due to larger red deer than today or the footprint formation process. Formation is
affected by the plasticity of the sediment, gait and speed of movement, and the way the foot has
come into contact with the sediment, which can result in a range of footprint sizes from just one
individual. Appearance of the footprint is therefore significant, with each footprint considered
independently of the other data.
The herd composition suggested by this evidence indicates that this herd had a dominant male
who would have been there to breed. The rut currently occurs in September/November and then
the stag will generally stay with the females until June/July when the oestrous period is over

422
(Figure 9.15). Calves are mainly born in May/June, so the appearance of very small deer
footprint-tracks among large stag and hind indicates that this is likely a red deer neonate born
before the male had left the herd. If rutting, oestrous, and birthing patterns of red deer are
similar today as those in prehistoric Britain (Ahlen 1965; Darling 1937), then these footprint-
tracks were likely to have been made between May and July.
Figure 9.11 Laminations trampled by ungulates at Uskmouth, photographed by M. Bell in 1994
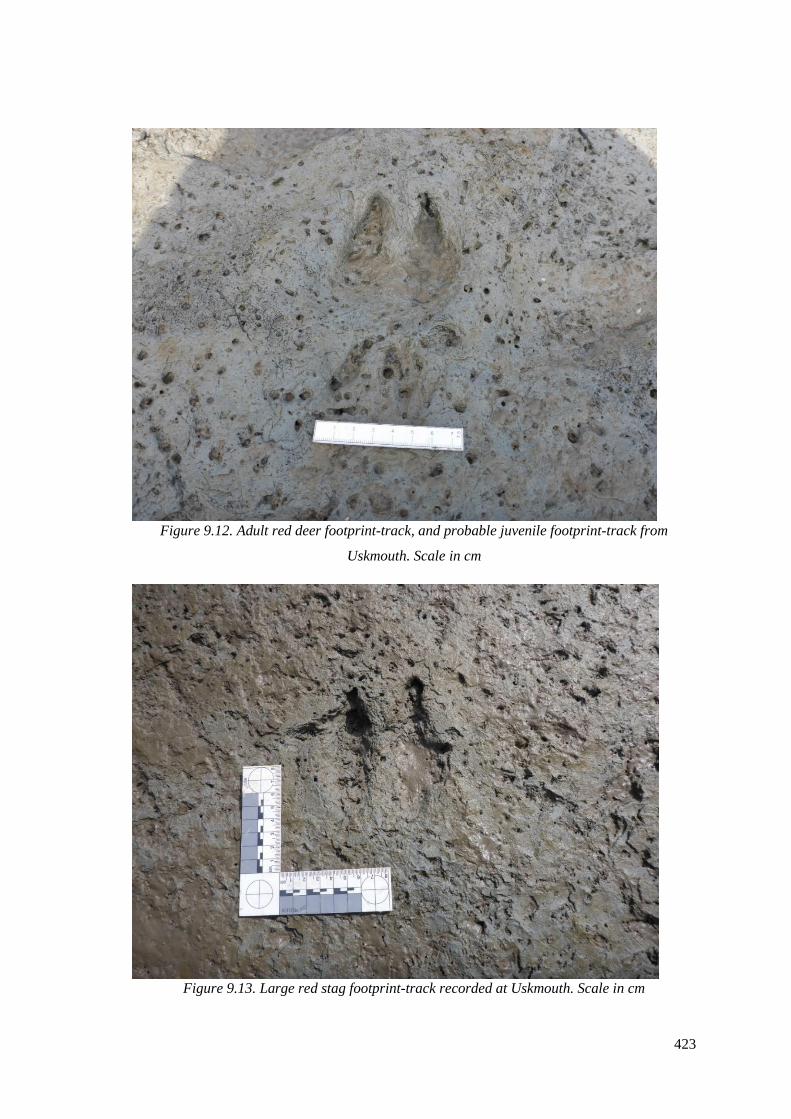
423
Figure 9.12. Adult red deer footprint-track, and probable juvenile footprint-track from
Uskmouth. Scale in cm
Figure 9.13. Large red stag footprint-track recorded at Uskmouth. Scale in cm

424
Figure 9.14. Uskmouth deer footprint-tracks plotted against measurements for red deer and roe
deer found in footprint tracking literature
Figure 9.15. Yearly cycle of modern red deer behaviour (The Deer Initiative 2008a)
0
2
4
6
8
10
12
14
0 1 2 3 4 5 6 7 8 9 1 0
LE
NG
TH
IN
CM
WIDTH IN CM
RED AND ROE DEER FOOTPRINT-TRACK DIMENSIONS
Mesolithic Buillion 2014
Baker 2013 Lawrence & Brown 1967
Roe Deer Buillion 2014 Roe Deer Baker 2013
Roe Deer Lawrence & Brown 1967
425
Exploitation of fauna at Goldcliff and the surrounding sites indicates that red deer may have
made up a large proportion of the hunter-gatherers’ diet, with half the faunal remains recorded
at Goldcliff East, and two-thirds of the Site W assemblage at Goldcliff West made up of red
deer remains (Scales 2006). Antler tools were also found, with an unstratified antler mattock-
hammer discovered near Site C, a split antler from Site B, and bone scrapers probably used for
processing and scraping red deer skins which were found in Site J (Bell 2007). These artefacts
could have been bought in from elsewhere, and so are not necessarily an indication of
seasonality (Fraser and King 1954b, p 93), however red deer footprint-tracks recorded at
Goldcliff East (Scales 2006), and trampling recorded at Uskmouth indicate that deer were
physically in the area.
Goldcliff and Uskmouth provided an environment that was favourable to red deer due to the
mineral rich marshes, and at Goldcliff there was woodland habitat at the edge of the island. Red
deer today will still exploit salt marshes for rich grazing, such as the Teifi marshes,
Pembrokshire (Wildlife Trust of South and West Wales n/d). Red deer have been documented
at a variety of Mesolithic and Neolithic sites across Britain, with red deer footprint-tracks found
at Druridge Bay and Low Hauxley in Northumberland, Formby Point, Merseyside and Lyndstep
II, Pembrokeshire, along with skeletal remains, among others (Cowell et al. 1993; Eadie &
Waddington 2013; Huddart et al 1999b; Jones 2010; Tooley 1970). A further example comes
from the submerged Mesolithic landscape at Seaton Carew, Durham. This site had a trampled
land surface underneath peat with evidence of red deer footprint-tracks (Figure 9.16), these
footprints were splayed and indicate that the animal may have been running. Skeletal remains of
red deer and auroch were found in a similar area to the red deer footprints which may indicate
that these deer were being hunted (Rowe 2015). Ungulate footprints such as these are often
mentioned briefly in site reports, meaning that there may be more footprint-track sites that are
relatively unknown due to the little importance given to mammal and avian footprints.
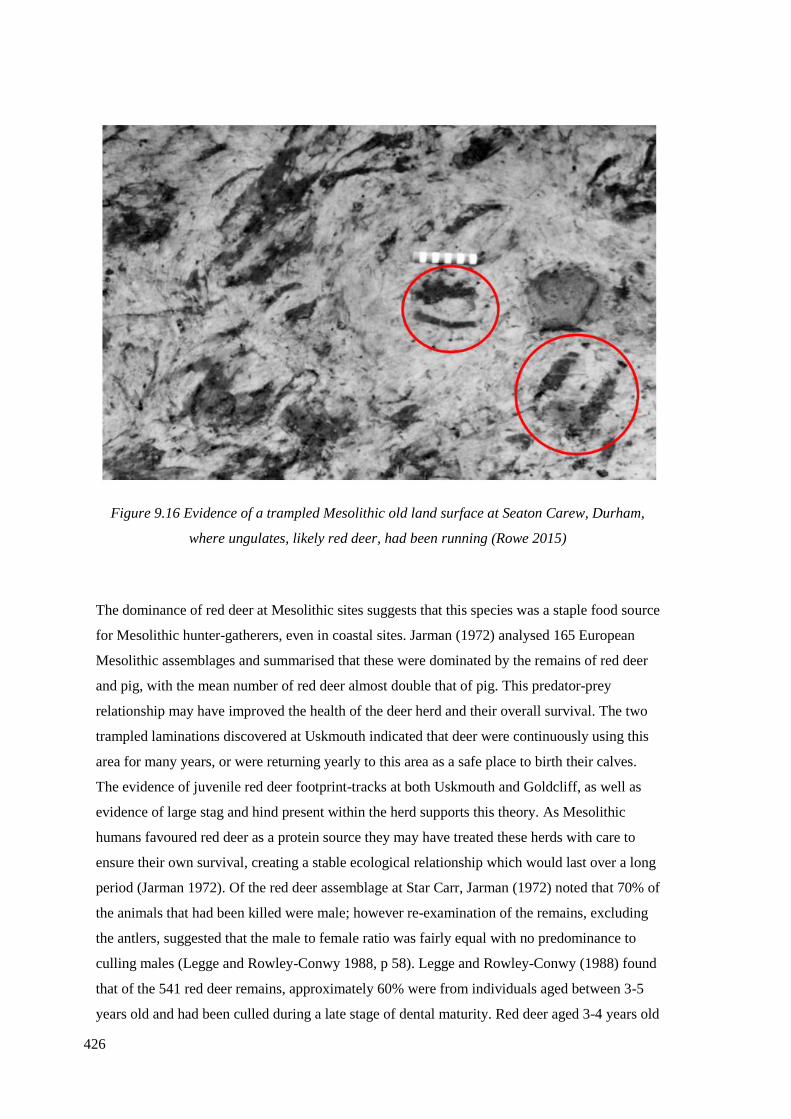
426
Figure 9.16 Evidence of a trampled Mesolithic old land surface at Seaton Carew, Durham,
where ungulates, likely red deer, had been running (Rowe 2015)
The dominance of red deer at Mesolithic sites suggests that this species was a staple food source
for Mesolithic hunter-gatherers, even in coastal sites. Jarman (1972) analysed 165 European
Mesolithic assemblages and summarised that these were dominated by the remains of red deer
and pig, with the mean number of red deer almost double that of pig. This predator-prey
relationship may have improved the health of the deer herd and their overall survival. The two
trampled laminations discovered at Uskmouth indicated that deer were continuously using this
area for many years, or were returning yearly to this area as a safe place to birth their calves.
The evidence of juvenile red deer footprint-tracks at both Uskmouth and Goldcliff, as well as
evidence of large stag and hind present within the herd supports this theory. As Mesolithic
humans favoured red deer as a protein source they may have treated these herds with care to
ensure their own survival, creating a stable ecological relationship which would last over a long
period (Jarman 1972). Of the red deer assemblage at Star Carr, Jarman (1972) noted that 70% of
the animals that had been killed were male; however re-examination of the remains, excluding
the antlers, suggested that the male to female ratio was fairly equal with no predominance to
culling males (Legge and Rowley-Conwy 1988, p 58). Legge and Rowley-Conwy (1988) found
that of the 541 red deer remains, approximately 60% were from individuals aged between 3-5
years old and had been culled during a late stage of dental maturity. Red deer aged 3-4 years old
427
are at an age when they leave their mothers, with the males leaving earlier than the females. At
this age red deer are more vulnerable and so would be easier to kill, it is therefore thought that
red deer bones which were around this age would be more likely to be male (Legge and
Rowley-Conwy 1988, p 44). The age range of 6-9 years old was also prominent, at this age the
remains were more likely female as a greater number reach this age (Lowe 1969). There were
also the remains of at least five juveniles/neonates in the Star Carr assemblage (Legge and
Rowley-Conwy 1988, p 44). This assemblage indicates that this site was likely occupied during
the spring/summer months when deer have their young, with juvenile roe deer remains also
indicating a spring/summer focus.
The culling of young males allows the dominant red deer stags to be more successful during
rutting season and thus ensure that the majority of females in a herd are impregnated, allowing
the herd to become more successful as a result (Deer Initiative 2008a,b). There is very little
skeletal evidence that has survived at Goldcliff East that may enable the age of the animals to
be determined; the land surfaces were trampled which caused fragmentation to many of the
bones (Scales 2007b, p 160). From the red deer fragments observed it was evident that
epiphyseal fusion had occurred in all of the bones, and enamel wear on the four complete teeth
indicated limited dental wear which led to the tentative conclusion that the animals within this
area ranged in age from juvenile to young adults when they died. Scales (2007a) identified 11
red deer footprint-tracks at Site J; seven were adult female, three were large male, and one was
small and likely a juvenile red deer calf, or possibly roe deer. The footprint evidence is similar
to Uskmouth and again indicates they were probably made between May/July. The skeletal and
footprint-track record at Goldcliff East indicates that these deer were probably in the area
during the spring and summer months when the tidal range is reduced and saltmarsh vegetation
is lush, and were being hunted by humans during this time.
Roe deer are also found within Mesolithic assemblages, though they were far less prolific than
red deer (Figure 9.10). Roe deer are smaller than red deer and spend most of their lives in small
family groups, or solitary, though in winter slightly larger groups may form (The Deer Initiative
2008b). Their preferred habitat is open mixed coniferous or completely deciduous woodland,
and they will often spend spring and summer in open grassland areas with nearby woodland for
safety. They are most active at dawn and dusk and will eat the buds, leaves and bark of
deciduous trees, shrubs, ferns, herbs, conifers, heather and grasses. If predators become
problematic roe deer will become nocturnal until the threat to the family group is over (The
Deer Initiative 2008b).
At Goldcliff East 10% of the recorded skeletal remains were from roe deer, these skeletal
remains lack the bones of the head or feet which may indicate that this species was hunted
428
inland and their remains were bought to Goldcliff Island (Scales 2007b, p 162). Although there
were possible roe deer footprints recorded by Scales (2006) from Sites C and J, these may have
been made by juvenile red deer. Within the current study there was not any evidence of roe deer
recorded at Goldlcliff East. On the trampled surface at Uskmouth there was one footprint-track
with dimensions similar to modern roe deer (Figure 9.12), however it is more likely that this
was the footprint of a juvenile red deer due to its association to other red deer footprint-tracks.
The preference for red over roe deer within Mesolithic assemblages may be due to the
difference in the size of the animals, as red deer would provide more protein and resources. Red
deer also travel in larger herds so may have been easier to locate and track compared to roe
deer. The difficulty finding a solitary roe deer and effectively hunting it in woodland may
provide an explanation for the preference for red deer at coastal and marginal environments; roe
deer were more likely to have been successfully hunted inland in open grassy areas (Barja and
Rosellini 2008). The other possibility is that during the Mesolithic period, red deer were more
numerous than roe.
9.5.2 Auroch
Within the Mesolithic period auroch are often seen in bone assemblages (Figure 9.10), with the
site of Westward Ho! dominated by auroch remains. During the fieldwork period of 2014-2017
there were not any likely aurochs footprint-tracks recorded at Goldcliff East. Previous research
at Goldcliff East recorded a possible auroch footprint-track at Site B, this was noted during
block-lifting and micro-excavation (Scales 2007a, p 154). The ungulate footprint-track had two
large, cleaved toes and measured 11.8cm in length and 11cm in width. Figure 9.17 demonstrates
the metric dimensions of this possible footprint plotted against a probable auroch footprint-track
found poorly preserved in Site N during 2010 fieldwork, as well as against Neolithic/Bronze
Age auroch footprint-tracks from Peterstone (Barr and Bell 2016). Both footprint-tracks from
Goldcliff East are small compared to the Peterstone auroch, though the shape of the cleaves and
the large width of the prints indicate they are more likely auroch than red deer.
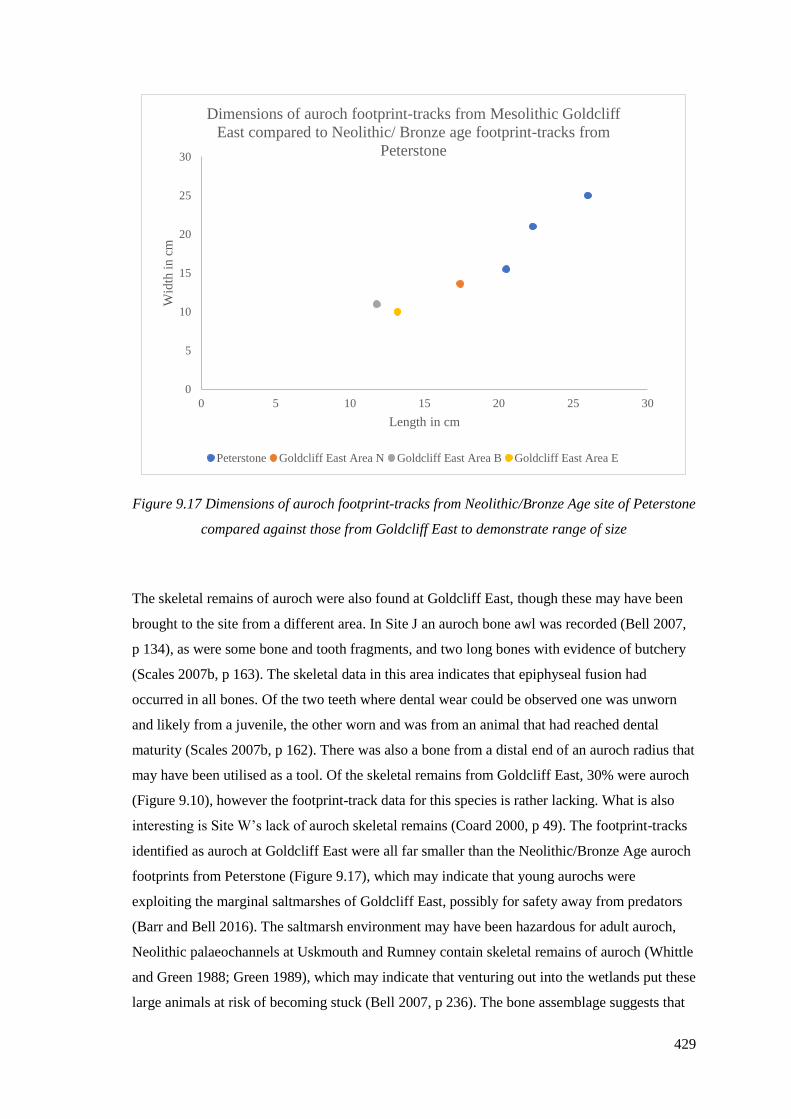
429
Figure 9.17 Dimensions of auroch footprint-tracks from Neolithic/Bronze Age site of Peterstone
compared against those from Goldcliff East to demonstrate range of size
The skeletal remains of auroch were also found at Goldcliff East, though these may have been
brought to the site from a different area. In Site J an auroch bone awl was recorded (Bell 2007,
p 134), as were some bone and tooth fragments, and two long bones with evidence of butchery
(Scales 2007b, p 163). The skeletal data in this area indicates that epiphyseal fusion had
occurred in all bones. Of the two teeth where dental wear could be observed one was unworn
and likely from a juvenile, the other worn and was from an animal that had reached dental
maturity (Scales 2007b, p 162). There was also a bone from a distal end of an auroch radius that
may have been utilised as a tool. Of the skeletal remains from Goldcliff East, 30% were auroch
(Figure 9.10), however the footprint-track data for this species is rather lacking. What is also
interesting is Site W’s lack of auroch skeletal remains (Coard 2000, p 49). The footprint-tracks
identified as auroch at Goldcliff East were all far smaller than the Neolithic/Bronze Age auroch
footprints from Peterstone (Figure 9.17), which may indicate that young aurochs were
exploiting the marginal saltmarshes of Goldcliff East, possibly for safety away from predators
(Barr and Bell 2016). The saltmarsh environment may have been hazardous for adult auroch,
Neolithic palaeochannels at Uskmouth and Rumney contain skeletal remains of auroch (Whittle
and Green 1988; Green 1989), which may indicate that venturing out into the wetlands put these
large animals at risk of becoming stuck (Bell 2007, p 236). The bone assemblage suggests that
0
5
10
15
20
25
30
0 5 10 15 20 25 30
Wid
th i
n c
m
Length in cm
Dimensions of auroch footprint-tracks from Mesolithic Goldcliff
East compared to Neolithic/ Bronze age footprint-tracks from
Peterstone
Peterstone Goldcliff East Area N Goldcliff East Area B Goldcliff East Area E
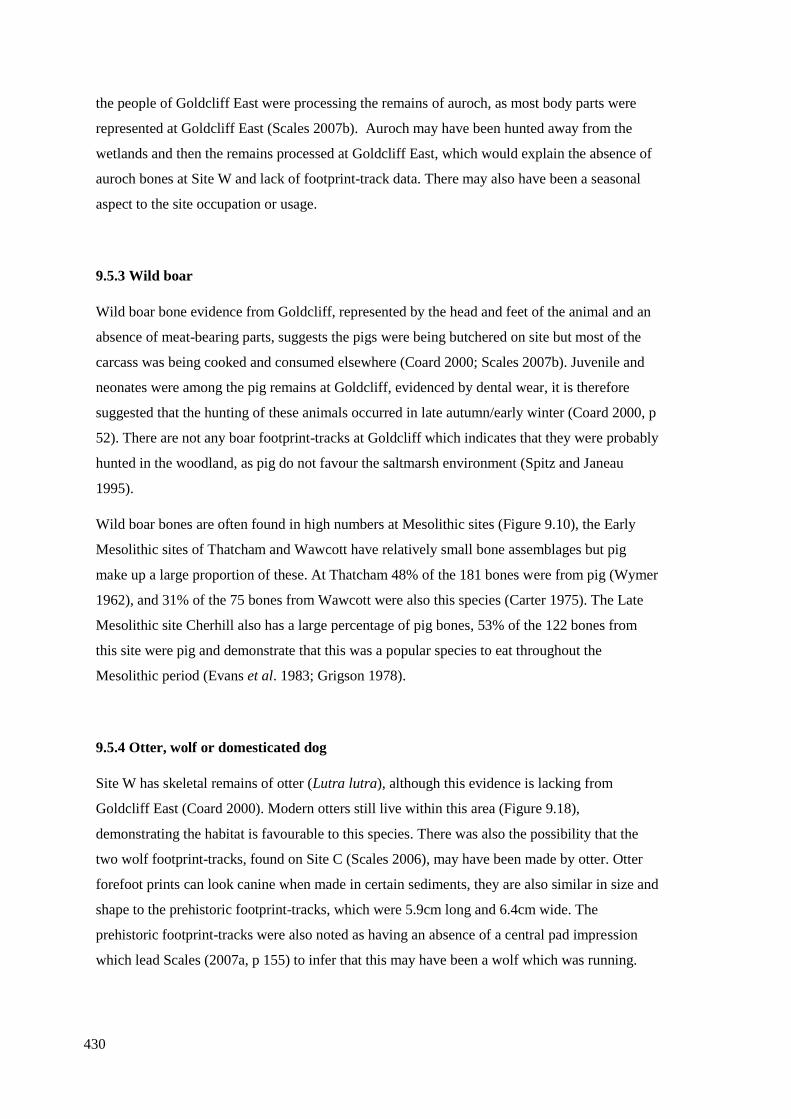
430
the people of Goldcliff East were processing the remains of auroch, as most body parts were
represented at Goldcliff East (Scales 2007b). Auroch may have been hunted away from the
wetlands and then the remains processed at Goldcliff East, which would explain the absence of
auroch bones at Site W and lack of footprint-track data. There may also have been a seasonal
aspect to the site occupation or usage.
9.5.3 Wild boar
Wild boar bone evidence from Goldcliff, represented by the head and feet of the animal and an
absence of meat-bearing parts, suggests the pigs were being butchered on site but most of the
carcass was being cooked and consumed elsewhere (Coard 2000; Scales 2007b). Juvenile and
neonates were among the pig remains at Goldcliff, evidenced by dental wear, it is therefore
suggested that the hunting of these animals occurred in late autumn/early winter (Coard 2000, p
52). There are not any boar footprint-tracks at Goldcliff which indicates that they were probably
hunted in the woodland, as pig do not favour the saltmarsh environment (Spitz and Janeau
1995).
Wild boar bones are often found in high numbers at Mesolithic sites (Figure 9.10), the Early
Mesolithic sites of Thatcham and Wawcott have relatively small bone assemblages but pig
make up a large proportion of these. At Thatcham 48% of the 181 bones were from pig (Wymer
1962), and 31% of the 75 bones from Wawcott were also this species (Carter 1975). The Late
Mesolithic site Cherhill also has a large percentage of pig bones, 53% of the 122 bones from
this site were pig and demonstrate that this was a popular species to eat throughout the
Mesolithic period (Evans et al. 1983; Grigson 1978).
9.5.4 Otter, wolf or domesticated dog
Site W has skeletal remains of otter (Lutra lutra), although this evidence is lacking from
Goldcliff East (Coard 2000). Modern otters still live within this area (Figure 9.18),
demonstrating the habitat is favourable to this species. There was also the possibility that the
two wolf footprint-tracks, found on Site C (Scales 2006), may have been made by otter. Otter
forefoot prints can look canine when made in certain sediments, they are also similar in size and
shape to the prehistoric footprint-tracks, which were 5.9cm long and 6.4cm wide. The
prehistoric footprint-tracks were also noted as having an absence of a central pad impression
which lead Scales (2007a, p 155) to infer that this may have been a wolf which was running.
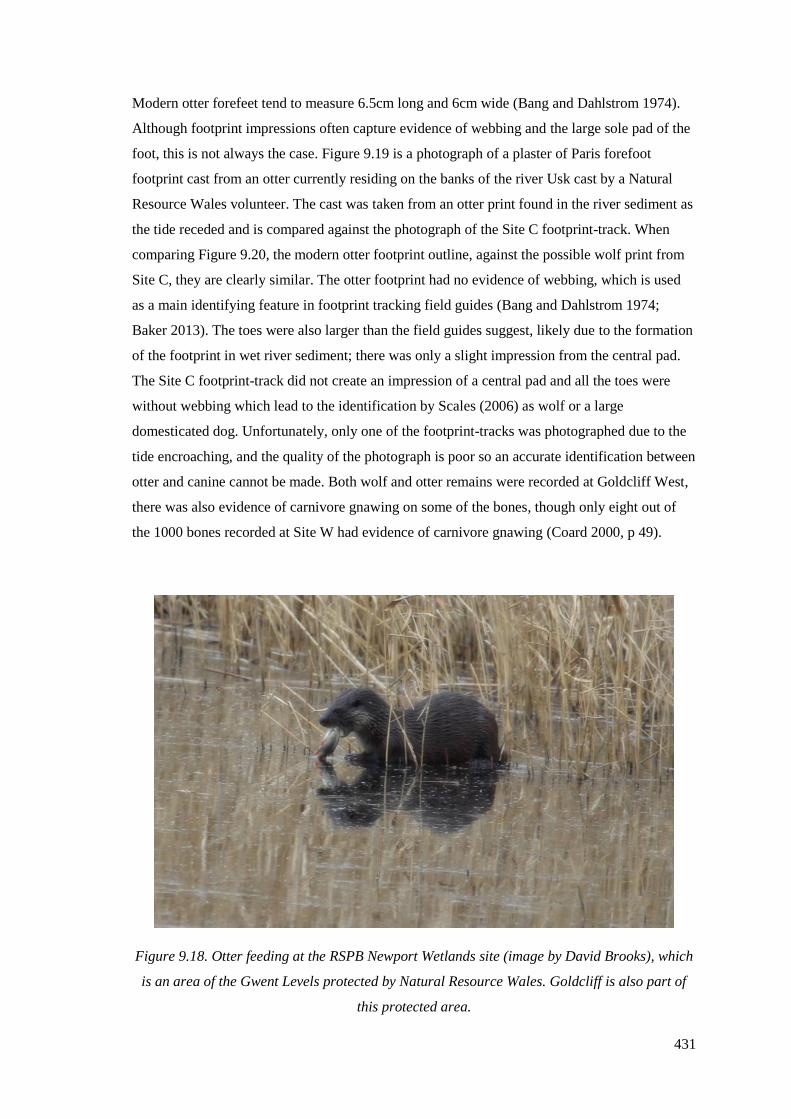
431
Modern otter forefeet tend to measure 6.5cm long and 6cm wide (Bang and Dahlstrom 1974).
Although footprint impressions often capture evidence of webbing and the large sole pad of the
foot, this is not always the case. Figure 9.19 is a photograph of a plaster of Paris forefoot
footprint cast from an otter currently residing on the banks of the river Usk cast by a Natural
Resource Wales volunteer. The cast was taken from an otter print found in the river sediment as
the tide receded and is compared against the photograph of the Site C footprint-track. When
comparing Figure 9.20, the modern otter footprint outline, against the possible wolf print from
Site C, they are clearly similar. The otter footprint had no evidence of webbing, which is used
as a main identifying feature in footprint tracking field guides (Bang and Dahlstrom 1974;
Baker 2013). The toes were also larger than the field guides suggest, likely due to the formation
of the footprint in wet river sediment; there was only a slight impression from the central pad.
The Site C footprint-track did not create an impression of a central pad and all the toes were
without webbing which lead to the identification by Scales (2006) as wolf or a large
domesticated dog. Unfortunately, only one of the footprint-tracks was photographed due to the
tide encroaching, and the quality of the photograph is poor so an accurate identification between
otter and canine cannot be made. Both wolf and otter remains were recorded at Goldcliff West,
there was also evidence of carnivore gnawing on some of the bones, though only eight out of
the 1000 bones recorded at Site W had evidence of carnivore gnawing (Coard 2000, p 49).
Figure 9.18. Otter feeding at the RSPB Newport Wetlands site (image by David Brooks), which
is an area of the Gwent Levels protected by Natural Resource Wales. Goldcliff is also part of
this protected area.
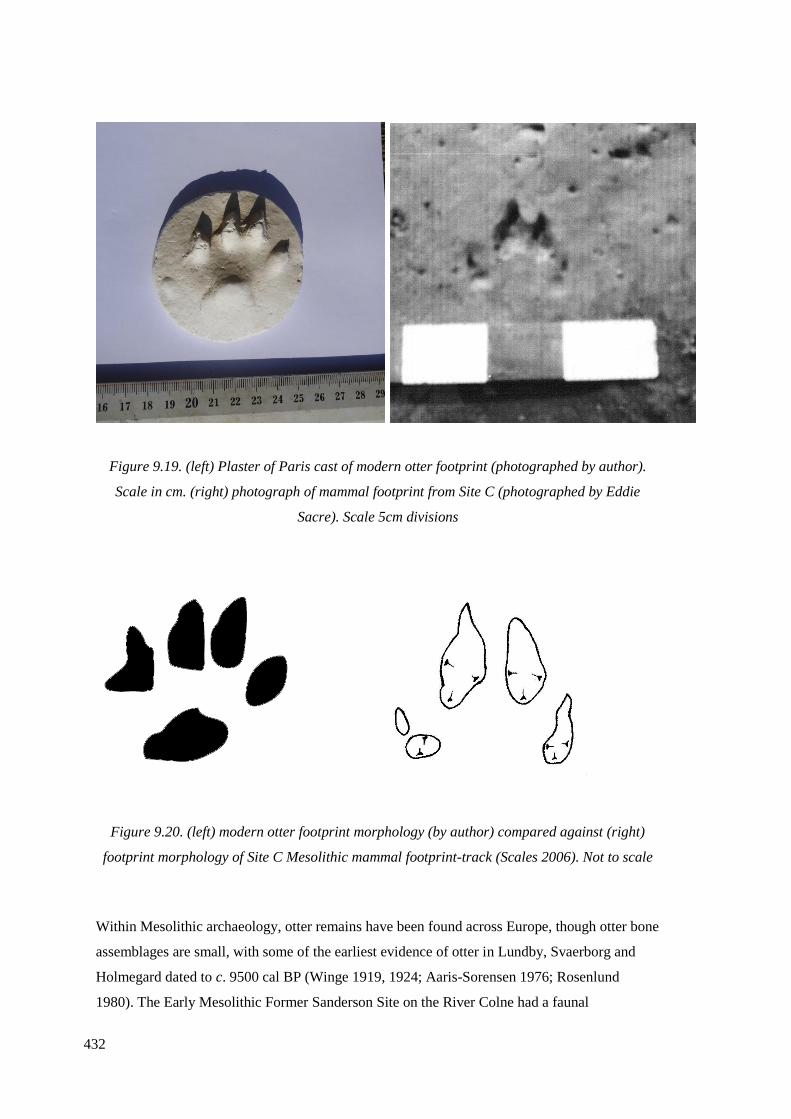
432
Figure 9.19. (left) Plaster of Paris cast of modern otter footprint (photographed by author).
Scale in cm. (right) photograph of mammal footprint from Site C (photographed by Eddie
Sacre). Scale 5cm divisions
Figure 9.20. (left) modern otter footprint morphology (by author) compared against (right)
footprint morphology of Site C Mesolithic mammal footprint-track (Scales 2006). Not to scale
Within Mesolithic archaeology, otter remains have been found across Europe, though otter bone
assemblages are small, with some of the earliest evidence of otter in Lundby, Svaerborg and
Holmegard dated to c. 9500 cal BP (Winge 1919, 1924; Aaris-Sorensen 1976; Rosenlund
1980). The Early Mesolithic Former Sanderson Site on the River Colne had a faunal
433
assemblage of 1072 bone fragments, 30.22% of these fragments were identifiable, with otter
making up only 0.09%, in comparison the red deer faunal remains at this site which made up
15.86% of the assemblage (Overton 2014).
Otters at Goldcliff may have been a nuisance to the Mesolithic fisherman. In modern Amazon
riverine communities, the fishermen are in direct competition with giant otters for the fish, with
otters having been noted to not only eat the fish and chase them away, but also cause deliberate
damage to the fishing gillets (Rosas-Riberio et al. 2011). This issue between fisherman and
otters is documented in a variety of otter species (Gómez & Jorgenson 1999, Roopsind 2002,
Carrera 2003, Gómez 2004, Recharte et al. 2008, Akpona et al. 2015), including in the Czech
Republic with Eurasian otters (Lutra lutra) which would have been present during Mesolithic
Britain (Václaviková et al. 2010). Eel are amongst otters’ favourite food source, which is also
the marine food most exploited by the hunter-gatherers of Goldcliff (Ingrem 2000, 2007).
A further possibility is that the footprint-track was made by neither otter nor wolf, but by
domesticated dog (Canis familiaris). It is not implausible for domesticated dogs to be at
Goldcliff, as the earliest evidence of domesticated dog in Britain comes from the Early
Mesolithic site of Star Carr, where there is a significant amount of carnivore gnawing on bones
which were made by domesticated dogs (Clark 1954). Although the presence of domesticated
dog at Goldcliff is possible, there has not been skeletal evidence of dog remains in this area and
the proportion of gnawed bones is very low, only eight bones at Goldcliff exhibit gnawing. We
therefore cannot know if these footprint-tracks were made by otter, wolf, or a domesticated dog
as all are possibilities.
9.5.5 Summary of mammals
The footprint-tracks of mammals at Goldcliff East indicate a site full of activity, though the
number of mammal footprints is lower than that represented by humans or birds. The majority
of the mammalian footprint-tracks were made by red deer, the skeletal assemblage was also
dominated by red deer remains (Scales 2006). The possible presence of juveniles as well as
stags allows for the tentative conclusion that these animals were present during the period of
May to July and were being hunted, butchered and consumed. There was limited footprint-track
evidence for other species, though roe deer and auroch were also in the area, but did not venture
too far into the wetlands.
434
9.6 Fish and marine resources
The variety of fish and marine resources may have been one of the appeals of this area to
Mesolithic hunter-gatherer-fishers. Fish bones were recovered from the site of Goldcliff East by
the utilisation of wet-sieving, with Site A providing the most abundant fish remains (Ingrem
2007, Table 13.3). There were 513 fragments from 6 taxa: salmon, eel, bass, bib, mullet and
flatfish as well as nine fragments from possible shellfish (Table 9.6). 404 of the bones were
burnt, indicating that these were likely to have been the remains of human food. At Site W, a
further 812 identified fish bones were recorded (Ingrem 2000, p 53). The species recorded
within the fish bone assemblage are all still found in the Severn Estuary, which provides a
unique ecosystem containing approximately 110 fish species. Salmon, eels and sea trout all use
the Severn Estuary as a migratory route from rivers to the sea for spawning, with the estuary
having the largest eel run in Great Britain today (Severn Estuary Partnership 2016). Eel
dominate the fish skeletal assemblage at Goldcliff East (83% from Site A), indicating that this
species was being targeted. The majority (60%) of eel bones from Goldcliff were small (150-
300mm), almost a quarter of the fish were medium sized (300-600mm) and the rest were very
small, under 150mm (Ingrem 2007). Eel migrate from freshwater sources to spawn in the sea,
and are generally adults of about 410mm in length when they make this journey (Wheeler
1969). As a result of this migratory spawning behaviour, eel will be numerous in estuaries and
the mouths of rivers during September/October where they can be easily trapped. Almost a
quarter of eel from Goldcliff would have been of migratory size, and so it can be suggested that
these fish were caught in the autumn (Ingrem 2007, p 168). Modern fishing techniques capture
eels with traps, nets, lines and spears, it is reasonable to think that this may have been the case
in prehistory.
At Site J at Goldcliff East there was evidence of molluscs, one cockle, (Cerastoderma edule),
one whelk (Buccinum undatum), and tiny periwinkles (Littorina obtusata, Littorina ‘saxatalis
type’ and Littorina littoralis). Mesolithic shell middens are often considered to be a defining
characteristic of the Mesolithic, so the lack of heavy shellfish exploitation of this site may
indicate shellfish were only eaten to supplement the diet. That said, the estuary is a very muddy
environment so edible shellfish, whilst present, are not particularly abundant as they do not
flourish in mud (Bell 2007, p168).
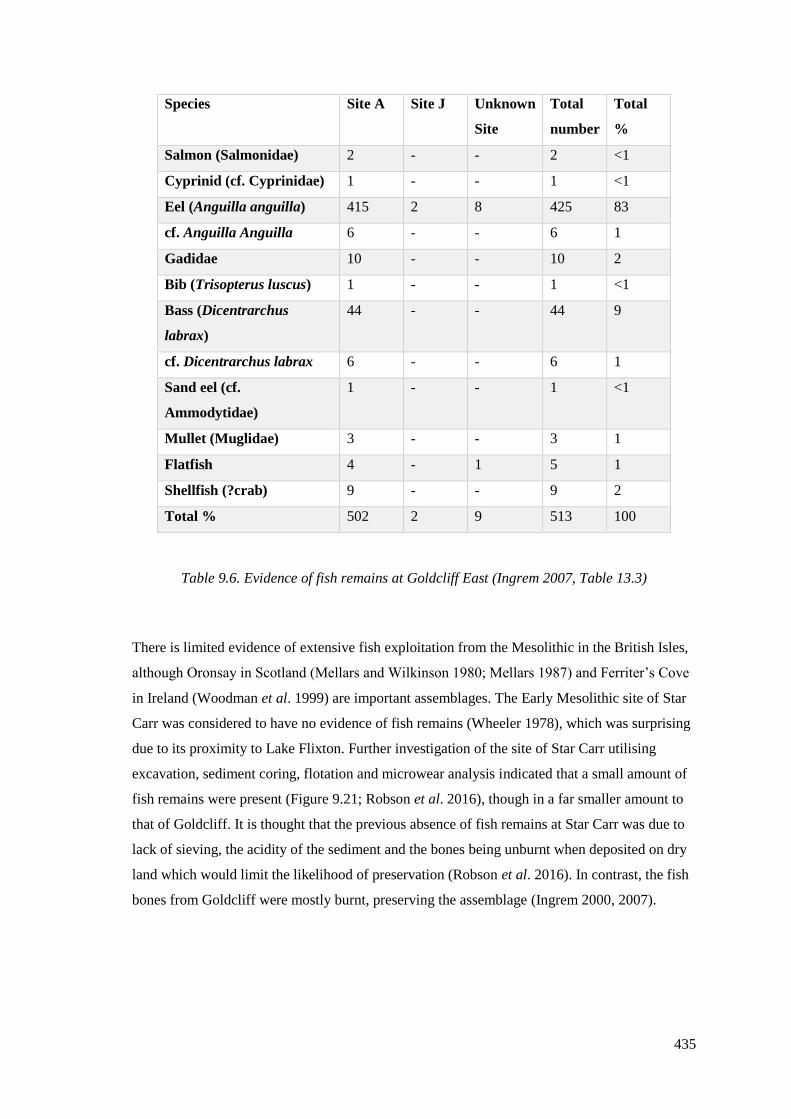
435
Species Site A Site J Unknown
Site
Total
number
Total
%
Salmon (Salmonidae) 2 - - 2 <1
Cyprinid (cf. Cyprinidae) 1 - - 1 <1
Eel (Anguilla anguilla) 415 2 8 425 83
cf. Anguilla Anguilla 6 - - 6 1
Gadidae 10 - - 10 2
Bib (Trisopterus luscus) 1 - - 1 <1
Bass (Dicentrarchus
labrax)
44 - - 44 9
cf. Dicentrarchus labrax 6 - - 6 1
Sand eel (cf.
Ammodytidae)
1 - - 1 <1
Mullet (Muglidae) 3 - - 3 1
Flatfish 4 - 1 5 1
Shellfish (?crab) 9 - - 9 2
Total % 502 2 9 513 100
Table 9.6. Evidence of fish remains at Goldcliff East (Ingrem 2007, Table 13.3)
There is limited evidence of extensive fish exploitation from the Mesolithic in the British Isles,
although Oronsay in Scotland (Mellars and Wilkinson 1980; Mellars 1987) and Ferriter’s Cove
in Ireland (Woodman et al. 1999) are important assemblages. The Early Mesolithic site of Star
Carr was considered to have no evidence of fish remains (Wheeler 1978), which was surprising
due to its proximity to Lake Flixton. Further investigation of the site of Star Carr utilising
excavation, sediment coring, flotation and microwear analysis indicated that a small amount of
fish remains were present (Figure 9.21; Robson et al. 2016), though in a far smaller amount to
that of Goldcliff. It is thought that the previous absence of fish remains at Star Carr was due to
lack of sieving, the acidity of the sediment and the bones being unburnt when deposited on dry
land which would limit the likelihood of preservation (Robson et al. 2016). In contrast, the fish
bones from Goldcliff were mostly burnt, preserving the assemblage (Ingrem 2000, 2007).
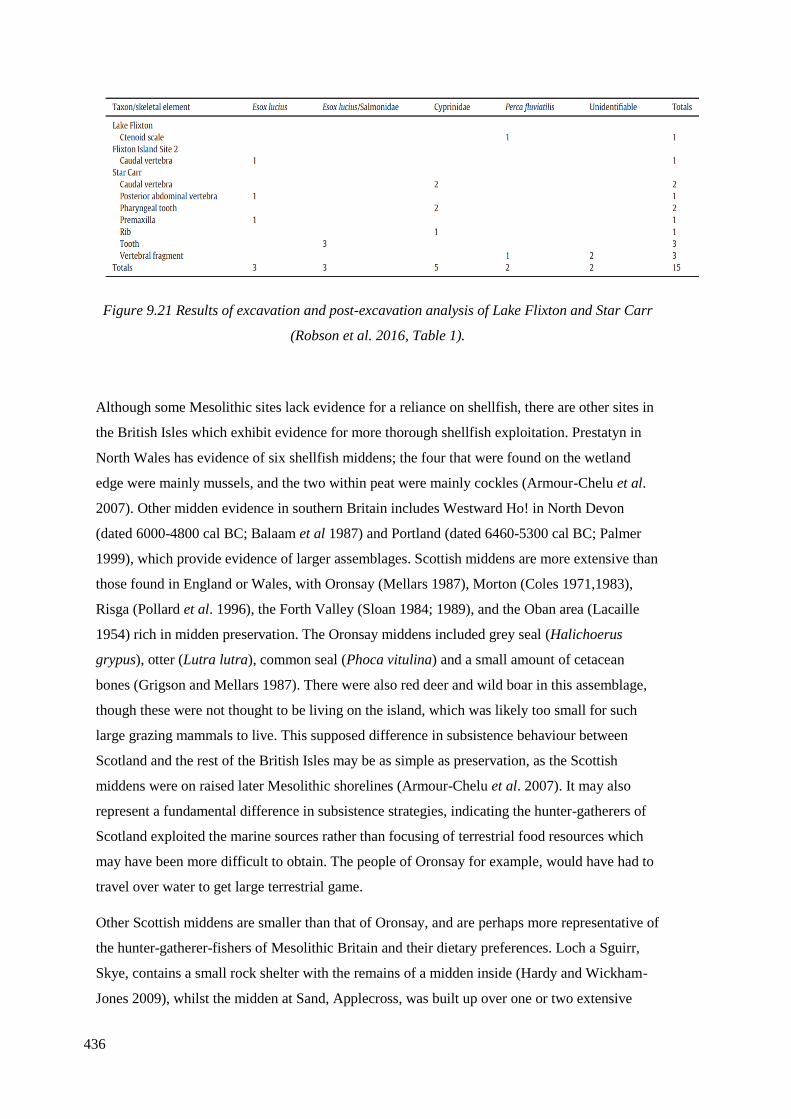
436
Figure 9.21 Results of excavation and post-excavation analysis of Lake Flixton and Star Carr
(Robson et al. 2016, Table 1).
Although some Mesolithic sites lack evidence for a reliance on shellfish, there are other sites in
the British Isles which exhibit evidence for more thorough shellfish exploitation. Prestatyn in
North Wales has evidence of six shellfish middens; the four that were found on the wetland
edge were mainly mussels, and the two within peat were mainly cockles (Armour-Chelu et al.
2007). Other midden evidence in southern Britain includes Westward Ho! in North Devon
(dated 6000-4800 cal BC; Balaam et al 1987) and Portland (dated 6460-5300 cal BC; Palmer
1999), which provide evidence of larger assemblages. Scottish middens are more extensive than
those found in England or Wales, with Oronsay (Mellars 1987), Morton (Coles 1971,1983),
Risga (Pollard et al. 1996), the Forth Valley (Sloan 1984; 1989), and the Oban area (Lacaille
1954) rich in midden preservation. The Oronsay middens included grey seal (Halichoerus
grypus), otter (Lutra lutra), common seal (Phoca vitulina) and a small amount of cetacean
bones (Grigson and Mellars 1987). There were also red deer and wild boar in this assemblage,
though these were not thought to be living on the island, which was likely too small for such
large grazing mammals to live. This supposed difference in subsistence behaviour between
Scotland and the rest of the British Isles may be as simple as preservation, as the Scottish
middens were on raised later Mesolithic shorelines (Armour-Chelu et al. 2007). It may also
represent a fundamental difference in subsistence strategies, indicating the hunter-gatherers of
Scotland exploited the marine sources rather than focusing of terrestrial food resources which
may have been more difficult to obtain. The people of Oronsay for example, would have had to
travel over water to get large terrestrial game.
Other Scottish middens are smaller than that of Oronsay, and are perhaps more representative of
the hunter-gatherer-fishers of Mesolithic Britain and their dietary preferences. Loch a Sguirr,
Skye, contains a small rock shelter with the remains of a midden inside (Hardy and Wickham-
Jones 2009), whilst the midden at Sand, Applecross, was built up over one or two extensive
437
episodes, with a focus on shellfish exploitation (Hardy and Wickham-Jones 2009; Milner
2009a). Middens can provide an insight into the dietary preferences of prehistoric people, with
puffin remains prevalent at the midden in An Corran, as well as salmon/trout, gadids, roe deer
and red deer, again indicating that a mix of marine, avian and terrestrial animals were consumed
(Bartosiewicz 2012).
Mesolithic fishing sites in Europe are extensive; Denmark in particular is abundant in
Mesolithic fish assemblages and indicates that the exploitation of one fish species above others
was not uncommon (Aaris-Sorensen 1980; Enghoff 1986; Noe-Nygaard 1983b). The people of
the Ertebølle culture did a lot of fishing, with their middens containing large accumulations of
fish bones and oyster shells from at least 41 species (Enghoff 1995, p 67). Their skeletons have
an oxygen isotopic composition which suggests marine resources played a key part in the diet
(Tauber 1993). Evidence of Mesolithic fish traps are also found in Denmark and compliment
the fish bone assemblage to indicate that fishing was an important subsistence practice
(Pedersen 1995; Pedersen 1997, p 140), with lime-based nets, fish hooks and harpoons being
common finds from Mesolithic settlements (Andersen 1995). At the centre of an ancient lake at
the site of Zamostje 2, Moscow, Russia, 300 wooden artefacts including fish traps, weirs,
paddles and fish screens were recorded and dated between Late Mesolithic and Early Neolithic.
One of the fish traps was C14 dated to 6550 ±40 BP (Beta-283033; 5560-5470 cal BC), an
Early Neolithic date (Lozovskaya and Lozovski 2016). At the bottom of a prehistoric reservoir,
lying close to three Early Neolithic fish traps, a fishing screen dating to the Late Mesolithic was
recorded, indicating that this site was exploited for fishing over hundreds of years (Lozovski et
al. 2013).
Enghoff (1995) has classified approximately 100,000 fish bones from Mesolithic coastal sites in
Denmark and has found that the fish being caught in the area were caught in stationary fish
traps and were fish species present near the coastline during the summer months, though eel
seem to be a target. Eel are a food source that is high in fat, protein and vitamins (Suhr 1972, p
493), and are simple to preserve by smoking so did not need to be consumed immediately
(Pedersen 1997, p 141). Complete and fragmentary eel baskets have been discovered
throughout Denmark, with one example from a refuse layer in Villingbaek, N.E. Zealand dated
to 7280-7040 BP (Kapel 1969).
In Denmark, archaeologists working on the Fehmarn Belt Tunnel Scheme discovered at least
two prehistoric human footprint-track trails along the edge of a post-and-wattle fish trap
(Museum Lolland-Falster 2014). This site is unique; not only does it contain a prehistoric fish
trap, but proof of the people who were using these for fishing, with evidence that they had
repeatedly repaired and moved part of the catch system to enable it to remain functioning.
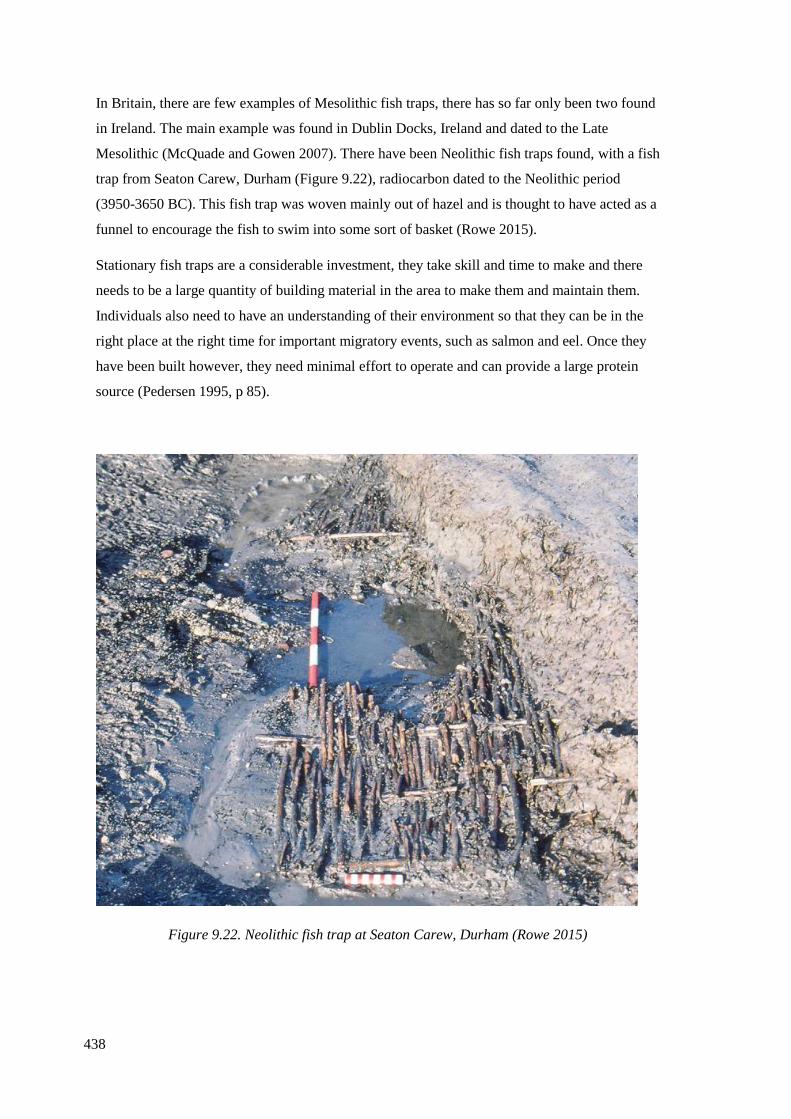
438
In Britain, there are few examples of Mesolithic fish traps, there has so far only been two found
in Ireland. The main example was found in Dublin Docks, Ireland and dated to the Late
Mesolithic (McQuade and Gowen 2007). There have been Neolithic fish traps found, with a fish
trap from Seaton Carew, Durham (Figure 9.22), radiocarbon dated to the Neolithic period
(3950-3650 BC). This fish trap was woven mainly out of hazel and is thought to have acted as a
funnel to encourage the fish to swim into some sort of basket (Rowe 2015).
Stationary fish traps are a considerable investment, they take skill and time to make and there
needs to be a large quantity of building material in the area to make them and maintain them.
Individuals also need to have an understanding of their environment so that they can be in the
right place at the right time for important migratory events, such as salmon and eel. Once they
have been built however, they need minimal effort to operate and can provide a large protein
source (Pedersen 1995, p 85).
Figure 9.22. Neolithic fish trap at Seaton Carew, Durham (Rowe 2015)
439
Possible fragments of a wooden fish trap at Goldcliff East were recorded in Site L, found in
2002 between Site H and the lower submerged forest (Site I). Site L was a marked channel
feature, where three small pointed stakes were recorded in the laminated silts. There were four
pieces of wood, as well as seeds and two hazelnut fragments found in this area, with a further
14 small pieces of wood found in a similar area when the channel was observed a year later
(Bell 2007, p 50). A recent find on the Severn Estuary provides much more convincing
evidence for a Mesolithic fish trap. On the final visit to Goldcliff East for this research in 2017,
a wooden structure was revealed, less than 30m west of Site N, and was named Site T. The
wooden structure lay along the edge of a palaeochannel and is made of roundwood posts at
intervals of c 1m with wattlework woven round to create a fence, one is in the form of a v-shape
fence structure which would presumably have led fish into basket traps. It is not clear if the 18m
length is one trap or shorter lengths of smaller traps on a similar alignment. The alignment is
well preserved in places, eroded away or below water in others. This structure was 14C
radiocarbon dated to 6107 ± 45 BP (UBA-35012; 5210-4912 cal BC). The human footprint-
tracks from Site N are all on a similar axis to this fish trap, heading south-west towards Site T,
and north-east away from the fish trap, almost at right angles to the palaeochannel. Site N is
east of Site T and given the dip of the laminated sediments is likely to be later in date and
related to another fish trap at a time when the channel had migrated further to the east, possibly
to Site L. The bones of fish, predominately eel (Ingrem 2007), and the fish trap and footprint-
track evidence indicate that the people of Goldcliff were fishing in this area.
9.7 Human footprint-tracks
Almost all human footprint-tracks from Prehistoric Europe are unshod. A possible exception to
this is the Neolithic site of Yenikapı, Istanbul, Turkey, where 390 footprints have been
recorded, many of which are clearly shod (Figure 9.23; Polat 2013). The earliest evidence of
shoes from Eurasia comes from Areni-1 cave, Vayots province, Armenia (Figure 9.24). This
shoe was made of leather and dated to 3627–3377 Cal BC, from the Chalcolithic period
(Pinhasi et al. 2010). The shoe is 24.5cm in length, between 7.6cm and 10cm in width and was
worn on the right foot of an individual. A single piece of leather was used to make this shoe,
which would have wrapped around the foot and includes a section of upper leather which
covers the front and middle of the foot (known as the vamp). The heel and hallux caused the
most wear, this occurs when a person has a normal gait as the heel and hallux are the two parts
of the foot where most pressure is asserted (Pinhasi et al. 2010). Further European evidence of
shoes comes from Ötzi the iceman, dated to 3365–3118 Cal BC (Kutschera 2000). Only parts of
Ötzi’s footwear remained preserved, with deer and bear leather creating a sole and an upper part
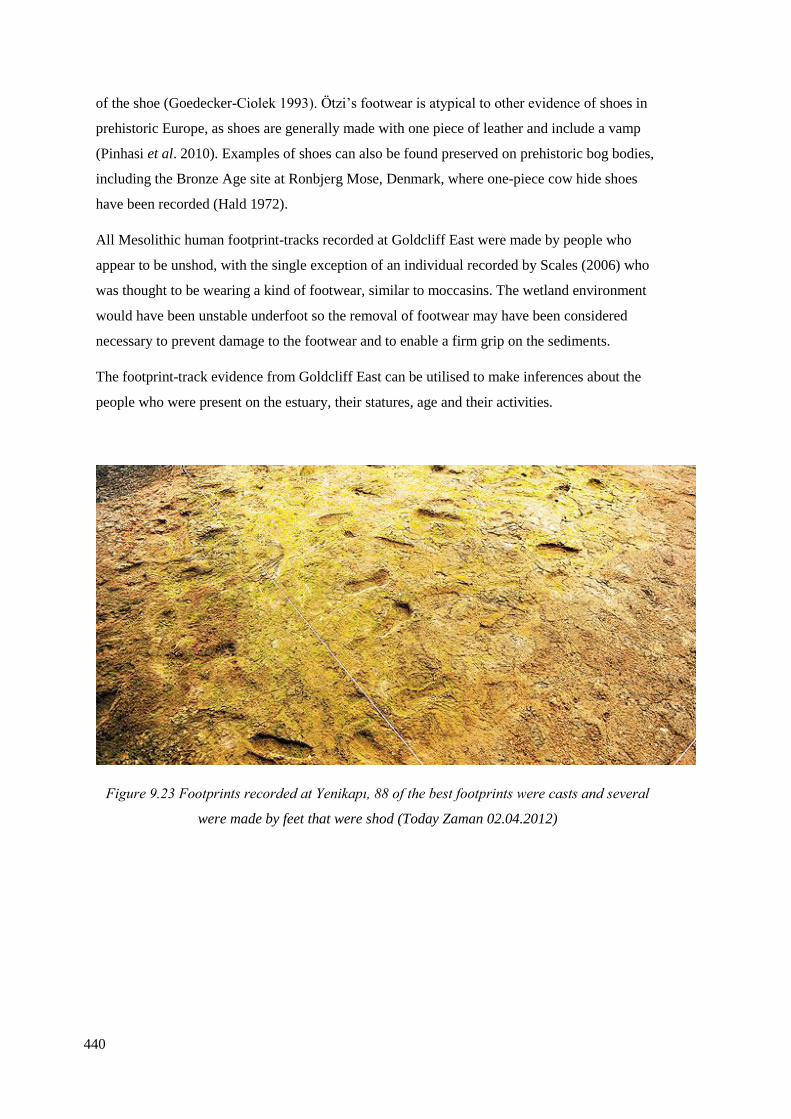
440
of the shoe (Goedecker-Ciolek 1993). Ötzi’s footwear is atypical to other evidence of shoes in
prehistoric Europe, as shoes are generally made with one piece of leather and include a vamp
(Pinhasi et al. 2010). Examples of shoes can also be found preserved on prehistoric bog bodies,
including the Bronze Age site at Ronbjerg Mose, Denmark, where one-piece cow hide shoes
have been recorded (Hald 1972).
All Mesolithic human footprint-tracks recorded at Goldcliff East were made by people who
appear to be unshod, with the single exception of an individual recorded by Scales (2006) who
was thought to be wearing a kind of footwear, similar to moccasins. The wetland environment
would have been unstable underfoot so the removal of footwear may have been considered
necessary to prevent damage to the footwear and to enable a firm grip on the sediments.
The footprint-track evidence from Goldcliff East can be utilised to make inferences about the
people who were present on the estuary, their statures, age and their activities.
Figure 9.23 Footprints recorded at Yenikapı, 88 of the best footprints were casts and several
were made by feet that were shod (Today Zaman 02.04.2012)

441
Figure 9.24 A leather shoe discovered at Areni-1 cave, Vayots province, Armenia (Pinhasi et al.
2010)
9.7.1 The people of Goldcliff and other prehistoric hunter-gatherers
An understanding of the Mesolithic hunter-gatherer demographic is complicated by the lack of
human skeletal remains at Goldcliff East. The largest collection of Mesolithic human remains in
the British Isles is from Aveline’s Hole, Mendip Hills, Somerset, this is within the Severn
Estuary region and as such is relatable to the Goldcliff East data (Figure 9.25). Aveline’s Hole
is far earlier in date than Goldcliff, dated between 9115±110 BP (BM-471) and 8740±100 BP
(OxA-1070; Shulting and Wysocki 2002). Preservation of organic material at Goldcliff has
meant that dating opportunities are excellent, and indicate that the site was visited by humans
over hundreds of years, though this was likely to be sporadic visits. Optically stimulated
luminescence (OSL) dating at Goldcliff East from the banded lamination containing footprint-
track 2014:310 which indicated a date of 8890±790 years before 2017 (GL16185), and the
442
lamination from Site R had an OSL date of 6620±610 years before 2017 (GL16184) (Appendix
1.2). Footprint-tracks from laminations at Site E were dated via the organic material within the
banded laminations, dated to 7300±65 BP (OxA-14037; 6340-6030 cal BC; Bell 2007, p 223).
The earliest horizon with artefacts at Site B was dated via the remains of a charred hazelnut to
7002±35 BP (OxA-13927; 5985-5784 cal BC; Bell 2007, p 45) and Site A was also dated from
a charred hazelnut, dated to 6629±38 BP (OxA-13928; 5622-5482 cal BC; Bell 2007, p 58).
At Aveline’s Hole there were originally estimated to be between 50 and 100 individuals
recorded within this ‘cemetery’ (Anon 1805, cited by Jacobi 1987). Most of the skeletal remains
from Aveline’s Hole was lost during bombings on Bristol in the Second World War, and all
remaining information is rather fragmentary. Ages were determined via dental wear analysis,
with the conclusion that it was rare for an individual to reach the age of 50 (Schulting and
Wysocki 2002). Within this sample there were five juveniles recorded, one was neonatal or
perinatal, one was a baby aged between 6-18 months, one aged 2.5-4.5 years, one aged 3.5-6.5
years, and one aged 5-7 years. The children had been included within the assemblage, rather
than buried separately from the adults. Schulting and Wysocki (2002) analysed the surviving
data, and determined that there were 15 or 16 adult individuals present. The sexing of these
individuals was problematic; it had previously been suggested that they were predominately
female (Fawcett 1922; Tratman 1922). Work by Schulting and Wysocki (2002) suggests that
this conclusion may be due to the small statue of the individuals. Most bones which would
enable stature estimations were missing; a distal humerus was estimated to be from an adult
female who was between 143cm-159cm (4’8” to 5’2”), this would be considered very short by
today’s standards and even short by prehistoric standards (Table 9.7).
The adults at Goldcliff East were estimated to have a stature of 166.5cm (5’5”), this was the
average height for all adult individuals, as sex was difficult to establish from the footprint-
tracks due to the variations in footprint formation on estuarine sediment. The smallest probable
adult female in the dataset had an estimated stature of 154.9cm (5’0”); the tallest adult male had
a stature of 198.5cm (6’6”). The assemblage at Goldcliff East suggests adults of both sexes
were present, as were children, with a large range in stature. The results from Scales’ (2006)
study of footprint-tracks at Goldcliff East found the average stature of the individuals who made
the footprints to be 178.7cm (5’10”). This is a 12cm height difference from the findings in the
current study, and is relatively tall even by today’s standards. Reanalysis of Scales (2006) data
(Table 9.8), utilising the stature equations within Chapter 5, suggests that the individuals
recorded may have a differing average height to that which Scales (2006) suggested, with adults
averaging 169.1cm (5’6”). This is an average stature that is 9.6cm shorter than Scales (2006)
original estimate, however the adjusted stature estimates in the current study are also similar to
the stature estimates from other prehistoric sites (Jakes et al. 1997; Hedges 1984; Schulting et

443
al. 2010). One of the explanations for this possible difference in stature estimates comes from
Scales’ (2006) recording technique. Scales (2006) established statures by utilising the theory
that a footprint is 15% of an individual’s stature (Giles and Vallandigham 1991) and estimated
ages using Clark’s (1990) shoe survey of age and foot size, as well as primary school children
aged between 4-11 years old, who drew around their feet to provide foot size dimensions.
Although this technique may work well in certain situations, specifically forensic work
(Robbins 1986), the experimental work in this study indicated that footprints made upon clayey
silt are more variable. The formation of a footprint on specific sediment influences the overall
size, they do not always conform to the generalisation that a foot length is 15% of a person’s
overall stature. Bennett and Morse (2014) found that empirical data from two-dimensional
footprints (such as those drawn around or ink-printed) were between 1cm and 2cm smaller than
the actual foot. Three-dimensional footprints were found to be 7% longer and up to 12% wider
when compared to the foot tracings. Within the current study it was found that footprints made
upon clayey silt sediment could range between 2cm shorter than the actual foot, up to 2cm
longer. When comparing the three-dimensional footprints to the two-dimensional, it was found
that they could be up to 9.5% longer than foot tracings. We must therefore treat footprints with
caution when calculating stature directly from the size, as they may be an underestimate or an
overestimate of actual foot length, in these situations stature regression equations may provide
more accurate results.
Scales’ (2006) data from footprint-track trails has been reanalysed using the three-dimensional
data and added to the results of the current study (Table 9.9). The Uskmouth and Magor Pill
footprint-track data recorded by Aldhouse-Green et al. (1992) has also been reanalysed utilising
the techniques from Chapter 5 (Table 9.10). The adults from Uskmouth and Magor Pill were
tall, ranging from 172.1cm (5’7”) to 188.7cm (6’2”), there were also two children.
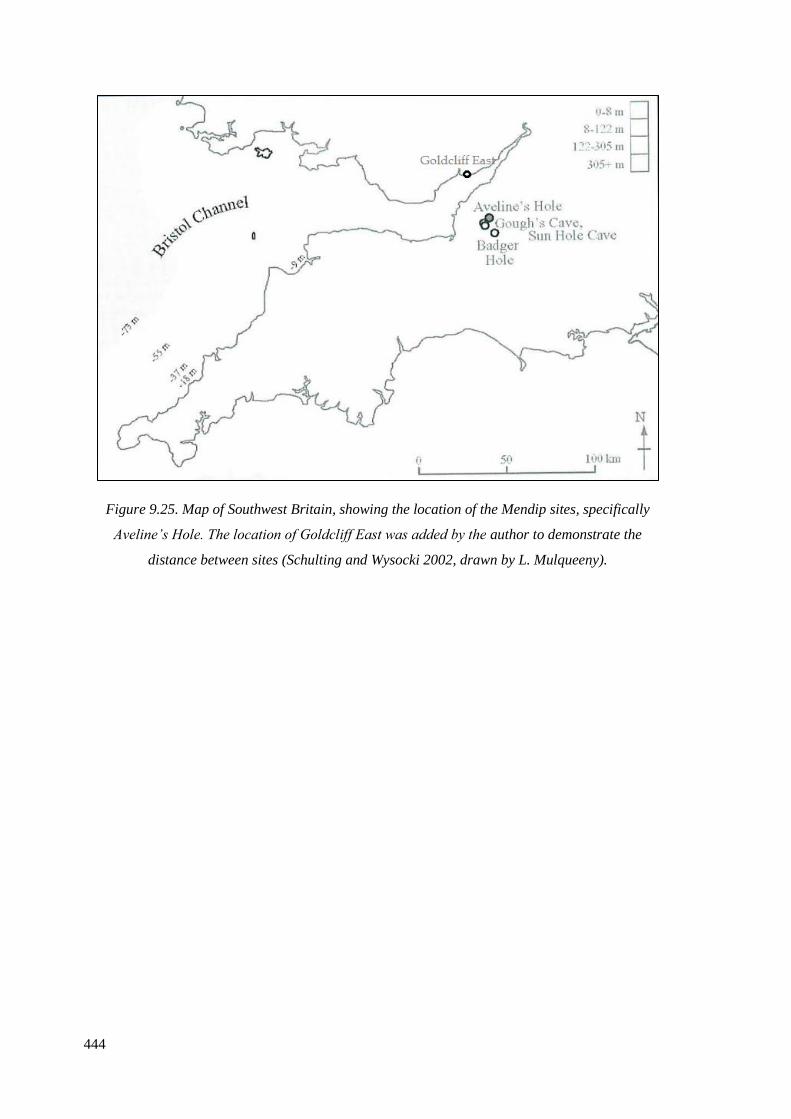
444
Figure 9.25. Map of Southwest Britain, showing the location of the Mendip sites, specifically
Aveline’s Hole. The location of Goldcliff East was added by the author to demonstrate the
distance between sites (Schulting and Wysocki 2002, drawn by L. Mulqueeny).
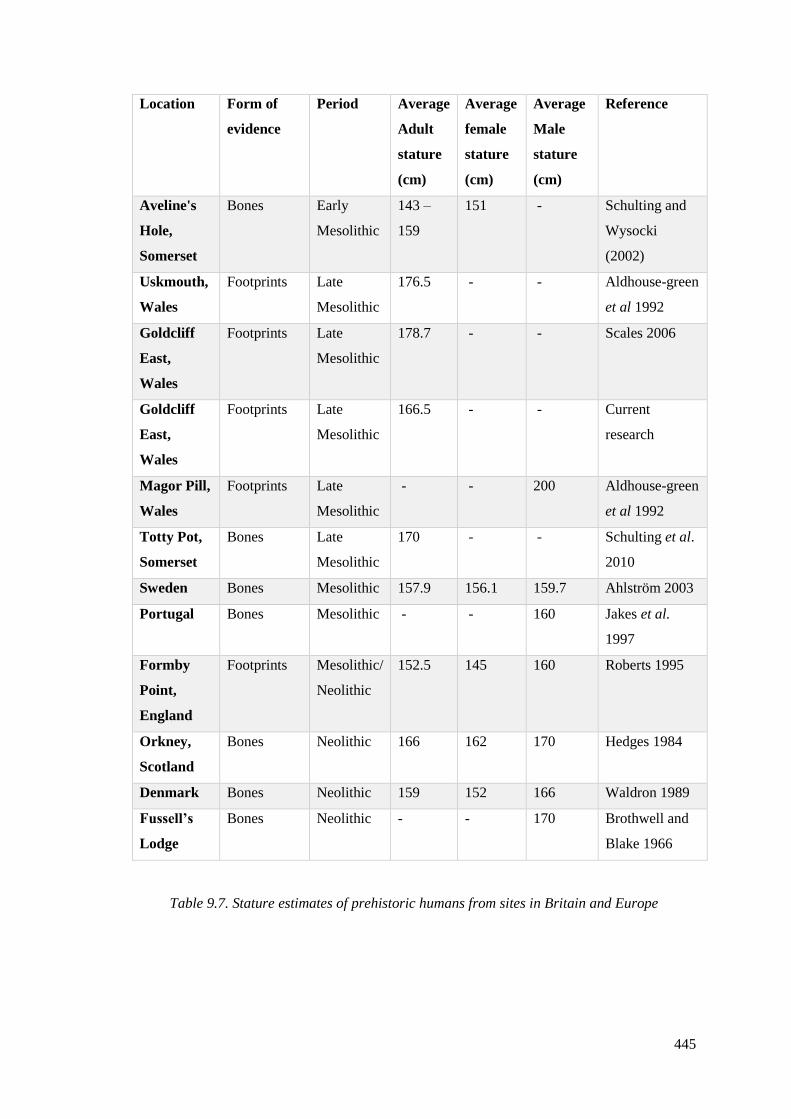
445
Location Form of
evidence
Period Average
Adult
stature
(cm)
Average
female
stature
(cm)
Average
Male
stature
(cm)
Reference
Aveline's
Hole,
Somerset
Bones Early
Mesolithic
143 –
159
151 - Schulting and
Wysocki
(2002)
Uskmouth,
Wales
Footprints Late
Mesolithic
176.5 - - Aldhouse-green
et al 1992
Goldcliff
East,
Wales
Footprints Late
Mesolithic
178.7 - - Scales 2006
Goldcliff
East,
Wales
Footprints Late
Mesolithic
166.5 - - Current
research
Magor Pill,
Wales
Footprints Late
Mesolithic
- - 200 Aldhouse-green
et al 1992
Totty Pot,
Somerset
Bones Late
Mesolithic
170 - - Schulting et al.
2010
Sweden Bones Mesolithic 157.9 156.1 159.7 Ahlström 2003
Portugal Bones Mesolithic - - 160 Jakes et al.
1997
Formby
Point,
England
Footprints Mesolithic/
Neolithic
152.5 145 160 Roberts 1995
Orkney,
Scotland
Bones Neolithic 166 162 170 Hedges 1984
Denmark Bones Neolithic 159 152 166 Waldron 1989
Fussell’s
Lodge
Bones Neolithic - - 170 Brothwell and
Blake 1966
Table 9.7. Stature estimates of prehistoric humans from sites in Britain and Europe
446
Footprint-tracks and skeletal remains from across Europe can give a further insight into the
relationship between hunter-gatherers and their stature (Table 9.7). Footprint-tracks recorded at
Formby Point were estimated to indicate an average male height of 166cm (5’5”) and female
height of 145cm (4’9”) (Roberts 1995), this is a similar stature to the estimates made from the
skeletal remains data at Aveline’s Hole. Neolithic remains recorded from Denmark also show a
similar average stature estimate, with males 166cm tall (5’5”) and females 153cm (5’0”)
(Waldron 1989). The average British woman is now 161.6cm (5’3”) tall, and average British
men are 175.3cm (5’9”) (Office for National Statistics 2011), this is slightly taller than the
average statures of individuals seen within prehistory, however there were still prehistoric
individuals who were taller than today’s averages. Reanalysis of Scales’ (2006) data indicates
that Person 4 was estimated to be 191.8cm (6’3”). This demonstrates the variability of heights
within a small population, and that although possibly shorter than today’s average height, the
people of Goldcliff East were not markedly short of stature.
Schulting and Richards (2000) performed stable carbon and isotope analysis on three humeri
bones from Aveline’s Hole. Interestingly, these results indicated a primarily terrestrial diet, with
very little consumption of marine foods, this lack of marine consumption could be due to their
geographical location, as the site would have been approximately 100km from the sea (Figure
9.25). Although the lack of marine foods can be explained by distance to the resources, other
water resources, such as river salmon, were not being consumed even though multiple water
sources would have been in the surrounding landscape (Schulting and Wysocki 2002). Within
the Aveline’s Hole skeletal assemblage, two of the individuals exhibited criba orbitlia, which is
associated with iron deficiency; this may have been caused by an inadequate diet, or from an
infestation of intestinal parasites (Stuart-Macadam 1992). There was evidence of human
parasites at Goldcliff Site B and D, these are thought to be whipworm (T. trichiura) (Dark 2007,
p 170), possibly similar to the parasites that were perhaps infesting individuals at Aveline’s
Hole. Seafood is one of the most iron rich protein sources so the lack of marine foods in the diet
of the people in the Aveline’s Hole assemblage may indicate the cause of their deficiencies.
Most of the Mesolithic burials from further west in the Bristol channel do show heavy reliance
on marine resources but there are a few which do not (Schulting and Richards 2000, 2002a,b).
This variation in terrestrial and marine diet is seen throughout the Mesolithic sites across Britain
and Ireland (Figure 9.26), and indicates that there was no standard behaviour when it came to
diet. The archaeological evidence from Goldcliff indicates a society that were exploiting both
terrestrial and marine resources, with fishing, hunting and processing carcasses all occurring in
vicinity to Goldcliff Island (Coard 2000; Ingrem 2000; 2007; Scales 2007b).

447
Figure 9.26 Summary graph of published carbon isotope values from British and Irish
Mesolithic sites before 4000BC (Milner 2009b, Figure 1).
The assemblage at Goldcliff represents both males and females of a variety of ages.
Interestingly, there were only two footprint-track trails at Goldcliff East (Person 5 and Person 6)
which could be identified as adult males. From the experimental work involving contemporary
footprints only one adult female and two adolescent children (one male, one female) had an
average footprint length of over 27cm. Only males had an average footprint length over 28cm,
and only 32% of males within the experiment had footprints smaller than 27cm. We can
therefore identify Person 5 and Person 6 as adult males who were present at Site E. The
presence of these tall males indicates a possible change in site usage over time. Site M, Site N
and Site S are earlier sites than Site E, and they have a different direction of movement, north
east to south west, as opposed to Site E which has a north-west focus. This change in direction
may indicate that males were on site for a specific activity, which the area may have not been
used for before that time. Person 4 from Magor Pill was also likely to be an adult male.
The sites of Goldcliff, Uskmouth and Magor Pill are relatively small, however they all contain
evidence of young children, indicating that juveniles were allowed out onto the wetlands. The
footprint-tracks made by children at Goldcliff were between 100-400m away from dry land,
whilst the people at Uskmouth were 3.4km from Goldcliff Island and 6km away from the
nearest dry land to the north. The footprint-tracks at Magor Pill were c. 3km from the nearest
dry land in the north. This demonstrates that children were not just allowed to enter the wetland
environment, but could be kilometres away from dry land.
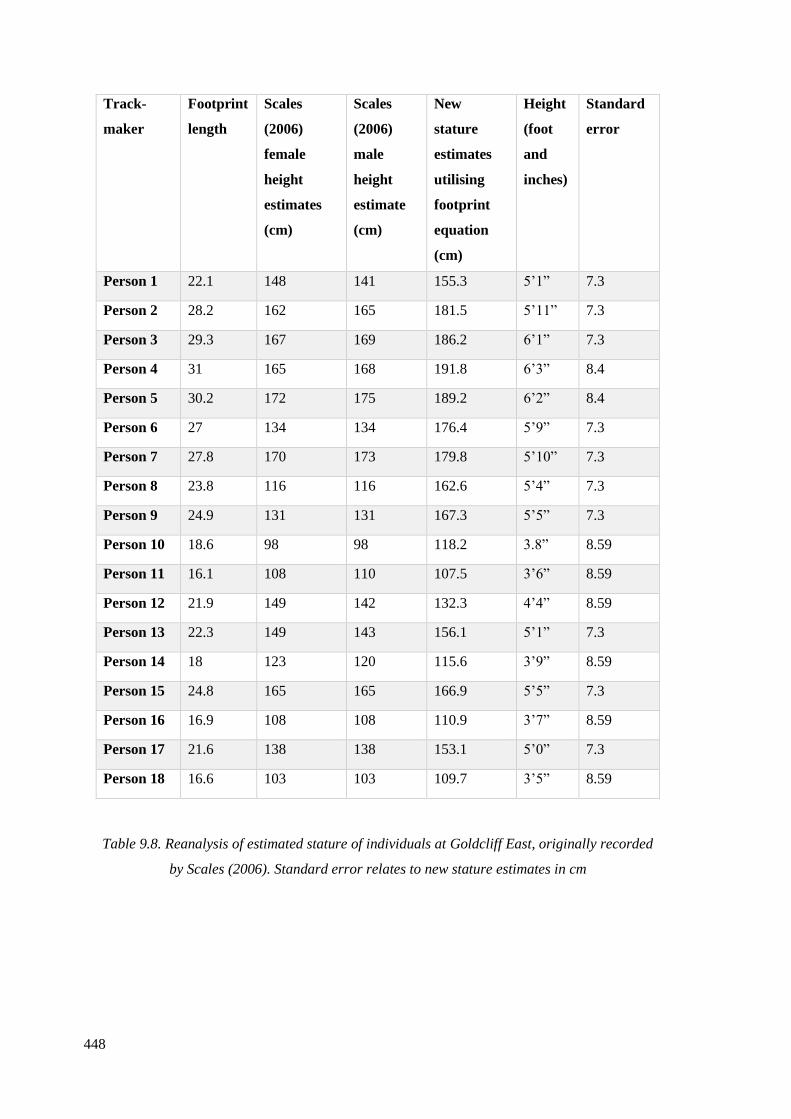
448
Track-
maker
Footprint
length
Scales
(2006)
female
height
estimates
(cm)
Scales
(2006)
male
height
estimate
(cm)
New
stature
estimates
utilising
footprint
equation
(cm)
Height
(foot
and
inches)
Standard
error
Person 1 22.1 148 141 155.3 5’1” 7.3
Person 2 28.2 162 165 181.5 5’11” 7.3
Person 3 29.3 167 169 186.2 6’1” 7.3
Person 4 31 165 168 191.8 6’3” 8.4
Person 5 30.2 172 175 189.2 6’2” 8.4
Person 6 27 134 134 176.4 5’9” 7.3
Person 7 27.8 170 173 179.8 5’10” 7.3
Person 8 23.8 116 116 162.6 5’4” 7.3
Person 9 24.9 131 131 167.3 5’5” 7.3
Person 10 18.6 98 98 118.2 3.8” 8.59
Person 11 16.1 108 110 107.5 3’6” 8.59
Person 12 21.9 149 142 132.3 4’4” 8.59
Person 13 22.3 149 143 156.1 5’1” 7.3
Person 14 18 123 120 115.6 3’9” 8.59
Person 15 24.8 165 165 166.9 5’5” 7.3
Person 16 16.9 108 108 110.9 3’7” 8.59
Person 17 21.6 138 138 153.1 5’0” 7.3
Person 18 16.6 103 103 109.7 3’5” 8.59
Table 9.8. Reanalysis of estimated stature of individuals at Goldcliff East, originally recorded
by Scales (2006). Standard error relates to new stature estimates in cm
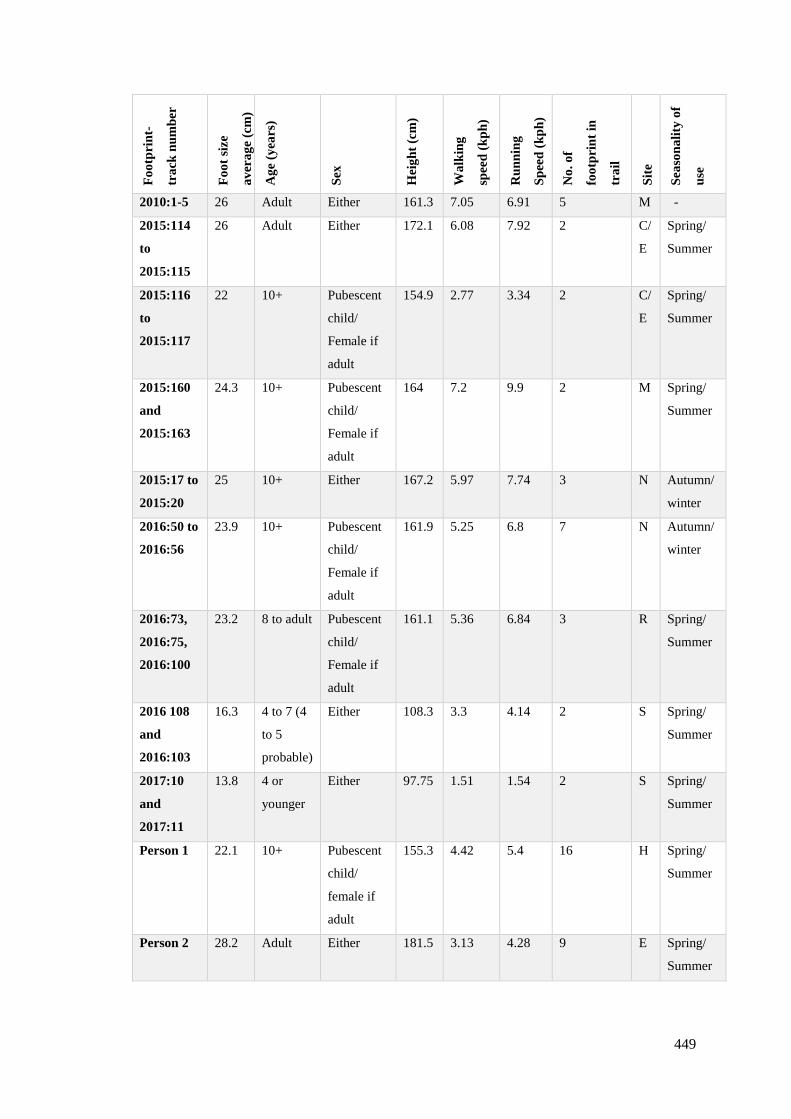
449
Fo
otp
rin
t-
tra
ck n
um
ber
Fo
ot
size
av
era
ge
(cm
)
Ag
e (y
ears
)
Sex
Hei
gh
t (c
m)
Wa
lkin
g
spee
d (
kp
h)
Ru
nn
ing
Sp
eed
(k
ph
)
No
. o
f
foo
tpri
nt
in
tra
il
Sit
e
Sea
son
ali
ty o
f
use
2010:1-5 26 Adult Either 161.3 7.05 6.91 5 M -
2015:114
to
2015:115
26 Adult Either 172.1 6.08 7.92 2 C/
E
Spring/
Summer
2015:116
to
2015:117
22 10+ Pubescent
child/
Female if
adult
154.9 2.77 3.34 2 C/
E
Spring/
Summer
2015:160
and
2015:163
24.3 10+ Pubescent
child/
Female if
adult
164 7.2 9.9 2 M Spring/
Summer
2015:17 to
2015:20
25 10+ Either 167.2 5.97 7.74 3 N Autumn/
winter
2016:50 to
2016:56
23.9 10+ Pubescent
child/
Female if
adult
161.9 5.25 6.8 7 N Autumn/
winter
2016:73,
2016:75,
2016:100
23.2 8 to adult Pubescent
child/
Female if
adult
161.1 5.36 6.84 3 R Spring/
Summer
2016 108
and
2016:103
16.3 4 to 7 (4
to 5
probable)
Either 108.3 3.3 4.14 2 S Spring/
Summer
2017:10
and
2017:11
13.8 4 or
younger
Either 97.75 1.51 1.54 2 S Spring/
Summer
Person 1 22.1 10+ Pubescent
child/
female if
adult
155.3 4.42 5.4 16 H Spring/
Summer
Person 2 28.2 Adult Either 181.5 3.13 4.28 9 E Spring/
Summer
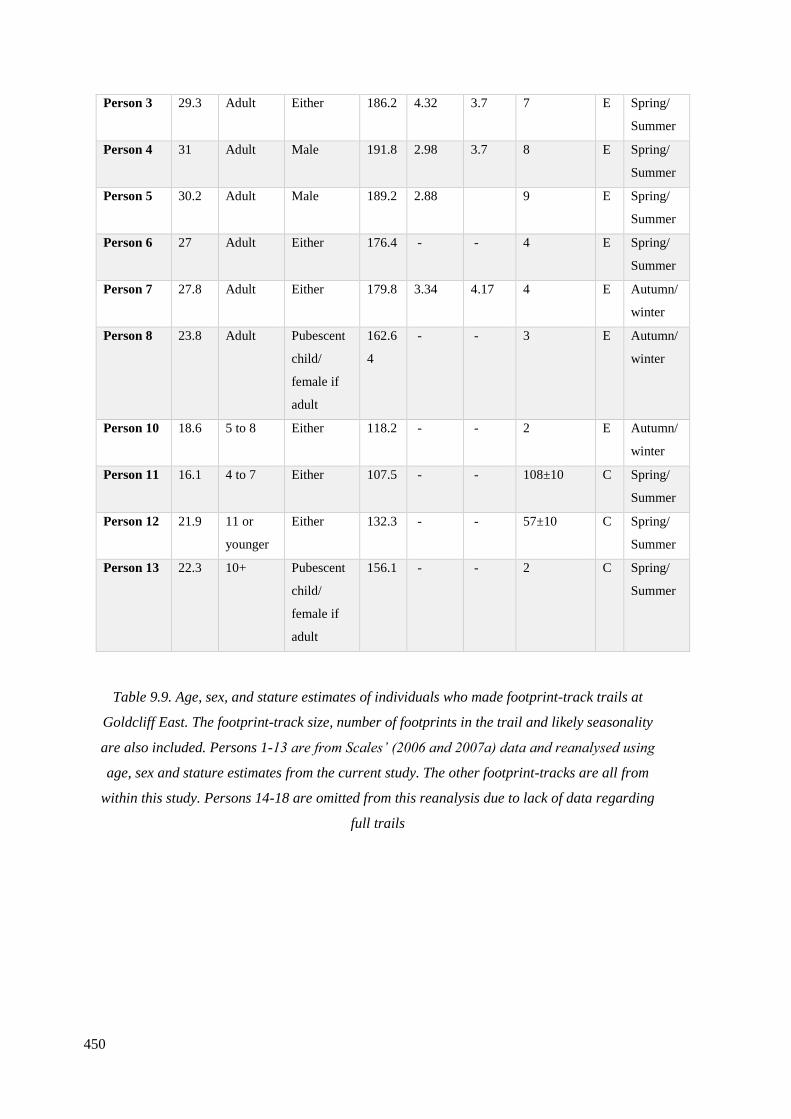
450
Person 3 29.3 Adult Either 186.2 4.32 3.7 7 E Spring/
Summer
Person 4 31 Adult Male 191.8 2.98 3.7 8 E Spring/
Summer
Person 5 30.2 Adult Male 189.2 2.88
9 E Spring/
Summer
Person 6 27 Adult Either 176.4 - - 4 E Spring/
Summer
Person 7 27.8 Adult Either 179.8 3.34 4.17 4 E Autumn/
winter
Person 8 23.8 Adult Pubescent
child/
female if
adult
162.6
4
- - 3 E Autumn/
winter
Person 10 18.6 5 to 8 Either 118.2 - - 2 E Autumn/
winter
Person 11 16.1 4 to 7 Either 107.5 - - 108±10 C Spring/
Summer
Person 12 21.9 11 or
younger
Either 132.3 - - 57±10 C Spring/
Summer
Person 13 22.3 10+ Pubescent
child/
female if
adult
156.1 - - 2 C Spring/
Summer
Table 9.9. Age, sex, and stature estimates of individuals who made footprint-track trails at
Goldcliff East. The footprint-track size, number of footprints in the trail and likely seasonality
are also included. Persons 1-13 are from Scales’ (2006 and 2007a) data and reanalysed using
age, sex and stature estimates from the current study. The other footprint-tracks are all from
within this study. Persons 14-18 are omitted from this reanalysis due to lack of data regarding
full trails

451
Person and site
Location
Footprint-
track
Length
(cm)
Age
(years)
Sex Height
(cm)
Standard
error
Height
(foot
and
inches)
Person 1
(Uskmouth)
27 Adult Either 176.4 7.3 5’9”
Person 2
(Uskmouth)
26 Adult Either 172.1 7.3 5’7”
Person 3
(Uskmouth)
21 10 or 11 Either 150.6 7.3 4’11”
Person 4
(Magor Pill)
30.1 Adult Male 188.7 8.3 6’2”
Person 5
(Magor Pill)
16 4 to 7 Either 107.1 8.59 3’6”
Table 9.10. Reanalysis of the footprint-track data from Uskmouth and Magor Pill (Aldhouse-
Green et al. 1992). Standard error relates to height in cm
9.7.2 Hunter-gatherer activities
A unique aspect of intertidal sites is that erosion and changes to sediment deposition result in
the constant exposure of important archaeology with very little excavation work required. Fish
bone evidence from Site A suggested that at Goldcliff marine resources were being exploited
with a focus on eel fishing (Ingrem 2007, p 167), this area was dated through a charred hazelnut
to 6629±38 BP (OxA-13928; 5630-5480 cal BC; Bell 2007, p 58). The newly discovered
wooden structure at Site T, west of Site N, thought to be a possible fish trap, was radiocarbon
dated to 6107±45 BP (UBA-35012; 5210-4912 cal BC), indicating that for at least 500 years
this area was used for fishing. The fish bone assemblage from Goldcliff was from species that
could be found close to the shore in shallow water (Ingrem 2000, 2007). The presence of the
possible stationary fish trap indicates that fish traps and nets were likely being utilised so that
people could walk out to their traps at low tide, possibly for basket fishing (Andersen 1995).
Although we have evidence of fish bones from Site A, there have not been any fish bones
recovered directly from Site T, and so we cannot say with certainty the species that was being
trapped with this structure, or the season in which fishing was performed.

452
Site N footprint-track trails had an obvious axis of movement, moving in two directions in a
belt between 50°-103° north east and 240°-250° south west. This axis leads towards and away
from Goldcliff Island. The individuals who were walking away from Goldcliff Island were
heading in a direction that would take them towards Magor Pill, another area where human
footprints have been recorded (Aldhouse-Green et al. 1992). They would have been walking
across laminated sediments laid down in a palaeochannel, the laminated sediments dip to the
east showing that through time the course of the palaeochannel was migrating from west to east
(Bell 2007, p 49). At the time of the Site N footprints, the course of the channel would have
been somewhere between a few tens of meters and 150m to the east. Possible fragments of a
fish trap were found in that direction in the channel during 2004 fieldwork, at Site L (Bell 2007,
Figure 4.2), however they were very fragmentary so the purpose of this structure could not be
identified with certainty. There is evidence of Mesolithic wooden structures that have been
associated with fishing at a variety of sites in Denmark (Pedersen 1995), from the site of
Zamostje 2, Moscow Russia (Lozovskaya and Lozovski 2016; Lozovski et al. 2013) and from a
channel adjacent to the Hoge Vart site, in the Netherlands (Hogestijn and Peeters 2001). This
evidence of wooden fishing structures in Europe, as well as that found at Site T, suggests that it
is possible that Site L was the remains of an eroded fishing structure still within the
palaeochannel, and that the people at Site N were likely exploiting this area for a specific
fishing task.
It may be that people who made the footprints on Site N were not based at Goldcliff Island, but
as they were using fixed fish-traps they would have had to remain relatively near the area to
check their catch. Providing that they are kept moist, eel can survive a long time in a fish trap
(Fischer 2007), however as otter and a variety of coastal birds were in the area it is likely that
they would have checked their catch with each low tide to prevent it being stolen, up to twice a
day. Stationary fishing structures would have needed to be checked for damage after each catch
so that any repairs could be carried out (Fischer 2007).
The human footprint-tracks from Site N were made by individuals who ranged in approximate
age from 6.5 +/-1.5 years to adult (Chapter 6; Table 6.16). 16 of the footprint-tracks were small
and likely made by individuals over ten years old, who may have been of either sex, or they
may have been adult females. Eight were over 24cm in length so could have been made by adult
males, females, or pubescent children, and nine footprint-tracks were incomplete. The high
number of footprint-tracks under 24cm and the recurrent patterns of movement along this
routeway (footpath) which we can logically suppose was associated with the use of fish traps in
the channel indicates that at Goldcliff it was children, adolescents and possibly adult females
who were mainly involved in fishing.
453
Burials from the Late Mesolithic/ Early Neolithic cemeteries in Dnieper Rapids region of
Ukraine suggest that children were buried in the same way as adults and were therefore fully
integrated within society and playing an active role in their community from an early age.
Evidence such as Cyprinidae teeth found within the burials suggests that fishing may have been
a subsistence activity that involved children (Lillie 1997, p 222).
Ethnographic hunter-gatherer subsistence strategies can vary depending on specific groups.
Roscoe (2006) found that the hunter-gatherers of New Guinea who rely on fish as their main
protein source have a higher population density than those relying on terrestrial resources.
Bahinemo hunters consumed minimal amounts of marine foods and had a population of 0.2
people/km2, as opposed to the Waropean tribe who mainly exploited saltwater and fresh water
foods, and had a population density of 25.8 people/km2. Although this theory cannot be applied
to Goldcliff East as the area was lacking in skeletal remains, Aveline’s Hole is the richest
Mesolithic site in Britain for skeletal remains and is part of the landscape surrounding the
Severn river. The human skeletal remains date between 9115BP and 8740 BP, meaning that this
area may have been used by multiple generations (Schulting and Wysocki 2002). The size of
this Mesolithic hunter-gatherer population is unknown, however anthropological research finds
that mobile hunter-gatherers with a population between 25-35 people who move camp several
times a year are most successful, especially when relying on terrestrial food sources (Lee and
Daly 1999). The Hazda people, for example, live in camps of approximately 29 (Blurton-Jones
et al. 1992). Given the reliance on terrestrial protein sources by the hunter-gatherers at
Aveline’s Hole, as well as a relatively limited amount of skeletal remains across a large time
periods, it may suggest that the people of Aveline’s Hole had a small population to enable
successful terrestrial hunting. The same is possible of the people of Goldcliff, as there is limited
evidence for extensive processing and resource exploitation, which would have suggested that a
large group was in the area. At Goldcliff the activity areas are small and the quantities of
artefacts and bones are not extensive, there is also no evidence of middening of material which
might be associated with large numbers of people or extended stays (Bell et al. 2000; Bell
2007), such as the extensive kitchen middens seen at Ertebølle, Denmark (Andersen 2000). The
quantities of material culture are in the order of what might be expected from visits of a few
days to a few weeks rather than months or sedentary occupation (Bell 2007, p 235). Multiple
discrete clusters suggestive of fairly short-term occupations and high mobility by fairly small
groups are an emerging characteristic of the Mesolithic which is seen at Star Carr (Conneller et
al. 2012), at Bexhill on Sea in Sussex (Champness and Hughes 2013) and at North Park Farm,
Bletchingley, Surrey (Jones 2013), among others.
454
9.7.3 Children and their behaviours
The presence of children is often hidden within prehistoric archaeology; footprint-tracks
provide perhaps our most tangible evidence of these individuals going about their lives. This
provides an entirely different perspective from the skeletal remains of children, who we know
must have suffered from illness, disease, or encountered an incident which ended their lives
during childhood. Oddly, within modern anthropological work, children are often omitted from
research, leading Hirschfeld (2002) to explore why children are ignored. It is interesting that
modern hunter-gatherer children are mainly absent from studies when the activities of
prehistoric hunter-gatherer children are often also missing from the archaeological record and
may indicate that as anthropologists and archaeologists we are biased towards assuming adult,
generally male, activity. We know that children and adult females were present in the past,
however they are often represented as just ‘there’ rather than playing an active role in society
(Moore 1997, p 254), with the women’s roles confined to childcare and staying in the
settlement (Derevenski 1997). It has even been suggested that within archaeology dogs are
more studied than children (Moore 1997, p 255). Chamberlain (1997, p 249) argues that most
prehistoric populations had a high mortality rate, and so to keep a stable or slowly growing
population at least 50% of individuals would need to be under the age of 18 years old. Both
children and women are being ignored in archaeology, possibly due to academic male
hegemony (Moore 1997, p 252); if we are ignoring children we are ultimately ignoring half the
prehistoric population.
Of the 21 footprint-track trails containing at least two footprints that have been recorded at
Goldcliff East between 2001-2017, six were made by children aged less than 11 years old. The
percentage of children (29%), may seem unusually high, however this is also reflected in
modern hunter-gatherer societies. In Australia a study was undertaken by The Australian
Bureau of Statistics (2012) to estimate the population of Aboriginal Australians with
comparison to non-indigenous peoples. This study recorded that 36% of Aboriginal people were
aged under 15-years-old, whereas only 18% of non-indigenous people fell into this same age
bracket, indicating indigenous people had almost double the number of children as non-
indigenous. Although Australian aborigines had a higher percentage of juveniles within their
community, they also have a higher rate of infant mortality, with 6.2 infant deaths per 1000
births as opposed to non-aboriginal infant death rates of 3.7 per 1000 births. It is thought that
the higher percentage of juveniles within the Aborigine population is due to their lifestyle and
increased fertility, however their children are also more likely to die when young (The
Australian Bureau of Statistics 2014).
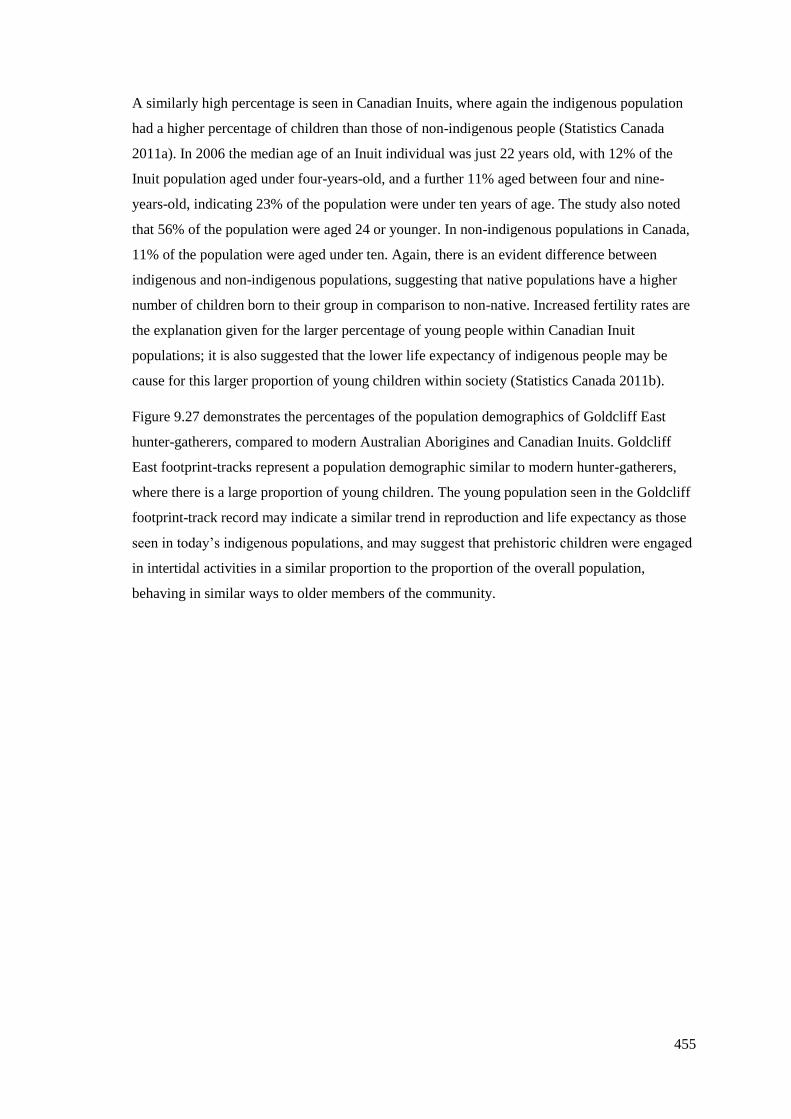
455
A similarly high percentage is seen in Canadian Inuits, where again the indigenous population
had a higher percentage of children than those of non-indigenous people (Statistics Canada
2011a). In 2006 the median age of an Inuit individual was just 22 years old, with 12% of the
Inuit population aged under four-years-old, and a further 11% aged between four and nine-
years-old, indicating 23% of the population were under ten years of age. The study also noted
that 56% of the population were aged 24 or younger. In non-indigenous populations in Canada,
11% of the population were aged under ten. Again, there is an evident difference between
indigenous and non-indigenous populations, suggesting that native populations have a higher
number of children born to their group in comparison to non-native. Increased fertility rates are
the explanation given for the larger percentage of young people within Canadian Inuit
populations; it is also suggested that the lower life expectancy of indigenous people may be
cause for this larger proportion of young children within society (Statistics Canada 2011b).
Figure 9.27 demonstrates the percentages of the population demographics of Goldcliff East
hunter-gatherers, compared to modern Australian Aborigines and Canadian Inuits. Goldcliff
East footprint-tracks represent a population demographic similar to modern hunter-gatherers,
where there is a large proportion of young children. The young population seen in the Goldcliff
footprint-track record may indicate a similar trend in reproduction and life expectancy as those
seen in today’s indigenous populations, and may suggest that prehistoric children were engaged
in intertidal activities in a similar proportion to the proportion of the overall population,
behaving in similar ways to older members of the community.
456
Figure 9.27 Percentages of population demographic of adults compared to children (a)
Mesolithic Goldcliff East (b) modern Canadian Inuit population (Statistics Canada 2011a) (c)
modern Australian aborigines’ population (The Australian Bureau of Statistics 2012)
77%
23%
Canadian Inuit population
demographic
10+ Children under 10
71%
29%
Goldcliff East population demographic
Adult/ children 10+ Children under 11
64%
36%
Australian Aborigines population demographic
Adult Children under 15
(a)
(b) (c)
457
It may seem strange or even dangerous to allow young children into an area such as the
intertidal zone where there was the danger of mud, palaeochannels and drowning, however we
know through footprint-track evidence that young children were in this area. It is worth
consulting ethnographic studies to understand what hunter-gatherer juveniles of a similar age in
contemporary hunter-gatherer societies are doing, and what the role is that they play within
their community. Though it must be stressed that there is no way of knowing with absolute
certainty what the activities of these children were, contemporary hunter-gatherer societies can
help us to understand what is expected of children.
Within the Efe tribe, a society of hunter-gatherer pygmies who live in the rainforest in the
Democratic Republic of the Congo, the roles for the specific sexes were noted as being
unimportant in terms of childcare (Ivey-Henry et al. 2005; Tronick et al. 1992). In this tribe
male and female children were equally involved with the care of the one-year old infants, it was
not seen as a role that females participated in any more than the males. A further example is
found within Hazda society, where the fathers provide a substantial amount of care for infants
and juveniles (Marlowe 2005). Although mothers and grandmothers provide post-weaning
children with high-calorie foods and the males are big game hunters, the males also take older
juveniles with them to hunt, travelling up to 10-15km away from the camp (Hawkes et al.
1995).
The roles and behaviours of hunter-gatherer children observed in ethnographical studies have
been found to vary in different hunter-gatherer populations. In the Baka pygmy tribe,
individuals who dwell in the Congo, juveniles were observed to rarely engage in any forms of
physical activity that would be interpreted as playing whilst mimicking adult activity. Rather,
children were playing to learn appropriate social interactions in a similar way as juveniles
behave in non-indigenous populations, rather than just being taught survival skills (Kamei
2005). A further study observed that the children of the Nyaka, a Madagascan tribe, engaged in
intense foraging, they did not do this because it was a requirement, but because it was
interesting and fun and there was very little else to do (Tucker and Young 2005). In this
situation, these young people were learning important skills through play, but it was not
expected of them. Australian Aboriginal Mardu children aged five years old were just as
efficient at hunting lizards as adolescents aged 14 years. The Mardu children were also found to
be most productive at hunting when taller, success is not significantly relatable to age (Bird and
Bliege-Bird 2005). Most footprint-tracks from Goldcliff East, adults and children, were made
by individuals who were moving at a relatively leisurely pace, not indicative of hunting.
Hunter-gatherer children develop important skills by teaching themselves, not by being taught
by adults. In the Aka tribe, children as young as six months old are given sticks or stone
458
implements such as spears and encouraged to start moving their arms appropriately (Hewlett
and Lamb 2005), and often encouraged to take an early interest in subsistence strategies (Figure
9.28). Studies indicate that hunter-gatherer children are fairly self-reliant and will
gather/catch/kill/cook their own foods without a problem from a young age, in some
circumstances as young as four or five years old (Figure 9.29; Bird and Bliege-Bird 2005;
Tucker and Young 2005).
In ethnographic studies it has been noted that infants and young children are almost continually
held or carried by older juveniles, parents, or other adults. Hunter-gatherers among the !Kung of
the Kalahari desert tribe carry babies in pouches on their backs when they are under two years
of age, and on their shoulders between the ages of two and four. They may be aged seven or
eight before they are walking consistently alone (Lee 1972). Children of the !Kung tribe are
generally not weaned from milk until four years old, and if the child’s mother is not pregnant
they may carry on breast feeding until aged five (Konner 1977). The carrying of young children
would enable individuals to go about their activities whilst providing comfort, food and safety
for the child.
Of the footprint-tracks recorded at Goldcliff East during the 2014-2017 research period, only
3% were made by juveniles aged under four years old. This small percentage of very young
people may indicate these individuals engaged in a similar practice, where the young children
were held constantly by individuals within the hunter-gatherer group until they were large
enough to be at less of a risk to predators or possible dangers. The footprint-tracks made by
young children were generally deep but very slender. This may be an indication of juveniles
being put down on the floor, either briefly to reposition the child or so that they could do some
walking themselves. Continuous carrying may also explain some of the very wide footprint-
tracks created by smaller footed individuals, the extra weight may cause foot spreading to
occur. In previous footprint-track research it has been suggested that small but wide footed
individuals were pregnant females (Roberts and Worsley 2008), however all ethnographic data
indicates an almost constant carrying of small children, this extra weight may also have this
effect on the foot.
There was one footprint-track trail at Goldcliff East, on Site S, made by a child aged four or
younger (2017:10, 2017:11), this was on the same lamination as footprint-tracks made by a
child aged four or five (2016:108, 2016:103), and within 30cm of an adult footprint (2017:12).
Given the carrying behaviours of contemporary hunter-gatherer people it is plausible that this
child was being carried, possibly on the shoulders. The adult may have put the child down
briefly before carrying on, this may be an explanation for the lack of any further footprint-tracks
on this lamination made by a very young child. They may have been in this area for a specific

459
subsistence purpose, although the adult may have accompanied the two young children out of
camp so that they could explore. Both children were walking at a slow speed, which could again
indicate that they were exploring rather than undertaking subsistence strategies (Bird and
Bliege-Bird 2005). Children aged under five years old in contemporary hunter-gatherer
societies are often left at camp as they do not walk fast enough to engage in hunting, where they
are left with adults and younger children so that they can play and explore (Konner 2005).
A further example of an individual who may have been carrying a child is seen in Site C/E. The
individual who made footprint-tracks 2015:116 and 2015:117 had a stature between 150.6cm
and 159.2cm (4’11” and 5’2”), indicating either a small full-grown female, or a pubescent child
of either sex, travelling 3km per hour (2mph). The formation of these footprints preserved an
indentation of the hallux as well as all other toes, heel, arch and ball of the foot, indicating a
stable substrate was walked upon, the hallux was curled slightly into the sediment. On this same
lamination, less than 20cm from 2015:117 there was footprint-track 2015:118. This footprint-
track was much deeper and lacked the clear human features such as the toes that were seen in
2015:116 and 2015:117. The slow speed of movement of the individual who made footprints
2015:116 and 2015:117 and the proximity of the single footprint 2015:118 may suggest that the
child who made 2015:118 was being carried by the maker of 2015:116 and 117. This hunter-
gatherer may have briefly put the child down rather heavily, which would explain the deep
formation of this singular footprint, before picking them up again and slowly walking off. The
child who made footprint 2015:118 is estimated to be around five years old, so would have been
small and light enough to carry on the shoulders when needed. It would be worthwhile to
perform more experimental work (Chapter 5) to investigate the effect on an adults’ footprint-
track formation when they are pregnant in comparison to carrying children of different ages.
A study by Konner (2005), on children over four years old suggested that childhood was
relatively carefree, with no expectation to provide food or care for siblings. Bird and Bliege-
Bird (2005; Tucker and Young 2005) conversely, suggested that there were activities and
responsibilities expected of children, depending on the social-ecological conditions. They might
forage close to camp, in areas where there were not predators or other immediate dangers. Their
research suggested that children provided 50% of the calories that they were consuming,
indicating that unlike Konners (2005) findings, the hunter-gatherer juveniles may not have been
working specifically for the collective group, but they were engaging in activities that taught
them important life skills and rewarded them with the ability to supply their own food.
By drawing upon the studies by Bird and Bliege-Bird (2005) and Tucker and Young (2005), it
could be suggested that there may be a high concentration of children footprints at Goldcliff
East because the socio-ecological conditions allowed for it. Goldcliff is an area where resources
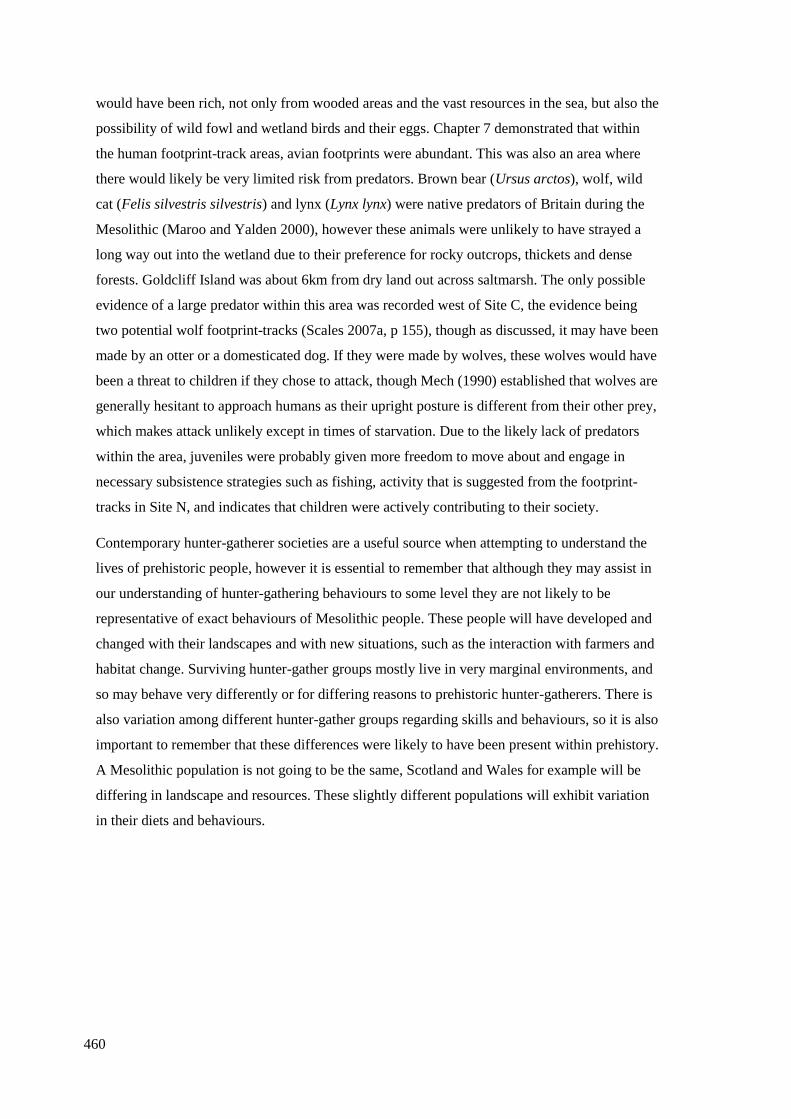
460
would have been rich, not only from wooded areas and the vast resources in the sea, but also the
possibility of wild fowl and wetland birds and their eggs. Chapter 7 demonstrated that within
the human footprint-track areas, avian footprints were abundant. This was also an area where
there would likely be very limited risk from predators. Brown bear (Ursus arctos), wolf, wild
cat (Felis silvestris silvestris) and lynx (Lynx lynx) were native predators of Britain during the
Mesolithic (Maroo and Yalden 2000), however these animals were unlikely to have strayed a
long way out into the wetland due to their preference for rocky outcrops, thickets and dense
forests. Goldcliff Island was about 6km from dry land out across saltmarsh. The only possible
evidence of a large predator within this area was recorded west of Site C, the evidence being
two potential wolf footprint-tracks (Scales 2007a, p 155), though as discussed, it may have been
made by an otter or a domesticated dog. If they were made by wolves, these wolves would have
been a threat to children if they chose to attack, though Mech (1990) established that wolves are
generally hesitant to approach humans as their upright posture is different from their other prey,
which makes attack unlikely except in times of starvation. Due to the likely lack of predators
within the area, juveniles were probably given more freedom to move about and engage in
necessary subsistence strategies such as fishing, activity that is suggested from the footprint-
tracks in Site N, and indicates that children were actively contributing to their society.
Contemporary hunter-gatherer societies are a useful source when attempting to understand the
lives of prehistoric people, however it is essential to remember that although they may assist in
our understanding of hunter-gathering behaviours to some level they are not likely to be
representative of exact behaviours of Mesolithic people. These people will have developed and
changed with their landscapes and with new situations, such as the interaction with farmers and
habitat change. Surviving hunter-gather groups mostly live in very marginal environments, and
so may behave very differently or for differing reasons to prehistoric hunter-gatherers. There is
also variation among different hunter-gather groups regarding skills and behaviours, so it is also
important to remember that these differences were likely to have been present within prehistory.
A Mesolithic population is not going to be the same, Scotland and Wales for example will be
differing in landscape and resources. These slightly different populations will exhibit variation
in their diets and behaviours.
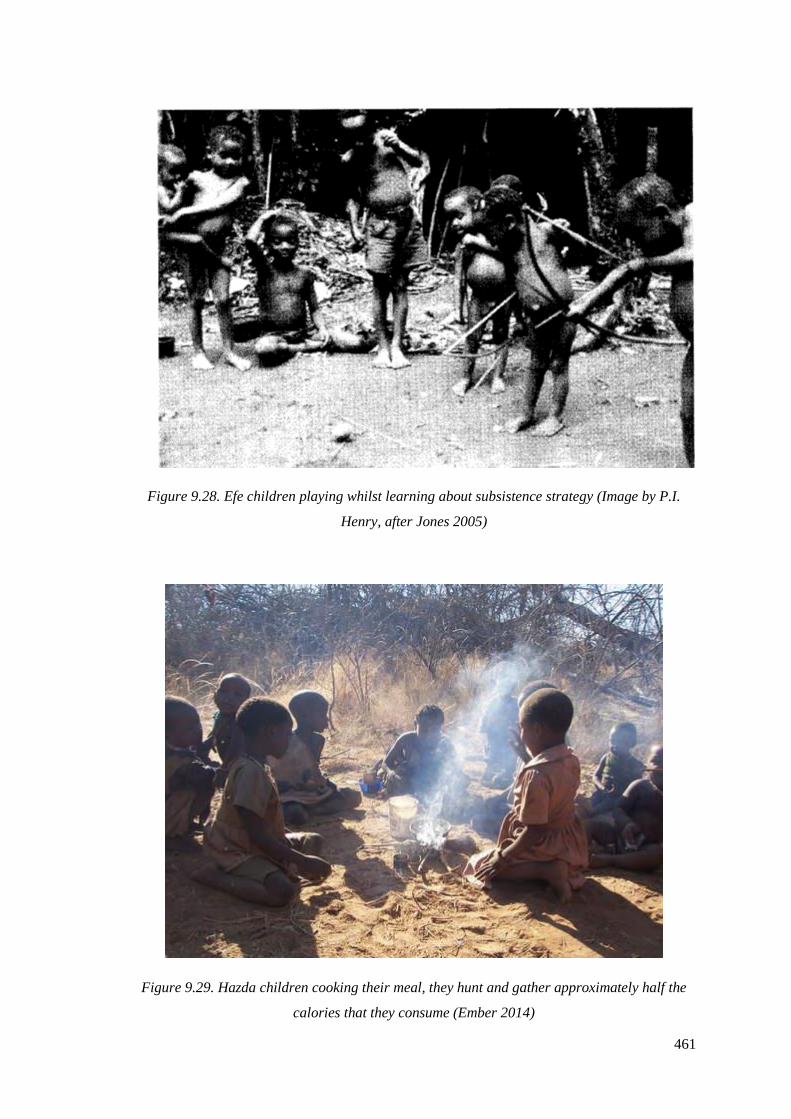
461
Figure 9.28. Efe children playing whilst learning about subsistence strategy (Image by P.I.
Henry, after Jones 2005)
Figure 9.29. Hazda children cooking their meal, they hunt and gather approximately half the
calories that they consume (Ember 2014)
462
9.8 Seasonality of the evidence
There are many sources of evidence for the seasonality of activity at Goldcliff, however the
identification of a specific season is challenging and we must rely on modern analogues
regarding bird, fish and mammal migratory and breeding behaviours when considering the data.
Evidence of a particular resource from one time of year does not mean that the site was
unoccupied on other occasions (Bell 2007, p 243). Site W provides evidence of an
autumn/winter activity area, this was inferred through the presence of pig bones, eel bones and
smelt at particular growth stages. Of the identifiable fish bones at Site W, 56% were from eel
and 8% were smelt. The size range of the eel and smelt bones suggested that adult eel and smelt
over a year old were being caught seasonally, as they often congregate in estuaries and river
mouths during winter months to spawn (Ingrem 2000, p 54). The pig bones from Site W
indicated that juveniles and adults were being hunted. The dental eruption stage of three
mandibles indicated that the piglets were older than seven months but under a year when killed.
If the piglets were born during early spring then this would suggest a winter/spring occupation
(Coard 2000, p 52). Although the faunal assemblage suggests an autumn/winter occupation, the
plant assemblage from burnt seeds of greater plantain, rushes, and sea club rush indicates that
burning occurred during July/October (Bell 2007, Table 18.3). This evidence therefore indicates
that Site W was occupied during summer/autumn, though activity also extended into the winter
or the site was returned to during the winter months (Bell et al.2000; Bell 2007).
The sites at Goldcliff East have similar evidence for seasonality as Site W (Bell 2007, Figure
18.4). Again, pig bones provide seasonal evidence, with neonates bones from Site A and J,
suggestive of activity during March/April, and the bones of neonatal roe deer suggesting
activity in about May (Scales 2007b, p 162). Scales (2007a) identified 11 red deer footprint-
tracks at Site J, the presence of both stag and neonate in this assemblage suggests that these deer
were present May/July, however they were not made upon a surface with human footprint-
tracks so we cannot say with certainty if they were being hunted at Goldcliff during these
months. The same is true regarding roe deer, there is not enough evidence to determine if the
animals were on the wetlands at the same time as humans.
At Site A 83% of bones from identified fish species came from eel, and about 25% of those
were a size that suggests that they were caught during their autumn migration (Ingrem 2007, p
167). The remaining eel were a smaller size and would have been available in the estuary year-
round, though Ingrem (2007) states that it is unlikely that they were caught in winter.
Plant based evidence from Goldcliff East is again similar to Site W, with charred seeds at Site
B, A and D representing 10 species, which indicates burning between June to October (Dark
2007, p 183). Charred hazelnuts from Site A, B and possibly J are evidence of possible
463
autumn/winter activity as they are best collected in September/October, however they store well
and can be eaten months later (Dark 2007).
The avian and human footprint-track data provides evidence of seasonality, though there has not
been a case where bird and human footprints have been recorded on the exact same lamination,
the human footprint-tracks were overtraces/undertraces and so were not an absolute indication
of the lamination walked upon. All the avian footprint-track laminations sampled in Chapter 8,
except those from Site N, and also footprint 2015:113 from Site C/E, were made upon fine-
grained sediment, these laminations were likely lain down in the calm summer months. There
were two species of bird from Site C/E that are suggestive of summer migrants, white stork and
common crane. These are both migratory birds that spend the summer breeding in northern
Europe before returning to winter in warmer climates. Neither of these species are currently
considered to be an established migrant of Britain, although a small population of crane has
been introduced in Norfolk and recently in Somerset (Buxton and Durdin 2011; Bridge 2015).
Historic evidence of the crane migrating and breeding in Britain is rich, with many of our
villages named after this species (Charles 1938), there is less reference to white stork however
there is still evidence of this bird migrating to Britain throughout history (Harman 1996; Platt
1933, 1956; Turk 1971; 1978).
There were two further avian species identified, the common gull and the tern, that are migrants
to Britain. There are several tern species that currently use the Severn Estuary as a passage to
their migration routes and can be present at any point between March and October (Hume
2002), so the appearance of tern footprints may indicate any time between Spring and Autumn.
Common gull currently winter on the Severn Estuary, but they can be seen across Britain year-
round so they do not provide any evidence of seasonality. The other four identified bird species
are all current residents of the Severn Estuary (Hume 2002), and so we cannot infer anything
about season from these footprint-tracks.
Scales (2006; 2007a) calculated that ten of the 14 footprint-track trails recorded were all made
upon fine-grained sediment, walked upon during the summer months. Within this current study
there were not any human footprints recorded where the exact lamination could be established,
due to being undertraces/overtraces, however there is new footprint-track evidence of possible
winter visits to the area, evidenced by Site N. Particle size analysis from grey heron footprints
made in the same area as human footprint-tracks suggests that the Site N avian footprints were
made on a sediment with a coarser particle size compared to the other footprint areas, with
research by Allen (2004; Dark and Allen 2005) suggesting that coarse-grained banded silts are
likely deposited during the winter months. The human footprint-tracks at Site N were
overtraces, however they may have been on the same lamination as the grey heron footprints.
464
Persons 7, 8 and 10, recorded by Scales (2006) were also on laminations with a coarser particle
size; these were later in date than Site N, higher up on the laminations.
The autumn exploitation of eel may be the reason that humans were present in Site N. These
people were walking in the direction of the palaeochannel where there is fish trap evidence at
Site T and possibly Site L. It is likely that the ‘pathway’ seen at Site N represents these
individuals walking the area over multiple occasions to check on their catch. The hunter-
gatherer footprints at Goldcliff East relate to activities in the saltmarsh and mudflats and it is
possible that these were concentrated in some seasons relating to salmon and eel runs, whereas
other hunting and plant activities may have been associated with visits at other times of year. It
is important to not class Goldcliff East as a late summer/autumn camp, as evidence indicates
that the site was not disused during the winter period (Bell 2007, Table 18.4). The main visits
were likely in late summer/autumn but brief stays were made at other times of year including
winter, spring and high summer.
9.9 Conclusion of the palaeoecology at Goldcliff East
A site such as Goldcliff East provides an excellent insight into the palaeoecology of Mesolithic
hunter-gatherers, due to the range of archaeological evidence. Bone assemblages are relatively
few, and are essentially portable artefacts. The faunal evidence suggests that there was a focus
on red deer hunting, though pig and auroch were also at some sites. Uskmouth provided heavily
trampled deer footprint-track areas, the presence of stag, juvenile and hind in the assemblage
suggests that red deer may have been specifically grazing on the wetlands during the late spring
and early summer periods.
Fish were an important resource to the Mesolithic people of Goldcliff, there were 4432 fish
bones from Site A and 1516 from Site W, many of the fish bones were calcined and it is likely
that uncalcined bones have not survived so well (Ingrem 2000; 2007). Around a quarter of eel
bones from Site A were large, and would have been from migrating eel (Ingrem 2007, p 167).
Two wooden structures, one from Site L (Bell 2007, Figure 4.2) and the other from Site T,
suggest fishing with stationary wooden fish traps was occurring, possibly with a focus on
migrating eel during the autumn months. Grey heron footprint-tracks from Site N, near Site T,
were made during the autumn/winter season, evidenced by the coarse-grain particles that
formed the lamination. Although the people of Goldcliff occupied a coastal island edge
location, the hunter-gatherer-fishers exploited a mixture of terrestrial animals and plant
resources, in addition to fishing.
465
Other evidence from the archaeological, skeletal and footprint-track assemblages indicate
activity in this area occurred throughout the year for different tasks. Site W contained artefacts
indicating a summer/autumn occupation, with winter visits. This is indicated by juvenile pig
remains, the size of eel and smelt bones and the burnt seeds from plants that flower
July/October (Bell 2007, Table 18.4). Similar seasonal evidence is seen at Goldcliff East. The
bones of neonate pig from Site A and J indicate the animal died in March/April, and neonatal
roe deer bones suggest the animal died in May (Scales 2007b). Large eel migrate during
September/October; over one quarter of eel remains from Site A were this size, though the other
75% were a small size and would be available year round (Ingrem 2007). Charred seeds from
Site A, B and J are from plants that currently flower June/October (Dark 2007).
Fine-grained laminations would have been lain down during a period of warmer sea
temperature which would affect water viscosity. There would also have been a calm wind-wave
climate and seasonal changes in pollen (Allen and Dark 2007). The appearance of common
crane footprint-tracks on these fine-grained laminations indicates that birds were in the area
during the late spring/late summer months, probably to breed. Their presence indicates that the
wetland environment would have been rich in food resources, as there was space for this
territorial bird species to feed or breed. There was not any evidence for the hunting of these
birds which may indicate that food was plentiful, humans had a dietary preference for red deer
and fish over wildfowl, that they specifically did not hunt these species, or that humans and
these bird species were not present at the same time. The seasonal evidence from the footprint-
tracks and other archaeology indicates that Goldcliff was visited most during the
summer/autumn, however shorter trips during the winter and spring were also occurring.
The population demographic at Goldcliff East indicates people who ranged in age from under
four years old to adult, and were a mix of both sexes. The adults of this area had an average
stature of 166.5cm which is similar to other estimates of statures of prehistoric people in Britain
and Europe (Table 9.7). Although the footprint-track dataset from Goldcliff is not large, the
stature estimates add to the relatively limited record of Mesolithic people from Europe. There
were several males who were tall, even by modern standards, and were over 182cm (5’11”), this
indicates a variation of height even between individuals of the same population. The footprint-
track trails that could be identified as male were only seen in Site E and the individuals in this
area, as well as Site C/E and Site R, were generally orientated north-west. This is a different
direction to the areas where male footprint-track trails could not be confidently identified (Site
M, N and S), and who were heading in a south-west, north-east direction. The presence of male
footprint-tracks, as well as a differing direction of movement may suggest a change in site
usage over time or contrasting patterns of activity between adult males (hunting) and females
and children (monitoring fish traps).

466
The children of Goldcliff East make up a large percentage of the population demographic, with
a similarly high percentage to contemporary indigenous populations. The footprint-track
evidence from Site N and at Goldcliff overall suggests that children were actively participating
in subsistence activities, rather than just using the area to play. The involvement of children in
subsistence activities is also attested by much of the ethnographic data. The evidence of
children within the footprint-track assemblage is particularly important as it enables
archaeologists to observe their daily activities, rather than remains of dead children, who would
only have been in the skeletal record if they had been unwell or had an accident, preventing
them from becoming adults.
Footprint-tracks can indicate the season in which a footprint was made, the species, age and sex
of an animal, and the sort of habitat and diet that these animals would have required to live.
This information is relevant not only to understanding hunter-gather activities but also those
involving domestic animals in later periods (Barr and Bell 2016).
467
Chapter 10
Public Engagement and Impact on the Gwent Levels, Wales
10.1 Introduction
The intertidal environments and coastal wetlands discussed in this thesis are increasingly
recognised to be of great importance as sources of archaeological and palaeoenvironmental
evidence, but there are many stakeholders in these landscapes and many factors which impact
on their future management. There is increasing recognition that progress requires dialogue
with the multiple stakeholders and communication with the wider public so that they are aware
of the scientific importance of the coastal zone. The public’s awareness of the scientific value of
coastal zones is becoming increasingly important to ensure that our coasts and our wetlands
remain places of conservation. The preservation of the important heritage and nature in and
around the Severn Estuary is at threat from humans. This chapter will address some of the
challenges that are facing the Severn Estuary, and what archaeologists can do to help preserve
these special areas.
There is currently a proposal to build a relief road for the M4 around Newport, which would go
through a substantial area of the Gwent Levels. The Gwent Wildlife Trust survey has suggested
that the risk of pollution entering waterways and poisoning fish is likely, which would have a
knock-on effect for the rest of the unique wildlife in the area (Gwent Wildlife Trust, n/d). This
relief road would be 14 miles long and cut through the heart of the Gwent Levels (Figure 10.1),
destroying resources and wildlife, not to mention the damage to the archaeological landscape.
There is a large amount of opposition to the proposed route for the M4, with 22 possible
alternatives. The Future Generations Commissioner has voiced concerns about the “dangerous
precedent” this relief road would set if allowed to destroy valuable parts of the wetlands (Future
Generations Commissioner for Wales 2017). These alternatives are currently under review by
the government and a decision was due to be reached by the end of 2017, however this has been
delayed and their decision will not be announced until the end of summer 2018 at earliest.
The threats to the Gwent Levels do not just come from the land, but also by sea, with the
proposal of tidal lagoons. The main proposed lagoon is in Swansea. There are also proposals to
build other lagoons if the Swansea lagoon is successful, with one of the proposed sites being
Cardiff, which would cover a large proportion of the Gwent levels (Figure 10.2; Tidal lagoon
power, n/d). A further lagoon east of the river Usk at Newport is also being considered, this
lagoon would cover Goldcliff as well as other areas of the Gwent Levels. The UK government

468
has expressed an aspiration to become world leaders in tidal lagoon power plants. If the lagoons
are built they would provide clean energy due to the huge tidal range on the Severn Estuary.
Although there is the potential to generate clean energy, the Severn Estuary is a site of Special
Scientific Interest, a Special Area of Conservation, and a RAMSAR site as it is home to a range
of rare birds, mammals, fish and plants. In the past decade the RAMSAR convention has
changed slightly to include cultural heritage as well as wildlife. There is concern about the
effects of the tidal lagoons not just on the fauna but also on the archaeology, with the effects on
Goldcliff East and other Severn Estuary sites being of concern. The Severn Estuary risks
changes in sediment deposition and changes in water levels if the lagoon is built in Cardiff, this
could have an impact on the archaeology, possibly covering areas constantly in water or in
meters of sediment which would prevent any future recording, or of greatest concern cause
abrupt erosion to the sites.
The Cardiff and Newport Lagoon have not yet had approval and there are still many groups
lobbying against them being built. This is where public archaeology becomes incredibly
important as, if we can raise issues such as the threats to the archaeology, the public may protest
against certain proposals and insure the survival of our heritage for future generations.
Archaeology is after all essentially a democratic subject, where the past is investigated by
means of material culture, instead of written records made by the elite. Due to its democratic
capability, archaeology has certain responsibilities to engage with the public. The human aspect
of archaeology, footprints for example, grab the attention of the public and this interest may
assist in the preservation of this unique landscape.
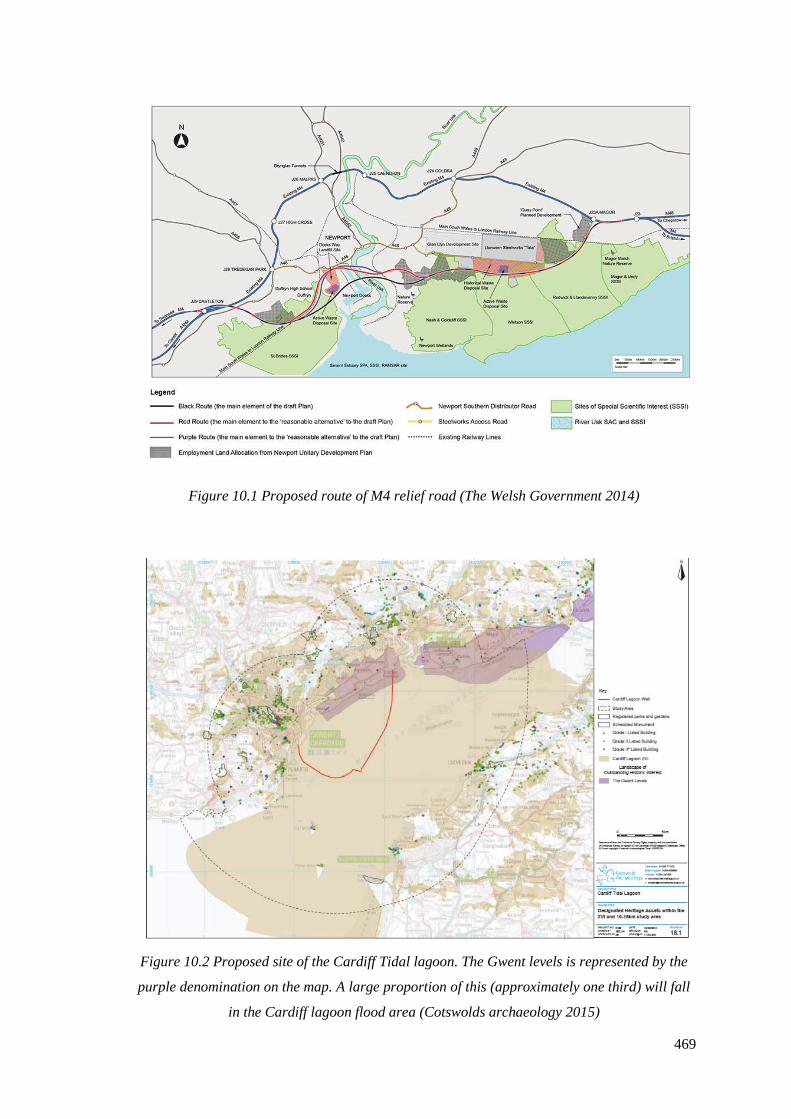
469
Figure 10.1 Proposed route of M4 relief road (The Welsh Government 2014)
Figure 10.2 Proposed site of the Cardiff Tidal lagoon. The Gwent levels is represented by the
purple denomination on the map. A large proportion of this (approximately one third) will fall
in the Cardiff lagoon flood area (Cotswolds archaeology 2015)

470
10.2 Public Archaeology
One of the many challenges in working within the heritage sector is appealing to a variety of
individuals and interests. Public archaeology was conceived to encourage financial interests and
political support from the public for archaeological sites (McGimsey 1972). A key question of
concern to members of the public regarding archaeology is ‘who pays and who benefits?’
(Klamer 2014). When the public are involved in the financial funding of projects archaeologists
must be able to demonstrate how the money is being spent and the way in which it engages all
members of the local community.
It is easy to assume that ‘archaeology is a public activity’ (Schadla-Hall 1999), the reality of the
situation is that archaeology has often excluded the general public. Archaeologists see
themselves as specialists, and so archaeological knowledge can stay within the discipline,
published in journals, within the past these have often been without open access, and with
public engagement treated with lower priority than other tasks (Rocks-Macqueen 2012). As of
the late 1990’s there has been recognition within the field that a diverse range of approaches are
needed to fully contribute to archaeological interpretation, these need to be both scientific and
social (Hodder 1999). Hodder (1999) introduced two concepts, multivocality and self-
reflexivity, these challenge the self-importance of the ‘expert view’. The former concept values
a diversity of approaches and the latter an understanding of the effects that scientific and
archaeological assumptions can cause, and the effects on the public (Bell 2015)
This study will be drawing upon the ‘multiple perspective model’, which recognises differences
in perspectives and the need to tailor information to the audience (Figure 10.3; Grima 2016).
This model, like the two concepts introduced by Hodder (1999), disregards other techniques
that use simplified language to refer to archaeology, assuming that the public has a ‘deficit’ of
archaeological knowledge, simplifying the research for accessibility but losing meaning
(Merriman 2004). The ‘multiple perspective model’ attempts to foster public engagement with
archaeologists operating from the perspective of members of the wider community (Grima
2016).
Organisations in England, such as the Coastal and Intertidal Zone Archaeological Network
(CITiZAN), are monitoring the coastlines of England, and are embracing public archaeology by
utilising members of the public as volunteers and training them in the processes of
archaeological recording. This provides resources to members of the public to enable direct
involvement in their coastal heritage (CITiZAN n/d), which will foster awareness of coastal
archaeology and a desire to preserve the local heritage. Although CITiZAN is a positive step
towards engaging the public with archaeology, there are still issues regarding the presentation
of the artifacts and the lack of availability of local archaeology to the general public. Many

471
people may be interested in their own heritage but do not have the time to record sites or
become involved in archaeological projects. CITiZAN is a step in the right direction but does
not fully embrace the ‘multiple perspectives model’, as the public would still need to have
specific knowledge to access and understand their own coastal heritage.
The writers’ discussions with local people and visitors to the area suggest that the prehistoric
archaeology on the Gwent Levels, Wales is subject to very little public engagement, and so
there is a lack of awareness of the prehistory of this site amongst the public. Although there
have been many attempts to engage with the public, such as conferences, lectures and the
archaeology featuring within television programmes and radio broadcasting, these types of
activities will generally appeal to members of the public who already have an interest or
awareness, rather than from people who are unlikely to have any kind of knowledge, and so
does not embrace the ‘multiple perspectives model’. The challenge of public archaeology is
increased when studying intertidal archaeology, as regular site tours cannot be arranged and
artefacts found are often small, occasionally organic and are not generally of a quality where
they are displayed in museums. It is also difficult to display the information when there is little
to see from the sea wall that overlooks the prehistoric intertidal sites, these are all challenges
archaeologists have had to deal with whilst trying to engage the public.
Prehistoric footprint-tracks preserved in the intertidal zone of the Severn Estuary are evocative
but ephemeral and often in difficult to access, dangerous areas, meaning it is impractical to
undertake tours such as those at Formby Point (National Trust, n/d). The areas along the Severn
Estuary are protected Sites of Special Scientific Interest, and there are concerns about
disturbances to birds during periods of breeding or very cold/stormy weather when bird
populations may be under stress. The strong tides and dangerous muddy terrain make it an
unsafe, impractical archaeological site to open up for public tours.
Within this study the public archaeology and engagement techniques utilised on the Gwent
Levels were assessed. Natural Resources Wales protects the areas of intertidal zone between
Uskmouth and Magor Pill, which are of interest due to preservation of prehistoric material. Part
of the wetlands have been turned into a Royal Society for the Protection of Birds (RSPB)
Nature Reserve, ‘Newport Wetlands’, where there is information about the surrounding area
and its important ecology at the interpretation centre and display boards, but there is no
information about the archaeology and heritage of this stretch of intertidal zone. It is essential to
understand the demographic of the Newport Wetlands visitors, why they are visiting and what
they are interested in before attempting to address the issue of public archaeology and what can
be done to engage the public on the Gwent Levels.
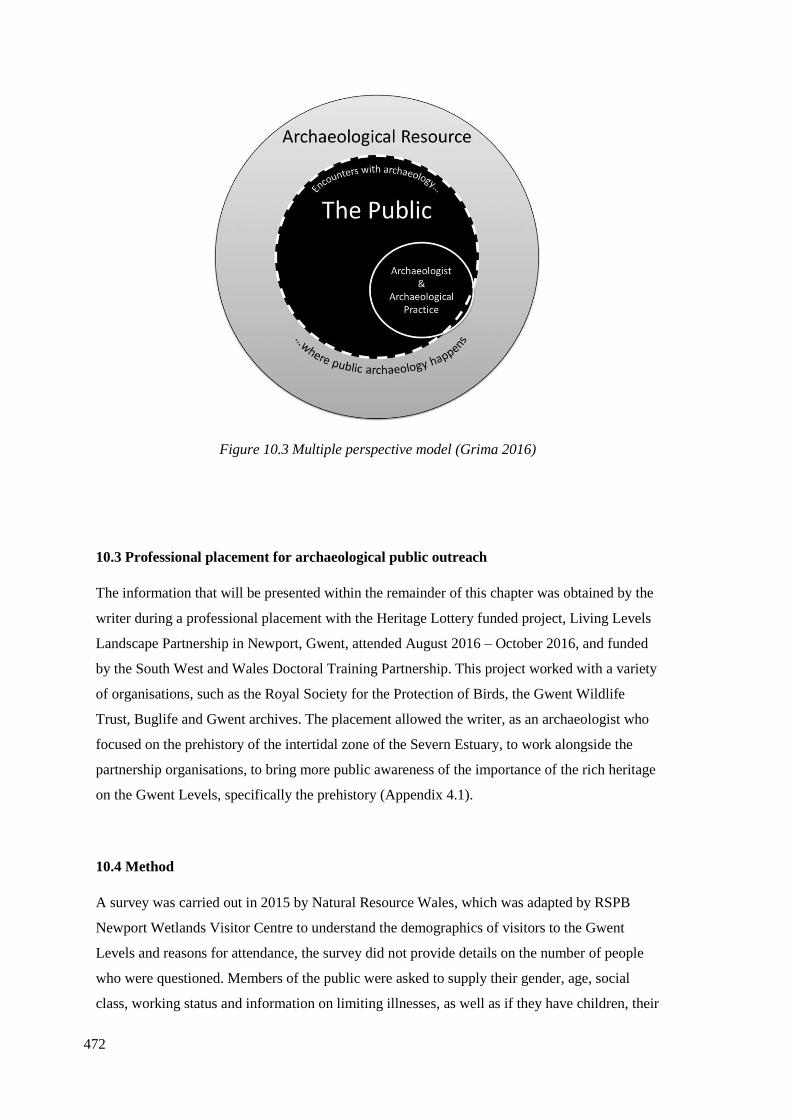
472
Figure 10.3 Multiple perspective model (Grima 2016)
10.3 Professional placement for archaeological public outreach
The information that will be presented within the remainder of this chapter was obtained by the
writer during a professional placement with the Heritage Lottery funded project, Living Levels
Landscape Partnership in Newport, Gwent, attended August 2016 – October 2016, and funded
by the South West and Wales Doctoral Training Partnership. This project worked with a variety
of organisations, such as the Royal Society for the Protection of Birds, the Gwent Wildlife
Trust, Buglife and Gwent archives. The placement allowed the writer, as an archaeologist who
focused on the prehistory of the intertidal zone of the Severn Estuary, to work alongside the
partnership organisations, to bring more public awareness of the importance of the rich heritage
on the Gwent Levels, specifically the prehistory (Appendix 4.1).
10.4 Method
A survey was carried out in 2015 by Natural Resource Wales, which was adapted by RSPB
Newport Wetlands Visitor Centre to understand the demographics of visitors to the Gwent
Levels and reasons for attendance, the survey did not provide details on the number of people
who were questioned. Members of the public were asked to supply their gender, age, social
class, working status and information on limiting illnesses, as well as if they have children, their
473
ethnicity and ability to speak Welsh. The information was added to by the RSPB Newport
Wetlands Reserve, who lease their land from Natural Resource Wales. They recorded visitor
numbers, the length of visit, previous visits, travel time and activities undertaken.
Further information was obtained by The Living Levels Landscape Partnership, during 2016,
asking community groups, schools, workshops, and pop-up events questions to ascertain the
degree of their knowledge about their local landscape. Twenty groups were involved in this
study, who lived or worked on the Gwent Levels, including children who were pond-dipping at
the Newport Wetlands, families attending days out at cinemas and at the Women’s Institute.
Groups ranged in size between two to twenty people. They were encouraged to take part in a
simple flip-board activity called Good Levels/Bad Levels, in which they were free to write any
thoughts they had about the Gwent Levels. This activity was thought up by Gavin Jones, the
community engagement officer for the Living Levels Landscape Partnership project.
The final information gathered was during an RSPB committee event, in which the author
displayed prehistoric faunal remains and casts of preserved footprint-tracks, allowing the twenty
RSPB Cymru committee members to handle the archaeology and ask questions, engaging in a
dialogue about their knowledge of the area.
10.5 Results
Of those surveyed by the RSPB (Table 10.1), only 7% went to the Newport Wetlands Nature
Reserve to explore the nature/natural history whilst out walking (Figure 10.4). The survey did
not ask if people were specifically interested in the archaeology of the area however in this
survey archaeology was included within nature/natural history and so the percentage interested
in the archaeology of the area would be 7% or less.
The main visiting demographic were employed adults who worked full time (Table 10.2), 97%
of those visiting were White British, 3% were White Other and there were no visitors who took
part in this survey who were of any other ethnicity. Males were slightly more likely to visit the
reserve than females, and of those, over the age of 55, non-manual workers were most likely to
visit (Figure 10.5). 98% of people visiting the RSPB Newport Wetlands were there as part of a
day trip and 88% of people travelled less than 3 hours to visit the site, suggesting that a fairly
large proportion of the visitors were from the local or surrounding areas (Table 10.2).
The results suggest the visiting demographic is not diverse, and that the sites are primarily
visited for people to go on walks or use the other facilities, rather than due to an interest in the
wildlife or the prehistoric landscape. This is an issue that needs to be addressed as the public are
not engaging with the natural landscape.
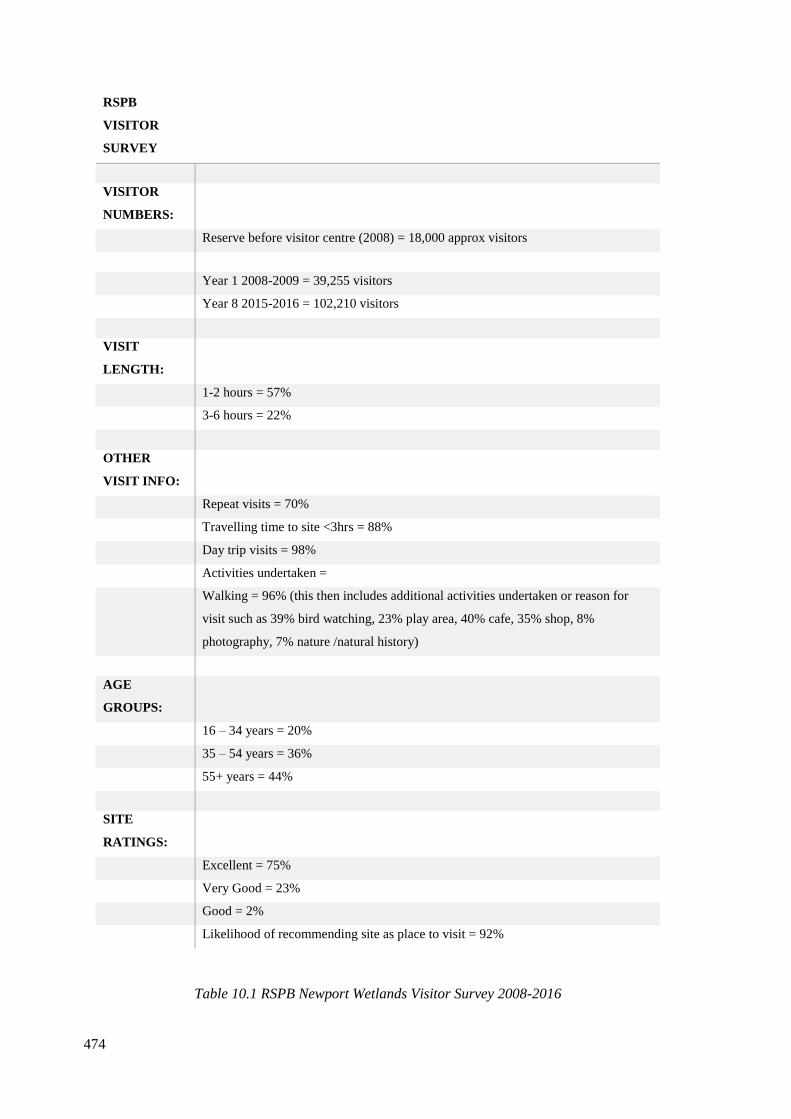
474
RSPB
VISITOR
SURVEY
VISITOR
NUMBERS:
Reserve before visitor centre (2008) = 18,000 approx visitors
Year 1 2008-2009 = 39,255 visitors
Year 8 2015-2016 = 102,210 visitors
VISIT
LENGTH:
1-2 hours = 57%
3-6 hours = 22%
OTHER
VISIT INFO:
Repeat visits = 70%
Travelling time to site <3hrs = 88%
Day trip visits = 98%
Activities undertaken =
Walking = 96% (this then includes additional activities undertaken or reason for
visit such as 39% bird watching, 23% play area, 40% cafe, 35% shop, 8%
photography, 7% nature /natural history)
AGE
GROUPS:
16 – 34 years = 20%
35 – 54 years = 36%
55+ years = 44%
SITE
RATINGS:
Excellent = 75%
Very Good = 23%
Good = 2%
Likelihood of recommending site as place to visit = 92%
Table 10.1 RSPB Newport Wetlands Visitor Survey 2008-2016
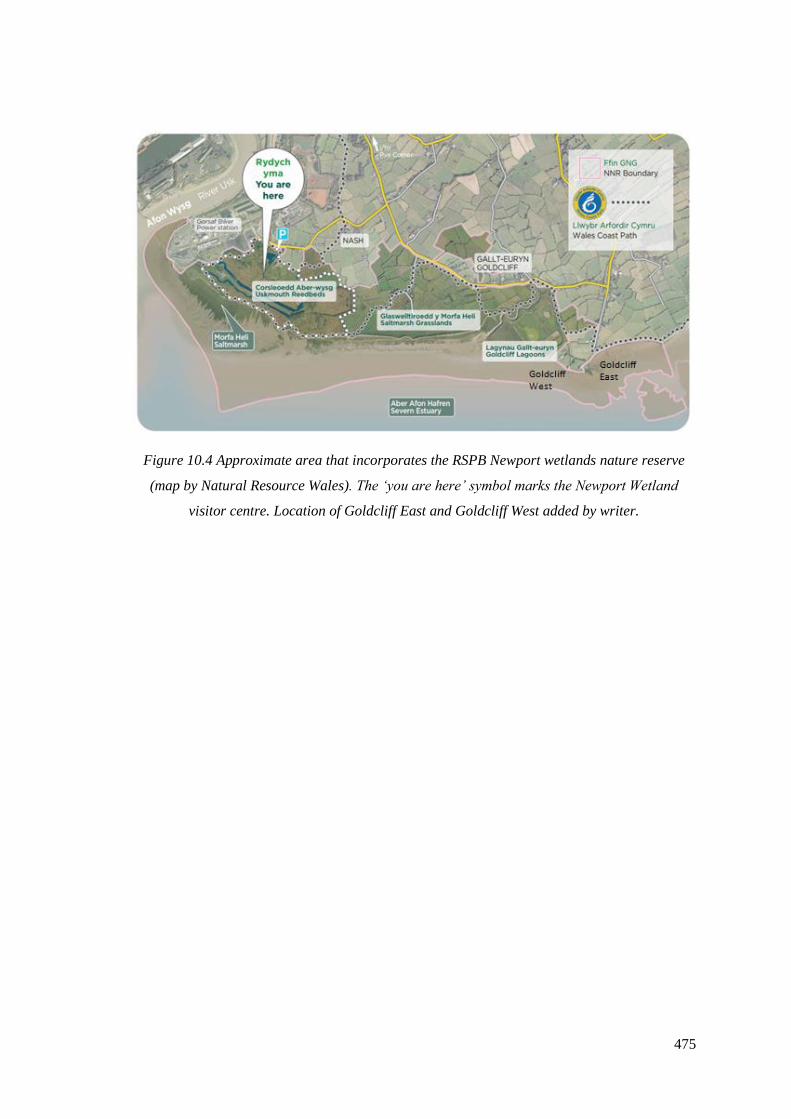
475
Figure 10.4 Approximate area that incorporates the RSPB Newport wetlands nature reserve
(map by Natural Resource Wales). The ‘you are here’ symbol marks the Newport Wetland
visitor centre. Location of Goldcliff East and Goldcliff West added by writer.
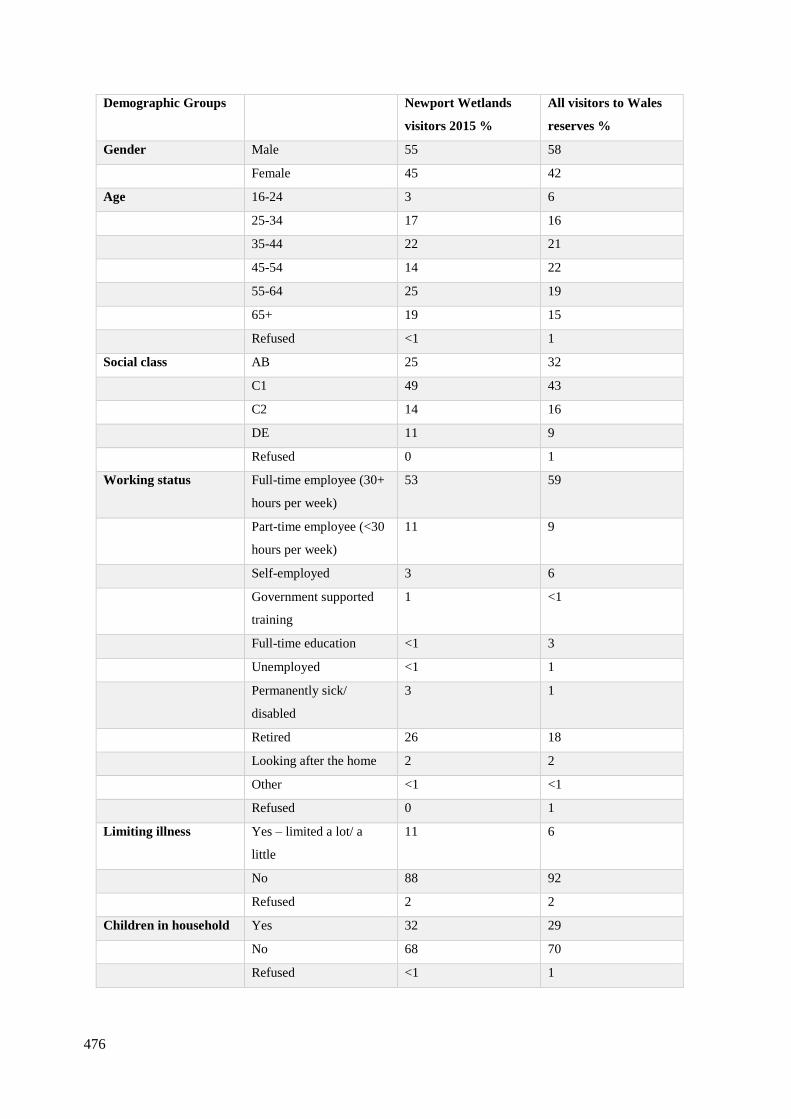
476
Demographic Groups Newport Wetlands
visitors 2015 %
All visitors to Wales
reserves %
Gender Male 55 58
Female 45 42
Age 16-24 3 6
25-34 17 16
35-44 22 21
45-54 14 22
55-64 25 19
65+ 19 15
Refused <1 1
Social class AB 25 32
C1 49 43
C2 14 16
DE 11 9
Refused 0 1
Working status Full-time employee (30+
hours per week)
53 59
Part-time employee (<30
hours per week)
11 9
Self-employed 3 6
Government supported
training
1 <1
Full-time education <1 3
Unemployed <1 1
Permanently sick/
disabled
3 1
Retired 26 18
Looking after the home 2 2
Other <1 <1
Refused 0 1
Limiting illness Yes – limited a lot/ a
little
11 6
No 88 92
Refused 2 2
Children in household Yes 32 29
No 68 70
Refused <1 1
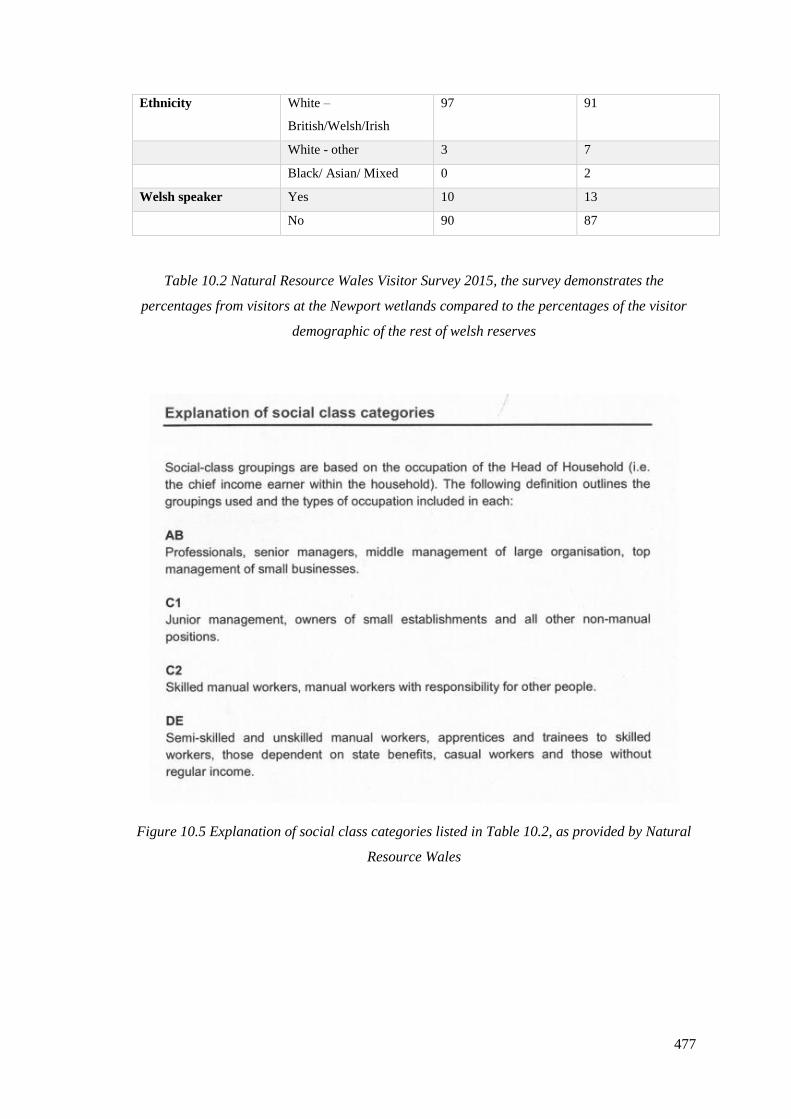
477
Ethnicity White –
British/Welsh/Irish
97 91
White - other 3 7
Black/ Asian/ Mixed 0 2
Welsh speaker Yes 10 13
No 90 87
Table 10.2 Natural Resource Wales Visitor Survey 2015, the survey demonstrates the
percentages from visitors at the Newport wetlands compared to the percentages of the visitor
demographic of the rest of welsh reserves
Figure 10.5 Explanation of social class categories listed in Table 10.2, as provided by Natural
Resource Wales
478
10.5.1 Good Levels/Bad Levels
The results obtained from the Good Levels/Bad Levels activity were varied; often features
disliked by one individual were considered a good feature by another person. Very few people
who took part in Good Levels/Bad Levels were aware of the historical and archaeological
importance of the area, though a large majority did know that Newport was important to the
Romans because of the site of Caerleon, and were aware of the Newport Medieval Ship. Both of
these are present in the minds of the locals living on the Gwent Levels, as Caerleon is a local
tourist destination and many people were involved in the demonstrations to save the Newport
Medieval Ship.
Only one of the twenty groups questioned highlighted the significance of the wetlands in terms
of its important archaeology. This group was made up of individuals who worked for the
Newport Museum, and had worked with some of the Gwent Levels archaeology.
Eight groups commented on the history of the area, and groups containing children discussed
the Romans and the Celts as they had studied this at school. Children were not aware that the
Gwent Levels contained prehistoric sites or that there were artefacts available for public
viewing.
Very few people were aware that they were living on the Gwent Levels, with four groups
thinking that the Gwent Levels were somewhere on the Somerset Levels. Over a quarter of the
groups had heard of the prehistoric footprints found on the Gwent Levels. Many had watched a
television programme in which they were featured, though they were not aware that these
footprints were located on the Gwent Levels.
Once made aware of the prehistoric footprints and other finds, members of the public expressed
a need for information boards along the coastal paths near areas of prehistoric significance.
People also wanted to see reconstruction drawings of the sites as they struggled to imagine the
landscape without the prominence of the Severn Estuary. Over a quarter of those spoken to
wanted more information about the area in general, linking the archaeology, history, natural
history and conservation together to create a clearer picture of the importance of the Gwent
Levels.
Another of the main concerns raised was the lack of public knowledge of where to view the
artefacts found on the Gwent Levels. Twenty members of the public who were at the RSPB
Newport Wetlands Centre were asked if they knew about their local museums, two of the
twenty were aware of the National Museum of Wales, Cardiff, but none knew about the
Newport Museum. When these twenty people were told that most of the Gwent Levels finds
were held at the National Museum of Wales, eighteen of the twenty people expressed their
479
disappointment at this as they were unwilling to travel to this museum, and felt that some of the
artefacts should be available to view at the RSPB Newport Wetlands Centre so that they could
see the artefacts and then look out onto the prehistoric landscape.
This lack of archaeological knowledge of the area was not only demonstrated within members
of the general public living on or near the Gwent Levels, but also by the RSPB Cymru
committee. Individuals attending the RSPB committee event were asked about what they knew
about the significant archaeological sites along the Gwent Levels, specifically the site at
Uskmouth within the RSPB reserve, or the site of Goldcliff within the Natural Resources Wales
reserve, and not one of the people spoken to was aware that the area was significant for
anything other than wildlife and history.
10.6 Where to go from here
The results of the NRW and RSPB visitor surveys indicate a clear visitor demographic for the
wetlands. There is a lack of archaeological knowledge of the area among members of the public
and those working near the prehistoric sites.
The two visitor surveys identify a large gap in the visitor demographic, with young people aged
16-24 having little interest in visiting the area. This study has determined that the Gwent Levels
have a high educational value that can be utilised to improve the public’s understanding of their
own heritage. Information boards and small artefacts at the RSPB Newport Wetlands may
encourage local Key Stage 3 and A-Level students to visit, specifically those studying history or
archaeology. Archaeology and heritage can be utilised as a tool to attract visitors belonging to
the younger demographic.
During this project a variety of outreach materials were created aimed at school children (Figure
10.6), to assist in the teaching of the archaeology of the Gwent Levels. Key Stage 2 children
were the target audience, with the hope that their interest may encourage the guardians of these
children to visit nearby archaeological sites. A Prehistoric Heritage Trail booklet was also
created (Appendix 4.2), which will be accessible to all members of the public via the Living
Levels Landscape Partnership. The booklet is a guided walk along the prehistoric coast, from
the RSPB Newport Wetlands visitor centre to Magor Pill. The booklet contains information
about the prehistoric sites and pictures of a selection of artefacts for those who are unable to
attend the museums. The need to put information boards along the coastal path near the
prehistoric sites was also seen as an incredibly important part of public engagement and the
‘multiple perspectives model’, this information board should incorporate the archaeology of the
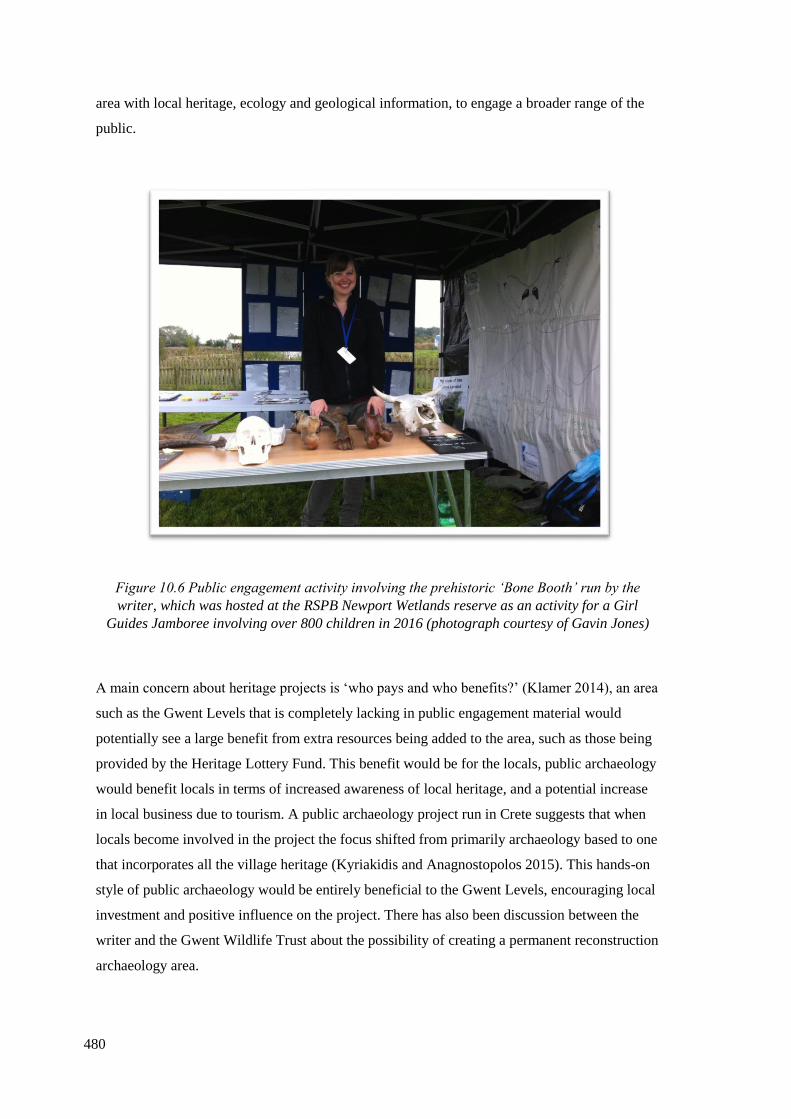
480
area with local heritage, ecology and geological information, to engage a broader range of the
public.
Figure 10.6 Public engagement activity involving the prehistoric ‘Bone Booth’ run by the
writer, which was hosted at the RSPB Newport Wetlands reserve as an activity for a Girl
Guides Jamboree involving over 800 children in 2016 (photograph courtesy of Gavin Jones)
A main concern about heritage projects is ‘who pays and who benefits?’ (Klamer 2014), an area
such as the Gwent Levels that is completely lacking in public engagement material would
potentially see a large benefit from extra resources being added to the area, such as those being
provided by the Heritage Lottery Fund. This benefit would be for the locals, public archaeology
would benefit locals in terms of increased awareness of local heritage, and a potential increase
in local business due to tourism. A public archaeology project run in Crete suggests that when
locals become involved in the project the focus shifted from primarily archaeology based to one
that incorporates all the village heritage (Kyriakidis and Anagnostopolos 2015). This hands-on
style of public archaeology would be entirely beneficial to the Gwent Levels, encouraging local
investment and positive influence on the project. There has also been discussion between the
writer and the Gwent Wildlife Trust about the possibility of creating a permanent reconstruction
archaeology area.
481
The successful integration between scientists and members of the public has been achieved on
the English side of the Severn Estuary, in Somerset. On the Somerset levels the Sweet Track
was discovered in 1970, John Coles who led archaeological work in Somerset during the 1960’s
before the Sweet Track was found became so interested in the find that he subsequently ran the
Somerset Levels project from 1973-1989 (Brunning 2000). This project was dedicated to the
recording of wetland archaeology, and was primarily funded by English Heritage. The success
of the Somerset Levels project resulted in further projects being established, such as a small
museum being set up, and archaeologists and nature conservationists have worked in
collaboration at places such as the Avalon Marshes Centre where they have reconstructed a
Roman villa and a Saxon hall in a similar area to where they would have been built in the past
(Avalon Marshes Centre, n/d). The successful collaboration between Natural England, the
South West Heritage Trust and nature conservation groups such as the RSPB and the Somerset
Wildlife Trust indicates that archaeologists may need to look beyond their own discipline when
dealing with the public, as work in Somerset has proven that nature conservation and
archaeology can be presented together very successfully.
The Somerset Levels project was so successful it has become a project to aspire to. Their
success indicates that although areas are currently lacking in public interest, projects can rectify
this. People of the Gwent Levels have become disassociated from the archaeology and the
landscape in general with very little easily accessible information about their heritage. If the
archaeology of the landscape can be metaphorically brought to life, it will seem tangible and
almost touchable, which would encourage the local people to learn more about their area. It is
through public archaeology and engagement that we can protect the importance of this heritage.
10.7 Conclusions
Public archaeology could benefit from the ‘multiple perspective model’ in places such as the
Gwent Levels to captivate individuals who might usually be uninterested in or unaware of
archaeology. Archaeologists should be considering the benefits of merging their specialised
knowledge with the ecological and conservation sector, as there are many situations in which
awareness of the area’s specific archaeology may assist in building a stronger picture of the
landscape, fauna and flora that they are fighting to preserve. The examples of NRW and RSPB
demonstrate that archaeology is often not considered in their procedures and policies; the
inclusion of archaeological information may attract individuals with interests outside of
conservation. Funding provided by organisations such as the Heritage Lottery Fund provides
areas with the opportunity to develop projects, hopefully this will soon start to include the
merging of disciplines to create a far stronger form of public engagement and archaeology.
482
Chapter 11
Conclusions and recommendations for future work
11.1 Conclusions
This research set out to investigate prehistoric bird, human and mammal footprint-tracks from
intertidal sediments as evidence of human palaeoecology, the key aims and questions asked in
Chapter 1 are answered within this conclusion along with recommendations for future work.
11.1.1 Experimental work with human footprints
The experimental analysis of modern footprints made on clayey silt by 177 males and females
aged between 3 and 71 years enabled the relationship between the length and width of the
footprint and the age, sex, height and weight of an individual to be explored. The experiment
included 89 adults aged above 16 years old, 30 males and 59 females. There were 88 children
aged under 16 years involved in the experiment, 46 females and 42 males. The difference
between ethnicities was not studied, though the majority of individuals were White European
(94%). Those who identified as British Indian (3%), Black British (2%), Filipino (0.5%) and
Filipino American (0.5%) also took part within the study.
Footprints made in clayey silt sediment were found to be larger than the actual parameters of
the foot, up to 9.5% longer than tracings made around the foot, and could be 2cm shorter or
2cm longer than the foot itself. We must therefore be careful with data that has assumed that
two-dimensional foot tracings or ink-prints provide the same evidence as three-dimensional
footprints, as footprints are not the exact size of the foot. The weight of an individual was not
found to be a significant variable regarding the footprint length and width when footprints are
made in clayey silt. The heaviest individual in the experiment, volunteer 131, a 50-year-old
male who was 126kg, had a foot width of 11.8cm. The average footprint width of a male in this
experiment was 11.3cm, meaning that although this individual was 16kg heavier than anyone
else, his footprints were only 0.5cm wider than the average male and slimmer than multiple
male and female footprints.
The height of a person and the length of a footprint has a positive relationship. A stature
equation was created for the estimation of height for adult males, adult females and children of
both sexes. The stature equation for a footprint that could be an adult of either sex is
Y=60.3+4.3x with a standard error of 7.3. The stature equation for children aged under 10 years
old of either sex is Y= 38.82+4.27x with a standard error of 8.59. Both equations can be applied
483
to either the left or right foot and give a height estimate in centimetres. Interestingly the adult
male regression equations for the left (y=82.48+3.53x) and right (y=89.24+3.31x) foot were
most similar to the work of Fawzy and Kamal (2010) and Uhrova et al. (2014). Fawzy and
Kamal (2010) created stature equations for the left foot and right foot (88.34+3.25 × T1L (left);
91.88+3.1 × T1R (right)), from 50 Egyptian males aged 18-25 who made two-dimensional ink
footprints. Research by Uhrova et al. (2014) of 120 Slovakian males aged 18-24 also resulted in
equations for the left and right foot (86.32+3.55 (left); 84.09+3.64 (right)), these again were
from two-dimensional footprints. Female stature regression equations were found to be different
from other female studies, though it should be noted that there are far fewer studies regarding
the relationship between female footprints, and most studies that we have are from Asian
populations (Chapter 2, Table 2.2). At the time of writing the author is unaware of any stature
equations which deal with the relationship between the height of a child and footprint length,
other than the one created within this study.
It was not possible to identify the sex of children between 3-10 years old from their footprints.
It was also not possible to differentiate adult female footprints from those of children aged 10+,
though it was found that 71% of adult females aged over 16 years old had footprints between
23cm and 25cm in length, as opposed to 56% of children aged between 10 and 15 years old.
Large adult males can be identified from their footprints, with footprints over 30cm in length
being male. There were not any adult females or children aged between 10 and 15 years old in
the experimental work who had an average footprint length of over 27cm. Only 32% of adult
males had footprints with an average length under 27cm. One adult female, volunteer 130,
made a singular footprint from her footprint-trail that was over 30cm (<1% of footprint
assemblage), however this footprint had obvious toe drag, and overall the average size of her
footprints was 26.7cm. If a footprint-track trail is made up of multiple footprints over 30cm we
can therefore say it is an adult male, though caution should be applied to single footprint-tracks.
Speed of movement was established from the footprint data using Dingwall et al’s (2013)
equation, though this deals with a specific hunter-gatherer group and was a small sample of just
38 adults, with no children included.
The estimates and findings from the modern footprint data made upon clayey silt can be applied
to prehistoric individuals. This comparison should be made cautiously. Sex cannot be identified
with certainty, though large adult males are identifiable. The approximate age, height and speed
of movement can be calculated. It is important to emphasise that these results are applicable to
footprints made on clayey silt sediment and may not produce accurate results when compared to
footprints made on other sediments.

484
11.1.2 Limitations of previous work and necessary improvements
The relationship between a footprint size and age, sex, stature, weight and even ethnicity has
been thoroughly studied in forensic science and anthropology. Although this important
relationship is being studied worldwide the data underpinning the research is rarely freely
available. Bennett and Morse (2014) identify the lack of open data access as an issue for
advancement of footprint analysis. If all footprint researchers made their data freely accessible
then a larger study on the relationship between a footprint and a person could be established.
Findings could then advance rapidly as broader research questions could be explored if we had
access to a far larger dataset, as at the present time sample sizes are often small and contain
only a certain group of people (e.g. many studies only use university students who are generally
under the age of 30). Although the footprint data from this study is not currently available for
open access on a specific website, the data underpinning the results is all available in this thesis.
11.1.3 Footprint formation and recording of footprint-tracks in the intertidal zone
Ichnological research has established that the type of sediment and its moisture content greatly
influences footprint formation, which in turn affects the size and shape of footprints. Research
as part of this study demonstrates the importance of a comparison with contemporary footprint
data made on similar substrates to archaeological data. A single individual can make footprints
of a variety of sizes when walking on different sediments, it is therefore important to establish
the type of sediment walked upon in prehistory before attempting experimental work, for
example there will be a marked difference in the size and shape of a footprint made in wet clay
compared to one made in dry sand.
Every footprint is different and each recording situation in the intertidal zone varies, so
recording methods must be flexible and adaptable. Standard photography and metric
measurements are an important method to utilise in the field, as although they may not be the
most accurate they provide a record of the size and morphology of the footprint, in case other
methods fail or situations only allow for extremely fast recording, such as the encroaching tide.
Footprint-track tracings and conventional plan drawings are an established method of recording
the Goldcliff East footprints and are helpful in terms of understanding the location of each
footprint in regard to others in the same area, as well as the axis of movement. Footprint-tracks
are complex and therefore should be treated as three-dimensional features, rather than two-
dimensional, as in plans or tracings. The latter do not include sufficient detail of the footprint
itself or the way it may have been affected by the formation processes. Experience in this
research has shown that tracings are too subjective and provide a two-dimensional record of a
485
three-dimensional object, so measurements of footprints should not be taken directly from them.
A further established method of footprint recording is casting. Casting footprints in dental
alginate enables a permanent plaster of Paris cast of the footprint to be made. This is beneficial
when a particularly good footprint is found. Casting is destructive but in areas where erosion
and destruction can happen in a short time it is still a preferable technique. It also provides
material for future museum displays.
Digital recording methods for recording ephemeral footprints were experimented with. The
Faro Handheld laser scanner was found to not be an appropriate machine to use in the intertidal
zone, due to variable weather conditions, the need to re-calibrate between uses which used up
time, and the expense of hiring a machine. Technological advancements may enable laser
scanners to be used in the intertidal zone in the future perhaps in less challenging contexts (i.e.
less muddy and less wet contexts) with a longer tidal window.
In the intertidal zone recording using multi-image photogrammetry was found to be most
effective. This technique was relatively fast, could be used in bad weather, equipment was
portable, it was accurate, it was not destructive and a model of the footprint-track area could
then be reproduced and analysed off site.
Although geometric morphometrics would work well in sites where the features of a footprint
are clear (Bennet and Morse 2014), in situations such as Goldcliff where all but a few footprint-
tracks are poorly preserved and generally overtraces/undertraces, geometric morphometrics are
not appropriate and should not be used, as landmarks of the foot are often indistinct and the
parameters of an overtrace/undertrace may be much larger than a normal footprint.
11.1.4 Mammals and birds
Avian footprint literature identifies species depending on certain features, such as total length of
footprint, number of toes, and angle of toe. The literature often shows large differences in size,
does not state the sediment walked upon, or how many birds were included in the research to
establish the average size. The writers experimental research demonstrates that size and toe
angle can vary in a singular bird’s footprint trail, and so relying solely on size or toe angle can
be misleading. Morphology must always be considered first. Many modern birds are obese,
especially ducks and geese (M. Roberts, pers comms, 12/01/2014), and so their gait may have
altered to accommodate their change in body size. These differences need to be considered
when comparing modern to prehistoric birds as diet, habitat and behaviours may be very
different.
486
329 footprints from 21 modern avian species were analysed in this study. These species were
chosen as there is bone evidence for these in prehistoric Britain. Many of these species are still
native to Britain or visiting migrants, as well as birds that are common in the Severn Estuary
today.
270 Late Mesolithic avian footprint-tracks were recorded at Goldcliff East during Scales’
(2006) research, the current research, and sporadic site visits between 2005-2014. These
footprint-tracks compliment bone assemblages, and provide data where bone assemblages are
missing. The avian bone record at Goldcliff is sparse, with only mallard bones recorded at Site
W, as well as unidentified bird bones from Site W and Site A (Coard 2000; Scales 2007b). The
footprint-track assemblage therefore provides much stronger evidence for birds from the area
and can be utilised similarly at other sites where there are avian footprints preserved even when
bone assemblages are lacking. Nine avian species were identified at Goldcliff from the bone
and footprint-track record. Of these, four are currently resident birds of the Severn Estuary, one
species migrates to Britain for the spring/summer and one species migrates during the
autumn/winter. The footprint-tracks made by waders may have been made by a variety of
species, likely of the Scolopacidae family, which includes turnstone, dunlin and sandpiper.
The earliest evidence of common crane (Grus grus) and possible white stork (Ciconia ciconia)
from Holocene Wales is found at Goldcliff in the footprint-track assemblage. White stork no-
longer visit Britain as part of their migration route, but they used to migrate to certain southern
areas during the spring/summer months and footprint-track evidence suggests the same may
have been true during the Mesolithic period. Common crane also stopped migrating to Britain,
or suffered localised extinction, though recent reintroduction programmes within the last decade
in Somerset and Norfolk have resulted in a small residential breeding population.
Footprint-tracks of migratory birds can be used as a seasonal indicator for when certain
laminations were lain down. Particle size analysis of banded laminations where footprint-tracks
were formed has made it possible to identify the season that humans and birds were active
(Dark and Allen 2005; Scales 2007a, Table 12.1). In the 2014-2017 research period there were
not any clear human footprints recorded, only footprint-tracks that were primarily
overtraces/undertraces, so the exact lamination band is not always clear. There were however
multiple avian footprints, these were primarily made on a fine-grained sediment (Site C/E),
suggesting the birds made the footprints during the summer months. The birds that made the
footprints in Site C/E were primarily common crane, a summer migrant. Grey heron footprints
from Site N were made on coarser-grained laminations and indicate that these were made in
autumn/winter, grey heron are currently year-round residents of the Severn Estuary.
487
The main evidence for terrestrial animal exploitation at Goldcliff is from red deer, though it
should be noted that bones were generally heavily trampled and small and porous bones may
not have survived. 86 mammal footprint-tracks have been identified in the Goldcliff East
footprint assemblage (Scales 2006). 95% of these footprint-tracks belong to deer; 20% of the
deer footprint-tracks were small and may have been roe deer, however the morphology is more
suggestive of juvenile red deer. The Goldcliff bone and footprint-track assemblages
complement each other and indicate that they were not a single sex herd, but rather a
combination of stag, hind and juvenile. This evidence is seen at Site J, below the upper peat and
lower foreshore and at Site G (Scales 2007, p 155). The presence of a red deer herd containing
stags, hinds and juveniles suggests the deer were physically in the area and probably being
hunted there during late spring/early summer when they had just started to birth their young.
Red deer footprint-tracks at Uskmouth were also made by a combination of stag, hind and
juvenile. The Uskmouth laminations had deer trampling on successive laminations suggesting
the area was being used year after year by red deer, possibly as a safe environment to raise their
young. The red deer at Uskmouth were also likely in the area in late spring/early summer.
There were also auroch (2%), wolf/otter/domesticated dog (2%) and indistinct (1%) mammal
footprint-tracks at Goldcliff East. The small number of auroch and roe deer footprints, and the
complete absence of wild boar footprints suggest that the wetland area was not a favourable
environment for these ungulate species; these were animals more likely to prefer the wooded
island habitat. It is also thought that the saltmarsh environment may have been dangerous to
large mammals, as auroch bones have been found stuck in Neolithic palaeochannels at
Uskmouth and Rumney (Whittle and Green 1988; Green 1989).
11.1.5 Goldcliff East Palaeoecology
The human footprint-tracks from Goldcliff East are generally poorly preserved
overtraces/undertraces, although a few exceptionally well-preserved footprints are present
(Figure 6.3). Even poorly preserved examples can be identified as human due to their long and
slender shape, and specific features such as evidence of hallux, arch of foot, ball of foot or a
heel. The most convincing human footprint-tracks are those that form a left-right-left footprint-
track trail. Footprint-tracks are relevant in establishing an understanding of hunter-gather
activities and their interactions with each other, their environment and other animals. This
interaction can also be seen in footprint-track evidence from other time periods. For example,
by the Bronze Age the saltmarshes of Goldcliff and Redwick were being exploited for the
seasonal grazing of domestic livestock with a focus on dairy production, evidenced from
488
footprint-track data (Barr and Bell 2016). Footprint-tracks are therefore an important part of
reconstructing a rich and varied picture of the palaeoecology of this landscape.
There have so far been 342 human footprint-tracks recorded at Goldcliff East. During the
research period of 2014-2017, there were 61 possible human footprint-tracks subjected to
detailed recording. These footprint-tracks ranged in size from 13cm to 30cm in length. Scales
(2006) recorded 233 human footprint-tracks, and during 2005-2014 there were 47 human
footprint-tracks recorded. A further 177 possible human footprint-tracks have been recorded
from 2001-2017, however these are poorly preserved and may include some ungulates and
some other types of sediment disturbance. There have been 21 human footprint-track trails
recorded at Goldcliff East between 2001-2017, with 12 obvious footprint-track trails recorded
by Scales (2006) and nine trails recorded between 2010-2017. These trails were found at Site H,
Site C/E, Site M, Site N, Site R and Site S.
The adults of Goldcliff East had an average stature of 166.5cm (5’5”). This is shorter than the
adult stature from Mesolithic skeletons at Totty Pots, Somerset, which have an average stature
of 170cm (5’6”) (Schulting et al. 2010), and is most similar to the average stature estimates
from Neolithic skeletal remains in Orkney, where there was an average height of 166cm (5’5”)
(Hedges 1984). Today an average British adult female has a stature of 161.6cm (5’3”), and
males 175.3cm (5’9”) (Office for National Statistics 2011). The average stature of British adults
is 168.5cm (5’6”), which is only 2cm taller than the average of Mesolithic humans at Goldcliff
East.
Only two of the nine footprint-track trails recorded during 2014-2017 were made by people
moving quickly. Footprint-tracks from a hunter-gatherer at Site M (2015:160 and 2015:163)
suggest that this person was possibly moving at 10km (6 miles) per hour, a steady jogging
speed. From Site C/E an individual (2015:114, 2015:115) was moving at a possible 8km (5
miles) per hour, a relatively slow jogging speed. All other footprint-tracks were made by
individuals who were walking. There was no indication of prey stalking.
Scales’ (2006) data was reanalysed and the results added to the data of the current study, with
21 human footprint-track trails all considered. Of the identifiable human footprint-tracks at
Goldcliff East, one was made by a child under 4 years old, two were made by children aged 5.5
+/- 1.5 years, one by a child aged 6 +/- 1.5 years and one aged 10 +/- 1 year. There were seven
footprint-tracks that may have been made by children aged 10+ or adult females, though three
of these were under 23cm so more likely to be made by children as only 13% of adult females
made footprints smaller than 23cm in the experimental data. There were five footprint-track
trails that may have been made by children aged over 10 years old, adult females or adult males.
Two footprint-track trails were made by adult males, identifiable as they were over 30cm, there
489
were a further two probable adult males, who made footprint-track trails with footprints over
27cm in length, though these could also have been large adult females or adolescent males. The
adult male and probable adult males all came from Site E.
Footprint-tracks can be utilised to understand a prehistoric individual’s direction of movement,
even if the actual size of the footprint is unclear. This direction of movement may be an
indication as to the location of specific resources or activity areas. The footprint-tracks from
Site C/E and Site R were mainly orientated in a west/north-west direction, footprint-tracks from
Site M, Site N and Site S were orientated in a south-west and north-east direction. The
footprint-tracks that were made in a north-east and south-west direction were heading towards
and away from the Goldcliff Island projection, towards a palaeochannel, this orientation would
take them towards the probable fish trap at Site T and the possible fish trap at Site L, indicating
these people were possibly fishing. The Site C/E and Site R footprint-tracks were mainly
orientated west/north-west, this direction would take these individuals towards Site A, Site J,
and Site W. The Site C/E and Site R footprint-tracks are on higher laminations than the other
sites, and are later in date. The direction of movement in the comparative areas suggests that
activities at the site changed over time. The only footprint-track trails that were positively
identified as male in origin all came from Site E. In this site they are moving in a different
direction to those on the lower laminations which may indicate that these males had a different
purpose to the females and children, who made footprint-track trails with a predominant east to
west direction, which connects to monitoring the fish traps.
The evidence of a probable fish trap in a paleochannel at Site T, along with 513 identifiable fish
bones recorded at Goldcliff from Site A, J and an unknown area, suggest that fish were being
exploited by the hunter-gatherer-fishers. Eel made up 83% of the fish bone assemblage. Around
25% of eel were of a size that suggested that they were caught during their migration to spawn,
which currently occurs in September/October (Ingrem 2007, p 167). Though the other 75% of
eel were smaller and would have been in river mouths from March to November, we can
therefore see targeted fishing of eel during their migration in September/October, but also
evidence that fishing was occurring early spring until late autumn (Bell 2007, Table 18.4). The
fish trap evidence, the eel remains, and the footprint-tracks from Site N, which were heading in
the same direction as the location of a palaeochannel, indicate that these people had an
understanding of migration times. They were probably in the area to fish for large eel, whilst
also still fishing the area at other times of year.
The footprint-track data and other archaeology from Goldcliff suggest that the environs were
being exploited throughout the year, though not extensively. It was not on a permanent or
sedentary basis, rather at various times through the year different activities were undertaken,
490
with the predominance of activity in the late summer/autumn and with spring and winter
activity at some sites (Bell 2007, Table 18.4).
Footprint-tracks can provide evidence of paleosociety. Of the 21 footprint-track trails recorded
during 2001-2017 (Table 9.9), 29% of this assemblage was made by children. Site N was
dominated by small footprint-tracks, from children (11%) and adolescents/adult females (58%).
A further 31% of footprint-tracks from Site N may have been made by adult females, small
adult males or children aged over 10 years old. There has so far been no clear evidence of large
adult males at Site N. Site N is made up of a ‘pathway’ 16m by 6m, and indicates that people
were walking south-west towards Goldcliff Island, and north-east away from it. This pathway is
on the same axis as Site T, a probable fish trap, located between Site N and Goldcliff Island.
Site N is east of Site T and given the dip of the laminated sediments it is likely to be later in
date and relate to another fish trap at a time when the channel had migrated further to the east,
possibly related to the wooden structure at Site L. Footprint-track evidence, especially from Site
N, suggests that children and adult females were involved in fishing and other subsistence
activities but the possibility that small adult males were also involved cannot be excluded. The
population composition evidence from Goldcliff East can be cautiously compared to
ethnographic data. In hunter-gatherer-fisher communities children often take an active role,
learning to hunt at a young age so that they could start to provide some of their own food. In
indigenous populations, children under 10 make up at least 23% of the population (Statistics
Canada 2011a), with children under 15 years old making up as much as 36% of the population
(Australian Bureau of Statistics 2012). The footprint-track data from Goldcliff East suggests
that children under 10 years old made up at least 29% of the footprint-track trails, and suggests
a high percentage of hunter-gatherer children similar to modern indigenous population
demographics. Children were not just on the wetlands to play, they were contributing to
activities of daily life.
11.2 Further work and recommendations
Mesolithic Goldcliff has been studied for over 26 years, however as the wooden structure at Site
T found in the final fieldwork of the present project in 2017 proves, there is still a possibly of
new sites and finds. Due to erosion and shifting sediments, finding a Palaeolithic site in this
area is probable, with an unstratified unifacial leaf point from the early Upper Palaeolithic
already found between Sites A and B (Barton 2007, p 113), as well as three other more recent
finds of the same date. Mesolithic footprint-track sites are also still being found in new areas,
indicating that there is scope for more research, especially as technology advances and sites are
exposed further by erosion. The benefits of long term monitoring are evident from both Scales’
491
(2006) dataset and that presented within this further research; new archaeology is constantly
being exposed. A comparison of these two bodies of work also indicates the advances in
recording techniques which have been made over this timescale. Structure from motion utilising
multi-image photogrammetry has been an effective recording technique for footprint-tracks and
it would be beneficial to integrate all data from the Goldcliff footprint areas, including
differential GPS, EDM survey, air photography and unmanned aerial vehicle data (drones) into
one large survey. An integrated survey of the Goldcliff data will allow for the extent of the
Mesolithic site to be fully appreciated.
There is a need for further study of mammal and avian footprints, especially in understanding
the formation processes in different sediments and the foot features that survive on these
sediments. An increase in the avian footprint database would be beneficial for ornithologists
and archaeologists alike, as the database is small and generally restricted to tracking guides.
This study found that differentiating between similar avian species can be problematic, and this
often results in an inability to accurately identify the bird that made the footprint, so a comment
on the birds’ migration or residential status could not always be made. There are 122 species of
bird that have been seen on the Severn Estuary since 1952, some are extremely rare but some
are not. Only 21 species were included in this study; these were from avian species that frequent
Britain, specifically the Severn Estuary, and are represented by archaeological bone evidence or
are currently found there. It is likely that many species of birds that were in prehistoric Britain
have not been preserved in the archaeological bone record but may appear in the footprint-track
record.
Further exploration of the formation of mammalian footprints upon different sediments, made
by differently aged animals of both sexes would be beneficial. This data would be relevant for
footprints made during prehistory to present and would be a valuable resource. The value of this
work is presented by Barr and Bell (2016), however a much larger database with more species
would be appropriate.
There is still scope for future research regarding the relationship between a human footprint and
a person’s height, weight, age, sex and speed of movement. A focus on pubescent children
would be beneficial to establish if there are any ways that adult females and adolescent
footprints differentiate from one another. Further work with children and the way they walk
would also be useful as footprints made by children are vastly understudied and there is very
little data available, especially regarding the relationship between stature and foot length, and
speed of movement. Further ethnographic data collection involving hunter-gatherer-fisher
children would be highly beneficial, as hunter-gatherer children are rarely included in
anthropological footprint-track research. It would be of interest to establish if in a larger dataset
492
the differences between an adolescent and an adult female footprint can be identified. A study
of pregnant women and women carrying heavy objects/young children would also make an
interesting comparison to see if this is identifiable in a footprint made on clayey silt. A
worldwide database of this sort of information would be beneficial to forensic scientists,
anthropologists and archaeologists alike and would greatly enhance and progress the study of
ichnology and forensic podiatry.
Footprint-tracks from intertidal sites provide us with important information about the people of
the past who formed them; however these sites are at risk for a variety of reasons. Planned tidal
energy lagoons and coastal defence upgrading are current threats to the intertidal zone of the
Severn Estuary. Multiple sites are currently being considered for the location of the lagoon,
including at Cardiff and east of the Usk river at Newport, these would both effect the intertidal
sites of the Gwent Levels. The building of a lagoon east of Newport would permanently
submerge lower footprint-track areas such as Site N at Goldcliff East. Site T, which is currently
of significant archaeological interest due to possible evidence of a Late Mesolithic fish trap,
would also be at high risk of being submerged. Lagoon construction and discharge would lead
to extensive erosion of many parts of the intertidal zone, affecting not just Mesolithic sites but
the entire area. It is essential that archaeologists work alongside other sectors, such as nature
conservationists, to investigate and protect these unique sites. This study, through a placement
with the RSPB and Gwent Levels Wildlife Trust as part of the Living Levels Landscape project,
has contributed to the establishment of links between archaeology and nature conservation. The
writer hopes that this relationship will assist in the protection of the intertidal zone, so that the
footprints made by Mesolithic hunter-gatherer-fishers will remain and continue to capture the
imagination of the general public and archaeologists alike for generations to come.
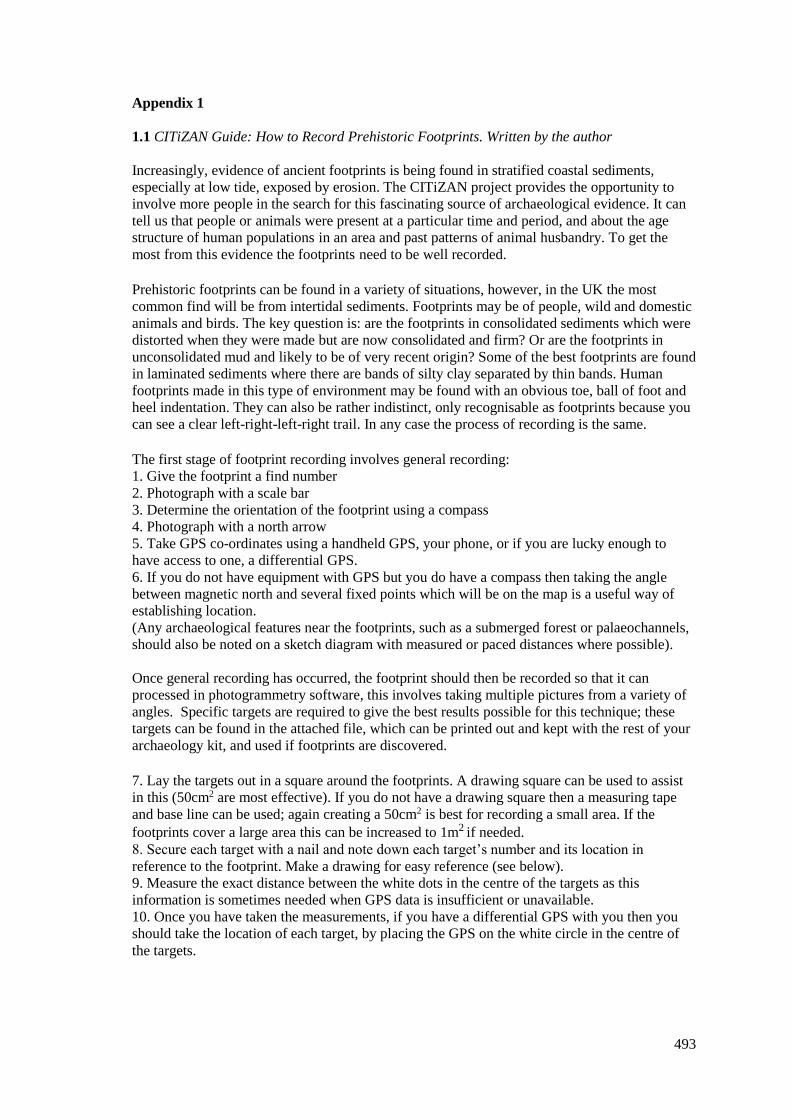
493
Appendix 1
1.1 CITiZAN Guide: How to Record Prehistoric Footprints. Written by the author
Increasingly, evidence of ancient footprints is being found in stratified coastal sediments,
especially at low tide, exposed by erosion. The CITiZAN project provides the opportunity to
involve more people in the search for this fascinating source of archaeological evidence. It can
tell us that people or animals were present at a particular time and period, and about the age
structure of human populations in an area and past patterns of animal husbandry. To get the
most from this evidence the footprints need to be well recorded. Prehistoric footprints can be found in a variety of situations, however, in the UK the most
common find will be from intertidal sediments. Footprints may be of people, wild and domestic
animals and birds. The key question is: are the footprints in consolidated sediments which were
distorted when they were made but are now consolidated and firm? Or are the footprints in
unconsolidated mud and likely to be of very recent origin? Some of the best footprints are found
in laminated sediments where there are bands of silty clay separated by thin bands. Human
footprints made in this type of environment may be found with an obvious toe, ball of foot and
heel indentation. They can also be rather indistinct, only recognisable as footprints because you
can see a clear left-right-left-right trail. In any case the process of recording is the same.
The first stage of footprint recording involves general recording:
1. Give the footprint a find number 2. Photograph with a scale bar
3. Determine the orientation of the footprint using a compass
4. Photograph with a north arrow
5. Take GPS co-ordinates using a handheld GPS, your phone, or if you are lucky enough to
have access to one, a differential GPS. 6. If you do not have equipment with GPS but you do have a compass then taking the angle between magnetic north and several fixed points which will be on the map is a useful way of
establishing location. (Any archaeological features near the footprints, such as a submerged forest or palaeochannels,
should also be noted on a sketch diagram with measured or paced distances where possible).
Once general recording has occurred, the footprint should then be recorded so that it can
processed in photogrammetry software, this involves taking multiple pictures from a variety of
angles. Specific targets are required to give the best results possible for this technique; these
targets can be found in the attached file, which can be printed out and kept with the rest of your
archaeology kit, and used if footprints are discovered.
7. Lay the targets out in a square around the footprints. A drawing square can be used to assist
in this (50cm2 are most effective). If you do not have a drawing square then a measuring tape
and base line can be used; again creating a 50cm2 is best for recording a small area. If the footprints cover a large area this can be increased to 1m2
if needed. 8. Secure each target with a nail and note down each target’s number and its location in reference to the footprint. Make a drawing for easy reference (see below).
9. Measure the exact distance between the white dots in the centre of the targets as this information is sometimes needed when GPS data is insufficient or unavailable.
10. Once you have taken the measurements, if you have a differential GPS with you then you should take the location of each target, by placing the GPS on the white circle in the centre of
the targets.
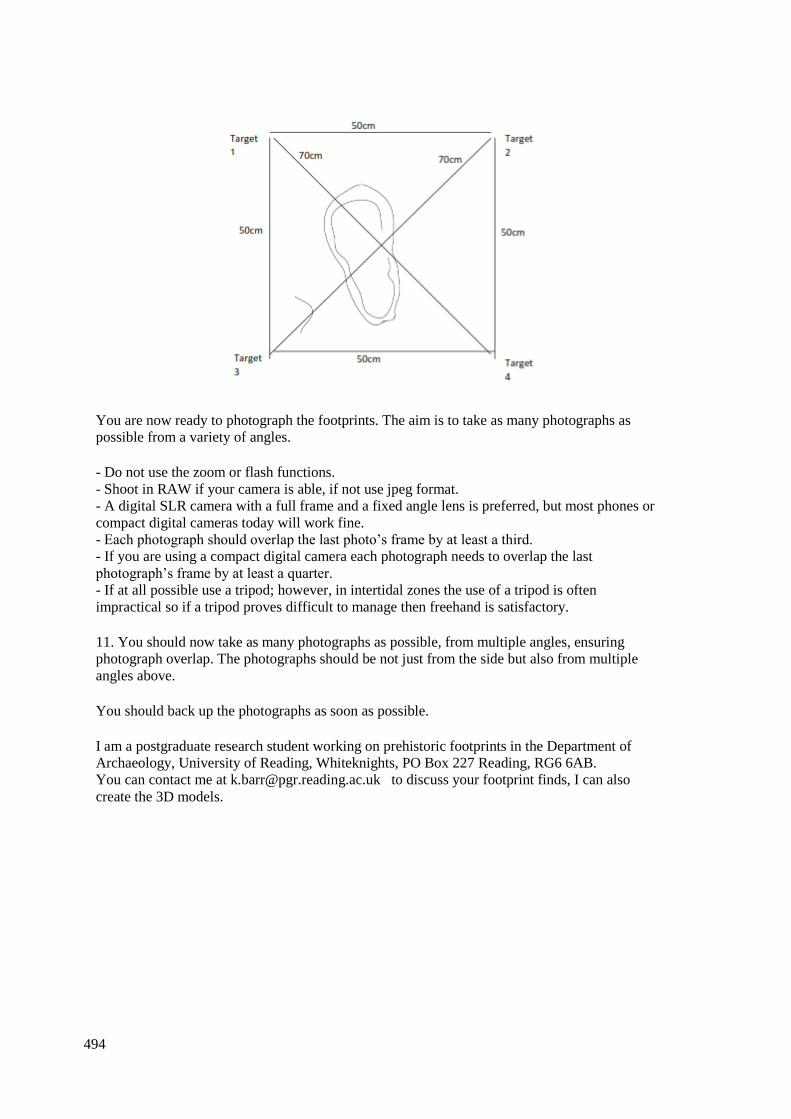
494
You are now ready to photograph the footprints. The aim is to take as many photographs as
possible from a variety of angles.
- Do not use the zoom or flash functions.
- Shoot in RAW if your camera is able, if not use jpeg format.
- A digital SLR camera with a full frame and a fixed angle lens is preferred, but most phones or compact digital cameras today will work fine.
- Each photograph should overlap the last photo’s frame by at least a third.
- If you are using a compact digital camera each photograph needs to overlap the last photograph’s frame by at least a quarter.
- If at all possible use a tripod; however, in intertidal zones the use of a tripod is often impractical so if a tripod proves difficult to manage then freehand is satisfactory.
11. You should now take as many photographs as possible, from multiple angles, ensuring
photograph overlap. The photographs should be not just from the side but also from multiple
angles above.
You should back up the photographs as soon as possible.
I am a postgraduate research student working on prehistoric footprints in the Department of
Archaeology, University of Reading, Whiteknights, PO Box 227 Reading, RG6 6AB. You can contact me at [email protected] to discuss your footprint finds, I can also
create the 3D models.
495
1.2 OSL Report
University of Gloucestershire
Luminescence dating laboratory
Optical dating of sediments:
Goldcliff East and East Dean Woods excavations, UK to
Prof. M.G. Bell
University of Reading
Prepared by Dr P.S. Toms, 16 November 2017
r Scope of Report
This is a standard report of the Luminescence dating laboratory, University of Gloucestershire. In large part, the
document summarises the processes, diagnostics and data drawn upon to deliver Table 1. A conclusion on the
analytical validity of each sample’s optical age estimate is expressed in Table 2; where there are caveats, the reader is
directed to the relevant section of the report that explains the issue further in general terms.
Copyright Notice Permission must be sought from Dr P.S. Toms of the University of Gloucestershire Luminescence dating laboratory
in using the content of this report, in part or whole, for the purpose of publication.
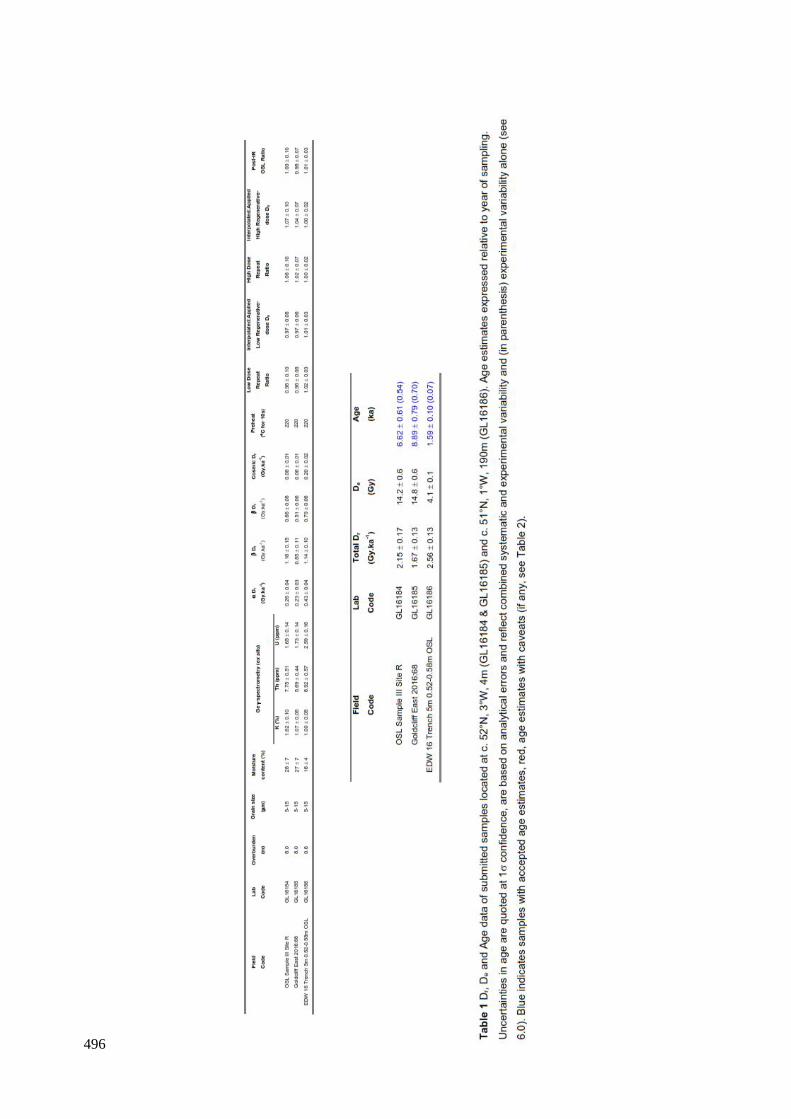
496
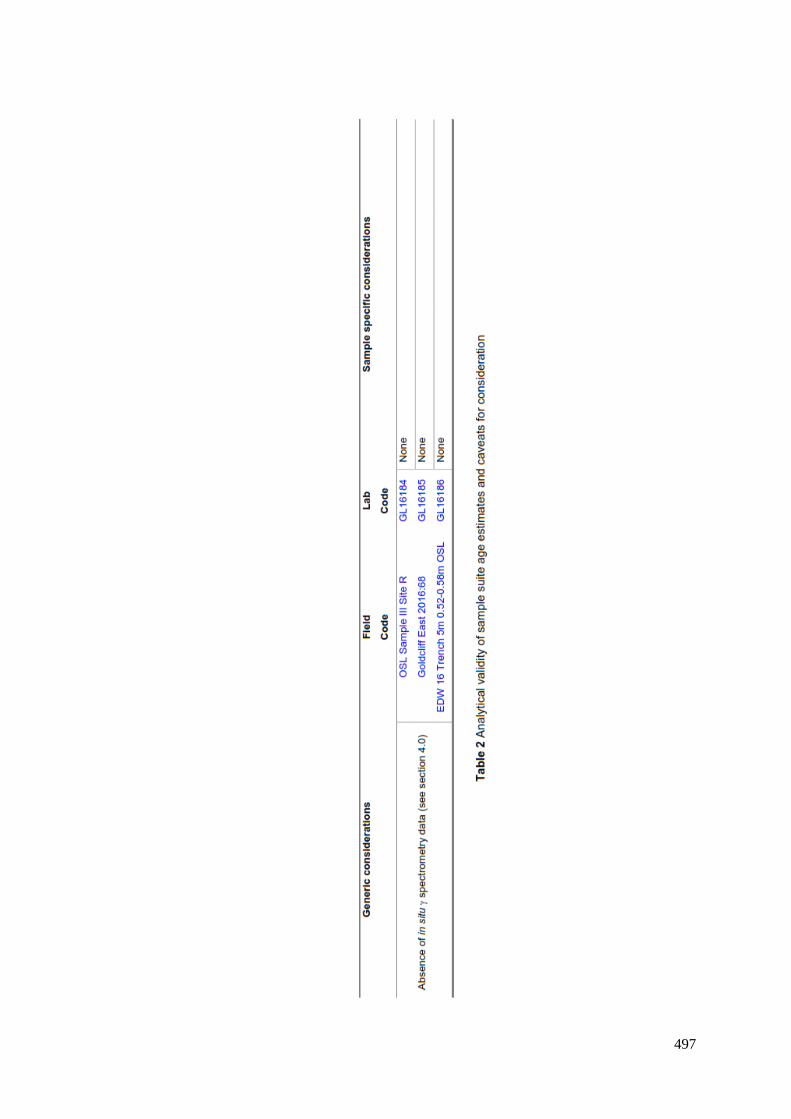
497
498
Mechanisms and principles Upon exposure to ionising radiation, electrons within the crystal lattice of insulating minerals are displaced from
their atomic orbits. Whilst this dislocation is momentary for most electrons, a portion of charge is redistributed to
meta-stable sites (traps) within the crystal lattice. In the absence of significant optical and thermal stimuli, this charge
can be stored for extensive periods. The quantity of charge relocation and storage relates to the magnitude and period
of irradiation. When the lattice is optically or thermally stimulated, charge is evicted from traps and may return to a
vacant orbit position (hole). Upon recombination with a hole, an electron’s energy can be dissipated in the form of
light generating crystal luminescence providing a measure of dose absorption.
Herein, quartz is segregated for dating. The utility of this minerogenic dosimeter lies in the stability of its datable
signal over the mid to late Quaternary period, predicted through isothermal decay studies (e.g. Smith et al., 1990;
retention lifetime 630 Ma at 20°C) and evidenced by optical age estimates concordant with independent
chronological controls (e.g. Murray and Olley, 2002). This stability is in contrast to the anomalous fading of
comparable signals commonly observed for other ubiquitous sedimentary minerals such as feldspar and zircon
(Wintle, 1973; Templer, 1985; Spooner,1993). Optical age estimates of sedimentation (Huntley et al., 1985) are
premised upon reduction of the minerogenic time dependent signal (Optically Stimulated Luminescence, OSL) to
zero through exposure to sunlight and, once buried, signal reformulation by absorption of litho- and cosmogenic
radiation. The signal accumulated post burial acts as a dosimeter recording total dose absorption, converting to a
chronometer by estimating the rate of dose absorption quantified through the assay of radioactivity in the surrounding
lithology and streaming from the cosmos.
Age = Mean Equivalent Dose (D e, Gy) Mean Dose Rate (D)
Aitken (1998) and Bøtter-Jensen et al. (2003) offer a detailed review of optical dating.
Sample Preparation Three sediment samples were collected within opaque tubing and submitted for Optical dating. To preclude optical
erosion of the datable signal prior to measurement, all samples were opened and prepared under controlled laboratory
illumination provided by Encapsulite RB-10 (red) filters. To isolate that material potentially exposed to daylight
during sampling, sediment located within 20 mm of each tube-end was removed.
The remaining sample was dried and then sieved. The fine silt fraction was segregated and subjected to acid and
alkaline digestion (10% HCl, 15% H2O) to attain removal of carbonate and organic components respectively. Fine
silt sized quartz, along with other mineral grains of varying density and size, was extracted by sample sedimentation
in acetone (<15 m in 2 min 20 s, >5 m in 21 mins at 20ºC). Feldspars and amorphous silica were then removed
from this fraction through acid digestion (35% H2SiF6 for 2 weeks, Jackson et al., 1976; Berger et al., 1980).
Following addition of 10% HCl to remove acid soluble fluorides, grains degraded to <5 m as a result of acid
treatment were removed by acetone sedimentation. Twelve multi-grain aliquots (ca. 1.5 mg) were then mounted on
aluminium discs for D e evaluation.
All drying was conducted at 40 C to prevent thermal erosion of the signal. All acids and alkalis were Analar grade.
All dilutions (removing toxic-corrosive and non-minerogenic luminescence-bearing substances) were conducted with
distilled water to prevent signal contamination by extraneous particles.
Acquisition and accuracy of De value All minerals naturally exhibit marked inter-sample variability in luminescence per unit dose (sensitivity). Therefore,
the estimation of D e acquired since burial requires calibration of the natural signal using known amounts of
laboratory dose. D e values were quantified using a single-aliquot regenerative-dose (SAR) protocol (Murray and
Wintle 2000; 2003) facilitated by a Risø TL-DA-15 irradiation-stimulation-detection system (Markey et al., 1997;
Bøtter-Jensen et al., 1999). Within this apparatus, optical signal stimulation is provided by an assembly of blue diodes (5 packs of 6 Nichia NSPB500S), filtered to 470 80 nm conveying 15 mW.cm -2 using a 3 mm Schott GG420 positioned in front of each
diode pack. Infrared (IR) stimulation, provided by 6 IR diodes (Telefunken TSHA 6203) stimulating at 875 80nm
delivering ~5 mW.cm-2, was used to indicate the presence of contaminant feldspars (Hütt et al., 1988). Stimulated
photon emissions from quartz aliquots are in the ultraviolet (UV) range and were filtered from stimulating photons
by 7.5 mm HOYA U-340 glass and detected by an EMI 9235QA photomultiplier fitted with a blue-green sensitive
bialkali photocathode. Aliquot irradiation was conducted using a 1.48 GBq 90Sr/90Y source calibrated for multi-
grain aliquots of 5-15 m quartz against the ‘Hotspot 800’ 60 Co source located at the National Physical
Laboratory (NPL), UK.

499
SAR by definition evaluates D e through measuring the natural signal (Fig. 1) of a single aliquot and then
regenerating that aliquot’s signal by using known laboratory doses to enable calibration. For each aliquot, five
different regenerative doses were administered so as to image dose response. D e values for each aliquot were then
interpolated, and associated counting and fitting errors calculated, by way of exponential plus linear regression (Fig.
1). Weighted (geometric) mean De values were calculated, given sufficient mass, from 12 aliquots using the central
age model outlined by Galbraith et al. (1999) and are quoted at 1 confidence (Table 1). The accuracy with which D
e equates to total absorbed dose and that dose absorbed since burial was assessed. The former can be considered a
function of laboratory factors, the latter, one of environmental issues. Diagnostics were deployed to estimate the
influence of these factors and criteria instituted to optimise the accuracy of D e values. Laboratory Factors Feldspar contamination
The propensity of feldspar signals to fade and underestimate age, coupled with their higher sensitivity relative to
quartz makes it imperative to quantify feldspar contamination. At room temperature, feldspars generate a signal
(IRSL; Fig. 1) upon exposure to IR whereas quartz does not. The signal from feldspars contributing to OSL can be
depleted by prior exposure to IR. For all aliquots the contribution of any remaining feldspars was estimated from the
OSL IR depletion ratio (Duller, 2003). The influence of IR depletion on the OSL signal can be illustrated by
comparing the regenerated post-IR OSL D e with the applied regenerative-dose. If the addition to OSL by feldspars is
insignificant, then the repeat dose ratio of OSL to post-IR OSL should be statistically consistent with unity (Table 1).
If any aliquots do not fulfil this criterion, then the sample age estimate should be accepted tentatively. The source of
feldspar contamination is rarely rooted in sample preparation; it predominantly results from the occurrence of
feldspars as inclusions within quartz.
Preheating
Preheating aliquots between irradiation and optical stimulation is necessary to ensure comparability between natural
and laboratory-induced signals. However, the multiple irradiation and preheating steps that are required to define
singlealiquot regenerative-dose response leads to signal sensitisation, rendering calibration of the natural
Signal inaccurate.
The SAR protocol (Murray and Wintle,2000;2003) enables this sensitisation to be monitored and corrected
Using a test dose, here set at 5 Gy preheated to 220 C for 10s, to track signal sensitivity between irradiation-preheat
steps. However, the accuracy of sensitisation correction for both natural and laboratory signals can be preheat
dependent.
The Dose Recovery test was used to assess the optimal preheat temperature for accurate correction and calibration of
the time dependent signal. Dose Recovery (Fig. 2) attempts to quantify the combined effects of thermal transfer and
sensitisation on the natural signal, using a precise lab dose to simulate natural dose. The ratio between the applied
dose and recovered D e value should be statistically concordant with unity. For this diagnostic, 6 aliquots were each
assigned a 10 s preheat between 180 C and 280 C. That preheat treatment fulfilling the criterion of accuracy within the Dose Recovery test was selected to generate the
final D e value from a further 12 aliquots. Further thermal treatments, prescribed by Murray and Wintle (2000; 2003),
were applied to optimise accuracy and precision. Optical stimulation occurred at 125ºC in order to minimise effects
associated with photo-transferred thermoluminescence and maximise signal to noise ratios. Inter-cycle optical
stimulation was conducted at 280ºC to minimise recuperation.
Irradiation
For all samples having De values in excess of 100 Gy, matters of signal saturation and laboratory irradiation effects
are of concern. With regards the former, the rate of signal accumulation generally adheres to a saturating exponential
form and it is this that limits the precision and accuracy of De values for samples having absorbed large doses. For
such samples, the functional range of De interpolation by SAR has been verified up to 600 Gy by Pawley et al.
(2010). Age estimates based on De values exceeding this value should be accepted tentatively.
Internal consistency Abanico plots (Dietze et al., 2016) are used to illustrate inter-aliquot De variability (Fig. 3). De values are standardised relative to the central De value for natural signals and are described as
overdispersed when >5% lie beyond 2 of the standardising value; resulting from a heterogeneous absorption of
burial dose and/or response to the SAR protocol. For multi-grain aliquots, overdispersion of natural signals does not
necessarily imply inaccuracy. However where overdispersion is observed for regenerated signals, the efficacy of
sensitivity correction may be problematic. Murray and Wintle (2000; 2003) suggest repeat dose ratios (Table 1) offer
a measure of SAR protocol success, whereby ratios ranging across 0.9-1.1 are acceptable. However, this variation of
repeat dose ratios in the high-dose region can have a significant impact on De interpolation. The influence of this
effect can be outlined by quantifying the ratio of interpolated to applied regenerative-dose ratio (Table 1). In this
study, where both the repeat dose ratios and interpolated to applied regenerative-dose ratios range across 0.9-1.1,
sensitivity-correction is considered effective.
500
Environmental factors Incomplete zeroing
Post-burial OSL signals residual of pre-burial dose absorption can result where pre-burial sunlight exposure is
limited in spectrum, intensity and/or period, leading to age overestimation. This effect is particularly acute for
material eroded and redeposited sub-aqueously (Olley et al., 1998, 1999; Wallinga, 2002) and exposed to a burial
dose of <20 Gy (e.g. Olley et al., 2004), has some influence in sub-aerial contexts but is rarely of consequence where
aerial transport has occurred. Within single-aliquot regenerative-dose optical dating there are two diagnostics of
partial resetting (or bleaching); signal analysis (Agersnap-Larsen et al., 2000; Bailey et al., 2003) and inter-aliquot De
distribution studies (Murray et al., 1995). Within this study, signal analysis was used to quantify the change in De
value with respect to optical stimulation time for multi-grain aliquots. This exploits the existence of traps within
minerogenic dosimeters that bleach with different efficiency for a given wavelength of light to verify partial
bleaching. De(t) plots (Fig. 4; Bailey et al., 2003) are constructed from separate integrals of signal decay as
laboratory optical stimulation progresses. A statistically significant increase in natural De (t) is indicative of partial
bleaching assuming three conditions are fulfilled. Firstly, that a statistically significant increase in De (t) is observed
when partial bleaching is simulated within the laboratory. Secondly, that there is no significant rise in De (t) when
full bleaching is simulated. Finally, there should be no significant augmentation in De (t) when zero dose is
simulated. Where partial bleaching is detected, the age derived from the sample should be considered a maximum
estimate only. However, the utility of signal analysis is strongly dependent upon a samples pre-burial experience of
sunlight’s spectrum and its residual to post-burial signal ratio. Given in the majority of cases, the spectral exposure
history of a deposit is uncertain, the absence of an increase in natural De
(t) does not necessarily testify to the absence of partial bleaching.
Where requested and feasible, the insensitivities of multi-grain single-aliquot signal analysis may be circumvented by
inter-aliquot De distribution studies. This analysis uses aliquots of single sand grains to quantify inter-grain D
distribution. At present, it is contended that asymmetric inter-grain D e distributions are symptomatic of partial
bleaching and/or pedoturbation (Murray et al., 1995; Olley et al., 1999; Olley et al., 2004; Bateman et al., 2003).
For partial bleaching at least, it is further contended that the De acquired during burial is located in the minimum
region of such ranges. The mean and breadth of this minimum region is the subject of current debate, as it is
additionally influenced by heterogeneity in microdosimetry, variable inter-grain response to SAR and residual to
post-burial signal ratios.
Turbation
As noted in section 3.1.1, the accuracy of sedimentation ages can further be controlled by post-burial trans-strata
grain movements forced by pedo- or cryoturbation. Berger (2003) contends pedogenesis prompts a reduction in the
apparent sedimentation age of parent material through bioturbation and illuviation of younger material from above
and/or by biological recycling and resetting of the datable signal of surface material. Berger (2003) proposes that the
chronological products of this remobilisation are A-horizon age estimates reflecting the cessation of pedogenic
activity, Bc/C-horizon ages delimiting the maximum age for the initiation of pedogenesis with estimates obtained
from Bt-horizons providing an intermediate age ‘close to the age of cessation of soil development’. Singhvi et al.
(2001), in contrast, suggest that B and C-horizons closely approximate the age of the parent material, the A-horizon,
that of the ‘soil forming episode’. Recent analyses of inter-aliquot D e distributions have reinforced this complexity
of interpreting burial age from pedoturbated deposits (Lombard et al., 2011; Gliganic et al., 2015; Jacobs et al., 2008;
Bateman et al., 2007; Gliganic et al., 2016). At present there is no definitive post-sampling mechanism for the direct
detection of and correction for post-burial sediment remobilisation. However, intervals of palaeosol evolution can be
delimited by a maximum age derived from parent material and a minimum age obtained from a unit overlying the
palaeosol. Inaccuracy forced by cryoturbation may be bidirectional, heaving older material upwards or drawing
younger material downwards into the level to be dated. Cryogenic deformation of matrix-supported material is,
typically, visible; sampling of such cryogenically-disturbed sediments can be avoided.
Acquisition and accuracy of D r value Lithogenic Dr values were defined through measurement of U, Th and K radionuclide concentration and conversion
of these quantities into, and D r values (Table 1). and contributions were estimated from sub-samples by laboratory-based spectrometry using an Ortec GEM-S high purity Ge coaxial detector system, calibrated using
certified reference materials supplied by CANMET. dose rates can be estimated from in situ NaI gamma
spectrometry or, where direct measurements are unavailable as in the present case, from laboratory-based Ge
spectrometry. In situ measurements reduce uncertainty relating to potential heterogeneity in the dose field
surrounding each sample. The level of U disequilibrium was estimated by laboratory-based Ge spectrometry.
Estimates of radionuclide concentration were converted into Dr values (Adamiec and Aitken, 1998), accounting for
D e modulation forced by grain size (Mejdahl,1979), present moisture content (Zimmerman, 1971) and, where Dr values were generated from 5-15m quartz, reduced signal sensitivity to radiation (a-value 0.050 0.002).
Cosmogenic D r sample depth, geographical position and matrix density (Prescott and Hutton, 1994).
501
The spatiotemporal validity of Dr values were calculated on the basis of values can be considered a function of five
variables. Firstly, age estimates devoid of in situ spectrometry data should be accepted tentatively if the sampled
unit is heterogeneous in texture or if the sample is located within 300 mm of strata consisting of differing texture
and/or mineralogy. However, where samples are obtained throughout a vertical profile, consistent values of D r
based solely on laboratory measurements may evidence the homogeneity of the field and hence accuracy of Dr
values. Secondly, disequilibrium can force temporal instability in U and Th emissions. The impact of this infrequent
phenomenon (Olley et al., 1996) upon age estimates is usually insignificant given their associated margins of error.
However, for samples where this effect is pronounced (>50% disequilibrium between 238U and 226Ra; Fig. 5), the
resulting age estimates should be accepted tentatively. Thirdly, pedogenically-induced variations in matrix
composition of B and C-horizons, such as radionuclide and/or mineral remobilisation, may alter the rate of energy
emission and/or absorption. If D r is invariant through a dated profile and samples encompass primary parent
material, then element mobility is likely limited in effect. Fourthly, spatiotemporal detractions from present moisture
content are difficult to assess directly, requiring knowledge of the magnitude and timing of differing contents.
However, the maximum influence of moisture content variations can be delimited by recalculating Dr for minimum
(zero) and maximum (saturation) content. Finally, temporal alteration in the thickness of overburden alters cosmic Dr values. Cosmic Dr often forms a negligible portion of total D r. It is possible to quantify the maximum influence of
overburden flux by recalculating D r for minimum (zero) and maximum (surface sample) cosmic D r.
Estimation of Age Ages reported in Table 1 provide an estimate of sediment burial period based on mean De and D r values and their associated analytical uncertainties. Uncertainty in age estimates is reported as a product of
systematic and experimental errors, with the magnitude of experimental errors alone shown in parenthesis (Table 1).
Cumulative frequency plots indicate the inter-aliquot variability in age (Fig. 6). The maximum influence of temporal
variations in D r forced by minima-maxima in moisture content and overburden thickness is also illustrated in Fig.6.
Where uncertainty in these parameters exists this age range may prove instructive, however the combined extremes
represented should not be construed as preferred age estimates. The analytical validity of each sample is presented in
Table 2.
Analytical uncertainty All errors are based upon analytical uncertainty and quoted at 1 confidence. Error calculations account for the
propagation of systematic and/or experimental (random) errors associated with D e and Dr values. For De values, systematic errors are confined to laboratory source calibration. Uncertainty in this respect is that combined from the delivery of the calibrating dose (1.2%; NPL, pers. comm.), the conversion of this dose for SiO2 using the respective mass energy-absorption coefficient (2%; Hubbell, 1982) and experimental error, totalling 3.5%.
Mass attenuation and bremsstrahlung losses during dose delivery are considered negligible. Experimental errors
relate to D e interpolation using sensitisation corrected dose responses. Natural and regenerated sensitisation
corrected dose points(S) were quantified by,
Si = (Di - x.Li) / (di - x.L) Eq.1
where Di = Natural or regenerated OSL, initial 0.2 s Li = Background natural or regenerated OSL, final 5 s
D i= Test dose OSL, initial 0.2 s
x = Scaling factor, 0.08
The error on each signal parameter is based on counting statistics, reflected by the square-root of measured values.
The propagation of these errors within Eq. 1 generating Si follows the general formula given in Eq. 2. S were then
used to define fitting and interpolation errors within exponential plus linear regressions.
For D r values, systematic errors accommodate uncertainty in radionuclide conversion factors (5%), attenuation coefficients (5%), a-value (4%; derived from a systematic source uncertainty of 3.5% and experimental error), matrix
density (0.20 g.cm-3), vertical thickness of sampled section (specific to sample collection device), saturation moisture content (3%), moisture content attenuation (2%), burial moisture content (25% relative, unless direct evidence exists

502
of the magnitude and period of differing content) and NaI gamma spectrometer calibration (3%). Experimental errors
are associated with radionuclide quantification for each sample by NaI and Ge gamma spectrometry.
The propagation of these errors through to age calculation was quantified using the expression,
y ( y/ x) = ( (( y/ x n). xn)2)1/2 Eq. 2
where y is a value equivalent to that function comprising terms xn and where y and x n are associated uncertainties. Errors on age estimates are presented as combined systematic and experimental errors and experimental errors alone.
The former (combined) error should be considered when comparing luminescence ages herein with independent
chronometric controls. The latter assumes systematic errors are common to luminescence age estimates generated by
means identical to those detailed herein and enable direct comparison with those estimates.
503

504
Appendix 1.3 Footprint recording form
Site: Date: Track No:
Sketch and observations:
Coordinates: Area: Plan No: Level:
Species: Age: Gait: Part of trail?
Photography: Standard digital photograph taken: Photo No: Photogrammetry performed: Photo No: Photogrammetry model created? Model name:
Laser Scanning Performed? Model name:
Tracings: Small Large Digitised?
Cast taken? Orientation Block-lifted?
Micro-CT scanning performed? Info:
Features: Are any of them recognisable?
Drag marks: Skim marks: Skid marks: Overtraces:
Footprint: Marginal ridge: Interdigital ridge: Undertraces
Track dimensions in cm:
Further comments: Anything else of particular interest? Was the material the track found in tested for the type of particle size? Any presence of organic material? Was Forum sampled?

505
Appendix 2.1 Letter from the University of Reading Ethics Committee regarding their
favourable opinion of the footprint experiment involving humans
UREC 15/38: Understanding the relationship between a child’s age
and their footprint size. Favourable opinion Thank you for the response (email dated 22 September 2015 from Kirsten Barr, including attachments,
refers) addressing the issues raised by the UREC Sub-committee at its September 2015 meeting. On the
basis of these responses and the revised documentation, I can confirm that the Chair is pleased to confirm
a favourable ethical opinion.
Please note that the Committee will monitor the progress of projects to which it has given favourable
ethical opinion approximately one year after such agreement, and then on a regular basis until its
completion.
Please also find attached Safety Note 59: Incident Reporting in Human Interventional Studies at the
University of Reading, to be followed should there be an incident arising from the conduct of this
research.
The University Board for Research and Innovation has also asked that recipients of favourable ethical
opinions from UREC be reminded of the provisions of the University Code of Good Practice in Research.
A copy is attached and further information may be obtained here:
http://www.reading.ac.uk/internal/res/QualityAssuranceInResearch/reas-RSqar.aspx
Yours sincerely
Dr M J Proven
Coordinator for Quality Assurance in Research (UREC Secretary) cc: Dr John Wright (Chair); Dr Nick Branch (Head of School); Ms Kirsten Barr (PhD student)

506
Appendix 2.2 DBS check for Kirsten Barr

507
Appendix 2.3 Consent forms for footprint experiment
2.3.1 Consent form for adults and children over 16 consenting for themselves to take part in the
footprint experiment
Consent Form
Please initial the boxes to indicate your confirmation and consent of each statement:
I confirm that I have read the accompanying Information Sheet relating to the
project
I confirm that I have had explained to me the purpose of the project and what will
be required of me, and all my questions have been answered to my satisfaction. I
agree to the arrangements described in the Information Sheet in so far as they
relate to my participation.
I confirm my willingness to partake in this experiment.
I understand that participation is entirely voluntary and that I have the right to
withdraw from the project any time, and that this will be without detriment.
This application has been reviewed by the University of Reading Research Ethics Committee
and has been given a favourable ethical opinion for conduct.
I have received a copy of this Consent Form and of the accompanying Information Sheet.
Name: ………………………………………………………………………………
Date of birth: ………………………………………………………………………
Signed: ……………………………………………...………………………………
Date: ………………………………………………………...………………………

508
2.3.2 Consent form for adults consenting for their children for the footprint experiment
Consent Form
Please initial the boxes to indicate your confirmation and consent of each statement:
I confirm that I have read the accompanying Information Sheet
I confirm that I have had explained to me the purpose of the project and what will be
required of my child. Any questions that I have about the project have been answered
to my satisfaction. I agree to the arrangements described in the Information Sheet in
so far as they relate to my child’s participation.
I give consent for my child to partake in this experiment.
I understand that participation is entirely voluntary and that my child may withdraw
from the project any time, and that this will be without detriment.
This application has been reviewed by the University of Reading Research Ethics Committee
and has been given a favourable ethical opinion for conduct.
I have received a copy of this Consent Form and of the accompanying Information Sheet.
Name: ………………………………………………………………………………
Date of birth: ………………………………………………………………………
Signed: ……………………………………………...………………………………
Date: ………………………………………………………...………………………

509
Appendix 2.4 Information sheets for footprint experiment
2.4.1 Information sheet for children under 7 years old
Information sheet for minors (<7 years old)
Making Footprints
Hi, my name is Charlotte and this is my brother George
Kirsten Barr MSc Doctoral Research Student
07875381244
Allen Lab 1.11,
Department of Archaeology,
School of Archaeology, Geography and Environmental
Science
University of Reading
Reading RG6 6AH
Phone +44 (0) 118 378 8132
Email [email protected]
Web www.reading.ac.uk/archaeology
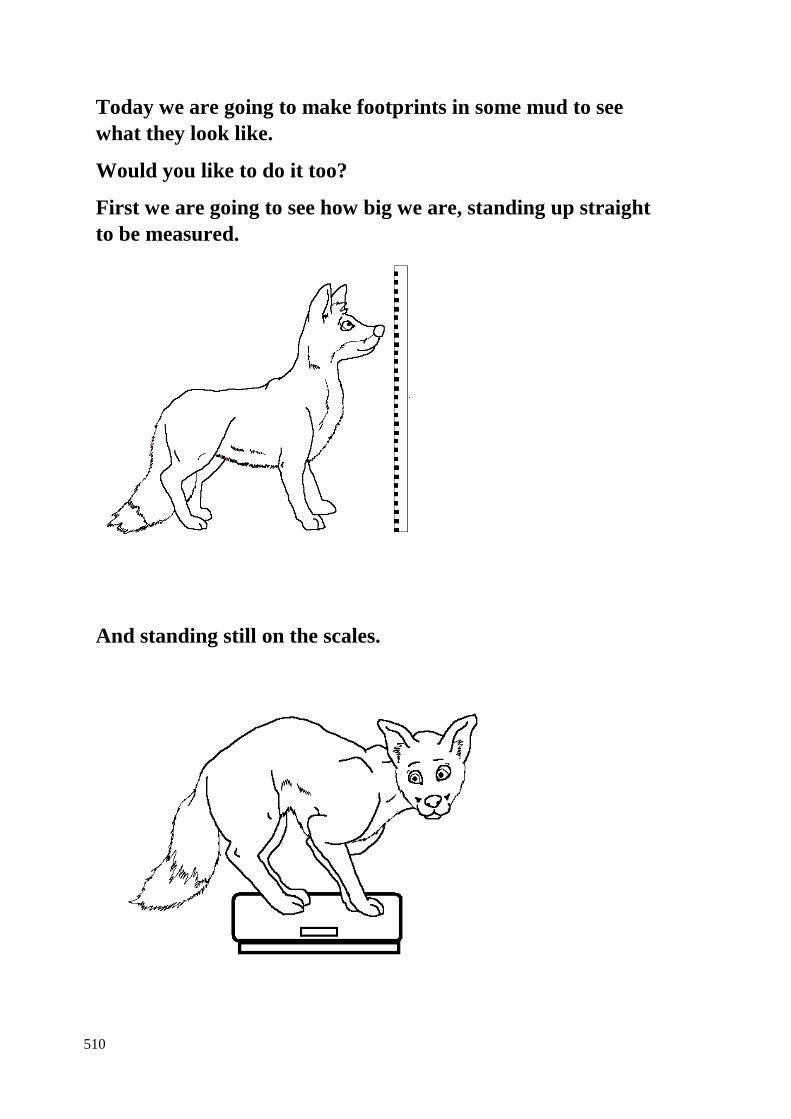
510
Today we are going to make footprints in some mud to see
what they look like.
Would you like to do it too?
First we are going to see how big we are, standing up straight
to be measured.
And standing still on the scales.
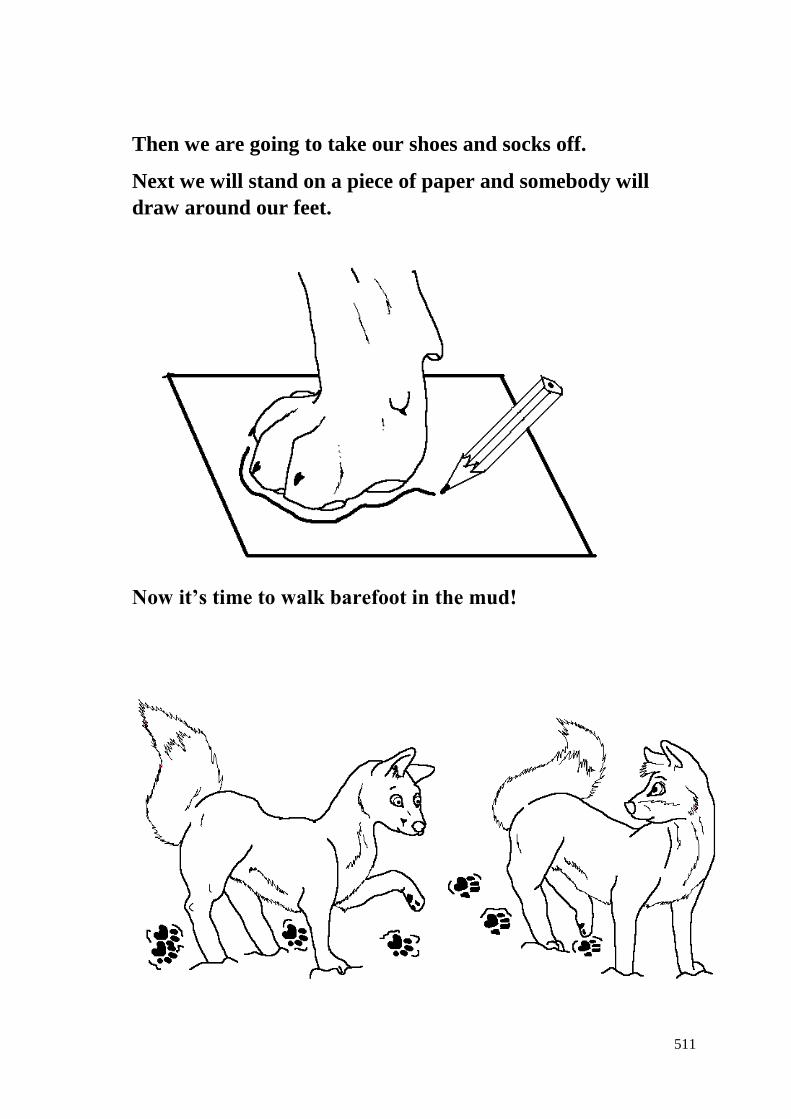
511
Then we are going to take our shoes and socks off.
Next we will stand on a piece of paper and somebody will
draw around our feet.
Now it’s time to walk barefoot in the mud!
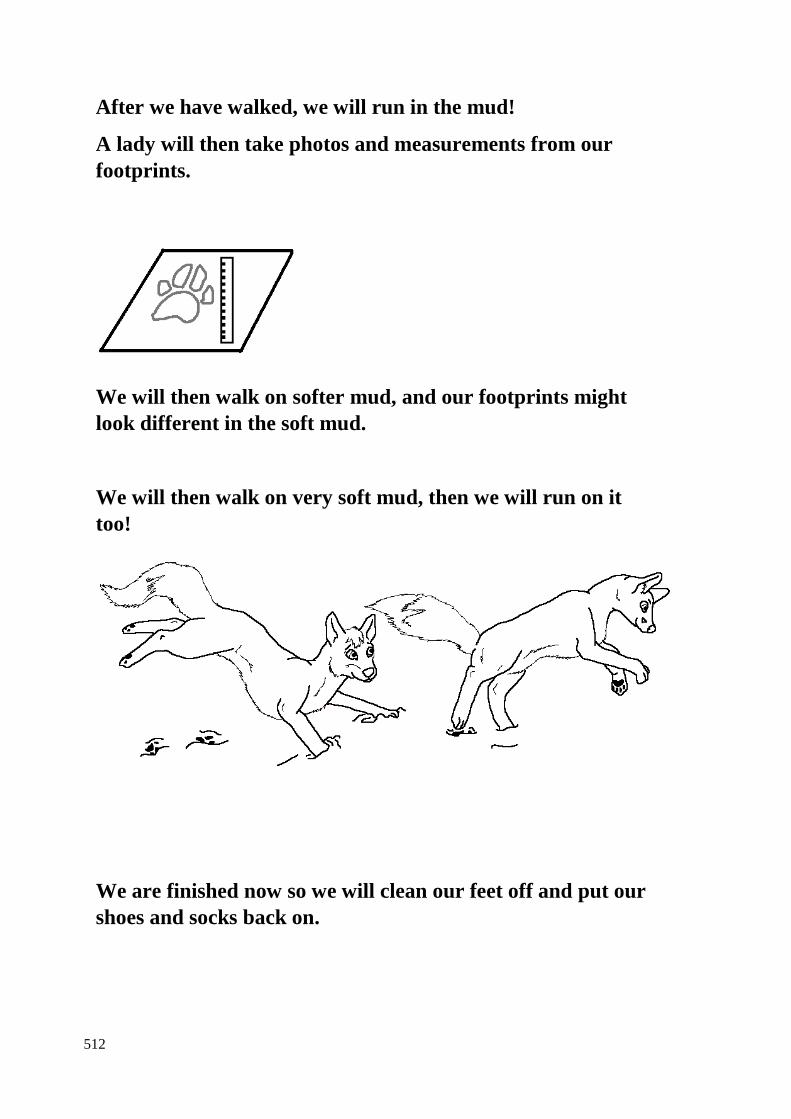
512
After we have walked, we will run in the mud!
A lady will then take photos and measurements from our
footprints.
We will then walk on softer mud, and our footprints might
look different in the soft mud.
We will then walk on very soft mud, then we will run on it
too!
We are finished now so we will clean our feet off and put our
shoes and socks back on.

513
2.4.2 Information sheet for children aged between 7 and 11 years old
Information sheet for minors (Age 7-11)
Making Footprints
Would you would like to take part in a research project?
Please read this information pack carefully with your parents so that everybody
understands why this study is being done and what it is we would like you to do.
If something doesn’t make sense, you can get your parents to contact me and we can
discuss it.
Thank you for taking the time to read this.
This research is being done to understand if the size of a person’s footprints can tell us
about their age and height.
Footprints from prehistoric people have been found in Wales and we are trying to find
out if we can look at the footprints of people today to help us understand how old and
how big prehistoric people were.
Children of the same age can be a lot of different heights and weights but we are trying
to find out if children of a similar age and height have similarly sized feet.
Why have I been asked to take part?
You have been asked to take part in this study as you are aged between 3 and 18 years,
and we are interested in footprints made by children.
Did anyone else check that this study is OK to do?
Before any research is allowed to go ahead a group of experts will discuss whether the
research is safe and fair.
Do I have to take part?
You don’t have to take part and can decide at any point throughout the study that you
no longer would like to be involved.
What will happen to me if I take part?
Once we have checked that you and your parents are happy with the project then we are
ready to start.
Kirsten Barr MSc Doctoral Research Student
07875381244
Allen Lab 1.11,
Department of Archaeology,
School of Archaeology, Geography and Environmental
Science
University of Reading
Reading RG6 6AH
Phone +44 (0) 118 378 8132
Email [email protected]
Web www.reading.ac.uk/archaeology
Information Sheet

514
The research will take place at your school/ childminding group/ after school club.
Everyone will be given a number instead of using their name.
We will measure your height and weight and ask you what shoe size you wear.
Then we will get you to remove your shoes and socks and stand up straight on a piece
of paper, we will draw around both your feet with a pencil, this will show us how big
your feet are and the shape of your feet.
There will be an area that we will get you to walk bare footed over, before you do this
we will have checked for anything sharp that could hurt your feet and removed it.
We will ask you to walk bare footed across a hard surface, if you make any footprints
we will photograph and measure them.

515
We will then ask you to run across the same surface to see if running changes the size
and shape of your footprints. Make sure you are careful when you run so that you don’t
slip up.
Next we will get you to walk over a softer, slightly muddy surface, we will record your
footprints. It is possible that you will create more footprints on this surface.
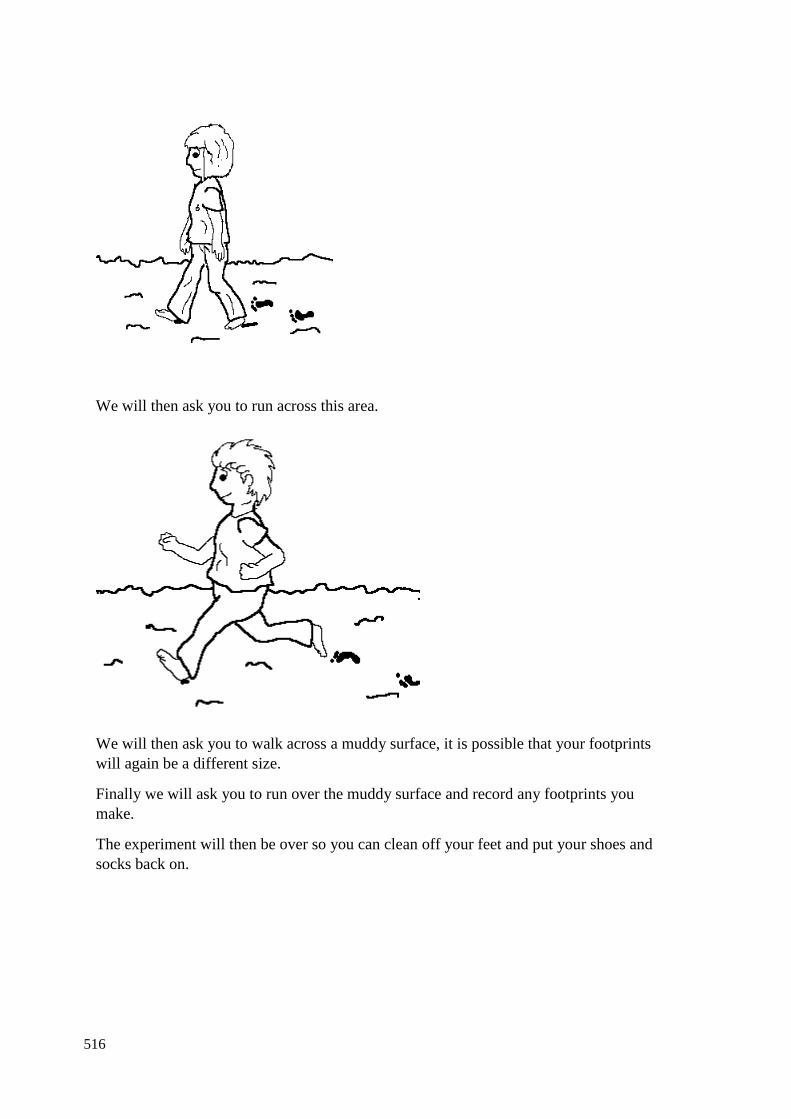
516
We will then ask you to run across this area.
We will then ask you to walk across a muddy surface, it is possible that your footprints
will again be a different size.
Finally we will ask you to run over the muddy surface and record any footprints you
make.
The experiment will then be over so you can clean off your feet and put your shoes and
socks back on.

517
Are there any risks?
All surfaces that you will be walking and running over will have been carefully checked
for anything that can hurt your feet, and you should walk and run on the mud carefully
so you don’t slip up.
What happens to the research?
The research will be written and talked about, you won’t be talked about directly, only
by the number you were given.
Will my information be kept private?
Yes all information will be private, you are given a number when you join the study for
your privacy.
What do I do if I don’t want to take part in the research?
At any time throughout the study you can decide that you no longer want to take part.
You can get your parents to phone or email the researcher or on the day of the
experiment you can tell the researcher you no longer want to take part.

518
2.4.3 Information sheet for children aged 12-15 years old
Making Footprints
I would like to ask whether you would be willing to take part in a research project.
Please read this information pack carefully with your parents so that everybody understands
why this study is being done and what it is we would like you to do.
If something doesn’t make sense, you can get your parents to contact me and we can discuss it.
Thank you for taking the time to read this.
This research is aiming to understand if the size of a person’s footprints can indicate the age and
height of the person who made them.
Footprints from prehistoric people have been found in Wales and we are trying to find out if we
can look at the footprints of people today to help us understand the age and height of prehistoric
people. Children of the same age can be a lot of different heights and weights, but we are trying
to find out if children of a similar age and height have similarly sized feet.
Why have I been asked to take part?
You have been asked to take part in this study as you are aged between 3 and 18 years, and we
are interested in the footprints made by young people.
Did anyone else check that this study is OK to do?
Before any research is allowed to go ahead a committee of experts will discuss whether the
research is safe and fair.
Do I have to take part?
You don’t have to take part and can decide at any point throughout the study that you no longer
would like to be involved.
What will happen to me if I take part?
Once we have checked that you and your parents are happy with the project then we are ready
to start.
Kirsten Barr MSc Doctoral Research Student
07875381244
Allen Lab 1.11,
Department of Archaeology,
School of Archaeology, Geography and Environmental
Science
University of Reading
Reading RG6 6AH
Phone +44 (0) 118 378 8132
Email [email protected]
Web www.reading.ac.uk/archaeology
Information Sheet

519
The research will take place at your school/ childminding group/ after school club.
Each person will be given a number instead of their name being used.
We will measure your height and weight and ask you what shoe size you wear.
Then we will get you to remove your shoes and socks and stand up straight on a piece of paper,
we will draw around both your feet with a pencil, this will show us the size of your feet and the
shape of your feet.
There will be an area that we will get you to walk bare footed over, before you do this we will
have checked for anything sharp that could hurt your feet and removed it.
We will ask you to walk bare footed across a hard surface, if you make any footprints we will
photograph and measure them. We will then ask you to run across the same surface to see if
running changes the size and shape of your footprints. Make sure you are careful when you run
so that you don’t slip up.
Next we will get you to walk over a softer, slightly muddy surface, we will record your
footprints. It is possible that you will create more footprints on this surface. We will then ask
you to run across this area.
We will ask you to walk across a muddy surface, it is possible that your footprints will again be
a different size. Finally we will ask you to run over the muddy surface and record any footprints
you make.
The experiment is now over so you can clean off your feet with the wet wipes, paper towels and
clean water, and then you can put your shoes and socks back on.
Are there any risks?
All surfaces that you will be walking and running over will have been carefully checked for
anything that can hurt your feet, you should walk and run on the mud carefully so you don’t slip
up.
What happens to the research?
Though the research will be written and talked about, you won’t be talked about directly, only
by the number that you were given.
Will my information be kept private?
Yes all information will be private, you are assigned a number when you join the study for your
privacy.
What do I do if I don’t want to take part in the research?
At any time during the study you can decide that you no longer want to take part. You can get
your parents to ring the researcher, or on the day of the experiment you can tell the researcher
you don’t want to take part anymore.

520
2.4.4 Information sheet for those over 16 years old consenting for themselves
Information Sheet
I would like to ask whether you would be willing to take part in a research project.
This project aims to understand the relationship between someone’s age and height and their
footprint size. The purpose of this research is to better understand prehistoric footprints that
have been found throughout the UK. Of the footprints recorded, between 70% and 80% are
fairly small, likely to have been created by children or young adults, so we are trying to
establish the age and size of the people from prehistory. Young people of the same age can be a
lot of different heights and weights but we are trying to find out if people of a similar age and
height have similarly sized feet.
Thank you for taking the time to read this.
Why have I been asked to take part?
You have been asked to take part in this study as you are aged between 3 and 18 years, and we
are interested in the footprints made by children and young adults.
Did anyone else check that this study is OK to do?
Before any research is allowed to go ahead the research will gain ethical approval from the
University Of Reading Ethics Research Committee who will decide that the research is safe.
Do I have to take part?
You don’t have to take part and can decide at any point throughout the study that you no longer
would like to be involved.
What will happen to me if I take part?
Once we have determined that you are happy with the project then we are ready to start the
footprint experiment. The research will take place at your school/ after school club. You will
remain anonymous throughout the whole project as you will be assigned a number.
We will ask you to remove your shoes and socks so that we can measure your height in
centimetres and your weight in kilograms, again this will all be anonymous. We will also ask
you what shoe sizes you wear.
After we have recorded your weight and height measurements you will be asked to stand up
straight on a piece of paper, we will then draw around both your feet with a pencil. This will
show us the size of your feet and the shape of your feet, and can be used as a comparison
against the footprints that you create.
Kirsten Barr MSc Doctoral Research Student
07875381244
Allen Lab 1.11,
Department of Archaeology,
School of Archaeology, Geography and Environmental
Science
University of Reading
Reading RG6 6AH
Phone +44 (0) 118 378 8132
Email [email protected]
Web www.reading.ac.uk/archaeology

521
The experimental area involves a surface approximately two and a half meters in length, filled
with sediment. We will ask you to walk barefoot over this area, before you do this we will have
checked for anything sharp that could hurt your feet and if anything is found we will remove it.
We will ask you to walk bare footed across the experimental hard surface, try to walk normally
and not alter the way that you usually walk. If you make any footprints we will photograph and
measure them. We will then ask you to run across the same surface to see if running changes
the size and shape of your footprints. Make sure you are careful when you run so that you don’t
slip up, again try to not alter the way in which you run.
Next we will ask you to walk over a softer, slightly muddy surface, we will record your
footprints. It is likely that your footprints will be different from the prints created previously.
We will then ask you to run across this area.
We will then ask you to walk across a muddy surface, it is possible that your footprints will
again be a different size. Finally we will ask you to run over the muddy surface and record any
footprints you make.
The repetitions of the experiment will now be complete so please clean your feet off using the
wet wipes, clean water and paper towels provided, then put your shoes and socks back on.
Are there any risks?
All surfaces that you will be walking and running over will have been carefully checked for
anything that can hurt your feet, and you should walk and run on the mud carefully so you don’t
slip up. Due to the potentially slippery surface there is a small risk of falling. We will have a
first aid kit on hand in case you do hurt your feet on something and we will be aware of the
location of the nearest hospital in the unlikely event of a severe accident.
In regards to your personal safety, all individuals involved with this project will have undergone
a full Disclosure and Barring Service check before they are permitted to become involved.
What happens to the research?
The research will be written about and presentations and talks may be given using this
information. You won’t be talked about directly, only by the number that you were assigned.
Will my information be kept private?
Yes all information will be private, you are assigned a number when you join the study for your
privacy.
What do I do if I don’t want to take part in the research?
At any time throughout the study you can decide that you no longer want to take part. You can
phone or email the researcher, or on the day of the experiment you can tell the researcher you
don’t want to take part anymore. At any moment throughout the experiment if you decide that
you do not want to be involved then tell the researcher, this is absolutely fine for you to do.

522
2.4.5 Information sheet for adults consenting for their children
Information Sheet
I would like to ask whether you would allow your child to take part in a PhD research project.
This project aims to understand the relationship between a person’s age and height and their
footprint size. The purpose of this research is to better understand prehistoric footprints that
have been found throughout the UK. We are trying to establish the age and size of the people
from prehistory; of the prehistoric footprints recorded, between 70% and 80% are fairly small,
likely to have been created by children or young adults. Children of the same age can be a lot of
different heights and weights but we are trying to find out if children of a similar age and height
have similarly sized feet. We will use the data gathered in this research to create a stature
equation that is directly relevant to footprints.
Thank you for taking the time to read this.
Why has my child been asked to take part?
Your child has been asked to take part in this study as they are aged between 3 and 16 years,
and we are interested in the footprints made by children and young adults. We are also
interested in footprints made by adults.
Did anyone else check that this study is appropriate?
Before we have undertaken any research we submitted the research to the University Of
Reading Ethics Research Committee and gained full approval.
Does my child have to take part?
Your child does not have to take part and you or your child can decide at any point throughout
the study that they no longer would like to be involved.
What will happen to my child if they take part?
Once we have determined that you are happy with the project then we are ready to start the
footprint experiment. The research will take place at your child’s school/childminders/ after
school club. Your child will remain anonymous throughout the whole project as they will be
assigned a number instead of any names or descriptions being used.
We will ask your child to remove their shoes and socks so that we can measure their height in
centimetres and their weight in kilograms, again this will all be anonymous. We will also ask
your child what shoe size they wear, or if they are very young we will ask you what size they
wear.
Kirsten Barr MSc Doctoral Research Student
07875381244
Allen Lab 1.11,
Department of Archaeology,
School of Archaeology, Geography and Environmental
Science
University of Reading
Reading RG6 6AH
Phone +44 (0) 118 378 8132
Email [email protected]
Web www.reading.ac.uk/archaeology

523
After we have taken the weight and height measurements your child will be asked to stand up
straight on a piece of paper, we will then draw around both their feet with a pencil. This will
show us the shape and size of their feet and can be used as a comparison against the footprints
that they create.
The experimental area involves a surface approximately two and a half meters in length, filled
with sediment. We will ask your child to walk bare footed over this area, before they do this we
will have checked for anything sharp that could hurt their feet and if anything is found we will
remove it immediately.
We will ask your child to walk bare footed across the experimental hard surface. While doing
so we will ask them questions as they walk to distract them from thinking about walking, this
will ensure that they walk normally and do not alter the way that they usually walk. If they
make any footprints we will photograph and measure them. We will then ask them to run across
the same surface to see if running changes the size and shape of the footprints. We will remind
your child to be careful when they are running so that they don’t slip up, again we will talk to
them to take their mind off running to try to prevent them from altering the way in which they
run.
Next we will ask your child to walk over a softer, slightly muddy surface, and record any
footprints created. It is likely that these footprints will be different from the prints created
previously. We will then ask your child to run across this area.
Finally we will ask your child to walk across a muddy surface, it is possible that the footprints
will again be a different size and shape. We will ask your child to run over the muddy surface
and record any further footprints made.
The experiment will now be complete so your child can then clean their feet off using the wet
wipes, clean water and paper towels provided, then they can put their shoes and socks back on.
Are there any risks?
All surfaces that your child will be walking and running over will have been carefully checked
for anything that can hurt their feet. Your child should walk and run on the mud carefully so
that they don’t slip up and hurt themselves. Due to the potentially slippery surface there is a
small risk of slipping and falling. We will have a first aid kit on hand in case they do hurt their
feet on something and we will be aware of the location of the nearest hospital in the unlikely
event of a severe accident.
In regards to your child’s personal safety, all individuals involved with this project will have
undergone a full Disclosure and Barring Service check before they are permitted to become
involved.
What happens to the research?
The research will be written about and presentations and talks may be given using this
information. Your child won’t be talked about directly, only by the number they were given.

524
Will the information be kept private?
Yes all information will be private, your child will be assigned a number when they join the
study for their privacy.
What do I do if I don’t want my child to take part in the research?
At any time throughout the study you can decide that you no longer want your child to take
part. You can phone or email the researcher or on the day of the experiment you can tell the
researcher you don’t want your child to take part any longer. At any moment throughout the
experiment if your child decides that they do not want to be involved then they can tell the
researcher, this is absolutely fine for them to do.
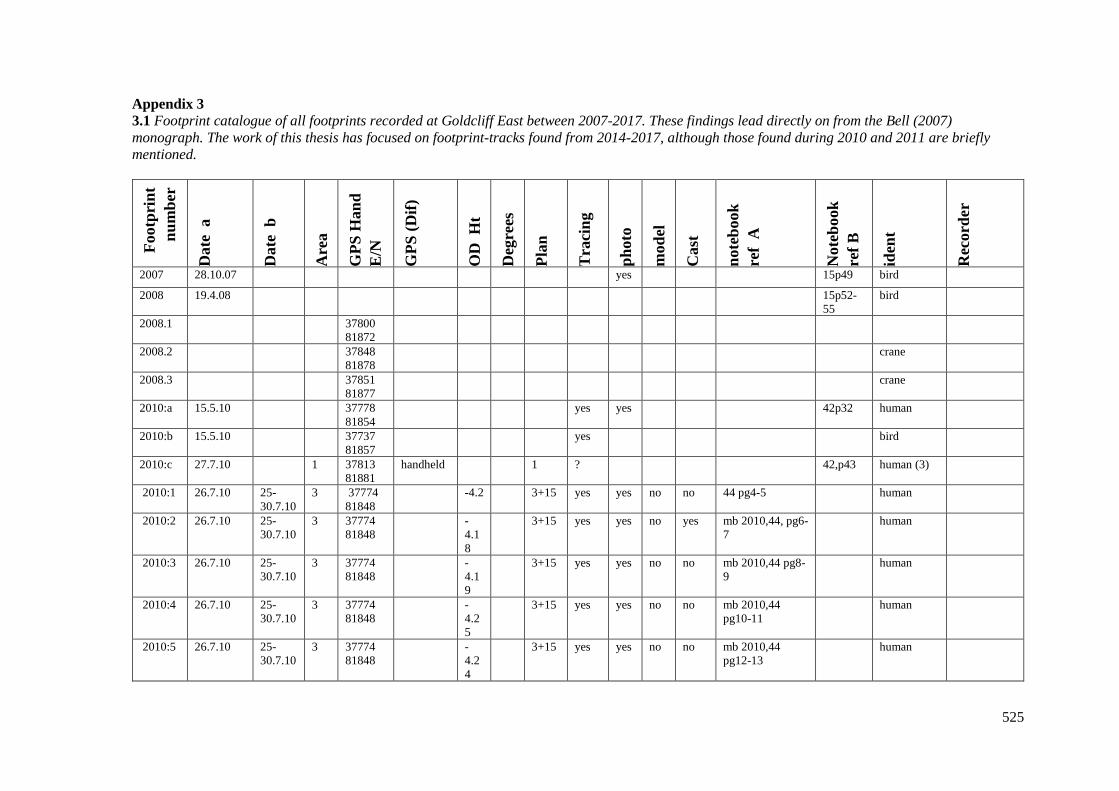
525
Appendix 3
3.1 Footprint catalogue of all footprints recorded at Goldcliff East between 2007-2017. These findings lead directly on from the Bell (2007)
monograph. The work of this thesis has focused on footprint-tracks found from 2014-2017, although those found during 2010 and 2011 are briefly
mentioned.
Footp
rin
t
nu
mb
er
Date
a
Date
b
Are
a
GP
S H
an
d
E/N
GP
S (
Dif
)
OD
H
t
Deg
rees
Pla
n
Tra
cin
g
ph
oto
mod
el
Cast
note
book
ref
A
Note
book
ref
B
iden
t
Rec
ord
er
2007 28.10.07
yes
15p49 bird
2008 19.4.08
15p52-
55
bird
2008.1
37800
81872
2008.2
37848
81878
crane
2008.3
37851
81877
crane
2010:a 15.5.10
37778
81854
yes yes
42p32 human
2010:b 15.5.10
37737
81857
yes
bird
2010:c 27.7.10
1 37813
81881
handheld
1 ?
42,p43 human (3)
2010:1 26.7.10 25-
30.7.10
3 37774
81848
-4.2
3+15 yes yes no no 44 pg4-5
human
2010:2 26.7.10 25-
30.7.10
3 37774
81848
-
4.1
8
3+15 yes yes no yes mb 2010,44, pg6-
7
human
2010:3 26.7.10 25-
30.7.10
3 37774
81848
-
4.1
9
3+15 yes yes no no mb 2010,44 pg8-
9
human
2010:4 26.7.10 25-
30.7.10
3 37774
81848
-
4.2
5
3+15 yes yes no no mb 2010,44
pg10-11
human
2010:5 26.7.10 25-
30.7.10
3 37774
81848
-
4.2
4
3+15 yes yes no no mb 2010,44
pg12-13
human
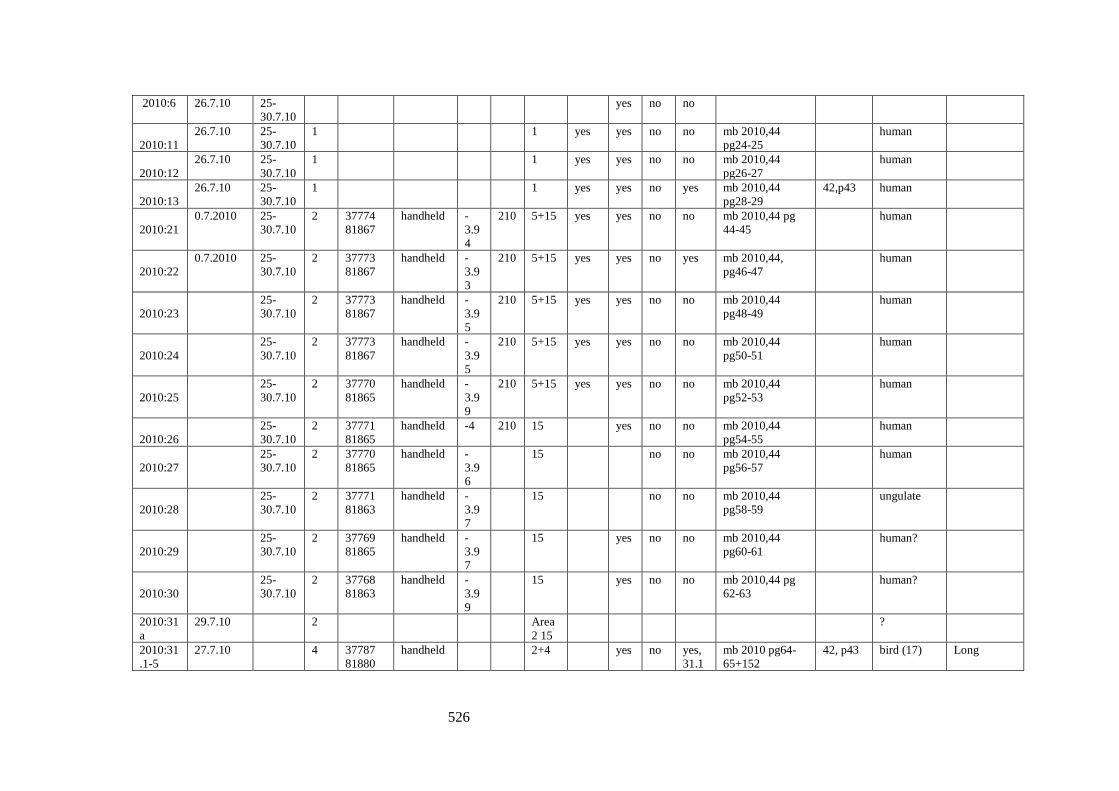
526
2010:6 26.7.10 25-
30.7.10
yes no no
2010:11
26.7.10 25-
30.7.10
1
1 yes yes no no mb 2010,44
pg24-25
human
2010:12
26.7.10 25-
30.7.10
1
1 yes yes no no mb 2010,44
pg26-27
human
2010:13
26.7.10 25-
30.7.10
1
1 yes yes no yes mb 2010,44
pg28-29
42,p43 human
2010:21
0.7.2010 25-
30.7.10
2 37774
81867
handheld -
3.9
4
210 5+15 yes yes no no mb 2010,44 pg
44-45
human
2010:22
0.7.2010 25-
30.7.10
2 37773
81867
handheld -
3.9
3
210 5+15 yes yes no yes mb 2010,44,
pg46-47
human
2010:23
25-
30.7.10
2 37773
81867
handheld -
3.9
5
210 5+15 yes yes no no mb 2010,44
pg48-49
human
2010:24
25-
30.7.10
2 37773
81867
handheld -
3.9
5
210 5+15 yes yes no no mb 2010,44
pg50-51
human
2010:25
25-
30.7.10
2 37770
81865
handheld -
3.9
9
210 5+15 yes yes no no mb 2010,44
pg52-53
human
2010:26
25-
30.7.10
2 37771
81865
handheld -4 210 15
yes no no mb 2010,44
pg54-55
human
2010:27
25-
30.7.10
2 37770
81865
handheld -
3.9
6
15
no no mb 2010,44
pg56-57
human
2010:28
25-
30.7.10
2 37771
81863
handheld -
3.9
7
15
no no mb 2010,44
pg58-59
ungulate
2010:29
25-
30.7.10
2 37769
81865
handheld -
3.9
7
15
yes no no mb 2010,44
pg60-61
human?
2010:30
25-
30.7.10
2 37768
81863
handheld -
3.9
9
15
yes no no mb 2010,44 pg
62-63
human?
2010:31
a
29.7.10
2
Area
2 15
?
2010:31
.1-5
27.7.10
4 37787
81880
handheld
2+4
yes no yes,
31.1
mb 2010 pg64-
65+152
42, p43 bird (17) Long

527
2010:32
.1-9
27.7.10
1 37820
81879
handheld
4 yes
no no mb 2010,44
pg66-67
bird (9) Long
2010:33
.1-2
25-
30.7.10
1
-
3.4
2
2 yes
no no mb 2010,44pg68-
69
44, p65 bird (2)
2010:34
xx.7.10 25-
30.7.10
37803
81841
handheld
yes no yes mb 2010,44pg70
bird
2010:43
xx.7.10 25-
30.7.10
37769
81862
handheld -4
no no mb 2010,44
pg88-89
human
2010:44
xx.7.10 25-
30.7.10
2 37769
81863
handheld -
4.0
1
15
no no mb 2010,44 pg90 42p55 birds
2010:45
xx.7.10 25-
30.7.10
37764
81861
handheld
no no mb 2010,44
pg92-93
human
2010:46
xx.7.10 25-
30.7.10
M5 37767
81855
handheld -
4.1
1
yes no no mb 2010,44
pg94-95
human
2010:47
xx.7.10 25-
30.7.10
M5 37768
81851
handheld -
4.2
2
yes no no mb 2010,44 pg96
human?
2010:48
xx.7.10 25-
30.7.10
M5 37768
81849
handheld -
4.2
4
197
no no mb 2010,44
pg98-99
42p112 human
2010:49
xx.7.10 25-
30.7.10
M5 37769
81855
handheld -
4.1
9
197
no no mb 2010,44 pg
100
42p112 ?
2010:50
xx.7.10 25-
30.7.10
M5 37769
81855
handheld -
4.1
8
197
no no mb 2010,44
pg102-103
42p112 human
2010:51
xx.7.10 25-
30.7.10
M5 37770
81857
handheld -
4.1
5
197
no no mb 2010,44
pg104-105
42p112 human
2010:52
xx.7.10 25-
30.7.10
M5 37781
81859
handheld -
4.1
5
197
no no mb 2010,44
pg106-107
42p112 human
2011:48
20.4.11 M5
15 +
28
yes
(52)
yes no
42p73,
95
human
2011:49
20.4.11 M5
15 +
28
yes
(52)
yes no
42p73,
95
human
2011:49
b
20.4.11 M5
15 +
28
yes
(52)
yes no
42p73,
95
human

528
2011:50
20.4.11 M5
Dif 355-8 -
4.6
3
15 +
28
yes
(52)
yes no
42p73,
95
human
2011:51
20.4.11 M5
Dif 347-
50
-4.6
15 +
28
yes
(52)
yes no
42p73,
95
human
2011:52
20.4.11 M5
Dif 339-
42
-
4.5
9
15 +
28
yes
(52)
yes no
42p73,
95
human
2011:53
yes no
human
2011:54
31.8.11
P
Dif ?54
yes no
43, p7 human
2011:55
31.8.11
P
Dif ?55
yes no
43, p7 human
2011.56 31.8.11
P
Dif?56
43, p7
2011.57 31.8.11
P
Dif ?57
43, p7
2011:60
31.8.11
N 37845
81817
Dif 187-
90
18 yes yes no
43.8-9;
mb2010,44p 108-
109
43, p8-9 human
2011:61
31.8.11
N 37845
81817
Dif 191-2
18 yes yes no
m.b.8-9;
mb2010, 44p109
43, p8-9 human
2011:62
31.8.11
N 37846
81817
Dif 193-6
18 yes yes no
m.b.8-9; mb
2010,44 pg110
43, p8-9 human
2011:63
31.8.11
N 37845
81818
Dif 197-
201
18 yes yes no
m.b.8-9; mb
2010,44 p111
43, p8-9 human
2011:64
31.8.11
N 37845
81817
Dif 202-5
18 yes yes no
m.b.8-9; mb
2010,44 p112
43, p8-9 human
2011:65
31.8.11
N 37845
81817
Dif 206-9
18 yes yes no
m.b.8-9; mb
2010,44 p113
43, p8-9 human
2011:66
31.8.11
N 37846
81817
Dif 210-
13
18 yes yes no
m.b.8-9; mb
2010,44 p114
43, p8-9 human
2011:67
31.8.11
N 37846
81817
Dif 214-
17
18 yes yes no
m.b.8-9; mb
2010,44 p114
43, p8-9 human
2011:68
31.8.11
N 37846
81813
Dif218-
21
18 yes yes no
m.b.8-9; mb
2010,44 p115
43, p8-9 human
2011:69
31.8.11
N 37847
81816
Dif161-4
18 yes yes no
m.b.8-9; mb
2010,44 p116
43, p8-9 human
2011:70
31.8.11
N 37846
81817
Dif159-
60
18 yes yes no
m.b.8-9; mb
2010,44 p117
43, p8-9 human
2011:71
31.8.11
N 37846
81817
Dif155-8
18 yes yes no
m.b.8-9; mb
2010,44 p118
43, p8-9 human

529
2011:72
31.8.11
N 37846
81817
Dif151-4
18 yes yes no
m.b.8-9; mb
2010,44 p119
43, p8-9 human
2011:73
31.8.11
N 37845
81819
Dif147-
50
18 yes yes no
m.b.8-9; mb
2010,44 p120
43, p8-9 human
2011:74 31.8.11
N 37848
31817
Dif143-6
18 yes yes no
m.b.8-9; mb
2010,44 p123
43, p8-9 human
2011:75 31.8.11
N 37848
31817
Dif139-
42
18 yes yes no
m.b.8-9; mb
2010,44 p123
43, p8-9 human
2011:76 31.8.11
N 37846
81819
Dif135-8
18 yes yes no
m.b.8-9; mb
2010,44 p124
43, p8-9 human
2011:77 31.8.11
N 37845
81818
Dif131-4
18 yes yes no
m.b.8-9; mb
2010,44 p125
43, p8-9 human
2011:78 31.8.11
N 37847
81821
Dif129-
30
18 yes yes no
m.b.8-9; mb
2010,44 p126
43, p8-9 human
2011:79 31.8.11
N 37846
81820
Dif126-8
18 yes yes no
m.b.8-9; mb
2010,44 p127
43, p8-9 ungulate?
2011:80 31.8.11
N 37847
81819
Dif122-5
18 yes yes no
m.b.8-9; mb
2010,44 p128
43, p8-9 human
2011:81 31.8.11
N 37846
81818
Dif112-
15
23 yes yes no
m.b.8-9; mb
2010,44 p129
43, p8-9 human
2011:82 31.8.11
N 37846
81818
Dif101-
111
23 yes yes no
m.b.8-9; mb
2010,44 p 130
43, p8-9 ungulate
2011:83 31.8.11
N 37848
81818
Dif107-
109
23 yes yes no
m.b.8-9; mb
2010,44 p 131
43, p8-9 human?
2011:84 31.8.11
N 37845
81818
Dif103-
106
23 yes yes no
m.b.8-9; mb
2010,44 p132
43, p8-9 human
2011:85 31.8.11
N 37846
81818
Dif99-
102
23 yes yes no
m.b.8-9; mb
2010,44 p123
43, p8-9 human
2011:86 31.8.11
N 37846
81820
Dif95-98
yes no
m.b.8-9; mb
2010,44 p134
43, p8-9 human
2011:87 31.8.11
N 37850
81822
Dif91-94
yes no
m.b.8-9; mb
2010,44 p135
43, p8-9 human
2011:88 31.8.11
N 37848
81820
Dif87-90
yes no
m.b.8-9; mb
2010,44 p136
43, p8-9 human
2011:89 31.8.11
N 37849
81820
Dif83-6 -
5.2
1
yes no
m.b.8-9; mb
2010,44 p137
43, p8-9 human
2011.91 31.8.11
37768
82082
Upper
Peat
yes
42p93 cow +
sheep
KB
2011.93 31.8.11
N 37848
81813
Dif 116-7
yes
m.b.8-9; mb
2010,44 p141
43p8-9 ungulate

530
2011:94 31.8.11
N 37849
81819
Dif 120-1
23 yes yes no
m.b.8-9; mb
2010,44 pg142
bird
2011:95 31.8.11
O 37824
81830
handheld
19 yes
no
mb 2010,44
pg143
42 bird
2011:96
37824
81841
Dif297
no
mb 2010,44 p144 43, p18-
19
bird
2011.97 31.8.11
Upper
Peat
yes
42p93 sheep KB
2011:98 30.8.11 2.9.11 O 37825
81840
20 yes
mb 2011,45 p2
bird
2011:99 31.8.11
N
Dif222-5
yes
(51)
yes
mb 2011,43
pg14-15
human?
2011:10
0
31.8.11
N
Dif226-9
23 yes yes
mb 2011,43
pg14-15
human?
2011:10
1
31.8.11
N
Dif230-3
23 yes yes
mb 2011,43
pg14-15
human?
2011:10
2
31.8.11
N
Dif234-7
23 yes yes
mb 2011,43
pg14-15
human?
2011:10
3
31.8.11
N
Dif238-9,
?241
23 yes yes
mb 2011,43
pg14-15
human?
2011:10
4
31.8.11
N
Dif242-5
23 yes yes
mb 2011,43
pg14-15
human?
2011:10
5
31.8.11
N
Dif414-
17
23 yes yes
mb 2011,43
pg14-15
human?
2011:10
6
31.8.11
N
23 yes yes
mb 2011,43
pg14-15
human?
2011:10
7
31.8.11
N
23 yes yes
mb 2011,43
pg14-15
human?
2011:10
8
31.8.11
N
30 yes yes
mb 2011,43
pg14-15
human?
2011:10
9
31.8.11
N
30 yes yes
mb 2011,43
pg14-15
human?
2011:11
0
31.8.11
N
30 yes yes
mb 2011,43
pg14-15
human?
2011:11
1
31.8.11
N
30 yes yes
mb 2011,43
pg14-15
human?
2011:11
2
31.8.11
N
30 yes yes
mb 2011,43
pg14-15
human?
2011:11
3
31.8.11
N
30 yes
(51)
yes
mb 2011,43
pg14-15
human?
2011:11
4
31.8.11
N
Dif246-9
30 yes
(51)
mb 2011,43
pg14-15
human?

531
2011:11
5
31.8.11
N
Dif250-1
30 yes
(51)
mb 2011,43
pg14-15
human?
2011:11
6
31.8.11
N
Dif252-5
23 yes
(51)
mb 2011,43
pg14-15
human?
2011:11
7
31.8.11
N
Dif418-
21
23 yes
(51)
mb 2011,43
pg14-15
human?
2011:11
8
31.8.11
N
yes
(51)
mb 2011,43 pg22
2011:11
9
31.8.11
N
30 yes
(51)
mb 2011,43 pg22
human?
2011:12
0
31.8.11
N
30 yes
mb 2011,43 pg22
human?
2011:12
1
31.8.11
N
30 yes
mb 2011,43 pg22
human?
2011:12
2
31.8.11
N
30 yes
mb 2011,43 pg22
human?
2011:12
3
31.8.11
N
30 yes
mb 2011,43 pg22
human?
2011:12
4
31.8.11
N
30 yes
mb 2011,43 pg22
human?
2011:12
5
31.8.11
N
30 yes
mb 2011,43 pg22
human?
2011:12
6
31.8.11
N
Dif 390-3
30 yes
mb 2011,43 pg22
human
2011:12
7
31.8.11
N
Dif385-8
30 yes
mb 2011,43 pg22
ungulate
2011:12
8
31.8.11
N
Dif381-4
30 yes
mb 2011,43 pg22
ungulate
2011:12
9
31.8.11
N
Dif377-
80
30 yes
mb 2011,43 pg22
human
2011:13
0
31.8.11
Oi6
Dif282/40
8-9
-
5.2
1
mb 2011,43pg19
bird
2011:13
1
31.8.11
Oi7 37828
81839
Dif290-3 -
5.2
5
21 yes
mb 2011,43
pg16-17
human
2011:13
2
31.8.11
Oi7 37828
81839
Dif294-7 -
5.2
7
21 yes
mb 2011,43
pg16-17
human
2011:13
3
31.8.11
Oi7 37828
81839
Dif298-9 -
5.2
1
21 yes
mb 2011,43
pg16-17
human L. Snape

532
2011:13
4
31.8.11
Oi7 37828
81839
Dif300-3 -
5.1
8
21 yes
mb 2011
,43pg16-17
42p94 human L. Snape
2011:13
5
31.8.11
Oi7 37828
81839
Dif304-7 -5.2
21 yes
mb 2011,43pg16-
17
42p94 human
2011:13
6
31.8.11
Oi7 37828
81839
Dif308-
11
-
5.1
9
21 yes
mb 2011,43
pg16-17
42p94 human
2011:13
7
31.8.11
Oi7 37828
81839
Dif312-
15
-
5.1
7
mb 2011,43
pg16-17
42p94 bird
2011.13
7a
31.8.11
Oi7
Dif406 -
5.3
6
43p16-
17
bird
2011.13
7b
31.8.11
Oi7
Dif407 -
5.3
3
43p16-
17
bird
2011:13
8
31.8.11
M6 37781
81848
Dif363-5 -
4.7
6
mb 2011,43pg24-
25
42p95/4
5p11
human
2011:13
9
31.8.11
M6 37771
81842
Dif366-9 -
4.8
9
mb 2011,43
pg24-25
42p95/4
5p11
human
2011:14
0.1-8
31.8.11
Oi5
b
37815
81860
25 yes
42p94 bird
2011:14
2
31.8.11
Oi2
Dif398-
401
-
5.2
9
29 yes
mb 2011,43 pg19
bird L.Snape
2011:14
3
31.8.11
Oi2
Dif402-
5/410-13
-
5.2
8
29 yes
mb 2011,43 pg19
bird L.Snape
2011.14
3A
19.4.11
Oi4
Dif271 -
5.3
4
bird
2011.14
4C
19.4.11
Oi1
Dif262 -
5.0
04
4.4 yes
human
2011.14
5D
19.4.11
Oi1
cDif263 -
4.9
63
4.4 yes
human

533
2011.14
6E
19.4.11
Oi1
cDif264 -
4.9
44
4.4 yes
human L.Snape
2011.14
7F
19.4.11
Oi1
cDif262 -
5.0
04
4.5 yes
human
2011:15
0
31.8.11
M
Dif335-8 -
4.5
9
15 +
28
yes
mb 2011,43
pg24-25
43, p19 human L.Snape
2011 Fig 4.5
2011:15
1
31.8.11
M
Dif331-4 -
4.5
7
15
+28
yes
mb 2011,43
pg24-25
human L.Snape
2011 Fig 4.5
2011:15
2
31.8.11
M
Dif351-4 -
5.3
4
15 +
27
yes
yes mb 2011,43
pg24-25
42p95 human
(Lola)
L.Snape
2011 Fig 4.5
2011:15
3
31.8.11 + 17.8.12 M5
Dif327-
30
15 +
28
yes yes
mb 2011,43
pg24-25
42p95 human
2011:15
4
31.8.11 + 17.8.12 M5
Dif323-6
28 yes yes
mb 2011,43
pg24-25
42p95 human
2011:15
5
31.8.11 + 17.8.12
Dif343-6
28 yes
mb 2011,43
pg24-25
human
2011:15
6
31.8.11 + 17.8.12 M5
a
Dif359-
60
28 yes
mb 2011,43
pg24-25
ungulate
2011:15
7
31.8.11 + 17.8.12 M9 37781
81848
Dif371-
4/?370-3
15 yes
(48)
mb 2011,43 pg98 42p98 human
2011:15
8
31.8.11
M9
/3
3778
81850
yes
(49)
mb 2011,43
pg24-25
human
2011:15
9
31.8.11
M8
Dif422-5
yes
(50)
no
43p26 human
2011:16
0a
31.8.11
M8
Dif426-9
yeas
(50)
no
43p26 human
2011?:
160b
2011 + 31.8.12 M5
Dif 101-3
15
KB 31.8.12
human
2011:16
1a
18.4.12
7
?Dif160-5
15
?
2011?:1
61
2011 + 31.8.12 M5
Dif 104-6
KB 31.8.12
human
2011:16
2a
18.4.12
?M
7
37791
81842
Dif101-
116
yes
(46)
yes
42p62-3 human
2011?:1
62
2011 + 31.8.12 M5 37792
81838
Dif 107-8
yes
(52)
no
KB 31.8.12
human

534
2011:16
3a
18.4.12
M7 37791
81843
?Dif101-
116
yes
(46)
yes
42 p62 human
2011?:1
63
2011 + 31.8.12 M5
?Dif109-
12
yes
(52)
no
KB 31.8.12 42p62-4 human
2011.16
3C
18.4.2011
37828
81855
sketc
h
yes
(47)
42 p63 human
2011.16
3D
18.4.2011
37828
81855
42 p 63 human
2011.16
3E
18.4.2011
human
2011.16
3F
18.4.2011
37794
81843
sketc
h
42 p 62 bird
2011:16
4
2.9.11 +31.8.12 F/5
Dif13-14
15
yes
?
yes yes mb 2011,42
pg98-99
42p98-9 human
2011.16
4a
F
2011:16
5
2.9.11
F
Dif115-
16
yes
?
yes yes mb 2011,42
pg98-99
42p98-9 human
2011.16
5a
F
MB 31.8.12, KB
31.8.12
2011.16
6-178
2.9.11
N
yes
?
42p100/
45p35
?human
2011.17
9
31.8.12
none no
yes
?
42 p 99
human
2011:20
0
Dif430-5
yes
2011:20
1
Dif430-5
yes
2011:20
2
Dif430-5
yes
42,p100
?human
2011:20
3
12-13.9.11
Dif464
yes yes no
mb 2011,43
pg28-29
bird
2011:20
4
12-13.9.11
Dif464
yes yes no
mb 2011,43
pg28-29
bird
2011:20
5
12-13.9.11
Dif467
yes yes no
mb 2011,43
pg28-29
human
2011:20
6
12-13.9.11
yes yes no
2011:20
7
12-13.9.11
yes yes no
2011:20
8
12-13.9.11
yes yes no
bird

535
2011:20
9
Dif476-7
yes no
mb 2011,43
pg28-29
human
2011:21
0
Dif478-9
yes no
mb 2011,43
pg28-29
human
2011:21
1
Dif470-
81?
yes no
mb 2011,43
pg28-29
human
2011:21
2
Dif482-3
yes no
mb 2011,43
pg28-29
human
2011:21
3
Dif484-5
yes no
mb 2011,43
pg28-29
human
2011:21
4
12-13.9.11
Dif486-7
yes no
mb 2011,43
pg28-29
human
2011:21
5
12-13.9.11
yes no
mb 2011,43
pg30-31
bird
2011:21
6
mb 2011,43
pg30-31
human
2011:21
7
mb 2011,43
pg30-31
human
2011:21
8
mb 2011,43
pg30-31
bird
2011:21
9
37864
81999
handheld
yes no yes mb 2011,43
pg30-31
human &
bird
2011:A:
220
37791
81843
handheld
yes
mb 2011 pg24-25
human
2011:B
221
37791
81842
handheld
yes
mb 2011 pg24-25
human
2011:C:
222
37791
81842
handheld
yes
mb 2011 pg24-25
human
2011:D:
223
37791
81842
handheld
yes
mb 2011 pg24-25
human
2011:E:
224
37791
81842
handheld
yes
mb 2011 pg24-25
human
2011:F:
225
37791
81842
handheld
yes
mb 2011 pg24-25
huamn
2011:22
6
31.8.11
S
Dif375-6
43p21-2 birds
2012.1
37868
81892
yes yes
43,p41 deer
2012.2
37868
81892
yes yes
43p41 deer
2012.3
37869
81897
yes yes
yes
43p41 birds

536
2012.4
37881
81902
yes
43p41 birds
2012:35
yes no
human
2013:29
a
S 37810
81836
yes no
43p44 human
2013:30
a
S 37809
81837
yes no
43p44 human
2014:2
yes no
human
2014:6
no
bird
2014:7
yes no
human
2014:9
yes no
human
2014:22
yes no
human
2014:24
yes no
human
2014:60
a
1.2.14
37790
81873
handheld 210
°
mb 2011 pg128 42p128 human
2014:71 17.7.14
S 37800
81840
yes yes
48p142 human
2014:72 17.7.14
S 37800
81840
yes yes
48p142 human
2014:73 17.7.14
O 37823
81846
bird
2014:74 17.7.14
N 37851
81814
yes yes
human
2014:30
0
E 37905
81921
handheld
yes yes no no kb.1 pg1-2 43p62 bird
2014:30
1
22.11.14
E 37905
81922
handheld
yes yes no no kb.1 pg1-2 43p62 bird
2014:30
2
differential GPS
no yes yes no no kb.1 pg1-2
bird
2014:30
3
differential GPS
no yes yes no no kb.1 pg1-2
bird
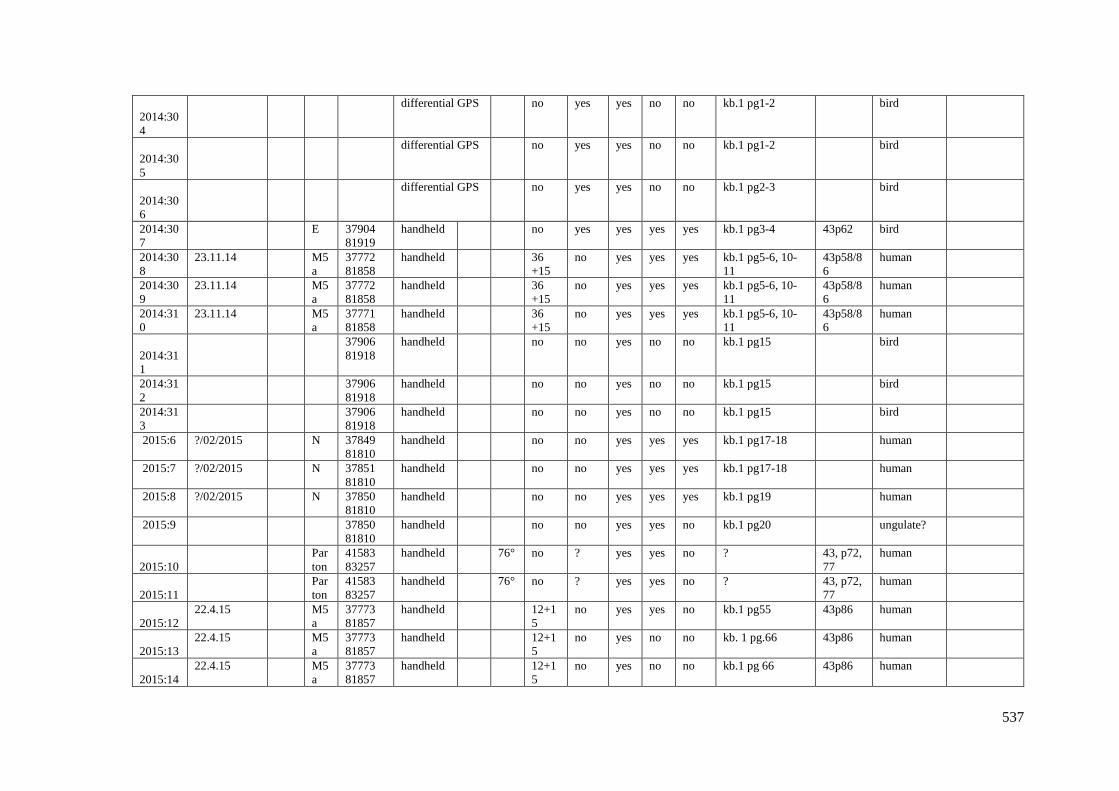
537
2014:30
4
differential GPS
no yes yes no no kb.1 pg1-2
bird
2014:30
5
differential GPS
no yes yes no no kb.1 pg1-2
bird
2014:30
6
differential GPS
no yes yes no no kb.1 pg2-3
bird
2014:30
7
E 37904
81919
handheld
no yes yes yes yes kb.1 pg3-4 43p62 bird
2014:30
8
23.11.14
M5
a
37772
81858
handheld
36
+15
no yes yes yes kb.1 pg5-6, 10-
11
43p58/8
6
human
2014:30
9
23.11.14
M5
a
37772
81858
handheld
36
+15
no yes yes yes kb.1 pg5-6, 10-
11
43p58/8
6
human
2014:31
0
23.11.14
M5
a
37771
81858
handheld
36
+15
no yes yes yes kb.1 pg5-6, 10-
11
43p58/8
6
human
2014:31
1
37906
81918
handheld
no no yes no no kb.1 pg15
bird
2014:31
2
37906
81918
handheld
no no yes no no kb.1 pg15
bird
2014:31
3
37906
81918
handheld
no no yes no no kb.1 pg15
bird
2015:6 ?/02/2015
N 37849
81810
handheld
no no yes yes yes kb.1 pg17-18
human
2015:7 ?/02/2015
N 37851
81810
handheld
no no yes yes yes kb.1 pg17-18
human
2015:8 ?/02/2015
N 37850
81810
handheld
no no yes yes yes kb.1 pg19
human
2015:9
37850
81810
handheld
no no yes yes no kb.1 pg20
ungulate?
2015:10
Par
ton
41583
83257
handheld
76° no ? yes yes no ? 43, p72,
77
human
2015:11
Par
ton
41583
83257
handheld
76° no ? yes yes no ? 43, p72,
77
human
2015:12
22.4.15
M5
a
37773
81857
handheld
12+1
5
no yes yes no kb.1 pg55 43p86 human
2015:13
22.4.15
M5
a
37773
81857
handheld
12+1
5
no yes no no kb. 1 pg.66 43p86 human
2015:14
22.4.15
M5
a
37773
81857
handheld
12+1
5
no yes no no kb.1 pg 66 43p86 human

538
2015:15
22.4.15
M5
a
37773
81857
handheld
12+1
5
no yes no no kb.1 pg66 43p86 human
2015:16
37852
81810
handheld
no no yes yes no kb.1 pg56-63
bird
2015:17
19-21.4.15
N 37852
81810
handheld
yes no yes yes no kb.1 pg56-63 43p81-2 human
2015:18
19-21.4.15
N 37853
81809
handheld
yes no yes yes no kb.1 pg56-63 43p81-2 human
2015:19
19-21.4.15
N 37853
81809
handheld
yes no yes yes yes kb.1 pg56-63 43p81-2 bird
2015:20
19-21.4.15
N 37855
81810
handheld
yes no yes yes no kb.1 pg56-63 43p81-2 human
2015:27
37852
81810
handheld
no no yes no no kb. 1 pg64
human
2015:28
37852
81810
handheld
no no yes no no kb. 1 pg64
human
2015
deer
37852
81812
handheld
no no yes no no kb. 1 pg64
ungulate
2015.40
a
18.5.15
M3
a
36
2015:42
22.4.15
N 37852
81812
handheld
no no yes no no kb. 1 pg69
human
2015:43
22.4.15
N 37852
81812
handheld
no no yes no no kb.1 pg69
ungulate
2015:44
22.4.15
N 37852
81812
handheld
no no yes no no kb.1 pg69
ungulate
2015:45
22.4.15
N 37852
81812
handheld
no no yes no no kb.1 pg69-70
ungulate
2015:46
37770
81858
handheld
no no yes no no kb.1 pg62-63
large and
small bird
2015:53
18.5.15
M5
a
differential GPS
36.15 no yes no no kb.1 pg84-85 43 p87 human and
bird
2015:54
18.5.15
M5
a
differential GPS
no no yes no no kb.1 pg84-85 43 p87 human
2015:87 13.9.15
?E 37864
81894
handheld
no no yes yes yes kb.1 pg96, 146-
147
43p88, bird
2015:88 13.9.15
37872
81894
handheld
no no yes no no kb.1 pg97 43p89 human
2015:89 13.9.15
37873
81894
handheld
no no yes no no kb.1 pg97 43p89 human
2015:90
a
13.9.15
C/E 37850
81883
handheld
no no yes no no kb.1 pg99 41, p 1 bird

539
2015:10
6
14.9.15
C/E
no no yes no no kb.1 pg102-103 43p93-
4,
human
2015:10
7
14.9.15
C/E
no no yes no no kb.1 pg102-103 43p93-
4,
human
2015:11
2
28.9.15
37376
81904
handheld
no no yes no no kb.1 pg108-109 43, p 95 bird
2015:11
3
28.9.15
37916
81920
handheld
no no yes no no kb.1 pg108-109 43p95 bird
2015:11
4
28.9.15
37881
81904
handheld
no no yes no no kb.1 pg110-112 43p95 human
2015:11
5
28.9.15
37883
81903
handheld
no no yes no no kb.1 pg110-112 43, p 95 human
2015:11
5a
28.9.15
C/E
yes
human
2015:11
6
30.9.15
C 37853
81899
handheld
no no yes yes yes kb.1 pg 126-130 43p98 human
2015:11
7
30.9.15
C 37853
81899
handheld
no no yes yes yes kb.1 pg126-130 43p98 human
2015:11
8
30.9.15
C 37853
81899
handheld
no no yes yes no kb.1 pg126-130 43p98 human
2015:11
9
30.9.15
C 37849
81897
handheld
no no yes yes no kb.1 pg126-130 43p98 human?
2015:12
0
30.9.15
C 37849
81897
handheld
no no yes yes no kb.1 pg126-130 43p98 human?
2015:12
1
30.9.15
C 37849
81897
handheld
no no yes yes no kb.1 pg138-139 43p98 human
2015:12
2
30.9.15
C 37849
81897
handheld
no no yes yes yes kb.1 pg138-139 43p98 human
2015:12
3
30.9.15
C 37849
81897
handheld
no no yes yes yes kb.1 pg138-139 43p98 human
2015:12
7
27.10.15
37852
81900
handheld
no no yes yes no kb.1 pg140-142 43p99 human and
bird
2015:human and bird
37883
81905
handheld
no no yes yes no kb.1 pg150-151
human and
bird
2015:130
37849
81885
handheld
no no yes yes no kb.1 pg152-153
bird
2015:131a 27.11.1
5
37889
81916
handheld
no no yes no no kb.2 pg3 43p103 oystercatch
er
2015:131
37867
81891
handheld
no no yes yes yes kb.2 pg4
human
2015:132 27.11.1
5
E c37870
81892
handheld
yes yes
43p101-
2
human
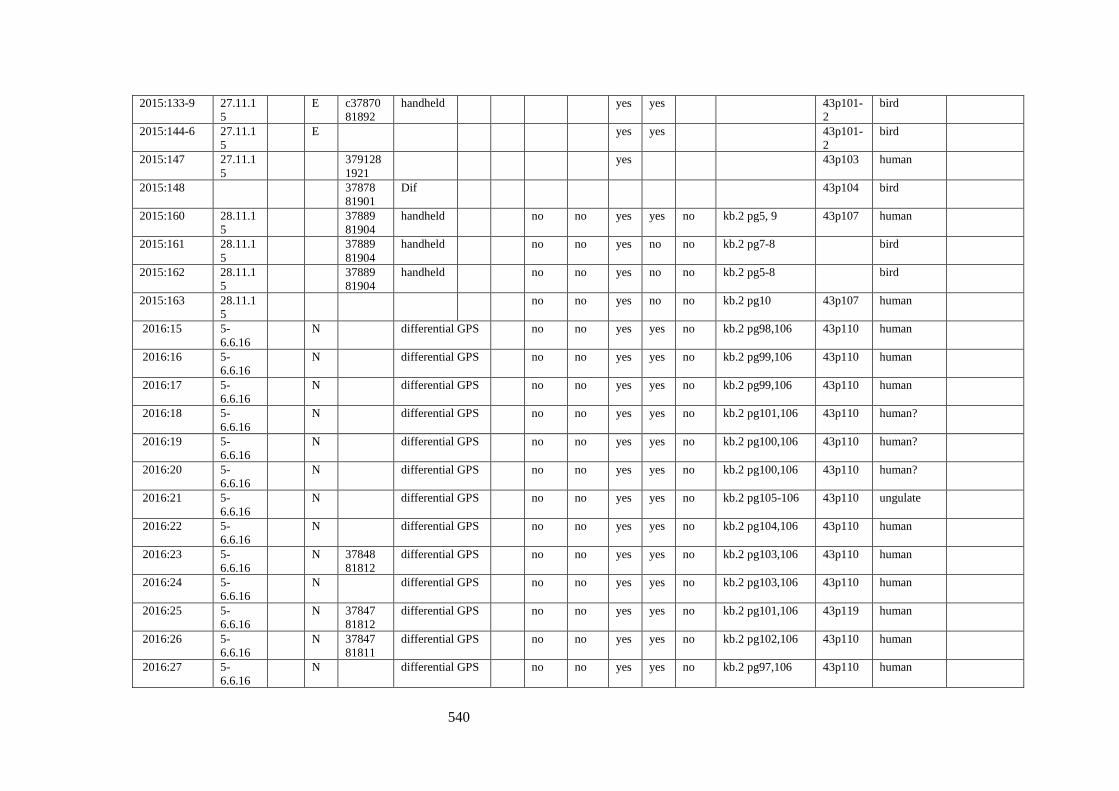
540
2015:133-9 27.11.1
5
E c37870
81892
handheld
yes yes
43p101-
2
bird
2015:144-6 27.11.1
5
E
yes yes
43p101-
2
bird
2015:147 27.11.1
5
379128
1921
yes
43p103 human
2015:148
37878
81901
Dif
43p104 bird
2015:160 28.11.1
5
37889
81904
handheld
no no yes yes no kb.2 pg5, 9 43p107 human
2015:161 28.11.1
5
37889
81904
handheld
no no yes no no kb.2 pg7-8
bird
2015:162 28.11.1
5
37889
81904
handheld
no no yes no no kb.2 pg5-8
bird
2015:163 28.11.1
5
no no yes no no kb.2 pg10 43p107 human
2016:15 5-
6.6.16
N
differential GPS
no no yes yes no kb.2 pg98,106 43p110 human
2016:16 5-
6.6.16
N
differential GPS
no no yes yes no kb.2 pg99,106 43p110 human
2016:17 5-
6.6.16
N
differential GPS
no no yes yes no kb.2 pg99,106 43p110 human
2016:18 5-
6.6.16
N
differential GPS
no no yes yes no kb.2 pg101,106 43p110 human?
2016:19 5-
6.6.16
N
differential GPS
no no yes yes no kb.2 pg100,106 43p110 human?
2016:20 5-
6.6.16
N
differential GPS
no no yes yes no kb.2 pg100,106 43p110 human?
2016:21 5-
6.6.16
N
differential GPS
no no yes yes no kb.2 pg105-106 43p110 ungulate
2016:22 5-
6.6.16
N
differential GPS
no no yes yes no kb.2 pg104,106 43p110 human
2016:23 5-
6.6.16
N 37848
81812
differential GPS
no no yes yes no kb.2 pg103,106 43p110 human
2016:24 5-
6.6.16
N
differential GPS
no no yes yes no kb.2 pg103,106 43p110 human
2016:25 5-
6.6.16
N 37847
81812
differential GPS
no no yes yes no kb.2 pg101,106 43p119 human
2016:26 5-
6.6.16
N 37847
81811
differential GPS
no no yes yes no kb.2 pg102,106 43p110 human
2016:27 5-
6.6.16
N
differential GPS
no no yes yes no kb.2 pg97,106 43p110 human
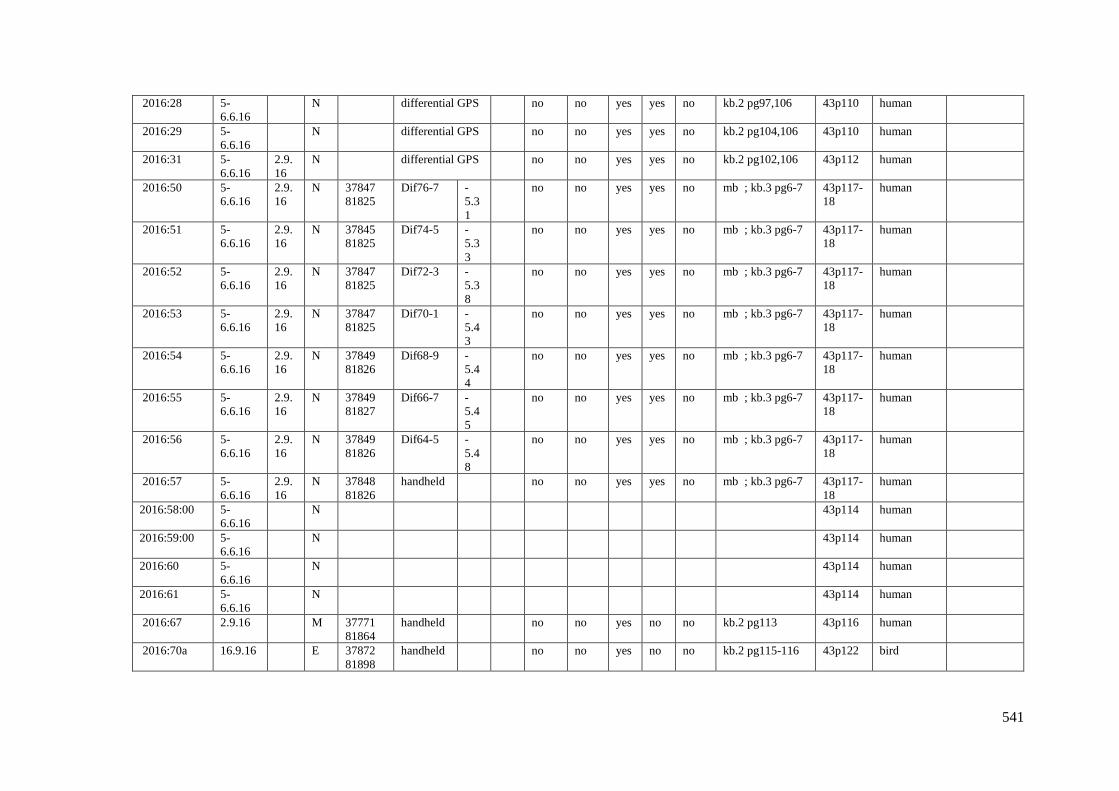
541
2016:28 5-
6.6.16
N
differential GPS
no no yes yes no kb.2 pg97,106 43p110 human
2016:29 5-
6.6.16
N
differential GPS
no no yes yes no kb.2 pg104,106 43p110 human
2016:31 5-
6.6.16
2.9.
16
N
differential GPS
no no yes yes no kb.2 pg102,106 43p112 human
2016:50 5-
6.6.16
2.9.
16
N 37847
81825
Dif76-7 -
5.3
1
no no yes yes no mb ; kb.3 pg6-7 43p117-
18
human
2016:51 5-
6.6.16
2.9.
16
N 37845
81825
Dif74-5 -
5.3
3
no no yes yes no mb ; kb.3 pg6-7 43p117-
18
human
2016:52 5-
6.6.16
2.9.
16
N 37847
81825
Dif72-3 -
5.3
8
no no yes yes no mb ; kb.3 pg6-7 43p117-
18
human
2016:53 5-
6.6.16
2.9.
16
N 37847
81825
Dif70-1 -
5.4
3
no no yes yes no mb ; kb.3 pg6-7 43p117-
18
human
2016:54 5-
6.6.16
2.9.
16
N 37849
81826
Dif68-9 -
5.4
4
no no yes yes no mb ; kb.3 pg6-7 43p117-
18
human
2016:55 5-
6.6.16
2.9.
16
N 37849
81827
Dif66-7 -
5.4
5
no no yes yes no mb ; kb.3 pg6-7 43p117-
18
human
2016:56 5-
6.6.16
2.9.
16
N 37849
81826
Dif64-5 -
5.4
8
no no yes yes no mb ; kb.3 pg6-7 43p117-
18
human
2016:57 5-
6.6.16
2.9.
16
N 37848
81826
handheld
no no yes yes no mb ; kb.3 pg6-7 43p117-
18
human
2016:58:00 5-
6.6.16
N
43p114 human
2016:59:00 5-
6.6.16
N
43p114 human
2016:60 5-
6.6.16
N
43p114 human
2016:61 5-
6.6.16
N
43p114 human
2016:67 2.9.16
M 37771
81864
handheld
no no yes no no kb.2 pg113 43p116 human
2016:70a 16.9.16
E 37872
81898
handheld
no no yes no no kb.2 pg115-116 43p122 bird
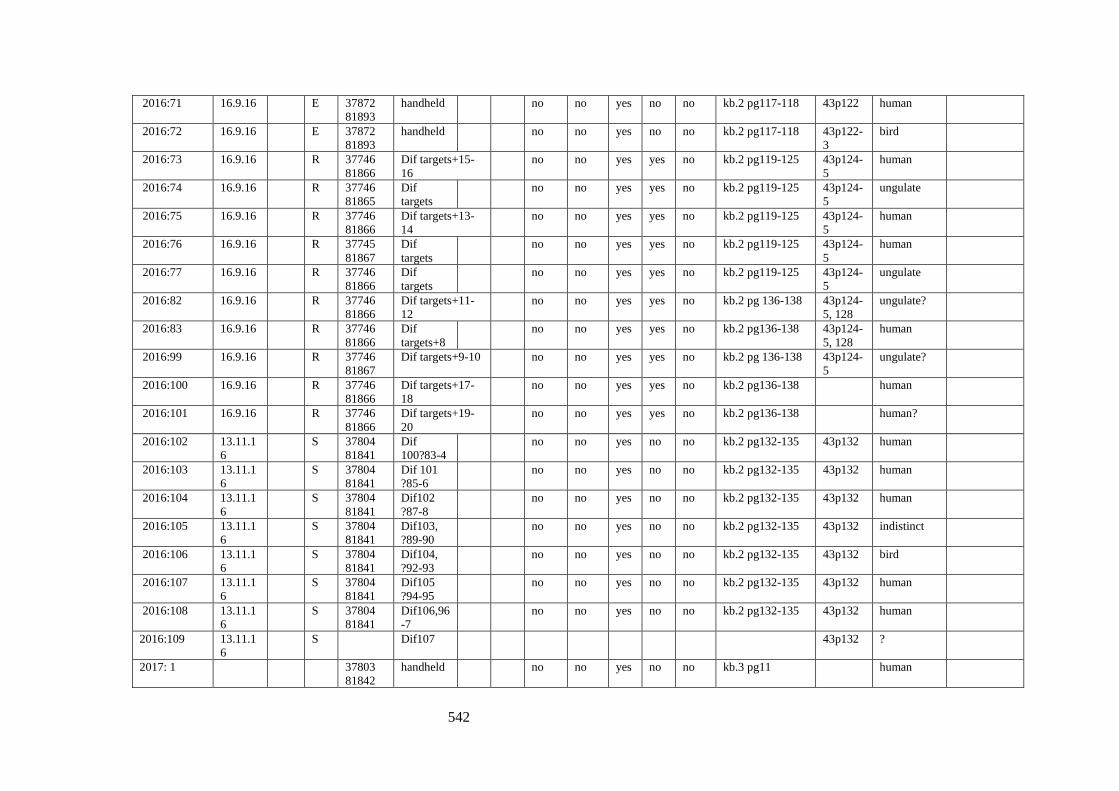
542
2016:71 16.9.16
E 37872
81893
handheld
no no yes no no kb.2 pg117-118 43p122 human
2016:72 16.9.16
E 37872
81893
handheld
no no yes no no kb.2 pg117-118 43p122-
3
bird
2016:73 16.9.16
R 37746
81866
Dif targets+15-
16
no no yes yes no kb.2 pg119-125 43p124-
5
human
2016:74 16.9.16
R 37746
81865
Dif
targets
no no yes yes no kb.2 pg119-125 43p124-
5
ungulate
2016:75 16.9.16
R 37746
81866
Dif targets+13-
14
no no yes yes no kb.2 pg119-125 43p124-
5
human
2016:76 16.9.16
R 37745
81867
Dif
targets
no no yes yes no kb.2 pg119-125 43p124-
5
human
2016:77 16.9.16
R 37746
81866
Dif
targets
no no yes yes no kb.2 pg119-125 43p124-
5
ungulate
2016:82 16.9.16
R 37746
81866
Dif targets+11-
12
no no yes yes no kb.2 pg 136-138 43p124-
5, 128
ungulate?
2016:83 16.9.16
R 37746
81866
Dif
targets+8
no no yes yes no kb.2 pg136-138 43p124-
5, 128
human
2016:99 16.9.16
R 37746
81867
Dif targets+9-10
no no yes yes no kb.2 pg 136-138 43p124-
5
ungulate?
2016:100 16.9.16
R 37746
81866
Dif targets+17-
18
no no yes yes no kb.2 pg136-138
human
2016:101 16.9.16
R 37746
81866
Dif targets+19-
20
no no yes yes no kb.2 pg136-138
human?
2016:102 13.11.1
6
S 37804
81841
Dif
100?83-4
no no yes no no kb.2 pg132-135 43p132 human
2016:103 13.11.1
6
S 37804
81841
Dif 101
?85-6
no no yes no no kb.2 pg132-135 43p132 human
2016:104 13.11.1
6
S 37804
81841
Dif102
?87-8
no no yes no no kb.2 pg132-135 43p132 human
2016:105 13.11.1
6
S 37804
81841
Dif103,
?89-90
no no yes no no kb.2 pg132-135 43p132 indistinct
2016:106 13.11.1
6
S 37804
81841
Dif104,
?92-93
no no yes no no kb.2 pg132-135 43p132 bird
2016:107 13.11.1
6
S 37804
81841
Dif105
?94-95
no no yes no no kb.2 pg132-135 43p132 human
2016:108 13.11.1
6
S 37804
81841
Dif106,96
-7
no no yes no no kb.2 pg132-135 43p132 human
2016:109 13.11.1
6
S
Dif107
43p132 ?
2017: 1
37803
81842
handheld
no no yes no no kb.3 pg11
human

543
2017: 2
37803
81842
handheld
no no yes no no kb.3 pg11
human
2017:3
37802
81842
handheld
no no yes no no kb.3 pg11
human

544
Appendix 3.2 Plan of footprint Sites R, M, S and O and their relationship to each other and the
topography. Plan by M.Bell and J.Foster
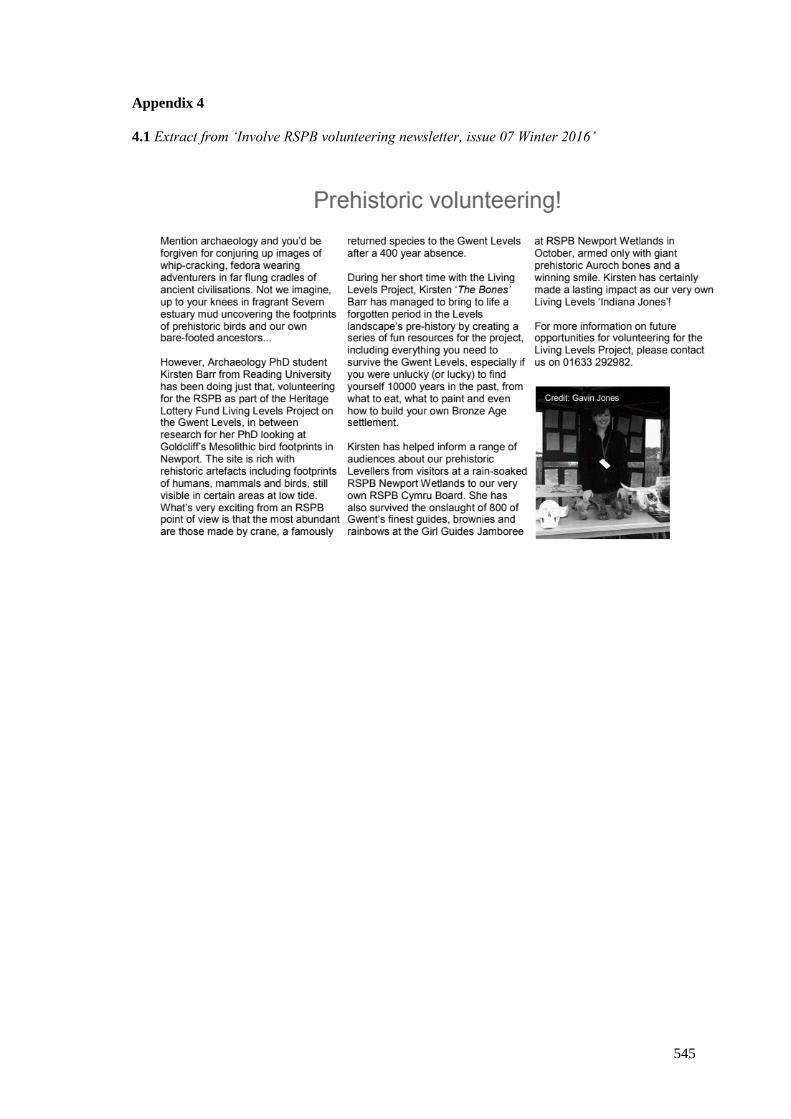
545
Appendix 4
4.1 Extract from ‘Involve RSPB volunteering newsletter, issue 07 Winter 2016’

546
Appendix 4.2 Prehistoric Heritage Trail by the author for the Living Levels Landscape
Partnership
Prehistoric Heritage Trail
By Kirsten Barr
Newport Wetlands, Newport, Wales. Aerial view, August 2007
Credit Line: David Wootton (rspb-images.com)
Introduction
The Gwent Levels are an extensive low lying area rich in sites of archaeology and
history. The area is easily reached, with central Newport less than 6 miles from the
RSPB Wetlands reserve, and the M4 (junction 25) a mere 9.5 miles away. The
countryside in this area is beautiful, once you leave central Newport you will be
surrounded by wildlife, cows and sheep.
If using public transport there are excellent rail links to Newport train station, there is
also a bus service from Newport Central Bus Station (63) directly to the RSPB wetlands
reserve, this is a demand responsive bus so does need to be booked
http://www.newportbus.co.uk .
The heritage trail begins at the RSPB Newport Wetlands centre and then carries on
along the coastal path; evidence of the prehistory of the area has survived on the tidal
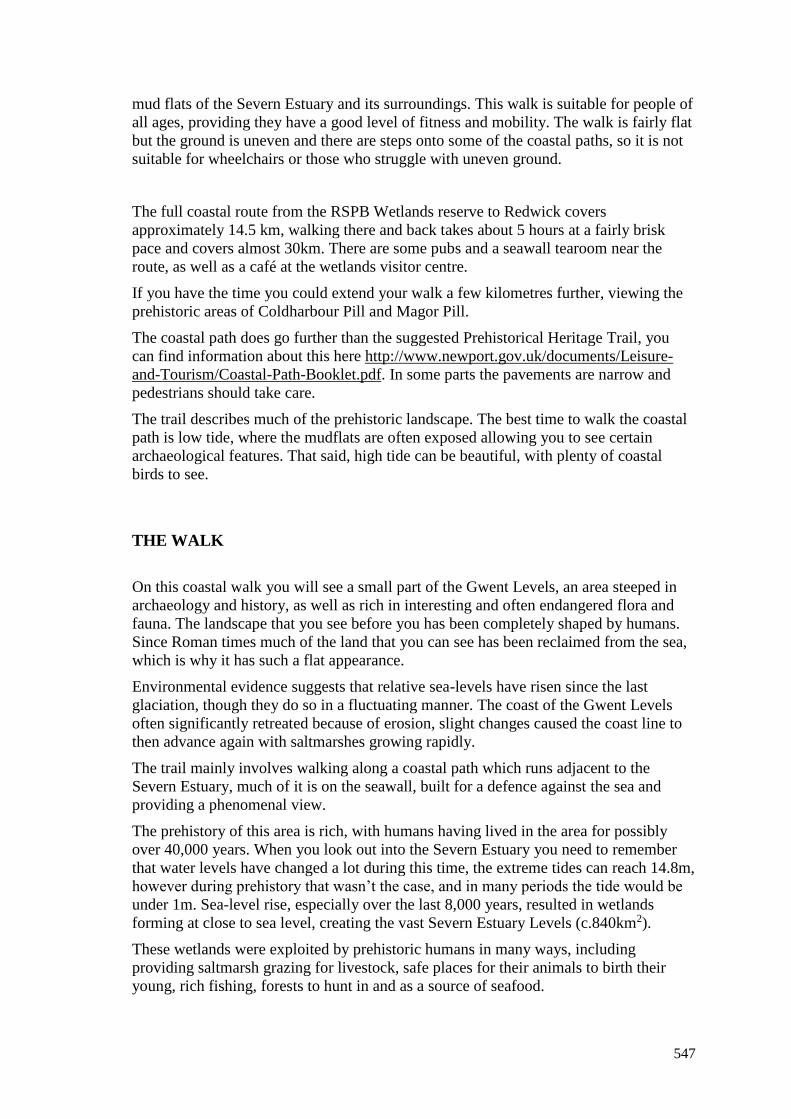
547
mud flats of the Severn Estuary and its surroundings. This walk is suitable for people of
all ages, providing they have a good level of fitness and mobility. The walk is fairly flat
but the ground is uneven and there are steps onto some of the coastal paths, so it is not
suitable for wheelchairs or those who struggle with uneven ground.
The full coastal route from the RSPB Wetlands reserve to Redwick covers
approximately 14.5 km, walking there and back takes about 5 hours at a fairly brisk
pace and covers almost 30km. There are some pubs and a seawall tearoom near the
route, as well as a café at the wetlands visitor centre.
If you have the time you could extend your walk a few kilometres further, viewing the
prehistoric areas of Coldharbour Pill and Magor Pill.
The coastal path does go further than the suggested Prehistorical Heritage Trail, you
can find information about this here http://www.newport.gov.uk/documents/Leisure-
and-Tourism/Coastal-Path-Booklet.pdf. In some parts the pavements are narrow and
pedestrians should take care.
The trail describes much of the prehistoric landscape. The best time to walk the coastal
path is low tide, where the mudflats are often exposed allowing you to see certain
archaeological features. That said, high tide can be beautiful, with plenty of coastal
birds to see.
THE WALK
On this coastal walk you will see a small part of the Gwent Levels, an area steeped in
archaeology and history, as well as rich in interesting and often endangered flora and
fauna. The landscape that you see before you has been completely shaped by humans.
Since Roman times much of the land that you can see has been reclaimed from the sea,
which is why it has such a flat appearance.
Environmental evidence suggests that relative sea-levels have risen since the last
glaciation, though they do so in a fluctuating manner. The coast of the Gwent Levels
often significantly retreated because of erosion, slight changes caused the coast line to
then advance again with saltmarshes growing rapidly.
The trail mainly involves walking along a coastal path which runs adjacent to the
Severn Estuary, much of it is on the seawall, built for a defence against the sea and
providing a phenomenal view.
The prehistory of this area is rich, with humans having lived in the area for possibly
over 40,000 years. When you look out into the Severn Estuary you need to remember
that water levels have changed a lot during this time, the extreme tides can reach 14.8m,
however during prehistory that wasn’t the case, and in many periods the tide would be
under 1m. Sea-level rise, especially over the last 8,000 years, resulted in wetlands
forming at close to sea level, creating the vast Severn Estuary Levels (c.840km2).
These wetlands were exploited by prehistoric humans in many ways, including
providing saltmarsh grazing for livestock, safe places for their animals to birth their
young, rich fishing, forests to hunt in and as a source of seafood.
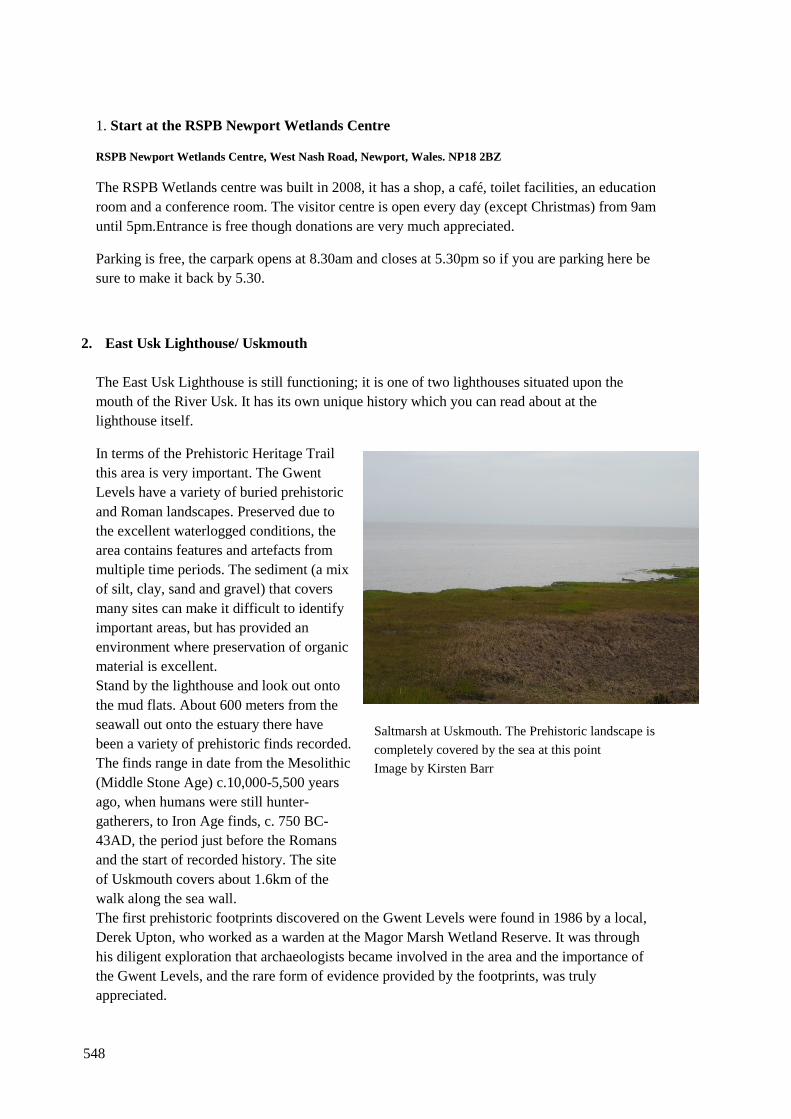
548
1. Start at the RSPB Newport Wetlands Centre
RSPB Newport Wetlands Centre, West Nash Road, Newport, Wales. NP18 2BZ
The RSPB Wetlands centre was built in 2008, it has a shop, a café, toilet facilities, an education
room and a conference room. The visitor centre is open every day (except Christmas) from 9am
until 5pm.Entrance is free though donations are very much appreciated.
Parking is free, the carpark opens at 8.30am and closes at 5.30pm so if you are parking here be
sure to make it back by 5.30.
2. East Usk Lighthouse/ Uskmouth
The East Usk Lighthouse is still functioning; it is one of two lighthouses situated upon the
mouth of the River Usk. It has its own unique history which you can read about at the
lighthouse itself.
In terms of the Prehistoric Heritage Trail
this area is very important. The Gwent
Levels have a variety of buried prehistoric
and Roman landscapes. Preserved due to
the excellent waterlogged conditions, the
area contains features and artefacts from
multiple time periods. The sediment (a mix
of silt, clay, sand and gravel) that covers
many sites can make it difficult to identify
important areas, but has provided an
environment where preservation of organic
material is excellent.
Stand by the lighthouse and look out onto
the mud flats. About 600 meters from the
seawall out onto the estuary there have
been a variety of prehistoric finds recorded.
The finds range in date from the Mesolithic
(Middle Stone Age) c.10,000-5,500 years
ago, when humans were still hunter-
gatherers, to Iron Age finds, c. 750 BC-
43AD, the period just before the Romans
and the start of recorded history. The site
of Uskmouth covers about 1.6km of the
walk along the sea wall.
The first prehistoric footprints discovered on the Gwent Levels were found in 1986 by a local,
Derek Upton, who worked as a warden at the Magor Marsh Wetland Reserve. It was through
his diligent exploration that archaeologists became involved in the area and the importance of
the Gwent Levels, and the rare form of evidence provided by the footprints, was truly
appreciated.
Saltmarsh at Uskmouth. The Prehistoric landscape is
completely covered by the sea at this point
Image by Kirsten Barr
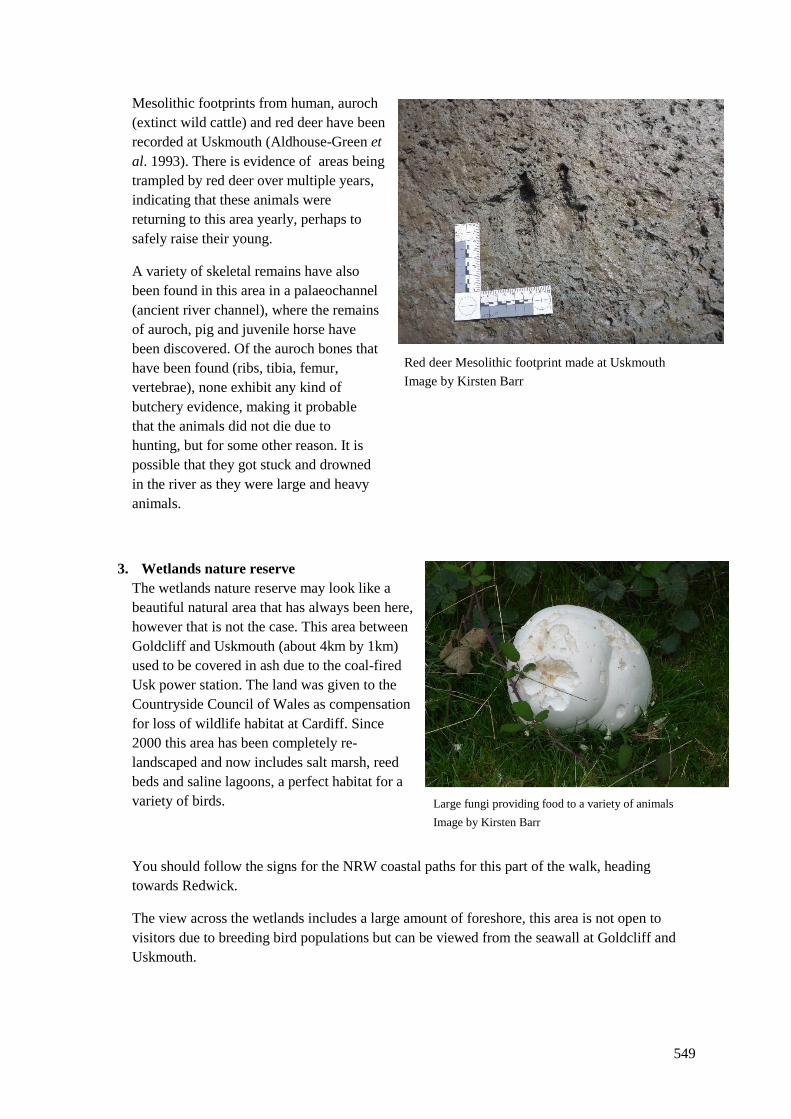
549
Mesolithic footprints from human, auroch
(extinct wild cattle) and red deer have been
recorded at Uskmouth (Aldhouse-Green et
al. 1993). There is evidence of areas being
trampled by red deer over multiple years,
indicating that these animals were
returning to this area yearly, perhaps to
safely raise their young.
A variety of skeletal remains have also
been found in this area in a palaeochannel
(ancient river channel), where the remains
of auroch, pig and juvenile horse have
been discovered. Of the auroch bones that
have been found (ribs, tibia, femur,
vertebrae), none exhibit any kind of
butchery evidence, making it probable
that the animals did not die due to
hunting, but for some other reason. It is
possible that they got stuck and drowned
in the river as they were large and heavy
animals.
3. Wetlands nature reserve
The wetlands nature reserve may look like a
beautiful natural area that has always been here,
however that is not the case. This area between
Goldcliff and Uskmouth (about 4km by 1km)
used to be covered in ash due to the coal-fired
Usk power station. The land was given to the
Countryside Council of Wales as compensation
for loss of wildlife habitat at Cardiff. Since
2000 this area has been completely re-
landscaped and now includes salt marsh, reed
beds and saline lagoons, a perfect habitat for a
variety of birds.
You should follow the signs for the NRW coastal paths for this part of the walk, heading
towards Redwick.
The view across the wetlands includes a large amount of foreshore, this area is not open to
visitors due to breeding bird populations but can be viewed from the seawall at Goldcliff and
Uskmouth.
Red deer Mesolithic footprint made at Uskmouth
Image by Kirsten Barr
Large fungi providing food to a variety of animals
Image by Kirsten Barr
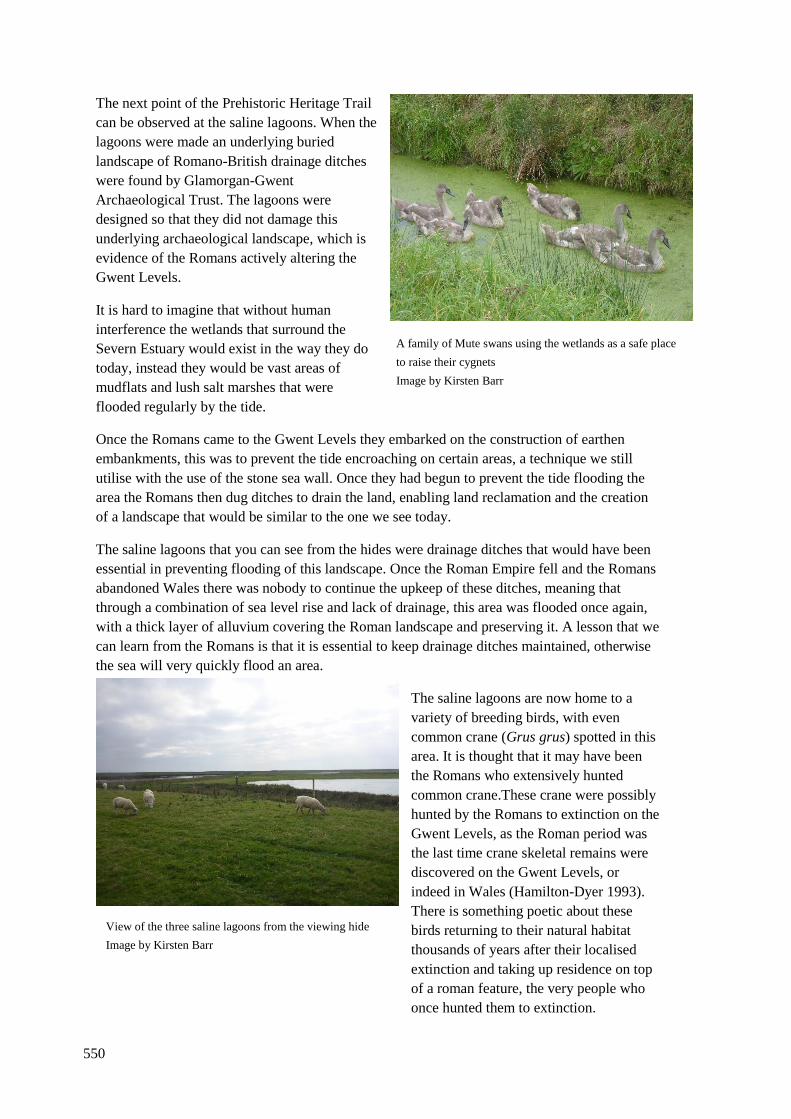
550
The next point of the Prehistoric Heritage Trail
can be observed at the saline lagoons. When the
lagoons were made an underlying buried
landscape of Romano-British drainage ditches
were found by Glamorgan-Gwent
Archaeological Trust. The lagoons were
designed so that they did not damage this
underlying archaeological landscape, which is
evidence of the Romans actively altering the
Gwent Levels.
It is hard to imagine that without human
interference the wetlands that surround the
Severn Estuary would exist in the way they do
today, instead they would be vast areas of
mudflats and lush salt marshes that were
flooded regularly by the tide.
Once the Romans came to the Gwent Levels they embarked on the construction of earthen
embankments, this was to prevent the tide encroaching on certain areas, a technique we still
utilise with the use of the stone sea wall. Once they had begun to prevent the tide flooding the
area the Romans then dug ditches to drain the land, enabling land reclamation and the creation
of a landscape that would be similar to the one we see today.
The saline lagoons that you can see from the hides were drainage ditches that would have been
essential in preventing flooding of this landscape. Once the Roman Empire fell and the Romans
abandoned Wales there was nobody to continue the upkeep of these ditches, meaning that
through a combination of sea level rise and lack of drainage, this area was flooded once again,
with a thick layer of alluvium covering the Roman landscape and preserving it. A lesson that we
can learn from the Romans is that it is essential to keep drainage ditches maintained, otherwise
the sea will very quickly flood an area.
The saline lagoons are now home to a
variety of breeding birds, with even
common crane (Grus grus) spotted in this
area. It is thought that it may have been
the Romans who extensively hunted
common crane.These crane were possibly
hunted by the Romans to extinction on the
Gwent Levels, as the Roman period was
the last time crane skeletal remains were
discovered on the Gwent Levels, or
indeed in Wales (Hamilton-Dyer 1993).
There is something poetic about these
birds returning to their natural habitat
thousands of years after their localised
extinction and taking up residence on top
of a roman feature, the very people who
once hunted them to extinction.
A family of Mute swans using the wetlands as a safe place
to raise their cygnets
Image by Kirsten Barr
View of the three saline lagoons from the viewing hide
Image by Kirsten Barr
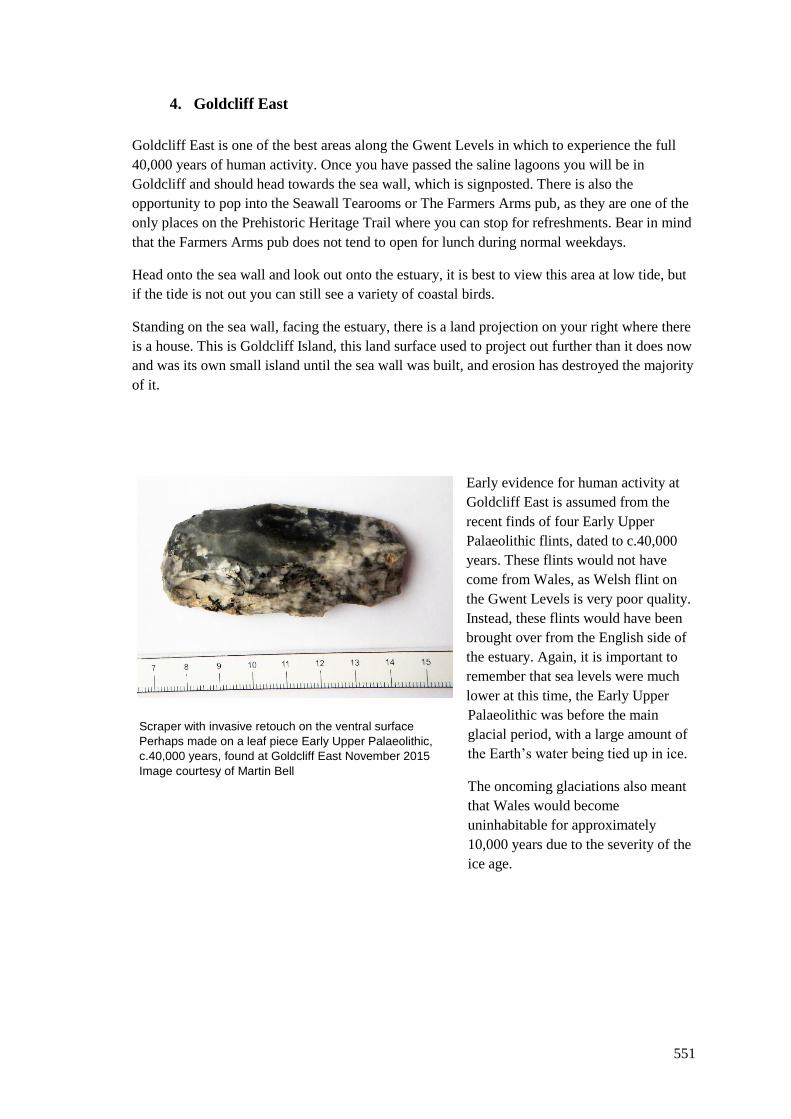
551
4. Goldcliff East
Goldcliff East is one of the best areas along the Gwent Levels in which to experience the full
40,000 years of human activity. Once you have passed the saline lagoons you will be in
Goldcliff and should head towards the sea wall, which is signposted. There is also the
opportunity to pop into the Seawall Tearooms or The Farmers Arms pub, as they are one of the
only places on the Prehistoric Heritage Trail where you can stop for refreshments. Bear in mind
that the Farmers Arms pub does not tend to open for lunch during normal weekdays.
Head onto the sea wall and look out onto the estuary, it is best to view this area at low tide, but
if the tide is not out you can still see a variety of coastal birds.
Standing on the sea wall, facing the estuary, there is a land projection on your right where there
is a house. This is Goldcliff Island, this land surface used to project out further than it does now
and was its own small island until the sea wall was built, and erosion has destroyed the majority
of it.
Early evidence for human activity at
Goldcliff East is assumed from the
recent finds of four Early Upper
Palaeolithic flints, dated to c.40,000
years. These flints would not have
come from Wales, as Welsh flint on
the Gwent Levels is very poor quality.
Instead, these flints would have been
brought over from the English side of
the estuary. Again, it is important to
remember that sea levels were much
lower at this time, the Early Upper
Palaeolithic was before the main
glacial period, with a large amount of
the Earth’s water being tied up in ice.
The oncoming glaciations also meant
that Wales would become
uninhabitable for approximately
10,000 years due to the severity of the
ice age.
Scraper with invasive retouch on the ventral surface
Perhaps made on a leaf piece Early Upper Palaeolithic,
c.40,000 years, found at Goldcliff East November 2015
Image courtesy of Martin Bell
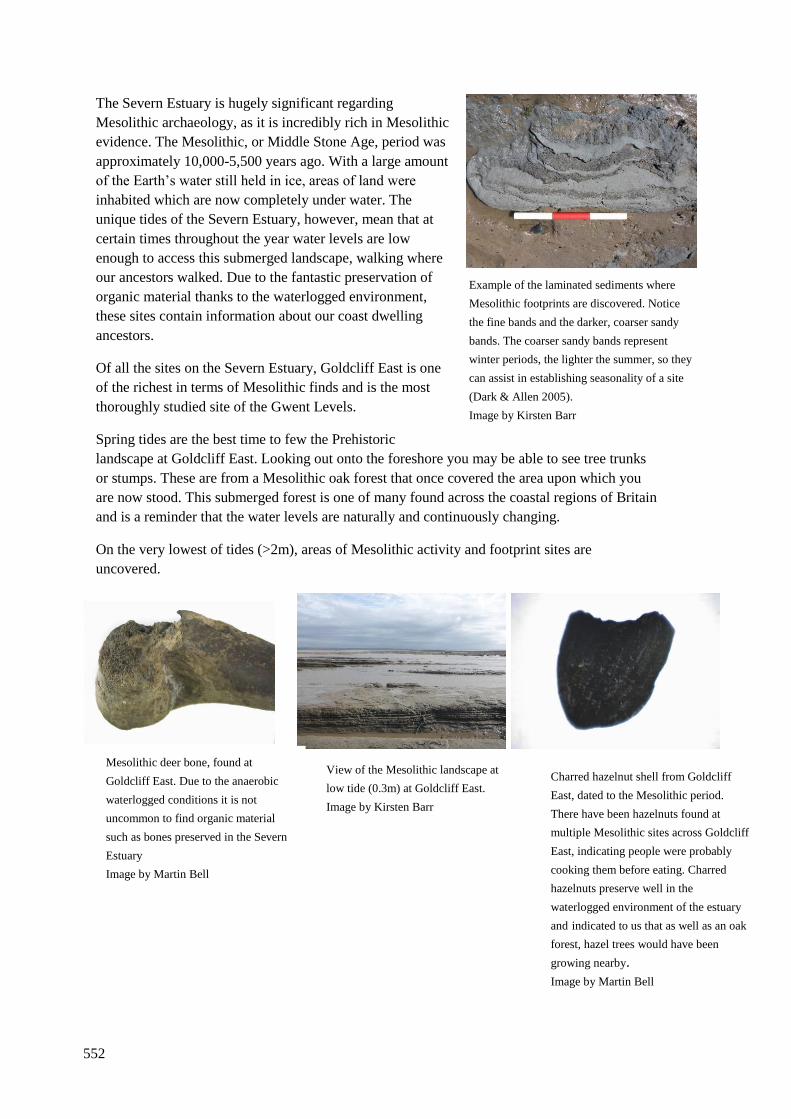
552
The Severn Estuary is hugely significant regarding
Mesolithic archaeology, as it is incredibly rich in Mesolithic
evidence. The Mesolithic, or Middle Stone Age, period was
approximately 10,000-5,500 years ago. With a large amount
of the Earth’s water still held in ice, areas of land were
inhabited which are now completely under water. The
unique tides of the Severn Estuary, however, mean that at
certain times throughout the year water levels are low
enough to access this submerged landscape, walking where
our ancestors walked. Due to the fantastic preservation of
organic material thanks to the waterlogged environment,
these sites contain information about our coast dwelling
ancestors.
Of all the sites on the Severn Estuary, Goldcliff East is one
of the richest in terms of Mesolithic finds and is the most
thoroughly studied site of the Gwent Levels.
Spring tides are the best time to few the Prehistoric
landscape at Goldcliff East. Looking out onto the foreshore you may be able to see tree trunks
or stumps. These are from a Mesolithic oak forest that once covered the area upon which you
are now stood. This submerged forest is one of many found across the coastal regions of Britain
and is a reminder that the water levels are naturally and continuously changing.
On the very lowest of tides (>2m), areas of Mesolithic activity and footprint sites are
uncovered.
View of the Mesolithic landscape at
low tide (0.3m) at Goldcliff East.
Image by Kirsten Barr
Charred hazelnut shell from Goldcliff
East, dated to the Mesolithic period.
There have been hazelnuts found at
multiple Mesolithic sites across Goldcliff
East, indicating people were probably
cooking them before eating. Charred
hazelnuts preserve well in the
waterlogged environment of the estuary
and indicated to us that as well as an oak
forest, hazel trees would have been
growing nearby.
Image by Martin Bell
Mesolithic deer bone, found at
Goldcliff East. Due to the anaerobic
waterlogged conditions it is not
uncommon to find organic material
such as bones preserved in the Severn
Estuary
Image by Martin Bell
Example of the laminated sediments where
Mesolithic footprints are discovered. Notice
the fine bands and the darker, coarser sandy
bands. The coarser sandy bands represent
winter periods, the lighter the summer, so they
can assist in establishing seasonality of a site
(Dark & Allen 2005).
Image by Kirsten Barr
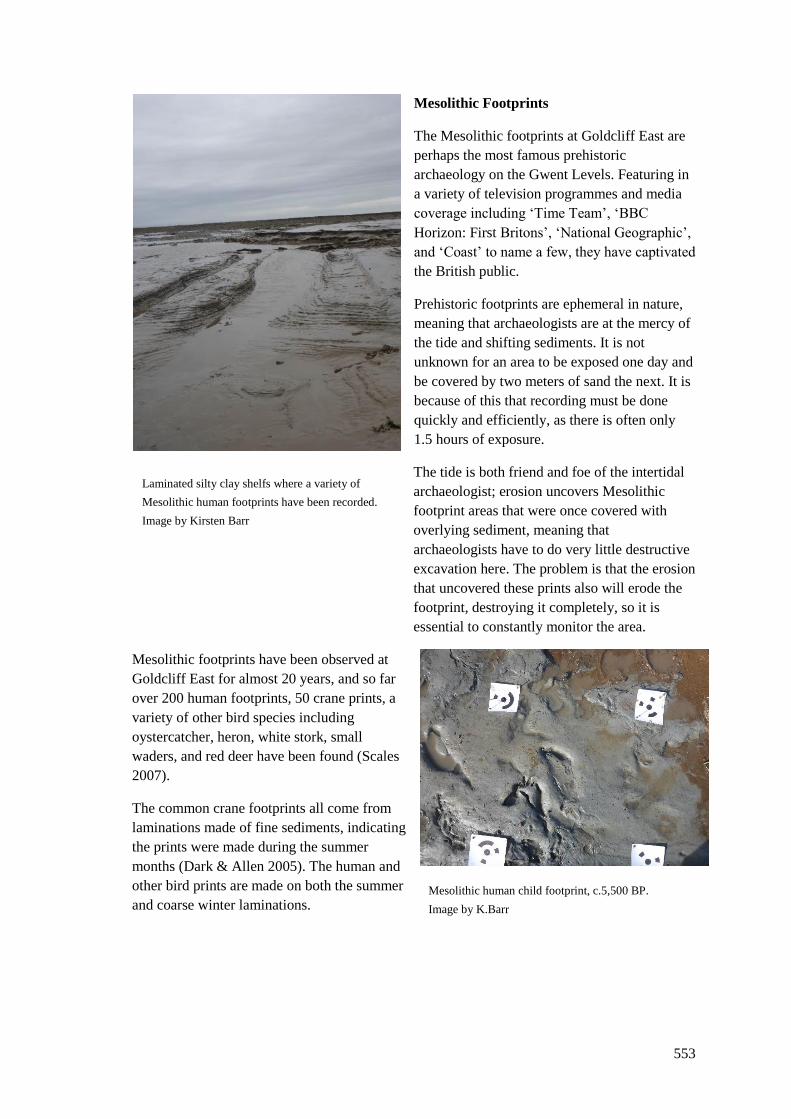
553
Mesolithic Footprints
The Mesolithic footprints at Goldcliff East are
perhaps the most famous prehistoric
archaeology on the Gwent Levels. Featuring in
a variety of television programmes and media
coverage including ‘Time Team’, ‘BBC
Horizon: First Britons’, ‘National Geographic’,
and ‘Coast’ to name a few, they have captivated
the British public.
Prehistoric footprints are ephemeral in nature,
meaning that archaeologists are at the mercy of
the tide and shifting sediments. It is not
unknown for an area to be exposed one day and
be covered by two meters of sand the next. It is
because of this that recording must be done
quickly and efficiently, as there is often only
1.5 hours of exposure.
The tide is both friend and foe of the intertidal
archaeologist; erosion uncovers Mesolithic
footprint areas that were once covered with
overlying sediment, meaning that
archaeologists have to do very little destructive
excavation here. The problem is that the erosion
that uncovered these prints also will erode the
footprint, destroying it completely, so it is
essential to constantly monitor the area.
Mesolithic footprints have been observed at
Goldcliff East for almost 20 years, and so far
over 200 human footprints, 50 crane prints, a
variety of other bird species including
oystercatcher, heron, white stork, small
waders, and red deer have been found (Scales
2007).
The common crane footprints all come from
laminations made of fine sediments, indicating
the prints were made during the summer
months (Dark & Allen 2005). The human and
other bird prints are made on both the summer
and coarse winter laminations.
Laminated silty clay shelfs where a variety of
Mesolithic human footprints have been recorded.
Image by Kirsten Barr
Mesolithic human child footprint, c.5,500 BP.
Image by K.Barr
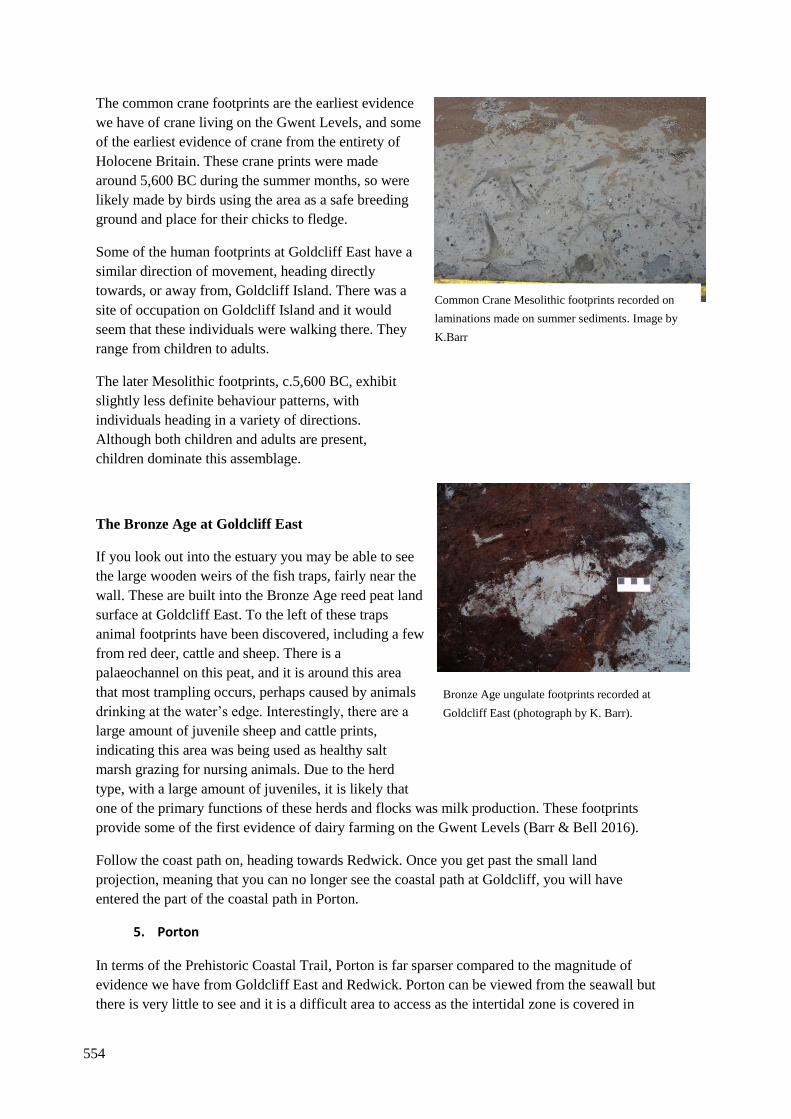
554
The common crane footprints are the earliest evidence
we have of crane living on the Gwent Levels, and some
of the earliest evidence of crane from the entirety of
Holocene Britain. These crane prints were made
around 5,600 BC during the summer months, so were
likely made by birds using the area as a safe breeding
ground and place for their chicks to fledge.
Some of the human footprints at Goldcliff East have a
similar direction of movement, heading directly
towards, or away from, Goldcliff Island. There was a
site of occupation on Goldcliff Island and it would
seem that these individuals were walking there. They
range from children to adults.
The later Mesolithic footprints, c.5,600 BC, exhibit
slightly less definite behaviour patterns, with
individuals heading in a variety of directions.
Although both children and adults are present,
children dominate this assemblage.
The Bronze Age at Goldcliff East
If you look out into the estuary you may be able to see
the large wooden weirs of the fish traps, fairly near the
wall. These are built into the Bronze Age reed peat land
surface at Goldcliff East. To the left of these traps
animal footprints have been discovered, including a few
from red deer, cattle and sheep. There is a
palaeochannel on this peat, and it is around this area
that most trampling occurs, perhaps caused by animals
drinking at the water’s edge. Interestingly, there are a
large amount of juvenile sheep and cattle prints,
indicating this area was being used as healthy salt
marsh grazing for nursing animals. Due to the herd
type, with a large amount of juveniles, it is likely that
one of the primary functions of these herds and flocks was milk production. These footprints
provide some of the first evidence of dairy farming on the Gwent Levels (Barr & Bell 2016).
Follow the coast path on, heading towards Redwick. Once you get past the small land
projection, meaning that you can no longer see the coastal path at Goldcliff, you will have
entered the part of the coastal path in Porton.
5. Porton
In terms of the Prehistoric Coastal Trail, Porton is far sparser compared to the magnitude of
evidence we have from Goldcliff East and Redwick. Porton can be viewed from the seawall but
there is very little to see and it is a difficult area to access as the intertidal zone is covered in
Common Crane Mesolithic footprints recorded on
laminations made on summer sediments. Image by
K.Barr
Bronze Age ungulate footprints recorded at
Goldcliff East (photograph by K. Barr).
555
very deep, dangerous mud. If you are able to stand on the seawall near to Porton House and
look out onto the estuary you will be looking at the area of Porton. Finds at Porton have
included a Mesolithic tranchet axe, reed matting, a Bronze Age palstave and a Bronze Age
spearhead, as well as a few potential deer and cattle hoof prints (Bell et al. 2000).
There is not much to see at Porton but it is important to remember the importance of the
evidence which might still be there under the deep mud.
Once you have seen Porton, carry along the coastal path and head to Redwick.
6. Redwick
At Redwick there is a final opportunity for a refreshment stop, at the Rose Inn. This pub is a
slight diversion from the coastal path and has parking. The pub is open daily and serves a
variety of foods.
Whilst in the village of Redwick bear in mind that the English name, Redwick, means
‘settlement where reeds grow’, indicating the strong relationship between the village and the
wetlands.
On the sea wall, Redwick is not much to look at and is a very small, less than a kilometre in
length. In a similar way to Goldcliff East, Redwick is hugely rich in prehistoric archaeology and
is a key site in understanding the prehistoric humans’ relationship to the area.
Bronze Age in date, 1691–1401 cal BC, the peat shelves at Redwick have preserved a variety of
data, including rectangular Bronze Age buildings, a thumbnail scraper, a human cranium, burnt
bone, charcoal, heat fractured stone, reeds and woodchips, as well as footprints from a variety
of animals, including humans, cattle, sheep/goat and pig. The humble selection of artefacts in
this occupation area suggests that these buildings were not a long-term campsite. Many of the
finds such as the heat fractured stone, are related to cooking, suggesting cooking in the area
(Bell 2013). The buildings were surrounded by a large amount of trampling, mainly by cattle,
but also sheep/goat. These animals were likely from a dairy herd, as many of the footprints
were made by young animals (Barr & Bell 2016). This evidence, as well as the limited amount
of artefacts, suggest that the site of Redwick was being used during the spring/summer as a safe
place for the livestock to raise their young on the nutrient rich salt-grass.
The peat is occasionally washed clean by a good tide, the remains of the buildings’ location can
just about be seen on these occasions, though erosion is wiping out this evidence.
7. Coldharbour Pill/Magor
Further along from Redwick there are two other important sites from the Prehistoric trail that
you may wish to view if you have time, and are also viewable from the coastal path, these are
Coldharbour Pill and Magor Pill. Footprints are some of the most important finds in these areas,
as well as Iron Age pottery, post stakes and flints.

556
Where to visit next?
To see the actual prehistoric artefacts from the area don’t forget to pay Newport Museum a
visit, here you can see the remains of an auroch found in a palaeochannel (ancient river), as well
as flints, and casts of Mesolithic footprints, all found on the Severn Estuary.
If you have the time, take a trip into Cardiff and visit the National Museum of Wales at St.
Fagans, this is where most of the estuarine finds from the Gwent Levels end up, as well as all
the other interesting finds from across Wales.
557
Bibliography
Aaris-Sorensen, K., 1980. Atlantic fish, reptile and bird remains from the Mesolithic settlement
at Vedbaek, North Zealand. Videnskabelige Meddelelser fra dansk Naturhistorisk Forening,
142:139-149.
Aaris-Sorrensen, K., 1976. Zoological investigation of the bone material from SvFrdborg I —
1943. In B. Henriksen, Sværdborg I, excavations 1943–44. A settlement of the Maglemose
Culture. Arkæologiske studier: Copenhagen. Pp 137–148.
Abledu, J.K., Abledu, G.K., Offei, E.B., and Antwi, E.M., 2016. Estimation of stature and body
weight from footprint dimensions among a female population in Ghana. Australian Journal of
Forensic Sciences, 48(2):195-202.
ABPmer and Atkins (2010). Severn Estuary Shoreline Management Plan Review (SMP2).
[online] Available at: www.severnestuarycoastalgroup.org.uk/shoreline-management-
plan/smp2-action-plan/ [accessed 17th November 2017]
Adams, B.J., and Hermann, N.P., 2009. Estimation of living stature from selected
anthropometric (soft tissue) measurements: applications for forensic anthropology. Journal of
Forensic Science, 54:753-760.
Adams, T.L., Strganac, C., Polcyn, M.J., and Jacobs, L.L., 2009. Three-dimensional laser-
scanning: implications for digital archiving and preservation of the type specimen of Eubrontes
(?) glenrosensis Shuler, 1935 from the Lower Cretaceous of Texas. Palaeontologia Electronica
13(3):217-14.
Admiralty tide tables 2015. Vol. 1, United Kingdom and Ireland, including European Channel
ports. Taunton:UK Hydrographic Office.
Agisoft LLC, 2018. Agisoft PhotoScan User Manual: Professional Edition, Version 1.4.
[online] Available at: http://www.agisoft.com/pdf/photoscan-pro_1_4_en.pdf [accessed 12th
January 2018]
Agnihotri, A.K., Purwar, B., Googoolye, K., Smriti, A., and Jeebun, N., 2007. Estimation of
stature by foot length. Journal of Forensic Legal Medicine, 14:279-283.
Ahlen, I., 1965. Studies on the Red Deer, Cervus elaphus L. in Scandinavia. III. Ecological
investigations. Viltrevy, 3:177-376.
Ahlström,T., 2003. Mesolithic human skeletal remains from Tagerup, Scania, Sweden. In
Larsson, L., Kindgren, H., Knutsson, K., Loeffler, D., and Akerlund, A., (eds.) Mesolithic on
the move. Papers presented at the sixth international conference on the Mesolithic in Europe,
Stockholm 2000. Oxbow books: Oxford. Pp 478-484.
Ahola, M.P., Laaksonen, T., Eeva, T., and Lehikoinen, E., 2007. Climate change can alter
competitive relationships between resident and migratory birds. Journal of Animal Ecology,
76(6):1045-1052.
Akpona, A.H., Djagoun, C.A.M.S., Harrington, L.A., Kabré, A.T., Mensah, G.A., and Sinsin,
B., 2015. Conflict between spotted-neck otters and fishermen in Hlan River, Benin. Journal for
Nature Conservation, 27:63-71.
Albarella, U., 1997. Crane and vulture at an Italian Bronze Age site. International Journal of
Osteoarchaeology, 7(4):346-349.
Albarella, U., & Pirnie, T., 2008. A review of animal bone evidence for central England.
[online] Available at:
http://archaeologydataservice.ac.uk/archives/view/animalbone_eh_2007/?CFID=5475156&CF
TOKEN=22862104 [accessed 8th August 2016]
558
Aldhouse-Green, S., and Housley, R. A., 1993. The Uskmouth mattock: a radiocarbon date.
Archeologia Cambrensis, 117:340.
Aldhouse-Green, S., Whittle, A., Allen, J.R.L., Caseldine, A.E., Culver, S.J., Day, M.H.,
Lundquist, J., and Upton, D., 1992. Prehistoric Human Footprints from the Severn Estuary at
Uskmouth and Magor Pill, Gwent, Wales. Archaeologia Cambrensis, 141:4-55.
Alexander, R.M.N., 1976. Estimates of speeds of dinosaurs. Nature, 261:129-130.
Alexander, R.M.N., 1984. Stride length and speed for adults, children and fossil hominids.
American Journal of Physical Anthropology, 63:23-27.
Allen, J.R.L., 1987. Late Flandrian shoreline oscillations in the Severn Estuary: the Rumney
Formation and its typeset. Philosophical Transactions of the Royal Society, B315:157-174.
Allen, J.R.L., 1996. Three final Bronze Age occupations at Rumney Great Wharf on the
Wentlooge Level, Gwent. Studia Celtica, 30:1-16.
Allen, J.R.L., 1997. Subfossil Mammalian Tracks (Flandrian) in the Severn Estuary, S.W.
Britain: Mechanics of Formation, Preservation and Distribution. Philosophical Transactions of
the Royal Society London B: Biological Sciences. 352(1352): 481-518.
Allen, J.R.L., 1998a. A Prehistoric (Neolithic-Bronze Age) complex on the Severn Estuary
Levels, Oldbury-on-Severn, South Gloucestershire, Transactions of the Bristol and
Gloucestershire Archaeological Society, 116:93-115.
Allen, J.R.L., 1998b. Late Iron Age and earliest Roman Calcite-tempered Ware from sites on
the Severn Estuary Levels: character and distribution. Studia Celtica, 32:27-41.
Allen, J.R.L., 2000a. Morphodynamics of Holocene salt marshes: a review sketch from the
Atlantic and Southern North Sea coasts of Europe. Quaternary Science Reviews, 19:1155-1231.
Allen, J.R.L., 2000b. Goldcliff Island: geological and sedimentological background. In M. Bell,
A. Caseldine and H. Neumann (eds.), Prehistoric intertidal archaeology in the Welsh Severn
Estuary, CBA Research Report 120. Council for British Archaeology: York, pp 12-18.
Allen, J.R.L., 2001a. Late Quaternary stratigraphy in the Gwent Levels (southeast wales): the
sub-surface evidence. Proceedings of the Geologist Association, 112:289-315.
Allen, J.R.L., 2001b. Sea level, salt marsh and fen: shaping the Severn Estuary Levels in the
Later Quaternary (Ipswichian-Holocene). Archaeology in the Severn Estuary, 11:13-34.
Allen, J.R.L., 2004. Annual textural banding in Holocene estuarine silts, Severn Estuary Levels
(SW Britain): patterns, cause and implications. The Holocene, 14(4):536-552.
Allen, J.R.L., 2005. Teleconnections and their archaeological implications, Severn Estuary
Levels and widerregion: the fourth’ and other mid-Holocene peats. Archaeology in the Severn
Estuary, 16:17-65.
Allen, J.R.L., 2007. The geology of utilised and heat-fractured stones. In M. Bell (ed.)
Prehistoric Coastal Communities: The Mesolithic in western Britain. Research report 149.
Council for British Archaeology: York. Pp 123.
Allen, J.R.L., and Dark, P., 2007. Seasonality of modern pollen and sediment deposition in an
estuarine context: the Severn Estuary Levels, southwest England. Journal of Quaternary
Science, 23(3):213-228.
Allen, J.R.L., and Duffy, M.J., 1998. Temporal and spatial depositional patterns in the Severn
Estuary, southwestern Britain: intertidal studies at spring-neap and seasonal scales, 1991-1993.
Marine Geology, 146:147-171.
559
Allen, J.R.L., Bell, M. & Scales, R. 2003. Animal and human footprint-tracks in archaeology:
description and significance. Archaeology in the Severn Estuary, 14:55-68.
Allen, J.R.L., and Haslett, S.K., 2002. Buried salt-marsh edges and tide level cycles in the mid-
Holocene of the Caldicot Levels (Gwent), South Wales, UK. The Holocene, 12(3):303-324.
Allen, J. R. L., and Haslett, S. K. 2006 Granulometric characterization and evaluation of
annually banded mid-Holocene estuarine silts, Welsh Severn Estuary (UK): coastal change, sea
level and climate, Quaternary Science Review, 25:1418-46.
Allen, J.R.L., and Rae, J.E., 1987. Late Flandrian shoreline oscillations in the Severn Estuary: a
geomorphological and stratigraphical reconnaissance. Philosophical Transactions of the Royal
Society London B, 315:185-230.
Altamura, F., Bennet, M.R., D’Août, K., Gaudzinski-Windheuser, S., Melis, R.T., Reynolds,
S.C., and Mussi, M., 2018. Archaeology and ichnology at Gombore II-2, Melka Kunture,
Ethiopia: everyday life of a mixed-age hominin group 700,000 years ago. Scientific Reports,
8:2815.
Amaral, J.S., Casal, S., Citova´, I., Santos, A., Seabra, R.M., and Oliveira, B.P.P., 2006.
Characterization of several hazelnut (Corylus avellane L.) cultivars based in chemical, fatty
acid and sterol composition. European Food Research and Technology, 222:274–280.
Ambert, P., Colomer, A., and Galant, P., 2000. Datations mésolithiques des empreintes
humaines de l’étage Cathala de la grotte d’Aldéne (Cesseras, Hérault). Comptes Rendus de
l’Académie des Sciences – Series IIA - Earth and Planetary Science, 331(1):67-74.
Andersen, S.H., 1995. Coastal adaptation and marine exploitation in Late Mesolithic Denmark
– with special emphasis on the Limfjord region. In A. Fischer (ed) Man and sea in the
Mesolithic coastal settlement above and below present sea level, Oxbow monograph 53. Oxbow
Books: Oxford. Pp 41-67.
Andersen, S.H., 2000. ‘Køkkenmøddinger’ (shell middens) in Denmark: a survey. Proceedings
of the Prehistoric Society, 66:361-384.
Anderson, M., Blais, M., and Green, W.T., 1956. Growth of the normal foot during childhood
and adolescence: Length of the foot and interrelations of foot, stature, and lower extremity as
seen in serial records of children between 1-18 years of age. American Journal of Physical
Anthropology, 14(2):287-308
Andrews, C.W., 1899. On some remains of birds from the lake-dwellings of Glastonbury,
Somerset. Ibis, 5(7):351-358.
Anon, undated. The dark secrets of cave art. The University of Wisconsin-Milwaukee Graduate
School Research Profile Magazine, 19(1).
Aramayo, S.A., and Manera de Bianco, T., 2009. Late Quaternary palaeoichnological sites on
the southern Atlantic coast of Buenos Aires Province, Argentina: Mammal, bird and hominid
evidence. Ichnos, 16(1-2):25-32.
Armour-Chelu, M., Bell, M., Brayshay, B., Britnell, W.J., Cameron, N., Caseldine, A.E.,
Dresser, P.Q., Fancourt, E., Gonzalez, S., Healey, E., Johnson, S., Norris-Hil, J., Schulting, R.,
and Thomas, D., 2007. Shell middens and their environment at Prestayn, north Wales. In M.
Bell (ed)Prehistoric coastal communities: The Mesolithic in western Britain. CBA research
report 149. Council for British Archaeology: York. Pp 263-317.
Armstrong, E.A., 1943. Crane dance in the East and West. Antiquity, 17:71-76.
Ashley, G., 2003. Tracks, trails and trampling by large vertebrates in a rift valley paleo-
wetland, Lowermost bed II, Olduvai Gorge, Tanzania. Ichnos, 9(1-2):23-32.
560
Ashton, N., Lewis, S.G., Groote, I.D., Duffy, S.M., Bates, M., Bates, R., Hoare, P., Lewis, M.,
Parfitt, S.A., Peglar, S., Williams, C., and Stringer, C., 2014. Hominin Footprints from Early
Pleistocene deposits at Happisburgh, UK. PLoS ONE, 9(2):e88329.
Atamturk, D., 2010. Estimation of sex from the dimensions of foot, footprints and shoe.
Anthropologischer Anzeiger: Journal of Biological and Clinical Anthropology, 68(1):21-29.
Atamturk, D., and Duyar, I., 2008. Age-Related Factors in the Relationship between foot
measurements, living stature and body weight. Journal of Forensic Sciences, 53(6):1296- 1300.
Avalon marches centre, n/d. Avalon marshes centre Somerset. [online] Available at:
https://avalonmarshes.org/explore/avalon-marshes-centre/ [accessed 7th June 2017].
Avanzini, M., Mietto, P., Panarello, A., De Angelis, M., and Rolandi, G., 2008. The Devil’s
trails: middle Pleistocene human footprints preserved in a volcanoclastic deposit of Southern
Italy. Ichnos, 15:179-189.
Bahn, P.G., and Vertut, J., 1988. Images of the ice age: facts on file. Winward:Leicester.
Bakels, C.C., and Zeiler, J., 2005. The fruits of the land: Neolithic subsistence. In L.P. Louwe
Kooijmans, P.W. Van den Broeke, H. Fokkens, and A. L. van Gijn (eds), The Prehistory of the
Netherlands. Amsterdam University Press: Amsterdam. Pp 311- 336.
Baker, N., 2013. The nature tracker handbook. Bloomsbury: London.
Balaam, N., Levitan, B., and Straker, V., 1987. Studies in palaeoecolgy and environment in
South west England, BS 181. British Archaeological Reports: Oxford.
Balasse, M. and Tresset, A., 2002. Early weaning of Neolithic domestic cattle (Bercy, France)
revealed by intra-tooth variation in nitrogen isotope ratios. Journal of Archaeological Science,
29:853–859.
Balch, H.E., 1928. Mendip Nature research committee report for 1927. 39th Annual Report
Wells Natural History Archaeological Society, 1927:26-29.
Balzer, M. M., 1996. Flights of the Sacred: Symbolism and theory in Siberian Shaminism.
American Anthropologist, 98(2):305-318.
Bang, P. and Dahlstrom, P., 1974. Animal tracks and signs. Collins: London.
Barber, D., and Mills, J., 2011. 3D Laser Scanning for Heritage (second edition) Advice and
guidance to users on laser scanning in archaeology and architecture. English Heritage
Publishing: London.
Barja, I., and Rosellini, S., 2008. Does habitat type modify group size in roe deer and red deer
under predation risk by Iberian wolves? Canadian Journal of Zoology, 86(3):170-176.
Barker, S.L., and Scheuer, J.L., 1998. Predictive value of human footprints in a forensic
context. Medicine, Science and the Law, 34(4):341-346.
Barnaby, W., 1975. International News. Nature, 254:553.
Barr, K., 2012. Bronze Age ungulate footprint-tracks of the Severn Estuary: species and age
identification and an interpretation of husbandry practices. Unpublished Undergraduate
Dissertation, University of Reading.
Barr, K., and Bell, M., 2016. Neolithic and Bronze Age ungulate footprint-tracks of the Severn
Estuary: species, age, identification and the interpretation of husbandry practices.
Environmental Archaeology, 22(1):1-15.
Barriere, C., and Sahly, A., 1964. Les empreintes humaines de Lascaux: miscelanea en
homenaje a Abate. H.Breuil: Barcelona. Pp. 173-180.
561
Bartosiewicz, L., 2012. Vertebrate remains from a shell midden at An Corran, Staffin (Isle of
Skye), in A. Saville, K. Hardy, R. Miket and T.B. Ballin (eds.), An Corran, Staffin, Skye: a
Rockshelter with Mesolithic and Later Occupation. Scottish Archaeological Internet Report,
51:47-59.
Barton, R.N., 2007. Goldcliff Lithic Artefacts. In M. Bell (ed.) Prehistoric coastal
communities: the Mesolithic in western Britain. Research report 149. Council for British
Archaeology: York. Pp 103-121.
Barton, N., and Bell, M., 2000. The Goldcliff late-Mesolithic site, 5400-4000 Cal BC. In Bell,
M., Caseldine, A., and Neumann, H., (eds.) Prehistoric intertidal archaeology in the Welsh
Severn Estuary. Research report 120. Council for British Archaeology: York. Pp 33-63.
Bassett, D.R., Schneider, P.L., and Huntington, G.E., 2004. Physical activity in an Old order
Amish community. Medicine and Science in Sports and Exercise, 36(1):79-81
Bassett, D.R., Wyatt, H.R., Thompson, H., Peters, J.C., and Hill, J.O., 2010. Pedometer-
measured physical activity and health behaviours in U.S. Adults. Medicine and Science in
Sports and Exercise, 42(10):1819-1825
Bates, K.T., Rarity, F., Manning, P.L., Hodgetts, D., Villa, B., Oms, O., Galobart, A., and
Gawthorpe, R.L., 2008a. High-resolution LiDAR and photogrammetric survey of the Fumanya
dinosaur tracksites (Catalonia): Implications for the conservation and interpretation of
geological heritage sites. Journal of the Geological Society, 165 (1):115-127.
Bates, K.T., Manning, P.L., Vila, B., and Hodgetts, D., 2008b. Three-dimensional modelling
and analysis of dinosaur trackways. Palaeontology, 51:999-1010.
Bates, K.T., Manning, P.L., and Hodgetts, D., 2006. 3D models of dinosaur tracks using light
detection and range (LiDAR) imaging. Poster presentation at the 50th Palaeontological
association meeting, Sheffield:UK.
Bayón, C., Manera, T., Politis, G., and Aramayo, S., 2011. Following the tracks of the first
South Americans. Evolution: Education and Outreach, 4:205-217.
Bayón, C., Frontini, R., and Vecchi, R., 2012. Middle Holocene settlements on coastal dunes,
southwest Buenos Aires Province, Argentina. Quaternary International, 256:54-61.
Beard, J., 1997. Lon Odell Memorial Cave, a Dade County Treasure. Missouri Caves and Karst
Conservancy Digest, 4:43-48.
Begouen, C.M., 1927. Les empreintes de pieds préhistoriques. Institut International
d’Anthropologie, III session: Amsterdam. Pp 323-327.
Behrensmeyer, A. K., and L. F. Laporte., 1981. Footprints of a Pleistocene hominid in Northern
Kenya. Nature, 289:l67-l69.
Bell, M.G.,1995. Field survey and excavation at Goldcliff, Gwent 1994. In M.G. Bell (ed.)
Annual report of the Severn Estuary Levels Research Committee for 1994. Severn Estuary
Research Committee:Lampeter. Pp 115-144.
Bell, M., 2001a. Interim report on the excavation of a middle Bronze Age settlement at
Redwick 2000-2001. Archaeology in the Severn Estuary, 12:99-117.
Bell, M., 2001b. Environmental archaeology in the Severn Estuary: progress and prospects. In
S. Rippon (ed.) Estuarine archaeology: the Severn and beyond. Archaeology in the Severn
Estuary 11. Pp 69-104.
Bell, M., 2007. Prehistoric coastal communities: the Mesolithic in western Britain. CBA
research report 149. Council for British Archaeology: York.
562
Bell, M., 2013. The Bronze Age in the Severn Estuary. Research report, 172. Council for
British Archaeology: York.
Bell, M., 2015. Experimental archaeology at the crossroads: a contribution to interpretation or
evidence of ‘xeroxing’? In R. Chapman and A. Wylie (eds.) Material evidence: learning from
archaeological practice. Routledge: Abingdon.
Bell, M., and Neumann, H., 1997. Prehistoric intertidal archaeology and environment in the
Severn Estuary, Wales. World Archaeology, 29:95-113.
Bell, M., Caseldine, A., and Neumann, H., 2000. Prehistoric Intertidal Archaeology in the
Welsh Severn Estuary. CBA Research Report 120. Council for British Archaeology: York.
Bell, M., Allen, J.R.L., Barton, R.N.E., Coard, R., Crowther, J., Cruise, G.M., Ingrem, C., and
Macphail, R., 2000. The Goldcliff late-Mesolithic site, 5400-4000 Cal BC. In Bell, M.,
Caseldine, A., and Neumann, H., (eds.), Prehistoric intertidal archaeology in the Welsh Severn
Estuary. CBA Research Report 120. Council for British Archaeology: York. Pp 33-63.
Bell, M., Allen, J.R.L., Nayling, N., and Buckley, S., 2001. Mesolithic to Neolithic coastal
environmental change c6500-3500 BC. Archaeology in the Severn Estuary, 12:27-53.
Bell, M., Allen, J.R.L., Buckley, S., Dark, P., and Haslett, S.K., 2002. Mesolithic to Neolithic
coastal environmental change: excavations at Goldcliff East 2002. Archaeology in the Severn
Estuary, 13:1-29.
Bell, M., Allen, J.R.L., Buckley, S., Dark, P., and Nayling, N., 2003. Mesolithic to Neolithic
coastal environmental change: excavations at Goldcliff East 2003 and research at Redwick.
Archaeology in the Severn Estuary, 14:1-16.
Belperio, A.P., and Fotheringham, D.G., 1990. Geological settings of two Quaternary footprint
sites, Western Australia. Australian Journal of Earth Sciences, 37:37-42.
Bennet, M.R., Harris, B.G., Richmond, D.R., Braun, D.R., Mbua, E., Kiura, P., Olago, D.,
Kibunjia, M., Omuombo, C., Behrensmeyer, A.K., Huddart, D., and Gonzalez, S., 2009. Early
hominin foot morphology based on 1.5-million-year-old footprints from Ilret, Kenya. Science,
323:1197-1201.
Bennett, M.R., Gonzalez, S., Huddart, D., Kirby, J., and Toole, E., 2010. Probable Neolithic
footprints preserved in inter-tidal peat at Kenfig, South Wales (UK). Proceedings of the
Geologists’ Association, 121:66-76.
Bennet, M.R., Falkingham, P., Morse, S.A., Bates., K., and Crompton, R.H., 2013. Preserving
the impossible: conservation of soft-sediment hominin footprint sites and strategies for three-
dimensional digital data capture. PLoS ONE, 8(4):e60755.
Bennett, M. R., and Morse, S.A., 2014. Human footprints: Fossilised locomotion?
Springer:London
Bennet, M.R., Morse, S.A., Liutkus-Pierce, C., McClymont, J., Evans, M., Crompton, R.H., and
Thackeray, J.F., 2014. Exceptional preservation of children’s footprints from a Holocene
footprint site in Namibia. Journal of African Earth Science, 97:331-341.
Bennet, M.R., Reynolds, S., Morse, S.A., and Buka, M., 2016. Laetoli’s lost tracks: 3D
generated mean shape and missing footprints. Scientific Reports, 6:21916.
Bertsch, C., Unger, H., Winkelmann, W., and Rosenbaum, D., 2004. Evaluation of early
walking patterns from plantar pressure distribution measurements. First year results of 42
children. Gait Posture, 19(3):235-242.
563
Bird, D.W., and Bliege-Bird, R., 2005. Mardu children’s hunting strategies in the Western
Desert, Australia. I. Hewlett and M.E. Lamb (eds.) Hunter-Gatherer Childhoods: Evolutionary,
Developmental and Cultural Perspectives. Routledge: Abingdon. Pp 129- 146.
Bliege-Bird, R., Douglas, W., Bird, B., Codding, F., Parker, C.H., and J. H. Jones., 2008. The
“fire stick farming” hypothesis: Australian Aboriginal foraging strategies, biodiversity, and
anthropogenic fire mosaics. Proceedings of the National Academy of Sciences of the USA,
105(39):14796–14801.
Bliege-Bird, R., Nyalangka, T., Codding, B.F., and Bird, D.W., 2013. Niche construction and
dreaming logic: Aboriginal patch mosaic burning and varanid lizards (Varanus gouldii) in
Australia. Proceedings of the Royal Society B: Biological Sciences, 280(1772):20132297–
20132297.
Blott, S.J., and Pye, K., 2001. GRADISTAT: a grain size distribution and statistics package for
the analysis of unconsolidated sediments. Earth Surface Processes and Landforms, 26:1237-
1248.
Blott, S.J., and Pye, K., 2012. Particle size scales and classification of sediment type based on
particle size distributions: review and recommended procedures. Sedimentology, 59:2071-2096.
Blurton-Jones, N.G., Smith, L.C., O’Connell, J.F., Hawkes, K., and Kamuzora, C.L., 1992.
Demography of the Hadza, an increasing and high density population of Savanna foragers.
American Journal of Physical Anthropology, 89(2):159-181.
Both, C., Van Turnhout, C.A.M., Bijlsma, R.G., Siepel, H., Van Strein, A.J., and Foppen,
R.P.B., 2010. Avian population consequences of climate change are most severe for long-
distance migrants in seasonal habitats. Proceedings of the Royal Society B: Biological Sciences,
277 (1685):1259-1266
Bosch, K., Gerb, J., and Rosenbaum, D., 2010. Development of healthy childrens feet – nine
year results of a longitudinal investigation of plantar loading patterns. Gait Posture, 32:564-
571.
Brady, R., Suksiri, S., Tan, S., Dodds, J., and Aine, D., 2008. Current health and environmental
status of the Maasai people in sub-saharan Africa. Honors Journal, 1(1):17-32.
Bramwell, D., 1960. Report on a collection of bird bones from the 1929 excavations at
Soldier’s Hole, Cheddar. Proceedings of Somerset Archaeological Natural History Society,
104:87-90.
Brennand, M., Taylor, M., Ashwin, T., Bayliss, A., Canti, M., Chamberlain, A., French, C. A.I.,
Fryer, V., Gale, R., Green, F. M L., Groves, C., Hall, A., Linford, N., Murphy, P., Robinson,
M., Wells, J., and Williams, D., 2003. The survey and excavation of a bronze age timber circle
at Holme-next-the-sea, Norfolk, 1998-9. Proceedings of the Prehistoric Society, 69:1-84.
Bridge, D., 2015. The Great Crane Project 2015 report. [online] Available at
http://www.thegreatcraneproject.org.uk/news/annual-reports [accessed 4th June 2017).
Britton, K., Muldner, G., and Bell, M., 2008. Stable isotope evidence of salt-marsh grazing in
the Bronze Age Severn Estuary, UK: implications for palaeodietary analysis at coastal sites.
Journal of Archaeological Science, 35:2111-2118.
Brodribb, G., 1979. Markings on brick and tile. In A. McWhirr (ed.) Roman Brick and Tile:
Studies in manufacture, distribution and use in the Western Empire, BAR 68. British
Archaeological Report International Series:Oxford. Pp 211-220.
Bronk Ramsey, C., Pettitt, P. B., Hedges, R. E. M., Hodgins, G. W. L., and Owen, D. C., 2000.
Radiocarbon dates from the Oxford AMS System: archaeometry date list 29. Archaeometry,
42:243-254.
564
Brothwell, D.R., and Blake, M.L., 1966. The human remains from Fussell’s Lodge long
barrow: their morphology, discontinuous traits and morphology. Archaeologia, 100:48-63.
Brown, R., Ferguson, J., Lawrence, M., and Leses, D., 1987. Tracks and signs of the birds of
Britain and Europe an identification guide. Christopher Helm: London.
Brown, T., 1997. Clearances and clearings: deforestation in Mesolithic/ Neolithic Britain.
Oxford Journal of Archaeology, 16(2):133-146.
Breuil, H., and Cartailhac, É., 1907. Une seconde campagne aux cavernes ornées de Niaux
(Ariégne) et de Gargas (Hautes-Pyrénées). Comptesw rendus de séances de l’Académie des
Inscriptions et Belles-Lettres, 51(4):213-222
Brunning, R., 2000. Neolithic and Bronze-Age Somerset: a wetland perspective. In C.J.
Webster (ed.) Somerset Archaeology: Papers to Mark 150 Years of the Somerset
Archaeological and Natural History Society South West Heritage Trust. Somerset County
Council: Taunton. Pp 67-72.
Bryan, A.L., 1973. New light on ancient Nicaraguan footprints. Archaeology, 26:146-147.
Bullion, S., 2014. A guide to British mammal tracks and signs. FSC Publications: Telford.
Bulleid, A., and Gray, H.G., 1911-1917. The Glastonbury Lake Village. 1&2.
Buxton, J., and Durdin, C., 2011. The Norfolk Cranes’ story. Wren publishing: Norfolk.
Campbell, T.D., Gray, J.H., and Hackett, C.J., 1936. Physical anthropology of the Aborigines of
central Australia. Oceania, 7:106-139.
Campbell, J.B., and Simpson, C.G., 1971. A new analysis of Kent’s cavern, Devonshire,
England. University of Oregon Anthropology Papers, 3:1-40.
Cardiff University News, 2017. Rare prehistoric footprints redefined as 7,000 years old.
[online] Available at: https://www.cardiff.ac.uk/news/view/615550-rare-prehistoric-footprints-
redefined-as-7,000-years-old [accessed 28th February 2017].
Carrera, P., 2003. Solapamiento de nicho entre el hombre y la nutria gigante (Pteronura
brasiliensis, Carnivora: Mustelidae) en la cuenca baja del Río Yasuní, Parque Nacional
Yasuní, Amazonía Ecuatoriana. Undergraduate Monograph, Pontificia Universidad Católica
Del Equador, Quito. Pp 60.
Carter, H.H., 1975. Fauna of an area of Mesolithic occupation in the Kennet valley considered
in relation to contemporary eating habits. Berkshire Archaeological Journal, 68:1-3.
Carter, R., 2001. New evidence for seasonal human presence at the Early Mesolithic site of
Thatcham, Berkshire, England. Journal of Archaeological Science, 28:1055-1060.
Carter, I., Newbery, P., Grice, P., and Hughes, J., 2008. The role of reintroductions in
conserving British birds. British Birds, 101:2–25.
Caseldine, A., 2000. The vegetation history of the Goldcliff area. In M. Bell, A, Caseldine, and
H. Neumann (eds.), Prehistoric Intertidal archaeology in the Welsh Severn Estuary, CBA
research report 120. Council for British Archaeology: York. Pp 208-244.
Caseldine, A., 1992. The palaeobotanical evidence. In S.H.R. Aldhouse-Green, A.W.R.,
Whittle, J.R.L. Allen, A.E. Caseldine, S.J. Culver, M.H. Day, J. Lundquist and D. Upton,
Prehistoric human footprints from the Severn Estuary at Uskmouth and Magor Pill, Gwent,
Wales. Archaeologica Cambrensis, 141:21-28
Casteret, N., 1948. The footprints of Prehistoric man: a vivid new evidence of our ancestors of
fifteen thousand years ago. Illustrated London News, 110:408-409.
565
Chamberlain, A.T., 1997. Commentary: missing stages in life – towards the perception of
children in archaeology. In J. Moore and E. Scott (eds.) Invisible people and processes writing
gender and childhood into European archaeology. Leicester University Press: London. Pp 248-
251.
Champness, C., and Hughes, V., 2013. Bexhill to Hastings Link Road Archaeological and
Geoarchaeological Evaluation Report. Oxford archaeology south issue number 3. [online]
Available at:
http://www.academia.edu/31176514/Bexhill_to_Hastings_Link_Road_Archaeological_and_Ge
oarchaeological_Evaluation_Report_Archaeological_Evaluation_Report [accessed 6th July
2017].
Charles, B.G., 1938. Non- Celtic place names in Wales. Chambers Norman & Smith: London.
Charteris, J., Wall, J. C., and Nottrodt, J. W., 1981. Functional reconstruction of gait from the
Pliocene hominid footprints at Laetoli, Northern Tanzania. Nature, 290:496–498.
Chavaillon, J., and Piperno, M., 2004. Studies on the Early Paleolithic site of Melka Kunture,
Ethiopia. Origines:Florence.
Chen, K.C., Yeh, C.J., Kuo, J.F., Hsieh, C.L., Yang, S. F., and Wang, C.H., 2011. Footprint
analysis of flatfoot in preschool-aged children. European Journal of Pediatrics, 170(5):611-
617.
Cheshire and Wirral Ornithological Society, 2008. Birds in Cheshire and Wirral: a breeding
and wintering atlas. [online] Available at http://www.cheshireandwirralbirdatlas.org/index.htm
[accessed 6th January 2017]
Chiapella,V.G., 1952. Orsi e nomini preistorici nella grotto della ‘Strega’, (Genova). Revista del
Comune, A29:22-29.
CITiZAN n/d. Recording prehistoric footprints. [online] Available at:
https://citizan.org.uk/resources/footprints/ [accessed 12th February 2018].
Clark, J.D.G., 1954. Excavations at Star Carr: An early Mesolithic site at Seamer near
Scarborough, Yorkshire. Cambridge University Press: Cambridge.
Clottes, J., 1975. Circonscription de Midi-Pyrénées. Gallia Prèhistoire, 18(2):613-650.
Clottes, J., 1984. Grotte de Niaux, in A. Leroi-Gourhan (ed.) L’art des cavernes: Atlas des
grottes ornées paléolithiques francaises. Ministere de la Culture. Imprimerie national: Paris. Pp
416–23.
Clottes, J., 2003. Return to Chauvet Cave. Thames and Hudson: London
Coard, R., 2000. Large mammal bone assemblage. In M. Bell, A. Caseldine, and H. Neumann
(eds.) Prehistoric Intertidal Archaeology in the Welsh Severn Estuary, CBA Research Report
120. Council of British Archaeology: York. Pp 48-53.
Coleman, T.S., and Boag, D.A., 1987. Canada goose foods: their significance to weight gain.
Wildfowl, 38:77-81.
Coles, J.M., 1971. The early settlement of Scotland: excavations at Morton, Fife. Proceedings
of the Prehistoric Society, 37:284-366.
Coles, J.M.,1983. Morton revisited, in A. O’Connor and D.V. Clarke (eds), From the Stone Age
to the ‘Forty-five’. John Donald:Edinburgh. Pp 9-18.
Coles, B., 2006. Beavers in Britain’s past. WARP occasional paper 19. Oxbow books: Oxford.
566
Copley, M.S., Berstan, R., Straker, V., Payne, S., and Evershed, R.P., 2005a. Dairying in
Antiquity II: Evidence from Absorbed Lipid Residues Dating to the British Bronze Age.
Journal of Archaeological Science, 32:505-521.
Copley, M.S., Berstan, R., Dudd, S.N., Aillaud, S., Mukherjee, A.J., Straker, V., Payne, S., and
Evershed, R.P., 2005b. Processing of Milk Products in Pottery Vessels through British
Prehistory. Antiquity, 79:895-908.
Conneller, C., Milner, N., Taylor, B., and Taylor, M., 2012. Substantial settlement in the
European Mesolithic: new research at Star Carr. Antiquity, 86(334):1004-1020.
Cowell, R. W., Milles, A., and Roberts, G. 1993. Prehistoric footprints on Formby Point beach,
Merseyside. In R. Middleton (ed.), North West Wetlands Survey Annual Report. Pp 43–48.
Cram, L., 1984. Footprints in the sands of time. In C. Grigson and J. Clutton-Brock (eds.)
Animals in Archaeology: Husbandry in Europe. BAR 227(4). British Archaeological Report
International Series: Oxford. Pp 231-235.
Cram, L., and Fulford, M., 1979. Silchester tile making – the faunal evidence. In A. McWhirr
(ed.) Roman Brick and Tile: Studies in manufacture, distribution and use in the Western
Empire. BAR 68. British Archaeological Report International Series:Oxford. Pp 201-209.
Cramp, S., and Simmons, K.F.L., 1977. The birds of the western Paleartic, Volume 1. Oxford
University Press:Oxford.
Cramp, S., and Simmons, K. F. L., 1980. Handbook of birds of Europe, the Middle East and
North Africa, Volume II. Oxford University Press:Oxford. Pp 618-631.
Crothers, G.M., 1997. Archaeological site inventory form 40RU0090. Submitted to Virginia
Department of Historic Resources: Richmond. Pp 502-524
Crothers, G.M., Faulkner, C.H., Simek, J.F., Watson, P.J., and Wiley, P., 2002. Woodland cave
archaeology in Eastern North America. In D. Anderson and R. Mainfort (eds.) The Woodland
Southeast. University of Alabama: Tuscaloosa. Pp 502-524.
Culver, S.J., and Lundquist, J., 1992. The Foraminifera. In S.H.R. Aldhouse-Green, A.W.R.,
Whittle, J.R.L. Allen, A.E. Caseldine, S.J. Culver, M.H. Day, J. Lundquist and D. Upton,
Prehistoric human footprints from the Severn Estuary at Uskmouth and Magor Pill, Gwent,
Wales. Archaeologica Cambrensis, 141:29-33.
D’Aoȗt, K., Pataky, T.C., De Clercq, D., and Aerts, P., 2009. The effects of habitual footwear
use: foot shape and function in native barefoot walkers. Footwear Science, 1(2):81-94.
Dark, P., Highman, T.F.G., Jacobi, R., and Lord, T.C., 2006. New radiocarbon accelerator dates
on artefacts from the Early Mesolithic site of Star Carr, North Yorkshire. Archaeometry,
48(1):185-200.
Dark, P., 2004. New evidence for the antiquity of the intestinal parasite Trichuris in Europe.
Antiquity, 78:676-681.
Dark, P., 2007. Plant communities and human activity in the Lower Submerged Forest and on
Mesolithic occupation sites. In M. Bell (ed.) Prehistoric coastal communities: the Mesolithic in
Western Europe. CBA research report, 149. Council for British Archaeology: York. Pp 169-
185.
Dark, P., and Allen, J.R.L., 2005. Seasonal deposition of Holocene banded sediments in the
Severn Estuary Levels (Southwest Britain): palynological and sedimentological evidence.
Quaternary Science Reviews, 24:11-33.
Darling, F.F., 1937. A herd of red deer. Oxford University Press: Oxford.
567
David, A., 2007. Palaeolithic and Mesolithic settlement in Wales, with special reference to
Dyfed. British Archaeological Reports, British Series 448. Archaeopress: Oxford.
Davidson, A., 2002. The nature of costal archaeology. In A. Davidson (ed.), The coastal
archaeology of Wales. CBA Research Report 131. Council for British Archaeology: York. Pp 1-
9.
Davies, M., 1989. Recent advances in cave archaeology in South-West Wales. In T.D. Ford
(ed.) Limestones and caves of Wales. Cambridge University Press: Cambridge. Pp 79-91.
Davis, P., and Walker, A., 1996. The footprint surface at Barnfield Pit, Swanscombe: the results
of analysis of a potential human footprint. In B. Conway, J. Mcnabb and N. Ashton (eds.)
Excavations at Barnfield Pit, Swanscombe, 1968-1972. Occasional papers British Museum 94.
Trustees of the British Museum: London. Pp 169-185.
Day, M.H., and Wickens, E.H., 1980. Laetoli Pliocene Hominid Footprints and Bipedalism.
Nature, 286:385-387.
De Lumley, H., 1966. Les fouilles de Terra Amata à Nice. Premiers resultants Bulletin du
Musée d’Anthropologie Préhistorique de Monaco, 13:29-51.
De Reu, J., Plets, G., Verhoeven, G., De Smedt, P., Bats, M., Cherretté, B., De Maeyer, W.,
Deconynck, J., Herremans, D., Laloo, P., Van Meirvenne, M., and De Clercq, W., 2013.
Towards a Three-Dimensional Cost-Effective Registration of the Archaeological Heritage.
Journal of Archaeological Science, 40(2):108-1121.
Delteil, J., Durbas, P., and Wahl, L., 1972. Presentation de la galerie ornee de Fontanet
(Ornolac-Ussat-les-Bains, Ariege). Bulletin de la Societe Prehistorique de l’Ariege, 27:11–20.
Derevenski, J.S., 1997. Engendering children, engendering archaeology. In J. Moore and E.
Scott (eds.) Invisible people and processes writing gender and childhood into European
archaeology. Leicester University Press: London. Pp 192-203.
Dickson, C. A., 1988. Distinguished cereal from wild grass pollen: some limitations. Circaea,
5:67-71.
Dillehay, T., 1989. Monte Verde: A Late Pleistocene settlement in Chile: palaeoenvironment
and site context, volume 1. Smithsonian Institutional Press: Washington.
Dillehay, T., 1997. Monte Verde: A Late Pleistocene settlement in Chile: the archaeological
context, volume II. Smithsonian Institutional Press: Washington.
Dingwall, H.L., Hatala, K.G., Wunderlich, R. E., and Richmond, B,G., 2013. Hominin stature,
body mass, and walking speed estimates based on 1.5 million-yea-old fossil footprints at Ilret,
Kenya. Journal of Human Evolution, 64:556-568.
Di Vito, M.A., Zanella, E., Gurioli, L., Lanza, R., Sulpizio, R., Bishop, J., Tema, E., Boenzi,
G., and Laforgia, E., 2009. The Afragola settlement near Vesuvius, Italy: the destruction and
abandonment of a Bronze Age village revealed by archaeology, volcanology and rock-
magnetism. Earth Planetary Science Letters, 277(3):408-421.
Dobney, K., nd. Review of Environmental Archaeology: Zooarchaeology in the North of
England. Unpublished report for English Heritage.
Domjanic, J., Fieder, M., Seidler, H., and Mitteroecker, P., 2013. Geometric morphometric
footprint analysis of young women. Journal of Foot and Ankle Research, 6:27
Dowling, A.M., Steele, J.R., and Baur, L.A., 2001. Does obesity influence foot structure and
plantar pressure patterns in prepubescent children? International Journal of Obesity Related
Metabolic Disorders, 25(6):845-852.
568
Driver, H.E., 1953. The acorn of North American Indian diet. Proceedings of the Indiana
Academy of Science, 62:56-62.
Eadie, G., and Waddington, C., 2013. Rescue recording of an eroding inter-tidal peat bed at
Lower Hauxley, Northumberland (6109). Archaeological Research Services, report no 2013/17.
[online] Available at: https://historicengland.org.uk/images-books/publications/rescue-
recording-eroding-inter-tidal-peat-bed-low-hauxley/ [accessed 21st February 2017].
Edwards, K.E., 1993. Models of mid-Holocene forest farming for north-west Europe. In
F.M.Chambers (ed.), Climate change and human impact on landscape. Chapman and Hall:
London. Pp 133-145.
Elftman, H., and Manter, J., 1935. Chimpanzee and human feet in bipedal walking. American
Journal of Physical Anthropology, 20:69-79.
Elliot, W., 1991. Animal footprints on Roman Bricks from Newstead. Society of Antiquaries of
Scotland:Edinburgh. Pp 223-226.
Ember, C., 2014. Hunter-gatherers (Foragers), Explaining Human Culture. [online] Available
at: http://hraf.yale.edu/ehc/summaries/hunter-gatherers [accessed 31st August 2017].
Enghoff, I.B., 1986. Fresh water fishing from a Sea-Coast settlement. Journal of Danish
Archaeology, 5:62-76.
Enghoff, I. B., 1995. Fishing in Denmark during the Mesolithic Period. In A. Fischer (ed.) Man
and Sea in the Mesolithic. Coastal settlement above and below present sea level. Oxbow
Books:Oxford. Pp 67–74.
Ettlinger, E., 1943. Omens and Celtic warfare. Man, 43:11-17.
Evans, J.G., Smith, I.F., Darvill, T., and Grigson, C., 1983. Excavations at Cherhill, North
Wiltshire, 1967. Proceedings of the Prehistoric Society, 49:43-117.
Facorellis, Y., Kyparissi-Apostolika, N., and Maniatis, Y., 2001. The Cave of Theopetra,
Kalambaka: Radiocarbon Evidence for 50,000 Years of Human Presence. Radiocarbon,
43(2B):1029-1048.
Falkingham, P.L., Margetts, L., and Manning, P.L., 2012.Fossil vertebrae tracks as
paleopeneetrometers: confouding effects of foot morphology. Palaios, 25:356-360.
Faro technologies 2017. Faro Scanner Freestyle. [online] Available at:
https://www.faro.com/en-gb/products/construction-bim-cim/faro-scanner-freestyle3d-x/
[accessed 7th October 2017].
Fawcett, E., 1922. Further reports on the material found in Aveline’s Hole. Proceedings of the
University of Bristol Spelaeological Society, 1:79-85.
Fawzy, I.A., and Kamal, N.N., 2010. Stature and Body Weight Estimation from Various
Footprint Measurements among Egyptian Population. Journal of Forensic Sciences, 55(4):884-
888.
Finlayson, B., and Warren, G.M., 2010. Changing natures: Hunter-gatherers, first farmers and
the modern world. Duckworth:London.
Fischer, A., 2007. Coastal fishing in Stone Age Denmark –evidence from below and above the
present sea level and from human bones. In N. Milner, G. Bailey, and O. Craig (eds.) Shell
middens in Atlantic Europe. Oxbow books:Oxford. Pp 54-69
Felstead, N.J., Gonzalez, S., Huddart, S., Noble, S.R., Hoffmann, D.L., Metcalfe, S.E., Leng,
M.J., Albert, B.M., Pike, A.W.G., Gonzalez-Gonzalez, A., and Jiménez-López, J.C., 2014.
569
Holocene aged human footprints from the Cuatrociénegas Basin, NE Mexico. Journal of
Archaeological Science, 42:250-259.
Flack, A., Fiedler, W., Blas, J., Pokrovsky, I., Kaatz, M., Mitropolsky, M., Aghababyan, K.,
Fakriadis, I., Makrigianni, E., Jerzak, L., Azafzaf, H., Feltrup-Azafzaf, C., Rotics, S.,
Mokotjomela, T.M., Nathan, R., and Wikelski, M., 2016. Costs of migratory decisions: A
comparison across eight white stork populations. Science Advances, 2(1):E1500931.
Fowler, P.J., 1981. The farming of prehistoric Britain. Cambridge University Press:Cambridge.
Pp 94-199
Franklin, S., Grey, M.J., Heneghan, N., Bowen, L., and Li, F., X., 2015. Barefoot vs common
footwear: A systematic review of the kinematic, kinetic and muscle activity differences during
walking. Gait and Posture, 42:230-239.
Fraser, F.C. and King, J.E.,1954a. Birds. In J.G.D. Clark (ed.) Excavations at Star Carr.
Cambridge University Press:Cambridge.
Fraser, F.C. and King, J.E., 1954b. Faunal remains. In J.G.D. Clark (ed.) Excavations at Star
Carr. Cambridge University Press:Cambridge. Pp 70-95.
Frayer, D.W., and Wolpoff, M.H., 1985. Sexual Dimorphism. Annual Review of Anthropology,
14:429-473.
Friedman, G.M., and Sanders, J.E., 1978. Principles of sedimentology. Wiley:New York.
Fulford, M.G., Allen, J.R.L., and Rippon, S., 1994. The settlement and drainage of the
Wentlooge Level, Gwent: excavation and survey at Rumney Great Wharf 1992. Britannia,
25:175-211.
Future generations commissioner for wales, 2017. Summary proof of evidence of the future
generations commissioner for Wales for the public local inquiry into the M4 corridor around
Newport. [online] Available at: (http://bailey.persona-pi.com/Public-Inquiries/M4-
Newport/Third%20Parties/M4%20-
%20Proofs/Future%20Generations%20Commissioner/17%2002%2007%20Summary%20Proof
%20of%20Evidence%20to%20M4%20PI%20-%20FINAL%20version.pdf) [accessed 15th
October 2017].
Gale, R., Charcoals from the Mesolithic Sites A, B, D and J. In M. Bell (ed.) Prehistoric
coastal communities: the Mesolithic in western Britain, CBA research report 149. Council of
British Archaeology:York. Pp 185-187
Garcia, M.A., 1999. La piste de pas humains de la grotte Chauvet á Vallon-Pont d’Arc.
International Newsletter on Rock Art, 24:1-4.
Garfinkel, Y., 2003. Dancing at the dawn of agriculture. University of Texas Press:Austin.
Gardner, A., and Guest, P., 2010. Exploring Roman Caerleon: new excavations at the legionary
fortress of Isca. Archaeology International, 12:47-51.
Geetha, S., Swathi, S., and Athavale, A., 2015. Estimation of stature from hand and foot
measurements in a rare tribe of Kerala State in India. Journal of Clinical and Diagnostic
Research, 9(10):HC01-HC04.
Giles, E., & Vallandigham, P.H., 1991. Height Estimation from Foot and Shoeprint Length.
Journal of Forensic Sciences, 36:1134-1151.
Gluckman, P.D., and Hanson, M.A., 2006. Evolution, development and timing of puberty.
Trends in Endocrinology and Metabolism, 17(1):7-12.
570
Goedecker-Ciolek, R., 1993. Zur Herstellungstechnik von Kleidung und
Aüstrustungsgegenständen. In M. Egg, R. Goedecker-Ciolek, W. Groenman-van Waateringe,
and K. Spindler (eds.) Die Gletschermumie vom Ende der Steinzeit aus den Ötztaler Alpen.
Mainz: Jahrbuch des Römisch-Germanischen Zentralmuseums. Pp. 100–113.
Gómez, J. R., and Jorgenson. J. P., 1999. An overview of the giant otter-fisherman problem in
the Orinoco basin of Colombia. IUCN Otter Specialist Group Bulletin, 16:1-6.
Gómez, D. M. V., 2004. Valoración biologica e cultural de la nutria gigante (Pteronura
brasiliensis), em el área de influencia de Puerto Carreño, Vichada, Colombia (Rios Orinoco,
Bita, Caños Juriepe y Negro). Undergraduate Monograph, Pontificia Universidad Javeriana,
Facultad de Estudios Ambientales y Rurales, Bogotá, Colombia.
Gonzalez, S., Huddart, D., and Roberts, G., 1997. Holocene development of the Sefton Coast: a
multidisciplinary approach to understanding the archaeology. In A. Sinclair, E. Slater, and J.
Gowlett (eds.), Proceedings of the Archaeological Sciences Conference, 1995. Oxbow
Archaeological Monographs Series:Oxford. Pp 289- 299.
Gonzalez, S., Huddart, D., Bennett, M.R., Gonzalez-Huesca, A., 2006. Human footprints in
central Mexico older than 40,000 years. Quaternary Science Review, 25(3):201-222
Gonzalez, A.H.G., Lockley, M.G., Rojas, C.S., Epinoza, J.L., and Gonzalez, S., 2009. Human
tracks from Quaternary Tufa deposits, Cuatro Cienegas, Coahuila, Mexico. Ichnos, 16(1-2):12-
24.
Gordon, C., and Buikstra, J.E., 1992. Linear models for the prediction of stature from foot and
boot dimensions. Journal of Forensic Sciences, 37:771-782.
Grant, A. 2002. Food, status and social hierarchy. In P. Miracle and N. Milner (eds.)
Consuming Passions and Patterns of Consumption. Mcdonald Institute for Archaeological
Research:Cambridge. Pp 17-23
Green, S. 1989 Some recent archaeological and faunal discoveries from the Severn Estuary
Levels. Bulletin of the Board of Celtic Studies, 36:187-99.
Grigson,C., 1978. The Late glacial and early Flandrian ungulates of England and Wales- an
interim review. In S. Limbrey and J.C. Evans (eds.) The effect of man on the landscape: the
lowland zone. CBA Research Report 21. Council for British Archaeology:York. Pp 46-56.
Grigson, C, 1981. Fauna. In Simmons, I.G., and Tooley, M., (eds.) The environment in British
Prehistory. Duckworth:London.
Grigson, C., and Mellars, P., 1987. The mammalian remains from the middens, in P. Mellars
(ed.), Excavations on Oronsay. Edinburgh University Press:Edinburgh. Pp 243-289.
Grima, R., 2016. But isn’t all archaeology ‘Public’ archaeology? Public archaeology, 15(1):50-
58.
Grivas, T.B., Mihas, C., Arapaki, A., and Vasiliadis, E., 2008. Correlation of foot length with
height and weight in school age children. Journal of Forensic Legal Medicine, 15:89-95.
Gunn, N., 1991. Old and new methods of evaluating footprint impressions by a forensic
podiatrist. British Journal of Podiatric Medicine and Surgery, 3:8-11.
Gurney, J. H. 1921. Early annals of Ornithology. Witherby:London.
Gwent Wildlife Trust 2017. M4 campaign. Save Magor Marsh Nature Reserve and the Gwent
Levels. [online] Available at: http://www.gwentwildlife.org/how-you-can-help/m4-relief-road-
help-us-protect-gwent-levels [accessed 12th October 2017].
571
Haberland, W., and Grebe, W.H., 1957. Prehistoric footprints from El Salvador. American
Antiquity, 22:282-285.
Hald, M., 1972. Primitive shoes: an archaeological-ethnological study based upon shoe finds
from the Jutland Peninsula. The National Museum of Denmark:Copenhagen.
Hamilton-Dyer, S., 1993. The animal bones. In J.D. Zienkiewicz, J. Hillam, E. Besly, B. M.
Dickinson, P. V. Webster, S. A. Fox, S. Hamilton-Dyer, A. E. Caseldine and P. A. Busby (ed.s)
Excavations in the Scamnum Tribunorum at Caerleon. Britannia 24:132-6.
Hardy, K., and Wickham-Jones, C., 2009. Mesolithic and later sites around the Inner Sound,
Scotland: the work of the Scotland's First Settlers project 1998–2004. Scottish Archaeological
Internet Reports 31. Society of Antiquaries of Scotland:Edinburgh.
Harman, M., 1996., Birds. In J. May (ed.) Dragonby, Volumes I and II. Oxbow Monograph
61:Oxford.
Harris, H.A., 1933. Bone growth in health and disease. Oxford University Press:London.
Harrington, S.P.M., 1999. Human footprints at Chauvet Cave. Archaeology, 52.
Harrison, C.J.O., 1977. Non-passerine birds of the Ipswichian Interglacial from the Gower
Caves. Transactions of the British Cave Research Association, 44:441-442.
Harrison, C.J.O., 1980a. Pleistocene bird remains from Tornewton Cave and the Brixham
Windmill Hill cave in South Devon. Bulletin of the British Museum (Natural History), 33:91-
100.
Harrison, C.J.O., 1980b. A re-examination of British Devensian and earlier Holocene bird
bones in the British Museum (Natural History). Journal of Archaeological Science, 7:53-68.
Harrison, C.J.O., 1986. Bird remains from Gough’s Cave, Cheddar, Somerset. Proceedings of
the University of Bristol Spelaeological Society, 17(3):305-310.
Harrison, C.J.O., 1987a. Pleistocene and Prehistoric Birds of South-West Britain. Proceedings
of the University of Bristol Spelaeological Society, 18(1):81-104.
Harrison, C.J.O. 1987b. A re-examination of the Star Carr birds. Naturalist, 112:141.
Harrison, C.J.O., and Cowles, G.S., 1977. The extinct large cranes of the north-west
Palaearctic. Journal of Archaeological Science, 4:25-27.
Hatala, K.,G., Dingwall, H.L., Wunderlich, R.E., and Richmond, B.G., 2013. The relationship
between plantar pressure and footprint shape. Journal of Human Evolution, 65(1):21-28.
Hawkes, K., O’Connell, J.F., and Blurton Jones, N., 1995. Hardworking Hazda Grandmothers,
in V. Standen and R. Goley (eds.), Comparative socio-ecology: The behavioural ecology of
humans and other mammals. Basil Blackwell:Oxford. Pp 341-366.
Hay, R.L., 1987. Geology of the Laetoli area. In M.D. Leakey, and J.M. Harris (eds.) Laetoli: a
Pleistocene site in northern Tanzania. Claredon:Oxford.
Hedges, J.W., 1984. The tomb of the Eagle. John Murry:London.
Hedges, R.E.M., Housley, R.A., Law, I.A., and Brock Ramsey, C., 1989. Radiocarbon dates
from the Oxford AMS system: archaeometry datelist 9. Archaeometry, 31(2):207-234.
Hedges, R.E.M., Housley, R.A., Bronk Ramsey, C., and Van Klinken, G.J., 1991. Radiocarbon
dates from the Oxford AMS system: archaeometry datelist 13. Archaeometry 33(2):279-296.
572
Hedges, R.E.M., Housley, R.A., Bronk Ramsey, C., and Van Klinken, G.J., 1994. Radiocarbon
dates from the Oxford AMS system: archaeometry datelist 18. Archaeometry, 36:337-374.
Hemy, N., Flavel, A., Ishak, N., and Franklin, D., 2013. Estimation of stature using
antropometry of feet and footprints in a western Australian population. Journal of Forensic and
Legal Medicine, 20:435-441.
Hewlett, B.S., and Lamb, M.E., 2005. Hunter-gatherer childhoods: evolutionary,
developmental and cultural practices. Routledge:Abingdon.
Hill, L.M., 1958. Changes in the proportion of the female foot during growth. American
Journal of Physical Anthropology, 16(3):349-366.
Hirschfeld, L. A., 2002. Why don't anthropologists like children? American Anthropologist,
104:611-627.
Hitchcock, E., 1858. A report on the sandstone of the Connecticut valley and its fossil
footmarks. White:Boston.
Hobusch, E., 1980. Fair game: A history of hunting, shooting and animal conservation. Arco
Publishing:New York.
Hodder, I., 1999. The archaeological process. Blackwell:Oxford.
Hogestijn, J.W.H., and Peeters, J.H.M., 2001. De Mesolithische en vroeg-neolitische vindplaats
Hoge Vaart-A27 (Flevoland). Rapportage archeologische monumentenzorg 79. Print X-
Press:Amersfoot.
Holdaway, S.J., Douglass, M.J., and Fanning, P.C., 2013. A new ecological framework for
understanding human environment interactions in arid Australia. In D. Frankel, S. Lawrence,
and J. Webb (eds.). Archaeology in environment and technology intersections and
transformations. Routledge:Melbourne. Pp 51-68.
Howell, N., 1979. Demography of the Dobe !Kung. Academic Press:New York.
Huddart, D., Gonzalez, S., and Roberts, G., 1999a. The archaeological record and Mid-
Holocene marginal coastal palaeoenvironments around Liverpool Bay. Quarternary
Proceedings, 7:563-574.
Huddart, D., Roberts, G., and Gonzalez, S., 1999b. Holocene human and
animal footprints and their relationships with coastal environmental change, Formby Point, NW
England. Quaternary International, 55:29–41.
Huddart, D., Bennet, M.R., Gonzalez, S., and Velay, X., 2008. Analysis and preservation of
Pleistocene human and animal footprints: An example from Toluquilla, Valsequillo basin
(central Mexico). Ichnos, 15(3-4):232-245.
Hume, R., 2002. RSPB birds of Britain and Europe. DK:London.
Ingrem, C., 2000. Fish, bird and small mammal remains. In M. Bell, A. Caseldine, and H.
Neumann (eds.) Prehistoric intertidal archaeology in the Welsh Severn Estuary, CBA report
120. Council for British Archaeology:York. Pp 53-55.
Ingrem, C., 2007. Fish bones. In M. Bell (ed.) Prehistoric coastal communities: the Mesolithic
in western Britain. CBA research report 149. Council for British Archaeology:York. Pp 166-
168
Inoue, M., and Sakaguchi, H., 1997. Estimating the withers height of the ancient Japanese horse
from hoofprints. Anthropozoologica, 25-26:119-129
573
Ivey-Henry, P., Morelli, G.A., and Tronik, E,Z., 2005. Child caretakers among Efe foragers of
the Ituri forest. In B.S. Hewlett and M.E. Lamb (eds.) Hunter-gatherer childhood: evolutionary,
developmental and cultural perspectives. Routledge:London. Pp 191-214.
Jacobi, R.M., 1986. The history and literature of Pleistocene discoveries at Gough’s cave,
Cheddar, Somerset. Proceedings of the University of Bristol Spelaeological Society, 17(2):102-
115.
Jacobi, R.M., 1987. Misanthropic miscellany: musings on British Early Flandrian archaeology
and other flights of fancy. In P. Rowley, M. Zvelebil, and H.P. Blankholm, (eds.), Mesolithic
northwest Europe: recent trends. University of Sheffield Press:Shefield. Pp 163-168
Jaggar, T.J., 1921. Fossil human footprints in Kau Desert. Hawaii Volcano Observatory
Monthly Bulletin, 9:114-118.
Jaggar, T.A., 1934. Fossil human footprints in the Kau Desert. Paradise Pacific, 46(5):5.
Jakes, M., Lubell, D., and Meiklejohn, C., 1997. Healthy but mortal: human biology and the
first farmers of Western Europe. Antiquity, 71:639-658.
Jarman, M. 1972. European deer economies and the advent of the Neolithic. In E. Higgs (ed.)
Papers in economic prehistory: studies by members and associates of the British academy
major research project in the early history of agriculture. Cambridge University
Press:Cambridge. Pp 125-147.
Jasuja, O.P.M., 1993. Estimation of stature from footstep length. Forensic Science
International, 61:1-5.
Jasuja, O.P., Singh, J., and Jain, M., 1991. Estimation of stature from foot and shoe
measurements by multiplication factors: a revised attempt. Forensic Science International,
50:203-215.
Jasuja, O.P., Harbhajan, S., and Anupama, K., 1997. Estimation of stature from stride length
while walking fast. Forensic Science International, 86:181-186.
Jay, M., and Richards, M., P., 2007. British Iron Age diet: stable isotopes and other evidence.
Proceedings of the Prehistoric Society, 73:169-190.
Jenkinson, R.D, 1984. Creswell Crags. Late Pleistocene sites in the East Midlands. BAR British
series 122. Archaeopress:Oxford.
Jenkinson, R.D. and Bramwell, D. 1984. The birds of Britain: when did they arrive? In D.D.
Gilbertson & R.D. Jenkinson (eds.) In the shadow of extinction: a Late Quaternary archaeology
and palaeoecology of the lake, fissures and smaller caves at Cresswell Crags SSSI. British
Archaeological Report Series:University of Sheffield. Pp 89–99.
Jessen, K., 1924. De geologiske forhold ved de to bopladser I Holmegaards Mose. In H.C.
Bromhold (ed.) Nye fund fra den aeldste stenalder, Holmegaard og Svaerdboorgfundene.
Aarbøger for Nordisk Oldkyndighed og Histoire:Copenhagen. Pp 14-27.
Johnsgard, P.A., 1983. Cranes of the world. Indiana University Press:Bloomington.
Johst, K., Brandl, R., and Pfeifer, R., 2001. Foraging in a patchy and dynamic landscape:
human land use and white stork. Ecological Applications Ecological Society of America,
11(1):60-69.
Jones, N., 2002a. Description of the coast. In A. Davidson (ed.) The coastal archaeology of
Wales. CBA Research Report 131. Council for British Archaeology:York. Pp 9-19.
Jones, N., 2002b. Reclamation. In A. Davidson (ed.) The coastal archaeology of Wales, CBA
Research Report 131. Council for British Archaeology:York. Pp 81-86.
574
Jones, N.B., 2005. Why does childhood exist? In B.S. Hewlett and M.E. Lamb (eds.) Hunter-
gatherer childhoods: evolutionary, developmental and cultural perspectives.
Routledge:London. Pp 105-109.
Jones, R., 2010. A prehistoric hunting site at Lyndstep haven. Dyfed Archaeological Trust
Newsletter Spring 2010:Cadw.
Jones, P., 2013. A Mesolithic 'persistent place' at North Park Farm, Bletchingley, Surrey. Spoil
heap monograph 8. Spoil Heap Publications:Norfolk.
Kamei, N., 2005. Play among Baka children in Cameroon. In B. S. Hewlett & M. E. Lamb
(eds.) Hunter-gatherer childhoods: evolutionary, developmental and cultural perspectives.
Routledge:Abingdon. Pp 343-359.
Kanchan, T., Menzes, R.G., Moudgil, R., Kaur, R., Kotian, M.S., and Garg, R.K., 2010. Stature
estimation from foot length using universal regression formula in a North Indian population.
Journal of Forensic Science, 55(1):163-166.
Kanchan, T., Krishan, K., Shyamsundar, S., Aparna, K.R., and Jaiswal, S., 2012a. Analysis of
footprint and its parts for stature estimation in India. The Foot, 22(3):175-180.
Kanchan, T., Krishan, K., Aparna, K.R., and Shyamsunder, S., 2012b. Footprint ridge density: a
new attribute to sexual dimorphism. HOMO Journal of Comparative Human Biology,
63(6):468-480.
Kapel, H., 1969. En boplads fra tidlig-atlantisk tid ved Villingbaek. Fra Nationalmuseets
Arbejdsmark: Kobenhavn.
Kennard, A.S., 1945. The early digs at Kent’s Hole, Torquay, and Mrs Cazalet. Proceedings of
the Geologists’ Association, 56(4):193-213.
Kim, C.B., Kim, J.Y., Kim, K.S., and Lim, H.S., 2010. New age constraints for hominid
footprints found on Jeju Island, South Korea. Journal of Archaeological Science, 37:3338-
3343.
Kinahan, J., 1996. Human and domestic animal tracks in an archaeological lagoon deposit on
the coast of Nambia. The South African Archaeological Bulletin, 51:94-98.
King, J.E., 1962. Report on animal bones. In J. Wymer, Excavations at the Maglemosian sites
at Thatcham, Berkshire. Proceedings of the Prehistoric Society, 13:355-61.
Kipke, M.D., and the National Research Council and institute of Medicine Forum of
Adolescent Development, 1999. Adolescent Development and the Biology of Puberty. National
Academies Press:Washington. PP 1-3.
Klamer, A., 2014. The values of archaeological and heritage sites. Public Archaeology, 13 (1-
3):59-70.
Klenerman, L., and Wood, B., 2006. The human foot: a companion to clinical studies.
Springer:London.
Knight, M., 2009. Excavating a Bronze Age timber platform at Must Farm, Whittlesey, near
Peterborough. Past 63, November 2009. Pp 1-4.
Konner, M. J., 1972. Aspects of the developmental ethology of a foraging people. In N.G.B.
Jones (ed.) Ethological studies of child behaviour. Cambridge University Press:Cambridge.
Konner, M. J., 1977. Infancy among the Kalahari Desert San. In P.H. Leiderman, S.R. Tulkin,
and A. Rosenfeld (eds.) Culture and infancy. Academic Press:New York.
575
Konner, M., 2005. Hunter-gatherer infancy and childhood. The !Kung and others. In B.S.
Hewlett and M.E. Lamb (eds.) Hunter-gatherer childhoods: evolutionary, developmental and
cultural perspectives. Routledge:Abingdon. Pp 19-64.
Krishan, K., 2007. Individualizing characteristics of footprints in Gujjars of North India –
forensic aspects. Forensic Science International, 169:137-144.
Krishan, K., 2008a. Estimation of stature from footprints and foot outline dimensions in Gujjars
of North India. Forensic Science International, 175:93-101.
Krishan, K., 2008b. Establishing correlation of footprints with body weight – forensic aspects.
Forensic Science International, 179:63-69.
Krishan, K., Kanchan, T., and DiMaggio, J.A., 2010. A study of limb asymmetry and its effect
on estimation of stature in forensic case work. Forensic Science International, 200:181.e1–
181.e5.
Krishan, K., Kanchan, T., and Sharma, A., 2011. Sex determination from hand and foot
dimensions in a North Indian Population. Journal of Forensic Sciences, 56(2):453-459.
Krishan, K., and Sharma, A., 2007. Estimation of stature from dimensions of hands and feet in
a North Indian Population. Journal of Forensic & Legal Medicine, 14(6):327-332.
Krishan, K., Kanchan, T., Passi, N., and DiMaggio, J.A., 2012. Stature estimation from the
lengths of the growing foot – a study on North Indian adolescents. The Foot, 22(4):287-293.
Kulthanan, T, Techakampuch, S., and Bed, N.D, 2004. A study of footprints in athletes and
non-athletic people. Journal of the Medical Association of Thailand, 87(7):788-793.
Kutschera, W., Werner, R., 2000. Ötzi, the prehistoric Iceman. Nuclear Instruments and
Methods in Physical Research Section B Beam Interactions with Materials and Atoms, 164–
165:12–22.
Kyriakidis, E., and Anagnostopolos, A., 2015. Archaeological ethnography, heritage
management, and community archaeology: a pragmatic approach from Crete. Public
Archaeology, 14(4):240-262.
Lawrence, M.J., and Brown, R.W., 1967. Mammals of Britain: their tracks, trails and signs.
Blandford Press: London.
Leach, A. L., 1918. Flint-working sites on the submerged land (submerged forest) bordering the
Pembrokeshire Coast. Proceedings of the Geologists’ Association, 29(2):46–64
Leakey, M.D., 1978. Pliocene footprints at Laetoli, Northern Tanzania. Antiquity, 52:133.
Leakey, M. D., 1984. Disclosing the past. Doubleday: New York.
Leakey, M. D., 1987. Animals prints and trails. In M.D. Leakey and J.M. Harris (eds.) Laetoli:
a Pliocene site in northern Tanzania. Clarendon Press: Oxford. Pp 451-489.
Leakey, M.D., and Harris, J.M., 1987. Laetoli: a Pleistocene site in northern Tanzania.
Claredon Press: Oxford.
Leakey, M.D., and Hay, R.L., 1979. Pliocene footprints in the Laetoli beds at Laetoli, northern
Tanzania. Nature, 278:317-323.
Lee, R.B., 1972. Population growth and the beginnings of sedentary life among the !Kung
bushmen. In B. Spooner (ed.) Population growth: anthropological implications. MIT
Press:Massachusetts. Pp 329-342.
Lee, R.B., and Daly, R., 1999. The Cambridge encyclopaedia of hunters and gatherers.
Cambridge University Press: Cambridge.
576
Legge, A., and Rowley-Conwy, P., 1988. Star Carr revisited: a re-analysis of the large
mammals. Birkbeck College: London.
Leito, A., Ojaste, I., Truu, J., and Palo, A., 2005. Nest site selection of the Eurasian Crane Grus
grus in Estonia: an analysis of nest record cards. Ornis Fennica, 82:44-54.
Leutscher, A., 1960. Tracks and signs of British animals. Cleaver-Hume: London.
Lewis, M. P., 1992. The prehistory of coastal south-west Wales 7500–3600 BP: an
interdisciplinary palaeoenvironmental and archaeological investigation. Unpublished PhD
thesis, University of Wales, Lampeter.
Liebenberg, L., 1990. A field guide to the animal tracks of Southern Africa. David Phillip
Publishers: Johannesburg. Pp 103-155.
Lillie, M.C., 1997. Women and children in prehistory: resource sharing and social stratification
at the Mesolithic-Neolithic transition in Ukraine. In J. Moore and E. Scott (eds.) Invisible
people and processes: writing gender and childhood into European archaeology. Leicester
University Press: London. Pp 213-28.
Liutkus-Pierce, C.M., Zimmer, B.W., Carmichael, S.K., McIntosh, W., Deino, A., Hewitt,
S.M., McGinnis, K.J., Hartney, T., Brett, J., Mana, S., Deocampo, D., Richmond, B.G., Hatala,
K., Harcourt-Smith, W., Pobiner, B., Mettalo, A., and Rossi, V., 2016. Radioisotopic age,
formation, and preservation of Late Pleistocene human footprints at Engare Sero, Tanzania.
Palaeogeography, Palaeoclimatology, Palaeoecology, 463:68-82.
Livadie, C.A., 2002. A First Pompeii: the Early Bronze Age village of Nola–Croce del Papa
(Palma Campania phase). Antiquity, 76(294):941-942.
Lock, L., and Cook, K., 1998. The Little Egret in Britain: a successful colonist. British Birds,
91:273-280.
Lockley, M.G., 1991. Tracking dinosaurs: a new look at an ancient world. Cambridge
University Press: Cambridge. Pp 238.
Lockley, M., Yang, S.Y., Matsukawa, M., Flemming, F., and Lim, S.K., 1992. The track record
of Mesozonic birds: evidence and implications. Philosophical Transaction of the Royal Society,
B336:113-134.
Lockley, M.G., Vasquez, R.G., Espinoza, E., and Luca, S.G., 2009. America’s most famous
human footprints: history, context and first description of mid-Holocene tracks from the shores
of Lake Managua, Nicaragua. Ichnos, 16:55-69.
Locock, M., 1998. A prehistoric trackway at Cold Harbour Pill. Unpublished report for
CADW.
Locock, M., 1999. Iron Age and later features at Greenmoor Arch, (Gwent Europ Ark),
Newport. Archaeology in the Severn Estuary, 10:128-130.
Lovejoy, C.O., 1981. The origin of man. Science, 211:341-350.
Lovejoy, C.O., 1984. Methods of footprint analysis. Paper for seminar in footprint and
shoeprint identification, April 29, Federal Bureau of Investigation, Washington, DC. Pp 43.
Lozovskaya, O.V., and Lozovski, V.M., 2016. The use of wood at the Zamostje 2 site. In P.
Uino and K. Nordqvist (eds.) New site, new methods. Iskos 21. The Finnish Antiquarian
Society: Helsinki. Pp 59-71.
Lozovski, V., Lozovskaya, O., and Clemente Conte, I., 2013. Zamostje 2: lake settlement of the
Mesolithic and Neolithic fisherman in Upper Volga Region. IHMC RAS: St Petersburg.
577
Lydekker, R., 1891. Catalogue of the fossil birds in the British Museum (Natural History).
British Museum (Natural History): London.
Machin, S., 2018. Footprints at roman Silchester. [email] (Personnel communication 21st
February 2018).
Mafart, B., 2006. Anthropological study of Holocene footprints of the Sebkra El Azrag (Islamic
Republic of Mauritania). Anthropologie, 110(5):766-787.
Maltby, M., 1984. The animal bones. In M.G. Fulford (ed.) Silchester: Excavations on the
Defence 1974–1980. Cambridge University Press: Cambridge. Pp 199–212.
Malvern, 2017. Mastersizer 3000 smarter particle sizing. [online] Available at:
https://www.malvern.com/en/products/product-range/mastersizer-range/mastersizer-3000
[accessed 26 April 2017].
Mannermaa, K., Panteleyev, A., and Sablin, M., 2008. Birds in Late Mesolithic burials at
Yuzhniy Oleniy Ostrov (Lake Onega, Western Russia) – what do they tell about humans and
the environment? Fennoscandia archaeologica, XXV:3-25.
Manning, A. J., Langston, W.J., and Jonas, P.J.C., 2010. A review of sediment dynamics in the
Severn Estuary: influence of flocculation. Marine Pollution Bulletin, 61:37–51.
Månsson, J., Nilsson, L., and Hake, M., 2013. Territory size and habitat selection of breeding
common crane (Grus grus) in boreal landscape. Ornis Fennica, 90:65-72.
Marcos, E.L., 2001. El descumbrimiento de las Huellas Prehistoricas: Ojo Guarena, Cubia.
Bolétin del Grupo Espeliológico Edelweiss, 3:34-35.
Marlowe, F.W., 2005.Hunter-gatherers and human evolution. Evolutionary Anthropology,
14:54-67.
Maroo, S., and Yalden, D.W., 2000. Mesolithic fauna of Great Britain. Mammal Review,
30(3/4):243-248.
Marty, D., Strasser, A., and Meyer, C.A., 2009. Formation and taphonomy of human footprints
in microbial mats of present-day tidal-flat environments: implications for the study of fossil
footprints. Ichnos, 16:127-142.
Masao, F.T., Ichumbaki, E.B., Cherin, M., Barili, A., Boschian, G., A lurion, D., Menconero,
S., Moggi-Cecchi, J., and Manzi, G., 2016. New footprints from Laetoli (Tanzania) provide
evidence for marked body size variation in early hominins. Genomics and Evolutionary
Biology, 5:e19568.
Mastrolorenzo, G., Petrone, P., Pappalardo, L., and Sheridan, M.F., 2006. The Avellino 3780-
yr-B.P. catastrophe as a worst case scenario for a future eruption at Vesuvius. Proceedings of
the National Academy of Science, 103:4366-4370.
Matthews, N.A., and Breithaupt, B.H., 2001. Close-range photogrammtric experiments at
Dinosaur Ridege. The Mountain Geologist, 38(3):147-153
Mayor, A., and Sarjeant, W.A.S., 2001. The folklore of footprints in stone: from classical
antiquity to the present. Ichnos, 8(2):143-163.
McGimsey, C.R., 1972. Public Archaeology. Seminar Press: London.
McLaren, D., Fedje, D., Dyck, A., Mackie, Q., Gauvreau, A., and Cohen, J., 2018. Terminal
Pleistocene epoch human footprints from the Pacific coast of Canada. PLoS ONE,
13(3):e0193522.
578
McMinn, R.M.H., Hutchings, R.T., Pegington, J., and Abrahams, P., 1993. A colour atlas of
human anatomy third edition. Wolfe publishing: London.
McQuade, M., and Gowen, M., 2007. Excavations.ie database of Irish excavation report.
[online] Available at: http://www.excavations.ie/report/2007/Dublin/0017470/ [accessed 4th
January 2018].
Mech, L. David. 1990. Who’s Afraid of the Big Bad Wolf? Audubon, 92(2):82-85.
Meek, J., 2012. Borth coastal defence scheme: phase 1, Borth, Ceredigion: archaeological
watching brief. Dyfed archaeological trust report 2012/2013.
Meldrum, D.J., Lockley, M.G., Lucas, S.G., and Musiba, C., 2011. Ichnotaxonomy of the
Laetoli trackways: the earliest hominin footprints. Journal of African Earth Science, 60(1):1-12.
Mellart, J., 1966. Excavations at Çatal Höyük, 1965: fourth preliminary report. Anatolian
Studies, 16: 165-191.
Meltzer, D.J., Grayson, D.K., and Ardilla, G., 1997. On the Pleistocene antiquity of Monte
Verde, Southern Chile. American Antiquity, 62(4):659-663.
Mellars, P., 1976. Fire ecology, animal populations and man: a study of some ecological
relationships in prehistory. Proceedings of the Prehistoric Society, 42:15-45
Mellars, P.A., 1987. Excavations on Oronsay: prehistoric human ecology on a small island.
Edinburgh University Press: Edinburgh.
Mellars, P., and Wilkinson., M.R., 1980. Fish otoliths as indicators of seasonality in prehistoric
shell middens: the evidence from Oronsay (Inner Hebrides). Proceedings of the Prehistoric
Society, 46:19-44.
Mellars, P., and Dark, P.,1998. Star Carr in context: new archaeological and palaeoecological
investigations at the Early Mesolithic site of Star Carr, North Yorkshire. McDonals Institute for
Archaeological Research: Cambridge.
Merriman, N., 2004. Introduction. In N. Merriman (ed.) Public Archaeology. Routledge:
London. Pp 1-17.
Mietto, P., Avanzini, M., and Rolandi, G., 2003. Human footprints in Pleistocene volcanic ash.
Nature, 422:133.
Milan, J., Clemmensen, L.B., Buchard, B., and Noe-Nygaard, N., 2006. Tracking the Bronze
Age fauna: preliminary investigations of a new Late Holocene track site, Lodbjerg dune system,
northwest Jylland, Denmark. Hantkeniana, 5:42-45.
Milne-Edwards, A., 1869. Recherches anatomiques et paléontologiques pour server à l’histoire
des oiseaux fossils de la France, Vol. 2. Masson: Paris.
Milne-Edwards, A., 1875. Observations sur les oiseaux don’t les ossements ont été trouvés dans
les caverns du Sud-Ouest de la France. Matériaux pour L’Histoire Primitive et Naturelle de
l’Homme (Ser. 2) 6:498-499.
Milner, N., 1999. Pitfalls and problems in analysing and interpreting the seasonality of faunal
remains. Archaeological Review from Cambridge, 16(1):51-67.
Milner, N 2009a Mesolithic middens and marine molluscs, procurement and consumption of
shellfish at the site of Sand, in K. Hardy and C.R. Wickham-Jones (eds.) Scotland's first
settlers: Mesolithic and later sites around the Inner Sound, Scotland. Scottish Archaeological
Internet Reports 31. Society of Antiquaries of Scotland: Edinburgh.
579
Milner, N., 2009b. Mesolithic consumption practices, food for thought. Journal of Nordic
Archaeological Science, 16:49-63
Milner, N., Craig, O.E., and Bailey, G.N., 2007. Shell middens in Atlantic Europe. Oxbow
books: Oxford.
Miskovski, J.C., 1967. Les paeosols Mindel-Riss et Riss-Wurm de Terra Amata. Etude
sédimentologique. Académie Science Paris, 264:2361-2363.
Mithen, S., 1999. Hunter-gatherers of the Mesolithic. In J. Hunter and I. Ralston (eds.) The
archaeology of Britain: an introduction from the Upper Palaeolithic to the Industrial
Revolution. Routledge: London. Pp 35-58.
Moll, K. H., 1963. Kranichbeobachtungen aus dem Müritzgebiet. Beitr. Vogelk. 8:221-253.
Mooney, S. D., S. P. Harrison, P. J. Bartlein, A.-L. Daniau, J. Stevenson, K. C. Brownlie, S.
Buckman, Cupper, M., Luly, J., Black, M., Colhoun, E., D’Costa, D., Dodson, J., Haberle, S.,
Hope, G.S., Kershaw, P., Kenyon, C., McKenzie, M., and Willianms, N., 2011. Late
Quaternary fire regimes of Australasia. Quaternary Science Reviews, 30(1-2):28–46.
Moore, J., 1997. Conclusion: the visibility of invisible. In J. Moore and E. Scott (eds.) Invisible
people and processes writing gender and childhood into European archaeology. Leicester
University Press: London. Pp 251-258.
Moorthy, N.T., Ling, A.Y., Sarippudin, S.A., and Hassan, F.N.H. 2014a. Estimation of stature
from footprint and foot outline measurements in Malaysian Chinese. Australian Journal of
Forensic Sciences, 46(2):136-159.
Moorthy, T.N., Mostapa, A.M.B., Boominathan, R., and Raman, N., 2014b. Stature estimation
from footprint measurements in Indian Tamils by regression analysis. Egyptian Journal of
Forensic Science, 4(1):7-16.
Morgan, L.E., Renne, P.R., Kieffer, G., Piperno, M., Gallotti, R., and Raynal, J., 2012. A
chronological framework for a long and persistent archaeological record: Melka Kunture,
Ethiopia. Journal of Human Evolution, 62(1):104-115.
Morse, S.A., Bennet, M.R., Gonzalez, S., Huddart, D., 2010. Techniques for verifying human
footprints: reappraisal of pre-Clovis footprints in Central Mexico. Quaternary Science Review,
29:2571-2578.
Morse, S.A., Bennet, M.R., Liutkus-Pierce, C., Thackerary, F., McClymont, J., Savage, R., and
Crompton, R.H., 2013. Holocene footprints in Nambia: the influence of substrate on footprint
variability. American Journal of Physical Anthropology, 151:265-279.
Morton, S. R., Stafford Smith, D.M., Dickman, C.R., Dunkerley, D.L., Friedel, M.H.,
McAllister, R.R.J., Reid, J.R.W., Roshier, D.A., Smith, M.A., Walsh, F.J., Wardle, G.M.,
Watson, I.W., and Westoby, M., 2011. A fresh framework for the ecology of arid Australia.
Journal of Arid Environments, 75(4):313–329.
Mountain, E.D., 1966. Footprints in calcareous sandstone at Nahoon Point. South African
Journal of Science, 62:103-111.
Mughal, Z., 2012. Resurgence of vitamin D deficiency rickets in the UK. Endochrine Abstracts,
28:S7.4.
Murchison, M.A., Owsley, D.W., and Riopelle, A.J., 1984. Transverse line formation in
protein-deprived rhesus monkeys. Human Biology, 56(1):172-182.
Murphy, K., 2002. The archaeological resource: chronological overview to 1500 AD. In A.
Davidson (ed.) The Coastal Archaeology of Wales. CBA Research Report 131. Council for
British Archaeology: York. Pp. 45-65.
580
Murphy, K., Caseldine, A. E., Barker, L., Fielding, S., Burrow, S., and Carlsen, S., 2014.
Mesolithic human and animal footprints at Lydstep Haven, Pembrokeshire, 2010: the
environmental context. Archaeologica Cambrensis, 163: 23-41.
Museum Lolland-Falster, 2014. Fortidens spor i nutidens øjne. [online] Available at:
http://www.aabne-
samlinger.dk/femernforbindelsen/femernforbindelsen/nyheder/2014/141106_foedder/
[accessed 12th November 2017].
Musiba, C.M., Tuttle, R.H., Hallgrimsson, B., and Webb, D.M.,1997. Swift and sure-footed on
the Savanna: a study of Hadzabe gaits and feet in Northern Tanzania. American Journal of
Human Biology, 9:303-321.
Nakamura, J.J. M., 2009. Hominid footprints in recent volcanic ash: new interpretations from
Hawaii volcanoes national park. Ichnos, 16:118-123.
National Trust, no date. Beyond the Formby footprints. [online] Available at:
www.nationaltrust.org.uk/formby/projects/beyond-the-formby-footprints [accessed 12th June
2017].
Nayling, N., 1998. The Magor Pill medieval wreck. CBA Research Report 115. Council for
British Archaeology: York.
Nayling, N., 2002. Environmental archaeology. In A. Davidson (ed.) The coastal archaeology
of Wales. CBA Research Report 131. Council for British Archaeology: York. Pp 25-33.
Nayling, N., and Manning, S., 2007. Dating the submerged forest: dendrochronology and
radiocarbon ‘wiggle-match’ dating. In M. Bell (ed.) Prehistoric coastal communities: the
Mesolithic in western Britain. CBA Research Report 149. Council for British Archaeology:
York. Pp 90-102.
Neumann, H., 2000. The intertidal peat survey, in M. Bell, A.E. Caseldine and H. Neumann
(eds.) Prehistoric intertidal archaeology in the Welsh Severn Estuary, CBA Research Report
120. Council for British Archaeology: York. Pp 282-321.
Newton, E.T., 1905. Bones from Silchester. Archaeologia, 61:213–214.
NHS Digital, 2010. Infant feeding survey – 2010. [online] Available at:
https://data.gov.uk/dataset/infant-feeding-survey-2010 [accessed 28th November 2017].
Noe-Nygaard, N., 1983a. A new find of brown bear (Ursus arctos) from Star Carr and other
finds in the Late Glacial and Post Glacial of Britain and Denmark. Journal of Archaeological
Science, 10:317-325.
Noe-Nygaard, N., 1983b. The importance of aquatic resources to Mesolithic man at inland sites
in Denmark. In C. Grigson and J. Clutton-Brock (eds.) Animals and Archaeology: Shell
middens, fishes and birds. BAR international series volume II. British Archaeological Reports
Series 183: London.
Northcote. E.M., and Mourer-Chauviré, C., 1985. The distinction between the extinct
Pleistocene European crane, Grus pritnigenia, and the extant Asian Sarus Crane, G. antigone.
Geobios, 18:877- 881.
Noval Fonseca, M.A., 2007. Cuevas tempranas (Posada, Llanes): Fragil Rastro del Pasado.
Excavaciones arqueologicos en Asturias 1999-2002, Gobierno del Principado de Asturias.
Servicio de Publicaciones: Oviedo. Pp 207-213.
Nowald, G., 2003. Bedingungen für den Fortpflanzungserfolg: Zur Öko-Ethologie des
Graukranichs Grus grus während der Jungenaufzucht. Unpublished dissertaition, University of
Osnabrück.
581
Nowald, G., and Fleckstein, T., 2001. Food availability and diet of Common Crane families
(Grus grus) in northeast Germany during rearing period. Volgelwarte, 41(2):93-108.
Oakley, K.P., 1971. British Isles. In K.P. Oakley, B.G. Campbell, and T.I. Molleson (eds.)
Catalogue of Fossil Hominids, Part II: Europe. British Museum (Natural History):London. Pp
15-43.
O’Connor, T.P., 2000. The Archaeology of Animal Bones. Stroud: Sutton.
Office of National Statistics 2010. ‘Average’ Briton highlighted on UN world statistics day.
[online] Available at:
http://webarchive.nationalarchives.gov.uk/20160105160709/http://www.ons.gov.uk/ons/about-
ons/get-involved/events/events/un-world-statictics-day/-average--briton-highlighted-on-un-
world-statistics-day.pdf [accessed 12th November 2017].
Office for national statistics 2011. Health and social care. [online] Available at:
www.ons.gov.uk/peoplepopulationandcommunity/healthandsocialcare [accessed 12th
November 2017].
Onac, B.P., Viehmann, L., Lundberg, J., Lauritzen, S.E., Stringer, C., and Popita, V., 2005. U-
Th ages constraining the Neanderthal footprint at Vartop Cave, Romania. Quaternary Science
Reviews, 24:1151-1157.
Overton, N.J., 2014. Memorable meeting in the Mesolithic: tracing the biography of human –
nonhuman relationships in the Kennet and Colne Valleys with social zooarchaeology.
University of Manchester unpublished thesis.
Ozansoy, F., 1969. Pleistocene fossil human footprints in Turkey. Bulletin of the Mineral
Research and Exploration Institute of Turkey, 72:146-150.
Ozden, H., Balci, Y., Demirüstü, C., Turgit, A., and Ertugrul, M., 2005. Stature and sex
estimate using foot and shoe dimensions. Forensic Science International, 147:181-184.
Pablos, A., Lorenzo, C., Martı´nez, I., Bermu´dez de Castro, J.M., Martino´n-Torres, M.,
Carbonell, E., and Arsuaga, J.L., 2012. New foot remains from the Gran Dolina-TD6 Early
Pleistocene site (Sierra de Atapuerca, Burgos, Spain). Journal of Human Evolution, 63:610–
623.
Page, S., 2016. Eating out in Skye 8,000 years ago. [online] Available at:
https://archaeologyorkney.com/2016/02/09/eating-out-in-skye-8000-years-ago/ [accessed 22nd
November 2016].
Pai, B., and Shaw, N., 2011. Understanding rickets. Paediatrics and Child Health, 21(7):315-
321.
Pales, L., 1955. Les empreintes de pieds humains de la Tana della Basura (Toirano). Revue
d’Etudes Ligures, 1:1-12.
Pales, L. 1960. Les empreintes de pieds humains de la ‘Tanna della Basura’ (Tororiano). Revue
des études ligures, 26:25-90
Pales, L., 1976. Les empreintes de pieds Humains dans le caverns. Archives de l’institut de
Paleontologie Humaine, 36:1-166.
Palmer, S., 1999. Culverwell Mesolithic habitation site, isle of Portland, Dorset: excavation
and research studies (BAR British Series). British Archaeological Reports: Oxford.
Parfitt, S.A., Ashton, N.M., Lewis, S.G., Abel, R.L., Coope, G.R., Field, M.H., Gale, R., Hoare,
P.G., Larkin, N.R., Lewis, M.D., Karloukovski, V., Maher, B.A., Peglar, S.M., Preece, R.C.,
Whittaker, J.E., and Stringer, C.B., 2010. Early Pleistocene human occupation at the edge of the
boreal zone in northwest Europe. Nature, 466:229–233.
582
Parkhouse, J., 1991. Second Severn Crossing, English approach. Stage 2 archaeological
assessment. Severn Estuary Levels Research Committee Annual Report. SELRC: Lampeter. Pp
11-14.
Parry, R.F., 1929. Excavations at the caves, Cheddar. Proceedings of Somerset Archaeology
and Natural History Society, 74:102-121.
Parry, R.F., 1931. Excavations at Cheddar. Proceedings of Somerset Archaeology and Natural
History Society, 76:46-62.
Pearson, C., 2013. Tree Ring studies from Redwick buildings and associated sites. In M. Bell
(ed.) The Bronze Age in the Severn Estuary. CBA Research Report 172. Council for British
Archaeology: York. Pp 82-89.
Pedersen, L., 1995. 7000 years of fishing: stationary fishing structures in the Mesolithic and
afterwards. In A. Fischer (ed.) Man and sea in the Mesolithic. Coastal settlement above and
below present sea level. Oxbow monograph 53. Oxbow books: Oxford. Pp 75-86.
Pedersen, L., 1997. Stone Age fishers at the Halsskov Fjord. In L. Pedersen, A. Fischer and B.
Aaby (eds) The Danish Storebaelt since the ice age – man, sea and forest. A/S Storebaelt fixed
link: Copenhagen. Pp 109-201.
Peglar, S.M., 1993. The mid-Holocene Ulmus decline at Diss Mere, Norfolk, UK: a year-by-
year pollen stratigraphy from annual laminations. Holocene, 3:1-13.
Pemberton, S.G., McCrea, R., Gingras, M.K., Sarjeant, W.A.S., and MacEachern J.A., 2008.
History of ichnology: the correspondence between the Reverend Henry Duncan and the
Reverend William Buckland and the discovery of the first vertebrate footprints. Ichnos, 15:5-
18.
Perl, D.P., Daoud, A.I., and Lieberman, D.E., 2012. Effects of footwear and strike type on
running economy. Medicine and Science in Sports and Exercise, 44(7):1335-1343.
Pfeiffer, S., and Crowder, C., 2004. An Ill child among Mid-Holocene foragers of Southern
Africa. American Journal of Physical Anthropology, 123:23- 29.
Pinhasi, R., Gasparian, B., Areshian, G., Zardaryan, D., Smith, A., Bar-Oz, A., and Higham, T.,
2010. First direct evidence of Chalcolithic footwear from the Near Eastern Highlands. PLoS
ONE, 5(6):e10984
Platt, M., 1933. Report on the animal bones from Jarlshof, Sumburgh, Shetland. In A.O. Curle
(ed.) Further excavations at Jarlshof, Shetland. Proceedings of the Society of Antiquaries of
Scotland, 67:127–136.
Platt, M., 1956. The animal bones. In J.R.C. Hamilton (ed.) Excavations at Jarlshof, Shetland
no 1. HMSO:London. Pp 212-215.
Polat, M.A., 2013 Neolithic period. In Z. Kiziltan and G. Baran Çelik (eds.) Stories from the
hidden harbour: the shipwrecks of Yenikapi. Istanbul Archaeological Museums Press: Istanbul.
Pp 77-93.
Pollard, T., Atkinson, J., and Banks, I., 1996. It is the technical side of the work which is my
stumbling block: a shell midden at Risga reconsidered. In T. Pollard and A. Morrison (eds.) The
early prehistory of Scotland. Edinburgh University Press:Edinburgh. Pp 165-182.
Pontzer, H., Raichlen, D.A., Wood, B.M., Mabulla, A.Z.P., Racette, S.B., and Marlowe, F.W.,
2012. Hunter-gatherer energetics and human obesity. PLoS ONE, 7(7):e40503
Pop, E., and Bakels, C., 2015. Semi-open environmental conditions during phases of hominin
occupation at the Eemian Interglacial basin site Neumark-Nord 2 and its wider environment.
Quaternary Science Reviews, 117:72–81.
583
Prestwich, J., 1874. Report on the exploitation of Brixham cave. Philosophical Transactions of
the Royal Society of London, 163(2):471-572.
Preusser, F., Degering, D., Fuchs, M., Hilgers, A., Kadereit, A., Klasen, N., Krbetchek, M.,
Richter, D., and Spencer, J.Q.G., 2008. Luminescence dating: basics, methods and applications.
Quaternary Science Journal, 57(1-2):95-149.
Price, N. 1995. Houses and horses in the Swedish Bronze Age: recent excavations in the Mälar
valley, Past 20:10–12.
Pryor, F.M.M., 1998. Farmers in Prehistoric Britain. Tempus Publications: Stroud.
Pye, K., and Neal, A., 1993. Stratigraphy and age structure of the Sefton dune complex:
preliminary results of field drilling investigations. In D. Atkinson and J. Houston (eds) The
Sand Dunes of the Sefton Coast. National Museums and Galleries on Merseyside: Liverpool. Pp
41-44.
Rackham, O., 1986. The history of the countryside. JM Dent: London.
Rackham, J., 1994. Interpreting the Past: Animal Bones. British Museum Press: London.
Raichlen, D.A., Gordon, A.D., Harcourt-Smith, W.E.H., Foster, A.D., and Haas, W.R., 2010.
Laetoli Footprints Preserve Earliest Direct Evidence of Human-Like Bipedal Biomechanics.
PLoS ONE, 5(3):e9769.
Recharte, M., M. Bowler, and R. Bodmer, 2008. Potential conflict between fishermen and giant
otter (Pteronura brasiliensis) populations by fishermen in response to declining stocks of
arowana fish (Osteoglossum bicirrhosum) in north eastern Peru. IUCN Otter Specialist Group
Bulletin, 25:89–93.
Rector, C.H., 1979. 5,000-year-old footprints on the Mojave River, California, USA. Antiquity,
54:149-150.
Rector, C.H., 1983. Appendix B, Ancient human and animal trackways. In C.H. Rector, J.D.
Swenson, and P.J. Wilke (eds.) Archaeological studies at Oro Grande, Mojave Desert,
California. San Bernardino County Museum Association: California. Pp 181.
Rector, C.H., Swenson, J.D., and Wilke, P.J., 1984. Archaeological studies at Oro Grande. San
Bernardio County Museum Association: California. Pp 46-55.
Rector, C.H., 1999. Human and animal trackway at Oro Grande. In R.E. Reynolds (ed.) Fossil
footprints. San Bernardino Country Museum Association California. Pp 53-55.
Reel, S., Rouse, S., Vernon, W., and Doherty, P., 2010. Reliability of a two-dimensional
footprint measurement approach. Science and Justice, 50:113-118.
Reel, S., Rouse, S., Vernon, W., and Doherty, P., 2012. Estimation of stature from static and
dynamic footprints. Forensic Science International, 219(1-3):283.e1- 283.e5.
Regnell, M., 2012. Plant subsistence and environment at the Mesolithic site Tågerup, southern
Sweden: new insights on the “nut age”. Vegetation History of Archaeobotany, 21:1-16.
Regnell, M., Gaillard, M.J., Bartholian, T.S., and Karsten, P., 1995. Reconstruction of the
environment and history of plant use during the Late Mesolithic (Ertebølle culture) at the inland
settlement of Blökenberg iii, Southern Sweden. Vegetation History of Archaeobotany, 4:67-91.
Remondino, F., Rizzi, A., Girardi, S., Petti, F.M., and Avanzini, M., 2010. 3D Ichnology-
recovering digital 3D Models of dinosaur footprints. The Photogrammetric Record,
25(131):266-282.
584
Renfrew, C., and Morley, I., 2009. Becoming human: innovation in prehistoric material and
spiritual culture. Cambridge University Press: Cambridge.
Richmond, B.G., Hatala, K.G., Harcourt-Smith, W.E.H., Rossi, V., and Metallo, A., 2011.
Early modern human footprint assemblage from Engare Sero, Tanzania. Paleoanthropology,
2011:A31.
Rippon, S., 1997. The Severn Estuary: landscape evolution and wetland reclamation. Leicester
University Press: London. Pp 31-47.
Riscutia, C., and Riscutia, I., 1970. Etude anthropologique des empreintes humaines du la grotte
"Ciurului-Izbuc". In E.G. Racovitza (ed.) Livre Du Centenaire, 1868–1968. Editions de l’Acad
emie de la Republique Socialiste de Roumanie: Bucarest. Pp 529–533.
Robbins, L.M., 1974. Prehistoric people of the Mammoth Cave area. In P.J. Watson (ed.)
Archaeology of the Mammoth Cave Area. Academic Press: New York. Pp 137-162.
Robbins, L.M., 1978. The individuality of human footprints. Journal of Forensic Sciences,
23:778-785.
Robbins, L.M., 1985. Footprint collection, analysis, and interpretation. Charles C. Thomas:
Springfield, IL.
Robbins, L.M., 1986. Estimating height and weight from size of footprints. Journal of Forensic
Sciences, 31:143-152.
Robbins, L.M.,1987. Hominid footprints from Site G. In M.D. Leakey and J.M. Harris (eds.)
Laetoli: a Pliocene site in Northern Tanzania. Clarendon Press: Oxford. Pp 497-502.
Roberts, E.J., 1995. The height distribution of a Stone Age population compared with that of a
modern population. Unpublished ‘A’ Level Oxford mathematics and statistics project.
Roberts, D., 2008. Last interglacial (c.117 kyr) human footprints from South Africa. South
Africa Journal of Science, 93:349-350.
Roberts, G., 2009. Ephemeral, subfossil mammalian, avian and hominid footprints within
Flandrian sediment exposures at Formby Point, Sefton Coast, North West England. Ichnos,
16:33-48.
Roberts, G., 2014. The lost world of Formby Point: footprints on the prehistoric landscape,
5000BC to 100 BC. The Alt Press: Liverpool.
Roberts, M., 2014. Obesity in wildfowl. [conversation] (Personnel communication January
2014).
Roberts, G., Gonzalez, S., and Huddart, D. 1996. Intertidal Holocene footprints and their
archaeological significance. Antiquity, 70:647–651.
Roberts, D., and Berger, L.R., 1997. Last interglacial (c.117 Kr) human footprints from South
Africa. South African Journal of Science, 93(8):349-350.
Roberts, G., and Worsley, A., 2008. Evidence of human activity in mid-Holocene coastal
palaeoenvironments of Formby, north west England. In J. M. Lewis and J. E. Stanistreet (eds.)
Sand and Sea Sefton’s coastal heritage: archaeology, history and environment of a landscape
in north west England. Sefton Council: Bootle. Pp 28-44.
Robinson, D.E., and Harild, J.A., 2002. Archaeobotany of an early Ertebølle (Late Mesolithic)
site at Halsskov, Zealand, Denmark. In J.G. Hather and S.L.R. Mason (eds.) Hunter-gatherer
archaeobotany: perspectives from the northern temperate zone. University of London Institute
of Archaeology Publications London.
585
Robinson, R., A., Crick, H.Q.P., Learmonth, J. A., Maclean, I.M.D., Thomas, C.D., Bairlein, F.,
Forchhammer, M.C., Francis, C.M., Gill, J. A., Godley, B.J., Harwood, J., Hays, G.C., Huntley,
B., Hutson, A.M., Pierce, G.J., Rehfisch, M.M., Sims, D.W., Santos, M.B., Sparks, T.H.,
Stroud, D.A. and Visser, M.E. 2009. Travelling through a warming world: climate change and
migratory species. Endangered Species Research, 7(2):87-99.
Robson, H.K., Little, A., Jones, A.K.G., Blockley, S., Candy, I., Matthews, I., Palmer, A.,
Schreve, D., Tong, E., Pomstra, D., Fletcher, L., Hausmann, N., Taylor, B., Conneller, C., and
Milner, N., 2016. Scales of analysis: evidence of fish and fish processing at Star Carr. Journal
of Archaeological Science: Reports 17:895-903.
Rocks-Macqueen, D., 2012. Archaeologists’ perceptions on public outreach and education.
Online Journal in Public Archaeology, 2:100–121.
Romano, M., and Whyte, M.A., 2003. Jurassic dinosaur tracks and trackways of the Cleveland
Basin, Yorkshire: preservation, diversity and distribution. Proceedings of the Yorkshire
Geological Society, 54:181-215.
Rooney, B.L., and Schauberger, C.W., 2002. Excess pregnancy weight gain and long-term
obesity: one decade later. Obstetrics & Gynecology, 100:245-252.
Roopsind, I. 2002. Fish consumption by giant otters (Pteronura brasiliensis) in the North
Rupununi Wetlands. Undergraduate Monograph, University of Guyana, Guyana. Pp 17.
Rosas-Riberio, P.F., Rosas, F.C.W., and Zuanon, J., 2011. Conflict between fishermen and
giant otters Pteronura brasiliensis in Western Brazilian Amazon. Biotropica: The Journal of
the Association for Tropical Biology and Conservation, 44(3):437-444.
Roscoe, P., 2006. Fish, game, and the foundations of complexity in forager society: the
evidence from New Guinea. Cross-cultural Research, 4(1):29-46.
Rose, M., 2005. When Giants Roamed the Earth. Archaeology a publication of the
Archaeological Institute of America. [online] Available at:
http://archive.archaeology.org/0511/etc/giants.html [accessed 7th April 2017].
Rosenlund, K., 1980. The bone material from the settlement Lundy II. In B. Henriksen (ed.)
Lundy-holmen. Sites of the Maglemose Culture in Sydsjaelland. Nordiske Fortidsminder:
Copenhagen. Pp 128–142.
Rowe, P., 2015. Hunting the hunter gatherers Mesolithic Teeside. Historic England. [online]
Available at:
http://www.teesarchaeology.com/downloads/documents/Mesolithic_Teesside_Booklet.pdf
[accessed 22nd January 2018].
Russell, N., 2011. Social zooarchaeology: humans and animals in prehistory. Cornell
University:New York.
Russell, N., and McGowan, K.J., 2003. Dance of the cranes: crane symbolism at Çatalhöyük
and beyond. Antiquity, 77(297):445-455.
Russell, N., and McGowan, K.J., 2005. Çatalhöyük bird bones. In I. Hodder (ed.) Inhabiting
Çatalhöyük reports from the 1995-1999 season. Çatalhöyük research project volume 4. BIAA
monograph 38. McDonald Institute monographs:Cambridge. Pp 99-111.
Rüther, H., Smit, J., and Kamamba, D., 2012. A comparison of close-range photogrammetry to
terrestrial laser scanning for heritage documentation. South African Journal of Geomatics,
1(2):149-162.
586
Saville, A., 1990. Hazleton North, Gloustershire, 1979-82: the excavation of a Neolithic long
cairn of the Cotswold-Severn group. HBMCE Archaeological Report 13. English
Heritage:London.
Saxena, S.K., 1984. A study of correlation and estimation of stature from hand length, hand
breadth and sole length. Anthropologischer Anzeiger, 42:271- 276.
Scaillet, S., Vita-Scaillet, G., and Guillo, H., 2008. Oldest human footprints dated by Ar/Ar.
Earth and Planetary Science Letters, 275:320-325.
Scales, R, 2006. Prehistoric coastal wetland exploitation: the evidence of footprint-tracks and
animal bones, with reference to the Severn Estuary. Unpublished PhD, Department of
Archaeology, University of Reading.
Scales, R. 2007a. Footprint tracks of people and animals. In M. Bell (ed.) Prehistoric coastal
communities: the Mesolithic in Western Britain. CBA Research Report 149. Council of British
Archaeology:York. Pp 139-147.
Scales, R., 2007b. Mammal bones. In M. Bell (ed.) Prehistoric coastal communities: the
Mesolithic in Western Britain. CBA Research Report 149. Council of British
Archaeology:York. Pp 160-166.
Schadla-Hall, T. 1999. Editorial: Public Archaeology. European Journal of Archaeology,
2(2):147–158.
Scheuer, L., and Black, S., 2004. The juvenile skeleton. Elsevier Academic Press:London.
Schmincke, H.U., Kutterolf, S., Perez, W., Rausch, J., Freundt, A., and Strauch, W., 2009.
Walking through volcanic mud: the 2,100-year-old Achualinca footprints (Nicaragua). Bulletin
of Volcanology, 71:479-493.
Schmincke, H.U., Rausch, J., Kutterolf, S., and Freundt, A., 2010. Walking through volcanic
mud: the 2,100-year-old Acahualinca footprints (Nicaragua): the Acahualinca people,
environment and conditions. International Journal of Earth Sciences, 99(1):S279-S292.
Schmidt, K., 2012. Göbekli Tepe: a Stone Age sanctuary in South-Eastern Anatolia. Ex-
Oriente e.V.: Berlin.
Schulting, R. J., 2000. New AMS dates from the Lambourn long barrow and the question of the
earliest Neolithic in southern England: repacking the Neolithic package? Oxford Journal of
Archaeology, 19(1):25–35.
Schulting, R.J., 2005. Pursuing a rabbit in Burrington Combe: new research on the Early
Mesolithic burial cave of Aveline’s Hole. Proceedings of the University of Bristol
Spelaeological Society, 23(3): 171-265.
Schulting, R.J., Gardiner, P.J., Hawkes, C.J., and Murray, E., 2010. The Mesolithic-Neolithic
human bone assemblage from Totty Pot. Proceedings of the University of Bristol Speleological
Society, 25(1): 75-95.
Schulting, R., Fibiger, L., MacPhail, R., McLaughlin, R., Murray, E., Price, C., and Walker,
EA., 2013. Mesolithic and Neolithic human remains from Foxhole Cave, Gower, South Wales.
Antiquaries Journal, 93:1-23.
Schulting, R.J., and Richards, M.P., 2000. The use of stable isotopes in studies of subsistence
and seasonality in the British Mesolithic. In R. Young (ed.) Mesolithic lifeways: current
research from Britain and Ireland. University of Leicester Press:Leicester. Pp 55-65.
Schulting, R.J., and Richards, M.P., 2002a. The wet, the wild and the domesticated: the
Mesolithic-Neolithic transition on the west coast of Scotland. Journal of European
Archaeology, 5(2):147-189.
587
Schulting, R.J., and Richards, M.P., 2002b. Finding the coastal Mesolithic in southwest Britain:
AMS dates and stable isotope results on human remains from Caldey Island, Pembrokeshire,
South Wales. Antiquity, 76:1011-1025.
Schulting, R., and Wysocki, M., 2002. The Mesolithic human skeletal remains at Aveline’s
Hole: a preliminary note. Proceedings of the University of Bristol Speleological Society,
22(3):255-268.
Scherjon, F., Bakels, C., MacDonald, K., and Roebroeks, W., 2015. Burning the land: an
ethnographic study of off-site fire use by current and historically documented foragers and
implications for the interpretation of past fire practices in the landscape. Current Anthropology,
56(3):299-326.
Scott, J.J., Renaut, R.W., and Bernhart Owen, R., 2008. Preservation and paleoenvironmental
significance of a footprinted surface on the Sandai Plain, Lake Bogoria, Kenya Rift Valley.
Ichnos, 15(3-4):208-231.
Scrivner, P., and Bottjer, D., 1986. Neogene avian and mammalian tracks from Death Valley
National Monument, California: their context, classification and preservation.
Palaeogeography, Palaeoclimatology, Palaeoecology, 57:285–331.
Sen, J., and Ghosh, S., 2008. Estimation of stature from foot length and foot breadth among the
Rajbanshi: An indigenous population of North Bengal. Forensic Science International,
181(1):55-e1.
Serjeantson, D., 2011. Review of animal remains from the Neolithic and Early Bronze Age in
Southern Britain (4000 BC – 1500 BC). Research Department Report Series 29 – 2011. English
Heritage: London.
Severn Estuary Partnership, 2016. Fish of the Severn Estuary European marine site. [online]
Available at: https://www.asera.org.uk/features/fish/) [accessed 12th March 2017].
Severnside birds, 2018. Systematic List. [online] Available at:
http://www.severnsidebirds.co.uk/page11.html [accessed 23rd February 2018].
Simm, C., 2016. Oystercatcher facts you need to know. [online] Available at:
http://www.discoverwildlife.com/blog/6-oystercatcher-facts-you-need-know [accessed 3rd
February 2017].
Singh, T.S., and Phookan, M.N., 1993. Stature and foot size in four Thai Communities of
Assam, India. Anthropologischer Anzeiger, 51:349- 355.
Singh, J.P., Meena, M.C., Rani, Y., and Sharma, G, K., 2013. Stature estimations from the
dimensions of foot in females. Antrocom Online Journal of Anthropology, 9(2):237-241.
Sloan, D., 1984. Shell middens and chronology in Scotland. Scottish Archaeological Review,
3:73-79.
Sloan, D., 1989. Shells and settlements. In J. Clutton-Brock (ed.) The walking larder. Unwin
Hayman: London. Pp 316-325.
Smith, C., 1992. Late Stone Age hunters of the British Isles. Routledge: London. Pp 139-158.
Smith, R.M.H. 1993 Sedimentology and ichnology of floodplain paleosurfaces in the Beafort
Group (late Permian), Karoo sequence, South Africa. Palaios, 8:339-357.
Smith, K., Coppen, J., Wainwright, G.J., and Beckett, S. 1981. The Shaugh Moor Project: Third
report: Settlement and environmental investigations. Proceedings of the Prehistoric Society,
47:205-73.
588
Smith, A.G., and Morgan, L.A., 1989. A succession to ombrotrophic bog in the Gwent Levels,
and its demise: a Welsh parallel to the peats of the Somerset Levels. New Phytologist, 112:145-
167.
Smith, D.N., Osborne, P., and Barrett, J., 2000. Beetles as indicators of past environments and
human activity at Goldcliff. In M.Bell, A. Caseldine., and H. Neumann (eds), Prehistoric
Intertidal archaeology in the Welsh Severn Estuary, CBA Research Report 120. Council for
British Archaeology: York. Pp 245-261.
Sneed, J.M., 1984. The Sequoyah Caverns story. National Speleological Society News, 42:178-
81.
Snow, D., Perrins, C.M., Gillmor, R., Hillcoat, B., Roselaar, C.S., Vincent, D., Wallace, D.I.M.,
and Wilson, M.G.,1998. The Birds of the Western Palearctic. Concise edition. Oxford
University Press: Oxford. Pp 511.
Soergel, E., 1955. Über einige Vogelreste (Seeadler, Kraniche) aus dem Neolithikum von
Ehrenstein bei Ulm. Jahresheft des Vereins für Väterlandische Naturkunde in Württemburg,
Stuttgart, 110:121-124.
Sohn, Y., Yoon, W. S., Ahn, U.S., Kim, G.B., Lee, J.-H., Ryu, C.K., Jeon, Y.M., and Kang,
C.H., 2015. Stratigraphy and age of the human footprints-bearing strata in Jeju Island, Korea:
Controversies and new findings. Journal of Archaeological Science: Reports, 4:264-275
Spitz, F., and Janeau, G., 1995. Daily selection of habitat in wild boar (Sus scrofa). Journal of
Zoology, 237(3):423-434.
Statistics Canada, 2011a. 2006 Census: AboriginalpPeoples in Canada in 2006: Inuit, Métis
and First Nations, 2006 Census: Inuit. [online] Available at:
http://www12.statcan.gc.ca/census-recensement/2006/as-sa/97-558/p6-eng.cfm [accessed 16th
June 2017].
Statistics Canada, 2011b. Projections of the Aboriginal Population and Households in Canada,
2011 to 2036. [online] Available at: http://www.statcan.gc.ca/pub/91-552-x/2015001/section08-
eng.htm [accessed 16th June 2017].
Stearns, S.C., 1992. The evolution of life histories. Oxford University Press: Oxford.
Street, M., and Peters, D.S., 1991. Ein früher nacheiszeitlicher Nachweis des Weißstorches
(Ciconia ciconia) aus dem Erfttal. Journal für Ornithologie, 132(1):102-103.
Stringer, C.B., 1975. A preliminary report on new excavations at Bacon Hole Cave. Gower,
26:1-6.
Stringer, C.B, 1977. Evidence of climatic change and human occupation during the last
interglacial at Bacon Hole Cave, Gower. Gower, 28:36-44.
Stringer, C.B., Currant, A.P., Schwarcz, H.P., and Collcutt, S.N., 1986. Age of Pleistocene
faunas from Bacon Hole, Wales. Nature, 320:59-62.
Stuart, A.J., 1982. Pleistocene vertebrates in the British Isles. Longman: London.
Stuart-Macadam, P., 1992. Anaemia in past human populations. In P. Stuart-Macadam and S.K.
Kent (eds.) Diet, demography and disease. Changing perspectives on anaemia. Aldine de
Gruyter: New York. Pp 151-170.
Suhr, I., 1972. Husholdningslaere. Copenhagen.
Sutcliffe, A.J., 1981. Progress report on excavations in Minchin Hole, Gower. Quaternary
Newsletter, 33:1-7.
589
Sutcliffe, A.J., and Zeuner, F.E., 1962. Excavations in the Torbryan Caves, Devonshire. I,
Tornewton Cave. Proceedings of the Devon Archaeology Explorer Society, 5(5&6):127-145.
Sutcliffe, A.J., and Kowalski, K., 1976. Pleistocene rodents of the British Isles. Bulletin of the
British Museum Natural History, 27:31-147.
Sutcliffe, A.J., and Bowen, D.Q., 1973. Preliminary report on excavation in Minchin Hole –
April –May 1973. Newsletter for the William Pengelly Cave Studies Trust, 21:12-25.
Sutcliffe, A.J., and Currant, A.P., 1984. Minchin Hole Cave. In D.Q. Bowen and A. Henry,
(eds.) Wales: Gower, Preseli, Fforest Fawr. Field Guide. Quaternary Research Association:
Cambridge. Pp 33-37.
Symes, S., 1984. Harris lines as indicators of stress; an analysis of tibiae from the Crow Creek
Massacre. American Journal of Physical Anthropology, 63:226.
Tauber, H., 1993. Dating methods. In S. Hvass and B. Storgaard (eds.) Digging into the past. 25
years of Archaeology in Denmark. The Royal Society of Northern Antiquaries and Jutland
Archaeological Society: Aarhus. Pp 40.
Taylor, B., Conneller, C., Milner, N., Elliott, B., Little, A., Knight, B., and Bamforth, M., 2018.
Human Lifeways. In N. Milner, C. Coneller and B. Taylor (eds) Star Carr Volume 1: a
persistent place in a changing world. White Rose University Press: York. DOI
https://doi.org/10.22599/book1
The Australian Bureau of Statistics, 2012. Australian Demographic Statistics, March 2012.
[online] Available at:
http://www.abs.gov.au/ausstats/[email protected]/featurearticlesbytitle/DB52AB9278B0C818CA257A
D7000D1067?OpenDocument [accessed 16th June 2017].
The Australian Bureau of Statistics, 2014. Estimates and Projections, Aboriginal and Torres
Strait Islander Australians, 2001 to 2026. [online] Available at:
http://www.abs.gov.au/ausstats/[email protected]/products/3E27B260A585DE5DCA257CC900143EF6
?OpenDocument [accessed 16th June 2017].
The Deer Initiative, 2008a. Species ecology red deer. [online] Available at:
http://www.thedeerinitiative.co.uk/uploads/guides/168.pdf [accessed 16th June 2017].
The Deer Initiative, 2008b. Species ecology deer behaviour. [online] Available at:
http://adlib.everysite.co.uk/resources/000/264/326/guide_ecology_behaviour.pdf [accessed 16th
June 2017].
The Wildlife Trust, Avon, 2017. The Severn Estuary. [online] Available at:
http://www.avonwildlifetrust.org.uk/what-we-do/we-create-living-landscapes-living-
seas/severn-estuary [accessed 16th June 2017].
Thulborn, R.A., and Wade, M., 1979. Dinosaur stampede in the Cretaceous of Queensland.
Lethaia, 12:275–279.
Thulborn, R.A., and Wade, M., 1989. A footprint as a history of movement. In D.D. Gillette
and M.G. Lockley (eds.), Dinosaur Tracks and Traces. Cambridge University Press:
Cambridge. Pp 51–56.
Timpany, S., 2002. The submerged forest at Goldcliff East. Archaeology in the Severn Estuary,
13:37-39.
Timpany, S., 2005. A multi-proxy palaeoecological investigation of submerged forests and
intertidal peats, Severn Estuary. Unpublished PhD Thesis, University of Reading.

590
Timpany, S., 2007. Plant communities and human activity. In M. Bell (ed.) Prehistoric coastal
communities: the Mesolithic in western Britain. CBA Research Report 149. Council for British
Archaeology: York. Pp 188-200.
Tooley, M.J., 1970. The peat beds of the southwest Lancashire coast. Nature in Lancashire,
1:19–21.
Tooley, M.J., 1974. Sea-level changes during the last 9000 years in north-west England,
Geographical Journal, 140:18-42.
Toppinard, P., 1877. L’Anthropologie. Reinwald: Paris
Tratman, E.K., 1922. Notes on the human teeth from Aveline’s Hole, Burrington Combe,
Somerset. Proceedings of the University of Bristol Spelaeological Society, 1:122-125.
Trinkaus, E., and Shang, H., 2008. Anatomical evidence for the antiquity of human foot-wear:
Tianyu and Sunghir. Journal of Archaeological Science, 35(7):1928-1933
Tronick, E.Z., Ivey, P.K., and Morelli, G.A., 1992. The Efe forager infant and toddler patterns
of social relationships: multiple and simultaneous. Developmental Psychology, 28(4):568-577.
Tryjanowski, P., Kosicki, J.Z., Kuzniac, S., and Sparks, T.H., 2009. Long-term changes and
breeding success in relationship to nesting structures used by white stork, Ciconia ciconia.
Annales Zoologici Fennici, 46:34-38.
Tucker, B., and Young, A.G., 2005.Growing up Mikea: children’s time allocation and tuber
foraging in southwestern Madagascar. In B.S. Hewlett & M.E. Lamb (eds.), Hunter-gatherer
childhoods: evolutionary, developmental and cultural perspectives. Routledge: Abingdon. Pp
147-171.
Turk, F.A., 1971. Notes on Cornish mammals in prehistoric and historic times: a report on the
animal remains from Nor-Nour, Isles of Scilly. Cornish Archaeology, 10:79–91.
Turk, F.A., 1978. The animal remains from Nor-Nour: a synoptic view of the finds. In S.A.
Butcher (ed.) Excavations at Nornour, Isles of Scilly, 1969–73: the Pre-Roman settlement.
Cornish Archaeology, 17:99–103.
Tuttle, R.H., 1984. Bear facts and Laetoli impressions. American Journal of Physical
Anthropology, 63:230.
Tuttle, R.H., 1987. Kinesiological inferences and evolutionary implications from Laetoli
bipedal trails G-1, G-2/3. In M.D. Leakey and J.M. Harris (eds.) Laetoli. A Pliocene Site in
Northern Tanzania. Clarendon Press: Oxford. Pp. 503-523.
Tuttle, R.H., Webb, D., Weidl, E., and Baksh, M., 1990. Further progress on the Laetoli trails.
Journal of Archaeological Science, 17:347–362.
Tuttle, R.H., 2008. Footprint clues in hominid evolution and forensics: lessons and limitations.
Ichnos, 15:158-165.
Udden, J.A., 1914. Mechanical composition of clastic sediments. Bulletin of the Geological
Society of America, 25:655-744.
Uhrova, P., Benus, R., Masnicova, S., Obertova, Z., Kramarova, D., Kyselicova, K.,
Dornhoferova, M., Bodorikova, S., and Nescakova, E., 2015. Estimation of stature using hand
and foot dimensions in Slovak adults. Legal Medicine, 17:92-97.
Václavikova, M., Václavik, T., and Kostkan, V., 2010. Otters vs. fishermen: stakeholders’
perceptions of otter predation and damage compensation in the Czech Republic. Journal for
Nature Conservation, 19(2):95-102.
591
Vallois, H.V., 1931. Les Empreintes des pieds humains des grottes Prëhistoriques du Midi de la
France. Palaeobiologica, 4:79-98.
Vereecke, E., D’Aout, K., De Clercq, D., Van Elsacke, L., Aerts, P., 2003. Dynamic plantar
pressure distribution during terrestrial locomotion of bonobos (Pan paniscus). American
Journal of Physical Anthropology, 120:373–383.
Vermeersch, P.M., Paulissen, E., Van Peer, P., and Van Neer, W., 2000. El Abadiya, a
Shuwikhatian site. In P.M. Vermeersch (ed.) Palaeolithic living sites in Upper and Middle
Eqypt. Leuven University Press: Leuven. Pp 159-199.
Waddington, C., 2010, Low Hauxley, Northumberland: a review of archaeological interventions
and site condition. Archaeological research Services Limited, 25. [online] Available at:
https://content.historicengland.org.uk/images-books/publications/low-hauxley-review-
archaeological-work/review_archaeological_work_Low_Hauxley_v1.pdf/ [accessed 7th June
2017].
Waldron, T., 1989. The effects of urbanisation on human health: the evidence from skeletal
remains. In D. Serjeantson and T. Waldron (eds.) Diets and crafts in towns. BAR 63. British
archaeological reports: Oxford. Pp 199:63.
Walker, M., 2005. Quaternary dating methods: an introduction. Wiley: Chichester.
Walker, T., and Bell, M., 2013. Bronze Age animal footprints at Gwithian, Cornwall. Past,
74:1-3.
Wall, S., 1985. A note on animal foot impressions on Roman tiles. In J. Hinchcliff and C.
Sparey Green ‘Excavations at Brancaster 1974 & 1977’. East Anglican Archaeology 23:174-
175.
Watson, P.J., 1969. The prehistory of Salt cave, Kentucky. Illinois state museum report of
investigations: Springfield.
Watson, P.J., Notes on a visit to Fisher Ridge cave. Unpublished field notes dated June 27
1982.
Watson, P.J., 1986. Prehistoric caves of the Eastern Woodlands. In C.H. Faulkner (ed.) The
prehistoric Native American art of Mud Glymph Cave. University of Tennesse Press:
Knoxville. Pp 109-116.
Watson, P.J., Wiley, P., Robbins, L.M., and Wilson, R.C., 2005. Prehistoric footprints in Jaguar
Cave, Tennessee. Journal of Field Archaeology, 30, 1:25-43.
Webb, S., 2007. Further research of the Willandra Lake fossil footprint site, south eastern
Australia. Journal of Human Evolution, 52:711-715
Webb, D., Robu, M., Moldovan, O., Constantin, S., Tomus, B., and Neag, I., 2014. Ancient
human footprints in Ciur-Izbuc Cave, Romania. American Journal of Physical Anthropology,
155(1):128-135.
Webb, S., Cupper, M.L., and Robins, R., 2006. Pleistocene human footprints from the
Willandra Lakes, southeastern Australia. Journal of Human Evolution, 50: 405-413.
Wentworth, C.K., 1922. A scale of grade and class terms for clastic sediments. Journal of
Geology, 30:377-392.
West, B., 1994. Birds and mammals. In D.J. Rackham and M.D. Culver (eds.) Saxon
environment and economy in London. Council for British Archaeology: London.
592
Westaway, R., Pringle, M., Yurtmen, S., Demir, T., Bridgland, D., Rowbotham, G., and
Maddey, D., 2004. Pliocene and Quaternary regional uplift in Western Turkey: the Gediz river
terrace staircase and the volcanism at Kula. Tectonophysics, 391:21-169.
Wheeler, A., 1969. The fishes of the British Isles and North-West Europe. Macmillan: London.
Wheeler, A., 1978. Why were there no fish remains at Star Carr? Journal of Archaeological
Science, 5:85-89.
White, T.D., and Folkens, P.A., 2005. The Human Bone Manual. Elsevier Academic Press:
London.
Whittle, A.W.R., and Green, S., 1988. The archaeological potential of the Severn Estuary: an
initial assessment for the STPG. Unpublished SELRC report.
Whittle, A, Antoine, S, Gardiner, N, Milles, A and Webster, A., 1989. Two Later Bronze Age
occupations and an Iron Age channel on the Gwent foreshore. Bulletin of the Board of Celtic
Studies, 36,200-223.
Wildlife Trust of South and West Wales. Teifi marshes. [online] Available at:
www.welshwildlife.org/nature-reserve/teifi-marshes/ [accessed 12th November 2017].
Willey, P., Stolen, J., Crothers, G., and Watson, P.J., 2005. Preservation of prehistoric
footprints in Jaguar Cave, Tennessee. Journal of Cave and Karst Studies, 67:61-68.
Willey, P., Watson, P.J., Crothers, G., and Stolen, J., 2009. Holocene human footprints in North
America. Ichnos, 16:70-75.
Wilson, R., Locker, A. and Marples, B. 1989. Medieval animal bones and marine shells from
Church Street and other sites in St Ebbes, Oxford. In T.G. Hassal, C.E. Halpin, and M. Mellor
(eds.) Excavations in St Ebbes, Oxford 1967–76. Oxoniensia, 54:258–268.
Wilson, J.A., Marsicano, C.A., and Smith, R.M.H., 2009. Dynamic locomotor capabilities
revealed by early dinosaur trackmakers from Southern Africa. PLoS ONE, 4(10):e7331.
Winge H. 1919. Survey of the bone material from the Sværdborg settlement. In K. Friis-
Johansen, A settlement from older Stone Age in Sværdborg Mose. Aarbrger for nordisk
Oldkyndighet og Historie 1919:128–133.
Winge H. 1924. Survey of the bone material from the Holmegaard settlement. In H.C. Broholm
(ed.) new finds from the older Stone Age, the Holmegaard- and Sværdborg site. Aarbrger for
nordisk Oldkyndighet og Historie, 1924: 28–30.
Wood, B., Pontzer, H., Raichlen, D., and Marlowe, F.W., 2014. Mutalism and manipulation in
Hazda-honeyguide interactions. Evolution and Human Behaviour, 35(6):540-546.
Wood, S., 2010. Archaeological remains and place names. In S. Wood (ed.) The birds of Essex.
Christopher Helm: London. Pp 19-20.
Woodman, P.C., Anderson, E., and Finlay, N., 1999. Excavations at Ferrier’s Cove, 1983-95:
Last Foragers, First Farmers in the Dingle Peninsula. Wordwell: Bray.
Wymer, J., 1962. Excavations at the Maglemosian sites at Thatcham, Berkshire, England.
Proceedings of the Prehistoric Society, 28:329-361.
Yalden, D., 1999. The History of British Mammals. Poyser Natural History: London
Yalden, D., and Albarella, U., 2009. The history of British birds. Oxford University Press:
Oxford.

593
Zhang, D.D., and Li, S.H., 2002. Optical dating of Tibetan human hand-and footprints: an
implication for the palaeoenvironment of the last glaciation of the Tibetan Plateau. Geophysical
Research Letters, 29:1072-1074.
Zeybeck, G., Ergur, I., and Demiroglu, Z., 2008. Stature and gender estimation using foot
measurements. Forensic Science International, 181:54.e1-54.e5.
Zvelebil, M., 1994. Plant use in the Mesolithic and its role in the transition to farming.
Proceedings of the Prehistoric Society, 60:35–74.