The hidden footprint of UK production overseas - Squarespace
57
The hidden footprint of UK production overseas
-
Upload
khangminh22 -
Category
Documents
-
view
2 -
download
0
Transcript of The hidden footprint of UK production overseas - Squarespace

The hidden footprint of UK production overseas

Part 1Introduction � 4
Part 2Methods� 14
Part 3Garments� 24
Part 4Bricks� 50
Part 5Tea� 74
Part 6UK policy� 96
Contents
AuthorsParsons,�L.,�Safra�de�Campos,�R.,�Moncaster,�A.,�Cook,�I.,�Siddiqui,�T.,�Abenayake,�C.,�Jayasinghe,�A.,�Mishra,�P.,�Scungio,�L.�and�Billah,�T.
FieldworkLy�Vouch�Long�(Cambodia);�Suruchi�Kumari�and�Vikas�Kumar�Moola�(Punjab);�Krunal�Sureshbhai�Panchal�and�Ashrafsha�Rafiksha�Diwan�(Gujarat);�Samith�Madusanka�and�Eshi�Wijegunarathna�(Sri�Lanka)
Report designBison�Bison�
PhotographyThomas�Cristofoletti,�Chamalka�Srimal,�Mahmud�Hossain�Opu�and�Tamim�Billah
Find out morewww.disastertrade.org
This�report�is�published�in�2021�by�Royal�Holloway,�University�of�London�under�a�Creative�Commons�Attribution-Non�Commercial�3.0�license�
32

Introduction Disasters like floods, droughts and landslides are a growing risk for millions of people in the global South. Yet in our globalising world, they are increasingly connected to processes originating in the global North. Focusing on imports from Cambodia, Sri Lanka and the South Asian ‘brick belt’, this project examines how British trade shapes the disasters that afflict the UK’s trading partners. As it exemplifies, the UK’s trade in garments, bricks and tea serves to displace emissions and environmental degradation, whilst intensifying the impacts of natural hazards linked to climate change. These complex impacts constitute the UK’s hidden disaster footprint.
Part 1
4 54

Trading disasters in a globalised environmentDisasters�are�increasingly�a�fact�of�life�around�the�world.�Each�year,�floods,�droughts�and�landslides�affect�tens�of�millions�of�people,�leaving�vast�human�and�economic�destruction�in�their�wake�wherever�they�occur.�The�cost�in�human�lives�and�livelihoods�each�year�is�enormous.�Yet�their�labelling�as�‘natural’�disasters�or�‘acts�of�God’�has�seen�has�cast�them�as�difficult�to�predict�and�thus�prevent.�As�the�impacts�of�climate�change�are�felt�more�and�more�clearly,�their�severity�is�expected�to�worsen�and�their�predictability�diminish.�As�global�tempera-tures�continue�to�rise,�we�are�facing�a�future�world�increasingly�defined�by�disaster.Faced�with�this�reality,�the�UK�and�other�countries�like�it�have�committed�to�ambi-
tious�targets�on�carbon�emissions�reduction,�with�apparent�success.�Yet�despite�the�rhetoric,�the�achievements�of�such�policies�are�grossly�overstated.�Many�of�the�environmental�gains�achieved�by�major�polluters�derive�from�moving�carbon�inten-sive�processes�to�manufacturing�bases�in�the�global�South,�rather�than�sustainable�emissions�reductions.�The�clothes�we�wear�and�building�materials�we�live�in�still�need�to�be�made,�but�their�production�overseas�allows�the�emissions�associated�with�their�manufacture�to�be�regulated�less�stringently�and�accounted�for�less�carefully.�Con-sequently,�whilst�emissions�produced�within�the�UK’s�borders�have�declined�by�over�44%�since�1990,�the�emissions�British�people�consume�has�declined�only�10%1.�As�of�2016,�almost�half�of�UK�emissions�were�produced�overseas,�compared�with�14%�in�1990�(Figure�1).�Worse�still,�the�process�of�moving�these�emissions�creates�emissions�of�its�own.�With�freight�expected�to�account�for�28%�of�global�emissions�by�20502,�the�UK’s�carbon�footprint�is�increasingly�global,�mobile,�and�harder�to�define�as�a�result.Moreover,�the�carbon�footprint�alone�doesn’t�tell�the�whole�story.�As�carbon�
emissions�continue�to�rise�globally,�increasing�the�risk�of�natural�hazards�such�as�droughts,�floods�and�landslides,�the�local�effect�of�British�trade�and�investment�are�worsening�their�impacts.�In�Cambodia,�from�where�the�UK�imports�4%�of�its�garments,�factories�providing�clothes�for�the�British�market�are�linked�to�carbon�intensive�ener-gy�generation,�large-scale�deforestation,�and�mismanagement�of�water�resources,�intensifying�the�impacts�of�drought.�
In�South�Asia,�from�where�the�UK�imports�a�growing�proportion�of�its�bricks,�brick�production�plays�a�major�role�in�degrading�the�environment,�engendering�droughts�and�floods,�whilst�undermin-ing�agricultural�livelihoods.�In�Sri�Lanka,�a�major�exporter�of�tea�for�the�British�mar-ket,�land�use�change�related�to�tea�cultivation�and�the�privatisation�of�the�industry�has�seen�the�growing�frequency�of�environmental�hazards�in�the�Sri�Lankan�uplands�translated�into�a�tragic�propensity�to�landslides.By�degrading�local�environments�in�this�way,�British�trading�practices�channel�and�
intensify�the�impacts�of�climate�change,�reducing�overseas�populations’�resilience�to�the�impacts�of�the�changing�climate�and�making�natural�disasters�more�likely.�The�result�is�that�when�we�import�goods,�we�are�effectively�exporting�disasters:�not�only�contributing�to�climate�change�globally,�but�also�exacerbating�its�impacts�locally.�Yet�despite�their�global�reach�and�severity,�this�‘disaster�footprint’:�the�environmen-tal�impacts�of�British�trade,�which�turn�global�hazards�into�local�disasters,�are�not�recorded�in�the�UK’s�statistics�or�strategies�on�climate�change.�This�project�will�elucidate�this�hidden�disaster�footprint�of�British�trade,�high-
lighting�both�the�shortcomings�of�overseas�emissions�accounting�and�the�manner�in�which�supply�chain�complexity�conceals�the�intensification�of�climate�impacts�in�the�global�South.�Disasters,�as�it�shows,�may�unpredictable,�but�they�are�anything�but�random.�As�the�climate�continues�to�change,�the�global�systems�and�structures�we�depend�upon�in�our�everyday�lives�will�play�an�ever�role�in�channelling�the�man-ifestation�of�hazards�in�the�global�South,�shaping�the�incidence�and�intensity�of�the�disasters�they�create.
1.1 1990
14%of UK emissions were produced overseas
46%of UK emissions were produced overseas
2016
Figure�1.�Change�in�the�provenance�of��UK�CO2�emissions�between�1990�and�2016.
The clothes we wear and building materials we live in still need to be made, but their production overseas allows the emissions associated with their manufacture to be regulated less stringently and accounted for less carefully.
6 7

When we import goods, we are effectively exporting disasters: not only contributing to climate change globally, but also exacerbating its impacts locally. Yet despite its global reach and severity, this ‘disaster footprint’ is not recorded in the UK’s statistics or strategies on climate change.
Emissions, growth and disasters in a climate emergencyIn�November�2019,�11,000�scientists�from�around�the�world�united�to�declare�a�cli-mate�emergency,3�insisting,�as�have�media�and�political�forces�from�the�Guardian�newspaper�to�the�UK�parliament,�on�an�end�to�business�as�usual.�As�they�declared�at�the�time,�the�world’s�people�face�‘untold�suffering�due�to�the�climate�crisis’�unless�global�society�accepts�major�transformations.�Simply�put:
‘To�secure�a�sustainable�future,�we�must�change�how�we�live.�[This]�entails�major�transformations�in�the�ways�our�global�society�functions�and�interacts�with�nat-ural�ecosystems’.�— The Guardian,�2019
In�the�latest�in�a�series�of�stark�messages�on�climate,�the�underlying�urgency�of�the�situation�has�been�laid�bare.�It�is�a�harrowing�message,�but�more�disturbing�than�the�message�itself�is�its�familiarity.�Similar�proclamations�were�made�in�advance�of�the�Paris�Agreement�of�2016,�which�succeeded�in�setting�out�a�framework�to�limit�warming�to�1.5˚C.�It�was�an�agreement�that�drew�much�acclaim�and�celebration�for�its�clarity�of�vision�and�commitment.�Yet�only�three�years�later,�annual�emissions�reached�an�all-time�high.4�Something,�it�is�increasingly�clear,�is�not�working.This�is�not,�moreover,�a�novel�problem.�The�Paris�agreement�is�only�the�latest�in�a�
long�running�series�of�international�agreements�to�make�limited�tangible�impact�on�emissions.�From�the�first�World�Climate�Conference�in�1979,�via�the�UN�Framework�Convention�on�Climate�in�1992,�Kyoto�in�1999,�Copenhagen�in�2009�and�finally�Paris�in�2016,�agreements�have�become�more�specific�and�binding�over�time.�Yet�all�the�while�the�atmospheric�CO2�concentrations�have�continued�to�increase.�As�shown�in�Figure�2,�at�the�time�of�the�first�World�Climate�Conference,�atmospheric�CO2�stood�at�339�parts�per�million;�at�the�foundation�of�the�UNFCCC�13�years�later,�it�was�358.�As�the�fireworks�boomed�in�Paris�it�was�402�parts�per�million;�and�today,�it�stands�at�417.5
The�apparent�lack�of�impact�of�these�agreements�presents�something�of�a�conun-drum�to�environmentalists.�Each�of�these�agreements�has,�to�a�greater�or�lesser�extent,�agreed�frameworks�and�policies�with�the�world’s�heaviest�emitting�nations�that�would�be�expected�to�reduce�carbon�emissions.�Moreover,�the�data�show�that�in�many�cases,�they�have�resulted�in�reduced�emissions.The�EU’s�net�emissions�fell�from�5.6�billion�tons�of�CO2�in�
1990�to�4.2�billion�in�2018,6�whilst�the�UK�–�historically�one�of�the�EU’s�largest�emitters�–�claims�a�44%�reduction�in�emis-sions�since�1990.7�Even�the�United�States,�a�country�whose�efforts�have�been�deemed�‘critically�insufficient’�by�monitors,�has�achieved�a�modest�decline,�from�7.1�billion�tons�in�1998�to�6.7�billion�today.8�
Smoke�rises�over�a�brick�kiln�outside�Dhaka.
1.2
Emissions from major economies are either falling or stabilising, yet the relentless uptick of global carbon emissions continues undiminished.
98

China,�one�of�the�world’s�largest�and�most�rapidly�increas-ing�carbon�emitters�of�recent�decades,�has�begun�to�slow�the�rate�of�increase,�with�emissions�projected�to�plateau�over�the�next�five�years9�as�part�of�a�national�plan�to�achieve�carbon�neutrality�by�2060.So�what,�then,�lies�behind�this�discrepancy?�Emissions�from�major�economies�
are�either�falling�or�stabilising,�yet�the�relentless�uptick�of�global�carbon�emissions�continues�undiminished.�Are�major�emitters�being�untruthful�about�their�emissions�figures?�Not�in�a�direct�sense.�Rather,�it�is�the�reductions�themselves�that�are�illuso-ry,�the�product�of�a�system�of�carbon�accounting�which�remains�firmly�national�and�bordered�within�an�increasingly�global�and�interconnected�world.�As�richer�nations�increasingly�diminish�their�share�of�global�industry,�‘outsourcing’�lower�margin�and�more�environmentally�damaging�processes�to�the�global�South,10�the�emissions�asso-ciated�with�those�processes�–�at�least�in�headline�figures�–�go�with�them.Indeed,�there�is�a�growing�recognition�that�national�accounting�of�carbon�usage�
may�lie�at�the�root�of�the�more�generalised�failure�to�make�concerted�inroads�into�carbon�emissions.11�The�ability�of�wealthier�countries�to�effectively�outsource�emis-sions�to�less�wealthy�ones�has�been�described�as�‘carbon�colonialism’ 12�and�there�is�increasing�unease�over�the�effectiveness�of�production-based�UK�emissions�targets,13�which�allow�ever�more�greenhouse�gas�emissions�to�‘flow�through�the�carbon�loop-hole�of�international�trade’. 14�In�total,�imported�emissions�now�account�for�a�quarter�of�global�CO2�emissions,15�making�this�the�‘next�frontier�of�climate�policy’. 16
Crucially,�this�is�a�perspective�that�casts�service-oriented�economies�like�the�UK�–�many�of�which�have�achieved�substantial�reductions�in�domestic�emissions�in�recent�years�–�in�an�especially�poor�light.�
The�UK�is�now�the�G7’s�largest�proportional�importer�of�emissions,�with�carbon�consumption�from�imports�now�28%�higher�than�1997�in�absolute�terms.17�The�value�of�UK�imports�has�more�than�doubled�in�the�last�two�decades,18�with�environmental-ly�regulated�EU�exporters�accounting�for�a�falling�proportion�of�the�total.19�This�rise�in�imported�–�or�embodied�–�emissions�chips�away�substantially�at�the�UK’s�much�trumpeted�domestic�emissions�reductions,�reducing�it�from�the�government’s�gross�44%�figure�to�a�net�10%�reduction�in�emissions�consumed.20�Rather�than�the�sub-stantial�reductions�claimed�by�the�UK�government,�therefore,�the�last�two�decades�have�seen�a�concerted�shifting�of�emissions�away�from�the�domestic�to�the�imported,�as�the�UK�effectively�outsources�its�carbon�intensive�industry�to�the�global�South.On�a�planetary�level,�this�is�pressing�concern,�
masking�as�it�does�an�ongoing�reliance�by�major�econ-omies�on�high�emission�technologies�and�processes.�Yet�beyond�the�global�climate�emergency,�there�is�also�a�smaller�scale�human�and�environmental�cost.�Not�only�will�a�temperature�rise�of�more�than�1.5°C�likely�result�in�‘several�hundred�million’�more�people�in�poverty�by�205021�at�a�global�scale,�but�the�local�effect�of�trade�and�investment�in�terms�of�worsening�the�impact�of�climate�change�on�poverty�and�liveli-hoods�are�equally�concerning.�Removed�from�the�regulations�and�standards�governing�domestic�production,�the�industrial�processes�that�manufacture�the�goods�consumed�by�British�people�remain�dangerous�and�environmentally�destructive.�Global�systems�ostensibly�protect�against�this�but,�as�with�the�broader�issue�of�emissions,�they�do�so�on�a�‘methodologically�nationalist’�basis,�framed�around�the�nation�state.22�This�gives�countries�the�opportunity�to�hide�the�damage�their�productive�processes�engender,�not�by�resolving�it,�but�by�moving�it�across�a�national�border�and�thus�largely�out�of�sight�of�regulation�and�accounting.Bringing�together�empirical�and�secondary�data�generated�across�four�national�
settings,�The�Disaster�Trade�project�aims�to�exemplify�this�process�using�three�com-plementary�investigations�of�how�trade,�emissions�and�local�environmental�destruc-tion�intersect�in�the�production�of�everyday�goods�used�in�the�UK.�Outlined�here�are�inquiries�into�the�export�of�bricks�from�the�‘brick�belt’�of�Bangladesh�and�India,�gar-ments�from�Cambodia,�and�tea�from�Sri�Lanka.�Yet�whilst�each�investigation�begins�in�a�key�exporting�site,�it�extends�its�reach�beyond�each�point�of�origin�to�highlight�the�global�and�mobile�nature�of�trade�processes�and�their�impacts�on�the�environment.In�the�brick�belt,�this�is�a�relatively�direct�trade.�Environmentally�degrading�pro-
cesses�are�outsourced�to�lower�cost�and�lower�regulation�exporters�where�the�vast�carbon�and�human�costs�associated�with�this�production�and�transportation�are�ren-dered�invisible�by�complex�supply�chains�and�limited�corporate�obligation�to�report�on�it.�Yet�whilst�the�complexity�of�supply�chains�is�one�issue,�their�mobility�is�another.�As�highlighted�in�the�case�of�Cambodia,�the�environmental�degradation�association�with�the�industry�is�in�constant�flux,�as�impacts�are�mobilised�and�relocated�to�sites�where�the�need�for�economic�growth�is�greatest�and�present�levels�of�environmental�destruction�lowest.�Moreover,�this�is�not�just�a�question�of�slow�burning�environmental�degradation.�Rather,�as�shown�in�Sri�Lanka,�environmental�degradation�of�this�sort�makes�areas�thus�afflicted�a�lightning�rod�for�the�impacts�of�climate�change,�increas-ing�the�likelihood�and�intensity�of�disasters.
Climate change impacts, including the slow-burn disasters of droughts and floods, are effectively traded out by wealthier countries and imported by less wealthy ones as the price of economic growth.
Figure�2.�Atmospheric�CO2�concentration�(ppm)�from�1960�to�2020,�with�international�climate�agreements.
325
350
375
400
425
60 65 70 75 80 85 90 95 00 05 10 15 20
1
2
3
4
5
1 � First�World�Climate�Conference�� 339ppm
2 � UN�Framework�Convention� 358ppm
3 � Kyoto�Protocol� 364ppm
4 � Copenhagen�Accord� 388ppm
5 � Paris�Agreement� 402ppm
111010
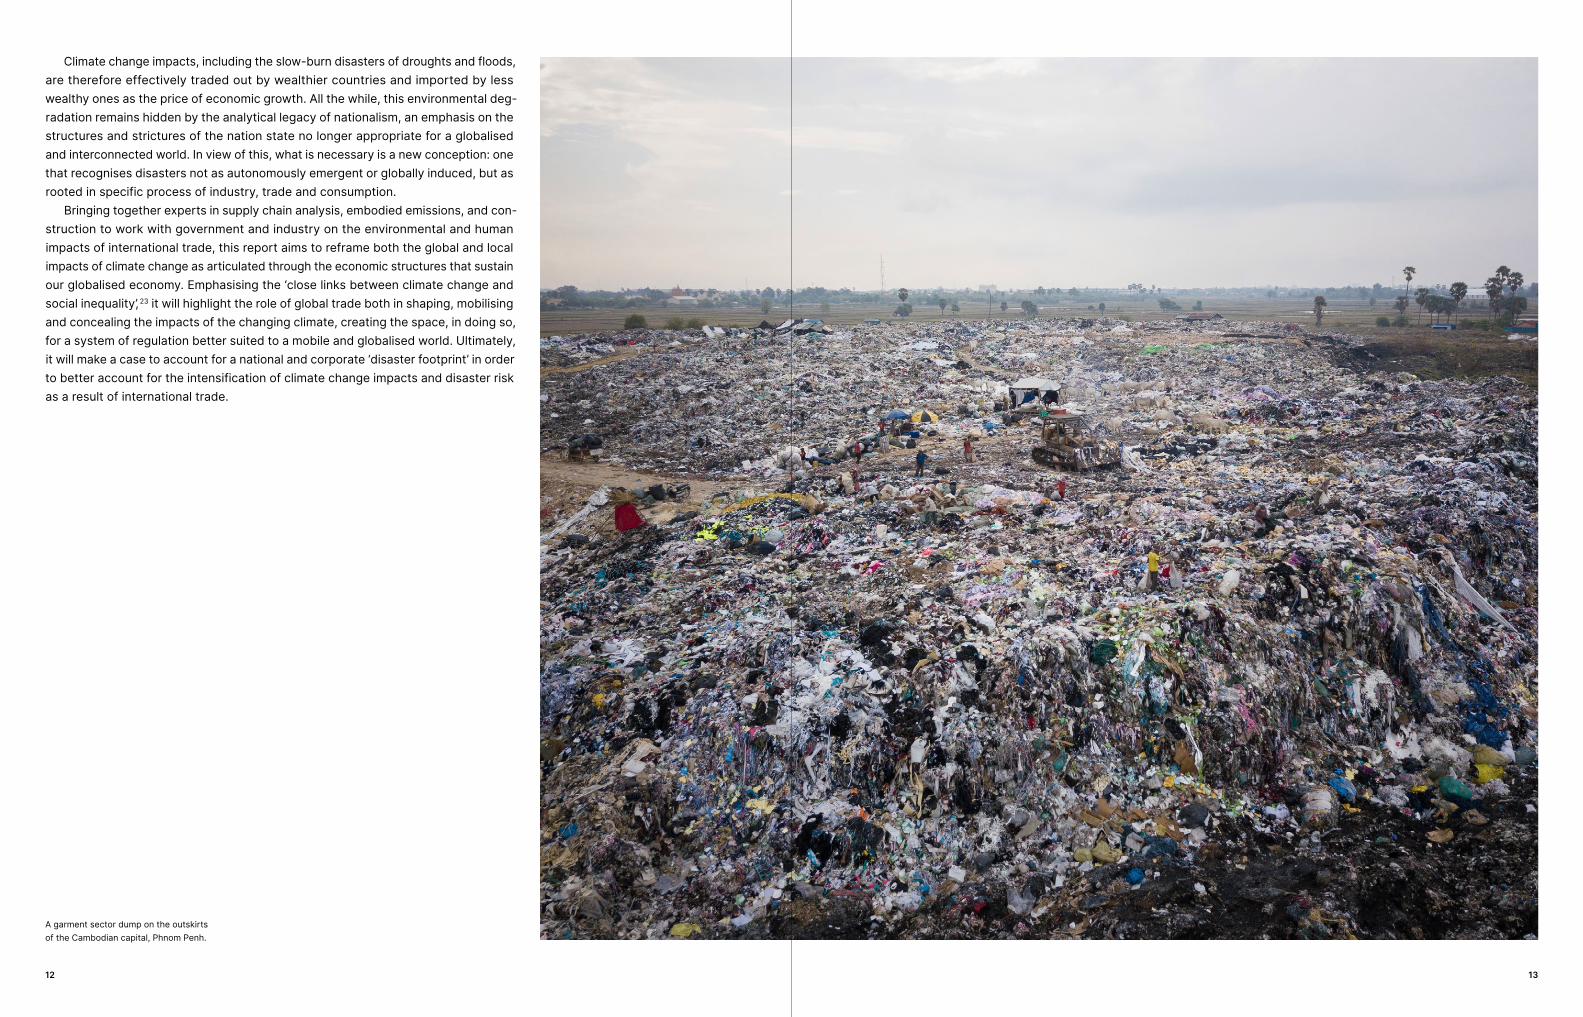
Climate�change�impacts,�including�the�slow-burn�disasters�of�droughts�and�floods,�are�therefore�effectively�traded�out�by�wealthier�countries�and�imported�by�less�wealthy�ones�as�the�price�of�economic�growth.�All�the�while,�this�environmental�deg-radation�remains�hidden�by�the�analytical�legacy�of�nationalism,�an�emphasis�on�the�structures�and�strictures�of�the�nation�state�no�longer�appropriate�for�a�globalised�and�interconnected�world.�In�view�of�this,�what�is�necessary�is�a�new�conception:�one�that�recognises�disasters�not�as�autonomously�emergent�or�globally�induced,�but�as�rooted�in�specific�process�of�industry,�trade�and�consumption.Bringing�together�experts�in�supply�chain�analysis,�embodied�emissions,�and�con-
struction�to�work�with�government�and�industry�on�the�environmental�and�human�impacts�of�international�trade,�this�report�aims�to�reframe�both�the�global�and�local�impacts�of�climate�change�as�articulated�through�the�economic�structures�that�sustain�our�globalised�economy.�Emphasising�the�‘close�links�between�climate�change�and�social�inequality’, 23�it�will�highlight�the�role�of�global�trade�both�in�shaping,�mobilising�and�concealing�the�impacts�of�the�changing�climate,�creating�the�space,�in�doing�so,�for�a�system�of�regulation�better�suited�to�a�mobile�and�globalised�world.�Ultimately,�it�will�make�a�case�to�account�for�a�national�and�corporate�‘disaster�footprint’�in�order�to�better�account�for�the�intensification�of�climate�change�impacts�and�disaster�risk�as�a�result�of�international�trade.
A�garment�sector�dump�on�the�outskirts�of�the�Cambodian�capital,�Phnom�Penh.
1312

Concepts and methods Emphasising the complexity and mobility of environmental processes as they relate to global trade, this project aims towards a novel perspective capable of communicating the inherent porosity of supply chains to both unrecorded resource flows and environmental harms.
Part 2
A�woman�prepares�food�in�a�Sri�Lankan�tea�plantation.�As�rainfall�becomes�more�intense�and�less�predictable,�workers�like�this�are�increasingly�vulnerable�to�landslides.
14 1514

Framing disaster in the global economyThe�term�‘natural�disaster’�is�still�widely�used�to�refer�to�events�such�as�droughts,�floods�and�landslides.�Yet�as�is�increasingly�recognised,24�this�is�a�misleading�term,�attributing�as�it�does�such�events�to�a�‘natural’�world�distinct�from�the�global�econo-my.�In�reality,�this�is�far�from�the�truth.�Not�only�are�global�processes�of�carbon�emis-sion�driving�such�events�with�increasing�regularity,25�but�local�economic�processes�articulate�their�manifestation�in�practice.�When�floods�destroy�houses�and�droughts�destroy�crops,�where,�when�and�to�what�extent�they�impact�depends�on�the�flows�of�goods,�people�and�money�that�structure�the�local�environment.For�every�good�that�we�use�and�every�object�we�import,�therefore,�there�is�a�triple�
cost.�First,�there�is�the�carbon�cost�which�contributes�to�climate�change�and�makes�extreme�weather�more�likely.�Second,�there�is�a�local�environmental�cost,�which�exacerbates�the�effects�of�extreme�weather.�And�finally�there�is�a�human�cost,�as�people�and�communities�absorb�the�impacts�of�climate�change,�driven�and�intensi-fied�by�global�trade.Local�studies�reveal�ample�evidence�of�such�processes�in�action.�Supply�chains�
involve�a�whole�range�of�actors�beyond�the�key�companies�involved�and�the�impacts�of�trade�extend�far�more�widely�than�is�often�appreciated.�These�secondary�impacts�of�trade�often�aren’t�fully�understood�in�supply�chain�analysis,�but�they�can�be�extremely�substantial,�playing�a�major�role�in�shaping�local�environments�and�the�resilience�of�local�communities�to�climate�change.In�highlighting�the�intersection�of�climate�change,�environmental�degradation�and�
global�trade,�this�project�aims�both�to�contribute�to�overcoming�some�of�the�diffi-culties�of�understanding�environment-trade�linkages�and�to�highlight�the�pressing�necessity�of�doing�so.�In�particular,�it�aims�to�challenge�scalar�conventions�which�place�the�nation-state,�often�implicitly,�as�both�a�producer�of�environmental�bads�and�container�of�environmental�damage.�Indeed,�a�key�goal�here�is�to�challenge�the�persistent�emphasis�on�climate�change�as�it�impacts�on�space,�rather�than�flows�of�goods,�people�and�money:�a�static�interpretation�that�fails�to�account�for�the�dynam-ic�economic�processes�through�which�climate�change�is�articulated.�Simply�put,�the�predominance�of�conventional�scalar�geographies�in�the�analysis�of�climate�change�impacts�leads�to�an�under-representation�of�the�systems�and�processes�that�con-nect�these�scales.�This�is�an�issue�of�growing�relevance�on�a�number�of�fronts.�First,�as�critical�schol-
ars�of�climate�change�accounting�have�argued�in�recent�years,�national�accounting�models�effectively�render�international�trade�a�‘loophole’�through�which�emissions�regulations�may�be�flouted.�Consumption�based�carbon�accounting�therefore�repre-sents�not�only�the�‘next�frontier’�of�climate�policy,26�but�also�a�topic�of�considerable�interdisciplinary�academic�interest.
Reflecting�this,�recent�years�have�seen�calls�for�a�shift�in�how�carbon�emissions�are�accounted�for,�from�a�production-based�metric�in�which�only�emissions�produced�within�a�country’s�borders�are�counted,�to�a�consumption-based�metric�in�which�emissions�associated�with�imported�goods�also�figure�in�the�total.�This,�argue�its�advocates,�is�necessary�to�‘close�the�carbon�loophole�in�carbon�policy’,27�wherein�wealthy�countries�claim�successes�in�cutting�emissions,�despite�increasing�the�total�emissions�with�which�they�are�associated.28
This�project�provides�a�new�body�of�evidence�to�support�this�view,�yet�in�doing�so,�it�also�highlights�understudied�aspects�of�consumption-based�carbon�accounting,�demonstrating,�in�particular,�the�need�to�explore�supply�chains�–�and�their�environ-mental�impacts�–�as�complex�rather�than�merely�linear�entities.�By�exploring�how�UK�pressures�on�urban�development�have�led�to�increased�Bangladeshi�brick�exports�and�consequent�acute�rural�and�urban�land�pressures�due�to�the�industry’s�use�of�topsoil,29�this�project�provides�a�key�exemplification�of�how�economic�processes�structure�environmental�degradation�overseas.�As�shown�here,�changes�to�produc-tion�and�land�use�in�the�global�North�have�specific�and�measurable�environmental�impacts�on�the�global�South,�promulgated�in�many�cases�by�regulatory�and�econom-ic�transitions,�effectively�transmitting,�or�‘telecoupling’,30�environmental�degradation�from�one�national�setting�to�another.From�this�perspective,�spatially�distant�environments�are�viewed�as�always�inter-
connected�by�trade.�Yet�they�are�also�linked�in�the�more�direct�sense�by�the�burgeon-ing�global�trade�in�materials.�Indeed,�as�the�UNEP31�outline,�‘global�material�use�has�tripled�over�the�past�four�decades,�with�total�global�consumption�of�raw�materials�predicted�to�double�again�by�2050.�From�sand�to�clay�to�wood,�a�third�of�the�total�volume�of�materials�extracted�in�the�world�economy�are�now�linked�to�the�production�of�an�internationally�traded�good.32�As�more�and�more�of�the�natural�environmental�is�packaged�in�this�way,�the�logic�and�logistics�of�trade�are�playing�an�ever�more�central�role�in�environmental�processes,�demanding�a�fresh�interrogation�of�the�conceptual�containers�that�govern�the�division,�mobility�and�redistribution�of�the�environment.Emphasising�the�complexity,�interconnectedness�and�mobility�of�environmental�
processes�as�they�relate�to�global�trade,�this�project�therefore�aims�towards�a�novel�perspective�capable�of�communicating�the�inherent�porosity�of�supply�chains�to�both�unrecorded�resource�flows�and�environmental�harms.�Analytically,�this�means�inter-rogating�the�conceptual�containers�that�structure�thinking�on�environmental�change:�metaphors�of�commodity�spatiality�like�carbon�footprints�and�commodity�chains�that�implicitly�denote�spatial�characteristics�to�environmental�degradation�as�a�starting�point�from�which�departure�has�often�proved�challenging.Three�containers,�in�particular,�are�identified�for�confrontation.�First,�the�spatial�
container�itself,�emphasising�the�porosity�and�flows�that�shape�environmental�impacts,�over�the�scalar�conventions�of�national�and�local�accounting�practices.�The�second�container�to�be�challenged�here�is�the�sectoral�container,�whereby�industrial�thinking�tends�to�structure�the�assessment�of�environmental�impacts�both�within�particular�industries,�and�within�the�boundary�of�industry�itself.�As�shown�here,�environmental�degradations�transect�such�boundaries,�as�social,�cultural�and�economic�structures�link�otherwise�disconnected�spheres.�The�third�and�final�container�is�temporal,�seeking�
2.1 When floods destroy houses and droughts destroy crops, where, when and to what extent they impact depends on the flows of goods, people and money that structure the local environment.
1716
to�challenge�in�particular�the�development�teleologies�–�most�famously�exemplified�in�the�environmental�Kuznets�curve33�–�which�indicate�a�reduction�in�environmental�impacts�associated�with�late-stage�economic�growth.�As�this�project�aims�above�all�to�demonstrate,�societies�such�as�the�UK�and�its�global�Northern�peers,�are�not�innovating�cleaner�methods�of�production,�but�simply�moving,�or�trading�out�envi-ronmental�impacts�beyond�the�purview�of�the�accounting�mechanisms�they�employ.
Spatial Sectoral
Temporal
Figure�3.�The�analytical�containers�that�shape�climate�policy.
In�departing�from�these�containers,�the�goal�is�freeing�conceptions�of�climate�change�impacts�and�environmental�degradation�from�some�of�the�underlying�assump-tions�that�go�unchallenged�in�climate�change�analysis,�as�a�result�of�their�ubiquity.�By�emphasising�the�intersection�of�human,�economic�and�environmental�processes,�these�processes�are�not�only�linked�together�but�recast�‘the�accelerated�circulation�of�ships,�goods,�capital,�and�labor�across�the�world’ 34�that�characterise�‘the�emerg-ing�container�economies’ 35�of�global�trade.�With�materials�circulating�at�the�current�high�and�accelerating�rate,�it�no�longer�suffices�to�view�environmental�impacts�asso-ciated�with�their�extraction,�use�and�consumption�as�static�within�space(s).�Instead,�they�must�be�viewed�as�flowing,�connected�and�traded�according�to�the�demands�of�the�global�economy.Though�focused�on�supply�chains,�however,�this�reformulation�is�directed�not�
towards�a�linear�ontology�of�environmental�degradation,�but�a�porous�one�capable�of�recognising�the�complex�‘patch�geographies’ 36�and�‘material�biographies’ 37�that�char-acterise�contemporary�global�commodity�trading�and�production.�This�perspective�both�underscores�the�primacy�of�supply�chains�as�environmental�arbiters�and�oppos-es�their�abstraction�within�simplified�linear�logics.�Instead,�it�emphasises�the�porous,�gaseous�and�‘hazy’�nature�of�emissions�and�their�impacts,38�drawing�in�both�spatial-ly�adjacent�and�telecoupled�sites�of�connection�beyond�those�originally�envisioned.By�accounting,�in�this�way,�for�the�complex�flows�that�territories�within�which�
territories�are�entangled,39�this�project�aims�not�only�to�draw�attention�to�‘the�wid-er�relational�roles�territories�play�in�emissions�beyond�their�borders’,40�but�also�the�histories�and�temporalities�of�these�processes.�Viewed�from�this�historically�and�geographically�embedded�perspective,�the�territories�within�which�emissions�and�
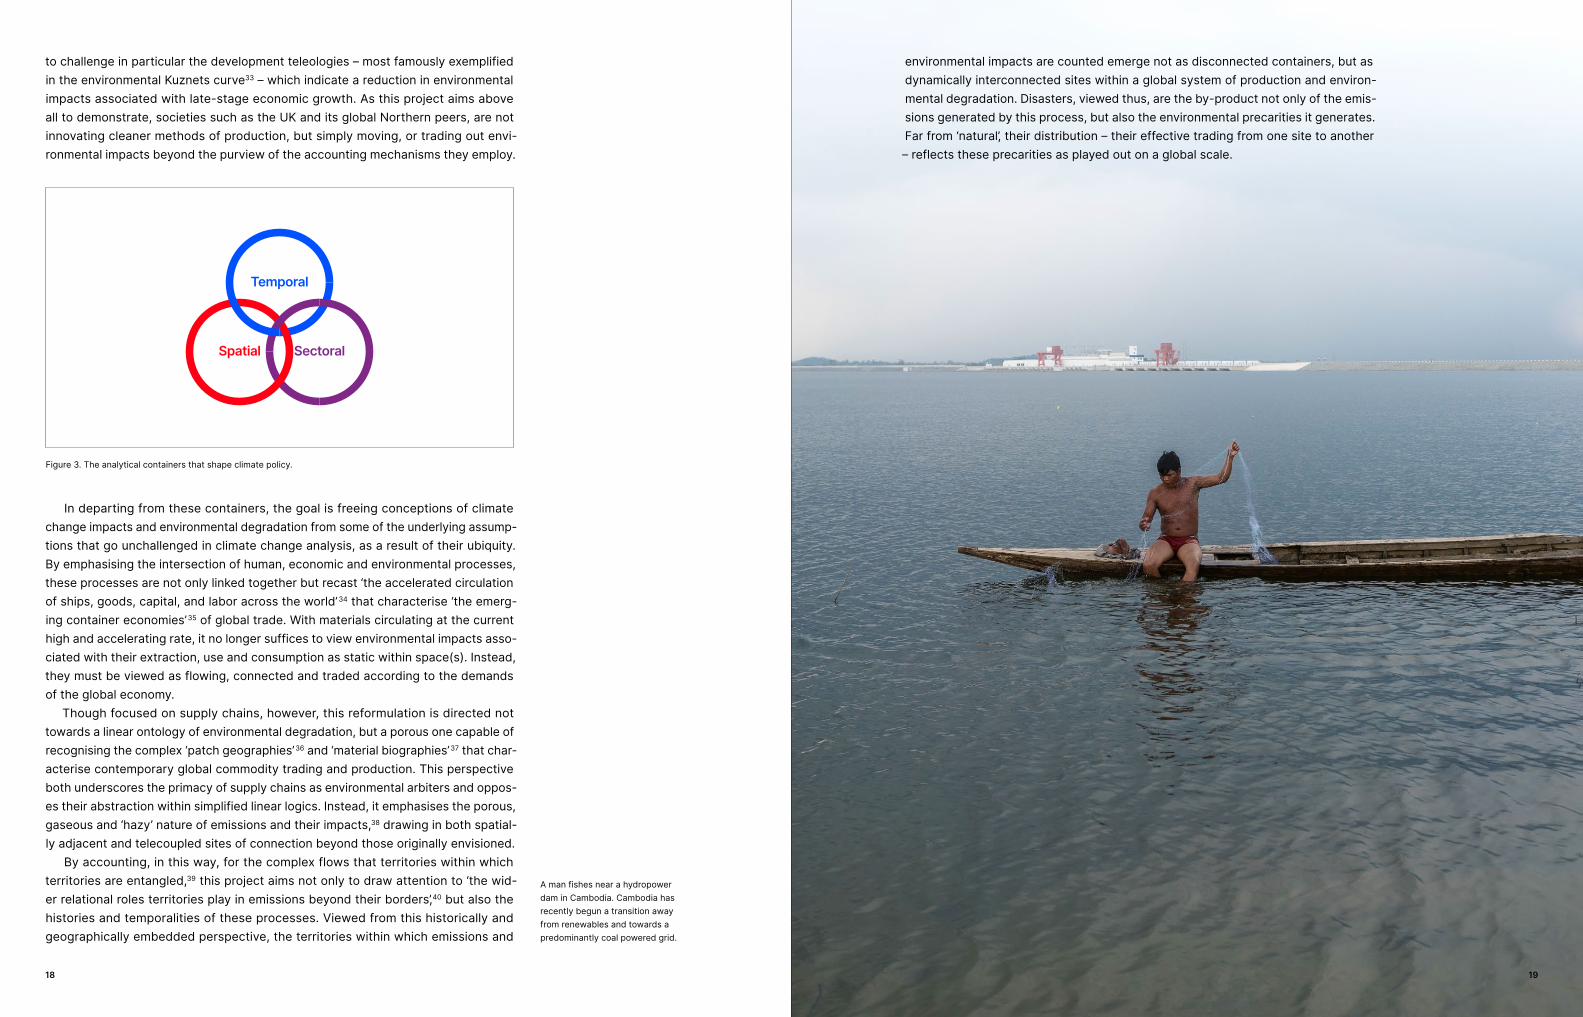
environmental�impacts�are�counted�emerge�not�as�disconnected�containers,�but�as�dynamically�interconnected�sites�within�a�global�system�of�production�and�environ-mental�degradation.�Disasters,�viewed�thus,�are�the�by-product�not�only�of�the�emis-sions�generated�by�this�process,�but�also�the�environmental�precarities�it�generates.�Far�from�‘natural’,�their�distribution�–�their�effective�trading�from�one�site�to�another�–�reflects�these�precarities�as�played�out�on�a�global�scale.
A�man�fishes�near�a�hydropower�dam�in�Cambodia.�Cambodia�has�recently�begun�a�transition�away�from�renewables�and�towards�a�predominantly�coal�powered�grid.
1918

Methods employed in the studyThis�study�draws�on�data�collected�by�an�interdisciplinary�team�of�more�than�twenty�people,�working�across�multiple�field�sites�across�five�countries:�Bangladesh,�India,�Cambodia,�Sri�Lanka�and�the�UK.�In�seeking�to�construct�a�novel�perspective�on�how�climate�change�emissions�and�impacts�are�linked�though�international�trade�pro-cesses,�it�combines�primary�and�secondary�data�collection�and�analysis�across�the�three�material�focal�points�of�garment�production�in�Cambodia,�brick�production�in�the�South�Asian�brick�belt,�and�tea�production�in�Sri�Lanka.�Where�primary�fieldwork�was�undertaken,�all�interviews�were�undertaken�outside,�with�face�coverings�man-dated,�at�a�minimum�distance�of�three�meters.
2.2.1 Garment manufacture in CambodiaThis�garment-focused�component�of�the�project�comprised�three�dimensions.�First,�an�analysis�of�international�trade�was�undertaken�using�the�UN’s�Comtrade�data�base�(2015�–�2018�for�Cambodia�imports�and�2015�–�2019�for�UK�imports),�in�order�to�gen-erate�data�on�the�volumes�of�garments�and�other�textiles�trad�ed�between�Cambodia�and�the�UK,�as�well�as�the�raw�materials�involved�in�their�manufacture.�Combined�with�a�review�of�literature�and�existing�published�data,�this�secondary�analysis�produced�data�on�a)�the�volume�of�trade�flows�between�Cambodia�and�the�United�Kingdom�(UK)�with�regards�to�the�garment�industry;�b)�the�countries�of�origins�and�sub-national�locations�from�which�Cambodia�imports�materials�used�for�man-ufacturing�textiles;�c)�UK�companies�connected�with�and/or�exposed�to�the�Cambodian�textile�industry;�d)�a�review�of�existing�data�on�environmental�problems�associated�with�the�production�of�textiles�in�Cambodia�and�its�supply�chain.These�data,�which�included�statistics�on�ports�of�origin�and�destination,�as�well�
as�the�mode�of�transportation�employed�for�transportation,�were�then�used�to�cal-culate�figures�on�embodied�emissions�associated�with�Cambodia’s�garment�exports�to�the�UK.�In�addition,�they�were�used�to�set�up�the�second�component�of�research�in�the�Cambodia�site:�primary�data�collection�on�the�environmental�impacts�of�gar-ment�production�for�UK�brands.This�second�component,�lasting�six�weeks�from�February�to�March�2021,�involved�
visiting�factory�sites�in�order�to�observe�the�environmental�issues�with�which�they�were�associated.�In�total,�twenty�factories�linked�to�British�brands�were�observed�in�person.�In�addition,�30�qualitative�interviews�lasting�between�10�and�40�minutes�were�undertaken�with�local�people�living�and�working�in�the�vicinity�of�these�target�factories.The�final�component,�lasting�four�weeks�from�June�to�July�2021,�comprised�a�
2.2
Colombo
SRI LANKA
Copyright © Free Vector Maps.com
INDIA
New Delhi
Copyright © Free Vector Maps.com
Phnom Penh
CAMBODIA
Dhaka
BANGLADESH
Figure�4.�Field�sites:�1.�Loolkadura�2.�Meeriyabedda�3.�Dickwella��4.�Narsingdi�5.�Gujurat�6.�Punjab�7.�Kampong�Speu��8.�Set�Bo
This study draws on data collected by an interdisciplinary team of more than twenty people, working across multiple field sites across five countries: Bangladesh, India, Cambodia, Sri Lanka and the UK.
20 21

nationally�representative�sample�of�fuel�use�in�the�Cambodian�garment�industry.�Data�were�obtained�via�a�randomly�selected�sample�of�255�GMAC�registered�factories�(of�which�158�yielded�responses).�Surveys�were�undertaken�anonymously�with�work-ers�involved�in�the�process�of�wood�delivery.�Their�names,�roles�and�the�factories�from�which�data�were�obtained�are�withheld�here,�in�order�to�protect�this�anonymity.
2.2.2 Brick exports from the South Asian brick beltAs�with�the�garment�focused�research�component,�the�component�on�brick�production�in�the�South�Asian�brick�belt�comprised�two�dimensions.�First,�a�secondary�analysis�of�carbon�emissions�associated�with�the�South�Asian�brick�trade�was�undertaken,�based�on�data�from�HMRC�on�brick�importation�trends�to�the�UK�over�time.�Using�these�data,�which�included�frequency�statistics�on�brick�imports�between�the�years�2015�and�2019,�disaggregated�by�county�of�origin,�it�was�possible�to�calculate�the�carbon�emissions�embodied�in�brick�importation�to�the�UK.The�second�element�of�the�brick-focused�research�component�comprised�fieldwork�
undertaken�by�research�teams�based�in�Bangladesh�and�India,�in�order�to�reflect�the�wider�trend�of�brick�importation�from�the�South�Asian�brick�belt�to�the�UK.�A�total�of�24�interviews�were�undertaken�with�local�people,�brick�kiln�works�and�kiln�owners�in�two�exporting�kilns�in�India,�located�in�Punjab�and�Gujarat.�A�total�of�45�interviews�were�undertaken�with�local�people,�brick�kiln�works�and�kiln�owners�across�five�brick�kilns�in�Bangladesh,�of�which�one�was�an�exporting�kiln�and�four�were�non-exporting�kilns.�Interviews�were�undertaken�in�local�languages�by�researchers�from�the�local�area.�Interviews�in�Bangladesh�were�undertaken�in�Bengali,�interviews�in�Punjab�were�undertaken�in�Punjabi,�and�interviews�in�Gujarat�were�undertaken�in�Gujarati�and�Hindi.These�two�contexts�were�selected�to�represent�different�facets�of�the�brick�belt.�In�
Bangladesh,�one�of�the�most�vulnerable�countries�to�climate�change�due�to�a�combi-nation�of�floods,�droughts�and�sea�level�rise,�the�brick�industry�is�widely�acknowledged�as�one�of�the�most�environmentally�destructive�sectors.�As�a�result,�brick�exports�are�technically�illegal�in�Bangladesh,�yet�as�evidenced�here�they�continue�to�take�place,�especially�for�non-standard�brick�types.�In�India,�by�contrast,�brick�exports�are�relatively�prevalent,�accounting�for�around�1%�of�all�brick�production�and�millions�of�those�imported�by�the�UK.�Thus,�by�highlighting�issues�linked�to�brick�exports�across�different�systems�of�environmental�governance,�these�linked�studies�are�intended�to�represent�an�issue�which�extends�across�multiple�South�Asian�countries�and�distinct�systems�of�governance.
2.2.3 Tea exports from Sri LankaThe�third�research�component,�focused�on�tea�production�in�Sri�Lanka,�comprised�three�dimensions,�each�of�which�are�intended�to�elucidate�the�role�of�land�use�change�related�to�tea�plantations�in�shaping�the�prevalence�and�intensity�of�landslides�in�Sri�Lanka.The�first�element�of�the�Sri�Lanka�component�used�secondary�datasets�made�
available�by�the�Central�Bank�of�Sri�Lanka�and�the�World�Bank�to�establish�long�term�trends�in�the�economics�of�the�Sri�Lankan�tea�industry,�as�well�as�changes�in�the�relative�share�of�British�exports�in�the�Sri�Lankan�tea�market.�This�component�also�provided�background�data�and�maps�on�the�locations�of�tea�plantations�in�plantations�in�Sri�Lanka�and�the�geographical�changes�to�the�sector�over�time.The�second�element�of�the�Sri�Lanka�component�involved�cross-referencing�the�
previously�established�database�on�tea�holdings�with�geospatial�data�on�landslide�
vulnerability�and�land�use�change.�This�element�provided�data�on�the�statistical�rela-tionship�between�transitions�into�and�out�of�tea�cultivation,�as�well�as�the�relative�landslide�risk�associated�with�tea�landholdings,�compared�with�other�forms�of�land�use.�In�addition,�this�element�specifically�focused�on�the�landholdings�of�British-owned�tea�plantations,�in�order�to�highlight�the�particular�impact�of�UK�investment�on�the�risk�of�landslides�in�the�Sri�Lankan�highlands.The�final�element�of�the�Sri�Lankan�work�package�comprised�the�collection�of�
qualitative�data�in�three�highland�locations�in�Sri�Lanka:�Two�active�British�tea�plan-tations�located�in�areas�of�high�landslide�risk�and�one�resettlement�site�for�the�sur-vivors�of�a�previous�landslide�on�a�British�tea�plantation.�In�total,�15�semi�structured�interviews�were�carried�out�with�tea�plantation�workers�and�supervisors,�lasting�between�30 – 60�minutes.�All�interviews�were�undertaken�in�Sinhala�or�Tamil�by�a�local�team�of�researchers.
2322

Garments Garment supply chains are long, complex and obscure, hiding environmental impacts and making them challenging to fully assess. Garment supply chains are often much longer than reported, concealing high levels of emissions from transport. Compounding this, limited supply chain regulation means that serious environmental abuses occur in the UK overseas production, whilst changes to overseas energy production generate massive increases in the UK’s consumed carbon footprint.
Part 3
A�garment�sector�dump�on�the�outskirts�of�the�Cambodian�capital,�Phnom�Penh.
24 2524

The�global�garment�industry�is�enormous,�accounting�for�more�than�75�million�workers�worldwide.�The�industry�as�a�whole�is�estimated�to�be�worth�$2.4�trillion,�with�tex-tile�and�apparel�exports�totalling�more�than�$750�billion�in�2017.41�A�growth�industry,�worth�3�trillion�USD,�or�2%�of�global�GDP,42�it�is�nevertheless�a�sector�characterised�by�significant�concerns�over�its�environmental�impact.�Described�as�‘the�world’s�sec-ond�most�polluting�industry’�after�oil,43�it�is�an�industry�to�which�a�significant�share�of�both�carbon�emissions�and�local�environmental�degradation�–�related�in�particular�to�the�overuse�of�water�and�release�of�industrial�pollutants�–�is�attributed.44�In�2015,�it�is�estimated�that�the�apparel�industry�alone�was�responsible�for�1.3�gigatons�of�carbon�emissions,�2.4%�of�the�global�total.45
Various�attempts�have�been�made�to�establish�the�environmental�impact�of�the�garment�industry.46�Yet�a�key�constraint�in�this�respect�is�its�sheer�size�and�complexity.�The�industry�in�recent�years�has�undergone�a�substantive�separation�of�‘consumer�and�producer�countries�and�in�practice�concealed�actors�in�the�workforce�via�nested�subcontractor�relation-ships,�so�the�geographic�locations�where�a�garment�causes�environmental�and�social�impacts�may�not�be�obvious�even�to�the�retailer’.47�As�per�data�pro-vided�to�the�Open�Apparel�registry,�the�top�six�Brit-ish�retailing�brands�as�of�2020,�for�example�(includ-ing�the�now�defunct�Arcadia�group),�sourced�goods�from�an�average�of�560�factories�in�25�countries�each.�Between�all�six�of�them,�a�total�of�6194�factories�in�57�different�countries�are�involved�in�the�supply�of�British�garments:�a�number�that�makes�establishing�environmental�impact�extremely�challenging.�Moreover,�the�supply�chain�logistics�of�the�industry�–�increasingly,�but�still�only�partially�transparent48�–�make�establishing�responsibility�for�environmental�degradation�more�problematic�still.Across�four�parts,�this�section�focuses�on�the�case�of�Cambodia,�as�an�example�
of�an�end�stage�‘cut-make-trim’�garment�industry�in�which�raw�materials�are�pre-dominantly�imported�and�processed�before�being�re-exported�to�buyers�such�as�the�UK.�One�of�many�such�intermediary�producers�worldwide,�Cambodia�here�exempli-fies�several�of�the�key�mechanisms�through�which�carbon�emissions�are�hidden�or�under-reported�in�supply�chains.The�section�begins�with�an�example�of�how�supply�chain�complexity�serves�to�
obfuscate�the�geographical�extent�of�production�processes,�concealing�both�the�extent�of�transport�emissions�and�the�conditions�in�which�primary�materials�are�produced.�Linked�to�this,�the�case�of�Cambodia’s�pivot�to�coal�power�will�be�explored,�in�order�to�exemplify�how�global�Southern�energy�transitions�impact�the�extent�of�consumed�emissions�in�the�UK.�Beyond�this�global�scale�analysis,�however,�the�remainder�of�the�section�will�highlight�how�the�same�processes�that�serve�to�conceal�emissions�ultimately�incentivise�supply�chain�growth�in�areas�covered�by�limited�or�ineffectu-al�regulation,�setting�in�motion�local�processes�that�intensify�the�impacts�of�climate�change�along�supply�chains�providing�garments�to�British�consumers.
Clothing the garment industry’s environmental footprintThe�garment�industry�is�acknowledged�to�be�a�major�contributor�to�climate�change,�contributing�between�5%49�and�10%�of�global�carbon�emissions.50�Yet�despite�a�growing�awareness�of�‘the�price�of�fast�fashion’,51�the�scale�and�complexity�of�the�industry,�as�well�as�the�opacity�of�supply�chains�defined�and�delimited�predominantly�by�large�scale�end-stage�buyers,52�means�that�much�of�its�impact�continues�to�be�underestimated.By�analysing�import�and�export�data�from�the�UN’s�Com-Trade�database,�rath-
er�than�relying�on�data�provided�by�corporate�supply�chains,�this�section�aims�to�elucidate�some�of�the�pathways�through�which�emissions�are�‘lost’�in�calculation.�Although�this�does�not�facilitate�the�attribution�of�specific�corporate�responsibility�for�resource�flows�and�environmental�impacts,�it�does�establish�the�size�and�direc-tion�of�both�direct�and�indirect�flows,�rendering�visible�the�UK’s�share�of�international�resources�and�responsibility.A�central�example�of�how�complex�garment�supply�chains�serve�to�obscure�gar-
ment�provenance�and�environmental�impacts�relates�to�the�place�of�China�within�international�garment�supply�chains.�According�to�World�Bank�trade�data,�China�is�directly�responsible�for�only�around�20%�of�apparel�imports�to�the�UK,�as�of�2018.53�Yet�as�the�figures�below�show,�the�proportion�of�UK�apparel�imports�with�an�indirect�Chinese�provenance�is�likely�to�be�far�higher.This�has�both�ethical�and�environmental�implications.�British�retailers�–�and�indeed�
the�UK�government�itself�–�has�come�under�increasing�pressure�in�recent�years�to�eliminate�cotton�originating�from�the�Xinjiang�region�of�China�from�their�supply�chains.54�The�region�is�controversial�for�its�association�with�the�forced�labour�of�hundreds�of�thousands�of�ethnic�minority�labourers,�in�which�‘grave�concerns�about�systemic,�state-sponsored�coercion’�in�the�annual�cotton�harvest�have�been�raised.55�Following�the�Better�Cotton�Initiative’s�removal�of�its�seal�of�approval�from�Xinjiang,56�several�brands,�including�Uniqlo,�Calvin�Klein�and�C&A,�have�consequently�issued�statements�claiming�not�to�source�any�materials�from�Xinjiang.�Nevertheless,�the�predominance�of�Xinjiang�in�global�supply�chains�make�this�a�more�difficult�claim�on�an�industry�scale.�China�is�the�world’s�largest�producer�of�cotton,�accounting�for�some�20%�of�world�output,�within�which�the�Xinjiang�region�produces�the�lion’s�share�of�national�output,�at�84%.57
This�substantial�share�means�it�is�difficult�to�avoid,�especially�in�Southeast�Asian�intermediary�manufacturers,�which�are�heavily�dependent�on�cotton�imports�par-ticularly�from�China.�For�example,�in�Cambodia,�as�in�neighbouring�Vietnam,�there�is�no�domestic�cotton�industry�at�all�(bar�a�small-scale�artisan�revival�in�recent�years),�meaning�that�the�raw�materials�for�cotton-based�garment�production�must�be�import-ed�from�overseas.�Of�the�cotton�imported�to�Cambodia,�81.6%�arrives�directly�from�China�and�a�further�4.8%�via�Hong�Kong;�meaning�that�a�total�of�86.4%�of�the�cotton�
Described as ‘the world’s second most polluting industry’ after oil, it is an industry to which a significant share of both carbon emissions and local environmental degradation – related in particular to the overuse of water and release of industrial pollutants – is attributed.
3.1
2726

used�in�Cambodia�originates�directly�or�indirectly�from�China.�Assuming�that�Chinese�cotton�exports�are�produced�and�imported�in�the�same�proportions�as�the�national�average,�this�suggests�that�some�71.5%�(84%�of�85.1%)�of�cotton�garments�made�in�Cambodia,�including�those�exported�to�the�UK,�are�made�with�cotton�grown�in�the�controversial�province�of�Xinjiang.These�raw�figures�suggest�that�it�would�be�difficult,�if�not�impossible,�for�all�of�
the�UK’s�major�apparel�companies�to�be�honouring�their�ethical�commitments.�Yet,�as�brands�themselves�concede,�the�obscurity�of�extended�supply�chains�makes�it�‘extremely�difficult’58�to�prove�or�disprove�linkages�between�end�retailers�in�countries�such�as�the�UK�and�regions�such�as�Xinjiang.Moreover,�in�addition�to�the�ethical�implications,�supply�chain�obscurity�of�this�
sort�presents�substantial�challenges�to�environmental�accounting.�In�disguising�the�provenance�of�the�raw�materials�used�in�garment�manufacture,�the�complexity�and�opacity�of�garment�supply�chains�serves�also�to�conceal�their�length.�Between�2014�and�2018�almost�a�third�of�China’s�total�cotton�supply�was�imported,�making�it�the�largest�importer�of�cotton�in�the�world,�as�well�as�the�largest�producer.59�Of�this�third,�the�vast�majority�of�imports�came�from�five�countries:�Australia�(25.9%),�the�USA�(28.9%),�Uzbekistan�(7.75%),�India�(12.9%)�and�Brazil�(12.7%).�Besides�a�small�contri-bution�from�Mexico,�the�remaining�7.5%�of�imports�were�produced�predominantly�in�Africa,�most�notably�Burkina�Faso,�Cameroon,�Mali,�Cote�d’Ivoire,�Benin�and�Zimbabwe.The�weighted�average�distance�between�China’s�primary�cotton�producing�regions�
–�Xinjiang,�Hebei,�Shandong�and�Hubei�–�and�the�primary�export�port�of�Shanghai�is�4100�km.�In�contrast�the�mean�distance�travelled�by�China’s�imported�cotton�to�reach�China�is�19,000�km,�around�five�times�the�distance�travelled�by�domestic�cot-ton.�Assuming�equal�usage�of�imported�raw�materials�across�export�and�domestic�sectors�and�weighting�distances�according�to�relative�proportions�of�China’s�total�cotton�usage,�this�increases�the�total�mean�distance�travelled�by�raw�materials�in�China�to�9,000�km,�more�than�double�the�domestic�figures�used�by�studies�such�as�Wang�(2015).
Even before it departs Cambodia for the UK, the materials in a cotton shirt have already travelled 14,000km and emitted some 63g of carbon from transportation alone.
Raw materials Final garment
Finding�alternatives�to�this�complex�supply�chain�is�difficult.�Besides�the�81.6%�of�Cambodia’s�cotton�originating�in�China,�the�next�biggest�exporters�are�Hong�Kong’s�4.8%�and�a�further�6.4%�from�Vietnam.�Both�Hong�Kong�and�Vietnam,�Cambodia’s�second�and�third�largest�cotton�exporters,�are�geographical-ly�far�closer�than�China’s�north-eastern�textile�export�hub.�Yet�unlike�China,�neither�produces�cotton�domestically�on�an�appreciable�scale,�importing�over�99%�of�what�they�use�or�sell.�Both�countries�therefore�offer�pro-cessed�re-exports�from�other�countries,�thereby�extending,�rather�than�shortening�the�length�of�the�raw�material�supply�chain.�Almost�three�quarters�(72.53%)�of�Hong�Kong’s�cotton�exports�come�directly�from�China,�for�example.�Vietnam,�which�imports�cotton�predominantly�from�USA,�Brazil,�Australia,�India�and�Cote�d’Ivoir,�has�an�even�longer�supply�chain.Taking�all�this�together,�this�means�that�the�cotton�processed�into�clothing�in�
Cambodia’s�factories�has�travelled�a�weighted�average�of�14,000km�to�get�there.�Even�before�it�departs�Cambodia�on�the�18,000�km�sea�journey�to�UK�shops,�this�circuitous�journey�means�that�the�materials�which�comprise�a�typical�280g�cotton�shirt�have�already�emitted�some�63g�of�carbon�from�transport�alone,�almost�exact-ly�doubling�the�additional�64g�direct�carbon�cost�of�transportation�from�Cambodia�to�the�UK.�Once�they�arrive�in�British�shops,�they�have�travelled�on�average�over�32,000km,�three�quarters�of�the�way�around�the�world�and�accompanied�by�total�emissions�from�transport�of�127g�CO2e�per�shirt.
Figure�5.�The�Chinese�cotton�supply�chain�underpinning�Cambodia-UK�exports.
28 29

If�this�is�now�extrapolated�to�the�22,783�tonnes�of�cotton-based�exports�from�Cambodia�to�the�UK�that�originated�in�China�(56%�of�a�total�annual�40,684�tonnes),�this�equates�to�emissions�from�transport�of�6,173�tonnes�CO2e�annually,�of�which�2,522�tonnes�CO2e�is�derived�from�the�transport�of�raw�materials.�Yet�despite�their�huge�scale,�these�emissions�are�effectively�invisible�under�accounting�measures�which�fail�to�account�for�the�complexity�and�obscurity�of�the�international�textile�supply�chain.�That’s�the�equivalent�of�33�tanker�trucks�full�of�gasoline�being�burnt,�or�the�average�total�annual�emissions�of�almost�1000�Europeans,�concealed�by�the�logistics�of�global�production.The�key�implication�here�is�not�that�Cambodia�is�a�uniquely�significant�offender�
in�the�complexity�and�carbon�inefficiency�of�its�supply�chain.�Indeed,�Cambodia�is�a�rather�typical�‘cut-make-trim’�processing�intermediary�within�a�highly�globalised�industry.�Rather,�what�this�case�demonstrates�is�the�ill�fit�of�current�emissions�calcula-tions�such�as�WRAP�(2017)�and�the�Environmental�Audit�Committee�(2019),�which�do�not�account�for�transport�emissions,�to�the�highly�mobile�context�of�a�contemporary�global�industry�in�which�complexity�serves�to�conceal�length.�In�order�to�account�for�the�true�carbon�cost�of�the�goods�and�services�we�use,�it�is�therefore�necessary�to�look�beyond�the�two-country�input-output�analysis�that�tends�to�characterise�the�field60�towards�a�dynamic�global�perspective,�which�recognises�and�accounts�for�the�extensive�and�complex�chains�through�which�global�emissions�are�generated.
Climate change and Cambodia’s pivot to coalThe�hidden�mileage�travelled�by�UK�clothes�and�their�component�materials�constitutes,�in�itself,�one�dimen-sion�of�the�garment�industry’s�hidden�environmental�footprint.�Yet�there�is�also�a�wider�story�at�play,�rooted�not�in�the�movement�of�goods,�but�energy.�Industrial�processes,�such�as�those�employed�in�the�manufac-ture�of�clothing,�are�energy�intensive,�relying�heav-ily�on�the�national�grid�of�wherever�they�are�based.�As�a�result,�the�energy�embodied�in�garments�depends�to�a�significant�extent�upon�energy�decisions�made�in�the�global�South,�many�of�which�are�linked�themselves�to�climate�change.In�exemplifying�the�role�played�by�energy�transitions�in�the�global�South�on�UK�
emissions�figures,�Cambodia�again�provides�an�instructive�example.�Endowed�with�relatively�little�infrastructure�for�electricity�generation,�the�Kingdom�has�historically�relied�on�imported�electricity�for�its�power�needs,�leaving�it�heavily�dependent�on�its�neighbours,�Vietnam�and�Thailand.�Seeking�to�address�this�dependency,�recent�years�have�seen�substantial�investment�in�electricity�generation,�according�to�a�strategy�centred�predominately�on�hydropower.�Since�2000,�some�29�hydropower�dams�have�been�brought�online�in�Cambodia,�alongside�a�further�44�planned,�with�devastating�ecological�consequences�in�some�cases.�Environmental�campaigners�have�fought�for�years�to�halt�or�mitigate�the�ecological�impact�of�unchecked�dam�building�in�Cambo-dia;�a�struggle�which�recently�took�an�unexpected�twist.In�the�grip�of�a�prolonged�drought�–�and�the�now�almost�annual�period�of�low�rain-
fall�linked�to�5�El�Niño�events�in�the�last�6�years61�–�Cambodia’s�decade�long�pivot�to�hydropower�hit�a�brick�wall�in�early�2019.�Without�the�stored�water�needed�to�power�Cambodia’s�new�dams,�the�country�plunged�into�a�deep�power�shortage,�resulting�in�rolling�blackouts�for�almost�six�months.�This�was�not�only�an�inconvenience�to�resi-dents�of�Cambodia,�forced�to�endure�the�hottest�part�of�the�year�without�power�for�six�hours�or�more�a�day,�but�a�major�blow�to�industry.�The�country’s�dominant�gar-ment�industry�was�forced�to�reduce�working�hours�and�turn�to�highly�polluting�and�expensive�diesel�generators,�creating�delays�in�supply�chains�and�badly�affecting�the�environmental�rating�presented�by�factories�to�brands.Viewed�by�the�government�as�a�national�embarrassment,�Cambodia’s�season�
of�power�shortages�instigated�an�abrupt�change�in�strategy.�Since�2020,�four�coal�burning�power�plants�have�been�proposed�by�the�Cambodian�government:�three�planned�within�Cambodia’s�borders�and�a�further�plant,�intended�to�be�based�in�Laos�for�Cambodian�supply.�This�latter�station�is�expected�to�generate�a�staggering�3.4�
Cambodia’s new energy plan will increase the UK’s embodied carbon footprint by 126,200 tons of CO2 annually, equivalent to almost 70,000 tons of coal being burned each year in the UK. All from 4% of the UK’s garments.
3.2
3130

GW�of�electricity�for�Cambodia�each�year,�in�the�process�consuming�so�much�coal�that�it�will�require�its�own�coal�mine�to�be�dug�to�fuel�it.�It�is�expected�to�produce�an�additional�3.6�megatons�of�CO2e�annually,�more�than�the�total�carbon�footprint�of�DR�Congo�and�a�huge�increase�for�a�country�with�a�relatively�small�carbon�footprint�in�global�terms.The�story�of�Cambodia’s�poorly�planned�and�now�apparently�abortive�drive�towards�
hydropower�illustrates�the�cruel�irony�of�climate�change�in�the�global�South.�Scup-pered�in�a�path�towards�renewable�energy�by�the�severity�of�climate-linked�drought,�the�government�has�decided�on�a�course�of�action�which�will�ultimately�deepen�the�ecological�crisis�which�sees�Cambodia�consistently�ranked�as�one�of�the�most�climate�vulnerable�countries�in�the�world.�Unable�to�overcome�the�impacts�of�climate�change,�the�decision�has�been�made,�it�appears,�to�join�in�contributing�to�them.�Nevertheless,�this�fundamental�transformation�of�Cambodia’s�energy�landscape�has�implications�far�beyond�the�borders�of�the�Kingdom.From�a�profile�of�49%�renewable,�34%�non-renewable,�and�16%�imported�energy�
today,�Cambodia’s�four�new�plants�will�see�80%�of�the�Kingdom’s�energy�generated�from�non-renewable�sources�by�2030.�Yet�this�change�of�direction�is�thrown�into�sharper�relief�still�in�the�context�of�previous�plans.�From�a�sustainable�energy�strat-egy�to�halve�the�carbon�intensity�of�the�national�grid,�from�806�tCO2/GWh�to�413�tCO2/GWh,�Cambodia’s�new�plan�would�see�the�grid’s�carbon�intensity�–�already�the�highest�in�ASEAN�–�increase�by�a�further�10%�to�888�tCO2/GWh.Assuming�non-grid�energy�usage�remains�constant,�Cambodia’s�pivot�to�coal�will�
see�the�total�carbon�footprint�of�a�ton�of�garments�increase�by�over�half�a�ton�to�8.3t/CO2e�by�2030.�To�put�this�into�perspective,�the�previous�energy�plan�was�expected�to�decrease�the�carbon�intensity�of�Cambodia’s�grid�substantially,�to�only�413�t/GWh.�Were�this�plan�to�have�gone�ahead,�the�total�carbon�footprint�of�a�ton�of�Cambodian�garments�would�have�decreased�to�5.2�tons/CO2e.The�new�energy�plan�underway�in�Cambodia�therefore�represents�a�relative�increase�
in�the�carbon�cost�of�garment�of�37%�over�the�previous�energy�plan,�a�change�of�direction�that�means�each�220g�garment�supplied�to�the�UK�will�be�associated�with�an�additional�680g�of�CO2�emissions:�slightly�over�the�volume�of�a�standard�bathtub.�Extrapolated�to�the�UK’s�40,684�tons�of�annual�garment�imports,�this�policy,�shift�which�has�gone�almost�entirely�unnoticed�in�the�UK,�has�therefore�increased�the�UK’s�consumption-based�carbon�footprint�by�some�126,200�tons�of�CO2�annually,�equivalent�to�70,000�tons�of�coal�being�burned�in�the�UK�each�year.�All�of�this�from�the�change�in�the�energy�underlying�garment�production�in�a�country�that�supplies�under�4%�of�the�UK’s�garments.62
Current plan
2030 sustainable energy plan
2030 new plan
Figure�6.�Embodied�emissions�–�mean�CO2�emitted�per�ton�of�garments�produced�–�generated�under�Cambodia’s�current,�previously�planned�and�currently�planned�energy�profile.
On�the�level�of�governance,�this�shift�in�strategy�runs�counter�to�both�national�and�international�environmental�statutes.�The�National�Strategic�Development�Plan�[NSDP]�2019–2023,63�for�example,�includes�actions�to�implement�the�government’s�priorities�related�to�energy,�including�both�‘promoting�sustainability�in�development�that�ensures�economic�prosperity�while�preserving�the�quality�of�the�environment,�sustainable�livelihoods�and�the�availability�of�natural�resources’�and�‘improving�poli-cies�and�regulations�to�increase�the�contribution�of�renewable�energy�in�Cambodia’s�diverse�energy�sector’.64�On�an�international�level,�moreover,�Cambodia’s�obligations�are�clearer�still.�As�laid�out�by�the�ADB,65�‘Cambodia’s�Nationally�Determined�Contribution,�enshrined�in�the�2015�Paris�Agreement,�commits�to�a�16%�reduction�in�greenhouse�gas�emissions�from�the�energy�sector�from�a�business-as-usual�scenario�by�2030’.This�reversal�in�energy�policy�therefore�appears�to�constitute,�in�terms�of�its�con-
tribution�to�the�national�grid,�a�breach�of�the�terms�of�the�Paris�Agreement.�Yet�in�reality,�the�domestic�nature�of�carbon�accounting�means�that�this�need�not�be�the�case.�Rather,�by�‘outsourcing’�a�large�segment�of�coal�power�generation�to�Laos,�Cambodia�itself�is�spared�the�burden�of�the�emissions�it�generates,�potentially�free-ing�up�the�‘national’�energy�quote�for�the�higher�proportion�of�renewables�required�under�its�Paris�agreement�national�target�of�a�27%�reduction�in�forecasted�emissions.66�This�case�therefore�exemplifies�the�counter-intuitive�role�played�by�domestic�emis-sions�governance�in�mobilising�carbon�intensive�energy�production�beyond�national�borders.�Yet,�more�complex�still,�the�globalised�nature�of�production�means�that�the�impact�of�Cambodia’s�energy�policy�extends�far�beyond�the�Kingdom�itself,�shaping�the�emissions�embodied�in�every�garment�produced�in�a�Cambodian�factory.Indeed,�given�the�substantial�implications�for�the�emissions�embodied�in�the�sup-
ply�chain�of�exporting�companies,�this�news�has�been�met�with�some�dissatisfaction�amongst�major�buyers.�In�late�2020,�a�letter�signed�by�8�major�brands,�including�H&M,�Adidas�and�Puma,�was�addressed�to�Cambodia’s�deputy�prime�minister�stating�that�‘shifting�from�hydroelectric�to�coal�is�not�the�solution�needed�by�industry�today,�and�we�must�stress�that�price�alone�is�not�enough�to�overcome�regional�industrial�com-petitiveness�that�is�increasingly�prioritising�environmental�sustainability�as�central�to�business�decision�making�and�planning’.�As�it�concluded,�‘Cambodia�is�at�an�impor-tant�crossroads.�Electricity�decisions�made�today�will�lock�Cambodia�into�a�future�that�appears�to�be�the�opposite�of�global�and�regional�trends�and�less�attractive�to�industry’.67
As�of�2021,�Cambodia’s�energy�sector�comprised�29%�imported�energy�(of�which�28%�from�Thailand,�34%�from�Laos�and�38%�from�Vietnam).�The�remaining�71%�is�split�between�non-renewables�(39%)�including�coal�and�fuel�oil�and�renewables�(32%),�of�which�more�than�90%�is�hydropower.�Given�projected�future�power�demands,�Cambodia�had�previously�announced�plans�to�expand�the�capacity�of�the�grid�by�focusing�on�the�development�of�natural�gas�capacity�and�hydropower.�By�2030,�this�plan�aimed�to�eliminate�power�imports�whilst�delivering�an�energy�composition�of�17%�coal,�33%�hydropower�and�50%�natural�gas.�The�new�plan�will�see�Cambodia�transition�towards�80%�non-renewable�power,�predominantly�coal.�
Figures�on�the�energy�costs�of�a�given�garment�vary�considerably,�but�an�oft�quoted�figure�for�the�production�of�a�ton�of�garments�in�Cambodia�is�42�Giga�joules�(GJ)�per�ton�of�garments�produced�in�the�Kingdom.216�Based�on�this�figure,�the�production�of�a�ton�of�garments�today�–�with�the�grid�producing�806g�of�CO2/�GWh�–�would�produce�emissions�of�9.4�tons�of�CO2,�were�the�process�entirely�powered�by�grid.�However,�factoring�in�10%�of�energy�produced�using�biomass�and�a�further�36%�through�small�scale�diesel�generators217�provides�a�lower�figure�of�7.77t�CO2.
3332

Nevertheless,�although�it�demonstrates�corporate�concern�over�the�issue�of�global�South�energy�transitions,�what�this�letter�highlights�above�all�is�the�extent�to�which�decisions�over�emissions�–�especially�those�which�are�embodied�and�traded�across�borders�–�are�left�to�the�purview�of�economic,�rather�than�political�actors.�UK�based�firms�are�subject�to�government�guidance68�which�states�the�following:
“Since�1�October�2013�the�Companies�Act�2006�(Strategic�Report�and�Directors’�Report)�Regulations�2013�has�required�all�UK�quoted�companies�to�report�on�their�greenhouse�gas�emissions�as�part�of�their�annual�Directors’�Report.�From�1�April�2019,�quoted�companies�must�report�on�their�global�energy�use�and�large�businesses�must�disclose�their�UK�annual�energy�use�and�greenhouse�gas�emis-sions.�This�is�required�by�the�Companies�(Directors’�Report)�and�Limited�Liability�Partnerships�(Energy�and�Carbon�Report)�Regulations�2018.”
Although�these�regulations�cover�Tier�1�(directly�produced)�and�Tier�2�(produced�via�energy�use)�emissions,�Tier�3�(supply�chain)�emissions�are�subject�only�to�vol-untary�submission.69�Consequently,�despite�the�concern�expressed�by�major�brands�over�Cambodia’s�energy�transition,�supply�chain�emissions�and�environmental�impacts�remain�beyond�the�purview�of�external�scrutiny�in�many�cases.�Were�brands�minded�to�require�the�full�extent�of�the�emissions�produced�by�their�supply�chains,�then�the�possibility�exists�simply�to�sub-contract�dirtier�and�more�carbon�intensive�processes.�Indeed,�this�practice�is�already�commonplace�both�globally,�where�it�is�estimated�to�be�employed�in�some�36%�of�factories�and�in�Cambodia�specifically,�where�52%�of�factories�subcontract�orders�without�authorisation.70�In�order�to�account�more�fully�for�the�implications�of�energy�policy�in�the�global�South,�therefore,�a�more�rigorous�approach�to�carbon�accounting�and�environmental�impacts�on�a�national�and�inter-national�scale�is�necessary.
Water pollution, environmental destruction and the Cambodian garment industryBefore�climate�change�began�to�take�centre�stage�in�global�environmental�policy,�the�management�of�local�pollutants�formed�the�mainstay�of�environmental�governance�in�the�industrial�economies�of�the�global�North.�Following�decades�of�worsening�environmental�conditions,�culminating�in�London’s�famous�‘pea�souper’�smogs�of�the�19th�and�early�20th�century,�the�UK’s�domestic�environmental�policy�was�tightened�to�place�stringent�regulations�on�manufacturing.�Local�pollution,�both�water�and�air-borne,�is�governed�by�the�Environmental�Protection�Act�(1990),�which�requires�com-panies�to�report�and�document�all�impacts�on�the�local�environment,�whilst�provid-ing�frameworks�also�for�complaints,�enforcement�and�the�imposition�of�penalties.�In�the�UK,�this�combination�of�environmental�legislation�and�enforcement�has�been,�in�historical�terms,�a�resounding�success,�generating�major�tangible�gains�in�the�qual-ity�of�domestic�water�resources.�Indeed,�as�the�Environment�Agency71�summarises:
“Since�1995�some�of�the�worst�pollutants�in�our�rivers�have�been�cut�dramatical-ly:�ammonia�levels�are�down�70%�and�phosphates�down�60%.�Toxic�metals�like�copper,�lead,�cadmium�and�mercury�have�also�been�reduced,�the�last�two�by�50%�since�2008.�Serious�water�pollution�incidents�have�been�cut�by�nearly�two�thirds,�from�765�in�2002�to�266�in�2019.
Since�the�1990s�there�has�been�a�big�increase�in�the�numbers�of�small�animals�that�live�in�rivers�like�snails,�worms�and�insects�–�a�key�indicator�of�the�overall�improving�health�of�our�waters.�Many�of�the�artificial�barriers�to�fish�and�other�wildlife�have�been�removed:�in�the�last�ten�years�the�Environment�Agency�and�its�partners�have�removed�over�130�weirs�and�improved�fish�passage�at�more�than�420�other�sites,�allowing�salmon,�other�fish�and�eels�to�migrate�and�breed.�Mean-while�the�bathing�waters�around�our�coasts�are�in�a�much�better�state�than�they�were�twenty�years�ago.�In�2019�98.3%�met�or�exceeded�the�minimum�standard�and�for�the�first�time�more�than�70%�achieved�the�Excellent�standard.”
Nevertheless,�as�manufacturing�continues�to�decline�as�a�proportion�of�the�UK�economy,�with�more�and�more�goods�being�imported�each�year,72�the�proportion�of�goods�consumed�by�UK�residents�that�are�governed�by�these�strictures�is�declining�also.�Companies�importing�goods�are�subject�to�only�voluntary�agreements�in�rela-tion�to�their�environmental�impacts�overseas,�with�responsibility�for�transparency�over�environmental�impacts�largely�being�left�to�companies�themselves�and�subject�to�environmental�regulations�that�are�far�less�stringent�than�those�governing�the�UK�
3.3
3534

itself.�As�a�result,�much�of�the�environmental�impact�associated�with�imported�goods�goes�either�unreported,�or�under-reported,�concealing�the�true�environmental�impact�of�the�UK�population’s�consumption.73
The�World�Health�Organization�estimates�that�more�than�12�million�people�die�annu-ally�from�environmental�health�risks�largely�caused�by�air,�land,�and�water�pollution,74�much�of�it�linked�to�export�focused�industrial�production.75�Nevertheless,�despite,�or�perhaps�due�to�its�disproportionate�impact�on�developing�countries,�‘industrial�pollution�in�the�global�South�it�remains�one�of�the�most�under-recognized�global�problems’.76�Far�from�being�managed�on�a�global�scale,�therefore,�water�land�and�air-borne�pollutions�are�increasing�rapidly�in�many�parts�of�the�global�South,�including�the�Greater�Mekong�Subregion.In�the�Cambodian�garment�industry,�where�just�under�4%�of�the�UK’s�clothes�are�
produced,�three�key�facets�of�environmental�degradation�predominate:�pollution,�resource�depletion,�and�carbon�emissions,�all�of�which�have�already�left�a�serious�and�lasting�impact�on�the�environments�within�which�UK�garments�are�produced.�Although�industrial�pollution�is�governed�in�principle�by�the�Law�on�Environmental�Protection�and�Natural�Resource�Management�(1996),�the�reality�of�enforcement�remains�far�removed�from�the�legal�principles�in�place.�As�outlined�in�the�global�Environmen-tal�Performance�Index,77�Cambodia�ranks�139th�out�of�180�indexed�countries,�with�wastewater�treatment�specifically�ranked�134th.�Reflecting�this�position,�rural�water�quality�in�Cambodia�has�been�described�as�a�‘crisis’,�posing�‘significant�challenges�for�the�government’�in�terms�of�sanitation,�health�and�environmental�sustainability.78
Moreover,�these�are�issues�that�can�be�traced�directly�to�the�activities�of�UK�indus-try.�UK�owned�and�linked�factories�continue�to�emit�harmful�chemicals�into�public�water�systems,�many�of�which�are�ultimately�released�into�the�natural�environment�without�further�treatment.�
“In the past, we could use water from the lake for cooking and household consumption. Since the factory came here, we cannot use the water from the lake anymore, especially the last 2 or 3 years … We cannot drink it because it is oily. The oil is everywhere.”
Smoke�rises�from�a�garment�factory�in�Cambodia.�Expensive�mains�electricity�means�that�many�garment�factories�produce�power�by�burning�garments�or�wood.�
373636

impacts�are�associated�with�‘natural’�environmental�processes�viewed�as�beyond�the�control�of�industry.�Local�people�experience�periods�of�high�water�and�flooding�on�a�regular�basis,�often�resulting�in�overspill�of�treated�or�untreated�wastewater�into�farmlands�and�fisheries.�Yet�the�idea�that�such�impacts�are�the�result�of�ungovern-able�environmental�processes�is�used�as�a�key�argument�against�industrial�culpabil-ity.�With�little�incentive�to�provide�robust�protections�against�wastewater�overspill�during�periods�of�heavy�rain,�industrially�induced�crop�destruction�of�this�sort�are�consequently�both�frequent�and�unanswerable:
“There�was�a�big�flood�last�year.�It�was�natural�disaster.�So,�how�can�we�complain�to�the�factory?�We�have�no�right�to�complain�to�them�because�we�don’t�have�a�sys-tem�to�release�[flood�water]�to�the�river.�Consequently,�[they�argue],�we�deserve�only�what�we�have�left�[after�the�chemical�damage].�We�did�not�know�whether�there�would�be�a�flood�or�not,�or�even�that�the�factory�stores�pollute�water.�But�[still]�we�cannot�beat�them.” — Fishers,�Set�Bo,�March�2021
Worse�still,�the�impacts�of�irregular�or�‘unexpectedly’�heavy�rainfall�are�increas-ingly�common�in�the�area.�As�farmers�complain,�this�is�a�daily�occurrence�when�fac-tory�orders�are�regular:�
“If�the�factory�is�operating,�it�creates�polluted�water�and�if�there�is�a�rain�as�well,�the�polluted�water�[rises]�high�and�flows�into�here�[the�lake�and�surrounding�area].” — Fishers,�Set�Bo,�March�2021�
Moreover,�as�local�residents�elaborated,�this�discharge�has�a�profound�effect,�not�only�on�local�agriculture,�but�also�the�water�supply�more�generally:
“Last�year,�it�destroyed�the�crop�of�the�villagers�and�then�villagers�complained�to�the�factory�about�that.�They�complained�that�water�leaked�out�and�damaged�their�mint�crop�because�it�contained�oil�and�other�substances.�After�that,�they�made�a�blockage�to�prevent�water�leaking�out�of�the�factory.�However,�when�there�was�a�flood,�[the�factory�managers]�were�afraid�that�water�would�come�inside�the�fac-tory�[itself],�so�they�released�the�blockage�and�the�water�flowed�out�of�the�fac-tory …�In�the�past,�we�could�use�water�from�the�lake�for�cooking�and�household�consumption.�Since�the�factory�came�here,�we�cannot�use�the�water�from�lake�anymore,�especially�the�last�2�or�3�years … We�cannot�drink�it�because�it�is�oily.�The�oil�is�everywhere.” — Female�Wage�Labourer,�Set�Bo,�March�2021
Even�during�the�course�of�normal�operations,�the�expulsion�of�factory�wastewater�into�the�nearby�lake�appears�to�have�had�a�profound�impact�on�local�ecology�in�this�area.�As�fishers�working�in�the�local�area�explained,�when�the�‘cleaned’�industrial�liquid�was�initially�pumped�into�the�lake,�it�resulted�in�degradation�of�the�local�ecosystem,�instigating�substantial�changes�in�the�local�fish�population.�As�local�people�explained:
“If the factory is operating, it creates polluted water and if there is a rain as well, the polluted water rises high and flows into the lake and surrounding area.”
In�an�industrial�agglomeration�to�the�South�of�the�Cambodi-an�capital�Phnom�Penh,�for�example,�one�of�the�largest�factories�in�the�area�and�a�major�supplier�to�UK�brands�is�responsible�for�liquid�emissions�with�a�history�of�damaging�local�farmers�crops�and�significantly�affecting�local�ecology.�Despite�liquid�emissions�from�this�factory�being�treated�on�site,�residents�of�the�local�area�have�for�some�years�complained�of�the�impact�of�wastewater�on�their�crops�when�the�large�reservoirs�locate�behind�the�factory�overflow�in�the�rainy�season.
“As�we�know,�the�laundry�water�always�has�chemicals�in�it.�It�is�not�cleaned�100%.�If�there�is�a�lot�of�rain,�then�it�rises�up�and�spills�out�and�floods�the�nearby�land.�It�is�sour.�That�is�the�problem.�If�we�complain�to�the�commune�chief,�or�village�chief,�nothing�is�solved.�As�a�citizen,�we�cannot�do�anything�…�They�give�[them]�some�money.�Then,�they�are�just�silent.” — Fishers,�Set�Bo,�March�2021
Despite�the�obvious�damage�underway,�a�key�issue�in�local�people’s�ability�to�resist�the�environmental�impacts�generated�by�nearby�factories�is�that�many�of�the�worst�
A�woman�living�in�the�vicinity�of�a�garment�factory�in�Kandal�province.�Liquid�and�airborne�pollution�are�a�major�problem�for�many�of�those�living�in�the�vicinity�of�the�industry.�
3938

“They�have�an�underground�pipe�system�from�the�factory�to�here�[the�lake].�The�water�flows�through�it�to�the�canal�and�then�to�the�lake.�They�made�the�under-ground�pipe�system�about�two�years�ago.�So,�if�the�factory�works�constantly,�then�water�goes�up�and�flows�down�here.�If�the�[water�storage]�reservoirs�of�the�factory�are�full,�they�will�release�the�water�out.�At�times�of�full�production,�if�they�work�every�day,�they�release�water�out�[like�this]�every�day.” — Wife�of�Fisher,�Set�Bo,�March�2021
Inevitably,�this�regular�industrial�discharge�has�negatively�impacted�local�liveli-hoods.�Casting�doubt�on�assertions�from�authorities�that�‘there�is�no�bacteria�in�the�polluted�water” — Fishers,�Set�Bo�08-03-2021),�locals�consistently�report�deleteri-ous�environmental�impacts�resulting�from�the�water-borne�pollution�from�the�factory.�Local�fishers�explained�that�despite�the�Ministry’s�assurances,�“even�the�weeds�inside�the�lake�also�died.�Before�it�had�a�lot�of�weeds.�The�polluted�water�killed�everything.”�— Fishers,�Set�Bo,�March�2021.�As�a�local�woman�continued:
“In�the�past,�when�there�was�no�water�from�outside�coming�to�the�lake,�we�could�find�a�lot�of�snails�and�fish.�But�since�that�water�come�into�the�lake,�it�kills�the�fish�and�snails,�and�it�makes�our�life�harder�and�harder�to�[earn]�rice�to�eat�…�It�occurred�after�the�establishment�of�[the�factory]�Goldfame�[Star].�Before�the�fac-tory�was�located�here,�we�could�[even]�use�the�water�for�household�consumption�and�other�purpose” — Wife�of�Fisher,�Set�Bo,�March�2021
For�people�already�struggling�to�adapt�to�the�impacts�of�climate�change-linked�floods,�therefore,�industrial�pollution�of�this�type�effectively�catalyses�the�destruc-tion�of�livelihoods,�intensifying�and�extending�the�impacts�of�Cambodia’s�increasingly�irregular�rainfall�through�chemical�pollution.�This�is,�moreover,�a�nationally�attribut-able�impact,�with�each�of�these�cases�linked�to�people�living,�farming�and�fishing�in�the�vicinity�of�a�factory�which�manufactures�and�processes�clothing�for�a�number�of�major�British�brands.�In�contrast�to�the�strictly�enforced�legal�frameworks�governing�domestic�production,�therefore,�these�accounts�highlight�how�UK�manufacturing�continues�to�play�a�key�role�in�driving�environmental�degradation�in�the�global�South.�Overarchingly,�however,�it�evidences�the�key�flaw�in�a�system�whereby�companies�themselves�are�handed�responsibility�for�oversight�of�their�supply�chains.In�this�industry,�as�in�others,�the�‘extremely�poor�state�of�Cambodia’s�water�resourc-
es�monitoring�and�assessment�systems’,79�combined�with�consistently�‘ambiguous�regulatory�enforcement’�by�environmental�institutions80�has�seen�water�pollution,�even�from�exporting�factories,�subject�to�limited�scrutiny,�creating�very�little�incen-tive�to�meaningfully�manage�the�environmental�impacts�of�their�operations.�Without�the�checks�and�balances�provided�by�enforceable�legislative�oversight�in�the�vicinity�of�production�sites,�local�people�in�the�vicinity�of�UK�industry�have�little�meaningful�capacity�to�raise�complaints�to�authorities�and�no�capacity�to�raise�these�issues�to�the�brands�charged,�in�theory,�with�their�oversight.
“If there is a lot of rain, then it rises up and spills out and floods the nearby land. It is sour. That is the problem.”
Rice�farmers�near�a�factory�complex�in�Kampong�Speu�providing�garments�to�the�UK�market.�Water�and�air�pollution,�as�well�as�overuse�of�water�resources,�are�common�problems�in�the�industry.
4140

Carbon emissions, deforestation and drought in the production of UK clothingIn�certain�communities�around�Cambodia,�industrial�liquid�discharge�from�garment�factories�plays�a�significant�role�on�local�livelihoods,�yet�it�is�by�no�means�the�only,�or�even�necessarily�the�worst,�example�of�the�Cambodian�garment�industry’s�envi-ronmental�impact.�Indeed,�as�evidenced�by�the�billowing�black�smoke�emerging�daily�from�many�of�the�factories�supplying�British�shops,�ground-based�pollutants�of�this�sort�are�only�one�dimension�of�a�far�wider�footprint�of�British�overseas�production.Compounding�these�regulatory�failings,�economic�factors�have�further�incentivised�
deleterious�environmental�regulation.�Faced�with�high�grid�energy�tariffs�compared�with�other�countries�in�the�region,81�garment�factories�have�long�sought�to�mitigate�energy�expenditure�through�the�use�of�boilers�and�burners�which�generate�power�through�the�combustion�of�both�forest�wood�and�–�increasingly�commonly�–�garment�offcuts.82�In�the�case�of�garment�burning,�the�impact�of�this�form�of�industrial�combus-tion�on�the�local�population�is�immediate.�Those�living�in�the�vicinity�of�the�factories�that�burn�garments�for�fuel�complain�of�persistent�health�problems�and�the�need�to�cover�their�possessions�when�prevailing�winds�draw�the�fumes�to�their�homes.�As�residents�of�one�factory�exporting�to�the�UK�explained:
“Since�the�factory�was�built,�it�has�been�difficult�to�live�here.�Now�they’ve�just�bought�land�close�to�the�village�and�they�bring�garment�waste�for�burning.�It�is�smoky�and�[makes�the�air]�full�of�smoke.�They�make�the�smoke�pile�very�low.�When�the�wind�comes�[in�this�direction]�it�brings�[the�smoke]�to�our�village.�At�that�time,�we�called�the�[factory]�but�they�didn’t�come�to�check�on�what�we�told�them …�We�called�the�boss�and�the�staff�there.�Garment�waste�is�carried�by�two-wheel�tractor�and�burnt�behind�our�village.�Burning�the�garment�waste�is�very�smoky …�
Here,�we�experience�the�impact�from�the�factory�[of�a�local�tycoon].�He�burns�the�garment�waste.�He�has�made�something�[to�mitigate�it]�but�there�is�still�an�impact.�The�smoke�does�not�go�up�in�the�air�but�even�if�it�does�it�impacts�the�environment�as�well …�All�of�his�factories�are�like�that.�He�makes�[a�closed�sys-tem]�but�it�is�still�producing�smoke.�The�smoke�is�black�and�makes�it�difficult�for�the�villagers�to�live�here.�We�have�requested�him�[to�do�something]�many�times.�We�don’t�want�to�stop�him.�We�just�want�him�the�chimney�higher.�They�don’t�burn�only�for�one�or�two�hours�but�they�burn�it�for�the�whole�morning.” — Kampong�Speu�Village�Chief,�March�2021
The�impacts�of�garment�burning�are,�therefore�both�visible�and�immediately�tangible.�As�outlined�in�a�UK�parliament�report�on�the�fashion�industry,83�the�practice�of�incinerating�garment�waste�‘multiplies�the�climate�impact�of�the�product�by�generating�further�emissions�and�air�pollutants�that�can�harm�human�health’.�Indeed,�this�is�precisely�the�result�witnessed�currently�in�Cambodia,�where�widespread�garment�burning�not�only�plays�a�substantial�hidden�role�in�the�industry’s�carbon�footprint,�but�also�intensifies�the�impacts�of�climate�change�by�undermining�health�and�wider�livelihoods.Nevertheless,�problematic�though�it�is,�garment�burning�is�ultimately�of�second-
ary�importance�to�the�equally�prevalent�–�but�similarly�unremarked�upon�–�practice�of�burning�forest�wood�in�the�Cambodian�garment�industry.�Cambodia�has�experi-enced�the�highest�rate�of�deforestation�in�the�region84�and�one�of�the�highest�in�the�world85�since�the�1990s,�yet�the�loss�of�Cambodia’s�forest�cover�has�been�predom-inantly�ascribed�to�land�concessions�linked�to�high�value�wood.86�The�loss�of�low�value�trees�for�firewood,�by�contrast,�has�received�far�less�attention,�tending�to�be�perceived�by�scholars,87�international�advocacy�groups88�and�even�local�people�in�some�cases89�as�predominantly�associated�with�small�scale�household�consumption,�rather�than�larger�scale�industrial�processes.�Nevertheless,�far�from�being�limited�to�isolated�infractions�of�environmental�legislation,�the�practice�of�burning�forest�wood�is�a�widespread�phenomenon�in�the�garment�industry.90�
3.4
“Since the factory was built, it has been difficult to live here. Now they’ve just bought land close to the village and they bring garment waste for burning.”
A�waste�burner�attached�to�an�exporting�garment�factory.�Waste�burning�is�common�practice�in�the�Cambodian�garment�industry,�often�being�used�to�generate�power�for�the�factory.�
4342

Attracted�by�the�high�caloric�value�of�forest�wood,�compared�to�farmed�wood�alternatives�such�as�acacia,�eucalyptus�or�rubber�trees,�the�garment�industry�has�historically�been�a�significant�driver�of�this�secondary�form�of�deforestation�in�Cam-bodia.91�Although�harvesting�firewood�from�forests�is�illegal�in�Cambodia�–�indeed,�in�announcing�a�recent�crackdown,�Prime�Minister�Hun�Sen�stated�he�had�commanded�those�tasked�with�enforcing�the�restrictions�“to�be�shot�from�helicopters�in�the�sky”92�–�a�substantial�proportion�even�of�registered�exporting�factories�to�UK�brands�con-tinue�to�burn�forest�wood�due�to�its�efficiency�and�low�cost�as�a�fuel.�Even�following�the�national�crackdown�on�forest�wood�usage�since�2018,�the�practice�has�contin-ued�largely�unabated,�with�wood�now�delivered�at�night�rather�than�during�the�day,�as�previously.�According�to�local�informants,�some�larger�factories�use�hundreds�of�tons�of�forest�wood�each�day�in�order�to�meet�their�energy�needs.�For�economic�rea-sons,�the�wood�sourced�for�this�purpose�tends�to�be�from�Cambodia’s�Central�and�Southern�areas,�with�wood�tracked�from�one�factory�specifically�to�Baseth�district,�in�Kampong�Speu.�Yet�this�is�by�no�means�an�isolated�practice.�Despite�enhanced�enforcement,�firewood�continues�to�be�collected�surreptitiously�from�Cambodia’s�remaining�areas�of�forest�cover,�such�as�Kampong�Thom�province,�where�the�sale�of�wood�by�the�roadside�remains�common.�As�one�such�roadside�wood�seller�explained:
“The�firewood�for�factory�[use],�Korean�trucks�[large�industrial�trucks]�come�and�deliver�it�out�every�day … They�collect�firewood�from�the�local�mountain�near-by … We�have�to�pay�[the�police]�money�at�every�checkpoint.�Otherwise,�they�catch�us.” — Aural�Roadside�Seller,�March�2021
Far�from�being�an�isolated�or�small-scale�infraction,�the�substantial�continuing�appetite�for�forest�wood�by�factories�in�the�vicinity�of�Phnom�Penh�–�predominantly�linked�to�the�garment�and�brick�industries�–�continues�to�play�a�major�role�in�deforesta-tion.�Even�in�the�vicinity�of�major�national�parks,�such�as�Prey�Long,�one�of�Cambodia’s�last�remaining�areas�of�old�growth�rainforest,�logging�for�firewood�to�feed�domestic�industry�remains�common,�as�a�second�local�wood�seller�outlined:
“For�firewood,�I�think�most�of�them�[are�taking�it]�from�Kampong�Thom�to�Phnom�Penh.�For�this�firewood,�they�just�collect�from�very�small�forests�nearby … As�far�as�I�know,�the�firewood�from�every�place�goes�to�Phnom�Penh.�I�think�once�one�place�is�finished,�then�they�will�go�to�another�place�for�firewood.�They�cut�down�the�forest�for]�firewood�a�lot�in�land�concessions.�
Firstly,�they�cut�the�inside�of�the�forest�and�just�leave�the�forest�next�to�the�road�standing,�to�prevent�[themselves]�being�watched�by�other�people …�Based�on�my�perception,�I�think�Prey�Lang�will�soon�be�cleared.�Now�the�big�forest�has�been�cleared�in�Prey�Lang.�I�can�say�now�95�or�99%�of�the�forest�has�gone.” — Wood�Seller,�Kampong�Thom,�March�2021
Similarly,�in�Preah�Vihear�province,�one�local�woman�explained�how�increasing�regulation�had�served�predominantly�to�push�control�of�deforestation�further�into�the�hands�of�the�biggest�local�actors:
“Yes,�they�do�[cut�it�secretly,�but]�only�the�big�people.�I�mean�the�big�people�use�the�small�people�to�cut�the�wood�for�them.�If�the�small�people�cut�the�wood�for�themselves,�they�will�be�caught,�but�if�the�small�people�cut�the�wood�for�the�big�people,�it�is�OK.�It�is�corruption …
As�far�as�I�know,�now�it�is�strict,�so�before�they�go�to�the�forest,�they�need�to�pay�money�first�to�the�authorities.�In�the�end,�after�that�[the�people�who�cut�it]�have�nothing�left.�The�profit�from�the�wood�is�shared�to�everybody�[else].” — Preah�Vihear�Roadside�Seller,�March�2021
Indeed,�despite�the�recent�crackdown�on�forest�wood�usage,�evidence�from�the�garment�industry�suggests�that�the�trade�in�forest�firewood�has�moved�underground,�rather�than�halted.�As�shown�in�Figure�7,�statistics�obtained�via�a�national�represent-ative�sample�of�workers�associated�with�255�GMAC�registered�factories�(of�which�158�yielded�responses)�indicated�that�32%�of�factories�used�forest�wood�either�exclusively�or�in�combination�with�other�fuels,�whilst�13.9%�burned�garment�wast�produced�in�the�factory�itself,�either�exclusively�or�in�combination.�For�comparison,�only�36.1%�depended�exclusively�on�mains�power�or�generator�usage,�highlighting�the�widespread�prevalence�of�carbon�intensive�small-scale�combustion�within�the�industry�as�a�whole.
Truck�drivers�unload�wood�at�night�in�Kandal�province.�Forest�wood�harvesting�is�illegal�in�Cambodia�and�has�been�cracked�down�on�heavily�since�2018,�yet�remains�a�common�source�of�fuel�in�the�garment�and�other�industries.
454444

15%Factories use garments for fuel exclusively or in combination with other fuels
32%Factories use forest wood for fuel exclusively or in combination with other fuels
Figure�7.�Fuel�use�by�garment�factories�in�Cambodia.93
Garment�burning,�a�practice�known�both�for�its�carbon�intensity�and�its�release�of�multiple�toxic�substances�in�the�local�environment,94�is�an�issue�rather�more�widespread�than�noted�in�previous�reporting�on�the�issue.95�Yet�it�is�firewood�burning�that�presents�arguably�the�larger�issue,�in�view�of�the�dual�problem�engendered�by�its�usage.�The�survey�results�suggest�that�each�factory�burning�firewood�utilises�a�daily�average�of�3.25�tons.�Extrapolated�to�the�31%�of�558�GMAC�member�factories�nationwide�burning�firewood,�this�indicates�an�average�of�562�tons�of�forest�wood�being�burned�by�the�Cambodian�garment�industry�every�day,�or�205,130�tons,�equivalent�to�810�to�1,418�hectares�of�forest�being�burned�each�year.�It�should�be�noted�also�that,�due�to�the�large�number�of�non-responses,�including�from�factories�known�to�burn�very�high�volumes�of�forest�wood,�this�figure�is�likely�to�be�a�substantial�underestimate.In�addition�to�the�carbon�emissions�associated�with�production,�therefore,�the�
contribution�of�the�industry�to�Cambodia’s�‘alarming�rate�of�deforestation’96�represents�a�substantial�concern�in�its�own�right.�The�ongoing�loss�of�forest�cover,�still�occurring�at�one�of�the�fastest�rates�in�the�world,97�is�contributing�to�widespread�local�environ-mental�degradation,�the�loss�of�habits�and�ecological�diversity.�Linked�to�this,�more-over,�the�experience�of�countries�suffering�similar�rates�of�deforestation�suggests�that�it�may�also�have�a�role�to�play�in�intensifying�Cambodia’s�struggles�with�drought.�Elsewhere,�rates�of�deforestation�have�been�statistically�linked�to�dry�season�intensity�in�the�Amazon,98�whilst�the�‘experiences�of�African�countries�demonstrate�that�the�removal�of�forest�cover�increases�incidents�of�flash�floods�and�worsens�the�effects�of�droughts’.99�Although�similar�trends�have�been�difficult�to�extricate�in�Cambodia�due�to�the�range�of�confounding�contributory�factors,�not�least�the�frequency�of�El�Niño�events,�which�have�worsened�droughts�in�recent�years,100�local�climate�narra-tives�unequivocally�support�this�relationship.�As�villagers�in�Kampong�Speu�province,�one�of�Cambodia’s�most�drought-hit�explained:
“[Drought]�has�happened�every�year�since�2003.�In�2003,�there�was�drought�for�the�whole�year.�After�that,�the�rain�was�not�regular.�Old�people�always�said�that�since�the�forest�has�gone,�the�rain�has�never�been�regular�anymore … For�rich�people,�they�can�buy�a�water�pipe�for�200�or�300�meters�to�pump�water�to�their�farm,�[but]�for�the�poor,�they�cannot�do�anything.�They�just�watch�the�rice�dying …
From�this�area�till�Koh�Kong�province,�the�forest�was�cut�down�or�cleared�[and]�the�rain�is�not�regular�as�it�was�in�the�past.�In�[former�King]�Sihanouk’s�time�[broad-ly�1941-2004],�there�was�so�much�forest.�Now�the�forest�is�very�thin,�the�rain�is�irregular,�the�forest�is�gone�and�even�the�firewood�has�almost�gone.” — Kampong�Speu�Farmer,�March�2021
Compounding�the�wider�issue�of�Cambodia’s�changing�rainfall�patterns�is�the�local�problem�of�water�usage�by�garment�factories,�most�of�which�is�unmeasured�and�unregulated�despite�the�substantial�volume�utilised�by�the�industry.�Garment�factories�located�in�Kampong�Speu�province,�for�example,�have�been�criticised�by�nearby�residents�for�their�abuse�of�local�water�resources�in�recent�years,�placing�further�pressure�of�scare�water�resources,�even�as�the�country�as�a�whole�–�and�Kampong�Speu�in�particular�–�has�been�gripped�by�water�scarcity�and�drought.�Local�residents�complained�that:
“In�the�past,�there�were�five�wells�in�my�village�that�the�Prasac�and�World�Bank�organizations�had�made�for�us.�Later�on,�they�did�not�have�water�anymore.�Before�the�garment�factories�were�established�here,�we�could�get�water�at�a�depth�of�22�meters�from�the�wells.�After�the�garment�factory�made�their�wells�too,�then�our�wells�did�not�have�any�more�water.�In�the�last�two�years,�the�factory�wells�ran�out�of�water�as�well�and�then�they�used�the�water�from�the�canal.” �— Kampong�Speu�Petty�Trader,�March�2021
As�a�local�official�tasked�with�the�measurement�of�water�resources�acknowledged,�this�has�been�a�known�issue�in�the�district,�only�recently�alleviated�by�the�construction�of�a�water�delivery�system�for�some�of�the�factories�in�the�province.�As�he�explained:
“Regarding�the�wells,�they�have�broken�down.�Like�at�the�North�side�[of�the�district],�factories�made�a�lot�of�wells�at�the�time�there�was�not�a�[separate]�water�system�yet.�But�our�wells,�we�made�before�them�and�they�were�shallower�than�the�wells�the�factory�made�later�on,�so�now�they�don’t�have�any�water.” �— Kampong�Speu�Provincial�Department�of�Water�Resources�and�Meteorology�Official,�March�2021
4746

The�disaster�footprint�of�UK�garment�production�in�Cambodia�is�therefore�a�com-plex�one,�incorporating�an�array�of�environmental�issues�linked�to�production�for�UK�consumers.�Beyond�the�purview�of�UK�environmental�regulations�as�they�are,�Cambo-dian�garment�factories�produce�pollutants�in�such�a�way�as�to�intensify�the�impact�of�climate-linked�disasters�at�both�the�local�and�the�national�scale.�Not�only�does�large�scale�deforestation�engender�a�higher�likelihood�of�droughts�–�a�phenomenon�regu-larly�bemoaned�by�the�80%�of�Cambodians�who�live�in�rural�areas�and�the�42%�who�depend�on�primary�agriculture�for�their�livelihoods�(UNDP,�2019)�–�but�local�impacts,�similarly,�may�be�seen�to�exacerbate�the�impacts�of�climate�change.�From�toxic�smoke�to�liquid�waste,�small-scale,�but�widely�replicated�hazards�such�as�these�ultimately�serve�to�compound�pressures�on�livelihoods�and�health,�even�as�they�contribute�more�broadly�to�the�atmospheric�emissions�under-girding�global�environmental�change.
A�wood�depot�outside�a�major�exporting�garment�factory�in�Cambodia.�At�full�capacity,�large�factories�like�this�one�burn�thousands�of�tons�of�forest�wood�every�week�to�generate�power�for�production�processes.
4948

Bricks The UK is the world’s largest importer of bricks, importing over 400 million each year. A growing proportion of these bricks are produced in the South Asian ‘brick belt’ where they produced in dangerous and exploitative conditions. Long distance transport and carbon intensive production processes, mean that a brick imported from South Asia ‘costs’ almost triple the carbon emissions of a domestic brick. And there is also a local cost. Brick production in South Asia enhances disaster risk, intensifying the impacts of climate change for communities in the vicinity of production.
Part 4
Workers�collect�fired�bricks�in�a�brick�factory�in�Narsingdi,�near�Dhaka.�
50 5150

We�are�living,�for�the�first�time�in�history,�in�an�urban�world.�By�2008,�more�than�half�of�the�world’s�population�was�living�in�towns�and�cities:101�a�development�with�profound�implications�for�sustainability.�Urban�areas�and�their�construction�are�increasingly�recognised�as�major�contributors�to�climate�change,�with�the�built�environment�cur-rently�responsible�for�39%�of�energy-related�carbon�dioxide�emissions�worldwide.102�Yet�what�makes�this�is�a�somewhat�intractable�issue�is�the�diversity�of�impacts.�28%�of�these�emissions�are�due�to�the�energy�used�within�existing�buildings�(17%�resi-dential�and�11%�non-residential),�while�the�remaining�11%�are�due�to�the�construction�processes�for�new�buildings�and�infrastructure.103
Moreover,�there�is�a�further�hidden�cost�to�construction�in�the�form�of�black�car-bon,�or�soot.�Some�20%�of�global�black�carbon�is�attributable�specifically�to�brick�kilns,�90%�of�which�are�in�central�Asia.104�Not�only�is�it�a�dangerous�local�pollutant,�highly�damaging�to�human�and�environmental�health,�but�–�despite�its�absence�from�most�greenhouse�gas�reporting�–�is�also�considered�to�have�a�significant�effect�on�global�warming.105
These�two�dimensions�of�environmental�impact�compound�one�another,�under-mining�the�viability�of�rural�livelihoods�through�a�combination�of�climatic�precarity�and�local�environmental�degradation.�As�a�result�of�their�impact�on�farming,�they�serve�indirectly�to�drive�urbanisation�by�incentivising�migration�away�from�rural�are-as�and�contributing�to�the�very�processes�of�urbanisation�that�are�fuelling�demand�for�bricks.106�By�degrading�agricultural�livelihoods�in�the�periphery�of�cities,�brick�kilns�exacerbate�the�impacts�of�climate�change,�encouraging�urbanisation�through�migration�away�from�the�vicinity�of�kiln�sites107�and�contributing�to�rapid�land�use�change�in�countries�like�Bangladesh,�where�1%�of�land�area�transitions�away�from�agriculture�each�year.108
Viewed�in�this�context,�both�the�impact�of�the�built�environment�and�responsibility�for�it�are�becoming�increasingly�geographically�complex.�Upfront�carbon�–�carbon�emissions�released�in�material�sourcing�and�transport�before�a�building�or�infrastruc-ture�begins�to�be�used�–�will�be�responsible�for�half�of�the�entire�carbon�footprint�of�new�construction�between�now�and�2050.109�This�has�been�a�rapidly�growing�phe-nomenon�as�construction�has�rapidly�increased�in�developing�countries.�Over�the�last�40�years,�global�material�use�has�tripled.110�However,�the�number�of�countries�who�are�net�importers�of�raw�materials�–�includ-
ing�materials�such�as�sand,�gravel�and�metal�ores�which�play�a�crucial�role�in�con-struction�–�is�rising�rapidly,�both�in�the�West�and�emerging�economies�of�the�Asia�and�Pacific�region.111�This�reflects�a�shift�in�the�global�economy�with�‘numerous�countries�shifting�to�becoming�net�importers�of�resources,�but�very�few�switching�to�becom-ing�net�exporters’.112�In�this�context,�national�accounting�of�the�built�environment’s�environmental�impact�is�increasingly�unfit�for�purpose.
As�the�UK�economy�transitions�ever�further�from�man-ufacturing�–�with�the�sector�declining�from�16.7%�of�GDP�in�1990�to�8.6%�in�2019113�–�the�nation’s�own�urban�infrastructure�is�becoming�ever�more�prone�to�carbon�embodied�in�the�burgeoning�global�trade�in�materials.�That�the�UK�is�now�the�world’s�sixth�biggest�importer�of�raw�materials114�highlights�the�pressing�relevance�of�the�issue,�yet�specif-ic�examples�from�the�construction�industry�highlight�the�shortcomings�of�domestic�environmental�policy�more�starkly.�The�anticipated�shift�in�trade�towards�non-Euro-pean�partners�following�Brexit�is�expected�to�exacerbate�this�discrepancy,�ultimately�engendering�a�rise�in�imported�emissions�of�between�5�and�11%,�depending�on�the�scale�of�the�shift�towards�non-EU�trading�partners.115
Within�this�darker�picture�of�UK�emissions,�a�worrying�trend�is�emerging.�Domestic�brick�production�is�insufficient�to�meet�demand,�leaving�the�UK�facing�a�‘brick�deficit’�of�more�than�half�a�billion�bricks�per�year.116�The�result�has�been�a�rise�in�brick�imports�to�more�than�400�million�per�year,�predominantly�from�the�EU�but�increasingly�from�global�Southern�countries�such�as�China,�India,�Pakistan�and�Bangladesh.117�
4.1Urban areas and their construction are increasingly recognised as major contributors to climate change, with the built environment currently responsible for 39% of energy-related carbon dioxide emissions worldwide.
The excess carbon ‘cost’ of a house built with imported over domestic bricks would be 5280kg: over 13,000 vehicle miles, or burning 12 barrels of oil.
The hidden carbon footprint of imported bricks
A�brick�factory�on�the�outskirts�of�Dhaka.�Brick�factories�like�this�generate�air�pollution�and�excess�heat�that�are�damaging�to�local�people�and�agriculture.
5352

The�UK�now�imports�over�16%�of�its�total�brick�stock,�the�highest�proportion�in�the�world,118�yet�the�embodied�carbon�associated�with�these�imports�has�yet�to�be�fully�accounted�for�in�policy�responses.�The�wider�environmental�and�social�foot-print�of�these�additional�bricks�being�produced�in�nations�recognised�as�a�source�of�key�humanitarian�and�socioeconomic�issues,�includ-ing�modern�slavery,119�has�similarly�been�ignored�in�UK�policy.When�it�comes�to�brick�imports,�distance�is�key.�
Within�the�EU�as�a�whole,�the�weighted�average�car-bon�emissions�per�brick�amounts�to�0.42�kg�CO2e�per�brick,�an�addition�of�carbon�through�transport�of�only�0.02kg�CO2e�per�brick,�around�6%�of�the�manufac-turing�emissions�and�thus�within�the�traditionally�estimated�range120�that�transport�emissions�account�for�around�9%�of�the�total�emissions�involved�in�the�lifecycle�of�a�brick.�Nevertheless,�this�is�a�by�no�means�universal�picture.�The�large�scale�of�the�EU�means�that�there�is�substantial�variation�in�transport�emissions�within�the�block�itself,�depending�on�the�country�exporting�to�the�UK.�Bricks�from�Portugal,�for�exam-ple,�‘cost’�an�additional�0.14kg�of�CO2�emissions�per�brick,�an�extra�35%�over�manu-facturing�emissions.�Bricks�from�Italy,�similarly,�‘cost’�an�additional�0.31kg�of�CO2�to�transport�to�the�UK,�an�excess�of�70%�over�the�emissions�generated�in�production.With�regard�to�the�emissions�embodied�in�UK�construction,�this�is�cause�for�sig-
nificant�concern.�On�average,�the�transportation�costs�associated�with�brick�imports�ensure�that�they�are�associated�with�a�considerably�higher�volume�of�CO2�emissions�than�domestically�produced�bricks.�Moreover,�the�situation�is�worsening.�As�brick�imports�increase,�the�trajectory�is�towards�longer�distance�imports�and�thus�higher�level�of�emissions�embodied�in�transportation.�Within�the�varied�landscape�of�UK�brick�imports,�the�historical�dominance�of�the�geographically�closest�importing�countries�–�specifically�Belgium�and�the�Netherlands,�which�supplied�58%�and�32%�of�EU�brick�imports�to�the�UK�respectively�in�the�last�5�years�–�is�fading.�Geographically�further�removed�countries�such�as�Italy�and�Portugal�are�increasing�as�a�share�of�the�total,�even�as�the�total�volume�of�imports�itself�increases.�And�the�trend�of�greatest�rele-vance�lies�further�afield�still.�A�growing�proportion�of�bricks�are�now�arriving�in�the�UK�from�sources�in�the�global�South�producers�such�as�India,�China,�Pakistan�and�Turkey.�Given�the�far�greater�distances�involved�in�transporting�bricks�from�major�non-EU�exporting�countries,�the�carbon�emissions�embodied�in�brick�imports�from�these�non-EU�sources�are�far�higher.Taken�as�a�whole,�the�transportation�emissions�associated�with�non-EU�brick�
imports�is�0.56kg�CO2e�per�brick:�far�higher�than�bricks�imported�from�the�EU.�Com-bined�with�higher�levels�of�emissions�released�in�production�compared�with�UK�brick�production�processes�0.55kg / brick�compared�with�0.45�kg / brick,�this�means�that�non-EU�bricks�imported�to�the�UK�carry�average�embodied�emissions�of�1.11kg�per�brick�on�arrival:�2.5�times�more�than�UK�bricks,�or�an�excess�carbon�cost�of�0.66kg�per�brick.�A�standard�house�built�with�8000�of�these�bricks�would�therefore�‘cost’�9000kg�of�CO2�emissions,�equivalent�to�a�car�driving�23,000�miles.�The�excess�car-bon�cost�alone�(i.e.�compared�to�the�equivalent�house�built�with�domestically�pro-duced�bricks)�would�be�5280kg:�over�13,000�vehicle�miles,�or�burning�12�barrels�of�oil.
2015
2016
2017
2019
2018
Figure�8.�Growth�in�non-EU�brick�imports�to�the�UK�over�time.
In�the�context�of�the�pressing�need�to�reduce�the�UK’s�carbon�footprint,�these�figures�are�clearly�cause�for�concern.�Whilst�brick�importation�from�the�global�South�in�this�way�is�a�relatively�new�phenomenon,�it�is�one�that�is�growing�rapidly.�In�2015,�the�proportion�of�imported�bricks�arriving�to�the�UK�from�outside�the�EU�amounted�to�just�1.1%,�but�within�five�years�this�had�increased�to�8.8%.121�This�proportional�rise,�moreover,�is�in�the�context�of�an�overall�increase�in�brick�imports,�meaning�that�the�number�of�bricks�imported�from�outside�the�EU�increased�more�than�tenfold�between�2015�and�2019,�from�3,088,902�to�32,942,280.122�Yet�from�a�carbon�accounting�per-spective,�the�scale�of�the�increase�is�starker�still.�The�exceptionally�high�transportation�emissions�associated�with�brick�imports�from�the�global�South�mean�that�they�carry�an�outsize�influence,�accounting�for�25.5%�of�all�emissions�from�brick�imports�in�2019.Given�the�rate�of�increase,�the�key�issue�to�consider�is�what�is�driving�these�
trends.�This�is�a�question�with�multiple�answers,�the�first�and�most�obvious�of�which�is�price.�Bricks�sourced�in�Bangladesh,�for�example�cost�£50�to�£120�per�1000�bricks�depending�on�production�type�and�cost,123�whilst�in�India�1000�bricks�costs�on�aver-age�£54.75,124�a�tiny�fraction�of�the�£686�charged�on�average�for�the�same�number�of�bricks�in�the�UK.125�Even�when�factoring�in�the�cost�of�transporting�those�bricks,�estimated�at�£39.51�based�on�a�full�40-foot�container�of�bricks,126�the�financial�incen-tive�to�import�bricks�remains�substantial.Coupled�to�these�financial�incentives�is�the�lack�of�regulation�with�which�the�
importation�of�construction�materials�of�this�sort�is�associated.�Indeed,�far�from�successfully�regulating�the�estimated�620�tons�of�CO2e�emitted�in�the�journey�of�a�40-foot�container�full�of�bricks�from�South�Asia,�UK�environmental�legislation�does�not�currently�require�even�a�disclosure�of�the�emissions�and�environmental�impacts�associated�with�corporate�supply�chains.�Rather,�as�noted�above�in�relation�to�garment�imports,�the�two�key�pieces�of�current�legislation�covering�environmental�reporting�remain�the�Directors’�Report�for�companies�and�the�Energy�and�Carbon�Report�for�Limited�Liability�Partnerships,�both�of�which�require�the�disclosure�of�greenhouse�gas�emissions.�Linked�to�this,�DEFRA�provides�specific�guidelines�for�Scope�1�(direct�emissions)�and�Scope�2�(purchased�energy)�emissions.�Yet�reporting�on�Scope�3�(sup-ply�chain�emissions)�is�discretionary�even�within�the�voluntary�guidance�as�a�whole.
Non-EU bricks imported to the UK carry average embodied emissions of 1.11kg per brick on arrival: 2.5 times more than UK bricks.
5554

Beyond�this,�UK�environmental�policy�on�material�imports�–�as�well�as�more�broadly�–�is�governed�predominantly�by�three�statutes.�First,�the�Climate�Change�Act�(2008),�which�aims�to�reduce�UK�carbon�emissions�by�at�least�80%�by�2050,�but�whose�targets,�though�ambitious,�refer�to�domestic�emissions�only.�Second,�the�Planning�and�Energy�Act�(2008),�allows�planning�authorities�in�England�and�Wales�to�impose�energy�use�and�efficiency�requirements�on�local�planning�applications.�Yet�whilst�this�statute�covers�construction�efficiencies,�imported�and�embodied�material�emissions�are�not�assessed.�Finally,�the�Energy�Act�2011�requires�energy�providers�to�meet�cer-tain�energy�efficiency�requirements�relating�to�carbon�emissions�and�home�energy�wastage.�Again,�however,�energy�efficiency�relating�to�overseas�energy�production�and�its�implications�for�manufacturing�imports�are�beyond�the�remit�of�the�act.�Thus,�although�each�of�these�legal�frameworks�speaks�to�one�dimension�of�brick�impor-tation,�none�extends�to�the�meaningful�regulation�of�this,�or�other�similar,�practices.This�lack�of�legal�coverage�for�imported�materials�exemplifies�how�bulk�imports�
of�this�sort�fall�through�the�cracks�of�environmental�governance.�It�is�an�issue�of�cross-cutting�relevance�to�multiple�government�and�non-government�agencies,�yet�the�international,�displaced�nature�of�the�environmental�impact�dislocates�it�beyond�the�reach�of�regulation.�Brick�kilns�are�recognized�as�one�of�the�largest�stationary�sources�of�black�carbon127�and�are�‘stringently’�regulated�by�Defra�within�the�UK’s�borders,128�but�remain�the�top�air�polluter�in�Bangladesh129�and�a�key�environmental�challenge�in�numerous�other�South�Asian�brick�exporters�to�the�UK.130
Moreover,�the�UK�is�far�from�alone�in�this�problem.�In�the�EU,�the�Energy�Perfor-mance�of�Buildings�Directive�(2002)�has�driven�building�regulations�in�all�member�states�to�require�increasing�operational�energy�efficiency�performance�from�‘regu-lated’�energy,�including�fixed�lighting,�and�space�and�water�heating�and�cooling.�Yet�embodied�energy,�from�construction�materials,�was�and�continues�to�be�excluded�from�the�Directive.�Indeed,�as�Becque�et�al.,�point�out�of�the�EU�as�a�whole:
‘The�European�Union�is�broadly�credited�with�reducing�its�emissions�of�greenhouse�gases�(GHGs)�and�is�on�track�to�meet�its�goal�of�a�20%�reduction�in�GHGs�in�2020�compared�to�1990�levels.�But�a�full�lifecycle�accounting�of�European�member�state�carbon�emissions,�including�those�emissions�caused�through�consumption�of�imported�goods,�tells�a�different�story:�Under�this�accounting�method,�EU�emis-sions�have�actually�grown�by�11%�–�with�some�nations�seeing�substantially�higher�emissions�growth�than�others.’131
As�these�examples�highlight,�rather�than�ensuring�a�meaningful�reduction�in�real�terms�emissions,�the�domestic�accounting�of�emissions�targets�ultimately�serves�to�undermine�their�efficacy�by�incentivising�the�exporting�of�emissions�overseas.�Referred�to�as�‘displacement’,132�or�‘carbon�leakage’,133�this�is�a�widespread�phenom-enon�that�represents�a�major�obstacle�to�the�efficacy�of�environmental�regulation.�Moreover,�as�highlighted�in�the�contextual�data�outlined�below,�the�carbon�dimen-sion�of�brick�importation�is�only�one�element�within�a�wider�process�of�articulated�environmental�damage.�In�the�South�Asian�brick�belt,�from�where�the�majority�of�the�UK’s�non-EU�bricks�originate,�climate�change�is�not�only�hastened�by�unregulated�and�unaccounted�emissions,�but�directed�and�intensified�in�its�impacts�by�the�mechanics�of�international�trade.
Labour rights and the brick trade
4.2
Figure�9.�Distribution�of�brick�kilns�in�the�South�Asian�‘Brick�Belt’.218
The�South�Asian�‘brick�belt’�covers�a�total�area�of�1,551,997 km2,�extending�from�Paki-stan�in�the�West,�via�Northern�India�and�Nepal,�to�Bangladesh�in�the�East�and�encom-passing�an�estimated�55,387�kilns.134�The�carbon�intensive�processes�utilised�by�this�vast�collection�of�kilns,�alongside�high�levels�of�‘black�carbon’�emissions,135�makes�them�a�key�contributor�to�climate�change,�responsible�for�an�estimated�131�tons�of�CO2�per�kiln�annually136�and�a�total�of�7,255,697�tonnes�of�CO2�each�year�across�the�brick�belt�as�a�whole.137�Brick�production�in�the�South�Asian�brick�belt�has�been�widely�noted�for�the�dirty,�dangerous�and�often�degrading�conditions�in�which�work�takes�place.�
INDIA
BANGLADESH
NEPALPAKISTAN
AFGHANISTAN
56 57

“I feel weak due to the heat from the fire. My head gets hot. My skin has deteriorated as well. I feel terrible breathing in the fumes from the burning coal gas.”
As�highlighted�in�a�range�of�reports�on�the�issue138�many�of�the�industry’s�labour-ers�are�debt�bonded,�made�to�work�–�alongside�their�families�in�many�cases�–�in�unhealthy�and�sometimes�lethal�conditions�to�pay�off�interest�on�long�term�debts�accrued�outside�of�the�kiln.�Viewed�on�its�own�terms,�this�is�an�issue�of�considerable�significance.�Whether�classified�as�modern�slavery,�as�has�been�the�case�in�some�quarters,139�or�merely�highly�exploitative�labour,140�it�has�been�flagged�by�monitoring�bodies�as�contravening�human�rights�related�to�employment,�including�Universal�Declaration�of�Human�Rights�Article�4�‘Freedom�from�Slavery’�and�the�UN’s�Sustain-able�Development�Goal�8�on�Economic�Growth�and�Decent�Work.Across�India,�for�example,�brick�kilns�are�notorious�spaces�of�labour�exploitation�
with�low,�mostly�piece-rate,�wages�for�long�hours�of�work�and�wage�arrangements�centred�around�debt�bondage�to�keep�workers�attached�to�the�kiln�for�months�or�years�on�end.�The�labouring�population�working�in�brick�kilns�often�consists�of�some�of�the�poorest�and�marginalized�sections�of�India’s�informal�workforce.141�Child�labour�is�widely�prevalent,�workplace�hazards�are�common�and�living�conditions�are�gener-ally�poor.142�Moreover,�this�is�a�widely�known�issue.�Reflecting�these�conditions,�brick�kilns�also�frequently�featured�in�domestic�and�international�news�coverage.�Indian�brick�workers�have�been�reported�in�the�international�media�as�‘living�like�slaves’143�as�sites�of�abuse,�physical�and�sexual�violence�inflicted�by�owners�and�managers�upon�workers.
5958

In�Bangladesh,�conditions�are�similarly�harsh.�As�in�India,�the�brick�industry�has�boomed�in�recent�years.�An�estimated�7,759�brick�kilns�produce�34�billion�bricks�each�year�in�Bangladesh,144�whilst�the�sector�now�accounts�for�approximately�1�per-cent�of�the�country’s�GDP,�employing�more�than�a�million�people.145�Yet�work�in�brick�kilns�continues�to�be�associated�with�a�range�of�serious�health�hazards,�including�harmful�chemicals�in�dust,�ash�and�smoke.146�Bricks,�as�in�India,�are�made�throughout�the�hottest�part�of�the�year,�during�which�time�workers�are�compelled�to�work�in�the�intensity�of�direct�sunlight�with�little�access�to�shade.147�Child�labour,�as�in�much�of�the�brick�belt,�is�illegal�but�endemic,148�whilst�national�and�international�news�outlets�continue�to�report�on�the�‘inhuman�torture’�facing�workers.149
Although�considerable�media�and�policy�attention�has�been�directed�towards�labour�conditions�in�the�South�Asian�brick�belt�in�recent�years,�the�issues�faced�by�the�industry�have�generally�been�seen�as�domestic,�a�matter�for�the�territories�in�which�such�abuses�occur.�Nevertheless,�the�growing�practice�of�brick�export�to�countries�such�as�the�UK�changes�this.�Kilns�in�Gujarat�and�Punjab,�for�example,�make�up�a�large�part�of�the�10�million�bricks�arriving�from�India�in�2019.�As�the�owner�of�one�such�kiln�in�Gujarat�explained:
“Our�bricks�only�go�to�the�UK.�Those�bricks�are�unlabelled,�without�our�kiln’s�name.�The�bricks�are�of�a�different�size�to�the�standard�and�have�a�good�polish.�We�meas-ure�it�up�to�the�millimetre�and�reject�any�bricks�that�are�substandard�[workers�aren’t�paid�anything�extra�for�the�bricks�made�for�UK,�but�the�same�piece�rate].�We�work�according�to�orders.�We�take�an�advance�of�up�to�30%�on�the�orders�from�abroad.” �— Kiln�Owner�2,�Gujarat,�April�2021
In�the�words�of�a�second�kiln�owner:
“Even�with�COVID,�the�demand�for�our�bricks�is�still�high.�All�our�work�is�done�through�labour�contractors.�Workers�are�paid�on�a�piece�rate�basis.�The�price�of�the�bricks�we�make�range�from�Rs.7�to�Rs.�80�(0.067�to�0.77�GBP)�per�brick�[whilst]�the�export�quality�bricks�begin�from�Rs.40�per�brick.�Our�suppliers�are�based�in�Delhi,�and�that�is�from�where�we�get�our�orders.�And�then�we�export�it�through�Mundhra�port.�Our�work�is�to�transport�it�to�Mundhra,�and�the�rest�of�the�export-ing�is�done�by�the�supplier�firms.” — Kiln�Owner�1,�Gujarat,�April�2021
Nevertheless,�although�the�quality�and�price�of�the�export-oriented�products�may�be�higher,�the�conditions�in�which�they�are�made�are�largely�indistinct�from�those�which�prevail�throughout�the�brick�belt.�Many�brick�workers�are�driven�to�the�industry�due�to�worsening�environmental�conditions,�many�of�which�are�linked�to�the�region’s�high�vulnerability�to�climate�change.�As�one�worker�in�an�exporting�kiln�in�Bangla-desh�explained,�for�example:�
“In�my�village�drought�is�very�common�environmental�hazards�during�the�dry�season.�Due�to�extreme�drought�we�could�not�produce�our�crops.” — Alim�Mia,�March�2021
Similarly,�as�a�second�Bangladeshi�brick�export�brick�producer�noted,�the�pressing�issue�of�soil�salinity�engendered�by�the�county’s�growing�vulnerability�to�rising�sea�levels�was�a�key�factor�in�this�departure�of�the�industry.�In�his�words,�“in�my�village�salinity�is�a�very�common�environmental�hazard.�Due�to�extreme�salinity�in�soil�and�water�farmers�could�not�cultivate�their�lands.”Workers�collect�fired�
bricks�in�a�brick�factory�in�Narsingdi,�near�Dhaka.
6160
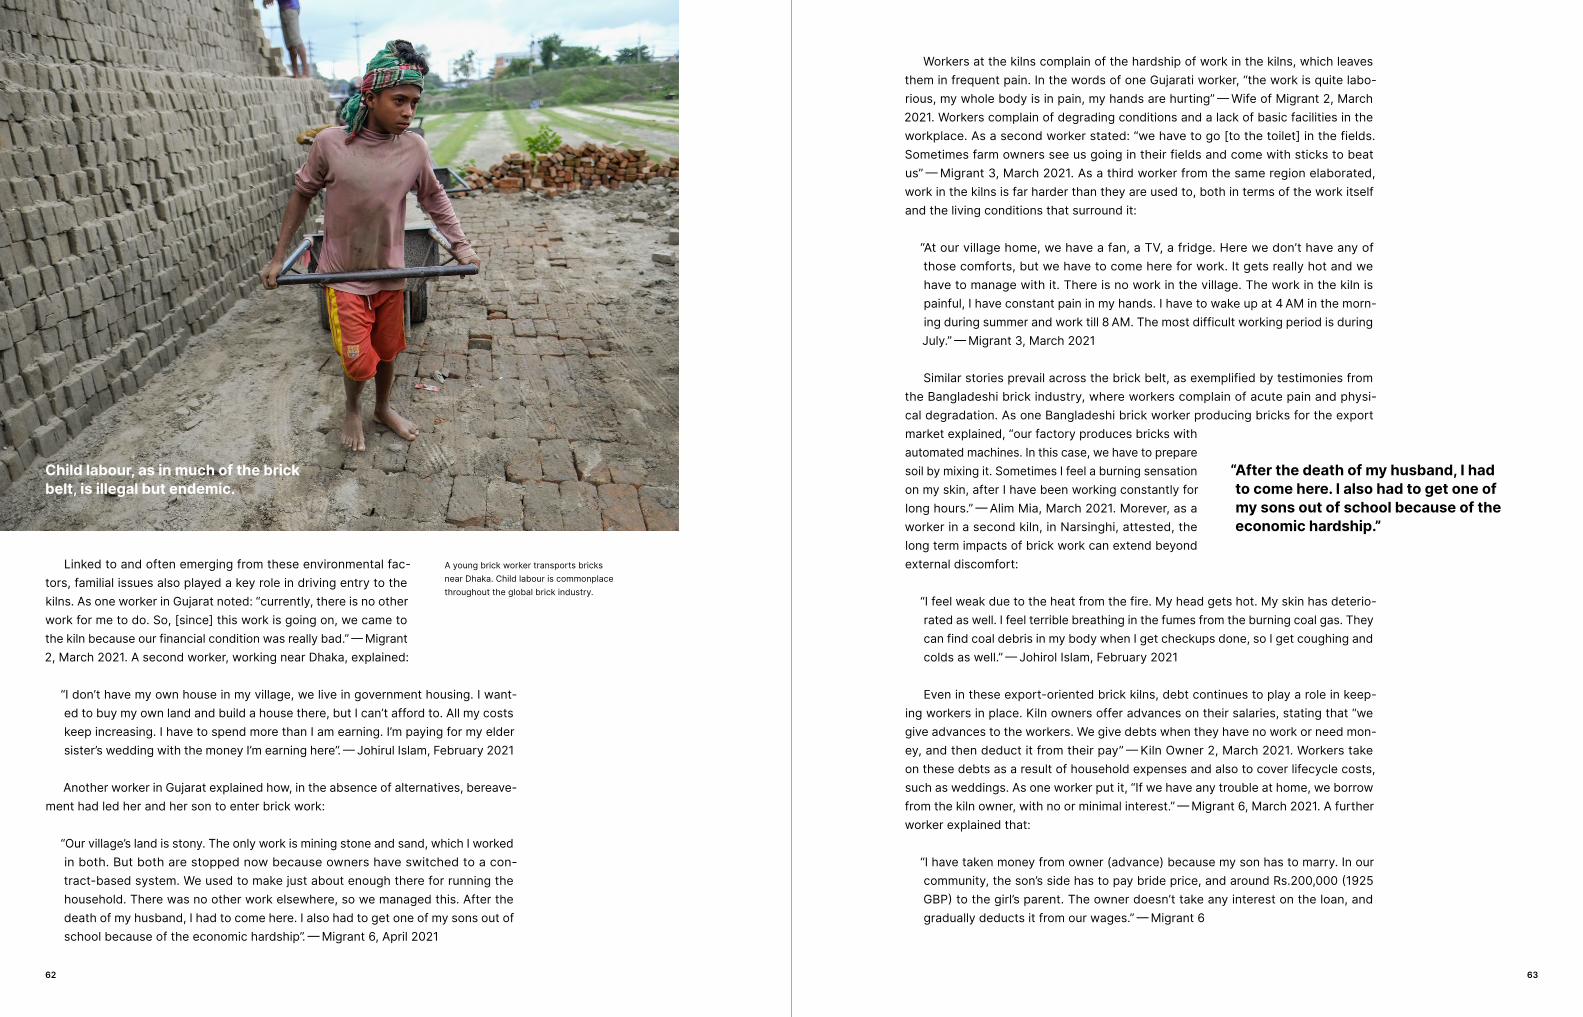
Linked�to�and�often�emerging�from�these�environmental�fac-tors,�familial�issues�also�played�a�key�role�in�driving�entry�to�the�kilns.�As�one�worker�in�Gujarat�noted:�“currently,�there�is�no�other�work�for�me�to�do.�So,�[since]�this�work�is�going�on,�we�came�to�the�kiln�because�our�financial�condition�was�really�bad.” — Migrant�2,�March�2021.�A�second�worker,�working�near�Dhaka,�explained:
“I�don’t�have�my�own�house�in�my�village,�we�live�in�government�housing.�I�want-ed�to�buy�my�own�land�and�build�a�house�there,�but�I�can’t�afford�to.�All�my�costs�keep�increasing.�I�have�to�spend�more�than�I�am�earning.�I’m�paying�for�my�elder�sister’s�wedding�with�the�money�I’m�earning�here”. — Johirul�Islam,�February�2021
Another�worker�in�Gujarat�explained�how,�in�the�absence�of�alternatives,�bereave-ment�had�led�her�and�her�son�to�enter�brick�work:
“Our�village’s�land�is�stony.�The�only�work�is�mining�stone�and�sand,�which�I�worked�in�both.�But�both�are�stopped�now�because�owners�have�switched�to�a�con-tract-based�system.�We�used�to�make�just�about�enough�there�for�running�the�household.�There�was�no�other�work�elsewhere,�so�we�managed�this.�After�the�death�of�my�husband,�I�had�to�come�here.�I�also�had�to�get�one�of�my�sons�out�of�school�because�of�the�economic�hardship”. — Migrant�6,�April�2021
Workers�at�the�kilns�complain�of�the�hardship�of�work�in�the�kilns,�which�leaves�them�in�frequent�pain.�In�the�words�of�one�Gujarati�worker,�“the�work�is�quite�labo-rious,�my�whole�body�is�in�pain,�my�hands�are�hurting” — Wife�of�Migrant�2,�March�2021.�Workers�complain�of�degrading�conditions�and�a�lack�of�basic�facilities�in�the�workplace.�As�a�second�worker�stated:�“we�have�to�go�[to�the�toilet]�in�the�fields.�Sometimes�farm�owners�see�us�going�in�their�fields�and�come�with�sticks�to�beat�us” — Migrant�3,�March�2021.�As�a�third�worker�from�the�same�region�elaborated,�work�in�the�kilns�is�far�harder�than�they�are�used�to,�both�in�terms�of�the�work�itself�and�the�living�conditions�that�surround�it:
“At�our�village�home,�we�have�a�fan,�a�TV,�a�fridge.�Here�we�don’t�have�any�of�those�comforts,�but�we�have�to�come�here�for�work.�It�gets�really�hot�and�we�have�to�manage�with�it.�There�is�no�work�in�the�village.�The�work�in�the�kiln�is�painful,�I�have�constant�pain�in�my�hands.�I�have�to�wake�up�at�4 AM�in�the�morn-ing�during�summer�and�work�till�8 AM.�The�most�difficult�working�period�is�during�July.” — Migrant�3,�March�2021
Similar�stories�prevail�across�the�brick�belt,�as�exemplified�by�testimonies�from�the�Bangladeshi�brick�industry,�where�workers�complain�of�acute�pain�and�physi-cal�degradation.�As�one�Bangladeshi�brick�worker�producing�bricks�for�the�export�market�explained,�“our�factory�produces�bricks�with�automated�machines.�In�this�case,�we�have�to�prepare�soil�by�mixing�it.�Sometimes�I�feel�a�burning�sensation�on�my�skin,�after�I�have�been�working�constantly�for�long�hours.” — Alim�Mia,�March�2021.�Morever,�as�a�worker�in�a�second�kiln,�in�Narsinghi,�attested,�the�long�term�impacts�of�brick�work�can�extend�beyond�external�discomfort:
“I�feel�weak�due�to�the�heat�from�the�fire.�My�head�gets�hot.�My�skin�has�deterio-rated�as�well.�I�feel�terrible�breathing�in�the�fumes�from�the�burning�coal�gas.�They�can�find�coal�debris�in�my�body�when�I�get�checkups�done,�so�I�get�coughing�and�colds�as�well.” — Johirol�Islam,�February�2021
Even�in�these�export-oriented�brick�kilns,�debt�continues�to�play�a�role�in�keep-ing�workers�in�place.�Kiln�owners�offer�advances�on�their�salaries,�stating�that�“we�give�advances�to�the�workers.�We�give�debts�when�they�have�no�work�or�need�mon-ey,�and�then�deduct�it�from�their�pay” — Kiln�Owner�2,�March�2021.�Workers�take�on�these�debts�as�a�result�of�household�expenses�and�also�to�cover�lifecycle�costs,�such�as�weddings.�As�one�worker�put�it,�“If�we�have�any�trouble�at�home,�we�borrow�from�the�kiln�owner,�with�no�or�minimal�interest.” — Migrant�6,�March�2021.�A�further�worker�explained�that:
“I�have�taken�money�from�owner�(advance)�because�my�son�has�to�marry.�In�our�community,�the�son’s�side�has�to�pay�bride�price,�and�around�Rs.200,000�(1925�GBP)�to�the�girl’s�parent.�The�owner�doesn’t�take�any�interest�on�the�loan,�and�gradually�deducts�it�from�our�wages.” — Migrant�6
Child labour, as in much of the brick belt, is illegal but endemic.
A�young�brick�worker�transports�bricks�near�Dhaka.�Child�labour�is�commonplace�throughout�the�global�brick�industry.
“After the death of my husband, I had to come here. I also had to get one of my sons out of school because of the economic hardship.”
6362

Nevertheless,�although�these�debts�are�often�framed�as�ad�hoc�transactions,�the�use�of�‘advances’�of�this�sort�is�often�used�as�a�means�by�which�to�ensure�that�work-ers�remain�with�the�kiln�throughout�the�dry�season,�even�when�wet�days�interrupt�production.�As�one�worker�explained:
“We�don’t�take�debt�from�the�owner.�But�the�owner�gives�us�an�advance�in�the�beginning�to�make�us�come�to�the�kiln,�and�deducts�it�from�our�wages�in�the�end.�Whenever�we�want�to�have�money�though,�we�take�money�from�the�owner,�and�don’t�have�to�return,�and�owner�deducts�it�from�the�wages.�When�it�rains,�the�owner�gives�us�Rs.100�[0.96�GBP]�per�day�as�compensation�for�not�being�able�to�do�any�work,�this�is�because�we�are�locals�and�could�leave�the�site�to�find�work�elsewhere.�We,�Banjaras,�have�a�reputation�for�being�hardworking�and�the�owner�doesn’t�want�to�lose�us.” — Migrant�2,�March�2021
As�a�second�worker�explained,�this�advance�from�the�brick�kiln�owner�in�some�cases�take�the�form�of�providing�an�entire�seasonal�salary�upfront,�leaving�workers�effectively�bonded�to�the�kiln�for�six�months,�unable�to�leave�or�find�work�elsewhere:
“I�receive�BDT�60,000�for�6�months�work.�I�was�paid�the�whole�amount�in�advance�before�coming�here�to�work.�My�living�costs�here�are�covered�entirely�by�my�employer�and�I�am�also�given�a�BDT�300�weekly�allowance.�I�will�not�be�getting�any-more�money�once�I�am�done�with�my�work�here.” — Md.�Monir�Mia,�February�2021
These�arrangements�are�by�no�means�unusual.�Reflective�as�they�are�of�dirty,�dangerous�and�poorly�paid�working�environments,�stories�such�as�these�are�typical�of�a�notorious�industry�encompassing�tens�of�thousands�of�kilns.�Nevertheless,�that�they�can�be�found�with�equal�ease�in�an�export�oriented�industry�in�which�bricks�sell�for�up�to�Rs.40�(0.39�GBP)�each�–�almost�ten�times�the�price�of�a�brick�for�domestic�consumption�at�Rs.�4.5�(0.044�GBP)�–�is�notable,�reflecting�as�it�does�how�little�of�the�additional�cost�of�exported�bricks�is�passed�on�to�workers�themselves.�Even�in�highly�mechanised,�export�oriented�kilns,�where�imported�machinery�facilitates�the�produc-tion�of�UK-oriented�bricks�with�nostalgically�British�product�names�such�as�Imperial�Red,�Rustica�London�Stock�and�Suffolk�Multi,�there�remains�very�little�difference�in�wages�or�labour�standards,�compared�with�kilns�focused�purely�on�domestic�produc-tion.�Nor,�similarly,�is�there�an�observable�reduction�in�the�incidence�of�child�labor.Furthermore,�beyond�these�highly�mechanised�firms,�there�is�a�further�layer�of�
sub-contracted�brick�manufacturing,�where�firms�predominantly�providing�domes-tic�materials�undertake�orders�for�middlemen�who�subsequently�sell�and�ship�their�wares�abroad�to�international�buyers�such�as�the�UK.�An�example�of�this�type�of�operations�is�the�kiln�explored�here�in�Godhra�in�Gujarat,�where�the�nearby�port�of�Mundra,�one�of�the�largest�in�India,�provides�ample�opportunities�for�export.�Bricks�produced�in�kilns�such�as�these�are�similar�to�the�ones�made�for�the�local�market,�only�with�further�quality�checking�for�imperfections.�Besides�this�additional�quali-ty�control,�they�are�indistinguishable�from�the�billions�of�bricks�produced�annually�throughout�the�brick�belt.Bricks�exported�to�the�UK�from�India�and�Bangladesh�are�therefore�associated�
with�conditions�notorious�throughout�the�brick�belt�more�broadly.�Work�is�undertak-en�in�hard�and�hazardous�conditions,�in�an�environment�so�filled�with�brick�dust�and�
sand�that�it�is�difficult�for�those�unused�to�it�even�to�open�their�eyes.�During�the�hot-test�part�of�the�year,�temperatures�above�the�kiln,�where�firemen�spend�their�days�stoking�the�flames�to�ensure�even�burning,�can�rise�above�60�or�even�65�degrees�Celsius.�These�workers,�recognisable�by�the�coating�of�black�coal�dust�on�their�skin,�wear�wooden�slippers�while�working,�because�rubber�soles�melt�in�a�few�minutes�where�they�stand.Working�conditions�such�as�these,�in�which�almost�24�million�bricks�are�produced�
for�the�UK�each�year�in�brick�belt�countries,�are�clearly�a�cause�for�concern�in�them-selves.�Yet�even�beyond�the�labourers�who�produce�these�bricks,�there�is�a�wider�environmental�implication.�In�addition�to�the�substantial�carbon�footprint�of�export-ed�bricks,�production�for�export�is�associated�with�local�environmental�effects�that�direct�and�intensify�the�impacts�of�climate�change,�worsening�its�impacts�in�South�Asia�in�the�service�of�the�UK’s�housing�stock.
“The work is quite laborious, my whole body is in pain, my hands are hurting.”
A�Bangladeshi�brick�worker�rests�after�a�hard�day’s�work.�The�brick�industry�both�in�South�Asia�is�notoriously�unhealthy�and�physically�draining.
6564

Environmental destruction and the brick trade in Bangladesh and IndiaThe�impact�of�unregulated�brick�production�overseas�–�combined�with�the�addition-al�carbon�embodied�in�transporting�them�–�has�substantial�implications�for�the�UK’s�consumed�carbon�footprint.�Yet�alongside�their�contribution�to�global�emissions,�production�practices�such�as�those�undertaken�in�the�brick�belt�serve�also�to�exac-erbate�the�impacts�of�climate�change,�enhancing�current�and�future�vulnerabilities,�and�structural�inequalities�through�investment�practices.�In�countries�such�as�Bangla-desh�and�India,�brick�production�is�associated�with�‘toxic�fumes�and�atrocious�work-ing�conditions’, 150�alongside�growing�concerns�over�the�impact�of�air�pollution�and�massive�topsoil�harvesting�for�the�brick�industry�on�local�people’s�ability�to�sustain�traditional�livelihoods.151
The�impact�of�brick�production�in�South�Asia�is�felt�in�both�human�and�environmental�health.�In�the�first�instance,�brick�kilns�are�notorious�for�their�impacts�on�the�health�not�only�of�workers,�but�the�surrounding�populations�also.�In�Bangladesh,�one�local�man�living�in�the�vicinity�of�brick�kilns�complained�that�“our�skin�becomes�black�while�the�raw�bricks�are�burnt�in�the�kiln.�I�learnt�that�this�smoke�can�cause�cancer.” — Rayhan�Alam,�Petty�Trader�and�Agricultural�Worker,�February�2021.�A�second,�living�beside�a�second�kiln,�confirmed�“those�who�are�living�near�the�brick�kilns,�they�are�suffering�a�lot.�Those�who�are�living�within�5�kilometres�of�the�kiln,�they�are�acutely�suffering.” — Jakaria�Ahamed,�Livestock�Farmer�and�Petty�Trader,�February�2021.�Similar�stories�were�repeated�by�locals�living�near�multiple�kilns�near�Dhaka.�One�farmer�and�petty�trader�explained�that:
“Smoke�from�brick�production�is�affecting�the�health�of�local�people.�Local�peo-ple’s�shortness�of�breath�is�increasing,�especially�when�they�leave�the�house�in�the�morning.�Then�I�see�everything�[looks]�dark�because�of�the�smoke.�There�is�a�strong�stench.�Our�body�is�always�covered�with�the�dust�and�sand�particles.�The�skin�of�the�people�here�becomes�completely�black.�Children,�the�old�and�people�of�all�classes�in�the�area�are�being�affected�by�this�trend.�Not�only�people�but�also�animals,�birds�and�cattle�are�being�affected�by�this.” — Alamgir�Bhuiyan,�Farmer�and�Petty�Trader,�February�2021
Similarly,�the�owner�of�a�fertiliser�business�near�Dhaka�related:
“In�the�morning,�it�seems�as�if�a�gas�has�formed.�You�can’t�look�ahead,�your�eyes�burn�a�lot.�The�atmosphere�is�getting�heated�due�to�the�smoke�from�the�brick�kiln,�as�a�result�of�which�people�are�getting�infected�with�various�diseases.�Conse-quently,�the�average�life�expectancy�is�declining�day�by�day.�People�are�getting�weak�at�a�young�age.�Children�are�being�affected�the�most.�Again,�those�who�are�a�little�physically�weak�are�also�being�attacked.” — Ataur�Rahman�Bhuiyan,�Fertil-iser�Business,�February�2021
As�evidenced�by�the�testimonies�of�local�residents,�airborne�and�heat�pollution�linked�to�the�brick�kilns�are�critical�everyday�issues�for�local�people,�who�face�their�own�health�degrading�in�parallel�to�that�of�their�local�environment.�Nevertheless,�whilst�these�acute�hazards�decline�outside�of�the�months�of�production,�the�wider�impacts�of�the�industry�in�terms�of�shaping�the�impacts�of�climate�change�are�both�enduring�and�cumulative,�engendering�both�heightened�vulnerability�and�intensified�impacts�to�floods�and�droughts�in�the�vicin-ity.�In�circular�fashion,�this�is�an�issue�both�driven�by�and�contributing�to�the�impacts�of�drought.�Threatened�by�increasingly�unreliable�rainfall�in�areas�traditionally�reliant�on�rain-fed�rice�paddy,152�many�farmers�are�willing�to�sell�parts�of�their�topsoil�to�the�brick�industry�to�be�processed�into�clay.�As�one�local�farmer�from�Gujarat,�who�had�not�yet�sold�any�land�explained:
4.3
Farmers incur immense losses due to the smoke, as major portions of the crops are damaged by the poisonous gas and heat of brick production.
“Brick kiln owners extract soil deeply from the land, which brings a high risk of collapse. We have seen a lot of land collapse due to the extraction soil in the nearby areas.”
Bangladeshi�brick�workers�collect�soil�to�mould�bricks.
6766

“Some�people�sell�their�soil�because�they�don’t�have�access�to�borewell�water.�Many�people�here�don’t�have�access�to�groundwater�through�borewells.�In�summer�there�is�no�water�in�the�canal�or�the�river.�This�is�a�drought�prone�area.” — Local�4,�April�2021
As�a�second�Gujarati�farmer,�who�had�already�sold�his�soil�for�these�reasons,�con-firmed,�the�lack�of�water�available�to�him�for�farming�was�a�key�factor�in�his�selling�part�of�his�land�to�the�kiln.�Indeed,�this�soil�sale�formed�part�of�a�wider�scheme�to�continue�farming�by�digging�a�bore�well�to�irrigate�the�remainder�of�his�rice�field:
“Because�we�did�not�have�groundwater�access,�we�took�the�kiln’s�offer�to�level�our�field,�to�dig�a�borewell�on�our�land�and�give�a�motor�pump�in�exchange�for�the�soil,�instead�of�paying�money.�There�is�a�river�nearby,�but�it�is�mostly�dry�or�shallow.�There�are�not�any�canals�or�reliable�surface�modes�of�irrigation�in�the�village.” — Local�2,�April�2021
Nevertheless,�although�farmers�selling�land�to�the�brick�industry�tended�to�cal-culate�the�costs�and�benefits�of�doing�so�on�a�household�basis,�their�doing�so�has�wider�implications�for�the�local�farming�community.�As�a�farmer�and�local�business-man�in�Narshingdi,�on�the�outskirts�of�Dhaka,�explained:
“The�local�land�is�in�extreme�danger�due�to�the�collection�of�topsoil.�The�land�around�the�area�they�are�cutting�out�has�col-lapsed�and�the�hole�gets�filled�by�[dirt]�again.�Soil�is�being�car-ried�away�by�the�trucks,�which�run�over�the�land�surrounding�the�part�where�the�soil�was�extracted,�leaving�it�in�a�danger-ous�condition.�Afterwards,�due�to�the�accumulation�of�water�in�the�hole,�the�surrounding�lands�are�also�unstable,�which�leads�to�their�collapse.” — Alamgir�Bhuiyan,�February�2021
Not�only�is�this�an�issue�for�farmers�in�the�immediate�term,�rendering�it�“not�pos-sible�to�cultivate�the�adjacent�land�due�to�the�cutting�of�soil” — Asharf�Uddin�Fakir,�Farmer�and�Fisher,�February�2021,�but�locals�fear�longer�term�implications�for�the�integrity�of�their�surrounding�lands.�As�a�teacher�in�the�local�school�argued:
“Brick�kiln�owners�extract�soil�deeply�from�the�land,�which�brings�a�high�risk�of�collapse.�We�have�seen�a�lot�of�land�collapse�due�to�the�extraction�soil�in�the�nearby�areas.�We�will�see�the�worst�impact�after�20�–�30�years,�but�I�think�the�potential�for�landslides�[in�this�area]�depends�on�the�depth�of�soil�extraction�from�the�land.” — Md.�Monurujjaman�Bhuiyan,�February�2021
“The local land is in extreme danger due to the collection of topsoil. The land around the area they are cutting out has collapsed and the hole gets filled by dirt again.”
Brick�workers�arrange�bricks�for�firing.�This�traditional�system�of�brick�production�is�largely�unchanged�for�centuries.
6968

Land�collapse�due�to�the�overexploitation�by�the�brick�industry�therefore�presents�a�key�risk�to�affect-ed�farmers�in�Bangladesh,�as�it�does�elsewhere�in�the�brick�belt.�Nevertheless,�as�farmers�in�the�local�area�elaborated,�it�is�only�one�dimension�of�the�wider�environmental�challenges�brough�about�by�large�scale�topsoil�removal.�In�Bangladesh,�a�country�badly�affect-ed�by�droughts�and�floods�made�more�frequent�and�damaging�through�climate�change,153�soil�harvesting�by�brick�kilns�is�intensifying�the�impacts�of�climatic�pressures�by�disrupting�flows�of�water�in�the�vicinity�of�brick�kilns�and�impacting�the�livelihood�of�subsistence�and�smallholder�farmers.154
By�lowering�one�section�of�land�within�an�agricultural�landscape�dependent�on�capturing�a�high�volume�of�rainwater,�this�reshaped�topography�of�the�landscape�alters�hydrological�flows�in�the�area,�creating�a�draining�effect�that�accentuates�water�shortage�in�surrounding�fields.�Consequently,�the�widespread�topographical�changes�arising�from�the�brick�industry’s�hunger�for�topsoil�are�well�understood�throughout�the�brick�belt,�as�too�are�its�impacts�on�agricultural�livelihoods.�As�a�local�factory�worker�living�near�one�of�these�kilns�explained:
“The�water�flow�changes�due�to�soil�extraction.�Due�to�the�brick�kiln,�the�water�of�the�area�cannot�pass�on�rainy�days,�causing�water�logging.�As�a�result,�the�agri-cultural�lands�of�the�area�become�stagnated,�[so]�farmers�cannot�cultivate�their�lands.” — Hafizullah,�Factory�Worker,�February�2021
As�a�result�of�these�changes,�“the�environment�is�being�extensively�damaged”�due�to�persistent�water�logging�leading�to�the�rotting�of�crops�and�soil — Ataur�Rahman�Bhuiyan,�Fertiliser�Business,�February�2021.�Moreover,�as�an�agricultural�and�con-struction�worker�nearby�outlined,�the�loss�of�tracts�of�topsoil�increases�vulnerability�to�both�flood�and�drought,�even�within�the�same�area�and�in�the�same�year:
“There�are�changes�to�water�flow�due�to�the�cutting�out�of�topsoil�from�the�crop-lands.�Water�cannot�pass�properly�through�the�channels,�which�results�in�water�logging�in�the�lands.�As�most�of�the�kilns�are�situated�in�a�somewhat�higher�place�[than�the�surrounding�lands],�our�area�goes�under�water�during�the�monsoon�peri-od,�which�damages�the�fertility�of�the�land.�Consequently,�during�dry�season�the�earth�is�dried�up�like�a�drought.�Earlier,�we�could�produce�crops�in�two�seasons.�Now�we�are�to�produce�[only]�one�season�of�crops.�Stagnant�water�is�[also]�dan-gerous�for�many�kinds�of�bacteria�and�leads�to�infection�from�water-borne�dis-eases�among�the�people.” — Ismail�Hossain,�Agricultural�Worker�and�Construction�Worker,�Dhaka�Tribune,�2019
Faced�with�these�issues,�local�people�have�in�many�cases�sought�unsuccessfully�to�protest�against�the�presence�of�brick�kilns�in�their�area.�As�locals�in�Narshingdi,�near�Dhaka,�related:�“we�demanded�to�remove�the�brick�kilns�from�our�area�[so]�we�could�at�least�save�our�lands.�But�we�were�not�able�to�continue�our�protest�against�the�brick�kilns�as�the�brick�kiln�owners�have�political�power.�They�can�influence�the�local�administration.” — Rabiul�Hasan,�February�2021.�
Indeed,�the�political�connections�possessed�by�brick�kiln�owners�was�a�recurring�theme�across�all�of�the�sites�explored�here.�Locals�in�Gujarat,�for�exam-ple,�stated�similarly�that�“the�ones�who�set�up�kilns�are�politically�powerful.�They�don’t�fear�any�author-ity,�and�bribe�regularly�to�get�their�way.�The�kilns�pay�the�Pollution�Control�Officers�so�that�the�kilns�are�not�shut�down�due�to�pollution.” — Surtan�Singh,�Gujarat,�April�2021.�Unable�to�push�back�against�the�operations�of�the�brick�industry,�the�intensified�cli-mate�impacts�engendered�by�soil�removal�–�which�render�floods�and�droughts�in�the�local�area�more�common,�extensive�and�damaging�–�set�in�motion�a�vicious�cycle�of�environmental�degradation,�crop�failure�and�land�sale�in�the�local�area.�As�a�Gujarati�farmer�explained:
“If�one�farmer�sells�soil�to�the�kiln,�then�nearby�farmers�have�to�sell.�Because�if�his�farm�is�at�a�low�level,�then�the�rain�runoff�from�the�other�lands�gets�to�his�land,�and�the�other�lands�remain�dry�and�lose�their�fertility.�Out�of�frustration,�the�neigh-bouring�farmers�sell�off�their�soil�to�the�kiln�as�well,�to�make�it�level.” — Vyanshak,�Farmer,�April�2021
Similarly,�in�Narsingdi,�locals�explained�how�the�environmental�impacts�engendered�by�topsoil�collection�served�to�reduce�the�value�of�nearby�lands,�thereby�further�incen-tivising�the�practice�and�accelerating�the�spread�of�land�sale�through�the�local�area:
“[Our]�local�land�is�in�a�dangerous�way�due�to�the�collection�of�topsoil.�Nearby�lands�have�collapsed�from�the�extraction�of�soil�[because],�due�to�stagnation�of�water�in�the�land,�the�soil…becomes�soft�and�breaks�down.�As�a�result,�farmers�have�nothing�to�do�but�sell�soil�from�their�lands�[leaving]�the�land�of�the�whole�area�in�a�dangerous�condition.�They�first�cut�the�soil�from�the�land�by�offering�more�money,�and�then�they�cut�off�the�soil�from�the�adjacent�land�with�a�little�money.” — Aminul�Fakir,�Farmer�and�Tractor�Driver,�February�2021
As�the�brick�industry�rapidly�expands�across�the�brick�belt,�therefore,�driven�in�small�but�growing�part�by�demand�for�exported�bricks�from�countries�such�as�the�UK,�significant�swaths�of�countries�such�as�Bangladesh�and�India�are�experiencing�a�heightened�vulnerability�to�the�impacts�of�the�changing�climate.�Even�as�the�fre-quency�and�intensity�of�droughts�and�floods�increases�elsewhere�in�the�area,�this�increase�is�greater�and�more�acute�where�the�influence�of�the�brick�industry�is�felt.Yet�these�direct�articulations�of�climatic�variation�are�only�one�dimension�of�the�
brick�industry’s�impact�on�the�environment�and�the�livelihoods�it�supports.�Further�compounding�this�cycle�of�water�over-abundance�and�scarcity,�the�airborne�impacts�of�brick�production�play�a�substantial�role�in�undermining�the�fertility�of�local�farm-ers’�crops.155�For�many�farmers,�who�have�already�shifted�away�from�rice�production�after�selling�their�topsoil�to�the�brick�kilns,�this�means�that�their�efforts�at�adapta-tion�are�once�again�blocked�by�industrial�impacts�on�the�environment.�As�locals�in�Gujarat�complain,�“the�smoke�from�the�kiln�cover�the�trees�and�they�don’t�fruit�or�flower.” — Vishnupad,�Farmer,�April�2021.�Moreover:
“The water flow changes due to soil extraction. Due to the brick kiln, the water of the area cannot pass on rainy days, causing water logging. As a result, the agricultural lands of the area become stagnated, so farmers cannot cultivate their lands.”
“If one farmer sells soil to the kiln, then nearby farmers have to sell. Because if his farm is at a low level, then the rain runoff from the other lands gets to his land, and the other lands remain dry and lose their fertility. Out of frustration, the neighbouring farmers sell off their soil to the kiln as well, to make it level.”
7170
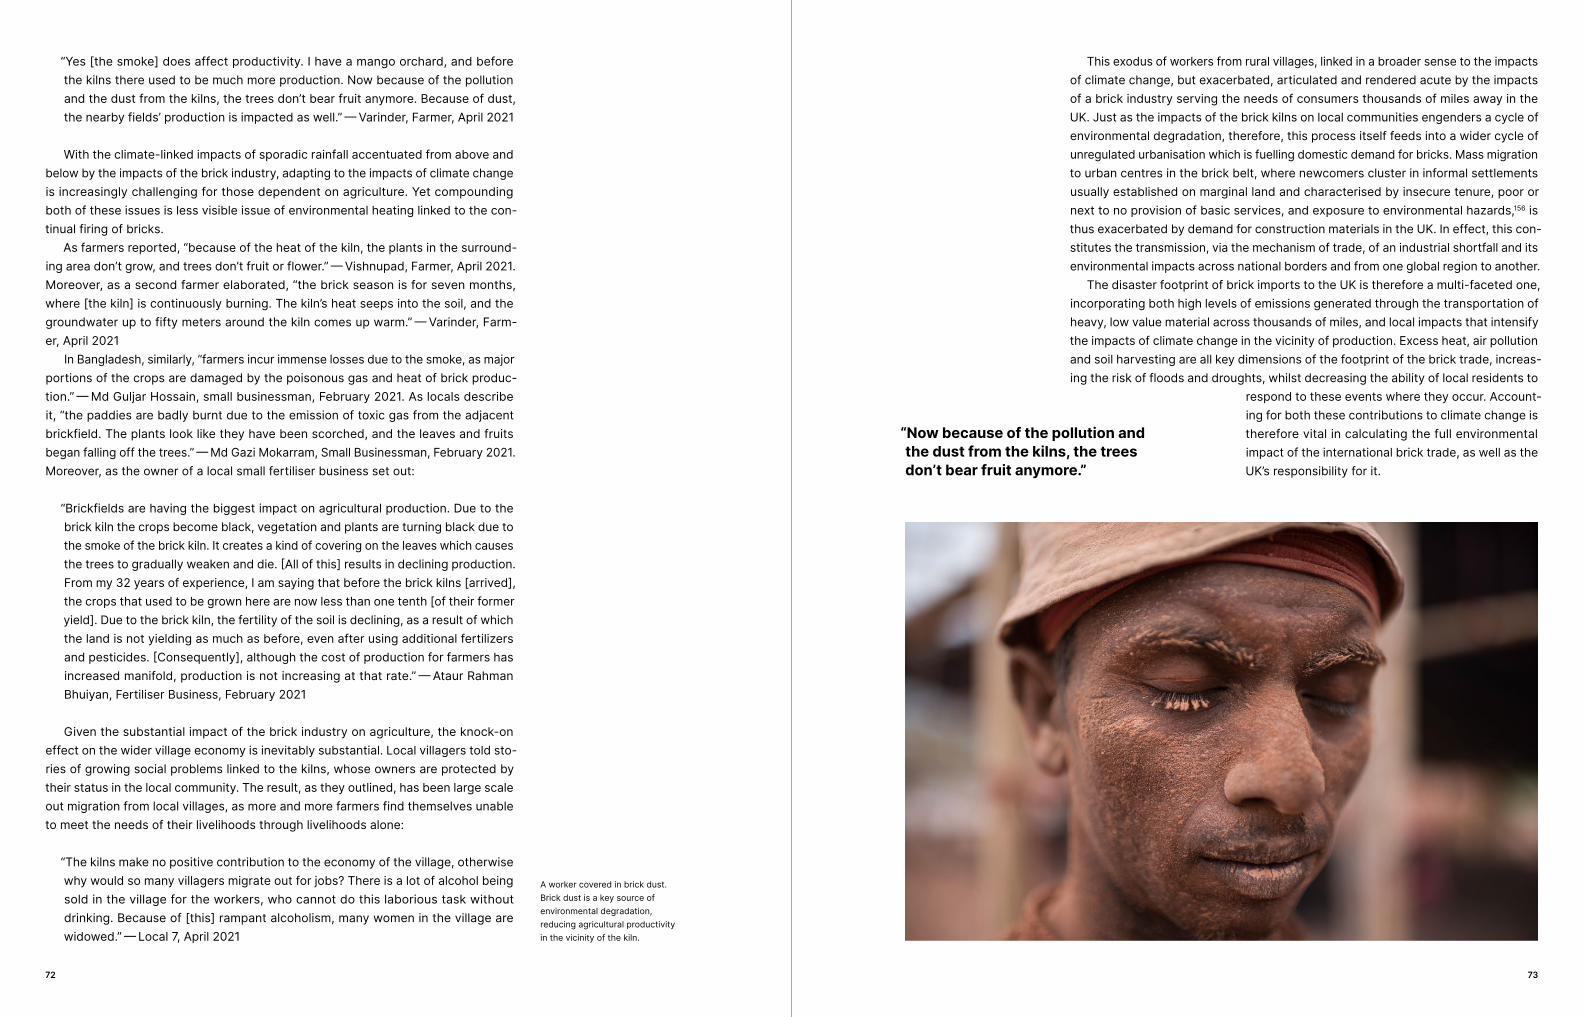
“Yes�[the�smoke]�does�affect�productivity.�I�have�a�mango�orchard,�and�before�the�kilns�there�used�to�be�much�more�production.�Now�because�of�the�pollution�and�the�dust�from�the�kilns,�the�trees�don’t�bear�fruit�anymore.�Because�of�dust,�the�nearby�fields’�production�is�impacted�as�well.” — Varinder,�Farmer,�April�2021
With�the�climate-linked�impacts�of�sporadic�rainfall�accentuated�from�above�and�below�by�the�impacts�of�the�brick�industry,�adapting�to�the�impacts�of�climate�change�is�increasingly�challenging�for�those�dependent�on�agriculture.�Yet�compounding�both�of�these�issues�is�less�visible�issue�of�environmental�heating�linked�to�the�con-tinual�firing�of�bricks.�As�farmers�reported,�“because�of�the�heat�of�the�kiln,�the�plants�in�the�surround-
ing�area�don’t�grow,�and�trees�don’t�fruit�or�flower.” — Vishnupad,�Farmer,�April�2021.�Moreover,�as�a�second�farmer�elaborated,�“the�brick�season�is�for�seven�months,�where�[the�kiln]�is�continuously�burning.�The�kiln’s�heat�seeps�into�the�soil,�and�the�groundwater�up�to�fifty�meters�around�the�kiln�comes�up�warm.” — Varinder,�Farm-er,�April�2021In�Bangladesh,�similarly,�“farmers�incur�immense�losses�due�to�the�smoke,�as�major�
portions�of�the�crops�are�damaged�by�the�poisonous�gas�and�heat�of�brick�produc-tion.” — Md�Guljar�Hossain,�small�businessman,�February�2021.�As�locals�describe�it,�“the�paddies�are�badly�burnt�due�to�the�emission�of�toxic�gas�from�the�adjacent�brickfield.�The�plants�look�like�they�have�been�scorched,�and�the�leaves�and�fruits�began�falling�off�the�trees.” — Md�Gazi�Mokarram,�Small�Businessman,�February�2021.�Moreover,�as�the�owner�of�a�local�small�fertiliser�business�set�out:
“Brickfields�are�having�the�biggest�impact�on�agricultural�production.�Due�to�the�brick�kiln�the�crops�become�black,�vegetation�and�plants�are�turning�black�due�to�the�smoke�of�the�brick�kiln.�It�creates�a�kind�of�covering�on�the�leaves�which�causes�the�trees�to�gradually�weaken�and�die.�[All�of�this]�results�in�declining�production.�From�my�32�years�of�experience,�I�am�saying�that�before�the�brick�kilns�[arrived],�the�crops�that�used�to�be�grown�here�are�now�less�than�one�tenth�[of�their�former�yield].�Due�to�the�brick�kiln,�the�fertility�of�the�soil�is�declining,�as�a�result�of�which�the�land�is�not�yielding�as�much�as�before,�even�after�using�additional�fertilizers�and�pesticides.�[Consequently],�although�the�cost�of�production�for�farmers�has�increased�manifold,�production�is�not�increasing�at�that�rate.” — Ataur�Rahman�Bhuiyan,�Fertiliser�Business,�February�2021
Given�the�substantial�impact�of�the�brick�industry�on�agriculture,�the�knock-on�effect�on�the�wider�village�economy�is�inevitably�substantial.�Local�villagers�told�sto-ries�of�growing�social�problems�linked�to�the�kilns,�whose�owners�are�protected�by�their�status�in�the�local�community.�The�result,�as�they�outlined,�has�been�large�scale�out�migration�from�local�villages,�as�more�and�more�farmers�find�themselves�unable�to�meet�the�needs�of�their�livelihoods�through�livelihoods�alone:
“The�kilns�make�no�positive�contribution�to�the�economy�of�the�village,�otherwise�why�would�so�many�villagers�migrate�out�for�jobs?�There�is�a�lot�of�alcohol�being�sold�in�the�village�for�the�workers,�who�cannot�do�this�laborious�task�without�drinking.�Because�of�[this]�rampant�alcoholism,�many�women�in�the�village�are�widowed.” — Local�7,�April�2021
This�exodus�of�workers�from�rural�villages,�linked�in�a�broader�sense�to�the�impacts�of�climate�change,�but�exacerbated,�articulated�and�rendered�acute�by�the�impacts�of�a�brick�industry�serving�the�needs�of�consumers�thousands�of�miles�away�in�the�UK.�Just�as�the�impacts�of�the�brick�kilns�on�local�communities�engenders�a�cycle�of�environmental�degradation,�therefore,�this�process�itself�feeds�into�a�wider�cycle�of�unregulated�urbanisation�which�is�fuelling�domestic�demand�for�bricks.�Mass�migration�to�urban�centres�in�the�brick�belt,�where�newcomers�cluster�in�informal�settlements�usually�established�on�marginal�land�and�characterised�by�insecure�tenure,�poor�or�next�to�no�provision�of�basic�services,�and�exposure�to�environmental�hazards,156�is�thus�exacerbated�by�demand�for�construction�materials�in�the�UK.�In�effect,�this�con-stitutes�the�transmission,�via�the�mechanism�of�trade,�of�an�industrial�shortfall�and�its�environmental�impacts�across�national�borders�and�from�one�global�region�to�another.The�disaster�footprint�of�brick�imports�to�the�UK�is�therefore�a�multi-faceted�one,�
incorporating�both�high�levels�of�emissions�generated�through�the�transportation�of�heavy,�low�value�material�across�thousands�of�miles,�and�local�impacts�that�intensify�the�impacts�of�climate�change�in�the�vicinity�of�production.�Excess�heat,�air�pollution�and�soil�harvesting�are�all�key�dimensions�of�the�footprint�of�the�brick�trade,�increas-ing�the�risk�of�floods�and�droughts,�whilst�decreasing�the�ability�of�local�residents�to�
respond�to�these�events�where�they�occur.�Account-ing�for�both�these�contributions�to�climate�change�is�therefore�vital�in�calculating�the�full�environmental�impact�of�the�international�brick�trade,�as�well�as�the�UK’s�responsibility�for�it.
“Now because of the pollution and the dust from the kilns, the trees don’t bear fruit anymore.”
A�worker�covered�in�brick�dust.�Brick�dust�is�a�key�source�of�environmental�degradation,�reducing�agricultural�productivity�in�the�vicinity�of�the�kiln.
7372

Tea Climate change is linked to changing rainfall and growing risk of landslides in Sri Lanka. Yet their growing deadliness is rooted not only in changes to the weather, but also degrading local conditions linked to tea production. Tea plantations are intensifiers of landslide risk, raising the population of landslide-prone upland areas, whilst also undermining the integrity of the soil where tea is grown. Many of these plantations are British owned, whilst others produce goods for the British market.
Part 5
A�tea�plantation�worker�stands�in�front�of�his�house.�The�cracks�behind�him�are�the�result�of�previous�landslides�nearby.
74 7574

Tea�is�the�world’s�most�popular�drink.�Consumed�by�an�estimated�3�billion�people�each�day,157�the�global�tea�trade�amounted�to�5.98�million�tons�in�2017�and�is�worth�an�estimated�8�billion�USD.158�It�employs�13�mil-lion�people,�9�million�of�whom�are�smallholder�farmers,�while�the�remaining�4�million�work�in�tea�estates.159�Yet�it�is�also�an�industry�associated�with�persistent�dan-gers.�The�need�to�situate�tea�plantations�on�slopes,�
to�avoid�waterlogging,�in�areas�associated�with�monsoon�rainfall�patterns,160�places�the�large�number�of�workers�involved�in�the�cultivation�of�tea�crops�at�heightened�risk�of�landslides.�These�local�dangers�associated�with�tea�production�contrast�with�a�relatively�innocuous�carbon�footprint,�compared�with�other�everyday�commodities�such�as�garments�and�bricks.�In�total,�it�takes�approximately�32�kg�CO2e�to�make�one�kg�of�tea,�including�all�processes�related�to�packaging�and�transportation.161�Yet�its�lightness�and�relatively�sparing�scale�of�use�(on�a�per�cup�basis)�places�it�amongst�the�less�carbon�intensive�commodities�consumed�in�the�UK�each�year.�Thus,�although�the�more�than�36�billion�cups�of�tea�drunk�each�year�in�the�UK�contribute�a�total�2�million�tons�of�CO2�to�global�emissions,�the�vast�majority�of�this�figure�is�expended�in�heating�the�drink�and�the�milk�that�is�added�to�it.�As�Mike�Berners-Lee162�summa-rises,�drinking�even�large�quantities�of�carbon�intensive�milky�tea�has�a�very�small�impact�compared�to�other�common�behaviours.�For�example,�even�“if�you�drink�four�mugs�of�tea�with�milk�per�day … [for�a�year] … that’s�the�same�as�a�60-mile�drive�per�year�in�an�average�car.”Given�that�the�UK�imports�around�16%�of�its�tea�from�Sri�Lanka,�amounting�to�1.3�
million�tons�each�year,�with�a�carbon�footprint�of�300,000�tons�of�CO2e,�the�impact�of�this�relatively�diminutive�trade�on�global�and�local�disasters�might�at�first�glance�appear�limited.�Nevertheless,�as�a�closer�look�reveals,�the�impact�of�trade�on�climate�change�impacts�is�not�limited�to�the�most�carbon�intensive�goods.�Rather,�the�case�of�tea�exemplifies�how�the�hazards�associated�with�primary�agricultural�production�are�shaped�by�the�twin�forces�of�economy�and�climate,�resulting�in�heightened�dan-gers�and�intensified�environmental�impacts�in�the�global�South.
Climate change, declining trade and land use changeFirst�cultivated�by�the�British�in�1839,�in�response�to�a�catastrophic�coffee�blight�which�scuppered�a�prior�effort�at�crop�importation,�tea�has�been�one�of�Sri�Lanka’s�major�exports�for�over�150�years.163�At�the�height�of�its�global�dominance,�in�the�1970s,�the�Sri�Lankan�tea�industry�supplied�some�40%�of�the�world’s�tea,164�yet�the�industry�has�since�faded�substantially�from�this�apogee.�A�new�crop�of�tea-growing�coun-tries—Argentina,�Brazil,�Cuba,�Malawi,�Malaysia,�Peru,�and�Vietnam—have�begun�to�produce�for�tea�for�export�in�globally�significant�quantities,165�joining�the�tradition-al�competitors�of�China,�India�and�Kenya.�Though�still�one�of�the�world’s�major�tea�exporters,�Sri�Lanka’s�proportion�of�the�global�market�had�shrunk�to�15%�by�2019,166�with�total�exports�stagnating�over�the�last�two�decades�at�around�300�million�kilos.167
There�are�various�reasons�behind�Sri�Lanka’s�regression�in�the�global�tea�market,�including�the�collapse�of�the�Soviet�Union�which�previously�provided�a�substantial�market�for�Ceylon�tea�and�the�rise�of�cheaper�black�tea�alternatives�in�India,�China�and�Kenya.�Yet�chief�amongst�the�challenges�posed�to�Sri�Lankan�tea�in�recent�years�has�been�the�changing�environment�in�which�it�is�cultivated.�Sri�Lanka�is�currently�under-going�a�number�of�changes�to�its�climate,�with�extreme�heat�in�particular�becoming�more�common.�Under�high�emission�or�‘business�as�usual’�scenario,�the�number�of�days�surpassing�35°C�is�predicted�to�rise�from�a�baseline�of�20�days�to�more�than�100�days�by�the�2090s.�This�not�only�‘threatens�human�health�and�living�standards,�particularly�for�outdoor�laborers�in�urban�areas’,�but�also�places�downward�pressure�on�agricultural�yields,�including�tea.168
Indeed,�the�effects�of�these�changes�are�already�being�felt�in�the�industry.�In�recent�years,�‘changes�in�temperature,�rainfall,�and�the�occurrence�of�extreme�weather�events�have�adversely�affected�the�sector’�leading�to�significant�dips�in�tea�production.169�Both�the�yield�and�production�of�tea�are�influenced�by�weather�patterns,170�with�drought�in�particular�affecting�both�the�quantity�and�value�of�tea�harvests,�leading�to�consid-erable�loss�of�export�earnings.�Compounding�this,�production�costs�often�increase�during�periods�of�drought�due�to�the�need�for�additional�inputs�such�as�irrigation,171�rendering�them�a�triple�blow�to�the�economy�of�the�industry.�Even�setting�aside�the�economic�dimensions,�therefore,�‘under�a�high�emissions�scenario,�by�mid-century,�a�decline�of�12%�in�annual�tea�production�is�predicted’. 172�Combined�with�confounding�economic�issues,�the�reality�may�be�a�far�steeper�decline.�In�economic�terms,�this�is�clearly�problematic�for�an�industry�that�employs�some�600,000�people,�roughly�7%�of�the�country’s�labour�force.173�Yet�there�are�also�implications�for�acute�human�impacts�of�climate�change�in�Sri�
Lanka.�Landslides�linked�to�rainfall�changes�are�one�of�the�major�current�and�pro-jected�impacts�of�climate�change�and�have�increased�substantially�in�frequency�in�the�last�30�years.�
5.1
The need to situate tea plantations on slopes, to avoid waterlogging, in areas associated with monsoon rainfall patterns, places the large number of workers involved in the cultivation of tea crops at heightened risk of landslides.
A�worker�repairs�a�wall�damaged�by�a�landslide�in�the�Sri�Lankan�highlands.�Landslides�are�a�growing�threat�to�workers�in�the�area.
7776

From�1990�to�2001,�an�average�of�587�Sri�Lankans�were�affected�by�landslides�each�year.�From�2002�to�2019,�this�annual�figure�rose�to�15,400:�a�26-fold�increase.174�Since�then,�the�frequency�of�landslides�has�rapidly�increased,175�moving�them�from�the�status�of�‘minor�disaster’�to�one�of�the�country’s�most�pressing�and�persistent�threats.176
This�increasing�frequency�and�deadliness�is�strongly�asso-ciated�with�land�use.�‘Human-induced’�landslides,�linked�to�land�use�change,�are�esti-mated�at�80%�of�total�landslide�incidents,177�in�large�part�due�to�the�changes�in�soil�consistency�and�associated�erosion.�Indeed,�estimates�of�human-mediated�activities�in�Sri�Lankan�upland�suggest�that�land�use�changes�‘have�increased�rates�of�ongo-ing�erosion�by�[more�than]�100�times�over�the�background�rates�of�natural�erosion’.178�Nevertheless,�although�most�land�use�changes�contribute�to�this�process,�tea�plan-tations�stand�out�as�especially�problematic.�As�studies�consistently�highlight179�tea�plantations�are�the�form�of�land�use�most�closely�associated�with�landslides,�with�statistical�analysis�suggesting�that�tea�plantations�account�for�35%�of�landslides,�the�greatest�share�of�any�form�of�land�use.180�Nevertheless,�a�crucial�detail�in�this�respect�is�that�the�establishment�of�tea�plantations�is�in�fact�less�of�a�risk�factor�than�their�conversion�to�other�uses.�
As�outlined�by�Gunarathna�et�al.�(2018),�for�example,�the�conversion�of�tea�plantations�to�any�other�land�use�presents�one�of�only�three�‘high�risk’�land�use�transi-tions,�alongside�two�forms�of�conversion�away�from�rubber�plantations.�This�is�not�a�phenomenon�unique�to�tea�transitions,�yet�the�reduction�in�soil�volume�asso-ciated�with�tea�cultivation�makes�it�an�especially�del-eterious�to�soil�stability�over�time�and�thus�particularly�prone�to�landslides�if�abandoned.181
As�such,�what�Sri�Lankan�are�currently�witnessing�is�increasing�intensity�of�climate�change�impacts,�articulated�through�the�lens�of�international�trade.�As�the�chang-ing�climate�makes�tea�cultivation�more�difficult�and�less�profitable,�the�market�for�Sri�Lankan�tea�exports�is�shrinking,�leading�to�a�slow�transition�away�towards�small-holder�plots�and�alternative�land�uses.�With�soil�stability�already�compromised�by�the�transition�into�tea�production,�the�transition�away�from�tea�production�heightens�the�risk�of�landslides�still�further.�At�the�same�time,�the�widespread�privatisation�of�the�Sri�Lankan�tea�industry�in�the�1990s,�intended�to�increase�efficiency�and�regain�something�of�the�ground�lost�in�the�global�market,�has�seen�a�significant�reduction�in�expenditure�on�maintenance�of�tea�estates’�physical�infrastructure.�In�the�absence�of�state�support,�much�of�the�residential�and�industrial�building�stock�–�originally�built�during�the�British�colonial�period�in�many�cases�–�has�been�allowed�to�fall�into�dan-gerous�levels�of�disrepair,�accentuating�the�risks�faced�by�workers�in�increasingly�landslide�prone�areas.This�combination�of�increasing�natural�hazards�due�to�climate�change,�with�the�
local�impacts�of�land�use�change�and�built�infrastructural�decline�constitutes�a�triple�threat�to�the�inhabitants�of�tea�plantations.�As�rainfall�becomes�heavier,�less�predict-able�and�more�intense,�the�frequency�of�landslides�is�increasing,�yet�crucially�their�threat�is�not�evenly�distributed.�Rather,�the�threat�of�landslides�is�articulated�by�the�specific�environmental�characteristics�of�the�tea�sector,�effectively�channelling�the�impacts�of�climate�change�through�the�lens�of�economic�structures�and�interna-tional�trade.�Lethal�climate�change-linked�landslides�in�the�Sri�Lankan�uplands�are�therefore�socio-economically�articulated�disasters,�which�the�tea�trade�plays�a�key�role�in�shaping.
What Sri Lankan are currently witnessing is increasing intensity of climate change impacts, articulated through the lens of international trade.
A�worker�points�out�the�large�cracks�in�his�house.�Tea�plantation�residents�fear�that�their�residences�have�been�severely�weakened�by�previous�landslides�nearby,�leaving�them�vulnerable�to�collapse.
The hazards associated with primary agricultural production are shaped by the twin forces of economy and climate, resulting in heightened dangers and intensified environmental impacts in the global South.
7978

Land-use change and landslide risk in the international tea tradeThe�landslide�risk�associated�with�tea�has�been�noted�in�a�global�literature�encompass-ing�cases�studies�from�Shizuoka,�Japan,182�to�Riza183�and�Anatolia184�in�Turkey,�to�the�Central�Kenyan�Highlands.185�As�these�studies�demonstrate,�various�attributes�of�tea�plantations�enhance�vulnerability�to�landslides.�In�the�first�instance,�the�‘topographic�setting,�as�well�as�other�natural�characteristics�including�geotechnical�conditions’186�underpin�an�underlying�predisposition�to�landslides.�Yet�this�is�inherent�vulnerability�is�compounded�both�by�the�nature�of�the�tea�crop�itself�and�the�manner�in�which�it�is�harvested.�In�the�first�instance,�the�‘deeper�root�system�of�the�trees�[are]�replaced�by�[the]�shallow�root�system�of�the�tea�plant’.187�As�a�result,�‘many�slopes�with�tea�plantations�are�subject�to�soil�subsidence’188:�an�issue�compounded�by�the�manner�in�which�the�crop�is�cultivated.�As�Uyeturk189�outlines,�‘61%�of�the�areas�where�land-slides�occur�in�Rize�have�tea�plantations’190�in�part�because:‘Plantation�on�slopes�requires�creating�small�horizontal�benches�(sets)�on�the�
slopes�for�growing�tea;�therefore�the�natural�drainage�conditions�of�the�slope�are�also�changed�by�creating�these�flat�surfaces,�which�reduces�the�surface�runoff,�thus�increasing�infiltration�of�rainfall�into�the�ground.’Although�the�relationship�between�landslides�and�tea�plantations�is�widely�noted,�
however,�it�is�nowhere�more�in�evidence�than�Sri�Lanka.�Indeed,�for�Sri�Lankans,�this�nexus�is�a�national�issue�of�growing�importance.�According�to�historical�data,�the�‘first�eight�decades�of�19th�century�recorded�only�six�major�landslide�events�in�Sri�Lanka,�but�the�two�decades�since�1981�have�registered�five�major�occurrence�of�land-slides’191:�a�trend�which�has�accelerated�in�recent�years.�Whilst�Sri�Lanka�experienced�an�average�of�less�than�50�annual�landslides�up�to�2002,�this�number�has�since�rapidly�increased�as�part�of�a�rising�trend�in�both�incidence�and�fatality�in�recent�decades.192�They�are�now�a�clear�and�ever-present�danger�to�communities�living�in�the�affected�areas,�punctuated�by�intermittent�major�disasters.�In�2017,�for�example,�floods�and�landslides�were�responsible�for�the�deaths�of�over�150�people,193�whilst�December�2019�saw�flooding�and�landslides�prompt�the�evacuation�of�over�20,000�people.194
Yet�remote�as�they�may�seem�to�UK�residents,�this�regular�procession�of�disas-ters�is�neither�natural,�nor�as�far�removed�from�their�everyday�lives�as�they�might�appear.�Rather,�ever�since�British�colonisers�first�introduced�tea�to�the�Sri�Lankan�highlands�in�1839,�the�region’s�endemic�hazards�have�been�structured�increasingly�by�the�products�that�are�grown�and�traded�there.�In�2014,�for�example,�37�people�were�killed�on�the�British-owned�Meeriyabadda�tea�plantation,�when�part�of�a�cultivated�hillside�collapsed,�burying�dozens.195�Some�180�years�after�the�British�first�began�commercially�cultivating�Sri�Lanka’s�uplands,�the�UK�and�other�importing�countries�are�continuing�to�enjoy�the�fruits�of�this�increasingly�hazardous�landscape,�whilst�remaining�far�removed�from�the�risks�of�their�production.
And�the�situation�is�worsening.�As�the�impacts�of�climate�change�shift�rainfall�pat-terns�around�the�region,�landslides�are�becoming�more�common�and�more�deadly.�Recent�precipitation�variation�studies�in�Sri�Lanka�have�revealed�a�significant�increase�of�rainfall�in�terms�of�intensity�and�frequency:�factors�strongly�linked�to�the�risk�of�landslides.196�As�shown�in�Figure�10,�the�cost�of�damage�associated�with�floods�and�landslides�in�Sri�Lanka�has�increased�more�than�tenfold�from�around�35�million�USD�in�1989�to�nearly�half�a�billion�USD�in�2017.
1989
1992
2010
2016
2017
2011
Figure�10.�Damages�due�to�landslides�in�Sri�Lanka�over�time.197
Moreover,�British�tea�plantations�play�a�key�role�in�enhancing�the�likelihood�and�risks�associated�with�landslides�in�Sri�Lanka.�As�shown�in�Table�1,�British�tea�plan-tations�are�distributed�across�a�range�of�categories�of�landslide�risk.�Of�these,�two�plantations,�representing�3.7%�of�the�total�British-owned�tea�plantation�land�area�are�located�in�areas�where�landslides�are�most�likely�to�occur.�However,�a�further�29�plantations,�accounting�for�some�43.71%�of�British�tea�plantations�are�found�in�are-as�in�which�landslides�are�‘to�be�expected’.�A�further�33,�slightly�smaller�plantations,�accounting�for�42.44%�of�total�land�area�are�found�in�areas�with�a�modest�risk�of�landslides,�whilst�only�10�plantations,�accounting�for�10.14%�of�total�British�tea�culti-vation,�are�found�in�areas�where�landslides�are�unlikely�to�occur.
5.2 British tea plantations play a key role in enhancing the likelihood and risks associated with landslides in Sri Lanka.
8180

Hazard zone Land area (Ha) %
Landslides�not�likely�to�occur 385.17 10.14
A�modest�level�of�landslide�hazard�exists 1612.20 42.44
Landslides�are�to�be�expected 1660.32 43.71
Landslides�most�likely�to�occur 140.79 3.71
Total 3798.48 100
Table�1.�Summary�of�British�own�tea�lands�and�its�hazard�category.�
If�the�same�plantations�are�sorted�by�their�geographical�distance�from�existing�landslide�locations,�as�shown�in�Table�2,�two�plantations,�accounting�for�2.7%�of�the�British�total,�may�be�observed�as�located�within�500m�of�previous�landslides,�whilst�a�further�5.3%�are�located�within�1km.�In�total,�18.7%�are�located�within�2km�of�a�pre-vious�landslide,�whilst�all�75�are�located�within�5km.The�clustering�of�British�tea�plantations�predominantly�within�Sri�Lanka’s�cen-
tral�highlands�means�that,�as�the�risk�of�landslides�has�grown�in�Sri�Lanka,�the�vast�majority�are�in�areas�which�have�already�experienced�landslides�or�are�likely�to�do�so�in�future.�Further�compounding�the�issues�in�the�area,�a�number�of�British�plan-tations�in�high-risk�areas�have�reduced�the�size�of�their�plantation�holdings,�thereby�heightening�the�risk�faced�by�those�living�and�working�in�the�remaining�cultivated�areas,�due�to�the�processes�of�land�use�changed�described�in�section�5.2.
Range 500m 1km 2km 3km 4km 5km
No. of lands located within different buffer zones 2 4 8 15 20 25
% of lands located out of identified lands 2.7% 5.3% 10.7% 20.0% 26.7% 33.3%
Table�2.�British�owned�tea�estates�which�are�located�in�landslide�locations�(N=75).
As�these�data�highlight,�therefore,�the�location�of�tea�plantations�in�the�Sri�Lankan�uplands�has�in�recent�years�become�a�source�of�substantial�risk�to�those�working�them.�Whilst�landslides�have�traditionally�been�a�rare�occurrence�despite�the�pre-cipitous�nature�of�tea�growing�topography,�recent�years�have�seen�a�marked�upturn�in�their�regularity.�As�heavier�and�more�intense�rainfall�becomes�a�feature�of�the�Sri�Lankan�climate,�these�risks�are�growing�ever�greater.�Yet�they�are�far�from�inevitable.�Land�use�associated�with�tea�growing�plays�a�key�role�in�enhancing�the�likelihood�of�landslides�relative�to�other�uses,�but�the�management�of�existing�tea�plantations�plays�a�greater�role�still.�As�changing�rainfall�patterns�and�the�risks�with�which�it�is�associated�begin�to�hit�the�Sri�Lankan�tea�industry�economically,�the�transition�away�from�tea�is�raising�risks�further�for�those�that�remain.
In 2017, floods and landslides were responsible for the deaths of over 150 people, whilst December 2019 saw flooding and landslides prompt the evacuation of over 20,000 people.
A�tea�plantation�worker�in�the�Sri�Lankan�highlands.�Older�workers�report�substantial�changes�to�the�climate�of�the�area�since�their�youth.
8382

Living landslide risk as a British tea producerThe�Sri�Lankan�tea�trade�employs�hundreds�of�thousands�of�workers,�divided�between�the�private�and�state�sectors�which�comprise�60%�and�40%�respectively.198�With-in�this,�tea�plantations�are�further�divided�into�smallholder�tea�growers�and�larger�scale�estates,�of�which�the�smallholding�sector�accounts�for�302,575�acres�of�tea�extent�(i.e.,�61%)�compared�with�191,637�acres�of�tea�extent�(i.e.,�39%)�belonging�to�the�estate�sector.199
Having�been�nationalised�in�the�1970s�and�subsequently�partially�privatised,�the�estate�sector�is�one�in�which�workers�have�seen�considerable�change�in�recent�dec-ades.�State�facilities�such�as�medical�centres�and�dispensaries�have�been�discon-tinued�in�some�cases,�whilst�estate�housing�and�infrastructure�such�as�roads�and�water�delivery�have�been�allowed�to�decline�in�some�cases.�In�addition,�support�for�workers�experiencing�environmental�hazards�has�diminished,�negatively�impacting�preparedness�for�extreme�weather�events�and�accentuating�the�risks�associated�with�these�hazards,�including�landslides.Indeed,�with�more�than�half�of�the�industry’s�plantations�located�in�areas�of�high�
or�moderate�landslide�risk,�a�proportion�reflected�in�British�owned�estates,�working�in�the�industry�means�living�against�a�backdrop�of�environmental�threats�to�life�and�property.�For�workers�in�the�more�than�10%�of�British�tea�plantations�located�in�are-as�categorised�as�the�highest�level�of�landslide�risk,�this�danger�often�manifests�in�physical�signals,�integrating�an�awareness�of�the�dangers�of�landslides�into�everyday�life�and�labour,�as�outlined�across�the�following�three�case�studies�of�British�owned�plantations.
5.3.1 The Dickwella EstateLocated�in�the�Hali-ela�district�of�upland�Sri�Lanka,�the�Dickwella�Estate�has�been�categorised�by�the�Sri�Lankan�National�Building�Research�Organization�[NBRO]�as�an�area�of�high�landslide�risk�for�a�variety�of�reasons.�Families�working�on�the�estate�rely�exten-sively�on�lands�in�landslide-prone�areas,�whilst�houses�have�been�designed�without�professional�support�and�constructed�without�approval�from�relevant�authorities.�In�addition,�houses�are�constructed�on�steep�slopes�(up�to�31°�in�some�cases),�with�no�drainage�system�to�discharge�rainwater.�Despite�the�presence�of�tell-tale�landslide�signs�in�the�vicinity�of�houses,�there�is�a�lack�of�access�routes�to�settlements,�inade-quate�instructions�to�inhabitants�on�disaster�preparedness,�and�a�lack�of�work�under-taken�to�strengthen�housing�and�infrastructure�to�protect�against�landslide�hazards.�Two�landslide�incidents�have�been�previously�reported�in�Hali-ela�district,�in�1986�
and�1990,�yet�none�in�the�vicinity�of�the�Dickwella�estate�and�none�in�the�area�in�recent�
years.�Consequently,�residents�perceive�the�risk�of�these�events�to�be�low�compared�with�the�surrounding�areas.�Instead,�workers�are�concerned�primarily�with�the�threats�posed�by�wildlife�whilst�working�in�the�fields.�As�one�tea�plucker�explained,�‘we�are�not�afraid�of�the�environmental�conditions�of�this�estate.�We�are�afraid�of�some�ani-mals�such�as�snakes,�wasps,�etc.�Wasp�attacks�are�very�common�in�the�plantation�fields” — Tharushi,�fieldworker,�08/04/2021).�Beyond�this,�as�outlined�by�a�worker�who�has�spent�17�years�on�the�estate,�the�main�environmental�hazards�perceived�by�workers�relate�to�storms�and�water�scarcity�during�the�dry�season:
“Drought�and�thunderstorms�are�the�main�hazards�in�this�area.�Especially�during�drought�periods,�we�suffer�from�scarcity�of�water.�During�the�rainy�season,�water�is�not�an�issue�for�us.�But�natural�water�springs�dry�out�due�to�drought.�On�those�days�we�have�to�go�to�the�river�to�get�water�which�is�far�away�(3.5�km)�from�the�place�where�we�live.�Absence�of�a�permanent�water�line�or�water�source�is�a�major�issue�that�affects�us�due�to�drought.” — Lahiru,�Watchman,�April�2021
Although�workers�are�well�aware�of�the�potential�for�landslides�in�the�surround-ing�highland�areas,�they�express�a�confidence�borne�of�insulating�local�factors�and�perceived�risks�elsewhere.�As�the�deputy�manager�of�the�estate�outlined:
“I�think�landslide�risks�are�somewhat�low�in�this�tea�plantation�when�comparing�the�other�hilly�areas�of�Sri�Lanka.�Because�old�tea�plantations�can�combine�the�soil�stability�with�their�roots.” — Chathura,�Deputy�Manager,�April�2021
Similarly,�as�a�watchman�on�the�estate�argued:
5.3
“The company focus is profit. Therefore, the company does not take necessary action immediately.”
A�woman�preparing�to�pick�tea�for�export�to�the�UK�and�other�markets.
8584

“The�[nearby]�Nuwara�Eliya�area�has�steep�mountains�and�people�are�cultivating�in�those�hills.�That�may�be�a�reason�for�the�landslides.�In�past�times,�those�are-as�were�mountain�forests,�but�now�people�cut�down�the�forest�and�do�planta-tions.�As�a�result,�the�Nuwara�Eliya�area�has�frequent�landslide�events.” — Lahiru,�Watchman,�April�2021
Despite�this�confidence,�though,�locals�are�aware�of�soil�slips�and�slope�failures�–�potential�warning�signs�of�landslides�–�occurring�in�the�local�area.�As�one�fieldworker�stated,�“I�have�never�experienced�a�landslide�while�working�at�the�Dickwella�Estate.�Here,�I�have�seen�[only]�a�few�small-scale�soil�slips�in�rainy�seasons.” — Tharushi,�Fieldworker,�April�2021.�As�the�deputy�estate�manager�continued:
“Within�my�working�period�of�13�years,�I�have�not�heard�about�a�landslide�in�a�near-by�location.�However,�some�slope�failures�were�reported�in�the�Hali-ela�town�area�[2km�away�from�the�estate].” — Chathura,�Deputy�Manager,�April�2021
Amidst�this�sense�of�security,�however,�the�primary�caveat�expressed�by�work-ers�was�the�lack�of�commitment�to�safety,�hazard�mitigation�and�compensation�for�environmental�risk.�In�particular,�the�transition�from�public�ownership�to�private�since�1992�has�resulted�in�substantial�changes�to�operating�practices.200�Services�previ-ously�offered�to�workers�have�been�scaled�back�in�terms�of�both�size�and�efficien-cy,�a�phenomenon�widely�observed�by�workers�themselves,�especially�in�relation�to�environmental�management:
“The�company�focus�is�profit.�Therefore,�the�company�does�not�take�necessary�action�immediately.�But�they�are�providing�some�mitigation�actions�to�preserve�the�environment�such�as�soil�conservation�strategies,�drainage�maintenance,�etc … Currently,�[though,]�these�estates�are�managing�by�private�companies.�They�are�giving�priority�to�maximising�profit.�As�a�result�of�that,�some�sort�of�delays�may�happen�from�the�estate�side�during�compensation�and�mitigation�works.” — Lahi-ru,�Watchman,�April�2021
As�testimonies�from�the�Dickwella�estate�demonstrate,�therefore,�living�within�a�high-risk�landslide�area�is�not�an�issue�of�pressing�concern�for�tea�plantation�work-ers.�Residents�recognise�the�importance�of�local�factors�in�shaping�the�likelihood�of�landslides�and�believe�the�context�of�their�work�to�be�sufficiently�safe�to�avoid�a�major�disaster.�Whilst�this�is�by�means�a�guaran-tee�of�safety�–�indeed,�the�residents�of�the�Meeri-yabadda�estate�where�37�people�were�killed�in�2014�recall�that�they�were�themselves�confident�due�to�the�lack�of�recent�landslides�in�the�area�–�it�does�nevertheless�point�to�the�importance�of�infrastructure�in�the�local�perception�of�risk.With�the�Dickwella�estate�having�transitioned�
to�private�ownership�only�relatively�recently,�investment�in�maintenance�of�the�estate�has�only�recently�begun�to�decline,�leaving�the�majority�of�the�estate’s�facilities�and�residential�infrastructure�in�good�condition�and�endowing�residents�with�a�certain�degree�of�confidence�in�their�ability�to�withstand�the�effects�of�an�increasingly�capri-
cious�climate.�As�outlined�in�the�next�case,�that�of�Loolkandura�Estate,�however,�a�longer�decline�in�maintenance�produces�a�very�different�outlook.
5.3.2 The Loolkandura EstateThe�Loolkandura�Estate�was�the�first�tea�plantation�estate�in�Sri�Lanka,�having�been�founded�in�1867�by�Scotsman�James�Taylor.�Yet�despite�operating�continuously�for�more�than�a�century�and�a�half,�recent�years�have�seen�the�area�categorised�as�increasingly�susceptible�to�landslide�risk.�In�2006,�a�landslide�occurred�in�the�Upper�Gonawa�area,�roughly�700�–�800m�away�from�the�workers’�residential�settlement.�Following�a�number�of�soil�slips�in�recent�times,�the�government�has�declared�the�area�highly�susceptible�to�landslides�due�to�its�steep�slopes�and�increasingly�high�intensity�rainfall�and�declared�that�residents�should�move�away.Nevertheless,�with�houses�yet�to�be�constructed�on�the�resettlement�sites,�the�
majority�of�the�residents�remain�in�place,�despite�a�widespread�awareness�of�the�dangers�they�face.�Residents�explained�that�“the�government�has�warned�us�that�in�the�near�future,�our�houses�will�be�affected�by�landslides”��— Shehan,�Retired�Perma-nent�Labourer,�April�2021.�As�a�supervisor�at�the�estate�admitted,�“yes,�our�laborers�are�at�higher�risk�of�landslide.�In�particular,�Upper�Gonawa�division�people�are�at�high�risk.�They�are�experiencing�landslide�signals” — Ishara,�supervisor,�April�2021.�Indeed,�some�on�the�estate�already�have�direct�experience�of�these�events:
“Yes,�I�have�experienced�it.�There�was�a�landslide�event�in�2006.�That�did�not�hap-pen�within�our�settlement,�but�it�happened�800m�away…That�was�a�heavy�rainy�day.�Our�settlements�were�located�at�the�top�of�the�mountain.�Suddenly�small�soil�portions�dropped�from�the�lower�part�of�the�mountain.�Then�a�huge�soil�portion�moved�downwards.�Nobody�was�injured�from�the�landslide,�but�our�houses�were�damaged…�I�saw�the�landslide�while�working�on�the�other�slope�of�the�moun-tain.” — Buddhika,�Farmer�and�Former�Permanent�Worker,�April�2021
Although�workers�now�are�keen�to�move�away�from�the�dangers�of�the�estate,�Loolkandura�is�a�well-established�community�whose�residents�often�go�back�several�generations.�As�those�longstanding�residents�explain,�this�is�an�area�that�has�under-gone�substantial�environmental�change�in�recent�decades,�in�order�to�give�rise�to�the�current�high�level�of�landslide�risk.�One�worker�explained�that�‘I�was�born�here.�However,�now�the�exposure�to�the�environmental�hazards�has�increased�in�this�area” — She-han,�Retired�Permanent�Labourer,�April�2021.�Another,�similarly,�commented�that:
“I�was�born�in�the�Loolkandura�tea�estate.�Now�our�settlement’s�risk�is�higher�because�of�the�possibility�of�landslides.�There�was�no�environmental�risk�when�I�was�young.�But�now�it�has�changed�totally.�We�have�many�signs�of�an�upcoming�landslide,�so�we�know�it�will�happen�soon.�Our�settlement�is�located�in�a�very�risky�area�when�compared�with�the�other�areas�of�the�country” — Buddhika,�Farmer�and�Former�Permanent�Worker,�April�2021
Nevertheless,�although�residents�of�the�estate�widely�noted�the�changing�envi-ronmental�profile�of�the�area,�they�were�keen�also�to�note�the�role�of�degrading�res-idential�infrastructure�in�intensifying�this�risk.�As�heavy�rain�and�strong�winds�have�become�more�frequent,�they�have�progressively�degraded�the�structural�stability�of�
“Now we are living without any future hopes. Because we are expecting future landslides which will destroy everything if we do not move away.”
8786

tea�workers’�housing.�Large�cracks�have�appeared�in�the�walls�of�many�houses�and�roofs�are�increasingly�vulnerable�to�the�effects�of�storms.�One�retired�worker�explained�that:
“Loolkandura�tea�estate�is�my�original�and�current�home.�Environmental�risk�on�the�estate�has�increased�compared�with�my�younger�days.�We�did�not�experience�this�much�risk�of�windstorms�when�we�were�young,�because�the�walls�of�the�house�were�not�cracked�at�that�time … Our�houses’�roofs�are�not�in�good�condition�now.�Furthermore,�we�have�a�huge�landslide�risk�now.�The�size�of�the�wall�cracks�increases�on�every�day�of�heavy�rain.�Further,�we�notice�cracks�in�our�lands�when�heavy�rains�occur.�So�now�we�are�at�high�risk.” — Cha-thura,�Retired�Permanent�Worker,�April�2021
As�such,�there�is�a�strong�sense�in�Loolkandura�that�the�effects�of�their�changing�environment�are�accumulating�in�the�infrastructure�they�depend�on�to�protect�them,�heightening�the�risk�of�disaster�with�every�new�hazard�they�face.�One�worker�explained,�for�example,�that�“I�have�not�lost�any�property�due�to�landslides,�but�our�houses�have�been�cracked.�Those�cracks�occurred�during�the�previous�landslide�event�[and]�the�size�of�the�cracks�increases�when�heavy�rains�occur.” — Shehan,�Retired�Permanent�Labourer,�April�2021.�In�a�similar�vein,�a�second�local�resident�bemoand�that�‘all�of�our�houses�were�partially�damaged�by�the�land-slide.�Now,�all�of�the�walls�of�the�house�have�been�cracked�because�of�[it�and]�the�size�of�the�cracks�is�increasing�day�by�day�with�the�rains” — Buddhika,�Farmer�and�Former�Permanent�Worker,�April�2021.�A�third�worker�articulated�the�implications�of�this�cumulative�damage�for�the�environmental�risks�they�face:
“There�were�no�injuries�because�of�the�[previous]�landslide,�but�we�are�anticipating�huge�damage�if�a�landslide�occurs�again.�We�desperately�need�[the�company’s]�support,�as�we�are�not�able�to�build�new�houses�on�our�own.�If�a�landslide�happens,�it�will�cause�huge�damage.�Then�we�will�lose�our�lives�and�properties.” — Chathura,�Retired�Permanent�Worker,�April�2021
Despite�the�clear�danger�presented�by�unsafe�housing,�however,�a�key�issue�fac-ing�Loolkandura�residents�is�the�difficult�in�repairing�heavily�damaged�houses.�Roofs,�frequently�needing�repair�following�increasingly�intense�storms�in�the�area,�sit�atop�walls�too�cracked�to�climb�in�order�to�access�them.�One�worker�outlined�how�this�
instigated�a�viscous�cycle�of�degrading�infrastructure,�wherein�“damages�and�the�risk�of�windstorms�have�been�exacerbated�by�the�nearby�landslide�incident�that�had�occurred�in�2006 … [so�that] … we�cannot�repair�our�houses�because�of�the�cracks�in�the�walls” — Nethmi,�Day�Labourer,�April�2021.�Indeed,�this�was�a�story�repeated�again�and�again�by�Loolkandura�residents,�who�bemoaned�that:
“We�need�to�repair�our�houses�in�the�rainy�season,�but�now�our�houses�are�not�in�a�good�state�due�to�the�previous�landslide.�All�of�the�houses�are�attached�in�a�row,�[so]�if�one�gets�damaged,�then�it�affects�the�other�houses�also.�Nobody�is�willing�to�climb�the�roof�to�repair�[it]�because�the�walls�are�weak,�but�we�somehow�replace�the�metal�roof�sheets�when�they�get�damaged�by�windstorms.” — Bud-dhika,�Farmer�and�Former�Permanent�Worker,�April�2021
Many�workers�had�a�bleak�outlook�on�their�future�prospects:
“The�landslide�happened�away�from�this�settlement,�but�it�has�caused�severe�damage�to�the�houses.�So,�now�the�walls�have�been�cracked�and�those�cracks�have�decreased�the�strength�of�the�house�walls.�We�cannot�repair�our�roofs�even,�because�nobody�can�work�on�the�roof�with�confidence�as�the�walls�are�weak.�Now�we�are�living�without�any�future�hopes.�Because�we�are�expecting�future�landslides�which�will�destroy�everything�if�we�do�not�move�away�from�this�area.” — Nethmi,�Day�Labourer,�April�2021
Faced�with�what�they�view�as�the�inevitability�of�a�catastrophic�landslide�event�in�their�immediate�vicinity,�residents�of�Loolkandura�above�all�expressed�disappointment�and�frustration�at�the�lack�of�support�they�are�receiving�from�the�management�of�the�estate.�Key�to�their�grievance�is�the�fact�that,�despite�doing�everything�they�can�to�mitigate�their�exposure�to�forthcoming�disasters,�their�capacity�to�meaningfully�reduce�their�own�risk�is�limited.�The�structural�factors�they�recognise�as�crucial�to�mitigating�disaster�risk�–�such�as�adequately�maintaining�existing�housing,�or�providing�alternative�living�sites�–�are�beyond�their�own�control.�As�workers�outlined:�“we�have�requested�to�get�new�lands�and�houses,�but�nobody�supports�us.�We�are�not�able�to�build�our�own�houses�by�obtaining�new�lands,�so�we�are�living�with�risk” — Shehan,�Retired�Permanent�Labourer,�April�2021.�As�a�second�worker�continued:
“They�should�support�us�as�workers�of�the�estate.�We�work�for�them.�If�we�get�their�support,�we�can�get�rid�of�the�higher�risk�of�the�windstorm�and�landslide.�If�we�move�to�a�safe�location�and�construct�houses�with�walls�[that�can]�resist�strong�winds�our�risk�level�will�be�low.�But�now�our�exposure�level�is�very�high.�I�do�not�have�any�hope�for�our�lives�because�of�the�environmental�risk” — Buddhika,�Farmer�and�Former�Permanent�Worker,�April�2021
Frustratingly�for�workers,�the�ability�to�reduce�this�risk�remains�strictly�in�the�purview�of�corporate�actors�whose�apparent�disinterest�in�doing�so�appears�both�illogical�and�callous�to�the�residents�themselves.�Indeed,�as�residents�complained,�if�and�when�a�disaster�does�occur,�“then�they�need�to�spend�more�money�[than�pre-venting�it].�If�we�get�impacted,�they�will�have�to�wait�until�recovering�our�damages�to�restart�estate�operations…�
“The landslide happened away from this settlement, but it has caused severe damage to the houses. Now the walls have been cracked and those cracks have decreased the strength of the house walls. We cannot repair our roofs even, because nobody can work on the roof with confidence as the walls are weak.”
The�cracked�wall�of�a�tea�plantation�worker’s�house.�Many�houses�are�now�so�weakened�by�landslides�that�they�are�impossible�to�repair.
8988

We�are�at�high�risk,�so�they�need�to�take�necessary�actions�on�mitigation�before�severe�disaster�losses” — Chathura,�Retired�Permanent�Worker,�April�2021.�As�the�same,�retired�worker�continued:
“We�look�for�their�support,�because�now�we�are�living�in�the�estate.�If�we�expe-rience�any�damage,�then�it�will�affect�the�tea�estate.�We�are�facing�severe�envi-ronmental�risks.�If�they�did�not�take�any�action�to�mitigate�our�risk,�it�will�cause�severe�damage.�So,�the�company�should�support�mitigating�the�risk�before�a�huge�disaster�[occurs].” — Chathura,�Retired�Permanent�Worker,�April�2021
At�the�same�time,�these�practical�arguments�were�underpinned�by�a�moral�log-ic.�As�workers�argued,�“we�are�providing�our�services�for�them.�The�estate�contin-ues�functioning�because�of�our�people,�so�they�should�not�abandon�us�in�a�difficult�time” — Buddhika,�Farmer�and�Former�Permanent�Worke,�April�2021.�Similarly,�as�a�day�labourer�concluded:�“I�think�they�should�support�us.�We�cannot�buy�land�and�build�a�house�[on�our�own�and]�we�are�their�only�workers.�They�will�not�have�people�to�work�in�the�estate�if�we�are�dead” — Nethmi,�Day�Labourer,�April�2021.In�highlighting�the�importance�of�corporate�governance�in�shaping�tea�workers’�
exposure�to�disaster�risk,�Loolkandura�estate�workers�articulate�a�clear�understand-ing�of�the�intersection�of�environmental�and�economic�factors�in�shaping�the�terms�of�landslide�risk�in�their�area.�Whilst�disaster�has�yet�to�strike�in�earnest�in�Loolkandura,�the�case�of�the�Meeriyabadda�estate�landslide�in�2014�highlights�how�high�the�cost�of�such�corporate�inaction�may�ultimately�come�to�be.
5.3.3 Meeriyabadda Tea EstateOn�the�29th�of�October�2014,�a�massive�landslide�occurred�in�the�Haldummulla�Divi-sional�Secretariat�in�the�Sri�Lankan�highlands’�Badulla�district.�The�affected�site�was�an�identified�landslide-prone�area,�located�in�a�tea�estate�known�as�Meeriyabedda�Watta�in�Koslanda.�The�landslide�was�triggered�by�monsoon�rains�and�extended�to�around�3�kilometers�in�length.�As�a�direct�result,�37�people�were�found�dead�or�missing,�70�houses�were�destroyed�completely,�whilst�over�275�individuals�were�left�homeless.�The�Government�of�Sri�Lanka�initiated�a�relocation�program�for�the�victims�and�con-structed�75�housing�units�at�Makaldeniya�estate.�However,�vulnerable�communities�still�remain�in�the�Meeriyabadda�division,�with�no�action�having�been�taken�to�move�those�communities�to�a�safer�area.�Meeriyabadda’s�remaining�community�therefore�remains�highly�exposed�to�the�future�landslides.Workers�who�survived�the�incident�recall�the�event�as�a�sudden,�catastrophic�col-
lapse�in�the�early�morning,�which�left�large�parts�of�the�area�buried�under�mud�and�rubble�within�minutes.�Even�those�who�did�not�lose�family�members�are�able�to�recall�near�misses,�with�workers’�aid�being�a�crucial�factor�in�the�number�of�lives�that�were�saved.�Many,�however,�were�not�so�lucky.�As�one�survivor�of�the�landslide�recalled:
“That�was�the�darkest�day�for�me.�The�landslide�happened�early�in�the�morning.�The�time�was�around�6.30 AM.�I�was�cooking.�I�have�two�children.�One�child�was�working�in�Colombo.�She�was�not�in�the�home.�My�younger�son�was�sleeping.�My�husband�was�working�on�our�farm.�Those�were�heavy,�rainy�days.�So,�we�noticed�severe�cracks�on�the�road.�We�noticed�those�cracks�the�evening�before�the�day�of�the�landslide.�Then�we�heard�a�huge�sound�in�the�early�morning�of�the�landslide�day.�My�husband�told�us�to�pay�attention�to�the�top�of�the�mountain.�Afterwards,�he�went�to�the�neighbours’�houses�to�inform�them�about�the�incident.�After�5�minutes,�the�whole�mountain�collapsed.�We�were�shouting�to�my�husband�and�other�neighbours.�Then�we�ran�to�the�other�side�of�the�mountain.�My�husband�was�affected�by�the�landslide,�but�he�was�not�injured.�He�was�covered�with�soil�up�to�his�hip,�but�neighbours�helped�to�get�him�out.” — Sanduni,�Former�Seasonal�Worker,�April�2021
Despite�the�unexpected�nature�of�the�landslide�itself�though,�which�occurred�in�the�early�morning�whilst�most�workers�were�still�at�home,�witnesses�to�the�event�recall�warning�signs�in�the�run-up�to�the�disaster.�One�worker�explained�that�“we�received�early�warnings�before�the�landslide�disaster�[itself].�Those�were�heavy�rainy�days.�We�had�a�channel�near�to�our�houses�and�we�noticed�very�darkly�coloured�water�was�flowing�along�the�channel” — Roshan,�Driver,�April�2021.�As�a�plantation�supervisor�at�the�time�of�the�disaster�elaborated:
“I saw soil and rocks were coming down, then the entire mountain came down with huge soil portions. It was like a sea wave. Everything had gone within 3 minutes.”
A�tea�plantation�worker�holds�a�scale�for�weighing�tea.�The�tea�industry�is�already�being�hit�hard�by�Sri�Lanka’s�changing�climate.
9190

“The�previous�three�days�were�rainy.�We�noticed�cracks�in�the�road�but�those�were�small�cracks … The�day�before�the�landslide,�the�waterways�had�changed�to�a�very�thick,�dark�coloured�water.�We�did�not�care�because�it�was�a�rainy�day.�We�never�noticed�that�much�dark�coloured�water�in�the�waterway.” — Hashan,�Supervisor,�April�2021
Although�workers�did�not�connect�these�warning�signs�to�the�possibility�of�a�major�landslide,�the�recent�government�warning�over�landslide�risk�was�enough�to�ensure�that�a�number�of�them�did�report�these�signs�to�the�company.�Workers�explained�that�they�“communicated�our�observations�to�the�plantation�administration,�but�they�did�not�take�it�seriously” — Hashan,�Supervisor,�April�2021.�Moreover,�as�a�second�worker�explained:
“In�the�early�morning�of�the�landslide�day,�we�noticed�the�road�had�cracks�[in�it].�So,�we�informed�the�plantation�administration�about�the�issue.�Then�they�responded�to�us�that�it�was�not�a�big�issue�and�to�report�to�work.�We�were�getting�ready�to�work�when�I�heard�a�huge�sound.�Then�I�came�out�of�the�house�and�looked�up.�I�noticed�something�was�happening�on�top�of�the�mountain.�So,�I�called�to�my�neigh-bours.�Then�I�saw�soil�and�rocks�were�coming�down,�then�the�entire�mountain�came�down�with�huge�soil�portions.�It�was�like�a�sea�wave.�Everything�had�gone�within�3�minutes.�Fortunately,�a�small�soil�portion�came�down�our�side,�which�stopped�near�to�our�house.�My�cattle�farm�and�[crop]�farm�were�destroyed,�but�neither�my�wife�nor�I�got�into�any�trouble�as�a�result�of�that.” — Roshan,�Driver,�April�2021
As�these�testimonies�demonstrate,�workers�recall�making�multiple�reports�to�the�plantation�management�in�the�immediate�leadup�to�the�landslide,�with�no�action�being�taken�in�response.�Nevertheless,�whilst�the�early�morning�timing�of�the�land-slide�left�limited�response�time�–�as�one�worker�put�it,�“they�didn’t�have�much�time�to�act�because,�after�20�minutes�of�reporting�cracks�the�incident�occurred” — Hashan,�Supervisor,�April�2021�–�the�disaster�was�shaped�by�a�longer-term�failure�to�act.�The�area�in�which�the�landslide�occurred�had�already�been�identified�by�the�government�as�unsafe�for�habitation,�with�workers�advised�to�move�away�from�the�area.�Yet,�as�in�Loolkandura�today,�a�lack�of�alternative�housing�provision�meant�that�workers�remained�in�place�despite�the�risk.�In�the�words�of�one�worker:
“I�had�not�experienced�any�disaster�before,�but�the�government�had�informed�us�to�move�away�from�this�place.�They�had�identified�this�area�as�a�landslide�risk-prone�area.�But�we�did�not�take�the�warning�seriously,�so�we�did�not�make�any�attempt�to�move�away�from�there.�I�had�never�heard�about�these�kinds�of�incidents�even�in�nearby�locations.�We�had�no�experience�related�to�landslides.�
The�government�had�issued�a�warning�before�the�landslide�incident,�[but]�we�did�not�have�an�idea�about�the�extent�of�the�expected�landslide.�In�addition�to�that,�we�did�not�have�any�option�to�move�from�Meeriyabadda,�as�we�were�living�in�the�estate�owned�houses.�We�did�not�have�alternative�lands�to�settle�on,�or�any�income�to�afford�to�rent�a�home�or�pay�for�transport�if�we�settled�away�from�the�estate.�So,�we�lived�there�with�the�risk.” — Hashan,�Supervisor,�April�2021
Beyond�the�limited�response�to�the�concerns�raised�by�workers�in�the�immediate�lead-up�to�the�landslide,�this�longer-term�inaction�in�response�to�government�warn-ings�is�viewed�by�workers�as�a�placing�significant�proportion�of�responsibility�for�the�disaster�on�the�plantation�administration.�Workers�argue�that�the�company�ignored�multiple�warnings�and�had�a�number�of�opportunities�to�respond�appropriately�to�the�impending�hazard,�yet�failed�to�do�so,�with�catastrophic�consequences:
“We�got�an�early�warning�of�the�landslide�incident�three�days�beforehand.�The�plantation�administration�has�been�aware�of�the�pre-incidents,�but�they�did�not�take�any�action�over�it.�Approximately�37�people�lost�their�lives.�All�of�them�were�labourers.�Their�houses�and�their�farms�were�destroyed.�In�my�neighbour’s�house,�only�a�child�survived.�His�father,�mother,�grandfather,�and�sister�all�died�due�to�the�landslide.” — Hashan,�Supervisor,�April�2021
Similarly,�as�a�second�worker�explained:
“The�company�had�not�done�anything�to�mitigate�the�landslide�in�advance.�We�had�informed�them�about�the�early�warning�signs�of�landslides,�but�they�did�not�take�any�action�over�it.�The�government�had�informed�[them]�about�this�possibil-ity�a�few�months�before,�but�the�plantation�administration�did�not�take�any�action�over�that.�We�were�informed�to�leave�the�area�by�the�government,�but�the�estate�did�not�provide�any�land�or�settlements�for�us.�The�company�needs�to�be�partial-ly�responsible�for�the�damage.�They�had�been�aware�of�this�issue�[in�advance].�They�could�have�attempted�to�provide�new�lands�to�settle�the�people�who�were�living�in�the�landslide�risk�area,�but�they�did�not�take�any�responsibility�for�that.�If�they�had�taken�responsibility�for�that,�we�could�have�moved�away�from�that�area�before�the�landslide.” — Roshan,�Former�Driver,�April�2021
As�these�stories�make�clear,�the�lack�of�provision�for�relocation�by�the�compa-ny�administration�for�dominate�recriminations�over�the�incident.�Yet�there�is�also�an�associated�sense�that�the�risks�faced�by�the�local�population�was�underplayed�by�the�company�administration,�that�“people�had�not�no�idea�about�the�extent�of�the�risk” — Dinesh,�Former�Permanent�Worker,�April�2021.�
“They had been aware of this issue in advance. They could have attempted to provide new lands to settle the people who were living in the landslide risk area, but they did not take any responsibility.”
9392

Workers�on�the�plantation�were�lulled�into�a�false�sense�of�security,�rather�than�being�helped�to�move,�as�recommended�by�the�government.�As�those�affected�explain,�this�led�directly�to�the�huge�loss�of�life�faced�by�those�working�on�the�plantation:
“They�did�not�explain�about�the�risk�of�the�landslide.�I�think�even�they�did�not�know�the�real�risk�of�the�landslide.�If�they�provided�a�good�place�to�[move�to],�my�son�would�still�be�alive,�with�us.�They�needed�to�take�responsibility�for�that.�They�had�a�lot�of�free�lands,�but�they�did�not�make�that�lands�available�for�us.” — Ranga,�Former�Permanent�Worker,�April�2021
Above�all,�the�testimonies�of�those�who�survived�the�Meeriyabadda�landslide�evi-dence�a�key�message�over�safety�in�the�tea�industry:�the�disaster�was�by�no�means�inevitable.�Both�government�and�company�officials�were�aware�of�the�issue�in�the�leadup�to�the�landslide,�but�chose�not�to�action,�leading�to�the�deaths�of�37�peo-ple,�as�well�as�a�huge�loss�of�property�and�livelihoods�for�others.�Yet�this�sentiment,�repeatedly�espoused�by�Meeriyabadda’s�former�residents,�points�to�a�wider�truth�about�the�nature�of�disaster.�As�climate�change�continues�to�increase�exposure�to�natural�hazards�such�as�the�strong�winds�and�heavy�rains�that�ultimately�triggered�this�and�other�landslides,�the�circumstances�within�which�work�takes�place�play�a�major�role�in�structuring�their�manifestation.�Whether�or�not�a�hazard�becomes�a�dis-aster�therefore�depends�to�a�great�extent�on�the�terms�of�work�in�which�it�manifests.As�a�tea�plantation�producing�crops�for�the�British�market,�the�disaster�at�Meeriya-
badda�was�one�connected�to�British�consumers�by�the�mechanism�of�trade.�Dickwel-la�and�Loolkandura,�similarly,�are�British�companies,�wherein�the�conditions�of�work�shape�the�climatic�risks�faced�by�workers.�As�accounts�from�Loolkandura�in�particular�make�clear,�these�conditions�are�playing�a�major�role�in�intensifying�the�impacts�of�the�changing�climate,�rendering�the�likelihood�that�everyday�hazards�manifest�in�a�future�disaster�substantially�more�likely.�The�disaster�footprint�of�British�trade,�in�Sri�Lanka�as�elsewhere,�plays�an�observ-
able�role�in�intensifying�these�climatic�hazards,�shaping�and�directing�the�impacts�of�the�changing�climate�on�multiple�fronts.�Indeed,�despite�its�relatively�low�contri-bution�to�carbon�emissions,�as�a�result�of�the�low�carbon�intensity�of�tea�production,�the�significant�contribution�to�climate�change�impacts�necessitates�tea’s�recognition�as�product�whose�overall�environmental�footprint�is�substantial.�By�increasing�the�population�of�high-risk�areas�whilst�failing�to�renovate�degrading�housing�and�pro-tective�infrastructure,�tea�plantations�producing�for�the�UK�market�play�a�major�role�in�raising�disaster�risk�in�Sri�Lanka,�placing�workers�in�the�supply�chain�at�substantial�and�increasing�risk.
By increasing the population of high-risk areas whilst failing to renovate degrading housing and protective infrastructure, tea plantations producing for the UK market play a major role in raising disaster risk in Sri Lanka, placing workers in the supply chain at substantial and increasing risk.
A�tea�plantation�worker�rests�after�a�day�of�work.�Behind�her,�red�mud�is�revealed�after�a�recent�landslip.
9594

The UK’s disaster footprint Almost half of the UK’s emissions are now imported. Yet measurement and regulation of overseas emissions and environmental impacts is less stringent than it is domestically. At the same time, UK trade is intensifying the impact of natural hazards linked to climate change: a dual impact that demands closer attention to the UK’s full disaster footprint.
Part 6
96 9796

A disaster footprint for UK trade: prospects, pitfalls and proposals Neither�climate�change,�nor�its�impacts�are�domestic�issues,�yet�we�continue�to�view�both�through�a�national�lens.�Our�economy�is�both�global�and�hugely�influential�over�the�natural�world.�The�vast�network�of�processes�and�interconnections�that�make�up�the�global�economy�not�only�underpin�and�distribute�the�production�of�carbon,�but�shape�its�impacts�also,�distributing�processes�of�production�–�and�the�environ-mental�impacts�that�go�with�them�–�to�places�far�from�where�those�goods�are�ulti-mately�used.�The�goal�of�this�project�has�been�both�to�exemplify�the�complexity�of�the�processes�that�shape�environmental�change�–�and�in�doing�so,�to�highlight�the�ill�fit�of�the�national�accounting�mechanisms�used�to�measure�it�–�but�also�to�raise�the�question�of�responsibility.�How�environmental�degradation�is�measured�and�how�its�costs�are�attributed�and�managed�are�two�elements�within�the�same�equation.�By�drawing�on�three�distinct�cases�of�the�trade-environment�nexus,�Disaster�Trade�has�aimed�to�highlight�the�shortcomings�of�systems�of�governance�which�implement�domestic�environmental�standards,�whilst�neglecting�to�regulate�global�systems�of�trade.�In�pursuit�of�a�new�approach,�each�of�the�investigations�here�explored�distinct�dimensions�of�this�issue.The�first�case�examined�here�concerns�the�rapidly�growing�phenomenon�of�brick�
importation�from�outside�the�UK.�Once�self-sufficient�in�terms�of�brick�production,�the�UK�has�since�the�great�recession�of�2008�seen�production�fall�behind�demand.�As�a�result,�the�UK�has�now�risen�to�become�the�world’s�largest�importer�of�bricks,�importing�more�than�400,000�in�2019.201�Moreover,�these�bricks�are�coming�from�further�and�further�afield.�Bricks�imported�from�outside�the�EU�increased�more�than�tenfold�in�the�five�years�between�2015�and�2019,�from�3,088,902�to�32,942,280:�a�low�value,�high�weight�trade�that�generates�carbon�on�an�enormous�scale.�Produced�in�largely�unregulated�kilns�and�shipped�thousands�of�miles�by�boat,�a�three-kilogram�house�brick�imported�from�outside�the�EU�has�a�carbon�cost�three�times�higher�than�one�produced�domestically.�Worse�still,�they�carry�with�them�a�legacy�of�local�envi-ronmental�destruction�and�human�exploitation�on�a�scale�that�the�UK�has�long�since�eliminated�domestically,�yet�on�which�the�goods�we�consume�continue�to�depend.In�the�second�case,�that�of�Cambodia,�the�aim�is�to�highlight�the�role�of�the�country�
within�a�wider�process�of�trade�and�environmental�destruction.�A�garment�labelled�‘Made�in�Cambodia’�tells�only�a�small�part�of�a�far�larger,�global�story.�Cambodia�has�no�cotton�fields,�it�neither�produces,�nor�processes�the�raw�materials�which�comprise�its�clothes.�Rather,�these�materials�have�come�in�many�cases�from�as�far�away�as�the�United�States,�Ivory�Coast�or�Brazil.�In�large�part,�those�materials�come�from�China:�a�country�whose�status�as�‘the�world’s�factory’202�has�come�at�a�heavy�environmental�
cost.203�With�China�now�committed�to�net�zero�in�the�next�four�decades,�many�of�these�high�emission�and�environmentally�damaging�processes�are�being�moved�to�countries�with�a�net�carbon�budget�remaining.�Just�as�the�UK�did�before�it,�China�is�therefore�beginning�to�outsource�emissions�and�environmental�degradation,�moving�a�problem�in�such�a�way�that�–�through�a�national�accounting�lens�–�it�appears�to�be�solving.The�third�and�final�investigation�of�this�study�explores�the�production�of�Ceylon�
tea�in�Sri�Lanka’s�central�highlands.�Long�a�central�pillar�of�the�Sri�Lankan�economy,�the�tea�trade�has�suffered�in�recent�years,�as�the�impacts�of�climate�change�increase�costs�and�reduce�yields.�Tea�plantations�have�begun�to�decline�in�response,�yet�as�land�use�in�the�highlands�changes,�the�impacts�of�climate�change�are�further�inten-sified.�Former�tea�plantations�are�now�a�major�risk�factor�for�the�growing�problem�of�landslides:�an�economically�destructive�and�lethal�phenomenon,�closely�associ-ated�with�a�declining�trade�introduced�by�British�colonisers�and�still�enjoyed�daily�in�British�homes.Although�each�of�these�cases�focuses�upon�a�distinct�commodity�and�geograph-
ical�area,�they�serve�in�combination�to�demonstrate�a�wider�quality�of�the�global�intersection�of�trade�and�environmental�degradation.�Simply�put,�the�environmental�regulations�that�appear�in�a�domestic�sense�to�resolve�issues�of�environmental�deg-radation�frequently�do�not�in�fact�result�in�their�amelioration�or�cessation,�but�rath-er�induce�the�mobility�of�environmental�bads�across�borders�and�beyond�the�reach�of�predominantly�nationally�focused�regulations.�The�result�of�this�‘outsourcing’�of�environmental�impacts�along�supply�chains�is�that�environmental�impacts�reflect�the�channels�of�economic�and�physical�goods�through�which�they�influenced�and�direct-ed,�rather�than�the�sites�in�which�they�are�consumed.�Economic�and�environmental�processes�therefore�become�spatially�intertwined,�mutually�shaping�the�geography�of�each�other’s�impacts.This�mobilisation�of�environmental�processes�takes�multiple�forms.�At�its�most�
basic�level,�this�might�refer�simply�to�the�transportation�of�waste�material�across�international�borders,�a�phenomenon�increasingly�noted�in�recent�years�as�interna-tional�waste�shipments�have�increased�substantially,�almost�doubling�in�the�EU�since�2001.204�Yet�the�aim�here�has�been�to�highlight�a�more�complex�and�environmentally�destructive�reality.�First,�that�it�is�not�only�waste�that�is�traded�across�borders,�but�environmental�degradation�itself,�as�polluting�industrial�processes�are�‘outsourced’205�from�heavily�regulated�nations�to�ones�where�environmental�strictures�are�less�strin-gent.�Crucially,�this�applies�not�only�to�local�pollutants,�but�also�to�carbon�emissions,�which�are�hidden�by�the�complexity�of�the�supply�chains�within�which�they�are�emit-ted.�With�international�transport�emissions,�in�particular,�tending�to�fall�outside�of�the�purview�of�regulation,�the�result�is�a�vast�source�of�carbon�emissions�hidden�amidst�the�movement�of�international�trade.The�complex�mobility�of�our�globalised�world�therefore�serves�to�obscure�key�
processes�driving�global�climate�change.�Yet�there�is�a�further�element�at�play�also.�As�rising�atmospheric�carbon�concentrations�increase�the�risk�of�extreme�weather�and�natural�hazards,�processes�of�international�trade�shape,�direct�and�intensify�its�impacts.�Indeed,�as�is�increasingly�recognised,�the�impacts�of�disasters�are�neither�random,�nor�natural,�but�articulated�by�the�socioeconomic�circumstances�within�which�they�manifest.206�Carbon�emissions�may�therefore�increase�the�likelihood�of�a�
Neither climate change, nor its impacts are domestic issues, yet we continue to view both through a national lens.
6.1
9998

given�hazard�–�floods,�or�heavy�rain,�for�example�–�but�whether�that�hazard�becomes�a�disaster�in�which�lives�are�lost�or�displaced,�and�homes�and�livelihoods�destroyed,�depends�upon�the�conditions�it�finds.�Thus,�it�is�these�elements�in combination�that�constitutes�the�full�disaster�footprint�of�international�trade.The�deforested�landscapes�of�Cambodia�thus�become,�in�statistical�terms,�mag-
nets�for�droughts�instigated�in�a�wider�sense�by�climate-linked�ENSO�abnormalities.�In�the�‘brick�belt’�of�Bangladesh�and�India,�excavated�paddy�fields�in�the�vicinity�of�sand�dredged�rivers,�shaped�by�bricks�produced�for�UK�consumers,�become�focal�points�of�vulnerability�to�flooding,�whilst�pollution�and�environmental�degradation�render�adaptation�more�challenging�for�those�affect-ed.�In�the�Sri�Lankan�highlands,�similarly,�heavy�rains�linked�to�climate�change�present�a�far�greater�risk�to�those�lands�reformed�for�tea�production�than�others�around�them,�thereby�directing�and�channelling�the�risk�of�landslides�towards�those�tasked�with�producing�the�beverage�for�British�breakfast�tables.�Disaster�risk,�viewed�thus,�is�therefore�the�price�paid�by�the�UK’s�trading�partners�in�return�for�the�economic�benefits�of�export.�As�the�emission�concealed�by�trade�continue�to�render�extreme�weather�more�likely,�local�economic�processes�direct�the�impacts�of�climate�change�through�trade�networks,�towards�the�producers�of�products�consumed�in�the�UK.This�is�not,�moreover,�a�case�of�one-off�displacement,�but�a�mobile�process�within�
which�environmental�degradation�may�be�moved�through�trade�from�one�site�to�anoth-er.�As�regulation�in�Bangladesh�has�limited�the�extent�of�brick�exports,�for�example,�brick�production�for�the�UK�market�has�expanded�elsewhere�to�compensate,�carrying�its�environmental�impacts�with�it.�India,�in�in�response,�has�been�a�key�recipient�of�the�brick�trade�diminished�in�Bangladesh,�intensifying�the�impacts�of�climate�change�in�the�vicinity�of�the�industry�and�expanding�the�Indian�labour�force�involved�in�the�wider�process�of�UK�construction.�Cambodia,�similarly,�presents�a�clear�example�of�the�dynamic�global�trade�in�environmental�destruction�and�disaster�risk.�With�Chi-nese�manufacturing�having�instigated�both�rapid�economic�growth�and�widespread�environmental�destruction,�Chinese�economic�development�is�increasingly�taking�the�form�of�displacing�low�value�economic�processes�beyond�national�borders�into�emerging�global�Southern�economies�like�Cambodia.Having�experienced�rapid�growth�in�a�garment�sector�focused�on�intermediary�
processing,�Cambodia�has�been�both�economic�beneficiary�and�environmental�loser�of�this�transition,�as�dirty�and�destructive�processes�accompany�the�arrival�of�a�bur-geoning�industry�whose�profitability�and�international�appeal�is�underpinned�by�laxity�and�loopholes�in�environmental�management.�Yet�economic�benefit�is�by�no�means�the�inevitable�accompaniment�to�trade-linked�environmental�damage,�as�highlighted�in�the�Sri�Lankan�case,�where�an�opposite�process�is�underway.�As�climate�change�increasingly�undermines�the�economics�of�the�tea�industry,�competition�from�pro-ducers�in�India,�China�and�Kenya�has�seen�a�transitioning�away�from�tea�cropping,�further�undermining�soil�stability�already�weakened�by�the�tea�industry�and�height-ening�the�risk�of�landslides�still�further.�The�Sri�Lankan�economy�is�losing,�rather�than�gaining�from�this�transition,�yet�the�relationship�between�international�trade�and�the�articulation�of�climate�change�impacts�are�equally�clear.As�these�examples�show,�the�true�footprint�of�global�trade�must�account�both�for�
its�role�in�promulgating�changes�to�the�climate�via�the�production�–�and�concealment�–�of�emissions,�but�also�in�directing�and�mobilising�the�impacts�of�these�changes.�Climate�change�impacts�are,�viewed�thus,�economically�articulated,�mobile�trans-boundary�flows,�dynamically�linked�to�the�shifts�in�the�global�economy.�Yet�despite�growing�evidence�of�this�economic-environmental�intersection,�climate�change�and�its�impacts�continue�to�be�treated�overwhelmingly�in�both�static�and�domestic�terms,�hampering�efforts�to�assess,�mitigate�and�adapt�to�the�impacts�of�the�changing�climate.�This�project�has�aimed�not�only�to�highlight�what�is�missed�through�our�prevailingly�
domestic�conception�of�emissions�and�environmental�impacts,�but�also�the�poten-tial�for�a�new�formulation,�capable�of�recognising�how�environmental�processes�are�channelled�through�and�influenced�by�economic�ones.�Achieving�this�is�complex.�It�requires,�overarchingly,�a�shift�in�emphasis�across�multiple�sectors�of�governance�and�corporate�practice,�yet�before�this�may�be�achieved�it�requires�a�renovation�of�the�manner�in�which�environmental�impacts�and�policies�are�conceptualised.�Rather�than�the�nationally�focused�container�thinking�that�has�tended�to�characterise�envi-ronmental�policy,�we�therefore�advocate�for�the�formulation�of�a�disaster�footprint�that�is�freed�from�these�conceptual�constraints�in�order�to�connect�the�dislocated�policy�spheres�of�adaptation,�mitigation�and�corporate�governance.�In�constructing�this�footprint,�it�is�necessary�to�connect�policy�and�scholarship�in�four�dislocated�spheres,�joining�the�dots�of�mitigation,�adaptation�and�accounting�in�order�to�reshape�climate�change�policy�for�an�increasingly�globalised�and�interconnected�world.
Recommendation 1: Accounting for emissionsThe�ongoing�dominance�of�domestic�carbon�emissions�accounting�presents�a�key�issue�for�climate�governance.�Nevertheless,�although�advocated�against�on�a�num-ber�of�fronts�in�recent�years,207�it�remains�a�difficult�point�to�address�both�because�national�responsibility�for�environmental�impacts�is�enshrined�in�all�major�environmen-tal�treaties,�from�Paris�to�Kyoto,208�but�also�because�it�tends�to�portray�major�global�economies�in�a�positive�light,�lending�it�support�amongst�influential�political�actors.�The�UK’s�success�in�reducing�domestic�carbon�emissions�by�44%�since�1990�is�a�key�case�in�point.�Viewed�in�terms�of�what�is�consumed�–�rather�than�produced�–�within�UK�borders,�carbon�emissions�have�declined�by�at�most�15%.209�Yet�without�a�clear�motivation�to�transition�to�a�footprint�approach,210�the�uptake�of�consumption-based�and�embodied�emissions�accounting�remains�limited.Despite�this�problem�of�incentive,�it�is�a�key�priority�that�carbon�accounting�tran-
sitions�to�supply�chain-led�model�of�emissions�regulation.�This�is�because�as�things�stand,�legal�environmental�standards�effectively�apply�only�to�domestically�produced�products,�whilst�imported�and�supply�chain�emissions�are�subject�to�voluntary�cor-porate�standards.211�In�practice,�this�has�the�effect�of�pushing�environmental�issues�away,�rather�than�resolving�them,�resulting�is�a�global�circulation�of�environmental�issues�and�carbon�emissions�that�extends�and�deepens�environmental�destruction�rather�than�resolving�it.�In�order�to�halt�this�process�of�burden-shifting,�‘major�econ-omies�must�recognize�that�even�strong�regulation�on�domestic�emissions�in�major�economies�may�not�be�effective�in�reducing�total�global�emissions�due�to�their�import-ed�carbon�footprint’.212 Indeed,�as�shown�in�the�cases�explored�here,�the�incentive�created�by�domestic�carbon�regulations�may�mean�that�they�are�not�only�ineffectual,�but�actively�antithetical�to�the�goals�of�the�laws�in�which�they�feature.�Rather�than�encouraging�a�reduction�in�emissions,�the�domestic�framing�instead�encourages�‘out-
The incentive created by domestic carbon regulations may mean that they are not only ineffectual, but actively antithetical to the goals of the laws in which they feature.
101100

sourcing’213�emissions�overseas.�Scholars�and�practitioners�are�increasingly�aware�of�this�issue,�raising�–�as�also�evidenced�here�–�the�capacity�of�this�framing�to�conceal�domestic�emissions.
Recommendation 2: Coordination of policyThe�recent�announcement�of�the�UK’s�sixth�carbon�budget�in�April�2021,�saw�the�UK�commit�to�reducing�net�carbon�emissions�by�78%�compared�to�1990�levels.�This�doc-ument�includes�targets�which�have�been�lauded�in�many�quarters�as�ambitious,�most�notably�in�relation�to�the�incorporation�of�international�aviation�and�shipping�emis-sions.�As�the�UK�government�itself�claims,�this�commitment�‘sets�in�law�the�world’s�most�ambitious�climate�change�target’.214
Nevertheless,�if�these�emissions�are�to�be�meaningfully�eliminated,�rather�than�simply�moved,�coordination�of�government�policy�is�key.�Central�to�ameliorating�this�broader�issue�is�understanding�how�responsibility�for�complex,�international�supply�chains�and�their�impacts�is�disaggregated�between�government�departments.�As�exemplified�in�the�UK�government�Environmental�Reporting�guidelines,215�domestic�environmental�management,�waste�and�sustainability�are�managed�by�The�Depart-ment�for�Environment,�Food�and�Rural�Affairs�[DEFRA],�whilst�carbon�accounting�and�supply�chain�emissions�fall�under�the�remit�of�the�Department�for�Business,�Energy�and�Industrial�Strategy�[BEIS].�Adaptation�to�climate�change�impacts�domestically�is�overseen�by�DEFRA�in�partnership�with�the�Environment�Agency,�amongst�others,�whilst�adaptation�overseas�is�the�remit�of�the�Foreign,�Commonwealth�and�Devel-opment�Office�[FCDO].This�range�of�actors�involved�in�the�management�
of�UK�climate�change�reflects�the�breadth�and�scale�of�the�issue.�Yet�the�distinct�approaches�to�govern-ance�practiced�by�each�agency�introduces�issues�of�competing�and�sometimes�counterproductive�incen-tives.�Whereas�domestic�environmental�regulations�are�stringently�monitored,�and�domestic�carbon�accounting�mandated,�supply�chain�environmental�impacts�and�emissions�are�subject�only�to�voluntary�reporting.�In�some�respects,�this�reflects�the�con-trasting�remits�of�DEFRA�–�responsible�squarely�for�domestic�environmental�man-agement�–�and�BEIS�–�whose�dual�responsibility�for�both�‘business’�and�‘industrial�strategy’�that�incentivises�a�lighter�tough�on�regulation.�Nevertheless,�the�ultimate�result�is�to�incentivise�offshoring�of�emissions�and�industrial�environmental�impacts,�a�process�demonstrated�throughout�this�report.In�contributing�to�the�intensity�of�climate�change�impacts�overseas,�therefore,�
strict�domestic�industrial�regulations�set�out�by�DEFRA,�combined�with�somewhat�looser�international�guidelines�set�out�by�BEIS,�effectively�undermine�the�sustainable�development�and�adaptation�goals�overseen�by�the�FCDO.�This�is�not�only�environ-mentally�damaging,�but�fiscally�inefficient.�Yet�in�a�positive�sense,�the�coordination�of�government�objectives�and�budgets�has�the�potential�not�only�to�deliver�meaningful�improvements�in�the�sustainability�of�UK�business,�but�to�do�so�without�additional�investment�of�government�funding.UK�government�agencies�related�to�industry,�development�and�climate�finance�
must�be�encouraged�to�work�collaboratively,�rather�than�discretely,�in�order�that�their�
goals�complement�each�other�rather�than�working�against�one�another.�First,�further�co-ordination�of�regulation�between�DEFRA�and�BEIS�–�including�more�stringent�supply�chain�monitoring�intended�to�match�the�regulation�set�out�by�DEFRA�–�will�attend�to�reducing�the�incentive�to�offshore�emissions.�Second,�co-ordination�of�BEIS�supply�chain�regulation�with�FCDO�development�and�adaptation�goals�is�needed,�in�order�to�ensure�that�British�business�overseas�does�not�contribute�to�undermining�FCDO�funded�adaptation�and�sustainable�development�programs�in�the�global�South.
Recommendation 3: Definition of supply chainsIn�the�context�of�our�increasingly�interconnected�glob-al�economy,�a�key�issue�facing�both�carbon�emission�mitigation�and�climate�change�adaptation�efforts�is�the�difficulty�of�delineating�the�true�extent�of�the�supply�chains�contributing�to�the�production�of�UK�goods.�As�things�stand,�companies�are�given�the�freedom�to�define�their�own�supply�chain,�both�for�their�(voluntary)�emission�reporting�obligations�and�for�the�purposes�of�any�commercial�claims�made�concerning�waste,�recycling�and�environmental�impacts.As�outlined�in�this�report,�however,�particularly�in�relation�to�the�case�of�Cambo-
dian�garment�exports�to�the�UK,�this�self-definition�of�supply�chains�presents�sig-nificant�problems�in�terms�of�emissions�reporting.�Neither�buyers�themselves,�nor�intermediary�firms�along�the�supply�chain,�are�incentivised�by�this�system�to�discern�the�complex�processes�that�supply�them,�resulting�in�oversimplified�supply�chains�in�which�only�primary�actors�are�represented.�The�suppliers�of�primary�materials�–�as�well�as�subsidiary�companies�undertaking�elements�of�production�processes�–�are�thereby�rendered�opaque,�allowing�companies�to�make�claims�of�‘zero-waste’�or�‘car-bon-neutral�supply�chains’�without�meaningful�oversight�over�their�accuracy.This�system�presents�three�problems.�First,�it�incentives�the�subcontracting�of�more�
environmentally�destructive�processes�to�subsidiary�operations,�beyond�the�regu-lation�of�buyers�oversight:�a�process�that�renders�supply�chains�artificially�simple�to�regulate.�Second,�it�allows�supply�chains�to�be�conceptually�shortened,�often�hiding�the�true�distances�travelled�by�raw�materials�in�the�course�of�producing�UK�goods.�Third,�it�elides�the�complexity�of�production�processes,�presenting�supply�chains�as�fundamentally�linear,�where�in�reality�they�depend�on�networks�of�industrial�producers�working�in�collaboration,�each�element�of�which�carries�its�own�environmental�impact.Given�the�announcement,�in�the�recent�sixth�carbon�budget,�that�emissions�from�
shipping�will�form�part�of�the�UK’s�net�zero�commitments,�this�failure�to�account�for�the�true�extent�of�supply�chains�and�the�systems�of�shipping�that�support�them,�pre-sents�a�significant�issue.�In�the�case�of�the�garment�industry,�current�assessments�of�the�length�of�shipping�supply�chains�–�and�thus�the�carbon�emissions�with�which�they�are�associated�–�are�significant�underestimates�and�it�is�likely�that�similar�issues�prevail�elsewhere.�Greater�regulation�and�oversight�of�the�provenance�of�raw�mate-rials�within�complex�supply�chains�is�therefore�an�essential�precondition�not�only�for�meaningful�compliance�with�the�UK’s�upcoming�carbon�commitments,�but�also�the�ability�to�monitor�the�environmental�impacts�of�UK�trade�as�a�whole.�To�be�genuinely�meaningful,�moreover,�such�monitoring�must�extend�beyond�a�reliance�on�voluntary�self-reporting�of�corporate�supply�chains.
UK government agencies related to industry, development and climate finance must be encouraged to work collaboratively, rather than discretely, in order that their goals complement each other rather than working against one another.
Corporate self-definition of supply chains presents significant problems in terms of emissions reporting.
103102

Recommendation 4: The UK’s disaster footprint and the global economyAlongside�rising�global�temperatures,�climatic�unpredictability�is�one�of�the�most�widely�observed�characteristics�of�climate�change.�Environmental�risk�is�growing�in�many�global�regions,�increasing�the�frequency�and�intensity�of�natural�hazards�lead-ing�to�disasters�such�as�floods,�droughts�and�landslides.�Evidence�of�these�global�processes�appears�most�obviously�in�the�incidence�of�sudden,�catastrophic�disas-ters,�destructive�to�life�and�property,�but�it�also�manifests�as�slower�onset�impacts.�The�growing�unpredictability�of�seasonal�rainfall�in�the�global�South,�for�example,�is�
making�subsistence�agriculture�increasingly�non-vi-able�for�many�farmers,�leading�to�loss�of�livelihoods,�accrual�of�debts�and�worsening�health�and�welfare.Yet�as�this�report�has�aimed�to�demonstrate,�the�
impacts�of�this�unpredictability�are�far�from�random.�As�highlighted�in�the�case�of�Cambodia,�Sri�Lanka�and�the�South�Asian�brick�belt,�the�contexts�within�which�climate�impacts�emerge�are�structured�in�pre-dictable�ways�by�economic�processes,�shaping�the�manifestation�of�climate�change�in�certain�areas,�so�as�to�direct�and�intensify�its�impacts.�Understanding�
climate�impacts�in�this�context�therefore�requires�a�monitoring�framework�capable�of�extending�beyond�geographical�boundaries,�in�order�to�better�reflect�the�mobile�processes�of�trade�shaping�environmental�change�in�the�global�South.Whether�this�takes�the�form�of�local�resource�depletion,�such�as�water�or�forest�
wood;�or�local�environmental�degradation�in�the�form�of�water�or�airborne�pollutants,�the�impact�on�health�and�livelihoods�compromises�the�adaptive�capacity�of�those�affected,�intensifying�the�impacts�of�the�changing�climate�where�they�are�felt.�These�local�environmental�impacts�worsen�the�impacts�of�climate�change�in�the�vicinity�of�production�processes,�shaping�a�geography�of�climatic�precarity�in�which�large�scale�climatic�and�local�economic�factors�combine�to�generate�an�intensified�geography�of�climate�change�impacts.On�the�one�hand,�global�supply�chains�shape�economic�conditions,�contribut-
ing�to�economic�precarity�that�impedes�efforts�to�adapt.�On�the�other,�they�impact�also�on�local�environmental�conditions�in�longer�–�and�shorter-term�ways,�shaping�the�conditions�through�which�climate�change�is�‘articulated’�by�local�circumstances.�Those�subject�to�this�kind�of�complex�climate�risk�face�high�levels�of�exposure�to�climatic�hazards,�low�levels�of�capital�to�adapt�and�high�levels�of�risk�intensification�engendered�by�local�environmental�degradation�linked�to�supply�chains�extending�beyond�the�local�area.�That�these�supply�chains�are�often�linked�to�global�Northern�consumers�presents�both�responsibility�and�opportunity:�the�necessity�to�act,�but�also�the�ability�to�do�so.
Local environmental impacts worsen the impacts of climate change in the vicinity of production processes, shaping a geography of climatic precarity in which large scale climatic and local economic factors combine to generate an intensified geography of climate change impacts.
105104

Adger,�W.�N.,�de�Campos,�R.�S.,�Codjoe,�S.�N.�A.,�Siddiqui,�T.,�Hazra,�S.,�Das,�S.,�…�&�Abu,�M.�(2021).�Perceived�environmental�risks�and�insecurity�reduce�future�migration�intentions�in�hazardous�migration�source�areas.�One�Earth,�4(1),�146-157.Afionis,�S.,�Sakai,�M.,�Scott,�K.,�Barrett,�J.,�&�Gouldson,�A.�(2017).�Con-
sumption‐based�carbon�accounting:�does�it�have�a�future?.�Wiley�Inter-disciplinary�Reviews:�Climate�Change,�8(1),�1-19.Albert,�E.�and�Xu,�B.�(2016).�China’s�Environmental�Crisis.�Council�on�
Foreign�Relations�backgrounder.�Accessed�on�06/07/2021�at�[https://cfr.org]Andersen,�O.,�Gössling,�S.,�Simonsen,�M.,�Walnum,�H.�J.,�Peeters,�P.,�&�
Neiberger,�C.�(2010).�CO2�emissions�from�the�transport�of�China’s�export-ed�goods.�Energy�Policy,�38(10),�5790-5798.Anti-Slavery�International.�(2017).�Slavery�in�India’s�Brick�Kilns�and�
the�Payment�System:�Way�Forward�in�the�Fight�for�Fair�Wages,�Decent�Work�and�the�Eradication�of�Slavery.�London:�Anti-Slavery�International.Asia�Development�Bank�[ADB].�(2018).�Cambodia:�Energy�Sector�
Assessment,�Strategy,�and�Roadmap.�Manila:�ADB.Asia�Development�Bank�[ADB].�(2020).�Projecting�Industrial�Pollution�
in�the�Greater�Mekong�Subregion.�Manila:�ADB.Asia�Development�Bank�[ADB].�(2020).�Climate�Risk�Country�Profile:�
Sri�Lanka.�Manila:�ADB.Athukorala,�P.�C.,�Ginting,�E.,�Hill,�H.,�&�Kumar,�U.�(Eds.).�(2017).�The�
Sri�Lankan�Economy:�Charting�a�New�Course.�Manila:�Asian�Development�Bank.Baird,�I.�G.,�&�Fox,�J.�(2015).�How�land�concessions�affect�places�else-
where:�Telecoupling,�political�ecology,�and�large-scale�plantations�in�southern�Laos�and�northeastern�Cambodia.�Land,�4(2),�436-453.Bandara,�R.�M.�S.,�&�Weerasinghe,�K.�M.�(2013).�Overview�of�landslide�
risk�reduction�studies�in�Sri�Lanka.�In�Margottini,�C.,�Canuti,�P.�and�Sassa,�K.�(eds).�Landslide�Science�and�Practice.�Berlin,�Heidelberg:�Springer,�345-352.Bangladesh�Department�of�Environment.�(2017).�National�Strategy�
for�Sustainable�Brick�Production�in�Bangladesh.�Dhaka:�Department�of�Environment.Baumert,�N.,�Kander,�A.,�Jiborn,�M.,�Kulionis,�V.,�&�Nielsen,�T.�(2019).�
Global�outsourcing�of�carbon�emissions�1995–2009:�A�reassessment.�Environmental�Science�&�Policy,�92,�228-236.BBC�News�(02/09/2014).�Why�India’s�brick�kiln�workers�‘live�like�slaves’.�
By�Humphrey�HawksleyBBC�News�(14/02/2014).�Tea�Industry’s�Future�Depends�on�Corporate�
Collaboration.�By�Richard�Anderson.BBC�News�(1/11/2021).�Sri�Lanka�landslide:�38�feared�dead�as�death�
toll�revised�down.Becqué,�R.,�Dubsky,�E.,�Hamza-Goodacre,�D.,�and�Lewis,�M.�(2018).�
Europe’s�Carbon�Loophole.�San�Francisco:�Climate�Works�Foundation.Ben-David,�I.,�Jang,�Y.,�Kleimeier,�S.,�&�Viehs,�M.�(2018).�Exporting�
pollution:�Where�do�multinational�firms�emit�CO2?�Economic�Policy.�DOI:�https://doi.org/10.1093/epolic/eiab009.Bhojvaid,�V.�(2021).�Hazy�clouds:�Making�black�carbon�visible�in�climate�
science.�Journal�of�Material�Culture,�1-16.�DOI:�10.1177/1359183521994864.Biswas,�D.,�Gurley,�E.�S.,�Rutherford,�S.,�&�Luby,�S.�P.�(2018).�The�drivers�
and�impacts�of�selling�soil�for�brick�making�in�Bangladesh.�Environmental�Management,�62(4),�792-802.Blakey,�J.�(2021).�Accounting�for�elephants:�The�(post)�politics�of�car-
bon�omissions.�Geoforum,�121,�1-11.Bond,�T.�C.,�Doherty,�S.�J.,�Fahey,�D.�W.,�Forster,�P.�M.,�Berntsen,�T.,�
DeAngelo,�B.�J.,�…�&�Zender,�C.�S.�(2013).�Bounding�the�role�of�black�car-bon�in�the�climate�system:�A�scientific�assessment.�Journal�of�geophysical�
research:�Atmospheres,�118(11),�5380-5552.Boyd,�D.�S.,�Jackson,�B.,�Wardlaw,�J.,�Foody,�G.�M.,�Marsh,�S.,�&�Bales,�
K.�(2018).�Slavery�from�space:�Demonstrating�the�role�for�satellite�remote�sensing�to�inform�evidence-based�action�related�to�UN�SDG�number�8.�ISPRS�journal�of�photogrammetry�and�remote�sensing,�142,�380-388.Brick�Development�Association�[BDA]�(2017).�UK�Brick�Makers�are�Fail-
ing�to�Make�Demand.�The�Construction�Index.�Accessed�on�04/11/2019�at�[http:/theconstructionindex.co.uk]Brickell,�K.,�Parsons,�L.,�Natarajan,�N.,�&�Chann,�S.�(2018).�Blood�bricks:�
Untold�stories�of�modern�slavery�and�climate�change�from�Cambodia.�London:�Royal�Holloway,�University�of�London.Broadhead,�J.,�&�Izquierdo,�R.�(2010).�Assessment�of�land�use,�for-
est�policy�and�governance�in�Cambodia.�Bangkok:�Food�and�Agricultural�Organization,�Regional�Office�for�Asia�and�the�Pacific.Brown,�D.,�Boyd,�D.�S.,�Brickell,�K.,�Ives,�C.�D.,�Natarajan,�N.,�&�Parsons,�
L.�(2021).�Modern�slavery,�environmental�degradation�and�climate�change:�fisheries,�field,�forests�and�factories.�Environment�and�Planning�E:�Nature�and�Space,�4(2),�191-207.Caro,�F.,�Lane,�L.,�&�Saez�de�Tejada�Cuenca,�A.�(2021).�Can�brands�
claim�ignorance?�Unauthorized�subcontracting�in�apparel�supply�chains.�Management�Science,�67(4),�2010-2028.Central�Bank�of�Sri�Lanka.�(2009).�Statistical�Appendix.�Accessed�on�
28/12/2020�at�[https://www.cbsl.gov.lk]Central�Bank�of�Sri�Lanka.�(2019).�Statistical�Appendix.�Accessed�on�
28/12/2020�at�[https://www.cbsl.gov.lk]Charpail,�M.�(2017).�The�fashion�industry�is�the�second�largest�polluter�
in�the�world.�Sustain�your�Style.�Accessed�on�11/02/2021�at�[https://www.sustainyourstyle.org]Climate�Action�Tracker�(2021).�Climate�Action�Tracker.�Accessed�on�
05/07/2021�at�[https://climateactiontracker.org/]Climate�and�Clean�Air�Coalition.�(2019).�Climate�and�Clean�Air�Coali-
tion�to�Reduce�Short-Lived�Climate�Pollutants:�Bangladesh�Brick�Sector�Roadmap�2019-2030.�Accessed�on�06/07/2021�at�[https://www.ccaco-alition.org/].Climate�and�Clean�Air�Coalition.�(2020).�Bricks:�Mitigating�black�carbon�
and�other�pollutants�from�brick�production.�Accessed�on�05/07/2021�at�[https://www.ccacoalition.org/].Climate�Investment�Fund�(2020).�From�Carbon�to�Competition:�Cambo-
dia’s�Transition�to�a�Clean�Energy�Development�Pathway.�Phnom�Penh:�CIF.Climate�Prediction�Centre� (2021).�El�Niño�–�Southern�Oscillation�
(ENSO).�Accessed�on�05/07/2021�at�[https://www.cpc.ncep.noaa.gov/]Committee�on�Climate�Change�[CCC]�(2019).�Reducing�UK�emissions�
2019:�Progress�Report�to�Parliament.�London:�CCC.co2levels.org�(2021).�Atmospheric�CO2�Levels�Graph.�Accessed�on�
05/07/21�at�[http://�co2levels.org]Crang,�P.,�Brickell,�K.,�Parsons,�L.,�Natarajan,�N.,�Cristofoletti,�T.,�&�Gra-
ham,�N.�(2020).�Discardscapes�of�fashion:�commodity�biography,�patch�geographies,�and�preconsumer�garment�waste�in�Cambodia.�Social�&�Cultural�Geography,�1-20.�DOI:�https://doi.org/10.1080/14649365.2020.1777322.Cullen,�B.�(2020).�Constellations�of�weathering:�following�the�meteor-
ological�mobilities�of�Bangla�bricks.�Mobilities,�15(6),�862-879.Davies,�T.�C.�(1996).�Landslide�research�in�Kenya.�Journal�of�African�
Earth�Sciences,�23(4),�541-545.Department�for�Environment,�Food�and�Rural�Affairs�[Defra]�(2017).�The�
UK’s�Carbon�Footprint�1997-2016.�Accessed�on�02/12/2019�at�[https://assets.publishing.service.gov.uk]Department�for�Environment,�Food�and�Rural�Affairs�[Defra]�(2018).�Clean�Air�Strategy�2018.�Accessed�on�05/07/2021�at�[https://assets.publishing.
References
service.gov.uk]Department�for�Environment,�Food�and�Rural�Affairs�[Defra]�(2019).�
Measuring�and�reporting�environmental�impacts:�guidance�for�business-es.�Accessed�on�05/07/2021�at�[https://assets.publishing.service.gov.uk]Dehm,�J.�(2016).�Carbon�Colonialism�or�Climate�Justice:�Interrogat-
ing�the�International�Climate�Regime�from�a�TWAIL�Perspective.�Windsor�Yearbook�of�Access�to�Justice.,�33(3),�129-161.Dhaka�Tribune�(27/03/2019).�Brick�Kilns�Destroy�Fertile�Topsoil�in�Chit-
tagong.�By�Anwar�HussainEil,�A.,�Li,�J.,�Baral,�P.,�&�Saikawa,�E.�(2020).�Dirty�stacks,�high�stakes:�
An�overview�of�brick�sector�in�South�Asia.�Washington:�World�Bank.Environment�Agency,�The.�(2020).�The�state�of�our�waters:�the�facts.�By�
James�Bevan.�Accessed�on�05/05/2021�at�[http://environmentagency.org]Environmental�Audit�Committee�(2019).�Fixing�fashion:�clothing�con-
sumption�and�sustainability.�London:�House�of�Commons.Ercelawn,�A.,�&�Nauman,�M.�(2004).�Unfree�labour�in�South�Asia:�Debt�
bondage�at�brick�kilns�in�Pakistan.�Economic�and�Political�Weekly,�2235-2242.Eurostat�(2020).�Waste�shipment�statistics.�Accessed�on�06/07/2021�
at�[https://ec.europa.eu/eurostat/]Fashion�Revolution�(2017).�The�Revival�of�Cotton�Weaving�in�Takeo�
Province,�Cambodia.�Accessed�on�05/07/2021�at�[https//fashionrevo-lution.org]Fashion�United�(2021).�Global�Fashion�Industry�Statistics.�Accessed�
on�03/04/2021�at�[http://fashionunited.com]Fezzinga,�P.,�Borghesi,�S.�and�Caro,�D.�(2019).�Revising�Emission�
Responsibilities�through�Consumption-Based�Accounting:�A�European�and�Post-Brexit�Perspective.�Sustainability�11(488),�1-13.Food�and�Agriculture�Organisation�[FAO].�(2018).�Committee�on�Com-
modity�Problems:�Intergovernmental�Group�on�Tea,�23rd�Session.�Hang-zhou,�the�People’s�Republic�of�China,�17-20�May�2018.�Current�Market�Situation�and�Medium-Term�Outlook.�Accessed�on�06/07/2021�at�[http://fao.org].Friis,�C.,�&�Nielsen,�J.�Ø.�(Eds.).�(2019).�Telecoupling:�Exploring�land-use�
change�in�a�globalised�world.�Berlin:�Springer.GIZ�(Deutsche�Gesellschaft�für�Internationale�Zusammenarbeit�(2021).�
Waste�Streams�Mapping:�Pathways�from�Key�Suppliers�to�Landfill.�Phnom�Penh:�GIZ.Global�Agricultural�Information�Network�[GAIN].�(2019).�China�Cotton�
and�Product�Annual.�Accessed�on�01/09/2020�at�[http://apps.fas.usda.gov]Government�of�India�National�Sample�Survey�Office�Ministry�of�Sta-
tistics�&�Programme�(2008).�Employment�and�Unemployment�Situation�in�India�2007-08.�New�Delhi:�Government�of�India.Griscom,�B.,�D.�Ganz,�N.�Virgilio,�F.�Price,�J.�Hayward,�R.�Cortez,�G.�
Dodge,�J.�Hurd,�F.�L.�Lowenstein,�B.�Stanley.�(2009).�The�Hidden�Frontier�of�Forest�Degradation:�A�Review�of�the�Science,�Policy�and�Practice�of�Reducing�Degradation�Emissions.�Arlington:�The�Nature�Conservancy.Guardian,�The�(28/05/2017).�Floods�and�landslides�in�Sri�Lanka�kill�at�
least�150�people.�From�Reuters�in�Agalawatte.Guardian,�The�(20/09/2019).�This�isn’t�extinction,�it’s�extermination:�the�
people�killing�nature�know�what�they’re�doing.�By�Jeff�Sparrow.Gunarathna,�B.�W.�G.�I.�D.,�Jayasinghe,�A.�B.,�Abenayake,�C.�C.,�&�
Mahanama,�P.�K.�S.�(2018).�Assessing�the�impact�of�land�use�on�trigger-ing�Landslides:�A�case�of�Sabaragamuwa�Province,�Sri�Lanka.�Bhumi,�The�Planning�Research�Journal,�6(2),�15-28.Gunathilaka,�R.�D.,�Smart,�J.�C.,�&�Fleming,�C.�M.�(2017).�The�impact�
of�changing�climate�on�perennial�crops:�the�case�of�tea�production�in�Sri�Lanka.�Climatic�Change,�140(3-4),�577-592.
Hacisalihoglu,�S.,�Gumus,�S.,�&�Kezik,�U.�(2018).�Land�Use�Conversion�Effects�Triggered�by�Tea�Plantation�on�Landslide�Occurrence�and�Soil�Loss�in�Northeastern�Anatolia,�Turkey.�Feb-Frenenius�Environmental�Bulletin,�27(5),�2933-2942.Her�Majesty’s�Revenue�and�Customs�[HMRC].�(2020).�UK�Brick�Import�
Data.�Private�Communication�via�the�Brick�Development�Association.HM�Government�(2019).�Environmental�Reporting�Guidelines:�Including�
streamlined�energy�and�carbon�reporting�guidance.�London:�HM�Gov-ernment.HM�Government�(20/04/2021).�UK�enshrines�new�target�in�law�to�slash�
emissions�by�78%�by�2035.�Press�Release.�Accessed�on�06/07/2021�at�[https://www.gov.uk/].Hewawasam,�T.�(2010).�Effect�of�land�use�in�the�upper�Mahaweli�catch-
ment�area�on�erosion,�landslides�and�siltation�in�hydropower�reservoirs�of�Sri�Lanka.�Journal�of�the�National�Science�Foundation�of�Sri�Lanka,�38(1),�3-14.House�of�Commons�Energy�and�Climate�Change�Committee�(2012).�
Consumption-Based�Emissions�Reporting.�Twelfth�Report�of�Session�2010–12,�Volume�I.�London:�House�of�Commons.Hossain,�M.�A.,�Zahid,�A.�M.,�Arifunnahar,�M.,�&�Siddique,�M.�N.�A.�
(2019).�Effect�of�brick�kiln�on�arable�land�degradation,�environmental�pol-lution�and�consequences�on�livelihood�of�Bangladesh.�Journal�of�Science,�Technology�and�Environment�Informatics,�6(02),�474-488.Human�Rights�Watch�[HRW]�(2017).�Tracing�the�Thread:�The�Need�for�
Supply�Chain�Transparency�in�the�Garment�and�Footwear�Industry.�New�York:�Human�Rights�Watch.Human�Rights�Watch�[HRW]�(2020).�Cambodia:�Joint�Open�Letter�to�
Foreign�Governments.�Accessed�on�05/07/2020�at�[http://www.hrw.org].Independent,�The�(05/11/2019).�‘Untold�human�suffering’:�11,000�sci-
entists�from�across�world�unite�to�declare�global�climate�emergency.�By�Phoebe�WestonIndependent,�The.�(23/04/2020).�UK�Government�Urged�to�Ban�Import�
of�Chinese�Cotton�Made�Using�Uighur�Muslim�Forced�Labour.�By�Adam�Withnall.International�Institute�for�Sustainable�Development�[IISD].�(2019).�
Global�Market�Report:�Tea.�Accessed�on�06/07/2021�at�[https://www.iisd.org].International�Labour�Organisation�[ILO].�(2014).�Health�Hazards�of�Child�
Labour�in�Brick�Kilns�of�Bangladesh.�Geneva:�ILO.International�Transport�Federation�[ITF]�(2021).�International�Transport�
Outlook�2021.�Paris:�OECD.Intergovernmental�Panel�on�Climate�Change�[IPCC].�Global�Warming�
of�1.5°�C:�An�IPCC�Special�Report�on�the�Impacts�of�Global�Warming�of�1.5°�C�Above�Pre-industrial�Levels�and�Related�Global�Greenhouse�Gas�Emission�Pathways,�in�the�Context�of�Strengthening�the�Global�Response�to�the�Threat�of�Climate�Change,�Sustainable�Development,�and�Efforts�to�Eradicate�Poverty.�Geneva:�IPCCIslam,�S.�N.,�&�Winkel,�J.�(2017).�Climate�change�and�social�inequal-
ity�DESA�working�paper�no.�152.�UN,�Department�of�Economic�&�Social�Affairs.�Accessed�on:�[www.un.org/esa/desa/papers/2017/wp152_2017.�Pdf]Jayathilaka,�D.�M.�S.�C.�D.�M.�and�Hennayake,�N.�(2018).�Social�Con-
struction�of�Landslides:�The�Case�of�Aranayake-Political�Ecological�Glances�in�Sri�Lanka.�International�Journal�of�Science�and�Research,�8(7),�439-444.Jayathilake,�D.,�&�Munasinghe,�D.�(2015).�Quantitative�landslide�risk�
assessment�and�mapping.�In�National�building�Research�Organization�symposium:�Innovation�for�Resilient�Environment,�December�2015,�Sri�Lanka.�Accessed�on�06/07/2021�at�[http://nbro.gov.lk/]
106106 107

Jayasinghe,�S.�L.,�Kumar,�L.,�&�Hasan,�M.�K.�(2020).�Relationship�between�environmental�covariates�and�Ceylon�tea�cultivation�in�Sri�Lanka.�Agron-omy,�10(4),�476,�1-15.Kelman,�I.�(2020).�Disaster�by�choice:�How�our�actions�turn�natural�
hazards�into�catastrophes.�Oxford:�Oxford�University�Press.Ken,�S.,�Sasaki,�N.,�Entani,�T.,�Ma,�H.�O.,�Thuch,�P.,�&�Tsusaka,�T.�W.�
(2020).�Assessment�of�the�local�perceptions�on�the�drivers�of�deforesta-tion�and�forest�degradation,�agents�of�drivers,�and�appropriate�activities�in�Cambodia.�Sustainability,�12(23),�1-26.Kenis,�A.,�&�Lievens,�M.�(2017).�Imagining�the�carbon�neutral�city:�The�
(post)�politics�of�time�and�space.�Environment�and�Planning�A:�Economy�and�Space,�49(8),�1762-1778.Khmer�Times�(02/10/2018).�Mondulkiri�governor�tackles�logging.�By�
Khy�Sovuthy.Lohani,�S.,�Dilts,�T.�E.,�Weisberg,�P.�J.,�Null,�S.�E.,�&�Hogan,�Z.�S.�(2020).�
Rapidly�accelerating�deforestation�in�Cambodia’s�Mekong�River�Basin:�A�comparative�analysis�of�spatial�patterns�and�drivers.�Water,�12(8),�2191.López-Aguilar,�H.� A.,�Huerta-Reynoso,� E.� A.,�Gómez,� J.� A.,�Oli-
varez-Ramírez,�J.�M.,�Duarte-Moller,�A.,�&�Pérez-Hernández,�A.�(2016).�Life�cycle�assessment�of�regional�brick�manufacture.�Materiales�de�Con-strucción,�66(322),�1-9.Malik,�A.,�&�Lan,�J.�(2016).�The�role�of�outsourcing�in�driving�global�
carbon�emissions.�Economic�Systems�Research,�28(2),�168-182.Markkula,�J.�(2021).�Containing�mobilities:�Changing�time�and�space�
of�maritime�labor.�Focaal,�2021(89),�25-39.Mees,�H.�(2016).�China�as�the�World’s�Factory.�In�Mees,�H.�The�Chinese�
birdcage.�New�York:�Palgrave�Macmillan,�21-32.Ministry�of�Plantation�Industries�&�Export�Agriculture�(2020).�Progress�
Report�2020.�Accessed�on�06/07/2021�at�[http://plantationindustries.gov.lk/].Mishra,�D.�K.�(2020).�Seasonal�migration�and�unfree�labour�in�glo-
balising�India:�Insights�from�Field�surveys�in�Odisha.�The�Indian�Journal�of�Labour�Economics,�63(4),�1087-1106.Mishra,�P.�(2020).�Urbanisation�Through�Brick�Kilns:�The�Interrelation-
ship�Between�Appropriation�of�Nature�and�Labour�Regimes.�Urbanisation,�5(1),�17-36.Munasinghe,�M.,�Deraniyagala,�Y.,�Dassanayake,�N.,�&�Karunarathna,�
H.�(2017).�Economic,�social�and�environmental�impacts�and�overall�sus-tainability�of�the�tea�sector�in�Sri�Lanka.�Sustainable�Production�and�Con-sumption,�12,�155-169.Moore,�S.�A.,�Rosenfeld,�H.,�Nost,�E.,�Vincent,�K.,�&�Roth,�R.�E.�(2018).�
Undermining�methodological�nationalism:�Cosmopolitan�analysis�and�visualization�of�the�North�American�hazardous�waste�trade.�Environment�and�Planning�A:�Economy�and�Space,�50(8),�1558-1579.Mora,�S.�(2009).�Disasters�are�not�natural:�risk�management,�a�tool�for�
development.�Geological�Society,�London,�Engineering�Geology�Special�Publications,�22(1),�101-112.Moran,�D.,�Hasanbeigi,�A.,�&�Springer,�C.�(2018).�The�Carbon�Loophole�
in�Climate�Policy.�Quantifying�the�Embodied�Carbon�in�Traded�Products.�San�Francisco:�KGM�&�Associates,�Global�Efficiency�Intelligence,�Climate�Work�Foundations.Morgan,�J.�A.,�&�Olsen,�W.�(2015).�The�absence�of�decent�work:�The�
continued�development�of�forced�and�unfree�labour�in�India.�Global�Labour�Journal,�6(2),�173-188.Natarajan,�N.�and�Parsons,�L.�(2021).�Climate�Change�in�the�Global�
Workplace:�Labour,�Adaptation,�Resistance.�London:�Routledge.Natarajan,�N.,�Parsons,�L.,�&�Brickell,�K.�(2019).�Debt‐Bonded�Brick�
Kiln�Workers�and�their�Intent�to�Return:�Towards�a�Labour�Geography�of�Smallholder�Farming�Persistence�in�Cambodia.�Antipode,�51(5),�1581-1599.
National�Geographic�(February�2nd�2021).�Why�call�recent�disasters�‘natural’�when�they�really�aren’t?�By�Elizabeth�Kolbert.Nature�Climate�Change�Editorial�(2018).�The�Price�of�Fast�Fashion.�
Nature�Climate�Change,�8(1),�1.Nielsen,�T.,�Baumert,�N.,�Kander,�A.,�Jiborn,�M.,�&�Kulionis,�V.�(2021).�
The�risk�of�carbon�leakage�in�global�climate�agreements.�International�Environmental�Agreements:�Politics,�Law�and�Economics,�21(2),�147-163.New�York�Times�(04/09/2018).�You’ve�heard�of�Outsourced�Jobs,�but�
Outsourced�Pollution?�It’s�Real�and�Tough�to�Tally�Up.�By�Brad�Plumer.Niinimäki,�K.,�Peters,�G.,�Dahlbo,�H.,�Perry,�P.,�Rissanen,�T.,�&�Gwilt,�A.�
(2020).�The�environmental�price�of�fast�fashion.�Nature�Reviews�Earth�&�Environment,�1(4),�189-200.Office�of�National�Statistics�[ONS]�(2019).�The�Decoupling�of�Economic�
Growth�from�Carbon�Emissions:�UK�evidence.�Accessed�on�23/10/2019�at�[http://www.ons.org.uk].�Accessed�on�23/10/2019�at�[https://www.ons.gov.uk]Observatory�of�Economic�Complexity�[OEC]�(2019).�Bricks/�Brick�Trade.�
Accessed�on�29/11/2019�at�[https://oec.world]Perera,�E.�N.�C.,�Jayawardana,�D.�T.,�Jayasinghe,�P.,�&�Ranagalage,�M.�
(2019).�Landslide�vulnerability�assessment�based�on�entropy�method:�A�case�study�from�Kegalle�district,�Sri�Lanka.�Modelling�Earth�Systems�and�Environment,�5(4),�1635-1649.Peters,�G.�P.,�Minx,�J.�C.,�Weber,�C.�L.,�&�Edenhofer,�O.�(2011).�Growth�in�
emission�transfers�via�international�trade�from�1990�to�2008.�Proceedings�of�the�national�academy�of�sciences,�108(21),�8903-8908.Peters,�G.�P.,�Andrew,�R.�M.,�&�Karstensen,�J.�(2016).�Global�environ-
mental�footprints:�A�guide�to�estimating,�interpreting�and�using�con-sumption-based�accounts�of�resource�use�and�environmental�impacts.�Copenhagen:�Nordic�Council�of�Ministers.Peters,�G.,�Li,�M.,�&�Lenzen,�M.�(2021).�The�need�to�decelerate�fast�
fashion�in�a�hot�climate�–�A�global�sustainability�perspective�on�the�gar-ment�industry.�Journal�of�Cleaner�Production,�295.�DOI:�[https://doi.org/10.1016/j.jclepro.2021.126390]Pink,�R.�M.�(2016).�Cambodia:�A�Rural�Water�Crisis.�In�Pink�(ed.).�Water�
Rights�in�Southeast�Asia�and�India.�New�York:�Palgrave�Macmillan,�35-61.Prüss-Üstün,�A.,�Wolf,�J.,�Corvalán,�C.,�Bos,�R.,�&�Neira,�M.�(2016).�
Preventing�disease�through�healthy�environments:�a�global�assessment�of�the�burden�of�disease�from�environmental�risks.�Geneva:�World�Health�Organization.Rahman,�M.�A.,�Kang,�S.,�Nagabhatla,�N.,�&�Macnee,�R.�(2017).�Impacts�
of�temperature�and�rainfall�variation�on�rice�productivity�in�major�ecosys-tems�of�Bangladesh.�Agriculture�&�Food�Security,�6(1),�1-11.Rathnaweera,�A.�T.�D.,�&�Nawagamuwa,�U.�P.�(2013).�Study�of�the�
Impact�of�Rainfall�Trends�on�Landslide�Frequencies:�Sri�Lanka�Overview.�Sri�Lanka:�The�Institute�of�Engineering,�35-42.Ratnayake,�U.,�&�Herath,�S.�(2005).�Changing�rainfall�and�its�impact�
on�landslides�in�Sri�Lanka.�Journal�of�mountain�science,�2(3),�218-224.Rathore,�D.,�&�Singh,�R.�(2019).�Carbon�and�Ecological�Footprint�of�
Textile�Industry:�Application�of�R3�Strategy�to�Mitigate�the�Environmental�Effects�of�Textile�Processing�Waste.�International�Journal�of�Plant�and�Environment,�5(02),�133-136.ReliefWeb�(2019).�Sri�Lanka:�Floods�and�Landslides�–�Dec�2019.�
Accessed�on�06/07/2021�at�[https://reliefweb.int/]Reuters�(2020).�UK�to�big�brands:�do�more�to�avoid�forced�labour�in�
China’s�Xinjiang.�By�Kieran�Guilbert.Rhodes,�C.�Manufacturing:�statistics�and�policy.�Briefing�Paper�Number�
01942.�London:�House�of�Commons�Library.Royal�Government�of�Cambodia�[RGC].�(2015).�Cambodia’s�Intended�
Nationally�Determined�Contribution.�Phnom�Penh:�RGC.
Royal�Government�of�Cambodia�[RGC].�(2019).�National�Strategic�Development�Plan�2019-2023.�Phnom�Penh:�RGC.Senanyake,�K.�(1993).�Causes�and�mechanism�of�landslides�in�Sri�Lan-
ka.�In�International�Conference�on�Environmental�Management,�Geo-Wa-ter�and�Engineering�Aspects,�323-326.Solidarity�Centre�(2019).�Global�Garment�and�Textile�Industries:�Work-
ers,�Rights�and�Working�Conditions.�Accessed�on�05/07/2021�at�[https://www.solidaritycenter.org/].Sri� Lanka� Tea� Board� (2017).� Annual� Report� 2017.� Accessed� on�
06/07/2017�at�[https://www.parliament.lk/]Staal,�A.,�Flores,�B.�M.,�Aguiar,�A.�P.�D.,�Bosmans,�J.�H.,�Fetzer,�I.,�&�
Tuinenburg,�O.�A.�(2020).�Feedback�between�drought�and�deforestation�in�the�Amazon.�Environmental�Research�Letters,�15(4),�1-9.Sun,�J.,�TONG,�Y.�X.,�&�Liu,�J.�(2017).�Telecoupled�land-use�changes�
in�distant�countries.�Journal�of�Integrative�Agriculture,�16(2),�368-376.Sugathapala,�K.,�&�Prasanna,�J.�(2010).�Essential�Human�Settlement�
Planning�Considerations�for�Sustainable�Landslide�Mitigation:�With�Special�Reference�to�Padiyapelella�Landslide�Area.�Colombo,�Sri�Lanka:�National�Building�Research�Organisation.Sugawara,�J.�(2013).�Landslides�in�tea�plantation�fields�in�Shizuoka,�
Japan.�International�Journal�of�Geomate,�4(1),�495-500.Tahir,�S.�N.�A.,�&�Rafique,�M.�(2009).�Emission�of�greenhouse�gases�
(GHGs)�from�burning�of�biomass�in�brick�kilns.�Environmental�Forensics,�10(4),�265-267.Tollefson,�J.�(2018).�Global�industrial�carbon�emissions�to�reach�all-
time�high�in�2018.�Nature,�3(369),�370.Turner�and�Townsend�(2019).�International�Construction�Market�Survey�
2019.�London:�Turner�and�Townsend.Tsing,�A.�L.�(2015).�The�Mushroom�at�the�End�of�the�World.�Princeton:�
Princeton�University�Press.UNISDR.�(2019).�DesInventar�database.�Accessed�on�01/02/2021�at�
[http://www.desinventar.lk]�United�Nations�Environment�Programme�[UNEP].�(2016).�Global�materi-
al�flows�and�resource�productivity.�Assessment�report�for�the�UNEP�inter-national�resource�panel.�Nairobi:�United�Nations�Environment�Programme.United�Nations�Development�Program�[UNDP]�(2018).�Why�Care�About�
Cambodia’s�Forests?�Accessed�on�05/07/2021�at�[https://www.kh.undp.org].United�Nations�Development�Program�[UNDP].�(2019).�Human�Devel-
opment�Report:�Cambodia�2019.�Phnom�Penh:�UNDP.United�Nations�Environment�Program�[UNEP]�and�International�Energy�
Agency�[IEA].�(2017).�Towards�a�zero-emission,�efficient,�and�resilient�buildings�and�construction�sector.�Global�Status�Report�2017.�Geneva:�UNEP.United�Nations�Environment�Programme�[UNEP].�(2020).�Sustainable�
Trade�in�Resources:�Global�Material�Flows,�Circularity�and�Trade.�Nairobi:�UNEP.UN�News�(2008).�Half�of�global�population�will�live�in�cities�by�end�of�
this�year,�predicts�UN.�Accessed�on�05/07/2021�at�[http://news.un.org].Uyeturk,�C.�E.,�Huvaj,�N.,�Bayraktaroglu,�H.,�&�Huseyinpasaoglu,�M.�
(2020).�Geotechnical�characteristics�of�residual�soils�in�rainfall-triggered�landslides�in�Rize,�Turkey.�Engineering�Geology,�264,�1-15.Wahlstrand,�A.�(2015).�Landslide�scars�in�the�Kenyan�highlands:�Physi-
cal�and�chemical�topsoil�changes�and�landslide�susceptibility�assessment�under�tropical�conditions�(Doctoral�dissertation,�Department�of�Physical�Geography,�Stockholm�University).�Stockholm:�Stockholm�University.Wang,�C.,�Wang,�L.,�Liu,�X.,�Du,�C.,�Ding,�D.,�Jia,�J.,�Yan�Yan�&�Wu,�G.�
(2015).�Carbon�footprint�of�textile�throughout�its�life�cycle:�a�case�study�of�Chinese�cotton�shirts.�Journal�of�Cleaner�Production,�108,�Part�A,�464-
475.Ward,�M.�(2020).�Statistics�on�UK-EU�Trade.�Briefing�Paper�Number�
7851.�London:�House�of�Commons�Library.Wendling,�Z.�A.,�Emerson,�J.�W.,�de�Sherbinin,�A.,�Esty,�D.�C.,�et�al.�
(2020).�2020�Environmental�Performance�Index.�New�Haven,�CT:�Yale�Center�for�Environmental�Law�&�Policy.World�Bank�(2016).�International�Development�Association�Project�
Appraisal�Document�on�a�Proposed�Credit�in�the�Amount�of�SDR�10.90�Million�(US$15.0�Million�Equivalent)�to�the�Kingdom�of�Cambodia�for�a�Mekong�Integrated�Phase�3�Project.�Phnom�Penh:�World�Bank.World�Bank�(2018).�Enhancing�Opportunities�for�Clean�and�Resilient�
Growth�in�Urban�Bangladesh:�Country�Environmental�Analysis.�Wash-ington:�World�Bank.World�Bank�(23/09/2019).�How�Much�Do�Our�Wardrobes�Cost�to�the�
Environment?�Feature�Story.�Accessed�on�05/07/2021�at�[http://world-bank.org].World�Bank�Databank�(2021).�Manufacturing,�value�added�(%�of�GDP)�
–�United�Kingdom.�Accessed�on�05/07/2021�at�[https://data.worldbank.org/].World�Freight�Rates�(2021).�Freight�Calculator.�Accessed�on�06/07/2021�
at�[https://worldfreightrates.com/]World�Green�Building�Council�[WGBC]�(2019).�Bringing�embodied�car-
bon�upfront:�Coordinated�action�for�the�building�and�construction�sector�to�tackle�embodied�carbon.�London:�WGBC.World�Green�Building�Council�[WGBC]�(2021).�Principle�One:�Protect�
Health�and�Wellbeing.�Accessed�on�05/07/2021�at�[https://worldgbc.org/]World�Integrated�Trade�Solution�[WITS].�(2021).�World�Integrated�Trade�
Solution�Database.�Accessed�on�05/07/2021�at�[http://wits.worldbank.org].World�Tea�News�(26/11/2019).�China�Greatly�Expands�Black�Tea�Trade�
with�Sri�Lanka.�By�Dan�Bolton.World�Wildlife�Fund�(2020a).�Carbon�Footprint:�Exploring�the�UK’s�
contribution�to�Climate�Change.�London:�WWF.World�Wildlife�Fund�(2020b).�Deforestation�Front�–�Key�facts:�Cambo-
dia.�Accessed�on�05/07/2021�at�[https://wwf.panda.org/]WRAP�(2017).�Valuing�our�Clothes:�The�Cost�of�UK�Fashion.�Banbury:�
WRAP.Yalcin,�A.�(2007).�Environmental�impacts�of�landslides:�a�case�study�
from�East�Black�Sea�region,�Turkey.�Environmental�engineering�science,�24(6),�821-833.Young,�S.�(2019).�Protests,�Regulations,�and�Environmental�Account-
ability�in�Cambodia.�Journal�of�Current�Southeast�Asian�Affairs,�38(1),�33-54.Zenz�(2020).�Coercive�Labor�in�Xinjiang:�Labor�Transfer�and�the�Mobi-
lization�of�Ethnic�Minorities�to�Pick�Cotton.Zhang,�B.,�Bai,�S.,�Ning,�Y.,�Ding,�T.,�&�Zhang,�Y.�(2020).�Emission�
Embodied�in�International�Trade�and�Its�Responsibility�from�the�Perspec-tive�of�Global�Value�Chain:�Progress,�Trends,�and�Challenges.�Sustain-ability,�12(8),�1-26.
References
108108 109

1� �WWF,�2020a2� �ITF�Transport�Outlook,�20213� �The�Independent,�20194� �Tollefson,�20185� �co2levels.org6� �Climate�Action�Tracker,�20217� �CCC,�20198� �Climate�Action�Tracker,�20219� �Climate�Action�Tracker,�202110� �Baumert�et�al.,�2019;�Malik�and�Lan,�201611� �Moran�et�al.,�2018;�Peters�et�al.,�201612� �Dehm,�2016:�113� �Afionis�et�al.,�201714� �Moran�et�al.,�2018:�715� �Moran�et�al.,�2018:�716� �New�York�Times,�2018:�117� �Defra,�201918� �ONS,�201919� �Ward,�202020� �WWF,�2020a21� �IPCC,�2018:�1122� �Moore�et�al.,�2018:�155823� �Islam�and�Winkel,�201724� �National�Geographic,�202125� �IPCC,�201826� �New�York�Times,�201827� �Moran�et�al.,�2018:�128� �Moran�et�al.,�2018;�Peters�et�al.,�2016;�Peters�et�al.,�201129� �Dhaka�Tribune,�201930� �Friis�and�Nielsen,�2019;�Sun�et�al.,�2017;�Baird�and�Fox,�201531� �2016:�532� �UNEP,�202033� �Stern,�200434� �Markkula,�2021:�2635� �Markkula,�2021:�2836� �Tsing,�2015,�p.�22537� �Crang�et�al.,�2020:�338� �Bhojvaid,�2021:�139� �Kenis�and�Lievens,�201740� �Blakey,�2021:�841� �Solidarity�Centre,�201942� �Fashion�United,�202143� �Charpail,�201744� �Niinimäki�et�al.,�202045� �Peters�et�al.,�202146� �Peters�et�al.,�2021;�Niinimäki�et�al.,�2020;�Singh�and�Rathore,�201947� �Peters�et�al.,�202148� Human�Rights�Watch,�201749� �Nature�Climate�Change�Editorial,�201850� �World�Bank,�201951� �Nature�Climate�Change�Editorial,�2018:�152� �Human�Rights�Watch,�201753� �WITS,�202154� �The�Independent,�202055� �Zenz,�202056� �The�Independent,�202057� �GAIN�2019,�Zenz,�202058� �Stella�McCartney,�cited�in�Reuters,�202059� �GAIN,�2019
60� �Zhang�et�al.,�2020;�Andersen�et�al.,�201061� �Climate�Prediction�Centre,�202062� �WITS,�202163� �RGC,�201964� �RGC,�2019:�13465� �2018:�2866� �Royal�Government�of�Cambodia,�201567� �HRW,�202068� �DEFRA,�201969� �DEFRA,�201970� �Caro�et�al.,�202071� �2020:�172� �Rhodes,�202073� �Ben-David�et�al.,�2020;�World�Green�Building�Centre,�201974� �Prüss-Üstün�et�al.,�201675� �ADB,�202076� �ADB,�2020:�177� �Wendling�et�al.,�202078� �Pink,�2016:�3579� World�Bank,�201680� �Young,�2019:�4081� �Climate�Investment�Fund,�202082� �GIZ,�202083� �UK�Parliament,�2019:�4584� �Lohani�et�al.,�202085� �WWF,�2020b86� �WWF,�2020b87� �Broadhead�and�Izquierdo,�201088� �Griscom�et�al.,�200989� �Ken�et�al.,�202090� �GIZ,�202191� �Broadhead�and�Izquierdo,�201092� �Khmer�Times,�2018:�193� �(N=158)94� �Niinimäki�et�al.,�202095� �GIZ,�202196� �IOM,�201697� �WWF,�2020b98� �Staal�et�al.,�202099� �UNDP,�2018:�1100� �Climate�Prediction�Centre,�2020101� �UN�News,�2008102� �World�Green�Building�Council,�2019103� �UNEP�and�IEA,�Global�Status�Report�2017104� �World�Green�Building�Council,�2021105� �Climate�and�Clean�Air�Coalition,�2018;�Bond�et�al.,�2013106� �Mishra,�2020;�Natarajan�et�al.,�2020;�Brickell�et�al.,�2018107� �Mishra,�2020108� �Biswas�et�al.,�2018109� �World�Green�Build�Centre,�2019110� �UNEP,�2016111� �UNEP,�2020112� �UNEP,�2020:�9113� �World�Bank�Databank,�2020114� �UNEP,�2020115� �Fezzinga�et�al.,�2019116� �BDA,�2017117� �HMRC,�2020118� �OEC,�2019
Endnotes
119� �Brown�et�al.,�2018120� �Lopez-Aguilar,�2016121� �HMRC,�2020122� �HMRC,�2020123� �Eil�et�al.,�2020124� �Turner�and�Townsend,�2019125� �Turner�and�Townsend,�2019126� �World�Freight�Rates,�2021127� �Climate�and�Clean�Air�Coalition,�2019128� �Defra,�2018:�4129� �World�Bank,�2018130� �Eil�et�al.,�2020131� �Becque�et�al.,�2017:�3132� �World�Green�Building�Centre,�2019133� �Ben-David,�2020:�1134� �Boyd�et�al.,�2018135� �Climate�and�Clean�Air�Coalition,�2019136� �Tahir�and�Rafique,�2009137� �Boyd�et�al.,�2018138� �Eil�et�al.,�2020;�Alam�and�Barman,�2019;�Bangladesh�Department�of�
Environment,�2017139� �Brown�et�al.,�2019;�Boyd�et�al.,�2018;�Anti-Slavery�International,�2017;�
Kara,�2014140� �Mishra,�D.,�2020;�Morgan�and�Olsen,�2015;�Ercelawn�and�Nauman,�
2004141� �Government�of�India,�2010142� �Mishra,�D.,�2020;�Mishra,�P.,�2020143� �BBC,�2014144� �Climate�and�Clean�Air�Coalition,�2019145� �Bangladesh�Department�of�Environment,�2017146� �ILO,�2014147� �Cullen,�2020148� �ILO,�2014149� �Dhaka�Tribune,�2019150� �Climate�and�Clean�Air�Commission,�2019151� �Dhaka�Tribune,�2019152� �Rahman�et�al.,�2017153� �Rahman�et�al.,�2017154� �Hossain�et�al.,�2019155� �Hossain�et�al.,�2019)156� �Adger�et�al,�2021157� �BBC,�2014158� �FAO,�2018159� �IISD,�2019160� �Jayasinghe�et�al.,�2020161� �Munasinghe,�2017162� �2020:�35163� �Athukorala�et�al.,�2018164� �World�Tea�News�2019165� �World�Tea�News,�2019166� �World�Tea�News�2019167� �Central�Bank�of�Sri�Lanka,�2009;�2019168� �ADB,�2020:�2169� �Gunathilaka�et�al.,�2019:�577170� �Uyeturk,�2020;�Gunarathna�et�al.,�2018;�Costa�et�al.,�2007171� �Gunathilaka�et�al.,�2019172� �Gunathilaka�et�al.,�2019173� �Gunathilaka,�2018174� �UNISDR,�2019
175� �Perera�et�al.,�2018:�2176� �Perera�et�al.,�2018:�2177� �Sugathapala�&�Presanna,�2010178� �Hewawasam,�2010179� �Perera�et�al.,�2019;�Gunarathna�et�al,�2018;�Jayathilaka�and�Hennay-
ake,�2018;�Hewawasam,�2010;�Senanayake,�1993180� �Senanayake,�1993181� �Gunarathna�et�al,�2018182� �Sugawara,�2013183� �Uyuturk�et�al.,�2020184� �Hacisalihoglu�et�al.,�2018185� �Wahlstrand,�2015;�Davies,�1996186� �Suguwara,�2013187� �Uyeturk�et�al.,�2020:�3188� �Davies,�1996:�543189� �2020:�3190� �Yalcin,�2007:�3191� �Ratnayake�and�Herath,�2005192� �Rathnaweera�and�Nawagaeera,�2013193� �The�Guardian,�2017194� �Reliefweb,�2020195� �BBC,�2014196� �Bandara,�2013197� �Saja�et�al.,�2019198� �Sri�Lanka�Tea�Board,�2017199� �Ministry�of�Plantation�Industries�&�Export�Agriculture,�2020200� �See�Chandrabose,�2019201� �HMRC,�2020202� �Mees,�2016203� �Albert�and�Xu,�2016204� �Eurostat,�2020205� �Baumert�et�al.,�2019;�Malik�and�Lan,�2016206� �Natarajan�and�Parsons,�2021;�Kelman,�2020;�Mora,�2009207� �WWF,�2020a;�Moran�et�al.,�2018;�House�of�Commons�Energy�and�
Climate�Change�Committee,�2012208� �Nielsen�et�al.,�2020209� �WWF,�2020a210� �Peters�et�al.,�2011211� �HM�Government�Environmental�Reporting�Guidelines,�2019212� �Moran�et�al.,�2018:�8213� �Baumert�et�al.,�2019;�Malik�and�Lan,�2016214� �HM�Government,�2021215� �2019216� �GEF�and�UNIDO,�2010217� 533x0.36�=�191.88;�+230x0.1�=�23;�+�806x0.56=�451.36�=�666.24�218� �Nazir�et�al.,�2020
110110 111

112