Hey! What's Your Footprint
79
Charlotte Baldwin Susanne Becken Will Allen Report NO.5 ........ LE P LAND ENVIRONMENT & PEOPLE
-
Upload
independent -
Category
Documents
-
view
0 -
download
0
Transcript of Hey! What's Your Footprint
Charlotte Baldwin Susanne Becken
Will Allen
Report NO.5
~ ........ LE P LAND ENVIRONMENT & PEOPLE

Hey! What’s Your Footprint?
Charlotte Baldwin Royal Society Teacher Fellow 2008
Susanne Becken
Lincoln University
Will Allen Landcare Research
Land Environment and People Research Report No. 5
November 2008
ISSN 1172-0859 (Print)
ISSN 1172-0891 (Online)
ISBN 978-0-86476-206-1
Lincoln University, Canterbury, New Zealand
Reviewed by:
Rhys Taylor Coordinator, Sustainable Living Programme
©LEaP, Lincoln University, New Zealand 2008 This information may be copied or reproduced electronically and distributed to others without restriction, provided LEaP, Lincoln University is acknowledged as the source of information. Under no circumstances may a charge be made for this information without the express permission of LEaP, Lincoln University, New Zealand. Series URL: http://hdl.handle.net/10182/580
Contents
Contents .......................................................................................................................................i List of Figures ............................................................................................................................ ii List of Photos ............................................................................................................................. ii Acknowledgements................................................................................................................... iii Chapter 1 Executive Summary........................................................................................1
1.1 Research Questions ..........................................................................1 1.2 Rationale...........................................................................................1
Chapter 2 Footprinting ....................................................................................................3
2.1 What is an ecological footprint?.......................................................3 2.2 What ecological calculators are on the World Wide Web?..............4 2.3 Pro-Environmental Behaviour and Action .......................................4 2.4 Environmental action and school-aged children ..............................7
Chapter 3 Methodology.................................................................................................11
3.1 Overview ........................................................................................11 3.2 Timeline..........................................................................................11 3.3 Interviews .......................................................................................13 3.4 Development process of the environmental footprint tool .............14
Chapter 4 Scoping, Model Development and School Visits.........................................17
4.1 Scoping...........................................................................................17 4.2 Footprint tool Version 1 .................................................................18 4.3 Footprint tool process model ..........................................................19 4.4 Results from Visit 1........................................................................20 4.5 Results from Visit 2........................................................................20 4.6 Results from Visit 3........................................................................23
Chapter 5 Answers to the Research Questions..............................................................25
5.1 Visual presentation of “One’s Footprint” + resource usage...........25 5.2 Awareness of environmental issues as a result of using this tool ..26 5.3 Motivation to act, goal setting and behaviour change....................26 5.4 Could this tool help to persuade others to act more sustainably? ..28 5.5 Results from incorporating the Action Research Model into the Footprint Programme .....................................................................29
Chapter 6 Conclusion ....................................................................................................35 References.................................................................................................................................37 Appendix 1 Lincoln University Consent Form.........................................................................41 Appendix 2 First Version of the Footprint Tool .......................................................................43 Appendix 3 Quiz Show Presentation ........................................................................................45 Appendix 4 Feedback/Evaluation Sheet 1 ................................................................................57 Appendix 5 Second Version of the Footprint Tool...................................................................59 Appendix 6 Feedback/Evaluation Sheet 2 ................................................................................61 Appendix 7 Discussion Version of the Footprint Tool .............................................................63 Appendix 8 Final Version of the Footprint Tool ......................................................................65 Appendix 9 Lesson Plan for the Classroom Programme ..........................................................67 Appendix 10 Teaching Notes How to Implement the Footprint Process in the Classroom .....69
List of Figures
Figure 1 The Living Plant Report...........................................................................................3 Figure 2 Timeline for this Ecological Footprint Tool Process .............................................12 Figure 3 The Footprint Tool Process....................................................................................20 Figure 4 Final Version of the Footprint Tool from Design, Trial and Discussion with all
Stakeholders ...........................................................................................................35
List of Photos
Photo 1 An Early Version of the Footprint Tool Used in the Scoping ...............................14 Photo 2 Setting an Environmental Goal After Completing the Ecological Footprint
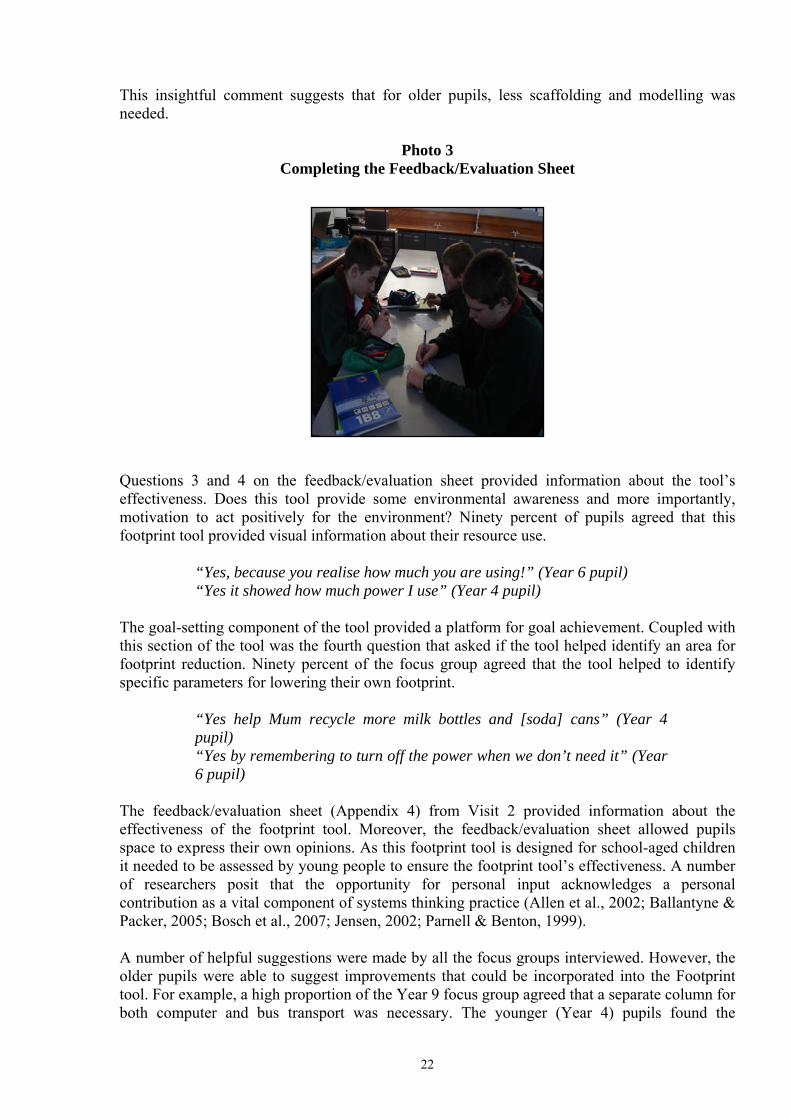
Tool ........................................................................................................................21 Photo 3 Completing the Feedback/Evaluation Sheet ..........................................................22 Photo 4 Discussion Section Using a Modified Version of the Footprint Tool....................28

Acknowledgements
I would like to thank the institutions, the participating schools and pupils and all the other people involved in making the “Hey! What’s your Footprint?” project into a reality. The institutions:
• The Royal Society of New Zealand • Lincoln University • Landcare Research.
The participating Canterbury schools:
• Lincoln High School • Christchurch South Intermediate School • Addington School • Beckenham School
The children and teachers:
• Yr 9 Science with Dr Sue Jarvis • Year 8 (Room 17) with Steve Prescott • Year 6 (Room 11) with Rebecca Meachen • Year 4 (Room 11) with Michelle Maul
The reviewer:
• Rhys Taylor The Secretary:
• Michelle Collings of Lincoln University The Editor:
• Christine Bezar of Landcare Research The photographer:
• Bridgit Anderson

iv
1
Chapter 1 Executive Summary
Ecological footprint calculators are an effective communication and educational tool to measure the impact of humanity on our planet (Barrett et al., 2004). This project’s aim was to design and then trial a footprint tool for children using a format that was engaging, purposeful and child-specific. A further objective was to test whether, through specific information and dialogue, pupils could then modify their own behaviour to reduce their footprint through action strategies in a collaborative environment. The method used involved scoping a group of three children to develop specific parameters and then trialling the footprint tool’s design and programme in four Canterbury schools. The results suggest that footprint tools can be effective in changing behaviour. The developmental process was critical to encourage planning, actions and reflection in a supportive setting (Allen et al., 2002; Bosch et al., 2007; Whitehead & McNiff, 2006). We further posit that the process used to motivate environmental behaviour change could be used effectively in other educational programmes in either schools or the wider community. It was not just the footprint tool used in isolation that effected behaviour change in over 70 percent of pupils; rather the tool was seen as a catalyst within this environmental education programme (Law, 2004; Ministry of Education, 2007). It was the process used to engage pupils – enhance their values for a sustainable future in a supportive landscape – that facilitated effective teaching and also learning processes in young people. 1.1 Research Questions
Does a purpose-designed footprint tool: • provide a snapshot of a child’s lifestyle impact on the environment using a visual tool that
has meaning and relevance? • generate awareness in children about their own lifestyle impacts and their use of resources
through specific criteria? • motivate pro-environmental behaviour change in children and young adults? • help to persuade others to act more sustainably? • create a process of dialogue for action and reflection? 1.2 Rationale
There are numerous uses and applications for ecological footprint calculators and environmental footprint tools throughout the world today. A number of these tools calculate the consumption of resources and the waste produced by a given population (Barrett et al., 2004; Chambers et al., 2005; Ryan, 2004, p. 249; Stoeglehner, 2007; Wackernagel & Rees, 1996) while others, especially versions on the Internet1 (referred to as ecological footprint calculators) do not. These ecological footprint tools use units and parameters for their calculations different to the “global hectares” used in the original Wackernagel & Rees model 1996. For the purposes of this report these tools will be referred to as environmental footprint tools. Ecological footprint calculator tools are seen as powerful communication tools and have been used since the mid 1990s. They provide information about the use of renewable and non-renewable resources and the waste produced by that group or region. According to the Best Foot Forward Report, ecological footprint calculators provide information about sustainable resource consumption in a context that has both weight and substance for people’s daily
1 See examples of EFTs given in Section 2.2

2
lifestyles (Barrett et al., 2004; Chambers et al., 2005). The concluding remarks in Barrett et al. (2004) highlighted the enormous educational potential of the ecological footprint calculator, stating that the Ecological Footprint concept has the “greatest lasting effect on people” to alter their lifestyles’ for pro-environmental change”. The ecological footprint tool has the potential to create effective dialogue between numbers of groups at a personal, local government or national level. The information provided or the conversations and links that the tool creates could help facilitate pro-environmental behaviour change in an individual or community (Chambers et al., 2005; Ryan, 2004; Stoeglehner, 2007). Allen et al. (2002, p. 7), argue that learning in a supportive environment is further enhanced if you “create the links between people” , which allows the information and learning to occur across social networks and settings (Spellerberg, 2001)2. Given that ecological footprint calculators provide important information about consumption and waste, some adults (or communities) might be motivated to alter their lifestyles (Allen et al., 2002; Chambers et al., 2005, pp. 18–19). Action Research methodology has clear applications in several fields such as community development, organisational management and education and could be able to be applied to an Action Research Ecological Footprint Tool programme (Allen, 2001). The essence of Action Research is participation through “collaboration, which enables mutual understanding, democratic decision-making and common action” (Allen, 2001; Whitehead & McNiff, 2006). The implication for ecological footprint calculators and tools is that groups and communities, such as the Best Foot Forward Report, can work collaboratively to derive a best practice programme for lowering lifestyle impacts that are democratic and enduring (Barrett et al., 2004; Chambers et al., 2005). However, most ecological footprint calculators and tools (especially those on the Internet) have less meaning or relevance for children. The information they provide is often too complex for children to grasp or is irrelevant. However, as for adults, children’s lifestyles impact on the planet. Children use water. They need food, transportation and need to be kept warm, clean and dry. As they develop, children need entertainment, sport, and time to socialise. All these activities require resources and energy. The consumption of energy to sustain that child’s lifestyle has an impact on the planet’s precious resources. The ecological footprint calculators provide important information but these tools need to have parameters that have relevance to them. Potentially, the ecological footprint tool is a “powerful communicator of sustainability issues” (Barrett et al., 2004, p. 7; Chambers et al. 2005; Allen et al. 2002). The process of determining their ecological footprint could help to motivate school-aged pupils to make connections and take action about environmental issues (Aleixandre & Rodriguez, 2001; Ballantyne & Packer, 2005; Jensen, 2002). Further, this tool could also facilitate sustainable “learning in the supportive environment” (Allen et al., 2002) and encourage a child’s environmental influence within his or her family. Rickinson & Reid (2003) and Ballantyne & Packer (2005) investigated the impact of environmental issues for school-aged children and the wider community. Both pairs of researchers posit that using effective educational programmes, teachers [and parents] observed that children were powerful communicators.
Studies of intergenerational influence suggest that students, after participating in environmental education activities, are capable of influencing the environmental attitudes and/or behaviours of their parents (p.289)’. (Rickinson & Reid, 2003)
2 Social Networks (Spellerberg 2001, cited in Allen et al., 2002, p. 7) is a framework that looks at social behaviour through relationships rather than as an individual. The creation of these links is referred to as “social capital”.

3
Chapter 2 Footprinting
2.1 What is an ecological footprint?
The “Ecological Footprint” was been developed by Wackernagel & Rees in 1996 and highlights an individual’s, group’s, city’s or region’s, use of renewable and non-renewable resources and the waste produced by that population (Loh, 2006). Ecological footprint analysis can provide information that estimates the resource consumption and waste assimilation of a particular group investigated in terms of the corresponding productive land and sea area used (Ryan, 2004; Wackernagel & Rees, 1996). In the World Wildlife Fund’s Living Planet Report 2006 an “ecological footprint” is a measure of the amount of productive land required to support the lifestyle of an individual, a city, region or country in today’s economy. It is calculated as the total of the different land-use types (built-up areas, grazing and crop land, managed forest land, energy land and fishing grounds) required for production and consumption of goods and services (food, housing, transport, consumer goods, wastes and services). Ecological footprints are usually expressed in hectares, or hectares per capita for a given year. The larger the ecological footprint, the more resources are needed to sustain an individual's or population’s current lifestyle (Loh, 2006; Environment Waikato, 2006). The Living Planet Report states that high-consuming Western lifestyles tend to have a higher ecological footprint per person than those of developing countries (Loh, 2006, pp. 16–17). When the planet’s global hectares of bio-productive land and sea are divided by the total global population, we end up with our fair earthshare – 1.8 gha in 20073 . “If everyone lived within their earthshare, we would consume only as much as the earth is able to produce” (Chambers et al., 2005, p. 10). For example:
Figure 1 The Living Plant Report
3 (http://www.ecohousefootprint.com/ Definitions)
The Living Planet Report
2006 Ecological Footprint per person
United Arab Emirates: 11.9 global hectares/person
United States of America: 9.5 global hectares/person
New Zealand: 6.5 global hectares/person
Ghana: 1.5 global hectares/person
India: 1.2 global hectares/person
Somalia: <1 global hectare/person
Source: (Loh, 2006, pp. 16–17)

4
Ecological footprint tools found on the Internet can estimate an individual’s impact rather than a group or region’s environmental impact using the unit “planet required”. 2.2 What ecological calculators are on the World Wide Web?
There are numerous ecological footprint calculators posted on the World Wide Web but only a few are suitable for children. For example: http://www.myfootprint.org/en/ (Redefining Progress Calculator) http://footprint.wwf.org.uk/ (World Wildlife Fund) Adult-based http://www.wastedtv.co.nz/index.cfm?&action=calculator - now unavailable http://www.mfe.govt.nz/withyou/do/footprint/index.html - now unavailable Effectively, all these ecological footprint programmes ask questions about various aspects of an individual’s or a given population’s lifestyle and the calculator will derive a figure to represent your lifestyle’s impact by your waste produced and consumption of renewable and non-renewable resources. Many of the personalised calculators ask questions about type of housing or the number of inhabitants. Other questions focus on travel, types of holidays, food consumption, waste practices, purchases and other general lifestyle assessments. From those questions asked, the tool then calculates how many “earth-sized planets” would be required to maintain your present lifestyle. This outcome of “planets required” may not be expressed in global hectares (and so not take into consideration all the bio-productive land and sea required for a “Wackernagel & Rees, 1996” ecological footprint model); however, as an indicator of an individual’s lifestyle impact these web-based tools have merit. For example, some ecological footprint tools, such as the Redefining Process Footprint Calculator, offer solutions. The “Take Action” section provides practical information and suggestions for footprint reduction. And: http://www.powerhousemuseum.com/education/ecologic/bigfoot/bigfoot2007/ Child-based http://www.kidsfootprint.org/ Of the child-appropriate calculators, the Powerhouse Museum in Sydney has an online ecological calculator called “Bigfoot” aimed for children. This tool is easy to navigate, has relevant questions and uses interactive technology that is appealing. The “Kidsfootprint” calculator is American and with added teacher support and lesson plans is aimed at Years 2–6 age group. 2.3 Pro-Environmental Behaviour and Action
2.3.1 Role of environmental education in the school curriculum
There are numerous debates about the role of environmental education (Heimlich & Ardoin, 2008; Keown & McGee, 1999). Some educationalists argue that the role of environmental education is to inform, motivate and change behaviour (Chawla, 1998; Jensen, 2002; Law, 2004; Orams, 1997; Stern, 2004). Debate over the definition and understanding of environmental education developed in the late 1980s (Bolstad, 2003; Tilbury, 1995, p. 196). Environmental education in the 1970s and mid-1980s was seen as a reaction to environmental

5
crises such as pollution and environmental degradation. While according to McKeown & Hopkins (2003), education for sustainability from 1987 onwards was a “shift in language and meaning,” through the integration of social, political and economic development with an emphasis on long-term future goals connecting the “environment, people, culture and society”4 (Bolstad, 2003; Eames & Cowie, 2004a; Jensen, 2002, p. 329; McKeown & Hopkins, 2003; Tilbury, 1995). Educators argued that education for sustainability needed to include environmental values, skills, explicit and tacit knowledge using action models (Aleixandre & Rodriguez, 2001; Ballantyne et al., 2001; Eames & Cowie, 2004b; Jensen & Schnack, 1997). Researchers argue that this process of “Education for Sustainability” needs to be succinct, informative and in contexts that actively involve the pupils. The ecological footprint tool process would provide both an informative, participatory and empowering component. In an attempt to develop sustainable education programmes for schools the New Zealand Ministry of Education published the Environmental Education Handbook in 1999. This document informed and developed action-oriented unit plans for schools about environmental issues. The “pièce de résistance” was the component for an action-orientated strategy. This process allowed pupils to play both an active and reflective role in environmental education programmes (Ministry of Education, 1999). Another important New Zealand initiative was the Enviroschools’ programme which started in the 1990s in the Waikato Region and now operates nationwide (Eames & Cowie, 2004a)5. Action projects undertaken by Enviroschools have both environmental and educational outcomes that benefit both the school and the wider community6. According to Law (2004) the Enviroschools’ programme provides an "incentive scheme for schools to become actively involved in environmental education" which assists students and teachers to "undertake initiatives that make a real difference to their communities" (Auckland Regional Council, p. 2 cited in Law, 2004, p. 99). Like New Zealand’s Environmental Education programmes, the Danish University of Education has approached the teaching of environmental and health education through a democratic process known as “action competence” (Jensen, 2002; Jensen & Schnack, 1997). This is an holistic approach to learning that has a number of components: knowledge/insights, commitment, visions, and action experiences. Like the action-oriented feature within both the Enviroschools and the New Zealand Ministry of Education’s Environmental Education Handbook (1999) “for the environment” components, the “action competence model” requires that school-aged pupils have the “capacity to act” by taking personal and direct action for environmental change (Jensen, 2002; Jensen & Schnack, 1997). The ecological footprint tool process has the potential to motivate positive environmental lifestyle change. Environmental education programmes have had mixed success7. Some researchers argue that children can have favourable attitudes towards the environment but lack the knowledge of basic environmental concepts to take action (Makki & Abd-El-Khalick, 2003); for example, Lebanese school children showed concern for pollution levels in local waterways but lacked the knowledge about what was polluting the waterways or who was responsible. Researchers have debated about the effectiveness of environmental education programmes in New Zealand schools. Cowie and Eames (2004b) and Law (2004) uncovered barriers to the teaching of
4 Jensen (2002) further argues that environmental education develops a pupil’s ability to act [for the environment] and effect change. 5 The Enviroschools Foundation works with a large network of people and organisations such as the Environmental Education Professional Development Programme overseen by the Ministry of Education, Te Mauri Tau Inc, Department of Conservation as well as numerous regional partners. http://www.enviroschools.org.nz 6 Eames & Cowie (2004): This programme helps school-aged pupils to develop skills, understanding, knowledge and confidence through planning, designing and creating a sustainable school. 7 For example the New Zealand Ministry of Education’s Environmental Education Handbook 1999 or Jensen (2002); Jensen & Schnack (1997); Eames & Cowie’s (2004) research and the Enviroschools programmes.

6
environmental education as well as to learning for pupils. For teachers, timetabling, knowledge about environmental issues, resources and a cramped curriculum were highlighted as concerns (Eames & Cowie, 2004b; Law, 2004). For children, the barriers expressed were knowledge [about the issues], experience or the confidence to do something for the environment (cited in Bolstad, 2003). 2.3.2 What shapes environmental behaviour? Understanding the myriad factors that affect environmental behaviour change are important for understanding the effectiveness of environmental footprint tools used in environmental education. In the 1960s pro-environmental behaviour was effectively seen as a linear process from environmental knowledge + environmental attitude (environmental awareness and concern) manifesting in the desired environmental behaviour (Hungerford & Volt, 1990; Kollmuss & Agyeman, 2002; Maiteny, 2002)8. Researchers Kollmuss and Agyeman (2002) and Hungerford and Volt (1990) highlight a number of theoretical frameworks to explain the gap between pro-environmental behaviour and the possession of environmental knowledge and awareness9. According to the researchers “no definitive explanation [models] has yet to be found” (Kollmuss & Agyeman, 2002, p. 239) To illuminate this complex field of research Kollmuss and Aygeman (2002) describe factors that have some influence, positively or negatively, to shape pro-environmental behaviour. External factors such as demographics and “situational factors” that include economic constraints, social pressures and opportunities to choose different actions are cited (Hines et al, 1986, cited in Kollmuss & Agyeman, 2002, p. 244). Internal factors as researched in various models highlight such factors such as motivation, pro-environmental knowledge, awareness, values, attitudes, emotion, locus of control, responsibilities and priorities in research frameworks (Ajzen, 1980; Hines, 1986-1987). For learners, an understanding of environmental change can then be linked directly to the footprint process to encourage positive changes in attitude, understanding and actions. The ecological footprint tool could help to foster positive environmental attitude and behaviour. A recent paper by Heimlich & Ardoin (2008, p. 243) argue that “pro-environmental attitudes only rarely lead to specific behavioural changes”. A critical step towards behaviour change is the improved self-esteem of an individual or group. According to Heimlich & Ardoin (2008) this can be achieved by using boarder environmental themes (sustainable housing methods) and using programmes that focus on specific attitudes (uses of recyclable waste) which are linked directly to explicit skills and specific environmental issues (Heimlich & Ardoin, 2008). To illustrate this point, “Garbage Warrior” (and architect), Michael Reynolds tried to change peoples’ attitudes towards more sustainable housing models in America. He designed and built sustainable housing out of recycled materials such as car tyres, plastic drink bottles and aluminium cans. He created housing (for himself and others) that was self-sustaining. These homes had waste systems, heating and water catchment systems that operated independently of the New Mexico municipalities. His “Earthship homes” were designed using principles of self-sufficiency, recycling and sustainability and recognised the need for humans to become more environmentally responsible for their buildings and waste (Reynolds, 2008). Reynolds, like Heimlich and Ardoin (2008), recognise the importance of changing people’s attitude through specific skills (building a house) and knowledge (to more sustainable housing designs for the wider community) as critical steps towards pro-environmental attitude and behaviour change. For teachers, the environmental footprint tool could change young people’s attitudes to their
8 Referred to as “Deficit models of public understanding and action” by Burgess et al. (1998, p.1 447) cited in Kollmuss and Argyman (2002, p, 241 9 Kollmuss & Argyman (2002) environmental awareness is defined as ”knowing of the impact of human behaviour on the environment” Further, environmental awareness has both a cognitive, knowledge-based component as well as affective (perception-based component) called emotional involvement. For example humans find it difficult to perceive nuclear radiation or the Ozone hole or the long-term impacts from human degradation. Because there is a time-lag from such events human impact is unnoticed until there has been severe damage caused.

7
lifestyle’s impact through the process of identifying areas for improvement and then set specific skills (and knowledge) to achieve environmental goals. Sarah Darby (2005) researched a social learning model as a useful way of looking at the issues that shape environmental behaviour. Her research study looked at improving energy consumption in Launton, England. She argues that for effective environmental action there needs to be a combination of explicit and tacit knowledge as well as the awareness and feedback about an environmental educational issue before an environmental action can take place10 (Darby, 2005 p. 7). From an environmental footprint perspective this could mean stopping to consider what triangle is on the bottom of a plastic bottle (tacit knowledge). If the triangle is a 1 or 2, it is placed into the recycle bin to reduce your footprint. Within Darby’s (2005, p. 10) study she concluded that for more effective environmental action there needs to be a combination of “increased tacit knowledge and good visibility of facts” and appropriate feedback and support (both technical and local council) that helps to shape people’s awareness and action. The success of an environmental footprint tool or programme is the feedback, dialogue and the learning about the goals set and achieved. Another important consideration when designing and implementing an ecological footprint tool is allowing children to use their critical thinking and negotiation skills to develop pro-environmental attitudes and skills to achieve behaviour change (Heimlich & Ardoin, 2008, p. 224). Aleixandre and Rodriguez’s (2001, pp. 6–7) research looked at how school children (constellations11) designed their own learning tasks and asked whether those pupils’ environmental behaviour was different if they designed their own environmental programmes for a pond study. These researches discovered that the classes which used democratic processes in the development of their environmental pond study had more positive environmental attitudes and values. Some teachers pointed out that although it was a time-consuming process this deliberation strategy was very positive and developed better environmental attitudes, skills and values in the children (Aleixandre & Rodriguez, 2001, p. 19). Furthermore, the authors argued that by working as a group (with an active voice) these children were better able to use their critical thinking skills to solve conflicts which seemed to reinforce more positive attitudes and values in their pond study (Aleixandre & Rodriguez, 2001). 2.4 Environmental action and school-aged children
2.4.1 Scare tactics and cognitive dissonance The plight of the planet has been dramatically highlighted recently. Al Gore’s An Inconvenient Truth really helped, through effective use of information and technology, to show how our human lifestyles are impacting on the planet. This documentary’s format tries to scare humans into sustainable action. The You Tube website calls this “scare tactics”12; however, researchers are concerned that scaring humans about terrifying issues such as global warming can create a type of “psychological discomfort” (Cohen, 2001, p. 266) called “ cognitive dissonance”. This is where an issue can seem too big and overwhelming and impedes any reason to act positively [for the environment] (Darby, 2005; Heimlich & Ardoin, 2008; Hillman & Fawcett, 2004; Maiteny, 2002).
10 Darby (2005) Explicit knowledge is facts, or things that are known. For example, a number of plastics are made from petroleum-based products and some can be recycled. Tacit knowledge, on the other hand, is gained knowledge from everyday experiences. According to Darby, tacit knowledge focuses on the skills and awareness (about an issue or event) 11 Heimlich & Ardoin (2008, p. 222): Constellations of behaviours refers to a group which perform behaviours that support each other and occur concurrently. 12 Cited on www.youtube.com/watch?v=0XMn_Ry3z6M..

8
Louie (1997), Cohen (2001) and Kollmus & Agyeman (2002) further suggest that cognitive dissonance can be decreased in certain circumstances and this can have implications for environmental behaviour change. For example I might think: “I am an environmentally responsible person”. However, in the community where I live sustainable policies are not supported by the local government. This can cause [you] discomfort13 (Cohen, 2001; Kollmuss & Agyeman, 2002; Louie, 1997; Stern, 2004). However, [your] cognitive dissonance can be reduced as you justify that you are now less environmentally responsible because you are forced to alter your behaviour. This is called distancing or trivialisation (Louie, 1997, p. 4). For example; “I can’t recycle anymore and thus be an environmentally responsible person because it is someone else’s [the municipalities] fault.” This justification reduces your psychological discomfort. In Darby’s 2005 study of people’s electricity usage in the UK she argues that cognitive dissonance can have a positive effect on environmental behaviour change. Effectively, Darby argues, a change in behaviour, through action, may also lead to a change in thinking. For example: a person might install a hot water solar panel and this might lead to further sustainable actions, like installing a rain-water collection tank. This leads to other pro-environmental changes within the home because of a change in environmental thinking. A number of ecological calculators provide positive action strategies for pro-environmental behaviour and (perhaps) reduce cognitive dissonance in a given group14. 2.4.2 A collaborative process: positive role-modelling, experience and free-choice learning Several researchers have argued that for pro-environmental behaviour to become enduring it is important to have both strong educational programmes and self-empowerment through positive role-modelling15 using a range of environmental experiences (Ballantyne & Packer, 2005; Chawla, 1998, p. 370; Dillon & Gayford, 1997; Maiteny, 2002; Orams, 1997; Palmer et al., 1998). The ecological footprint tool process can offer a wealth of learning experiences and the web-based version has links to a range of educational programmes that could support pro-environmental behaviour change in pupils. Ballantyne & Packer (2005) posit that young people need to evaluate information from a variety of sources; such as the Internet, media and free-choice learning experiences to continuously update their knowledge of “rapidly evolving environmental issues” (Ballantyne & Packer, 2005, p. 282)16. These researchers argue that well-designed free-choice learning experiences (e.g., whale-watching) can influence, through real-life experiences, deepen and expand personal knowledge, pro-conservation attitudes and emotional experiences (Maiteny, 2002; Orams, 1997). Rickinson & Reid (2003, p. 289). Ballantyne & Packer (2005) suggest that the combination of environmental classroom programmes coupled with effective real-life experiences can have a huge impact. Further, this influence can be a “catalyst for environmental change in homes and communities”. Pupils give examples of how their own personal, environmental experiences have facilitated changes in their own homes;
For example, “I make my family recycle” (13-year-old) – (Ballantyne & Packer, 2005, p. 286).
13 Interestingly, Kollmus and Agyeman (2002, p. 246) point out that without appropriate infrastructure and economics people might, for example, have a positive environmental attitude and want to recycle their household waste but if the city council does not provide collection services for recycling or a refuse station where recyclables can be taken to, recycling is thwarted and less likely to happen. 14 Such as The Redefining Progress Calculator http://www.myfootprint.org/en/ and the World Wildlife Fund Calculator http://footprint.wwf.org.uk/. 15 Ballantyne & Packer (2005) suggest that positive role-models could be teachers, or other educators who run the free-choice learning activities. 16 Ballantyne & Packer (2005): free-choice learning experiences could be traditional libraries, museums, sciences centres, botanic gardens and also include newer wildlife-based choices such as community organisations, whale and dolphin watching, penguin parades and information- enriched zoo programmes such as Australia Zoo in connection with the Steve Irwin Conservation Foundation, later renamed Wildlife Warriors Worldwide.
9
It seems that we have a golden opportunity to empower children with meaningful life-experiences and positive learning contexts through using this ecological footprint tool in teaching and learning programmes. A research paper by Bosch et al. (2007) applied “Systems Thinking” to natural resource management problems in Northern Queensland and the Philippines. This process was a shift away from single-disciplinary projects towards multidisciplinary and interdisciplinary research. This new approach allowed for deeper understanding by stakeholders using a participatory approach “using action research and adaptive management systems” (Bosch et al., 2007, p. 219). As discussed earlier the 1960’s linear approach to understanding pro-environmental behaviour change (Hungerford & Volt, 1990; Kollmuss & Agyeman, 2002) systems thinking fits more closely with modern learning models such as Orams’ (1997, p. 297) “features for an effective education programme for tourists” Darby’s (2005) social learning model, and Hines et al.’s (1986/87) behaviour change model. Importantly, these non-linear models link external and internal factors as well as effective communication, collaboration and appreciation for different stakeholder’s knowledge to “create new forms of community and ecological governance” (Bosch et al., 2007, p. 230). Effectively, these same processes can be applied when using the ecological footprint tool. Like the programmes advocated by Ballantyne & Packer (2005), Jensen & Schnack (1997), Jensen (2002), Orams (1997), and in New Zealand through the Enviroschools programmes (Law, 2004), Systems thinking (Bosch et al., 2007) and Action Research modelling (Allen, 2001) use collaborative and participatory processes together with dialogue and ownership to deepen understanding and develop action-orientated environmental programmes.


11
Chapter 3 Methodology
3.1 Overview
The research team brought together a school teacher, a social scientist (with experience in action research and learning) and an ecologist (with expertise in the field of environmental management) to develop a footprint tool into an integrated learning process for environmental education. Children were interviewed to help design, trial and evaluate an environmental footprint tool that would facilitate pro-environmental behaviour change through action and dialogue. As argued earlier, the ecological footprint tools currently on the market are (mostly) adult-focused and less suitable for most pupils. The information and parameters used are too complicated or irrelevant for children; or fail to address their lifestyle’s impacts, I believe that ecological footprint tools have merit as a “powerful communication tool” and need to be purpose-designed to be effective (Barrett et al., 2004, p. 7; Chambers et al., 2005). This tool developed into an environmental rather than ecological footprint format17. Critically important to the design of this footprint tool are the identification of resources used and waste generated in a visual layout. For children these impacts include entertainment, food, water and power usage and transport. Further, the footprint model needed to support teaching and learning so the action learning process needed to be supportive, collaborative and informative. Through scoping, data-analysis and trialling this tool developed appropriate parameters applicable to a child’s lifestyle. We argue that by using this footprint tool the information gained (from the slider positions) as well as from the Feel-Good Factor section might provide the motivation to act positively for the environment. Another important aspect of this footprint programme is the dialogue through action research and systems thinking models was generated between the different stakeholders (teachers, pupils, peers, and the community) to plan, action and review pro-environmental behaviour change (Allen, 2001; May et al., 2003). 3.2 Timeline
This is a visual representation of the footprint tool’s process from the development of the scope to the final purpose-designed footprint tool and programme.
17 The Professor Rees and Dr Wackernagel Ecological Footprint is now in common use in many countries at national and local levels (Barret et al., 2004). Further, in the Living Planet report (2006) compares different countries’ footprints by each country’s use of non-renewable resources as well as the impact of renewable and bio-productive capacity using the units of global hectares p. 8. Our tool does not take into consideration the bio-productive land area for a country and region or use the units of gha/region.
12
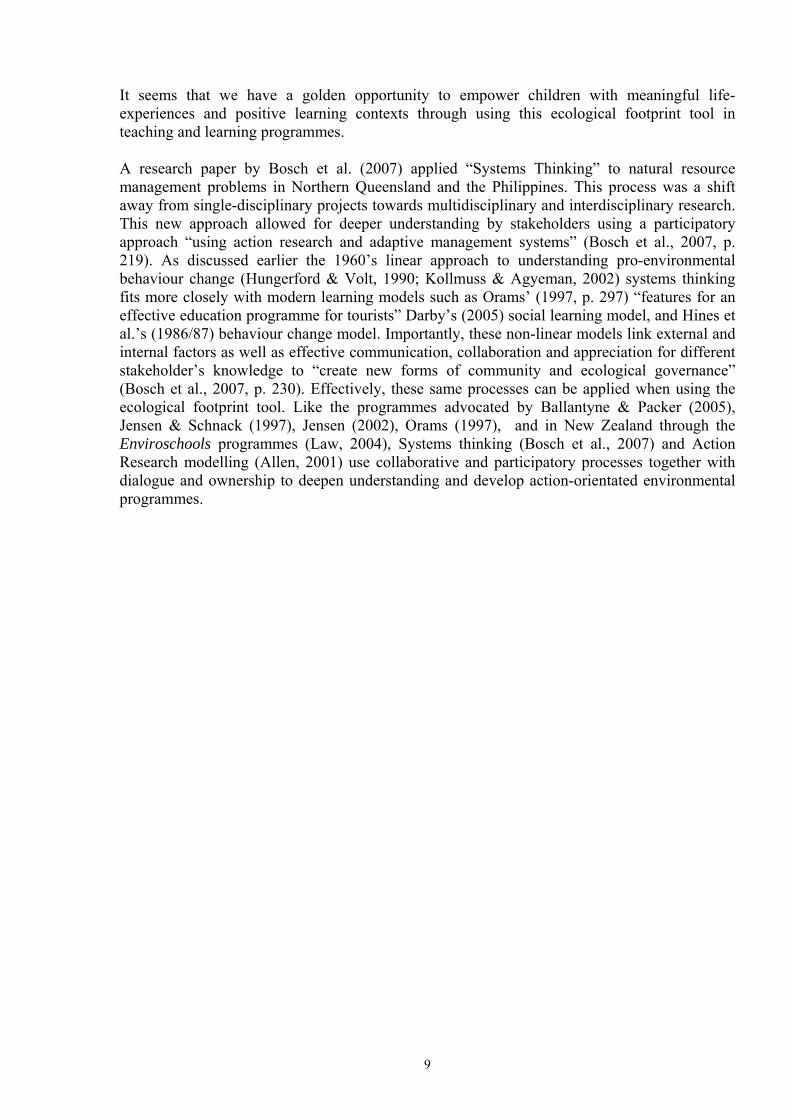
Figure 2 Timeline for this Ecological Footprint Tool Process
Children from four different schools were interviewed for the development of this environmental footprint tool programme. • Beckenham School: Year 4 class (29 students, age range: 7–8 years) • Addington School: Year 6 class (24 students, (2 in wheelchairs) age range: 10–11 years) • Christchurch South Intermediate School: Year 8 class (32 students, age range: 11–12
years) • Lincoln High School: Year 9 Science Class (28 students, age range: 13–14 years) A total of 113 pupils were given consent forms (Appendix 1). One hundred and one forms were signed by the pupils and their parent (or caregiver) and returned to class. The children who did not have consent were removed by the class teacher for the duration of the two footprint trials (Visits 2 & 3). Any variation in total pupil numbers participating in the sessions reflects absences or other school commitments. Each classroom teacher participated in the trial and supported me. The teachers seemed very pleased to be involved. The new curriculum document released by the Ministry of Education (2007) strongly recommends pro-environmental behaviour practice by New Zealand pupils so this footprint tool was seen as a way of promoting sustainable action concepts in the class.
Timeline for this Ecological Footprint Tool Process
Scope Visit 1 Visit 2 Visit 3 Final Design
Guidance and support for the researcher continuous and on-going by the supervisors 2 interviews 1 x 1 Male low SEG 1 x2 Male + female Semi-structured interview to gauge parameters of Footprint tool + Prior environmental knowledge
Sign consent forms PowerPoint + class discussion about environmental issues Briefly view tool Action Research Model
Quiz- environmental issues Trial first version of tool Set environmental goal/s from information highlighted on the tool Fill in feedback/evaluation sheet (4 Questions) Action Research Model
From the feedback given
Revisit goals from Visit 2 • Achieved goals • Not achieved
goals
Trial new version of tool + feel-good factor
Feedback/evaluation
sheet (6 Questions)
Action Research Model
Discussion version of
tool (Small focus groups)
From the feedback given
Final paper version of the footprint tool
Internet version of the tool
planned
Availability? Unit plans
Quiz PowerPoints
Support between each visit Revisit goals in class? Supportive environment to encourage pro-environmental behaviour change
13
3.3 Interviews
3.3.1 Semi-structured questions – convergent interview style The best-fit approach to gathering and trialling the environmental footprint tool was a focus group structure and also the convergent interview technique whereby a group of subjects are interviewed together in a semi-structured or unstructured format (Babbie, 2004). The advantage of focus groups in that they allow the researcher time to question systemically and simultaneously a group of individuals. Often, the focus group is not selected through rigorous, probability sampling methods. This means that the participants will not necessarily represent a meaningful population. However, the process of data gathering can often be an enjoyable and also highly effective collection technique (Patton, 1987, p. 135). Babbie (2004) and Patton (1987) list a number of advantages to using focus groups: • technique is a socially oriented research method that records real-life data in a social
environment such as a classroom • flexibility • high face validity • speedy results • low in cost as there is little use for expensive data recording gear • sometimes, over the course of the interview, aspects of the topic not thought of by the
interviewer could be revealed • often homogeneous18 Some possible disadvantages of using focus groups are: • can give the research less control than using individual interviewing techniques • data can be difficult to analyse • moderators require specific skills • differences between groups can be troublesome – although, in this instance, this might not
apply as we used pupil’s year level as the only criterion • groups can be difficult to assemble • response time can be effected • discussion must be conducted in a conducive environment (Babbie, 2004, pp. 302-303;
Patton, 1987) As with focus groups the convergent interview style is a technique used when there might be doubt about the information that is to be collected (Dick, 1998). Also, if you are using surveys, this technique can help when deciding what questions to ask. Although this means that the content is unstructured, Dick argues that the process, however, “ is tightly structured” (1998, p. 2). 3.3.2 Scoping to set ecological footprint tool parameters Two interviews involving three pupils in a semi-structured convergent method were carried out. This method was selected to gain information about a child’s lifestyle, environmental behaviour, environmental attitudes and values as well as any prior knowledge about environmental issues. A set number of focus themes were used by the interviewer under these broad, life-style headings that the child might have some control over:
18 Patton, 1987, p. 54 Focus groups are often homogeneous using (in some cases) open-ended interviews or talk about specific targeted or focused issues… and often with similar backgrounds and experiences.
14
• Getting to school • Water/power • Entertainment • Food • The Environment/nature For example, a child can decide how long s/he will spend in the shower, or what sort of entertainment s/he will participate in. Finally the information gained from the scoping provided the parameters for the first environmental footprint tool to be used with the four focus groups.
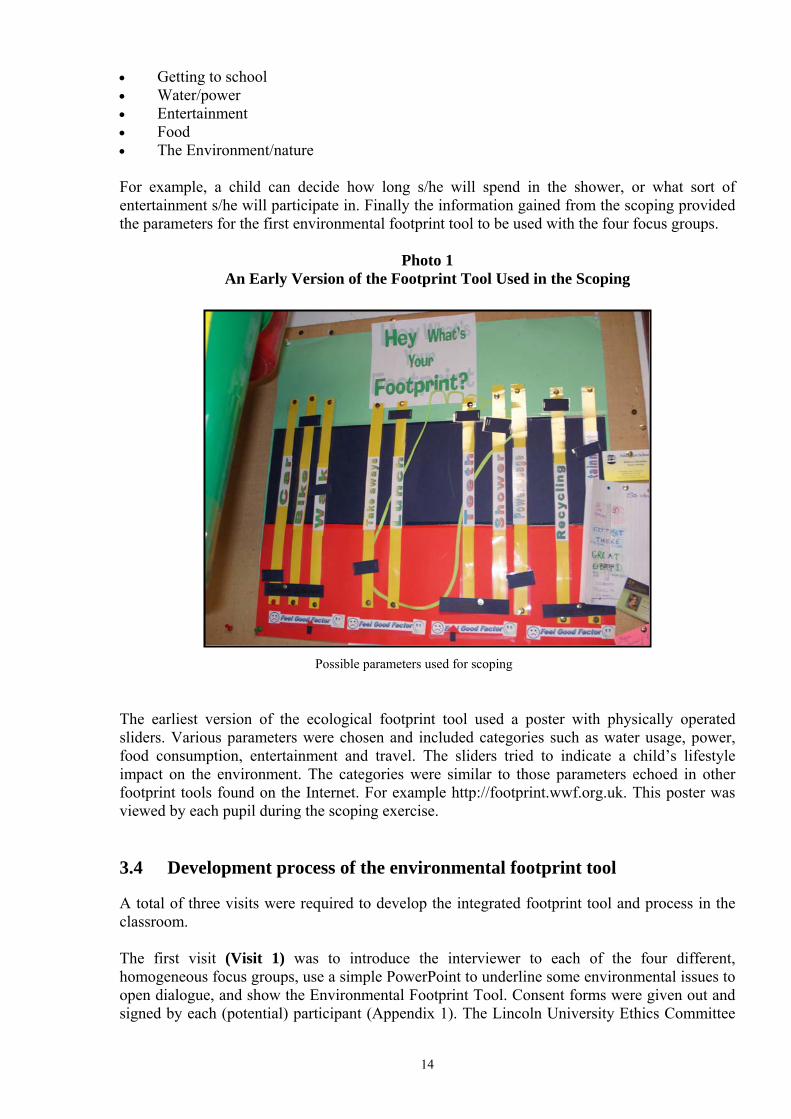
Photo 1 An Early Version of the Footprint Tool Used in the Scoping
The earliest version of the ecological footprint tool used a poster with physically operated sliders. Various parameters were chosen and included categories such as water usage, power, food consumption, entertainment and travel. The sliders tried to indicate a child’s lifestyle impact on the environment. The categories were similar to those parameters echoed in other footprint tools found on the Internet. For example http://footprint.wwf.org.uk. This poster was viewed by each pupil during the scoping exercise. 3.4 Development process of the environmental footprint tool
A total of three visits were required to develop the integrated footprint tool and process in the classroom. The first visit (Visit 1) was to introduce the interviewer to each of the four different, homogeneous focus groups, use a simple PowerPoint to underline some environmental issues to open dialogue, and show the Environmental Footprint Tool. Consent forms were given out and signed by each (potential) participant (Appendix 1). The Lincoln University Ethics Committee
Possible parameters used for scoping
15
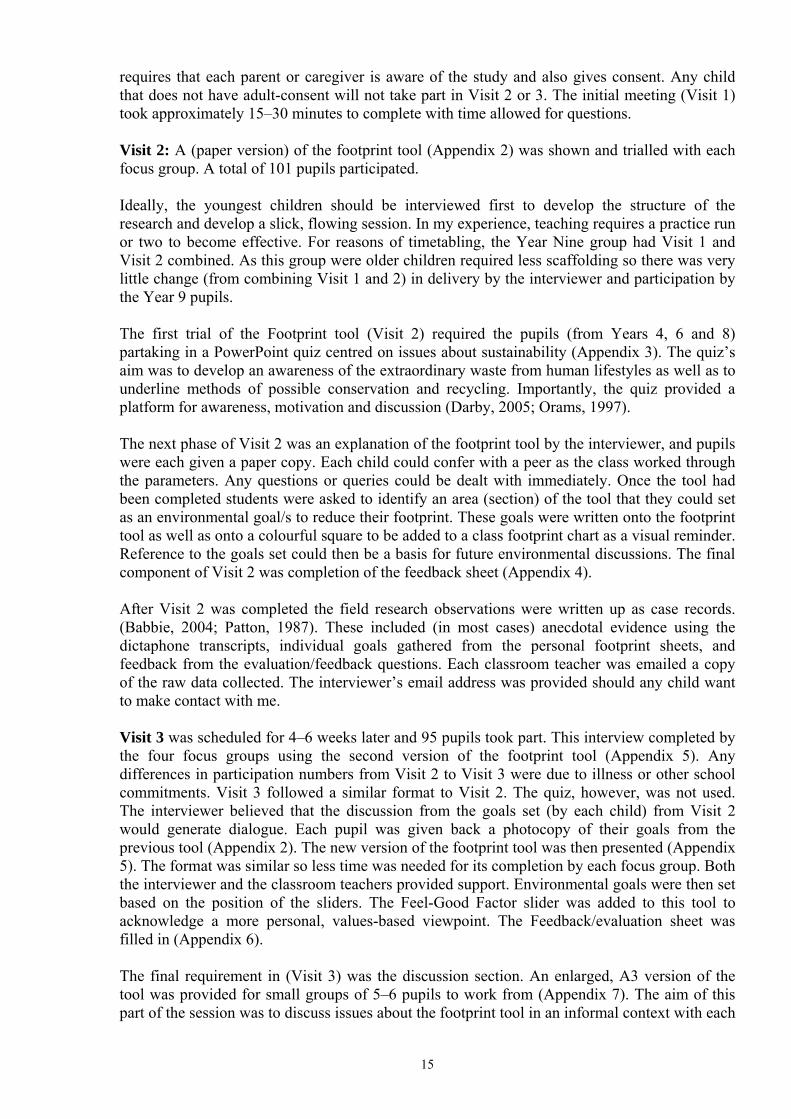
requires that each parent or caregiver is aware of the study and also gives consent. Any child that does not have adult-consent will not take part in Visit 2 or 3. The initial meeting (Visit 1) took approximately 15–30 minutes to complete with time allowed for questions. Visit 2: A (paper version) of the footprint tool (Appendix 2) was shown and trialled with each focus group. A total of 101 pupils participated. Ideally, the youngest children should be interviewed first to develop the structure of the research and develop a slick, flowing session. In my experience, teaching requires a practice run or two to become effective. For reasons of timetabling, the Year Nine group had Visit 1 and Visit 2 combined. As this group were older children required less scaffolding so there was very little change (from combining Visit 1 and 2) in delivery by the interviewer and participation by the Year 9 pupils. The first trial of the Footprint tool (Visit 2) required the pupils (from Years 4, 6 and 8) partaking in a PowerPoint quiz centred on issues about sustainability (Appendix 3). The quiz’s aim was to develop an awareness of the extraordinary waste from human lifestyles as well as to underline methods of possible conservation and recycling. Importantly, the quiz provided a platform for awareness, motivation and discussion (Darby, 2005; Orams, 1997). The next phase of Visit 2 was an explanation of the footprint tool by the interviewer, and pupils were each given a paper copy. Each child could confer with a peer as the class worked through the parameters. Any questions or queries could be dealt with immediately. Once the tool had been completed students were asked to identify an area (section) of the tool that they could set as an environmental goal/s to reduce their footprint. These goals were written onto the footprint tool as well as onto a colourful square to be added to a class footprint chart as a visual reminder. Reference to the goals set could then be a basis for future environmental discussions. The final component of Visit 2 was completion of the feedback sheet (Appendix 4). After Visit 2 was completed the field research observations were written up as case records. (Babbie, 2004; Patton, 1987). These included (in most cases) anecdotal evidence using the dictaphone transcripts, individual goals gathered from the personal footprint sheets, and feedback from the evaluation/feedback questions. Each classroom teacher was emailed a copy of the raw data collected. The interviewer’s email address was provided should any child want to make contact with me. Visit 3 was scheduled for 4–6 weeks later and 95 pupils took part. This interview completed by the four focus groups using the second version of the footprint tool (Appendix 5). Any differences in participation numbers from Visit 2 to Visit 3 were due to illness or other school commitments. Visit 3 followed a similar format to Visit 2. The quiz, however, was not used. The interviewer believed that the discussion from the goals set (by each child) from Visit 2 would generate dialogue. Each pupil was given back a photocopy of their goals from the previous tool (Appendix 2). The new version of the footprint tool was then presented (Appendix 5). The format was similar so less time was needed for its completion by each focus group. Both the interviewer and the classroom teachers provided support. Environmental goals were then set based on the position of the sliders. The Feel-Good Factor slider was added to this tool to acknowledge a more personal, values-based viewpoint. The Feedback/evaluation sheet was filled in (Appendix 6). The final requirement in (Visit 3) was the discussion section. An enlarged, A3 version of the tool was provided for small groups of 5–6 pupils to work from (Appendix 7). The aim of this part of the session was to discuss issues about the footprint tool in an informal context with each

16
group writing comments and adding colourful dots onto the A3 paper. The researcher travelled around the different groups, writing quick observations and field notes. The interviewer would provide a copy of the final footprint tool and an Internet address once this tool was hosted. A full report about the footprint’s development will be forwarded to all participating schools. The same process was used to collate field research observations after Visit 3 was completed. A dictaphone was not used in Visit 3 as the background noise levels made transcribing of individual conversations almost impossible. However, anecdotal data (from individual and group conversations) were recorded by the researcher. Each classroom teacher was again emailed a copy of the raw data. Discussions and the planning for this project were ongoing with the supervisors. Incorporating Action Research theory, systems thinking and a more collaborative learning process for environmental education became a significant focus (Allen, 2001; Allen et al., 2002; Bosch et al., 2007; Darby, 2005; Jensen, 2002; Whitehead & McNiff, 2006). The footprint tool was developed as an important leverage point: Effectively, the footprint tool’s context created the dialogue to develop environmental-action strategies for footprint reduction. The tool became a catalyst for pro-environmental behaviour change. However, it was this cyclic process of learning, doing and reflecting throughout this research project that was relevant for environmental behaviour change for the stakeholders (researcher, supervisors, teachers and pupils) (Ballantyne et al., 2001; Jensen, 2002; Keown & McGee, 1999). Finally, this collaborative cycle was placed within a supportive environment which facilitated the reason to act and modify behaviour (Allen, 2001 Chapter 3 p.7). The results section has been broken into two distinct parts. The first focuses on the scoping exercise, development of the footprint model, and information from each school visit. This is a linear process as the development of this part of the programme was driven by the length of time taken to complete this section of the project with each focus group. The second part tries to answer the research questions set in section (1.1). It collates the information from all the children and teachers – the feedback/evaluation sheets, conversations and observations – and further links the data collected from Visits 2 and 3 to the behaviour-change models and the Action Research methods.
17
Chapter 4 Scoping, Model Development and School Visits
4.1 Scoping
The scoping highlighted a number of key points. For example each of the three pupils interviewed cared deeply about the environment. Each child talked about special holidays camping in New Zealand as “peaceful and beautiful”. Another interviewee referred to building dams in a local river.
“ You [my family] go out for a whole day just mucking around on the river; it’s so much fun. Mum always makes great food cause you’re always starving!” (Year 8 pupil)
The use of power and batteries by school-aged children was another key point raised. All three participants regularly used a number of electrical appliances at home, from electric blankets to console games. One child said that family members (in his house) each had a television, stereo, electric blanket, computer or console game as well as battery-operated games and toys in their bedrooms. Provision would need to be included for high power usage in the footprint tool. Another key point was each child’s lifestyle was (reasonably) sustainable. For example, the after-school entertainment preferred was often an environmentally friendly option such as going to the park to kick a ball around with friends or reading a book. This group were less interested in going to the mall and spending money. They enjoyed cooking chocolate cake, scrambled eggs or pizza. Two pupils had vegetable gardens. Transportation was often an environmentally sustainable option. Travelling to school, friends or an after-school job was by bike or on foot. Occasionally car-pooling was used to a sports game or practice. Although these three pupils had small environmental footprints, the information gained was vital for the tool’s development. The scoping provided some further considerations. The tool needed to be purposed-designed, that is visually interesting and has parameters that were applicable to a child’s lifestyle. As mentioned in the literature any positive change in environmental behaviour needed to be highly visible on the tool. This would help to encourage positive learning experiences, motivate to act and foster actions (Ballantyne & Packer, 2005; Chawla, 1998; Darby, 2005; Jensen, 2002; Maiteny, 2002; Makki & Abd-El-Khalick, 2003; Orams, 1997). The scoping underlined a number of implications for this tool. For example, how could this tool show the high use of electrical appliances and battery-operated gadgets? How could this tool visually show a child who can watch television [or play a consol computer game] in two separate rooms as s/he moves around the house? Water consumption became another consideration. Did this tool need separate sliders to show numbers of showers per day or the time spent? Laundry was also mentioned in the scoping. Could this tool acknowledge whether children get clothes washed daily [even if still clean] or only when they were genuinely dirty? One child earned pocket money by water-blasting the family car. This is a high use of freshwater and a less sustainable option than washing the car using a bucket and cloth. Food choices are an important consideration. How would this tool show the consumption of highly packaged and processed foods bought at the supermarket or school canteen? If a child made his/her own lunch from individual ingredients such as sandwiches or home-made muffins how could this feature? The scoping brought to light consumption and waste patterns of young people or how a footprint tool might acknowledge other aspects of this focus group’s lives such

18
as positive environmental behaviour in the recycling of organic waste or keeping a worm farm. Conversely, negative environmental impacts discussed were overseas holidays, the high-energy and high-resource consumption in some forms of entertainment such as go-carting or shopping. Further, all three pupils acknowledged holidays in New Zealand as important and the connections to nature. One girl spoke of her annual holiday to the Nelson area.
“ Dad always works! Golden Bay is so beautiful and warm. The sea is so good to swim in; I love it there!” (Year 8 pupil)
Another subject spoke about a private camp site he visits in North Canterbury:
“Some times my Dad’s boss, Dad and me go to the pond…. We just sit around and stare into the pond. It’s a quiet time. I really like that.” (Year 8 pupil)
4.2 Footprint tool Version 1
Figure 3 First Version of the Footprint Tool
The footprint tool used in Visits 2 and 3 developed differently from other tools on the World Wide Web19. Ecological Footprint calculators are one way of providing information about a person’s or group’s lifestyle’s impact. However, for school-aged children a simpler, more visual tool might provide more specific information to develop the motivation to act positively (Orams, 1997). The development of an environmental goals section was designed to highlight and then encourage pro-environmental behaviour change in a supportive setting (Allen, 2001; Allen et al., 2002; Bosch et al., 2007). Furthermore, the need for complex units of measurement seemed unnecessary and limits some children from using a tool such as this. Finally, this tool needed to show any positive, environmental behaviour change both visually and explicitly. To highlight this change in behaviour, any reduction in that child’s footprint needed to be shown by a marked change on the sliders. 19 See section 2.2 for examples of ecological footprint calculators on the World Wide Web.
The Ecological Footprint tool used in Visits 1 & 2. Appendix 2
19
4.3 Footprint tool process model
This model (Figure 4) represents the learning process experienced by a pupil using the environmental footprint tool program. Although this model appears linear (with reference to the time taken to measure your footprint, set and execute environmental goals) the process of lowering your footprint is essentially cyclic as you move from one environmental behaviour goal to the next or revisit a previous goal. The repeated cycles of behaviour change further acknowledge the action learning process from planning, to action and self-reflection. This model tries to acknowledge that pro-environmental behaviour change does not happen in isolation using a single event such as a footprint tool. Rather, as Orams (1997) and Ballantyne et al (2005) would argue, changing your behaviour requires a number of internal and external factors – money, motivation to act, curiosity about environmental issue/s, supportive and effective educational programmes (Ballantyne & Packer, 2005; Darby, 2005; Jensen, 2002; Kollmuss & Agyeman, 2002; Orams, 1997, p. 298). Of equal importance, learning, or changing behaviour is in itself a cyclic process. This model recognises that developing pro-environmental behaviour can take time to understand and then practise – sometimes referred to as a double-loop learning (Mezirow, 1991, cited in Allen et al., 2002) where a new behaviour (issue to be addressed and solved) requires a reflective or critical process through conversation, action, trial and reflection. Like double-loop learning, the “behaviour change spiral” is a process to change behaviour over time. Parnell & Benton (1999) argue that learning is never straightforward or viewed as a single event. The behaviour-change spiral could also be applied within this ecological footprint tool model. According to Parnell & Benton (1999, p. 12) the difference in this second model (“behaviour change spiral”) recognises that behaviour change can be difficult to achieve and therefore a new behaviour might need to be modified or adapted for initial success. Again, the footprint tool allows for modification or adaptation. Sometimes a small change in environmental behaviour is better than nothing at all. Perhaps, using the recycling example, a child might decide to recycle all the plastic milk bottles and kitchen recyclables but leave other recyclables until she can persuade others to recycle alongside her. In this way she is still reducing her footprint. This positive behaviour change will be visible on the tool, but in time she can do even more to reduce her footprint as she gathers family support. This model of the environmental footprint programme applied Action Research methodology (Allen, 2001). Action Research involves taking action in social systems whereby the activity of the researcher-observer has direct involvement in the learning-action process. Fundamentally important for all classroom programmes is the development of ongoing learning as a social process through dialogue, collaboration and understanding (Allen, 2001; Ballantyne et al., 2001; Jensen, 2002; Keown & McGee, 1999). According to Allen (2001, Chapter 3, p.3) Action Research methodology is an appropriate model in qualitative research such as the footprint project. Another application for Action Research is the possibility of multiple solutions by any given group of pupils (May et al., 2003). The element of flexibility within the footprint programme allows for effective group work, critical thinking, and time to develop actions. Coupled with the behaviour change models the Action Research model facilitates desired outcomes of behaviour change through an holistic and democratic environment. Finally the Feel-Good Factor needs to be acknowledged. Although difficult to quantify, this model argues that if children can feel good about and value environmental issues they then have a chance to take action (Jensen, 2002) to lower their footprints.

20
Figure 4 The Footprint Tool Process
4.4 Results from Visit 1
Visit 1 introduced the interviewer to each focus group and the classroom teacher. The children viewed a PowerPoint presentation to help gauge their awareness, concern and knowledge about environmental issues (Ballantyne et al., 2001; Darby, 2005; Jensen, 2002; Maiteny, 2002; Orams, 1997). For example; one slide showed a polluted waterway with green sludge running into a stream from a rusted pipe. Discussions arose as to why this could be happening, who might be responsible, and how does this affect others who use this waterway? All the children interviewed showed concern.
“Those people who put bad stuff into that river should be made to clean it up!.... what happens if a duck or dog swims in that?” (Year 4 pupil)
In the final phase of Visit 1 each focus group viewed the footprint tool (Appendix 2). The consent forms were filled in by each student and then placed into school-bags to be taken home (Appendix 1). Any questions raised about the tool itself or the programme were answered by the researcher. This first visit took no longer than 20 minutes to complete. 4.5 Results from Visit 2
An interactive quiz was used to engage each focus group in environmental issues (Appendix 3). To encourage collaborative behaviour and create systems thinking practice the children could either work in pairs or complete the quiz by themselves (Allen et al., 2002; Bosch et al., 2007). The quiz’s aim was to develop an awareness of the extraordinary waste from human lifestyles as well as underline solutions such as conservation and recycling. For example, questions were asked about the efficiency of eco-friendly fluorescent lightbulbs compared with the conventional, incandescent bulbs. Another question focussed on how many plastic drink bottles were thrown away per hour in America in 2005? The answer was two million plastic bottles (Source http://earth911.org). Research suggests that good information can provide an excellent
21
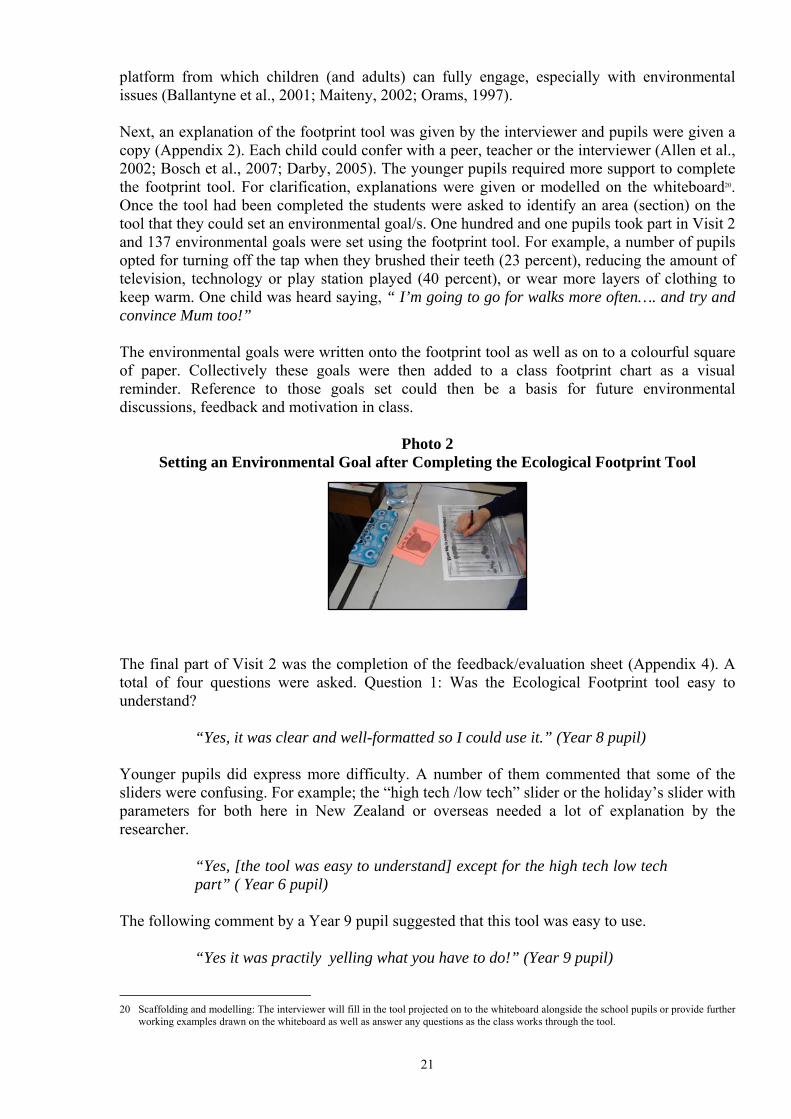
platform from which children (and adults) can fully engage, especially with environmental issues (Ballantyne et al., 2001; Maiteny, 2002; Orams, 1997). Next, an explanation of the footprint tool was given by the interviewer and pupils were given a copy (Appendix 2). Each child could confer with a peer, teacher or the interviewer (Allen et al., 2002; Bosch et al., 2007; Darby, 2005). The younger pupils required more support to complete the footprint tool. For clarification, explanations were given or modelled on the whiteboard20. Once the tool had been completed the students were asked to identify an area (section) on the tool that they could set an environmental goal/s. One hundred and one pupils took part in Visit 2 and 137 environmental goals were set using the footprint tool. For example, a number of pupils opted for turning off the tap when they brushed their teeth (23 percent), reducing the amount of television, technology or play station played (40 percent), or wear more layers of clothing to keep warm. One child was heard saying, “ I’m going to go for walks more often…. and try and convince Mum too!” The environmental goals were written onto the footprint tool as well as on to a colourful square of paper. Collectively these goals were then added to a class footprint chart as a visual reminder. Reference to those goals set could then be a basis for future environmental discussions, feedback and motivation in class.
Photo 2 Setting an Environmental Goal after Completing the Ecological Footprint Tool
The final part of Visit 2 was the completion of the feedback/evaluation sheet (Appendix 4). A total of four questions were asked. Question 1: Was the Ecological Footprint tool easy to understand?
“Yes, it was clear and well-formatted so I could use it.” (Year 8 pupil) Younger pupils did express more difficulty. A number of them commented that some of the sliders were confusing. For example; the “high tech /low tech” slider or the holiday’s slider with parameters for both here in New Zealand or overseas needed a lot of explanation by the researcher.
“Yes, [the tool was easy to understand] except for the high tech low tech part” ( Year 6 pupil)
The following comment by a Year 9 pupil suggested that this tool was easy to use.
“Yes it was practily yelling what you have to do!” (Year 9 pupil)
20 Scaffolding and modelling: The interviewer will fill in the tool projected on to the whiteboard alongside the school pupils or provide further working examples drawn on the whiteboard as well as answer any questions as the class works through the tool.
22
This insightful comment suggests that for older pupils, less scaffolding and modelling was needed.
Photo 3 Completing the Feedback/Evaluation Sheet
Questions 3 and 4 on the feedback/evaluation sheet provided information about the tool’s effectiveness. Does this tool provide some environmental awareness and more importantly, motivation to act positively for the environment? Ninety percent of pupils agreed that this footprint tool provided visual information about their resource use.
“Yes, because you realise how much you are using!” (Year 6 pupil) “Yes it showed how much power I use” (Year 4 pupil)
The goal-setting component of the tool provided a platform for goal achievement. Coupled with this section of the tool was the fourth question that asked if the tool helped identify an area for footprint reduction. Ninety percent of the focus group agreed that the tool helped to identify specific parameters for lowering their own footprint.
“Yes help Mum recycle more milk bottles and [soda] cans” (Year 4 pupil) “Yes by remembering to turn off the power when we don’t need it” (Year 6 pupil)
The feedback/evaluation sheet (Appendix 4) from Visit 2 provided information about the effectiveness of the footprint tool. Moreover, the feedback/evaluation sheet allowed pupils space to express their own opinions. As this footprint tool is designed for school-aged children it needed to be assessed by young people to ensure the footprint tool’s effectiveness. A number of researchers posit that the opportunity for personal input acknowledges a personal contribution as a vital component of systems thinking practice (Allen et al., 2002; Ballantyne & Packer, 2005; Bosch et al., 2007; Jensen, 2002; Parnell & Benton, 1999). A number of helpful suggestions were made by all the focus groups interviewed. However, the older pupils were able to suggest improvements that could be incorporated into the Footprint tool. For example, a high proportion of the Year 9 focus group agreed that a separate column for both computer and bus transport was necessary. The younger (Year 4) pupils found the
23
references to the slider “Low and High tech” confusing as well as the slider for holidays (in New Zealand versus overseas). The researcher and classroom teacher had a quick debrief session to discuss any issues and developments required. The classroom teacher was emailed a copy of the raw data collected. 4.6 Results from Visit 3
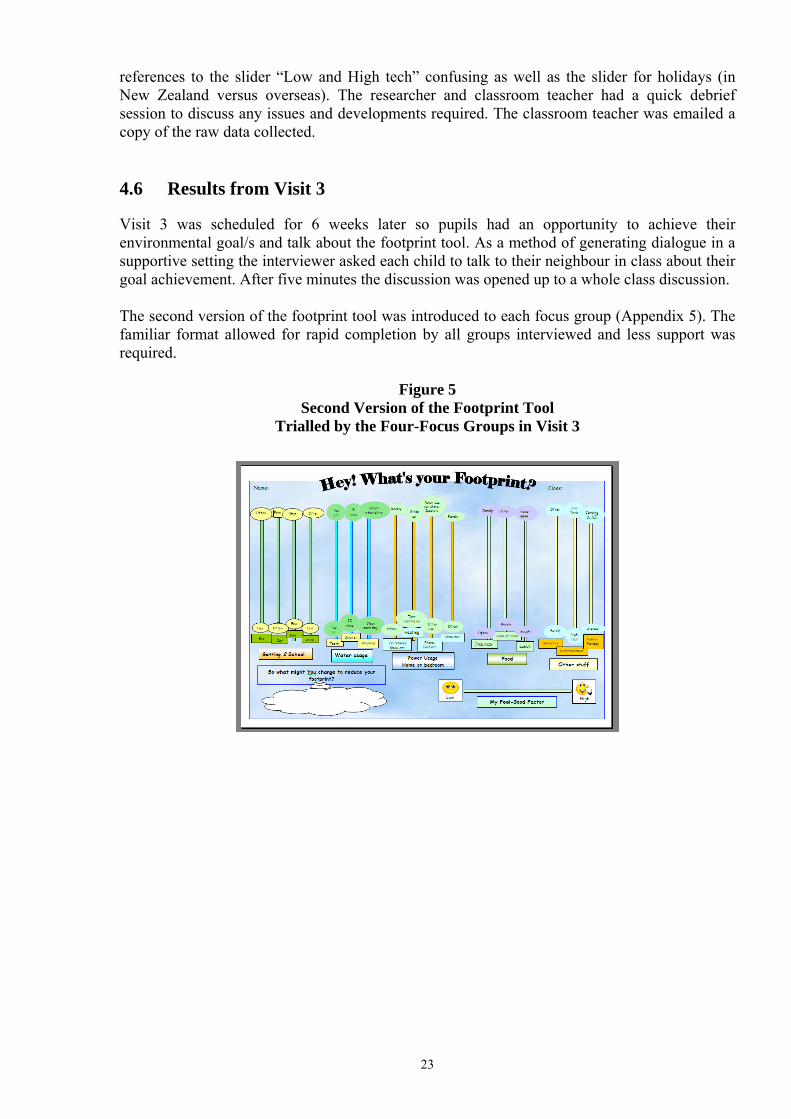
Visit 3 was scheduled for 6 weeks later so pupils had an opportunity to achieve their environmental goal/s and talk about the footprint tool. As a method of generating dialogue in a supportive setting the interviewer asked each child to talk to their neighbour in class about their goal achievement. After five minutes the discussion was opened up to a whole class discussion. The second version of the footprint tool was introduced to each focus group (Appendix 5). The familiar format allowed for rapid completion by all groups interviewed and less support was required.
Figure 5 Second Version of the Footprint Tool
Trialled by the Four-Focus Groups in Visit 3


25
Chapter 5 Answers to the Research Questions
5.1 Visual presentation of “One’s Footprint” + resource usage
The second version (Appendix 5) of the environmental footprint tool was able to provide a snapshot of the child’s lifestyle’s impact. Seventy-seven percent of pupils who used the second version of the tool liked it more because it had “better options and format”. Seventy-five percent of pupils made explicit comments about how the positions on the sliders helped then to understand how many resources are used each day.
“I found it easier because there were more questions [sliders] so you could see nearly everything you were doing right or wrong.” (Year 8 pupil) “I’m going to turn off the heater more often.” (Year 6 pupil)
A number of students mentioned that the added “Feel-Good Factor” slider (an added addition to the second tool trialled) as being a valuable option on the footprint tool.
“ Yes, because it feels like you are being noticed.” (Year 9 pupil) “I liked the ‘Feel-Good Factor’ part.” (Year 4 pupil) “It [Feel-Good Factor] acknowledges positive behaviour.” (Year 6 pupil)
The Feel-Good Factor slider was added to this new version of the tool to acknowledge a more personal, and values-based viewpoint. Further, the Feel-Good Factor might highlight positive or negative feelings about environmental achievement. Of the 95 students who filled the “Feel-Good Factor” slider 85 pupils rated it positively while 10 pupils found it had a negative impact.
“No, it makes me feel guilty about using so much.” (Year 9 pupil) The feedback sheet (Appendix 6) also gathered data about the effectiveness of the Feel-Good Factor slider and specifically asked in Question 1: Q.1: Does using the E.F.Tool make you “feel good” about reducing your footprint? Eighty-one pupils (90 percent) indicated that using the footprint tool made them feel good about reducing their footprint.
“Yes it does make me feel great because it helps the world be a better place.”(Year 6 pupil) “Yes it helped me to realise the resources I waste.” (Year 6 pupil)

26
5.2 Awareness of environmental issues as a result of using this tool
Both feedback/evaluation sheets used in visits 2 and 3 (Appendix 4 & 6) gathered data about the effectiveness of this tool. A large number of pupils could highlight a precise area on the tool that identified their resource use. Eighty-one percent of pupils agreed that the tool helped them to identify different resources used such as electricity, water, transportation and waste. Question 2: Did the Environmental Footprint tool (EFT) help you to understand how you use resources (like power, water and transport (fuel)) wisely or wastefully each day? Tell me how?
“Yes, because I can see how much power I am using.” (Year 4 pupil) “Yes, it showed me how I leave the tap on [when brushing teeth] and use the computer.” (Year 9 pupil)
This second group of comments suggests that using this tool helped bring awareness about the focus groups’ environmental impact. Eighty-one percent of pupils thought that this tool made them aware of specific resources used by stating specific areas for personal footprint reduction.
“Yes, because I have never really thought about what I do and how it affects the environment until now.” (Year 8 pupil) Yes, it showed me that I use too much technology [computer games, Xbox, PS2, etc.] and I need to cut down.” (Year 9 pupil) “Yes it makes me think about walking more often” (Year 6 pupil)
5.3 Motivation to act, goal setting and behaviour change
Being aware about footprint reduction does not necessarily bring about behaviour change in an individual or group (Aleixandre & Rodriguez, 2001; Ballantyne & Packer, 2005; Heimlich & Ardoin, 2008; Orams, 1997) However, motivation to act positively for the environment could be linked to the environmental goals set by each group. In Visit 2 the total number of goals set exceeded the number of children. This suggests that these pupils were interested in this footprint tool and sufficiently motivated to set a goal that would affect their personal footprint. The goals section within this tool, as well as dialogue and support in class, would help to facilitate positive environmental attitudes and motivation. The Goals section of the footprint tool was developed to encourage specific pro-environmental behaviour change. As stated earlier; On Visit 2, 137 environmental goals were set by 101 pupils ranging from turning off the tap when brushing their teeth to biking and using the bus more often. Each goal was also written onto colourful squares and glued onto a ‘Goals Poster’. Teachers were asked to talk about the environmental goals set and offer and gather feedback from pupils about attaining their environmental goals before the final visit in 6 weeks time. Two teachers mentioned that pupil’s goal setting varied markedly. Those pupils who set realistic and manageable goals were more likely to achieve pro-environmental behaviour change. For example, turning off the tap when brushing their teeth became easier as that child remembered to change her/his behaviour (Allen et al., 2002; Parnell & Benton, 1999). Another pupil set a goal of watching less television. He found this difficult because he forgot. The interviewer asked the class to suggest ways to help him remember his environmental goal.
27
Suggestions ranged from putting a notice on the television to finding other entertainment (reading a book, doing homework [not popular], playing outside, having friends around). The pupils agreed that to change your behaviour you need to be organised, and perhaps have others in the family supporting you. Finally it was agreed that to be able to reduce television watching a time limit needed to be set as a realistic and more achievable goal. This would be visible on the footprint tool because using fewer resources (power) lowers your impact on the environment. Discussion in class as well as the feedback/evaluation sheet (Appendix 6) from Visit 3 asked specific questions about goal achievement. Q.1 After using the EFG (the first session) you then set a goal/s to reduce your footprint. Did you find it easy or difficult to achieve your goals? (Tell me) How do you feel about it? It became evident from discussion and from the data collected that some pupils found it easy to achieve their personal goals while others found it difficult. Some pupils suggested that their personal goals were hard to achieve. For example; other people in the home were not as supportive about the environmental goal set, or issues about forgetfulness or planning arose.
“Sometimes it was easy to remember my goal but sometimes I forgot because I had nothing to remind me.” (Year 8 pupil)
Other pupils appeared more positive about their achievements and went on to set another goal. The researcher also talked about the difficulties in changing behaviour or a habit and talked about some of the research concerning pro-environmental behaviour change. For example double-loop learning and also the behaviour change spiral model which acknowledges the process of behaviour change is never straightforward (Allen et al., 2002; Parnell & Benton, 1999). With ongoing discussion some pupils appeared happier because they had partially achieved their goals.
“Yes.. sort of.. I at least feel good about doing something [for the environment].” (Year 9 pupil)
Data gathered from the feedback sheets suggested that 56.0 percent of pupils (51 out of 91) found that they had easily achieved their environmental goal. Of that group, 41 pupils were from the two younger cohorts and seemed genuinely more positive. Only 10 pupils from Year 8 and 9 groups felt that they had easily achieved their environmental goal. And 14 out of 93 pupils (15 percent) thought that they had partially achieved their environmental goal/s. Interestingly, 26 out of 91 pupils (29 percent) found that they had difficultly in achieving the environmental goals set. One group were identified as being of high ability. This group had high expectations about their own personal achievement.
“I found it difficult because I was used to doing what I do. It’s annoying.” (Year 8 pupil)
Pupils suggested that their personal goals were hard to achieve for a variety of reasons. For example; other people in the home were not as supportive about the environmental goal set, or issues about forgetfulness or planning arose.
“I feel good about achieving my goals but it’s hard to break a habit.” (Year 8 pupil)

28
Another pupil wanted to wear his clothes until they were dirty to reduce water and electricity consumption. His Mum, however, wanted to wash his clothes everyday:
“I found it hard because Mum kept bossing me around.” (Year 6 pupil) 5.4 Could this tool help to persuade others to act more sustainably?
The discussions held as well as a specific question from the feedback/evaluation sheet were designed to gather data on how effectively young people persuaded other family members to reduce their footprint. Rickinson & Reid’s (2003) and Ballantyne & Packer’s (2005) research suggests that children can influence other family members. Based on this premise, Question 5 asked the pupils to record any ideas that had been discussed for home footprint reduction (Appendix 6). Q.5 Have you talked with your parents/caregivers/family about reducing your footprint? Yes or No (Circle one) If you answered “yes” what ideas have you discussed with your family about reducing their footprint? The data gathered suggests that in all of the focus groups children were not sufficiently motivated to tell a parent or other family member about footprint reduction. Ninety-one students answered this question. Seventy-six children (84 percent) had not mentioned the environmental footprint tool whereas 16 percent had mentioned the footprint tool and had linked their discussion to an environmental goal achieved.
“Yes, we will watch less television and have shorter showers.” (Year 6 pupil)
Photo 4
Discussion Section Using a Modified Version of the Footprint Tool (Year 6 pupils)
The final data gathered from Visit 3 were the discussions generated from the “Discussion version” of the footprint tool (A3 paper copy) using small groups within each class (Appendix 7). The researcher had some specific questions for each group. Answers were written onto the A3 tool by a child or the researcher. For example; the Transportation parameter was referred to as “Getting 2 School” on all versions of the footprint tool. Children, however, do more than go to school. This tool does not take into consideration the transport needs such as getting to and
29
from sports, music, and “other” places. The “Getting 2 School” parameter appeared limiting. Of the 18 groups interviewed 15 groups wanted that parameter changed to “Getting Around” while 3 groups wanted the name “Getting 2 School” parameter to remain. A sports column was also discussed. If a sports column was added to the footprint tool, under which parameters would it best fit? This tool didn’t recognise or acknowledge school children who played sport regularly. This generated discussion about the effects of being active on the environment. One pupil commented that
“Playing sport is good for the environment and us. It keeps you fit and healthy and it saves power. If you need a shower after playing sport – just have a short one!” (Year 4 pupil)
Seventeen out of the 18 groups interviewed wanted a sports column included on the tool. Discussions were voiced about acknowledging other, unconventional sports played, such as karate, hiking or mountain biking. One boy suggested an “Active Column” rather than a “Sport Column” as being a better alternative on this footprint tool.
“Not everyone plays sport but they might bike heaps, walk a dog or play games [like tag].” (Year 6 pupil)
Colourful dots were used to show a distribution (of ideas or opinions) on the particular sliders chosen at random. Data like these are very difficult to analyse. Different groups chose different sliders to discuss. Some groups recorded their discussions while other groups chose not too. The researcher and homeroom teacher recorded some responses and talked about aspects of the tool. Valuable information could have been lost as the researcher and or the children failed to collect raw data accurately. 5.5 Results from incorporating the Action Research Model into the Footprint Programme
The discussion section of the footprint programme encouraged the process of action research. Group dynamics can facilitate systems thinking with open dialogue, problem solving and participation (Allen, 2001; Allen et al., 2002; Bosch et al., 2007; Jensen, 2002). The focus groups could voice their own opinions about the tool and the goals set. Most remarkable was the atmosphere experienced by the researcher as the discussion section took place. Albeit difficult to gather, the process used to gather information, support others and create a positive learning environment was very noticeable. A discussion [remembered by the researcher] about water reduction by a Year 8 group highlights the process of planning, actioning and reflecting using the Action Research model.
“I keep forgetting to get out of the shower.” (First Year-8 pupil) “Why don’t you take a radio or alarm clock into the bathroom with you?” (Second Year-8 pupil) “You could get your Mum to bang on the [bathroom] door, hehe.” (Third Year-8 pupil) “Yeah, might try that, thanks.” (First Year-8 pupil)
30
Although the discussion section lent itself to the Action Research model, the questions asked, the discussions voiced, the participation and actions undertaken throughout the second and third visits suggested that the process of Action Research encouraged pro-environmental attitudes and behaviour change. 5.5.1 Discussion Three-quarters of the children interviewed stated that this footprint tool was easy to read and use (Appendix 5). The positioning of the sliders was also helpful and provided useful information about resource use through dialogue. In Visit 3 the “Feel-Good Factor” slider was acknowledged as having a valuable contribution.
“Yes it does because it helped me help the environment.” (Year 8 pupil) “It gave me a positive voice.” (Year 6 pupil)
Has this tool increased children’s environmental awareness? The researcher would argue that the tool, on its own, would provide limited support for young people to become more environmentally aware. Rather, it was the whole teaching process used that increased the awareness about environment issues (Ballantyne & Packer, 2005; Chawla, 1998; Kollmuss & Agyeman, 2002, p. 246; Maiteny, 2002; Palmer et al., 1998). Deliberately, a number of support mechanisms, such as PowerPoint presentations and the quiz show, were used to highlight environmental issues. The presentations were simple, using explicit photographs (from the Internet) to show aspects of pollution, global warming and biodiversity loss. Time was set aside at the start of both Visits 1 and 2 to encourage dialogue and gauge environmental awareness and concern. The quiz (Appendix 3) was used to heighten environmental awareness but also feed information for possible solutions to consumerism and waste. Another important process used by the researcher was the dialogue created and in a supportive environment (Allen, 2001; Allen et al., 2002; Bosch et al., 2007). To encourage systems thinking practice pupils could confer with each other, the classroom teacher and the interviewer. This involved the PowerPoint presentations, quiz show and while filling out the footprint tool, the feedback/evaluation sheets and the discussion version of the tool. Critically important in the delivery of any classroom programme is the use of information, skills, resources, and actions in an open, holistic environment. It is the combination of all aspects of this footprint process, the discussions, resources and the tool itself that helped increase environmental awareness in 80 percent of the children.
“Yes, because I have never really thought about what I do and how it affects the environment until now.” (Year 8 pupil)
Has this environmental footprint tool sufficiently motivated children to set environmental goals and change their behaviour? As stated earlier, being aware about an environmental issue, or having specific knowledge or positive environmental attitudes does not necessarily bring about behaviour change (Heimlich & Ardoin, 2008; Kollmuss & Agyeman, 2002). Many researchers posit that the ultimate goal in environmental education is in changing behaviour (Bolstad, (2003); McKeown & Hopkins, 2003; Tilbury, 1995). To support this role in footprint reduction a “goals section” was used to gauge the motivation to act (goal setting) and goal achievement of pupils (behaviour change). A goals section was placed on the tool itself and also on a separate “Goals Poster”. This would help encourage and reinforce behaviour change. In Visit 2 the total number of goals set exceeded the number of children. This suggests that these pupils were interested in this footprint tool and sufficiently motivated to set a goal that would affect their own behaviour to reduce their footprint. The goals section, as well as the dialogue generated,
31
would help to facilitate positive environmental attitudes and motivation. Aleixandre & Rodriguez (2001), Allen (2001), Ballantyne & Packer (2005), Jensen (2002), Darby (2005), Orams (1997), and Maitney (2002) all posit that to develop pro-environmental awareness, motivation and (perhaps) behaviour change needs a combination of good information, a supportive environment, time to engage, feedback about the goals set, and the provision for outside providers to establish behaviour change. This whole footprint process of goal setting and goal achievement as well as the dialogue and critical thinking has the potential to reduce your impact on the environment. Interestingly, two teachers identified some barriers to the achievement of some pupils’ goals. Those children, who set manageable and realistic goals, such as turning off the tap when brushing their teeth, were more likely to be achieved. Those children who set vague, less well-structured goals had more difficulty in their goal achievement (watch less television or use less technology). Other barriers could be highlighted from several viewpoints. Some children expressed difficulty in changing their behaviour because they were not supported. Parents and caregivers were mentioned by several pupils as either forgetting to remind the child (time in the shower) or disagreeing with the goal set (walking to school or laundry). Another barrier was the language used by the interviewer or on the tool itself. Those children who spoke English as a second language were not well-catered for in this research. Other issues that might have affected the numbers of pupils who achieved their environmental goals are issues of time-management, as is, a burgeoning timetable and an overstretched curriculum (for stressed teachers) (Eames & Cowie, 2004; Law, 2004). The short amount of time spent by the interviewer in each class might have prohibited effective behaviour change in some of this group. Although a majority (56.0 percent pupils) felt that they had easily achieved their environmental goals and 13 percent had partially achieved them, a number (28 percent) expressed difficultly. The success of footprint reduction needs to be ongoing and sustaining. Should the interviewer spend more time in the classroom supporting the actions set by the pupils? Further research in this area would be valuable. The programme’s design and the processes used to change environmental behaviour may have been at fault. Perhaps a substantial programme could be provided to schools with many links to the curriculum. An integrated footprint programme that contains a number of resources, expert contacts, outsider providers (such as Landcare Research or Environment Canterbury) skills and possible action-learning, systems thinking (Bosch et al., 2007, p. 219) models – this would help facilitate pro-environmental behaviour change. Another barrier to understanding pro-environmental behaviour change is in the process of appreciating and understanding the “behaviour change process” by children. Although a number of older children expressed frustration at not having achieved their environmental goal 12 percent of pupils were happy to have partially achieved. The researcher discussed a number of models used to demonstrate how behaviour can be changed. The behaviour change spiral (Parnell & Benton, 1999) and double-loop learning (Mezirow, 1991, cited in Allen et al., 2002) were mentioned by the researcher to each focus group. Pro-environmental behaviour change might need to be modified or adapted for initial success (Parnell & Benton, 1999). This process was greeted positively by all the focus groups.
“I found it quite hard to achieve my goals as it is hard to break a habit.” (Year 8 Pupil)
32
Linked to the barriers for understanding the process of behaviour change is the issue of cognitive dissonance. The focus groups interviewed appeared initially overwhelmed by the examples used from the quiz show or PowerPoint presentations. Some of the groups found it difficult to think of ways to alter their present lifestyle because these issues (pollution, consumerism, global warming, and deforestation) appeared too large and overwhelming.
“What’s the point when everyone else in the world dumps waste, drives around in huge vehicles and eats heaps of takeaway food! ” (Year 9 pupil) “It was hard! I feel Okay but I can’t change the way I live or how my parents do!” (Year 8 pupil)
The level of psychological discomfort appeared to be reduced over the course of the three visits. Sarah Darby (2005) and further supported by Ballantyne & Packer (2005) and Orams’ (1997) research any of these children were happy to discuss the difficulties in lowering their own individual footprint. However, if the Darby study is applicable, cognitive dissonance can be reduced through a number of factors such as constructive dialogue, behaviour change models, goal achievement feedback, outside resources as well as a good visibility of facts. Some 13 percent of children interviewed felt that they had partially achieved their environmental goals. The footprint tool has the potential to reduce cognitive dissonance through a change in behaviour and a change in thinking. Key to the reduction of dissonance is the support mechanisms put in place (Darby, 2005). Therefore it is the environmental footprint tool process, as a whole, that has the potential to reduce dissonance and provide information, motivation, and positive action strategies critical to develop pro-environmental behaviour change.
“Yes sort of… I at least feel good about doing something [for the environment]” (Year 9 pupil)
Data on whether or not this tool was able to motivate this group into talking to a parent/caregiver were gathered. Over 80 percent of this focus group had not mentioned the environmental footprint tool or their own environmental goals set to their parents. Again some of the barriers acknowledged such as the language used, time spent on the programme, the time with the interviewer, or a busy classroom schedule might have been responsible. Most interesting was the discussion session on Visit 3 (Appendix 7). Valuable feedback about the footprint tool’s design was discussed. The pupils acknowledged that the sliders were an effective way of showing resource usage but some of the parameters needed changing or removing altogether. For example, the transport parameter changed from “Getting 2 School” to “Getting Around” as the second option was less limiting. The slider referring to holidays in New Zealand or overseas was discussed. Although valuable discussion was gained about carbon-miles and environmental issues around holidaying overseas by the researcher, the children decided that parents had more control over holidays so this slider needed to be removed from the footprint tool. Another important discussion was sport. This tool didn’t, at this point, recognise or acknowledge school children who play sport. This generated discussion about the effects of being active on the environment. One pupil commented that
“I have practices most nights so I don’t use power as much after school…. but, Mum gets cranky cause I need lots of washing done all the time – especially with all this [crap] weather!!” (Year 9 pupil)
33
An “Active Column” was voted unanimously. Issues surrounding where to place this Active slider developed. Again a large majority voted for the “Other stuff” parameter for the placement of this new slider. For this group, sport was considered beneficial to the environment because sports equipment was reusable and recyclable. Children used their own energy rather than electricity to keep warm or entertained. If a shower was needed afterwards it could be a very short shower to limit water usage. As one pupil pointed out, “Mum could always wash the sport’s gear once a week.” Interestingly, most groups offered solutions to the environmental issues raised about sport. Further, the discussions made in these small groups were very worthwhile and could offer valuable insights into the sustainable behaviour of the class. This discussion version of the tool was an important part of the process. This process engaged small groups using parts of this tool that were of interest to them. According to Jensen et al. (1997) and Jensen (2002) children who develop their own interests and visions for environmental issues are more likely to take positive action. It was also critically important to get feedback from the groups about the footprint tool (Allen, 2001; Darby, 2005; Orams, 1997). This instrument was for children so it needed to resonate with their own lifestyles. Importantly, the double-loop model acknowledges the process of thinking and action through the various related stages of learning for an individual or group (Allen et al., 2002; Parnell & Benton, 1999). In relation to the footprint tool a child might decide to lower his/her footprint by becoming responsible for the household recycling. Changing your behaviour requires a lot of deliberate organisation; collecting all the household recyclables and perhaps, the training of others in the family. The act of recycling (tacit knowledge) coupled with a positive environmental attitude, motivation to act, as well as the skills and support to achieve that environmental goal can enhance positive behaviour change and reduce your footprint (Allen et al., 2002; Darby, 2005; Jensen, 2002; Maiteny, 2002; Orams, 1997). I was not convinced that one or two sessions using the footprint tool would facilitate enduring pro-environmental behaviour change. Therefore multiple and flexible methods using the action research model were applied (Allen, 2001; Whitehead & McNiff, 2006). For effective behaviour change a deliberate process of planning, action and reflection needed to occur for all stakeholders (Allen, 2001). The discussion section of the footprint process as well as the dialogue throughout the second and third visits encouraged the action learning practice. Goal achievement or non-achievement allowed for a process of self-reflection and learning. The boy who set the unrealistic goal of watching less television was helped to plan a better strategy. The dialogue allowed for a new action to be undertaken in a democratic and holistic manner. Further, the information offered by the researcher about behaviour change models helped to evaluate the goals set. The setting of a new or revisited goal on the footprint tool reinforces the cyclic process of action research, which is reflective, accountable and enables mutual understanding (Allen, 2001). As ongoing research it would be interesting to collate data on the success of Action Research process. If the Action Research programme had been used for a whole year would the children have experienced increased pro-environmental behaviour change?


35
Chapter 6 Conclusion
The aim of this project was to design and trial a purpose-designed environmental footprint tool for children and met the requirements of the New Curriculum Document 2007. Nearly 100 children took part in this study with their ages ranging from 8 to 14 years. The process involved scoping a small focus group to develop parameters for the tool that specially related to a child’s lifestyle such as water and power usage, transportation, food and “other”. Interestingly it was not the final version (Appendix 8) of the tool itself that encouraged environmental awareness and action; rather it was the whole teaching and learning process used by the researcher, over a period of several months. The programme involved quiz shows and PowerPoint presentations (to gauge interest and awareness of environmental issues). Group work was used throughout the programme to enable children to ask questions, talk to others, evaluate the tool, and set environmental goals. Barriers arose as some children found it difficult to achieve their environmental goals. An understanding of behaviour models and systems thinking as well as developing action-learning strategies did help to encourage dialogue between children as well as further goal achievement (behaviour change). Most importantly, this footprint tool is a snapshot of a child’s lifestyle impact at any given moment. However, over time and with discussion, support and encouragement pro-environmental, behaviour change was achieved by nearly 70 percent of the pupils surveyed. We argue that this footprint process could be beneficial to different teaching and learning programmes used by education providers. This cyclic process of using a purpose-designed tool coupled with effective Action Research models (in a supportive environment) facilitates enduring teaching and learning practice across all levels and curricula.
Figure 6 Final Version of the Footprint Tool from Design
Trial and Discussion with all Stakeholders


37
References
Aleixandre, M. P. J., & Rodriguez, R. L. (2001). Designing a field code: Environmental values in primary school. Environmental Education Research, 7(1), 5–22.
Ajzen, I., & Fishbein, M. (1980). Understanding attitudes and predicting social behavior.
Englewood Cliffs, NJ: Prentice-Hall. Allen, W. (2001). Working together for environmental management: the role of information
sharing and collaborative learning. PhD thesis?, Massey University, Palmerston North. Allen, W., Kilvington, M., & Horn, C. (2002). Using participatory and learning-based
approaches for environmental management to help achieve constructive behaviour change. Landcare Research Contract Report LC0102/057. Lincoln: Landcare Research. Retrieved from http://www.landcareresearch.co.nz/research/social/parrep.asp
Babbie, E. (2004). The Practice of Social Research (10th ed.). Belmont: Wadsworth/Thomson
Learning. Ballantyne, R., & Packer, J. (2005). Promoting environmentally sustainable attitudes and
behaviour through free-choice learning experiences: what is the state of the game? Environmental Education Research, 11(3), 281–295.
Ballantyne, R., Fien, J., & Packer, J. (2001). School Environmental Education Programme
impacts upon student and family learning: a case study analysis. Environmental Education Research, 7(1), 23–37.
Barrett, J., Birch, R., Cherrett, N., & Simmons, C. (2004). An Analysis of the Policy and
Educational Applications of the Ecological Footprint: Stockholm Environment Institute: York.
Bolstad, R. (2003a). Environmental education: Roots in the past, visions of the future,
opportunities in the present. Set, 2, 10–13. Bolstad, R. (2003b). Environmental education for secondary students. Set, 3, 25–30. Bosch, O., King, C., Herbohn, L., Russell, I., & Smith, C. (2007). Getting the big picture in
natural resource management – Systems thinking as method: for scientists, policy makers and other stakeholders. Systems Research and Behavioural Science, 24, 217–232. Retrieved from www.interscience.wiley.com DOI: 10.1002/sres.818
Chambers, N., Child, R., Jenkin, N., Lewis, K., Vergoulas, G., & Whiteley, M. (2005). Stepping
Forward – A resource Flow and Ecological Footprint Analysis of the South West of England. The South West England Environment Trust (SWEET).
Chawla, L. (1998). Significant life experiences revisited: a review of research on sources of
environmental sensitivity. Environmental Education Research, 4(4), 369–382. Cohen, S. (2001). States of Denial – Knowing about Atrocities and Suffering. Cambridge: Polity
Press. Darby, S. (2005). Social learning and public policy: Lessons from an energy-conscious village.
Energy Policy. Elsevier. Pp. 1–12.

38
Dick, B. (1998). Convergent interviewing: a technique for qualitative data collection. Retrieved from ftp://ftp.scu.edu.au/www/arr/iview.txt
Dillon, P. J., & Gayford, C. G. (1997). A psychometric approach to investigating the
environmental beliefs, intentions and behaviours of pre-service teachers. Environmental Education Research, 3(3), 283–297.
Eames, C., & Cowie, C. (2004a). Environmental education in New Zealand schools:
characteristics and achievements. Set, 2, 19–24. Eames, C., & Cowie, C. (2004b). Environmental education in New Zealand schools: challenges
for sustainability. Set, 3, 19–24. Heimlich, J., & Ardoin, N. (2008). Understanding behavior to understand behavior change: a
literature review. Environmental Education Research, 14(3), 215–237. Hillman, M., & Fawcett, T. (2004). How We Can Save The Planet. Auckland: Penguin Group
(NZ). Hines, J. M., Hungerford, H. R., & Tomera, A. (1986-1987). Analysis and synthesis of research
on responsible environmental behaviour: A meta-analysis. Journal of Environmental Education, 18(2), 1-8.
Hungerford, H. R., & Volt, T. L. (1990). Changing behavior through environmental education.
Journal of Environmental Education, 21(3), 8–21. Jensen, B. B. (2002). Knowledge, action and pro-environmental behaviour. Environmental
Education Research, 8(3), 325–334. Jensen, B. B., & Schnack, K. (1997). The action competence approach in environmental
education. Environmental Education Research, 3(2), 163–178. Keown, P., & McGee, C. (1999). Values in the Social Studies Project: The Final Report of the
Enviro-School Monitoring Project. Waikato: School of Education The University of Waikato.
Kollmuss, A., & Agyeman, J. (2002). Mind the gap: why do people act environmentally and
what are the barriers to pro-environmental behavior? Environmental Education Research, 8(3), 239–260.
Law, B. (2004). Environmental education/Education for sustainability. Paper presented at the
2004 UNESCO/JAPAN Asia Pacific Environmental Education Research Seminar. from http://www.eec.miyakyo-u.ac.jp/APEID2004/pdf/Barry.pdf
Loh, J. (2006, 2002). Living Planet Report. Cambridge, UK. Louie, A. J. (1997). The Role of Cognitive Dissonance in Decision Making. Retrieved from
http://www.yetiarts.com/aaron/science/cogdiss.shtml Maiteny, P. T. (2002). Mind the gap: summary of research exploring 'inner' influences on pro-
sustainability learning and behaviour. Environmental Education Research, 8(3), 299–306.
39
Makki, M. H., & Abd-El-Khalick, F. (2003). Lebanese secondary school student's environmental knowledge and attitudes. Environmental Education Research, 9(1), 21–33.
May, A., Shaw, H., Orlando, Y., & Boxelaar, L. (2003). Developing social capacity through
participatory action research – the application and evaluation of RAAKS. The Regional Institute Ltd http://www.regional.org.au/au/apen/2003/non_refereed/106maya.htm
McKeown, R., & Hopkins, C. ((2003)). EE=/=ESD: Defusing the worry. Environmental
Education Research, 9(1), 117–119. Ministry of Education. (1999). Guidelines for Environmental Education in New Zealand
Schools. Wellington, New Zealand. Ministry of Education. (2007). The New Zealand Curriculum for English-medium teaching and
learning in year 1–13. Orams, M. B. (1997). The effectiveness of environmental education: Can we turn tourists into
'Greenies'? Progress in Tourism and Hospitality Research, 3, 295–306. Palmer, J., Suggate, J., Bajd, B., & Tsaliki, E. (1998). Significant influences on the
development of adults' environmental awareness in the UK, Slovenia, and Greece. Environmental Education Research, 4(4), 429–444.
Parnell, B., & Benton, K. (1999). Facilitating Sustainable Behavior Change. A Guidebook for
Ddesigning HIV Programs. Victoria: MacFarlane Burnet Centre for Medical Research. Patton, M. (1987). How to Use Qualitative Methods in Evaluation: Program Evaluation Kit.
California, 91320: Sage Publications. Reynolds, M. (2008). Earthship Building: An Ecocentric Method of Construction. Retrieved
from http://www.greenhomebuilding.com/earthship.htm Rickinson, M., & Reid, A. (2003). What's the use of research in environmental education?
Paper presented at the Annual Meeting of the American Educational Research Association.
Ryan, B. (2004). Ecological Footprint analysis: An Irish rural study. Irish Geography, 37(2),
223–235. Spellerberg, A. (2001). Framework for the measurement of social capital in New Zealand.
Research and Analytical Report 2001#4. Wellington. Stern, P. C. (2004). Understanding global change: What Psychology can contribute? IHDP
Update (Newsletter of the International Human Dimensions Programme On Global Environmental Change), 4(2004), 4–5.
Stoeglehner, G. N., & Nardoslawsky, M., (2007). Implementing ecological footprinting in decision-making processes. Land Use Policy, doi:10(1016/j landusepol.2007.10.002), 1–11.

40
Tilbury, D. (1995). Environmental education for sustainability: defining the new focus of environmental education in the 1990s. Environmental Education Research, 1(2), 195–212.
Wackernagel, M., & Rees, W. E. (1996). Our Ecological Footprint: Reducing Human Impact
on the Earth. Gabriola Island, B.C.: New Society Publishers. Environment Waikato. (2006). Waikato Region Ecological Footprint 2004 (No. 2006/50).
Hamilton. (1123843) Whitehead, J., & McNiff, J. (2006). Action Research Living Theory. London: Sage Publications. Websites used http://www.enviroschools.org.nz http://www.yetiarts.com/aaron/science/cogdiss.shtml www.greenhomebuilding.com/earthship.htm
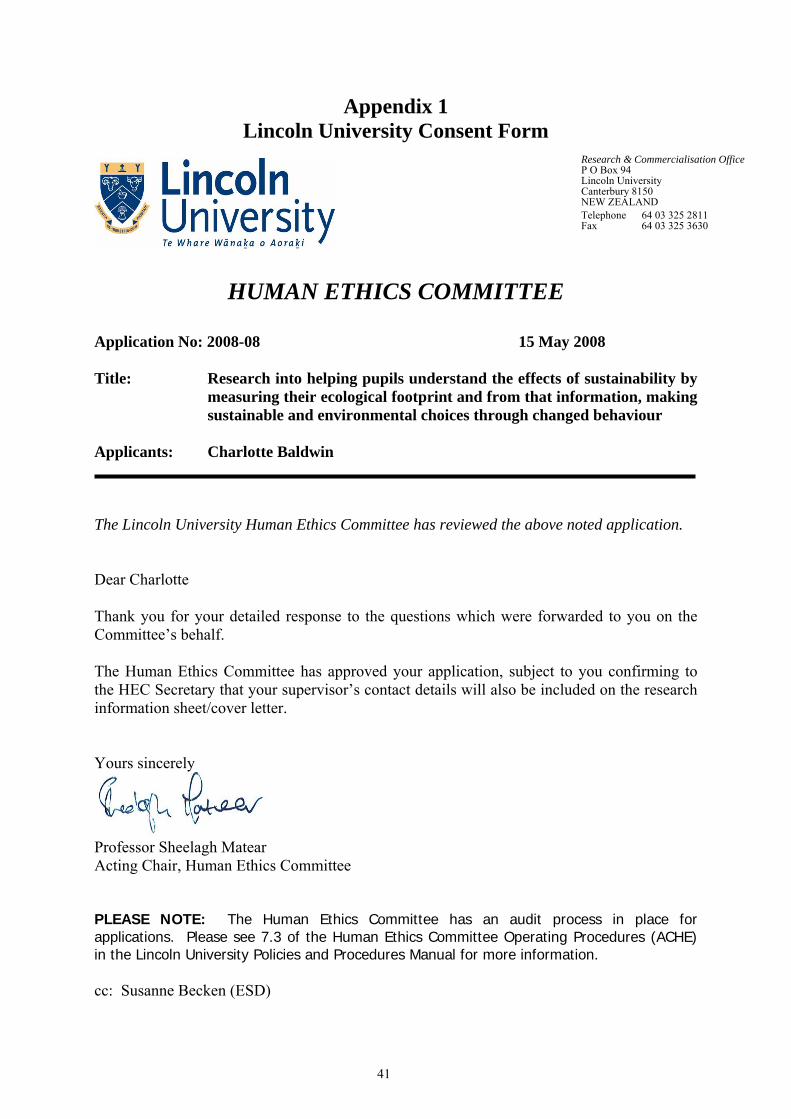
41
Appendix 1 Lincoln University Consent Form
HUMAN ETHICS COMMITTEE
Application No: 2008-08 15 May 2008 Title: Research into helping pupils understand the effects of sustainability by
measuring their ecological footprint and from that information, making sustainable and environmental choices through changed behaviour
Applicants: Charlotte Baldwin The Lincoln University Human Ethics Committee has reviewed the above noted application. Dear Charlotte Thank you for your detailed response to the questions which were forwarded to you on the Committee’s behalf. The Human Ethics Committee has approved your application, subject to you confirming to the HEC Secretary that your supervisor’s contact details will also be included on the research information sheet/cover letter. Yours sincerely
Professor Sheelagh Matear Acting Chair, Human Ethics Committee PLEASE NOTE: The Human Ethics Committee has an audit process in place for applications. Please see 7.3 of the Human Ethics Committee Operating Procedures (ACHE) in the Lincoln University Policies and Procedures Manual for more information. cc: Susanne Becken (ESD)
Research & Commercialisation OfficeP O Box 94 Lincoln University Canterbury 8150 NEW ZEALAND Telephone 64 03 325 2811 Fax 64 03 325 3630


43
Appendix 2 First Version of the Footprint Tool
lloW big is your FOOtprinW Class'
• -
" -
---, -- --
•• -.. .. .. , --""' ., ""'~
[~N;·~:~:'~-E·_·J'I·~-~~.~~·'·C';'? 1 ~i·~-' ~~' """" .!<
r ....... '-" "9" Homo .. bo<i-oom
--===-c ___ ::>
..... , .,... 0<0 ..
~,. -I Ge"'-c .;> ...... I
1l0"W big is your FootprinW " .. " • -
• -
--- - --
•• -..... , []:;-;":'-~-J~'~-~"~::'c'~;'J 19i1£' _n, ~ -'. .... ---
c ___ ::>

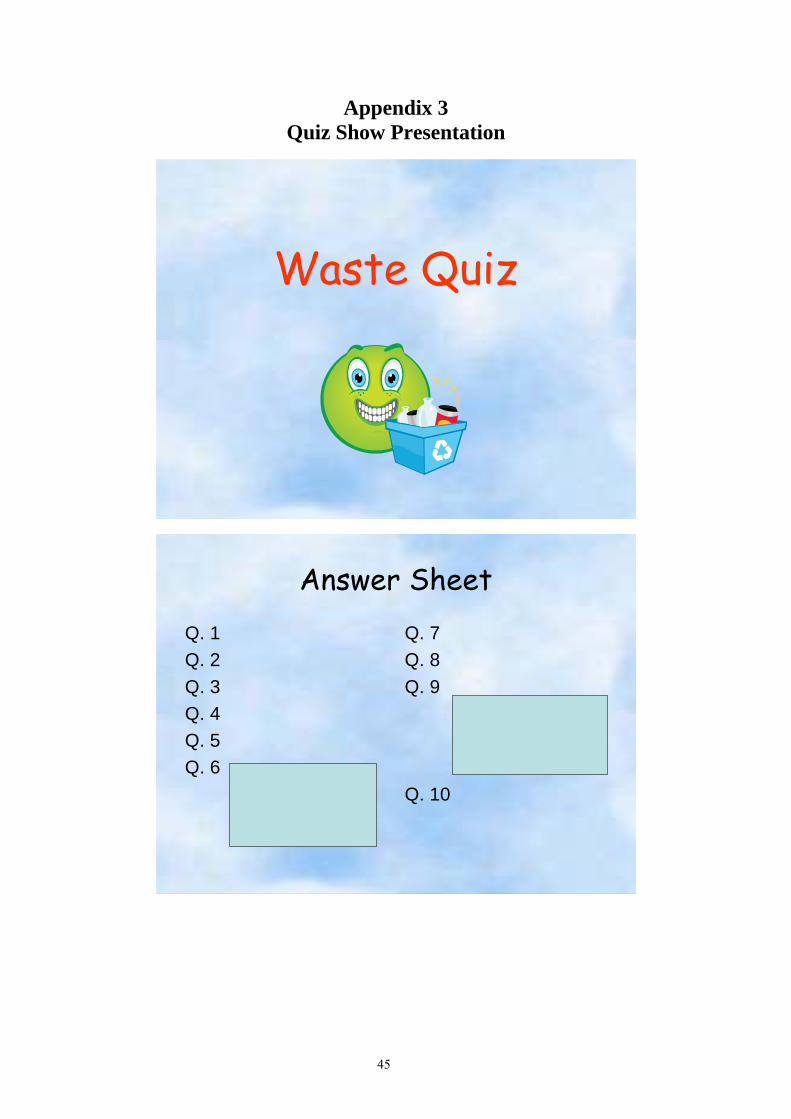
45
Appendix 3 Quiz Show Presentation
Waste Quiz
Answer SheetQ. 1Q. 2Q. 3Q. 4Q. 5Q. 6
Q. 7Q. 8Q. 9
Q. 10
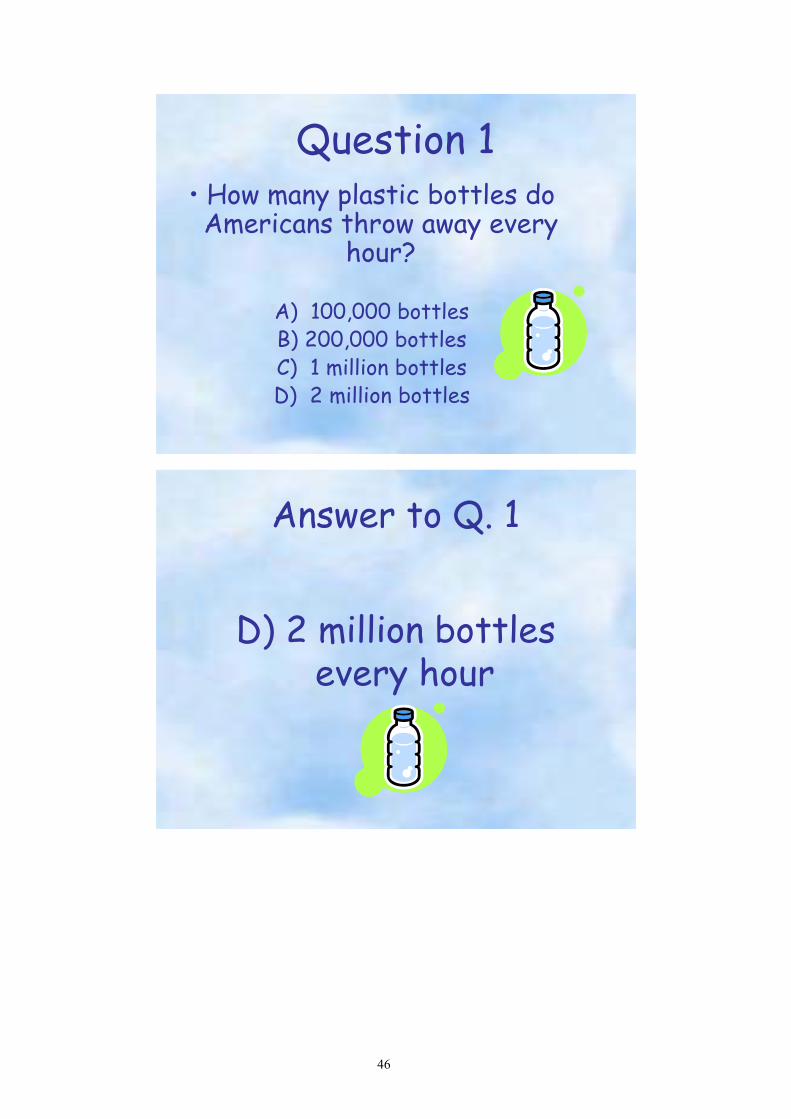
46
Question 1• How many plastic bottles do Americans throw away every
hour?
A) 100,000 bottlesB) 200,000 bottlesC) 1 million bottlesD) 2 million bottles
Answer to Q. 1
D) 2 million bottles every hour
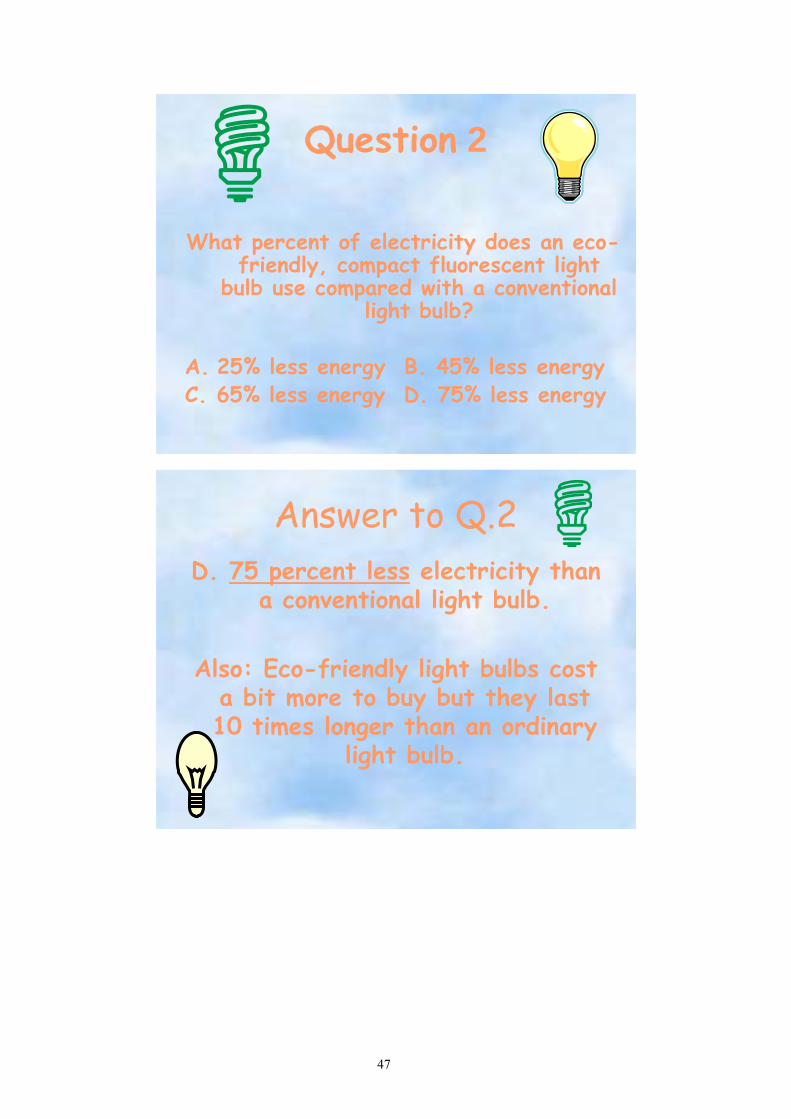
47
Question 2
What percent of electricity does an eco-friendly, compact fluorescent light
bulb use compared with a conventional light bulb?
A. 25% less energy B. 45% less energyC. 65% less energy D. 75% less energy
Answer to Q.2D. 75 percent less electricity than
a conventional light bulb.
Also: Eco-friendly light bulbs cost a bit more to buy but they last 10 times longer than an ordinary
light bulb.
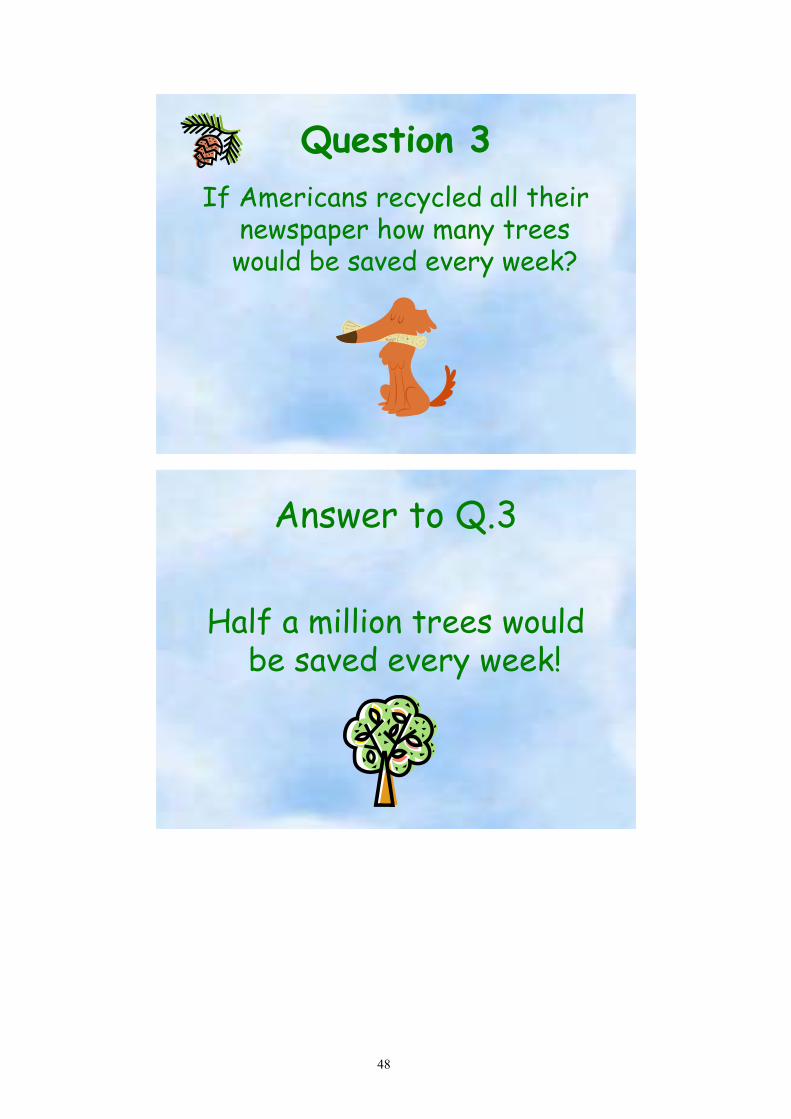
48
Question 3If Americans recycled all their
newspaper how many trees would be saved every week?
Answer to Q.3
Half a million trees would be saved every week!
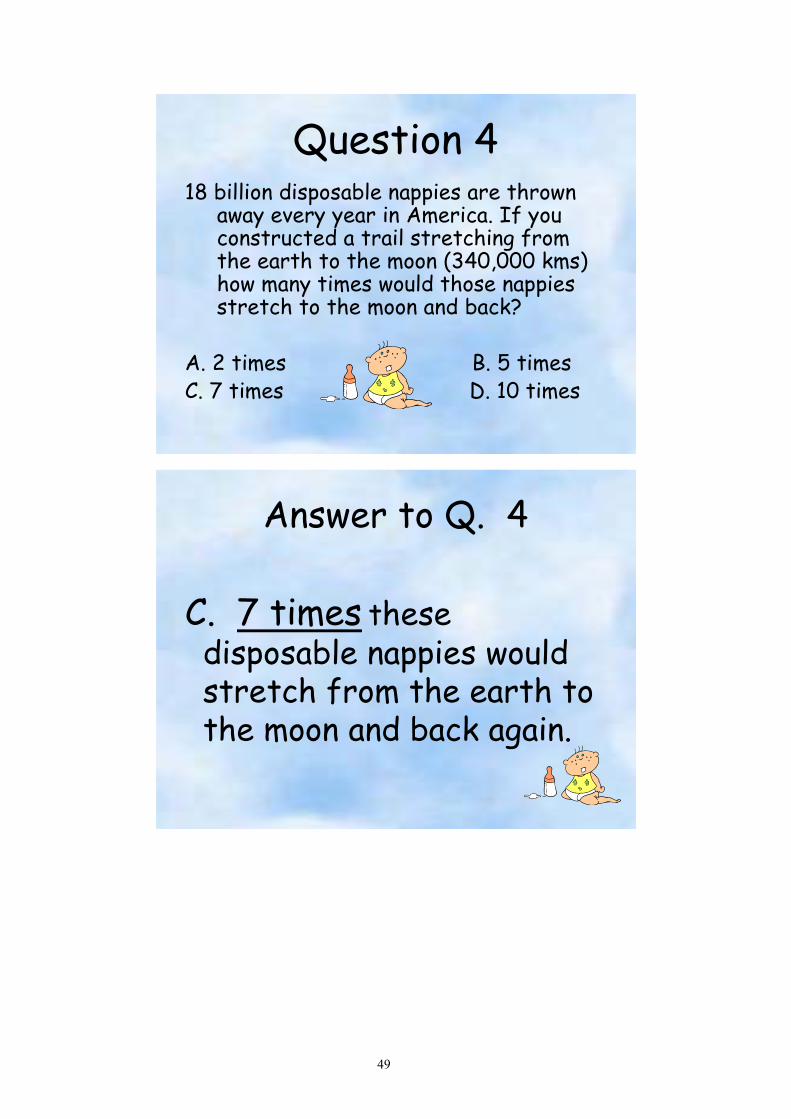
49
Question 418 billion disposable nappies are thrown
away every year in America. If you constructed a trail stretching from the earth to the moon (340,000 kms) how many times would those nappies stretch to the moon and back?
A. 2 times B. 5 times C. 7 times D. 10 times
Answer to Q. 4
C. 7 times these disposable nappies would stretch from the earth to the moon and back again.

50
Question 5What is E-waste?
A.Egg cartonsB.Computer waste
C.Cell phonesD.Batteries
Answer Q. 5Answers B,C & D are all types of
e-waste.E-waste is Electronic waste
In 2005 Americans threw away 130 million cell phones. That amounts to 65 tonnes of E-waste. Or the equivalent of 30 small elephants- worth of rubbish!
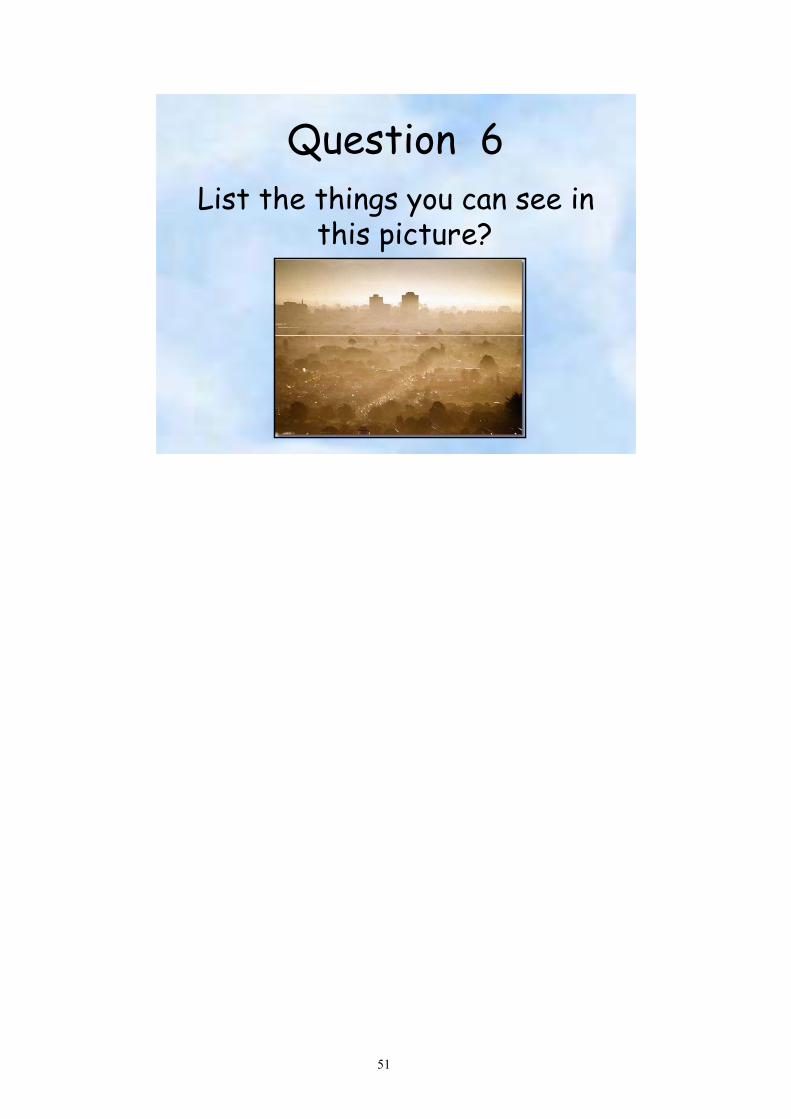
51
Question 6List the things you can see in
this picture?
52
Question 7Recycling – what do you know?
If you recycled just 1 aluminium can it would save enough electricity to power your computer or T.V for……
A. 30 minutes, B. 1 hourC. 2 hours D. 3 hours
Answer Q. 7
1 Aluminium can would save enough electricity to run your
computer or T.V for
3 hours.
53
Question 8If we use paper that has been made
from recycled materials like cardboard or reused paper………..
How much less pollution are we putting into the atmosphere and our
waterways?A. 50 % lessB. 70% less
Answer to Q. 8B. 70% is more correct
In fact: We create 74% less air pollution
35% less water pollution
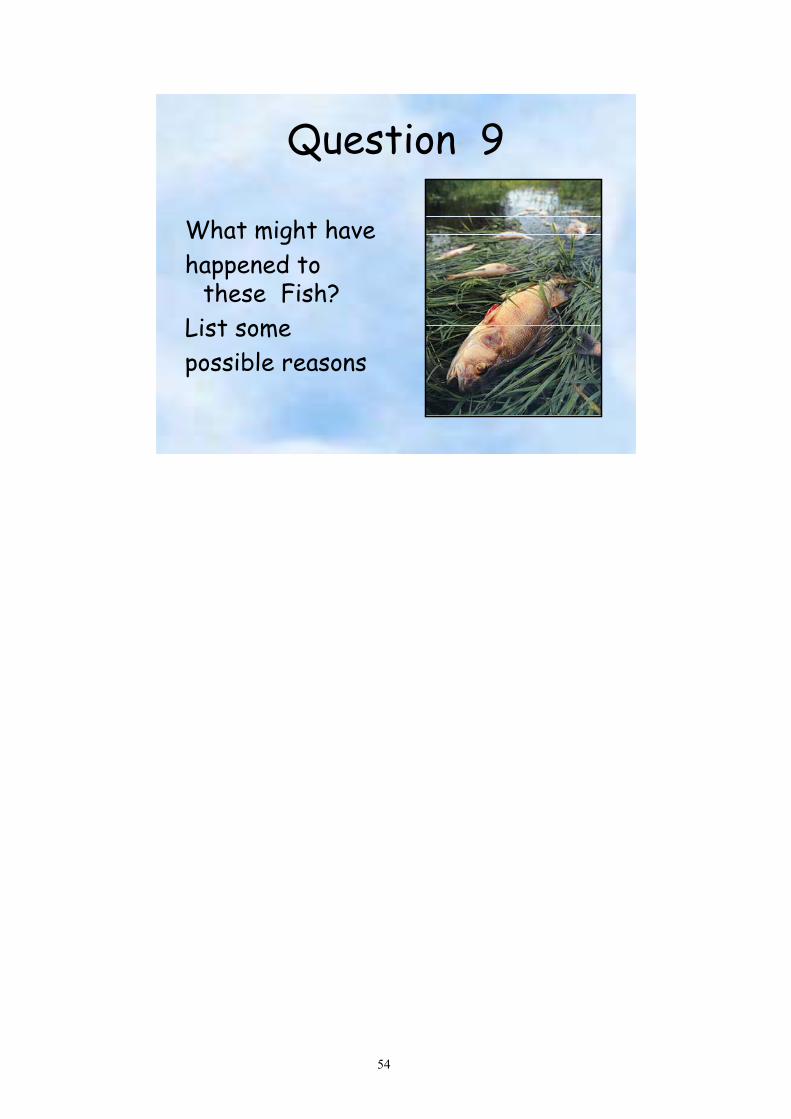
54
Question 9
What might have happened to
these Fish?List some possible reasons
55
Question 10Modern Landfills release Toxic Methane
gas into the air. If we collected the Methane and used it to power Christchurch homes- How many homes would that Methane supply?
A. 4000 homes B. 400 homesC. 1400 homes D. 40 homes
Answer Q.10
The methane gas collected from the landfill would supply
A. 4000 homes with power

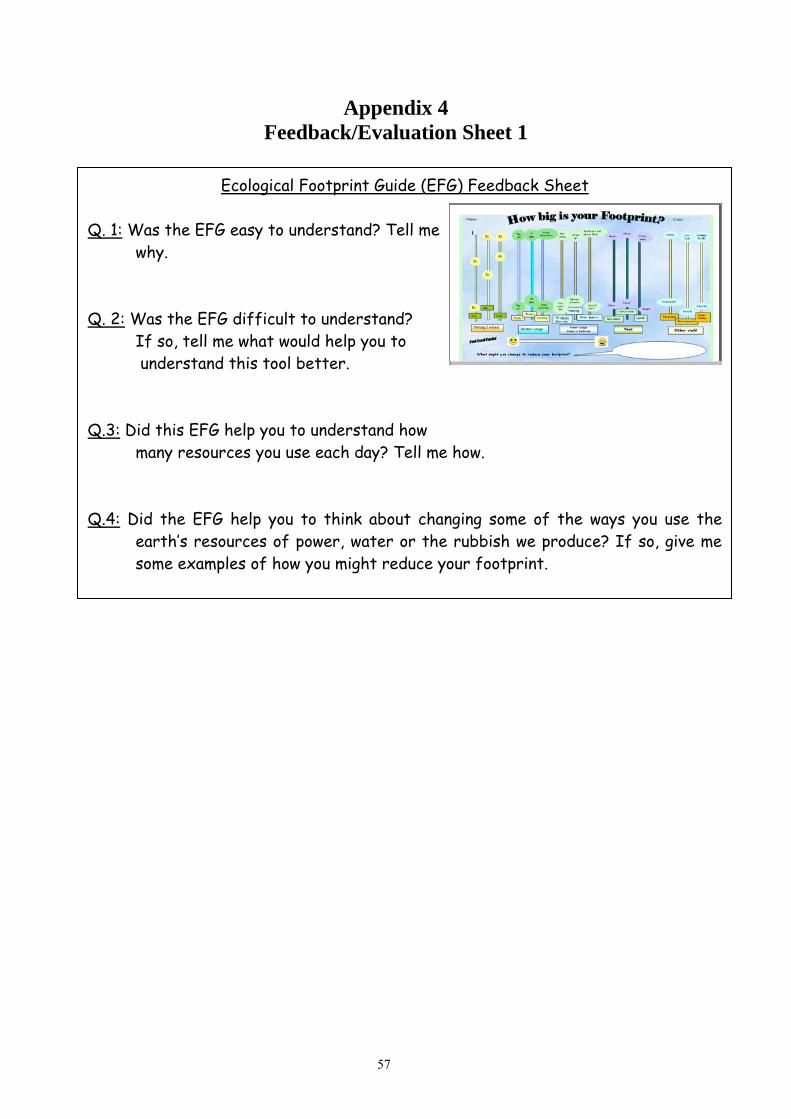
57
Appendix 4 Feedback/Evaluation Sheet 1
Ecological Footprint Guide (EFG) Feedback Sheet Q. 1: Was the EFG easy to understand? Tell me why. Q. 2: Was the EFG difficult to understand? If so, tell me what would help you to understand this tool better. Q.3: Did this EFG help you to understand how many resources you use each day? Tell me how. Q.4: Did the EFG help you to think about changing some of the ways you use the earth’s resources of power, water or the rubbish we produce? If so, give me some examples of how you might reduce your footprint.


59
Appendix 5 Second Version of the Footprint Tool
..... '
~ ~ ~. ~ -k
~ -I /ie~ l "~MI
'"
• -
• -
.~ --,
-.. ~ § -T_ _
W ........
~.
-.... , .. ~ ~.
~.
H«' in9 ---. -. -..
~,
-. -
.., ""'.. ----'-"-- -,
'! - .. -~ I --- I I.\fIcII
I ....
-... T... .. .... ..... -..-Otw. mtf
~ :.1
-• - --- -. •
----- --
-, - .... QI'I.. • .... -
I, .... .:: I j;] .... 1
CIon,
,-'''' "'.~
-'''' ...... ---


61
Appendix 6 Feedback/Evaluation Sheet 2
Q.1: After using the EFG (the first session) you then set a goal/s to reduce your footprint. Did you find it easy or difficult to achieve your goals? (Tell me) How do you feel about it? Q. 2: Is this new version of the EFG better or worse at showing you your footprint? Tell me why? Q.3: Did this EFG help you to understand how you use the earth’s resources (like water, power and transport (Fuel)) wisely or wastefully each day? Tell me how. Q.4: Did the EFG help you to think about changing some of the ways you use the earth’s resources? If so, tell me some further goals you might set to reduce your footprint even further. Q.5: Have you talked with your parents/caregivers/family about reducing your footprint? Yes No (Circle one)
If you answered “yes” what ideas have you discussed with your family about reducing their footprint? Q.6: Does using the E.F.Tool make you “feel good” about reducing your footprint?
Ecological Footprint Guide (EFG) Feedback Sheet: Second Session


63
Appendix 7 Discussion Version of the Footprint Tool
lleyt What's your FoofprinW . 00 .. " .. " 0 'f"'"' a->
Group: • "". ;, plot ... 'P'" ""of", ,., ,,,,;,,~,
' '''-"''''''''''''.'F'=''''''' "' ./ C., ( ") - ,
''"' .~ - - , ~
0 , ~
'";. •
I
~ ) 0 "_.M ( .j ~ .:~ .... "" W ~. . ~ ...
s O. 0'..-. ~ ~--
I Getti"9 2 S<: ...... I ? ..,, / ... ~ 1-1"",,"1 , ..
"""",.--I I Xk> ' '' ' ' '
To"~ ~"yd "I -,",,,,. I-''t, ,',
I Gettirog A"",,,,d , I I WGtar II'Gg " I
'0 ... ' v.og. I I ,..,
I I Othl r ,Mf I 1-10 "", Of' b<<froo m
Ie ~ Co;nment <= Co , I My F« I_"-I F"" .... I liigk
c<""'" "';'" ,..;, E, ,,,,,,"" fWf'i " , <>OJ , ,.,,.;,,,,.,. , . ..... P' ... 0 f'U"'" to illbI12<: o"'-~ "'~.., "" _, ;<ihu .,.; .. """"", too'", ,,' E~; ~
lleyt What's your FootprinW . "" .. ""'0 'f"'" =--0
Groop: • foo" ;'Fl' ''' 'I"'" " "of« 't. U'';'''''''.''
'W""""""""'P"""""'" "' / ,- (-) - -, , '"'" .~ - - 0 ~,
"':' •
I
~ ) 0 ~-- 0 ~ ., ..... - "
~ .-r:'-l
0 " ~ -. ",=-
I G<lTti~ 2 scllool ? -V"~ ~,
,., -- I I _. ''''' 0 To"~ ~<ry< 1 '" -""'" I-"",,-, I /;<otting AI'o,,,,d , I I WGtcr lI'cg" I Pow" v'":9< I I ,~, I I Oth l r ,tuff I
lie ... Of" be""", ..
Comment.: 16 ~ ee. I My f • • I_Good f"" ... I l1igh
c. ... "" "Ii -'" ,,,,.,",,' ' '''f'i '' ,,," ',,",""""" "!"~'''''' P"""" ' .Ii<bII>oIl """"' """0"" " V "'" "',~"'_','" ',o'F'"'' E'I""~

64
Discussion Phase 1. Which title does your group prefer? Getting 2 School or Getting Around Tick one 2. Choose 2 to 4 sliders (to discuss in your group) • Each person puts a dot on the slider chosen • Then discuss why you have put your dot there, whereas • someone else (in the group) • may have put their dot somewhere else. Find out the reasons why. • Write down some of those ideas in the comments box. 3. Sports column/slider? • Do we need a separate slider for sports? Yes or No (circle one) Tell me Why? • How is playing sport good for the environment? • What parameters do we need?
4. Feel-Good Factor slider? • Does using the Footprint tool make you feel good in any way? Yes or No (circle one) • Does your group think that it is important to be able to express how you feel about the environment?
Comments
Comments
Ideas? Ideas?
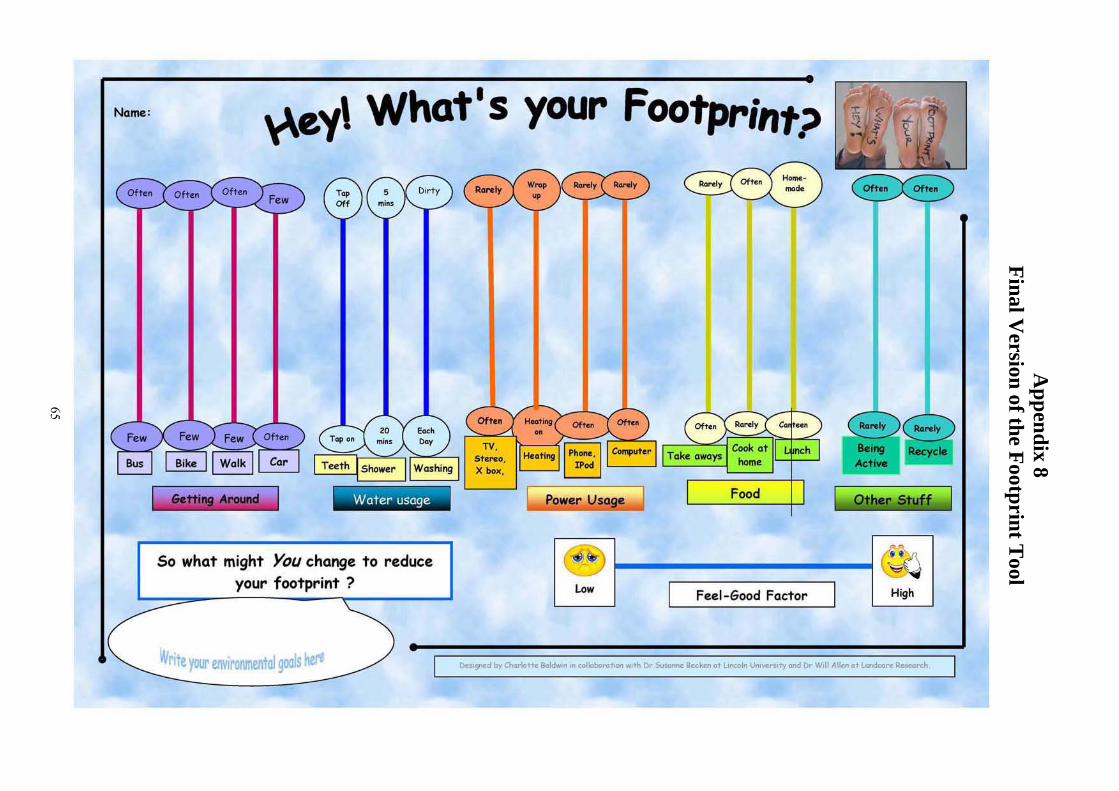
65
Appendix 8
Final Version of the Footprint T
ool Name. : '(\ey\ What's your Footprint;>
T" Off
Water usage
So what might You change to reduce your footprint ?
WMte yOI!' en~ronmeIItai goals her!
,E~~)
0fh0I Y Heatiog - 7_ M
TV. Heoti.., 1 PtI_·1 St.,..o,
IP .. x boll ,
t...
~ ~
Food
Feel- Good Factor
Ee
......
High
DuIgnod by Ghorionc 8<>ldw>n '" ""llobontloon ... Th [)ro 5utotwIe ik<"-' Gll.o<><o~ u....,r$>'ty ond!)r W,II All ... GII.or>6<Ot'C R~~h
Nome. : '(\ey\ What's your Footprint;>
T" ""
, ~.
Water usage
So what might You change to reduce your footprint ?
Wnte)Oll' I!Ilvironmentoi goals hell
""'" TV,
$t.,..o, X bo_,
...... "'- ""- ,~. -§ H.GtI"!I
IPod ho_
Food
.... Feel-Good Foctor
- -..... - Aoqdo
nt-ha.. illlI
High

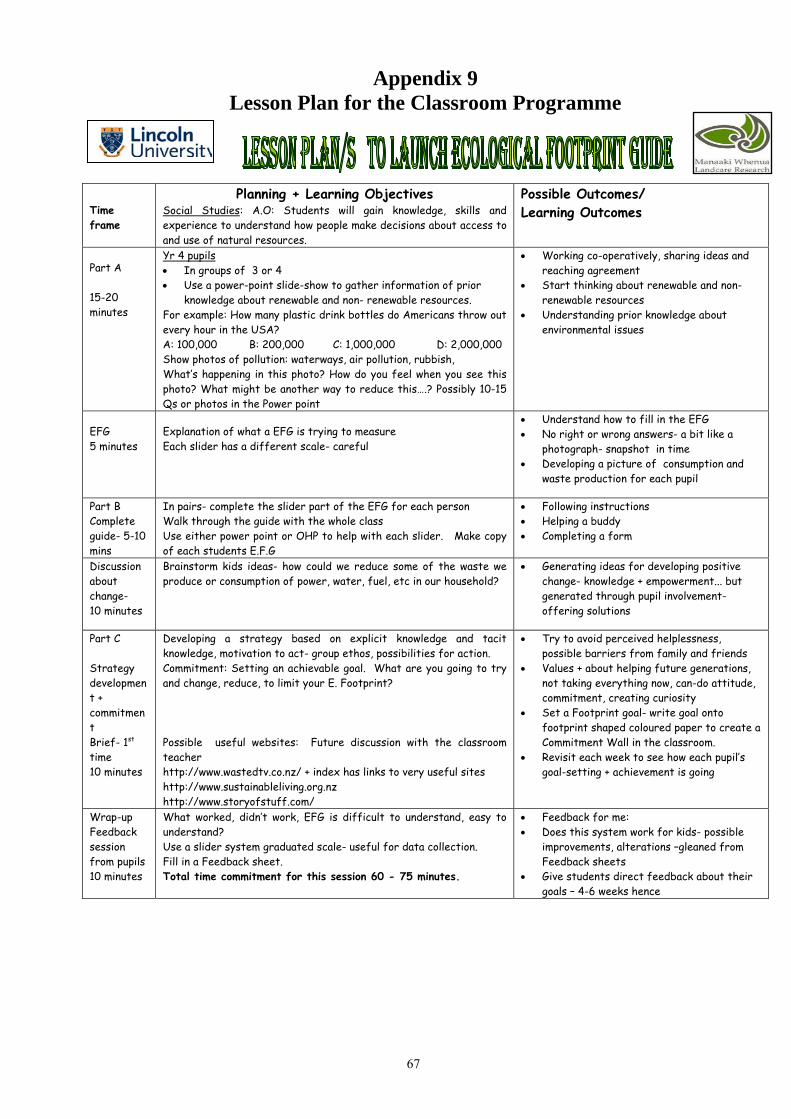
67
Appendix 9 Lesson Plan for the Classroom Programme
Time frame
Planning + Learning Objectives Social Studies: A.O: Students will gain knowledge, skills and experience to understand how people make decisions about access to and use of natural resources.
Possible Outcomes/ Learning Outcomes
Part A 15-20 minutes
Yr 4 pupils • In groups of 3 or 4 • Use a power-point slide-show to gather information of prior
knowledge about renewable and non- renewable resources. For example: How many plastic drink bottles do Americans throw out every hour in the USA? A: 100,000 B: 200,000 C: 1,000,000 D: 2,000,000 Show photos of pollution: waterways, air pollution, rubbish, What’s happening in this photo? How do you feel when you see this photo? What might be another way to reduce this….? Possibly 10-15 Qs or photos in the Power point
• Working co-operatively, sharing ideas and reaching agreement
• Start thinking about renewable and non-renewable resources
• Understanding prior knowledge about environmental issues
EFG 5 minutes
Explanation of what a EFG is trying to measure Each slider has a different scale- careful
• Understand how to fill in the EFG • No right or wrong answers- a bit like a
photograph- snapshot in time • Developing a picture of consumption and
waste production for each pupil
Part B Complete guide- 5-10 mins
In pairs- complete the slider part of the EFG for each person Walk through the guide with the whole class Use either power point or OHP to help with each slider. Make copy of each students E.F.G
• Following instructions • Helping a buddy • Completing a form
Discussion about change- 10 minutes
Brainstorm kids ideas- how could we reduce some of the waste we produce or consumption of power, water, fuel, etc in our household?
• Generating ideas for developing positive change- knowledge + empowerment... but generated through pupil involvement- offering solutions
Part C Strategy development + commitment Brief- 1st time 10 minutes
Developing a strategy based on explicit knowledge and tacit knowledge, motivation to act- group ethos, possibilities for action. Commitment: Setting an achievable goal. What are you going to try and change, reduce, to limit your E. Footprint? Possible useful websites: Future discussion with the classroom teacher http://www.wastedtv.co.nz/ + index has links to very useful sites http://www.sustainableliving.org.nz http://www.storyofstuff.com/
• Try to avoid perceived helplessness, possible barriers from family and friends
• Values + about helping future generations, not taking everything now, can-do attitude, commitment, creating curiosity
• Set a Footprint goal- write goal onto footprint shaped coloured paper to create a Commitment Wall in the classroom.
• Revisit each week to see how each pupil’s goal-setting + achievement is going
Wrap-up Feedback session from pupils 10 minutes
What worked, didn’t work, EFG is difficult to understand, easy to understand? Use a slider system graduated scale- useful for data collection. Fill in a Feedback sheet. Total time commitment for this session 60 - 75 minutes.
• Feedback for me: • Does this system work for kids- possible
improvements, alterations –gleaned from Feedback sheets
• Give students direct feedback about their goals – 4-6 weeks hence
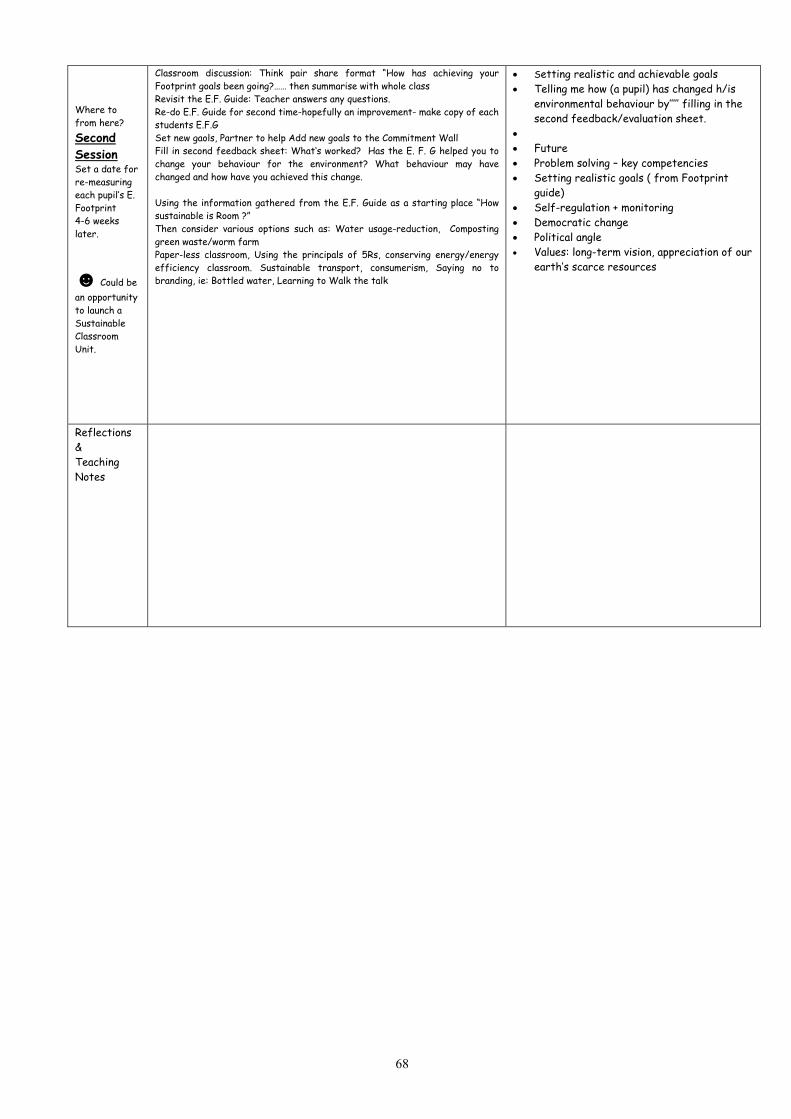
68
Where to from here? Second Session Set a date for re-measuring each pupil’s E. Footprint 4-6 weeks later.
☻ Could be an opportunity to launch a Sustainable Classroom Unit.
Classroom discussion: Think pair share format “How has achieving your Footprint goals been going?…… then summarise with whole class Revisit the E.F. Guide: Teacher answers any questions. Re-do E.F. Guide for second time-hopefully an improvement- make copy of each students E.F.G Set new gaols, Partner to help Add new goals to the Commitment Wall Fill in second feedback sheet: What‘s worked? Has the E. F. G helped you to change your behaviour for the environment? What behaviour may have changed and how have you achieved this change. Using the information gathered from the E.F. Guide as a starting place “How sustainable is Room ?” Then consider various options such as: Water usage-reduction, Composting green waste/worm farm Paper-less classroom, Using the principals of 5Rs, conserving energy/energy efficiency classroom. Sustainable transport, consumerism, Saying no to branding, ie: Bottled water, Learning to Walk the talk
• Setting realistic and achievable goals • Telling me how (a pupil) has changed h/is
environmental behaviour by’’’’’ filling in the second feedback/evaluation sheet.
• • Future • Problem solving – key competencies • Setting realistic goals ( from Footprint
guide) • Self-regulation + monitoring • Democratic change • Political angle • Values: long-term vision, appreciation of our
earth’s scarce resources
Reflections & Teaching Notes

69
Appendix 10 Teaching Notes
How to Implement the Footprint Process in the Classroom
Teacher Guide to filling in: “Hey! What’s your Footprint?” 1. This tool is effectively a photograph or snapshot of a child’s
lifestyle and tries to show how environmentally friendly (sustainable) that young person is.
2. This tool shows good sustainable behaviour if most of the marks (on each vertical bar or slider) are near the top of the page.
3. The upright bars represent different parameters (such as power usage and
transportation) within a child’s lifestyle. They are also areas where children could make a difference and become more environmentally responsible or even challenge him/herself to making positive environmental, behavioural changes.
For example: The teacher could ask these sorts of questions so the pupils could then start filling in the vertical bars. Getting Around Section: (Thinking about the environmental effects of being driven to school- pollution, congestion, stress,) • Teacher: Have you been driven to school everyday this week? S/he would just fill in the
bar representing car • However if that child has been driven to school once and walked to school all the rest of
the week s/he would fill in 2 bars ( Car and walk) Water Usage Section: (Thinking about how much water we waste each day) • Teacher: Do you leave the tap on when you brush your teeth?
Yes or no – mark on the bar • Teacher: How long do you normally spend in the shower? –
put a cross on the bar that best represents the time taken ( Half way if you spend 10 minutes in the shower)
Power Usage (How can we start to limit our use of power each day) • Teacher: If you are cold when you get home from school do you put on a
heater, gas fire, or switch on heat pump etc? Put a mark on the bar • Teacher: Do you wrap up by putting on warmer clothes: Put a cross on the bar near the
bubble saying “wrap up”. • Teacher: Technology usage: Do you use your IPod, cell phone, everyday so you might have
to charge those machines batteries a lot? • Teacher: When you get home from school do you use a T.V, stereo, computer in your
bedroom or do you share those appliances with other family members? (trying to gauge
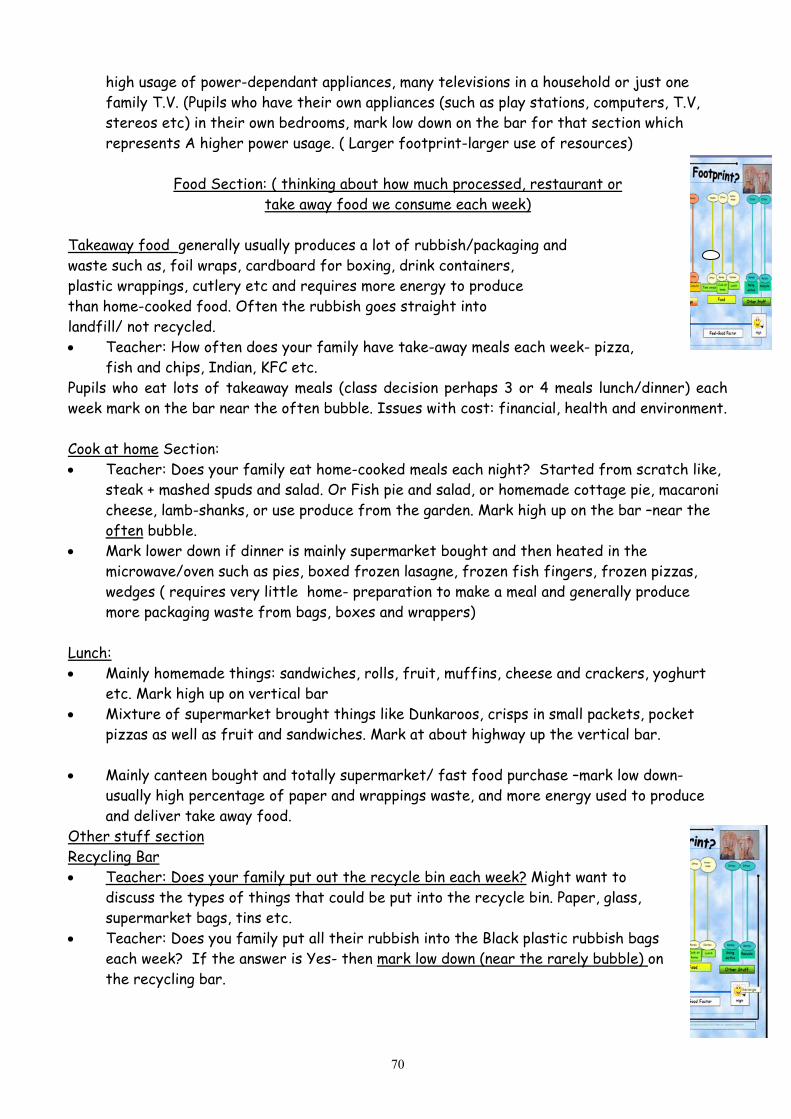
70
high usage of power-dependant appliances, many televisions in a household or just one family T.V. (Pupils who have their own appliances (such as play stations, computers, T.V, stereos etc) in their own bedrooms, mark low down on the bar for that section which represents A higher power usage. ( Larger footprint-larger use of resources)
Food Section: ( thinking about how much processed, restaurant or
take away food we consume each week) Takeaway food generally usually produces a lot of rubbish/packaging and waste such as, foil wraps, cardboard for boxing, drink containers, plastic wrappings, cutlery etc and requires more energy to produce than home-cooked food. Often the rubbish goes straight into landfill/ not recycled. • Teacher: How often does your family have take-away meals each week- pizza,
fish and chips, Indian, KFC etc. Pupils who eat lots of takeaway meals (class decision perhaps 3 or 4 meals lunch/dinner) each week mark on the bar near the often bubble. Issues with cost: financial, health and environment. Cook at home Section: • Teacher: Does your family eat home-cooked meals each night? Started from scratch like,
steak + mashed spuds and salad. Or Fish pie and salad, or homemade cottage pie, macaroni cheese, lamb-shanks, or use produce from the garden. Mark high up on the bar –near the often bubble.
• Mark lower down if dinner is mainly supermarket bought and then heated in the microwave/oven such as pies, boxed frozen lasagne, frozen fish fingers, frozen pizzas, wedges ( requires very little home- preparation to make a meal and generally produce more packaging waste from bags, boxes and wrappers)
Lunch: • Mainly homemade things: sandwiches, rolls, fruit, muffins, cheese and crackers, yoghurt
etc. Mark high up on vertical bar • Mixture of supermarket brought things like Dunkaroos, crisps in small packets, pocket
pizzas as well as fruit and sandwiches. Mark at about highway up the vertical bar. • Mainly canteen bought and totally supermarket/ fast food purchase –mark low down-
usually high percentage of paper and wrappings waste, and more energy used to produce and deliver take away food.
Other stuff section Recycling Bar • Teacher: Does your family put out the recycle bin each week? Might want to
discuss the types of things that could be put into the recycle bin. Paper, glass, supermarket bags, tins etc.
• Teacher: Does you family put all their rubbish into the Black plastic rubbish bags each week? If the answer is Yes- then mark low down (near the rarely bubble) on the recycling bar.
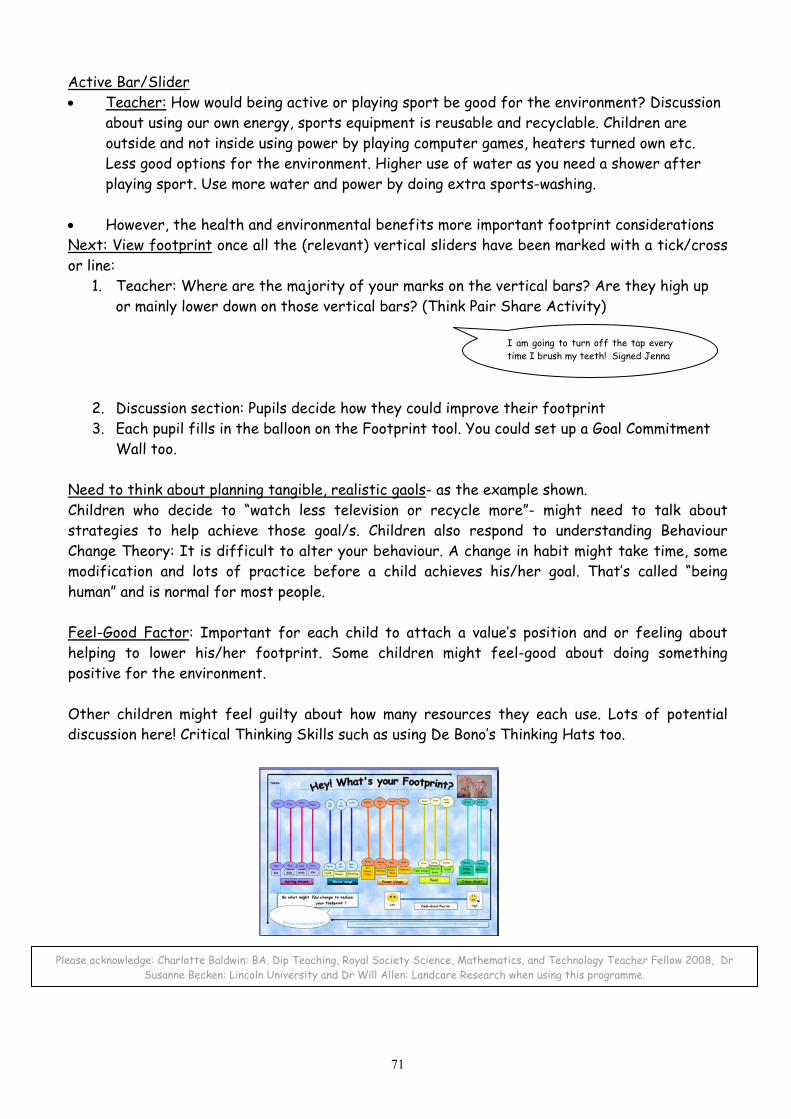
71
Active Bar/Slider • Teacher: How would being active or playing sport be good for the environment? Discussion
about using our own energy, sports equipment is reusable and recyclable. Children are outside and not inside using power by playing computer games, heaters turned own etc. Less good options for the environment. Higher use of water as you need a shower after playing sport. Use more water and power by doing extra sports-washing.
• However, the health and environmental benefits more important footprint considerations Next: View footprint once all the (relevant) vertical sliders have been marked with a tick/cross or line:
1. Teacher: Where are the majority of your marks on the vertical bars? Are they high up or mainly lower down on those vertical bars? (Think Pair Share Activity)
2. Discussion section: Pupils decide how they could improve their footprint 3. Each pupil fills in the balloon on the Footprint tool. You could set up a Goal Commitment
Wall too. Need to think about planning tangible, realistic gaols- as the example shown. Children who decide to “watch less television or recycle more”- might need to talk about strategies to help achieve those goal/s. Children also respond to understanding Behaviour Change Theory: It is difficult to alter your behaviour. A change in habit might take time, some modification and lots of practice before a child achieves his/her goal. That’s called “being human” and is normal for most people. Feel-Good Factor: Important for each child to attach a value’s position and or feeling about helping to lower his/her footprint. Some children might feel-good about doing something positive for the environment. Other children might feel guilty about how many resources they each use. Lots of potential discussion here! Critical Thinking Skills such as using De Bono’s Thinking Hats too.
I am going to turn off the tap every time I brush my teeth! Signed Jenna
Please acknowledge: Charlotte Baldwin: BA, Dip Teaching, Royal Society Science, Mathematics, and Technology Teacher Fellow 2008, Dr Susanne Becken: Lincoln University and Dr Will Allen: Landcare Research when using this programme.