Reducing India's energy and carbon footprint
35
ROLE OF TRANSPORT SECTOR 1 Reducing India’s energy and carbon footprint Akshima T Ghate Fellow and Associate Director, TERI Presentation at the India – Japan Energy Forum “2017” New Delhi
-
Upload
khangminh22 -
Category
Documents
-
view
5 -
download
0
Transcript of Reducing India's energy and carbon footprint

ROLE OF TRANSPORT SECTOR
1
Reducing India’s energy and carbon footprint
Akshima T GhateFellow and Associate Director, TERI
Presentation at the India – Japan Energy Forum “2017”New Delhi

Transport sector: Increasing share in total energy consumption
2
Transport will be the second fastest growing sector in terms of energy use after commercial sector
Source: IESS2047 Results
2011-12 2031-32
Total energy demand 424 mtoe 1,019 mtoe
Transport sector’s energy demand
80 mtoe(19%)
253 mtoe(25%)
2.4 times increase
3.2 times increase
5%
48%
19%
5%1%
22%
Energy Demand - 2011-12
9%
54%
25%
5%
2%
5%
Energy Demand - 2031-32
Buildings
Industry
Transport
Pumps& Tractors
Telecom
Cooking

Transport sector: Heavy dependence onliquid hydrocarbons
3
Source: IESS2047 Results
2011-12 2031-32
Transport sector’s share in consumption of liquid
hydrocarbons48% 61%
Transport sector will have the maximum share in liquid hydrocarbon consumption in 2031-32
26%
61%
4%
6%3%
Sectoral share in liq. hydrocarbon consumption (2031-32)
Buildings
Industry
Transport
Cooking
Agriculture
Telecom
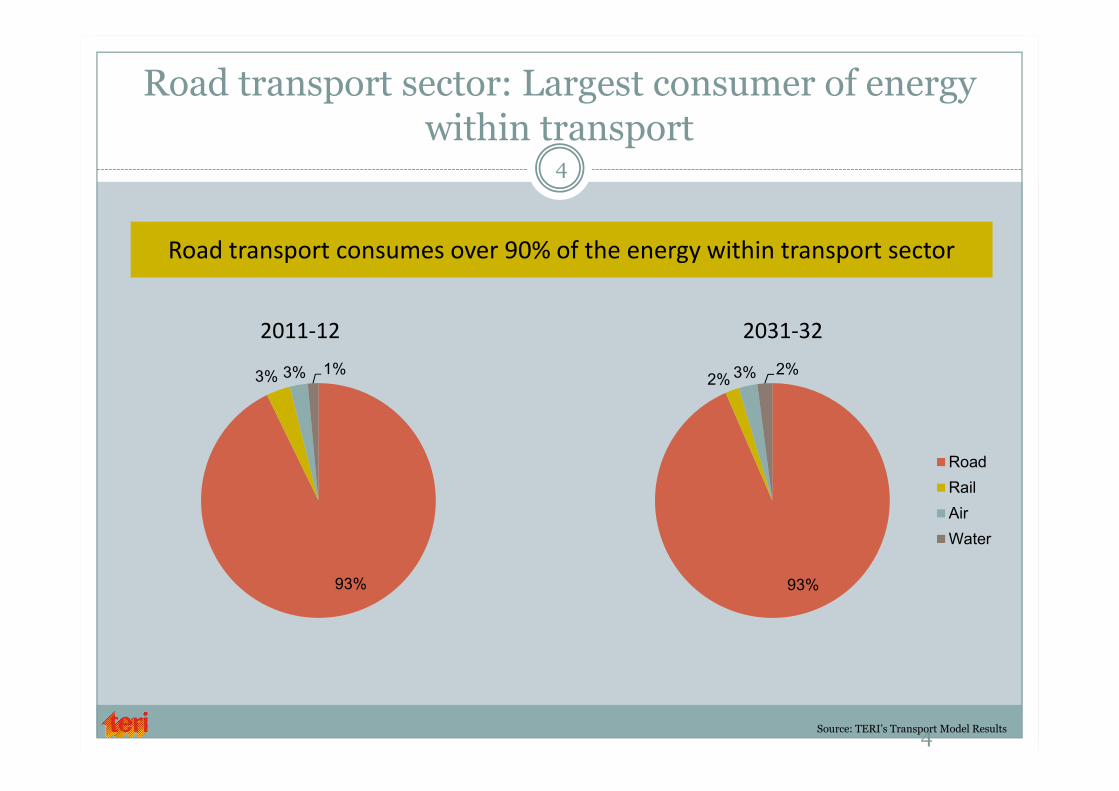
Road transport sector: Largest consumer of energy within transport
4
Road transport consumes over 90% of the energy within transport sector
2011-12 2031-32
4
Source: TERI’s Transport Model Results
93%
3% 3% 1%
93%
2% 3% 2%
RoadRailAirWater

Rapid motorization: A key reason for increasing oil dependence
5
Number of on-road vehicles expected to quadruple by 2031-32
0
50
100
150
200
250
300
350
400
450
2001-02 2011-12 2021-22 2031-32
Mill
ion
Number of vehicles (on-road)
HCV/LCV
Bus
3W
Taxis
Cars
2W
39
106
238
451
Source: TERI’s MARKAL Model Results

9%
90%
1%
Fuel basket for transport not diversified
6
2011-12 2031-32
Very low penetration of alternative fuels like electricity and biofuels
6
Source: IESS2047 Results
80 mtoe
6%
92%
2%
Electricity
LiquidhydrocarbonsGaseoushydrocarbons
253 mtoe

Why should this concern us? (1)7
Because,Oil import dependence will increase from current level of 76% (of 160 mtoe) in 2011-12 to 91% (of 524 mtoe) in 2031-32
Oil import bill will rise from Rs. 5.6 trillion in 2011-12 to Rs. 32.5 trillion in 2031-32*
Issues related to geopolitical instability
*Costs as of 2011 prices
Source: TERI’s MARKAL Model Results
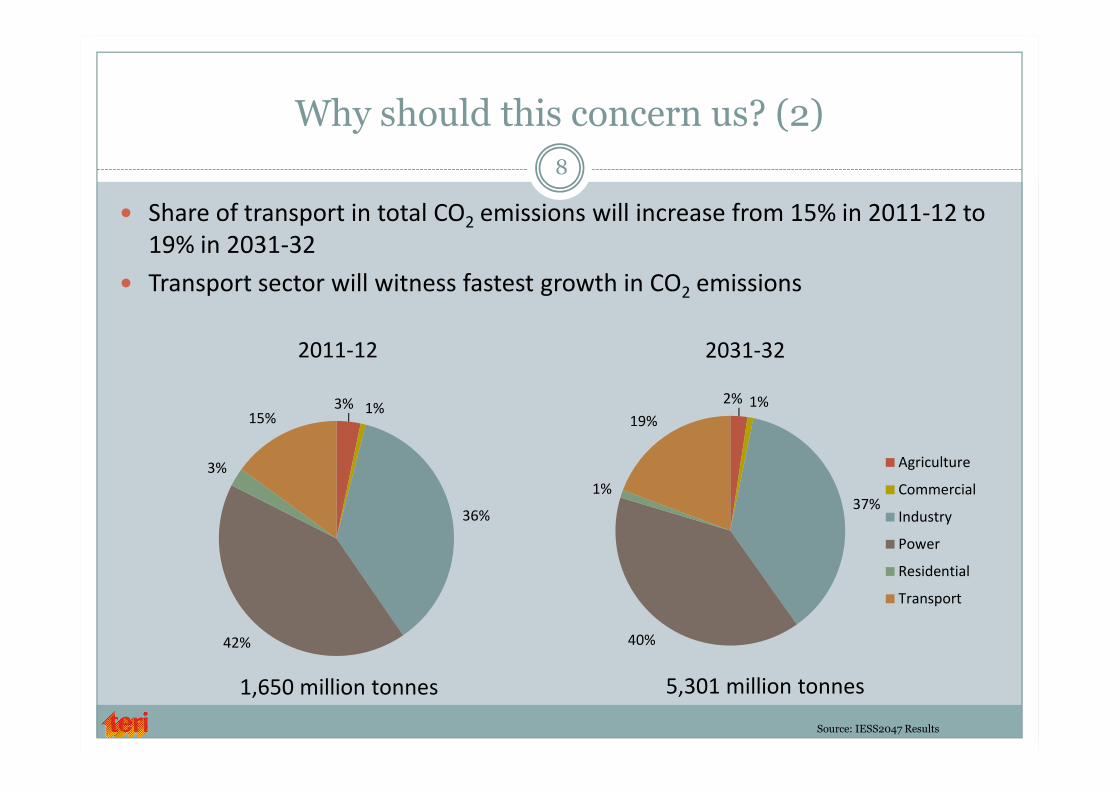
Why should this concern us? (2)8
Share of transport in total CO2 emissions will increase from 15% in 2011-12 to 19% in 2031-32Transport sector will witness fastest growth in CO2 emissions
3% 1%
36%
42%
3%
15%2% 1%
37%
40%
1%
19%
Agriculture
Commercial
Industry
Power
Residential
Transport
2011-12 2031-32
Source: IESS2047 Results
1,650 million tonnes 5,301 million tonnes

Why should this concern us? (3)9
Impact of vehicular emissions on air quality will increase; most cities exceed the ambient air quality standards set by the Govt. of India In 2011-12, mortality from PM 2.5 was estimated to be 5.73 lakhsAir quality projected to worsen in the BAU scenario – increase in mortality expected torise to 33.6 lakhs by 2031-32
More than 80% cities violate the standards of RSPM
Source: CPCB, NAMP data

Can we reduce transport sector’s oil consumption?10
Need to move away from Business As Usual (BAU) to reduce transport sector’s oil
consumption
How to move away from BAU? 11
Improve efficiencies in road sector
Promote coastal shipping and IWT
Promote initiatives to improve market share of railways
Promote inter-modal shift from road to more energy efficient modes

12
Road sector

Set fuel efficiency standards and streamline I&M regime
13
Actions neededOperationalize and advance fuel efficiency standards for cars Introduce fuel efficiency standards for two wheelers and heavy duty vehicles at the earliest; Japan, USA, Canada and China have already started implementing standards for HDVs
HDVs and two wheelers responsible for 50% of transport sector’s total energy consumption in 2011-12; share expected to increase to 60% by 2031-32
Establish computerised and robust Inspection and Certification centresIn the interim, audit and strengthen PUC centres
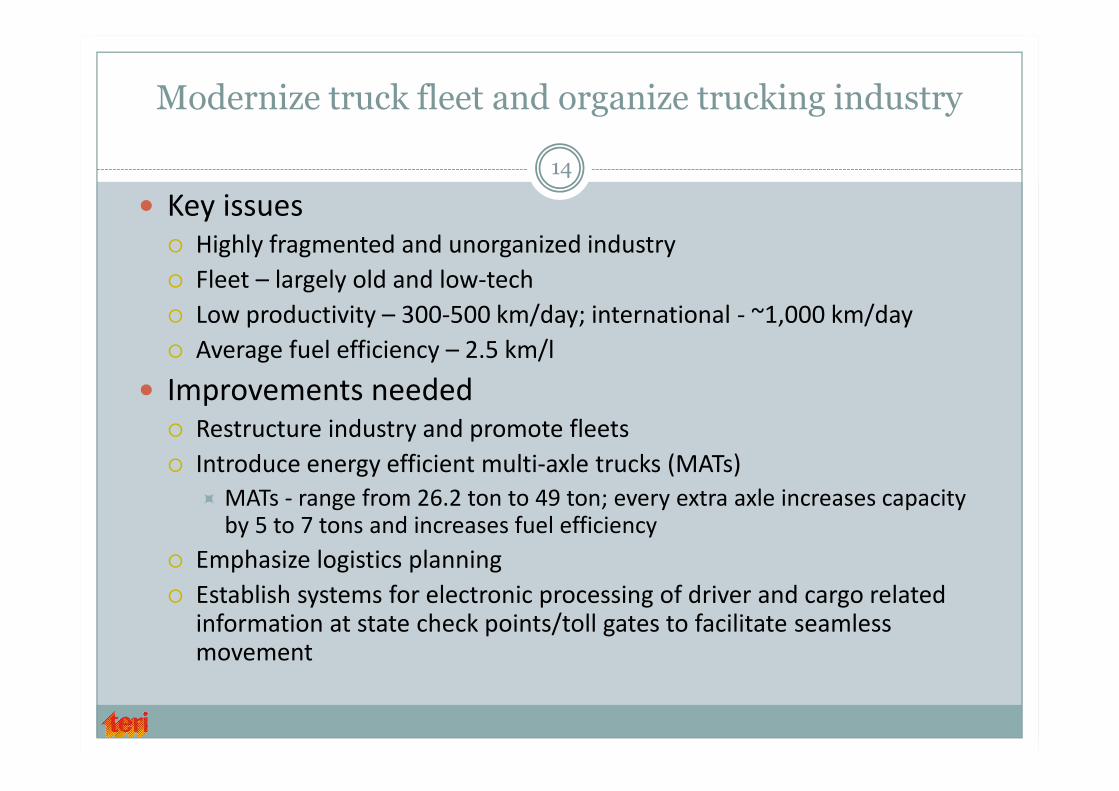
Modernize truck fleet and organize trucking industry
14
Key issuesHighly fragmented and unorganized industryFleet – largely old and low-techLow productivity – 300-500 km/day; international - ~1,000 km/dayAverage fuel efficiency – 2.5 km/l
Improvements neededRestructure industry and promote fleetsIntroduce energy efficient multi-axle trucks (MATs)
MATs - range from 26.2 ton to 49 ton; every extra axle increases capacity by 5 to 7 tons and increases fuel efficiency
Emphasize logistics planningEstablish systems for electronic processing of driver and cargo related information at state check points/toll gates to facilitate seamless movement
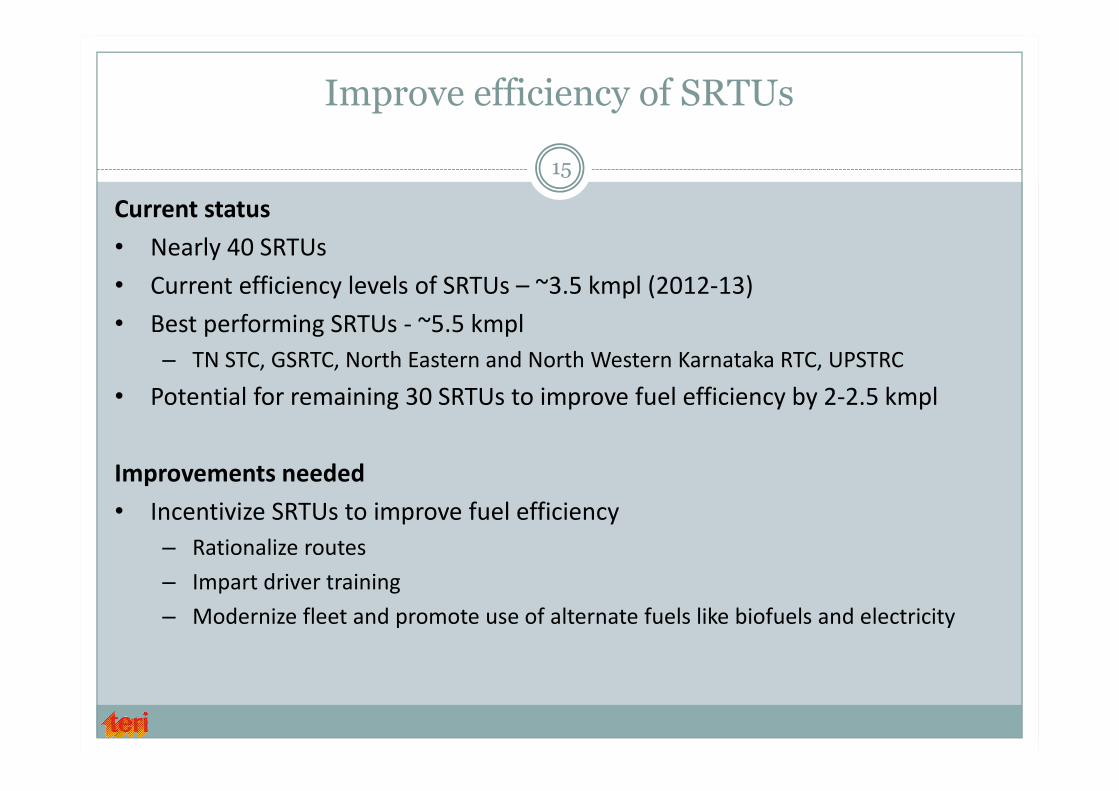
Improve efficiency of SRTUs
15
Current status • Nearly 40 SRTUs• Current efficiency levels of SRTUs – ~3.5 kmpl (2012-13)• Best performing SRTUs - ~5.5 kmpl
– TN STC, GSRTC, North Eastern and North Western Karnataka RTC, UPSTRC• Potential for remaining 30 SRTUs to improve fuel efficiency by 2-2.5 kmpl
Improvements needed• Incentivize SRTUs to improve fuel efficiency
– Rationalize routes– Impart driver training– Modernize fleet and promote use of alternate fuels like biofuels and electricity

Introduce alternate fuels – electricity and biofuels16
Negligible penetration of electricity and biofuels in road transport Suggested targets (2011-12 to 2031-32)
Increase share of electricity in transport fuels from 1% to 4% and biofuels from 0% to 20%
Impact by 2031-3218% of energy consumption in transport by 2031-32 could be met by biofuels (15%) and electricity (3%)
0
50
100
150
200
250
300
350
400
RES ESA RES ESA RES ESA
2011/12 2021/22 2031/32
Electricity
Bio fuels
CNG
Petroleum Fuel
Source: TERI’s MARKAL Model Results
RES - Reference Energy Scenario
ESA – Energy Security Ambitious Scenario

Promote shift from private to public transport modes (1)17
Source - http://movabilityaustin.org/

Promote shift from private to public transport modes (2)18
Mass/public transport modes – highly fuel efficient on a passenger km (pkm) basis as compared to private transport modes (cars and two-wheelers)Need to promote use of public transport in cities
Source: TERI’s LCA study
86.4208.5
467.5
1870.0
2343.3
0.0
500.0
1000.0
1500.0
2000.0
2500.0
Metro rail -Delhi
Urban bus -Average
Two wheeler Petrol car Diesel car
kJ/p
km
Energy consumption (kJ/pkm)
19
Coastal shipping and IWT

Promote costal shipping and IWT
Current statusPotential for water transport not exploitedWater transport share - only 6% in the total freight traffic as against 30% in China and about 14% in the USA
Actions neededSet up dedicated ports and dedicated terminals in major ports for coastal shippingConnect ports to freight corridors and national highwaysMake necessary policy/legislative changes to provide for preferential treatment for coastal vessels Invest in IWT infrastructure, including IWT terminals Promote inter-modal integration of IWT networks with road and rail
20

21
Railways

Energy consumption in Railways – current status22
Indian Railways - single largest energy consuming organisation in the country
Energy consumption for traction - 2.7 billion litres of diesel and 13.9 billion kWh of electricity (2012-13)Energy consumption for non-traction purposes – 0.047 billion litres of diesel and 2.48 billion kWh of electricity
In 2012-13, Indian railways spent 18.02% of its gross earnings on fuel
Fuel accounted for 26.5% of the total Ordinary Working Expenses
Large variation in energy efficiency of various Zonal Railways
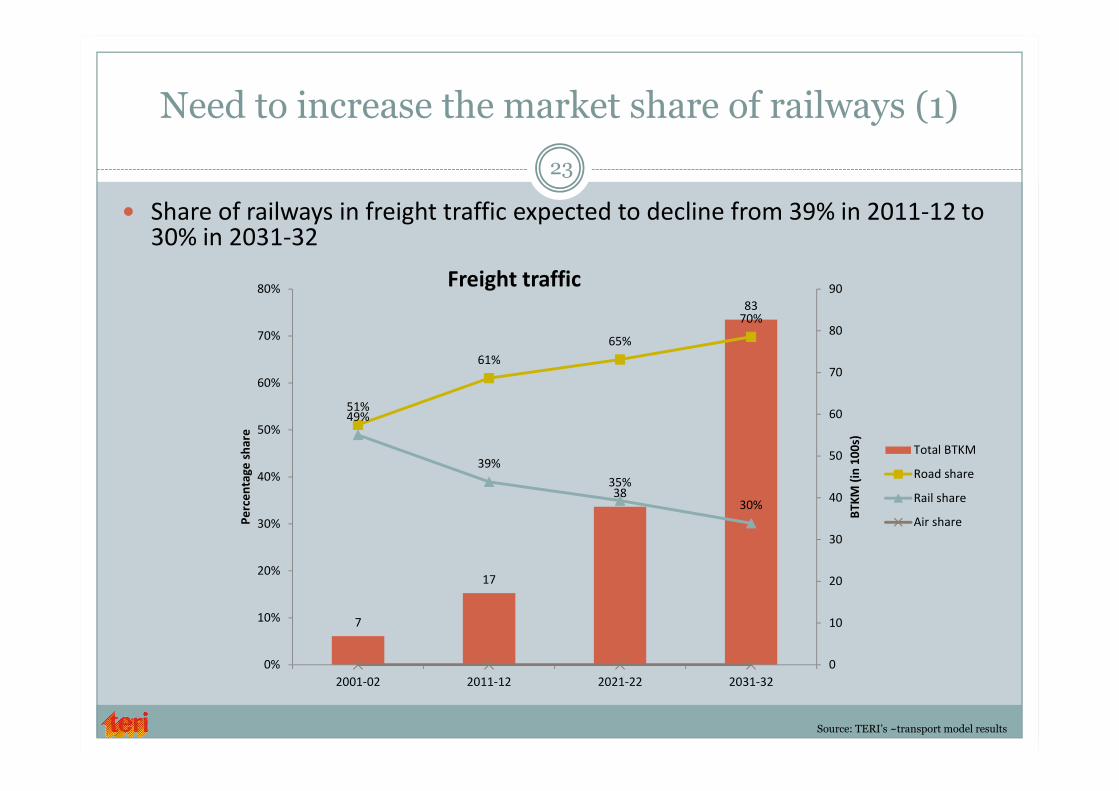
Need to increase the market share of railways (1)
Share of railways in freight traffic expected to decline from 39% in 2011-12 to 30% in 2031-32
23
7
17
38
83
51%
61%65%
70%
49%
39%35%
30%
0
10
20
30
40
50
60
70
80
90
0%
10%
20%
30%
40%
50%
60%
70%
80%
2001-02 2011-12 2021-22 2031-32
BTKM
(in
100s
)
Perc
enta
ge sh
are
Total BTKM
Road share
Rail share
Air share
Freight traffic
Source: TERI’s ~transport model results

Need to increase the market share of railways (2)24
Share of railways in passenger traffic declined from 19% in 2001-02 to 14% in 2011-12; likely to remain stagnant at this level till 2031-32
26
72
138
21481%
85% 84% 84%
19%14% 14% 15%
0
50
100
150
200
250
0%
10%
20%
30%
40%
50%
60%
70%
80%
90%
2001-02 2011-12 2021-22 2031-32
BPKM
(in
100s
)
Perc
enta
ge sh
are
Total BPKM
Road share
Rail share
Air share
Passenger traffic
Source: TERI’s transport model results

Need to increase the market share of railways (3)25
National Transport Policy Committee, 1980 had recommended increasing the railway share to more than 72% in freight traffic , primarily on energy security considerations; National Transport Development Policy Committee, 2014 has reiterated the recommendationTrends have been opposite; railways are unable to meet the entire traffic demandUrgent need to arrest decline in railways’ share
Augment capacity of railwaysIntroduce High Speed RailImplement Regional Rapid Rail Transit ProjectsPromote introduction of private freight operators in commodities where the railways share is small/non-existentIncrease investment in railways

High Speed Rail (HSR) - Advantages
26
Data for Europe

Need to select HSR corridors rationally27
Findings of TERI’s study of two potential HSR corridors (Ahmedabad-Mumbai-Pune and Chennai-Bangalore-Coimbatore)
Will help in achieving energy savings - however the level of savings would depend on the nature of modal shifts
Introduction of HSR may not result in decreased emissions in all cases
Electricity generation from fuels like coal could reduce the overall benefits of HSR
Selection of HSR corridors should be done on a case by case basis after understanding the traffic patterns along each section

Promote energy efficiency in non-traction28
Railways have initiated several measures to promote energyefficiency in non-traction, therefore electricity consumption isnearly stagnant
However, still there is scope for improvement
According to TERI’s study, energy saving potential is around31% in non-traction by application of various energyconservation measures in lighting and air conditioningsystems

Promote use of renewable energy in railways29
IR Vision 2020 proposes to use at least 10% energy from renewable sources
2011-12 was declared as the ‘Year of Green Energy’ by IR– several renewable energy projects initiated by IR
Ample potential to replace conventional energy sources with renewable-based energy in IR – Need for a clear roadmap
Promote inter-modal shift
30
Even as investments are made in water and rail transport, there is a need to incentivize shift from road transport to rail and water
Necessary to design specific strategies to effect targeted shifts from road to rail and waterIn EU, the Marco Polo program being implemented to promote a switch of freight traffic to greener transport modes
Subsidy provided for every 500 tkm of freight shifted off roads

Estimate for energy reduction in Energy Security Ambitious Scenario (ESA) in TERI’s MARKAL Model: Assumptions
Continuous vehicle efficiency improvement (1-1.5% per annum)Natural gas seen as a bridge fuel while moving towards electric vehicles Higher penetration of electric vehicles (two wheelers, three wheelers, and cars) Higher penetration of biofuels; development and use of second and third generation biofuels also takes placesShare of public transport based passenger movement is 75% in 2031/32 (53% in RES) Demand side measures: 5% reduction in motorized passenger transportation demandShare of rail in freight movement (50% by 2031/32 as compared to 30% in RES) Share of rail in passenger movement (20% by 2031/32 as compared to 15% in RES) Share of electricity in rail based freight movement - 80% by 2031/32 as compared to 70% in RES; in passenger movement - 60% in 2031/32 as compared to 52 % in RES
31
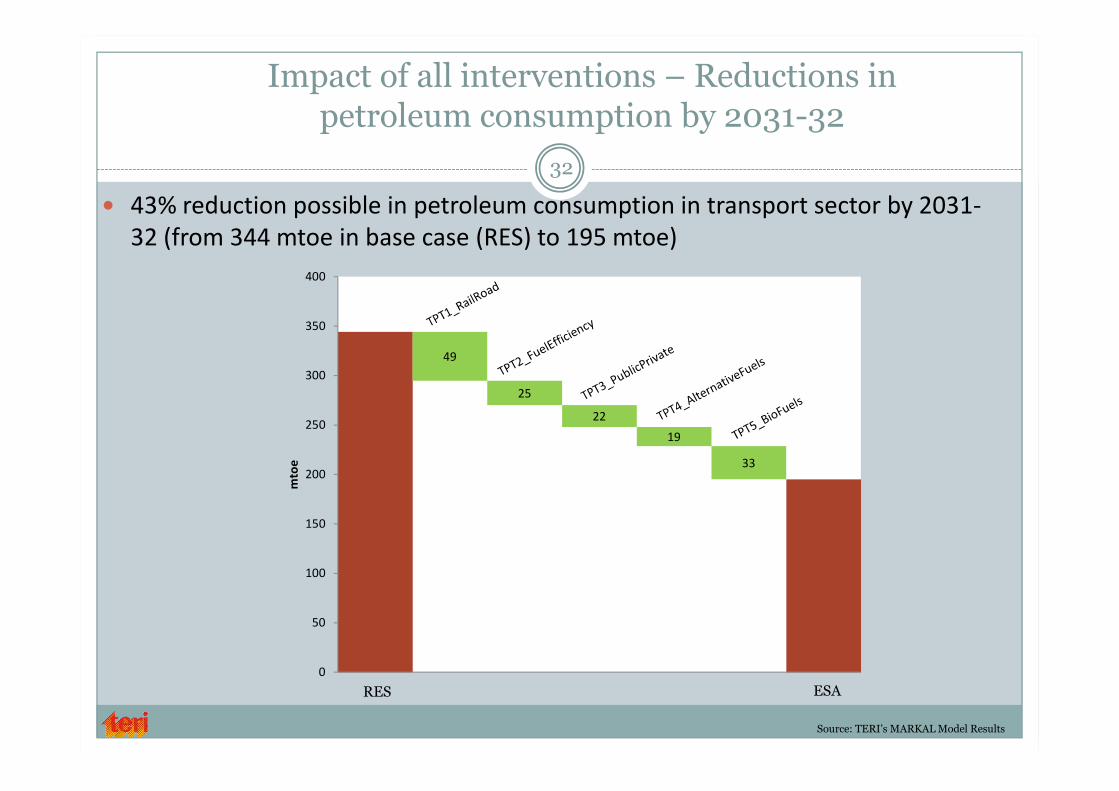
Impact of all interventions – Reductions in petroleum consumption by 2031-32
32
43% reduction possible in petroleum consumption in transport sector by 2031-32 (from 344 mtoe in base case (RES) to 195 mtoe)
Source: TERI’s MARKAL Model Results
49
25
2219
33
0
50
100
150
200
250
300
350
400m
toe
RES ESA

TERI’s work in transport sector33

Some typical studies34
Macro modelling of transport demand, energy consumption and CO2 emissionsCurrently working on special issue of TERI’s Energy Security Outlook on transportPrepared transport energy calculator for Planning Commission
Policy and economic feasibility studies on electric mobilityCurrently carrying out a cost benefit analysis of introducing hybrid/electric buses in the fleet of GSRTC and MTC
Energy and emissions impact analysis for inter-modal shiftCarried out study on impact of shift to high speed rail for ITPS, Japan
Life cycle energy and emission analysis for transport modesStudy carried out for the National Transport Development Policy Committee
Studies related to vehicular emissions and air pollutionStudies carried out for CPCB, MoEF, World Bank
Policy and technical studies on fuel efficiency standards Impact of subsidy removal in diesel on car ownership and useStudy on fare elasticity for DMRCPolicy studies related to sustainable urban transport – promoting sustainable urban transport planning, promoting cycling, improving informal transport modes

35
Thank you