Carbon footprint of an olive tree grove
10
Carbon footprint of an olive tree grove Stefania Proietti a , Paolo Sdringola a , Umberto Desideri a,⇑ , Francesco Zepparelli a , Antonio Brunori b , Luana Ilarioni b , Luigi Nasini b , Luca Regni b , Primo Proietti b a Department of Engineering, University of Perugia, Via G. Duranti 67, 06125 Perugia, Italy b Department of Agricultural, Food and Environmental Sciences, University of Perugia, Via Borgo XX Giugno 74, 06121 Perugia, Italy highlights The carbon stocks from olive permanent and non-permanent components were evaluated. The emissions due to the cultivation processes of the olive trees were identified. The carbon footprint of the olive grove over its life cycle (11 years) was assessed. The break-even point (where carbon stocks exceed carbon emissions) was determined. Actions for reducing emissions during the olive grove life cycle were proposed. article info Article history: Received 3 October 2013 Received in revised form 6 March 2014 Accepted 4 April 2014 Keywords: Carbon footprint Life Cycle Assessment Olea europaea Carbon stock CO 2 sequestration abstract In recent years, the role of Life Cycle Assessment (LCA) of products and processes has increased in importance, since it is the best technique to quantify environmental impacts associated with a process or product. The study was carried out in an olive grove located in Central Italy with ‘‘Leccino’’ cultivar. The olive grove was established in year 2000 with a planting distance of 5.5 5.5 m, trained to the vase system, under dry conditions. The same methodology used for forestry trees (‘‘model tree’’) was adopted to esti- mate the biomass and the respective carbon stock of the below-ground and above-ground parts of the olive tree as well as quantification of the non-permanent components periodically removed, i.e. fruits and prunings. The environmental impacts associated with management processes were evaluated according to LCA standards (UNI EN ISO 14040 and 14044). In relation to the impact on climate change, the CO 2 sources and sinks were calculated in order to obtain the net carbon stock of the olive grove. These data were con- firmed by experimental measurement of the tree biomass in three representative olive trees. The treat- ments and processes that had the greatest impact were identified and the individual phases and materials were then analysed in order to propose possible actions for reducing emissions throughout the entire olive grove life cycle. Removals and emissions were compared on a time scale, in order to identify the break-even point. The results allow to assess the carbon footprint of an olive grove, at different stages of its life cycle, as a support tool for creating a sustainable production chain in the olive sector. The paper proposes a meth- odological approach that can be adopted also in other olive groves with different horticultural manage- ment models. Ó 2014 Elsevier Ltd. All rights reserved. 1. Introduction The United Nations Framework Convention on Climate Change (UNFCCC) signed in Rio de Janeiro in 1992 was the first interna- tional legally binding tool directly related to climate change. With the Kyoto Protocol, the regulatory approach based on economic elements became an integral part of the strategy for reducing cli- mate-changing emissions (Joint Implementation, Clean Develop- ment mechanism and Emissions Trading) [1]. Through specified, binding and quantifiable targets of the Protocol, industrialized and in-transition countries are committed to limiting their green- house gas (GHG) emissions derived from human activities. To reduce GHG emissions, and specifically to fix CO 2 , the Proto- col identifies a number of activities that are closely related to land use (Land Use, Land-Use Change and Forestry, LULUCF). In this http://dx.doi.org/10.1016/j.apenergy.2014.04.019 0306-2619/Ó 2014 Elsevier Ltd. All rights reserved. ⇑ Corresponding author. Tel.: +39 075 5853743; fax: +39 075 5853736. E-mail address: [email protected] (U. Desideri). Applied Energy 127 (2014) 115–124 Contents lists available at ScienceDirect Applied Energy journal homepage: www.elsevier.com/locate/apenergy
Transcript of Carbon footprint of an olive tree grove

Applied Energy 127 (2014) 115–124
Contents lists available at ScienceDirect
Applied Energy
journal homepage: www.elsevier .com/locate /apenergy
Carbon footprint of an olive tree grove
http://dx.doi.org/10.1016/j.apenergy.2014.04.0190306-2619/� 2014 Elsevier Ltd. All rights reserved.
⇑ Corresponding author. Tel.: +39 075 5853743; fax: +39 075 5853736.E-mail address: [email protected] (U. Desideri).
Stefania Proietti a, Paolo Sdringola a, Umberto Desideri a,⇑, Francesco Zepparelli a, Antonio Brunori b,Luana Ilarioni b, Luigi Nasini b, Luca Regni b, Primo Proietti b
a Department of Engineering, University of Perugia, Via G. Duranti 67, 06125 Perugia, Italyb Department of Agricultural, Food and Environmental Sciences, University of Perugia, Via Borgo XX Giugno 74, 06121 Perugia, Italy
h i g h l i g h t s
� The carbon stocks from olive permanent and non-permanent components were evaluated.� The emissions due to the cultivation processes of the olive trees were identified.� The carbon footprint of the olive grove over its life cycle (11 years) was assessed.� The break-even point (where carbon stocks exceed carbon emissions) was determined.� Actions for reducing emissions during the olive grove life cycle were proposed.
a r t i c l e i n f o
Article history:Received 3 October 2013Received in revised form 6 March 2014Accepted 4 April 2014
Keywords:Carbon footprintLife Cycle AssessmentOlea europaeaCarbon stockCO2 sequestration
a b s t r a c t
In recent years, the role of Life Cycle Assessment (LCA) of products and processes has increased inimportance, since it is the best technique to quantify environmental impacts associated with a processor product.
The study was carried out in an olive grove located in Central Italy with ‘‘Leccino’’ cultivar. The olivegrove was established in year 2000 with a planting distance of 5.5 � 5.5 m, trained to the vase system,under dry conditions. The same methodology used for forestry trees (‘‘model tree’’) was adopted to esti-mate the biomass and the respective carbon stock of the below-ground and above-ground parts of theolive tree as well as quantification of the non-permanent components periodically removed, i.e. fruitsand prunings.
The environmental impacts associated with management processes were evaluated according to LCAstandards (UNI EN ISO 14040 and 14044). In relation to the impact on climate change, the CO2 sourcesand sinks were calculated in order to obtain the net carbon stock of the olive grove. These data were con-firmed by experimental measurement of the tree biomass in three representative olive trees. The treat-ments and processes that had the greatest impact were identified and the individual phases and materialswere then analysed in order to propose possible actions for reducing emissions throughout the entireolive grove life cycle. Removals and emissions were compared on a time scale, in order to identify thebreak-even point.
The results allow to assess the carbon footprint of an olive grove, at different stages of its life cycle, as asupport tool for creating a sustainable production chain in the olive sector. The paper proposes a meth-odological approach that can be adopted also in other olive groves with different horticultural manage-ment models.
� 2014 Elsevier Ltd. All rights reserved.
1. Introduction elements became an integral part of the strategy for reducing cli-
The United Nations Framework Convention on Climate Change(UNFCCC) signed in Rio de Janeiro in 1992 was the first interna-tional legally binding tool directly related to climate change. Withthe Kyoto Protocol, the regulatory approach based on economic
mate-changing emissions (Joint Implementation, Clean Develop-ment mechanism and Emissions Trading) [1]. Through specified,binding and quantifiable targets of the Protocol, industrializedand in-transition countries are committed to limiting their green-house gas (GHG) emissions derived from human activities.
To reduce GHG emissions, and specifically to fix CO2, the Proto-col identifies a number of activities that are closely related to landuse (Land Use, Land-Use Change and Forestry, LULUCF). In this

116 S. Proietti et al. / Applied Energy 127 (2014) 115–124
sector GHG sources and sinks are considered in five categories: for-est land, cropland, grassland, wetlands and settlements. In 2006,with the Guidelines for national greenhouse gas inventories, theInter-governmental Panel on Climate Change (IPCC) merged theAgricultural and LULUCF activities into a single category calledAgriculture, Forestry and Land Uses (AFOLU).
In this category, greenhouse gases have a twofold sign: esti-mates should include both CO2 absorption (live biomass, dead bio-mass and soil) and emissions. This mechanism is characterized by aseries of complex biological, physical and chemical processes thatare widespread and highly variable over time. The factors affectingemissions and removals can be both natural and anthropogenic.
Through photosynthesis, plants absorb CO2 from the atmo-sphere and release O2. A portion of the absorbed CO2 is returnedto the atmosphere through respiration, while a part is stored invarious organic compounds. This CO2 component increases, creat-ing a so-called carbon sink, until it reaches the upper limit beyondwhich the losses, due to respiration and the death of the trees, off-set the increase in carbon due to photosynthesis. It should be notedthat on a worldwide scale, after the use of fossil fuels for energy,agriculture and livestock are the major causes of greenhouse gasemissions (in particular CH4 and N2O). These net GHG emissionsplus the deforestation and degradation of tropical forests areresponsible for at least 15% of greenhouse gas emissions [2].
While quantification of the amount of forest carbon has beenthe object of extensive studies [3–6], information about theamount from agricultural systems is extremely limited, becausetheir productive role is usually considered rather than their ecolog-ical role.
1.1. Life Cycle Assessment and carbon footprint
Life Cycle Assessment (LCA) is an objective procedure for eval-uating energy and environmental loads related to a process oractivity. It is carried out by identifying the energy and materialsused and the waste released into the environment. In an assess-ment, the entire life cycle of the process or activity is evaluated,including the extraction and processing of raw materials, manufac-turing, transport, distribution, use, reuse, recycling and final dis-posal. The International Standards Organization (ISO) has definedand adopted standards that provide references for the correctapplication of a LCA, the UNI EN ISO 14040: 2006 [7] and UNI ENISO 14044: 2006 [8]. They are within the scope of the ISO 14000,related to environmental management systems and instrumentsfor their implementation.
In an LCA there is a shift from a separate study of the individualelements in the production processes, to a comprehensive view,where all the processes of transformation are considered in orderto achieve a specific final function. It starts from the extraction ofthe raw materials and ends with end-of-life disposal (‘‘cradle-to-grave’’, while aiming at the highest degree of environmental sus-tainability, i.e. ‘‘cradle-to-cradle’’ through reuse/recycling). Theapplication of LCA methodology does not guarantee a reductionof emissions or energy consumption, but it highlights the ‘‘weakpoints’’ of the production process and identifies possible improve-ments in technology and management within a perspective of sus-tainable development [9]. At the European level, the strategicimportance of LCA as a scientific tool for identifying significantenvironmental aspects is clearly expressed in the Green PaperCOM 2001/68/CE and COM 2003/302/CE related to Integrated Pol-icy of Products, and it is indirectly supported by European Regula-tions: EMAS (1221/2009/CE) and Ecolabel (66/2010/CE).
The Carbon Footprint (CF) can be seen as an LCA limited to theemissions that have an effect on climate change. It is defined as thesum of GHG emissions and removals, expressed as the net impacton global warming in terms of CO2 equivalents; the Carbon
Footprint of a Product (CFP) is specifically the CF of a product sys-tem and the GHG emissions refer to its complete life cycle. TheGHG emissions that are specified by the Kyoto Protocol include,among others, carbon dioxide (CO2), nitrous oxide (N2O), methane(CH4), sulphur hexafluoride (SF6), hydrofluorocarbons (HFCs) andperfluorocarbons (PFCs) [10]. The Global Warming Potential(GWP) is an indicator that quantifies the carbon footprint. This fac-tor describes the radiation forcing impact of one mass-based unitof a given greenhouse gas related to an equivalent unit of carbondioxide over the given period of time of 100 years (GWP100).GWP is thus based on a relative scale which compares the specificGHG with an equivalent mass of CO2, whose GWP by definition isequal to 1. Updated GWP factors from the IPCC should be used toquantify the amount of CO2-eq. The GWPs for different emissionscan then be added together and the sum expresses the overall con-tribution of these emissions to climate change [11]. Althoughbased on a life cycle approach, carbon footprints only addressimpacts on climate change. In order to avoid misleading resultsand erroneous strategic decisions, a CF assessment should beextended to include other important environmental impacts,which often run opposite to climate change resulting in a ‘‘shiftingof burdens’’.
Many researchers have analysed the carbon footprint of systemsand processes. Some examples are: strategies for integrating wasteand renewable energy into the energy source mix and conse-quently for reducing the carbon footprint of locally integratedenergy sectors [12]; a collaborative web service framework formeasuring, monitoring, and integrating environmental and carbonfootprint data in construction supply chains [13]; a comparison interms of cost and carbon footprint of two potential water supplyoptions, seawater desalination and water conveyance from remotelocations [14]; an analysis of carbon footprint within the context ofautomobile supply chain management [15]; and an evaluation ofthe environmental impact, and therefore the actual sustainabilityof photovoltaic technology, examining a ground-mounted plant(1.7 MWe) [16].
With reference to products and not to processes, the CFs of var-ious types of shopping bags (plastic, paper, non-woven and woven)were evaluated using LCA in cradle-to-gate and cradle-to-gravescenarios [17]. Other studies have been carried out addressing: acomparison between electric and LPG forklifts [18]; the uncer-tainty in estimated CFs of a liquid and a compact powder detergentand how the uncertainty varies with the type of comparison [19];the life cycle carbon footprint of National Geographic magazine,the results of which provided the publisher and material supplierswith information for reducing GHG [20]; a Life Cycle Energy Anal-ysis (LCEA) of two tourist accommodation facilities in Poole, Dorset(UK) to quantify their CO2 emissions [21]; the construction sector(materials, technical elements and entire building) [22–26].
With regard to food products, the scientific literature shows thatLCA and CF studies have been carried out in different sectors. Sev-eral consumer goods have been investigated in order to estimate:for example, the carbon footprint of bread produced and consumedin the UK [27]; sugar produced in eastern Thailand [28]; butter anddairy-blend products with the focus on fat content and size andtype of packaging [29]; carbon fluxes in the biomass of two typicalMediterranean orchards (olives and peach) [30]. Calculating the CFof food products is complex and is associated with unavoidableuncertainty due to the inherent variability of natural processes.Some researchers have quantified the uncertainty of common foodproducts, such as King Edward table potatoes grown in theÖstergötland region of Sweden or a refined wheat-based product(pasta) for different resolutions of farm-level in-data [31,32].Finally an interesting assessment was carried out on the effectsthat individual consumption behaviour has on climate change,focusing on products that satisfy the same need but which have
S. Proietti et al. / Applied Energy 127 (2014) 115–124 117
different carbon footprints. In particular, two types of drinkingwater, produced, distributed and consumed in Italy, were com-pared as a case study: tap water and PET-bottled natural mineralwater [33].
Environmental assessments focusing on olive sector were per-formed, as described by Salomone and Ioppolo [42], De Gennaroet al. [43] and Avraamides and Fatta [44].
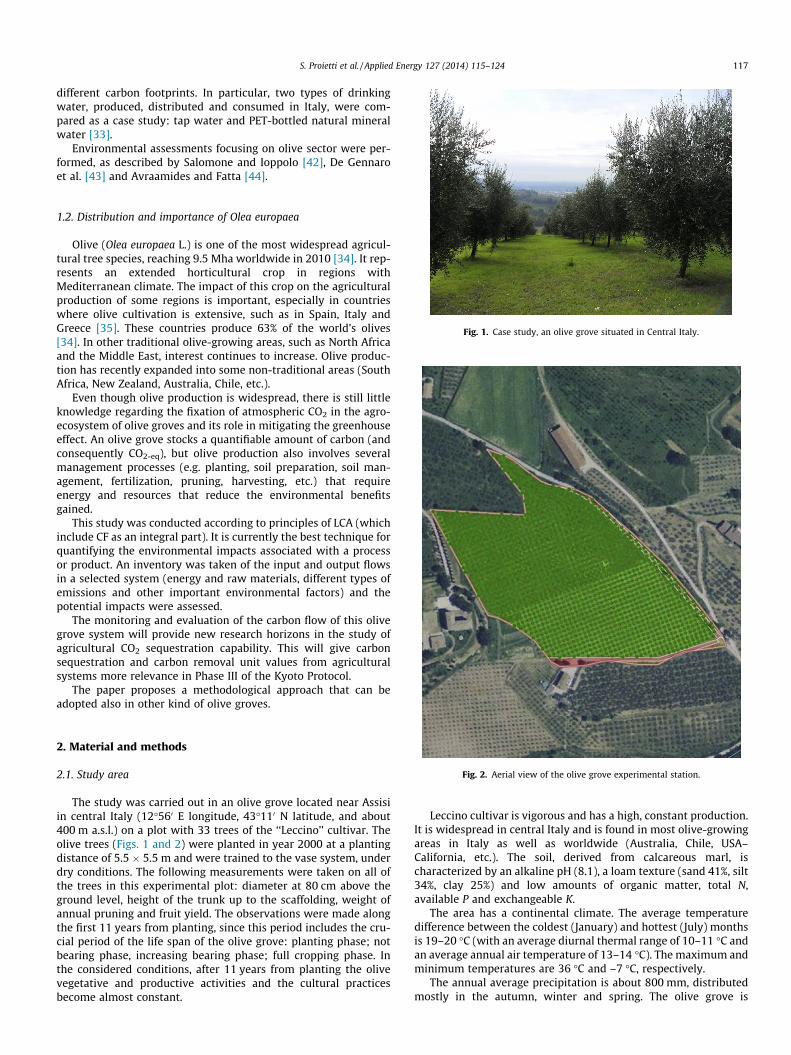
Fig. 1. Case study, an olive grove situated in Central Italy.
1.2. Distribution and importance of Olea europaea
Olive (Olea europaea L.) is one of the most widespread agricul-tural tree species, reaching 9.5 Mha worldwide in 2010 [34]. It rep-resents an extended horticultural crop in regions withMediterranean climate. The impact of this crop on the agriculturalproduction of some regions is important, especially in countrieswhere olive cultivation is extensive, such as in Spain, Italy andGreece [35]. These countries produce 63% of the world’s olives[34]. In other traditional olive-growing areas, such as North Africaand the Middle East, interest continues to increase. Olive produc-tion has recently expanded into some non-traditional areas (SouthAfrica, New Zealand, Australia, Chile, etc.).
Even though olive production is widespread, there is still littleknowledge regarding the fixation of atmospheric CO2 in the agro-ecosystem of olive groves and its role in mitigating the greenhouseeffect. An olive grove stocks a quantifiable amount of carbon (andconsequently CO2-eq), but olive production also involves severalmanagement processes (e.g. planting, soil preparation, soil man-agement, fertilization, pruning, harvesting, etc.) that requireenergy and resources that reduce the environmental benefitsgained.
This study was conducted according to principles of LCA (whichinclude CF as an integral part). It is currently the best technique forquantifying the environmental impacts associated with a processor product. An inventory was taken of the input and output flowsin a selected system (energy and raw materials, different types ofemissions and other important environmental factors) and thepotential impacts were assessed.
The monitoring and evaluation of the carbon flow of this olivegrove system will provide new research horizons in the study ofagricultural CO2 sequestration capability. This will give carbonsequestration and carbon removal unit values from agriculturalsystems more relevance in Phase III of the Kyoto Protocol.
The paper proposes a methodological approach that can beadopted also in other kind of olive groves.
Fig. 2. Aerial view of the olive grove experimental station.
2. Material and methods
2.1. Study area
The study was carried out in an olive grove located near Assisiin central Italy (12�560 E longitude, 43�110 N latitude, and about400 m a.s.l.) on a plot with 33 trees of the ‘‘Leccino’’ cultivar. Theolive trees (Figs. 1 and 2) were planted in year 2000 at a plantingdistance of 5.5 � 5.5 m and were trained to the vase system, underdry conditions. The following measurements were taken on all ofthe trees in this experimental plot: diameter at 80 cm above theground level, height of the trunk up to the scaffolding, weight ofannual pruning and fruit yield. The observations were made alongthe first 11 years from planting, since this period includes the cru-cial period of the life span of the olive grove: planting phase; notbearing phase, increasing bearing phase; full cropping phase. Inthe considered conditions, after 11 years from planting the olivevegetative and productive activities and the cultural practicesbecome almost constant.
Leccino cultivar is vigorous and has a high, constant production.It is widespread in central Italy and is found in most olive-growingareas in Italy as well as worldwide (Australia, Chile, USA–California, etc.). The soil, derived from calcareous marl, ischaracterized by an alkaline pH (8.1), a loam texture (sand 41%, silt34%, clay 25%) and low amounts of organic matter, total N,available P and exchangeable K.
The area has a continental climate. The average temperaturedifference between the coldest (January) and hottest (July) monthsis 19–20 �C (with an average diurnal thermal range of 10–11 �C andan average annual air temperature of 13–14 �C). The maximum andminimum temperatures are 36 �C and –7 �C, respectively.
The annual average precipitation is about 800 mm, distributedmostly in the autumn, winter and spring. The olive grove is

118 S. Proietti et al. / Applied Energy 127 (2014) 115–124
considered to be representative of many intensively managed olivegroves in central Italy.
Fig. 4. Cutting and uprooting of the model tree.
2.2. Methodology in calculating carbon stock
To calculate the carbon and CO2 stock of the olive grove since itsplanting, all of the dendrometric and fruit yield data were analysed[36], using the IPCC formula:
C ¼ ðV � D � BEFÞ � ð1þ RÞ � CF ð1Þ
where C is the carbon of the calculated biomass (tons); V is treestem volume (m3/ha); D is density of the wood (t/m3); BEF is bio-mass expansion factor to obtain the total above-ground biomass;R is ratio between below-ground and above-ground biomass; CFis the carbon fraction of the dry mass (conventionally equal to 0.5as suggested by IPCC 2003).
The weights of the permanent tree components (roots, exclud-ing thin roots; root collar; trunk; branches) and the non-perma-nent tree components (twigs and leaves) were estimated usingthe ‘‘model tree’’ method (Figs. 3 and 4) [37].
This is the most commonly used model in the forestry sectorbecause it allows the biomass of the stand, in which the model treeis living, to be calculated, with the least expenditure of time andmoney. This approach was tested and validated by Ilarioni et al.[38]. Three olive trees were selected as representatives of the olivegroves, having diameter at 80 cm above the ground level andheight of the trunk equal to the average diameter and height. Afteruprooting the three selected 11-year-old model trees in the olivegrove and taking care to retrieve most of their root system, theirindividual components, i.e. the trunk, branches, twigs and root col-lar (above-ground parts) and roots (below-ground part) wereweighed; samples from all of the parts were put in a ventilatedoven at 105 �C until they reached a constant weight, as suggestedby Hultnäs [39] and Nyström and Dahlquist [40]. To calculate theamount of organic C, the dry matter is multiplied by a value of Car-bon Fraction equal to 0.5.
This methodology was used to find the different IPCC indexesfor the olive grove. The amount of CO2-eq stocked by the averagetree in the form of organic substance was obtained by dividingthe amount of C by a factor equal to 0.27 (ratio of the moles of car-bon and the sum of the moles of carbon and oxygen). The result intons of C per hectare for the above-ground and below-ground bio-mass in the olive grove was obtained by multiplying the amount ofC in the ‘‘model tree’’ by the number of trees per hectare (330).
Fig. 3. Example of a model tree selected for the study.
2.3. LCA methodology
An LCA is divided into four main phases. Goal and scope defini-tion is the phase in which the investigated product, the systemboundaries and the data sources are described, and the functionalunit used in the analysis is defined. The Life Cycle Inventory (LCI) isan inventory of the input/output data with respect to the systemstudied. Data collection is necessary in LCI in order to meet the goalof the study. Data are collected on the energy and raw materialrequirements, air emissions, water-borne effluents, solid wasteand other material released into the environment during the lifecycle of a product, process or activity. Life Cycle Impact Assessment(LCIA) assesses the extent of potential environmental impactsusing the LCI results. The inventory data are associated with spe-cific environmental impact categories and class indicators. TheInterpretation is the final phase in which the results of an LCI oran LCIA, or both, are summarized, discussed and used as a basisfor conclusions, recommendations and decision-making in accor-dance with the defined aim and scope.
This LCA study assessed the environmental impact of olivegrove cultivation, particularly the calculation of CO2 emissionsthroughout the life cycle, in view of the carbon footprintevaluation.
The environmental impacts were simulated through the soft-ware SimaPro 7.1, produced by PRé Consultants. For the data imple-mentation, the general library Ecoinvent databases were mainlyused.
The environmental assessment was done using the Eco-Indica-tor 99 methodology, considering that the most suitable impact cat-egories were ‘‘Land Use’’, ‘‘Minerals’’, ‘‘Fossil fuels’’ and ‘‘ClimateChange’’. Some parameters such as GWP100 were then calculatedusing the EPD methodology.

Table 2EPD methodology categories.
Original names Names in SimaPro
Gross Calorific Values (GCV) Non renewable, fossilGreenhouse gases Global Warming (GWP100)Ozone depleting gases Ozone layer depletion (ODP)Acidifying compounds AcidificationGases creating ground level ozone Photochemical oxidationEutrophicating compounds Eutrophication
Table 3Average dry weight of permanent components of three ‘‘model tree’’ (11th year), withcalculated C and CO2-eq stock, measured after pruning and fruit harvesting.
Permanent tree component Dry weight (kg) C (kg) CO2-eq (kg)
Roots 8.23 4.11 15.22Root collar 12.02 6.01 22.26Trunk 13.94 6.97 25.81Branches 16.32 8.16 30.22Twigs 10.00 5.00 18.51Leaves 6.72 3.36 12.44
Total 67.23 33.61 124.48
S. Proietti et al. / Applied Energy 127 (2014) 115–124 119
2.4. Approach to LCI: description of the olive grove plant and datacollection methodology
To build an inventory, the qualitative and quantitative datawere collected separately for each unit process included withinthe system boundaries. In particular, the data sheet found inAppendix A of the UNI EN ISO 14044: 2006 was used as a model.It was modified according to the requirements of this LCA studyand the particular type of product examined.
All of the information collected is reported in a database thatwas used to make the calculations needed for the SimaPro 7.1 sim-ulation software. The olive grove was considered to be an assemblyof the different years of cultivation, each of which is a sub-assem-bly. For the eleven-year life cycle of the olive grove, the followingprocesses were taken into account in terms of material and energyflows (Table 1):
– Planting: of the olive grove: the transport phase, the fuel con-sumption by agricultural machinery, the substances used andthe man-hours needed.
– Fertilization: the amount of fertilizer used, the fuel consumptionby agricultural machinery and the man-hours needed.
– Phytosanitary treatments: the amount of pesticide used, the fuel con-sumption by agricultural machinery and the man-hours needed.
– Soil management: (green cover mowing or soil tillage): the fuelconsumption by the agricultural machinery and the man-hoursneeded.
– Chipping of prunings: the fuel consumption by agriculturalmachinery and the man-hours needed.
– Pruning: the transport, the fuel consumption by agriculturalmachinery and the man-hours needed.
– Olive harvesting: the fuel consumption by agricultural machin-ery, transport and the man-hours needed.
2.5. Life Cycle Impact Assessment
The Life Cycle Impact Assessment of this intensively managedolive grove was conducted after designating 1 ha of olive trees asa functional unit and estimating an 11-year life cycle. The variousstages of the assembly were entered into the section of SimaPro 7.1related to life cycle, with respect to the quantities of the definedfunctional unit.
To assess the potential environmental impact of the olive groveexamined in this LCA study, the EPD 2007 Impact AssessmentMethod was chosen. The categories are summarized in Table 2.
Except for the Gross Calorific Value (GCV), all of the impact cat-egories were taken directly from the CML 2 baseline 2000 method,also found in SimaPro.
3. Results
3.1. Calculation of carbon and CO2-eq stock of the permanentcomponents of the model trees
The average organic carbon in the permanent structures of the‘‘model tree’’, after weighing the dry matter of trunk, branches,
Table 1Processes considered throughout the life cycle.
Year 1
Process PlantingFertilizationPhytosanitary treatmentsSoil tillage
twigs and root collar (above-ground parts) and roots (below-ground part) of three representative trees, was 33.61 kg, parti-tioned in 29.50 kg of C in the above-ground biomass and 4.11 kgof C in the below-ground biomass. The amount of carbon calcu-lated using the weight of the individual components of the modeltree and the amount of equivalent carbon dioxide (CO2-eq) arereported in Table 3.
These data refer to the carbon stock of the average ‘‘model tree’’without considering the non-permanent components per tree(fruit and prunings), that were separately considered andmeasured.
3.2. Calculation of carbon and CO2-eq stock of the non-permanentcomponents of the model trees
The amount of carbon stocked by the non-permanent compo-nents of the three 11-year-old model tree was 11.04 kg. The valuewas calculated using the average weight of the fruit yields and pru-nings from the last three years (in order to take into account thealternate annual fruit production yield of the species). The amountof carbon and the average equivalent carbon dioxide per plant arereported in Table 4.
3.3. Calculation of carbon and CO2-eq stock of the olive grove
The amount of C in the permanent structures in the 11-year-oldolive grove was 11.09 t per hectare; the above-ground biomass was9.73 tC/ha and the below-ground biomass was 1.36 tC/ha. Theamount of CO2-eq of the permanent structures was 41.07 tons perhectare, while the above-ground biomass was 36.05 tCO2-eq/haand the below-ground biomass was 5.02 tCO2-eq/ha.
From year 2 to year 4 From year 5 to year 11
Fertilization FertilizationPhytosanitary treatments Phytosanitary treatmentsGreen cover mowing Green cover mowingChipping of prunings Chipping of pruningsPruning Pruning
Olive harvesting

Table 4Average dry weight of non permanent components of the model trees (11th year, average value of last 3 years), with calculated C and CO2-eq stock.
Non permanent tree component Dry weight (kg) C (kg) CO2-eq (kg)
Fruits 9.28 4.64 17.18Prunings 12.80 (9.53 branches + 3.27 leaves) 6.40 23.70
Total 22.08 11.04 40.88
Table 5Olive grove C and CO2-eq stock and sequestration during the 11 years.
Year 1 Year 2 Year 3 Year 4 Year 5 Year 6 Year 7 Year 8 Year 9 Year 10 Year 11
C stocked (tC/ha) 0 0.20 0.80 1.60 3.00 5.00 7.2 12.35 14.00 14.55 14.73CO2-eq stocked (tCO2-eq/ha) 0 0.74 2.96 5.93 11.11 18.52 26.67 45.74 51.85 53.88 54.55C sequestered (tC/ha) 0 0.20 0.60 0.80 1.40 2.00 2.20 5.15 1.65 0.55 0.18CO2-eq sequestered (tCO2-eq/ha) 0 0.74 2.22 2.96 5.19 7.41 8.15 19.07 6.11 2.03 0.67
120 S. Proietti et al. / Applied Energy 127 (2014) 115–124
The amount of C in the non-permanent components was 3.64tons per hectare; the fruit yield biomass was 1.53 tC/ha and thepruning biomass was 2.11 tC/ha. The amount of CO2-eq of non-permanent components was 13.44 tons per hectare; the fruitbiomass was 5.66 tCO2-eq/ha and the pruning biomass was7.81 tCO2-eq/ha.
In the total tree biomass (including roots, prunings and fruit),the dry weight was 14.73 tC/ha, which is equivalent to 54.57 tonsof CO2 stocked per hectare.
In the above-ground biomass with the addition of the values ofthe non-permanent structures (prunings and fruit), the dry weightwas 13.38 tC/ha which is equivalent to 49.55 tons of CO2 stockedper hectare.
3.4. Calculation of carbon and annual CO2-eq stocked by the olive groveduring its life cycle
The amounts of C, and consequently of CO2-eq, stocked by theolive grove, including prunings and fruit yield, are summa-rized in Table 5. The difference between the C and CO2-eq
amounts related to the nth and (n � 1)th year gives the annualsequestration of C and CO2-eq, as shown in the second part ofTable 5.
Within the system boundaries, the emissions related to part ofthe C accumulated in the soil after chipping the prunings were nottaken into account. In fact, in accordance with IPCC, ecosystems are
Table 6Annual data collected for every process.
Process Workinghours
Agricult(litres)
Planting (levelling, trenching, basal fertilization, refining,squaring, planting)
75 200 (tra
Fertilization 3 15 (trac
Phytosanitary treatments 4 20 (trac
Green cover mowing or soil tillage 3 30 (tracChipping of prunings 4 26 (shre
Pruning 20 20 (pneelectric
Olive harvesting 30 40 (trunpneuma
a Staff car, 1600 cc, petrol powered.
divided into three categories that can stock carbon: biomass, deadorganic matter (litter) and soil. To evaluate changes in the carbonstocks of the three categories and to assess the net balancebetween the CO2 emissions and absorptions, the IPCC methodology[41] was used. It is based on the assumption that changes in thecarbon stock in an ecosystem are mainly due to the exchange ofCO2 between the land surface and the atmosphere. Leaching oremissions that are not due to human activity (such as the percent-age of organic matter lost from prunings into the soil or from thelitter in a forest) can be ignored.
3.5. Application of LCA methodology
The results were examined by choosing 1 ha of olive grove as afunctional unit. This was done in order to normalize the flows intoand out of the system. The analysis of the life cycle considered aperiod of 11 years (beginning with the planting).
The study took into account all the processes that were carriedout in the cultivation of the olive grove (as reported in Table 1):planting, fertilization, phytosanitary treatments, soil management,pruning, chipping of prunings and harvesting, which define thephysical boundaries of the system. The annual data collected foreach process are summarized in Table 6.
The annual CO2-eq emissions per year to cultivate the olivegrove were calculated and are reported in Table 7.
ural fuel oil Material Transportationa Year
ctor) 500 kg potassiumsulfate,
150 km 1st
400 kg triplesuperphosphate
tor) 330 kg chemicalfertilizer
– Every year
tor) Copper sulfate: – Every year1 kg for 100 waterlitres
tor) – – Every yeardder) – – Starting from 2nd
yearumatic ortools)
– 100 km Starting from 2ndyear
k shaker ortic combs)
– 100 km Starting from 5thyear
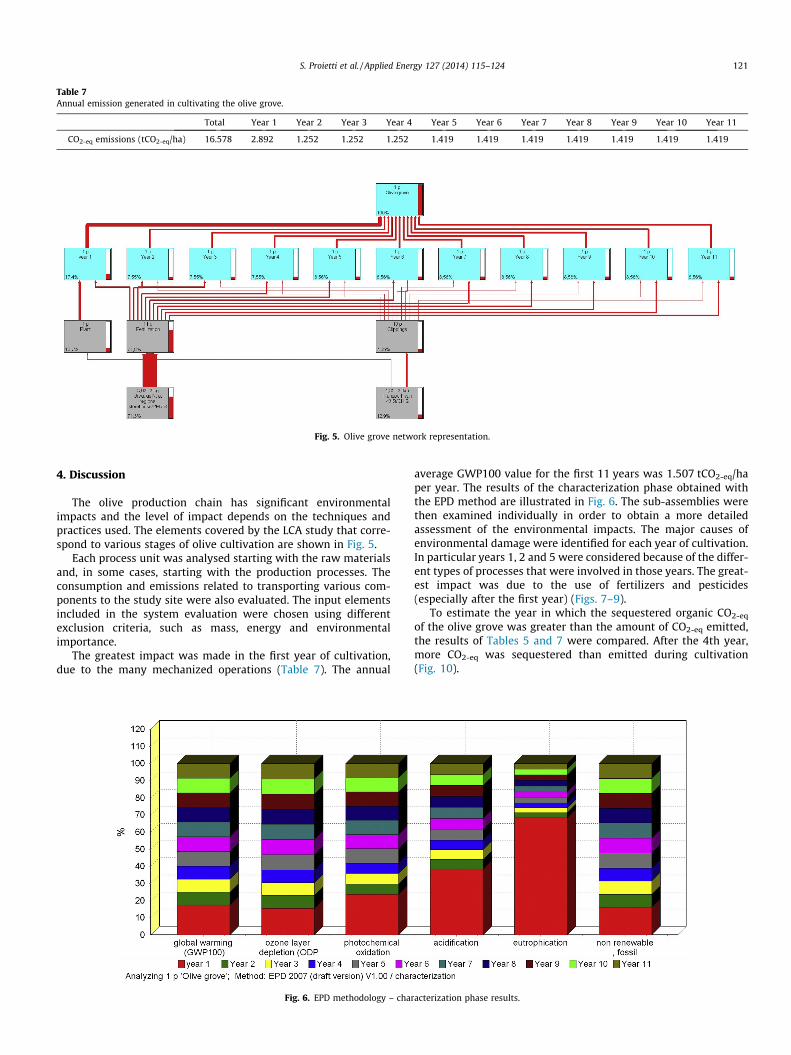
Table 7Annual emission generated in cultivating the olive grove.
Total Year 1 Year 2 Year 3 Year 4 Year 5 Year 6 Year 7 Year 8 Year 9 Year 10 Year 11
CO2-eq emissions (tCO2-eq/ha) 16.578 2.892 1.252 1.252 1.252 1.419 1.419 1.419 1.419 1.419 1.419 1.419
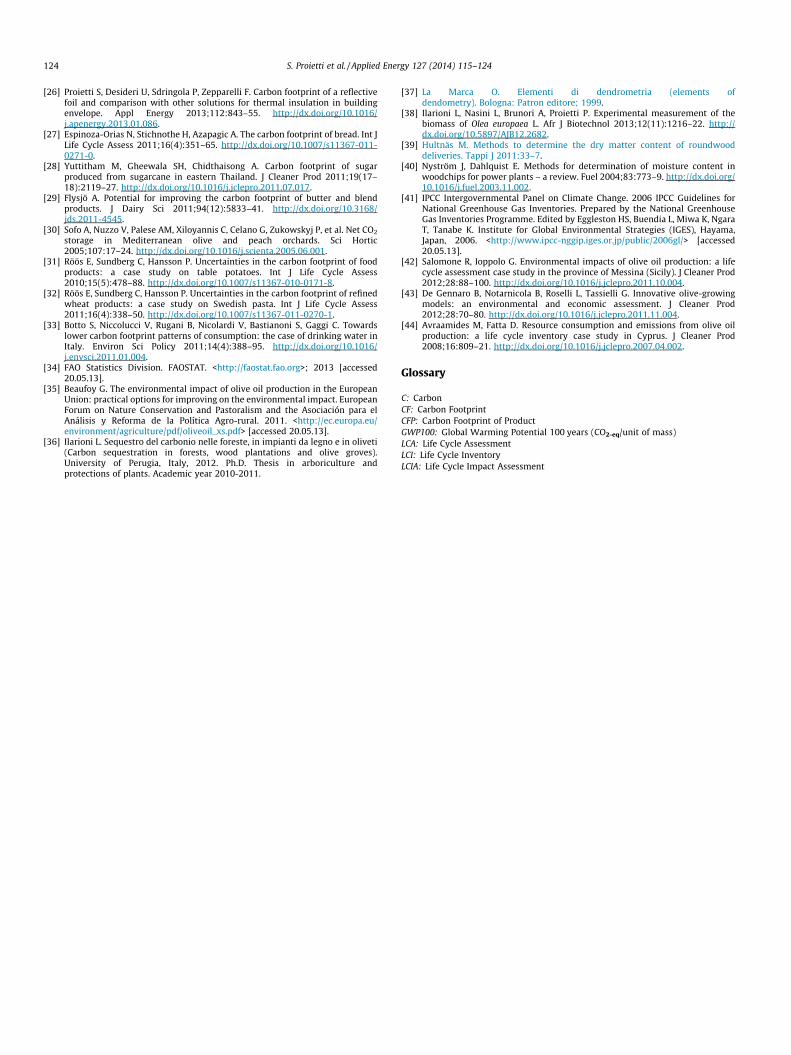
Fig. 5. Olive grove network representation.
S. Proietti et al. / Applied Energy 127 (2014) 115–124 121
4. Discussion
The olive production chain has significant environmentalimpacts and the level of impact depends on the techniques andpractices used. The elements covered by the LCA study that corre-spond to various stages of olive cultivation are shown in Fig. 5.
Each process unit was analysed starting with the raw materialsand, in some cases, starting with the production processes. Theconsumption and emissions related to transporting various com-ponents to the study site were also evaluated. The input elementsincluded in the system evaluation were chosen using differentexclusion criteria, such as mass, energy and environmentalimportance.
The greatest impact was made in the first year of cultivation,due to the many mechanized operations (Table 7). The annual
Fig. 6. EPD methodology – char
average GWP100 value for the first 11 years was 1.507 tCO2-eq/haper year. The results of the characterization phase obtained withthe EPD method are illustrated in Fig. 6. The sub-assemblies werethen examined individually in order to obtain a more detailedassessment of the environmental impacts. The major causes ofenvironmental damage were identified for each year of cultivation.In particular years 1, 2 and 5 were considered because of the differ-ent types of processes that were involved in those years. The great-est impact was due to the use of fertilizers and pesticides(especially after the first year) (Figs. 7–9).
To estimate the year in which the sequestered organic CO2-eq
of the olive grove was greater than the amount of CO2-eq emitted,the results of Tables 5 and 7 were compared. After the 4th year,more CO2-eq was sequestered than emitted during cultivation(Fig. 10).
acterization phase results.

Fig. 7. EPD methodology – characterization phase results for year 1 of cultivation.
Fig. 8. EPD methodology – characterization phase results for year 2 of cultivation.
Fig. 9. EPD methodology – characterization phase results for year 5 of cultivation.
122 S. Proietti et al. / Applied Energy 127 (2014) 115–124

Fig. 10. Comparison between olive grove cumulative CO2-eq emissions andsequestrations.
S. Proietti et al. / Applied Energy 127 (2014) 115–124 123
5. Conclusions
The present study was highlighted by several original elements:
� In the study of C sequestration in an olive grove, the contribu-tion made by the biomass removed through the annual pruningand fruit yield was also considered.� Each process was monitored in an on-site investigation and
long-term primary data were available, starting from the timeof planting.� The processes that had the greatest impact were identified and
the individual phases and materials were analysed further.� Carbon sequestration and emissions were compared on a time
scale, in order to identify the break-even point, after whichthe amount of sequestered carbon exceeds the energy invest-ments linked to human activities. From the results, it can beassumed that energy investments (in the first 11 years of theolive grove) were not relevant and were surpassed by plant Cabsorption activity after the first four years.
The following conclusions have been made:
1. The greatest impact occurred in the first year of cultivation. Theannual average GWP100 value for the first 11 years of the olivegrove was 1.507 tCO2-eq/ha per year.
2. Considering the different years of cultivation, the greatestimpact was made by the use of fertilizers and pesticides (espe-cially after the first year).
3. Olive cultivation could be eligible for future investments relatedto the carbon credit market.
4. If low impact management activities (such as no-chemical fer-tilization and organic phytosanitary treatments) are used, thecarbon footprint of olive cultivation could be lower and lessC-fossil-dependent.
Acknowledgements
Part of the research was supported by the Italian Ministry ofEducation, University and Research – PRIN Project 2010-2011 prot.201049EXTW_009 ‘‘CARBONTREE’’ – Strategie di mitigazione deicambiamenti climatici da parte dei sistemi colturali agricoli eforestali italiani (Climate change mitigation strategies in agricul-ture and forestry in Italy).
References
[1] Lattazzi P. Gli strumenti di mercato e la riduzione delle emissioni climalteranti(Market mechanisms and the reduction of GHG emissions). In: Paoloni L,editor. Tellus Editions. Politiche di forestazione ed emissioni clima alteranti,Studi e Materiali di diritto agrario (Afforestation politics and GHG emissions,Studies and Materials of agricolture jurisprudence). Rome; 2009.
[2] Van der Werf GR, Morton DC, DeFries RS, Olivier JGJ, Kasibhatla PS, Jackson RB,et al. CO2 emissions from forest loss. Nat Geosci 2009;2:737–8.
[3] Brown S. Measuring carbon in forests: current status and future challenges.Environ Pollut 2002;116(3):363–72. http://dx.doi.org/10.1016/S0269-7491(01)00212-3.
[4] Fonseca W, Rey Benayas JM, Alice FE. Carbon accumulation in the biomass andsoil of different aged secondary forests in the humid tropics of Costa Rica. ForEcol Manage 2011;262(8):1400–8. http://dx.doi.org/10.1016/j.foreco.2011.06.036.
[5] Kauppi PE, Rautiainen A, Korhonen KT, Lehtonen A, Liski J, Nöjd P, et al.Changing stock of biomass carbon in a boreal forest over 93 years. For EcolManage 2010;259(7):1239–44. http://dx.doi.org/10.1016/j.foreco.2009.07.044.
[6] Peichl M, Arain MA. Allometry and partitioning of above- and belowgroundtree biomass in an age sequence of white pine forests. For Ecol Manage2007;253(1–3):68–80. http://dx.doi.org/10.1016/j.foreco.2007.07.003.
[7] UNI EN ISO 14040. Environmental management – life cycle assessment –principles and framework; 2006.
[8] UNI EN ISO 14044. Environmental management – life cycle assessment –requirements and guidelines; 2006.
[9] JRC-IES Joint Research Centre, Institute for Environment and Sustainability ofthe European Commission. International Reference Life Cycle Data System(ILCD) Handbook – General guide for Life Cycle Assessment – Detailedguidance. Publications Office of the European Union 2010. <http://lct.jrc.ec.europa.eu> [accessed 20.05.13].
[10] Finkbeiner M. Carbon footprinting – opportunities and threats. Int J Life CycleAssess 2009;14(2):91–4. http://dx.doi.org/10.1007/s11367-009-0064-x.
[11] JRC Joint Research Centre, European Platform on Life Cycle Assessment. Carbonfootprint – What it is and how to measure it. Publications Office of theEuropean Union 2007. <http://lct.jrc.ec.europa.eu> [accessed 20.05.13].
[12] Perry S, Klemeš J, Bulatov I. Integrating waste and renewable energy to reducethe carbon footprint of locally integrated energy sectors. Energy2008;33(10):1489–97. http://dx.doi.org/10.1016/j.energy.2008.03.008.
[13] Chenga JC. A web service framework for measuring and monitoringenvironmental and carbon footprint in construction supply chains. Proc Eng2011;14:141–7. http://dx.doi.org/10.1016/j.proeng.2011.07.016.
[14] Shrestha E, Ahmad S, Johnson W, Shrestha P, Batista JR. Carbon footprint ofwater conveyance versus desalination as alternatives to expand water supply.Desalination 2011;280(1–3):33–43. http://dx.doi.org/10.1016/j.desal.2011.06.062.
[15] Lee K. Integrating carbon footprint into supply chain management: the case ofHyundai Motor Company (HMC) in the automobile industry. J Cleaner Prod2011;19(11):1216–23. http://dx.doi.org/10.1016/j.jclepro.2011.03.010.
[16] Desideri U, Proietti S, Zepparelli F, Sdringola P, Bini S. Life cycle assessment of aground-mounted 1778 kWp photovoltaic plant and comparison withtraditional energy production systems. Appl Energy 2012;97:930–43. http://dx.doi.org/10.1016/j.apenergy.2012.01.055.
[17] Muthu Subramanian Senthilkannan, Li Y, Hu JY, Mok PY. Carbon footprint ofshopping (grocery) bags in China, Hong Kong and India. Atmos Environ2011;45(2):469–75. http://dx.doi.org/10.1016/j.atmosenv.2010.09.054.
[18] Johnson E. Disagreement over carbon footprints: a comparison of electric andLPG forklifts. Energy Policy 2008;36(4):1569–73. http://dx.doi.org/10.1016/j.enpol.2008.01.014.
[19] De Koning A, Schowanek D, Dewaele J, Weisbrod A, Guinée J. Uncertainties in acarbon footprint model for detergents; quantifying the confidence in acomparative result. Int J Life Cycle Assess 2010;15(1):79–89. http://dx.doi.org/10.1007/s11367-009-0123-3.
[20] Boguski TK. Life cycle carbon footprint of the national geographic magazine.Int J Life Cycle Assess 2010;15(7):635–43. http://dx.doi.org/10.1007/s11367-010-0210-5.
[21] Filimonau V, Dickinson J, Robbins D, Huijbregts MAJ. Reviewing the carbonfootprint analysis of hotels: life cycle energy analysis (LCEA) as a holisticmethod for carbon impact appraisal of tourist accommodation. J Cleaner Prod2011;19(17–18):1917–30. http://dx.doi.org/10.1016/j.jclepro.2011.07.002.
[22] Frenette CD, Bulle C, Beauregard R, Salenikovich A, Derome D. Using life cycleassessment to derive an environmental index for light-frame wood wallassemblies. Build Environ 2010;45(10):2111–22. http://dx.doi.org/10.1016/j.buildenv.2010.03.009.
[23] Haapio A, Viitaniemi P. Environmental effect of structural solutions andbuilding materials to a building. Environ Impact Assess Rev2008;28(8):587–600. http://dx.doi.org/10.1016/j.eiar.2008.02.002.
[24] Kellenberger D, Althaus H. Relevance of simplifications in LCA of buildingcomponents. Build Environ 2009;44(4):818–25. http://dx.doi.org/10.1016/j.buildenv.2008.06.002.
[25] Ortiz O, Pasqualino JC, Díez G, Castells F. The environmental impact of theconstruction phase: an application to composite walls from a life cycleperspective. Resour Conserv Recycl 2010;54(11):832–40. http://dx.doi.org/10.1016/j.resconrec.2010.01.002.
124 S. Proietti et al. / Applied Energy 127 (2014) 115–124
[26] Proietti S, Desideri U, Sdringola P, Zepparelli F. Carbon footprint of a reflectivefoil and comparison with other solutions for thermal insulation in buildingenvelope. Appl Energy 2013;112:843–55. http://dx.doi.org/10.1016/j.apenergy.2013.01.086.
[27] Espinoza-Orias N, Stichnothe H, Azapagic A. The carbon footprint of bread. Int JLife Cycle Assess 2011;16(4):351–65. http://dx.doi.org/10.1007/s11367-011-0271-0.
[28] Yuttitham M, Gheewala SH, Chidthaisong A. Carbon footprint of sugarproduced from sugarcane in eastern Thailand. J Cleaner Prod 2011;19(17–18):2119–27. http://dx.doi.org/10.1016/j.jclepro.2011.07.017.
[29] Flysjö A. Potential for improving the carbon footprint of butter and blendproducts. J Dairy Sci 2011;94(12):5833–41. http://dx.doi.org/10.3168/jds.2011-4545.
[30] Sofo A, Nuzzo V, Palese AM, Xiloyannis C, Celano G, Zukowskyj P, et al. Net CO2
storage in Mediterranean olive and peach orchards. Sci Hortic2005;107:17–24. http://dx.doi.org/10.1016/j.scienta.2005.06.001.
[31] Röös E, Sundberg C, Hansson P. Uncertainties in the carbon footprint of foodproducts: a case study on table potatoes. Int J Life Cycle Assess2010;15(5):478–88. http://dx.doi.org/10.1007/s11367-010-0171-8.
[32] Röös E, Sundberg C, Hansson P. Uncertainties in the carbon footprint of refinedwheat products: a case study on Swedish pasta. Int J Life Cycle Assess2011;16(4):338–50. http://dx.doi.org/10.1007/s11367-011-0270-1.
[33] Botto S, Niccolucci V, Rugani B, Nicolardi V, Bastianoni S, Gaggi C. Towardslower carbon footprint patterns of consumption: the case of drinking water inItaly. Environ Sci Policy 2011;14(4):388–95. http://dx.doi.org/10.1016/j.envsci.2011.01.004.
[34] FAO Statistics Division. FAOSTAT. <http://faostat.fao.org>; 2013 [accessed20.05.13].
[35] Beaufoy G. The environmental impact of olive oil production in the EuropeanUnion: practical options for improving on the environmental impact. EuropeanForum on Nature Conservation and Pastoralism and the Asociación para elAnálisis y Reforma de la Política Agro-rural. 2011. <http://ec.europa.eu/environment/agriculture/pdf/oliveoil_xs.pdf> [accessed 20.05.13].
[36] Ilarioni L. Sequestro del carbonio nelle foreste, in impianti da legno e in oliveti(Carbon sequestration in forests, wood plantations and olive groves).University of Perugia, Italy, 2012. Ph.D. Thesis in arboriculture andprotections of plants. Academic year 2010-2011.
[37] La Marca O. Elementi di dendrometria (elements ofdendometry). Bologna: Patron editore; 1999.
[38] Ilarioni L, Nasini L, Brunori A, Proietti P. Experimental measurement of thebiomass of Olea europaea L. Afr J Biotechnol 2013;12(11):1216–22. http://dx.doi.org/10.5897/AJB12.2682.
[39] Hultnäs M. Methods to determine the dry matter content of roundwooddeliveries. Tappi J 2011:33–7.
[40] Nyström J, Dahlquist E. Methods for determination of moisture content inwoodchips for power plants – a review. Fuel 2004;83:773–9. http://dx.doi.org/10.1016/j.fuel.2003.11.002.
[41] IPCC Intergovernmental Panel on Climate Change. 2006 IPCC Guidelines forNational Greenhouse Gas Inventories. Prepared by the National GreenhouseGas Inventories Programme. Edited by Eggleston HS, Buendia L, Miwa K, NgaraT, Tanabe K. Institute for Global Environmental Strategies (IGES), Hayama,Japan, 2006. <http://www.ipcc-nggip.iges.or.jp/public/2006gl/> [accessed20.05.13].
[42] Salomone R, Ioppolo G. Environmental impacts of olive oil production: a lifecycle assessment case study in the province of Messina (Sicily). J Cleaner Prod2012;28:88–100. http://dx.doi.org/10.1016/j.jclepro.2011.10.004.
[43] De Gennaro B, Notarnicola B, Roselli L, Tassielli G. Innovative olive-growingmodels: an environmental and economic assessment. J Cleaner Prod2012;28:70–80. http://dx.doi.org/10.1016/j.jclepro.2011.11.004.
[44] Avraamides M, Fatta D. Resource consumption and emissions from olive oilproduction: a life cycle inventory case study in Cyprus. J Cleaner Prod2008;16:809–21. http://dx.doi.org/10.1016/j.jclepro.2007.04.002.
Glossary
C: CarbonCF: Carbon FootprintCFP: Carbon Footprint of ProductGWP100: Global Warming Potential 100 years (CO2-eq/unit of mass)LCA: Life Cycle AssessmentLCI: Life Cycle InventoryLCIA: Life Cycle Impact Assessment