The hidden footprint of UK production overseas - Squarespace
Upload
khangminh22Category
view
0download
0
CARBON FOOTPRINT REPORT OF MAITREYI COLLEGE
ReportingYear 2018-19
Prepared By: Pooja Goel (GGSIPU)

2 | P a g e
ACKNOWLEDGEMENT
Report Prepared By
Pooja Goel
Special Thanks to Principal: Dr. Haritma Chopra
Core Team:
Teachers: Dr. Pinkey Gandhi; Dr. Veena Ghuriani; Dr. Pooja Baweja Non-teaching Staff: Sachin Saini
Students: Nikita Goel; Shivani Sharma; Ritika; Nidhi Yadav; Tanishka; Stuti
Alumni: Neha Kaul (Batch: 2009 - 2012)

3 | P a g e
Table of Contents
1. Executive Summary ........................................................................................................ 5
1.1 About the project……………………………………………………………………….….5
1.2 Objectives of the project…………………………………………………………………..6
1.3 Relevance ........................................................................................................................ 6
2. Background…………………………………………………………………………… .8
3. Study Area ....................................................................................................................... 9
3.1 About reporting entity
3.2 Reporting Period
3.3 Scope of project
4. Methodology for GHG Quantification ......................................................................... 10
4.1 About the Agile CF Toolkit…………………………………………………………...11
4.2 Limitations Disclosure………………………………………………………………...12
5. Data Collection…………………………………………………………………………...13
5.1 Scope 1 Direct GHG Emissions
5.2 Scope 2 Electricity Indirect GHG Emissions
5.3 Scope 3 Other Indirect GHG Emissions
6. Data Analysis: Calculations and Results……………………………………………….14
6.1 Scope 1 GHG Emissions……………………………………………………………..14
6.2 Scope 2 GHG Emissions……………………………………………………………...15
6.3 Scope 3 GHG Emissions……………………………………………………………...16
7. Recommendations and Suggestions……………………………………………………..18
7.1 General…………………………………………………………………………..……18
7.2 Scope wise mitigation measures…...…………………………………………………18
8. Conclusion and Discussion ........................................................................................... 22
9. References……………………………………………………………………………….24
4 | P a g e
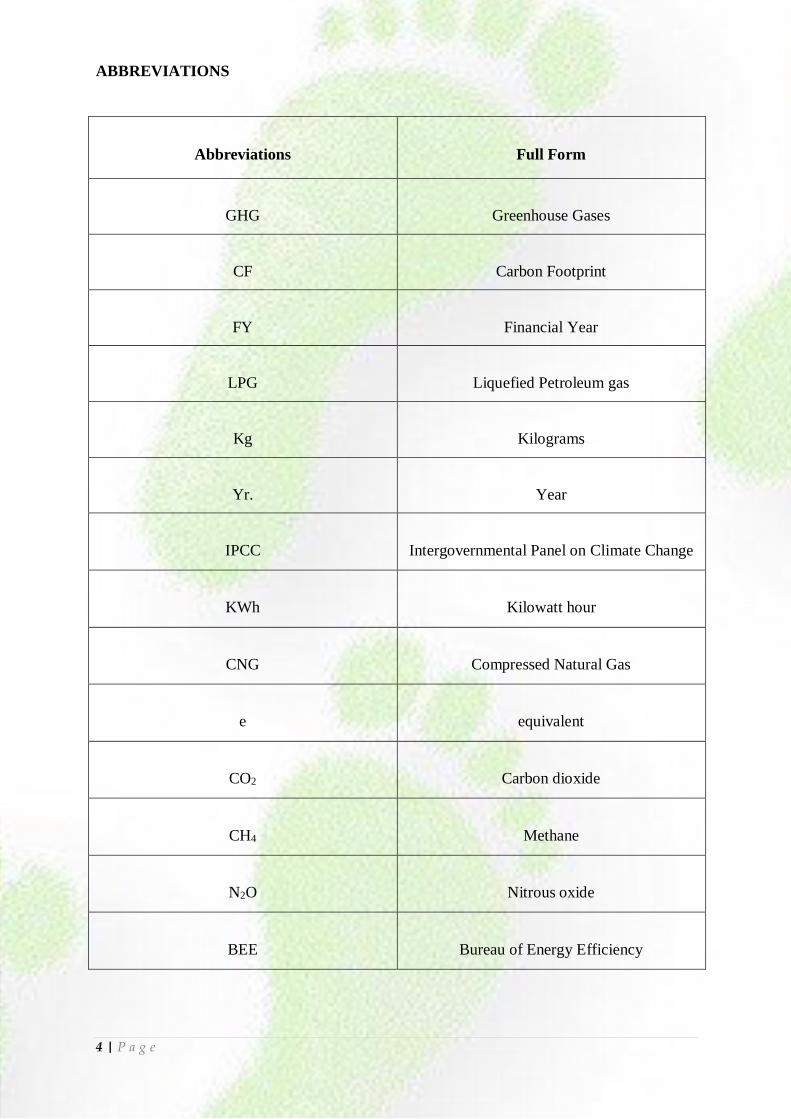
ABBREVIATIONS
Abbreviations
Full Form
GHG
Greenhouse Gases
CF
Carbon Footprint
FY
Financial Year
LPG
Liquefied Petroleum gas
Kg
Kilograms
Yr.
Year
IPCC
Intergovernmental Panel on Climate Change
KWh
Kilowatt hour
CNG
Compressed Natural Gas
e
equivalent
CO2
Carbon dioxide
CH4
Methane
N2O
Nitrous oxide
BEE
Bureau of Energy Efficiency

5 | P a g e
1. EXECUTIVE SUMMARY
1.1 ABOUT THE PROJECT
Carbon Footprint refers to the potential climatic impact (Global Warming) of the
Greenhouse Gases (GHG) emitted directly or indirectly due to an organization’s activities.
A Carbon Footprint Disclosure of any educational institution is very important to understand
such that its key emission sources can be identified and necessary mitigation measures can be
adopted for carbon reduction.
In today’s date, very few colleges disclose their carbon emissions. Maitreyi College under
Delhi University is a STAR College that has taken a first-time initiative to compute its carbon
footprint and set a benchmark for other Colleges/Universities. The college has adopted a
carbon reduction strategy to undertake this project.
Figure 1: Carbon Roadmap Strategy
The report indicates GHG emissions assessed for Maitreyi College for the Financial Year
2018-19. The report highlights the current key emission sources of the college and sets a
baseline data for setting up college-wide emission reduction targets for next Financial Years
(FY). Several recognized national and international standards have been referred for the
computation of the footprint of the college.
The project was carried out in three phases namely, Planning, Collection of data and
Estimation of CO2 following with suggestive measures for reduction. The project was
initiated with understanding the intent of management, post which a core team was
formulated comprising of teachers and students from different departments. Several site visits
and face to face interactions were done with the departments to collect the required data. The
study included extensive research on latest emission factors for computing the footprint. Both
Feasibility study on
carbon reduction
measures
Evaluation
Setting practiced and
pragmatic carbon
reduction targets
Implementation of
programmes
Development of
carbon reduction
programmes

6 | P a g e
qualitative and quantitative data was collected from the college. An online survey was
conducted for capturing data on commuting. The survey was carried out for a month and was
rolled out to the teachers, non-teaching staff and students.
The successful completion of this project is dedicated to the entire college because of its hard
work & enthusiasm shown. Cooperation from all the departments led to the smooth running
of the project throughout 3 months.
Maitreyi College, through this project, has reported on its scope 1, 2 & 3 carbon emissions,
emerging as the first Delhi University College to undergo such disclosure. Through this,
other educational institutions will be motivated to undertake similar disclosure projects and
bring to the table innovative & cost effective carbon reduction measures for education sector.
The benefits of the project will manifest in substantial utility cost reductions across the on-
campus operations and will lead to both financial as well as environmental sustainability of
the college.
1.2 OBJECTIVES OF THE PROJECT
Identify key emission sources of GHG at the campus
Compute Scope 1, Scope 2 and Scope 3 emissions for operations carried out at
Maitreyi
Analyze the results and provide cost effective & efficient measures for reducing
the GHG emissions.
1.3 RELEVANCE
Today’s changing climate has resulted in an increased temperature (global warming) world-
wide. In addition to this, the year 2018 experienced some of the catastrophic climate
extremes, including disastrous storms, floods, droughts, heat waves etc. causing huge loss
and damage to both life and property.
India’s Nationally Determined Contributions (NDCs) commit to reduce its emission intensity
per unit GDP by 33 to 35% below 2005 by 2030 under the Paris Agreement. This has resulted
in the need for various sectors to come up and report their carbon emissions so that
appropriate measures can be adopted. Reporting the emissions will enable them to set
practical targets for carbon reduction in upcoming years.
An educational institution plays an influential role in both local and national policymaking,
both by informing society through research and educating graduates. It sets ground for

7 | P a g e
imparting responsible perspectives to the young minds who act as successful incubators for
innovation, from which many sustainability initiatives originate.
Computing Carbon Footprint of Maitreyi College will allow them to position themselves
favourably in tackling the future challenges associated with a changing climate. Maitreyi
College being a pioneer Delhi University College provides a diverse range of graduate, post
graduate and other courses. Therefore, it holds a significant position in population, economic
importance and societal influence.
With the help of such projects, students, teachers and other staff will get a chance to
understand the importance & relevance of global warming, GHG emissions & carbon
footprint. Such projects will help students develop knowledge on key areas and gain first-
hand experience which will invite career opportunities for them in the field of climate
change. The project will empower them to suggest new innovative ideas on how emissions
can be reduced across the college operations. Prioritising carbon reductions at the college
campus will not only yield environmental benefits to them but will also promote financial
savings and increase competition among other educational institutions.

8 | P a g e
2. BACKGROUND
Currently, Global warming has become one of the most prominent issues faced by world
community at local, national and global level. The most instant and obvious effect of global
warming is the increase in temperatures around the world. GHG emissions are one of the
primary causes of global warming. The valuable first step towards the emission reduction and
understanding disaster risk, is quantifying the GHG emissions due to various human
activities.
Carbon Footprint (CF), as an indicator of climate performance, helps identify major GHG
emission sources & potential areas for improvement. It has been introduced as a tool to guide
the relevant emission cuts and verifications that will facilitate the understanding of the risk of
global warming at the very first stage. According to Carbon Trust (2007), “Carbon
Footprint is defined as a measurement of the total GHG emissions caused directly and
indirectly by an individual, an organization, event or product and is expressed as a carbon
dioxide equivalent (CO₂e)”. An organizational carbon footprint measures the GHG emissions
from all the activities across the organization, including energy used in buildings, industrial
processes, fugitive emissions and organization’s vehicles. Besides quantifying organization’s
total GHG impact, a CF analysis will provide the organization with a comprehensive GHG
inventory, allowing it to identify and target reductions from its major emissions sources.
Different sectors like Manufacturing Industries, Hospitality, Hotels, Educational Institutions,
Agricultural Sector, Medical Industry etc. estimate their carbon footprint nowadays.
The study is an initial step of action, towards mitigating the emissions of the college and
formulates an environmental policy framework. It will give an overall picture of the campus
CO2 emissions; help identify major emission sources & potential areas of improvement.

9 | P a g e
3. STUDY AREA
3.1. ABOUT REPORTING ENTITY: Maitreyi College, University of Delhi.
Carbon Footprint was carried out at the campus of Maitreyi College in Chanakyapuri spread
over 10 acres of land in lush green surroundings with extensive play grounds and open
spaces.
3.2.REPORTING PERIOD: 1 April 2018 to 31 March 2019
The emissions reported for FY 18-19 will be considered as baseline to set emission reduction
targets for upcoming FYs.
3.3.SCOPE OF PROJECT:
a) Physical boundary
- Location of the building: Maitreyi College, Bapudham Complex,
Chanakyapuri, New Delhi-110021
- Description of areas excluded from GHG accounting: The new Science block
(non-operational) and the Girls Hostel (under construction) were not in the
scope.
b) Operational boundary
- Scope 1 Direct GHG emissions from:
Combustion of fuels in stationary sources-diesel used in electricity
generators
Combustion of fuels in stationary sources – LPG consumption in canteen
and Chemistry laboratories
Combustion of fuels in mobile sources- CNG used in owned vehicle
(College Bus)
Fugitive emissions from Refrigeration/air-conditioning equipment
- Scope 2 Indirect emissions from:
Purchased electricity
- Scope 3 Other Indirect GHG emissions from:
GHG emissions due to daily commuting of Teaching Staff, Non-Teaching
Staff and Students to and from college
GHG emissions due to paper consumption
GHG emissions from garden waste generation across the campus

10 | P a g e
4. METHODOLOGY FOR GHG QUANTIFICATION
Figure 2: Flowchart showing adopted methodology for estimation of Carbon Footprint
Both qualitative and quantitative data was collected for the project:
Figure 3: Types & methods of data collection
Best practices listed for the College to reduce the emissions
Analysis of the collected data to calculate the Carbon dioxide equivalent for all the three scopes.
On the basis of data collected, Emission factors were obtained for the calculation of Carbon Footprint.
Scope 1, Scope 2 and Scope 3 sources were identified and listed through site visits
Validation and quantification of data.
Data Collection Template was designed to track emissions
Set the Operational Boundaries: Operational buildings/departments were decided for which the Foootprint was calculated
Set the organizational boundaries
DATA COLLECTION
Primary Online Survey
Face to Face Discussions
On site Visits
Personal Interviews
Secodary
Unpublished sources
Invoices and Quotations
Record/Maintenance Registers

11 | P a g e
Of some of the d
Figure 4: Scheme adopted for the implementation of CF methodology
Calculation of GHG emissions from the unit of activity data requires emission factors for
various Greenhouse Gases (specifically CO2, CH4and N2O). These factors enable GHG
emissions to be estimated from a unit of available activity data (e.g. Kg of fuel consumed, Kg
of product produced etc.). These are multiplied with their respective conversion factors to be
expressed in terms of kg CO2 equivalent (kgCO2e). These emission factors were researched
and extracted from various national and international standards. Compilation of all the latest
required factors was done in the Agile Carbon Footprint Toolkit© which was later used in the
computation of the carbon footprint.
4.1.ABOUT THE AGILE CF TOOLKIT ©
Agile CF Toolkit© is the software used for calculating the CO2 equivalent. The software uses
latest applicable emission factors sourced from published reliable databases for specific
country of computation.
Scoping Study and Selection
of Boundaries
Identification of potential
GHG emission sources
Setting of Operational
boundaries (Identification of
actual GHG emission sources)
Calculation of CO2e for each
emission source
Estimation of overall Carbon Footprint of the College and
providing mitigation measures
Consider worst and best
case scenarios
Data
Collection
Review of
Activities
Public domain
information &
data sources on
carbon emissions
from relevant
sources

12 | P a g e
4.2.LIMITATIONS DISCLOSURES
In the absence of exact quantity of refrigerant load on installed air conditioners,
refrigerators and water coolers, industry recommended values for capacity and type of
equipment were considered.
The data used for computation of carbon footprint was as provided by the Institution.
In case the data did not include travel related information for few employees and
students, the same have been ignored.
The electricity units were taken from the actual electricity meter bills and the same is
considered to be accurate.
There could always be a calibration error in the system while the computation was
made.

13 | P a g e
5. DATA COLLECTION
5.1.SCOPE 1 DIRECT GHG EMISSIONS
Direct GHG emissions occur from sources that are owned or controlled by the organization,
for example, emissions from combustion in owned or controlled boilers, furnaces; emissions
from combustion of fuels in vehicles, fugitive emissions etc.
5.2.SCOPE 2 ELECTRICITY INDIRECT GHG EMISSIONS
Scope 2 accounts for the GHG emissions from the generation of purchased electricity
consumed by the organization.
5.3.SCOPE 3 OTHER INDIRECT GHG EMISSIONS
It includes emissions from outsourced activities i.e. from the activities of members of the
organization but occurred at sources owned/controlled by another organization. (E.g.
commuting activities, waste generation etc.)
Table 1: Types of Data Collected and their source and units
GHG ACCOUNTING
ACTIVITY
ACTIVITY SUBSET
DATA COLLECTION
SOURCES
UNITS
Stationary
Combustion
LPG Consumption in
Canteen & Chemistry Lab
Record Registers from the
respective department
Kg of LPG/ yr.
Stationary Combustion
Diesel used in DG
Purchase Record Books
Liters of Diesel/ yr.
Mobile
Combustion
CNG used in College
Bus/Distance Travelled by
Bus in FY 18-19
Transport Record Books
Amount of Fuel or total
distance covered/ yr.
Fugitive
Emissions
Refrigerant used in
Refrigerators & Air
Conditioners
Invoices, Quotations,
Equipment Photographs,
On site Visits
Kg of Refrigerant/ year
Purchased Electricity
Units of electricity used
during the FY 18-19
Monthly Electricity Bills
KWh / yr.
Employee Commuting
Distance travelled, Mode of Transport used
Online Survey
Distance travelled/ yr.
Students Commuting
Distance travelled, Mode
of Transport used
Online Survey
Distance travelled/ yr.
Paper
Consumption
Amount of paper (fresh &
recycled) used
Data Shared by College
Administration
Kg of Paper Consumption/
yr.
Garden Waste
Amount of garden waste generated
Data shared by college Gardner
Kg of waste/yr.

14 | P a g e
6. DATA ANALYSIS: CALCULATIONS AND RESULTS
With reference to the data provided by the college, the number of students, teaching staff
and non-teaching staff considered for the project is:
Students: 3106
Teaching Staff: 156
Non-teaching staff: 96
Table 2: A summary of the estimation of Maitreyi College for the Reporting Year 2018-19
GHG
Emissions Scope 1 Scope 2 Scope 3 Total
Total
kgCO2e
LPG
Consu
mption
Diesel
Consumpti
on
Mobile
Source
emission
Fugitive
Emissions
Purchased
Electricity Commuting
Paper
Consump
tion
Garde
n
Waste
(kgCO2e)
6,744.82 5,135.73 11.94 695.60 2,66,910.98 1,91,957.2 8860.3722 6 480322.64
In Financial Year 2018-19, Carbon Footprint of Maitreyi College was computed to be 480.32
tons of CO2 equivalent or carbon intensity as 0.143 tCO2e/individual for the identified
GHG emission sources. The major source of emissions came from Scope 2 emissions i.e.
266.91 tCO2e followed by Scope 3 which is 200.82 tCO2e. The minimum contribution is by
Scope 1 which was computed to be 12.59 tCO2e.
The scope wise breakdown is analyzed as follows:
6.1 SCOPE 1 GHG EMISSIONS
Figure 5: Pie chart showing Scope 1emissions (%) emissions for different activities
53.5840.80
0.0945
5.53
Scope 1 Direct Emissions(%)
LPG CONSUMPTION
DIESEL CONSUMPTION
CNG USED IN COLLEGEBUS
FUGITIVE EMISSIONS

15 | P a g e
As indicated above, the maximum GHG emissions are contributed by LPG consumption i.e.
53.58% of the total scope 1 emissions. The LPG cylinders are used in canteen for food
preparation and chemistry lab for research purposes. It was estimated that a total of 97
commercial cylinders (19kg capacity) were used in the canteen during FY 2018-19. Hence,
the total emissions computed for LPG cylinders was 6744.82 kg of CO2 equivalent.
This was followed by consumption of diesel (i.e. 40.80% of total scope 1 emissions) in
Diesel Generator (DG) to provide power backup to the College during power cuts to sustain
the ongoing operations across campus.
Diesel emissions were followed by the emissions from refrigerators and air conditioners
installed across the college. The fugitive emissions made up a very little part of Scope 1
emissions i.e. 5.53% of the total scope 1 emissions.
Minimum emissions were from mobile source i.e. CNG consumed by the college bus. It was
computed to be 0.095% of the total scope 1 emissions. The reason for low emissions from
CNG bus can be estimated as less frequent trips made by the bus, especially during activities
or competitions.
6.2 SCOPE 2 GHG EMISSIONS
Figure 6: Bar Graph showing monthly GHG emissions due to electricity consumption under Scope 2
The maximum GHG emissions are the Scope 2 emissions. These are the emissions due to the
electricity consumption by the college. The total emissions were estimated to be 2,66,910.98
kgCO2e or 266.91 tCO2e for the reporting year 2018-19.
It was observed that the maximum emissions were made in the month of July followed by
October, September and June and minimum emissions were reported in the months of
November. The trend analysis indicates that emissions were maximum during the active
months of the year and least during holidays and mid semester breaks.
17726.104
23195.176
29318.936
32313.412
28570.76830568.944 30568.996
2285.632
14048.568
13512.78
14888.90413882.764
0
5000
10000
15000
20000
25000
30000
35000
Apr-18 May-18 Jun-18 Jul-18 Aug-18 Sep-18 Oct-18 Nov-18 Dec-18 Jan-19 Feb-19 Mar-19
GHG Emissions from Purchased Electricity
kgCO2e
16 | P a g e
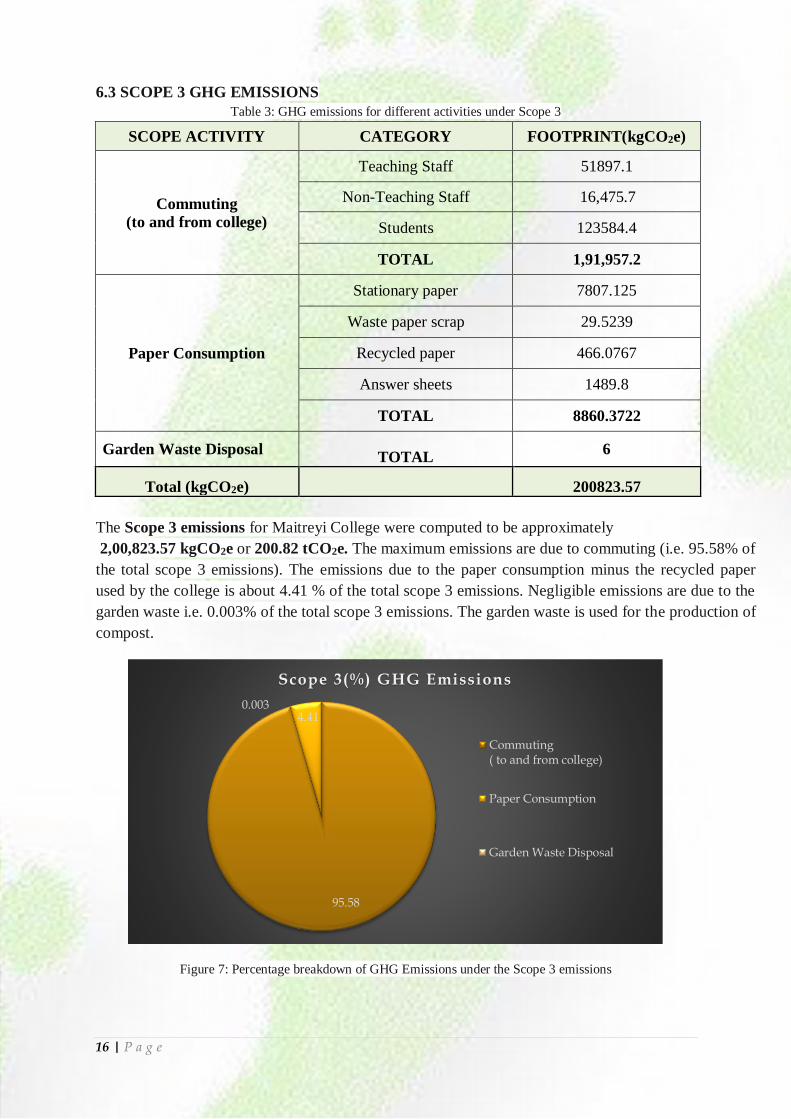
6.3 SCOPE 3 GHG EMISSIONS
Table 3: GHG emissions for different activities under Scope 3
SCOPE ACTIVITY CATEGORY FOOTPRINT(kgCO2e)
Commuting
(to and from college)
Teaching Staff 51897.1
Non-Teaching Staff 16,475.7
Students 123584.4
TOTAL 1,91,957.2
Paper Consumption
Stationary paper 7807.125
Waste paper scrap 29.5239
Recycled paper 466.0767
Answer sheets 1489.8
TOTAL 8860.3722
Garden Waste Disposal TOTAL
6
Total (kgCO2e) 200823.57
The Scope 3 emissions for Maitreyi College were computed to be approximately
2,00,823.57 kgCO2e or 200.82 tCO2e. The maximum emissions are due to commuting (i.e. 95.58% of
the total scope 3 emissions). The emissions due to the paper consumption minus the recycled paper
used by the college is about 4.41 % of the total scope 3 emissions. Negligible emissions are due to the
garden waste i.e. 0.003% of the total scope 3 emissions. The garden waste is used for the production of
compost.
Figure 7: Percentage breakdown of GHG Emissions under the Scope 3 emissions
95.58
4.410.003
Scope 3(%) GHG Emissions
Commuting( to and from college)
Paper Consumption
Garden Waste Disposal

17 | P a g e
Though the absolute emissions indicate maximum commuting emissions from students,
however the intensity calculations conclude that maximum emissions are done by the
teachers (332 kgCO2e per teacher) followed by non-teaching staff (181 kgCO2e per non-
teaching staff) and least by students (82 kgCO2e per student). It was assumed that the higher
emissions contributed by the teaching & non-teaching staff may be due to the private vehicles
brought by them for daily commute.

18 | P a g e
7. RECOMMENDATIONS AND SUGGESTIONS
7.1. GENERAL
a. Building of GHG Information Management System
(CARBON POLICE OF MAITRETYI COLLEGE)
A carbon management team can be established comprising of representatives from teaching
staff, students and other non-teaching staff of various departments. The team will enable the
college to collect necessary data for computation, measure its carbon performance, to identify
and implement improvements, to monitor progress, and internally verify results. The team
will also encourage participation and consultation of students, teachers & non-teaching staff
throughout the year. The team may also report progress on the performance periodically.
b. Formulating Environmental Policy
An Environmental Policy should be formulated by the Management to commit to adopt
sustainable practices at the campus. The policy should be well communicated & displayed
across the campus.
c. Set reduction targets
Based on the baseline and available resources, the College may develop its short / medium /
long term reduction targets and plans to achieve the targets.
d. Green events
The activities carried out at the campus should be performed in light of low carbon emissions.
The team may ensure low carbon products and strategies are adopted for various events.
e. CF Disclosure
With GHG accounting and management systems well in place, the College can demonstrate
its best practices at public platforms. Besides recognition, this will be a step towards
generating awareness to other universities and colleges to undertake similar disclosures for
comparison. Through disclosures there can be an exchange platform developed for institutes
to share eco-friendly and energy efficient techniques & equipment to be installed in colleges.
f. Awarding and labelling Departments
Department with minimum carbon emissions should be rewarded with eco-friendly
labels/batches/medals/trophies/certificates to motivate other departments to work towards the
same.
g. Eco suggestion box
A suggestion box can be placed at the campus inviting innovative ideas from
students/teachers/other staff members for carbon reduction.
7.2. SCOPE WISE MITIGATION MEASURES
Scope 1:
Retrofitting of the old air conditioners should be done in order to prevent any leakage.
Regular maintenance of the air conditioners and refrigerators should be done and
records should be maintained.

19 | P a g e
New equipment to be procured should be assessed on its emissions prior to the
purchase. (For ex. ACs and refrigerators should be checked on BEE star labeling)
Reheating of food can be done on induction / microwave minimizing the use of LPG.
All leakages should be checked regularly.
The waste from compost pit can be used to generate biogas and the same pipeline may
be extended to cafeteria for cooking.
Source: Petroleum Conservation Research Association (Google images)
Scope 2:
Sub-metering system for electricity usage may help to identify high energy
consumption areas.
Posters should be displayed across the college, spreading awareness among the
students, teachers and other staff members to switch off the lights and fans when not
in use, switching off microwaves after use etc.
Source: Clipart Library (Google)
The systems (computers, laptops, air conditioners, refrigerators etc.) should be
procured for the college considering the latest energy efficient technologies in the
markets. (For ex All in One Units etc.)
Occupancy sensors should be installed in the classrooms and offices.
LED lights should be installed in phase wise manner.

20 | P a g e
Solar panels can be installed in the college to generate electricity.
Scope 3:
Teachers and other staff members should be encouraged & rewarded for using carpool
for their daily commuting. E.g.: Apps like BlaBlaCar, SRide, UberPool, OlaShare,
Ridely, ToGo, QuickRIde, ZIFY etc.
A campaign can be run in the college- #ZEROCARBONCOLLEGE under which any
event occurring in the college like Fresher’s, Farewell or any other facilitation, the
theme should be decided under this campaign. E.g. the decorations done during the
event can be done by reused or recycled products.
Online salary slips should be generated for staff instead of issuing paper slips. This
will help preventing the use of fresh paper.
Both teachers and students should be encouraged to use e-notes as study material.
College should identify the types & quantity of waste generated. Relevant waste
minimization strategies should be adopted to prevent the waste into landfills. Regular
waste audits may be conducted to check the same.
Teachers should encourage students to submit soft copy of their internal assignments
to avoid wastage of paper.
Source: Wiki how images
Food waste from kitchen should also be sent to the compost pit for making manure.
Biogas generated within college can be used for small activities like cooking or
lighting up small bulbs.
A chemical effluent treatment plant can be built by the college to treat all the
chemical waste generated in laboratories before releasing them into drain.
Old Catalogues/records in the library should be saved in the computer and can be sent
for phase wise discarding/recycling.
College societies like dance society, drama society etc. should take initiatives to
prepare their events/plays/performances with messages of conserving resources and
saving environment.

21 | P a g e
Source: Google images

22 | P a g e
8. CONCLUSION AND DISCUSSION
The present study computes the carbon footprint of MAITREYI COLLEGE, University of
Delhi for the Reporting Year 2018-19. It is a pioneer step undertaken by the college amongst
other Delhi University colleges to report and reduce its carbon emissions. The study presents
the Scope 1, Scope 2 & Scope 3 emissions of the scope location. It highlights, the top 3 areas
of emissions within the campus i.e. electricity consumption (55.57% of the total emissions),
commuting (39.96% of total emissions) and paper consumption (1.84% of total emissions).
The total emissions computed for the college is 480322.64 kg of CO2 equivalent, out of
which the major contribution is of Scope 2 (55.57%) emissions, followed by Scope 3
(41.81%) and least by Scope 1 (2.62%).
Figure 8: Carbon Footprint and percentage GHG emissions for Scope 1, Scope 2 and Scope 3
Thus, the baseline set for the college is 480.32 tons of CO2 equivalent which can be further
reduced using the recommended measures provided in chapter 7. The activity-wise analysis is
indicated as below:
12.58
266.91
200.82
2.62
55.5741.81
0
50
100
150
200
250
300
Scope 1 Scope 2 Scope 3
Carbon Footprint tCO2e Percentage Emission
1.4 1.07
55.57
39.96
1.84
Scope 1,2 &3 Activity GHG Emissions(%)
LPG Consumption
Diesel Consumption
Fugitive Emissions
Mobile Source Emission
Purchased Electricity
Commuting
Paper Consumption
Garden Waste Generation

23 | P a g e
Figure 9: Percentage GHG emissions for various activities under Scope 1, Scope 2 and Scope 3
The study highlights negligible emissions from garden waste, mobile source and fugitive
emissions. The awareness will invite career opportunities for the students in the field of
environment & ecology.
Besides the computation of Carbon Footprint of Maitreyi, the study has raised a reasonable
awareness amongst faculty and students about carbon footprint and impacts of global
warming which was lacking initially.
Few of the several benefits associated with this study is implementing directional mitigation
measures in the college, thereby, saving resources. Setting of policy & objectives will help
the college to achieve both environmental & financial sustainability. The study will
encourage other Universities & colleges to identify their key areas of emissions and report on
the same. This will bring informational exchange between the colleges and universities to
share latest, sustainable and cost-effective technologies & processes to the table.
Overall, this project / initiative is a step towards contributing to India’s nationally determined
goals and achieving carbon neutrality by Maitreyi College.

24 | P a g e
9. REFERENCES
Agile CF Toolkit ©
IPCC 2006, 2006 IPCC Guidelines for National Greenhouse Gas Inventories,
Prepared by the National Greenhouse Gas Inventories Programme, Eggleston H.S.,
Buendia L., Miwa K., Ngara T. and Tanabe K. (eds). Published: IGES, Japan.
Kuldeep Singh Sangwan et al. (2018). Measuring Carbon Footprint of an Indian
University Using Life Cycle Assessment, Volume (1), DOI: 10.10.16
Olive J. Robinson et al (2017). Towards a universal carbon footprint standard: A case
study of carbon management at universities, Journal of Cleaner Production, 4435-
4455, Retrieved from www.elsevier.com/locate/jclepro
Sivaram pm (2015). Carbon Footprint Analysis of an Educational
Institution,Volume.787,pp187\-191, DOI: 10.4028, retrieved from
www.scientific.net/AMM.787.187
WRI, WBCSD (2015). GHG Protocol- A Corporate Accounting and Reporting
Standard. Retrieved from www.ghgprotocol.org (last accessed on: 01/07/2019)
Copyright © 2022 FDOKUMEN