Carbon footprint of transportation of staff and faculty members at IIT Gandhinagar
45
Carbon footprint of transportation of staff and faculty members at IIT Gandhinagar An in depth study Tesla Environmental Solutions Pvt Ltd T: +91-79-22783412 E: [email protected]
Transcript of Carbon footprint of transportation of staff and faculty members at IIT Gandhinagar

Carbon footprint of transportation of staff and faculty members at IIT Gandhinagar
An in depth study
Tesla Environmental Solutions Pvt Ltd
T: +91-79-22783412 E: [email protected]

Carbon footprint of transportation of staff and faculty members at IIT Gandhinagar | 2
Copyright © 2013
Tesla Environmental Solutions Pvt Ltd.

Carbon footprint of transportation of staff and faculty members at IIT Gandhinagar | 3
Executive Summary In light of the recent initiatives undertaken by Indian Institute of Technology Gandhinagar to create a
green campus and propagate eco-friendly practices, this study, done by Tesla Energy Solutions,
focuses on assessing Carbon footprints produced due to the transportation of faculty and staff
members. It also explores the possibility of reducing overall greenhouse (GHG) emissions to further
these goals.
Carbon footprint is a tool primarily used to describe the total amount of CO2 and other GHG emissions
for which the organization is responsible. The transport sector is one of the largest emitters of
greenhouse gases. Especially at educational institutes such as IIT Gandhinagar, many staff and faculty
members are engaged in some form of travel on a daily basis. However, the primary mode of
transportation is usually different with options ranging from public transport to owned 4-wheeler
vehicle. Considering the fact that different modes of transportation contribute to GHG emissions to
different extents, this study tries to bring all contributors under a single umbrella by creating a survey
model to identify their travelling habits, preferences and their potential impact on environment.
Data collected from the survey is then analyzed and a model is generated to estimate net carbon
footprint generated per week. It is only when an organization has a clear idea of the size of its carbon
footprint, caused by work related travel, that measures can be put in place for alternatives to reduce
carbon emissions. Some alternatives are explored in this report and, while there are many limitations,
where assessment and accreditation has only recently been introduced, we believe that they are
worthy of further investigation.
Calculations showed that the average carbon footprint per member of staff or faculty member at IIT
Gandhinagar was 7.85 kg CO2 eq of vehicular emissions per week and a total of 1358 kg CO2 eq of
emissions per week is released from IIT Gandhinagar through vehicular emissions. A midpoint LCA
also quantified the environmental impact that these emissions were having by using the normalized
impacts provided in LCIA Recipe as well as following ISO 14040 standards. The LCA that was
performed was a source to grave LCA as we were only concerned with emissions during operation of

Carbon footprint of transportation of staff and faculty members at IIT Gandhinagar | 4
the vehicle and not emissions due to fuel production, manufacturing and pre processing of other
factors.
Another study that we undertook was to determine the willingness of IIT Gandhinagar members to
shift to other modes of transportation to reduce their total footprint. The results indicated that, in
order of preference, people would opt for public transport over carpooling and were most averse to
using a bicycle for everyday transport. This may be due to social constraints as carpooling involves
several social dynamics due to the fact that a person may have to travel long distances with a certain
group of people. Public transport in auto rickshaws reduces an individual’s emissions on average by
120 g CO2 eq per kilometer travelled in a 4 wheeler. For people using 2 wheelers this figure lies closer
to -20 g CO2 eq per kilometer which implies that 2 wheelers are more carbon neutral as compared to
auto rickshaws. Quantifying the difference for buses proved to be more difficult, due to difficulties in
estimating the net carbon footprint caused due to buses per individual travelling in the bus.
People were more averse to bicycles due to low air quality and no special rules and regulations to
protect cyclists as well as the fact that there are no special lanes apart from the road that are suitable
for bicycles.

Carbon footprint of transportation of staff and faculty members at IIT Gandhinagar | 5
TABLE OF CONTENTS
Executive Summary 3
Nomenclature 7
List of Figures 9
List of Tables 11
Introduction 13
Methodology 17
Data Collection: Survey 17
Data Analysis 18
Model Generation 20
Carbon Footprint 20
Life Cycle Assessment 21
Results 23
Model Generation 23
Carbon Footprint Results 23
Life Cycle Assessment 26
Analysis of Willingness Factors 28
Android Application 30
Conclusions and Recommendations 32
Conclusions 32
Recommendations 34
Biofuels 35
References 36

Carbon footprint of transportation of staff and faculty members at IIT Gandhinagar | 6
Appendix A 37
Appendix B 39

Carbon footprint of transportation of staff and faculty members at IIT Gandhinagar | 7
Nomenclature
LCA Life cycle Analysis
GHG Green House Gases
LCIA Life Cycle Impact Analysis
IPCC The Intergovernmental Panel on Climate Change
DCB Dichloro Benzene
DEFRA Department for Environment, Food and Rural Affairs
CNG Compressed Natural Gas
CO2 Carbon Dioxide
CO Carbon Monoxide
CH4 Methane
CFC Chloro Fluoro Carbons
NOx Nitrogen Oxides
VOC Volatile Organic Compounds
SOx Sulphur Oxides
PM Particulate Matter
GWP Global Warming Potential
AP Terrestrial Acidification

Carbon footprint of transportation of staff and faculty members at IIT Gandhinagar | 8
HTP Human Toxicity Potential
ODP Ozone Depletion Potential
POFP Photochemical Oxidant Formation
FERP Fossil Energy Resource Depletion

Carbon footprint of transportation of staff and faculty members at IIT Gandhinagar | 9
List of Figures
Figure 1. Traditional life cycle schema. Pg 14
Figure 2. Distribution of data points collected during the survey. Pg 18
Figure 3. Distribution of data points collected with respect to the emissions
generated. Pg 19
Figure 4
Average emissions of Carbon Dioxide and Carbon Monoxide per
person from academic and administrative staff at IIT Gandhinagar.
Pg 24
Figure 5. Average emissions of criteria air pollutants at IIT Gandhinagar per
person from academic and administrative staff at IIT Gandhinagar. Pg25
Figure 6 Distribution of willingness factors over 3 areas of interest – Bicycle,
Carpooling, Public Transport. Pg 27
Figure 7 Comparison between average carbon footprint values of 2
wheelers and 4 wheelers at IIT Gandhinagar. Pg 33
Figure 8 Recommendations to reduce carbon footprint Pg 34
.
.

Carbon footprint of transportation of staff and faculty members at IIT Gandhinagar | 10

Carbon footprint of transportation of staff and faculty members at IIT Gandhinagar | 11
List of Tables
Table 1. Average carbon emissions per week per person (from staff and
faculty) at IIT Gandhinagar Pg 23
Table 2. Total Carbon Footprint generated per week by IIT Gandhinagar
staff and faculty members Pg 24
Table 3. Environmental Impact factors calculated through a midpoint Life
Cycle Assessment. Pg 25
Table 4. Values for comparison of transportation carbon footprint at
different educational institutes. Pg 30

Carbon footprint of transportation of staff and faculty members at IIT Gandhinagar | 12

Carbon footprint of transportation of staff and faculty members at IIT Gandhinagar | 13
Introduction Carbon footprint has historically been defined by Championne as "the total sets of greenhouse gas
emissions caused by an organization, event, product or person." However, the total carbon footprint
cannot be calculated because the large amount of data required and the fact that carbon dioxide can
be produced by natural occurrences. Wiedmann and Minx (2007) provide a more practical definition of
a carbon footprint: “The carbon footprint is a measure of the exclusive total amount of carbon dioxide
emissions that is directly and indirectly caused by an activity or is accumulated over the life stages of a
product”. Furthermore, “the ‘total amount’ of CO2 is physically measured in mass units (kg, t, etc)”.
There are several models for estimating the carbon footprint for transportation but the most popular
methods are
Intergovernmental Panel on Climate Change (IPCC): The Intergovernmental Panel on Climate
Change (IPCC) is a scientific intergovernmental body whose sole mission is to provide comprehensive
scientific assessments of current scientific, technical and socio-economic information worldwide
about the risk of climate change. IPCC provides software for estimating the GHG emissions from a
given set of data of fuel Consumption and usage patterns of the vehicle.
GHGenius: GHGenius is a software developed by National Resources Canada in association with
(S&T)2 consultants. The software provides sufficient data related to the emissions of greenhouse
gases (GHG) for different type of fuels as well as different type of engines. It is based on the 1998
version of Dr. Mark Delucchi’s Lifecycle Emissions Model (LEM).
Department for Environment, Food and Rural Affairs (DEFRA): DEFRA stands for Department of
environmental protection, food production and standards, agriculture, fisheries and rural
communities, United Kingdom. It has also come up with a model to estimate the GHG emissions
which can be used to provide comprehensive assessments about the effects of emissions on the
environment.

Carbon footprint of transportation of staff and faculty members at IIT Gandhinagar | 14
In light of various initiatives to curb carbon footprint gaining momentum, the footprint framework
enables us to address the problem in a comprehensive way, one that does not simply shift the burden
from one natural system to another.
A life cycle assessment is a technique to assess the environmental impacts of a product. A traditional
LCA is performed from cradle-to-grave which implies that all impact associated all the way from
producing the initial feedstock and the final use of the product is accounted for. A traditional LCA
methodology includes:
- Compiling an inventory of all the relevant mass and energy balances
- Evaluating the potential impacts associated with identified inputs and releases
- Interpreting the results to help make a more informed decision
The life cycle assessment is usually a “Cradle to Grave” assessment which is associated with various
stages of the of a products life. It is a method to assess the environmental impacts associated with a
products life from Cradle to Grave. The life cycle looks into everything from the raw materials, its
manufacture, and the energy consumed, also, the atmospheric emissions, solid wastes and other
releases.

Carbon footprint of transportation of staff and faculty members at IIT Gandhinagar | 15
Figure 1. Traditional life cycle schema
Using LCA we compile an inventory of relevant energy and material inputs and environmental
releases. Life Cycle Assessment gives an impact on the local environment. LCA is used to measure the
potential environmental trade-offs. It is also used to identify the significant shifts in life cycle stages. It
is used Interpret the results to help make a more informed decision.
The reasons for using an LCA to quantify and compare environmental impacts are due to the fact that
LCA results can be easily compared due to their universality. Environmental impact factors can be
compared across continents, places .etc. to determine which process or item is more environmental
friendly.

Carbon footprint of transportation of staff and faculty members at IIT Gandhinagar | 16

Carbon footprint of transportation of staff and faculty members at IIT Gandhinagar | 17
Methodology While GHG emission inventories are compiled at different scales (countries, regions, metropolitan
areas, communities, and organizations) on a regular basis, their scope and breadth, in both
methodology and analysis, varies dramatically. Therefore, it was important to familiarize ourselves
with the terminology and learn relevant concepts. Through an extensive literature review, we tried to
understand different methodologies to calculate carbon footprint in the context of campus transport.
After a thorough discussion, we designed a framework to put the objectives of the project in
perspective.
Define the problem statement along with relevant parameters and aspects of the problem.
Adopt a suitable methodology for data collection in order to assess the current transportation
scenario in the campus.
Develop a model to calculate the net carbon footprint produced per week.
Analyse and compare the results summarizing the segmentation of GHG emissions.
Explore opportunities of GHG reduction and discussion on policy recommendations.
Data Collection: Survey
In an effort to capture the travel behavior of IIT Gandhinagar population, a travel survey was
designed and administered to approximately 100 IIT Gandhinagar faculty, staff members and
students. The questionnaire is attached in the Appendix of this report for reference.
The survey is primarily based on following parameters:
Contributing factors to the carbon footprints associated with travelling.
Type of transportation used, fuel consumption and performance related factors.
Analysis of the travelling habits of IITGN Staff and faculty members.
Willingness of using other eco-friendly modes of transportation.
The survey was taken individually in person. The six members of the group were divided into groups
of two. The groups of two were made in-charge of conducting the survey in one Shed each in the

Carbon footprint of transportation of staff and faculty members at IIT Gandhinagar | 18
Institute. The personal approach of the survey was to avoid any confusion as well as answer any
doubts that the participant might have. A total of 100 data points was generated through surveys
conducted.
The surveyed data also posed a challenge in some cases where the provided values in a survey did
not fit together. This was mainly due to gross approximations done by the participants when
providing data, for example, about mileage. We, as a team, decided to re-calculate the misleading
figures using other data provided by the participants which made more sense. While this might, in
rare cases, lead to truncation of potentially true value, but in the big picture of the entire campus,
these special points in the data set do not skew the general outcome.
The data points so obtained were analyzed to identify developing trends. They are also represented
graphically for better understanding.
Data Analysis
Fig 2. Distribution of data points collected during the survey.
As evident from the above pie-chart, majority of people (43%) use 4-wheelers as the primary mode
of transportation closely followed by 2-wheelers (42%). Other modes of transportation such as
43%
6% 7%
42%
2%
NUMBER OF PEOPLE
Two Wheelers
Public Transport
Walking
Cars
Carpooling
Carbon footprint of transportation of staff and faculty members at IIT Gandhinagar | 19
carpooling, public transport and walking are used by a very few members. Moreover, during the
survey it was observed that most of the people who use public transportation also walk to and
from the college and thus have no carbon footprint whatsoever when it comes to activities
concerning the college.
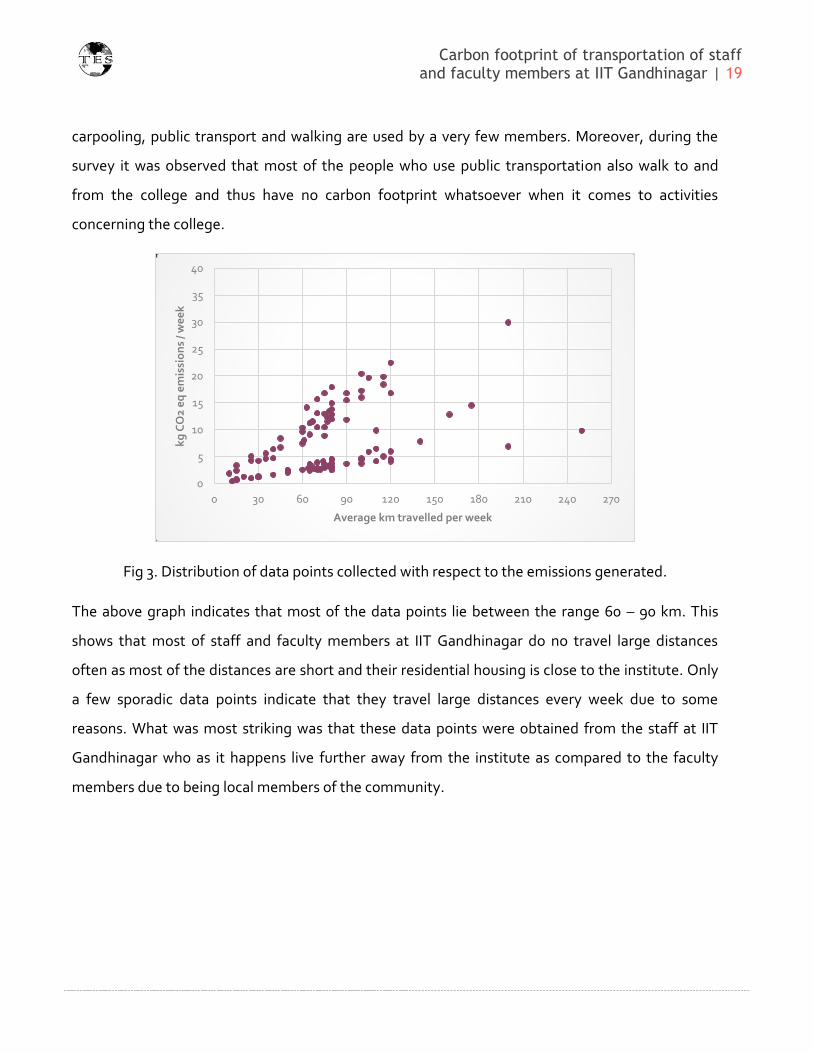
Fig 3. Distribution of data points collected with respect to the emissions generated.
The above graph indicates that most of the data points lie between the range 60 – 90 km. This
shows that most of staff and faculty members at IIT Gandhinagar do no travel large distances
often as most of the distances are short and their residential housing is close to the institute. Only
a few sporadic data points indicate that they travel large distances every week due to some
reasons. What was most striking was that these data points were obtained from the staff at IIT
Gandhinagar who as it happens live further away from the institute as compared to the faculty
members due to being local members of the community.
0
5
10
15
20
25
30
35
40
0 30 60 90 120 150 180 210 240 270
kg
CO
2 e
q e
mis
sio
ns
/ we
ek
Average km travelled per week

Carbon footprint of transportation of staff and faculty members at IIT Gandhinagar | 20
Model Generation
Another aim of the project was to develop a model to quantify the fuel consumption in terms of the
total amount travelled in a week and the mileage of the vehicle in question. A lot of the data collected
during the course of the survey was not consistent with each other. Consequently a lot of bad data
was present in the data set which posed a threat to the accuracy of the Carbon footprint assessment.
A linear regression analysis on the available data points was performed to achieve better results for
the erroneous values. This will provide a better estimate of the total fuel consumed for the total IIT-
GN Community.
The parameters were developed and characterized using multivariate regression to relate the fuel
consumption (the dependent variable) to the mileage of the vehicle and the average distance travelled
per week by the concerned person
Carbon Footprint
As soon as we had sufficient data, the next step was to calculate the total and average carbon
footprint of all the staff and faculty members at IIT Gandhinagar. To calculate the carbon footprint
data was sourced from GHGenius, a carbon emissions spreadsheet developed by National Resources
Council of Canada. The main reason why this spreadsheet was chosen was because they have
collected data regarding Carbon Emissions in India as well as Canada for a comparison between the
two. Another aspect of the values present in the spreadsheet is that they have segregated carbon
emission values based on the part of the life cycle we are concerned with. In this case as we are only
concerned with the source to gate emissions i.e. emissions related to vehicle operation.
The data collected needed to be scaled up from the average values calculated to account for all 173
staff and faculty members at IIT Gandhinagar which was done in the due course of time.

Carbon footprint of transportation of staff and faculty members at IIT Gandhinagar | 21
Life Cycle Assessment
To quantify the effects of carbon emissions at IIT Gandhinagar with respect to emissions occurring
around the world, a life cycle assessment is the best method to determine the effects on the
environment. The LCA was performed as per ISO 14040 standards using data provided by Pre
consultants, who have the most comprehensive data set related to LCA in the world. The LCA dataset
that was used in calculating the Environmental Impact factors was the Egalitarian dataset (Egalitarian
factors are based on a long term precautionary thinking principle).
The obtained environmental impact factors were compared to a similar study in the USA, Canada and
South Africa to observe the difference between lifestyles.

Carbon footprint of transportation of staff and faculty members at IIT Gandhinagar | 22

Carbon footprint of transportation of staff and faculty members at IIT Gandhinagar | 23
Results
Model Generation
A linear regressions analysis of the data points provided the following results
For 2 wheelers
For 4 wheelers
Using this formula it became easier to quantify the fuel consumption for unknown parameters. This
model is better at higher values of distance travelled as compared to lower values.
The above model can be used for scaling up as well as estimating new emissions due to changes in
transportation patterns at IIT Gandhinagar.
Carbon Footprint Results
The multiplying factors used for calculating the CO2 equivalent emissions for the given dataset were
sourced from GHGenius and are stated below
For Petrol = 2244.7
For Diesel = 2728.9
For CNG = 2782.0
or
Individual component emissions were calculated using the average emissions/km for a light duty
vehicle and adjusting the values for the fact that most of the data points in our set belonged to 2

Carbon footprint of transportation of staff and faculty members at IIT Gandhinagar | 24
wheelers. Thus along with the total equivalent emissions, we were able to calculate individual
components in the vehicle exhaust as well.
On average in 1 week, the data mentioned below in the table is the total emissions per person at IIT
Gandhinagar on average. These values were calculated using the data collected from the survey
participants as well as data from GHGenius.
Equivalent Carbon Emissions kg CO2 eq 7.85
Carbon Dioxide kg CO2 7.19
Carbon Monoxide kg CO 0.42
Methane g CH4 0.84
Chloro Fluoro Carbons g CFC 0.11
Nitrogen Oxides g NOx 9.1
Volatile Organic Compounds g VOC 10.39
Sulphur Oxides g SOx 2.04
Particulate Matter g PM 0.58
Table 1. Average carbon emissions per week per person (from staff and faculty) at IIT Gandhinagar

Carbon footprint of transportation of staff and faculty members at IIT Gandhinagar | 25
Figure 4. Average emissions of Carbon Dioxide and Carbon Monoxide per person from academic and
administrative staff at IIT Gandhinagar.
Figure 5. Average emissions of criteria air pollutants at IIT Gandhinagar per person from academic and
administrative staff at IIT Gandhinagar.
The total carbon emissions over 1 week at IIT Gandhinagar, accounting for all 173 staff and faculty
members is shown in the table below
0
1
2
3
4
5
6
7
8
kg CO emissions/week kg CO2 emissions/week
Emissions in kg/week
0
2
4
6
8
10
12
Emissions in grams/week

Carbon footprint of transportation of staff and faculty members at IIT Gandhinagar | 26
Equivalent Carbon Emissions kg CO2 eq 1358
Carbon Dioxide kg CO2 1244.5
Carbon Monoxide kg CO 72.27
Methane g CH4 0.15
Chloro Fluoro Carbons g CFC 0.02
Nitrogen Oxides g NOx 1.57
Volatile Organic Compounds g VOC 1.8
Sulphur Oxides g SOx 0.35
Particulate Matter g PM 0.1
Table 2. Total Carbon Footprint generated per week by IIT Gandhinagar staff and faculty members
Life Cycle Assessment
A method of quantifying the environmental impact of the carbon footprint values is by performing a
midpoint Life Cycle Assessment as prescribed by Pre consultants. In a life cycle assessment all the
emissions are characterized in terms of the following impact factors – Global Warming Potential
(GWP), Terrestrial Acidification, Human Toxicity Potential, Ozone Depletion Potential, Photochemical
Oxidant Formation, and Fossil Energy Resource Potential. The obtained values are normalized
through dividing it by the total consumption in the calendar year 2000 as given by LCIA Recipe and
subsequently calculating the corresponding factors. The following LCIA impact factors were obtained
for this project after normalization

Carbon footprint of transportation of staff and faculty members at IIT Gandhinagar | 27
Impact Factor Value Units
Global Warming Potential (GWP) 4.76E-11 kg CO2 eq/kg
Terrestrial Acidification (AP) 2.68E-11 kg SO2 eq/kg
Human Toxicity Potential (HTP) 6.29E-12 kg 1,4-DCB to urban
air/kg
Ozone Depletion Potential (ODP) 4.93E-10 kg CFC eq/kg
Photochemical Oxidant Formation (POFP) 1.57E-09 kg NMVOC eq/kg
Fossil Energy Resource Depletion (FERP) 3.76E-10 kg Crude Oil/kg
Table 3. Environmental Impact factors calculated through a midpoint Life Cycle Assessment.
What these results indicate is the fact that toxicity due to vehicular emissions is much lesser as
compared to other impact factors, where as the photochemical oxidant formation is the maximum.
This means that vehicular emissions contribute the most to photochemical oxidant formation and the
least towards human toxicity.
There was no data available to compare these results with other such studies in India; else this would
have been the best comparison metric for calculating the environmental impact of vehicular
emissions.

Carbon footprint of transportation of staff and faculty members at IIT Gandhinagar | 28
Analysis of Willingness Factors
Figure 6. Distribution of willingness factors over 3 areas of interest – Bicycle, Carpooling, Public
Transport.
As a part of the project, we conducted a study to determine the willingness of people to shift to other
environmental friendly means of transport. A factor of 5 represents high willingness and 1 represents
low willingness.
From the statistical chart, we can conclude that more people are willing to environment-friendly
modes like bicycling, car-pooling and public transport with the most being willing to shift to public
transport.
As a majority of people are willing to shift to public transport the average carbon footprint could be
reduced. Auto rickshaws and buses, both of them have a lower footprint as compared to using a
personal vehicle and thus contribute to carbon savings. Obviously, if people pool together in rickshaws
their footprint values will be even lower but that might not be feasible.
A lot of people are also willing to participate in car pooling but have indicated that they are probably
not as confident of its’ success as compared to public transport by marking out their willingness
0
5
10
15
20
25
30
1 2 3 4 5
Willingness Factor to shift to another mode of transport
Bicycle Car Pooling Public Transport

Carbon footprint of transportation of staff and faculty members at IIT Gandhinagar | 29
factors as 3 and 4 as opposed to 5. A main component of car pooling is to have a group of people who
are comfortable with each other and ready to travel together for a sustained period of time. As so
many social factors come into account this is why people are probably more averse to adopting car
pooling as a primary means of transport.
The opinion on shifting to bicycling/walking is split right down the middle with some enthusiastic
people ready to adopt such a practice but most of them are against the idea and this is supported by
the fact that majority of the people assigned it a low willingness factor. In India, bicycling is
comparatively dangerous and there are no special rules and protection for cyclists. Coupled with the
fact that the air quality is extremely bad, most people tend to avoid adopting a bicycle as their primary
mode of transport to and from their work area in India.

Carbon footprint of transportation of staff and faculty members at IIT Gandhinagar | 30
Android Application
An android application to determine the
individual carbon footprint of individuals was
developed. The main purpose of this application
was to help an individual determine his carbon
footprint regularly as well as give suggestions
on how to reduce their carbon footprint at any
point of time.
The carbon footprint is mainly calculated by
analyzing their fuel consumption as the first
choice for calculating the carbon footprint and if
this data is not available, the next thing that was
used to calculate was the combination of
mileage and distance travelled. Knowing these 2
values helps us find out the average fuel
consumption per week through the formula we
developed. Obviously, the fuel consumption will
depend on whether a 2 wheeler is being used or
a 4 wheeler and the segregation is done using a
if condition on the mileage. Therefore,
depending on the mileage the application will calculate the fuel consumption, the carbon footprint
and provide custom recommendations.

Carbon footprint of transportation of staff and faculty members at IIT Gandhinagar | 31

Carbon footprint of transportation of staff and faculty members at IIT Gandhinagar | 32
Conclusions and Recommendations
Conclusions
The carbon footprint due to transportation at IIT Gandhinagar is much lower than what has been
calculated through similar studies at different institutions across the world. Several public research
universities across Canada and USA undertake similar and more detailed studies into the total carbon
footprint of all the activities conducted on campus (with transportation being 1 of them) and publish a
detailed report for all to observe. The results from these other studies are summarized in the table
below
Academic Institutes Avg. kg eq. of CO2 per week
IIT Gandhinagar 7.85
University of Toronto 22.81
University of Maryland 34.32
University of Cape Town** 8.76
Table 4. Values for comparison of transportation carbon footprint at different educational institutes.
The values for University of Cape Town include student commute as well as faculty and staff
commute, which may have pulled the value down.
Carbon footprint at IIT Gandhinagar is much lower than what is observed at University of Toronto,
University of Maryland and University of Cape Town. This is due to shorter distances being travelled
by staff and faculty members as well as a high incidence of two wheelers as compared to other
countries on the list. 2 wheelers have a lower carbon footprint as compared to 4 wheelers and that is

Carbon footprint of transportation of staff and faculty members at IIT Gandhinagar | 33
why they bring down the average carbon footprint of IIT Gandhinagar. A comparison between the
average emissions of 2 wheelers and 4 wheelers is presented in the graph below.
Figure 7. Comparison between average carbon footprint values of 2 wheelers and 4 wheelers at IIT
Gandhinagar.

Carbon footprint of transportation of staff and faculty members at IIT Gandhinagar | 34
Recommendations
Recommendations to reduce carbon footprint for all aspects of travel.
Figure 8. Recommendations to reduce carbon footprint
Another interesting point to note is that the average carbon emissions for CNG kits is lower than that
of petrol. Using Auto Rickshaws for example reduces the carbon footprint on average by a princely
figure of 120 g CO2 eq of emissions. Thus using CNG kits in cars or public transportation will be more
carbon neutral and will reduce the average footprint. Obviously, CNG has some dangers as well as the
fact that it is more capital intensive due to extra expenses involved in installing CNG kits, but it is
becoming more popular as days go by. Another disadvantage is the fact that CNG refueling stations
are not present everywhere in the city and thus refueling might be a barrier to the growth of CNG as
an alternate fuel to petrol.
Reduce Carbon Footprint of your car
• Accelerate slowly
• Maintain a steady speed
• Anticipate your stops and starts
• Keep your car tuned up
• Keeping tires properly inflated can save 400-700 pounds CO2 per year
Reduce Footprint of your travel
• Combine your trip with another. Carpooling once a week saves 20% fuel
• Check your transit options - It may not work for you everytime but use it when it does
• Walk short distances
• Work from home occasionally

Carbon footprint of transportation of staff and faculty members at IIT Gandhinagar | 35
Shifting from 2 wheelers to public transport i.e. Auto Rickshaws is not recommended due to an
increase in the amount of carbon emissions, on average by a figure of 20 g CO2 eq of emissions per
kilometer travelled.
Biofuels
Most of the western countries have adopted biofuel as an agent to reduce vehicular carbon footprint
due to the sequestration of carbon that occurs in the life cycle of biofuels. India currently has not
adopted any biofuel resolution to introduce these fuels into traditional vehicular fuels. Any such
change would lead to an overall reduction in carbon emissions across all factors due to carbon
sequestration.
Carbon footprint of transportation of staff and faculty members at IIT Gandhinagar | 36
References
1. Thomas CES. Transportation options in a carbon-constrained world : Hybrids , plug-in hybrids ,
biofuels , fuel cell electric vehicles , and battery electric vehicles. International Journal of
Hydrogen Energy. 2009;34(23):9279–9296. Available at:
http://dx.doi.org/10.1016/j.ijhydene.2009.09.058.
2. Sprangers S. Calculating the carbon footprint of universities. 2011;(December).
3. Pandey D, Agrawal M. Carbon footprint : current methods of estimation. 2010.
4. Yee KF, Tan KT, Abdullah AZ, Lee KT. Life cycle assessment of palm biodiesel: Revealing facts
and benefits for sustainability. Applied Energy. 2009;86:S189–S196.
Available at: http://linkinghub.elsevier.com/retrieve/pii/S0306261909001597. Accessed August
10, 2013.
5. Mathez A, Hall B, Manaugh K, et al. How can we alter our carbon footprint ? Estimating GHG
emissions based on travel survey information. 2013;40:131–149.
6. Wiedmann, T. and Minx, J. (2008). A Definition of 'Carbon Footprint'. In: C. C. Pertsova, Ecological
7. Economics Research Trends: Chapter 1, pp. 1-11, Nova Science Publishers, Hauppauge NY, USA. https://www.novapublishers.com/catalog/product_info.php?products_id=5999.
8. A Carbon Footprint Analysis : Louisiana State University and Agricultural and Mechanical College Baton Rouge , Louisiana. 2010.
9. Integrating carbon footprint into supply chain management: the case of Hyundai Motor
Company (HMC) in the automobile industry, Ki-Hoon Lee
10. Baseline effects on carbon footprints of biofuels: The case of wood, Eric Johnson, Daniel
Tschudi
11. A life-cycle carbon footprint of Yosemite National Park, Gara Villalba, Leland Tarnay, Elliott
Campbell , Xavier Gabarrell .
12. Estimating the carbon footprint of Australian tourism Larry Dwyer, Peter Forsyth, Ray Spurr, Serajul Hoque.
13. Distributed computing for carbon footprint reduction by exploiting low-footprint energy
availability, Ward Van Heddeghem, Willem Vereecken, Didier Colle, Mario Pickavet, Piet
Demeester
Carbon footprint of transportation of staff and faculty members at IIT Gandhinagar | 37
Appendix A
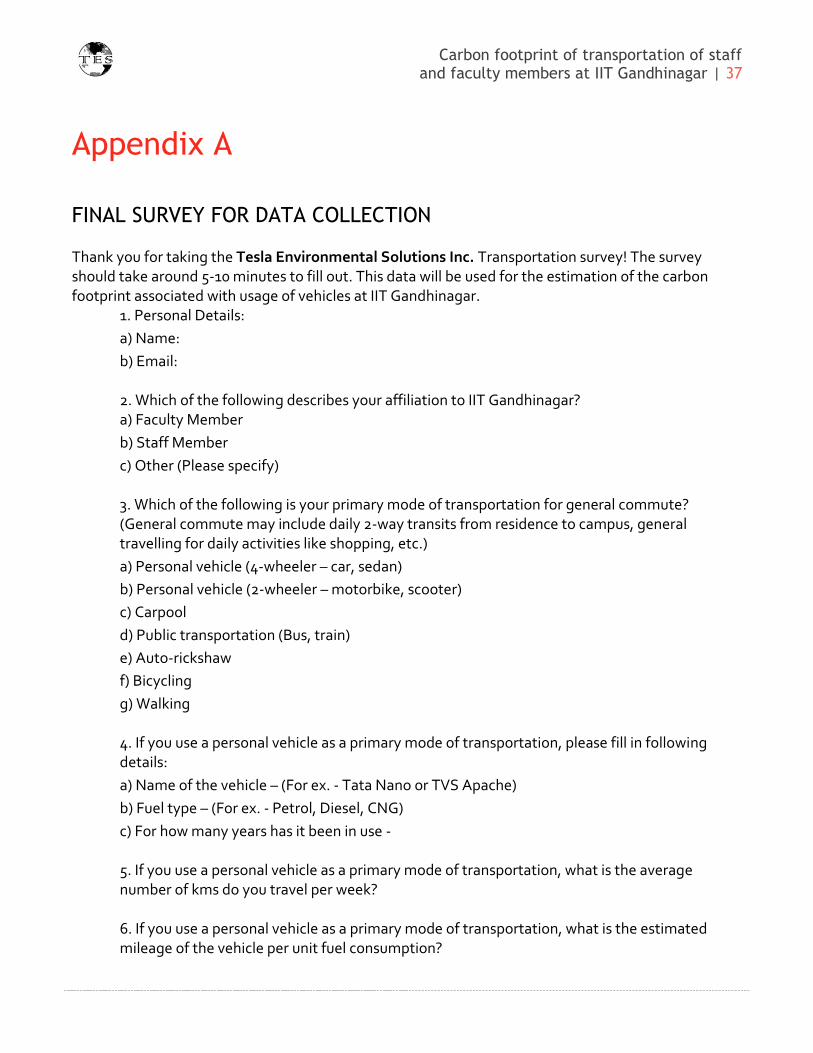
FINAL SURVEY FOR DATA COLLECTION
Thank you for taking the Tesla Environmental Solutions Inc. Transportation survey! The survey should take around 5-10 minutes to fill out. This data will be used for the estimation of the carbon footprint associated with usage of vehicles at IIT Gandhinagar.
1. Personal Details:
a) Name:
b) Email:
2. Which of the following describes your affiliation to IIT Gandhinagar? a) Faculty Member
b) Staff Member
c) Other (Please specify)
3. Which of the following is your primary mode of transportation for general commute? (General commute may include daily 2-way transits from residence to campus, general travelling for daily activities like shopping, etc.)
a) Personal vehicle (4-wheeler – car, sedan)
b) Personal vehicle (2-wheeler – motorbike, scooter)
c) Carpool
d) Public transportation (Bus, train)
e) Auto-rickshaw
f) Bicycling
g) Walking
4. If you use a personal vehicle as a primary mode of transportation, please fill in following details:
a) Name of the vehicle – (For ex. - Tata Nano or TVS Apache)
b) Fuel type – (For ex. - Petrol, Diesel, CNG)
c) For how many years has it been in use -
5. If you use a personal vehicle as a primary mode of transportation, what is the average number of kms do you travel per week?
6. If you use a personal vehicle as a primary mode of transportation, what is the estimated mileage of the vehicle per unit fuel consumption?

Carbon footprint of transportation of staff and faculty members at IIT Gandhinagar | 38
7. If you use a personal vehicle as a primary mode of transportation, what is the estimated fuel consumption of the vehicle per week?
8. If you use a personal vehicle as a primary mode of transportation, what is your willingness factor to shift to other modes of transportation? a) Carpooling – (On a scale of 1-5 with 5 being the highest)
b) Public transport – (On a scale of 1-5 with 5 being the highest)
c) Bicycling/Walking (On a scale of 1-5 with 5 being the highest)
9. If you use carpooling as a primary mode of transportation, please fill in following details -
a) Whom does the car belong to - (For ex. – IIT Gn, colleague/faculty member)
b) Name of the car owner –
c) Name of the car – (For ex. - Tata Indica)
10. If you use carpooling as a primary mode of transportation, how many people (IIT Gn faculty or staff members including you) are generally in the car?
11. If you use carpooling as a primary mode of transportation, what is the average number of kms do you travel per week?
12. If you use any other mode (Public transport, Auto-rickshaw) as a primary mode of transportation, please fill in following details:
a) Type of transportation – (For ex. - Bus, train, auto-rickshaw)
b) Average number of kms you travel per week –
13. Any other remarks/suggestions:

Carbon footprint of transportation of staff and faculty members at IIT Gandhinagar | 39
Appendix B
Type Avg
Kms/week
Estimated
Mileage
Fuel (l) /
Week
kg CO2 eq
emissions /
week
Car
Pooling
Public
transport Bicycling
Four
Wheeler 160 28 5.71428571 12.82685714 1 1 1
Four
Wheeler 77 15 5.13333333 11.52279333 2 1 1
Four
Wheeler 110 25 4.4 9.87668 5 2 1
Four
Wheeler 30 16 1.88 4.21 3 4 1
Four
Wheeler 10 12 0.83 1.87 4 5 1
Four
Wheeler 75 19 3.95 8.86 2 1 2
Four
Wheeler 61 17 3.58823529 8.054511765 4 1 2
Four
Wheeler 67 13 5.15384615 11.56883846 4 1 2
Four
Wheeler 40 19 2.11 4.73 4 2 2
Four
Wheeler 78 13 6 13.4682 1 4 2
Four
Wheeler 77 14 5.5 12.34585 2 4 2
Four
Wheeler 100 13 7.69230769 17.26692308 3 4 2
Four
Wheeler 65 16 4.06 9.12 5 4 2
Four
Wheeler 75 10 7.50 16.84 2 5 2
Four
Wheeler 90 12 7.50 16.84 2 5 2

Carbon footprint of transportation of staff and faculty members at IIT Gandhinagar | 40
Four
Wheeler 25 13 1.92 4.32 5 1 3
Four
Wheeler 80 12
6.6666666
7 14.96466667 1 2 3
Four
Wheeler 75 16 4.69 10.52 3 2 3
Four
Wheeler 100 11
9.0909090
9 20.40636364 5 2 3
Four
Wheeler 90 17 5.29411765 11.88370588 3 3 3
Four
Wheeler 175 27 6.48148148 14.54898148 4 3 3
Four
Wheeler 120 16 7.5 16.83525 1 4 3
Four
Wheeler 15 14 1.07 2.41 3 4 3
Four
Wheeler 45 15 3.00 6.73 3 4 3
Four
Wheeler 75 13 5.77 12.95 1 5 3
Four
Wheeler 200 15 13.33 29.93 1 5 3
Four
Wheeler 63 10 6.3 14.14161 2 5 3
Four
Wheeler 66 13 5.07692308 11.39616923 5 5 3
Four
Wheeler 60 13 4.62 10.36 2 1 4
Four
Wheeler 80 14 5.71 12.83 5 1 4
Four
Wheeler 60 14 4.28571429 9.620142857 5 1 4
Four
Wheeler 120 12 10 22.447 2 3 4
Four
Wheeler 80 15 5.33333333 11.97173333 4 3 4
Four
Wheeler 45 12 3.75 8.42 5 3 4
Four
Wheeler 80 13 6.15384615 13.81353846 1 4 4

Carbon footprint of transportation of staff and faculty members at IIT Gandhinagar | 41
Four
Wheeler 115 14 8.21428571 18.43860714 2 5 4
Four
Wheeler 35 17 2.06 4.62 3 5 4
Four
Wheeler 90 13 6.92307692 15.54023077 4 5 4
Four
Wheeler 40 14 2.86 6.41 2 1 5
Four
Wheeler 35 14 2.50 5.61 3 1 5
Four
Wheeler 100 14 7.14285714 16.03357143 5 4 5
Four
Wheeler 70 10 7.00 15.71 3 5 5
Four
Wheeler 15 10 1.5 3.36705 4 1 5
Four
Wheeler 105 12 8.75 19.641125 2 2 5
Four
Wheeler 80 10 8.00 17.96 4 3 5
Four
Wheeler 70 15
4.6666666
7 10.47526667 4 3 5
Four
Wheeler 25 11 2.27 5.10 3 4 5
Four
Wheeler 115 13 8.84615385 19.85696154 3 4 5
Four
Wheeler 60 18 3.33 7.48 4 4 5
Four
Wheeler 65 13 5.00 11.22 4 4 5
Four
Wheeler 70 12 5.83 13.09 3 5 5
Two
Wheeler 65 55 1.18 2.65 3 2 1
Two
Wheeler 74 40 1.85 4.152695 4 2 1
Two
Wheeler 70 60 1.16666667 2.618816667 3 4 1
Two
Wheeler 80 40 2 4.4894 5 4 1

Carbon footprint of transportation of staff and faculty members at IIT Gandhinagar | 42
Two
Wheeler 50 45 1.11 2.49 2 5 1
Two
Wheeler 68 55 1.23636364 2.775265455 5 5 1
Two
Wheeler 70 40 1.75 3.928225 1 1 2
Two
Wheeler 20 35 0.57 1.28 3 1 2
Two
Wheeler 105 40 2.625 5.8923375 4 1 2
Two
Wheeler 120 60 2 4.4894 3 2 2
Two
Wheeler 100 60 1.66666667 3.741166667 4 2 2
Two
Wheeler 30 50 0.60 1.35 3 3 2
Two
Wheeler 65 60 1.08333333 2.431758333 3 3 2
Two
Wheeler 140 40 3.5 7.85645 1 4 2
Two
Wheeler 110 38 2.89473684 6.497815789 2 4 2
Two
Wheeler 40 55 0.73 1.63 4 4 2
Two
Wheeler 120 45
2.6666666
7 5.985866667 2 5 2
Two
Wheeler 15 51 0.29 0.66 3 5 2
Two
Wheeler 90 55 1.64 3.67 3 5 2
Two
Wheeler 75 57 1.32 2.95 1 1 3
Two
Wheeler 110 59 1.86440678 4.185033898 5 1 3
Two
Wheeler 115 51 2.25490196 5.061578431 1 2 3
Two
Wheeler 100 50 2 4.4894 5 2 3
Two
Wheeler 80 40 2 4.4894 1 3 3

Carbon footprint of transportation of staff and faculty members at IIT Gandhinagar | 43
Two
Wheeler 75 47 1.59574468 3.581968085 4 3 3
Two
Wheeler 60 52 1.15384615 2.590038462 1 5 3
Two
Wheeler 15 40 0.38 0.84 4 5 3
Two
Wheeler 200 65 3.08 6.91 4 5 3
Two
Wheeler 80 57 1.40350877 3.15045614 1 2 4
Two
Wheeler 80 59 1.36 3.04 2 2 4
Two
Wheeler 72 62 1.16129032 2.606748387 3 2 4
Two
Wheeler 78 55 1.41818182 3.183392727 4 2 4
Two
Wheeler 30 55 0.55 1.22 1 3 4
Two
Wheeler 50 45 1.11 2.49 1 4 4
Two
Wheeler 72 60 1.2 2.69364 2 4 4
Two
Wheeler 66 45 1.46666667 3.292226667 4 4 4
Two
Wheeler 12 61 0.20 0.44 3 1 5
Two
Wheeler 25 55 0.45 1.02 4 2 5
Two
Wheeler 80 48 1.66666667 3.741166667 4 3 5
Two
Wheeler 120 65 1.85 4.14 5 5 5
Two
Wheeler 250 57 4.38596491 9.845175439 5 5 5
Two
Wheeler 70 55 1.27 2.86 2 1 5
Two
Wheeler 64 50 1.28 2.873216 2 1 5
Two
Wheeler 65 40 1.625 3.6476375 5 3 5

Carbon footprint of transportation of staff and faculty members at IIT Gandhinagar | 44
Two
Wheeler 80 71 1.12676056 2.529239437 3 5 5
Two
Wheeler 50 55 0.91 2.04 4 5 5
Two
Wheeler 79 51 1.54901961 3.477084314 5 5 5
Two
Wheeler 100 48 2.08333333 4.676458333 5 5 5

Carbon footprint of transportation of staff and faculty members at IIT Gandhinagar | 45
Prepared By
Sumit Deshmukh – Associate Vice President – [email protected]
Akshay Mall – Senior Analyst – [email protected]
Nisarg Shah – Senior Analyst, [email protected]
Sudhamsu Krishna – Design Head, [email protected]
Atharva Patil – Design Head, [email protected]
Mayank Jhalaria – Freelancer,On contract, [email protected]