District Census Handbook, Gandhinagar, Part XIII-A & B ...
88
CENSUS 1981 SERIES-5 GUJARAT DISTRICT CENSUS HANDBOOK PARTS XllJ-A & B VILLA(;E & TOWN DIRECrORY VILLAGE & TOWN'''lSE PRIMARY CENSUS ABSTRACf GANDHINAGAR DISTRICT R. s. CHHAYA of the Indian Administrative Service Director of Census Operations Gujarat
-
Upload
khangminh22 -
Category
Documents
-
view
1 -
download
0
Transcript of District Census Handbook, Gandhinagar, Part XIII-A & B ...

CENSUS 1981
SERIES-5
GUJARAT
DISTRICT CENSUS HANDBOOK
PARTS XllJ-A & B
VILLA(;E & TOWN DIRECrORY
VILLAGE & TOWN'''lSE PRIMARY CENSUS
ABSTRACf
GANDHINAGAR DISTRICT
R. s. CHHAYA of the Indian Administrative Service
Director of Census Operations Gujarat

CENSUS Oi' INDIA 1981
LIST OF PROPOSED PUBLICATIONS
CENTRAL GOVERNMENT PUBLICATIONS
Census of India. 1981 Series - 5 -Gujarat is being published in the following parts
Part Number
H-A I-B
+II-A ·IT-B III-A IIl ..... B
IV-A IV-B V-A V-B VI-A VI-B
*VII VIn-A \'1II-B VIII-C IX X-A X_;B X-C XI XII
Subject Covered
Administration Rcport-Enumcrati 011
Administration Report-Tabulation General Population Tables - A - Series General Popu'ation Trebles - Prim ary Census Abstract General Economic Tables - B-Seri es (Tables B--I to B-1O) General Economic Table_<; -_ n-Seri es (Tables B-11 to B-22)
Social and Cultural Tables - C-Scries (Tables C-l to C-6) Social and Cultural Tables - c-Se ries (Tables C- 7 to C-J 0)
Migration Tables - D-Series (TabJes D-J to D-4) Migration Tables -- D-Series (Tables D-5 to D-13) Fertility Tables - F-Series (Tables F-J to F-19) Fertility Tables - F-Serie5 (Tables F-20 to F-28) Tables on Houses and Disabled Population Household Tables (Tables HH-l 10 HH-J6) Household Tables (Tables HH-17) Report on Households Special Tables on Scheduled Castes and Scheduled Tribes Town Directory Survey Reports on Sclected Towns
Survey Reports on Selecled Villages Ethnographic Notcs and Special Studies on Schedukd Castes and Scheduled Tribes Census Atlas
" ~< ,;;(?~~~. 'f("
nfSTRICT CENS~ Hl\ ~.Jf)B()OKS XIll-A Village and Town Directory . - ~
XllI-B Village and Townwise Primary' Ce usus Abstract
._----------- _ -_--- --------
Note : (1) A1t the maps included in this publication arc ba_'c:.J UP"!} Survey of India map
with the permission of the Surveyor General of India.
(2) © Govemment of India Copy Right 1984_
* Published
t Under Print

DISTRICT ~ GANDHINAGAR
Page No.
1
vii
Particulan.
2
Preface - 1st Half - 1st line
~nalyHcal Notes
(i) 1st Half - 2nd para - 6th line to 10th lines
(iii) 1st Half -- ]tern No. 21
(x) 1st Half - Last line
(xii) Table 3 - Col. Heading
'(xiii) Table 4 - Col. Heading
(xiii) Table 5 - Total
(xviii) Table 21 - Table Heading -- Above Col. Heading
(xix) Table 22 - SI. No.3
10
12
13
22
22
26
15
- S1. No.4
Village Directory L. C. No. 46 - Randesan
L C. No. 70 - Chandkheda
L. C. No. 60 - Nabhoi
TOWIl Directory
Heading of Col. 10 - 2nd line
Vern No.2 of Col. 20
Column Heading - 2nd line
Prrmary Cen. . .,us Abstract L.C. No. 24 - Shiholi Moti
ERRATA
<tol. ~o.
3
~ to 6
2
11
7 to 11
12-13 14
12 13 14
7 9
10 11
9 10
18 19
13 15
20
For
4
frim
8th line 6th line
10th line 9l'h line 7th line Kaehchh
Read
5
from
6th line 7th line Sl'h line 9th ~ine
10th line Kutch
1111
Rule given above Col. Heading may please be treated afler third line of the Cols.
range from Distance lllhabited No. of (10000)
Percentage of 'Blank
41.42 2,225 905
41.00 1,625 893
TW -(10 + Kms) BS KR -(5-10 Kms) BS
57.00 Blank
and other training
PR
Seeond and dary literacy centres Classes!
25
Distance range from No. of inhabited (100.00) Pleas; Delete Percentage of
41,00 1,625 893
41.42 2,225 9\)S
T,W -(5-10 Kms) -<-5 Kms) PR, KR
-(10 + Kms) BS, RS
44.07 57.00
and other vocational training
RR
Secondary and literacv Classes! Centre~,
52

Capital Complex located right in the Centre of the town is designed on 75 hectares of land on classical lines with multistroied blocks on either side and VIDHAN SABHA GRUH set on a rectangular platform in the middle of a Circular pond, in 1he Centre.
GANDHINAGAR, the Capital of Gujarat has been constru<:ted recently over the last fifteen years and is the third New Capital town developed in post - Independent India after Chandigarh and Bhuvneshwar. Today Capital Complex is the main attraction of the town which has rightly been dedicated 10 the peace and nature loving Father of the Nation. Mahatma Gandhi.

r
GUJARAT DISTRICT GANDHINAGAR 2 0 2 .. I I I I
I I I I I 2 0 2 6 8 10
6 I I I
12 1 .. 0 c: 0
8 MILES I
I 16 Kill. ~
.::-C o
0.'-
§-.. S ~°.:iA .. e. .c: tv ~l
" ~ ~ I ]01 STRICT
-cr
f'n). Kalol { ...
-o
.,.
CAPITAL OF THE STATE ••.........
DISTRICT HEADQUARTERS. .••.•••.••
TAlU KA HEADQUARTERS·············
DISiRICT BOUNDARY ..••..
NATIONAL HIGHWAY
. .. _._._ STATE HIGHWAY •.....••.
OTHER IMPORTANT ROAD ...
NHSB
SH 68
RS BROAD GAGE WITH STATION - .. _
RS METRE GAUGE WITH STATION ..... 1IIIIIIIFi'lIIII
~AHMADAeAO /.. . .-". ''''j'Y'DISTRICT
oJ .~ABARKANTHA Chhala • C
To Rakhlyal
~
C
~EVER AND ST~EAM..... • •. ~ VI LLAGE HAV I NG 5000 AND ABOVE
POPUL.ATION WITH NAME ..... '. . . • •
URBAN AREA WITH POPUL.ATlON
SIZE CL.ASS, Il ........... .
POST AND TELEGRAPH OFFICE .. .
DEGREE COL.LE~E AND TECHNICAL
INSTITUTION
REST HOUSE
... PTO
I-I .... [I]
RH


1
2
3
4
5
CONTENTS
FOREWORD
PREFACE
Map of District
Important Statistics
Analytical Notes and Tables
( i) Censlls concept of rural and urban areas and other terms
(ii) Brief history of district and DistriCt Census Handbook
(iii) Scope of Village Directory, Town Directory and Primary Census Abstrac~
(iv) Physical aspects ~ighlights of the. cha ng~ In.*hc j~ldsdic.ation· of the district during the decade
(v) Major characteristics of the district particularly in relation to the economic resources
(vi) Brief discription of places of n:::J:gi()O, historical or archaeological importance and places of tourist interest in Villa ges and Towns
(vii) Brief analysis of Village and Town Directory and Primary Census Abstract
PART XIII-A VILLAGE & TOWN DIREcrORY
SECTION I-VILLAGE DIRECfORY
List of Abbreviations used in the Village Directory
The Gandhinagar T aluka
Page No.
ili-iv
v-vii
Frontispiece
ix-x
i-xix
iv
v
Vi
VI
x
xi
1-27
1-20
2
( i) Talllka Map Facing Page 3 (ii) Alphabetic List of Villages 5
(iii) Village Directory 6-15
Appendix T Talukawise Abstract of Educational, Medical and other Amenities 18
Ap~ndix II Land UtiIisajol1 Data in Resp.:ct of Non-Municipal Towns (Census Towns) 19
Appendix TIl Talukawise List of Villages where no Amenities. viz: Educational. Medical. 19
Post and Telcgmph. Market/H at, Communication and Power Supply are available
Appendix IV List of Villages according to the proportion of Scheduled Castes and 20 Scheduled Tribes to Total Population Ranges
SECTION II-TOWN DIRECTORY 2H~7
List of abbreviations and codes used in the Town Directory 22
Statement I
Statement II
Statement III
Statement IV
Status and Growth History
Physical Aspects and Loca tions of Towns, 1979
Municipal Finance, 1979
Civic and other Amenities 1979
Statement IV-A Civic and other AmenitiCl> in Notified Slums, 1979
Statement V
Statement VI
Medical, Educau(\nal, Rccre ational and Cultural Facilities, 1979
Trade, Commerce. Industry and Banking, 1979
(i)
23
23
24
24
25
26 27

PART XUI-B PRIMARY CENSUS ABSTRACT
Explanatory Note for Primary Census Abstract
DISTRICf PRIMARY CENSUS ABSTRACT
(1) General Primary Census Abstract
(2) Scheduled Castes Primary Census Abstract
(3) Scheduled Tribes Primary Census Abstract
VlLLAGEflOWNWISE PRIMARY CEN SUS ABSTRACT
Page No. 1-24
2
4-5 8
10
J Gandhinagar Taluka 11-20
Appendix - Total, Scheduled Ca9tts and ScbMI DIed Ttibet &pulatiOD - Urban Block-wise 21-24
( ji)

FOREWORD
The district census handbook (DCH). compiled by the Census Organisation on t>~half .of the. State governments. is one of the most valuable products of the Census. The OCH is co~stantly referred to by planners, administrators. academicians and researchers. It is inter uti" used fot delimita,tion of con~tituencies, formulation of local level find regional plans and as an aid to District administratiull. The district census handbook is the only publication which provides Primary Census Abstract (PCA) data upto village level for the rural areas and ward wise for each city or town. It also provides data on infrastructure and ~.menities in villages and towns. etc.
The district census handbook series was initiated during the 1951 Census. It contained important ccnsu~ table~ and PCA for each village and town l1f the district. During 1961 Census the s,:ope of the OCH was enlargt."d and it contained a descriptive account of the district, administrative statistics. census tables and a village and tuwn directory. including peA. The 1971 DCH serie!:> was planned in three parts. Part-A related to village and town directory. Part-B to village and town PeA and Part-C comprised analytical report, administrative statistics. district census tabies and certain analytical tables based on PeA and amenity data in respect of villages. However, in some states it was confined to district census tables and in a few cases altogether given up due to delay in cumpilation and printing.
While designing the format of 1981 DeH series some new features along with the restructuring of the formate of village and town directory have been attempted. At the same time. wmparability with the 1971 data has also been kept in view. All the amenities except power supt'ly in the village have been brought together in the vilJage directory with the instruction that in case an amenity is nol available in the referrent village the distance in broad ranges from the nearest plaCe where the amenity is available may be given. The restructuring of the format of the village directory and incorporating more exhaustive data on infrastructure aspect particularly in rdation to amenities and land-use pattern is expected to further meet the need of micro level planning for rural areas. It is expect.ed to help not only in local arca planning but
ill
regulating the provision of goods a nd services as well so as to minimise the regional imbalances in the process of development. A few new items of information have also been introduced to meet . some of the requirements of the Revised Minimum Needs Programme. Such new items of information as adult literacy centres. primary health sub-centres and community health workers in the village have been introduced in the village directory with this objective' in mind. The new item on approach to the village is to have an idea, about the villages in the district which are. inaccessible. A new column, "total population and number of -households". has been. introdu~ to examine the correlation of the amenities with the population and number of households they serve. Addition of two more appendices listing the villages where no amenities are available and according to the proportion of Scheduled Castes ... and Scheduled Tribes popul«ti(}D to the total population has also been made with tbis view in mind.
The formats of the town directory have also been modified to meet the requirements of the Minimum Needs Programme by providing information on a few new items. A new statement (Ill civic and other amenities in slums in Class-I and Class-ll towns (Statement IV-A) has been introduced with this objective in mind. It is expected that this will help the planners to chalk out programmes on provision of civic amenities for tlie improvement of slums. The columns OIl
Scheduled Castes and Scheduled Tribes population in Statement IV relating to civic and other amenitie~ and adult literacy classes/centres under .:ducational facilities in statement V are also added inter alia with this view. A significant addition is class of town in all the seven statc-men:s of the town directory. The infrastructure of amenities in urban areas of the country can be best analysed by taking the class of towns into consideration. The addition of the columns on civic administration status and population III a few statements also serves this purpose.
The format 01 the primary census ab:>tract
for the "mages and towns has bccn formulated in the light of changes in the economic and other questions canvassed through the individual slip of ] 981 Census.

In order to avoid delay in publication ·of ]981 OCH series it has been so designed that Part-A of the volume contains village and town direCtory and Part-B, the PCA of villages and towns including the Scheduled Castes and Scheduled Tribes PCA upto· Tahsil{fown levels. At the begining of the DCH a detailed analytical note supported by a number of inset tables based on PeA and non census data in relation to the infrastructure has been introduced to enhance its value. The di!>trict and tahsil/police station/ C D Block, etc., level maps depicting the boundaries and other important features have been inserted at appropriate places, to further enhance the value of the pUblication.
This publication is a joint venture of the
NEW DELHI the 26th April. 1982
iv
State Government and the Census Organisation. The data have been collected and compiled in the State under the direction of Shri R. S. Chhaya the Director of CensllS Operations, GujCll'at OD 'behalf of the State Government which has borne the cost of· printing .. The task of planning. de..~igning a:ld co-ordination of this publication was carried out by Shri N. G. Nag. Deputy Registrar General (Social Studies) of my office. Dr. R K, Roy, Deputy Registrar General (Map) provided the techniCal guidance in the preparation of the maps. Data received from Census Directora:e~ hav~ been scrutinised in the Social Studies Division at the headquarters under the guidance of Shri M. M. Dua, Senior Research Dfficer. [am thankful to all who have· I:ontributed in this project.
P. PADMANABHA Registrar General. Indi(J.

PREFACE The District Census Handbooks are printed
during every decadal Census from 1951. These District Census Handbooks are prepared by the Census Organisation and DCHB Unit of the S:ate Government. These are published by the State Government at their own cost.· The District Census Handbooks arc the first publications in the series of 1981 Census publications. The Cen~us Organisation has been collecting an enormous data both during the Census Enumeration period as well as after the Census Enumeration period. This data is very valuable to
the Administrators, Economists, Planners,. Research Workers, Scholars and other intelligentsia and also to the several institutions dealing with social-economic and developmental aspects of the State. It is absolutely necessary that this data after its collection is printed in time and reaches the data users also in time. It is a matta of great satisfaction that the present volume is being published in the minimum possible time· after the Census count.
The Census count in Gujarat State was taken during the period February-March 1981. The provisional figures coUected. through the District Census Officers were published and presented to the Chief Minister of Gujarat State on 23rd March, 1981. After the declaration of the pro vi-1>ional count six Regional Tabulation Offices were op~neu al diiferent places in the State. Three such Regional Tabulation Offices were upened at Ahmadabad, one at Vadodara, one at Surat and one at Rajkot. The Census records were edited and checked in these offices and the Primary Censu§ Abstracts for aU the areas of the State were prepared. For this purpose· 1,102 Tabulators, 184 Checkers and 61 Supervisors were temporarily engaged for a period of ten months.
These offices were supervised by IJ.cputy Director of Census Operations who were taken on deputation from the State Government.
The District Cen."us Handb,)ok for the 1981 Census is published in two parts as follows :
1. Pari: A (I) Village Directory (2) . Town Directory
II. Part B District(Talukawise Primary Census Abslrad
v
. Both the Parts A and· B of the District Census Band .... ook for 1981 CenslIs have been combined and printed in one volume.
The Village Directory contains comprehensive information about the basic amenitie~ avail-able. at the village level such as medical, educational, drinking water, etc. The Town Directory, also consists of information about the status, growth, history, municipal finances, civic and other amenities etc.
The Primary Census Abstract contains lll
formation about the number of occupied residen-· tia} houses and households, total population including houseless and institutional population, literacy, Scheduled Castes/Scheduled Tribes pop~ lation and· the information pertaining to workers and non-workers. A special feature of the 1981 District Census Handbook is the inclusion of Scheduled Castes/Scheduled Tribes Primary Census Abstracts which gives complete District I Taluka(Townwise data on Scheduled Castes! S:.:ll~duled Tribes. .
The data for the Village Directory ha'i been collected through the Taruka Development Ofltcers who in turn obtained the data from the village officials throught their Statistical Assistants.
In the District Census Handbook Cell this data was subjec~ed to a very close scrutiny and inaccuracies or deficiencies where noted ,~crc again got checked through the· Statistical Assistants. For this purpose persons were deputed to the districts for obtaining the informatlons quickly. The area figures as reported by the village officials were also checked with tbe figures reported by the District Inspectors of Land Records. Utmost care has been taken to see that the· spellings of the villages arc correct. Some of the data collected from the viUage level has also been cross-<:hccked with the data which was supplied by the different Directorates and the Heads of the Departments oC the State Government. The information pertaining to the Distrid write-up (Item V of the Analytical Note) has been obtained through the Collectors and the District Development Officers and the other district heads.

The data on Town Directory bas been obtained through the various local bodies such as Municipal Corporations. Municipalities. Nagar Panchayats and Gram Panchayats. These were also checked in the Directorate by Special Cell.
The Primary Census Abstract and Town Dircctory with their Inset Tables have bccn prepared in the Directorate whereas Vi1lag~
Directory alongwith its Inset Tables hayc b.!en prepared in District Census Handbook Cei1.
Maps
In each volume one district map showing the taluka boundaries. location of towns·and village~ having a population of. 5,000. communications. etc. has been printed. Taluka Illaps for each of the talu~~ in the district are also inserted in .the
District Census Handbook. These taluka rna ~ indicate. the boundaries of tpe 'village and lown~ withiQ the taluka and the locatiun code numbers of each village. The maps were prepared in the map section of the Director of Census Operations.
The compilation of a huge mass of data which is printed in this book requires the active help and cO~peratkm of the State Goyernment in addition to the hdp and cO--<:lperation of all the officers and staff members of the Census Directorate. I am deeply indebted to Shri H. K. L. Kapoor, Chief Secrelary to the Government of GujaraL for cxt~nding aU help in the matter. Shri K. Rammoorthy who was working as Secreta!'). General Administration Department. during the Census Enumerati,1D period extended his wholehearted co-operation. Shri V. Krishnamurthy who subsequently took over as Se\;retary. General Administration Department, also look active interest in the progress of Census work. I woulJ like to make a special mention about the extra facilities granted by the State Government by way. of creation of a Special Cell for the c.ompilation of District Census Handbooks. One po~t
of Deput y Director and seH~ral p0s:~ of Reseal'cll A~istants, Statistical Assistants. Clerk.s and Typists have been sanctioned by the State Government specially for the c,)mpilation of the data. The services of all these perS()n,s were pla(cd at .
the disposal of the Directorare for compilation work.
VI
Shri G. S. Shah. Director. Bureau of Economics & Statistics. Government of Gujarat, also rendered very valuable help by providing whatever data was required for cross-checks and by providing personnel for the Special Cell of District Census Handbook.
The Collectors and the District Devclopmen: Officers incharge of the districts and the Municipal Commissioners incharge of the Municipal Corporation areas. have extended their wholehearted co-opcration for the Census work. The Resident Deputy Collectors. the Deputy Collectors incharge of Sub--Divisionals. the District Statistical Officers. the Deputy District Develop-ment Officers, the Mamlatdars. the Taluka De- . \ elopment Officers. the Chief Officers of the Municipalities, the Deputy Mamlatdars and the Statistical Assistants at the District[faluka levels. all played an important role in the Census work. I express my deep gratitude to all of them. After the Census count a 1arge number of young boys and girls coming right from the schools and colleges were employed as Tabulators. Checkers and Supervisors and all of them worked \~r)
hard for the compilation of the useful data.
Shri P. T. Thakkar. Director of Printing and Stationery. Government of Gujarat, has taken the interest in the printing of the Handnooks. I hereby acknowledge the valuable help. guidance and assistance rendered by him and other officers of .the Prin:ing Department. Shri P. K. Choksi, Printing, Inspector in this Directorate looked after the printing jobs very well.
In the Census Directorate Shri J. K. Patel, Deputy Director of Census Operations (T<!ch-) was looking after the Compilation Section so far as Censu-; data was concerned_ The Collection and compilation of data for the Village Directory was look;xl after by Mrs. Neelaben A. Bhatt. Deputy Director who;;e services were placed at the dislJ\lsaJ of the Directoraic. Both these officers haw PUl in hard labour for the compilation and printing ()f the data.
Shri K. H. I)"'ai. Shri V. A. Sath;::, Shri K. R. Shridh.arani and Shri S. D. Vadera. who were officers on deputation from the Gujarat Administrative Service, supervised the editing, checking and compUatinn work at the Regional Offices in Ahmadabad. Surat. Vadodara and Rajkot respectively. Shri P. J. Jhala and Shri M. A. Malwade

who were officers on deputation frim the State Government from the Bureau of Economics and Statistics, supervised the editing, checking and compilation work at Regional Tabulation Offices in Ahmadabad. Shrj V. H. Vasavada, Deputy Director from the Gen~ral Administtathe Service looked after the administration work. All these officers worked diligently and accurately during their Service in the Census Organisation.
In the Directorate Shri J. K. Patel, Depu:y Director was assisted by Shri R. V. Sanghani and Smt. D. D. Jhala Investigators and Sta.tist;cal Assistants Shri K. P. Patel, Shri R. R. Upadhyay, Kum. J. R. Megha, Smt. M. B. Pa:d and Smt. K. S. Mehta. The typing of Primary Cea:>us Abstracts was undertaken in a special section which was headed by Investigator Shri M. H. Patel. In the State Cell of Dis:rict Ccn~li'
Handbook Smt. Neelaben A. Bhatt, Deputy
Director, was assisted by the Assistant Director
Shri V. R. Gandhi and Research Assistants
Kum. T. K. Shah and Smt. S. B. SoJanki and
S,atis,ical Assistants Smt. C. C. M~hta.
Shri S. V. Patd Smt. H. A. Patel and Shri P. K.
Shastri.
AHMADABAD 18th August, 1982
In the Map Section the work of preparation of State/District(faluka maps was looked after by Shri K. M. Dhawale, Senior Geographer and Shri B. L. Arya, Geogr.aph>!r. They were ably a~"jsi~d hy. Shri K. K. Patel, Artist, SIShri M. S. Bha1t and B. J. Mooi, Senior Draftsmen and S/Shri D. A. Marao, R. K. Joshi, G. M. Ko~ti,
B. C. Trivedi and M. ;\. Shukla, Draft')mcl1.
The work of dictations and typing of notes, reports tables, etc., was undertaken by Shri J. A. Harry, Confidential Assistant in the Directorate, diligently with speed and accuracy. He was assisted by a number of Typists in the office.
Limitations of space prevent me from making individual mention of all those who have contributed to the making of this volume so accurate and complete. Quite a large number I)[
Assistant Compilers, Computors, Clerks, Typists, Proof Readers. Draftsman, Artist, etc., have con-tributed valuable help in this work.
Finally. I would like to expn..~ lIly deep gratitude to Shri P. Padmanabha, lAS, Registrar General, Government of India, and Sarvashri K. K. Chakravorty. V. P. Pandey, N. G· Nag and Dr. B. K. Roy, Deputy Registrars General, for the guidance given to me from time to time.
vii
R. S. CHHAYA Director of Census Operations,
Gujarat, Ahmadabad


IMPORTANT STA'fISTICS
POPULATION TOTAL
Rural
Urban
DECENNIAL POPULATION GROWTH RATE 1971-81
AREA (Sq. Kms.)' " '
DENSITY OF POPULATION (per Sq. Km.)
SEX RATIO (Number of Females per 1000 Males)
LITERACY RATE
PERCENTAGE OF VRBAN POPULAflON TO TOTAL POPULA nON
PERCENTAGE TO TOTAL POPVLATION
(i) Main Workers
(il) Marginal Workers
(iii) Noo-WOI'kers
Break-up of Main Workt:rs:
1:'
PERCENTAGE AMONG MAIN WORKERS (i) CULTIVATORS
Persons Males Females
PersoDS Males Females
PersoDS Males FemaI~
PefS(}ns Males Females
Persons Males Females
Persons Males FemaJes
Persons Males Females
Persons Males Females
Ix
Slate
Gujaral
34,085,799 17,552,640 ]6,533,159
23,484,146 11,986,672 11,497,474
10,601,653 5,565,968 5,035,685
+ 27.67
196,024.0
114
942
-43.70 54.44 32.30
31.10
32.23 52.19 11.03
5.04 0.72 9.63
62.73 47.09 79.34
37.46 38.95 30.02
District
Gandhinagar
289,088 150,194 138,894
226,645 116,575 110,070
62,443 33,619 28,824
+ 44.08
649.0
445
925
51.48 63.17 38.84
21.60
29.30 49.24 7.74
1.95 0.60 3.40
68.75 50.16 88.86
22.97 25.40
6.27

State District
Gujarat Gandhillagar
(ii) AGRlCULnrRAL LABOURERS Persons 22.65 25.81
Males 17.59 21.00 Females 48.08 51.02
(iii) HOUSEHOLD INDUSTRY Persons 2.44 .2.15 Males .2.42 2.11 Females .2.48 240
(IV) OTHER WORKERS I'ersons 37.45 49.07 Males 41.04 50.49 Females 19.42 39.31
PERCENI'AGE 01< SCHEDULED CASTES Persoos 7.15 7.33 POPULAll0N 'fO TOTAL POPULATION :\laJes 7.15 7.36 ..
Females 7.1S 7.30
PERCENTAGE OF SCHEDULED TRIBES Persons 14.U 0.58 POPULATION TO TOTAL POPULATION Males 13.98 0.65
Females 14.49 O.SO
NUMBER OF OCCUPIED RESIDENfIAL 5,854,862 54,618 HOUSES
NUMBER OF VILLAGES Total 18.550 75 Inhabited 18,U4 75 U .... habited 436
NUMBER OF TOWNS lSi 1

ANALYTICAL NOTES AND TABLES
I. Census concepts of .rural and urban arcas and other terms, viz., Census House, Household, Scheduled Castes, Scheduled Tribes, I;iterates, Main Workers, Marginal Workers, Non-Workers, ctc.
The 191)1 Census was carried out in Gujarat in two stages. The first stage of houselisting was completed in the months of .I une-J uly 1980. The houselist~ thus prepared provided a frame for the enumeration work. j n the second stage the house to house Census enumeration was carried out from 9th February, 1981 to 28th February, 1981 with reference date as ~unri.se of ]:,\ /.,1arch. In1. The enumeration of houseless population was carried out on the night of 28th February, 1981. A revisional round was also taken from 1st March, 1981 to 5th March, }981. In this revisional round the Enumetators recorJed new births that had taken place after their last visit for enumeration but before the sunrise of 1st March, 1981 and also any visitor (s) that had moved into household and who had been away from his/her/their place of normal residence throughout the enumeration period or an entire household that had moved into the jurisdiction of ,the enumeration during this period and
which had not been enumerated before. The names of persons who had died after the enumeJ;ation period but before the sunrise of 1st March, 1981 were deleted from the Individual Slips which had been filled up during enumeration period.
In Gujarat prior to the taking of 1981 Census a special programme of Updating permanent house-numbering scheme in the different parts of the State was also carried out in co-ordination with the Local Bodies and State Government. Gujara:t was introduced during the 1971 Censlis and Villa)!c Panchayais played a vcry useful The permanent house-numbering scheme in Corporations, Municipalities, Nagar Panchayats and the District/faluka Panchayats, Municipal role in fixing the number plates on the house:; and buildings.
After the Census cOllnt was over the Enumerators submitted the figures to the Charge Officers through their Supervisors. These figures
G-I ( i )
were obtained by the Director of CenslIs Operations through the District Census Officers and the figures after compilation were dedared on 23rd March, 1981 as Provisional CensllS Figures for 1981 Census. Paper 1 sho",;ng those figures was printed and published and distributed on a complimentary basis.
During the Census Operations mainly two Census records were filled up by the Enumerators in each block. These were (1) Household Schedules and (2) Individual Slips. The different concepts which were adopted during Ithe houselisting stage as well as during the Census enumeration are as follows:
( I) Rural and Urban Areas
Rural Areas. The basic unit for rural areas is a revenue village which has a definite boundary. The revenue vil:lage may comprise ~everal hamlets but the entire village has been treated as one unit for presentation of the data.
Urban Areas: Urban areas have been specifically defined for the 1981 Census. The criteria adopted during the 1981 Census was almost the same as adopted in 1961 and 1971 Censuses. The following criteria were adopted for classifying urban areas in the States :
(a) All places with a Municipality, Municipal Corporation or Cantonmcn. Board or Notified Town Area.
(b) All other places which specified the following criteria: 1 A minimum population of 5,000,
2 At least 75 per cent of the male working population engaged in non-agricul-tural (and allied) activity,
3 A population of at least 400 persons per sq. km. or a popUlation of 1,000 per sq. mile.
The slight variation of the criteria adopted in 1981 and that adopted in 1961-1971 Censuses was that during 1981 Censlis the persons working in activities ::ouch as fishing, logging, etc., were treated as on par with cultivators and agricultural labourers whereas in ]961-1971 Censuses these were treated as engaged in non
agricultural activity.

( II) Census House
A 'Census House' is a builiding or part of a building having separate main entrance from the road or common courtyard or staircase. e~c .. used or recognised as a separate unit. I t may be occupicd or 'vacant. lit may b.:: used for a
residential or non-residential purpose or both. In case of a building having a number of flats or blocks which are independent of one another having separatc entrances of their own from the road or a common staircase or a common courtyard leading to a main gate, were conSIdered as separate Census houses.
( III) Census Household
A household is a group of persons who commonly live together and would take .their
meals from a common kitchen unless the exigencies of work prevented any of them from doing
so. There may be a household of persons related
by blood or a household of unrelated person or
having a mix of both. Examples of unrelated
household are boarding hOll,~es, messes. hos~els.
residential hotels. rescue homes, jails, etc. These are called 'institutional Households'.
( IV) Scheduled Castes! Scheduled Tribes
The Scheduled Ca-;tes and Sched1l1ed Tribe,;
as notified under the Constitution for Gujarat
State have been treated as Scheduled Castes and Scheduled Tribes for the purpose of enll meration.
A list of such Scheduled Castes/Scheduled Tribes notified for Gujarat is as under
GUJARAT
The SC'heduled Castes wui Scheduled rr; bes Orders (Amendment) AN, 1976 (No. 108 of 1976 dmed the 18th Septelllher, 1(76)
Schcdnlt)d Castes
Ager
2 Bakad, Banl
3 Bawa-Dedh, Dedh-Sadhu
4 Bhambi, Bhambhi, Asadaru. A~Jdi, Chamadia, Chamar, Chambhar. Chamgar, Haralayya, Harali. KhaJpa, Machigar, Mochigar, Madar,
Madig, Mochi, Nalia, Telegu Mochi. Kamali Mochi, Ranigar, Rohidas, Rohit, Samgar
:'i Bbangi, Mehtar, Olgana, Rukhi, Malkana, HaIalkhor, LaIbegi, Balmiki, Korar, ZadmaIli
(ii)
6 Chalvadi, Channayya 7 Chenna Dasar, Holaya Dasar 8 Oangashia 9 Dhor, Kakkayya, Kankayya
10 Garmatang II Garoda. Garo 1:2 Halleer
13 Halsar. Haslar, H ula~var. Halasvar 14 Holar, Valhar 15 Hoiaya, Holer 16 Lingader 17 Mahar, Taral, Dhegu Megu
18 Mahyavansi, Dhed, Dhedh, Vankar. Maru Vankar, Antyaj
I () Mang, Matang, Minimadig 20 Mang-<Jarudi 21 Meghval, Meghwal, Menghvar 22 Mukri
23 Nadia, Hadi 24 Pasi
25 Scnva. Shenva, Chenva, Sedma, Rawat 26 Shemalia
27 Thori
28 Tirgar, Tirbanda 29 Turi
30 Turi Barat, Dedh Barot
Scheduled Tribes
Barda
SavaclIa, Bameha
Bharwad (in the Nesses of the forests of Alech, Barada and Gir)
4 BhU, Bbi} Garasia, Dholi-Bhil, Dungri Bhil, Dungri Garasia, Mewasi Bhil, Rawal Bhit Tadvi Bhil, BhagaJia, BhHam, Pawra, Vasava, Vasave
:) Char an (in the Nesses of the forests of Alech, Barada and Gir)
6 Chaudhri (in Surat and Valsad districts) 7 Chodhara
)) Dhanka, Tadvi, Telaria, Valvi l) Dhodia
10 Dubla, Talavia, Halpati I j Gamit, Gamta, Gavit, Mavchi, Padvi 12 Gond, Rajgond
13 Kalhodi. Katkari, Dhor Kathodi, Dhor Katk.ari, Son Kathodi, Son Katkari
J.f Kokna, Kokni, Kukna
15 Koli (in Kuteh district)
16 Koli Dhor, Tokre Koli, Kolcha, Kolgha
11 Kunbi (in the Dungs districi)
18 Naikda, Nayaka, Cholivata Nayaka, Kapadia Nayak, Mota Nayaka, Nana Nayaka
19 Padhar 20 Paradhi (in Kutch district) 2 I Pardhi, Advichincher, Phanse Pard hi
(excluding Amreli, Bhavnagar, J am nagar. J unagadh, Kachchh. Rajkot and Surendranagar districts)
22 Patelia 23 Pomla 24 Rabari (in the Nesses of the forests
of Alech, Barada and Gir) 25 Rathawa 26 Siddi (in Amreli, Bhavnagar, Jamnagar,
Junagadh, Rajkot and Surendranagar districts)
27 Vaghri (in Kutch district) 28 Varli 29 Vitola, Kotwalia, Barodia
( V) Literates
A person who can both read and write with understanding in any language is taken as 'literalte'. A person who can merely read but cannot write is not literate. It is not necessary that a person who is literate should have received any formal education or should have passed any minimum educational standard.
(VI) Main WOl'kers, Marginal WOl'kers, Non-Workers
Dudilg the 1S'81 Ce;;nsu& 'Work' had been defined as participation in any economically productive activity. Such participation may be physica~ or mental in nruture. The work involves not only actual work but also effective supcrvi~
sIan and direction of work.
1 he rdefence period for 'Work' is one year preceding (he date of enumeration. The mainworker was a person who had worked for the major part of the year in that actIvIty. By
major part of the year it was intended to lind out as to whether a person had worked for 183 dayS or more or in other words worked for six months or more. Those who had worked for less than six months or 183 days were treated a<; marginal workers. A non-worker was one who had no economical activit)l during the year.
The information on 'Workers and NonWorkers' were obtained through Q. Nos. 14(a)
(iii )
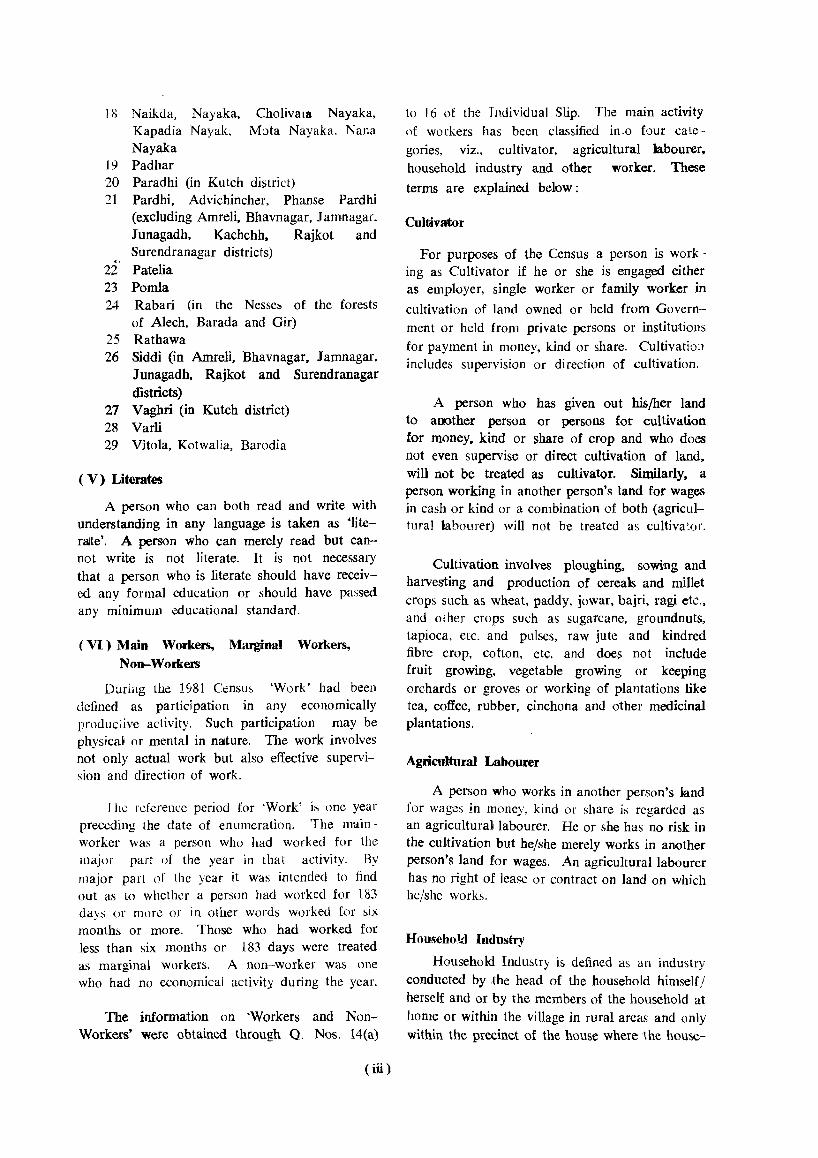
to 16 of the Individual Slip. The main activity of workers has been classified in.o four catcgories, viz., cultivator, agricultural labourer. household industry and other worker. These
terms are explained below:
Cultivator
For purposes of the Census a person is working as Cultivator if he or she is engaged either as employer, single worker or family worker in cultivation of land owned or held from Govern-ment or held from private persons or institutions
for payment in money. kind or share. Cultivaticl:1 includes supervision or direction of cultivation.
A person who has given out his/her land to another person or persons for cuttivation for money, kind or share of crop and who does not even supervise or direct cultivation of land, wil1 not be treated as cultivator. Similarly. a person working in another person's land for wages in cash or kind or a combination of both (agricultural labourer) will not be treated as cultiva:o r.
Cultivation involves ploughing, sowing and harvesting and production of cereals and millet crops such as wheat, paddy, jowar, bajri, ragi etc., and other crops such as sugarcane, groundnuts, tapioca. etc. and pulses, raw jute and kindred fibre crop, cotton, etc. and does not include fruit growing, vegetable growing or keeping orchards or groves or working of plantations like tea, coffee, rubber, cinchona and other medicinal plantations.
Agricultural Labourer
A person who works in another person's land for wag~s in money, kind or share is regarded as an agricultural labourer. He or she has no risk in the cultivation but he/she merely works in another person's land for wages. An agricultural labourer has no right of lease or contract on land on which he/she works.
Household Industry
Household Industry is defined as an industry conducted by ,the head of the household himself! herself and or by the members of the household at home or within the village in rural areas and only within the precinct of the house where the house-
hold lives in uroan areas. The larger proportion of workers in a household industry should consist of member of the household includinu the
'" head. The industry should not be run on the scale of a registered factory which would qualify or has to be registered under the Indian Factory Act.
There may be an industry which is being run by a large joint family of more {han 10 persons and where power is used or more than 20 persons wher~ power is not used. In such cases, though only family members are involved, this is not to be treated as 'RHI '. Thus, the meaning of the term 'run on the scale of a registered factory' refers to such cases even if these are not registered as such.
The main criterion of a Household Industry is the partic:pation of one or more members of a household. This criterion applies in urban areas too. Even if the industry is not actually located at home in rural areas there is greater possibility of the members of the household participating even if it is located anywhere within the village limits. In the urban areas where organised industry takes greater prominence, the Household Industry should be confined to the precincts of the house where the participants live. In urban areas even if the members of the household by themselves run an industry, but at a place away from the precincts of their home, it is not to be considered a Household Industry. It should be located within the precincts of the house where the members live in the case of urban areas.
A Household Industry should related to prod uctiol1, processing, SerVICll1g, repamng or
making and selling (but not merely selling) of goods. It does not include professions sllch· as a Pleader or Doctor, Barber, Musician, Dance:', Waterman, Dhobi, Astrologer, etc., or merely trade or business, even if such professi:.:>ns, trade or services are run at home by members of the household.
Other Workers
All workers, i. e. those who have been engaged in some economic activity during the last one year, wh~) are not cultivators or agricultural labourers or in HOllseJlllld I ndu~, ry. are
. Other Workers '. The type of work~rs that come under this category include factory
(iv)
workers, plantation workers, those in trade com-, mcrce, business, transport, mining, construction. political or social work, all Government servants, Municipal employees, teachers, priests, entertainment artists, etc. In effect, aU those who work
in any field of eoonomic activity other than cultivator, agricultural labourer or household industry, are' Other Workers '.
H. Brief History of the District and D~strici Census Handbook
[AI History of the District
The State of Gujarat came into existence on the I st May, 1960. as a result of the bifurcation of the erstwhile Bombay State and Ahmadabad became the State's temporary Capital. In the mean-while a site on the bank of Sabarmati river ncar Pethapur village of Kalal taluka was selected for the new capital of the State and CL)n~truc~ion work was started. This new township was named Gandhinagar after Mahatma Gandhiji the father of the Nation and a new district was formed by transfering 54 villages from Ahmadabad district and 25 villages from Mahesana district. The district was named Gandhinagar district. The capital of the Slat(.; was shifted to Gandhinagar in 1970. The district is a single taluka district and has a populaticn ,)f 200.6-Q persons forming 0.75 per cent of the total State popuplation.
In NuYclllbcr, 1956, thi: States \'.C1'e reorganised and the bigger bilinEual State _ef/Bombav was formed with Vid;rbha. /~arathawad~, Saurashtra, Kachchh regio~/a'nd Gandhinagar district became a part of t¥bigger bilingual State.
Lastly, the B :.lbay Sta:e was bifurcated on 1st May, 196 nd separate State of Gujarat and Maharas a were formed. Since that date the Ga !nagar district became a r:11't of the G:'jarat
[B] History of District Census Handbook
Prior to the 1951 Census the Census figures Were brought out villagewise under a booklet knowll as • Village Handbook' which contained only the popUlation totals of Villages. These books
were prepared by the Census Organisation on behalf of the State Government and published by the latter. It was for the first time in 1951 Census that a more detailed and

well organised book known as 'District. Census Handbook' was brought out by the Census Organisation. The 1951 Census Handbook contained the viUagc;-;is::: Pr!m~ry Census Abstracts which also included the information on post offices, railway stations and the nearest bazars of each village. The handbook also contained several district tables.
During the 1961 Census the District Census Handbooks were brought out which contained the Primary Census Abstracts as wen as certain district tables.
During 1971 Census also the District Census Handbooks were published which in addition to the Primary Census Abstracts contained a Village Directory showing the different village amenities and land-use of all the villages in the district. A separate portion known as 'Town Directory' was also included in the District Census Handbook. The Handbook was divided into three subparts known as Part-A, which contained the Village Directory and Town Directory, Part-B which contained the Primary Census Abstracts and Part-C which contained the Introductory Essay. Official Statistics, etc.
For the 1981 Census the District Census Handbook is being brought out in two Parts. Part XIlIA and Part X1II-B. Part XUI-A will contain the Village and Town Directory whereas Part XHI-B will contain the Primary Census Abstracts both General and Scheduled Castes and Scheduled Tribes. The Part-C as it was brought Ollt during the ] 971 Census has been dropped.
III. Scope of Village Director)" Town Directory and Primary Census Absract
The District Census Handbooks which are now being printed during every Census after the
1951 Census, are very important publications of the CensllS Organisation. With the emphasis by the Planning Commission on the' Minimum Needs Programme' of the rural areas the District
Census Handbook has bec.ome an important tool in the hands of the Administrators, Planners, Policy Makers and Academicians. For the 19R1 Census ,the District Census Handbook has been
divided into two parts which are combined in one volume. The details of the oontents of each of these two parts are as follows:
PART A : ViLLAGE AND TOWN DIRECTORY
Village Diredory
This Part-A contains the non-census statistics of each viI age and town in the district. The Village Directory gives villagewise particulars of amenities available for each village in the spheres of education, medical, power supply, drinking water, post and telegraph. communication, land-usc, weekly markets and places of religious, historical and archaeological interests in the village. During the 198i Census additional information regarding (1) copies of the newspapers coming in the Village, (2) number of motor-cycles and scooters avail-able in the village, (3) numbers of cars and jeeps available in the village and (4) number of tractors available in the village hav.e been added. The above non-cenSllS data of the Village Directory was collected from the Taluka Development Officers of each Taluka Panchayat in the State. In Gujarat under the democratic decentralisation scheme the Panchayats are now exercising very wide powers and the P0St. of Statistical Assistants are under the administrative and technical control of the Taluka Parichayats. Besides, the TalaticlIIn-Mantris at the village level who are the base village functioneries are also under the control of the Ta:luka Panchayats. The proformas for soliciting the information were despatched to the Talati~um-Mantris tllrough the Taluka Develop'ment Officers and these after they were filled up were checked by the Taluka Development Officers and also by the Districts Statistical Officers who work under the administrative and technical control of the District Panchayats. The data thus received was checked fully in the District Census Handbook Unit of the State Government. At the end of Village Directory a taluka abstract in Appendix-l of educationaL medical and other amenHies is also prepared and printed. Appendix-II which shows the land utilisation data
in respect of non-municipal towns is printed. In Appendix-Ill the talukawise list of villages where no amenities relating to educational, medical, drinking water, post and telegraph, communication, power supply and market/hats, are available have been shown. Appendix-IV shows talukawise list of vil1ages according to the proportion of
( v)

Scheduled Castes/Scheduled Tribes population by ranges. The last two appendices have been included for the first time in the 1981 Census.
Town Directory
The Town Directory portion furnishing the data for each town in the district is exihibited in seven statements covering (1) the status and growth of the civic administration. (2) physical a~pcct and loca~ion of [own. (3) the civic finances of the towns, (4) the civic and other amenities in the towns. (5) the mc(.Lical, educational, recreational and cultural facilities in dIe ,uwns. Ie») llude,
commerce, im1 ustries and banking in· the towm and lastly (7) the civic and other amenities in notified S}UlllS 7Vnerever they exi:;t.
The non-census data for each of the towns for the Town Directory were obtained from the
. Municipal authority in case of municipal towns ~nd for other towns the data were obtained from the c~ncerned Nagar and Gram Panchayats. An Appendix showing the towns with their outgrowths with population is also prepared and attached at the end of the, Town Directory.
PART B : PRIMARY CENSUS ABSTRACT
Part-B gives for each village and for each ward of the town the primary cen::.us data incorporating area of the town in sq. kms. and of the villages in hectares, the number of occupied residential houses. the number of households. total population and its break-up by sex, Scheduled Cas:es and Scheduled Tribes population, literate popUlation and working popUlation by four broad ca:egories, viz., (l) cultivator~, (2) agticultural labourers, (3) those working in household industries and (4) other workers. There is a slight departure in the presentation from the 1971 categories which were in. all nine categories.
The Scheduled Castes/Scheduled Tribes and Primary Census Abstracts at the Distric~(faluka/ City level are also printed in Part-13 of the Handbook.
lV Physical aspects highlights on the changes in the jurisdiction of the distrid during the decade including jt(s boundaries and any Important event 01) geographic or geophysical aspect
There have been no jurisdictional changes in the district boundaries during the last decade. The adll1jni~trative jurisdiction of Gandhinagar tall1ka
( vi)
a~ :;hown in 1971 Census is the same during 1981
Census.
V. Maior characteristics of the district particu!~.!y ;;. j~!a'.ian to ,ile econolnic resources namely agriculture, irrigation, co-operation, livestock and animal husbandary, industries, power supply, transport and communication, pr:ces, insurance, education, medical and public heaith etc.
L II Agricultm:e
( (/) Land U tilisatioll
The total repClrting area in the district in the year 1979-80 was 6.53 lakh hectares. The details of land utilisation for the year 1979-RO
are as undex :
Land Utilisation
5L Classification Area in '00
)'\0. of area hectares
Forest j -.
:2 Barren and unculfivable land 3
Land put to l1on-agricdtural use 97
4 Culturable waste 10
5 Permanent pasture and other grazing land 34
6 Land under miscellaneous tree crops and groves not included
in area sown •• 7 Current fallows 14
8 Other fallows 2
9 Net area sown ~93
Total area 653
(b) Area under Major Crops
Area under major crops in the year 1971-72, 1975-76 and 1980-81 are :,hown in the table helow :
Area under different Crops
5J (in '00 hectares)
i\o. Crop Arca under different crops
1971-72 I 'nS-76 1';,;()-81
Wheal 3g 47 62 2 Bajri 203 [65 153 3 Rice 9 12 6 4 Iowar 52 49 5 Other Cereals 2 6 Total Cereals 302 275 221 7 Other Pulses 38 043 34 8 Total Pluses 3g 43 34 <) Groundnl!! 10 J:!
)0 Cottl)D 107 9:! 42
The mUIll flwd ern p; a;'c Bajti, Wheat and Rice whereas non food crop is cotton.

(c) Yield per Hectare
During the year 1971-72. 1975-76 and 1980-81 the yield per hectare of im~rtant crops in the district are as under :
Yield per Hectare (in Kg.)
SI. . Crop 1971-72 1975-76 1980-81 No. 1 Wheat 2,460 1,847 2,718 2 Bajri kharif 1,531 306 1.23~
3 Bajri summer -
767 1.516 4 J owar kharif 65 122 5 Kharif pulses 200 100 167
6 T oral pulses 333 150 235 7 Groundnut kharif 715 1,190 8 Cotton 328 167 413
(d) Crop Calandar
The months of sowing and harveSting of different crops are given below:
Crop Calandar 51. Crop Months of l\Ionths of No. Sowing harvesting
Paddy June-August October-oN ovember
2 Wheat October-November March
3 Jowar July-August October-November
4 Bajri June-July September-October
5 Cotton June-July October-M arch
6 Groundnut June-July October
(e) Scarcity
The scarcity affected villages in the district during the year 1971-72 to 1979-80 are as under:
'Scardfy SI. Year Scarcity affected village,
1\0. 1 1971-72 2 1972-73 75 3 1973-74 4 1974-75 75 5 1975-76 6 1976-77 7 1977-78 8 1978-79 9 1979-80 75
12) lrrigatilln
The area irrigated by different crops for the year 1971-72. 1975-76 and 1979-80 is given below:
Sl. Crop
No. 1 Wheat 2 Bajri
Area Irrigated by Crops
1971-72
31;
12
(in '00 hectares) 1975-76 1979-~O
47 6
52 18
(vii )
SI. Crop 1971-72 No.
3 Chil1ie~ 18
4 Rice 9 5 Other food crops 22
'6 Total food crops 99 7 Cotton 26 8 Fodder crops 8 9 Other non-food 4
crops 10 Total non-food 38
crops Total gross area 137
under irrigation
(i'n '00 hectares) 1975-76 1979-80
G 5
35 99
6 l~
44 135
22 30 14 26 6 50
42 106
141 241
The irrigated crops are mainly Wheat. Bajri. Rice, whereas 0ther crops are mainly depending on the monsoon.
Sources of I,rrigation
During the year 1971-72. 1975-76 and 1979-80 the sources of irrigation are as follow
Irrigation by Sources
SJ. Source
No.
1 :Government Canals 2 Tanks 3 Wells 4 Other Sources 5 Net Area irrigated 6 Gross Area irrigated
(in '00 hectares) 1971-72 1975-76 1979-80
137 121 206
137 121 206
137 141 241
. The major source of irrigation in the district
is wells.
[3] Co-<iperation
Co-operatives have been playing an increasingly important role in the rural economy of this district during the last decade. A super structure of co-operative societies with an apex bank at the State level, the District Central Co-operative Banks at the district level and Co-operative Societies at the village level is built up with the objective of strengthing the rund· economy. The agricultural credit co-operative societies advance short and medium term loans to their members for purchasing seeds, fertilizers, agricullural implements, etc.
The details regarding Co-operative Societies during the year 1971-72. 1975-76 and 1979-80 are as under :

CO-i)perative Societies
S1. Co-operative Item 1971-?~ 1~7S-76 l~79-80 No. Sc:;;etie8
Primary Agri-cultural Credit Societies
Societies 67 58 42 Members 10,000 15,000 J4,984
(in '00)
Societies 2 6 21 agricultural Credit Societies
Members 1,000 1 ,O()() 13,000 (in '00
3 Primary Consu- Societies
mers Stores i\1~!11bers
(in '(0)
4 Primary Markc- Societies ting Societies Members
5 Central and State Marketing Societies
(in '00)
Societics Members
(in '(0)
6 Primary Proce- Societies ssi ng Societies Members (Including Spih- (in'OO)
ning) .
7 All other types Societies of Primary Members Societies (in '(0)
8 All other types Societies of Societies Members (Central and (in'OO) State)
5
743
1
151
44
N-A. N.A.
9
896
163
1
43
~.A.
N.A.
13
U,::, ,,').
,11-'
4 268
1
45
N.A. N.A.
64 94 152 4,159 4,643 8,782
24 40 49
The data reveals an increasing trend in the field of Co-operative Societies. J t would be observed from the above figures that a majotity of the Co-operative Societies are Primary Agricultural Credit Societie;; in ,the year 1971-72, the total Co-operative Societies were 14] and the same increased !o 234 during the year 1979-80.
During the decade the scheduled banks have also increased their credit activities in the different spheres of agriculture industry etc.
[4] Livestock and Animal Hllsbandary
((~) Livestock
According to the Livestock Censuses of 1972 and 1977. the livestock population of the district is found to be distributed as under:
( viii)
Livestock
S1. Category of Livestock No.
I Total Livestock
A Bullocks alld Cows
(1) Males over 3 years
(2) Females over 3 year,
(3) Young ~tock
B Buffaloes
(1) Males over 3 years
(2) Females over 3 years
(3) Young stock
C Sheff!
D GoalS
E Horses and POllies
F Mules
G Donkeys
H Camels
J Pigs
II Poultry
1972
85,6G3
22,615
12,986
5,980
3,649
49,984
76
27,160
22,748
1,296
Y,575
99
7
1,241
846
j ..
3,249
1977
52,926
20,295
11,190
5,447
3,658
48,755
99
29,i25
19,53 i
1,884
9,941
53
30
953
I:NO
175
7,372
The livestock population in the district has considerably decreased during the year 1972-77.
The number of pouHry farms have increased from 3,249 to 7,372. During the year 1979-80 there were 5 vaterinary dispensaries and 3 stock
men centres.
The totai number of milk co-operatvie societies in the district is 56 in the year 1979-80.
(b) Agricultural Tools and l/llplement~
The following table ~hows the agricultural
implements in the district during the year 1972
and in 1977 Livestock Census.
Ag,ricultural Implements
SJ. Name of agricultural 1971 1977 No. implements
Plough 10,759 8,605 (1) Wooden 8,002 6,110 (2) Iron 2,757 2,595
2 Carts 3,986 3,511 3 Sugarcane Crushers 76 4 4 Oil Engines 1,310 681
" Electric Motors & Pump! 864 1,508 6 Tractors 181 313
It is seen that traditional implements like wooden ploughs and carts are main agricultural

implements. During the period 1972 to 1977 electric motors and pumps and tractors shows an increasing trend.
[5] Industries
The following table gives the details of important industries classified by major groups of industry during the year 1981.
Distribution of Important Industrial
Establishments by Major Industry Group
81. Major No. Group
32
2 28
3 40
4 97
5 31
6 22
Description No. of No. of cstabJish- persons
ment
Manufacture of 34
non-metallic mineral products
Manufacture of paper and paper products and printing, publishing and allied industries.
Manufacture of 2
electricity
Repair services 3
Manufacture of 1 chemical anq chemical products (except products of petrolium and coal
Manufacture of Cotton Textiles
employed
2,018
718
370
110
82
52
Establishment engaged in the manufacture of nOll metallic mineral product provided employment to a maj;)! portion of the industrial workers. The manufacture of paper and paper products and printing publishing and allied industries was another important industry providing employment to a large number of workers in the district. These two togather provided employment to 2,736 workers. The third important industry was manufacture of electricity which provides employment to 370 workers.
Durin:; the houselisting operations for the 1981 Census an Economic Census was also COll-
ducted in the year 1980 alongwith the houselisting opc;-atj,)ns. The Economic Census was conducted through the Bureau of Economics and Statistic,;:; at the State level and through the Central Statistical Organisation at the National level. The preliminary provi~iol1al result (If Economics Census 1980 have been published by the State Bureau. According to the provisio~al figures the total enterprises in Gandhinagar district are 6,301 out
of which 559 arc agricultural enterprises whereas 5,742 are non agricultural enterprises. The total number of persons actually working in these enterprises are 28,992 out of which 990 persons are working in agricultural enterprises. Further details of the Economic Census are yet to be worked out by the State Bureau.
During the 1981 Census out of total 84,711 workers 22.97 per cent were cultivators, 25.81 per cent were agricultural labourers, 2.15 per cent were in household industry and 49.07 per cent were other workers.
The District Industrial Centre was established at Gandhinagar on 2/10/78. This centre also provides term loans to new enterpreneurs and also provides working capital requirement of tbe industries for building up the infrastructure facilities and providing raw materials.
There were 16 small scale industrial units at the end of 1980. A large number of small scale industries in the year 1980 are pertaining to glass, quarry works and cement (8), metallic (7) ancI cotton industry (1)
There is one Industrial Es:ate managing by Gujarat Industrial Development Corporation in th:: distrk~ at the end of the year 1980.
[6] Trade and Commerce
There were 14 joint stock companies in the district as on 31/3/80 with authorised capital of 1,667 lakh and paid up capital 202.62 lakll. In the year 1979 there were 27 commercial scheduled bank offices at 19 places in the district whereas there were 14 co-operative banks at 19 places.
[7] Power Supply
The Gujarat Electricity Board is the chief source of electric power in the district. The use of electricity has increased rapidly during the last decade.
During 1971 CeilSus 61 villages were shown as electrified. W~thin a period of ten years the number of villages electrified have arisen to 75 which roughly works out at 100 per cent of the to~al inhabited villages of the district.
[8J Transpurt and Communication
(a) Roads
In the year 1971-72 the total road milkagc was J 38 kms_ which increased to 295 kms. in
G-2 (ix)

the year 1980-81. The respective kms. for 1971-72, 1975-76 and 1980-81 are as under;
Roads (in kIllS.)
National State District Other Village Total SI. High- High- Major Roads Roads No. Year way way Roads
1 1971-72 28 34 68 8 138 2 1975-76 53 :R 99 62 :!52 3 1980-81 44 16 46 114 75 295
It would be observed from the above that there is a improvement in the net work of roads in the district.
( b) Railways
There arc 38 kIllS. of railways in the district and the number of railway stations are 10:
(cd Post alld Telegraph
In Gandhinagar district, the villages with post and phone facilities are 47 and 26 respectively.
(d) State Road Transport
Out of 75 inhabited villages,' 66 villages are connected by State Road Transport buses.
[9J P,rices
The retail prices per kilogram of some of the important commodities during the month of
January 1979 and January 1981 are as foUows : Retail Prices per kg.
Sl. Commodity No.
Rice--Finc 2 Rice-Medium 3 Rice Coarse 4 Wheat-Medium 5 Whoat-Coarsc 6 lowar 7 Bajri 8 Gram Dal 9 Tur DaI
10 Groundnut Oil ] 1 Gur 12 Sugar
Jan. 1979
2.75 2.25 : .. 05 2.00
1.20 1.25 2.80 4.70 7.20 2.10 2.15
(in Rs.) Jan. 1981
3.50 3.00 2.60 2.00 2.C:: 1.70 1.75 5.60 5.55
12.20 4.75 7.20
[10 J Education
Education plays an important role in the National DeVelopment Programme. Primary edu-
- cation is compulsory both for boys and girls in the age group 6-11 Years. The State Government has been making all efforts to provide at least one primary school in each village of .the State so that this basic necessity can be within the reach of every rural citizen. After the formation of District Panchayats in Gujarat. the function of primary education has been transferred to the district panchayats in the rural areas, whereas in urban areas, the same is under munidpalities.
Education facilities in the district for the year ]971-72, 1975-76 and 1979-80 are as under:
Education Facilities
51. Education No.
Primary Institutions Education Pupils
Teachers
2 Secondary Institutions Education Pupils
Teachers
3 Higher Institutions Education Pupils
Teachers
1971-72
116
28,018
843
26
5,5%
231
2
565
77
[U] Medical and Public Health
1975-76
115
32,949
943
32
9,492
318
2
1,073
77
(aJ Medical institutiolls in Rural Areas
1979-80
131
43,671
1,030
35
8,757
233
3
810
89
There are 4 hospitals, ] 2 dispensaries, 27 family planning centres, :2 primary health centres, 25 primary health sub-centres, 13 maternity and child welfare centres and 59 community health workers in the district.
(b) Medi'Cal institutiolls ill Urball Arcos
There is a civil hospital, dispensaries. T. B. centre, nursing home and family planning I:cntre in Gandhinagar township.
VI Bt'ief discnption of places of ,religi,on, historical or archaeological imporilance and places of tourist interest in the villages/towns of the district
S1. Name of L. C. Name of Details of religion, historical or archaeological interest No. Taluka No. Town/Villagc
1 3 4
Gandhinagar Gandhinagar
(x)
Thc township was named Gandhinagar after 1'.fahatma Gandhi the father of the Nation. The capital of the State was shifted to Cjandhinagar in 1970. The ri vcr Sabarrnati pass near the Gandhinagar.

2 3 4 S -------- --------_._--
Gandhinagar :! Rupal
3 Gandhinagar 8 Jakhora 4 Gandhinagar 14 Jalund 5 Gandhinagar 43 Adalaj 6 Gandhinagar 70 Chandkheda
VII. Brief analysis of the Village and Town Directory and Primary Census Abstract data
based on inset tables
NOTE ON V] LLAGE DIRECTORY
The different types of amenities available -at the village level in the district have been tabulated in the form of Village Directory. The statement shows the different types of amenities and landuse in each village in the district. At the end of the Village Directory a taluka abstract of all the amenities has been prepared and printed as Appendix-I. In Gandhinagar district there is only one taluka. There are 75 villages in the district and all the villages are inhabited. It can be seen from the Appendix-I that out of 75 inhabited villages 74 viUages have primary school facilities a.nd only one village is without primary education
facilities.
In the district 12 viilages have dispensaries, 4 villages have hospitals whereas 8 villages have maternity and child welfare centres, 2 villages have primary health centres, 27 villages have family planning centres, 25 villages have primary health .,ub-<::entres. There are 42 villages having community health workers.
As regards drinking water wells and taps are
Old temple of Varadayani l\1ata and big fair is held on Aswin Sud-9.
Nilkanth Mahadev Vayinatha Temple Famous Step-well Artistic Glass Temple
the main sources of the drinking water facility. There are 70 villages which have wells. 58 villages have taps and 42 villages have tubewells. All the villages have drinking water facility.
As regards post and telegraph facilities 27 viHages have only post office, 20 villages have post office and phone. 6 villages have post, telegraph and phone facilities.
As regards communication out of 75 viHages. 66 villages have facility of a bus stop. There arc 9 railway stations in the district.
As regards the electric power supply, all the villages of the district have electric power supply either for domestic or af!ricultural or industrial purposes.
On the basis of the amenities noted in the Village Directory a brief analysis of the different amenities has been made which is as follows:
Amenities in villages
The Table No. ] shows the distribution of villages according to the availability of different amenities.
All the villages in the district have drinking water facility either by well or tank or tubewell or hand-pump. river e:c. In the district 98.67
TABLE 1
Distribul'ion of villages according to tlhe avaiJability of different amt!nities
S1. Name of No. of No. Taluka inha-
bited vill- Education Medical ages
1 2 3 4 5 Gandhinagar 75 74 (98.67) 40 (53.33)
Total 75 74 (98.67) 40 (53.33)
per cent of the total villages have the facilities of primary education.
The medical amenities are available 111 the 53.33 per cent of the total Villages. It is also observed from the statement that 70.67 per cent villages of the district have the facility of post and telegraph.
No. (with percentage) of villages having one or more of the following amenities
Drinking Post Mar-- Corn- Approach Power Water and ket/ muni- by Pucca Supply
Tele- Hat cation Road graph
6 7 8 9 10 11 75 (100.00) 53 (70.67) 66 (88.00) 58 (77.33) 75 (100.00)
75 (100.0e) 53 (70.67) 66 (88.00) 58 (77.33) 7S (100.00)
The communication facility by way of bus or tratn are available in 88 per cent of total villages of the district. Out of tO'tal villages of the district 77.33 per cent villages have pucca road approaches.
All the villages in the district have the facility of electric power supply.
(xi)

Proportion of ruml population served by different amenities
~ht' Table No. :2 show~; the proporlion of rural population scrved by different amenities
TABLE 2
SI. Name of
No. Taluka
Total Propnmon of mfal popu~a1jO:l ~':;ncc by the different amenities
Proportion of rural population served by the amenities of population - _- ------... -------- -.--.. _._.- ---- --_ -_-_._-- - _------
of inhabited Education Medical Drinking Post Marketl Com- Approach Power Supply villages in Water and Hat munica byPucca
the taluka 2 3 4 5
Ci:lr;dhillag;"--lr 126,645 226,599 174,299 (99.98) (76.90)
Total 226,645 226,599 174,299 (99.98) (76.90)
It wm b:: seen from the figures that 99.98 per cent of the total rural population of the district lS covered by primary education facility.
As regards medical facilities the rural popUlation coverage is 76.90 per cent. The rural popUlation is fully covered by drinking water facility.
The coverage of rural popUlation in respect of post and telegraph facility is 90.14 per cent and the same for communication it is 96.89 per cent. The position of approaches to the village by pucca road is quite satisfactory and 88.95 per cent of the rural population is covered by pucca approach road to their villages. The rural popUlation is fully covered by facility of electricity.
Distribution of villages not baving certain amcntitlcs
arranged by distance ranges from the places where these are available
The Table No, :I shows the distribution of villages not having ~ertain amenities arranged by
distance ranges from the places where these are available.
TABLE 3
Distribution of villages not having certain amenities arranged hy distance ranges from
tbe places where these are available
SI. Villages not -Number of ~viljages -where-the-amenity is not available and available at distance of
No. having the amenity of
1 2 1 Education 2 Medical 3 Drinking 4 Post and Telegraph 5 Market/Hat 6 Communication
-5 Kms. 5-10 10+ Total Kms. Kms. (Co]s. 3-5)
3 4 S 6
27 7 35
19 3 22
11 20 44 75 9 <)
(xii)
Telegraph tion Road
6 7 8 9 10 11
226,645 204,298 219,604 201,599 226,645
(iOO.OO) (90.14) (98.89) (88.95) (100.00)
226,645 204,298 219,604 201,599 226,645
(100.00) (90.14) (98.89) (88.95) (100.00)
]I ''Vi11 he observed from 'he abo\'e tab k that
only one village is without primary education facility. the same is available at a distance of Ie,:; than 5 kms.
Out of 75 villages 35 villages of the district have no medical facilities, 34 villages have the same available at a distance of less than 10 kms. whereas in one village the same is available at a distance of more than 10 kms. from the village. In respect of post and telegraph facility 22 villages have no such facilities and in 19 villages the same is available at a distance of less than 5 kms. from the village, whereas in 3 villages the same is available at a distance range of 5-10 kms from the village.
As regards market/hat facility, out of 75 villages. 31 villages have this facility available at a distance of less than 10 kms. from the village and in 44 villages the same is available at a distance of more than 10 kmlO.
In respect of communication facility 9 villages are without ~uch facility aDd such a facility is available at a distance of less than 5 kms. from the village.
There are 13 villages in the district which are in the range of 0.5 kms. from the nearest town, except medical facilities, the other facilities are quite satisfactory. There are 46 villages in the distance range of 6-15' kms. from the nearest town. These villages arc fu Ily cove;-ed with the facility of primary education, drinking water and power supply_ The other facilities are quite satisfactory except medical facilities. There are 16 villages at a distance range of 16-50 kms. ;rom the nca:'cst town. These villages are fully covered with the facility of primary education. drinking water and power supply. The other facilities are quite satisfactory.

Distribution of Villages according to the distance from the nearest town and availability of different
amenities
The Table No. 4 shows the distribution vf villages according ,to the distance from the nearest town and availability of different amenities.
TABLE 4
Distribution of viDages according to the distance from the nearest town and availability of different amenities
S1. range from inhabiter No. (with perctntage) of villages having the amenity of
Distance No. of ------ --~-------.-.------------------~----
No. the nearest villages Education Medical Drinking Post and Market/ Commu- Approach Power Supply town in each
(in kms.) range 2 3 4 5
1 O-S 13 12 (92.31) 6 (46.15)
2 6-15 46 46 (100.00) 24 (52.17)
3 16--S0 \(l 16 (100.CO) 10 (62.50)
4 51 and above 5 Unspeciafied .. '; • I
Total 75 74 (98.67) 40 (53.33)
Distribution of villages according to population range imd amenities available
13 46 16
I •
75
Water Telegraph Hat nication byPucca Road
6 7 8 'J 10 11
(100.00) 9 (69.23) 10 (76.92) 10 (76.92) 13 (lW.OD)
(100.00) 32 (69.57) 41 (89.13) 35 (76.09) 46 (100.00)
(100.00) 12 05.00) 15 (93.75) 13 (81.25) 16 (100.00) . . .. • • I ~
(lOOJ)O) 53 (70.67) 66 (88.00) 58 (77.33) 75 (100.00)
The Table No. 5 shows the distribution of villages according to population range and amenities available.
TABLE 5
Distribu:ion of villages according to population rang~ and amenides available
Sl. Population No. range
No. of No. (with percentage) of village;, having the amenity ,)f inhabited -.--.-------.-----~-.--.---.------- --.--- ------- --------
villages in Education Medical Drinking Post Mar- Com- Approach Power each Water amI ket/ muni- by Puce;! Supply range Tele- Hat cation Road
graph 2 .< 4 5 6 7 8 9 10 11
(\ 5 (3.33) (16.67) 6 (100.00) 1 (16.67) 3 (50.00) 6 (100.00) 29 29 (100.00) 9 (31.03) 29 (100.00) 15 (51.72) 25 (86.21) 18 (62.07) 29 (100.00)
Upto 499 2 500-1,999 3 2,000-4.<)99 26 26 (100.00) 16 (61.54) 62 (100.00) 24 (92.31) 26 (100.00) 24 (92.31) 26 (100.00) 4 5,000 and Above 14 14 (100.00) 14 (100.00) 14 (100.00) 14 (100.00) 14 (100.00) 13 (92.86) 14 (100.00)
Total 75 74 (98.67) 40 (53.33) 75 (100.00) 53 (70.67) 66 (88.00) 58 (77.33) 75 (10000)
It will be seen from the table that therc are 6 villages in the range of below 500 popUlation.
There is an increasing trend in thc availability of facilities with the increase in popUlation. The villages with more than 5.000 population are fully covered with primary education, medical, drinking water, post and telegraph, communication and pJwer supply.
. Staple food The Table No.6 shows the main stapk food
in the majority of the villages in the district.
TABLE 6 Main s.taple food in the majority of
villages in each taIuka Sl. Name of No. Taluka 1 2
Main staple food
3 Gandhinagar Bajri, Jo\"ar, Wheat, Rice
Bajri, Wheat and Rice are the main staple food of the most of tlle villages.
Land-use Pattern
The Table No. 7 shows the distribution of villages according to their land-use.
TABLE 7
Distribution of villages according to land-use S1. Name of Taluka No. of Total area Percentage of cultivable Percentage of irrigatted No. inhabited area to total area area to total cultivable
villages area 2 3 ' 4 5 6
Gandhinagar 75 59,468.19 54,995.46 (92.48) 22,890.00 (41.62) Total 75 59,468.19 54,995.46 (92.48) 21,890.00 (41.62)
(xiii)
The cultivable area to the total rural area
is 92 . .48 per cent and irrigated area to the total cultivable area is 41.62 percent.
NOTE ON TOWN DlRECfORY
The list of urban areas for the purpose of 1981 Census wa:; finalised in consultation with the State Government. The following criteria were applied for the purpose of determining any area
as an urban area :
(a) An places with a Municipality, Municipal Corporation or Cantonment
Board or Notified Town Area.
( b) AU other places which ~p:cified : he ' following criteria:
(i) A minimum population of 5,000,
(ii) Atleast 75 per cent of the male working population engaged in non-agricultural (and allied) acti
vity,
( iii) A population of atleast 400 persons per sq.' km. or a population of 1,000 persons per sq. mile,
The Town Directory bas been compiled In
seven statements given in the Section-II
for all the urban areas' of district. For presentation of the data, ,fhe towns of the district have been arranged in alphabetical order. The details of the data covered in these state
ments are as follow :
Note on StalJemt'nt-I
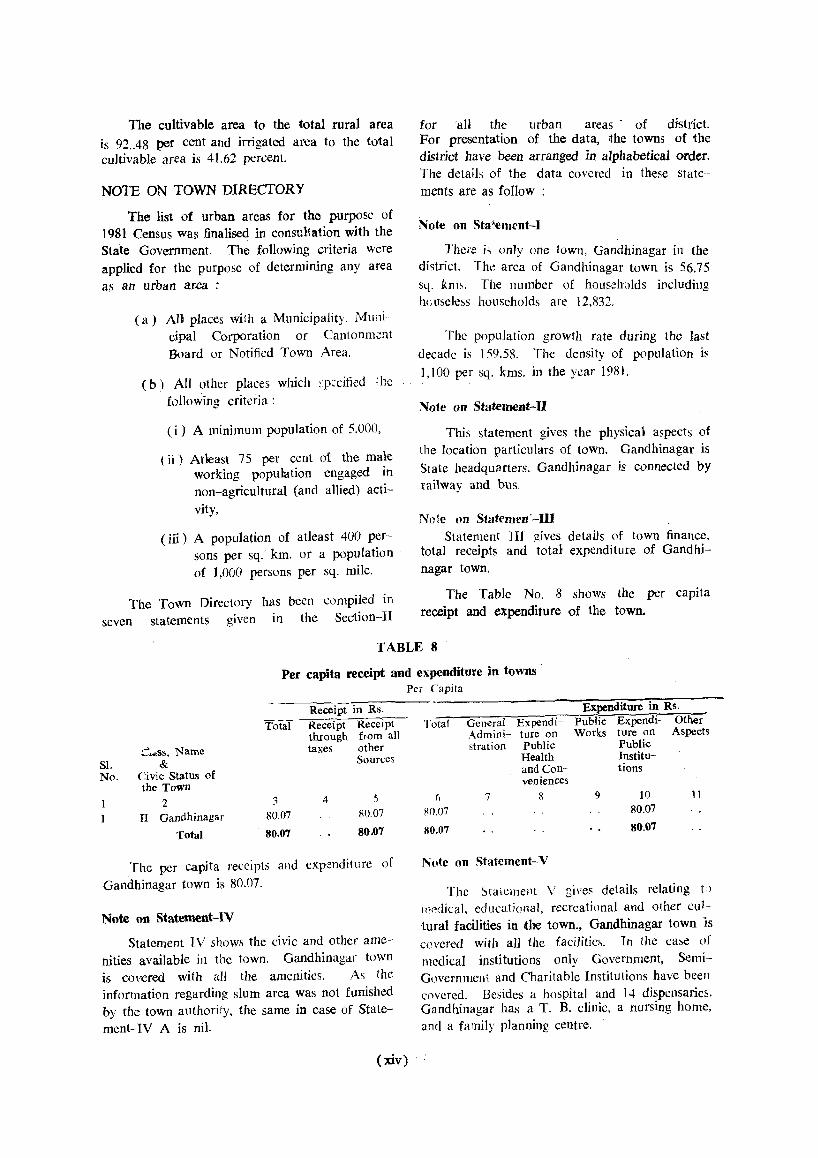
There i, only one town, Galldhinagar in the di~trict. Th\~ area of Gandhinagar town is 56.75 s4. knl~. The number of housch::)lds including he useless households are 12,832.
The popUlation growth rate during the last decade is 159.58. The density of population IS
1, too per sq. kms. in the year 1981.
Note on Statement-U
This statement gives the physical aspects of the location particulars of town. Gandhinagar is
State headquarters. Gandhinagar is connected by railway and bus,
Note on Stat{'men'~I1I Statement III gives details of town finance,
total receipts and total expenditure of Gandhi~
nagar :town.
The Table No. 8 shows the per capita
receipt and expenditure of the town.
TABLE 8
Per capita receipt and expenditure in towns .
S1. No,
C.&.::.ss, Name &
Civic Status of the Town
2 II Gandhinagar
Total
Total
3 80.07
80.07
Receipt in Rs. Receipt Receipt through from all taxes other
4
Sources
80,07
80.07
The per capita reccipts and expenditure of
Gandhinagar town is 80.07.
Note on Statement-IV
Statement IV shows the civic and other amenities available in the town. Gandhinagar town is covered wi1h all the amcnities. As the information regarding slum area was not funished by the town authori1ty. the same in case of State
ment-IV A is nil.
Per Capita
Total
()
80,07
80.07
General ExpendiAdmini- ture on stration Public
Health and Conveniences
7 8
Note on Statcment-V
Expenditure in Rs. Public Expendi- Other Works ture on Aspects
9
Public Institu-tions
10 80,07
80.07
11
The ~taiClJlent V gives details relating ti)
medical, educational, recreational and other cultural facilities in the town., Gandhinagar town is covered with all the facilities. In the case of medical institutions only Government, SemiGovernI11CIH and Charitable Institutions have been covered. Besides a hospital and 14 dispensaries. Gandhinagar has a T. B. clinic, a nursing home, and a family planning centre.
(xiv)

The Table No. 9 shows the total number of beds in medical institutions per 1,000 population in Gandhinagar town.
TABLE 9
No. of beds in medical institufons in towns
SI. Class, Name and Civic No. Status of the Town
II Gandhinagar (NA)
Total
No. of Beds in Medical Institutions per 1,000
population 3
1.60
1.60
Gandhinagar town has 1.60 beds per 1,000 popUlation.
In respect of educational facilities Gandhinagar has an Arts and Commerce College and a Science College. There are 4 higher secondary, 6 secondary and 29 primary schools in Gandhinagar. There is no adult literacy centre in Gandhinagar.
As regards Medical and Engineering College and Polytechnics such facilities are not available in Gandhinagar. All the three facilities are available, at a distance of 35 kms. in Ahmadabad.
The Table No. 10 shows the number of different categories of schools per 10,000 population in town of the district.
TABLE 10 Schools per tcn toousand popUlation in towns
Higher Secondary' Secondary! Inter/PUC/Junior College Matriculation
SI. Class, Name and Civic Junior Secondary! Primary No. Status or Town 1 2 3 4
Middle 5 6
4.644 4.644
II Gandhinagar (NA) Total
0.641 &.641
Note In Gujarat State the level of Education are classified as under :
( i) Primary (From Std. 1 to VII passed)
( ji) Secondary fMatricukation (From Std. VIli to X passed)
( iii) Higher Secondary (From Std. Xl to XII passed.
I fence the details order col. 5 are not shown.
The number of higher seci.1l1dary/intermediate/juni~w college, secondary/matriculation and primary ~cho()ls per 10,000 population for Gandhinagar town "is 0.641. 0.961 and 4.644 respectively.
Gandhinagar ha~ facilities for recugnised shorthand! typewriting/vocational training institu-
0.961 0.961
tions. The number of such institutions is 10 in Gandhinagar town. There is only one cinema house, two auditoria/drama/community halls, two stadiam and one public library in Gandhinagar.
No'~e on Statement-V]
Statement VI shows the details regarding trade, commerce, indmtry and banking in 1 he
town. It can be seen from the statement that
Gandhinagar is importing food-grains, medicines and edible oil.
The Table No. 11 shows the details of the importal1t commodities manufactured. imported and exported in Gandhinagar town of the district.
TABLE 11 Most important commodity manufactured,
SI. Class, Name and Civic No. Statu, of the Town 1 2 1 II Gandhinagar (NA)
Man ufactured 3
Gandhinagar is. mainly importing foodgrains.
There are twelve banks in Gandhinagar.
NOTE ON PR1MARY CENSUS ABSTRACr
The district Primary Census Abstract of Gandhinagar district showing talukawise totals, rural and urban population is included in part B of the volume. The district Primary Census
(xv)
imported and exported in towns Most Important Commodity --- -E.\ported - --_-- -
4 Imported
5 Foodgrains
Abstract is followed by tahIka Primary Census Abstract.
This part also ,ontains the district Primary Census Abstract for Scheduled Castes/Scheduled Tribes population followed by TalukaiCitywise Primary Census Abstract of Scheduled Castes/ Scheduled Tribes population.
A brief analysis of the Primary Census Abstract is as follow :

Population, number of villages and number of towns-1981, in the district
The Table No. 12 shows the population. number of villages and number of t(lWllS within taluka of the district.
fABLE 12. Population, number of villages and tow~ 1981
POPULATION S1. Name of Total
Rural----------------- Urbiiil"-- No. of villages No. of -----------No. Taluka
p M F P ~1
2 .3 4 5 6 7
Gandhinagar 289,088 150,194 138,89~ :::::6,645 116,575
Taluka Total 289,088 150,194 138,894 226,645 116,575
The tolal population of Gandhinagar district is 289,088 during the 1981 Census which is 0.85 per cent of the total State popUlation. The rural popUlation is 0.97 per cent of total rural popu1a--
tion of the State and urban population is O.~;9
per cent of total urban population of the Stale.
The district ranks 18th in popUlation out of total 19 dist~icts of the State. All the vi1l~~ of the district are inhabited villages. There is one
Total Inhabited Towns l~ P 1\1 F l' 9 10 11 12 13 14
llC,070 62,443 33,619 28,824 7S 7S I
110,070 62,443 33,619 28,814 75 75 1
lown and one taluka in the district. The proporlion of urban population in the district to the district popUlation is 21.60 per cent.
Decadal change in distributlion of po.pulation in the district
The Table No. 13 shows the talukmvis.e details regarding the decadal change in the population during the last decade of 1971-]981.
TABLE 13 Decadal change in distribution of population
Sl. Population Percentage decadal (1971-81) variation No. Taluka 1971 1981
-- _"----_._._-_-* --
2 Gandhinagar Taluka
Total
Tot<d 3
200,642 100,641
Rural Urban 4 5
176,5~7 24,055
176,587' 14,055
The decadal growth rate of population in the distriot is 44.08 per cent. In respect of urban areas and rural areas the population growth rate is 159.58 and 28.35 per cent respectively.
Distribution of viJlages by population ranges
The details of distribution of villages by
population ranges are given in the Table No. l .. l.
TABLE 14
Distribution of villages by population ranges SJ. Range of No. population
2 I Less than 200 2 200-- 499 3 500--1,999 4 2,000---4,999 5 5,000--9,999 6 10,000 and above
No. of villages in each range
3
.5 29 26 12
Percentage of villages in each range
4 1.33 6.67
38.66 34.(\7
16.00 2 2.67
Total 75 100.00
. Out of total :'illages 73·33 per cent village~ are In the populatIOn range of 500-4,999. There are only two villages in the popUlation range of 10,000 and above.
( xvi)
Total Rural Urban Total Rural Urban 6 -; 8 9 10 11
289,088 226,645 62,443 +4408 ';-28.35 -+ 159.58 289,088 226,645 62,443 +44.08 +28.35 +159.58
Density of popUlation The Table No. J 5 shows th~ distribution of
vJ;lages by density of popUlation.
TABLE 15 Distribution of villages by density
51. Range of density No. (per sq. km.)
2 !..ess than 10
2 11- 20 3 21- 50 4 51-100 5 Wi-20U h 201-30() I 301-500 t\ ~Ol and above 9 Not Known
Total
Total No. of Percentage of villages in :each villages in each density range density range
3 4
3 9
29 I:.'.
... .. it ".
4.00 12.00 29.33
38.67 16.00
75 100.00 The density range of 201-500 person~ p::r
~q. km. covers the 68 per rent of the total villages. There are 12 villages which have a high density r<lnge of 5111 or more persons per sq. km .
Proportion of Scheduled Castes and Scheduled Tribes popUlation to to~al population in the )illages and towns

The total Scheduled Castes population of the district is 21,199.which.is O~87 per cent of the total
-S,sheduh:d Castes population of the State. whereas the total Scheduled Tribes population of the district is 1,672 which is 0.03 per cent of the Scheduled Tribes population of the state. The Scheduled· Castes pOpnlation· of the district is 7.33 per
. cent of the total district population whereas the Scheduled Tribes population is 0.58 per cent of the· total' district population.
The Table No. 16 gives the proportion of Scheduled Castes popUlation to the total population in the Villages.
TABLE 16 .!. c Prop~rti~n .. (lf Scheduled Castes population
to tofal population in the. villages 81. Percentage range No. of villages Pe.rcentage of No. of Scheduled . in each range villages in
Castes population each range to total population 234
Nil 10 13.33 2 5 .or less. 3 6 - 10 4 11 - 15 5 16 ~ 20
6 if - 30 7 31 ~nd above·
32 28
-+ .. .
.
42.67 37.33 5.34
! •
1.33
1 ~
Total 75 100.00 There are 10 villages in the district which
". have no Scheduled Castes population. In the 80
per cent of the total villages of the district il:he propofltion of Scheduled Castcs population is up-
to 10 per cent to the total population of the village. One village have proportion of Scheduled Castes population to the total population in the range of 21-30 per cent.
The Table No. 17 shows the proportion of Scheduled Tribes population to the total population of the villages .
SI.
TABLE 17 Propmuon of Scheduled Tribes population
to total populaaon in tlhe villages Percentage range No. of villages Percentage of
No. of Scheduled in each range villages in Tribes population to total population
each range
1 2 3 4 1 Nil 56 74.67 2 5 or less 19 25.33 3 6 ~ IS . ~ .. 4 16 - 2S ~ . 5 26 -35 ; . -.: ~
6 36 - 50 .. 7 51 and above ....
Total 75 100.00
Out of total vilJages in the district 74.67 per cent villages have no Scheduled Tribes population. The remaining villages have proportion of Scheduled Tribes population to the total population of village in the range of upto 5 per cent or less.
The Table No. 18 shows the proportion of Scheduled Castes and Scheduled Tribes population in the town of the district.
TABLE 18
Proporiton of Scheduled Castes/Scheduled Tribes population in towns S1. Name of No. the town
t 2 I Gandhinagar
Total
Total population
3 62,443
'2,443
Total Scheduled Castes population
4 7,893
7,893
The propOrtion of Scheduled Castes and Scheduled Tribes population to the total population in the Gandbinagar town is 12.64 and 2.00 per' cent respectively. Literacy rates in villages and towns
The total literacy rate in the district was 4'LSO . per cent in 1971 Census which has increased to 51.48 per cent during the 1981 Cen&us. This is
. 'hb;her than the State· avarage of 43.70 per cent . The d,istrict ranks second in literacy rate. in the
State during 1981 Census. The .percentage. of male literacy is 63.17 per cent whereas the percentage of female literacy is 38.84 per cent which are both higher than the Slate average literacy rate ·of 54.44 percent and 32.30 percent respectively.
Total Percentage of Percentage of Scheduled Scheduled Castes Scheduted Tribes Tribes population to population to population total population total population
5 6 7 1,250 12.64 2.00
1,250 12.64 2.00
The Table No. 19 shows the literacy rates of
the different population ranges of the villages of the district.
TABLE 19
Literacy rates by population ranges of villages
SI . Range of popu- No. of villages Literacy rate No. lation in each range 1 2 3 4 1 Less than 200 67.39
2 200 - 499 5 36.24 j 500 - 1,999 29 45.45
4 2,000 :__ 4,999 26 45.05
5 5,000 - 9,999 12 . 48.39
6 -lO,OOO and above 2 54.97
Total 75 . 47~25
(xvii.) G-3

There is one village in the population range upto 200 and two villages in the {Xlpulation range of 10,000 and more which have literacy rate above the district literacy rate 51.48 whereas other villages have literacy rate below the district literacy rate.
literacy rate of town
The Table No. 20 shows the literacy rate of the town of the district. The literacy rate of Gandhinagar town is 66.86.
TABLE 20 Literacy rates for to'Wll
S1. Name of the town Literacy rate No. 1 2 3 I Gandhinagar 66.86
T~l ~M
Scheduled Castes and Sc:hedultd TnDes population, literates, workers and DOll-WOrkers in the district
The Table No. 21 shows tbe Scheduled Castes/ Scheduled Tribes population, literates, workers and non-workers in the taluka of the district as recorded during Hle 1981 Census.
TABLE 21 Uterates, workers and non-workers Scheduled Castfsfhibes population, in the pet'Celltage of district
Total Total Popu'lation Scheduled --- Scheduled Sl. Name of Taluka Rural Castes Tribes Literacy to No. Urban Persons Males Females population population total population
to total to total population population P M F
1 2 3 4 5 6 7 8 9 10 11 I Gandhinagar Total 289,088 150,194 138,894 7.33 0.58 51.48 63.17 38.84
Taluka Rural 226,645 116,575 HOmO 5.87 0.19 47.25 60.09 33.65 Urban 62,443 33,619 28,824 12.64 2.00 66.86 73.88 58.68
Gandbioagar Total 289,088 150,194 138,894 ~.33 0.58 51.48 63.17 31.14 District Roral 1%6,645 116,575 110,076 5.87 0.19 47.2.5 69.09 33..65
Urbao 62,443 33,619 18,824 n.64 2.00 66.86 73.88 53.68
.Percentar e o f
Main Workers to Marginal Workers Total Worker s to total popula tion
Non-workers to Total Name of 51. total population to total population total population Rural Talun No.
Urban -- .... ---~ ..•. ~. P M F P M F P M F
12 13 14 15 16 17 29.30 49.24 7.74 1.95 0.60 3.40 29.68 50.20 7.94 2.37 0.70 4.15 27.94 45.92 6.98 0.38 0.25 0.52
29.30 49.24 7.74 1.95 OM 3.40 19.68 50.10 ...... 7.94 2.37 0.70 4.15 27.94 45,91 6.918 0..38 0.25 0.51
Scheduled Castes/Scheduled Tribes
P M 18 19
31.25 49.84 32.05 50.90 28.32 46.17
31.25 49-84 31.05 50.90 18.32 46.17
popUlation
The total Scheduled Castes population of the district is 21,199 which is 0.87 per cent of the total Scheduled Castes population of the State whereas the total Scheduled Tribes population of the district is 1,672 which is 0.03 per cent of the total Scheduled Tribes popUlation of the State.
The Scheduled Castes population of the district is 7.33 per cent of the total district population whereas the Scheduled Tribes population is 0.58 per cent of the total district population. Lit«ates
The proportion of literate persons in the di~trict is 5l.48 per cent in the rural and in tbe urban population of the district the same is recorded as 47.25 and 66.48 percent respectively.
As regards the male and female literates the respective percentage are 60.09 and 33.65
F 20
11.14 21 22 23 3 2 1
12.09 7.50
11.14 12.09 7J50
68.75 67.95 71.66
68.75 67.95 71.68
50.16 49.10 53.83
50.16 49.10 S3Jl3
88.86 T Gandhinagar 87.91 R Talun 92.50 U
88.86 T Gandbioapr 87.91 R Di!llbid 9.1.58 U
per cent in rural areas and 73.88 and 58.68 per cent in urban area. Workers and NOR-workers
The percentage of male workers in the district is 49.24. In respect of urban area of the taluka tbe percentage of male main workers is 45.92 per cent. The respective per centage of female workers is 6.98 per cent. The number of total marginal workers in rurai areas in the district is high as compared to the figures of corresponding urban area.
The proportion of main workers and marginal workers to the total population is 29.30 and 1.95 per cent respectively.
It is also worth noting that percentage of main workers in respect of male and female workers are 49.24 and 7.74 correspondingly whereas quite rever~e trend is noticed in respect of marginal
1
(nru )

workers. where proportion Df male workers are
only 0.60 and female workers are 3.40. The percentage of total workers to total popu-
lation is 31.25 and the respective percentages in case of male and female worker, are 49.84 and 11.14 respectively.
Growth rate, density and sex ratio of urban
populatioo
The Table No. 22 shDws the growth rate, density and sex ratio of urban population in the district in relation to Ithe State.
TABLE 12 Growth, density and sex ratio of urban popula tion in the district in relation to the State
Gandhinagar District Gujarat State Total population
Urban % Urban Decadal Density Sex Total Urban % Urban De- Den- Sex popu- popula- percen- (popu- ratio popula- popu- popula- cadal sity ratio lation lation tage lation (No. of tion lation tion per- (po- (No. of
varia- per females cen- l?ula- females SI. Census No. year ion in sq. per 1,000 tage hon per
popu- km.) males) varia- per sq. 1,000 lation tion km.) males)
2 3 4 6 7 8 9 10 11 12 13 14
1951 2 1961
119,698 137,063
16,478 13.77 N.A. 985 16,262,657 4,427,896 27.23 20,633,350 5.316.624 25.77
N.A. 920 +20.07 2,799 896
3 1971 4 1981
200,642 289,088
24,055 62,443
11.99 424 21.60 +159.58 1,099
It is ob~crved from the table that the percentage of urban population to total population in Gandhinagar district is lower than the state average during all the four censuses. The urban population in the district which was 16,478 in 1951 census is now 62,443 in 1981 census.
The density of population in the urban area is 1,099 persons per sq. km. during the 1981 census. There is a decline trend in sex ratio in the district from 985 to 857 females per 1,000 males over the period of 1951 to 1981.
Proportions of slum populations in toWD5
Table No. 23 shows the proportion of slum population in towns.
TABLE 13 Proportions of slum plpulatiou in towns
Sl. Class, name and No. civic status
of the town
2 II Gandhinagar (NA)
Proportion of the slums population to total population of the town
3
.Density in slums (per sq. Jun.)
4 Not reported by Notified Area
Authority
858 857
26,697,475 7.4%,500 28.08 34,085.799 10.601,653 31.10
+41.42 2.225 905 -141.00 1.615 893
New towns addedf:towns declassified in 1981
Census
Table No. 24 given below gives the information of new towns added or towns declassified in 1981 Census.
TABLE 24
New towns added/towm dedassified in 1981 Census
S1. Name of town
No.
2
(a) Added --Nil--
(b) Declassified --Nil--
Population 1981 Census
3
• I
It can be seen from the table that there is no addition/deletion in total number of towns in the dis,trict during 1981 Census.
( xix)


~';-1
PART xm-A
VILLAGE AND TOWN
DffiECTORY
SECTION-I VILLAGE DIRECTORY

LIST OF ABBREVIATIONS USED IN THE VILLAGE DIRECTORY
Col. 5 - Educational
Primary or Elementary School 2 Junior Secondary or
Middle School 3 Matriculation or Secondary 4 Higher Secondary II ntermcdiate/
Pre-university/Junior College 5 College, Any College (Graduate
level and above) like Arts. Science, Commerce, ctc.
o Industrial School 7 Training School
~ Adult Literacy Cla~s/Centre
9 Other Educational Institutions
Col. 6 - Medica) Amenities
Hospital 2 Maternity and
Child Welfare Centre 3 Maternity Home 4 Child Welfare Centre 5 Health Centre 6 Primary HeaLh Centre 7 Primary H~aIth Sub-Centre 8 Dispensary 9 Family Planning Centre
lOT. B. Clinic 11 Nursing Home 12 Registered Private Practitioner 13 Subsidised Medical Practitioner 14 Community Health Worker 15 Others
Col. 7 - Drinking Water
Tap Water ') Well Water 3 Tank Water -l Tub~well Water
5 Handpump 6 River Water
7 Fountain 8 Canal
9 Lake 10 Spring 11 Nallah ]2 Others 13 Information Not A \ ailabl,:
P
M H
PUC
C I 'II'
AC
o
H
Mc\V
MH ewe HC PHe PHS o FPC TB NH RP SMP CHW o
T W Tk TW
Hp R F C
L 5 N o NA
2
Col. 8 -- Post and Telegraph
Post Office 2 T e1cgraph Office 3 Post and Telegraph Office 4 Telephone Connection
Col. 10 - COimnunications
Bm 2 Railway Station ~ Navigabk Waterway
Col. 11 - Approach to Village
Pucca Road 2 Kaccha Road ~ Navigable River .f Navigable Canal 5 Navigable Waterway
Col. 13 - Power Supply
Electricity for Domestic Purpose
2 Electricitv for Agriculture 3 Electricity for other purpose
like Industrial. Commercial, c~c_
4 Electricity for all purposes
Col. 16, 17 - Irrigated by Source and Uirrigatcd (Land use)
(JQvertJmcnt Canal 2 Private Canal 3 Well (without electricity)
4 Well (with electricity)
5 Tubewell (without electricity) 6 Tubcwell (wi<th electricity) 7 Tank 8 River
9 Lake
10 Waterfall
11 Others
12 Total
Col. 20
I Copies of Newspapers 2 Motorcycles/Scouters
available in village ~ Cars/Jeep~ available in the village 4 Tractors available in the village
PO TO PTO Phone
BS RS NW
PR KR NR NC NW
ED BAg
EO EA
GC PC
W
WE
TW
TWE Tk
R
L
Wf
o T
N
M C T

GUJARAT TALUKA GANDHINAGAR
DISTRICT GANDHINAGAR 2 o 2
2 o 2
o
s
DtSTRICT BOUNDARy ....
VILLAGE BOUNDARY WITH LOCATION
CODE NUMBER ...... .
CAPITAL OF THE STATE •
DISTRIC'" HEADQUAnERS ..
TALUKA HEADQUARTERS •..
VILLAGES WITH POPULATION SIZE
BELOW 200,200-499,500-999,
1000- 4999, 5000 AND ABOVE.,. - Po. ~r." URBAN AREA WITH LOCATION CODE. ;?!~V.('~ NATIONAL HIGHWAY. NH 8
STATE HIGHWAY . SH 68
\ c.
IMPORTANT
o ~ o II)
METALLED
~ c o ..
a.
ROAD.
RAILWAY LINE WITH STATION,
BROAD GAUGE.
RAILWAY LINE WITH STATION,
METRE
RIVER
POST
HIGHER
POLICE
GAUGE
OFFICE TELEGRAPH OFFicE
SECONDARY SCHOOL
STATION
HOSPITAL, PRIMARy HEALTH
CENTRE. DISPENSARY. MATERNITY
CHILD WELFARE CENTRE
MANDI .......... '
o
RS _liiil_ RS
11111"'11111
:~ PO / PTO
S PS
TALUKA
GANDHINAGAR


ALPHABETIC LIST OF VILLAGES 1. GANDWNAGAR TALUKA
Page No. Paa. No.
Part A Part B Part A Part B
S1. Name of Location Village Primary 51. Name of Location Village Primary
No. Village Code No. Directory Census No. Village Code No. Directory Census
Abstract Abstract
2 3 4 5 2 3 4 5
Adalai 43 10 16 38 Motera 71 12 18
2 Adrai Moti 15 6 14 39 Nabhoi 60 12 16 3 Alampur 25 8 14 4 Ambapur 55 12 16 40 Palai 32 8 16
5 Amiyapur 58 12 16 41 Pethapur 17 8 14
42 Pindharada 5 6 14 6 Basan 37 10 l' 43 Piplai 11 6 14 7 Rhat 69 12 16 44 Pirojpur 52 10 16 8 Bhoyan Rathod 28 8 16 45 Por 44 10 16 9 Bhundia 19 8 14 46 Prantiya 36 8 16
10 Chandkheda 70 12 16 47 Pundarasan 26 8 16
11 Chekhalarani 7 6 14 48 Raipur 75 14 18
12 Chhala 9 6 14 49 Rajpur 6 6 14
13 Chiloda 33 8 16 50 RanasanV'" 74 14 111
14 Chiloda (Naroda) 73 12 18 51 Randesan 46 10 16
15 Dabhoda 50 10 16 52 Randheja 12 6 14
16 Dantali 41 10 16 53 Ratanpur 48 10 16
17 Dashela 20 8 14 54 Raysan 53 10 16
18 Dhanap 21 8 14 55 Rupal 2 6 14
19 Dolarana Vasana 10 6 14 56 Sardhav 1 6 14
20 Galudan 64 12 16 57 Sargasan 39 10 16
21 Giyad 22 8 14 58 Shahpur 47 10 16
59 Shertha 29 8 16
22 Isanpur Mota 34 8 16 60 Shiholi Moti 24 8 14
23 lakhora 8 6 14 61 Sonarda 65 12 16
24 Jalund 14 6 14 62 Sonipur 13 6 14
25 Jamiyatpur 42 10 16 63 Sugad 59 12 16
26 Karai 61 12 16 64 Tara pur 40 10 16
Khorai 56 12 16 65 Titoda 27 8 16 27 28 Koba 54 12 16 66 Unava 4 6 14
29 Kolavada 16 6 14 67 Unvarsad 30 8 16
30 Koteshwar 72 12 18
31 Kundasan 45 10 16 68 Vadodara 51 10 16
69 Valad 62 12 16
32 Lavarpur 49 10 16 70 Vankanerda 63 12 16
33 Lekawada 18 8 14 71 Vasan 3 6 14
34 Limbadia 68 12 16 n Vasana-Hadmatia 38 10 16
73 Vavol 31 8 16 35 Magadi 35 8 16 66 12 16 36 Mahudara 23 8 14 74 Viratalavdi
37 Medra 67 12 16 75 Zundal 57 12 16
5

TALUKA : GANDHINAGAR VILLAGE
Loca- ~ame of ti on village Code No.
Total area of the village (in hectares)
Total popula
tilln and number of households
~nities and
Amcnitic, available (if not available within the village, a dash (-) is shown in the Column and ne),t to it in the brackch. the distance in broad ranges yiz., -5 km,. 5--10 kIT". and J(};- km\ of the nearest place where the facility is available is given)
Educa-=--Medical Drinking Post and Day:----Comrnu-::'--tional water Telcgr<ll'h nf picatio'l APPIT
(potable) days (Bus-stop, ach of railway to market! station, village hat, if water-
------------- any way)~ __ . ____ _
2
Sardhav
2 Rupal
3 Vasan
4 Unava
5 Pindharada
6 Rajpur
7 Chekhalarani
8 lakhora
9 Chhala
10 Dolarana Vasana
11 l'iplaj
12 Randheja
13 Sonipur
14 Jalund
15 Adraj Moti
16 Kolavada
3 4 5 6 7 8 9 10 11
1.161,07
1.722.85
804.36
1,407.32
7,216 (l,437)
5,980 (l,150)
2,390 (431)
6,413 (1,206)
P(2), H(2) H, MH, PUC, AC(4) PHS, D,
to PC LH~V(~), a
P(2), H, MH, CWC, PUC, AC(6) PHS, D,
FPC, RP(4)
P, AC(4)
1'(2), H, AC(4)
CHW(5)
(--5 kms)
MCW, MH, CWC, PHS, D, FPC, NH, RP, SMP, CHW
T W. TW PTa. Phone -(lO+kms)
..__ T, W. Tk po. Phone -(5-10kms) TW
T, W, Tk PO, -(lO":-kms) TW
T. W, TW PTa, Phone --(Woe km"J
596.13 1.167 P ('-10 l-.I11S) T, W, Tk PO TW, R
-(IO-i-kms) (236)
BS PR.KR
BS PR
BS PR.KR
nS,RS PR
BS PR
261.08 241 " (40)
I'! '''. J }'( \\' R -(-5 km,) -(lO-;-kms) -(-5 kms) KR
325.78 626 P (120)
598.38 2,406 P (455)
2,168.93 5,115 P, H (987) AC(3)
1,075.45 3,150 f' 11 (643)
1,168.19 1,597 1'(:) (367)
ClefW W, R (5-I01-.:ms) -rIO-f.-kms)
elIW T, Tk, TW 1'0 - (10 . kms)
MH, PHS, 1. W. TW PO, Phone -(10-+ kms) D, FPC,
t!, PHS, l. \V. R PO Phnnc -f" -1 Oh.ms) D, FPC, RP(2) HI' T, W. Tk pn (liJ '-kms)
TW. R
BS 1?R,KR
ns PR
DS PR
DS PR
BS PH.
1,418.89 9,245 P,H, PUC H, Mew, T, W, Tk PTO.Phull" -(10- kmsj BS,RS PR.KR (1,757) I,Tr, AC(5) MH, PHS,
D, FPC NH, RP, CHW
331.44 1,329 P CHW(2) T, W -H kms) -(I0--kms) BS,RS KR (238)
544.91 1,253 1', j\C (2) CIlW (225)
1,175.47
1,684.91
5,603 (1,022)
8,341 (1,612)
p .. \(1'1)
P(2), H AC(6)
PHS, D, FPC, eHW PHS, FPC. RP, SMP, CHW
6
W -(-5 kms) -(-5 kms)
T, W, Tk PO. Phone -(10-i--kms) TW
T, W, Tk PO. Phone -(5-lUkmsJ TW
BS KR
DS,RS KR
BS PR

DIRECTORY
Land Use
Land use (i. e., area under different types of land Amenities - Contd. usc in hectarers rounded up 2 decimal places.)
Nearest town and distance (in km.)
-----",---=---:--Power Staple Food Forest Irri gated Un- Cultu- Area Remarks
Supply by source irrigated rable not (including waste avail- any place of
(inclu- able reiigious, ding for historical or
gauchar cultiva- archaeological and tion interest) groves)
Location Code No.
'-----------.--."---.---------~--."-- ---_--_._. __ -----~-- ---~---.----12 13 14 15 16 17 18 19 20 ------------_._- -------._----- -------- ---------_
KaloHI ED,EAg Hajri, Wheat, Rice T (465.00) 533.00 78.00 85.07 N3: M7: C2: TI7 WE (263.00)
TWE (202.00)
Kalol-14 EA Bajri, Wheat, Rice, T (799.00) 720.85 114.00 89.00 Old Temple of 2 Iowar WE (607.00) Vardaxini Mata &
TWE (192.00) big fair is held on Aswin Sud-9.
N:M7:C:Tl2 Gandhinag;lr-15 ED,EAg Bajri, Wheat. Rice T (637.00) 81.00 85.00 1.36 N5: T3 3
TWE (637.00) Gandhinagar-l0 EA Bajri. Wheat, Rice T (1,201,00) 50.00
WE (1,085.00) 42.32 114.00 N250: M4: 1'25 4
TWE (116.00)
Mansa-15 EA Bajri, Wheat, Rice T (285.00) 121.13 110.00 80.00 N2 - 5 WE (243.00)
TWE ( 42.00) Gandhinagar-27 EAg Bajri, Wheat, Rice T (121.00) 56.00 12.00 72.08 6
TW (101.00) TWE (20.00)
Gandhinagar-26 EAg Bajri, Wheat, Rice T (202.00) 63.00 17.00 43.78 N: M: T2 7 TW (182.00) TWE ( 20.00)
Gandhinagar-27 ED,EAg Bajri, Wheat, Rice T (448.00) 76.00 36.38 38.00 Nilkanth Mahadev 8 WE (124.00) N20:M7:C:T18 TWE (324.00)
Gandhinagar-25 ED,EAg Bajri, Wheat, Rice T (894.00) 948.00 207.93 119.00 N20: M7: TIS 9 TWE (894.00) Gahdhinagar-25 EA Bajri, Wheat, Rice T (283.00) 514.00 167.00 111.45 N8: T9 10 WE (223.00)
Bairi, Wheat, Rice TWE (60.00)
Mansa-17 EA T (593.00) 275.19 204.00 %.00 N3: T2 11 WE (567.00)
Gandhinagar-12 Bajri, Wheat, Rice rWE ( 26.(0)
EA T (1,012.00) 218.00 188.89 N150: M35: T20 12 WE (487.00) TWE (525.00)
Gandhinagar-8 EA Bajri, Wheat, Rice T (123.001) 171.44 18.00 19.00 N30: T 13 WE (101.00) TWE ( 22 .. 00)
Kalol-9 EAg Bajri, Wheat, Rice T (279.00) 215.00 28.91 22.00 Vayinatha Temple 14 WE (243.00) N3: M: T TWE ( 36.(0)
KaloI-12 ED,EAg Bajri, Wheat, Rice T (154.00) 809.47 184.00 28.00 T2 15 WE (121.00) TWE ( 33.00)
Gandhinagar-5 EA Bajri, Wheat, Rice T (894.00) 578.91 66.00 146.00 N300:MlO:C3:T20 16 Jowar W ( 49.(0) WE ( 85.00)
TWE (760.00)
7

TALUKA: GANDIDNAGAR VILLAGE
--------------~~'.----- ----, -- --._-Amenities available (if not availahle within the village. a dash (-)
Loca- Name of tion village Code No.
1 2
17
18
19
20
Petbapur
Lekawada
Bhundia
Dasbela
21 Dhanap
22 Glyod
23 Mabudara
24 Shiholi Moti
25 Alampur
26 Pundarasan
27 Titoda
28
29
30
31
Bboyan Rathod Shertba
Unvarsad
Vavol
32 Palaj
33 Chiloda
Total area of tbe village (in hectares)
Total population and number of households
is ,hown in the Column and Dc d to it in the brackets. the distance in broad ra!lges \i7., - ~ km s _ 5-10 kms, and 10-J-- kms of the nearest place where the facility is available is given.)
Educa- Medi cal Drinking---Post and -----Day-----Commu":' tional watcr Telegraph or ni(.'~tion Appro-
3 4
2,526.48 11,319 (2,206)
527.61 1,258
386.39
1,165.66
(228)
492 (103)
2,723 (518)
s PC!), H, AC
P, AC
P
P
1,019.16 2,462 P, H, (447) AC(2)
86U7 1,930 P. AC(2) (400)
853.33 1,640 P. AC (280)
709.95 2732 P, AC(2) (524)
371-22 1,731 P, AC(2) (316)
256.72 1,475 P. AC(2) (301)
991.24 4,729 P, H(2), (908) AC(6)
756.06 1,665 (29S)
1,258.10 6,771 (1,326)
1.727.05
761.35
7,027 (1,381)
4,612 (8S2)
f. ACI~)
P(4), H, PUC
P(2), H,
\('(4)
P. H,
:" (~,
1,119.98 2,670 I' .. ~ Ci _i i (517)
582.84 2,398 P, H, (449) AC(2)
(potable) days (Bus-stop, ach of railway to market! station, village hat, if water-any way)
6 7 8 9 10 11
H, MH, PHS. D. FPC, RP(4).
1, TW. R PTO.Phdnc· (JO,kms) I3S PR,KR
CHW CHW
(-5 kmq
(10+kms)
T, TW. R PO
T. W. TW -(-5 kms)
T, \'- PO
-(I0+kms) BS KR
-(10+kms) -{-5kms) KR
-(5-10 kms) BS PR,KR
PHS, FPC, T, W. T\\' PO -(10+kms) BS PR,KR SMP. CHW(2)
(-5 kms) T. W, TW PO, Phone -(lO+kms) BS PR,KR
CHW w
PHS, FPC. T. W, Tk, PO RP, CHW TW
-(IO+kms)
-(10+kms)
BS PR,KR
BS PR,KR
-(5-10 kms) T. W PO -(lO+kms) -(-Skms) PR,KR
-(5-10 kms) W, TW PO
PHS, FPC. RP
CHW
1. \Y, n, 1'0 TW,
W, Ih PO
PHS, FPC, T, W, I k, P(). I'ho;]: RP,O 0
-(S-10kms)
-(5-10 kms)
-(-5 kma)
-(]() , kms)
MH, PHS, D. FPC, RP(S)
T. W. n, PO. Phone -(1O+kms) TW
PHS, FPC, RP(2)
T, W, Tk. PO. Phone TW,Hp.
-(-S kms)
BS KR
BS,RS PR,KB
DS KK
BS,RS PR
as PR,KR
BS PR,KR
. (-5 kIm) T, TW, HI' (-5 kms) -(-5 Ions) BS PR,KR
RP, SMP, T, W, Tk PO, Phone -(lO+kms) BS PR,KR CHW
34 I$anpur Mota 1.285.10 3,923 (771)
P(2), H, PHS, FPC, T, W, Tk, PO R
-(5-10 kms) as PR,KR
35 Magodi
36 PraDtiya
1,355.84 3,475 (642)
PUC, AC(2) RP(2), CHW
P, H, -(5-10kms)
AC(3)
484.87 3,054 P, H, Tr -(-5-10 (558) kIlls)
a
T, \Y, Tk, PO, Phone TW,R
T. W. Tk. PO TW
-(S-lOkms)
-(10+kms)
BS PR,KR
BS PR

DIRECTORY
Land· Use
------
Ameni~ies - Couid. Land use (i. e., ,area under different types of land
use in hectaters rounded up to 2 decimal place.) Nearest town Po\vcr Staple Food -Forest Irri gated Un- Cultu- Area Remarks Loca-and distance Supply hy source irrigated rable not (including tion (in km.) waste avail- any place of Code
(inclu- able religious. No. ding for historical or gauchar cultiva- archaeological and tion interest) groves)
12 13 14 15 16 17 18 19 20
Gandhinagar-l EA Bairi, Wheat, Rice. T (730.00) 1,085.00 504.00 207.48 N65: M19: 17 lowar W ( 10.00) C2: T6
WE (270.00) TWE (450.00)
Gandhinagar-3 EAg Bairi, Wheat, Rice. T ( 41.00) 42.00 350.00 94.61 T9 18 Iowar WE ( 36.00)
TW ( 5.00) GaIKIhinagar-5 EAg Bajri, Wheat, Rice T ( 20.00) 207.00 102.39 57.00 T 19
WE ( 20.00) Gandhinagar-15 EA Bairi, Wheat. Rice T (861.00) 202.00 %.66 6.00 N3: M2: T22 20
WE (721.00) TWE (140.00)
Gandhinagar-I8 EAg Bairi, Wheat, Rice T (223.00) 659.16 73.00 64.00 NlS: MIS: Tl6 21 WE ( 81.00)
TWE (142.00) Gandhinagar-12 EAg Hajri, Wheat, Rice T (377.00) 433.00 53.27 2.00 N5: M5: T3 22
TWE (371.00) Tk( 6.00)
Ahmadab;:HI-12 EAg,EO Bajri. Wheat, Rice T (453.00) 325.33 71.00 4.00 NI0: M: T2 23 WE (405.00)
TWE ( 48.00) Gandhinagar-12 EA Bairi, Wheat, Rice T (587.00) 38.00 36.00 48.95 N2: C: T25 24
W (530.00) TWE ( 57.00)
Gandhinagar-8 EAg Bajri, Wheat, RIce T ( 95.00) 189.22 38.00 49.00 NlO: M: T4 25 WE ( 95.00)
Gandhinagar-8 EAg Bajri, Wheat, Iowar . T ( 15.00) 199.00 38.72 4.00 N2 26 TWE ( 15.00)
Kalol-7 ED,EAg Bajri, Wheat. Rice. T (515.00) 313.24 89.00 74.00 N60: M3: C: T5 '2.7 Jowar WE (170.00)
TWE (345.00) Kalol-4 ED,EAg Bajri, Wheat, Rice T (344.00) 107.00 256.00 49.06 N40: M2: T3 28
WE (283.00) TWE ( 61.00)
Kalol-9 ED,EKg Bairi, Wheat, Rice T (253.00) 817.00 188.10 N50: MID: C: T5 29 WE (162.00)
TWB ( 91.00) Gandhinagar-8 ED,EAg Bairi, Wheat, Rice T (426.()()) 1,039.05 165.00 97.00 N20: M6: C: T12 30
WE (243.00) TWE (183.00)
Gandhinagar-l EA Bajri, Wheat, Rice T ( 61.00) 553.00 55.00 92.35 N50: M14: T6 31 WE { 20.00)
TWE (41.00) Gandhinagar-2 EAg Bairi, Wheat, Rice T (203.00) 535.00 333.00 48.98 N2: M2: T 32
WE (138.00) TWE (65.00)
33 Gandhinagar-IO EA Bajri, Wheat, Rice T (216.00) 289.84 66.00 11.00 N5: C2: TIl WE (166.00)
TWE ( 50.00)
Dehgarn-8 EA Bajri, Wheat, Rice T (566.00) 456.00 205.10 58.00 N3: M3: T7 34 WE (384.00)
TWE (182.00)
Dchgarn-8 EA Bajn, Wheat, Rice T (473.00) 608.84 119.00 155.00 N5: M4: T5 35 WE (207.00)
TWE (266.00) Ahmadabad-22 ED,EAg BajTi, Wheat, Rice T (:'12400) 39.00 119.87 2.00 N20: M7: C2 36
WE (243.00) TWE ( 81.00)
9 G-2

T ALUKA : GANDHll"lAGAR VILLAGE
Amenities and
---------------- ----------------------~------
Loca- Name of tion village Code No.
37 Basan
38 Vasana-Radmatia
39 Sargasan
40 Tarapur
41 Dantali
42 Jamiyatpur
43 Adalaj
44 Por
45 Kundasan
46 Randesan
47 Shahpur
48 Ratanpur
49 Lavarpur
50 Dabhoda
51 Vadodara
52 Pirojpur
53 Raysan
Total area
Amenities available (if not available within the village, a dash H is shown in the Column and next to it in the brackets, the distance in broad ranges viz., -5 kms, 5-10 kms, and 10+ kms of the nearest place where the facility is available is given.)
Educa- Medi cal Drinking Post and Day Commu-of the village (in hectares)
Total population and number
of tional water Telegraph or nication Appro-households
(potable) days (Bus-stop, ach of railway village market! station, to hat, if water-any way)
3 4 5 6 7 8 9 ]0 11
53.08 892 P - (5 kms) T, W, TW -(-5 kms) -(-5 kms) --(-5 kms) PR (149)
67.87 46 -(-5 kms) -(-5 kms) W. Tk. Hp (-5 kms) -(5-10 kms) -(-5 kms) PR,KR (10)
536.28 1,222 r -(5-10 kms) W. Tk (235)
-(5-10 kms) -(5-10 kms) BS PR
354.11 1.604 p. AC(4) RP. CHW \'. (337)
PO,Phonc -(10+ kms) BS KR
399.48 1.495 P (284)
369.87 3,360 P (673)
--(-5 kms) T, W, Tk, -(-5 kms) -00+ krn,)
TW
RP. SMP, CHW
T w. Tk. PO. Phone -(I0-i-kms) TW
1,791.47 7,291 P, H, PUC, PHC, FPC, T W, Tk, PTO,Phone -(lO+kms) (1514) I, Tr, RP(4). TW
AC(2) CHW
587.16 4.273 p, H (837)
731.46 2,212 P (409)
348.54 456 r (76)
RP(4), CHW T, W, Tk, PO.l'>one -(10-,-- kms), TW, Hp
--(5-10 kms) TW PO -(10+kms)
CHW T, W, Tk, -(-5 kms) -(to-\-.kms) R
ns PR.KH
BS PR.KR
BS PR,KR
BS PR,KR
BS KR
BS KR
689.75 2,026 P (346)
CHW W, R P0 -(10j__km~) BS KR
520.63 917 P (175)
CHW T. \\' -(-5kms) -(10+kms) BS KR
431.10 1,790 P, H (330)
PHS. 'FPC T, W PO -(10 Hms) ns PR
~,307.40 9,737 (1,830)
P, J I. AC(2) .\fCW, MH, PRC, RP, CHW
1,275.05 4,463 (849)
P, AC~5) PHS, FPC, RP
592.50 1.126 r."I1 (2012)
354.65 1,183 P (219)
(fTW
CHW
10
T, W, Tk, PTO,Phone -(-) kms) TW, R
T. W. Tl. PO, Phone -C'-lOkms)
w -(-5 kms) -(-5 km';)
T,w.TW. POYhOllC -(5-10 kms) R
BS,RS PR,KR
BS PR,KR
TIS rR
ns KR

DIRECTORY
Land Use
---.------.-----------~.- ._._ .~----- ._ .---._ -_._---
Land use (i. e., area under different types of land Amenitlies - ConM. ''',C in hcctarcrs rounded up 2 decimal places.)
~-.-~-"---""-
Nearest town Power Staple Food Forest Irrigated Un- Cultu- Area Remarks Loca-and distance Supply by source irrigated rable not (including tion (jn kill.) waste avail- any place of Code
(inclu- able re1igious, No. ding for historical or gauchar cultiva- archaeological and tion interest) groves)
12 13 14 15 16 17 18 19 20
Gandhinagar-2 RAg Bajri, Wheat, Rice T ( 13.00) 40.08 37 TWE ( 13.00)
Gandhinagar--4 EAg Bajri, Wheat, Rice T ( 10.00) 46.87 8.00 3.00 38 WE ( 10.00)
Gandhinagar-6 EAg Bajri, Wheat, Rice, T (242.00) 223.00 37.00 34.28 39 Jowar W ( 40.00)
WE (202.00) Gandhinagar-9 EAg Bajri, Wheat, Rice T ( 26.00)
WE ( 10.00) 271.11 40.00 17.00 N5: C2 40
TWE ( 16.00) Kalol-8 EAg Bajri, Wheat, Rice, T (355.00) 4:00 11.48 29.00 N2: M: T6 41
Jowar W ( 30.00) WE (49.00)
TWE (276.00) KaloH2 EA Bajri, Wheat, Rice, T ( 40.(0) 298.87 10.00 21.00 N22: M: T2 42
lowar W ( 5.00) WE ( 32.00)
TWE ( 3.00) KaloHO EA Hajri, Wheat, Rice T (991.00) 537.00 213.47 50.00 Famous Stepwell 43
W (49.00) N70:M'17 :C2:T8 WE (417.00)
TWE (525.00) Gandhinagar-5 ED,EAg Bajri, Wheat, Rice T (317.00) 232.00 13.00 25.16 N50: M7: C2: T2 44
WE (293.00) TWE ( 24.(0)
Gandhinagar-l0 . ED,RAg Bajri, Wheat, Rice T (135.00) 413.00 111.46 72.00 N5: M13: C2: T4 45 WE (122.00)
TWE ( 13.00)
Gandhinagar-6 EAg 13ajri, Wheat, Rice, T ( 95.00) 203.54 49.00 1.00 N5 46 Jowar W ( 16.(0)
WE (61.00) TW ( 8.(0)
TWE ( 10.(0) Gandhinagar-23 EAg Bajri, Wheat, Rice T (109.00)
WE (40.00) 287.00 189.00 104.75 N3: T6 47
TWE ( 69.(0)
Gandhinagar-20 EAg Bajl'i, Wheat, Rice T (113.00) 206.63 145.00 56.00 N3: T2 48 WE ( 32.00)
TWE ( 81.(0)
Gandhinagar-15 EA Bajri, Wheat, Rice .. T (282.00) 4910 28.00 72.00 N15: M22: 49 W ( 53.00) C2: TIS
WE ( 93.00) TWE (136.00)
Dehgam-5 EA Bajri, Wheat, Rioe .. T (182.00) 1,803.00 2110.40 42.00 N95: M6: C3: T20 50 WE (128.00)
TWE ( 54.(0)
Dehgam-5 RA Bajri, Wheat, Rice, T ( 51.00) 1,005.00 42.00 177.05 N20: M4: T6 51 Maize W ( 4.(0)
WE ( 18.00) TWE ( 29.00)
Ahmadabad-22 EAg Bajri, Wheat, Rice T (364.00) WE (283.00)
60.00 119.50 49.00 N: MlO: T 52
TWE ( 81.00)
Gandhinagar-8 EA Bajri, Wheat, Rice, T (125.00) 108.65 50.00 71.00 NlO: M2: T2 53 Jowar W ( 4.00)
WE ( 61.00) 1WE ( 60.00)
11

T ALUKA : GANDHINAGAR VILLAGE
Amenities and
Amenities available (if" not available within the village, a dash (-)
Loca- Name of Total Total is shown in the Column and next to it in the brackets, the tion village area popula- distance in broad ranges viz., -5 kms, 5-10 kms, and 10+ kms
Code of the tion and of the nearest place where the facility is available is given.)
No. village number -Educa- Medica! Drinking Post and Day Commu-(in hee- of tional water Telegraph or nieation Appro-tares) house- (potable) days (B~s-stop, ach
holds of raIlway to market! station. village hat, if water-any way)
._--------._-_--2 3 4 5 6 7 8 9 10 11 _. __ ._."
54 Koba 675.12 1,961 P(2). H, PHS, FPC, T, W, Tk, PO. Phone -(10+kms) BS PR.KR (345) Tr. A04) CHW TW, R
55 Ambapur 549.45 2,558 P, H, AC RP, T, W. Tk PO -(lO+kms) BS PR,KR (490) CHW(2)
56 Khoraj 762.85 4,272 P, H, AC PHS,FPC, T, W, Tk, PO. Phone -(lO+kms) BS PR,KR (806) RP(3) TW
57 Zundal 668.92 2,759 P. H PHS. D, T, W, Tk, PO -(IO-Hms) BS PR,KR (571) FPC, RP(3) 'TW, Hp
58 Amiyapur 197.35 955 P. AC(Z) CHW W,Tk -(-5 kms) -(5-10 kms) BS KR (200)
59 Sugad 427.41 1,240 P, AC RP(2), T, W, Tk. PO -(5-1 Okms) BS PR,KR (248) CHW
60 Nabhoi 291,07 378 P (79)
CHW W, R -(-5 kms) -(5-lOkms) BS, PR,KR
61 Karai 462.07 403 I' -(-5 kms) W.TW. R -(-5 kIns) -(5-10 kms) -(-5 kIns) KR (69)
62 Valad 1,594.38 6,652 P(4), H PHS, D, T, W, Tk, PO, . Phone -(5-10 kIns) BS PRKR (1,379) FPC, RP, TW, Hp, R
SMP, CHW(2)
63 Vankanerda 478.72 1,146 P CHW TW. R -(-5 kms) -(10+ kms) -(-5 kms) KR (210) 64 Galudan 714.53 2,083 P, H RP(3), T, W, Tk,
(373) tHW TW. IIp. R PO. Phone -(5-10kms) BS PR.KR
65 Sonarda 732.15 2,0:)2 P CHW(2) (375)
'\V R PO -(lO+kms) BS PR.KR
66 Viratalavdi 258.38 1,281 P CHW W -(-5 kms) -(10+ knis) 1'1S PR
(243) 67 Mcdra 469.42 1,284 P RP. CHW r.W PO . (5-lOkms) BS RS I'R KR
(237)
68 Limbadia 352.00 910 l' PHS, FPC, W, Tk, PO, Phone -(lO+kms) BS PR (145) RP, S~IP, TW. IIp, R
CHW 69 Bhat 694.95 1,634 P RP. CRW T,W,TW, -(5-10 kms) -(10+ kms) -(-5 kms) PR,KR
(306) Hp
70 Chandkheda 1,047.95 10,240 P,H,PUC RP(3), 1, W, Tk, PO --(5--10 kllb) BS PR.KR (2,064) CHW, ° TW,Hp
71 Motera 513.85 4,172 P, H PHS, D, T. W,TW; PO -(-5 kms) BS PR,KR (894) FPC, RP, H
CHW 72 Koteshwar 296.60 850 P () T. W, R -(-5 kms) -(-5 kIns) 1'1S PR,KR
(168)
73 Chiloda 500.93 2,295 P, AC (Naroda) (497)
-(-5 kms) R
T,W,TW, -(-5 kms) -(-5 kms) BS PR,KR
12

DIRECTORY
Land' Use
Amenities - Contd. Land use (i. e., area under different types of land
use in hectarers rounded up 2 decimal places.) Nearest town and distance (in krn.)
12
Gandhinagar-10
Ahmadabad-22
Gandhinagar-17
Ahmadabad-l 9
Ahmadabad-12
Ahmedabad--13
Ahmedabad-13
Gandhinagar-15
Gandhinagar-18
Dehgam-13
Dehgam-8
Dehgam-10
Dehgam-10
Naroda-8
Ahmadabad-20
Ahmadabad-1 0
Ahmadabad-12
Ahmadabad-lO
Ahmada bad-9
Ahmadabad-10
Power Supply
Staple Food Forest lrri gated Un- Cultu---Area-- Remarks Location Code No.
by source irrigated rable not (including waste avail- - any place of (inclu- able reUgious, ding for historical or gauchar cultiva- archaeological and tion interest) groves)
--_ -. - --__ -.. ---_- ---- --_:... 13 14 15 16 17 18 19 20 1
----~-- .• ---.-------.- ------ ._----------------EA Bajri, Wheat, Rice .. T (162.00) 270.00 81.00 162.12 NlO: M3: T2 54
EA Bajri, Wheat, Rice
ED.EAg Bajri, Wheat, Rice
EA Bajri, Wheat, Rice
EAg Bajri, Wheat, Jowar
EAg Bajri Wheat, Rice, Jowar
BAg Bajri, Wheat, Rice, Jowar
EA Bajri. Wheat, Rice
EA Bajri, Wheat, Rice, Iowar
EA Bajri, Wheat, Rice
EA Bajri, Wheat, Rice, Jowar
EA Bajri, Wheat, Rice
BAg Bajri, Wheat, Rice
EA Bajri, Wheat, Rice
ED,EAg Bajri, Wheat, Rice
EA Bajri, Wheat, Rice
EA Bajri, Wheat, Rice .,
EA Bajri, Wheat, Rice, Jowar
EA Bajri, Wheat, Rice
ED,EAg Barji, Wheat, Rice
WE ( 61.00) TWE {I 0 1.00)
T (209.00) WE (209.00)
T (486.00) WE (405.00)
TWE (81.00) T ( 35.00)
WE -(. 30.00) TWE ( 5.00)
T ( 27.(0) WE (27.00)
T ( 12.00) WE- ( 12.(0)
T ( 36.00) WE ( 36.00)
T (162.00) W ( 4.00)
WE ( 36.00) TWE (122.00)
T (757.00) WE - (514.00)
TWE (243.00) T (129.00)
WE (121.00) TWE ( 8.00)
T (486.00) W ( 28.00)
WE (418.00) TWE (40.00)
T (496.00) WE (354.00)
TWE (142.00) T ( 53.00)
WE (40.00) TWE ( 13.00)
T ( 91.00) WE (71.00)
TWE ( 20.00) T (271.00)
WE (170.00) TWE (101.00)
T (178.00) W ( 6.00)
WE ( 81.00) TWE ( 91.00)
T (142.00) W ( 10.00)
WE ( 72.00) TWE (60.00)
T ( 57.00) WE (27.00)
TWE ( 30.00) r ( 48.00
WE (48.00) T (116.00)
Wf!. ( 55.00) TW ( to.OO)
TWE ( 51.00)
13
306.45
186.00
598.92
135.00
343.41
154.00
143.D7
87.00
293.72
142.00
149.15
179.00
322.42
42.00
207.95
708.95
219.00
111.60
258.93
6.00 28.00 N20: M8: Tll 55
68.85 22.00 N90: M12: T4 56
33.00 2.00 N20: M8 57
26.35 9.00 N2 58
36.00 36.00 N5: M3 59
57.00 60
17.00 140.00 N: M 61
616.38 134.00 N50: M9: T4 62
28.00 28.00 M8: T3 63
76.53 10.00 N: M3: T 64
76.00 11.00 N3: T2 65
12.38 14.00 M16 66
35.00 21.00 NIO T4 67
16.00 23.00 N8: M2: C2: T4 68
70.00 239.00 N30: M3: T 69
49.00 148.00 Artistic Glass 70 Temple. NlOO: M25: T6
59,85 178.00 N30: M5 71
59.00 78.00 N: M3: T 72
79.00 47.00 T 73

TALUKA GANDHINAGAR VJLLAGE
Ame,uities and
---- '-~---~ Amenities available (if not available within the village, a dash (-)
Location Code No.
Name of village
2
74 Ranasan
75 Ralpur
Total area of the village (in hectares)
3
290.11
Total is shown in the Column and nex~ to it in the brackets, the popula- distance in broad ranges viz., -5 kms. 5-10 kms. and 10+ kms tion and --:~o~f....:t.:..h_e ...... n~e~ar:-e-;st:-:::pITa_ce.:.__w:;:;h~e;:re:'i:!:th:::-e:-=fa:;;Cl ...... ·l-=:it~Y_i:..:;·s ...... a:..:v..:::a.:.:il __ ab~l:.:e....:· i:.:s~g:::.jve~n;;:.)~ __ _ number Educa- Medi cal Drinking Post and Dav Commu-of tional water Telegraph or' nication Appro-house- (potable) days (Bus-stop, ach holds of railway to
market! station, village hat, if water-
____________ al1y ___ ~~y) ____ _
4 5 6 7 8 9 10 11
947 P -(-5 kms) T PO -(-5 kms) BS PR,KR (191 )
630.20 2,292 P. H T, w. n. PO TW, Hp, R
-(10-;-kms) BS PR,KR (451)
------- -----_-_.
Total 59,468.19 226,645 (43,762)
P(S9)
H(32) pvcm 1(2)
'Ir(5)
AC(lOO)
If(-4)
,\fCW(3)
MB(S)
CWC(2)
PHf'(2) PHS (25) D(12)
FPC(27) NH(2) Sl\-fP(71
RP(59)
CHW(591
0(4).
Note : The figures in the last line indicate Taluka totals. Tile figures in brackets in this line under Col. 5, 6 and 20 indicate the number of those particular amenitie~.
14

DIRECTORY
Land Use
Amenities - Contd. Land use (i. e.; area under different types oClanl
use in hectarers rounded up 2 decimal plac_:.9 __
Nearest town and distance (in km.)
12
Naroda-4
Ahmadabad-IS
---_._--
Power Supply
Staple Food Forest Irri gated ~~ Cultu- Area Remarks by sOlJrce Ifflgated ra')\c not (including
Location Code No.
13 14
EAg,EO Bajri, Wheat, Rice
ED,EAg Bajri, Wheat, Rice
15
T WE
TWE T
WE TWE
15
waste avail- any place of (inclu- able religious ding for hil.torical or gauchar cultiva- archaeological and tion interest) groves)
16 17 18 19 20
201.00 12.11 18.00 N8 74
240.00 81.00 54.20 N20: MIS: 75 C2: T3
22,890.00 24,657.09 7448,37 4472.73 N (1878) M (38&) C (34)
T (414)
--_.------

G-3 17
APPENDICES TO VEULAGE DIRECTORY
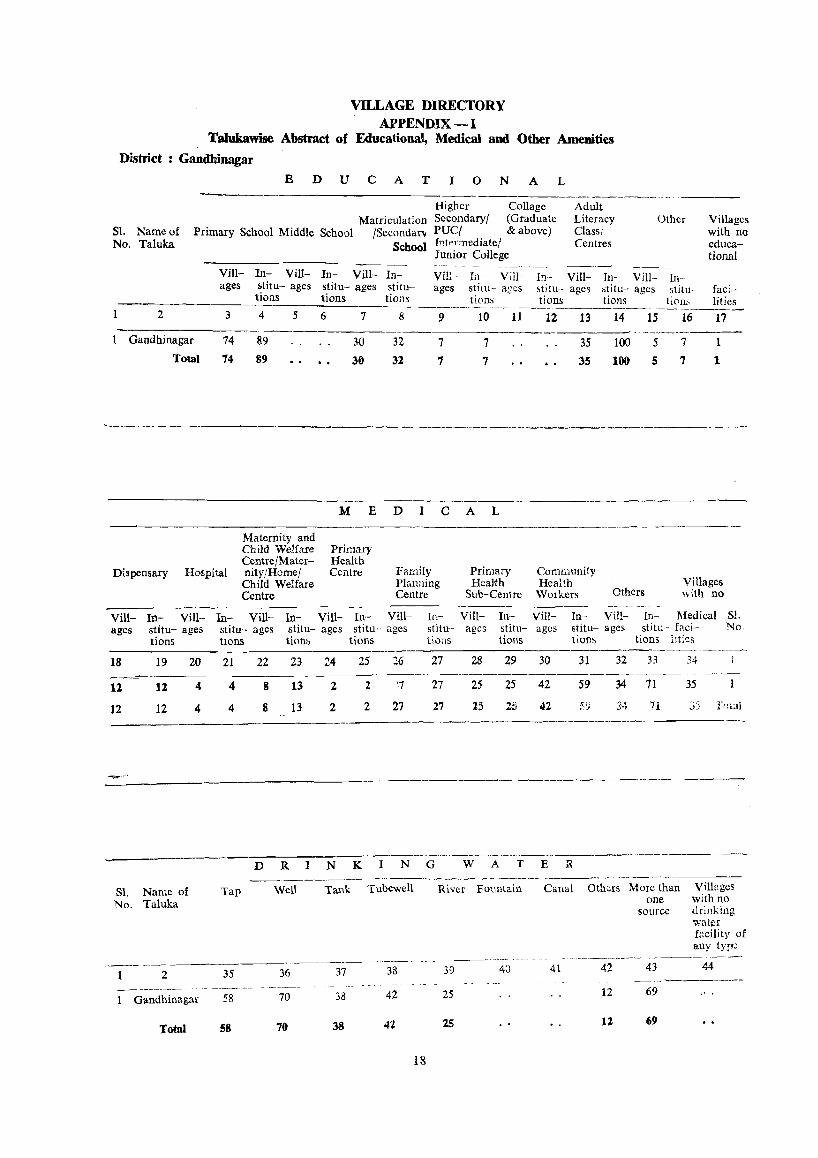
VILLAGE DlRECfORY APPENDIX-I
Talukawise Abstract of Educational, Medical and Other Amenities
District Gandhinagar
E DU C AT ION A L
Higher Collage Adult Matriculation Secondary/ (Graduate Literacy Other Villages
51. Name of Primary School Middle School jSecondaf'/ PUC/ & above) Class! with no No. TaIuka School fntertl'cdiate/ Centres educa-
Junior College tiona! ----_
VilI- In- Vill- In- Vill- In- ViI:- In Vill- In~ ViJl- 1n- Vill- 111-ages stitu- ages stitu- ages stitu- ages stitu- ages stitu- ages stitu- ages stitu- faci-
tions tions tions tions tions lions (ions lities .-~- ------------
2 3
Gandhinagar 74
Total 74
Dispensary Hospital
---Vill- In- Vill- Iu-
4 5
89
89
Maternity and Child Welfare Centre/Maternity/Home/ Child Welfare Centre
Vill- In-
6 7 8 9 10 11
30 32 7 7
30 32 7 7
M EDleAL
Primary Health Centre
-_--_ ViU- In-
Family Planning Centre
Vill- 1n-
Primary Health
Sub-Centre
Vill- In-ages stitu- ages stitu- ages stitu- ages stitu- ages stitu- ages stitu-
tions bons tions tions tiOllS Hons
18 19 20 21 22 23 24 25 26 27 28 29 -~-- -----12 11 4 4 til 13 2 2 'j 27 25 25
12 12 4 4 8 13 2 2 27 27 15 25
12 13
35
35
Comraunity Health
Workers
Vill- In--
14 15 16 17 -._---------
100 5
100 5
Others ------,._--
Vill- 1n-
7 1
7 1
Villages \:vith no
Medical S1. ages stitu- ages stitu-- faci- No-
tions tions litics
:30 31 32 33 34 ---~-
42 59 34 71 35
42 59 34 71 ~i5 1('131
DRINKING W ATE R
S1. Name of No. Taluka
Gandhinagar
Total
Tap Well
58 70
58 70
Tank Tubewdl
38 42
38 41
River Fountain
25
2S
18
Canal Others More than Villages
41 42
12
lZ
one with no source drinking
43
69
69
Walj;f bcility of any type
44

P OST AND
VILLAGE DIRECfORY APPENDIX - I - Contd.
TELEGRAPH -_-._----- -----------------_._- -
S1. Name of P.O. T.O. P.T.O. P.O. T.O. P.T.O. No. Taluka & & & SI.
Phone Phone Phone Phone No.
2 45 46 47 48 49 50 51
Gandhinagar 27 20 6 1
Total 27 ZO 6 .. ToCaI
c 0 M M U N I C A T I 0 N S POWER SUPPLY
SI. Name of Bus Stop Railway Station Navig able Waterway Available Not Availabile No. Taluka
2 52 53
Gandhinagar 66 9
Total 66 t
54
VILLAGE DIRECI'ORY
APPENDIX - n
55
75
75
56
i »
••
Land utilisation data in respect 01 DOJI-"municipal towns (Census towns}
SI. Name ()of Town No. and Taluka
within bra-ckets
2 ~-l---Gandhimigar
(Gandhinagar) Total
Land use I(i. c. area under different types of land use in hectares rounded to the nearest unit)
Total area
3
Forest Irrigated by source
Unirrigated Culturable waste (including gauchar and groves)
Area not available for cultivation
-------------4 ________ ~5 ________ 6 ______ . __ 7 ______ ~~8~---
5,674-:80------- 5,674.80
5,674.80 ..
VILLAGE DIRECfORY APPENDIX - m
5,674-80
Talokawise List of Villages where no Amenities are available
Note
--Nil--
In Gandhinagar District all the villages having different types of seven amenities is available viz., Educational, Medical, Drinking Water, Post and Telegraph, Communications, Power Supply and Market facility.
In Gandhinagar District this type of information is NIL.
19
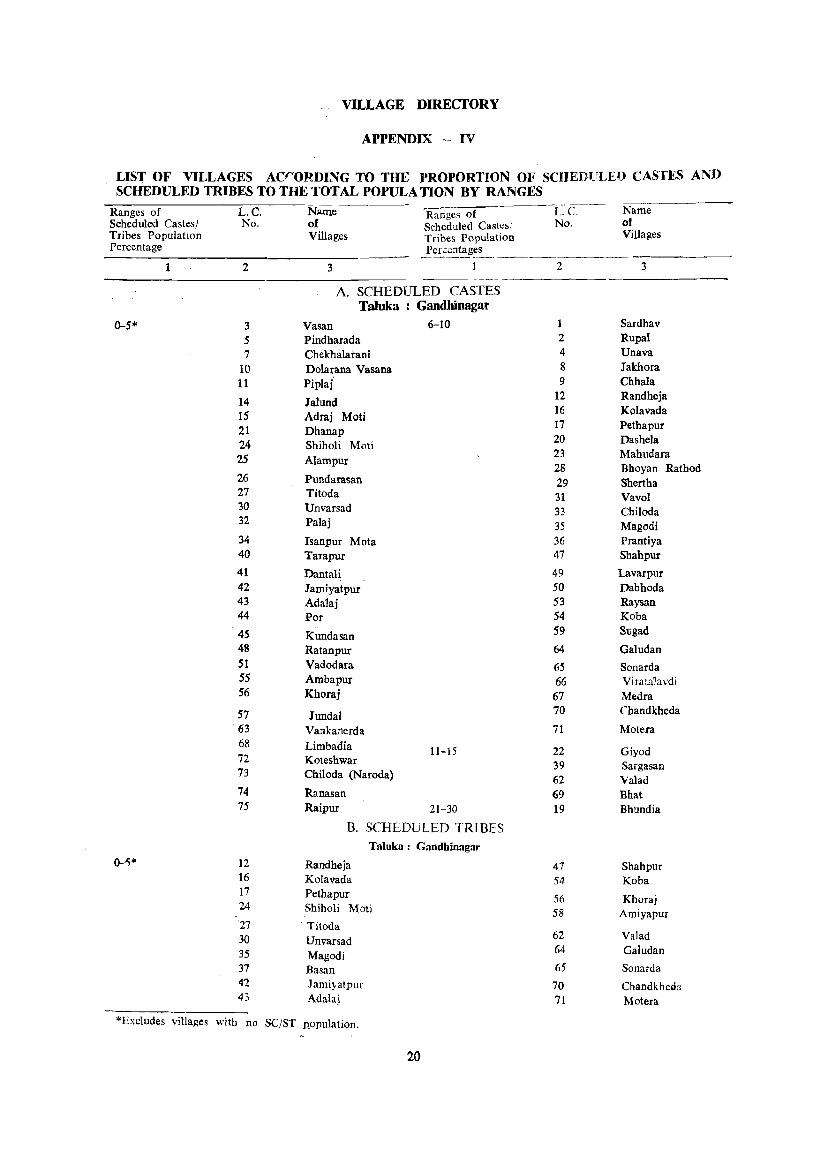
VILLAGE DIRECTORY
APPENDIX -- IV
LIST OF VILLAGES ACrORDING TO THE PROPORTION OF SCHEDUI_ED CASTFS AND SCHEDULED TRIBES TO THE TOTAL POPULA TION BY RANGES
Ranges of Scheduled Castes! Tribes Population Percentage
1
0-5*
O-~*
L.C. No.
2
3 5 7
10 11
14 15 21 24 25
26 27 30 32
34 40
41 42 43 44
45 48
51 55 56
57 . 63
68 72 73
74 75
12 16 17 24
27 30 35 37 42 43
N:>me of Villages
Ranges of -C C~-~Name Scheduled Caste,: No. of Tribes Population Villages Pcr~cntag~~_. __ ~ ___ ._. __ . ______ _
3
A. SCHEDULED CASTES Taluka Gandbinagat
Vasan Pindharada Chekhalal:ani Dolarana Vasana Piplaj
Jalund Adraj Moti Dhanap Shiholi Moti Alampur
Pundarasan Titoda Unvarsad Palaj
Isanpur Mota Tarapur
Dantali Jamiyatpur Adalaj Por
Kundasan Ratanpur Vadodara Ambapur Khoraj
Jundal Vankanerda Limbadia Koteshwar Chiloda (Naroda)
Ranasan Raipur
6-10
11-15
21-30
B. SCHEDULED TRIBES Taluka: Gandhinagar
Randheja Kolavada Pethapur Shiholi Mati
. Titoda Unvarsad Magodi Basan JamiyatpuI Adalaj
2
2 4
8 9
12 16 17 20 23 28 29 31 33 35 36 47
49 50 53 54 59 64
6S 66
67 70
71
22 39 62 69 19
47 54
56 58
62 64
65
70 71
3
Sardhav Rupal Unava Iakhora Chhala Randheja Kolavada Pethapur Dashela Mahudara Bhoyan Rathod Shertha VavoI Chiloda Magodi Prantiya Sbahpur
Lavarpur Dabhoda Raysan Koba Sugad
Galudan
Sonarda Viratalavdi Medra C'handkheda
Motera
Giyod Sargasan Valad Bhat Bhundia
Shah pur Koba
Khoraj Amiyapur
Valad Galudan
Sonarda
Chandkhed~;
Matera
*Excludes villages with no SC;ST population.
20

SECfION - II TOWN DmECrORY

LIST OF ABBREVIATIONS AND CODES USED IN THE TOWN DIRECTORY
Statement I Col 2 - Civic Administrative Status of Town
1 Municipal Corporation/Corporation M Corp. 2 Municipal CommitteejMunicipal
Town Committee 3 Municipality 4 Municipal 'Board 5 Municipal CounciJ 6 Cantonment Board/Cantonment 7 Notified Area/Notified Area
Committee/Notified Committee 8 Town Committee(Towl1 Area
Committee 9 Town Board
10 Gram PanchayatjVilIage Panchayat 11 Nagar Panchayat{fown Panchayat 12 Non Municipal Town/Committee!
Panchayat Committee
Statement IV Col. 6 - Road Length
1 Pucca Road 2 Kuccha Road
Col. 7 - System of Sewerage 1 Sewer 2 Open Surface Drains 3 Box Surface Drains 4 Sylk Drains 5 Cesspool Method 6 Pit System
Col. 11 - Method of Night Soil
Me M MB l\l C1 CB
NAC TC
TB GPjVP NP NM
PR KR
S OSD BSD SO CD Pt
1 Head Loads HL 2 Baskets B 3 Wheel Barrows WB 4 Septic tank latrines ST 5 Sewerage S
Col. 12--13 - Protected Water Supply -. Source
and Capacity of Storage Systems 1 Overhead tank OHT 2 Service Reservoir SR 3 River Infiltration Gallery IG 4 Borewell Pumping System I3WP 5 Pressure Tank PT 6 TubeweH water /Handpump TW 7 Tap Water T 8 Well Water W Y Tank Water TK
10 Others 0
22
Statement V - Col. 4-5 - Medical Fadlities
1 Hospital H 2 Dispensary D 3 Healtll Centre BC 4 Family Planning Centre Fe 5 T. B. Clinic TB 6 Nursing Home NH 7 Others 0
In Col. 4 the following additional
abbreviations are used as:
Ayurvedic 2 Unani 3 Homoeopathic
Col. 6 - Educational Fadlities
A U Hom
1 Arts only A 2 Science only S 3 Arts and Science only AS 4 Commerce only C 5 Arts and Commerce only AC 6 Combined for all categories ~ Arts, ASC
Science and Commerce 7 Law L 8 Commerce and Law CL
('0). 10 - Recognised Shorthand, TypellTiting and otileil' Training Institutions
1 Shorthand 2 Typewriting 3 Shorthand &
10 Others Typewritmg
SH Type Sh Type o
Cot 20 - Hecrc3'ional and Cultural faciliti£s
Public Library 2 Reading Room
PL PR
Abbreviations of relating to Class of Town
PopulaC1ion Class
1,00,000 and above 50,000 - 99,999 20,000- 49,999 10,000 - 19,999 5,000- 9,999 Below 5,000
I II ill IV V Vi

TOWN DIRECfORY STATEMENT I
STATUS AND GROWTH mSTORY
Area Number of (in Sq. Households
Sf Class, Name and Location Name of Kms) including Code Taluka/ House1ess Population
----No. Civic Administration
Status of Town No. Mahal Hou~eholdj
2 :3 4 5 -----~--.--.~-- --------
II Gandhinagar (NA) 11/1 Gandhinagar
'" Not Classified as Town durin a relevant Census.
and Growth Rate of Town at the Censuses of
1921 1931 1941 ._ - - _--- ._--_- ---- ---~- -
1951 1961 1971 1981
56.75
Ilonaity (in 1981
Census)
(in 1981 Cen~m)
6
12,832
1961 1971 Census Census
1901 1911
7 S
.. •
Sex .katIo
1981 Census
81. No.
--9---10---Tl---ii- ---0--;;1-:;3---:-14:-------:1-=-5---1:--6-:----1-=-7---1-8-----}-9---1------- -----------------
24,OSS 62,443 1,100 !:I5S !:IS7 .. .. (+159.58)
TOWN DIREctORY ST A TEMENf II
Physical Aspects and Location of Towns, 1979 Sl. Class and Name Physical
--~--.------ ------ -----Aspects
No. of Town Rainfall (in m.m.)
Temperature State HQS. (in Centigrate)
Maximum Minimum ----------2-----------3---------4-----5----6---
~__:_-7::____::----------------- -------- -------II Gandhinagar 516.5 45.0 9.0
~---:' -------_.- -__ ~~ -- _._,--_. ~- ._ -----Distance (in Kms.) from
Nearest City Railway Bus Route -Navigahle-with Population Station of One Lakh and more
River/
Canal' (if within-
10 krns.) - _o ________ 9 ------ 10 -------1-1---' --12--
(35.4) (0) (0)
SI. No.
Gandhinagar (O)
Name of and Road
District HQS. Sub-division/ Tal uka;Mahal
HQS.
7
Gandhinagar (0)
8
Gandhinagar (0)
Gandhinagar (0)
Note : The Rainfall Temperature data for Gandhinagar town have been obtained locally.
23

St. Class and. Name No. of Town
2
II Gandhinagar
TOWN DIRECfORY STATEMENT III
Municipal Finance, 1978 1978-79
Receipt Receipt (in
Civic -------Government
Administration through Revenue derived from Grant Status Taxes,
(in 1980) etc. Municipal Properties and Power apart from Taxation
3 4 5 6 ~---.----' --'_ ----~--- --- _ .. _._------
NA 50,000
Rs. '00)
Loan Advance
7 8 ------~-----
Receipt ( in Rs. . 00 ) E;..penditurc ( in Rs. ' 00 ) ------
• ____ • __ T ____ __
Other Total General PubH" . PUblic- Public Public Others Total S1. Sources Receipt Admini- Safety Health Works Institutions (Specify) Expenditure No.
(Specify) stration and Conve-niences
9 10 11 12 13 14 15 16 17 1
50,000 50,000 50,000
TOWN DIRECTORY STATEMENT IV
S1. No.
Qvic and' Other Amenities. ] 979
Class and Name of Town
Civic Population Administration
Status (in 1980)
2 3
II Gandhinagar NA
~ethod of
Disposal
Protected Water Supply
of Source System of Storage with capacity in Litres
Night of Soil Supply
ilire Fighting Service
(in brackets)
4
62,443
Domestic
Scheduled Castes and Scheduled
Tribes Population
5
----------- ---------:-:c------:--Road. System Number of Latrines Length of
(in Kms.) Sewerage
6 7
Water Borne
Service Others
9 10
SC - 7,893 PR -- (93.14) 5
8
16,000 ST-l,250
Electrification (Number of Connections ) Industrial Commercial---Roal Lighting-others---SC
(points) No.
-------- ----:--:------:--- ::------11 12 13 14 15 ---17-----1-8-----19---
s T
IG (22,500,00)
BWP. (20,000,000)
Yes 11,598
24
16
70 764 4,912 483
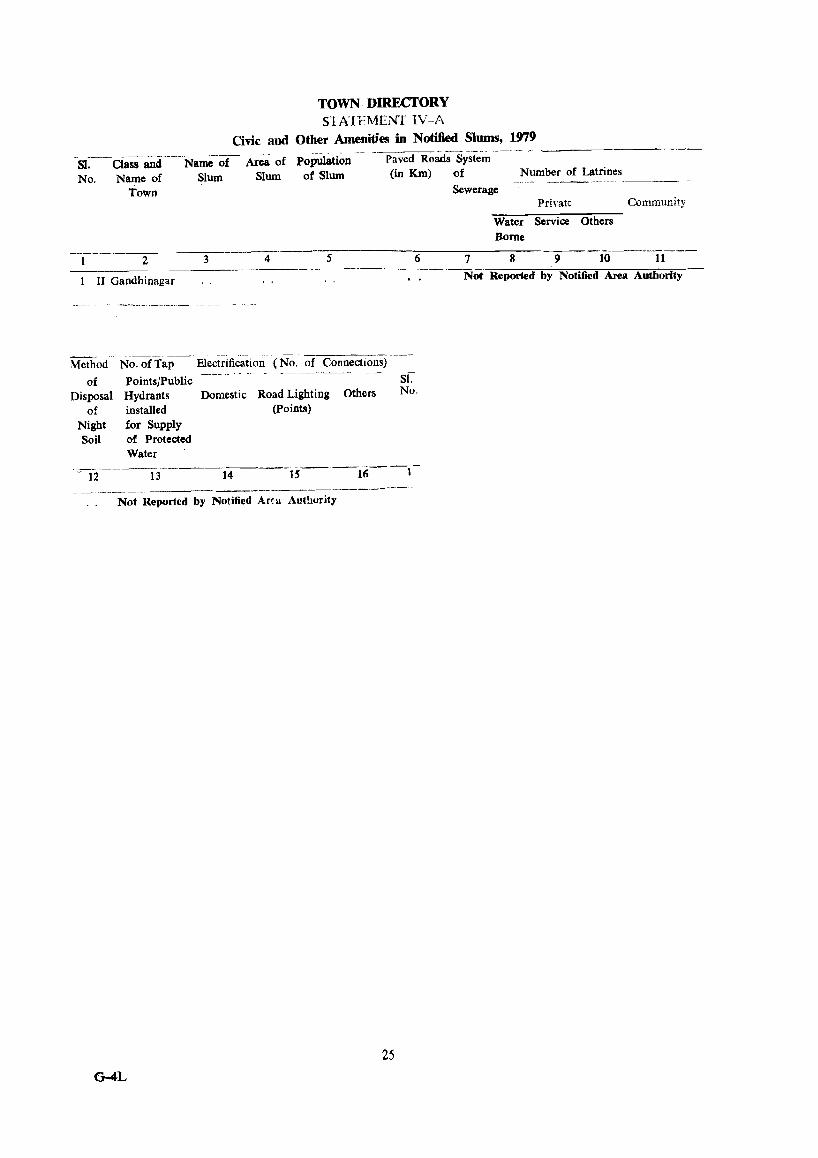
TOWN DIRECTORY STA'IEMENI' IV-A
Chic and Other Amenities in Notified Slums, 1979 - -- .--------- -----_ SI. Class and Name of Area of Population
No. Name of Slum Slum of Slum
Town
2 3 4 5
------:--:---- -------- _-- ---- _ Paved Roads System (in Km) of
Sewerage
Number of Latrines
Private
Water Service Others Borne
6 7 8 9 10
Community
11
II Gandhinagar -~ot Reported by Notified Area Authority
Method N;' of Ta-p--Eiectrificati~<No. of Connections) of Points/Public -- -- - --- --------------Sl.
Disposal Hydrants Domestic Road Lighting Others No. of installed (points)
Night for Supply Soil of Protected
Water - 12 13 ----------14-----'5----16- -1-
- -------------------------- ---Not Reported by Notified Ar~a Authority
25 G-4L

TOWN DIRECTORY STATEMENT V
Mectical, Educational, Recreational and O!JltUl'aJ Facilities, 1979 .------. ---_. -.------~----
SL Class and No. Name of
Town
2
Medical Facilities
Population Hospitals! I1eds in
3
Dispen- Medical saries/T.I1. Institutions
Clinics, etc. noted in Column 4
4 5
Artsj Science! Commerce Colleges (of Degree Level and above)
6
Medical Engineering Colleges Colleges
7 8
Educational
Polytechnics
9
-1 -iI Gandhinaga;---62-;-443 ···-ii-={l)--iOO ----AC(i-)--A~adab;dAhmadab;d---A.tllnadab_;_d-D-(14) S (1) (35.4) (35.4) (35.4)
Tn -( 1) NH- ( 1) FC- ( 1)
Note In Gujarat State the levels of education are classified as under:
(1) Prilll1lry (from Std. I to VII passed) (2) SecondaryjMatriculation (from Std. VIn to X passed) (3) Higher Secondary (from Std. XI to XII passed)
Hence the details under Cot 13 are not shown.
STATEMENT V - Contd. -- .. --.---------------~
Facilities
Recognised Higher Secondary! Junior Primary Shorthand, Secondary, Matricu- Secon- Schools
Adult Literacy Centres, C1assesj
Others
Number of Recreational and Cultural Facilities
Working Stadia Cinema Auditoriaj Public
Type- Interme- lation and writing diate/' dary and PUC Midd'le Vocational (Pre- Schools Training University Institutions College!
10
Junior College level)
11 12 13
(Specify)
14 15 10 4 6 ~i9-----·
26
Women's Drama! Libraries Hostels Community including with Halls Reading S1. Number Rooms No. of Seats
----;:---_._-----16 17 18 19 20
2 2 PL-l J

TOWN DIRECTORY STATEMENT VI
Til'ade, Commerce, Industry and Banking, 1979
S1. Class and Name No. of Town
Name of Three Most Important ____ Commodities Imported
Name of Three Most Important Commodities Exported
lst 2nd 3rd
.------------ -- ------II Gandhinagar Foodgrains
ST ATEMENT VI Contd.
4
Medicines
Number of ftanks
5
Edible Oil
Number of Agricultural
1st
6
2nd
7
Number of Non-Agricultun.
3rd
8
S1. Name of Three Most Important
Commodities Manufactured --ls.-----2nd-----3rd- Credit Societies Credit Societies No.
9 10 11 12 13 14
.. . .. • i 12 i,
APPENDIX
TOWNS SHOWING THEIR OUTGROWTII WITH POPULATION
st. Name of the Town No. with Location Code
Population 01 Core Town
Out Growth Population of Out Growth
--------- ----------_---------------------------~ 2 3 4 s
Nil -----------------
27


PART xm-B
PRIMARY CENSUS ABSTRACf
0-1

'~EXJ»LANATORY NOTE FOR PRIMARY C'ENSUS ABSTRACf
Primary Census Abstract of' 1981 Census provides information in respect of each ,village in rural area and town/ward in urban area. It gives information about the
area of the village in hectares and towns in Square Kilometers, number of occupied residential houses and households. 'total population with sex break-up (including Houseless and Institutional Population) and population of Scheduled Castes and
Scheduled Tribes. Literates. The entire population of village/town/ward is divided into main workers, marginal workers and :~on~v{Orkers and main workers are further divided in to four broad industrial categories as under :
1. Cultiva:tor~ (I) 2. Agricultural Labourers (Il) 3. Household Industry -
Manufacturing, Proce~sillg, Servicing and Repairs [V(a)l 4. Other Workers [III, IV. V ( b) & VI to IX]
The sexwise break-up of total main workers (industrial category I to IX) has been presented in addition to similar break-up fo~ each broad industrial category of workers.
marginal workers an non-w()rker~.
The following abbreviations have been used in tile Primary Census Abstract far facility of presentation :
1. Municipal Corpor!1 t1 ol1 Me 2. Municipality M 3. Non-Municipal Area NM 4. Nagar Panchayat NP 5. Village Panchayat VP 6. Cantonment Cantt. 7. Notified Area n.a. 8. Industrial Notified Area INA 9. Not Available NA
10. Urban Agglomeration VA 11. Out-Growth OG
The following conversion factor has been used for converting acres into hectar~ and hectares in'o Km2.
Acres X 0.40467 = Hectares flectare3 X 100 = Krn2.
1

DISTRICT PRIMARY CENSUS ABSRACf
(GENERAL)

DISTRICT : GANDmNAGAR DISTRICT PRIMARY
Location Code No.
11
1
Name 01-District/ Taluka/ Mahal
2
Total Rural Urban
3 .-------~-----~--~ -_._
GAl~DJUNAGAR
DISTRICT T R U
Gandhinagar Taluka
T R U
Area inKm2
,~ No. of - - -- ---- -.- ~ _. ----- - _'h~'~ - .~. -- -~ .. _ •• __ ._-.... __ . __
Occu-pied Residential Houses
No. of Households
T('tal Population (illclu~Lng Institutional and
Houseless Population) --.",p---- -r.'r '---"'F""--
------.-- ._--_._ ._-_. __ ._------_--_._------4 6 7 8 9
·649.0 54,618 56,594 289,088 150,194 138,894 592.2 42,027 43,762 22(;.645 116,57.' 110,0'70 56.8 12,591 12,832 62,443 33,61Y 28,824
G5L4 54,618 56,594 289,08S 150J9·~' 138,894 .°')4.6 42,027 43,762 226,64j 116,57< 110,070 5fi.8 12,591 12,832 62,4·:; 33.619 28,824
• . These represent provisional 'geographical area' figures suprlied by the Surveyor General. riel-rICs for urban area are those supplied by the local bodies. Arca figures for rural area are ckrived by sub:,tracting the urban area from the total area of the Di~'r;ct. The total area figures of the Talukas;Mahals \" ill n,)t tally with the district figures because the f"rmer represent 'land use' area and are derived from the ilglll'<:s s~,pj:'lirJ by the Director of Land Re~ords.
-------_ .. _-_-_-- .. -~-------- ... ------
M A IN
Loca- Name of Total T~)~al I\fain Cuitivators Agricultural Household Industry-tion Districtf Rural Workers Laboulers Manufacturing, Code Taluka! Urban (I-IX) (I) (II) Proc~ssing, Servicing No. Mahal :lnd Repairs
[V (a)] -_ •.. ---------
M F M F M F M F -------
2 3 16 17 H> 19 20 21 22 23
11 GANDHINAGAR DISTRICT
T 73,95 .. 10,757 18,786 674 16,269 5,596 1,560 158 R 58,517 8,745 18,691 671 15,572 5,440 1.466 241 U 15,437 2,012 95 3 697 156 94 17
1 Gandhinagar Taluka
T i3,%~ 10,757 18,786 674 16,26~ 5,596 1,560 258 R 58,517 8,745 18,691 671 15.572 5,440 , 166 241 U 15,437 2,012 95 3 697 156 94 17
4
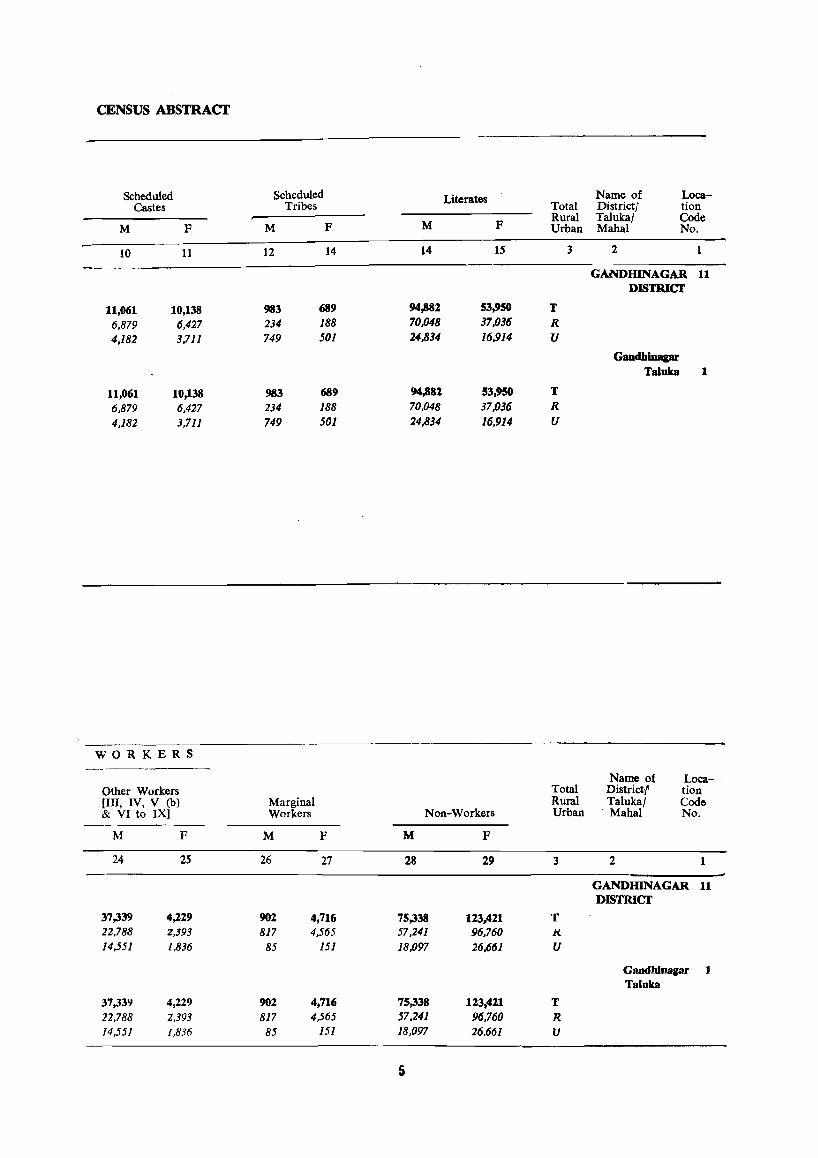
CENSUS ABSTRACf
Scheduled Scheduled Literates Name of Loca-Castes Tribes Total District; tion
M F Rural Taluka/ Code
M F M F Urban Mahal No.
10 11 12 14 14 15 3 2
GANDHINAGAR 11 DISTRlCf
11,061 10,138 983 689 94,882 53,950 T
6,879 6,427 234 188 70.048 37.036 R 4,182 3,711 749 501 24,834 16,914 U
Gandhina&ar Taluka 1
11,061 10,138 983 689 94,882 53,950 T
6,879 6,427 234 188 70,048 37.036 R
4,182 3,711 749 501 24,834 16,914 U
WORKERS
Name of Loca-Other Workers Total District'f tion [III, IV, V (b) Marginal Rural Taluka/ Code & VI to IX] Workers Non-Workers Urban . Mahal No.
M F M F M F
24 25 26 27 28 29 3 2 1
GANDHINAGAR 11 DISTRlCf
37,339 4,229 902 4,716 75,338 1l3,411 T 22,788 2,393 817 4,565 57,241 96,760 1< 14,551 1,836 85 151 18,097 26.661 U
GandhlDapr 1 Taluka
37,339 4,229 902 4,716 75,338 123.421 T 22,788 2.393 817 4,565 57,241 96.760 R 14,551 1.836 85 151 18,097 26.661 U
5

DISTRICT PRIMARY CENSUS ABSTRACf
(SCHEDULED CASTES)
1.

DISTRIcr : GANDIDNAGAR
Loca- Name of Total No. of tion District/ Rural Hoose-Code Taluka/ Urban holds No. Mahal with
SC Meillbel
2 3 4
11 GANDIDNAGAR DISTRICf
1 Gandhinagar Taluh
T R U
T R U
3,991 2,498 1,493
3,991 2,498 1,493
CENSUS ABSTRACt'
CASTES
WORKERS
Household Tndustry-
Total SC Population (including Institutional and Houseless Population)
p M F
5 6 7
21,199 11,061 10,138 13.306 6,879 6,427 7,893. 4,182 3,711
21,199 11.061 10,138 13.306 6,879 6,417 7,893 4,182 3,711
Man ufact uring, Processing, Other Workers
Agricultural Servicing [III, IV, Labourers and Repairs V (b) &
(II ) [V (a») VI to IX)
P M F P M F P M F P
17 18 19 20 21 22 23 24 25 26
1,870 1,190 680 78 59 19 3,717 3,232 485 US 1,850 1,177 673 75 57 18 ],iS3 1,577 206 230
20 13 7 3 2 1 1,934 1,655 279 35
1,870 1,190 680 78 59 19 3,717 3,232 485 265 1,850 1,177 673 75 57 18 1,783 1,577 206 230
20 13 7 3 2 1 1,934 1,655 279 35
8
Literates
p M F
8 9 10
12,598 7,692 4,906 7,397 4,636 2,761 5,201 3,056 2,145
12,598 7,692 4,906 7,397 4,636 2,761 5,201 3,056 2,145
Marginal Workers
DISTRIcr PRIMARY
SCHEDULED
MAIN
Total Milii-- -Cultivtaors Workers (I)
(I-IX )
p M F
11 12 13
5,858 4,667 1,191 3,901 2,997 904
1,957 J ,670 287
5,858 4,6()7 1.191 3,901 2,997 Q()4
, ,957 1,670 287
Non-Workers
P M F
14 15 16
193 186 7 193 186 7
193 186 7 193 186 7
Loca-tion Code No.
---M F P M F
27 28 29 ~O 31
57 208 15,076 6,337 8,739 11 40 190 9,175 3,842 5,333 1 GANDHINAGAR 17 18 5,901 2,495 3,406 DISTRICf
57 208 15,076 6,337 8,739 40 190 9,175 3.842 5,333 Gandhinagsr 17 18 5,901 2.495 3.406 Taluka

DISTRICf PRIMARY CENSUS ABSTRACf
(SCHEDULED TRIBES)

DISTRICf GANDHINAGAR
Location Code No.
Name of District/ Taluka' Mahal
Total No. of Rural HouseUrban holds
----------- --2 3
11 GANDHINAGAR DISTIRCf
T R U
1 GANDBINAGAR TALUKA
T R U
with Sf
Member
-- --_---4
369 104 265
369 104 265
Total Sf Population (including Institutional and Houseless, Population)
P M F
'i (, 7
1,672 983 689 422 234 188
1,250 749 SOl
1,671 983 689 422 234 188
1,250 749 501
Literate~
P M F _ .--- ---_ 8 " 10 " -----_-
601 439 161 51 42 9
550 397 153
601 439 161 51 42 9
550 397 153
DISTRICI' PRIMARY
SCHEDULED
Total Main workers
(I-IX )
P M F
11 12 13 _-_._
759 610 l~n
215 161 5~-(
.~44 449 95
759 610 149 215 161 54 544 449 95
MAIN
Cultivators ( I )
P M' F -----_
14 15 16 -- --
2 1 •.
2 2 ..
1 1 •.
2 2 ..
-------- -_ ---_-- --.-----.-~,------
CENSUS ABSI'RACf
TRIBES
WORKERS
Agricultural Labourers
(n)
p M F
17 18 19
Household IndustryManufacturing, Processing, Servicing and Repa irs, [v (a) ]
P 1\1 F
20 21 22 ---. - ---- -- ----~ --._.--- .-_._-_.- --
224 169 55 1 1
109 96 13
115 73 ,,2 1 1
124 169 55 1 1 109 96 13 115 73 42
Other Workers [III, IV, V (b) & V to IX]
P M F
23 24 25 ---- --
532 438 94
106 65 41
426 373 53
:'.U 438 94 106 65 41 ·f1fi 373 53
10
Loca-
Non-tion
Marginal Code Workers Workers No.
-------P M F P M F
26 27 28 29 30 31
11 3 9 901 ~70 531 11 4 I 3 203 72 131 GANDIllNAGAR 8 2 6 69~' 298 400 DISTRICT
12 3 9 1/>411 370 531 4 3 203 72 131 Gandhinagar 8 2 6 fi98 298 400 Taluka

VILLAGEjTOWNWISE PRIMARY CENSUS ABSTRACT
11

13
T,ALUKA GANDHINAGAR

TALUKA : GANDmNAGAR '-'--Name of--____'"
Village! Area of Urban ViJIag~ in
Loca- Agg!omc- hectares tion ration! & of Towill Code Town/ Ward in No. Ward Km2 -------------_ .. _-
No. of Occupied Residential Houses
No. of Households
Total Population (including Institutional and Houseless Population) P M F
Scheduled Castes
M F
URBAN {VILLAGE
Scheduled Tr:bes M F
Literates
2 3 4 --------------------- -~-~---.----
M F -.-"---~--
1 Gandhinagar District
Total
Rural
Urban
Gandhinagar Ta!uka Tota)
Rural
Urball
RURAL AREAS Sardhav
2 Rupal 3 Vasan 4 Unava 5 Pindharada
6 Rajpur 7 Chekhalarani 8 Iakhora 9 Chhala
10 Dolarana Vasana
11 Piplaj 12 Randheja 13 Sonipur 14 Ialund
15 Adraj Moti
16 Kolavadll 17 Pethapur 18 Lekawada 19 Bhundia 20 Dashela
21 Dhanap 22 Giyod 23 Mahudara 24 Shiholi Moti 25 Alampur
K.mt. 649.0 Km2, 592.2 Km!, 56.8
Km' 651.4
Hectares (65142.64)
54,618
42,027
12,591
54,618
Kill:, 42,027
594.6
Hectares (59,468.19)
Km", 56.8
1.161.07
1,722.85
804.36 1,407.32 5%.13
261.08
325.78
598.38 2,168.93
1,075.45
1,168.19 1,418.89
~31.44
544.91 1,175.47
1,684.91 2,526.48
527.61
386.39 1,165.66
1.019.16
865.27 853.33
709.95 371.21
12,591
1,427
1.146
420 1,206 236
40 118
428 968 62<)
366 1,748
238 203
1,011
1,575 2,067
226
102
496
396 400 273
524 316
43,762
12,832
56,594
43,762
12,831
1.4:\7
1.150
431
1,206 236
40
120
455 987
643
367 1,757
238
225 1,022
1,612 2,206
228
103
518
447 400 280
524
316
5
---------,-,---.~- .. __ ----
6 7 8
289,088 138,894
150,194 226,645 110,070
116,575
62,443 28,824 33,619
289.088 D8.894 I ~0.19.t
226.645 110,070
116,575
62.44.< 28.824
33.619
7.216 3,681
5,980 3.035 2,390 1,237
6.413 3.254 1,167 593
241 133
(126 319
2.406 1,201
5,115 2.594
3.150 1.600
3,.'135 1,945 1,153
3.159 574
108 307
1,205 2,521
1.550
1,597 821 77h 9,245 4,769 4,476
1,329 706 1l2)
1,253 1139 614
5,603 2,H46 2,757
8,341 4,239
11,319 5841
1,258 655
492 250
2,723 1,369
2,462 1,226 1,930 959 1,640 840 2,732 1.379
1,731 874
4,102
5.478 603 242
1,354
1,236 971
SOO 1,353
857
<)
!I,061
6,879
4,18]
11.061
15,879
4,182
263 301 76
323 24
5 1~3
135 6B
36 472
11 12~
255 363
61 110
45
126 66 73
36
10 II 12 13 14
HI,DB 689 53.9~
983 94,882 15,427 188 37,036
234 70.048 3.7l! 501 16,914
749 24,834
10,1 _;" 689 53.950 983 94,882
6,427 188 37,036
234 70,048
3:: l! 501
248 3()(l
29 452
II;
109
235 :125
·n 117
52 121 70
70
749
3
40
8
2
2 22
4
16,914 24,834
2,584 1,999
697
1,990 335
29
139 602
1,724 888
474 3,161
493
350 1,446
2,707
3,236 351
196
735
668 509 505
881 573
1,894
1,366 360
1,337 151
50
283
796
527
254 1,934
180
168 317
1,636
1,856 164 117
292
314 157 221
290 249
• These represent provisional, 'geographical area' figures sup plied by the Surveyor General. Figures for Urban area are those ,upplied by the local bodies. Area figures for rural area are derived by substracting the urban area from the total area of the District. The lotal of the area figures of the Talukas/Mahals will not tallv with the district figures hecause the former represent 'land use' area arc derievd from the figures supplied hy the Dir~ctor of Land Records.
14

.PRIMARY CENSUS ABSTRACT ----, ...... ---.---. \I A [N W 0 R K E R~S;;--------------
Total Main Worker!(I-IX ) Agricultural
Cult 'Htp1"S Labourers (I) (In
M--F 11-F-- --~f F
15 i0 17 I;,;
73,954 18,786 10,757 674
58,517 18,691 8,745 671
15,437 95 2,012
73,954 18,786 10,757 674
58,517 18,691 8,743 671
15,437 95 2,0/2 3
1,836 1 t.':: 652 16
1,435 495 456 47 601 19r, 2R8
1,592 232 526 3
295 12 '78
66 5 65 4
180 16 42 4
619 124 256 10 1,257 314 546 40
772 148 257 5
397 39 15-1
2,308 427 574 20
357 16 zoo 306 55 186 15
1,490 138 621 2
2,003 273 644 11 3,027 185 462 9
297 37 88 86 12 54 11
723 221 320 3
609 188 276 Ii 494 50 209 29
461 8 228 709 57 376 4 444 YO 1M 2
19 2()
16,269
5,596
5,440 697
156
16,269
5,596
15,572 5,440
697 156
493 lC~
567 427 195 35 728 lcl~'
203 11
106 8 269 W2 325 230 222 99
160 33 708 357 104 Ii 62 39
390 87
600 216 866 74 109 35
16 1 283 209
257 158
219 11 146 7 153 25 182 86
Househ<>ld Industry· ManufactJring, Processing, Servicing and Repairs [V(a)]
M F
21
1,560
/,466
94
1.560
/,466
94
26 18 17 21
1
11
258
241
17
258
17
9 5
46 'n
129 2~
In
86 3 3
14 15
47 139 3
7
12 19 10 5 17 .'4 4
1 S
Other Workers [Ill, N, V ( b) & Marginal VI to IX 1 Workers 'M F -51--'1'
23 24 25 26
37,339 '}02 4.229 4716
21,788 ,\17 2,3'13 4,565
14,551 85 J,S36 1.'/
37,339 902
4,229 4.716
22,788 817 2,3'13 4,565
14,551 1,836
665 35 394 lfi 101 149 317 41
13
31 ~3
340 164
76 940
50 58
465
712 1,560
100 16
113
4 12 22 16
3 47
7
34
46 99
2
3 5
2
85 151
5 850 12 145 5 29
38 :·11 2
4 84 8 4R
23 !l4 27 120
9 152 12 118 17 266
181
21
44 104 9 55
1 18 12 4 2r,()
IS
, 13
Loca . tion Code No.
1\011-
Workers M F
27
75.338
57,241
18,097
75,338
57,241
18,097
1.840 1,588
631 1,624
29~
67 135 574
1,314 801
415
2.449 332 333
1,356
2.192 2,805
357
146 642
602
464 379
668 430
28
123,421
96,760
26,661
113,421
96,760
26,661
2,523 2,305
938 2.7~6
560
103
II
4 5
'207 7 1,033 8
I,2(j2 10
585 11
3.931 12 341 13 378 14
2,598 15
3,725 16 5,238 17
566 18 218 19 873 20
1.048 21 '}() 1 22 792 23
1,Z83 24 604 25
~ --------- --- --- - -- -.---~--

TALUKA: GANDmNAGAR URBANjVlLLAGE ,,, __ .. _--_.
-------,,---~~------,,-.,,'-
Name of Villagep Urb:lll
L'o.ca- Agg}ometion' ration! Cod.c Towr./ No. Ward
2:
26 Pundarasan 27 Titoda
28 Bhoyan Rathod 29 Shertha 30 Unvarsad
31 Vavol 3l Palaj
;33 Chiloda 34 Isanpur Mota 35 Magadi
36 Prantiya 37 Basan
Area of Village in :-!~ctares & of Town! Ward in Km')
3
256.72 991.24
156.06 1,258.10 1,727.05
761.35
1,119.98 582.84
1,285.10 " 1,355.84
38. Vasana Hadmatiil 39 Sargasan ..
484.87
53.08
67.87
536.28 354.11 40 Tanipur'
41 DantaJi 42 Jamiyatpur 43 Adalaj 44 Por 45 Kun4asan
46 Randesan 47 Shah pur 48 Ratanpur 49 Lavarpur
50 Dabhoda
51 Vadodara 52 Pirojpur 53 Raysan 54 Koba 55 Ambapur
56 KhoraJ 57 Zund~l 58 Amiyapur 59 Sugad'
60 Nabhoi.,.
61 Karai~.' 62 yalad
63 Vankanerda 64 Galudan 65 Sonarda
66 Viratala vd i 67 Medfli 68 Limbadia 69 Bhat 70 Chandkheda
399.48 369.87
1,791.47
587.16 731.46
348.54
689.75
520.63 431.10
2,307.40
1,275.05 592.50 354.65
575.12
549.45
762.85 668.92
197.35 427.41 291.07
462.07
'. J ,594.38 478.72
714.53 732.15
258.38
. 469.42
35200
694.95
1,047.95
No. of Occupied Resi~ dential Houses
4
301
902 284
1,295 1,371
814
505 449
733 580
551
149 10
235 337
274
401
1,046 703
389
76
331 171
330 1,830
849 199 219
345
490
802
561
200 248 .70
69
1,375 210
372
357
238
233 145
277
1,956
;--';0. of House...:. holds
5
301
908
295
1,326 1,381
852
517 449 771 642
558
149 10
235 337
284
673 1,514
837
409
76 346 17)
330 1,830
849
200 219 345 490
806
571 200 248 79.
69
1,379 210 373
375
243 237 145 306
2,064
Total Population (including Institutional and. Houseless Population) P M F
1,475
4,729
1,665
6,771
7,027
766
2,498 845
3.,523
3,585
8
709
2,231 820
3,248 3,442
4 6.12 2,359 2,253 2,670 1,375 1,295 2,398 1.231 1.167 3,923 1.988 1,935 3,475 1,843 1,632
3,054 1.544
892 452
46 27
1,222 628 1,604 831
1,495 780 3.360 1,786 7,291 3,722
4,273 2,219
2,212 1,164
456 228
2,026 1.013 917 495
1,790 915 9.737 4,903
4,463 2.346 1,126 605 1.183 593 1,961 890
2558 1,300
4.272 2,759
955 1,240
378
2,170
1,431
493
641
213.
1,510
440 19
594 773
715 1,574 3,569
2.054 1.048
228 1.013
422
875 4.834
2,117 521 590
1,071
1,258
2.102 1,328
462 599 165
403 214 189
6,652 3,478 3,174 1,146 588 558
2,083 1,118 965 2,082 1,058 1.024
1,281 659 622
1.284 65 J 633 910 469 441
1.634 R58 776
10,240 5,431 4,809
16
Scheduled Scheduled Castes Tribes Literates M-----F--~F M --P 9,.
10 76
74 237, 92
191 78
81
98 102
90
76 2
17 25
181 12(, 46
75
8 63
292
33·
5R 59 15 .
72 39
44
396 25
124
106
62 41 13· 108
2Cf7
10 11 12 13 14 --------------------
13 427 189 67 6 8 1,218 322 65 474 195
215 2,486 1,628 84 3 2 1,995 953
209 • . 1,361 866
59 890 439 92 . ../ .. J 822 430
101 1,219 749 105 21 18 1,004 4S~
82
57 3
11 17
200
93 50
69 4
56 267
29
41 91
16
77
27
40
12
I I
· .. 3
I •
9
• I
· .-
• •
9
1
.. .
10
• i
· . 2 2
10
· .
· . 8
2
, .
369 56 42 2(1
93 19 18
103 9 6
52 4J
7 8R
272 ~ I
29 i. 26
1,070 258 21
447 415
417 903
1,727 1,393
723
129 621 275 758
2,837
1,006 432 413 582 780.
1,480 1,039. 280. 399
83
580
65 10
222 105
153 442
1,182 715
368
42
304 91
500 1,221
386 148 257
593
458
813 612 77
158 36
56 26 1,743 659
394 260 676 305
481 237
391 , •.. 101
332 187
327 175
493 202 3,974 2.784

PRIMARY CENSUS ABSTRAcr \[ A I N W 0 R K E R S
Total Main Workers (I-IX )
CdtiY:ltllfS II)
M l' \1 f,-------_- - -"~--~
15 16 17 Ii'
395 84 1,319 145
436 21 1,595 194 1,746 23;
1,125 180 632 28 649 29 938 113
1,013 <::J
761 III 200 _,
10 293 188 405 6)
386 45 1,141 559 2,134 44~
1,199 ~3_i
535 27
114 53 497 262 251 2
434 23 2,434 340
1,109 39 336. 138 306 70 452 192 669 5~
1,120 76 684 192 223 23 280 12 106 23
126 7 1,8')1 .111
302 10 572 15 561 13
342 70 331 99 258 8 443 12
2,537 136
234 6 801 39 169 378 8 618 18
208 3
138 221 3 320 359 3
311 6 53
9 131 7
91
114 17 127 20 181 1 245 3 188 1
90 18 195. 3 167 1 243 1 978 101
549 91
108
2
1'"1 -, 156 58 283 4
219 5 123 62 2
114 5 2::1 4
61 5 -169 6 179 218 278
183 12 120 1 100 2 ll~
201 12
Agricultural LaJ:,ourers
(II )
M F 19 20
119 77 202 90 153 18 328 145 559 179
379 89 257 26 112 II 371 86 505 31
153 90 80 :;
22 177 6i 6
79 t 1 74 58
417 62 286 52 221 20
13 35 202 250 54 34 12
325 176
251 2-:: 214 136 104 35 144 101 172 26
270 55 169 169
38 20 24 3 30 18
36 360 192 45 10
208 7 135 8
90 58 96 96 64 3 41
274 33
Household Industry-Manufacturing Other Workers Processing, [III, IV,
.' Servicing and V ( b) & '. Repairs [V(a)] VI to 1X1
M F M F ---
21 22
42 316 ](, III 2
866 "9 16 4 553 36
23 ::! 515 86 4 233 2
315 15 20 :2 227 2':: 4 145 6
10 287 14 51i I
15 125 4 91 52 162 5
192 17 13 93') 468
83 6 1.453 37') 23 2 645 178 12 2 114 4
Marginal Workers
M F
25 6 :<~;
51 31 19 ~\1I
26 ~4
2 28
3 3
14 60
4 32 20
18 7 B9
I·; 2 'l]
5
11 5 11 89 30 145
4 29 24
12 29 5
10
4 17 11
13 61
5
17 I 5 3
7 Ii
7
9
i
153 2
17
109
to 1 46 1.102 5S 33 93
299 31 90
135 203
618 331 123 137 48
10 1 8
26 22
16 13 1 4
1
29 2 1.045 ::!O'i
77 141 8 145 4
(,~
115 2 87 3
272 JO 1'<):)9 li9
15 2
3
2
5 85 7 7
48 113 59 107 13
f 2
3
85 3~
Location Code No,
NonWorkers
M F 27 2ll
369 1,179
403 1,877
1,820
1,234 717 580
1,050 827
769 251
17 335 394
394 638
1,588 1,018
624
114 487 243 479
2,436
1,22~
269 284 438 ('29
1,045 740 222 302
94
S8 1,.587
286 546 497
316 319 211 413
2,857
625 26 2,061 27
761 2tl 3.023 29 3,004 30
2,072 31 1.233 31 1.110 33 1,730 34 1,589 35
1,339 36 435 37
19 3~
402 3') 690 40
652 41 876 42
3.107 43 1,728 44 1,021 45
175 46 727 ~7
311 48 80S 4')
4,401 50
7,076 3!i3 519
51
878 54 1.205 55
1,941 56 1,129 57
326 58 480 59 142 60
IS2 61 2,751 62
548 63 950 64
1,008 65
550 (,6
531 67 433 68 67f1 (,<I
4,641 70
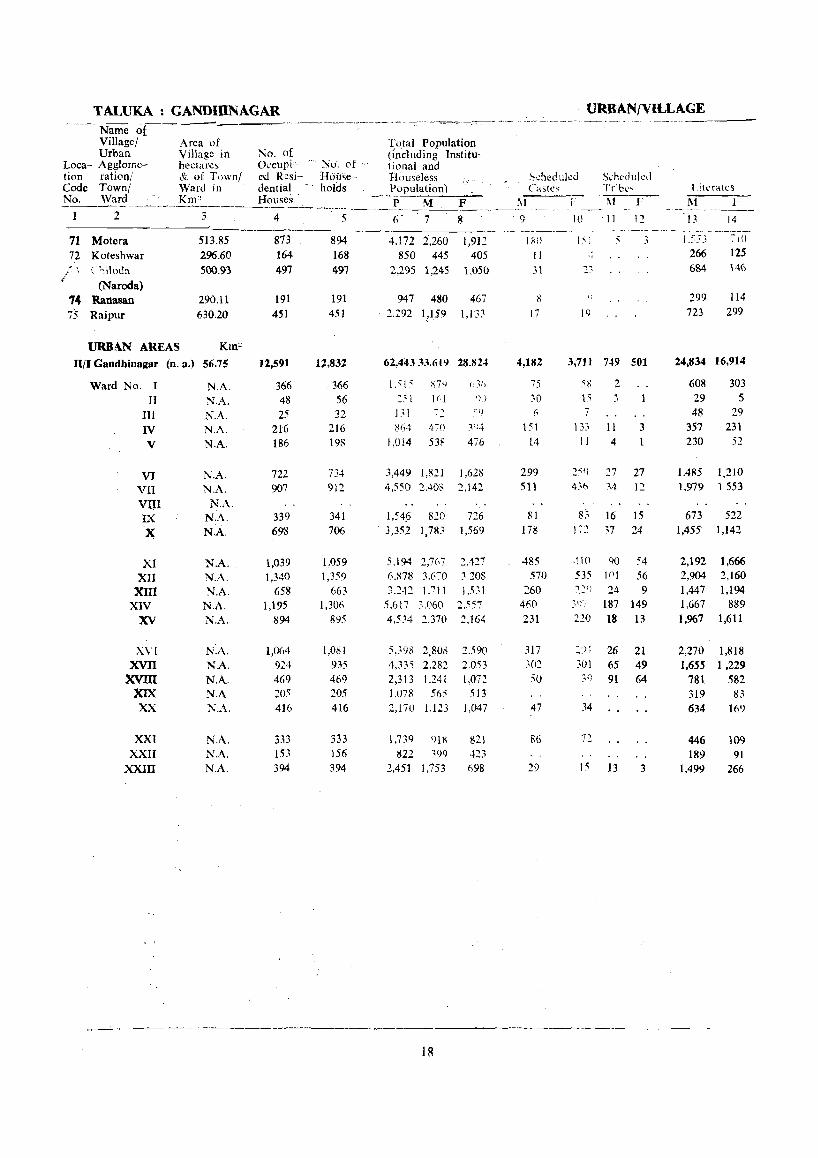
TALUKA GANDHINAGAR URBAN{VILLAGE Name of Village/ Urban
._---- ._-----------_ ... __ . ---.--.. -~~.--.- - ---_._----_ ._.
Loca- Agglometion ration/ Code Town! No. Ward
2
71 Motera 72 Koteshwar
/ ~ C'~;\()da
" (Naroda) 74 Ranasan 75 Raipur
Area of Village in hectares & of Town/ Ward in Km"
3
513.85 296.60
500.93
290.11 630.20
URBAN AREAS Km2
njl Gandhinagar (n. a.) 56.75
Ward No. I ]I
III IV V
VJ vn VllI IX '~
XI XII xm
XIV XV
XV[ XVII xvm
XIX XX
XXI XXII
XXIII
N.A. I\.A. N.A. N.:'>.
NA.
N.A. ('.lA. NA
N.A. N.A.
NA. XA. "'1.A.
N.A. N.A.
N.A. N.A. NAN.A N.A.
N.A. N.A N.A.
~o. of O..-cupic-·
od Resi'dential Houses
4
873 164 497
191
451
12,591
366 48
25 216 186
722 907
339 69'3
1,039 1,340
658 1,195
894
1,()64
924 469 205 416
333-153
394
No. of . HOll~e-· holds
5
894 168 497
191
451
U,832
366 56 32
216 19R
734 91:2
341 706
1,059 1,359
663 1,306
895
1,0g I 9}5
469 205 416
333 156 394
l:otal PopUlation (including Institutional and 'Hiiuseless
___ _Popul_a_ti_o_n )'--...._..;;._ P M F
6' 7 8
4.172 2,260 850 445
2,295 1,245
947 480 2.292 1,159
1,912 405
1,OSO
467
1.133
62,44333.619 28,824
151' 'ii')
::.' I I (.j
131 72 :<114 470
J ,014 53~
3,449 1.821 4,550 2.408
1,54? 820 3,352 1,783
5.194 2,7(,7 6.~78 3,670
3.242 1.711 5,617 3.060 4,534 2,370
5,393 2,808 4.335 2,282 2,313 1.241 1.078 565 2,170 1.123
1.739 918
476
1,628 2,142
726 1,569
:'...127 3,2OS 1.5~ 1
2.557 2.164
2.590 2.053 l,On
513 1,047
821 822 399 423
2,451 1,753 Ii 98
IR
S",hcdulcd SC'hedulcd Td,\> Castes
1\1
Il:O 11
31
~
17
4,182
75 30 11
151
14
299 511
81 1715
485 570
260 460 231
3i7 302 50
47
86
29
\I}'-
10 II 12
.;
19
3,711 749 501
l.~ :.;
7 133 11 3
II 4 1
2,1)
436
1_, 1-
27 :;4
16 37
27 12
15 24
"no 90 54 535 101 56 220 24 9 ~l/; 187 149 220 18 13
-',1. ! __ _}- f
301
.14
26 65 91
J" 13
21 49 64
3
l.iterates
1\1 F 13 14
266 684
299
723
-; il)
125 146
114
299
24,834 16,914
608 303 29 5 48 29
357 231 230 52
1.485 1,979
673 1,455
2,192 2,904 1,447 1,667 1,967
1,210 1553
522 1,142
1,666 2,160 1,194
889 1,611
2,270 1,818 1,655 1,229
781 582 319 83 634 169
446 189
1,499
109 91
266

PRIMARY CENSUS ABSTRACt
:\1 A I N W 0 R K E R S ---- .------.- .. Household Loca-
Total Main Industry- tion Workers Manufacturing Other Workers Code (I-IX ) Agricultural Processing, [III, IV, No.
Cuitivatof': Labourers Servicing and V(b) & Marginal Non-( I ) ( II) Repairs [V(a)] VltoIXL Workers Workers
M F -MF M F --M--F-- M F M P 1\1 F ~---'---'-- ----.
----.--~- -- ---_. 15 16 17 18 19 20 21 22 23 24 25 26 17 28
-------~.--~~~.-.-~----.-~---- ---- --- ---.---.' - __,,_ - - - -----~.-.. --- -
1,077 38 68 114 19 87 3 808 16 113 37 I,G70 1,837 71
230 22 37 84 17 2 107 5 13 215 370 n 740 128 177 5 119 114 13 431 Ii 505 922 73
233 17 135 7 41 8 57 2 246 4~9 74
583 20 331 7 71 2 4 177 11 21 121 555 992 75
15,437 1,Oll 95 3 697 156 94 17 14,551 1,836 85 151 18,097 .26,661 nIl
548 109 548 109 5 331 522
116 29 7 109 29 045 61 IT
36 3 36 3 .. 36 56 III
228 ... 7 228 47 3 " 239 345 lV .. 263 7 13 249 7 1 2 274 467 V
874 }34 873 134 6 946 1,488 VI
1,092 183 2 1,092 181 1,316 1,959 VII VlIl
423 87 422 86 397 638 IX
782 135 7 2 774 133 3 1.001 1,431 X
1,221 213 1,220 213 11 10 1,535 2,204 XI 1,625 237 5 5 2 1.615 235 6 12 2,039 2,959 XII
765 116 3 :2 762 114 I 1 945 1,414 xm 1,580 154 5 42 :2 ],533 15] 5 ],480 2,398 XN 1,024 127 1 6 1,022 121 6 1,346 2,031 XV
1,222 96 2 7 1,213 96 3 2 1.583 2,492 XVI 1,101 137 8 :! 1,093 135 1 1,180 1,915 XVII
661 126 179 110 482 16 2 580 944 XVIII 259 22 57 1 89 20 3 110 8 16 2~ 475 XIX 523 20 10 231 13 13 269 7 600 1,027 XX
369 16 6 120 9 243 6 50 72 499 733 XXI 193 4 12 S3 127 3 206 419 xxn 532 10 1 S31 10 5 1,221 683 XXIII
19


APPENDIX TO PRIMARY CENSUS ABSTRACl'
21

URBAN/VlLLAGE PRIMARY CENSUS ABSTRACT
APPENDIX
TOTAL, SCHEDULED CASTES AND SCHEDULED TRIBES POPULAHON-URBAN BLOCK-WISE
~-~~~-~-----~--------Loca- Name of tion T own/W ard Code Urban Block No.
2
IT/I/Gandhinagar Total
TotuI Ward : I Block No. 1
1/2
Total Ward : IT
Block No. 2
Total Ward : In Block No. 3
Total Ward : IV Block No. 4
Total Ward : V Block No. 5
Ii
Total Ward: VI Block No. 7
8 9
10 11 12
Total Ward : vn Block No. 13
14 15 16 17 18
19
Total Ward : VIII Total Ward : IX Block No. 20
21 22
Total Ward : X Block No. 23
24 25 2(;
27 28
Total Ward : XI Block No. 29
30 31 32
33 34
Total Population
3
62,443
1,515 978 537
251
251
131 131
864 864
1,014 270 744
3,449
573 608 642 527 55!! 541
4,550 524 631 694 685 737 659 620
1,546 460 Sl1 575
3,352 755 553 631 576 491 346
5,194 638 (l13
528 441 357 655
Schedu-- Schedu-led led Castes Tribes
4 5
7,893
133 129
4
45
45
13 13
285 284
25 20 5
549
148 76 62 63 97
103
947 151 103 90
262 1% 77 68
164 11 28
125
350 15 93 51 26 56
109
895 lOG 62 87
141 174
237
1,250
2 2
4
4
15 14
5 5
54 (,
14 Ii
15 13
46 4
4 5
10
20
31 I
13 17
61 5
4 37
15
144 (i
19 26 29
13
-----~~~ ~-~---
Ln,;} Name of tion Town/Ward Code Urban Block No. ~i-~~2'-
Total Popu
lation
3 -<~-~-~---
Block No. 35
36 37
Total Ward : XU Block No. 311
39
40 41 42 43 44
45 46 47 48 49 50 51 52
Total Ward : xm Block No. 53
54 55 56 57
T at:!l Ward : XIV Block ~o. 58
59 60 61 62 63 64 65
6(;
67
Total Ward: XV Block 1'\0. 68
69 70 71 72 73 74 75
Total Ward : XVI Block No. 76
568
51:1 8S1
6,878 575 <;2(>
415 401 415 464 513 483
499 640 475 467 367 470 16g
3,242 634
617
462 566 963
5,617 585 526 633 426 436
361 664 531 632 823
4,534 646 646 579 527 611 319 513 693
5,398 598
Schedu- Schedu -led led Castes Trib.es
4 5
29 19 40
1.105 55
140 178 112 120
81 160 60 54 81 25 4 4
13 18
489 124 130 16 94
125
857 132 92 33
9 49 12
113 162 79
176
451 25 48
40 181
64 33 44 16
611 50
2 32 16
157 6 9
35 42
14
10
33 2 6
33 12 9 2
10
336 45 17
2
23
129 120
31 7
4
12 8
47
----.. ----- - .. ---~- -- - -----------------------22

URBAN jVlLLAGE PRIMARY CENSUS ABSTRACT
APPENDjX (Contd.)
TOTAL, SCHEDULED CASTES AND scnE DULED TRIBES POPULA nON-URBAN BLOCK~.wISE
----_._------- ~___,"~---
Loca- Name of Loca- Name of
tion Town/Ward Total Schedll- Schcd- lion Town/Ward Total Schedu- Schedu-
Code Urban Block Popu- led led Code Urban Block Popu- led led
No. lation Castes TrilK> Nt'. lation Castes Tribe,
2 -_ ---~--~----
3 4 5 :2 3 -----~4----5-
--~~~-~-, "----~----- -----_ .. __ ._.____..._-- ~-.. --~-.---..
Block No. 77 628 49 Total Ward : XIX 1,(178
78 524 19 Block No. 96 425
79 395 28 fJ7 317
80 671 28 11 98 336
Block No. 81 714 109 10 Total Ward : XX 2,170 81 82 669 175 7 Block No. 99 643 83 493 115 19 100 523 81 84 706 38 101 190
Total Ward : XVll 4,335 603 114 102 614
Block No. 8S 589 23 :!3 Total Ward : XXI 1,739 153 86 305 13 38 Bcolk ~o. 103 451 87 730 51 104 342 1511 88 637 Q~ _ f 5 105 563 89 546 152 311 106 383 90 647 114 13
91 881 153 20 Total Ward : xxn 822 .. Rlock No. 107 822
Total Ward : XVllI 2,313 89 155 Total Ward: XXW 2,451 44 16 Block No. 92 688 51 Block No. 108 542
93 641 7 (> 109 426 94 481 110 623 33 4 95 503 31 149 III 860 11 12
-----
23