Prehistoric avian, mammalian and H.sapiens footprint-tracks ...
Upload
khangminh22Category
view
1download
0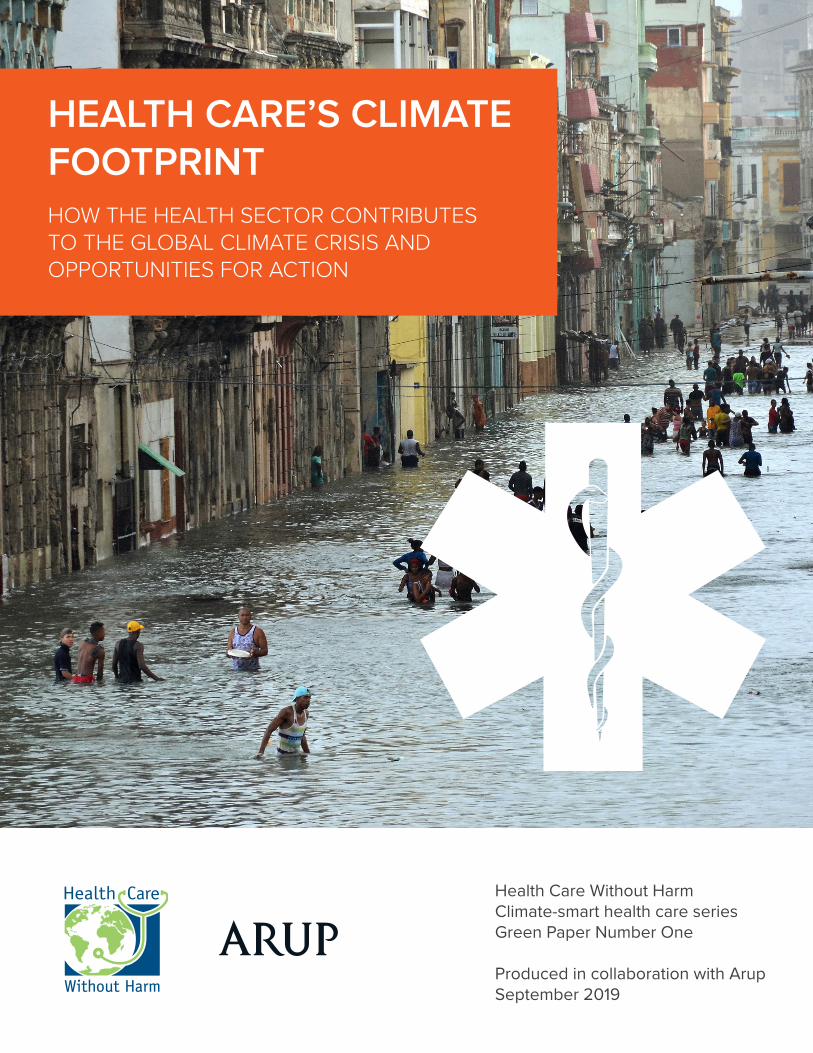
HEALTH CARE’S CLIMATE FOOTPRINTHOW THE HEALTH SECTOR CONTRIBUTES TO THE GLOBAL CLIMATE CRISIS AND OPPORTUNITIES FOR ACTION
Health Care Without Harm Climate-smart health care seriesGreen Paper Number One
Produced in collaboration with ArupSeptember 2019

About this paper: This is the first in a series of research and policy papers Health Care Without Harm and its partners, including Arup, aim to produce over the next three years. The series will define health care’s climate footprint and outline a set of actions the sector can take to align itself with the ambition of the Paris Agreement while simultaneously achieving global health goals. Future paper topics will include a global road map for health care decarbonization and resilience; strategies for national and sub-national governments to develop and implement climate-smart health care policies; decarbonizing the health care supply chain; recommendations for sustainable, climate-resilient, decarbonized health development assistance; and more.
Authors: Health Care Without Harm: Josh Karliner and Scott SlotterbackArup: Richard Boyd, Ben Ashby, and Kristian Steele
External scientific advisor: Dr. Peter-Paul Pichler, Social Metabolism & Impacts, Potsdam Institute for Climate Impact Research, Germany
Technical advisory group: Health Care Without Harm established a Climate Measurement Technical Advisory Group to guide the development of the methodology and other research for this and forthcoming studies, so as to ensure accuracy and integrity; integration of aspects unique to health care into climate footprint measurement; alignment with best practices in the field of climate footprint measurement; flexibility for regional differences in health systems; and uptake by key stakeholders.
The advisory group, which met virtually at key moments in the project’s development, is drawn from international organizations, health and health care institutions, climate organizations, and academic experts. Members include:
• Andrés Alvarado, Head of Facilities Management, Hospital Clínica Bíblica (Costa Rica)
• Joe Bialowitz, National Environmental Program Leader, Kaiser Permanente (United States)
• Anthony Capon, Professor of Planetary Health, University of Sydney (Australia)
• Dr. Diarmid Campbell-Lendrum, Climate Change and Health Team Leader, World Health Organization
• Sally Edwards, Regional Advisor, Pan American Health Organization/World Health Organization
• Dr. Rosemary Kumwenda, Coordinator of the United Nations informal Interagency Task Team on Sustainable Procurement in the Health Sector, United Nations Development Programme
• Dan Plechaty, Senior Associate, ClimateWorks Foundation (United States)
• Sonia Roschnik, Director, NHS England, Sustainable Development Unit (SDU) (United Kingdom)
• Jonas Age Saide Schwartzman, Environmental Engineer, SPDM Health System (Brazil)
• Dr. DongChun Shin, Professor, Department of Preventive Medicine and Director of the Institute for Environmental Research, Yonsei University College of Medicine (Republic of Korea)
• Dr. Nick Watts, Executive Director, Lancet Countdown on Health and Climate Change (United Kingdom)
• Chendan Yan, Research Analyst, World Resources Institute (United States)
Acknowledgements: In addition to those listed above, the project team would like to thank the following individuals for their contributions, time, review and/or advice: Fiona Armstrong, Climate and Health Alliance, Australia; Ana Belluscio, Health Care Without Harm Global Team; William Clark, Health Care Without Harm Europe; Gary Cohen, Health Care Without Harm; Kevin Conway, Health Care Without Harm U.S.; Lindsey Corey, Health Care Without Harm, U.S.; Mandeep Dhaliwal, UNDP; Mireia Figueras Alsius, Health Care Without Harm Europe; Laura Gilbert, Arup; Benn Grover, Health Care Without Harm; Suvi Huikuri, UNDP; Viktor Jósa, Health Care Without Harm Europe; Nick Knock, Health Care Without Harm U.S.; Lauren Koch, Health Care Without Harm U.S.; Aidan Long, Health Care Without Harm Europe; Manfred Lenzen, University of Sydney; Natalia Linou, UNDP; Rick Lomax, NHS England Sustainable Development Unit (SDU); Marina Maiero, World Health Organization; Dr. Peter Orris, University of Illinois, Chicago; Dr. Anne Owen, University of Leeds; Vital Ribeiro, Projeto Hospitais Saudáveis, Brazil; Antonella Risso, Health Care Without Harm Latin America; Dr José Rueda-Cantuche, European Commission; Ramon San Pascual, Health Care Without Harm Southeast Asia; Sangwon Suh, University of California, Santa Barbara; Maria Sunyer Pinya, Arup; Imogen Tennison, NHS England SDU; Elena Villalobos Pratts, WHO; Jennifer Wang, Health Care Without Harm Global Team; Susan Wilburn, Health Care Without Harm Global Team; Jessica Wolff, Health Care Without Harm U.S.; Zhao Ang, Rock Environment and Energy Institute, China.

Health Care Without Harm (HCWH) is an international NGO that seeks to transform the health sector worldwide so that it becomes ecologically sustainable and a leading advocate for environmental health and justice. Health Care Without Harm has worked for 23 years with the health care sector to reduce its use of toxic chemicals and generation of waste, while transforming the supply chain and fostering climate action.
With offices in the United States, Europe, Asia; a regional team in Latin America; and country-level partnerships with national organizations in Australia, Brazil, China, India, South Africa, and Nepal; Health Care Without Harm is a leader in mobilizing the health care sector to realize this vision.
Health Care Without Harm’s staff of health professionals, researchers, and advocates work with hospitals, health systems, governments, and international agencies to accelerate health care decarbonization, resilience, and climate policy leadership around the world. Health Care Without Harm’s Global Green and Healthy Hospitals Network has 1,200 institutional members across 60 countries, all working to bring the health sector into the climate movement and expand their healing mission beyond the four walls of their facilities.
Arup is the creative force at the heart of many of the world’s most prominent projects in the built environment and across industry. They offer a broad range of professional services that combine to make a real difference to their clients and the communities in which they work.
Arup is truly global. From 89 offices in 34 countries, their 14,000 planners, designers, engineers, and consultants deliver innovative projects across the world with creativity and passion.
Founded in 1946 with an enduring set of values, their unique trust ownership fosters a distinctive culture and an intellectual independence that encourages collaborative working. This is reflected in everything they do, allowing them to develop meaningful ideas, help shape agendas, and deliver results that frequently surpass the expectations of clients.
The people at Arup are driven to find a better way and to deliver better solutions for clients.
Health Care Without Harm would like to acknowledge support from the Fast Start Fund of the Climate Works Foundation, the Swedish International Development Cooperation Agency (SIDA) via UNDP, the Wallace Global Fund, and the MacArthur Foundation, which helped make this paper possible.
Green pa·per/ɡrēn/ ˈpāpər/
1. An environmental health policy paper.
2. A first-draft document on a specific policy area circulated among interested parties who are invited to join in a process of consultation and debate. The objective of a green paper is to arrive at a general consensus before drafting the official policy document, the white paper.
1
How the Health Sector Contributes to the Global Climate Crisis and Opportunities for Action

CONTENTS
Executive summary 4
1 Introduction 8
Climate change is a health issue 9
Health care’s climate impact 10
This paper’s contribution 10
2 Study methodology 14
Definition of the health sector 14
Databases, applied information, and method architecture 15
MRIO choice 15
Environmental extensions 15
National expenditure data 16
Presentation and reporting of results 16
Study limitations 18
3 Findings: Health care’s global climate footprint 19
Health care is a major contributor to the climate crisis 19
More than half of health care’s footprint comes from energy use 19
Health care’s climate footprint generally reflects overall 22
national emissions patterns
Decarbonizing health care’s supply chain is critical 28
Fossil fuel combustion is at the heart of health care’s climate footprint 28
Health care spending and the sector’s growth is an important factor in emissions 29
Significant data gaps remain 32
4 Policy recommendations 34
Health care’s responsibility 34
Six action areas for climate-smart health care 34
Action 1: Reduce health care’s climate footprint now 34
Action 2: Support a societal transition to clean, renewable energy 36
Action 3: Chart the course for zero emissions health care by 2050 36
Action 4: Make development assistance for health climate-smart 37
Action 5: Establish and implement government action plans for 38
climate-smart health care
Action 6: Deepen research on health care and climate change 39
5 Final words 40
2

APPENDICES
Appendix ATabulated national health care emissions for the 43 WIOD countries available at: www.noharm.org/ClimateFootprintReport
Appendix BDetailed methodology available at www.noharm.org/ClimateFootprintReport
Appendix CCountry snapshots available at www.noharm.org/ClimateFootprintReport
3
How the Health Sector Contributes to the Global Climate Crisis and Opportunities for Action

• Establishes the first-ever global estimate of health care’s climate footprint.
• Is based on full global coverage of spending data, together with detailed information from 43 countries.
• Identifies key sources of health care emissions while allowing for a comparison between nations and among
many regions of the world.
• Makes a set of recommendations to align global health goals with global climate goals.
KEY FINDINGS
Health care’s global climate footprint• The health sector, whose mission is protecting and promoting health, makes a major contribution to the
climate crisis — the greatest health threat of the 21st century — and therefore has an important role to play in resolving it.
• Health care’s climate footprint is equivalent to 4.4% of global net emissions (2 gigatons of carbon dioxide equivalent).
• The global health care climate footprint is equivalent to the annual greenhouse gas emissions from 514 coal-fired power plants.
• If the health sector were a country, it would be the fifth-largest emitter on the planet.
Top health care emitters• The top three emitters, the United States, China, and collectively the countries of the European Union,
comprise more than half the world’s total health care climate footprint (56%). • The top ten health care emitters make up 75% of the global health care climate footprint.• The United States health sector, the world’s number one emitter in both absolute and per capita terms,
produces 57 times more emissions per person than does India. • While India has the seventh-largest absolute health sector climate footprint, it has the lowest health-related
emissions per capita of all 43 nations considered in detail in this study. • China’s health sector produces six times more greenhouse gases per person than India’s does. But China’s
health system also emits one-seventh the greenhouse gases per capita as that off the United States, one-third that of Korea and just under one-half per capita that of the European Union.
EXECUTIVE SUMMARY
THIS PAPER
“Health care’s climate footprint is equivalent to 4.4% of global net emissions”
4
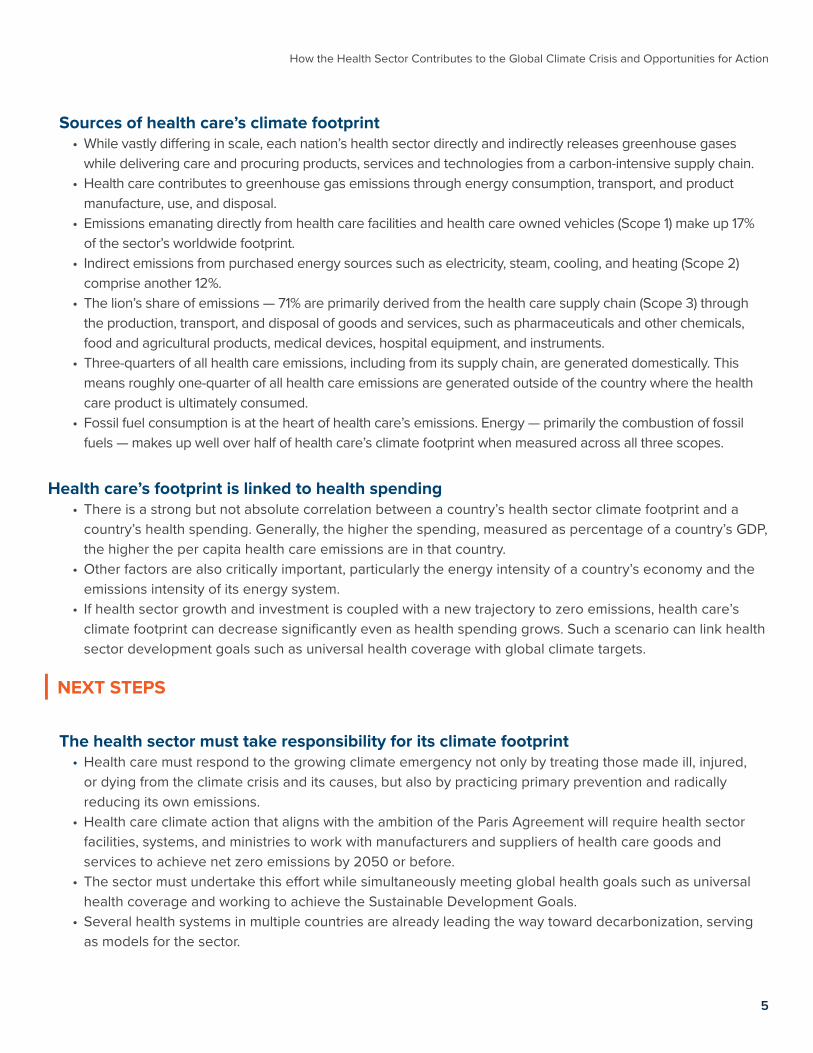
Sources of health care’s climate footprint• While vastly differing in scale, each nation’s health sector directly and indirectly releases greenhouse gases
while delivering care and procuring products, services and technologies from a carbon-intensive supply chain. • Health care contributes to greenhouse gas emissions through energy consumption, transport, and product
manufacture, use, and disposal. • Emissions emanating directly from health care facilities and health care owned vehicles (Scope 1) make up 17%
of the sector’s worldwide footprint. • Indirect emissions from purchased energy sources such as electricity, steam, cooling, and heating (Scope 2)
comprise another 12%.• The lion’s share of emissions — 71% are primarily derived from the health care supply chain (Scope 3) through
the production, transport, and disposal of goods and services, such as pharmaceuticals and other chemicals, food and agricultural products, medical devices, hospital equipment, and instruments.
• Three-quarters of all health care emissions, including from its supply chain, are generated domestically. This means roughly one-quarter of all health care emissions are generated outside of the country where the health care product is ultimately consumed.
• Fossil fuel consumption is at the heart of health care’s emissions. Energy — primarily the combustion of fossil fuels — makes up well over half of health care’s climate footprint when measured across all three scopes.
Health care’s footprint is linked to health spending• There is a strong but not absolute correlation between a country’s health sector climate footprint and a
country’s health spending. Generally, the higher the spending, measured as percentage of a country’s GDP, the higher the per capita health care emissions are in that country.
• Other factors are also critically important, particularly the energy intensity of a country’s economy and the emissions intensity of its energy system.
• If health sector growth and investment is coupled with a new trajectory to zero emissions, health care’s climate footprint can decrease significantly even as health spending grows. Such a scenario can link health sector development goals such as universal health coverage with global climate targets.
NEXT STEPS
The health sector must take responsibility for its climate footprint• Health care must respond to the growing climate emergency not only by treating those made ill, injured,
or dying from the climate crisis and its causes, but also by practicing primary prevention and radically reducing its own emissions.
• Health care climate action that aligns with the ambition of the Paris Agreement will require health sector facilities, systems, and ministries to work with manufacturers and suppliers of health care goods and services to achieve net zero emissions by 2050 or before.
• The sector must undertake this effort while simultaneously meeting global health goals such as universal health coverage and working to achieve the Sustainable Development Goals.
• Several health systems in multiple countries are already leading the way toward decarbonization, serving as models for the sector.
5
How the Health Sector Contributes to the Global Climate Crisis and Opportunities for Action
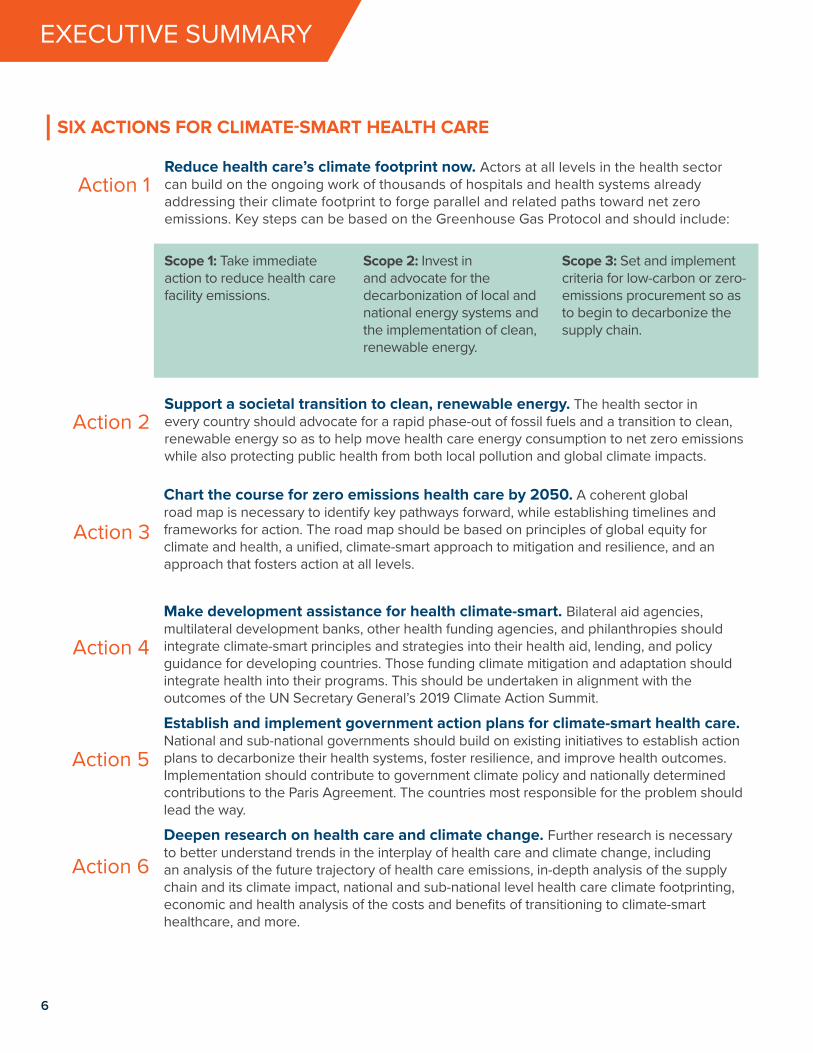
SIX ACTIONS FOR CLIMATE-SMART HEALTH CARE
EXECUTIVE SUMMARY
Action 1Reduce health care’s climate footprint now. Actors at all levels in the health sector can build on the ongoing work of thousands of hospitals and health systems already addressing their climate footprint to forge parallel and related paths toward net zero emissions. Key steps can be based on the Greenhouse Gas Protocol and should include:
Action 2Support a societal transition to clean, renewable energy. The health sector in every country should advocate for a rapid phase-out of fossil fuels and a transition to clean, renewable energy so as to help move health care energy consumption to net zero emissions while also protecting public health from both local pollution and global climate impacts.
Scope 1: Take immediate action to reduce health care facility emissions.
Scope 2: Invest in and advocate for the decarbonization of local and national energy systems and the implementation of clean, renewable energy.
Scope 3: Set and implement criteria for low-carbon or zero-emissions procurement so as to begin to decarbonize the supply chain.
Action 3
Chart the course for zero emissions health care by 2050. A coherent global road map is necessary to identify key pathways forward, while establishing timelines and frameworks for action. The road map should be based on principles of global equity for climate and health, a unified, climate-smart approach to mitigation and resilience, and an approach that fosters action at all levels.
Action 4
Make development assistance for health climate-smart. Bilateral aid agencies, multilateral development banks, other health funding agencies, and philanthropies should integrate climate-smart principles and strategies into their health aid, lending, and policy guidance for developing countries. Those funding climate mitigation and adaptation should integrate health into their programs. This should be undertaken in alignment with the outcomes of the UN Secretary General’s 2019 Climate Action Summit.
Action 6
Deepen research on health care and climate change. Further research is necessary to better understand trends in the interplay of health care and climate change, including an analysis of the future trajectory of health care emissions, in-depth analysis of the supply chain and its climate impact, national and sub-national level health care climate footprinting, economic and health analysis of the costs and benefits of transitioning to climate-smart healthcare, and more.
Action 5
Establish and implement government action plans for climate-smart health care. National and sub-national governments should build on existing initiatives to establish action plans to decarbonize their health systems, foster resilience, and improve health outcomes. Implementation should contribute to government climate policy and nationally determined contributions to the Paris Agreement. The countries most responsible for the problem should lead the way.
6

CONCLUSION
• Health, as with every sector of society, has the responsibility to align its actions and development trajectory with the Paris Agreement in order to stave off the worst impacts of climate change.
• Given its mission to protect and promote health, the sector also has a responsibility to implement the Hippocratic Oath to “first, do no harm” as it relates to its own climate footprint, while influencing other sectors to do the same.
• Health investment and policy must be retooled to support decarbonization. If the health sector — individual health facilities, health systems, ministries of health, international and bilateral development agencies, and private health care organizations — all take action toward this goal, it can be achieved.
• If health care development, growth, and investment can align with global climate goals, the 10% of the world economy that health care represents, together with its political influence at every level of government, can help provide leadership for a low-carbon, climate-smart, more equitable, and healthier future.
7
How the Health Sector Contributes to the Global Climate Crisis and Opportunities for Action

“Health sector facilities are the operational heart of service delivery, protecting
health, treating patients, and saving lives. Yet health sector facilities are also a
source of carbon emissions, contributing to climate change. The world’s health sector facilities churn out CO
2 through
the use of significant resources and energy-hungry equipment. This is perhaps
ironic — as medical professionals our commitment is to ‘first, do no harm.’ Places of healing should be leading the way, not
contributing to the burden of disease.”
- Tedros Adhanom Ghebreyesus, Director General, World Health Organization
In October 2018, the Intergovernmental Panel on Climate Change (IPCC) issued an alarming report which found that staving off the worst impacts of climate change by limiting global warming to 1.5°C, the ambition of the Paris Agreement, would “require rapid, far-reaching and unprecedented changes in all aspects of society.”
Such thoroughgoing change, according to the IPCC, would need to include transitions in land, energy, industry, buildings, transport, and cities, that reduced global net human-caused emissions of carbon dioxide (CO2) “by about 45% from 2010 levels by 2030, reaching ‘net zero’ around 2050”.1
This stark and urgent message from the world’s leading climate scientists, together with a relentless, ongoing assault of extreme weather and other climate impacts around the world today, presents a clarion call for a rapid transformation of the global economy to a low-carbon, and ultimately zero-emissions future. It has spurred a growing number of institutions and jurisdictions to declare a “climate emergency.” For instance, at the time of publication, nearly 900 local governments in 18 countries had declared climate emergency and committed to action to rapidly reduce emissions.2
This paper focuses on how the health sector, which sits on the front lines as a first responder to climate change, also makes a heretofore little recognized but significant contribution to the problem. The paper argues that health care must respond to the climate emergency not only by treating those made ill, injured, and dying from the climate crisis and its causes, but also by practicing primary prevention by radically reducing its own emissions.
Despite its clear identity as a cohesive sector of society with a robust private dimension and governance bodies at local, national and global levels — a sector that collectively spend $7.2 trillion annually or 10% of world GDP3 — health care’s emissions footprint has been largely ignored by those addressing climate change over the past quarter century. The health sector itself has paid scant attention until recently.
This paper takes the most comprehensivea look at health care’s climate emissions to date in order to build an understanding of where the problem comes from so that this challenge can be tackled not only without compromising the quality of care, but by potentially improving it. The paper identifies a path forward that can empower health systems, ministries, multilateral and bilateral health lenders and donors, together with suppliers and manufacturers of health goods and services, to begin to take cost-effective, urgent action to move toward net zero emissions in order to protect public health from climate disruption.
INTRODUCTION
a. Global spending data together with detailed information on 43 countries provides global coverage that allows for a comparison among nations and many regions of the world.
8

Climate change is a health issue
Climate change is damaging human health today and will have a greater impact in the future. The Lancet has called it the “biggest global health threat of the 21st century.”4
Direct climate impacts, such as the spread of vector-borne disease, increased heat, drought, severe storms, and flooding as well as the mass migration of climate refugees, have health consequences that will disproportionately affect the most vulnerable and marginalized populations and increase in intensity over time (Figure 1).
All countries will experience significant and growing health impacts from climate change. Low- and middle-income countries will see the worst effects as they are most vulnerable to climate shifts and least able to adapt given weak health systems and poor infrastructure. Climate change could drag more than 100 million people back into extreme poverty by 2030 with much of this reversal attributable to negative impacts on health.5
The “lack of progress to date in reducing emissions and building adaptive capacity threatens” not only “human lives and the viability of the national health systems they depend on,” according to the Lancet Countdown on Health and Climate, but also has “the potential to
disrupt core public health infrastructure and overwhelm health services.”6
Hospitals, health centers, and public health workers are first responders to the health effects of climate change. Hospitals and health systems will inevitably bear high costs resulting from the growing number of extreme climate events and must become resilient to climate’s impacts. Some of the poorest health systems in the world are often some of the most vulnerable both in harm’s way and without tools and resources to protect themselves. At the same time, the main driver of climate change — fossil fuel combustion — is causing major health problems now, contributing to air pollution that prematurely kills more than seven million people a year, roughly twice as many people as HIV AIDS, Malaria, and TB combined.7 Air pollution also makes a major contribution to long-term chronic diseases that require treatment and hospitalization, which in turn contributes to increased health sector spending and emissions. This is linked with inequity as more than 80% of premature deaths attributed to non-communicable diseases occur in low- and middle-income countries. The worst effects and causes of climate change can be prevented, and such prevention presents a significant opportunity to simultaneously improve health outcomes and increase health equity.8
Figure 1: Impact of climate change on human health (Source: U.S. Centers for Disease Control and Prevention)
Injuries, fatalities, mental health impacts
Heat-related illness and death, cardiovascular failure
Forced migration, civil conflict, mental health impacts
Malnutrition, diarrheal disease
Asthma, cardiovascular disease
Malaria, dengue, exephalitis, hantavirus, Rift Valley Fever, lyme disease, chikungunya, West Nile virus
Respiratory allergies, asthma
Cholera, cryptosporidiosis, campylobacter, leptospirosis, harmful algal blooms
9
How the Health Sector Contributes to the Global Climate Crisis and Opportunities for Action
Health care’s climate impact
While vastly differing in scale, each nation’s health sector directly and indirectly releases greenhouse gases (GHG) while delivering care and procuring products, services, and technologies from a carbon-intensive supply chain. Health care contributes to carbon emissions through energy consumption, transport, and product manufacture, use, and disposal.
Indeed, the health sector, which comprises 10% of world GDP and is dedicated to preventing, treating, and healing disease, cuts across many of the categories often associated with climate footprint measurement. Yet until recently it has not been measured as a coherent segment of the world’s climate footprint.
In recent years, comprehensive health care climate footprint measurements were undertaken in a few countries. Two studies in the United States found the country’s health care emissions to alternately have reached 8%9 and 9.8% of the national total respectively, with the latter estimate comprising 655 million metric tons of carbon dioxide equivalent (CO2e).10 In the United Kingdom, the National Health Service (NHS) and Public Health England estimated the health and social care climate footprint in England in 2017 to be 27.1 Mt CO2e, representing around 6.3% of the country’s climate footprint.11 Similar studies had comparable findings in Australia (7%)12 and Canada (5%).13
Until recently, no one had undertaken a comprehensive global study of health care’s emissions. In 2017, the World Bank, in collaboration with Health Care Without Harm, published an estimated calculation which found that the health care sector generated 2.6 billion out of the 52 billion metric tons of CO2e globally emitted in 2011 — or 5% of global emissions.14
In 2018, the Kigali Cooling Efficiency Program (K-CEP) published a study on global emissions from cooling in health care. It found that globally, roughly 365 Mt CO2e (+/- 90 Mt) annually comes from energy used to provide hospital cooling. This is equivalent to the emissions from over 75 million cars on the road or 110 coal power plants for an entire year. The study did not take into account harmful F-gases (HFCs, HCFCs) used in cooling, which would make the number even higher.
The study found that reducing the energy used for hospital cooling and refrigeration by 30% could abate ~110 Mt CO2e per year currently, equivalent to installing 27,400 wind turbines.15
In 2019, an in-depth study by Pichler et. al. published in Environmental Research Letters examined all Organization for Economic Cooperation and Development (OECD) countries (minus Chile), plus India and China. It found that the health care sectors of the 36 countries sampled combined were responsible for 1.6 GtCO2e emissions or 4.4% of the total emissions from these nations in 2014. Their study provides the first comparable estimates of CO2 emissions of health care across a large group of nations that comprise 54% of the world’s population and 78% of world GDP.16
This paper’s contribution Until recently, both the health sector and the climate community have had limited awareness of the significant contribution the sector makes to greenhouse gas emissions, and with it the need to take thoroughgoing action to align health care with the ambition of the Paris Agreement. This report, together with other emerging research, provides baseline information that can inform a pathway to health care decarbonization via sector-wide action. The areas of the report’s groundbreaking findings include the following: Global estimate: This report establishes the first-ever detailed estimate of health care’s global climate footprint. It makes several contributions to the world’s understanding of the extent of health sector emissions and their sources. In doing so it builds on the growing base of knowledge of health care’s climate footprint.
This paper also goes further than previous work in terms of number of countries covered in detail and number of greenhouse gases considered. The World Input-Output Database (WIOD) database was employed and covers all remaining countries in the world, albeit with much less detail. This has allowed us to produce a global estimate with reasonable confidence (Section 2 - Study methodology).
INTRODUCTION
10

The study breaks down the estimate in several ways, including looking at both absolute and per capita health sector emissions by country and region, as well as correlations between health care spending and sector emissions by country.
Regional estimates: The study has developed an approach that allows us to reasonably disaggregate health care’s climate footprint for world regions where sufficient data exists. Thus, it provides regional estimates for East Asia and the Pacific (and within that, ASEAN countries), Europe and Central Asia (and within that, the European Union), Latin America and the Caribbean, and South Asia.
A particular focus in this paper is given to the European Union as a political union that is forging a collective political response to the climate crisis. It has set block-wide goals which drive action on a national level, and therefore this study considers the EU as an entity when making comparisons with major emitters such as the United States, China, and other nations. (Specific data for all 28 EU countries is available in Appendix A)
Given lower data quality for the countries of Africa and the Middle East collected by our chosen database, we elected not to report regional results for these important parts of the world; subsequent updates to this methodology and footprint will seek to address this gap.
Alignment with the Greenhouse Gas Protocol: The report breaks down global emissions according to the framework established by the Greenhouse Gas Protocol, the world’s most widely used greenhouse gas accounting standards. It aligns World Health Organization (WHO) health sector definitions with an emissions analysis organized by the categories of Scope 1 (direct emissions from health care facilities), Scope 2 (indirect emissions from purchased energy), and Scope 3 (all indirect emissions, not included in scope 2, that occur in the value chain, including both upstream and downstream emissions).
This aligns the health care sector estimate with the same framework being used by many other sectors, sub-national and national governments, and health care systems and facilities. It is important to note that the proportions attributed to the three scopes in the global
and country estimates will differ from, for instance, a hospital’s estimate of its scopes, in that this study covers the entire health sector and therefore includes, for instance, health care insurance providers or retail outlets for medical devices. (See Appendix B for further details.)
Country estimates broken down by scope: The study provides five sample country estimates based on GHG Protocol scopes. Similar analyses for all 43 countries are available online in supplemental material. It is important to note that the health care climate footprint estimates in this report may differ from the handful of national studies that have been carried out. National studies have access to more precise and granular data at a country level, which can facilitate a more specific level of reporting, while this study is using a global database to produce a global estimate, as well as a series of national estimates based on that data.
Analysis by economic sector: The study has traced health care’s climate footprint back to the original emissions sectors covered in the WIOD database. This has allowed for a wide-angle snapshot of most sources of the health care sector’s emissions, including energy, transportation, agriculture, pharmaceutical production, and more.
Anesthetic gases and metered-dose inhalers: While limited by the use of data from only 31 countries, the study generates a conservative estimate of the climate impact of anesthetic gases — highly potent greenhouse gases — and metered-dose inhalers, which use them. Due to different data sources, these estimates are not included in the overall global estimate of health care’s footprint, but are in addition to it.
Research agenda: The study identifies a number of areas where further research and methodological development can help support the sector in its efforts to understand and address its climate footprint.
Policy recommendations: Based on the findings, the study sets forth a group of recommendations based on our growing knowledge of the important role that health care plays in relation to climate change, along with the imperative of the sector to align with the Paris Agreement and meet its sustainable development goals.
11
How the Health Sector Contributes to the Global Climate Crisis and Opportunities for Action
Health care taking climate action
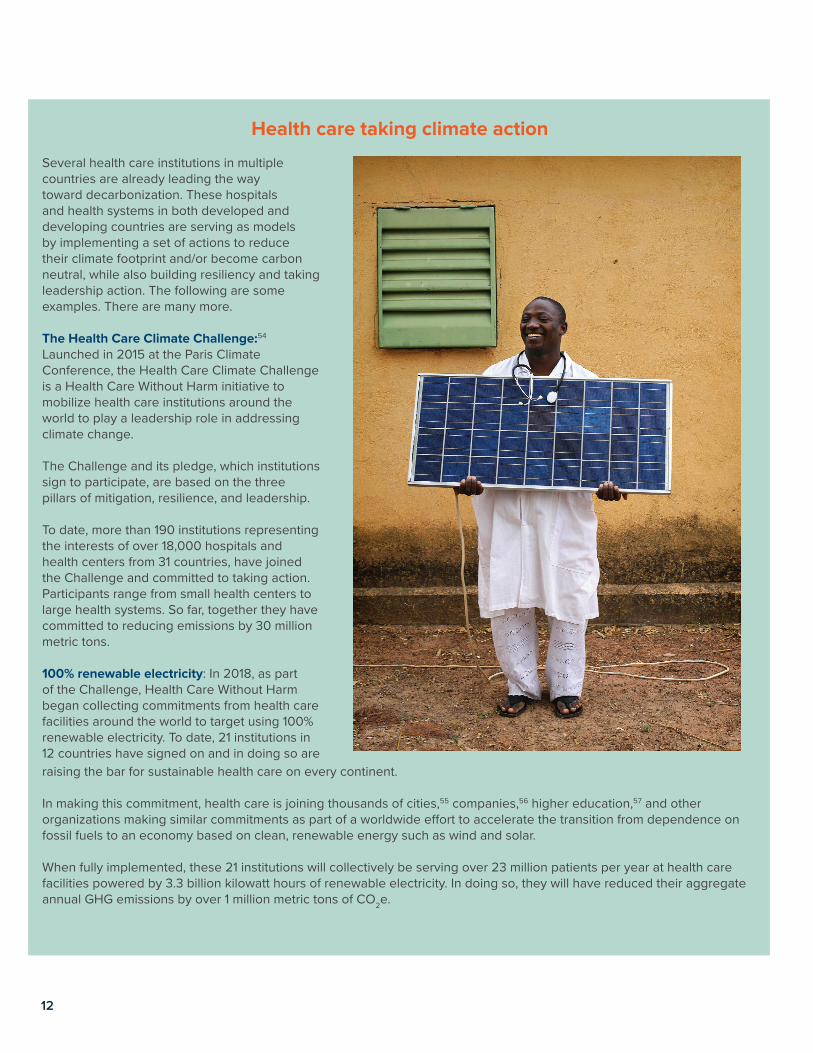
Several health care institutions in multiple countries are already leading the way toward decarbonization. These hospitals and health systems in both developed and developing countries are serving as models by implementing a set of actions to reduce their climate footprint and/or become carbon neutral, while also building resiliency and taking leadership action. The following are some examples. There are many more.
The Health Care Climate Challenge:54 Launched in 2015 at the Paris Climate Conference, the Health Care Climate Challenge is a Health Care Without Harm initiative to mobilize health care institutions around the world to play a leadership role in addressing climate change.
The Challenge and its pledge, which institutions sign to participate, are based on the three pillars of mitigation, resilience, and leadership.
To date, more than 190 institutions representing the interests of over 18,000 hospitals and health centers from 31 countries, have joined the Challenge and committed to taking action. Participants range from small health centers to large health systems. So far, together they have committed to reducing emissions by 30 million metric tons.
100% renewable electricity: In 2018, as part of the Challenge, Health Care Without Harm began collecting commitments from health care facilities around the world to target using 100% renewable electricity. To date, 21 institutions in 12 countries have signed on and in doing so are raising the bar for sustainable health care on every continent.
In making this commitment, health care is joining thousands of cities,55 companies,56 higher education,57 and other organizations making similar commitments as part of a worldwide effort to accelerate the transition from dependence on fossil fuels to an economy based on clean, renewable energy such as wind and solar.
When fully implemented, these 21 institutions will collectively be serving over 23 million patients per year at health care facilities powered by 3.3 billion kilowatt hours of renewable electricity. In doing so, they will have reduced their aggregate annual GHG emissions by over 1 million metric tons of CO2e.
12
Health care climate action by region
Europe: England’s NHS reduced the health and social care climate footprint — including Scopes 1, 2, and 3 – by 18.5% since 2007. Its goal is to comply with the country’s Climate Change Act, which sets a requirement of reducing the footprint further so that United Kingdom achieves a 34% reduction by 2020 and an 80% reduction by 2050.58 There are other outstanding local and regional examples in Europe, particularly in Scandinavia and the Netherlands, where zero emissions hospital buildings, increasing organizational commitments to carbon neutrality, innovative climate-smart technologies, and strategies to address supply chain emissions are being adopted in the sector.59
North America: In the United States, where, arguably the most work needs to be done, several major health systems are moving toward decarbonization in Scopes 1 and 2. For example, Kaiser Permanente, one of the largest U.S. non-profit health systems, is committed to being carbon net positive by 2025; the University of California Health System has set a goal of 2025 for carbon neutrality; and Cleveland Clinic aims to be carbon neutral by 2027.60 Several Canadian health systems are also committed to carbon neutrality.
Latin America: In Latin America more than 175 hospitals in Argentina, Brazil, Chile, Colombia, and Costa Rica, working in collaboration with Health Care Without Harm’s Global Green and Healthy Hospitals Network, have calculated their climate footprints and are making reduction commitments.
Africa: In Africa, the Mohammed VI University Hospital has set the target of 100% renewable electricity by 2030. They will achieve this through investments in on-site solar and geothermal energy. In Zimbabwe, UNDP’s Solar for Health Program has installed solar arrays to power more than 400 health centers, facilitating quality care, cutting costs and building resiliency with zero emissions. In South Africa, Netcare, a private health system, has a target to reduce their emissions by over 35% by the year 2023. Solar energy is a key component of this effort. They currently have solar panels providing 10MW of power with plans for further expansion.
Asia: In South Korea, Yonsei University Severence Hospital has committed to a 30% reduction of carbon emissions by 2020, equal to nearly 12,000 metric tons of CO2e. In India, the Chhattisgarh State Renewable Energy Development Agency (CREDA) and State Health Department have collaborated to install, operate and maintain solar PV systems in 900 health centres and district hospitals, reducing their carbon footprint while building resiliency. Many other Indian large hospitals and small health centers are also pursuing climate-smart strategies. Similar initiatives exist across South East Asia. And in Nepal, Kirtipur Hospital and Tilganga Institute of Ophthalmology have both committed to powering their facilities on 100% renewable electricity. This will allow them to dramatically reduce their climate footprint while providing consistent care in Nepal where the electrical grid is unstable and prone to black outs.
China has formulated numerous regulations and plans at the national to provincial and municipal levels, focusing on energy conservation in public institutions within which healthcare is one of the major sectors. For instance, in 2016, Beijing Municipal Health and Family Planning Commission issued The Plan of Action for Energy Conservation and Carbon Reduction in the 13th Five-Year (2016-2020) Plan of Beijing Healthcare Institutions, setting a goal for the healthcare institutions’ energy consumption reduction. In this context several Beijing hospitals have achieved significant carbon emission reductions by conducting green building retrofits, improving energy management and constructing new buildings by following new for Green Hospital Building hospital standards.
Climate action in the global supply chain: Some supply chain companies, such as Johnson & Johnson and Philips, have committed to 100% renewable electricity in their operations by 2050 or earlier. UNDP and Health Care Without Harm are developing criteria for low carbon health procurement that can mobilize health sector demand for zero emissions products.61
13
How the Health Sector Contributes to the Global Climate Crisis and Opportunities for Action

The purpose of this study was to calculate the climate footprint of the global health care sector. A climate footprint covers emissions of carbon dioxide, methane and nitrous oxide gases associated with the activities of a sector or organization, and provides a more comprehensive measure of its contribution to climate change than a carbon footprint alone.
The method for calculating the climate impact of a studied system generally consists of multiplying the units of output of the system (i.e. quantity of activity it undertakes) by the amount of carbon associated with that unit of output (i.e. carbon intensity). This can be done at multiple scales ranging discrete product supply chains, whole organizations, sectors of the economy, or even geographic regions or nations.
Almost all activities in the global economy have some level of emissions associated with them. Economic systems such as health care are also highly interconnected with supporting sectors and through regional and multi-national supply chains. This means the real complication that comes with calculating a climate footprint, is that of sourcing data (activity and carbon intensity), tracking impacts through the value chain, and using appropriate accounting methods to accurately attribute impacts across connected systems.
Multi-Region Input-Output (MRIO) modelling offers a powerful methodology for doing this. It is a particularly useful tool since it avoids truncation errors that can occur due to insufficient data or as a consequence of the complexity and connectedness of supply chains.
MRIO harnesses economy Input-Output (IO) tables, which detail the trade flows and transactional quantities between sectors in an economy. Through combining national IO tables, a model for global trade split by sector and nation is constructed to create a MRIO table, capturing economic flows across borders and sectors. Such tables, paired with carbon emissions data, can then be used in environmentally extended MRIO (EE-MRIO) analyses to evaluate the links between economic activity and resource use, including greenhouse gas emissions.17 With refinements to approach, EE-MRIO tables can be used to estimate the
climate emissions of national, regional, and sectoral level activities of the economy.
A full description of methodology taken in this study including the MRIO approach, applied data and reporting structures can be found in Appendix B.
Definition of the health sector
To define study boundaries and create definition for what should be included in the assessment of the global health care sector carbon emissions, it was important to apply a definition for the sector. The World Health Organization’s definition of the health sector was applied because it is commonly recognized and is aligned with useful published and available data. It defines the health sector as: “all organizations, institutions, and resources that are devoted to producing health actions. A health action is defined as any effort, whether personal health care, public health service or inter-sectoral initiative, whose primary purpose is to improve health.”
Using the WHO definition as a foundation, the study combined this with the OECD health statistics reported in the System of Health Accounts (SHA) 2011 (co-published by the OECD, Eurostat, and WHO), and its allocation of health care activities across the global economy and the reported expenditures in those activities within the MRIO. This created a method for determining the scale of activities across the global health care sector and for producing climate footprint assessment outputs aligned with health care sector definitions.
STUDY METHODOLOGY
14

Databases, applied information, and method architecture
In developing the study method, a range of choices and database decisions were required. These are examined below covering the choice of MRIO database, environmental extensions, and national account expenditure data on health care. Taken together the methodology applied is summarized in Figure 2.
MRIO choice
This study was conducted using the World Input-Output Database (WIOD), a global MRIO model funded by the European Commission.19 WIOD provides a full model of global trade, using a consistent 56-sector definition to describe the economies of 43 nations in detail, with an aggregated rest-of-world (ROW) category ensuring full global coverage. It is a highly regarded model, which has been widely used and validated in literature. WIOD was chosen over other database options due to its robust methodology, as well as its sectoral and geographical resolution.
Environmental extensions
The WIOD dataset provides a detailed environmental extension (EE) covering carbon dioxide emissions for all nations and sectors.20 Unfortunately, other GHGs are not included in the EE, so a customised approach to including these emissions was required. The Greenhouse Gas Protocol lists six classes of greenhouse gas to be included in footprinting calculations:
• carbon dioxide• methane• nitrous oxide • hydrofluorocarbons (HFCs)• perfluorocarbons (PFCs)• sulphur hexafluoride (SF6)
After carbon dioxide, the main contributors to global warming are methane and nitrous oxide. These gases were added to our methodology by allocating emissions reported in the PRIMAP emissions database to WIOD categories. This approach allowed us to incorporate virtually all global methane emissions and over 93% of global nitrous oxide emissions into the model. Collectively carbon dioxide, methane, and nitrous oxide accounted for over 98% of global GHG emissions in 2014.21
Figure 2: Methodology architecture for HCWH global health sector climate footprint
METHODOLOGY RESULTS
WIOD IO database – capturing the global trade relationships
Environmental extensions and PRIMAP emissions data
WHO health sector definition, OECD/WHO health care
expenditure data
Total CO2, CH4, and N2O emissions intensities for all
WIOD categories
Mapped OECD/WHO expenditure data presented in
WIOD sector breakdowns
Concordance / mapping process based on Pichler et al. (2019)18
Global and national health care climate footprints
15
How the Health Sector Contributes to the Global Climate Crisis and Opportunities for Action

National expenditure data
The concordance process used to map expenditures is widely adopted and documented in the literature12, 18. Health expenditure data was used to ensure alignment between sector boundaries and the definition of the health care sector by WHO. National expenditure data was mapped onto WIOD categories using a concordance matrix between WHO and WIOD sector definitions. The theory behind this process is set out in the supplementary information to the study by Pichler et al.22. Detailed descriptions of the WIOD sector definitions21 and of the WHO expenditure categories23 were used to ensure consistent mapping of expenditures. Further detail on the health expenditure data for each nation and region in WIOD is available in Appendix B.
Presentation and reporting of results The reporting of climate change impacts requires careful presentation so that the language used, and the systems and scopes applied are familiar to the intended audience and users of the information. The study reporting is framed by three general perspectives including the:
• World Input Output Database (WIOD) structure and economy sectors
• Structure of the WHO System of Health Accounts (SHA)
• Greenhouse Gas Protocol (GHGP) Scope 1, 2, and 3 categories
The GHGP scope categories are a widely applied and common framework (also in the health sector), for the allocation and reporting of GHG emissions of organizational and supply chain settings (Figure 3).
Figure 3: Greenhouse Gas Protocol Scopes 1, 2, and 3. (Source: Greenhouse Gas Protocol)
STUDY METHODOLOGY
16

It was important to have a means to translate the study results based on the WIOD and SHA structures into a form consistent with the GHGP scopes. The approach developed for this framing of outputs involved a mapping of the SHA to the Scope 1, 2, and 3 categories through the economy sectors in the WIOD. Further description of this can be found in Appendix B, including a summary of how the GHGP scope definitions were interpreted into the health care sector’s specific activities. A summary of this mapping is shown in Figure 4.
Hospitals Long-term care
Ambulatory care
Ancillary services
Retailers Preventative care
Admin + finance
Care given at home
Providing care to non-
residents
Total Emissions from Sector – segmented by WIOD production categories
Scope 3 = Total – Scope 1 – Scope 2
Scope 1
Scope 2
Figure 4: Approach taken for mapping emissions to GHGP Scope 1, 2, and 3 categories from the SHA and WIOD climate footprint assessment model
The audience for this paper is wide ranging and includes those across the health sector value chain. Its particular focus is to support the development of strategic and policy direction for health systems’ climate action. In its findings, the reader will find results presented to both the WIOD and GHGP scopes. This should provide sufficient balance between understanding the key emission sources (via WIOD) and the reporting categories (via GHGP) commonly used for communicating and presenting climate action. A range of country- and region-specific summaries are also presented.
Metered-Dose Inhalers
Metered-Dose Inhalers (MDIs), typically used for the treatment of asthma and other respiratory conditions, use hydrofluorocarbons as propellants. These gases are highly potent greenhouse gases, with warming potentials between 1,480-2,900 times that of carbon dioxide.26 As with anesthesia, global data on emissions from MDIs was not available, however, UNFCCC Annex 1 nations report data on emissions from this source.27 For UNFCCC Annex 1 nations, emissions from MDI use totalled 6.9MtCO2e, an additional 0.3% on top of the global health care footprint. The full global emissions from MDIs can be expected to be substantially greater than this figure, and while antiasthmatics are included on the WHO essential medicine list,28 alternative delivery mechanisms to MDIs, such as dry powder based inhalers, are available which provide the same medicines without the high global warming potential propellents.
SHA Health Care Providers
17
How the Health Sector Contributes to the Global Climate Crisis and Opportunities for Action

Study limitations
This paper aims to create an understanding of the climate footprint of the global health care sector and has used data sources and methods that prioritize the completeness of this over resolution. Therefore, the approach should not be expected to give results to a similar level of detail as footprints calculated for national health care systems, health care organizations, or individual health care facilities. A generalized summary of other limitations including data collection and reporting approaches include:
1. Alignment with previous studies: This paper is the first to estimate the climate impact of health care in all countries and across three major greenhouse gases. The closest comparable study18 used a similar methodology, yet this paper differs in five key aspects (among others):
a. It covers all countries, including an additional 25% of global GDP.
b. It considers methane and nitrous oxide in addition to carbon dioxide emissions, equivalent to an additional 25% of global climate impact.
c. Its modelling is based on WIOD MRIO database rather than Eora to facilitate comparison among countries.
d. It uses a more granular approach to map health care spending for non-OECD countries, such as China and India.
e. In the specific case of China, expenditure data was revised downward by 15% between the publication of Pichler et al.’s paper and this paper.
2. Spending data: The System of Health Accounts (SHA) spending data uses a consistent definition of health care and categorization of health care providers across countries.
3. Allocation of SHA spending data into WIOD economic sectors: The SHA health care provider categories do not align directly with WIOD economic sectors. The method of translating between the two requires some approximations based on detailed definitions of SHA and WIOD categories.
4. WIOD detail countries and the rest of the world (ROW): The WIOD database gives detailed information on 43 countries and combines the rest of the world into one aggregated sector. This means there is a loss of resolution into many countries. The ROW category – because it plays a balancing role within the model – also masks any irregularities in data reporting and sector definitions between the detail countries. This also means specific country data is lacking for all of Africa and the Middle East, as well as many low- and middle-income countries in Asia, Latin America, and the Caribbean.
5. Allocation of emissions footprint to GHGP scopes: It is challenging to disaggregate the MRIO-based approach to assessment into the Scope 1, 2, and 3 reporting structure, particularly regarding the sub-categories of Scope 3. Only partial perspectives to this are offered in the study. A structural path analysis is necessary to show full supply chain relationships with the model.
6. Nitrous oxide as anesthetics: The assessment is determined from data available for 31 countries under the UNFCCC reporting regime. These countries represent 15% of world population, 57% of GDP, and 73% of global health care expenditure. Due to this limitation, we report this data separately.
7. Fluorinated gases as anesthetics (desflurane, sevoflurane, isoflurane): Figures are derived from published research on atmospheric concentrations. The global warming potential is inferred from these measurements. It can be taken as a global footprint, but due to the different method for deriving the value, we report it separately.
8. Reporting year: This study considered emissions from the health care sector for 2014, the latest year available for the WIOD database. Progress has been made in the five years since then by health sector providers and their partners in decarbonising their activities. This is not as yet represented in the findings.
STUDY METHODOLOGY
18

FINDINGS: HEALTH CARE’S GLOBAL CLIMATE FOOTPRINT
This paper contributes to a growing body of evidence documenting the extent and nature of health care’s climate footprint. Six key conclusions can be drawn from this study.
1. Health care is a major contributor to the climate crisis
Health care, a sector whose mission is to “first, do no harm” and to heal, has a significant climate footprint and makes a major contribution to the climate crisis, which is quickly evolving into a global health emergency. A growing number of national and international studies confirm and shed light on this finding.
This study, the only comprehensive global analysis to date, finds that the global health care sector had a climate footprint of 2.0GtCO2e in 2014, equivalent to 4.4% of global net emissions.
If health care were a country, it would be the fifth-largest emitter on the planet. Health care’s climate footprint is smaller than that of China, the United States, India, and Russia but larger than Japan’s and Brazil’s.
The global health care climate footprint is equivalent to the greenhouse gas emissions from 514 coal-fired power plants.24
The highest contributions to the global health care climate footprint come from the United States (546 million metric tons of CO2e), China (342 MtCO2e), and the European Union (248 MtCO2e). (See Appendix A for a ranking of the 43 countries, plus the EU.)
Health care emissions make up a varying percentage of each country’s climate footprint. They range from highs in the United States (7.6%), Switzerland (6.7%) and Japan (6.4%) to lows in India (1.5%) and Indonesia (1.9%). Data was not available for many low- and middle-income countries. Most of the 43 countries in the study fall close to the world average of 4.4% (Figure 7).
2. More than half of health care’s footprint comes from energy use
Emissions emanating directly from health care facilities (Scope 1) make up 17% of the sector’s worldwide footprint. Indirect emissions from purchased electricity, steam, cooling and heating (Scope 2) comprise another 12%. And the lion’s share of emissions — 71% — come from what is known as Scope 3, and are primarily derived from the health care supply chain — the production, transport, use, and disposal of goods and services that the sector consumes.
When viewed across all three scopes, more than half of the health sector’s footprint is attributable to energy use, primarily consumption of electricity, gas, steam and air conditioning supply combined with health sector operational emissions.
Other significant activities that contribute to health care’s footprint include: agriculture (9% including catering at health facilities, growing cotton for surgical gowns, etc.), pharmaceuticalsb,21 and chemicals (not including the energy used to produce them, 5%), transport (7%), and waste treatment (3%). In addition, a limited estimate covering only 31 countries shows that an additional nearly 1% of health care’s global climate footprint or nearly four million metric tons of health care emissions come from the sector’s use of anesthetic gases (0.6%) and metered dose inhalers (0.3%). (See: Metered Dose Inhalers on page 17 and Anesthetic Gases on page 31)
b. Other studies in this field have found the contribution of pharmaceuticals to be greater that our stated result here. This is a result of different reporting practice. We present the emissions from the manufacturing of pharmaceuticals and chemicals, whereas previous reporting give the full embodied emissions in the pharmaceutical products purchased by health care. Primarily, these numbers differ since emissions from energy used in the supply chain are captured in the results when reporting full embodied emissions.
19

FINDINGS: HEALTH CARE’S GLOBAL CLIMATE FOOTPRINT
Global footprint by GHGP categories
Figure 5 shows the global health care footprint split according to GHGP Scopes. Results were mapped to these categories as described in Figure 3.
Figure 5: Global health care footprint split by GHGP Scopes
Climate footprint by WIOD emissions sources
Figure 6 shows the global health care footprint traced back to the original emissions sectors; given in WIOD categories and the groupings detailed in Appendix B.
c. This breakdown differs to sector splits reported in previous work in this area (such as by the NHS in the United Kingdom). These studies attributed supply chain emissions to sectors providing goods and services directly to the health care sector, whereas in this study, emissions are traced through the supply chain to the original emitter.
Scope 1 Scope 2 Scope 3
Figure 6: Global health care emissions split by production sector. Definitions of categories used in the legend are provided in Appendix B. c,25
Generation and distribution of electricity, gas and heat or cooling
Health care facilities operational emissions
Other manufacturing (basic metals, textiles and food products etc)
Agriculture (provision of food and products etc)
Other sectors and services
Transport; (business travel, operational transport and supply chain logistics etc)
Pharmaceutical and chemical products
Waste treatment
Other primary industries (mining, forestry, and fishing/aquaculture etc)
Rubber and plastic products
Computers, electronic and optical equipment
40%
13%11%
9%
8%
7%
5%
3% 3%
17%
12%
71%
20

Relationship of GHGP categories to WIOD emissions sources
Figure 6a shows the proportion of WIOD emissions sources attributable to GHGP Scopes 1, 2 and 3.
GHGP SCOPE CATEGORIES WIOD CATEGORIES
Scope 117%
Scope 212%
Scope 371%
Health sector operational emissions
Transport
Transport
Othermanufacturing
Agriculture
Other sectorsand services
Pharmaceutical and chemical products
Waste treatment
Other primary industries
Rubber and plastic products
Computers, electronic and optical equipment
Distribution of electricity, gas, heat or cooling
Distribution of electricity, gas, heat or cooling
40%
3%3%
5%
8%
9%
11%
7%
13%
1.3%
0.2%
21
How the Health Sector Contributes to the Global Climate Crisis and Opportunities for Action
Australia 2%
Canada 2%South Korea 2%
India 2%
Russia 4%
Japan5%
United States 27% China
17%
European Union 12%
Brazil 2%
FINDINGS: HEALTH CARE’S GLOBAL CLIMATE FOOTPRINT
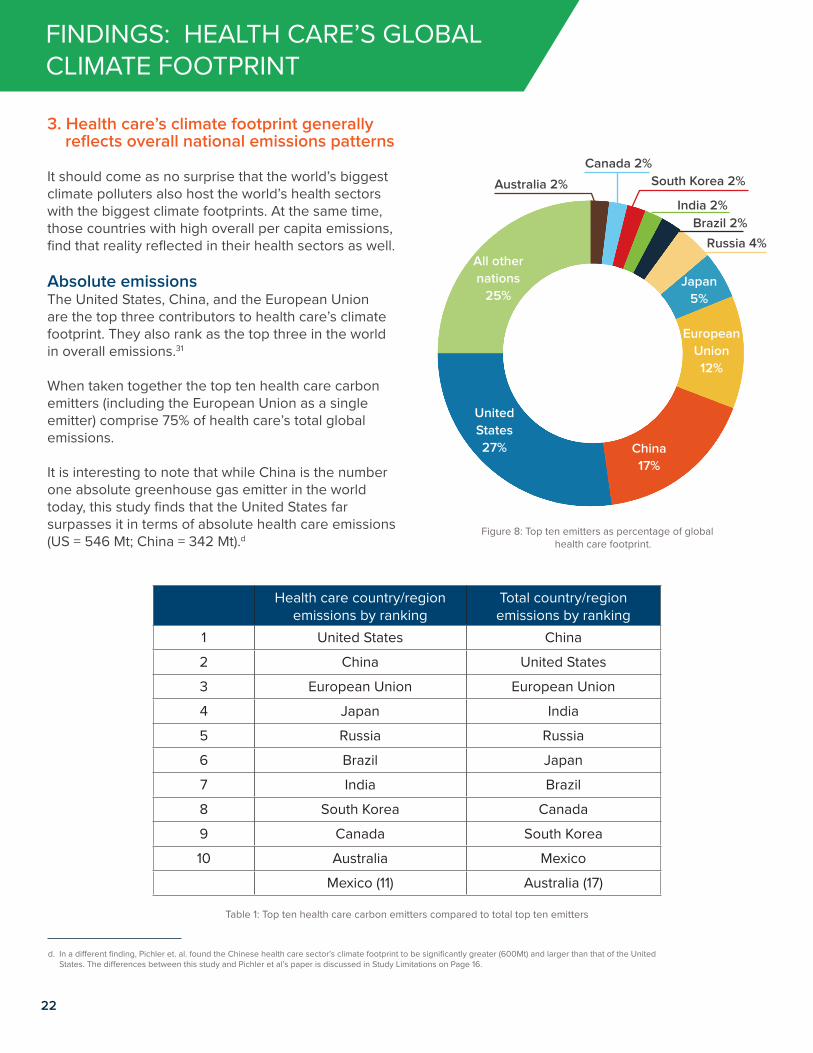
3. Health care’s climate footprint generally reflects overall national emissions patterns
It should come as no surprise that the world’s biggest climate polluters also host the world’s health sectors with the biggest climate footprints. At the same time, those countries with high overall per capita emissions, find that reality reflected in their health sectors as well.
Absolute emissions The United States, China, and the European Union are the top three contributors to health care’s climate footprint. They also rank as the top three in the world in overall emissions.31
When taken together the top ten health care carbon emitters (including the European Union as a single emitter) comprise 75% of health care’s total global emissions.
It is interesting to note that while China is the number one absolute greenhouse gas emitter in the world today, this study finds that the United States far surpasses it in terms of absolute health care emissions (US = 546 Mt; China = 342 Mt).d
d. In a different finding, Pichler et. al. found the Chinese health care sector’s climate footprint to be significantly greater (600Mt) and larger than that of the United States. The differences between this study and Pichler et al’s paper is discussed in Study Limitations on Page 16.
Figure 8: Top ten emitters as percentage of global health care footprint.
Table 1: Top ten health care carbon emitters compared to total top ten emitters
Health care country/region emissions by ranking
Total country/region emissions by ranking
1 United States China
2 China United States
3 European Union European Union
4 Japan India
5 Russia Russia
6 Brazil Japan
7 India Brazil
8 South Korea Canada
9 Canada South Korea
10 Australia Mexico
Mexico (11) Australia (17)
All other nations
25%
22
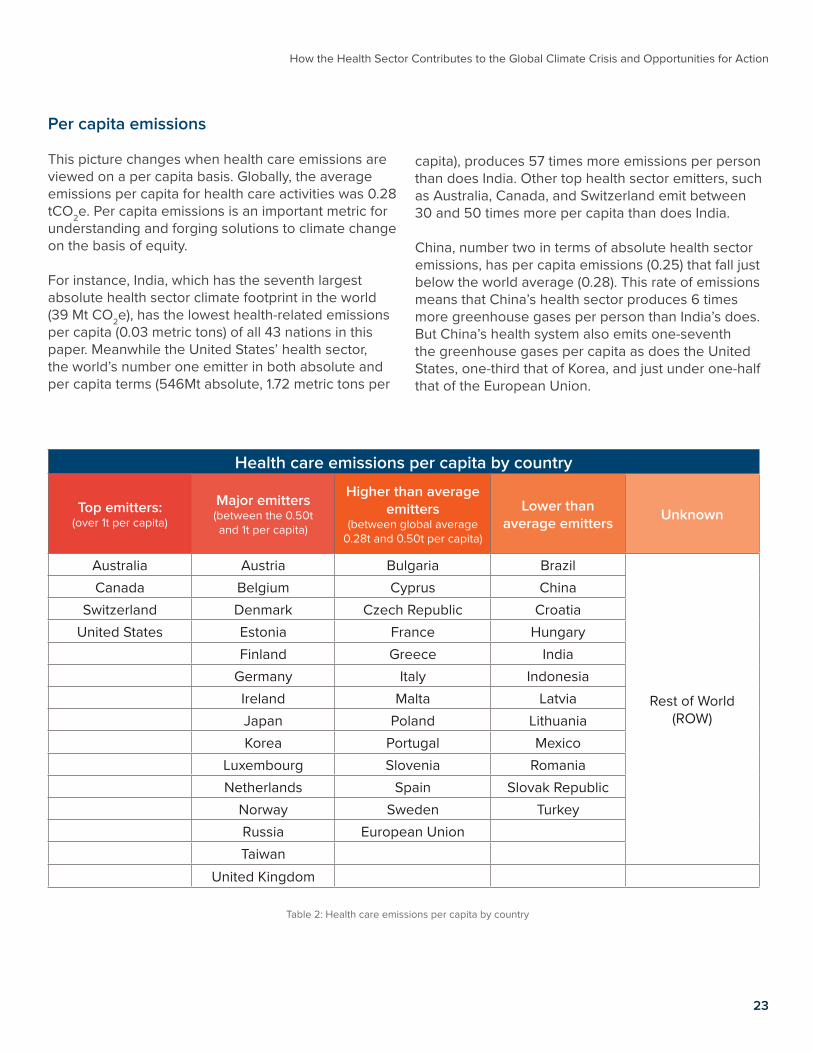
Per capita emissions This picture changes when health care emissions are viewed on a per capita basis. Globally, the average emissions per capita for health care activities was 0.28 tCO2e. Per capita emissions is an important metric for understanding and forging solutions to climate change on the basis of equity.
For instance, India, which has the seventh largest absolute health sector climate footprint in the world (39 Mt CO2e), has the lowest health-related emissions per capita (0.03 metric tons) of all 43 nations in this paper. Meanwhile the United States’ health sector, the world’s number one emitter in both absolute and per capita terms (546Mt absolute, 1.72 metric tons per
capita), produces 57 times more emissions per person than does India. Other top health sector emitters, such as Australia, Canada, and Switzerland emit between 30 and 50 times more per capita than does India.
China, number two in terms of absolute health sector emissions, has per capita emissions (0.25) that fall just below the world average (0.28). This rate of emissions means that China’s health sector produces 6 times more greenhouse gases per person than India’s does. But China’s health system also emits one-seventh the greenhouse gases per capita as does the United States, one-third that of Korea, and just under one-half that of the European Union.
Health care emissions per capita by country
Top emitters: (over 1t per capita)
Major emitters(between the 0.50t and 1t per capita)
Higher than average emitters
(between global average 0.28t and 0.50t per capita)
Lower than average emitters
Unknown
Australia Austria Bulgaria Brazil
Rest of World (ROW)
Canada Belgium Cyprus ChinaSwitzerland Denmark Czech Republic Croatia
United States Estonia France HungaryFinland Greece India
Germany Italy IndonesiaIreland Malta LatviaJapan Poland LithuaniaKorea Portugal Mexico
Luxembourg Slovenia RomaniaNetherlands Spain Slovak Republic
Norway Sweden TurkeyRussia European UnionTaiwan
United Kingdom
Table 2: Health care emissions per capita by country
23
How the Health Sector Contributes to the Global Climate Crisis and Opportunities for Action

FINDINGS: HEALTH CARE’S GLOBAL CLIMATE FOOTPRINT
Figure 7: Health care footprint as a percentage of national emissions for all nations and regions covered in this study
Health care footprint as % of national footprint
Australia
Austria
Belgium
Brazil
Bulgaria
Canada
China
Croatia
Cyprus
Czech Republic
Denmark
Estonia
Finland
France
Germany
Greece
Hungary
India
Indonesia
Ireland
Italy
Japan
Korea
Latvia
Lithuania
Luxembourg
Malta
Mexico
Netherlands
Norway
Poland
Portugal
Romania
Russia
Slovak Republic
Slovenia
Spain
Sweden
Switzerland
Taiwan
Turkey
United Kingdom
United States
Rest-of-World
European Union
Nat
ion
0% 1% 6% 7%2% 3% 4% 5% 9% 10%8%
World - 4.4%
5.1%
5.2%
5.5%
4.4%
6.0%
5.2%
3.1%
3.2%
2.9%
3.6%
6.3%
4.7%
5.0%
4.6%
5.2%
3.7%
4.3%
1.5%
1.9%
4.4%
4.0%
6.4%
5.3%
3.2%
2.0%
3.7%
4.8%
3.4%
5.9%
4.3%
3.7%
4.8%
2.7%
4.0%
2.8%
4.6%
4.5%
4.4%
6.7%
4.6%
3.2%
5.4%
7.6%
3.9%
4.7%
Carbon Dioxide Methane Nitrous Oxide
24

Snapshots
The following section provides a series of snapshots of the global large emitting health care countries including the United States, China, India, and Brazil, as well as the 28 nations of the European Union.
A full set of country snapshots of all 43 countries, is provided in Appendix C.
United States
United States health care Value Unit
Climate footprint 547 MtCO2e
Emissions per capita 1.72 tCO2e/capita
Emissions as % of national footprint 7.6 %
Expenditure per capita 9053 USD
Expenditure as percentage of GDP 16.5 %
% of footprint generated domestically 78.2 %
Health sector footprint equivalence to coal power plant emissions32 141
coal-fired power plants in one year
China
2 1%
15%64%
12%
7%
80%
China health care Value Unit
Climate footprint 342 MtCO2e
Emissions per capita 0.25 tCO2e/capita
Emissions as % of national footprint 3.0 %
Expenditure per capita 362 USD
Expenditure as percentage of GDP 4.8 %
% of footprint generated domestically 90.5 %
Health sector footprint equivalence to coal power plant emissions32 87.8
coal-fired power plants in one year
Scope 1 Scope 2 Scope 325
How the Health Sector Contributes to the Global Climate Crisis and Opportunities for Action

FINDINGS: HEALTH CARE’S GLOBAL CLIMATE FOOTPRINT
European Union
14%
11%
75%
European Union health care Value Unit
Climate footprint 249 MtCO2e
Emissions per capita 0.49 tCO2e/capita
Emissions as % of national footprint 4.7 %
Expenditure per capita 3668 USD
Expenditure as percentage of GDP 10.0 %
Health sector footprint equivalence to coal power plant emissions32 64
coal-fired power plants in one year
India
8%
11%
81%
India health care Value Unit
Climate footprint 39 MtCO2e
Emissions per capita 0.03 tCO2e/capita
Emissions as % of national footprint 1.5 %
Expenditure per capita 57 USD
Expenditure as percentage of GDP 3.6 %
% of footprint generated domestically 80.1 %
Health sector footprint equivalence to coal power plant emissions32 10
coal-fired power plants in one year
Scope 1 Scope 2 Scope 3
26

GHG emissions by region
Figure 9: Estimated health care emissions for World Bank regions other than Sub-Saharan Africa and Middle East and North Africa
Brazil
21%
6%
73%
Brazil health care Value Unit
Climate footprint 44 MtCO2e
Emissions per capita 0.21 tCO2e/capita
Emissions as % of national footprint 4.4 %
Expenditure per capita 1301 USD
Expenditure as percentage of GDP 10.8 %
% of footprint generated domestically 70.6 %
Health sector footprint equivalence to coal power plant emissions32 11.3
coal-fired power plants in one year
Scope 1 Scope 2 Scope 3
North America Latin America & Caribbean
East Asia Pacific South Asia Europe & Central Asia
1.65 0.20 0.26 0.03 0.43 tCO2e/capita
0.58 0.13 0.60 0.05 0.39 GtCO2e total
29 6 30 2 19 % global
27
How the Health Sector Contributes to the Global Climate Crisis and Opportunities for Action

4. Decarbonizing health care’s supply chain is critical
The finding that 71% of health care’s climate footprint is attributable to Scope 3 emissions is significant (Figure 3).While further study is needed, it is highly likely that the vast majority of these emissions emanate from the production, packaging, transport, and disposal of goods and services that health care purchases. These include pharmaceuticals and other chemicals, medical devices, hospital equipment, instruments, and more.
There is further work to be done to understand the full picture of GHG emissions emanating from health care’s supply chain. In order to address the climate footprint of the health care supply chain, it will be essential to understand its global nature.
This paper finds that 76% of all health care emissions, including supply chain, are generated domestically. This means that around one-quarter of all health care emissions are generated outside of the country where the health care product is ultimately consumed. In some of the largest emitting countries the domestic emissions profile is even higher, with China reaching above 90%, the United States at 78%, India at 80%, and Brazil at 70%.
It will be important to further analyse and identify the climate footprint of countries’ production for the health care supply chain, as well as which countries are the greatest consumers of these goods and services. For instance, when evaluating their Scope 3 emissions, NHS England SDU found that pharmaceuticals made the largest contribution to their climate emissions.Understanding this supply chain landscape, including what the climate footprint hotpots are in various countries’ Scope 3 emissions, is an important next step. This will be essential for developing an approach to address this major component of health care’s climate footprint.
FINDINGS: HEALTH CARE’S GLOBAL CLIMATE FOOTPRINT
Based on data points for 43 countries, we have been able to establish a series of regional estimates of health care emissions with a strong level of confidence (Figure 9). These estimates are for all regions except Africa and the Middle East, where the WIOD global database does not provide sufficient coverage for a confident estimate.
It is important to note that these estimates are based on figures from countries at the higher end of the global income distribution. So while we have full confidence in the estimate for the European Union, the values for regions such as Latin America which do not have full WIOD detail country coverage are estimated based on the WIOD detail country results, including those from neighboring countries. (See Appendix B for details on methodology). The opportunity exists to refine these estimates further once additional country-specific data becomes available.
With these caveats in mind, the picture these estimates paint is of the vast majority or 78% of health care emissions coming from the North America (29%), East Asia/Pacific (30%), and Europe/Central Asia regions (19%). Of the remaining 22% of global health care emissions, we can estimate that Latin America generates 6% and South Asia generates 2%. Although data is absent, we can also infer by deduction that the remaining 14% of health care emissions are generated by the health sectors in the 21 countries in the Middle East and North Africa together with the 48 countries in Sub-Saharan Africa. 5. Fossil fuel combustion is at the heart of
health care’s climate footprint
Energy — primarily the combustion of fossil fuels — makes up well over half of health care’s climate footprint.
As Figure 6 shows, 40% of health care’s climate footprint comes from electricity and thermal power supply attributed to health care-related activities. It is energy both purchased by health care facilities (Scope 2 emissions in Figure 5), as well as that purchased by manufacturers and suppliers of goods and services for the sector (Scope 3 in Figure 5). This includes, for instance, the energy purchased by pharmaceuticals and medical device industries.
28
Another 13% of health care’s footprint primarily arises from on-site power generation in health care facilities and is shown in Figure 6 as “health sector operational emissions.” This brings the total up to 53%. That figure will increase further when fossil fuels burned onsite in the health care supply chain, such as for transport or on-site combustion for heating, cooling and manufacturing are taken into account.
This conclusion points to the importance of society-wide transitions to clean energy to address both health care’s climate footprint and to protect public health from the broader climate crisis (Action 2).
6. Health care spending and the sector’s growth is an important factor in emissions
There is a strong but not absolute correlation between a country’s health sector’s climate footprint and a country’s health spending. As Figure 10 shows, generally the higher the spending on health care (measured as percentage of a country’s GDP) the higher the per capita health care emissions are in that country.
Other factors are also important, particularly the energy intensity of a country’s economy and the emissions intensity of its energy system. For instance, in their 2019 study, Pichler et.al. found that a group of “14 mainly European countries has achieved absolute decoupling of health care expenditure from CO2 emissions by combining growing real health care expenditure with a declining health climate footprint.” Another 10 countries, including the United States, Canada, Australia, South Korea, Japan, and India achieved relative decoupling where emissions and health care expenditure have both increased, but the emissions grew at a slower pace than expenditure. They conclude that the emissions intensity of the domestic energy system and the energy intensity of the domestic economy have a significant influence on the climate footprint of health care.16
In this context, the direct link to health care spending is both clear, as well as important to recognize and address. Global health spending is expected to increase at an annual rate of 3.8%, from $9.2 trillion in 2014 to $24.2 trillion in 2040, with most of the growth expected in high- and middle-income countries.33
Indeed, health spending will continue to grow as the population ages in advanced economies and middle-income countries invest significant amounts in strengthening their health infrastructure and services. Health system spending will also grow in many low-income countries as these nations develop and invest billions of dollars in health care for their populations. For instance, Development Assistance for Health (DAH) totals more than $37 billion annually and has a significant influence on health systems in low income countries.34
Health care growth and investment needs to be decoupled from GHG emissions, and aligned with the decarbonization of all aspects of how health is delivered, including the energy that it generates onsite, purchases, or is embodied in the supply chain. This will be essential to significantly decrease the sector’s footprint in coming decades. Such a scenario can align health sector growth trajectories, as well as goals such as universal health coverage, with one another.
Decoupling growth from resource consumption, including climate emissions, is the explicit aim of a transition to a circular economy — an economy that instead of consuming and polluting, it regenerates and restores. Organizations such as the World Economic Forum, OECD and European Union have recognised the importance of a circular economy to achieving societal economic and environmental goals.21,23,35
The principles of a circular economy can help health care organisations tackle even the hardest-to-mitigate aspects of their climate footprint.
29
How the Health Sector Contributes to the Global Climate Crisis and Opportunities for Action

1.72
0.44
1.02
0.46
0.71
0.79
0.81
0.21
0.59
0.83
0.78
0.49
1.01
0.66
0.61
0.64
0.45
0.60
1.29
0.36
0.35
0.35
0.37
0.45
0.38
0.35
0.26
0.19
0.22
0.73
0.30
0.84
0.34
0.66
0.17
0.52
0.18
0.25
0.53
0.15
0.25
0.19
0.03
0.05
0.16
FINDINGS: HEALTH CARE’S GLOBAL CLIMATE FOOTPRINT
Figure 10: Health Care footprint per capita ordered by percentage of GDP spent on health care
United States (16.5%)
France (11.6%)
Switzerland (11.5%)
Sweden (11.1%)
Germany (11.0%)
Netherlands (10.9%)
Japan (10.8%)
Brazil (10.8%)
Austria (10.4%)
Belgium (10.3%)
Denmark (10.2%)
European Union (10.0%)
Canada (10.0%)
United Kingdom (9.7%)
Ireland (9.7%)
Finland (9.5%)
Malta (9.4%)
Norway (9.3%)
Australia (9.1%)
Spain (9.0%)
Portugal (9.0%)
Italy (9.0%)
Bulgaria (8.5%)
Slovenia (8.5%)
Greece (8.0%)
Czech Republic (7.8%)
Hungary (7.1%)
Croatia (7.1%)
Slovak Republic (6.9%)
Korea (6.8%)
Cyprus (6.8%)
Luxembourg (6.4%)
Poland (6.3%)
Estonia (6.2%)
Lithuania (6.2%)
Taiwan (6.2%)
Mexico (5.5%)
Latvia (5.5%)
Russia (5.2%)
Romania (5.0%)
China (4.8%)
Turkey (4.4%)
India (3.6%)
Indonesia (3.1%)
Rest-of-World
Nat
ion
0.0 1.50.5 1.0 2.0
Carbon Dioxide Methane Nitrous Oxide
Health care footprint per capita (tCO2e/capita)
30

Anesthetic Gases
The gases used for anesthesia are potent greenhouse gases. Commonly used anesthetics include nitrous oxide and the fluorinated gases sevoflurane, isoflurane, and desflurane. Global warming potentials range between 130 kgCO2e/kg (sevoflurane) and 2540 kgCO2e/kg (desflurane). At present, the majority of these gases enter the atmosphere.29
Research by the NHS Sustainable Development Unit indicates that the United Kingdom’s anesthetic gas footprint is 1.7% and the majority can be attributed to nitrous oxide use.30 Available data on the medical consumption of nitrous oxide for anesthesia is not global. UNFCCC reports for a subset of developed nations within its Annex 1 grouping.27 Medical nitrous oxide use for these nations totalled 7 MtCO2e, presenting an additional 0.4% to the global healthcare
footprint, and an additional 2.5% on the global Scope 1 footprint. Together, these nations accounted for 15% of the global population, 57% of the global GDP, and 73% of global health expenditure in 2014, and so the full impact of nitrous oxide use in anesthesia on the global health care footprint can be expected to be substantially greater than the figures for Annex 1 nations alone.
For regions where full coverage is available in the UNFCCC data, nitrous oxide anesthesia adds an additional 0.7% to the North American and 1.0% to the European Union’s health care footprint.
For fluorinated gases used in anesthesia, global emissions to atmosphere in 2014 was estimated to be 3.1±0.6MtCO2e
27. This figure presents an additional 0.2% on the global health care footprint. Due to increasing uptake of these gases, increasingly preferred to nitrous oxide, the footprint from anesthetic gases can be expected to increase.
Anesthetic gases therefore contribute at least 0.6% of health care’s global climate impact. Wider adoption of waste anesthetic capture systems has the potential to be a high impact health care-specific climate mitigation measure.
For many individual health facilities and systems of hospitals the proportion of the contribution of both nitrous oxide and fluorinated anesthetic gases to their climate footprint can be significantly higher. For instance, Albert Einstein Hospital in Sao Paulo, Brazil found that GHG emissions from nitrous oxide contributed to 75% of their Scope 1 GHG emissions and nearly 35% of their total reported GHG emissions in 2013. Meanwhile a study of operating theaters in three health systems in the United States, United Kingdom, and Canada found that preferential use of desflurane resulted in a ten-fold higher quantity of anesthetic-related GHG emissions across hospitals in the study.
31
How the Health Sector Contributes to the Global Climate Crisis and Opportunities for Action
7. Significant data gaps remain
Global health care is a complex and diverse sector that has never been mapped to climate emissions before. Over the course of this paper, a series of data gaps emerged that we were not able to address given limited time and resources and/or the nature of the methodology we have used.
National and regional estimates are limited. One important gap exists between the global estimates and national estimates. By using the MRIO model we were able to produce a coherent estimate of health care’s global climate footprint that allows for comparison between nations and regions. However, the limitation of this model is that we were not able to use specific country data. Therefore this paper’s country estimates will differ from what will often be much more granular and accurate country estimates that are carried out at the national level.
Additionally, the absence of country specific data for this global model from Africa and the Middle East, as well as a large number of countries in Asia, Latin America, and the Caribbean, is a significant gap. The poor quality of available data for African countries leaves a major opportunity to improve the breadth of this study. For many other low- and middle-income countries in Latin America and Asia results were attributed to World Bank regions based on estimates using data from neighboring countries. Establishing the capacity for the health sector to understand, measure, and track its climate footprint in every region and every country is a fundamental step for aligning the sector with the ambition and vision of the Paris Agreement.
One solution we are recommending is that a standardized framework for national and sub-national health care climate footprint measurement be developed by WHO to ensure consistent and ongoing health sector climate footprint measurement and tracking (Policy Recommendations, Action 5).
WIOD categories are not broken down by Greenhouse Gas Protocol scopes. While the WIOD database provides an important lens to view health care’s global climate footprint via a set of expenditure categories, this paper does not allocate those categories within the three GHG Protocol scopes. A deeper understanding of health care’s global footprint will emerge once a structural path analysis can be conducted.
Health care’s supply chain needs to be better understood. A structural path analysis can provide a more sophisticated understanding of health care’s Scope 3 emissions and the global health care supply chain. Importantly this paper does not deliver a global estimate of the contribution of the pharmaceutical industry to health care’s climate footprint. This is important as the NHS i n the UK found that pharmaceuticals made up 11% of England’s health and social care footprint in 2015.36
The footprints of anesthetic gases and meter dosed inhalers need to be measured. Current data from 31 countries is insufficient. Anesthetic gases may also play a much more significant role in the footprint of health care facilities than reported in this paper and should not be overlooked.
The trajectory of health care emissions is not well understood. This paper provides an analysis based on data from one year (2014). It does not provide a time-sequenced approach that would allow for an understanding of the evolution of health care’s footprint or for an analysis of the trajectory it is on.
32

33

POLICY RECOMMENDATIONS
Health care’s responsibility
Given that the health sector contributes 4.4% to global GHG emissions, it is imperative that health care acts now to begin to reduce its own climate footprint and move toward net zero emissions.
Health policies and investment must be retooled to support decarbonization. If the health sector — individual health care facilities, health systems, ministries of health, international and bilateral development agencies, and private health care organizations — all take action toward this goal, it can be achieved. If we can align health care development, growth, and investment with global climate goals, the 10% of the world economy that health care represents can help drive decarbonization and lead to a climate-smart, more equitable, and healthier future.
The following are a set of recommendations of how to get there.
Six actions areas for climate-smart health care
Action 1: Reduce health care’s climate footprint now
toward net zero emissions from the bottom up, while simultaneously improving climate resiliency.
These actions could include the use of appropriate low-carbon technology for care; low-carbon or net zero emissions building design and construction; investment in renewable energy and energy efficiency; climate-smart cooling technologies; sustainable waste, water, and transport management; and minimizing the use of high high global warming potential anesthetic gases; among others.37
Decentralized models of care that take advantage of telemedicine and other new technologies can also help reduce health care’s climate footprint. Health systems that are increasingly focused on prevention rather than treating disease will further reduce the need for carbon intensive treatment and facilities.
Climate-smart strategies and investments can also foster more equitable access to health care, and serve as an anchor for sustainable community development, and therefore not only resilient health systems, but also resilient, healthier communities. For instance, in energy-poor settings, powering health care with low-carbon solutions can enhance access to care, contributing to the advancement of universal health care for the poor and most vulnerable.
Thousands of hospitals and health systems, both public and private, are already taking action to address their climate footprint, both through Health Care Without Harm’s Health Care Climate Challenge and via related actions (See:Climate-smart health care: A low-carbon and resilience framework for health sector action on page 41). These leaders can provide examples of the way forward for the sector.
The Greenhouse Gas Protocol provides a useful framework for the health sector to further advance its climate mitigation efforts, while aligning with other sectors. Action in each of the three Scope areas by all actors at all levels in the health sector can further develop parallel and related paths toward zero emissions.
Scope 1: Decarbonize health care facilities. WHO should produce a guidance that outlines actions that health facilities can take to reduce their climate footprint and become more resilient.
Such a guidance would enable and empower national and sub-national ministries of health that manage hospitals, private health care systems, as well as individual hospitals and health centers to build on existing best practice examples and take on a series of cost-effective initiatives that can move the sector
34

Scope 2. Health organizations, public and private, should invest in and advocate for the decarbonization of local and national energy systems, and the implementation of clean renewable energy at the local, sub-national and national levels.
With 10% of health care facilities’ climate footprint coming from purchased energy, and with a large amount of the supply chain also consuming grid energy, decarbonization of national energy systems is essential to move health care to net zero emissions. As discussed in this paper, there is a large potential to mitigate health care’s climate footprint by decarbonizing the domestic energy system.
Health systems in several countries are investing renewable energy through power purchasing agreements and other mechanisms, while others can use their political and ethical influence to impact energy policies in their jurisdictions (Action 2). For instance, the health sector can partner with city-based efforts such as those of C40 cities, that are embracing robust renewable energy goals.
Scope 3: Decarbonize the health care supply chain. Health ministries, hospitals, and health systems should set criteria for low-carbon or zero emissions procurement. Suppliers and manufacturers should decarbonize their operations and products.
Much of the 71% of health care Scope 3 emissions are embodied in the global supply chain. The transition to low-carbon or decarbonized health care will require moving global production of health care products — everything from pharmaceuticals to medical devices, from food to clothing — onto a zero emissions trajectory.
There is limited guidance or standardized methodology on how to calculate the health sector’s global supply chain and therefore a limited understanding of key areas for action. An important step in addressing this challenge is to identify the GHG emissions hotspots in the global supply chain, in terms of both products and geography.
Decarbonizing the health care supply chain will require greater responsibility by and accountability of the global corporations at the center of it. Such accountability can be achieved through national government action and through market-based approaches, including leveraging health care’s purchasing power toward low-carbon energy sources and technologies, as well as plant-centered, sustainable, and locally grown food.
For instance, health systems acting in concert around the world can pursue a demand-based strategy to require health care products and devices based on emissions criteria. Such an approach can also influence broader markets and policy and helping accelerate the transition to clean, renewable energy and a low-carbon future.
Tools and resources need to be developed to catalyze and support such a major effort. UNDP and Health Care Without Harm are taking a step in this direction by working together in an initiative funded by the Swedish International Development Cooperation Agency (SIDA) to develop a set of criteria, model policies (such as requesting carbon data in tendering documents), and tools for health ministries, health systems, and hospitals to implement sustainable procurement across the sector, including reducing carbon emissions.38
35
How the Health Sector Contributes to the Global Climate Crisis and Opportunities for Action

Action 2: The health sector must support a societal transition to clean, renewable energy
In every country, the health sector has its own government ministry with a seat at the table in cabinet discussions, and analogous local institutions in nearly every city, state, or province. These organizations, together with private health systems, health professionals, medical students, and civil society organizations should all advocate for the transition to clean, renewable energy and transportation as the key step in protecting public health from climate change and as a central measure to reduce health care’s climate footprint.
As we have seen in this paper, decarbonizing a country’s energy system and transitioning to clean, renewable energy is essential for health care in every country to decarbonize. By helping foster this transition, the health sector will contribute to its own climate footprint reduction.
Doing so would also protect public health, by transitioning from fossil fuels to clean, renewable energy and therefore reducing the burden of disease from both air pollution and climate change. This will in
turn reduce health care costs. For instance, according to the International Monetary Fund, approximately half of the United States’ $5.3 trillion a year in “energy subsidies” are not direct financial subsidies, but rather attributable to the health costs of air pollution. Conversely, pricing carbon in line with these health impacts would cut roughly 50% of air pollution deaths and 20% of CO2 emissions.39
Such a significant reduction of air pollution and the mitigation of the worst impacts of climate change will also reduce the need for health care to consume and expend resources to treat air pollution and climate related illness. This in turn would create a virtuous cycle and further reduce health care’s climate footprint.
The transition to clean, renewable energy is occurring in many countries and in sight globally. There are increasingly viable pathways for most of the world’s countries to shift to 100% clean, renewable energy by 2050, avoiding global warming above 1.5°C and millions of annual deaths from air pollution.40
The health sector in every country should advocate for a rapid phase-out of fossil fuels and a transition to clean renewable energy so as to help move health care to zero emissions while also protecting public health from both local pollution and global climate change.
Action 3: Chart the course for zero emissions health care by 2050
The road map should be based on principles of global equity for climate and health, a unified, climate-smart approach to mitigation and resilience, and an approach that fosters action at all levels.
As this paper documents, there is a wide variation between the emissions intensity of health care in different countries and regions of the world. Each country has its own unique circumstances, and will face specific challenges as it moves to decarbonize and build greater climate resilience in its health sector.
At the same time, given the globalized nature of the health sector, particularly its supply chain, and the significant impact of some countries and regions, a global road map can help chart a course to ameliorate the health sector’s climate impact and move the sector toward zero emissions by 2050.
POLICY RECOMMENDATIONS
36

Action 4: Make development assistance for health climate-smart
Bilateral aid agencies, multilateral development banks, other health funding agencies, and philanthropies should integrate climate-smart principles and strategies into their health aid, lending, and policy guidance for developing countries. Those funding climate mitigation and adaptation should integrate health into their programs.
Global institutions are beginning to move in this direction. For instance, the World Bank, in collaboration with Health Care Without Harm, published Climate-Smart Health Care as a framework
for its health development assistance (See: Climate-smart health care: A low-carbon and resilience framework for health sector action on page 41). Meanwhile, in the lead up to the 2019 Climate Summit
Such a road map should be based on the following principles:
Global equity for climate and health: The principle of “common but differentiated responsibilities and respective capabilities in light of different national circumstances” used by the United Nations Framework Convention on Climate Change should apply to this effort.41 In other words, a road map should identify significant time-bound actions along three pathways. First, those most responsible for contributing to the problem should take the most rapid action. Second, the road map should identify pathways that support middle-income nations whose health sectors are projected to grow significantly in coming years to not fall into the trap of investing in old carbon intensive models that replicate the problem, but rather adjust their health sector growth trajectory to align with national and international climate goals. And third, a global road map must also identify how those health sectors least responsible for climate emissions can forge a transition to a low-carbon health care development path that improves health equity and access. Financing mechanisms for the transition should also be identified.
A unified approach toward mitigation and resilience: While putting health care on a path toward zero emissions is essential, so is adaptation — building climate resilient health care infrastructure and systems. Hospitals and health centers are often directly impacted by extreme weather events, while health professionals are first responders to climate impacts in their communities. Building health care resilience is often the most compelling and urgent
action for health systems impacted by climate change everywhere. It is particularly important for those in low-income countries whose health systems’ climate footprint may be small, yet who are severely impacted by climate change. Increasing climate resilience and mitigating health care’s carbon emissions can be complementary rather than competing objectives (See: Climate-smart health care: A low-carbon and resilience framework for health sector action on page 41). A global road map should chart this course.
A global framework for action at all levels: Health care climate action will manifest differently, depending on the local, national, and regional differences across the health care sector. Such differentiation may be determined by a sector’s level of development, its emissions profile, and its composition. For instance, what portion of the sector is public vs. private? Is the country a major supplier and manufacturer of health care goods and services? What is the carbon intensity of the country’s electricity grid and its overall economy? Nevertheless, there are several broad principles and approaches for climate-smart health care that can be applied to all (See: Climate-smart health care: A low-carbon and resilience framework for health sector action on page 41). A global road map should establish a framework for regional, national, and sub-national action plans that contribute to a country’s Nationally Determined Contributions to the Paris Agreement (Action 5). It can also help chart a course for bilateral and multilateral health aid and finance (Action 4). And it can begin to set targets and timetables for decarbonization of the supply chain — including the pharmaceutical and medical device manufacturing industries.
37
How the Health Sector Contributes to the Global Climate Crisis and Opportunities for Action

in New York, the UN Secretary General for the first time placed a high emphasis on the health dimensions of climate change.
One of the action items promoted through the Summit by WHO, the governments of Peru and Spain, as well as others is for multilateral development banks; climate, health, or development funds; bilateral development agencies; philanthropic organizations; and/or private sector actors to commit to significantly scale up their investment in proven interventions for climate resilient, low-carbon, environmentally sustainable health systems.42
As discussed earlier, Development Assistance for Health (DAH) totals more than $37 billion annually.43
While a relatively small part of the world’s total spending on health, DAH has a major influence on the design of health systems and implementation of health policy in many developing, primarily low-income countries.
By making DAH climate-smart, these powerful institutions can assure that the health sector invests in a low-carbon, climate-resilient health development model that establishes a trajectory toward zero emissions health care while strengthening health systems and promoting health access.
Under such an approach, DAH funded primary health care can become a powerful agent for advancing climate protection, community climate resilience, and low-carbon development. For instance, renewable energy, particularly in remote areas, increases the resilience of health care facilities to climate change. Health care facilities powered by solar or wind energy as well as deploying increasingly energy efficient medical devices can be more cost-effective to run, more productive, and can improve access to health care, thereby contributing to the goal of universal health coverage.44 Indeed, the infrastructure and operational efficiencies of primary health care facilities around the world should become shining examples of renewable energy and sustainable development.
Action 5: Establish and implement government action plans for climate-smart health care
National and sub-national governments should establish action plans to decarbonize their health systems, build resilience, and improve health outcomes.
The health ministries of national and sub-national governments must provide leadership and take action to transition the health systems under their jurisdiction toward decarbonization and climate resilience. In many cases, they will require financing and investment to do so. They will also need political support from their government sectors tasked with leading the work on climate change. Conversely, they can influence these other sectors of government.
International and civil society organizations can help facilitate this process by creating a standardized and adaptable framework for these plans and by convening key stakeholders to develop them in
multiple jurisdictions. National and sub-national plans, particularly in low- and middle-income countries, can be linked with the UNFCCC National Adaptation Plans and the health components of National Adaptation Plans (HNAPs) that WHO is supporting countries to produce.
Governments can also draw from existing examples, including the work of England’s National Health Service Sustainable Development Unit;45 a national strategy developed by WHO and Health Care Without Harm for the Maldives;46 the work of the Boston Green Ribbon Commission’s Health Care Working Group to develop a strategy for that city;47 the establishment
POLICY RECOMMENDATIONS
38

Action 6: Deepen research on health care and climate change
Health care and climate change is a new sub-field of research in the relatively new research area of climate and health. As Health Care Without Harm and Arup developed this paper it became clear that further research is necessary to better understand trends in the interplay of health care and climate change, so as to facilitate the transition of the health sector to a climate-smart future.
Some of the research areas we identified include:
• An analysis of the future trajectory of health care emissions under various scenarios of investment, development, and growth and their implications for carbon emissions.
• National and sub-national level research on health care’s climate footprint based on a standardized methodology (Action 6).
• Identifying carbon budgets for national health systems.
• Developing a sophisticated structural path analysis of the climate emissions from the health care supply chain and identifying key points of leverage for decarbonization.
• Developing a more sophisticated analysis of health care’s climate emissions based on the WHO categories that define the health sector.
• Establishing economic analysis of the costs and benefits of transitioning to climate-smart health care, as well as the necessary investment and financing mechanisms that can facilitate the transition.
of state-wide Health Care Climate Alliances in Massachussets and California to impact policies in those U.S. states;48 and a civil society effort led by the Climate and Health Alliance of Australia to establish a National Strategy for Climate, Health and Well Being, currently being adapted by several state governments there.49
National and sub-national health care climate action plans can serve as vehicles to convene the various stakeholders in the health sector in a given jurisdiction, and to mobilize the sector to make a contribution to sub-national or national climate policy as well as a country’s Nationally Determined Contributions for Paris.
In order to best develop and implement such plans, national and sub-national governments will need to understand their climate footprint. While this paper is the first ever global analysis of health care’s climate footprint, it provides a necessarily limited view of 43 individual countries’ footprints where data is available. As noted previously, recent country studies in Australia, Canada, England and the United States have shed a more detailed light on health care’s climate footprint in this handful of countries. However, in most
of the world national and sub-national health ministries have little capability to calculate the climate footprint of the sector they are responsible for, let alone track it. Overall, this is no standardized approach for the sector.
Therefore, WHO should establish a validated measurement approach and tracking system that allows health ministries at the national and sub-national levels as well as other national and regional health standards bodies to develop granular analyses of their health sectors’ climate footprints, track progress, and take action.
A standardized framework should be designed to allow all governments to measure their health sector’s footprint and track their progress toward decarbonization and resilience. Such a tool would help inform departments or ministries of health as they develop action plans that contribute to the implementation of municipal, state/provincial and national climate policies, as well as countries’ Nationally Determined Contributions to the Paris Agreement.
39
How the Health Sector Contributes to the Global Climate Crisis and Opportunities for Action

FINAL WORDS
Health, as with every sector of society, has the responsibility to align its actions and development trajectory with the Paris Agreement in order to stave off the worst impacts of climate change.
Given its mission to protect and promote health, the sector also has a special responsibility to implement the Hippocratic Oath to “first, do no harm” as its relates to its own climate footprint.
To resolve the climate crisis is a daunting task for all of civilization. For the health sector specifically, serious climate action will require facilities, systems, and ministries, together with manufacturers and suppliers to organize to achieve net zero emissions by 2050 or before.
The sector must undertake this effort in the context of its own growth and demand for health services. It must become climate-smart while addressing its own inequities, and in the context of meeting global health goals, including the Sustainable Development Goals.
If it fails to act decisively, health sector emissions could grow to make up an even more significant portion of the global climate footprint. Without concerted action, the health sector will find itself on a trajectory that is in contradiction with growing public alarm at the social, political, economic, and ecological dimensions of the climate crisis. Climate change, in all its dimensions, will become an increasingly high priority for consumers and decision-makers across every society. Health care must become a leader in solving this problem.
Fortunately, several health care institutions in multiple countries are already leading the way toward decarbonization (See: Climate-smart health care: A low-carbon and resilience framework for health sector action on page 41). Several international institutions have also called for health care to address its own climate impacts. The WHO has called for health systems to “lead by example, advancing models of low-carbon health care”50 and has suggested that “a low-carbon development path for health systems and ultimately a transition to net-zero emissions is essential for health sector facilities to meet the goal of the Paris Agreement of maintaining global warming below 2.0 °C or 1.5 °C.” 51 The World Bank has established a framework for climate-smart health care (See: Climate-smart health
care: A low-carbon and resilience framework for health sector action on page 41). In the lead-up to the UN Secretary General’s 2019 Climate Action Summit, the WHO, together with the governments of Peru and Spain advocated for multilateral development banks, climate funds, bilateral development agencies, philanthropic organizations, and private sector actors “to commit to significantly scale up their investment in proven interventions for climate-resilient health systems”.52
These are all just initial steps for the health sector. To solve the problem documented in this paper, it is essential that all health systems in high-, middle-, and low-income countries, together with the private sector, development agencies, multilateral funders, international organizations, and civil society, take concerted action to put health care on a trajectory to net zero emissions, while continuing to strive toward globally agreed upon health goals. Every nation and segment of the health sector must do its part.
In addition to the decarbonization of the sector itself, a big part of the solution will need to be disease prevention. In other words, reducing the growing global burden of non-communicable disease depends on addressing the factors that lead to them — tobacco, alcohol, air pollution, and petrochemical contamination of our environment. Doing so will reduce carbon intensive hospitalizations, the demands for health care services, and the use of carbon intensive pharmaceuticals as treatment. Such prevention will also reduce health care costs.
Many of these health-based interventions will also reduce carbon emissions outside of the health sector. Air pollution is a case in point. The main driver of air pollution and climate change is the same: the combustion of fossil fuels. Addressing the scourge of air pollution and solving for climate change requires the same action: transitioning to a clean energy future. This preventative action will save millions of lives, significantly reduce climate emissions and reduce health care costs.
Utlimately the health sector goals of health promotion, disease prevention, universal health coverage and the global climate goal of net zero emissions must become intertwined. The sector must become climate-smart. Both climate justice and health equity depend on it.
40

Climate-smart health care: A low-carbon and resilience framework for health sector action.
A 2017 World Bank report, co-produced with Health Care Without Harm, established a new approach that bridges the divide between adaptation and mitigation in the health sector. While mitigation and resilience are often placed in separate silos in the climate world, the climate-smart health care approach encompasses both low-carbon and resilience strategies in an overarching framework.53
Climate-smart health care is an approach for designing, building, operating, and investing in health systems and health care facilities that generates minimal amounts of GHGs. It puts health systems on a climate-smart development path, aligning health development and delivery with global climate goals. This approach saves money by reducing energy and resource costs. It can improve the quality of care in a diversity of settings. Climate-smart health care strengthens health systems by increasing facilities’ resilience to extreme weather events and other disasters, while also promoting approaches to adaptation.
As hospitals and health systems explore opportunities to address climate change, they are finding significant overlap and synergy between mitigation measures and climate change resilience interventions.
Many resilience strategies also contribute to climate mitigation and vice versa — for example, siting health sector facilities with access to public transportation, deploying on-site energy generation including solar and other renewable sources, combined heat and power, building with natural ventilation, purchasing energy-efficient medical devices, and changes in health delivery such as telemedicine contribute to both system resilience and climate footprint reduction. Hospitals are finding that the interventions that enable them to reduce their dependence on large power grids and infrastructure also enable them to better withstand situations, like increased storms, that disable centralized infrastructure.
41
How the Health Sector Contributes to the Global Climate Crisis and Opportunities for Action

NOTES
1 IPCC Special Report on Global Warming of 1.5 °C (SR15) https://archive.ipcc.ch/pdf/special-reports/sr15/sr15_spm_final.pdf
2 J Ellsmoor, Forbes Climate Emergency Declarations: How Cities Are Leading The Charge https://www.forbes.com/sites/jamesellsmoor/2019/07/20/climate-emergency-declarations-how-cities-are-leading-the-charge/
3 WHO Global Health Observatory (GHO) Data https://www.who.int/gho/health_financing/en/
4 The Lancet: http://www.thelancet.com/journals/lancet/article/PIIS0140-6736(15)60931-X/abstract
5 The World Bank, 2015, Shock Waves: Managing the Impacts of Climate Change on Poverty https://openknowledge.worldbank.org/bitstream/handle/10986/22787/9781464806735.pdf
6 N Watts et.al The 2018 report of the Lancet Countdown on health and climate change: shaping the health of nations for centuries to come, , P2479-2514, DECEMBER 08, 2018, https://www.thelancet.com/journals/lancet/article/PIIS0140-6736(18)32594-7/fulltext
7 The World Health Organization,https://www.who.int/news-room/detail/02-05-2018-9-out-of-10-people-worldwide-breathe-polluted-air-but-more-countries-are-taking-action
8 The Lancet: http://www.thelancet.com/journals/lancet/article/PIIS0140-6736(15)60931-X/abstract
9 Chung JWand MeltzerDO2009 Estimate of the carbon footprint of the US health care sector J. Am. Med. Assoc. 3021970–2
10 Eckelman MJ, Sherman J (2016) Environmental Impacts of the U.S. Healthcare System and Effects on Public Health. PLoS ONE 11(6): e0157014. doi:10.1371/journal.pone.0157014
11 Reducing the use of natural resources in health and social care 2018 report, Sustainable Development Unit, NHS and Public Health England. https://www.sduhealth.org.uk/documents/Policy%20and%20strategy/20180912_Health_and_Social_Care_NRF_web.pdf
12Malik A, Lenzen M, McAlister S and McGain F 2018 The carbon footprint of Australian health care Lancet Planet. Health 2 e27–35
13 EckelmanMJ, Sherman JDand MacNeill AJ 2018 Life cycle environmental emissions and health damages from the Canadian healthcare system: an economic-environmentalepidemiological analysis PLoS Med. 15 e1002623
14 The World Bank, 2017, Climate Smart Health Care: Low Carbon and Resilience Strategies for the Health Sector http://documents.worldbank.org/curated/en/322251495434571418/Climate-smart-healthcare-low-carbon-and-resilience-strategies-for-the-health-sector
15 Hovland Consulting LLC, Health Care Without Harm, with Natural Resources Defense Council (2018), “Global Climate Impact from Hospital Cooling,” Kigali Cooling Efficiency Program, San Francisco.
16 Peter-Paul Pichler et al 2019 Environ. Res. Lett. 14 064004 https://iopscience.iop.org/article/10.1088/1748-9326/ab19e1/meta
17 J. Kitzes, “An Introduction to Environmentally-Extended Input-Output Analysis,” Resources, no. 2, pp. 489-503, 2013.
18 P.-P. Pichler, I. Jaccard, U. Weisz and H. Weisz, “International comparison of health care carbon footprints,” Environmental Research Letters, no. 14, pp. 1-8, 2019.
19 J. Gütschow, L. Jeffery and R. Gieseke, “The PRIMAP-hist national historical emissions time series v2.0 (1850-2016),” GFZ Data Services, https://doi.org/10.5880/PIK.2019.001, 2019.
20 Eurostat, “NACE Rev. 2: Statistical classification of economic activities in the European Community,” Office for Official Publications of the European Communities, Luxembourg, 2008.
21 OECD, Eurostat and World Health Organisation, “A system of health accounts 2011: revised edition,” OECD Publishing, Paris, 2017.
22 OECD, “OECD Health Statistics 2019,” 2019. [Online]. Available: https://stats.oecd.org/index.aspx?DataSetCode=HEALTH_STAT. [Accessed 6 May 2019].
23 M. P. Timmer, E. Dietzenbacher, B. Los, R. Stehrer and G. J. de Vries, “An Illustrated User Guide to the World Input–Output Database: the Case of Global Automotive Production,” Review of International Economics, no. 23, p. 575–605, 2015.
24 USEPA Greenhouse Gas Equivalencies Calculator. Calculated 8/8/19.
25 Sustainable Development Unit (NHS), “Carbon Footprint update for NHS in England 2012,” Sustainable Development Unit, Cambridge, 2013.
26 Sustainable Development Unit, “Call for action on gases used in inhalers,” Sustainable Development Unit, [Online]. Available: https://www.sduhealth.org.uk/news/605/call-for-action-on-gases-used-in-inhalers/. [Accessed 19 July 2019].
27 UNFCCC, “National Inventory Submissions 2016,” UNFCCC, 2019. [Online]. Available: https://unfccc.int/process/transparency-and-reporting/reporting-and-review-under-the-convention/greenhouse-gas-inventories/submissions-of-annual-greenhouse-gas-inventories-for-2017/submissions-of-annual-ghg-inventories-2016. [Accessed 19 July 2019].
28 World Health Organization, “World Health Organization Model List of Essential Medicines,” World Health Organization, Geneva, 2019.
29 Vollmer, M. K., T. S. Rhee, M. Rigby, D. Hofstetter, M. Hill, F. Schoenenberger, and S. Reimann (2015), Modern inhalation anesthetics: Potent greenhouse gases in the global atmosphere, Geophys. Res. Lett., 42, 1606–1611, doi:10.1002/2014GL062785.
30 Sustainable Development Unit (NHS), “Carbon Footprint from Anaesthetic gas use,” Sustainable Development Unit, Cambridge, 2013.
31 PRIMAP 32 United States Environmental Protection Agency Greenhouse
Gas Equivalencies Calculator URL: https://www.epa.gov/energy/greenhouse-gas-equivalencies-calculator
33 Institute for Health Metrics Evaluation, Financing Global Health, 2016, https://issuu.com/ihme/docs/ihme_fgh2016_technical-report, p. 79
42

NOTES
34 https://issuu.com/ihme/docs/ihme_fgh2016_technical-report35 T. Corsatea, S. Lindner, I. Arto, M. Román, J. Rueda-Cantuche,
A. A. Velázquez, A. Amores and F. Neuwahl, “World Input-Output Database Environmental Accounts. Update 2000-2016,” Publications Office of the European Union, Luxembourg, 2019.
36 Sustainable Development Unit, “Carbon update for the health and care sector in England 2015,” Sustainable Development Unit, Cambridge, 2016.
37 Bouley, et.al., Climate Smart Health Care, World Bank Group, 2017; Diarmid Campbell-Lendrum, Nicola Wheeler (consultant), Marina Maiero, Elena Villalobos Prats and Tara Neville, “Health and Climate Change: COP 24 Special Report,” December 2018, World Health Organization, Geneva.
38 See Sustainable Health in Procurement Project (SHiPP). https://noharm-global.org/documents/sustainable-health-procurement-project-shipp-2018-2021.
39 International Monetary Fund: https://www.imf.org/en/News/Articles/2015/09/28/04/53/sonew070215a
40 Jacobson et al., “100% Clean and Renewable Wind, Water, and Sunlight All-Sector Energy Roadmaps for 139 Countries of the World, Joule 1, 1–14,” September 6, 2017 ª 2017 Elsevier Inc. http://dx.doi.org/10.1016/j.joule.2017.07.005
41 See https://climatenexus.org/climate-change-news/common-but-differentiated-responsibilities-and-respective-capabilities-cbdr-rc/ For a succinct explanation.
42 See https://www.who.int/globalchange/commit/en/43 https://issuu.com/ihme/docs/ihme_fgh2016_technical-report44 See UNDP Solar for Health, https://stories.undp.org/solar-for-
health; UN Foundation, Powering Health Care http://poweringhc.org/; and World Health Organization & World Bank. (2014). Access to modern energy services for health facilities in resource-constrained settings: a review of status, significance, challenges and measurement, Reprinted in 2015 with changes. World Health Organization. https://apps.who.int/iris/handle/10665/156847
45 https://www.sduhealth.org.uk/policy-strategy/46 World Health Organization, Health Care Without Harm, Maldives
green climate-smart hospitals: policies and strategies report, 2019 https://apps.who.int/iris/handle/10665/312046
47 https://www.greenribboncommission.org/work/health-care-working-group/
48 https://noharm-uscanada.org/content/us-canada/california-health-care-climate-alliance and https://noharm-uscanada.org/ Health Care Without Harm-content-tags/massachusetts
49 “Towards a National Strategy on Climate, Health and Well-Being for Australia, Discussion Paper,” Climate and Health Alliance of Australia, June 2016, http://s3-ap-southeast-2.amazonaws.com/caha-org/uploads/2016/06/CAHA-Discussion-Paper-v04.pdf
50 World Health Organization, “Conference Conclusions and Action Agenda (Final Version),” Second Global Conference, Health and Climate, Paris, 7-8 July, 2016.
51 Diarmid Campbell-Lendrum, Nicola Wheeler (consultant), Marina Maiero, Elena Villalobos Prats and Tara Neville, “Health and Climate Change: COP 24 Special Report,” December 2018, World Health Organization, Geneva.
52 Social and political drivers workplan, https://www.un.org/sustainabledevelopment/wp-content/uploads/2019/05/WP-Social-and-political-drivers.pdf, Climate Action Summit 2019, Office of the UN Secretary General, https://www.un.org/en/climatechange/climate-action-areas.shtml, accessed July 18, 2019
53 Bouley T, Roschnik S, Karliner J, Wilburn S, Slotterback S, Guenther R, et al. Climate smart healthcare: low-carbon and resilience strategies for the health sector. Washington DC: World Bank; 2017. http://documents.worldbank.org/curated/en/322251495434571418/Climate-smart-healthcare-low-carbon-and-resilience-strategies-for-the-health-sector
54 For more information see http://healthcareclimatechallenge.org/55 CDP URL: https://www.cdp.net/en/cities/world-renewable-energy-
cities56 RE100 URL: http://there100.org/companies57 US EPA URL: https://www.epa.gov/greenpower/green-power-
partnership-top-30-college-university-058 Reducing the use of natural resources in health and social care
2018 report, Sustainable Development Unit, NHS and Public Health England. https://www.sduhealth.org.uk/documents/Policy%20and%20strategy/20180912_Health_and_Social_Care_NRF_web.pdf
59 Skåne – Fossil fuel-free by 2020, URL: https://www.skane.se/en/politics-and-organisation/environment-and-nature/skane--fossil-fuel-free-by-2020/
60 https://practicegreenhealth.org/sites/default/files/201906/PracticeGreenhealth_GHG_Toolkit_Executive_Summary.pdf
61 https://noharm-global.org/articles/news/global/united-nations-development-programme-and-health-care-without-harm-launch-new
43
How the Health Sector Contributes to the Global Climate Crisis and Opportunities for Action

44

Design by Kariza Cruz Photos:Cover: La Habana, Cuba in the wake of Hurricane Irma, 2017. Photo: EFE/Rolando Pujol
p. 7. Hospital evacuation, Tambaram, Chennai, India, photo PTI p. 14. Kaara health center, Mali. Photo: Abbie Trayler-Smith p. 31. Image from Earth.com p. 33, Severance Hospital, Yonsei University Health System, Seoul South Korea. Photo: Josh Karliner, Health Care Without Harm p. 33. 1500 MW Coal-fired NTECL Vallur Thermal Power Station, Ennore, North Chennai, India Photo: Amirtharaj Stephen,
Healthy Energy Initiative India p. 41. Bertha Gxowa Hospital, Johannesburg, South Africa. Photo: Susan Wilburn, Health Care Without Harm p. 44. Beijing Ditan Hospital, China. Photo: Josh Karliner, Health Care Without Harm Back Cover: Kaiser Permanente medical facility, Santa Clara California, USA. Photo: courtesy of Kaiser Permanente.

www.noharm.org
E D C M Q
Copyright © 2022 FDOKUMEN