Indicator Reports - Dec-2013 (1)
152
Telecom Regulatory Authority of India The Indian Telecom Services Performance Indicators October - December, 2013 New Delhi, India 28 th April, 2014 Mahanagar Doorsanchar Bhawan, Jawahar Lal Nehru Marg, New Delhi-110002 Tel: +91-11- 23230752, Fax: +91-11- 23236650 Website: www.trai.gov.in
-
Upload
independent -
Category
Documents
-
view
1 -
download
0
Transcript of Indicator Reports - Dec-2013 (1)

Telecom Regulatory Authority of India
The Indian Telecom Services Performance Indicators
October - December, 2013
New Delhi, India 28th April, 2014
Mahanagar Doorsanchar Bhawan, Jawahar Lal Nehru Marg, New Delhi-110002
Tel: +91-11- 23230752, Fax: +91-11- 23236650
Website: www.trai.gov.in

Disclaimer
The Information and Statistics contained in this report are derived from
variety of sources, but are mainly reliant on data obtained from Service
Providers. This report does not constitute commercial or other advice. No
warranty, representation or undertaking of any kind, express or implied,
is given in relation to the information and statistics contained in this
report.

Table of Contents
Snapshot ......................................................................................................... i
Trends at a Glance ........................................................................................... x
Introduction ................................................................................................. xiii
Chapter 1 : ...................................................................................................... 1
Subscription Data ............................................................................................ 1
Section A : Access Service - An Overview .......................................................... 2
Section B : Wireless Service ........................................................................... 10
Section C : Wireline Service ........................................................................... 18
Section D : Internet Service ............................................................................ 25
Chapter 2 : Revenue and Usage ...................................................................... 37
Section A: GSM Service .................................................................................. 38
Section B: CDMA - Full Mobility Service ......................................................... 46
Chapter 3 : Financial Data of Telecom Service Sector .................................... 53
Chapter 4 : Quality of Service (QoS) ............................................................... 58
Section A: Quality of Service Performance of Wireless Service Providers .......... 59
Section B: Quality of Service Performance of Wireline Service Providers .......... 68
Section C: Quality of Service Performance of Broadband Service .................... 72
Chapter 5 : Performance of Cable TV, DTH and Radio Broadcasting Services.. 75
Annexures ..................................................................................................... 81
Annexure 1.1: Licensed Cellular (GSM & CDMA) Service Providers ....................... 82
Annexure 1.2: Wireless Subscriber Base .......................................................................... 83
Annexure 1.3: Wireline Subscriber Base .......................................................................... 86
Annexure 1.4: Service Area and Operator wise details of PCOs ............................... 88
Annexure 1.5: Service Provider wise details of Village Public Telephones ............ 91
Annexure 1.6: List of Internet Service Providers Providing Internet Telephony Service ............................................................................................................. 99
Annexure 1.7 : Internet Service Provider(ISP) wise Internet Subscriber base (except subscribers accessing internet by mobile devices) ............ 94
Annexure 1.8: Service Area wise PMRTS subscriber Base ....................................... 100
Annexure 2.1: GSM Service - Service Area wise Statistics for QE Dec-13 .......... 101
Annexure 2.2: CDMA Full Mobility Service - Service Area wise Statistics for QE Dec-13 ........................................................................................................... 102
Annexure 4.1: Performance of QoS Parameters for Cellular Mobile 2G Service 103
Annexure 4.2: Performance of QoS Parameters for Cellular Mobile 3G Service 108
Annexure 4.3: Performance of QoS Parameters for Basic (Wire-line) Service .... 110
Annexure 4.4: Quality of Service Performance of Broadband Service Providers 113
Annexure 5.1: A-la-carte rates of pay channels for non-CAS areas, as reported to TRAI by the respective Broadcasters .................................................. 116
Annexure 5.2: List of operational private FM Radio Stations in India .................. 121
Annexure 5.3: List of applicants who have been granted DTH License ............... 129
Annexure 5.4: List of permitted teleports at various locations in India ............... 130
Index of Tables & Charts ....................................................................... 135

i
Snapshot
(Data As on 31st December, 2013)
Telecom Subscribers (Wireless +Wireline)
Total Subscribers 915.19 Million
% change over the previous quarter 1.70%
Urban Subscribers 549.40 Million
Rural Subscribers 365.79 Million
Market share of Private Operators 86.63%
Market share of PSU Operators 13.37%
Teledensity 74.02
Urban Teledensity 144.95
Rural Teledensity 42.67
Wireless Subscribers
Total Wireless Subscribers 886.30 Million
% change over the previous quarter 1.81%
Urban Subscribers 526.63 Million
Rural Subscribers 359.67 Million
GSM Subscribers 824.06 Million
CDMA Subscribers 62.24 Million
Market share of Private Operators 88.73%
Market share of PSU Operators 11.27%
Teledensity 71.69
Urban Teledensity 138.94
Rural Teledensity 41.95
Wireline Subscribers
Total Wireline Subscribers 28.89 Million
% change over the previous quarter -1.33%
Urban Subscribers 22.77 Million
Rural Subscribers 6.12 Million
Market share of Private Operators 22.21%
Market share of PSU Operators 77.79%
Teledensity 2.34
Urban Teledensity 6.01
Rural Teledensity 0.71
Village Public Telephones (VPT) 0.59 Million
Public Call Office (PCO) 1.02 Million

ii
Internet / Broadband Subscribers
Total Internet Subscribers 238.71 Million
Narrowband subscribers 183.51 Million
Broadband subscribers 55.20 million
Wired Internet Subscribers 18.33 Million
Wireless Internet Subscribers 220.38 Million
Broadcasting & Cable Services
No. of private satellite TV channels registered with Ministry of I&B 782
Number of private FM Radio Stations 242
Registered DTH Subscribers 62.97 Million
Active DTH Subscribers 35.81 Million
Telecom Financial Data (for the QE Dec-13)
Gross Revenue(GR) during the quarter ` 58385 Crore
% change in GR over the previous quarter 1.62%
Adjusted Gross Revenue (AGR) during the quarter `39575 Crore
% change in AGR over the previous quarter 1.97%
Share of Public sector undertaking's in Access AGR 12.36%
Monthly Average Revenue Per User (ARPU) for Access Services `116
Revenue & Usage Parameters (for the QE Dec-13)
Monthly ARPU GSM Full Mobility Service ` 112
Monthly ARPU CDMA Full Mobility Service ` 80
Minutes of Usage (MOU) per subscriber per month GSM Full Mobility Service
379 Minutes
Minutes of Usage (MOU) per subscriber per month CDMA Full
Mobility Service 230 Minutes
Minutes of Usage for Internet Telephony 319 Million
Data Usage of Mobile Users (for the QE Dec-13)
Data Usage per subscriber per month - GSM 50.70 MB
Data Usage per subscriber per month - CDMA 175.90 MB
Data Usage per subscriber per month – Total(GSM+CDMA) 59.62 MB

iii
Executive Summary
1. The number of telephone subscribers in India increased from
899.86 million at the end of Sep-13 to 915.19 million at the end of
Dec-13, registering a growth of 1.70% over the previous quarter.
This reflects year-on-year (Y-O-Y) growth of 2.20% over the same
quarter of last year. The overall Tele-density in India increased
from 73.01 as on 30th September, 2013 to 74.02 as on 31st
December, 2013.
Trends in Telephone subscribers and Teledensity in India
2. Subscription in Urban Areas increased from 543.18 million at the
end of Sep-13 to 549.40 million at the end of Dec-13, and Urban
Tele-density also increased from 144.02 to 144.95. Rural
subscription increased from 356.68 million to 365.79 million, and
Rural Tele-density also increased from 41.70 to 42.67.
3. Share of subscription in Rural areas out of total subscription
increased from 39.64% at the end of Sep-13 to 39.97% at the end
of Dec-13.

iv
Composition of Telephone Subscribers
4. With a net addition of 15.33 million subscribers during the
quarter, total wireless(GSM+CDMA) subscriber base increased
from 870.58 million at the end of Sep-13 to 886.30 million at the
end of Dec-13, registering a growth rate of 1.81% over the previous
quarter. The year-on-year (Y-O-Y) growth rate of Wireless
subscribers for Dec-13 is 2.50%. Wireless Tele-density increased
from 70.63 at the end of Sep-13 to 71.69 at the end of Dec-13.
5. Wireline subscriber base further declined from 29.28 million at the
end of Sep-13 to 28.89 million at the end of Dec-13, registering a
decline of 1.33%. Wireline Tele-density also declined from 2.38 at
the end of Sep-13 to 2.34 at the end of Dec-13.
6. Total number of Internet subscribers is 238.71 million at the end
of Dec-13. Out of which Wired Internet subscribers are 18.33
million and Wireless Internet subscribers are 220.38 million.

v
Composition of internet subscription
7. Number of Broadband subscribers (as per revised definition i.e.
minimum speed of 512 kbps) is 55.20 million and the number of
Narrowband subscribers is 183.51 million at the end of Dec-13.
8. Monthly Average Revenue Per User (ARPU) for GSM service
increased by 2.62%, from `109 in QE Sep-13 to `112 in QE Dec-
13, whereas Y-O-Y increase of 14.06%. Prepaid ARPU per month
increased from `95 in QE Sep-13 to `98 in QE Dec-13 while
Postpaid ARPU per month decreased from `463 in QE Sep-13 to
`456 in QE Dec-13.
9. On an all India average, the overall MOU per subscriber per month
for GSM service increased by 1.10% from 375 in QE Sep-13 to 379
in QE Dec-13. Prepaid MOU per subscriber increased from 351 in
QE Sep-13 to 355 in QE Dec-13 while postpaid MOUs decreased
from 981 in QE Sep-13 to 964 in QE Dec-13.
10. Monthly ARPU for CDMA full mobility service increased by 5.48%,
from `98.22 in QE Sep-13 to `103.60 in QE Dec-13. ARPU for
CDMA has increased by 29.58% on Y-O-Y basis in this quarter.

vi
11. The total MOU for CDMA per subscriber per month increased by
3.53%, from 262 in QE Sep-13 to 272 QE Dec-13. The outgoing
MOUs increased from 137 in QE Sep-13 to 141 in QE Dec-13 and
incoming MOUs also increased from 125 in QE Sep-13 to 130 in
QE Dec-13.
12. Gross Revenue (GR) and Adjusted Gross Revenue (AGR) of Telecom
Service Sector for the QE Dec-13 has been `58385 Crore and
`39575 Crore respectively. There has been an increase of 1.62% in
GR and 1.97% in AGR as compared to previous quarter. The year-
on-year (Y-O-Y) growth in GR and AGR over the same quarter in
last year has been 10.46% and 14.62% respectively.
13. Pass-through charges accounted 32.22% of the GR for the quarter
ending Dec-13. The quarterly and the year-on-year (Y-O-Y) growth
rates of pass-through charges for QE Dec-13 are 0.90% and 2.62%
respectively.
14. The License Fee has been 3168 Crore for the QE Dec-13. The
quarterly and the year-on-year (Y-O-Y) growth rates of license fee
are 2.03% and 12.57% respectively in this quarter.
15. Access services contributed 79.36% of the total Adjusted Gross
Revenue of telecom services. In Access services, Gross Revenue,
Adjusted Gross Revenue (AGR), License Fee, Spectrum Usage
Charges and Pass Through Charges increased by 3.00%, 3.47%,
3.54%, 7.30% and 1.84% respectively in QE Dec-13.
16. Monthly Average Revenue per User (ARPU) for Access Services
based on AGR increased from `112 in QE Sep-13 to `116 in QE
Dec-13.

vii
Composition of Adjusted Gross Revenue
17. The performance of 2G wireless service providers in terms of QoS during
the quarter vis-à-vis that in previous quarter is depicted as under:
Parameters showing Improvement in QoS
Parameters showing deterioration in QoS
Metering and billing
credibility - post paid
Metering and billing
credibility - pre paid
%age of calls answered by
the operators (voice to
voice) within 60 sec
%age requests for
Termination/ Closure of
service complied within 7
days.
BTSs Accumulated downtime (not available for service)
Worst affected BTSs due to downtime
Call Set-up Success Rate (within licensee’s own
network)
SDCCH/ Paging Channel Congestion (%age)
TCH Congestion
Call Drop Rate
Worst affected cells having more than 3% TCH drop
(call drop) rate
Connection with good voice quality
Resolution of billing/ charging/ validity complaints.
Period of applying credit/waiver/adjustment to
customer’s account from the date of resolution of
complaints
Accessibility of call centre/customer care
Time taken for refund of deposits after closures.

viii
18. The performance of 3G wireless service providers in terms of QoS during
the quarter vis-à-vis that in previous quarter is depicted as under:
19. The performance of wireline service providers in terms of QoS during
the quarter vis-à-vis that in previous quarter is depicted as under:
Parameters showing Improvement in QoS Parameters showing deterioration in QoS
Faults incidences (No. of faults/ 100
Subs./month)
% Fault repaired by next working day
% of faults repaired within 3 days (for urban area)
% of faults repaired within 5 days (for rural &
hilly areas)
Mean Time to Repair (MTTR).
Resolution of billing/ charging/ validity
complaints
%age requests for Termination/Closure of service
complied within 7 days
Metering & Billing Credibility
– Postpaid (<= 0.1%)
Parameters showing
Improvement in QoS
Parameters showing deterioration in QoS
Worst affected cells having more
than 3% TCH drop (call drop)
and Circuit Switched Voice
Drop Rate - CBBH.
Point of Interconnection (POI)
Congestion
Node-B’s Accumulated downtime (not available
for service) (%age).
Worst affected Node-B’s due to downtime
(%age).
Call Set-up Success Rate (within licensee’s own
network)
SDCCH/ Paging Channel and RRC Congestion
(%age)
Connection with good voice quality and Circuit
Switch Voice Quality (CSV Quality)

ix
20. Total number of private satellite TV channels permitted by the
Ministry of I&B, as obtained from its website, are 782. There are a
total of 187 pay channels, as reported by the broadcasters/
distributors for which the rates have been taken on records at the
QE Dec-13.
21. Maximum number of TV channels (Pay, FTA and Local) being
carried by any of the reported MSOs is 231 whereas in the
conventional analogue form, maximum number of channels being
carried by any of the reported MSOs is 100 channels.
22. Apart from All India Radio, Prasar Bharti a public broadcaster,
there are 242 private FM Radio stations in operation at the end of
Dec-13.
23. Besides the free DTH service of Doordarshan, there are 6 private
DTH licensees, offering their services to the DTH subscribers. As
on 31.12.2013, total registered subscribers are 62.97 million and
active subscribers are 35.81 as reported by these 6 operators.

x
Trends at a Glance
A. Wireline & Wireless Services
QE Dec 2012
QE Mar 2013
QE Jun 2013
QE Sep 2013
QE Dec 2013
%age change
over Dec- 2012
%age change
over Mar- 2013
%age change
over Jun- 2013
%age change
over Sep- 2013
(12
months) (9
months) (6
months) (3
months)
1) Subscriber's Base (in million)
i) Wireline 30.79 30.21 29.73 29.28 28.89 -6.15% -4.37% -2.80% -1.33%
ii) Wireless 864.72 867.80 873.36 870.58 886.30 2.50% 2.13% 1.48% 1.81%
Total 895.51 898.02 903.09 899.86 915.19 2.20% 1.91% 1.34% 1.70%
Rural 338.54 349.22 357.61 356.68 365.79 8.05% 4.75% 2.29% 2.55%
Urban 556.96 548.80 545.48 543.18 549.40 -1.36% 0.11% 0.72% 1.15%
2) Traffic (MOU) (minutes of use/ sub/month)
Wireless - full mobility
i) GSM 360 383 388 375 379 5.36% -0.87% -2.17% 1.10%
ii) CDMA 230 275 278 262 272 18.06% -1.21% -2.41% 3.53%
3) ARPU (Rs./sub/ month)
Wireless - full mobility
i) GSM 98.14 105.00 111.45 109.08 112 14.06% 6.61% 0.45% 2.62%
ii) CDMA 79.95 95.25 98.35 98.22 104 29.58% 8.77% 5.34% 5.48%
4) Teledensity
Population in
million (Estimated)
1221 1225 1229 1233 1236
i) Wireline
teledensity 2.52 2.47 2.42 2.38 2.34 -7.31% -5.26% -3.40% -1.63%
ii) Wireless
teledensity 70.82 70.85 71.08 70.63 71.69 1.22% 1.18% 0.85% 1.49%
Total
Teledensity 73.34 73.32 73.50 73.01 74.02 0.93% 0.97% 0.71% 1.39%
Rural teledensity 39.85 41.02 41.90 41.70 42.67 7.06% 4.03% 1.82% 2.32%
Urban
teledensity 149.90 146.96 145.35 144.02 144.95 -3.30% -1.37% -0.27% 0.65%

xi
B. Subscriber Base
(i) Wireline Subscribers Base (in Million)
Service Provider QE Dec 2012
QE Mar 2013
QE Jun 2013
QE Sep 2013
QE Dec 2013
%age change
over Dec- 2012
%age change
over Mar- 2013
%age change
over Jun- 2013
%age change
over Sep- 2013
(12
months)
(9
months)
(6
months)
(3
months)
BSNL 21.04 20.45 19.89 19.37 18.94 -10.01% -7.39% -4.80% -2.23%
MTNL 3.46 3.46 3.55 3.54 3.54 2.44% 2.31% -0.28% -0.08%
Bharti 3.28 3.28 3.28 3.34 3.35 2.33% 2.18% 2.22% 0.51%
Tata 1.49 1.51 1.47 1.49 1.51 1.22% 0.14% 2.53% 1.15%
Reliance Communications
Group
1.26 1.24 1.24 1.24 1.24 -1.40% -0.12% -0.14% -0.02%
Quadrant 0.18 0.19 0.20 0.20 0.21 13.34% 11.03% 6.36% 2.94%
Sistema 0.05 0.05 0.05 0.05 0.06 12.39% 6.43% 4.14% 2.76%
Vodafone 0.03 0.04 0.04 0.04 0.05 69.74% 40.45% 19.79% 13.77%
Total 30.79 30.21 29.73 29.28 28.89 -6.15% -4.37% -2.80% -1.33%
(ii) Wireless Subscriber Base (in Million)
Service Provider
QE Dec
2012
QE
Mar 2013
QE Jun
2013
QE
Sep 2013
QE
Dec 2013
%age
change
over Dec-
2012
%age
change
over Mar-
2013
%age
change
over Jun-
2013
%age
change
over Sep-
2013
(12
months)
(9
months)
(6
months)
(3
months)
Bharti 181.91 188.20 190.91 193.39 198.41 9.07% 5.43% 3.93% 2.60%
Vodofone 147.48 152.35 155.03 155.54 160.41 8.77% 5.29% 3.47% 3.13%
Idea 113.95 121.61 124.97 127.23 128.69 12.93% 5.82% 2.97% 1.15%
Reliance
Communications
Group
118.53 122.97 125.73 116.26 117.24 -1.08% -4.66% -6.75% 0.84%
BSNL 99.92 101.21 97.99 97.86 96.29 -3.63% -4.86% -1.73% -1.60%
Aircel 63.35 60.07 60.97 63.25 66.91 5.63% 11.39% 9.75% 5.80%
Tata 69.56 66.42 64.63 63.55 63.27 -9.04% -4.74% -2.10% -0.44%
Telewings 41.52 31.68 32.30 32.36 32.78 -21.05% 3.46% 1.50% 1.31%
Sistema 14.88 11.91 9.77 9.56 9.81 -34.09% -17.67% 0.39% 2.62%
Videocon 3.64 2.01 2.42 3.24 3.97 9.04% 97.54% 64.17% 22.35%
MTNL 5.30 5.00 4.51 3.74 3.59 -32.26% -28.16% -20.38% -4.00%
Loop 3.00 3.01 2.72 2.89 2.98 -0.53% -0.96% 9.68% 3.21%
Quadrant 1.70 1.37 1.42 1.73 1.96 15.32% 43.15% 37.92% 13.33%
Total 864.72 867.80 873.36 870.58 886.30 2.50% 2.13% 1.48% 1.81%

xii
C. Internet Services
QE Dec 2012
QE Mar 2013
QE Jun 2013
QE Sep 2013
QE Dec 2013
%age change
over Dec- 2012
%age change
over Mar- 2013
%age change
over Jun- 2013
%age change
over Sep- 2013
(12
months) (9
months) (6
months) (3
months)
Total Internet
Subscribers N/A 164.81 198.39 210.38 238.71 - 44.84% 20.32% 13.47%
D. Telecom Financial Data
QE Dec 2012
QE Mar 2013
QE Jun 2013
QE Sep 2013
QE Dec 2013
%age
change over Dec-
2012
%age
change over Mar-
2013
%age
change over Jun-
2013
%age
change over Sep-
2013
Telecom Sector (12
months) (9
months) (6
months) (3
months)
i) Gross Revenue
(Rs. in Crores) 52858.39 54283.78 57260.98 57452.56 58385.39 10.46% 7.56% 1.96% 1.62%
ii) Adjusted
Gross Revenue
(Rs. in Crores)
34527.50 35279.50 38640.30 38810.56 39574.99 14.62% 12.18% 2.42% 1.97%
Access Services
Adjusted Gross
Revenue (Rs. in Crores)
27455.16 27801.94 30492.88 30353.17 31406.54 14.39% 12.97% 3.00% 3.47%
ARPU per month
(AGR/ Average
subscribers/3)
99.00 103.66 113.04 111.85 115.70 16.87% 11.61% 2.35% 3.44%

xiii
Introduction
This Report presents the Key Parameters and growth trends for the
Telecom Services in India for the quarter ending December, 2013. It
provides a broad perspective on the Telecom Services to serve as a
reference document for various stakeholders, research agencies and
analysts. Chapter-1 depicts the growth pattern, in terms of Subscriber
base and Tele-density of Wireline, Wireless, Internet and Value Added
Services (VAS). Chapter-2 covers the key revenue and usage parameters.
Chapter-3 gives the financial and accounting data. Chapter-4 covers
performance of various service providers in terms of QoS. The
information relating to Cable TV, DTH & Radio Broadcast services is
provided in Chapter-5.
2. The Report has been prepared based on the information furnished
by the Service Providers. It is also available on TRAI’s website
(www.trai.gov.in). Any suggestion pertaining to this report may please be
addressed to Advisor(F&EA), TRAI; Tel. +91-11-23230752, Fax. +91-11-
23236650 and e-mail: [email protected]

1
Chapter 1 :
Subscription Data
----------------------------------------------------------------------------------------------------------------
Teledensity is based on the population projections from census data published by the Office of Registrar General & Census Commissioner of India.

2
Section A : Access Service - An Overview
1.1 The number of telephone subscribers in India increased from 899.86
million at the end of Sep-13 to 915.19 million at the end of Dec-13,
registering a growth of 1.70% over the previous quarter. This reflects
year-on-year (Y-O-Y) growth of 2.20% over the same quarter of last
year. The overall Tele-density in India increased to 74.02 at the end of
Dec-13 from 73.01 at the end of the previous quarter.
Chart 1.1: Trends in Telephone Subscribers and Tele-density in India
Table1.1: Subscriber Base & Teledensity - Rural & Urban
Quarter ending
Subscriber Base (million) Teledensity
Rural Urban Rural Urban
Dec-12 338.54 556.96 39.85 149.90
Mar-13 349.22 548.80 41.02 146.96
Jun-13 357.61 545.48 41.90 145.35
Sep-13 356.68 543.18 41.70 144.02
Dec-13 365.79 549.40 42.67 144.95
3
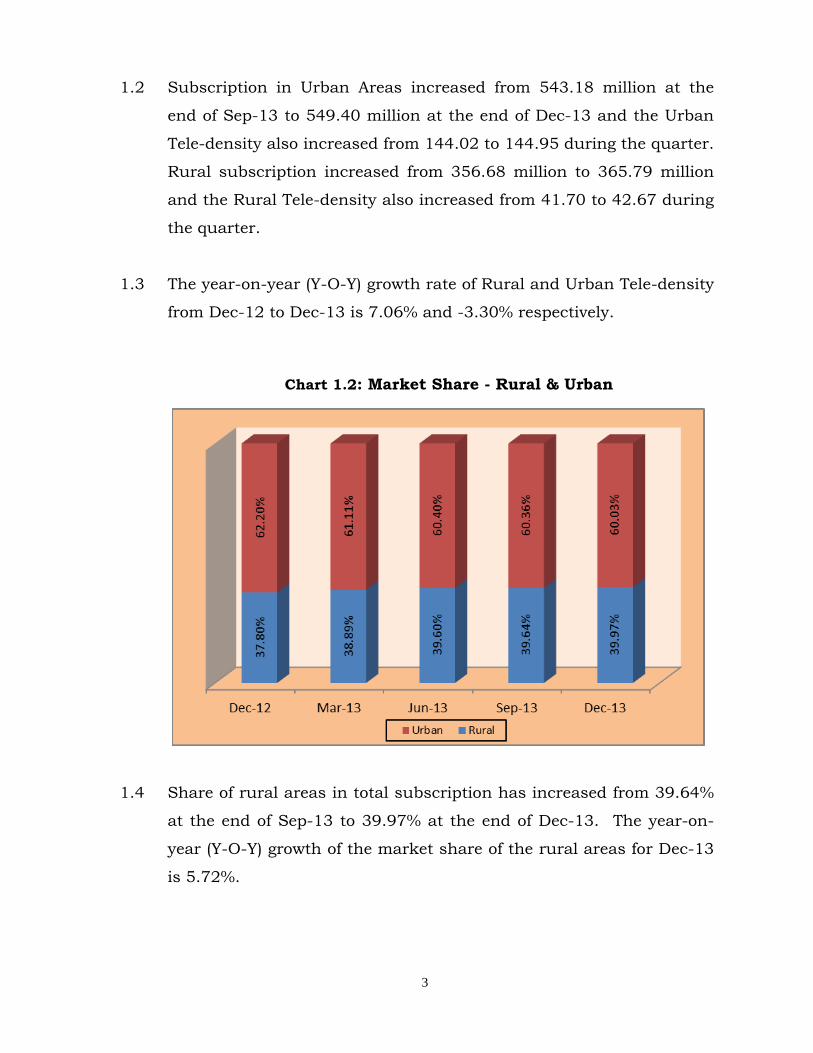
1.2 Subscription in Urban Areas increased from 543.18 million at the
end of Sep-13 to 549.40 million at the end of Dec-13 and the Urban
Tele-density also increased from 144.02 to 144.95 during the quarter.
Rural subscription increased from 356.68 million to 365.79 million
and the Rural Tele-density also increased from 41.70 to 42.67 during
the quarter.
1.3 The year-on-year (Y-O-Y) growth rate of Rural and Urban Tele-density
from Dec-12 to Dec-13 is 7.06% and -3.30% respectively.
Chart 1.2: Market Share - Rural & Urban
1.4 Share of rural areas in total subscription has increased from 39.64%
at the end of Sep-13 to 39.97% at the end of Dec-13. The year-on-
year (Y-O-Y) growth of the market share of the rural areas for Dec-13
is 5.72%.

4
Chart 1.3: Composition of Access subscription - Wireline & Wireless
Chart 1.4: Composition of Telephone Subscribers at the end of the quarter

5
Table 1.2: Service Area wise Access (Wireless+Wireline) Subscriber base
Service Area Subscribers (million)
Sep-13 Dec-13 Net
Additions Rate of
Growth(%)
Andhra Pradesh 66.85 67.72 0.86 1.29
Assam 14.86 15.23 0.37 2.51
Bihar 58.71 59.55 0.84 1.42
Delhi 44.10 45.25 1.15 2.61
Gujarat 53.86 55.05 1.18 2.20
Haryana 20.42 21.01 0.59 2.87
Himachal Pradesh 7.30 7.39 0.09 1.28
Jammu & Kashmir 7.60 7.78 0.19 2.45
Karnataka 55.80 56.69 0.89 1.60
Kerala 33.99 34.26 0.27 0.80
Madhya Pradesh 54.57 55.86 1.29 2.36
Maharashtra 71.05 72.82 1.77 2.49
Mumbai 32.36 33.16 0.81 2.49
North East 9.52 9.73 0.21 2.18
Orissa 25.50 25.01 -0.48 -1.90
Punjab 31.48 31.63 0.15 0.49
Rajasthan 50.70 51.94 1.24 2.45
T.N. (incl. Chennai) 76.32 77.22 0.90 1.18
U.P.(E) 73.62 75.42 1.80 2.44
U.P.(W) 47.39 48.02 0.63 1.32
Kolkata 22.61 22.96 0.35 1.56
West Bengal 41.26 41.49 0.23 0.56
All India 899.86 915.19 15.33 1.70
1.5 During the quarter, Haryana Circle has recorded the highest growth
rate of 2.87%, followed by Delhi (2.61%). Orissa Circle shows the
decline rate of 1.90% during the quarter ending Dec-13.

6
Chart 1.5: Net Addition/decline in Telephone Subscription
1.6 The net addition in telephone subscribers is 15.33 million in QE Dec-13
as against the net decline of 3.23 million in QE Sep-13.
Table 1.3: Service Area wise Teledensity
As on 30th September, 2013 As on 31st December, 2013
Service Area Rural
Teledensity
Urban
Teledensity
Total
Teledensity
Rural
Teledensity
Urban
Teledensity
Total
Teledensity
Andhra Pradesh 43.51 164.43 77.15 44.14 165.74 77.99
Assam 32.36 127.30 47.10 33.23 128.94 48.15
Bihar 27.51 147.38 43.95 28.16 146.76 44.43
Delhi - - 222.10 - - 226.29
Gujarat 54.53 134.18 87.29 56.03 135.87 88.92
Haryana 57.07 114.32 77.06 58.87 116.23 78.97
Himachal
Pradesh 75.59 333.15 104.93 76.22 337.19 106.04
J&K 40.28 122.68 62.82 40.85 125.93 64.17
Karnataka 44.60 167.95 91.52 45.75 169.06 92.76

7
As on 30th September, 2013 As on 31st December, 2013
Service Area Rural
Teledensity
Urban
Teledensity
Total
Teledensity
Rural
Teledensity
Urban
Teledensity
Total
Teledensity
Kerala 62.88 194.79 96.43 64.20 193.39 97.05
Madhya Pradesh 31.87 115.52 54.44 32.80 116.90 55.52
Maharashtra* 53.34
124.87
87.29
54.48
127.44
89.17
Mumbai*
North East 41.73 157.14 70.15 42.45 160.12 71.48
Orissa 39.40 165.83 61.21 38.52 162.27 59.92
Punjab 68.83 153.11 104.68 69.16 152.86 104.87
Rajasthan 45.68 154.65 71.88 46.94 156.80 73.37
T.N. (incl Chennai) 69.45 138.33 108.96 71.08 138.76 110.07
U.P.(E)* 33.04 130.28 54.99 33.99 130.75 55.86
U.P.(W)*
Kolkata* 41.97 136.08 68.87 43.78 133.19 69.35
W.B.*
All India 41.70 144.02 73.01 42.67 144.95 74.02
* Population data/projections are available state-wise only. Notes:
1. Teledensity figures are derived from the subscriber data provided by the operators and the population projections, for Urban and Rural areas, of the country, published by the Office of the Registrar General & Census Commissioner, India.
2. Delhi Service area, apart from the State of Delhi, includes wireless subscribers of the areas served by the local exchanges of Ghaziabad & Noida (in UP) and Gurgaon & Faridabad (in Haryana).
1.7 Himachal Pradesh has the highest Rural Teledensity of 76.22, followed
by Tamil Nadu (71.08). Bihar continues to have the lowest Rural
Teledensity of 28.16, followed by Madhya Pradesh (32.80).

8
Table 1.4: Growth/Decline in Subscribers
Service
Provider
Subscriber base (millions) Rate of Growth
(%)
Market Share Sep-13
(%)
Market Share • Dec-13
(%) Sep-13 Dec-13
Net Additions
Bharti 196.73 201.76 5.04 2.56 21.86 22.05
Vodafone 155.59 160.46 4.87 3.13 17.29 17.53
IDEA 127.23 128.69 1.46 1.15 14.14 14.06
Reliance Communications
Group
117.50 118.48 0.98 0.83 13.06 12.95
Tata 65.04 64.78 -0.26 -0.40 7.23 7.08
Aircel 63.25 66.91 3.67 5.80 7.03 7.31
Loop Mobile 2.89 2.98 0.09 3.21 0.32 0.33
Quadrant 1.93 2.16 0.24 12.23 0.21 0.24
Sistema 9.61 9.86 0.25 2.62 1.07 1.08
Telewings 32.36 32.78 0.42 1.31 3.60 3.58
Videocon 3.24 3.97 0.72 22.35 0.36 0.43
BSNL 117.23 115.23 -2.00 -1.70 13.03 12.59
MTNL 7.28 7.13 -0.15 -2.09 0.81 0.78
Total 899.86 915.19 15.33 1.70
1.8 Bharti is the leading operator in Access segment in terms of number of
subscribers and net addition. During the quarter, Bharti recorded the
highest net addition of 5.04 million, followed by Vodafone (4.87 million)
and Aircel (3.67 million). BSNL recorded the highest net decline of 2.00
million subscribers during this quarter.

9
Table 1.5 : Market Share of the operators in total rural subscriber base for the quarter ending Dec-13
Service Provider No. of Total
Subscribers (in millions)
No. of Rural Subscribers (in millions)
Percentage of Rural
subscribers
Market share of Rural
subscribers (%)
Bharti 201.76 90.16 44.68 24.65
Vodafone 160.46 86.12 53.67 23.54
IDEA 128.69 70.38 54.69 19.24
BSNL 115.23 38.62 33.52 10.56
Reliance Communications
Group
118.48 28.54 24.09 7.80
Aircel 66.91 24.24 36.23 6.63
Tata 64.78 15.09 23.30 4.13
Telewings 32.78 10.32 31.47 2.82
Sistema 9.86 2.27 23.06 0.62
Quadrant 2.16 0.05 2.26 0.01
MTNL 7.13 - - -
Videocon 3.97 - - -
Loop Mobile 2.98 - - -
Total 915.19 365.79 39.97
1.9 IDEA continues to be the Service provider with highest proportion of
Rural subscribers (54.69%), followed by Vodafone (53.67%) to their
total subscribers.

10
Section B : Wireless Service
Table 1.6: List of Cellular Mobile (GSM & CDMA) Service Providers currently
providing service [As on 31st December, 2013]
Sl.No. Service Provider Area of Operation
1 Bharti All India
2 Aircel Group All India
3 Reliance Communications
Ltd All India (except Assam & NE)
4 Reliance Telecom Ltd Kolkata, MP, WB, HP, Bihar, OR, Assam &
NE
5 Vodafone All India
6 Tata Teleservices All India except Assam, NE & J&K
7 IDEA/Spice All India
8 Sistema Shyam Telelink Delhi, Kolkata, Guj., KTK, T.N. incl.
Chennai, Kerala, UP(W), Rajasthan & W.B.
9 BSNL All India (except Delhi & Mumbai)
10 MTNL Delhi & Mumbai
11 Loop Mobile (India) Ltd Mumbai
12 Quadrant Punjab
13 Telewings Communications
Services Pvt. Ltd. MH, Guj., AP, UP(W), UP(E), Bihar
14 Videocon
Telecommunications Ltd Guj, Haryana, UP(W)*, UP(E)*, MP, Bihar*
* M/s Videocon has no subscriber in UP(W), UP(E) and Bihar service areas as on 31.12.2013.
1.10 Complete list of licensed Cellular (GSM & CDMA) Service providers as
on 31st December, 2013 is at Annexure -1.1
1.11 Total Wireless (GSM+CDMA) subscriber base increased from 870.58
million at the end of Sep-13 to 886.30 million at the end of Dec-13,
thereby showing a gowth rate of 1.81%. During this quarter net
addition of 15.72 million subscribers was recorded. The year-on-year
(Y-O-Y), wireless subscribers shows growth rate of 2.50% for Dec-13.
Wireless Teledensity increased from 70.63 at the end of Sep-13 to 71.69
at the end of Dec-13.

11
Chart 1.6: Wireless Subscriber Base and Teledensity
Table 1.7: Wireless Subscriber Base & Teledensity - Rural & Urban
Quarter ending Subscriber Base (million) Teledensity
Rural Urban Rural Urban
Dec-12 331.60 533.12 39.04 143.48
Mar-13 342.50 525.30 40.23 140.67
Jun-13 351.10 522.27 41.14 139.16
Sep-13 350.37 520.21 40.96 137.93
Dec-13 359.67 526.63 41.95 138.94
1.12 The Rural Wireless subscribers increased from 350.37 million at the
end of Sep-13 to 359.67 million at the end of Dec-13.
1.13 Rural subscription increased at the rate of 2.65% in QE Dec-13 as
against the decline rate of 0.21% in QE Sep-13. Urban subscription
increased at the rate of 1.23% as against the decline rate of 0.39% in
the previous quarter. The share of Rural wireless subscription
increased from 40.25% to 40.58% in total wireless subscription in this
quarter.

12
Chart 1.7: Wireless Market Share - Rural & Urban
Table 1.8: Growth in Wireless Subscriber base
Service Provider Subscriber Base (millions) Rate of
Growth (%)
Market Share • Sep-13
(%)
Market Share • Dec-13
(%) Sep-13 Dec-13
Net Additions
Bharti 193.39 198.41 5.02 2.60 22.21 22.39
Vodafone 155.54 160.41 4.86 3.13 17.87 18.10
IDEA 127.23 128.69 1.46 1.15 14.61 14.52
Reliance
Communications Group
116.26 117.24 0.98 0.84 13.35 13.23
BSNL 97.86 96.29 -1.57 -1.60 11.24 10.86
Aircel 63.25 66.91 3.67 5.80 7.26 7.55
Tata 63.55 63.27 -0.28 -0.44 7.30 7.14
Telewings 32.36 32.78 0.42 1.31 3.72 3.70
Sistema 9.56 9.81 0.25 2.62 1.10 1.11
Videocon 3.24 3.97 0.72 22.35 0.37 0.45
MTNL 3.74 3.59 -0.15 -4.00 0.43 0.41
Loop 2.89 2.98 0.09 3.21 0.33 0.34
Quadrant 1.73 1.96 0.23 13.33 0.20 0.22
Total 870.58 886.30 15.72 1.81 - -
13
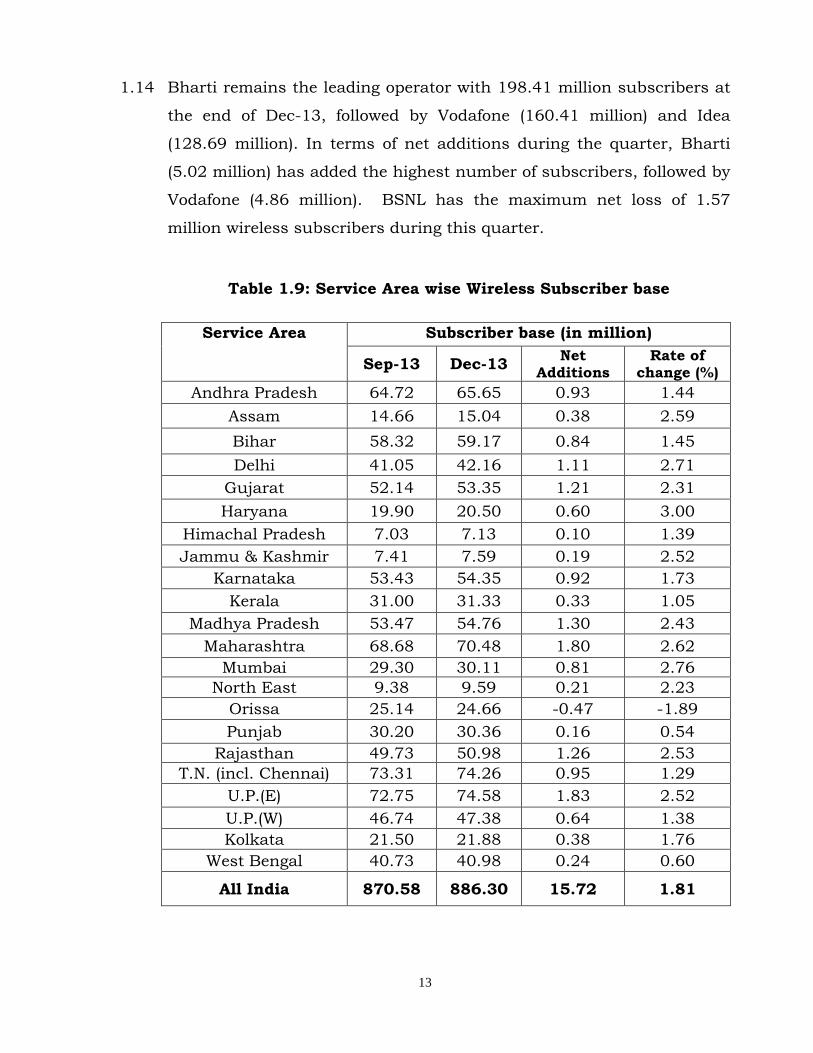
1.14 Bharti remains the leading operator with 198.41 million subscribers at
the end of Dec-13, followed by Vodafone (160.41 million) and Idea
(128.69 million). In terms of net additions during the quarter, Bharti
(5.02 million) has added the highest number of subscribers, followed by
Vodafone (4.86 million). BSNL has the maximum net loss of 1.57
million wireless subscribers during this quarter.
Table 1.9: Service Area wise Wireless Subscriber base
Service Area Subscriber base (in million)
Sep-13 Dec-13 Net
Additions Rate of
change (%)
Andhra Pradesh 64.72 65.65 0.93 1.44
Assam 14.66 15.04 0.38 2.59
Bihar 58.32 59.17 0.84 1.45
Delhi 41.05 42.16 1.11 2.71
Gujarat 52.14 53.35 1.21 2.31
Haryana 19.90 20.50 0.60 3.00
Himachal Pradesh 7.03 7.13 0.10 1.39
Jammu & Kashmir 7.41 7.59 0.19 2.52
Karnataka 53.43 54.35 0.92 1.73
Kerala 31.00 31.33 0.33 1.05
Madhya Pradesh 53.47 54.76 1.30 2.43
Maharashtra 68.68 70.48 1.80 2.62
Mumbai 29.30 30.11 0.81 2.76
North East 9.38 9.59 0.21 2.23
Orissa 25.14 24.66 -0.47 -1.89
Punjab 30.20 30.36 0.16 0.54
Rajasthan 49.73 50.98 1.26 2.53
T.N. (incl. Chennai) 73.31 74.26 0.95 1.29
U.P.(E) 72.75 74.58 1.83 2.52
U.P.(W) 46.74 47.38 0.64 1.38
Kolkata 21.50 21.88 0.38 1.76
West Bengal 40.73 40.98 0.24 0.60
All India 870.58 886.30 15.72 1.81

14
Table 1.10: Service Area wise Wireless Teledensity
Service Area As on 30th September, 2013 As on 31st December, 2013
Rural Teledensity
Urban Teledensity
Total Teledensity
Rural Teledensity
Urban Teledensity
Total Teledensity
Andhra
Pradesh 42.58 157.97 74.69 43.27 159.44 75.61
Assam 32.22 124.13 46.49 33.10 125.87 47.56
Bihar 27.41 145.87 43.66 28.06 145.28 44.15
Delhi - - 206.73 - - 210.84
Gujarat 53.61 128.72 84.50 55.12 130.49 86.18
Haryana 56.20 110.29 75.09 58.03 112.30 77.04
Himachal Pradesh
72.43 324.41 101.13 73.13 328.52 102.31
Jammu & Kashmir
39.90 117.97 61.26 40.47 121.25 62.61
Karnataka 43.65 159.27 87.63 44.86 160.46 88.93
Kerala 55.37 183.51 87.96 56.86 182.27 88.74
Madhya
Pradesh 31.66 112.02 53.34 32.58 113.45 54.44
Maharashtra* 52.42
116.26
82.71
53.58
118.89
84.64 Mumbai*
North East 41.38 153.93 69.10 42.10 156.94 70.44
Orissa 39.11 162.22 60.35 38.24 158.73 59.09
Punjab 66.72 145.98 100.43 67.08 145.83 100.68
Rajasthan 45.24 150.28 70.49 46.52 152.49 72.01
T.N. (incl.
Chennai) 67.69 132.15 104.67 69.35 132.70 105.85
U.P.(E)* 32.86
127.80
54.30
33.82
128.36
55.19
U.P.(W)*
Kolkata* 41.59
130.83
67.10
43.41
128.06
67.62
West Bengal*
All India 40.96 137.93 70.63 41.95 138.94 71.69
* Population data/projections are available state-wise only. Notes:
1. Teledensity figures are derived from the subscriber data provided by the operators and the population projections, for Urban and Rural areas, of the country, published by the Office of the Registrar General & Census Commissioner, India.
2. Delhi service area, apart from the State of Delhi, includes the areas served by the local exchanges of Ghaziabad & Noida (in UP) and Gurgaon & Faridabad (in Haryana).

15
Table 1.11: Rural Wireless Subscriber base and Market Share
Service Provider
Subscribers at the end of Dec-13
(in millions)
Rural Subscribers (in millions)
% of Rural subscribers in
total
Market Share of Rural
Subscribers (%)
Sep-13 Dec-13 Sep-13 Dec-13 Sep-13 Dec-13
Bharti 198.41 86.81 90.16 44.89 45.44 24.78 25.07
Vodafone 160.41 83.19 86.12 53.48 53.69 23.74 23.94
IDEA 128.69 69.16 70.38 54.36 54.69 19.74 19.57
BSNL 96.29 33.55 32.56 34.28 33.81 9.58 9.05
Reliance
Communications Group
117.24 28.29 28.54 24.33 24.34 8.07 7.94
Aircel 66.91 23.25 24.24 36.76 36.23 6.64 6.74
Tata 63.27 14.45 15.04 22.73 23.77 4.12 4.18
Telewings 32.78 10.24 10.32 31.66 31.47 2.92 2.87
Sistema 9.81 1.40 2.27 14.61 23.10 0.40 0.63
Quadrant 1.96 0.04 0.05 2.29 2.50 0.01 0.01
MTNL 3.59 0.00 0.00 0.00 0.00 0.00 0.00
Videocon 3.97 0.00 0.00 0.00 0.00 0.00 0.00
Loop 2.98 0.00 0.00 0.00 0.00 0.00 0.00
Total 886.30 350.37 359.67 40.25 40.58 100 100
1.15 Detailed table on service provider wise subscriber base in each service area is at Annexure-1.2.
Chart 1.8: Wireless Subscription: GSM vs CDMA

16
1.16 At the end of Dec-13, GSM subscribers constituted 92.98% of the
wireless market.
GSM Services
1.17 The GSM subscribers were 824.06 million at the end of Dec-13 as
against 807.68 million at the quarter ending Sep-13, showing a growth
of 2.03%. Bharti with 198.41 million subscribers continues to be the
largest GSM mobile operator, followed by Vodafone (160.41 million).
Table 1.12: Group-wise Market Share (in terms of subscription) within GSM Service
Sep-13 Dec-13
Service
Provider
No of
Subscribers (in millions)
Market
Share (%)
No of
Subscribers (in millions)
Market
Share (%)
Net
Additions (in million)
Bharti 193.39 23.94 198.41 24.08 5.02
Vodafone 155.54 19.26 160.41 19.47 4.86
Idea 127.23 15.75 128.69 15.62 1.46
BSNL 95.47 11.82 93.99 11.41 -1.48
Reliance Communications
Group
83.85 10.38 84.88 10.30 1.03
Aircel 63.25 7.83 66.91 8.12 3.67
Tata 45.13 5.59 45.64 5.54 0.51
Telewings 32.36 4.01 32.78 3.98 0.42
MTNL 3.61 0.45 3.46 0.42 -0.15
Videocon 3.24 0.40 3.97 0.48 0.72
Loop 2.89 0.36 2.98 0.36 0.09
Quadrant 1.72 0.21 1.95 0.24 0.23
Total 807.68 100 824.06 100 16.39
1.18 There has been a net increase of 16.39 million GSM subscribers during
the quarter ending Dec-13.

17
CDMA Services
1.19 The CDMA subscriber base further declined from 62.91 million at the
end of Sep-13 to 62.24 million at the end of Dec-13, thereby showing a
negative growth rate of 1.07%. Reliance Communications Group with
32.37 million subscribers continues to be the largest CDMA mobile
operator. In terms of net additions during the quarter, all the service
providers except Systema Shyam recorded decline in their subscriber
base.
Table 1.13: Market Share (in terms of subscription) within CDMA Service
Service Provider Sep-13 Dec-13 Net Addition/ Decline
(in million)
No of Subscribers (in million)
Market Share (%)
No of Subscribers (in million)
Market Share (%)
Reliance Communications
Group
32.42 51.53 32.37 52.01 -0.05
Tata 18.41 29.27 17.63 28.32 -0.78
Sistema 9.56 15.19 9.81 15.76 0.25
BSNL 2.39 3.79 2.30 3.70 -0.08
MTNL 0.13 0.21 0.13 0.21 -0.002
Quadrant 0.01 0.01 0.003 0.004 -0.004
Total 62.91 100 62.24 100 -0.67
1.20 There has been a net decline of 0.67 million CDMA subscribers during
the quarter ending Dec-13.

18
Section C : Wireline Service
Table 1.14 : Service Providers providing Wireline Service
[as on 31st December, 2013]
Sl. No. Name of the Service Provider
Area of Operation
1 BSNL All India except Delhi & Mumbai
2 MTNL Delhi & Mumbai
3 Bharti Airtel Ltd
Andhra Pradesh, Delhi, Gujarat, Haryana,
Madhya Pradesh & Chhatisgarh, Maharashtra, Mumbai, Punjab, Tamil Nadu
(incl. Chennai), Karnataka, Kerala, Kolkata, Rajasthan, UP(East) and UP(West)
4
Tata Teleservices Ltd. &
Tata Teleservices
(Mah) Ltd.
All India except N.E., Assam and J&K
5
Quadrant
Televentures Ltd. (HFCL)
Punjab
6 Sistema Shyam
Telelink Ltd. Rajasthan
7 Reliance
Communications
Ltd.
All India except Assam & North-East
8 Vodafone
Andhra Pradesh, Assam, Bihar, Delhi, Gujarat, Karnataka, Kolkata, Madhya
Pradesh, Maharashtra, Mumbai, Orissa,
Punjab, Rajasthan, Tamilnadu including Chennai, U.P.(East) & U.P.(West)

19
1.21 Total Wireline subscriber base declined from 29.28 million at the end of
Sep-13 to 28.89 million at the end of Dec-13 with declining rate of
1.33%. Overall Wireline Teledensity is 2.34 at the end of this quarter
as against 2.38 of the previous quarter.
1.22 Rural subscriber base has shown decline of 2.99%, from 6.31 Million at
the end of Sep-13 to 6.12 Million at the end of Dec-13. During the same
period, Urban subscription also recorded decline of 0.87%, from 22.97
million to 22.77 million.
Chart 1.9: Wireline Subscriber Base and Teledensity
Table 1.15: Wireline Subscriber Base & Tele-density - Rural & Urban
Quarter ending Subscriber Base (million)
Teledensity
Rural Urban Rural Urban
Dec-12 6.95 23.84 0.82 6.42
Mar-13 6.71 23.50 0.79 6.29
Jun-13 6.51 23.22 0.76 6.19
Sep-13 6.31 22.97 0.74 6.09
Dec-13 6.12 22.77 0.71 6.01

20
Chart 1.10: Composition of Wireline Subscriber base - Rural & Urban
Table 1.16: Service Provider wise Subscriber base (Rural - Urban) &
Share of Rural Subscription
Service Provider
Subscriber Base (million) Dec-13 Share of Rural subscription
(%) Rural Urban Total
BSNL 6.06 12.87 18.94 32.02
MTNL - 3.54 3.54 --
Bharti - 3.35 3.35 --
Reliance Communications
0.002 1.24 1.24 0.16
Tata 0.05 1.46 1.51 3.27
Quadrant - 0.21 0.21 --
Sistema 0.01 0.05 0.06 16.58
Vodafone - 0.05 0.05 --
Total 6.12 22.77 28.89 21.19

21
Table 1.17: Service Provider wise growth in Subscriber base
Service Provider Subscriber Base (million) Rate of change
(%)
Market share-
Sep-13 (%)
Market share-
Dec-13 (%) Sep-13 Dec-13 Net
Addition
BSNL 19.37 18.94 -0.433 -2.23 66.14 65.54
MTNL 3.54 3.54 -0.003 -0.08 12.10 12.25
Bharti 3.34 3.35 0.017 0.51 11.40 11.61
Tata 1.49 1.51 0.017 1.15 5.09 5.22
Reliance Com. 1.24 1.24 0.0002 -0.02 4.24 4.30
Quadrant 0.20 0.21 0.006 2.94 0.69 0.72
Sistema 0.05 0.06 0.002 2.76 0.19 0.19
Vodafone 0.04 0.05 0.006 13.77 0.15 0.17
Total 29.28 28.89 -0.388 -1.33
Table 1.18: Service Area wise Wireline Subscriber base (in million)
Service Area Sep-13 Dec-13 Net Additions (in million)
Rate of
Change (%)
Andhra Pradesh 2.14 2.07 -0.069 -3.23
Assam 0.19 0.19 -0.006 -2.92
Bihar 0.39 0.38 -0.009 -2.23
Delhi 3.05 3.09 0.037 1.21
Gujarat 1.72 1.70 -0.023 -1.31
Haryana 0.52 0.51 -0.011 -2.10
Himachal Pradesh 0.26 0.26 -0.004 -1.65
Jammu & Kashmir 0.19 0.19 -0.001 -0.29
Karnataka 2.37 2.34 -0.034 -1.41
Kerala 2.99 2.93 -0.053 -1.79
Madhya Pradesh 1.10 1.09 -0.010 -0.94
Maharashtra 2.36 2.33 -0.028 -1.17
Mumbai 3.06 3.06 -0.003 -0.10
North East 0.14 0.14 -0.001 -0.95
Orissa 0.36 0.35 -0.009 -2.47
Punjab 1.28 1.27 -0.011 -0.88
Rajasthan 0.98 0.96 -0.016 -1.67
T.N. (incl. Chennai) 3.01 2.96 -0.047 -1.55
U.P.(E) 0.87 0.84 -0.037 -4.23
U.P.(W) 0.65 0.64 -0.015 -2.35
Kolkata 1.11 1.09 -0.026 -2.35
W.B. 0.53 0.52 -0.012 -2.28
All India 29.28 28.89 -0.388 -1.33
1.23 Only Delhi Service Area showed positive growth in wireline service
during this quarter.

22
Table 1.19: Service Area wise Wireline Teledensity
Service Area
As on 30th September, 2013 As on 31st December, 2013
Rural Teledensity
Urban Teledensity
Total Teledensity
Rural Teledensity
Urban Teledensity
Total Teledensity
Andhra Pradesh
0.93 6.46 2.47 0.87 6.30 2.38
Assam 0.14 3.17 0.61 0.13 3.06 0.59
Bihar 0.10 1.51 0.29 0.10 1.47 0.28
Delhi - - 15.37 - - 15.45
Gujarat 0.93 5.46 2.79 0.90 5.38 2.75
Haryana 0.87 4.04 1.97 0.84 3.92 1.92
Himachal Pradesh
3.16 8.75 3.80 3.09 8.66 3.73
Jammu & Kashmir
0.39 4.71 1.57 0.38 4.68 1.56
Karnataka 0.95 8.68 3.89 0.89 8.59 3.82
Kerala 7.51 11.28 8.47 7.35 11.12 8.31
Madhya
Pradesh 0.22 3.50 1.10 0.21 3.45 1.09
Maharashtra* 0.93
8.62
4.58
0.90
8.54
4.54
Mumbai*
North East 0.35 3.22 1.06 0.34 3.18 1.04
Orissa 0.29 3.61 0.86 0.27 3.55 0.84
Punjab 2.11 7.13 4.25 2.08 7.03 4.20
Rajasthan 0.44 4.37 1.38 0.42 4.31 1.36
T.N.
(incl. Chennai) 1.76 6.18 4.29 1.73 6.05 4.22
U.P.(E)* 0.17
2.48
0.69
0.16
2.40
0.67
U.P.(W)*
Kolkata* 0.38
5.25
1.77
0.36
5.12
1.73 W.B.*
All India 0.74 6.09 2.38 0.71 6.01 2.34
* Population data/projections are available state-wise only Note:
1. Teledensity figures are derived from the subscriber data provided by the operators and the population projections, for Urban and Rural areas, of the country, published by the Office of the Registrar General & Census Commissioner, India.
1.24 Detailed table on service provider wise subscriber base in each service
area is at Annexure-1.3.

23
Public Call Offices (PCO)
1.25 Total number of PCOs in the country at the end of Dec-13 is 10.20 lakh
as compared to 10.89 lakh at the end of Sep-13, showing a decline of
0.69 lakh PCOs. Detailed table is at Annexure -1.4.
Chart 1.11: Number of PCOs
Table 1.20: Rate of change & Market share of PCOs
Service Provider Sep-13 (In Lakh)
Dec-13 (In Lakh)
Rate of change (%)
% Market share (Sep-13)
BSNL 6.95 6.54 -5.87 64.16
MTNL 1.47 1.45 -1.55 14.21
Bharti 0.34 0.29 -15.14 2.82
Quadrant 0.04 0.03 -5.46 0.33
Sistema 0.12 0.12 -1.94 1.20
Tata 1.03 0.91 -11.29 8.96
Reliance Communications
0.94 0.85 -9.83 8.31
Vodafone - - - -
Total 10.89 10.20 -6.38% 100.00

24
1.26 Number of PCOs continued to show declining trend. This quarter has
recorded a decline of 6.38%. The year-on-year (Y-O-Y) decline over the
same quarter of the last year is 27.72%.
Village Public Telephones (VPTs)
1.27 There are 5,93,731 inhabited villages in India as per census 2001. At
the end of the quarter, 99.26% of the total inhabited villages in India
have been connected by VPT. The number of VPTs increased from
5,89,313 at the end of Sep-13 to 5,89,330 at the end of Dec-13.
1.28 BSNL (5,82,340) has 98.8% market share of total VPTs followed by Tata
(3953) with 0.7%. Detailed table is at Annexure -1.5.
Chart 1.12: Growth in VPTs

25
Section D: Internet Service
1.29 Department of Telecommunication vide its notification dated 18th July,
2013 has revised the definition of broadband as follows;
„Broadband is a data connection that is able to support interactive
service including internet access and has the capability of the minimum
download speed of 512 kbps to an individual subscriber from the Point of
Presence (PoP) of the service provider intending to provide broadband
service‟.
Accordingly, the minimum download speed has been increased from
256 kbps to 512 kbps in broadband service.
1.30 From the report of this quarter, the service providers have started
reporting the data of broadband subscribers in accordance with the
revised definition i.e. >=512 kbps. Hence, comparison of data vis-à-vis
data for previous quarter is not attempted.
1.31 The report summarized information submitted by 143 service providers.
It is divided into three parts. Part-I consists of information of Internet
service (both narrowband and broadband), Part-II consists of
broadband service and Part-III covers narrowband service.
Part-I : Internet Service (broadband + narrowband)
1.32 As per reports received from service providers, there were 238.71
million Internet Subscribers as on 31st December, 2013. Out of which
Wired Internet subscribers are 18.33 million and Wireless Internet
subscribers are 220.38 million.

26
Table 1.21: Trend of Internet subscriber base
Mode of Access
Total
Subscribers
Segment
Wired
Wireless
Fixed Wireless (Wi-Fi, Wi-Max, Point-to-Point Radio & VSAT)
Mobile Wireless
(Phone + Dongle)
Total Wireless
Broadband 14.54 0.39 40.27 40.66 55.20
Narrowband 3.79 0.07 179.65 179.72 183.51
Total 18.33 0.46 219.92 220.38 238.71
1.33 The following chart presents the composition of Internet Subscribers by
mode of access.
Chart 1.13: Composition of Internet subscription
1.34 Number of Broadband subscribers is 55.20 million and the number of
Narrowband subscribers is 183.51 million at the end of Dec-13.

27
Chart 1.14 : Composition of Broadband & Narrowband subscription
Table 1.22: Internet Subscriber Base and Market Share of top 10
Service Providers
S.No ISP Subs Share (%)
1 Bharti 55787450 23.37
2 Vodafone 45653907 19.13
3 BSNL 41080353 17.21
4 Reliance Communications Group
36387480 15.24
5 Idea 25525638 10.69
6 Aircel 15054166 6.31
7 Telewings (Uninor) 6559648 2.75
8 Tata 3065785 1.28
9 Loop 2829274 1.19
10 MTNL 1758448 0.74
Total of Top 10 ISPs 233702149 97.90
Others 5006192 2.10
Grand Total 238708341 100.00
1.35 Bharti holds the top position with 23.37% of market share of internet
subscribers followed by Vodafone with 19.13%. Top 10 Service
Providers together hold 97.90% of total internet subscriber base.
Detailed table of all the SPs is available at Annexure-1.6.

28
1.36 The following chart depicts the trend of subscriber base achieved by top
ten ISPs in the QE Dec-13.
Chart 1.15 : Trends of subscriber base achieved by top ten ISPs
1.37 Top five states in terms of internet subscriptions (wired + wireless) are
Maharashtra (38.77 million), Uttar Pradesh (22.90 million), Tamil Nadu
(19.65 million), Gujarat (17.92 million) and Andhra Pradesh (17.07
million).
1.38 In wired internet segment, BSNL holds 71.91% market share with
13.18 million subscribers, followed by Bharti with 1.47 million and
MTNL with 1.11 million subscribers.
1.39 The following chart shows the composition of Wired Internet
Subscribers.

29
Chart 1.15 : Composition of Wired Internet subscribers
1.40 In wireless internet segment, Bharti holds 24.65% market share with
54.32 million subscribers followed by Vodafone with 45.65 million and
Reliance Communications Group with 36.22 million internet
subscribers.
Chart 1.16 : Composition of Wireless Internet subscription

30
Chart 1.17 : Technology trend for Internet Access
ISP Connectivity
1.41 The International Internet bandwidth owned by various SPs is reported
to be 1209 GB during the quarter ending Dec-13.
Internet Telephony 1.42 As per the reports available with the TRAI, 33 ISPs are providing
Internet Telephony services presently. Total outgoing minutes of usage
for internet telephony during the quarter ending Dec-13 were 319
million. The list of Internet Telephony Service providers is available at
Annexure-1.7.

31
Chart 1.19 : Trends in MOU for Internet Telephony
Part-II : Broadband Service
1.43 As per information received from service providers, the total number of
broadband subscribers as on 31st December, 2013 is 55.20 million.
Out of which wired broadband subscribers are 14.54 million and
wireless broadband subscribers are 40.66 million.
1.44 Top five broadband (wired + wireless) service providers in term of
subscribers are BSNL (16.54 million), Bharti (10.88 million), Reliance
Communications Group (6.98 million), Idea (5.87 million) and Vodafone
(5.20 million).
1.45 In wired broadband segment, BSNL holds 68.68% market share with
9.98 million subscribers followed by Bharti with 1.39 million and MTNL
with 1.11 million wired broadband subscribers.

32
1.46 In wireless broadband segment, Bharti holds 23.33% market share
with 9.49 million subscribers followed by Reliance Communications
Group with 6.87 million and BSNL with 6.55 million wireless
broadband subscribers.
Chart 1.20 : Composition of Broadband subscription – Technology wise
1.47 Wireless (dongle + phone) is the most preferred technology used by the
Service Providers to provide Broadband Services and it constitutes
72.95% of total broadband subscribers.
1.48 Top five states in respect of broadband subscriptions are Maharashtra
(9.23 million), Delhi (5.78 million), Tamil Nadu (5.77 million),
Karnataka (4.61 million) and Andhra Pradesh (4.40 million).
Part-II : Narrowband Service
1.49 As reported by the service providers, total number of narrowband
subscriber is 183.51 million at the end of Dec-13. Out of which Wired
Narrowband subscribers are 3.79 million and Wireless Narrowband
subscribers are 179.72 million.

33
1.50 The top five narrowband (wired + wireless) service providers in term of
subscriber base area Bharti (44.91 million), Vodafone (40.45 million),
Reliance Communications Group (29.40 million), BSNL (24.55 million)
and Idea (19.66 million).
1.51 In wired narrowband segment, BSNL holds 84.30% market share with
3.19 million subscribers followed by YOU Broadband (0.17 million) and
Bharti (0.08 million).
1.52 In wireless narrowband segment, Bharti holds 24.95% market share
with 44.84 million subscribers followed by Vodafone (40.45 million) and
Reliance Communications Group (29.35 million).
Chart 1.21 : Composition of Narrowband subscription – Technology wise
1.53 Wireless (dongle + Phone) is the most preferred technology used by the
service providers to provide narrowband service.

34
Section E : Other Value Added Services - PMRTS & VSAT
Public Mobile Radio Trunk Services (PMRTS)
Table 1.23 : PMRTS Subscriber base - Service Provider wise
Sr. No.
Name of the Service Provider
Subscriber Base as on 30.09.13
Subscriber Base as on 31.12.13
%age Growth in
Subscribers
%age in Market Share
1
Arya Omnitalk
Radio Trunking Services Pvt.Ltd.
28494 29636 4.02 74.05
2 Procall Ltd. 5740 5865 2.18 14.65
3 Smartalk Pvt Ltd. 1014 1061 4.64 2.65
4 QuickCall 2550 2753 7.96 6.88
5 Bhilwara Telenet Services Pvt.Ltd.
1101 707 -35.79 1.77
6 India Satcom Ltd. 0 0 0.00 0.00
Total 38899 40025 2.89 100.00
*M/s India Satcom Ltd. reported that their MRTS department is non-functional and they do
not have any subscriber.
1.54 The subscriber base of PMRTS increased from 38,889 at the end of Sep-
13 to 40,025 at the end of Dec-13 with quarterly growth rate of 2.89%.
1.55 Detailed table on Service Area wise subscriber base of PMRTS is at
Annexure-1.8.

35
Chart 1.22 : Number of PMRTS subscribers & Rate of Growth (%)
Very Small Aperture Terminal (VSAT)
Table 1.24 : VSAT Service Providers currently providing service &
their subscriber base
Sr. No
Name of Service Providers
Subscriber base at the Quarter ending %age
Growth
Market Share (%) Dec-13 Sep-13 Dec-13
1 Hughes Communications Ltd. 77399 82634 6.76 40.77
2 Bharti Airtel Limited, 50334 51305 1.93 25.31
3 Tatanet Services 25985 30664 18.01 15.13
4 HCL Comnet 21981 21907 -0.34 10.81
5 BSNL 12978 13803 6.36 6.81
7 Infotel Satcom 1713 1856 8.35 0.92
6 Essel Shyam 2728 400 -85.34 0.20
8 Bharti Broadband 129 119 -7.75 0.06
9 Infinium India Ltd. 7 7 0.00 0.00
Total 193254 202695 4.89 100.00

36
1.56 The total number of VSAT subscribers increased from 1,93,254 at the
end of Sep-13 to 2,02,695 at the end of Dec-13. Net additions during
the quarter has been 9,441 at the quarterly growth rate of 4.89%.
1.57 Hughes Communication Limited with subscriber base of 82,634
continues to be the market leader.
1.58 Tatanet Service has recorded maximum growth rate of 18.01%, whereas
Essel Shyam has registered 85.34% decline in VSAT subscribers in this
quarter.
Chart 1.23 : Number of VSAT Subscribers & Rate of Growth (%)

37
Chapter 2 :
Revenue and Usage
---------------------------------------------------------------------------------------------------------------- For all the parameters, Metros indicate data for Delhi, Mumbai & Kolkata. Data for
Chennai service area has been included in Circle A, as part of TN.
ARPU arrived after adjusting interconnect usage charges and roaming settlement charges.
The data contained in the section A & B covers the licensees, who have been providing service during the entire period from 1st October, 2013 to 31st December, 2013 in the various service areas.

38
Section A: GSM Service
Table 2.1: Key Indicators - GSM Service
# Subscriber figures are closing figures as on the last day of the respective quarters * Minutes of Usage
Chart 2.1: Break-up of Outgoing minutes from Home Service Area
(HSA) - GSM Service
Intra-circle to Fixed1.5%
Intra-circle to own Mobile41.3%Intra-circle to other
Mobile37.9%
Inter-circle to Fixed0.5%
Inter-circle to own Mobile6.3%
Inter-circle to other Mobile12.4% ILD
0.2%
2.1 The following chart depicts prepaid subscribers as a % of total
subscribers as on the last day of the respective quarters for various
categories of circles.
Parameter
Q.E.
Dec-13
Q.E.
Sep-13
Q.E.
Dec-12
QoQ %age
change over Sep-13
YoY %age
change over Dec-12
Subscriber Base# (million)
823.23 807.16 786.64 1.99 4.65
Share of Prepaid (%) 95.99 96.07 96.46 -0.08 -0.48
Incoming MOU* per sub. per month
195 193 186 1.17 5.04
Outgoing MOU* per sub. per month
184 182 174 1.02 5.70
Outgoing SMS per sub. per month
28 29 39 -3.37 -26.59
Average Revenue Per User (ARPU) per month
112 109 98 2.62 14.06

39
Chart 2.2: Proportion of prepaid subscribers - GSM Service
60%
65%
70%
75%
80%
85%
90%
95%
100%
Circle A Circle B Circle C Metros All India
95
.42
%
97
.86
% 98
.17
%
87
.99
%
96
.07
%
95
.37
%
97
.79
% 98
.12
%
87
.82
%
95
.99
%
Sep-13 Dec-13
2.2 Market share of prepaid segment slightly declined from 96.07% at the
end of Sep-13 to 95.99% at the end of Dec-13.
2.3 The ARPU per month (all India, blended) increased from Rs.109 in Q.E.
Sep-13 to Rs.112 in Q.E. Dec-13. The following table presents the
ARPU per month for various categories of circles and various platforms
for payment viz. post-paid and pre-paid.
Table 2.2: Monthly ARPU - GSM Service
Circle Category ARPU per month in Q.E. December 2013
Post-paid Pre-paid Blended
Circle A 451 103 119
Circle B 433 93 101
Circle C 434 97 103
Metros 484 98 145
All India 456 98 112
All private SPs 464 101 116
BSNL/MTNL 391 73 85

40
2.4 The ARPU per month for pre-paid segment increased from Rs.95 in QE
Sep-13 to Rs.98 in QE Dec-13 and the ARPU per month for post-paid
segment decreased from Rs.463 in QE Sep-13 to Rs.456 in QE Dec-13.
2.5 The following table presents the composition of ARPU per month in the
Q.E. Dec-13.
Table 2.3: Composition of ARPU per month - GSM Service
S. No.
Item
Revenue (excl.
service tax) per subscriber per
month (in Rs.)
% share of
total revenue from
subscribers
1 Usage from Home Service Area
1.1. Rental Revenue 18.65 15.05
1.2. Revenue from calls 71.71 57.87
1.3. Revenue from SMS 4.20 3.39
1.4. Revenue from data usage 14.96 12.07
1.5. Revenue from other VAS 5.01 4.05
1.6. Other revenue 1.89 1.53
2 Usage outside Home Service Area
2.1. Revenue from outroamers 7.49 6.05
3 Total revenue from subscribers (1+2) 123.91 100
4 Net inter-operator settlement charges receivable * -11.97
5 Net Revenue (ARPU) per month(3+4) 111.94
* includes Interconnect Usages Charges and roaming settlement charges
2.6 From the above table, it may be seen that the net inter-operator
settlement charges payable (Rs.11.97) accounts for 9.66% of the total
revenue from subscribers.
2.7 On an all India average, the overall MOU per subscriber per month
increased from 375 in QE Sep-13 to 379 in QE Dec-13. The following
table presents the total minutes of usage (MOU) and SMS usage (usage
from, and outside, the home service area) per subscriber per month for
various categories of circles.

41
Table 2.4: MOU per subscriber per month - GSM Service
Circle
category
MOU per subscriber per month
Postpaid Prepaid Blended
Ou
tgoin
g
MO
U
Incom
ing
MO
U
Tota
l
MO
U
Ou
tgoin
g
MO
U
Incom
ing
MO
U
Tota
l
MO
U
Ou
tgoin
g
MO
U
Incom
ing
MO
U
Tota
l
MO
U
Circle A 588 420 1008 168 171 339 187 183 370
Circle B 574 386 960 160 189 348 169 193 362
Circle C 513 397 910 176 227 403 182 230 412
Metro 547 369 916 199 174 373 241 198 439
All India 568 396 964 169 187 355 184 195 379
Note: MOU indicate total usage i.e. usage from and outside HSA
2.8 The overall ratio of incoming MOU and outgoing MOUs remained
unchanged 51:49 during the quarter ending Dec-13.
2.9 Outgoing SMS per subscriber per month decreased from 29 in Q.E.
Sep-13 to 28 in Q.E. Dec-13. The following table presents the outgoing
SMS usage (usage from, and outside, the home service area) per
subscriber per month for various categories of circles and various
platforms for payment viz. post-paid and pre-paid.
Table 2.5: Outgoing SMS per subscriber per month - GSM Service
Circle
category
Outgoing SMS per subscriber month
Postpaid Prepaid Blended
Circle A 74 39 40
Circle B 56 19 20
Circle C 40 17 18
Metro 70 30 35
All India 67 27 28
Note: SMS indicate total usage i.e. usage from and outside HSA

42
Chart 2.3 : Minutes of Usage by Outroamers as a % of Total Minutes
of Usage
Minutes of use from
HSA 97.37%
Minutes of use by
outroamers (outside
HSA) 2.63%
Chart 2.4: Outgoing SMS Usage by Outroamers as a % of Total
Outgoing SMS Usage
Outgoing SMS from
HSA 97.66%
Outgoing SMS usage
by outroamers
(outside HSA)
2.34%
2.10 The following table presents the percentage break-up of outgoing
minutes of usage from home service area between various categories of
termination networks.

43
Table 2.6: %Break-up of Outgoing minutes from Home Service Area (HSA)
Circle
category
% Intra-circle to
wireline
% Intra-circle to
own wireless
% Intra-circle to
other wireless
% Inter-circle to
wireline
% Inter-circle to
own wireless
% Inter-circle to
other wireless
% ILD
Circle A 1.71 39.56 42.43 0.37 4.59 11.19 0.15
Circle B 1.12 43.45 37.44 0.48 7.03 10.34 0.14
Circle C 1.26 52.83 31.01 0.76 4.71 9.38 0.05
Metros 2.21 26.16 33.68 0.71 11.30 25.59 0.34
All India 1.49 41.26 37.88 0.51 6.32 12.38 0.15
2.11 The chart given below presents the percentage of subscribers who
availed roaming services (outroamers) during the quarter.
Chart 2.5: % subscribers who availed roaming services during the quarter
% subscribers who availed
roaming services
during the quarter, 13.08%
% subscribers who did not
avail roaming services
during the quarter, 86.92%
2.12 The usage pattern of outroamers i.e. usage from outside the home
service area shows that incoming minutes accounts for 43.4% of the
total minutes of usage by outroamers as against 42.6% in the previous
quarter. The chart given below presents the break-up of minutes of
usage of outroamers during the Q.E. Dec-13.

44
Chart 2.6: % Break-up of minutes of usage of outroamers (usage from outside the Home Service Area)
Incoming43.40%
Outgoing -local
30.97%
Outgoing - STD 25.30%
Outgoing - ISD 0.33%
Average Subscriber outgo* per Outgoing Minute for usage from Home
Service Area (HSA)
2.13 The tariff plans are of bundled nature and the trade-off is generally
between monthly fixed charges and variable (call) charges. Therefore,
average subscriber outgo per outgoing minute for usage from Home
Service Area (HSA) as defined below would be a realistic indicator of
average tariff.
Average Subscriber Outgo per Outgoing Minute for usage from HSA
= Rental revenue + revenue from outgoing calls from HSA No. of outgoing minutes from HSA
Table 2.7: Average subscriber outgo per outgoing minute from HSA - GSM Service
(` per minute)
Circle Category Postpaid Prepaid Blended
Circle A 0.56 0.52 0.52
Circle B 0.56 0.48 0.49
Circle C 0.65 0.46 0.47
Metros 0.64 0.52 0.55
All India 0.59 0.49 0.51

45
2.14 All India average subscriber outgo per outgoing minute remained at the
same level i.e. ` 0.51 in the QE Dec-13.
Table 2.8: Trends of Key Parameters - GSM Service
2.15 Service Area wise statistics are available at Annexure-2.1.
Parameter Dec-12 Mar-13 Jun-13 Sep-13 Dec-13
1. ARPU (` Per month) 98 105 111 109 112
2. MOU per subscriber per month 360 383 388 375 379
3. Outgoing MOU per subscriber per month
3.1 Local (Intra-circle) 142 150 154 145 147
3.2 NLD (inter-circle) 33 35 35 37 37
3.3 ILD 0.3 0.3 0.3 0.3 0.3
4. Outgoing SMS per subscriber per month SMS
39 30 27 29 28
5. Average subscriber Outgo per
outgoing minute from HSA (`) 0.47 0.48 0.50 0.51 0.51

46
Section B: CDMA - Full Mobility Service
Table 2.9: Key Indicators - CDMA Full Mobility Service
Parameters QE
Dec-13 QE
Sep-13 QE
Dec-12
QoQ
change (%)
YoY
change (%)
Subscriber Base in Millions*
50.69 51.48 65.15 -1.54 -22.20
Share of Prepaid (%) 89.9 89.8 90.8 0.06 -1.00
Incoming MOUs per subs per month
130.25 125.41 113.31 3.86 14.95
Outgoing MOUs per subs per month
141.35 136.94 116.75 3.23 21.07
Outgoing SMS per subs per month
17.0 16.9 21.19 0.96 -19.56
ARPU (Rs. per month) 103.60 98.22 79.95 5.48 29.58
* Subscriber figures are closing figures as on last day of the quarter.
2.16 The following chart depicts % break-up of outgoing minutes from home
service area (HSA).
Chart 2.7: % Break-up of Outgoing Minutes from Home Service Area (HSA) - CDMA Full Mobility Service

47
2.17 The following chart depicts prepaid subscribers as a % of total
subscribers as on the last day of the respective quarters for various
categories of circles.
Chart 2.8: Proportion of prepaid subscribers - CDMA Full Mobility Service
2.18 Market share of Prepaid segment slightly increased from 89.82% in QE
Sep-13 to 89.87% in QE Dec-13.
2.19 The following table presents the ARPU per month for various categories
of circles and various platforms for payment viz. postpaid and prepaid.
Table 2.10: Monthly ARPU - CDMA Full Mobility Service (` per month)
Circle category Postpaid Prepaid Blended ARPU
Circle A 474 76 129
Circle B 369 55 72
Circle C 409 59 74
Metro 463 71 128
All India 446 65 104

48
2.20 The All India blended Average Revenue Per User (ARPU) per month has
shown an increase of 5.48% from Rs.98.22 in QE Sep-13 to Rs.103.60
in QE Dec-13.
2.21 ARPU for Prepaid service increased by 5.66% from Rs.61.49 in QE Sep-
13 to Rs.64.97 in QE Dec-13. ARPU for Postpaid service has decreased
by 0.63% from Rs.449.04 in QE Sep-13 to Rs.446.20 in QE Dec-13.
Table 2.11: Composition of ARPU per month- CDMA Full Mobility Service
S.
No. Item
Revenue (excl. service tax) per
subscriber per month (in Rs.)
% Share of total revenue from
subscribers
1 Usage from Home Service Area
1.1 Rental Revenue 21.64 19.25
1.2 Revenue from Calls 45.35 40.34
1.3 Revenue from SMS 1.87 1.66
1.4 Revenue from data usage 37.91 33.72
1.5 Revenue from other VAS 3.44 3.06
1.6 Other Revenue -0.71# -0.06
2 Usage outside Home Service Area
2.1 Revenue from Outroamers 2.93 2.61
3 Total Revenue from Subscribers (1+2)
112.42 100%
4 Net inter-operator settlement charges receivable*
-8.82
5 Net Revenue (ARPU) (3+4) 103.60
# Other Revenue is negative because of the adjustment of Exceptional Items (Bad Debt) by
one of the service provider. * Includes Interconnect Usage Charges and roaming settlement charges
2.22 The total MOUs per subscriber per month increased by 3.53%, from
262.35 in QE Sep-13 to 271.60 in QE Dec-13. The outgoing MOUs
increased by 3.23% and incoming MOUs increased by 3.86%.
2.23 Prepaid MOUs per subscriber per month increased by 4.85% and
postpaid MOUs per subscriber per month decreased by 5.59% in this
quarter.

49
2.24 Outgoing SMS per subscriber per month has more or less remained
stable at 17 in QE Sep-13.
Table 2.12 : MOU per subscriber per month – CDMA Full Mobility Service
MOU per subscriber per month
Circle category
Postpaid Prepaid Blended
Ou
tgoin
g
MO
U
Incom
ing
MO
U
Tota
l
MO
U
Ou
tgoin
g
MO
U
Incom
ing
MO
U
Tota
l
MO
U
Ou
tgoin
g
MO
U
Incom
ing
MO
U
Tota
l
MO
U
Circle A 295 145 440 120 122 241 143 125 268
Circle B 382 184 566 123 132 254 138 135 272
Circle C 457 345 802 99 151 250 114 159 274
Metro 282 133 416 132 118 250 153 121 274
All India 314 156 470 122 127 249 141 130 272
Note: MOU indicate total usage i.e. usage from and outside HSA
Table 2.13 : Outgoing SMS per subscriber per month – CDMA Full Mobility Service
Circle category
Outgoing SMS per subscriber month
Postpaid Prepaid Blended
Circle A 14 20 19
Circle B 13 14 14
Circle C 13 10 10
Metro 17 21 21
All India 15 17 17
Note: SMS indicate total usage i.e. usage from and outside HSA
50
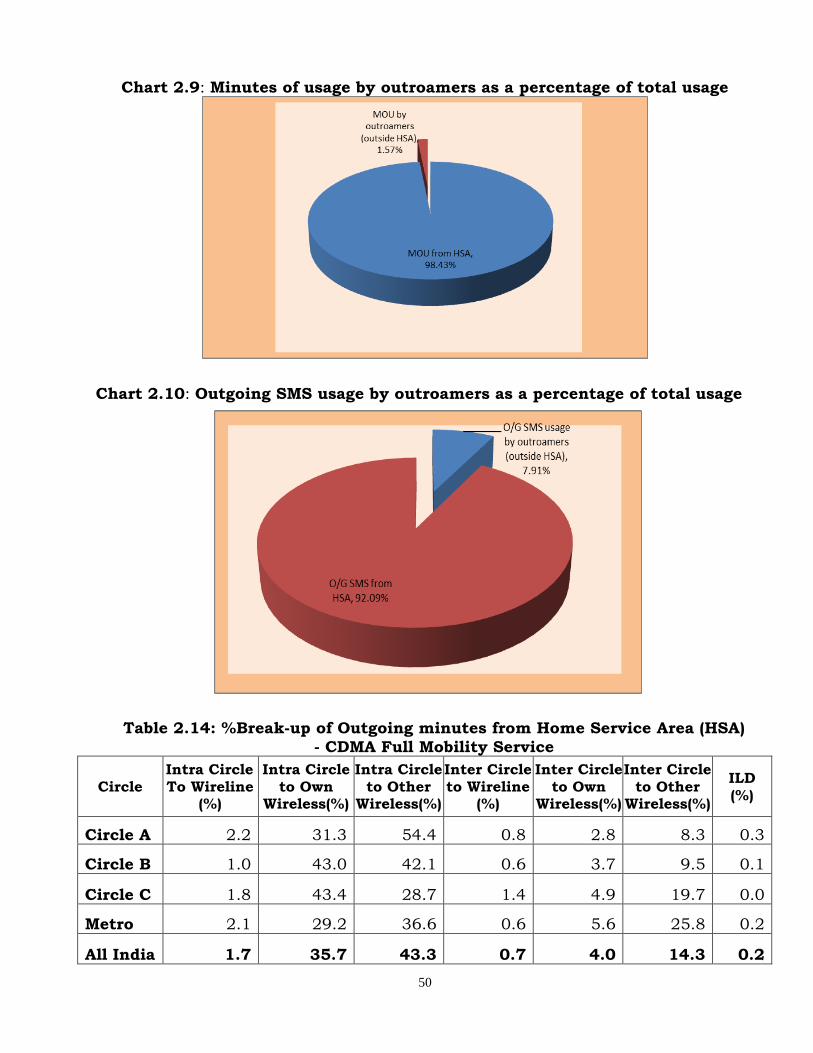
Chart 2.9: Minutes of usage by outroamers as a percentage of total usage
Chart 2.10: Outgoing SMS usage by outroamers as a percentage of total usage
Table 2.14: %Break-up of Outgoing minutes from Home Service Area (HSA)
- CDMA Full Mobility Service
Circle
Intra Circle
To Wireline (%)
Intra Circle
to Own Wireless(%)
Intra Circle
to Other Wireless(%)
Inter Circle
to Wireline (%)
Inter Circle
to Own Wireless(%)
Inter Circle
to Other Wireless(%)
ILD (%)
Circle A 2.2 31.3 54.4 0.8 2.8 8.3 0.3
Circle B 1.0 43.0 42.1 0.6 3.7 9.5 0.1
Circle C 1.8 43.4 28.7 1.4 4.9 19.7 0.0
Metro 2.1 29.2 36.6 0.6 5.6 25.8 0.2
All India 1.7 35.7 43.3 0.7 4.0 14.3 0.2

51
2.25 The chart given below presents the percentage of subscribers who
availed roaming services (outroamers) during the quarter.
Chart 2.11: Percentage of subscribers who availed roaming service during the quarter
Chart 2.12: Percentage breakup of minutes of usage of Outroamers (usage
from outside the Home Service Area)
52
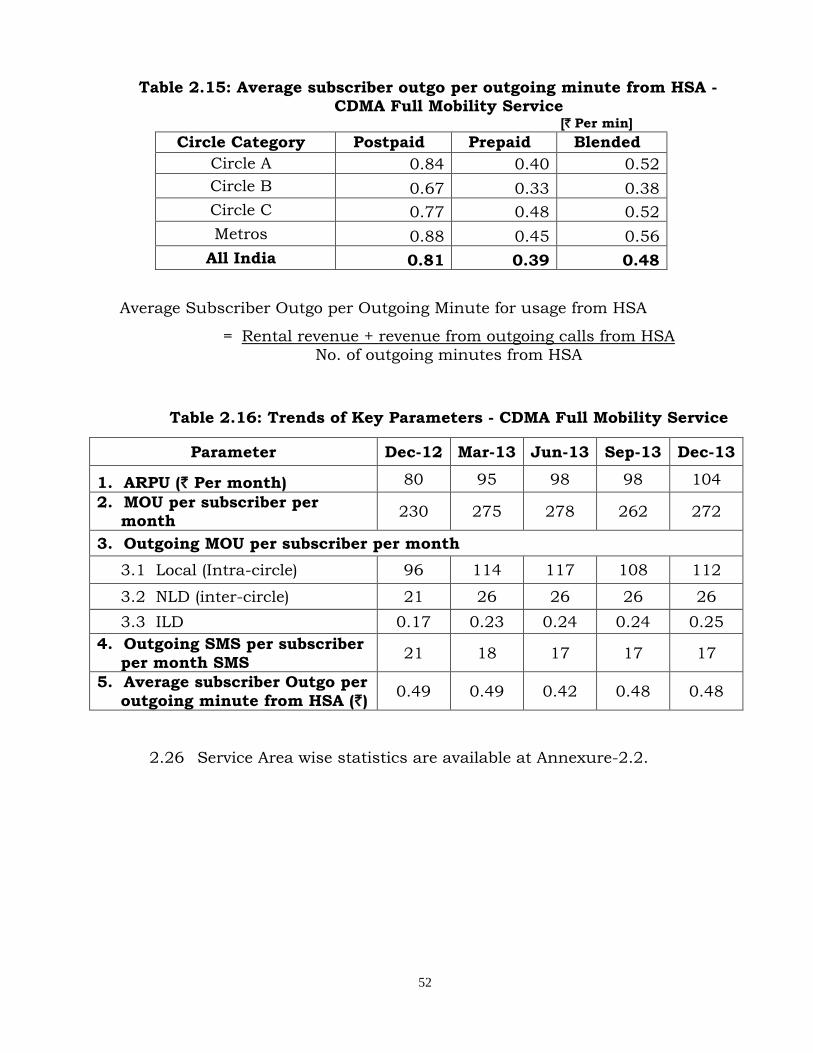
Table 2.15: Average subscriber outgo per outgoing minute from HSA - CDMA Full Mobility Service
[` Per min]
Circle Category Postpaid Prepaid Blended
Circle A 0.84 0.40 0.52
Circle B 0.67 0.33 0.38
Circle C 0.77 0.48 0.52
Metros 0.88 0.45 0.56
All India 0.81 0.39 0.48
Average Subscriber Outgo per Outgoing Minute for usage from HSA
= Rental revenue + revenue from outgoing calls from HSA No. of outgoing minutes from HSA
Table 2.16: Trends of Key Parameters - CDMA Full Mobility Service
Parameter Dec-12 Mar-13 Jun-13 Sep-13 Dec-13
1. ARPU (` Per month) 80 95 98 98 104
2. MOU per subscriber per month
230 275 278 262 272
3. Outgoing MOU per subscriber per month
3.1 Local (Intra-circle) 96 114 117 108 112
3.2 NLD (inter-circle) 21 26 26 26 26
3.3 ILD 0.17 0.23 0.24 0.24 0.25
4. Outgoing SMS per subscriber
per month SMS 21 18 17 17 17
5. Average subscriber Outgo per
outgoing minute from HSA (`) 0.49 0.49 0.42 0.48 0.48
2.26 Service Area wise statistics are available at Annexure-2.2.
53
Chapter 3 :
Financial Data of Telecom Service Sector

54
Table 3.1: Gross Revenue (GR), Adjusted Gross Revenue (AGR), License Fee (LF) & Spectrum Charges
Particulars QE Dec-12 (` in Crore)
QE Sep-13 (` in Crore)
QE Dec-13 (` in Crore)
Q-O-Q % Change
Over Sep-13
Y-O-Y % Change
over Dec-12
Gross Revenue (GR)
52858 57453 58385 1.62 10.46
Adjusted Gross 34528 38811 39575 1.97 14.62
Revenue (AGR)
Pass Through 18331 18642 18810 0.90 2.62
(GR-AGR)
License Fee 2814 3105 3168 2.03 12.57
Spectrum
Charges 1281 1477 1585 7.27 23.69
3.1 Gross Revenue(GR) and Adjusted Gross Revenue(AGR) increased by
1.62% and 1.97% respectively in the QE Dec-13.
3.2 Pass through increased by 0.90% in the QE Dec-13, and on annual
basis it has increased by 2.62%.
3.3 Pass-through charges as % Gross Revenue: 32.22% in QE Dec-13 as
against 32.45% in the previous quarter.
Table 3.2: Service-wise Gross Revenue, Adjusted Gross Revenue, License Fee and Spectrum Charges
(` in Crore)
Service GR AGR LF Spectrum Charges
Access Providers
43817 31407 2514 1582
NLD 8383 6372 510 -
ILD 3544 1601 128 -
Others 2642 195 16 3
Total 58385 39575 3168 1585

55
Chart 3.1: Composition of Adjusted Gross Revenue
3.4 Access services contributed 79.36% to the total Adjusted Gross
Revenue (AGR) of telecom services. In Access services, Gross Revenue,
AGR, License Fee, Spectrum Usage Charges and Pass Through Charges
increased by 3.00%, 3.47%, 3.54%, 7.30% and 1.84% respectively in
QE Dec-13.
3.5 Public Sector Undertakings' share in the Access AGR of telecom
services is 12.36% in the QE Dec-13.
3.6 Monthly ARPU based on AGR for Access services is `116 for the Q.E.
Dec-13. Chart below shows the trend in ARPU.

56
Chart 3.2: Trend in ARPU per month for Access Services
Table 3.3: Access Services - Service Provider wise Adjusted
Gross Revenue (` in Crore)
Service QE Sep-13 QE Dec-13 % Change
Bharti 8655.57 9009.60 4.09
Vodafone 6452.15 6609.90 2.45
Idea 4633.65 4857.83 4.84
BSNL 3228.61 3279.38 1.57
Tata 2188.95 2291.72 4.70
Reliance 2068.55 2208.66 6.77
Aircel 1551.97 1635.18 5.36
MTNL 746.38 601.67 -19.39
Telewings 480.27 555.41 15.65
Sistema Shyam 200.63 212.19 5.76
Loop 113.06 97.10 -14.12
Quadrant 33.39 25.96 -22.25
Videocon * 21.93 -
Grand Total (Access) 30353.17 31406.54 3.47 *Data not received.

57
Table 3.4: Category-wise share in Access Services Adjusted Gross Revenue (AGR)
Category Access AGR for
QE Dec-13
(` in Crore)
%age share of
AGR
Metro 4847 15.4
A 12057 38.4
B 10750 34.2
C 3752 12.0
Total 31407 100.0
Notes :
1. Source: Figures are un-audited and as submitted by the Operators.
2. The figures have been regrouped wherever considered necessary for analysis purpose.
3. The Spectrum usage charges (mostly) are now reported on “Payment for the current
Quarter” basis. However, some operators are reporting on payment basis or on estimate
basis on projected AGR for next quarter.
4. Metro area includes Delhi, Mumbai and Kolkata only. Chennai is clubbed with
Tamilnadu.

58
Chapter 4 : Quality of Service (QoS)

59
Section A: Quality of Service Performance of Wireless Service Providers
Part-I : 2G Wireless Services
Table 4.1: QoS Summary - 2G Wireless Service
Sl. No.
Parameters Benchmark
No. of CMTS Licensees not Meeting the Benchmarks
Quarter Ending
September, 2013
Quarter Ending
December, 2013
Out Of 183
(Nos.)
Out of 183 (%)
Out Of 183
(Nos.)
Out of 183 (%)
I. Network Related Parameters
1 Network Availability
(i) BTSs Accumulated downtime (not available for service)
≤ 2% 1 0.55% 4 2.19%
(ii) Worst affected BTSs due to downtime
≤ 2% 7 3.83% 8 4.37%
2 Connection Establishment
(Accessibility)
(i) Call Set-up Success Rate (within licensee's own network)
≥ 95% 0 0 1 0.55%
(ii) SDCCH/ Paging Chl. Congestion
≤ 1% 0 0 1 0.55%
(iii) TCH Congestion ≤ 2% 0 0 1 0.55%
3 Connection Maintenance (Retain ability)
(i) Call Drop Rate ≤ 2% 0 0 2 1.09%
(ii) Worst affected cells having more than 3% TCH drop (call drop) rate
≤ 3% 5 2.73% 10 5.46%
(iii) Connection with good voice quality
≥ 95% 2 1.09% 4 2.19%
4
Point of Interconnection (POI) Congestion (No. of POIs not meeting the benchmark) (Averaged over a period of quarter)
≤ 0.5% 1 0.55% 1 0.55%

60
S. No.
Parameters Benchmark
No. of CMTS Licensees not Meeting the Benchmarks
4 1.75%
Quarter Ending, September, 2013
Quarter Ending, December, 2013
Out Of 183
(Nos.)
Out Of 183 (%)
Out Of 183
(Nos.)
Out Of 183 (%)
II. Customer Service Quality Parameters
5 Metering and Billing
(i) Metering and billing credibility - post paid
≤ 0.1% 6 3.28% 4 2.19%
(ii) Metering and billing credibility - pre paid
≤ 0.1% 4 2.19% 3 1.64%
(iii) Resolution of billing/charging/validity complaints
100% within 4
weeks
2 1.09% 4 2.19%
(iv)
Period of applying credit/ waiver/ adjustment to customer’s account from the date of resolution of complaints
within 1
week of resolution
of complaint
3 1.64% 5 2.73%
6 Response time to the customer for assistance
(i) Accessibility of call centre/ customer care
≥ 95% 4 2.19% 15 8.20%
(ii) %age of calls answered by the operators (voice to voice) within 60 seconds
≥ 90% 60 32.79% 41 22.40%
7 Termination / closure of service
(i) %age requests for Termination / Closure of service complied within 7 days
100% within 7
days
7 3.83% 5 2.73%
(ii) Time taken for refund of deposits after closures
100%
within 60 days
3 1.64% 5 2.73%

61
4.1 The performance has improved in this quarter as compared to the previous quarter in respect of the following parameters :-
a. Metering and billing credibility - post paid
b. Metering and billing credibility - pre paid
c. %age of calls answered by the operators (voice to voice) within 60 sec
d. %age requests for Termination / Closure of service complied
within 7 days.
4.2 The performance has deteriorated in this quarter as compared to the
previous quarter in respect of the following parameters:-
a. BTSs Accumulated downtime (not available for service)
b. Worst affected BTSs due to downtime
c. Call Set-up Success Rate (within licensee’s own network)
d. SDCCH/Paging Channel Congestion (%age)
e. TCH Congestion
f. Call Drop Rate
g. Worst affected cells having more than 3% TCH drop (call drop) rate
h. Connection with good voice quality
i. Resolution of billing/ charging/ validity complaints.
j. Period of applying credit/waiver/adjustment to customer’s
account from the date of resolution of complaints
k. Accessibility of call centre/ customer care
l. Time taken for refund of deposits after closures.

62
Table 4.2: Parameter wise Analysis of Non-compliance of QoS Benchmarks for 2G Wireless Service Providers
Parameter Benchmark Service Provider
Service Area
Performance
BTSs Accumulated downtime
(not available for service) (%age)
≤ 2%
BSNL
ASM 2.70
NE 6.03
WB 2.22
Idea MP 3.49
Worst affected BTSs due to
downtime (%age) ≤ 2%
Aircel
ASM 6.00
BH 4.26
CHN 4.57
NE 6.14
BSNL
ASM 6.30
NE 15.85
WB 8.19
Idea MP 8.61
Call Set-up Success Rate (within licensee's own network)
≥ 95% BSNL ASM 92.67
SDCCH/ Paging Chl. Congestion (%age)
≤ 1% BSNL NE 3.00
TCH Congestion (%age) ≤ 2% BSNL NE 4.22
Call Drop Rate (%age) ≤ 2%
BSNL
ASM 2.17
NE 4.08
Worst affected cells having more than 3% TCH drop
≤ 3%
Aircel
ASM 3.94
BH 3.10
HR 8.33
KR 3.11
MP 4.51
NE 5.47
BSNL
ASM 5.57
NE 12.77
PB 5.37
WB 11.01
Connection with good voice
quality ≥ 95%
Aircel
ASM 93.77
NE 94.22
BSNL ASM 91.33
NE 92.50
Point of Interconnection (POI) Congestion (No. of POIs not
meeting the benchmark)
≤ 0.5% BSNL HR 2
Metering and billing credibility - post paid
≤ 0.1%
Idea AP 0.11
KL 0.11
Vodafone DLI 0.15
MP 0.13

63
Metering and billing credibility - pre paid
≤ 0.1% BSNL
KOL 0.40
WB 0.33
Idea TN 0.14
Resolution of
billing/charging/validity complaints
100%
within 4 weeks
BSNL KOL 65.90
WB 99.50
Vodafone AP 99.94
MP 99.90
Period of applying credit/ waiver/ adjustment to
customer’s account from the date of resolution of complaints
within 1
week of resolution
of
complaint
Airtel
BH 99.97
UPE 99.97
UPW 99.98
BSNL
KOL 66.00
MH NR
Accessibility of call centre/
customer care ≥ 95%
Aircel
ASM 76.02
BH 94.30
CHN 91.66
GUJ 93.61
HR 93.08
J&K 93.01
KR 93.92
MH 92.13
MP 93.01
OR 92.54
UPE 88.84
UPW 87.91
BSNL ASM 80.00
BH 48.50
Idea J&K 94.90
Percentage of calls answered by
the operators (voice to voice) within 60 seconds
≥ 90%
Aircel
DLI 74.64
MH 66.56
MBI 82.91
BSNL
HR 65.00
J&K 64.00
KOL 88.30
BSNL
NE 89.00
PB 67.00
UPW 68.20
MTNL
CDMA MUM 47.52
RCOM CDMA
AP 76.76
BH 80.11
CHN 73.05
HR 73.84
KOL 82.46
KR 78.06
KTK 74.22

64
Percentage of calls answered by the operators (voice to voice)
within 60 seconds
≥ 90%
RCOM CDMA
TN 73.05
WB 82.46
RCOM GSM
AP 62.32
DLI 64.62
GUJ 69.69
HR 81.31
KR 73.26
KTK 42.58
MH 81.58
MBI 89.36
PB 74.89
RAJ 88.00
TN 32.60
RTL
ASM 89.02
BH 87.66
HP 63.60
NE 83.54
OR 82.07
TATA CDMA
KR 83.75
TN 80.09
TATA GSM
GUJ 85.19
HR 88.58
TN 78.77
Vodafone MH 86.91
%age requests for Termination / Closure of service
100%
within 7 days
Airtel AP 99.94
BSNL WB 97.21
Idea AP 98.42
TATA GSM
RAJ NR
Vodafone MH 99.16
Time taken for refund of deposits after closures
100%
within 60 days
Aircel TN 99.73
Idea AP 96.26
Idea OR 70.37
TATA GSM
RAJ NR
Vodafone GUJ 43.00
4.3 The detailed table on Service Provider wise performance of QoS
parameters for Wireless 2G Services is available at Annexure-4.1.

65
Part-II : 3G Wireless Services
4.4 The summary of performance of 3G service providers (excluding BSNL)
who have not met the benchmarks in this quarter is given in below
table.
Table 4.3: QoS Summary - 3G Wireless Service
S. No.
Parameters Benchmark
No. of CMTS Licensees not Meeting the Benchmarks
Quarter Ending, Sep, 2013
Quarter Ending, Dec, 2013
Out Of 72
(Nos.)
Out of 72
(in %)
Out Of 93
(Nos.)
Out of 93
(in %)
1
Network Availability
Node-B's Accumulated downtime (not available
for service) (%age) ≤ 2% 0 0 1 1.08%
Worst affected Node-B's due to downtime (%age)
≤ 2% 3 4.17% 4 4.30%
2
Connection Establishment (Accessibility)
Call Set-up Success Rate (within licensee's own
network) ≥ 95% 0 0 1 1.08%
SDCCH/Paging Channel and RRC Congestion
(%age) ≤ 1% 0 0 3 3.23%
TCH and Circuit Switched RAB Congestion (%age)
≤ 2% 0 0 1 1.08%
3
Connection Maintenance
(Retainability)
Call Drop and Circuit Switched Voice Drop Rate:
(%age) ≤ 2% 0 0 0 0
Worst affected cells having more than 3% TCH drop
(call drop) and Circuit Switched Voice Drop
Rate:-CBBH
≤ 3% 9 12.50% 11 11.83
%
Connections with good voice quality and Circuit
Switch Voice Quality (CSV quality)
≥ 95% 0 0 3 3.23%
4 Point of
Interconnection
Point of Interconnection (POI) Congestion
≤ 0.5%
1 1.39% 1
1.08%

66
4.5 The performance has improved in this quarter as compared to the
previous quarter in respect of the following parameters :-
a. Worst affected cells having more than 3% TCH drop (call drop)
and Circuit Switched Voice Drop Rate:-CBBH
b. Point of Interconnection (POI) Congestion
4.6 The performance has deteriorated in this quarter as compared to the
previous quarter in respect of the following parameters:-
a. Node-B's Accumulated downtime (not available for service) (%age)
b. Worst affected Node-B's due to downtime (%age)
c. Call Set-up Success Rate (within licensee’s own network)
d. SDCCH/ Paging Channel and RRC Congestion (%age)
e. TCH and Circuit Switched RAB Congestion (%age)
f. Connection with good voice quality and Circuit Switch Voice
Quality (CSV Quality)
Table 4.4: Parameter wise Analysis of Non-compliance of QoS Benchmarks for 3G Wireless Service Providers
Parameter Benchmark Service
Provider
Service
Area Performance
Node-B's Accumulated downtime (not available for
service) (%age)
≤ 2% BSNL NE 3.85
Worst affected Node-B's due to downtime (%age)
≤ 2%
Aircel BH 4.45
CHN 8.51
BSNL NE 3.00
WB 11.47
Call Set-up Success Rate
(within licensee's own network) ≥ 95% BSNL MP 64.91
SDCCH/Paging Channel and
RRC Congestion (%age) ≤ 1%
Aircel BH 1.17
BSNL NE 2.03
UPW NR

67
TCH and Circuit Switched RAB
Congestion (%age) ≤ 2% BSNL UPW NR
Worst affected cells having
more than 3% TCH drop (call drop) and Circuit Switched
Voice Drop Rate:-CBBH
≤ 3%
Aircel
ASM 9.01
BH 12.04
CHN 7.95
NE 19.78
OR 11.79
PB 20.83
TN 6.25
WB 5.69
BSNL
MP 3.28
NE 3.60
WB 3.96
Connections with good voice quality and Circuit Switch
Voice Quality (CSV quality)
≥ 95% BSNL
AS 92.87
UPE 31.67
WB 81.33
Point of Interconnection (POI) Congestion
≤ 0.5% BSNL HR 1
4.7 The details table on Service Area wise performance of QoS parameters
for 3G Wireless Services is available at Annexure-4.2.

68
Section B: Quality of Service Performance of Wireline
Service Providers
Table 4.5: QoS Summary - Wireline Service
S. No.
Parameters Benchmark
No. of license operators not meeting the benchmarks
September, 2013
December, 2013
Out of 111
In Nos.
Out of 111
In %age
Out of 111
In Nos.
Out of 111
In %age
(i) Fault incidences per 100 subs/month
≤ 5 11 9.91% 1 0.90%
(ii) a % Fault repaired by next working day
≥ 90% 13 11.71% 2 1.80%
(ii) b % Fault repaired within 3 days (for urban areas)
100% 20 18.02% 9 8.11%
(ii) c % Fault repaired within 5 days (for rural & hilly areas)
100% 14 12.61% 2 1.80%
(iii) MTTR <8Hrs 12 10.81% 0 0.00%
(iv) a Call Completion Rate (in local network)
≥ 55% 0 0.00% 0 0.00%
(iv) b Answer to Seizure Ratio (ASR) ≥ 75 % 0 0.00% 0 0.00%
(v) Point of Interconnection (POI) Congestion (No. of PoIs not meeting benchmark)
≤ 0.5% 0 0.00% 0 0.00%
(vi) Metering & billing credibility • Post-paid
≤ 0.1% 1 0.90% 2 1.80%
(vii) Metering & billing credibility • Pre-paid
≤ 0.1% 0 0.00% 0 0.00%
(viii) Resolution of billing/charging/Credit & validity complaints
100% within 4 weeks
1 0.90% 0 0.00%
(ix)
Period of applying credit/ waiver/ adjustment to customer’s account from the date of resolution of complaints
Within 1 week of
resolution of complaint
0 0.00% 0 0.00%
(x) Response time to the customer for assistance
- - - - -
(x) a Accessibility of call centre/ customer care
≥ 95% 1 0.90% 1 0.90%

69
S. No.
Parameters Benchmark
No of license operators not meeting the benchmarks
15 17.05%
September, 2013
December, 2013 meeting the benchmarks
Out of 111
In Nos.
Out of 111
In %age
Out of 111
In Nos.
Out of 111
In %age
(x) b %age of calls answered by the operators (voice to voice) within 60 seconds
≥ 90% 18 16.22% 18 16.22%
(xi) Termination / closure of service
100%
within 7 days
5 4.50% 1 0.90%
(xii) Time taken for refund of deposits after closures
100% within 60
days
0 0.00% 0 0.00%
NOTE : (1) As per “The Standards of Quality of Service of Basic Telephone Service (Wireline)
and Cellular Mobile Telephone Service Regulations, 2009 “, the service providers
who cannot measure and report Call Completion Rate (CCR) due to constraint in
network architecture may opt to measure and report their performance on Answer to Seizure Ratio (ASR). M/s RCOM have reported the ASR for 20 licensed service
areas. Therefore, 90 Licensees for CCR and 21 Licensees for ASR have been taken
into account for the analysis of these parameters.
(2) Most of the SPs have not reported for the parameter “Metering and billing credibility - pre paid” because most of the service providers are not providing pre-
paid service in Basic (Wireline) service.
4.8 The performance has improved in this quarter as compared to the
previous quarter in respect of the following parameters:-
a. Faults incidences ( No. of faults/100 Subs./month)
b. % Fault repaired by next working day
c. % of fault repaired within 3 days
d. % of faults repaired within 5 days (for rural & hilly areas)
e. Mean Time to Repair (MTTR)
f. Resolution of billing/ charging/ validity complaints
g. %age requests for Termination / Closure of service complied
within 7 days

70
4.9 The performance has deteriorated in this quarter as compared to the
previous quarter in respect of the following parameters:-
a. Metering and billing credibility - post paid (≤ 0.1%)
Table 4.6: Parameter wise Analysis of Non-compliance of QoS Benchmarks for Wireline Service Providers
Parameters and Benchmark Service
Providers
Service
Area
Parameters
not met
Faults incidences ( No. of faults/100 Subs./month)
Benchmark( ≤5 )
MTNL DEL 7.17
% of faults repaired by next working day
Benchmark( ≥ 90% )
MTNL DEL 86.89%
Vodafone OR 89.47%
% of faults repaired within 3 days Benchmark (For urban areas:
100% )
BSNL
AS 99.86%
Chhattisgarh 99.69%
HP 99.85%
Uttaranchal 99.94%
Tata Teleservices
MH 99.94%
MUM 99.98%
Quadrant PB 99.90%
MTNL DL 96.06%
MUM 98.39%
% of faults repaired within 5 days Benchmark (For rural and hilly areas:
100% ) BSNL
HP 99.87%
Uttaranchal 99.99%
Metering and Billing credibility - post paid (≤ 0.1% )
BSNL OR 0.11%
Quadrant PB 0.11%
Accessibility of call centre/ customer
care Benchmark( ≥ 95%) BSNL Chhattisgarh 94.69%

71
Percentage of calls answered by the operators (voice to voice) within 60
seconds (Benchmark≥ 90%) BSNL
AP 81.33%
BH 50.67%
Chhattisgarh 45.00%
CN 84.00%
GUJ 63.67%
HP 85.33%
HR 51.07%
J&K 68.33%
KOL 85.67%
KTK 64.67%
MH 53.00%
PB 62.33%
RAJ 20.00%
TN 79.33%
UPE 36.67%
UPW 38.67%
Uttaranchal 66.67%
WB 81.00%
%age requests for Termination /
Closure of service complied within 7 days Benchmark (100% )
MTNL MUM 96.69%
4.10 Detailed table containing QoS parameters for all the Wireline Service
Providers is given in Annexure-4.3.

72
Section C : Quality of Service Performance of Broadband Service
4.11 Out of 141 Broadband Service providers, 30 Service Providers are
having subscriber base >10,000 and these 30 Service providers share
the 98.84% of total subscriber base. This report covers performance of
30 broadband Service Providers vis-à-vis the QoS benchmarks
prescribed by TRAI, for the QE December, 2013.
Table 4.7 : Summary of Performance of Broadband Service Providers against identified parameters
S. No.
Parameters
Benchmark
No. of Licensees not Meeting the Benchmarks
Quarter Ending, September, 2013
Quarter Ending, December, 2013
Out of 108
(in Nos.)
Out of 108
(in %)
Out of 87
(in Nos.)
Out of 87
(in %)
1 Service Provisioning/ Activation Time
100% in =< 15 working
days
1.2 %age of connections provided within 15 days of registration of demand
100% 20 18.51% 9 10.34%
2 Faults Repair/ Restoration Time
2.2 % of faults repaired by next working day
>90% 23 21.29% 2 2.29%
2.3 % of faults repaired within 3 working day
=>99% 27 25.00% 7 8.04%
2.4
No. of customers to whom rent rebate is given in
minimum monthly charges or
equivalent usage allowance
for delay in fault repair
3 Billing Performance
3.3 %age of bills disputed <2% 0 0 0 0
3.4 %age of complaints resolved within 4 weeks
100%
within 4 weeks
2 1.85% 0 0
3.5 %age of cases to whom refund of deposits is made within 60 days of closures
100% within 60
days 10 9.25% 1 1.14%

73
S. No.
Parameters
Benchmark
No. of Licensees not Meeting the Benchmarks
Quarter Ending, September, 2013
Quarter Ending, December, 2013
Out of 108
(in Nos.)
Out of 108
(in %)
Out of 87
(in Nos.)
Out of 87
(in %)
4 Response Time to the
Customer for assistance
4.2 %age of calls answered by operator (Voice to voice) within 60 sec
>60% 16 14.81% 2 2.29%
4.3 %age of calls answered by operator (Voice to voice) within 90 sec
>80% 21 19.44% 4 4.59%
5 Bandwidth utilisation/
throughput
5.2 No. of Intra network links having Bandwidth utilisation >90% during peak hours (TCBH)
1 0.92% 0 0
5.4 No. of Upstream links for International connectivity having bandwidth utilisation >90% during peak hours (TCBH)
3 2.77% 3 3.44%
5.7 % International bandwidth utilization during peak hours (TCBH) (Enclose MRTG)
1 0.92% 0 0
5.8 Broadband Connection Speed available (download) from ISP node to user
>80% 1 0.92% 0 0
6 Service Availability/ Uptime (for all users) in %age
>98%
6.3 Service availability/uptime (for all users) in %age
>98% 2 1.85% 2 2.29%
7 Packet loss (for wired
broadband access) in % <1% 1 0.92% 1 1.14%
8 Network latency (for wired
broadband access)
8.1 User reference point at POP/ISP Gateway node to IGSP/NIXI
<120 ms 0 0 0 0
8.2 User reference point at ISP Gateway node to International nearest NAP port abroad (terrestrial)
<350 ms 0 0 0 0
8.3 User reference point at ISP Gateway node to International nearest NAP port abroad (satellite)
<800 ms 0 0 0 0

74
Table 4.8: Parameter-wise Analysis of non-compliance of QoS benchmarks for Broadband Service Providers
Sl. No.
Parameters Benchmarks Name of Service Provider not Meeting the Benchmark
1
Service Provisioning/ Activation Time
%age of connections provided within 15 days of registration of demand
100% in =< 15 working days
MTNL – Delhi(92.46%),Mumbai(90.11%) You Broadband - All India (95.00%), MH(97.00%), Guj(93.00%), TN(97.00%), HR(99.00%), AP(99.09%) Home Systems – Mumbai(99.00%)
2 Faults Repair /Restoration Time
% of faults repaired by next working day
>90%
MTNL – Delhi (81.83%) Atria Convergence- All India(79.00%)
% of faults repaired within
3 working day
= >99%
MTNL – Delhi(95.17%),Mumbai(96.11%)
D-Vois Broadband- All India(98.00%) Tata Communications - MH&Goa(98.00%) You Broadband - KTK(98.00%), AP(98.00%) Atria Convergence- All India (96.00%)
3 Billing Performance
%age of cases to whom refund of deposits is made within 60 days of closures
100% within 60 days
You Broadband - HR (99.00%)
4 Response Time to the Customer for assistance
%age of calls answered by operator (Voice to voice) within 60 sec
Benchmark
>60%
BSNL- All India(52.10%) You Broadband - MH(58.00%)
%age of calls answered by operator (Voice to voice) within 90 sec
Benchmark >80%
BSNL- All India (57.04%) MTNL- Mumbai(73.34%) You Broadband - MH(64.0%), Guj(76.0%)
5 Bandwidth utilisation/throughput
No. of Upstream links for International connectivity having bandwidth utilisation >90% during peak hours (TCBH)
Benchmark 0
BSNL- All India (3 links) MTNL- Delhi (1 link) Siti Cable Network Limited – All India (3 links)
Service availability/uptime (for all users) in %age
Benchmark >98%
Gujarat Telelink – All India (97.97%) Indusland Medial & Communications Ltd – All India (96.00%)
6. Packet Loss
Packet loss (for wired broadband access) in %age
Benchmark <1%
BSNL- All India (1.50%)
4.12 Detailed table containing QoS parameters for all the Broadband Service
Providers is given in Annexure-4.4.

75
Chapter 5 : Performance of Cable TV, DTH and Radio
Broadcasting Services

76
Table 5.1: Key Parameters - Broadcasting & Cable Services
S.No Parameter QE
Sep-13 QE
Dec-13
1 Number of private satellite TV channels registered with Ministry of I&B
784 782
2 Maximum number of Pay TV Channels carried by certain cable operator in non-CAS areas
135 138
3 Maximum number of Free-to-Air (FTA) TV Channels carried by certain cable operator in
non-CAS areas
110 97
4 Private FM Radio stations in operation 242 242
5 Private DTH Operators 6 6
6 Licensees of community radio stations 196 196
7 Operational community radio station 156 162
Cable TV Services
5.1 Chart 5.1 depicts the maximum number of Free-to-Air (FTA) channels,
Pay channels and local channels being carried by the Multi System
Operators (MSOs) in their network across the country. This is based on
the reports received from some of the major service providers regarding
the number of channels being carried by them in their networks
analogue and/or in digital form. These channels have been reported
across different networks of the service providers having different
combinations of pay, FTA and Local channels in their network.
5.2 The maximum number of Free-to-Air (FTA) and Pay Channels
reportedly being carried in the cable networks in non-CAS areas are 97
and 138 respectively in the QE Dec-13. However, these numbers relate
to different networks and hence cannot be added for arriving at the
total number of channels being carried in network.

77
Chart 5.1: Maximum number of TV Channels being carried by certain Cable operators in their networks
5.3 Maximum number of TV channels (Pay, FTA and Local) being carried by
any of the reported MSOs is 231 whereas in conventional analogue
form, the maximum number of channels being carried any by the
reported MSOs is 100 channels.
5.4 The digitization of cable TV sector is in progress in a phase manner in
the country. The first phase for migration to Digital Addressable Cable
TV System was 31.10.2012 and second phase was 31.03.2013. The
final schedule notified by the Government for migration to Digital
Addressable Cable TV System is given in Table-5.2.
Table 5.2 : Migration to Digital Addressable Cable TV Systems
Phase Areas Sunset date for Analog Cable TV
Phase •I Four Metros of Delhi, Mumbai, Kolkata, Chennai
31.10.2012
Phase •II Cities with a population more than one million (38 cities)
31.03.2013
Phase •III All Urban areas (Municipal
Corporation/ Municipalities) 30.09.2014
Phase •IV Rest of India 31.12.2014

78
Satellite TV Channels 5.5 The total number of private satellite TV channels permitted by the
Ministry of Information & Broadcasting, as obtained from its website, is
782 at the QE Dec-13.
5.6 There are a total of 187 pay channels as reported by broadcasters /
distributors for which rates have been taken on records. The list of
broadcasters/ distributors of pay TV channels along with the reported
rates of pay channels for Non-CAS areas is at Annexure-5.1.
DTH Services
5.7 Besides the free DTH service of Doordarshan- a public broadcaster,
there are 6 private DTH licensees, offering their services to the DTH
subscribers. As on 31.12.2013, their reported registered and active
subscriber base is 62.97 million 35.81 million respectively. The list of
DTH licensees is at Annexure-5.3.
FM Radio Services
5.8 Apart from All India Radio of Prasar Bharti - a public broadcaster, there
are 242 FM Radio stations in operation at the end of Dec-13. The list of
242 private FM Radio stations is at Annexure-5.2.
5.9 The total Advertisement Revenue during the quarter ending Sep-13 in
respect of 237 private FM Radio stations was `334.41 crore and for
quarter ending Dec-13 in respect of 238 private FM Radio stations, the
total Advertisement Revenue was `383.53 crore. The reports prepared
on the basis of reports submitted by the FM Radio service providers to
TRAI. However, the details do not pertain to the same set of service
providers.

79
Chart 5.2 : Comparative position of Revenue from FM Radio Stations as reported to TRAI
Community Radio
5.10 At the quarter ending Sep-13, out of 196 licensees of community radio
stations, 156 stations were in operation. During the QE Dec-13, no
license was issued and 6 new stations were operationalized. At the end
of Dec-13, out of 196 licensees, 162 Community Radio Stations are in
operation, as per the information received from Ministry of Information
& Broadcasting.
Table 5.3 : Status of applications for community radio station licenses
received from Ministry of Information and Broadcasting
As on 31.12.2013
Total No. of Applications Received 1292
No. of Licenses issued 196
No. of Letters of Intent Issued 461
No. of Applications rejected 580
No. of stations operational 162
Source: Ministry of Information & Broadcasting

80
Teleport Service
5.11 As per the information available on the website of the Ministry of
Information and Broadcasting, there are 90 numbers of permitted
Teleports as on 20.03.2013. A list of the permitted Teleports is at
Annexure-5.4.

81
Annexures

82
Annexure 1.1: Licensed Cellular (GSM & CDMA) Service Providers
Sl. No
Service Provider Area for which licensed with No.
UASL/UL(AS) CMTS
1 Bharti All India (22) All India except NE
North East
2 Aircel Group All India (23) All India except Chennai & TN
Chennai & Tamil Nadu
3 Reliance Communications Ltd
All India (except Assam & NE) (20)
All
4 Reliance Telecom Ltd
Kolkata, MP, WB, HP, Bihar, OR,
Assam & NE (8)
All
5 Vodafone All India (23) All
6 Tata Teleservices
All India except Assam, NE & J&K
(19)
All
7 IDEA All India except KTK
& Punjab (20)
Mumbai, TN
incl. Chennai, Kol, WB, Bihar, OR, Assam, NE
& J&K
Delhi, MH, Guj.,
AP, Kerala, Haryana, UP-W, UP-E, Raj.,
MP, HP
8 Shyam Telelink Delhi, Kol, Guj,
KTK, TN incl. Chennai, Kerala,
UP-W, Raj, WB (9)
All
9 BSNL All India (except Delhi & Mumbai) 20
All
10 MTNL Delhi, Mumbai (2) All
11 Loop Telecom Private
Ltd
Mumbai (1) Mumbai
12 Telewings
Communication Services Pvt Ltd
MH, Guj, AP, UP-W,
UP-E, Bihar (6)
All
13 Videocon
Telecommunications. Ltd.
Guj, Har, UP-W,
UP-E, MP, Bihar (6)
All
14 Spice Communications
KTK, Punjab (2) All
15 Quadrant Punjab (1) Punjab
Source: DoT and Service providers UASLs/UL( AS) 145 CMTSs 37 Total 182

83
Annexure 1.2: Wireless Subscriber Base
Sep-13 Dec-13 Sep-13 Dec-13 Sep-13 Dec-13 Sep-13 Dec-13 Sep-13 Dec-13 Sep-13 Dec-13
Andhra Pradesh 5,863,892 6,077,497 18,902,208 19,436,219 11,981,302 11,871,133 1,858,428 1,915,091 3,302,018 3,368,207 2,536,067 2,538,547
Assam 2,556,126 2,675,731 4,196,065 4,328,881 476,682 522,948 3,588,972 3,688,411 2,596,140 2,587,203
Bihar 6,747,640 6,981,540 20,518,049 21,199,942 6,164,066 6,176,803 4,677,210 4,956,916 6,123,656 6,379,154 2,694,819 2,742,005
Delhi 8,845,576 9,027,906 9,725,980 9,905,645 5,251,411 5,286,966 3,133,898 3,616,425 4,557,804 4,730,797 3,228,548 3,201,908
Gujarat 16,518,850 17,013,839 7,117,258 7,214,153 8,690,983 8,921,842 35,773 30,773 5,128,669 5,143,415 1,568,723 1,568,019
Haryana 4,681,275 4,785,526 2,337,348 2,350,583 3,882,250 3,973,386 11,092 11,092 1,614,441 1,662,566 517,621 499,680
Himachal Pradesh 534,203 525,407 2,090,603 2,136,526 513,452 504,451 742,881 791,195 1,267,067 1,306,505 198,739 200,228
Jammu & Kashmir 687,681 722,504 2,532,977 2,568,145 267,487 286,557 2,014,339 2,083,022 672,572 691,528 54 54
Karnataka 6,920,902 7,105,202 16,564,821 16,906,063 6,586,224 6,554,392 2,201,043 2,339,135 4,441,790 4,494,243 1,838,724 1,839,144
Kerala 6,489,482 6,615,300 3,599,838 3,668,530 8,466,741 8,610,522 4,883 1,183 1,130,014 1,015,151 1,201,330 1,159,647
Madhya Pradesh 4,256,579 4,526,810 10,209,163 10,421,680 16,295,647 16,569,091 22,694 22,694 9,908,435 9,876,445 2,569,387 2,592,615
Maharashtra 14,076,683 14,730,310 10,226,355 10,363,527 17,421,267 18,052,738 1,312,246 1,368,100 5,157,213 5,325,678 2,032,701 2,060,384
Mumbai 6,831,544 7,022,548 4,107,494 4,265,414 3,237,854 3,308,930 1,704,239 1,966,337 2,805,549 2,956,907 3,120,434 3,102,968
North East 1,045,692 1,112,729 2,852,276 2,987,775 328,482 326,038 2,352,414 2,345,455 992,057 1,023,042
Orissa 3,168,882 3,257,688 7,289,389 7,441,424 1,063,004 1,045,241 2,908,410 3,386,838 3,754,694 3,842,728 379,860 385,234
Punjab 4,503,245 4,586,222 7,107,014 7,276,076 5,845,234 5,779,877 1,002,025 833,256 2,689,306 2,566,045 381,418 387,985
Rajasthan 9,270,335 9,492,378 14,836,741 15,367,403 5,660,460 5,596,326 3,566,660 4,097,283 4,806,161 4,856,013 1,091,245 1,061,915
Tamil Nadu (incl. Chennai) 12,665,721 12,848,672 13,929,539 14,166,935 2,486,098 2,584,110 21,968,800 22,304,026 4,106,932 4,002,037 2,157,626 2,118,118
UP(E) 14,400,071 14,918,878 15,433,113 15,961,838 7,594,778 7,627,574 4,767,195 5,030,073 5,537,833 5,672,983 2,998,214 2,974,721
UP(W) 9,261,589 9,523,020 6,484,305 6,701,790 11,014,960 11,171,838 109,150 109,150 4,274,851 4,309,748 1,653,053 1,664,984
Kolkata 4,365,823 4,509,247 3,751,235 3,807,919 1,316,958 1,235,606 2,179,944 2,652,293 2,761,261 2,614,826 1,201,709 1,206,155
West Bengal 11,851,390 12,349,011 9,575,630 9,930,069 2,682,852 2,678,674 3,082,883 3,363,082 6,218,327 6,451,392 1,044,939 1,061,628
Total 155,543,181 160,407,965 193,387,401 198,406,537 127,228,192 128,685,043 63,245,179 66,911,830 83,846,790 84,876,613 32,415,211 32,365,939
Vodafone (GSM) Service Area
Bharti (GSM) Idea (GSM) Reliance (GSM) Reliance (CDMA)Aircel/Dishnet (GSM)

84
Annexure 1.2 (contd.)
Sep-13 Dec-13 Sep-13 Dec-13 Sep-13 Dec-13 Sep-13 Dec-13 Sep-13 Dec-13 Sep-13 Dec-13
Andhra Pradesh 4,723,236 4,802,176 1,699,113 1,681,313 9,349,505 9,604,480 87,158 76,421
Assam 1,153,377 1,143,663 95,649 95,371
Bihar 2,033,802 1,919,561 1,238,615 1,033,023 3,510,198 2,939,328 214,798 204,800
Delhi 2,869,124 2,898,651 2,519,080 2,520,737 37,612 36,467
Gujarat 2,092,574 2,266,660 535,624 515,423 4,218,468 4,297,197 109,037 104,912
Haryana 1,824,233 1,877,141 817,589 801,970 3,065,505 3,193,250 18,550 17,235
Himachal Pradesh 69,671 63,761 79,785 70,910 1,481,202 1,477,516 53,943 52,797
Jammu & Kashmir 1,166,603 1,178,974 65,798 63,072
Karnataka 5,157,911 5,294,829 689,734 644,396 6,955,768 7,072,026 145,763 140,436
Kerala 1,398,752 1,426,913 255,706 250,114 7,756,318 7,857,756 260,649 271,097
Madhya Pradesh 3,218,368 3,326,886 711,197 661,718 4,953,138 5,176,348 196,441 190,971
Maharashtra 3,446,184 3,565,541 2,627,930 2,607,010 6,477,014 6,474,446 135,438 129,233
Mumbai 2,138,244 2,197,159 1,282,546 1,274,075 1,091,980 942,465 92,434 91,853
North East 1,657,849 1,641,699 151,150 152,276
Orissa 1,774,216 1,777,597 268,993 222,674 4,467,195 3,243,644 61,835 58,832
Punjab 1,554,875 1,572,920 894,229 880,504 4,460,100 4,490,945 35,907 33,990
Rajasthan 978,466 839,646 1,445,410 1,384,505 5,720,320 5,808,585 171,097 161,098
Tamil Nadu (incl. Chennai) 4,910,490 5,038,164 393,235 373,646 9,502,797 9,606,131 102,651 98,175
UP(E) 3,570,283 3,544,089 701,993 682,508 9,910,844 10,052,307 294,068 271,481
UP(W) 2,700,299 2,754,713 1,048,448 914,218 4,514,419 4,481,829 90,971 88,949
Kolkata 2,227,895 2,267,470 646,206 573,001 2,259,186 2,242,865 22,543 21,361
West Bengal 1,314,911 1,104,517 207,051 158,095 2,893,021 2,005,493 71,908 71,229
Total 45,134,410 45,639,743 18,412,528 17,627,754 95,472,827 93,988,482 2,385,354 2,303,736 3,611,060 3,463,202 130,046 128,320
MTNL (CDMA)BSNL (GSM) Service Area
MTNL (GSM)BSNL (CDMA)Tata (GSM) Tata (CDMA)

85
Annexure 1.2 (contd.)
Sep-13 Dec-13 Sep-13 Dec-13 Sep-13 Dec-13 Sep-13 Dec-13 Sep-13 Dec-13 Sep-13 Dec-13 Sep-13 Dec-13
Andhra Pradesh 4,414,731 4,278,351 64,717,658 65,649,435
Assam 14,663,011 15,042,208
Bihar 4,398,886 4,633,099 58,321,739 59,166,171
Delhi 882,224 938,558 41,051,257 42,164,060
Gujarat 175,572 179,551 4,960,851 4,846,861 988,327 1,244,101 52,140,709 53,346,746
Haryana 1,131,142 1,326,511 19,901,046 20,498,940
Himachal Pradesh 7,031,546 7,129,296
Jammu & Kashmir 7,407,511 7,593,856
Karnataka 1,924,172 1,961,615 53,426,852 54,351,481
Kerala 436,353 449,336 31,000,066 31,325,549
Madhya Pradesh 1,125,094 1,398,950 53,466,143 54,764,208
Maharashtra 5,770,597 5,806,333 68,683,628 70,483,300
Mumbai 2,886,719 2,979,460 29,299,037 30,108,116
North East 9,379,920 9,589,014
Orissa 25,136,478 24,661,900
Punjab 1,718,915 1,953,050 6,920 2,761 30,199,188 30,363,631
Rajasthan 2,178,127 2,316,631 49,725,022 50,981,783
Tamil Nadu (incl. Chennai) 1,085,246 1,117,198 73,309,135 74,257,212
UP(E) 7,541,316 7,846,532 72,749,708 74,582,984
UP(W) 318,743 293,125 5,269,519 5,369,705 46,740,307 47,383,069
Kolkata 764,521 745,896 21,497,281 21,876,639
West Bengal 1,791,852 1,805,129 40,734,764 40,978,319
Total 9,556,810 9,807,039 1,718,915 1,953,050 6,920 2,761 2,886,719 2,979,460 32,355,900 32,780,881 3,244,563 3,969,562 870,582,006 886,297,917
TotalSistema (CDMA)Quadrant (HFCL)
(CDMA)
Service AreaVideocon (GSM)
Quadrant (HFCL)
(GSM)Telewings (GSM)Loop (GSM)

86
Annexure 1.3: Wireline Subscriber Base
Service Area
Sep-13 Dec-13 Sep-13 Dec-13 Sep-13 Dec-13 Sep-13 Dec-13 Sep-13 Dec-13
Andhra Pradesh 125,802 126,496 88,593 87,876 - - - - 165,416 166,744
Assam - - - - - -
Bihar 5,592 5,834 - - - - 10,692 11,189
Delhi 1,162,863 1,186,998 183,570 184,055 - - - - 93,159 100,738
Gujarat 55,994 56,133 96,795 95,800 - - - - 72,875 73,128
Haryana 20,742 16,477 5,440 5,759 - - - - 26,489 26,749
Himachal Pradesh 4,733 4,856 - - - - 2,446 2,448
Jammu & Kashmir - - - - - -
Karnataka 487,776 493,897 115,937 117,531 - - - - 149,472 154,795
Kerala 49,218 49,272 52,885 51,980 - - - - 11,420 11,841
Madhya Pradesh 231,995 226,033 25,563 24,879 - - - - 17,100 17,093
Maharashtra 68,774 69,319 99,408 98,502 - - - - 247,964 249,660
Mumbai 350,592 356,733 233,286 234,398 - - - - 523,465 518,645
North East - - - - -
Orissa 3,676 3,784 - - - - 6,738 6,954
Punjab 97,111 91,883 24,577 23,735 202,402 208,344 - - 17,087 17,382
Rajasthan 36,466 37,007 24,193 23,629 - - 54,351 55,850 7,935 8,381
Tamil Nadu (incl.
Chennai) 471,287 465,007 147,040 147,584 - - - - 74,523 76,902
U.P.(E) 51,230 50,791 40,525 40,807 - - - - 14,000 14,205
U.P.(W) 21,128 21,257 5,998 6,038 - - - - 8,464 8,446
Kolkata 106,901 107,463 81,377 81,744 - - - - 37,917 38,984
West Bengal 2,153 2,315 - - - - 3,755 3,764
Total 3,337,879 3,354,766 1,241,341 1,241,106 202,402 208,344 54,351 55,850 1,490,917 1,508,048
Reliance TataSistema Quadrant (HFCL)Bharti

87
Annexure 1.3 (contd.)
Service Area
Sep-13 Dec-13 Sep-13 Dec-13 Sep-13 Dec-13 Sep-13 Dec-13
Andhra Pradesh - - 1,751,010 1,679,727 5,940 6,870 2,136,761 2,067,713
Assam - - 191,564 185,797 840 990 192,404 186,787
Bihar - - 372,808 363,274 270 390 389,362 380,687
Delhi 1,598,794 1,602,073 14,490 15,840 3,052,876 3,089,704
Gujarat - - 1,496,328 1,473,942 630 1,110 1,722,622 1,700,113
Haryana - - 470,023 462,718 522,694 511,703
Himachal Pradesh - - 256,824 252,335 264,003 259,639
Jammu & Kashmir - - 189,774 189,215 189,774 189,215
Karnataka - - 1,613,635 1,566,297 4,260 5,040 2,371,080 2,337,560
Kerala - - 2,871,487 2,818,490 2,985,010 2,931,583
Madhya Pradesh - - 830,208 826,412 120 150 1,104,986 1,094,567
Maharashtra - - 1,942,678 1,913,174 3,210 3,630 2,362,034 2,334,285
Mumbai 1,944,053 1,937,858 8,190 8,790 3,059,586 3,056,424
North East - - 143,447 142,023 60 143,447 142,083
Orissa - - 348,150 338,976 360 360 358,924 350,074
Punjab - - 935,140 923,595 270 360 1,276,587 1,265,299
Rajasthan - - 852,978 834,746 510 540 976,433 960,153
Tamil Nadu (incl.
Chennai) - - 2,310,589 2,266,474 3,000 3,870 3,006,439 2,959,837
U.P.(E) - - 766,715 729,687 540 570 873,010 836,060
U.P.(W) - - 616,600 601,092 270 270 652,460 637,103
Kolkata - - 886,504 858,171 1,320 1,470 1,114,019 1,087,832
West Bengal - - 521,979 509,748 527,887 515,827
Total 3,542,847 3,539,931 19,368,441 18,935,893 44,220 50,310 29,282,398 28,894,248
Vodafone TotalMTNL BSNL
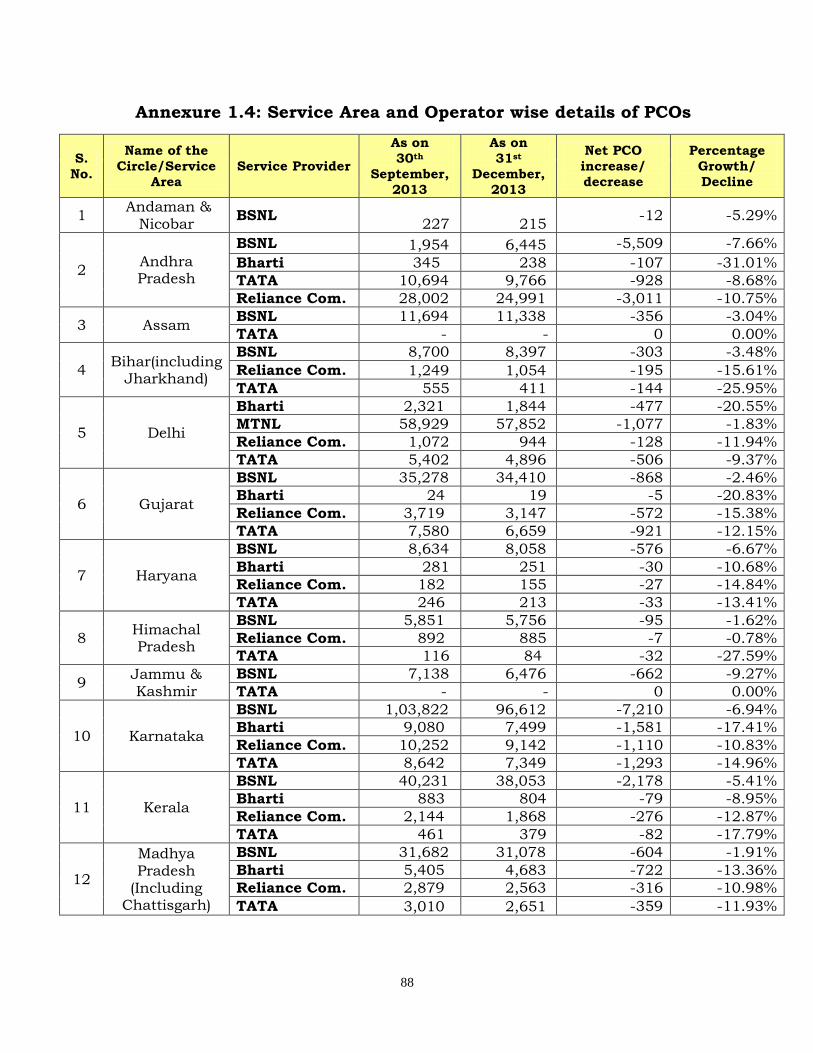
88
Annexure 1.4: Service Area and Operator wise details of PCOs
S.
No.
Name of the
Circle/Service
Area
Service Provider
As on
30th
September,
2013
As on
31st
December,
2013
Net PCO
increase/
decrease
Percentage
Growth/
Decline
1 Andaman &
Nicobar BSNL
227 215 -12 -5.29%
2 Andhra Pradesh
BSNL 1,954 6,445 -5,509 -7.66%
Bharti 345 238 -107 -31.01%
TATA 10,694 9,766 -928 -8.68%
Reliance Com. 28,002 24,991 -3,011 -10.75%
3 Assam BSNL 11,694 11,338 -356 -3.04%
TATA - - 0 0.00%
4 Bihar(including
Jharkhand)
BSNL 8,700 8,397 -303 -3.48%
Reliance Com. 1,249 1,054 -195 -15.61%
TATA 555 411 -144 -25.95%
5 Delhi
Bharti 2,321 1,844 -477 -20.55%
MTNL 58,929 57,852 -1,077 -1.83%
Reliance Com. 1,072 944 -128 -11.94%
TATA 5,402 4,896 -506 -9.37%
6 Gujarat
BSNL 35,278 34,410 -868 -2.46%
Bharti 24 19 -5 -20.83%
Reliance Com. 3,719 3,147 -572 -15.38%
TATA 7,580 6,659 -921 -12.15%
7 Haryana
BSNL 8,634 8,058 -576 -6.67%
Bharti 281 251 -30 -10.68%
Reliance Com. 182 155 -27 -14.84%
TATA 246 213 -33 -13.41%
8 Himachal Pradesh
BSNL 5,851 5,756 -95 -1.62%
Reliance Com. 892 885 -7 -0.78%
TATA 116 84 -32 -27.59%
9 Jammu & Kashmir
BSNL 7,138 6,476 -662 -9.27%
TATA - - 0 0.00%
10 Karnataka
BSNL 1,03,822 96,612 -7,210 -6.94%
Bharti 9,080 7,499 -1,581 -17.41%
Reliance Com. 10,252 9,142 -1,110 -10.83%
TATA 8,642 7,349 -1,293 -14.96%
11 Kerala
BSNL 40,231 38,053 -2,178 -5.41%
Bharti 883 804 -79 -8.95%
Reliance Com. 2,144 1,868 -276 -12.87%
TATA 461 379 -82 -17.79%
12
Madhya Pradesh
(Including Chattisgarh)
BSNL 31,682 31,078 -604 -1.91%
Bharti 5,405 4,683 -722 -13.36%
Reliance Com. 2,879 2,563 -316 -10.98%
TATA 3,010 2,651 -359 -11.93%
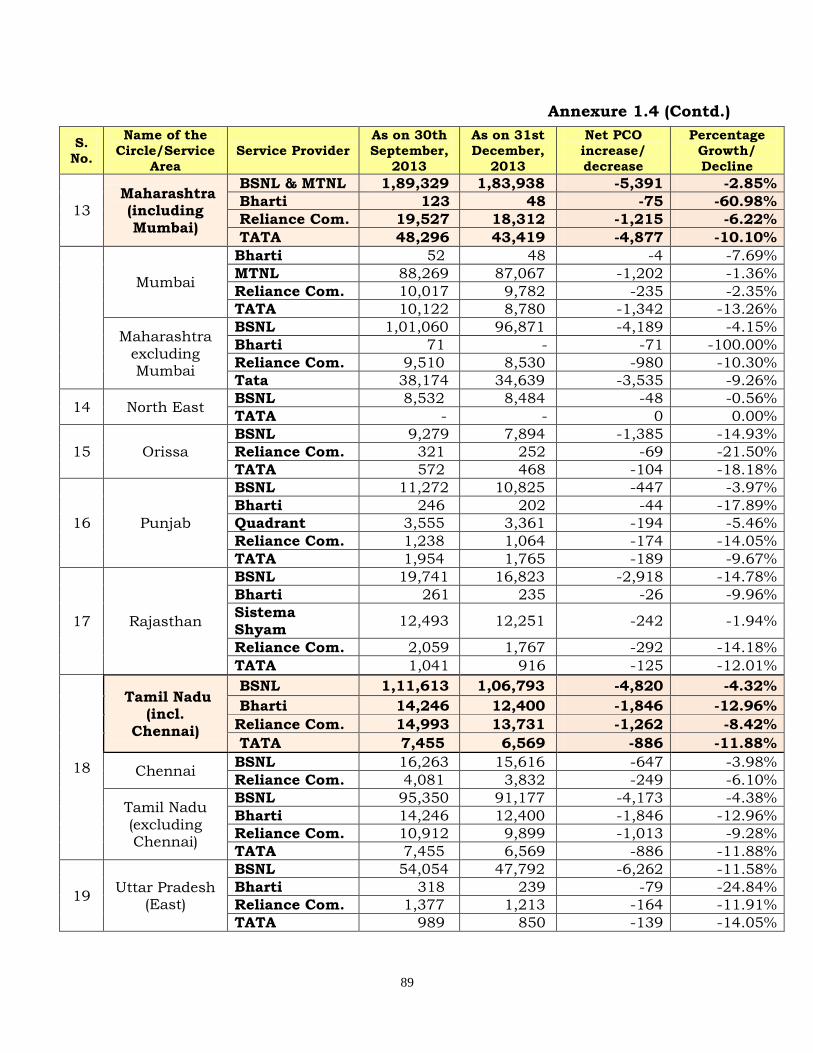
89
Annexure 1.4 (Contd.)
S.
No.
Name of the
Circle/Service
Area
Service Provider
As on 30th
September,
2013
As on 31st
December,
2013
Net PCO
increase/
decrease
Percentage
Growth/
Decline
13 Maharashtra
(including Mumbai)
BSNL & MTNL 1,89,329 1,83,938 -5,391 -2.85%
Bharti 123 48 -75 -60.98%
Reliance Com. 19,527 18,312 -1,215 -6.22%
TATA 48,296 43,419 -4,877 -10.10%
Mumbai
Bharti 52 48 -4 -7.69%
MTNL 88,269 87,067 -1,202 -1.36%
Reliance Com. 10,017 9,782 -235 -2.35%
TATA 10,122 8,780 -1,342 -13.26%
Maharashtra excluding Mumbai
BSNL 1,01,060 96,871 -4,189 -4.15%
Bharti 71 - -71 -100.00%
Reliance Com. 9,510 8,530 -980 -10.30%
Tata 38,174 34,639 -3,535 -9.26%
14 North East BSNL 8,532 8,484 -48 -0.56%
TATA - - 0 0.00%
15 Orissa
BSNL 9,279 7,894 -1,385 -14.93%
Reliance Com. 321 252 -69 -21.50%
TATA 572 468 -104 -18.18%
16 Punjab
BSNL 11,272 10,825 -447 -3.97%
Bharti 246 202 -44 -17.89%
Quadrant 3,555 3,361 -194 -5.46%
Reliance Com. 1,238 1,064 -174 -14.05%
TATA 1,954 1,765 -189 -9.67%
17 Rajasthan
BSNL 19,741 16,823 -2,918 -14.78%
Bharti 261 235 -26 -9.96%
Sistema Shyam
12,493 12,251 -242 -1.94%
Reliance Com. 2,059 1,767 -292 -14.18%
TATA 1,041 916 -125 -12.01%
18
Tamil Nadu (incl.
Chennai)
BSNL 1,11,613 1,06,793 -4,820 -4.32%
Bharti 14,246 12,400 -1,846 -12.96%
Reliance Com. 14,993 13,731 -1,262 -8.42%
TATA 7,455 6,569 -886 -11.88%
Chennai BSNL 16,263 15,616 -647 -3.98%
Reliance Com. 4,081 3,832 -249 -6.10%
Tamil Nadu (excluding Chennai)
BSNL 95,350 91,177 -4,173 -4.38%
Bharti 14,246 12,400 -1,846 -12.96%
Reliance Com. 10,912 9,899 -1,013 -9.28%
TATA 7,455 6,569 -886 -11.88%
19 Uttar Pradesh
(East)
BSNL 54,054 47,792 -6,262 -11.58%
Bharti 318 239 -79 -24.84%
Reliance Com. 1,377 1,213 -164 -11.91%
TATA 989 850 -139 -14.05%

90
Annexure 1.4 (Contd.)
S.
No.
Name of the
Circle/Service
Area
Service Provider
As on 30th
September,
2013
As on 31st
December,
2013
Net PCO
increase/
decrease
Percentage
Growth/
Decline
20
Uttar Pradesh (West)
(including Uttranchal)
BSNL 17,859 16,359 -1,500 -8.40%
Bharti 268 220 -48 -17.91%
Reliance Com. 1,000 897 -103 -10.30%
TATA 1,422 1,213 -209 -14.70%
21
West Bengal (including Kolkata)
BSNL 36,305 35,471 -834 -2.30%
Bharti 93 80 -13 -13.98%
Reliance Com. 3,092 2,769 -323 -10.45%
TATA 4,589 3,781 -808 -17.61%
Kolkata
BSNL 9,135 8,447 -688 -7.53%
Bharti 93 80 -13 -13.98%
Reliance Com. 1,452 1,313 -139 -9.57%
TATA 3,201 2,757 -444 -13.87%
West Bengal (excluding Kolkata)
BSNL 27,170 27,024 -146 -0.54%
Reliance Com. 1,640 1,456 -184 -11.22%
TATA 1,388 1,024 -364 -26.22%
TOTAL 10,89,088 10,19,586 -69,502 -6.38%

91
Annexure 1.5: Service Area & Operator wise details of Village Public Telephones
S.
No.
Name of the
Circle/Service
Area
Service Provider
As on 30th
September,
2013
As on 31st
December,
2013
Net VPT
increase/
decrease
Percentage
Growth/
Decline
1 Andaman &
Nicobar BSNL
352
352
0 0%
2 Andhra Pradesh
BSNL 25,107 25,107 0 0%
Bharti - - 0 0%
TATA 1,358 1,358 0 0%
Reliance Com. - - 0 0%
Vodafone - - 0 0%
3 Assam BSNL 24,688 24,688 0 0%
TATA - - 0 0%
4 Bihar(including
Jharkhand)
Vodafone - - 0 0%
BSNL 67,748 67,748 0 0%
Reliance Com. - - 0 0%
5 Delhi
TATA - - 0 0%
Vodafone - - 0 0%
Bharti - - 0 0%
MTNL - - 0 0%
TATA - - 0 0%
6 Gujarat
Reliance Com. - - 0 0%
Vodafone - 0 0%
BSNL 18,051 18,051 0 0%
Bharti - - 0 0%
TATA - - 0 0%
7 Haryana
Reliance Com. - - 0 0%
Vodafone - 0 0%
BSNL 6,678 6,678 0 0%
Bharti - - 0 0%
8
Himachal Pradesh
Reliance Com. - - 0 0%
TATA - - 0 0%
BSNL 17,408 17,408 0 0%
9 Jammu & Kashmir
Reliance Com. - - 0 0%
10 Karnataka
TATA - - 0 0%
BSNL 6,384 6,384 0 0%
BSNL 27,449 27,449 0 0%
Bharti - - 0 0%
TATA - - 0 0%
11 Kerala
Reliance Com. - - 0 0%
Vodafone - 0 0%
BSNL 1,372 1,372 0 0%
Bharti - - 0 0%

92
Annexure 1.5 (contd.)
S.
No.
Name of the Circle/Service
Area
Service
Provider
As on 30th September,
2013
As on 31st December,
2013
Net VPT increase/
decrease
Percentage Growth/
Decline
12
Madhya Pradesh
(Including Chattisgarh)
Reliance Com. - - 0 0%
TATA - - 0 0%
BSNL 70,309 70,309 0 0%
Bharti - - 0 0%
Reliance Com. - - 0 0%
13
Maharashtra (including Mumbai)
BSNL& MTNL 40,654 40,654 0 0%
Bharti - - 0 0%
TATA 2,595 2,595 0 0%
Reliance Com. - - 0 0%
Vodafone - - 0 0%
Mumbai
MTNL - - 0 0%
Bharti - - 0 0%
Reliance Com. - - 0 0%
TATA - - 0 0%
Vodafone - - 0 0%
Maharashtra Excluding Mumbai
BSNL 40,654 40,654 0 0%
Bharti - - 0 0%
Reliance Com. - - 0 0%
TATA 2,595 2,595 0 0%
Vodafone - - 0 0%
14 North East BSNL 13,017 13,017 0 0%
15 Orissa
BSNL 45,215 45,215 0 0%
Reliance Com. - - 0 0%
TATA - - 0 0%
Vodafone - - 0 0%
16 Punjab
BSNL 12,065 12,065 0 0%
Quadrant Televentures Ltd.
27
27
0 0%
Bharti - - 0 0%
Reliance Com. - - 0 0%
TATA - - 0 0%
Vodafone - - 0 0%
17 Rajasthan
BSNL 39,568 39,568 0 0%
Bharti - - 0 0%
Sistema Shyam
3,010 3,010 0 0%
Reliance Com. - - 0 0%
TATA - - 0 0%
Vodafone - - 0 0%

93
Annexure 1.5 (contd.)
S.
No.
Name of the
Circle/Service
Area
Service Provider
As on 30th
September,
2013
As on
31st
December,
2013
Net VPT
increase/
decrease
Percentage
Growth/
Decline
18
Tamil Nadu(including
Chennai)
BSNL 15,492 15,492 0 0%
Bharti - - 0 0%
TATA - - 0 0%
Vodafone - - 0 0%
Reliance Com. - - 0 0%
Chennai
BSNL 1,655 1,655 0 0%
Vodafone - - 0 0%
Reliance Com. - - 0 0%
Tamil Nadu (excluding Chennai)
BSNL 13,837 13,837 0 0%
TATA - - 0 0%
Reliance Com. - - 0 0%
Bharti - - 0 0%
19 U P (East)
BSNL 74,145 74,145 0 0%
Bharti - - 0 0%
Reliance Com. - - 0 0%
TATA - - 0 0%
20 UP (West)
(incl. Uttaranchal)
BSNL 39,071 39,071 0 0%
Reliance Com. - - 0 0%
Bharti - - 0 0%
TATA - - 0 0%
21
West Bengal (including Kolkata)
BSNL 37,550 37,567 17 0.05%
Bharti - -
0 0.00%
Reliance Com. - -
0 0.00%
TATA - -
0 0.00%
Kolkata
BSNL 613
613 0 0%
Bharti - - 0 0%
Reliance Com. - - 0 0%
TATA - - 0 0%
West Bengal (excluding Kolkata)
BSNL 36,937
36,954 17 0.05%
Reliance Com. - - 0 0%
TATA - - 0 0%
Total 5,89,313 5,89,330 17 0.003%

94
Annexure 1.6 : Internet Service Provider(ISP) wise Internet Subscriber base
S.NO Name of Service Provider Narrowband
(< 512 Kbps Speed)
Broadband (> 512 Kbps
Speed) Total
1 Bharti Airtel Ltd./ Bharti Hexacom Ltd. 44912289 10875161 55787450
2 Vodafone 40453634 5200273 45653907
3 Bharat Sanchar Nigam Limited 24545106 16535247 41080353
4 Reliance Communications Group 29404921 6982559 36387480
5 Idea Cellular Limited 19660190 5865448 25525638
6 Aircel 13424430 1629736 15054166
7 Uninor 6559648 0 6559648
8 Tata 201997 2863788 3065785
9 Loop 2829274 0 2829274
10 Mahanagar Telephone Nigam Ltd. 264 1758184 1758448
11 Sistema Shyam Teleservices Ltd. 33796 1294254 1328050
12 Videocon 715241 0 715241
13 Quadrant Televentures Ltd.(HFCL Infotel Ltd.) 354979 116970 471949
14 You Broadband & Cable India Private Limited 172004 211748 383752
15 Hathway Cable & Datacom Pvt. Ltd. 9823 369290 379113
16 Beam Telecom Pvt. Ltd. 0 354376 354376
17 Tikona Digital Networks Pvt Ltd 4032 247251 251283
18 Asianet Satellite Communications Ltd. 0 121504 121504
19 D-Vois Broadband Private Limited 0 74239 74239
20 Syscon Infoway Pvt Ltd 4945 68684 73629
21 Atria Convergence Technologies Pvt. Ltd. 0 70670 70670
22 Five Network Solution (India) Ltd. 0 56959 56959
23 Ortel Communication Ltd. 5368 49266 54634
24 Chandra Net Pvt. Limited 25072 25050 50122
25 Broadband Pacenet (I) Pvt. Ltd. 1145 43921 45066
26 Alliance Broadband Services Pvt. Ltd. 35724 7052 42776
27 Gujarat Telelink Pvt Ltd 5421 36056 41477
28 Citycom Networks Pvt. Ltd. 7197 33318 40515
29 Siti Cable Network Ltd. (Wire and Wireless India Ltd.) 22060 12113 34173
30 Indusind Media & Communications Limited (In2cable (I) Ltd.) 4750 23587 28337
31 Honesty Net Solutions (I) Pvt Ltd 7502 20245 27747
32 Noida Software Technology Park Ltd. 0 24160 24160
33 Meghbela Cable & Broadband Servies (P) Ltd 16915 6617 23532
34 City Online Services Ltd 12977 7900 20877
35 Digital Network associates Pvt. Ltd 7754 12971 20725
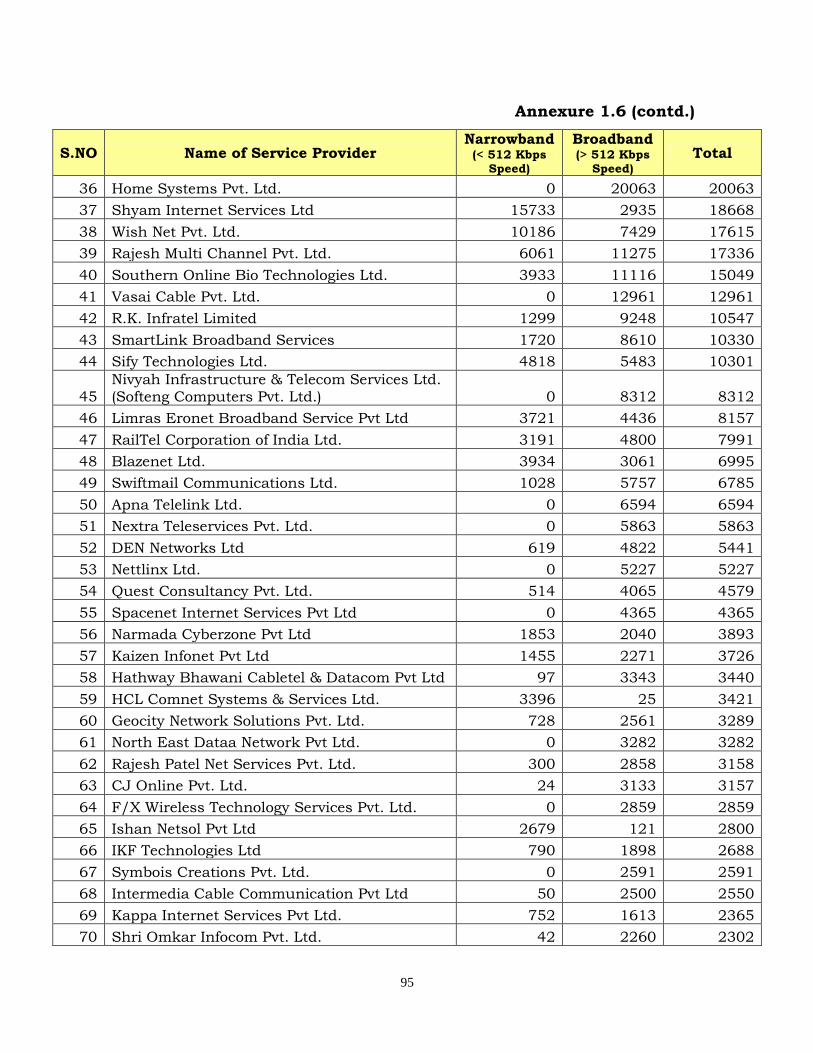
95
Annexure 1.6 (contd.)
S.NO Name of Service Provider Narrowband
(< 512 Kbps Speed)
Broadband (> 512 Kbps
Speed) Total
36 Home Systems Pvt. Ltd. 0 20063 20063
37 Shyam Internet Services Ltd 15733 2935 18668
38 Wish Net Pvt. Ltd. 10186 7429 17615
39 Rajesh Multi Channel Pvt. Ltd. 6061 11275 17336
40 Southern Online Bio Technologies Ltd. 3933 11116 15049
41 Vasai Cable Pvt. Ltd. 0 12961 12961
42 R.K. Infratel Limited 1299 9248 10547
43 SmartLink Broadband Services 1720 8610 10330
44 Sify Technologies Ltd. 4818 5483 10301
45 Nivyah Infrastructure & Telecom Services Ltd. (Softeng Computers Pvt. Ltd.) 0 8312 8312
46 Limras Eronet Broadband Service Pvt Ltd 3721 4436 8157
47 RailTel Corporation of India Ltd. 3191 4800 7991
48 Blazenet Ltd. 3934 3061 6995
49 Swiftmail Communications Ltd. 1028 5757 6785
50 Apna Telelink Ltd. 0 6594 6594
51 Nextra Teleservices Pvt. Ltd. 0 5863 5863
52 DEN Networks Ltd 619 4822 5441
53 Nettlinx Ltd. 0 5227 5227
54 Quest Consultancy Pvt. Ltd. 514 4065 4579
55 Spacenet Internet Services Pvt Ltd 0 4365 4365
56 Narmada Cyberzone Pvt Ltd 1853 2040 3893
57 Kaizen Infonet Pvt Ltd 1455 2271 3726
58 Hathway Bhawani Cabletel & Datacom Pvt Ltd 97 3343 3440
59 HCL Comnet Systems & Services Ltd. 3396 25 3421
60 Geocity Network Solutions Pvt. Ltd. 728 2561 3289
61 North East Dataa Network Pvt Ltd. 0 3282 3282
62 Rajesh Patel Net Services Pvt. Ltd. 300 2858 3158
63 CJ Online Pvt. Ltd. 24 3133 3157
64 F/X Wireless Technology Services Pvt. Ltd. 0 2859 2859
65 Ishan Netsol Pvt Ltd 2679 121 2800
66 IKF Technologies Ltd 790 1898 2688
67 Symbois Creations Pvt. Ltd. 0 2591 2591
68 Intermedia Cable Communication Pvt Ltd 50 2500 2550
69 Kappa Internet Services Pvt Ltd. 752 1613 2365
70 Shri Omkar Infocom Pvt. Ltd. 42 2260 2302
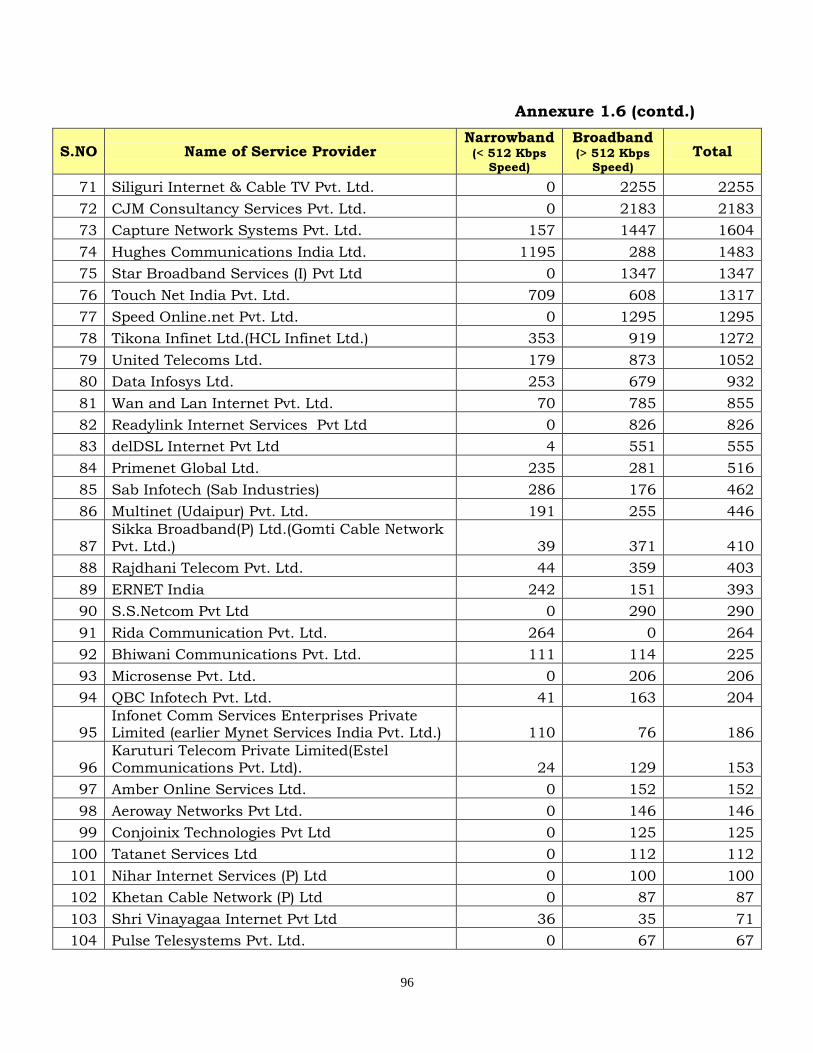
96
Annexure 1.6 (contd.)
S.NO Name of Service Provider Narrowband
(< 512 Kbps Speed)
Broadband (> 512 Kbps
Speed) Total
71 Siliguri Internet & Cable TV Pvt. Ltd. 0 2255 2255
72 CJM Consultancy Services Pvt. Ltd. 0 2183 2183
73 Capture Network Systems Pvt. Ltd. 157 1447 1604
74 Hughes Communications India Ltd. 1195 288 1483
75 Star Broadband Services (I) Pvt Ltd 0 1347 1347
76 Touch Net India Pvt. Ltd. 709 608 1317
77 Speed Online.net Pvt. Ltd. 0 1295 1295
78 Tikona Infinet Ltd.(HCL Infinet Ltd.) 353 919 1272
79 United Telecoms Ltd. 179 873 1052
80 Data Infosys Ltd. 253 679 932
81 Wan and Lan Internet Pvt. Ltd. 70 785 855
82 Readylink Internet Services Pvt Ltd 0 826 826
83 delDSL Internet Pvt Ltd 4 551 555
84 Primenet Global Ltd. 235 281 516
85 Sab Infotech (Sab Industries) 286 176 462
86 Multinet (Udaipur) Pvt. Ltd. 191 255 446
87 Sikka Broadband(P) Ltd.(Gomti Cable Network Pvt. Ltd.) 39 371 410
88 Rajdhani Telecom Pvt. Ltd. 44 359 403
89 ERNET India 242 151 393
90 S.S.Netcom Pvt Ltd 0 290 290
91 Rida Communication Pvt. Ltd. 264 0 264
92 Bhiwani Communications Pvt. Ltd. 111 114 225
93 Microsense Pvt. Ltd. 0 206 206
94 QBC Infotech Pvt. Ltd. 41 163 204
95 Infonet Comm Services Enterprises Private Limited (earlier Mynet Services India Pvt. Ltd.) 110 76 186
96 Karuturi Telecom Private Limited(Estel Communications Pvt. Ltd). 24 129 153
97 Amber Online Services Ltd. 0 152 152
98 Aeroway Networks Pvt Ltd. 0 146 146
99 Conjoinix Technologies Pvt Ltd 0 125 125
100 Tatanet Services Ltd 0 112 112
101 Nihar Internet Services (P) Ltd 0 100 100
102 Khetan Cable Network (P) Ltd 0 87 87
103 Shri Vinayagaa Internet Pvt Ltd 36 35 71
104 Pulse Telesystems Pvt. Ltd. 0 67 67

97
Annexure 1.6 (contd.)
S.NO Name of Service Provider Narrowband
(< 512 Kbps Speed)
Broadband (> 512 Kbps
Speed) Total
105 Harisree CableNet Pvt. Ltd. 0 54 54
106 NetMagic Solutions(P) Ltd. 0 53 53
107 Verizon Communications India Pvt. Ltd. (Worldcom Communications ). 0 53 53
108 Kelnet Communication Services Pvt. Ltd 0 42 42
109 Essel Shyam Communications Limited 42 0 42
110 Adya Tech One Services Pvt Ltd 0 39 39
111 AT&T Global Network Services India Private Limited 0 35 35
112 Sanyog Networks Pvt Ltd 15 20 35
113 Power Grid Corporation of India Ltd. 0 33 33
114 West Bengal Electronics Industry Development Corp. Ltd. 0 28 28
115 Nelco Ltd. 0 27 27
116 Dreamzcraft Info Solutions Pvt Ltd 2 22 24
117 STN Communication & Advertising Pvt Ltd. 0 21 21
118 Reach Network India Pvt. Ltd. 3 15 18
119 Financial Technologies Communications Ltd. 0 17 17
120 Vcare Call Centres India Pvt. Ltd. 0 14 14
121 Chemical And Metallurgical Design Co. Ltd 0 13 13
122 Novanet Ltd. 0 11 11
123 Nextgen Communications Ltd (RPG Infotech Ltd). 0 8 8
124 ABT Ltd. 0 5 5
125 Opto Network Pvt. Ltd. 0 3 3
126 VIVA Communications Pvt Ltd(Mylai Karpagambal Information Systems (P) Ltd) 0 3 3
127 Godrej Infotech Ltd. 2 1 3
128 Centre for Development of Advanced Computing, C-DAC 0 2 2
129 Devas Multimedia Pvt.Ltd. 0 2 2
130 Orange Business Services India Network Pvt. Ltd. 0 2 2
131 Compucom (I) Pvt. Ltd. 2 0 2
132 Maple PC & Peripherals Pvt Ltd 0 1 1
133 Reliance Jio Infocomm Ltd (Infotel Broadband Services Limited) 0 1 1
134 L&T Finance Ltd.(L&T Netcom Ltd.) 1 0 1
135 Advanced Financial Services Pvt Ltd 0 0 0

98
Annexure 1.6 (contd.)
S.NO Name of Service Provider Narrowband
(< 512 Kbps Speed)
Broadband (> 512 Kbps
Speed) Total
136 Kerala State Electronics Development Corp Ltd.(Keltron) 0 0 0
137 Manipal Ecommerce Ltd. 0 0 0
138 Pan India Network Infravest Pvt. Ltd. 0 0 0
139 Reliance Wimax Limited (Gateway Systems (I) Ltd) 0 0 0
140 Spectrum Softech Solutions Pvt. Ltd. 0 0 0
141 Tata Internet Services Ltd. 0 0 0
142 Trikon Electronics Pvt. Ltd. 0 0 0
143 Urban Communications Infrastructure Pvt Ltd. 0 0 0
Total 183511991 55196350 238708341
Total (in Million) 183.51 55.20 238.71

99
Annexure 1.7: List of Internet Service Providers Providing Internet
Telephony Service
S.No Name of the Service Providers
1 Alliance Broadband Services Pvt. Ltd.
2 Apna Telelink Ltd.
3 Asianet Satellite Communications Ltd.
4 Bharat Sanchar Nigam Ltd.
5 Blazenet Ltd.
6 City Online Services Ltd
7 Citycom Networks Pvt. Ltd.
8 Cordia LT Communications Pvt Ltd
9 Data Infosys Ltd.
10 delDSL Internet Pvt Ltd
11 Digital2Virtual ISP Pvt. Ltd.
12 Dishnet Wireless Ltd
13 Fast Lynx Internet Service Pvt Ltd.
14 Indusind Media & Communications Limited (In2cable (I) Ltd.)
15 Karuturi Telecom Private Limited (Estel Communications Pvt. Ltd).
16 Manipal Ecommerce Ltd.
17 My Own Infotech Pvt. Ltd
18 Novanet Ltd.
19 Oistel Telecom Pvt. Ltd.
20 Opto Network Pvt. Ltd.
21 Ortel Communication Ltd.
22 Pipetel Communications Pvt. Ltd.
23 Pulse Telesystems Pvt. Ltd.
24 QBC Infotech Pvt. Ltd.
25 Sify Technologies Ltd.
26 Swiftmail Communications Ltd.
27 Tata Communications Limited
28 Tata Teleservices(Maharashtra) Ltd.
29 Trikon Electronics Pvt. Ltd.
30 Tulip Telecom Limited (Tulip IT Services Ltd.)
31 VIVA Communications Pvt Ltd (Mylai Karpagambal Information Systems (P) Ltd)
32 World Phone Internet Services Pvt Ltd
33 You Broadband & Cable India Private Limited

100
Annexure 1.8: Service Area wise PMRTS subscriber Base
SNo. Operative Area Service Providers Subscriber Base
30.9.2013 31.12.2013
1 Delhi(Faridabad/ Gurgaon)
Arya Omnitalk Radio Trunking Servives Pvt.Ltd.
2652 2617
Procall(Delhi) 3910 4103
Procall (Faridabad) 452 368
Procall (Gurgaon) 871 864
Total 7885 7952
2 Mumbai(Navi Mumbai/Vashi)
Arya Omnitalk Radio Trunking Services Pvt.Ltd.
5234 6404
Smartalk (Mumbai) 446 513
Smartalk (Vashi) 65 65
Bhilwara Telenet(Mumbai) 1101 707
Total 6846 7689
3 Kolkata Arya Omnitalk Radio Trunking Services Pvt.Ltd.
1845 1825
Total 1845 1825
4 TN(Chennai) Arya Omnitalk Radio Trunking Services Pvt.Ltd.
4828 4649
Quick Calls 259 451
Total 5087 5100
5 Karnataka (Bangalore) Arya Omnitalk Radio Trunking Services Pvt.Ltd.
5122 5290
Quick Calls 507 469
India Satcom 0 0
Total 5629 5759
6 Andhra Pradesh (Vishakhapatnam)
Arya Omnitalk Radio Trunking Services Pvt.Ltd.
2838 2873
Quick Calls 1784 1833
Total 4622 4706
7 Madhya Pradesh ( Indore)
Arya Omnitalk Radio Trunking Services Pvt.Ltd.
732 755
Total 732 755
8 Rajasthan (Jaipur) Procall 507 530
Total 507 530
9 Gujrat(Ahmedabad/ Surat/Baroda/
Bharuch)
Arya Omnitalk Radio Trunking Services Pvt.Ltd.
4038 4048
Total 4038 4048
10 Maharashtra (Pune) Smartalk 503 483
Arya Omnitalk Radio Trunking Services Pvt.Ltd.
1205 1178
Total 1708 1661
Grand Total 38899 40025
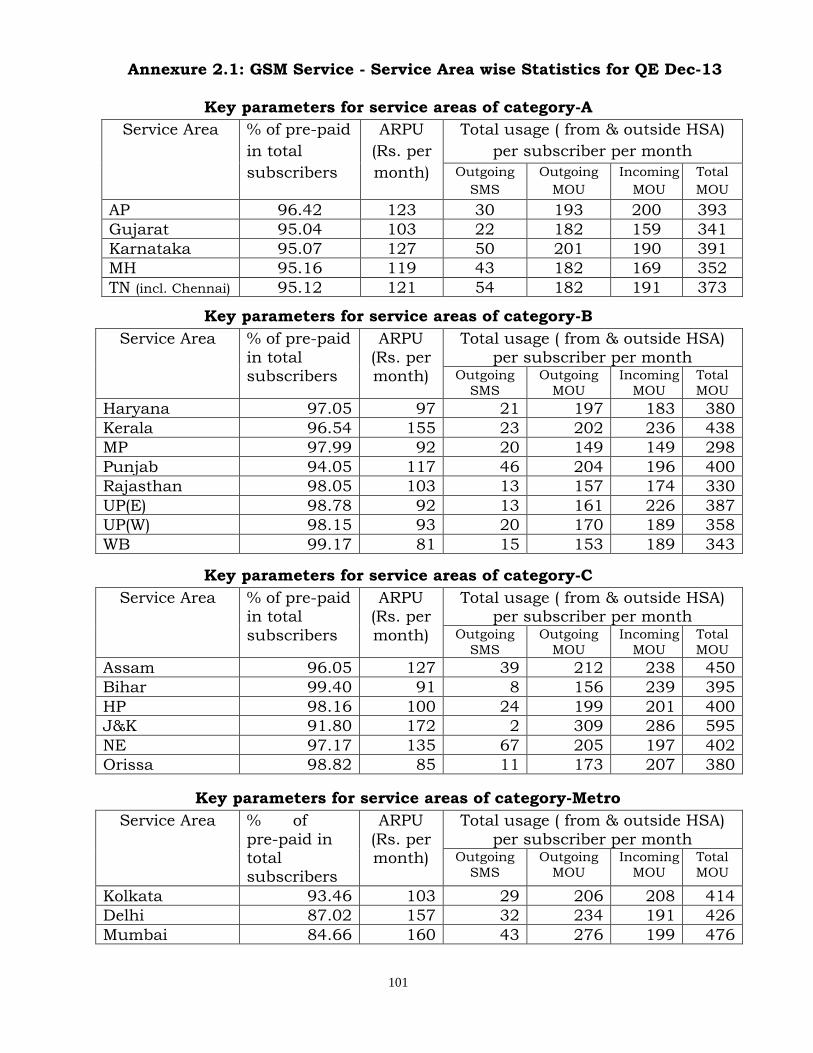
101
Annexure 2.1: GSM Service - Service Area wise Statistics for QE Dec-13
Key parameters for service areas of category-A
Service Area % of pre-paid
in total
subscribers
ARPU
(Rs. per
month)
Total usage ( from & outside HSA)
per subscriber per month
Outgoing
SMS
Outgoing
MOU
Incoming
MOU
Total
MOU
AP 96.42 123 30 193 200 393
Gujarat 95.04 103 22 182 159 341
Karnataka 95.07 127 50 201 190 391
MH 95.16 119 43 182 169 352
TN (incl. Chennai) 95.12 121 54 182 191 373
Key parameters for service areas of category-B
Service Area % of pre-paid
in total subscribers
ARPU
(Rs. per month)
Total usage ( from & outside HSA)
per subscriber per month Outgoing
SMS
Outgoing
MOU
Incoming
MOU
Total
MOU
Haryana 97.05 97 21 197 183 380
Kerala 96.54 155 23 202 236 438
MP 97.99 92 20 149 149 298
Punjab 94.05 117 46 204 196 400
Rajasthan 98.05 103 13 157 174 330
UP(E) 98.78 92 13 161 226 387
UP(W) 98.15 93 20 170 189 358
WB 99.17 81 15 153 189 343
Key parameters for service areas of category-C
Service Area % of pre-paid in total
subscribers
ARPU (Rs. per
month)
Total usage ( from & outside HSA) per subscriber per month
Outgoing
SMS
Outgoing
MOU
Incoming
MOU
Total
MOU
Assam 96.05 127 39 212 238 450
Bihar 99.40 91 8 156 239 395
HP 98.16 100 24 199 201 400
J&K 91.80 172 2 309 286 595
NE 97.17 135 67 205 197 402
Orissa 98.82 85 11 173 207 380
Key parameters for service areas of category-Metro
Service Area % of
pre-paid in total subscribers
ARPU
(Rs. per month)
Total usage ( from & outside HSA)
per subscriber per month Outgoing
SMS
Outgoing
MOU
Incoming
MOU
Total
MOU
Kolkata 93.46 103 29 206 208 414
Delhi 87.02 157 32 234 191 426
Mumbai 84.66 160 43 276 199 476

102
Annexure 2.2: CDMA Full Mobility Service - Service Area wise Statistics for QE Dec-13
Key parameters for service areas of Category A
Service Area % of Prepaid
in total
subscribers
ARPU (Rs. per
month)
Total usage ( from & outside HSA) per subscriber per month
Outgoing SMS
Outgoing MOU
Incoming MOU
Total MOU
MH 89 125 21 143 127 269
Gujarat 83 118 32 136 106 242
TN (incl. Chennai) 83 153 17 142 109 251
Karnataka 88 125 11 140 128 268
AP 88 125 20 152 143 295
Key parameters for service areas of Category B
Service Area % of Prepaid
in total
subscribers
ARPU (Rs. per
month)
Total usage ( from & outside HSA) per subscriber per month
Outgoing
SMS
Outgoing
MOU
Incoming
MOU
Total
MOU
WB 99 57 6 150 167 317
Rajasthan 95 71 13 195 157 352
UP(E) 96 66 18 100 115 215
MP 95 69 15 112 130 242
Kerala 87 108 12 116 92 209
UP(W) 95 70 20 110 126 236
Haryana 91 71 17 147 129 275
Punjab 81 123 17 165 104 269
Key parameters for service areas of Category C
Service Area
% of Prepaid
in total subscribers
ARPU
(Rs. per month)
Total usage ( from & outside HSA) per subscriber per month
Outgoing
SMS
Outgoing
MOU
Incoming
MOU
Total
MOU
Orissa 92 84 10 126 159 284
Bihar 97 70 10 112 162 273
HP 86 119 8 131 112 243
J&K 63 100 21 103 88 191
North East NA
Assam NA
Key parameters for service areas of Category Metro
Service Area % of Prepaid
in total subscribers
ARPU (Rs. per month)
Total usage ( from & outside HSA) per
subscriber per month Outgoing
SMS
Outgoing
MOU
Incoming
MOU
Total
MOU
Kolkata 90 102 9 145 150 305
Delhi 87 125 22 174 126 304
Mumbai 81 147 26 126 95 213

103
Annexure 4.1: Performance of QoS Parameters for Cellular Mobile 2G Service
POI
BTSs
Acc
umul
ated
dow
ntim
e (n
ot a
vaila
ble
for s
ervi
ce)
(%ag
e)
Wor
st a
ffec
ted
BTSs
due
to d
ownt
ime
(%ag
e)
Call
Set-
up S
ucce
ss R
ate
(wit
hin
licen
see'
s ow
n
netw
ork)
SDCC
H/
Pagi
ng C
hl.
Cong
esti
on (
%ag
e)
TCH
Con
gest
ion
(%ag
e)
Call
Dro
p Ra
te (%
age)
Wor
st a
ffec
ted
cells
havi
ng m
ore
than
3%
TCH
dro
p
(cal
l dro
p) ra
te (%
age)
Conn
ecti
on w
ith
good
voic
e qu
alit
y
Poin
t of I
nter
conn
ecti
on
(PO
I) C
onge
stio
n (N
o. o
f
POIs
not
mee
ting
the
benc
hmar
k)
(Ave
rage
d ov
er a
per
iod
of q
uart
er )
Met
erin
g an
d bi
lling
cred
ibili
ty -
pos
t pai
d
Met
erin
g an
d bi
lling
cred
ibili
ty -
pre
paid
Reso
luti
on o
f
billi
ng/c
harg
ing/
valid
ity
com
plai
nts
Peri
od o
f app
lyin
g
cred
it/
wai
ver/
adju
stm
ent t
o
cust
omer
’s a
ccou
nt fr
om
the
date
of r
esol
utio
n of
com
plai
nts
Acc
essi
bilit
y of
cal
l
cent
re/
cust
omer
car
e
Perc
enta
ge o
f cal
ls
answ
ered
by
the
oper
ator
s (v
oice
to
voic
e) w
ithi
n 60
sec
onds
%ag
e re
ques
ts fo
r
Term
inat
ion
/ Cl
osur
e of
serv
ice
Tim
e ta
ken
for r
efun
d of
depo
sits
aft
er c
losu
res
≤ 2% ≤ 2% ≥ 95% ≤ 1% ≤ 2% ≤ 2% ≤ 3% ≥ 95% ≤ 0.5% ≤ 0.1% ≤ 0.1%100% within 4
weeks
within 1 week of
resolution of complaint≥ 95% ≥ 90%
100% within
7 days
100% within
60 days
Aircel 0.05 0.02 99.04 0.07 0.16 0.93 1.41 97.80 0 0.00 0.00 100.00 100.00 97.69 90.68 100.00 100.00
Airtel 0.01 0.00 99.30 0.08 0.06 0.40 0.55 98.85 0 0.02 0.00 100.00 100.00 100.00 94.00 99.94 100.00
BSNL 1.70 1.93 98.00 0.47 1.80 0.57 2.07 98.00 0 0.00 0.00 100.00 100.00 97.00 96.00 100.00 100.00
Idea 0.02 0.01 99.99 0.49 0.67 0.77 2.34 96.86 0 0.11 0.00 100.00 100.00 99.52 95.10 98.42 96.26
RCOM CDMA 0.20 0.45 99.14 0.00 0.02 0.11 0.08 99.69 0 0.10 0.04 100.00 100.00 98.13 76.76 100.00 100.00
RCOM GSM 0.23 0.81 99.71 0.06 0.04 0.38 0.06 98.87 0 0.09 0.10 100.00 100.00 98.83 62.32 100.00 100.00
TATA CDMA 0.02 0.00 98.82 0.01 0.39 0.37 1.04 98.36 0 0.00 0.00 100.00 100.00 99.19 94.40 100.00 100.00
TATA GSM 0.11 0.50 98.48 0.04 0.28 0.69 2.60 98.12 0 0.00 0.00 100.00 100.00 99.53 91.05 100.00 100.00
Uninor 0.25 0.96 98.37 0.24 0.28 1.02 2.05 97.67 0 NA 0.00 100.00 NA 95.54 92.80 NA NA
Vodafone 0.05 0.27 99.77 0.07 0.23 0.59 2.38 99.02 0 0.06 0.07 99.94 100.00 100.00 97.90 100.00 100.00
Aircel 0.86 6.00 96.32 0.79 1.61 0.88 3.94 93.77 0 0.03 0.02 100.00 100.00 76.02 91.19 100.00 100.00
Airtel 0.22 1.00 98.59 0.16 0.46 1.21 1.13 98.31 0 0.01 0.00 100.00 100.00 100.00 94.00 100.00 100.00
BSNL 2.70 6.30 92.67 0.77 1.43 2.17 5.57 91.33 0 0.00 0.00 100.00 100.00 80.00 100.00 100.00 100.00
Idea 0.70 0.91 98.90 0.06 0.70 1.44 2.19 95.77 0 0.00 0.00 100.00 100.00 97.13 99.32 100.00 100.00
RTL 0.30 1.58 98.64 0.02 0.14 0.65 0.08 98.36 0 0.10 0.10 100.00 100.00 98.78 89.02 100.00 100.00
Vodafone 0.84 1.97 99.40 0.15 0.60 0.60 2.70 97.89 0 0.08 0.01 100.00 100.00 99.89 96.44 100.00 100.00
Aircel 1.16 4.26 96.72 0.25 0.99 0.51 3.10 95.10 0 0.00 0.00 100.00 100.00 94.30 92.73 100.00 100.00
Airtel 0.10 0.25 98.70 0.19 0.24 0.50 1.90 99.02 0 0.01 0.01 100.00 99.97 99.00 96.00 100.00 100.00
BSNL 2.00 1.77 97.50 0.50 0.82 1.53 2.43 95.63 0 0.05 0.05 100.00 100.00 48.50 97.00 100.00 100.00
Idea 0.76 1.75 98.61 0.49 0.91 1.24 2.75 96.88 0 0.02 0.02 100.00 100.00 99.52 99.41 100.00 100.00
RCOM CDMA 0.37 0.91 98.33 0.00 0.00 0.26 0.23 99.80 0 0.09 0.10 100.00 100.00 98.88 80.11 100.00 100.00
RTL 0.11 0.55 96.57 0.17 0.07 0.47 0.12 97.88 0 0.09 0.10 100.00 100.00 98.67 87.66 100.00 100.00
TATA CDMA 0.17 0.87 97.93 0.00 0.38 0.93 2.78 98.22 0 0.00 0.00 100.00 100.00 99.44 96.81 100.00 100.00
TATA GSM 0.02 0.00 99.13 0.08 0.07 0.45 0.24 97.92 0 0.00 0.01 100.00 100.00 96.31 95.18 100.00 100.00
Uninor 0.23 0.65 97.27 0.46 1.85 0.64 1.96 96.72 0 NA 0.01 100.00 NA 96.99 94.11 NA NA
Vodafone 0.46 1.85 99.61 0.12 0.39 0.78 2.33 97.57 0 0.04 0.01 100.00 100.00 100.00 97.50 100.00 100.00
Aircel 0.64 4.57 97.97 0.17 0.80 0.51 0.74 98.00 0 0.00 0.00 100.00 100.00 91.66 90.04 100.00 100.00
Airtel 0.02 0.00 99.93 0.01 0.01 0.16 0.08 99.73 0 0.03 0.00 100.00 100.00 100.00 92.00 100.00 100.00
BSNL 0.40 1.60 100.00 0.23 0.37 0.70 1.27 100.00 0 0.10 0.10 100.00 100.00 100.00 93.00 100.00 100.00
Idea 0.01 0.00 99.66 0.07 0.11 0.57 0.58 97.20 0
RCOM CDMA 0.10 0.03 100.00 100.00 99.21 73.05 100.00 100.00
RCOM GSM*
TATA CDMA 0.05 0.00 99.32 0.00 0.04 0.25 0.85 98.40 0
TATA GSM 0.04 0.00 98.21 0.01 0.02 0.83 0.81 98.59 0
Vodafone 0.02 0.05 99.66 0.02 0.34 0.50 1.14 98.81 0 0.06 0.01 100.00 100.00 100.00 96.57 100.00 100.00
Incl. In TN
Incl. In TN
Incl. In TN
Incl. In TN
Incl. In TN
Incl. In TN
AP
ASM
BH
CHN
Performance Monitoring Report on Quality of Service of Cellular Mobile Serivce (2G) Providers for quarter ending, December , 2013
Nam
e of
Ser
vice
Are
a
Nam
e of
Ser
vice
Pro
vide
rNetwork Related Parameters Customer Service Quality Parameters
Network AvailabilityConnection Establishment
(Accessibility)
Connection Maintenance
(Retainability) Metering and Billing
Response time to the
customer for
assistance
Termination / closure of
service
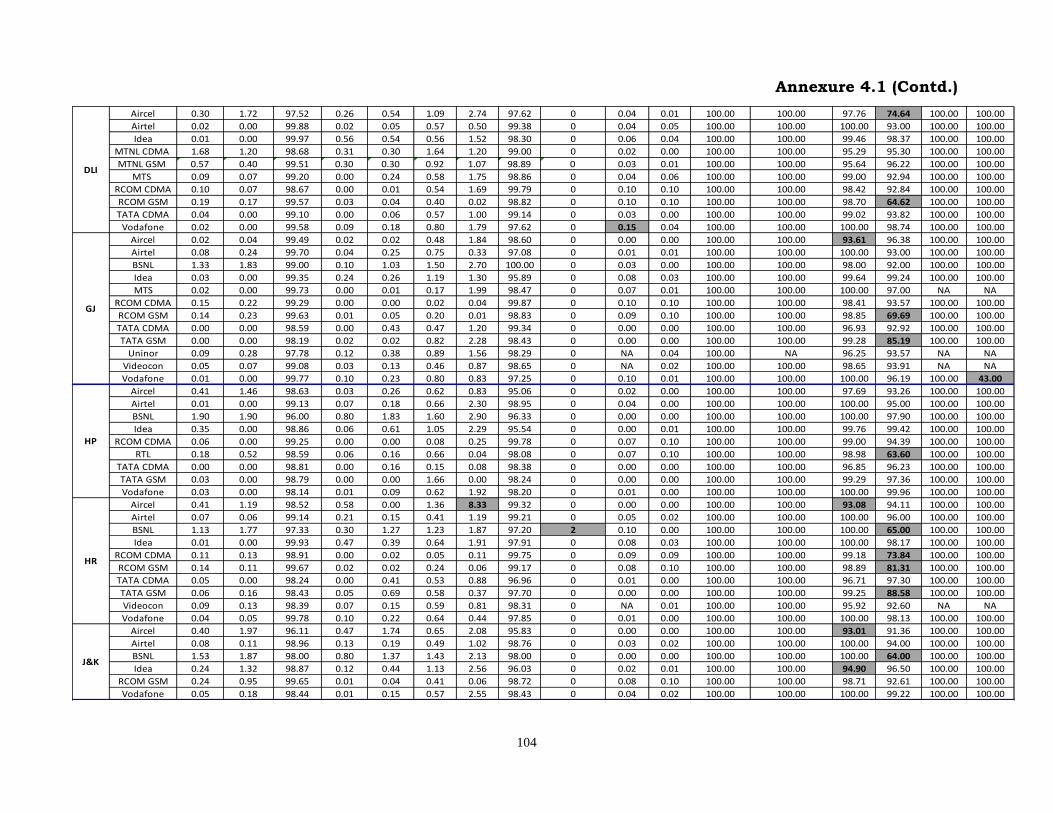
104
Annexure 4.1 (Contd.)
Aircel 0.30 1.72 97.52 0.26 0.54 1.09 2.74 97.62 0 0.04 0.01 100.00 100.00 97.76 74.64 100.00 100.00
Airtel 0.02 0.00 99.88 0.02 0.05 0.57 0.50 99.38 0 0.04 0.05 100.00 100.00 100.00 93.00 100.00 100.00
Idea 0.01 0.00 99.97 0.56 0.54 0.56 1.52 98.30 0 0.06 0.04 100.00 100.00 99.46 98.37 100.00 100.00
MTNL CDMA 1.68 1.20 98.68 0.31 0.30 1.64 1.20 99.00 0 0.02 0.00 100.00 100.00 95.29 95.30 100.00 100.00
MTNL GSM 0.57 0.40 99.51 0.30 0.30 0.92 1.07 98.89 0 0.03 0.01 100.00 100.00 95.64 96.22 100.00 100.00
MTS 0.09 0.07 99.20 0.00 0.24 0.58 1.75 98.86 0 0.04 0.06 100.00 100.00 99.00 92.94 100.00 100.00
RCOM CDMA 0.10 0.07 98.67 0.00 0.01 0.54 1.69 99.79 0 0.10 0.10 100.00 100.00 98.42 92.84 100.00 100.00
RCOM GSM 0.19 0.17 99.57 0.03 0.04 0.40 0.02 98.82 0 0.10 0.10 100.00 100.00 98.70 64.62 100.00 100.00
TATA CDMA 0.04 0.00 99.10 0.00 0.06 0.57 1.00 99.14 0 0.03 0.00 100.00 100.00 99.02 93.82 100.00 100.00
Vodafone 0.02 0.00 99.58 0.09 0.18 0.80 1.79 97.62 0 0.15 0.04 100.00 100.00 100.00 98.74 100.00 100.00
Aircel 0.02 0.04 99.49 0.02 0.02 0.48 1.84 98.60 0 0.00 0.00 100.00 100.00 93.61 96.38 100.00 100.00
Airtel 0.08 0.24 99.70 0.04 0.25 0.75 0.33 97.08 0 0.01 0.01 100.00 100.00 100.00 93.00 100.00 100.00
BSNL 1.33 1.83 99.00 0.10 1.03 1.50 2.70 100.00 0 0.03 0.00 100.00 100.00 98.00 92.00 100.00 100.00
Idea 0.03 0.00 99.35 0.24 0.26 1.19 1.30 95.89 0 0.08 0.03 100.00 100.00 99.64 99.24 100.00 100.00
MTS 0.02 0.00 99.73 0.00 0.01 0.17 1.99 98.47 0 0.07 0.01 100.00 100.00 100.00 97.00 NA NA
RCOM CDMA 0.15 0.22 99.29 0.00 0.00 0.02 0.04 99.87 0 0.10 0.10 100.00 100.00 98.41 93.57 100.00 100.00
RCOM GSM 0.14 0.23 99.63 0.01 0.05 0.20 0.01 98.83 0 0.09 0.10 100.00 100.00 98.85 69.69 100.00 100.00
TATA CDMA 0.00 0.00 98.59 0.00 0.43 0.47 1.20 99.34 0 0.00 0.00 100.00 100.00 96.93 92.92 100.00 100.00
TATA GSM 0.00 0.00 98.19 0.02 0.02 0.82 2.28 98.43 0 0.00 0.00 100.00 100.00 99.28 85.19 100.00 100.00
Uninor 0.09 0.28 97.78 0.12 0.38 0.89 1.56 98.29 0 NA 0.04 100.00 NA 96.25 93.57 NA NA
Videocon 0.05 0.07 99.08 0.03 0.13 0.46 0.87 98.65 0 NA 0.02 100.00 100.00 98.65 93.91 NA NA
Vodafone 0.01 0.00 99.77 0.10 0.23 0.80 0.83 97.25 0 0.10 0.01 100.00 100.00 100.00 96.19 100.00 43.00
Aircel 0.41 1.46 98.63 0.03 0.26 0.62 0.83 95.06 0 0.02 0.00 100.00 100.00 97.69 93.26 100.00 100.00
Airtel 0.01 0.00 99.13 0.07 0.18 0.66 2.30 98.95 0 0.04 0.00 100.00 100.00 100.00 95.00 100.00 100.00
BSNL 1.90 1.90 96.00 0.80 1.83 1.60 2.90 96.33 0 0.00 0.00 100.00 100.00 100.00 97.90 100.00 100.00
Idea 0.35 0.00 98.86 0.06 0.61 1.05 2.29 95.54 0 0.00 0.01 100.00 100.00 99.76 99.42 100.00 100.00
RCOM CDMA 0.06 0.00 99.25 0.00 0.00 0.08 0.25 99.78 0 0.07 0.10 100.00 100.00 99.00 94.39 100.00 100.00
RTL 0.18 0.52 98.59 0.06 0.16 0.66 0.04 98.08 0 0.07 0.10 100.00 100.00 98.98 63.60 100.00 100.00
TATA CDMA 0.00 0.00 98.81 0.00 0.16 0.15 0.08 98.38 0 0.00 0.00 100.00 100.00 96.85 96.23 100.00 100.00
TATA GSM 0.03 0.00 98.79 0.00 0.00 1.66 0.00 98.24 0 0.00 0.00 100.00 100.00 99.29 97.36 100.00 100.00
Vodafone 0.03 0.00 98.14 0.01 0.09 0.62 1.92 98.20 0 0.01 0.00 100.00 100.00 100.00 99.96 100.00 100.00
Aircel 0.41 1.19 98.52 0.58 0.00 1.36 8.33 99.32 0 0.00 0.00 100.00 100.00 93.08 94.11 100.00 100.00
Airtel 0.07 0.06 99.14 0.21 0.15 0.41 1.19 99.21 0 0.05 0.02 100.00 100.00 100.00 96.00 100.00 100.00
BSNL 1.13 1.77 97.33 0.30 1.27 1.23 1.87 97.20 2 0.10 0.00 100.00 100.00 100.00 65.00 100.00 100.00
Idea 0.01 0.00 99.93 0.47 0.39 0.64 1.91 97.91 0 0.08 0.03 100.00 100.00 100.00 98.17 100.00 100.00
RCOM CDMA 0.11 0.13 98.91 0.00 0.02 0.05 0.11 99.75 0 0.09 0.09 100.00 100.00 99.18 73.84 100.00 100.00
RCOM GSM 0.14 0.11 99.67 0.02 0.02 0.24 0.06 99.17 0 0.08 0.10 100.00 100.00 98.89 81.31 100.00 100.00
TATA CDMA 0.05 0.00 98.24 0.00 0.41 0.53 0.88 96.96 0 0.01 0.00 100.00 100.00 96.71 97.30 100.00 100.00
TATA GSM 0.06 0.16 98.43 0.05 0.69 0.58 0.37 97.70 0 0.00 0.00 100.00 100.00 99.25 88.58 100.00 100.00
Videocon 0.09 0.13 98.39 0.07 0.15 0.59 0.81 98.31 0 NA 0.01 100.00 100.00 95.92 92.60 NA NA
Vodafone 0.04 0.05 99.78 0.10 0.22 0.64 0.44 97.85 0 0.01 0.00 100.00 100.00 100.00 98.13 100.00 100.00
Aircel 0.40 1.97 96.11 0.47 1.74 0.65 2.08 95.83 0 0.00 0.00 100.00 100.00 93.01 91.36 100.00 100.00
Airtel 0.08 0.11 98.96 0.13 0.19 0.49 1.02 98.76 0 0.03 0.02 100.00 100.00 100.00 94.00 100.00 100.00
BSNL 1.53 1.87 98.00 0.80 1.37 1.43 2.13 98.00 0 0.00 0.00 100.00 100.00 100.00 64.00 100.00 100.00
Idea 0.24 1.32 98.87 0.12 0.44 1.13 2.56 96.03 0 0.02 0.01 100.00 100.00 94.90 96.50 100.00 100.00
RCOM GSM 0.24 0.95 99.65 0.01 0.04 0.41 0.06 98.72 0 0.08 0.10 100.00 100.00 98.71 92.61 100.00 100.00
Vodafone 0.05 0.18 98.44 0.01 0.15 0.57 2.55 98.43 0 0.04 0.02 100.00 100.00 100.00 99.22 100.00 100.00
DLI
GJ
HR
HP
J&K

105
Annexure 4.1 (Contd.)
Aircel 0.45 1.97 97.37 0.41 0.36 0.75 0.73 97.46 0 0.05 0.00 100.00 100.00 99.77 93.91 100.00 100.00
Airtel 0.03 0.03 99.65 0.05 0.05 0.75 0.17 97.66 0 0.01 0.00 100.00 100.00 100.00 95.00 100.00 100.00
BSNL 1.23 1.90 99.00 0.47 0.80 0.80 2.90 99.87 0 0.10 0.40 65.90 66.00 96.00 88.30 100.00 100.00
Idea 0.45 0.63 99.58 0.06 0.06 0.34 0.32 97.80 0 0.07 0.01 100.00 100.00 99.47 97.68 100.00 100.00
MTS 0.19 0.00 99.72 0.00 0.05 0.53 0.97 99.53 0 0.09 0.03 100.00 100.00 100.00 91.00 100.00 NA
RCOM CDMA 0.07 0.00 99.32 0.00 0.01 0.07 0.41 99.75 0 0.10 0.10 100.00 100.00 99.24 82.46 100.00 100.00
RTL 0.10 0.26 99.33 0.01 0.00 0.44 0.06 98.35 0 0.09 0.10 100.00 100.00 98.91 95.01 100.00 100.00
TATA CDMA 0.10 0.00 98.75 0.00 0.09 1.11 1.89 98.18 0 0.01 0.00 100.00 100.00 99.46 93.15 100.00 100.00
TATA GSM 0.02 0.00 98.63 0.03 0.05 0.79 1.49 98.26 0 0.00 0.00 100.00 100.00 99.31 93.43 100.00 100.00
Vodafone 0.03 0.07 99.57 0.05 0.43 0.84 2.53 97.59 0 0.03 0.02 100.00 100.00 100.00 96.95 100.00 100.00
Aircel 0.31 0.43 99.87 0.00 0.00 0.78 3.11 98.71 0 0.00 0.00 100.00 100.00 93.92 95.54 100.00 100.00
Airtel 0.02 0.02 99.80 0.06 0.08 0.24 0.65 99.74 0 0.03 0.01 100.00 100.00 100.00 93.00 100.00 100.00
BSNL 0.50 0.57 98.00 0.33 2.00 0.70 1.93 99.27 0 0.00 0.00 100.00 100.00 100.00 90.30 100.00 100.00
Idea 0.09 0.43 99.97 0.18 0.92 0.59 1.83 95.22 0 0.11 0.05 100.00 100.00 99.61 98.36 100.00 100.00
MTS 0.03 0.00 99.62 0.00 0.02 0.63 2.53 98.26 0 0.00 0.05 100.00 100.00 99.60 92.76 NA NA
RCOM CDMA 0.06 0.03 99.36 0.00 0.00 0.03 0.14 99.74 0 0.08 0.03 100.00 100.00 98.95 78.06 100.00 100.00
RCOM GSM 0.05 0.00 99.81 0.00 0.01 0.12 0.07 99.33 0 0.08 0.10 100.00 100.00 98.62 73.26 100.00 100.00
TATA CDMA 0.03 0.00 98.81 0.00 0.03 0.79 1.96 99.12 0 0.00 0.00 100.00 100.00 99.57 83.75 100.00 100.00
TATA GSM 0.01 0.00 98.97 0.01 0.02 0.60 1.20 98.32 0 0.00 0.00 100.00 100.00 99.37 92.59 100.00 100.00
Vodafone 0.02 0.03 99.43 0.11 0.55 0.63 0.73 97.32 0 0.08 0.00 100.00 100.00 98.57 92.57 100.00 100.00
Aircel 0.05 0.03 99.09 0.05 0.15 1.07 2.67 97.48 0 0.00 0.00 100.00 100.00 97.01 92.29 100.00 100.00
Airtel 0.36 1.48 99.05 0.24 0.26 0.36 0.39 99.08 0 0.05 0.00 100.00 100.00 100.00 96.00 100.00 100.00
BSNL 1.20 1.83 98.00 0.10 0.57 1.20 2.17 96.43 0 0.00 0.00 100.00 100.00 99.00 97.50 100.00 100.00
Idea 0.17 0.52 97.69 0.17 0.53 0.82 1.87 96.80 0 0.06 0.03 100.00 100.00 99.45 98.36 100.00 100.00
MTS 0.15 0.00 99.03 0.00 0.29 0.40 0.09 98.26 0 0.10 0.01 100.00 100.00 96.93 91.42 100.00 100.00
RCOM CDMA 0.23 0.36 99.02 0.00 0.00 0.04 0.22 99.77 0 0.10 0.05 100.00 100.00 97.46 74.22 100.00 100.00
RCOM GSM 0.24 0.77 99.72 0.02 0.04 0.31 0.04 99.02 0 0.09 0.10 100.00 100.00 98.15 42.58 100.00 100.00
TATA CDMA 0.02 0.00 98.75 0.00 0.04 0.60 2.27 98.37 0 0.01 0.00 100.00 100.00 99.66 91.99 100.00 100.00
TATA GSM 0.05 0.02 98.67 0.03 0.13 0.66 2.39 98.24 0 0.00 0.00 100.00 100.00 99.52 94.69 100.00 100.00
Vodafone 0.25 1.57 99.84 0.07 0.16 0.61 2.48 98.87 0 0.09 0.04 100.00 100.00 100.00 96.15 100.00 100.00
Aircel 0.03 0.02 98.19 0.09 0.17 0.82 1.68 97.99 0 0.00 0.00 100.00 100.00 99.51 82.91 100.00 100.00
Airtel 0.00 0.00 99.99 0.00 0.00 0.31 0.00 99.97 0 0.02 0.00 100.00 100.00 100.00 94.00 100.00 100.00
Idea 0.04 0.10 98.22 0.41 1.05 1.90 2.87 98.22 0 0.06 0.02 100.00 100.00 99.36 97.59 100.00 100.00
Loop Mobile 0.01 0.00 99.19 0.04 0.04 0.63 0.76 98.09 0 0.00 0.01 100.00 100.00 99.34 99.01 100.00 100.00
MTNL CDMA 0.05 1.64 98.58 0.79 0.01 1.12 2.30 97.63 0 0.08 0.04 100.00 100.00 96.00 47.52 100.00 100.00
MTNL GSM 0.63 1.58 97.90 0.35 0.05 1.25 2.36 96.86 0 0.03 0.01 100.00 100.00 95.91 95.91 100.00 100.00
RCOM CDMA 0.21 0.04 98.99 0.00 0.01 0.39 0.07 99.79 0 0.10 0.07 100.00 100.00 99.44 93.41 100.00 100.00
RCOM GSM 0.18 0.14 99.65 0.03 0.04 0.36 0.02 99.13 0 0.10 0.10 100.00 100.00 99.38 89.36 100.00 100.00
TATA CDMA 0.01 0.00 98.96 0.00 0.03 0.65 1.06 99.04 0 0.00 0.00 100.00 100.00 99.62 94.54 100.00 100.00
TATA GSM 0.01 0.00 99.58 0.08 0.15 0.70 1.54 98.47 0 0.00 0.00 100.00 100.00 99.44 94.09 100.00 100.00
Vodafone 0.00 0.00 99.49 0.05 0.51 0.84 2.66 97.40 0 0.06 0.01 100.00 100.00 99.91 95.10 100.00 100.00
Aircel 0.13 0.53 99.62 0.06 0.02 0.69 1.85 97.51 0 0.01 0.00 100.00 100.00 92.13 66.56 100.00 100.00
Airtel 0.01 0.00 99.86 0.04 0.07 0.55 0.27 98.93 0 0.02 0.00 100.00 100.00 100.00 92.00 100.00 100.00
BSNL 1.87 1.91 95.87 0.74 1.78 1.75 2.76 95.83 0 NA NA NA NR N/A N/A 100.00 100.00
Idea 0.25 1.65 98.88 0.53 0.60 1.12 2.25 97.51 0 0.09 0.00 100.00 100.00 99.17 99.39 100.00 100.00
RCOM CDMA 0.19 0.21 98.22 0.00 0.02 0.21 0.82 99.80 0 0.10 0.10 100.00 100.00 99.44 94.67 100.00 100.00
RCOM GSM 0.30 0.89 99.59 0.05 0.04 0.34 0.01 98.87 0 0.09 0.10 100.00 100.00 98.64 81.58 100.00 100.00
TATA CDMA 0.02 0.00 97.91 0.00 0.78 1.08 2.17 99.10 0 0.00 0.00 100.00 100.00 99.19 95.29 100.00 100.00
TATA GSM 0.01 0.00 99.34 0.06 0.11 0.75 2.68 98.05 0 0.00 0.00 100.00 100.00 99.10 93.70 100.00 100.00
Uninor 0.15 0.64 97.78 0.31 1.03 0.86 1.64 97.67 0 NA 0.03 100.00 NA 96.54 91.41 NA NA
Vodafone 0.14 0.80 99.45 0.23 0.54 0.73 2.83 97.30 0 0.05 0.03 100.00 100.00 99.92 86.91 99.16 100.00
KTK
KOL
MBI
MH
KR

106
Annexure 4.1 (Contd.)
Aircel 0.32 0.52 99.09 0.07 0.00 0.72 4.51 99.17 0 0.00 0.00 100.00 100.00 93.01 97.78 100.00 100.00
Airtel 0.11 0.32 99.49 0.05 0.22 0.96 1.13 95.98 0 0.02 0.01 100.00 100.00 100.00 94.00 100.00 100.00
BSNL 1.70 1.52 96.17 0.52 1.70 1.57 2.72 96.80 0 0.00 0.05 100.00 100.00 99.50 95.15 100.00 100.00
Idea 3.49 8.61 98.66 0.56 0.78 1.00 1.58 98.82 0 0.06 0.01 100.00 100.00 99.54 98.74 100.00 100.00
RCOM CDMA 0.35 0.54 99.31 0.00 0.00 0.06 0.21 99.85 0 0.10 0.10 100.00 100.00 98.71 94.44 100.00 100.00
RTL 0.18 0.59 98.66 0.02 0.19 0.57 0.01 97.91 0 0.09 0.10 100.00 100.00 98.97 91.22 100.00 100.00
TATA CDMA 0.00 0.00 98.88 0.00 0.09 0.66 0.95 99.18 0 0.00 0.00 100.00 100.00 97.85 92.81 100.00 100.00
TATA GSM 0.00 0.00 98.49 0.04 0.05 0.68 1.83 98.48 0 0.00 0.00 100.00 100.00 99.24 93.52 100.00 100.00
Videocon 0.17 0.56 98.87 0.07 0.25 0.60 1.13 98.43 0 NA 0.02 100.00 100.00 95.81 91.90 NA NA
Vodafone 0.07 0.04 99.70 0.07 0.30 0.72 2.09 98.99 0 0.13 0.04 99.90 100.00 100.00 96.82 100.00 100.00
Aircel 0.87 6.14 95.50 0.75 1.64 0.88 5.47 94.22 0 0.01 0.01 100.00 100.00 95.91 93.10 100.00 100.00
Airtel 0.34 0.82 98.06 0.29 0.36 1.14 0.95 98.90 0 0.00 0.01 100.00 100.00 100.00 95.00 100.00 100.00
BSNL 6.03 15.85 95.00 3.00 4.22 4.08 12.77 92.50 0 0.05 0.05 100.00 100.00 98.50 89.00 100.00 100.00
Idea 1.54 1.52 96.97 0.36 1.59 1.82 2.53 95.63 0 0.00 0.00 100.00 100.00 97.41 99.17 100.00 100.00
RTL 0.34 1.66 98.46 0.02 0.44 0.63 0.22 98.37 0 0.08 0.10 100.00 100.00 98.41 83.54 100.00 100.00
Vodafone 1.77 1.88 99.44 0.12 0.56 0.71 2.74 97.92 0 0.07 0.01 100.00 100.00 99.98 97.74 100.00 100.00
Aircel 0.61 1.59 98.11 0.53 0.50 0.96 2.63 95.46 0 0.00 0.00 100.00 100.00 92.54 93.69 100.00 100.00
Airtel 0.37 1.15 98.39 0.60 1.11 1.11 0.94 95.84 0 0.00 0.00 100.00 100.00 100.00 94.00 100.00 100.00
BSNL 1.00 0.80 98.33 0.83 1.40 1.63 2.33 97.00 0 0.00 0.00 100.00 100.00 95.00 97.30 100.00 100.00
Idea 0.28 1.23 99.48 0.29 0.28 0.42 1.32 96.68 0 0.01 0.02 100.00 100.00 98.32 98.95 100.00 70.37
RCOM CDMA 0.36 0.68 99.39 0.00 0.00 0.10 0.95 99.80 0 0.08 0.07 100.00 100.00 98.50 94.10 100.00 100.00
RTL 0.06 0.06 98.16 0.21 0.71 0.54 0.20 98.26 0 0.09 0.10 100.00 100.00 98.94 82.07 100.00 100.00
TATA CDMA 0.05 0.00 98.44 0.00 0.13 0.78 1.07 98.25 0 0.01 0.00 100.00 100.00 99.83 96.73 100.00 100.00
TATA GSM 0.08 0.59 99.11 0.10 0.22 0.47 0.53 97.86 0 0.00 0.00 100.00 100.00 96.68 91.37 100.00 100.00
Vodafone 0.14 0.34 99.18 0.47 0.82 0.78 2.36 98.35 0 0.04 0.07 100.00 100.00 99.94 96.84 100.00 100.00
Aircel 0.14 0.06 98.10 0.04 0.32 0.76 1.65 97.88 0 0.00 0.00 100.00 100.00 99.94 92.61 100.00 100.00
Airtel 0.05 0.06 99.30 0.08 0.13 0.52 1.02 98.67 0 0.05 0.00 100.00 100.00 100.00 94.00 100.00 100.00
BSNL 0.20 1.57 97.67 0.90 1.70 1.70 5.37 95.87 0 0.00 0.00 100.00 0.00 100.00 67.00 100.00 100.00
Idea 0.03 0.01 98.23 0.08 0.49 0.62 0.73 96.82 0 0.04 0.01 100.00 100.00 99.92 98.20 100.00 100.00
QTL CDMA 0.47 0.00 98.61 0.72 0.73 1.07 0.53 97.66 0 0.00 0.00 100.00 100.00 95.00 93.00 100.00 100.00
QTL GSM 0.23 0.52 98.17 0.57 0.97 1.13 2.21 96.78 0 0.00 0.01 100.00 100.00 95.54 92.06 NA NA
RCOM CDMA 0.09 0.04 99.00 0.00 0.00 0.01 0.05 99.70 0 0.09 0.10 100.00 100.00 99.01 92.07 100.00 100.00
RCOM GSM 0.09 0.16 99.67 0.02 0.04 0.29 0.03 99.03 0 0.08 0.10 100.00 100.00 98.96 74.89 100.00 100.00
TATA CDMA 0.02 0.00 98.96 0.00 0.06 0.58 0.48 98.97 0 0.00 0.00 100.00 100.00 98.40 95.38 100.00 100.00
TATA GSM 0.03 0.08 99.20 0.00 0.07 0.55 0.86 97.78 0 0.00 0.00 100.00 100.00 99.08 90.80 100.00 100.00
Vodafone 0.03 0.10 99.83 0.03 0.17 0.61 0.84 98.10 0 0.04 0.00 100.00 100.00 100.00 99.44 100.00 100.00
Aircel 0.05 0.17 96.69 0.24 0.44 0.68 0.74 97.49 0 0.00 0.00 100.00 100.00 98.74 90.18 100.00 100.00
Airtel 0.08 0.19 98.98 0.22 0.33 0.82 1.47 98.99 0 0.01 0.00 100.00 100.00 100.00 93.00 100.00 100.00
BSNL 1.83 1.90 99.00 0.33 1.17 1.60 2.90 98.30 0 0.00 0.10 100.00 100.00 99.00 93.00 100.00 100.00
Idea 0.08 0.03 99.09 0.27 0.44 1.29 2.60 95.62 0 0.07 0.02 100.00 100.00 99.43 98.84 100.00 100.00
MTS 0.04 0.00 99.28 0.00 0.17 0.58 1.29 98.71 0 0.07 0.04 100.00 100.00 99.37 97.20 100.00 100.00
RCOM CDMA 0.26 0.42 99.16 0.00 0.00 0.10 0.37 99.67 0 0.10 0.10 100.00 100.00 98.96 98.40 100.00 100.00
RCOM GSM 0.20 0.47 99.64 0.05 0.06 0.31 0.06 98.75 0 0.09 0.10 100.00 100.00 99.00 88.00 100.00 100.00
TATA CDMA 0.03 0.00 98.41 0.00 0.61 0.63 2.88 98.96 0 0.00 0.00 100.00 100.00 97.94 94.94 100.00 100.00
TATA GSM 0.04 0.00 98.55 0.03 0.05 0.69 1.15 98.67 0 0.00 0.00 100.00 100.00 99.33 93.84 NR NR
Vodafone 0.27 0.91 99.74 0.19 0.26 0.77 0.66 97.26 0 0.09 0.04 100.00 100.00 100.00 98.79 100.00 100.00
OR
NE
MP
RAJ
PB

107
Annexure 4.1 (Contd.)
Aircel 0.28 1.37 98.05 0.39 0.74 0.54 1.09 95.05 0 0.00 0.00 100.00 100.00 97.01 90.51 100.00 99.73
Airtel 0.01 0.01 99.81 0.08 0.03 0.21 0.17 99.67 0 0.05 0.00 100.00 100.00 100.00 92.00 100.00 100.00
BSNL 0.47 1.60 97.67 0.10 0.20 0.67 1.73 99.00 0 0.10 0.00 100.00 100.00 100.00 94.00 100.00 100.00
Idea 0.02 0.00 99.76 0.06 0.10 0.41 0.47 97.35 0 0.05 0.14 100.00 100.00 99.45 98.47 100.00 100.00
MTS 0.05 0.13 99.46 0.00 0.19 0.42 0.00 98.25 0 0.00 0.01 100.00 100.00 99.48 91.43 NA NA
RCOM CDMA 0.24 0.38 99.19 0.00 0.00 0.05 0.09 99.78 0 0.10 0.03 100.00 100.00 97.45 73.05 100.00 100.00
RCOM GSM 0.26 0.56 99.73 0.02 0.04 0.36 0.02 99.01 0 0.10 0.10 100.00 100.00 98.62 32.60 100.00 100.00
TATA CDMA 0.03 0.00 98.82 0.00 0.03 0.82 2.25 98.82 0 0.00 0.00 100.00 100.00 99.13 80.09 100.00 100.00
TATA GSM 0.08 0.18 98.66 0.02 0.02 0.61 0.78 98.59 0 0.00 0.00 100.00 100.00 99.21 78.77 100.00 100.00
Vodafone 0.07 0.51 99.74 0.12 0.26 0.74 1.10 97.71 0 0.05 0.00 100.00 100.00 100.00 93.29 100.00 100.00
Aircel 0.40 1.63 97.78 0.79 0.33 0.63 1.17 96.39 0 0.00 0.00 100.00 100.00 88.84 92.71 100.00 100.00
Airtel 0.69 1.02 99.46 0.10 0.39 0.78 2.66 98.67 0 0.01 0.02 100.00 99.97 100.00 96.00 100.00 100.00
BSNL 1.25 0.84 97.00 0.73 1.57 1.60 2.53 96.67 0 0.08 0.07 100.00 100.00 97.32 91.00 100.00 100.00
Idea 0.21 0.94 98.56 0.69 1.37 1.12 2.85 96.53 0 0.05 0.01 100.00 100.00 99.98 99.17 100.00 100.00
RCOM CDMA 0.35 0.95 98.50 0.00 0.01 0.19 0.22 99.76 0 0.10 0.10 100.00 100.00 97.54 93.40 100.00 100.00
RCOM GSM 0.23 0.55 99.47 0.11 0.05 0.28 0.01 98.85 0 0.08 0.10 100.00 100.00 99.15 97.04 100.00 100.00
TATA CDMA 0.04 0.00 98.57 0.00 0.19 0.53 2.95 97.56 0 0.00 0.00 100.00 100.00 99.34 96.93 100.00 100.00
TATA GSM 0.01 0.00 98.13 0.07 0.66 0.81 1.72 97.57 0 0.00 0.00 100.00 100.00 99.34 95.70 100.00 100.00
Uninor 0.39 1.92 97.43 0.47 1.58 0.70 2.33 96.14 0 NA 0.01 100.00 NA 96.16 97.01 NA NA
Vodafone 0.47 1.78 99.40 0.22 0.60 1.22 2.45 95.83 0 0.06 0.02 100.00 100.00 100.00 93.77 100.00 100.00
Aircel 0.20 1.33 98.97 0.17 0.16 0.53 1.67 97.76 0 0.00 0.00 100.00 100.00 87.91 94.28 100.00 100.00
Airtel 0.16 0.39 97.51 0.82 1.22 1.29 2.14 97.62 0 0.03 0.02 100.00 99.98 100.00 92.00 100.00 100.00
BSNL 0.95 1.90 97.17 0.74 1.45 1.57 2.49 96.58 0 0.00 0.00 100.00 100.00 100.00 68.20 100.00 100.00
Idea 0.04 0.09 99.94 0.67 0.64 0.91 2.33 96.10 0 0.05 0.00 100.00 100.00 99.57 97.33 100.00 100.00
MTS 0.05 0.00 99.59 0.00 0.00 0.46 1.26 99.26 0 0.10 0.01 100.00 100.00 97.80 97.32 100.00 NA
RCOM CDMA 0.29 0.77 98.54 0.00 0.01 0.17 0.56 99.78 0 0.09 0.10 100.00 100.00 97.74 93.74 100.00 100.00
RCOM GSM 0.26 0.89 99.67 0.03 0.03 0.23 0.02 99.05 0 0.08 0.10 100.00 100.00 98.54 92.85 100.00 100.00
TATA CDMA 0.02 0.00 98.98 0.00 0.17 0.54 0.53 97.72 0 0.00 0.00 100.00 100.00 98.74 97.52 100.00 100.00
TATA GSM 0.10 0.29 98.89 0.02 0.20 0.67 1.50 98.03 0 0.00 0.00 100.00 100.00 99.37 94.51 100.00 100.00
Uninor 0.16 0.60 98.06 0.22 1.43 0.45 1.56 97.13 0 NA 0.03 100.00 NA 96.23 96.68 NA NA
Vodafone 0.16 0.91 99.32 0.14 0.68 0.73 1.12 97.53 0 0.05 0.02 100.00 100.00 100.00 93.35 100.00 100.00
Aircel 0.87 1.89 95.75 0.65 1.80 1.05 2.49 95.58 0 0.00 0.00 100.00 100.00 99.80 92.60 100.00 100.00
Airtel 0.07 0.19 98.85 0.23 1.19 1.38 1.62 97.88 0 0.01 0.00 100.00 100.00 100.00 96.00 100.00 100.00
BSNL 2.22 8.19 97.20 0.46 0.92 1.48 11.01 96.52 0 0.07 0.33 99.50 100.00 100.00 98.90 97.21 100.00
Idea 0.36 1.15 98.65 0.06 0.18 0.58 2.48 95.71 0 0.02 0.02 100.00 100.00 99.52 98.24 100.00 100.00
MTS 0.30 0.00 99.33 0.00 0.17 1.03 2.56 99.62 0 0.10 0.03 100.00 100.00 100.00 90.00 100.00 NA
RCOM CDMA 0.23 0.40 98.97 0.00 0.02 0.15 0.25 99.67 0 0.07 0.10 100.00 100.00 99.12 82.46 100.00 100.00
RTL 0.24 0.78 98.53 0.02 0.11 0.65 0.11 98.24 0 0.08 0.10 100.00 100.00 98.97 95.21 100.00 100.00
TATA CDMA 0.05 0.00 98.39 0.00 0.15 0.80 2.63 98.01 0 0.00 0.00 100.00 100.00 99.73 96.99 100.00 100.00
TATA GSM 0.00 0.00 98.30 0.04 0.47 0.79 2.10 97.81 0 0.00 0.00 100.00 100.00 96.05 95.26 100.00 100.00
Vodafone 0.01 0.02 99.50 0.25 0.50 0.93 1.43 95.33 0 0.04 0.04 100.00 100.00 100.00 95.47 100.00 100.00
NA : Not Applicable NR : Not Reported RCOM CDMA & RCOM GSM :
CN included in TN for Network Related parameters onlyRCOM GSM :
Percentage of calls answered by the operators has been reported combined for TN and CH for customer related parameters only.RCOM CDMA :
Percentage of calls answered by the operators has been reported combined for TN and CH for customer related parameters only.
Percentage of calls answered by the operators has been reported combined for WB and KOL for customer related parameters only.
UPW
UPE
TN
WB

108
Annexure 4.2: Performance of QoS Parameters for Cellular Mobile 3G Service
POI
1 2 3 4 5 6 7 8 9 10
Benchmark ≤ 2% ≤ 2% ≥ 95% ≤ 1% ≤ 2% ≤ 2% ≤ 3% ≥ 95% ≤ 0.5%
Aircel 0.04 0.00 99.04 0.51 0.45 0.65 2.76 99.76 0
Airtel 0.10 0.19 99.00 0.23 0.00 0.64 2.16 99.12 0
BSNL 1.00 1.73 98.67 0.70 1.20 1.07 2.70 98.27 0
Idea 0.02 0.00 99.21 0.21 0.75 0.47 1.24 99.62 0
BSNL 1.90 1.97 96.33 0.00 0.00 0.80 2.90 92.87 0
Airtel 0.15 0.60 98.14 0.69 0.14 0.66 1.33 99.15 0
RTL 0.38 1.49 97.09 0.07 0.03 0.47 2.22 99.85 0
Aircel 0.54 1.78 99.25 0.06 0.02 0.97 9.01 99.41 0
Airtel 0.01 0.64 99.45 0.03 0.04 0.60 0.24 99.63 0
RTL 0.45 1.54 96.76 0.01 0.34 0.64 2.55 99.84 0
Aircel 1.09 4.45 98.07 1.17 0.12 1.17 12.04 99.11 0
BSNL 1.43 1.62 98.17 0.18 0.55 1.17 2.93 95.73 0
Aircel 0.94 8.51 98.21 0.31 0.23 1.30 7.95 98.22 0
Vodafone 0.04 0.08 99.81 0.01 0.01 0.33 0.71 99.01 0
Airtel 0.07 0.10 99.76 0.01 0.09 0.27 0.32 98.73 0
BSNL 0.80 1.83 98.00 0.77 0.27 1.20 1.87 95.90 0
Airtel 0.14 0.78 97.80 0.51 0.27 0.71 2.21 99.07 0
MTNL 0.53 1.57 96.83 0.50 1.63 1.63 2.33 96.30 0
RCOM 0.25 0.90 99.21 0.04 0.13 0.60 2.26 99.73 0
Vodafone 0.02 0.00 97.72 0.01 0.00 0.79 2.84 99.11 0
BSNL 1.80 1.83 96.67 0.60 1.27 1.60 2.43 100.00 0
Idea 0.03 0.01 99.76 0.24 0.12 0.53 1.55 99.11 0
Tata 0.00 0.00 99.27 0.02 0.26 0.76 1.27 99.74 0
Vodafone 0.02 0.00 99.80 0.15 0.04 0.24 0.16 99.04 0
Airtel 0.04 0.00 98.26 0.15 0.00 1.26 2.14 98.62 0
BSNL 1.80 1.33 96.00 0.87 1.90 1.97 2.73 96.70 0
Idea 0.30 0.00 99.41 0.68 0.33 1.39 2.28 98.94 0
RTL 0.52 1.38 97.73 0.05 0.00 0.48 2.00 99.90 0
BSNL 1.72 1.13 96.59 0.70 1.18 1.27 2.13 96.57 1
Idea 0.00 0.00 99.79 0.01 0.00 0.24 1.02 99.01 0
Tata 0.04 0.00 99.61 0.16 0.11 0.20 0.28 99.22 0
Vodafone 0.04 0.00 99.85 0.07 0.01 0.29 1.41 99.02 0
Airtel 0.22 0.56 98.56 0.22 0.00 1.24 2.06 98.77 0
RCOM 0.59 1.59 99.62 0.01 0.02 1.15 2.21 99.46 0
Aircel 0.31 1.63 98.20 0.50 0.16 1.34 2.87 99.07 0
BSNL 1.40 1.55 96.50 0.75 1.10 1.40 2.55 98.00 0
Idea 0.43 1.40 99.81 0.24 0.04 1.23 1.85 99.10 0
Aircel 0.00 0.00 99.59 0.18 0.00 0.04 0.15 99.93 0
Tata 0.00 0.00 99.62 0.02 0.07 0.42 0.64 99.83 0
BSNL 0.37 1.27 98.33 0.13 1.97 1.07 0.10 97.37 0
Idea 0.04 0.02 99.25 0.69 0.39 0.26 1.85 98.78 0
Aircel 0.40 1.14 99.88 0.16 0.17 0.25 1.47 98.87 0
BSNL 1.98 1.68 98.53 0.80 0.76 0.25 1.90 98.80 0
RTL 0.13 0.69 97.57 0.04 0.00 0.71 2.47 99.86 0
Vodafone 0.03 0.10 99.89 0.02 0.02 0.29 0.93 99.05 0
SDCCH/Paging
Channel and RRC
Congestion
(%age)
TCH and Circuit
Switched RAB
Congestion (%age)
Call Drop and
Circuit Switched
Voice Drop
Rate: (%age)
Worst affected cells
having more than 3%
TCH drop (call drop) and
Circuit Switched Voice
Drop Rate:-CBBH
J&K
AP
AS
BH
Call Set-up Success
Rate (within
licensee's own
network)
CHN
DL
GJ
HP
HR
KR
KOL
Connections with
good voice quality
and Circuit Switch
Voice Quality (CSV
quality)
Point of
Interconnection
(POI) Congestion
Performance Monitoring Report on Quality of Service of Cellular Mobile Serivce (3G) Providers for quarter ending, December , 2013
Name of
the
Service
Provider
Name of Service
Area / City
Network Availability Connection Establishment (Accessibility) Connection Maintenance (Retainability)
Node-B's
Accumulated
downtime (not
available for
service) (%age)
Worst affected
Node-B's due to
downtime
(%age)
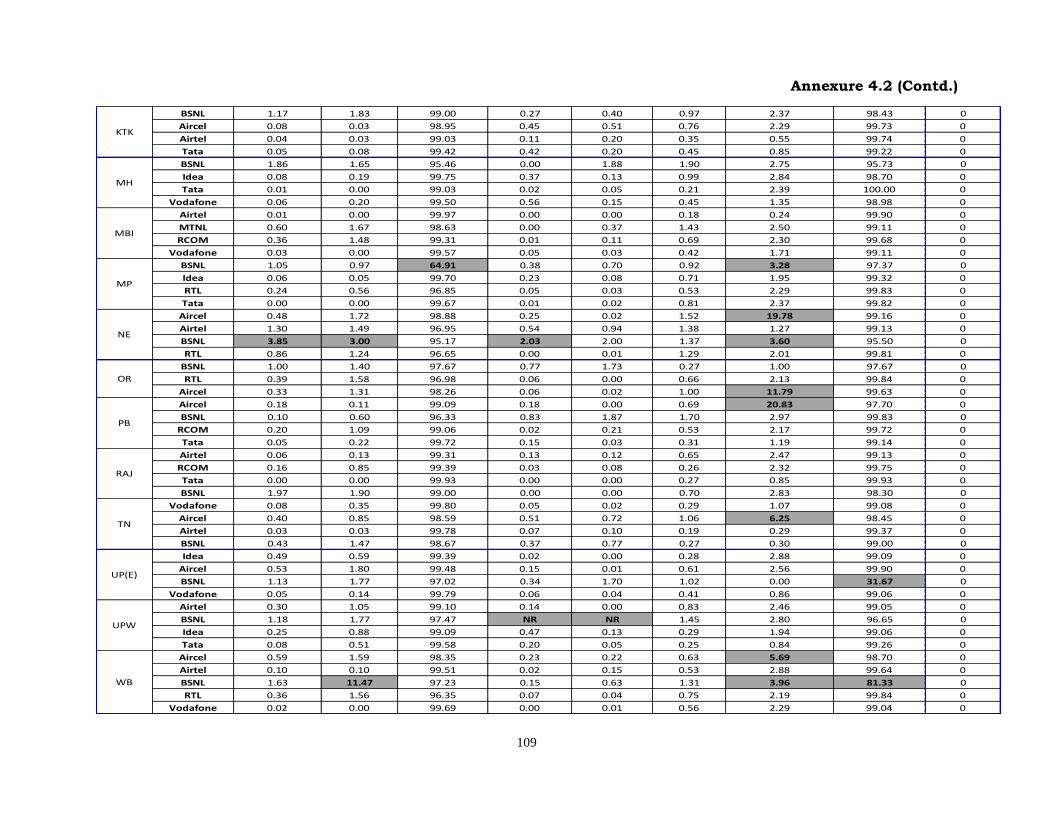
109
Annexure 4.2 (Contd.)
BSNL 1.17 1.83 99.00 0.27 0.40 0.97 2.37 98.43 0
Aircel 0.08 0.03 98.95 0.45 0.51 0.76 2.29 99.73 0
Airtel 0.04 0.03 99.03 0.11 0.20 0.35 0.55 99.74 0
Tata 0.05 0.08 99.42 0.42 0.20 0.45 0.85 99.22 0
BSNL 1.86 1.65 95.46 0.00 1.88 1.90 2.75 95.73 0
Idea 0.08 0.19 99.75 0.37 0.13 0.99 2.84 98.70 0
Tata 0.01 0.00 99.03 0.02 0.05 0.21 2.39 100.00 0
Vodafone 0.06 0.20 99.50 0.56 0.15 0.45 1.35 98.98 0
Airtel 0.01 0.00 99.97 0.00 0.00 0.18 0.24 99.90 0
MTNL 0.60 1.67 98.63 0.00 0.37 1.43 2.50 99.11 0
RCOM 0.36 1.48 99.31 0.01 0.11 0.69 2.30 99.68 0
Vodafone 0.03 0.00 99.57 0.05 0.03 0.42 1.71 99.11 0
BSNL 1.05 0.97 64.91 0.38 0.70 0.92 3.28 97.37 0
Idea 0.06 0.05 99.70 0.23 0.08 0.71 1.95 99.32 0
RTL 0.24 0.56 96.85 0.05 0.03 0.53 2.29 99.83 0
Tata 0.00 0.00 99.67 0.01 0.02 0.81 2.37 99.82 0
Aircel 0.48 1.72 98.88 0.25 0.02 1.52 19.78 99.16 0
Airtel 1.30 1.49 96.95 0.54 0.94 1.38 1.27 99.13 0
BSNL 3.85 3.00 95.17 2.03 2.00 1.37 3.60 95.50 0
RTL 0.86 1.24 96.65 0.00 0.01 1.29 2.01 99.81 0
BSNL 1.00 1.40 97.67 0.77 1.73 0.27 1.00 97.67 0
RTL 0.39 1.58 96.98 0.06 0.00 0.66 2.13 99.84 0
Aircel 0.33 1.31 98.26 0.06 0.02 1.00 11.79 99.63 0
Aircel 0.18 0.11 99.09 0.18 0.00 0.69 20.83 97.70 0
BSNL 0.10 0.60 96.33 0.83 1.87 1.70 2.97 99.83 0
RCOM 0.20 1.09 99.06 0.02 0.21 0.53 2.17 99.72 0
Tata 0.05 0.22 99.72 0.15 0.03 0.31 1.19 99.14 0
Airtel 0.06 0.13 99.31 0.13 0.12 0.65 2.47 99.13 0
RCOM 0.16 0.85 99.39 0.03 0.08 0.26 2.32 99.75 0
Tata 0.00 0.00 99.93 0.00 0.00 0.27 0.85 99.93 0
BSNL 1.97 1.90 99.00 0.00 0.00 0.70 2.83 98.30 0
Vodafone 0.08 0.35 99.80 0.05 0.02 0.29 1.07 99.08 0
Aircel 0.40 0.85 98.59 0.51 0.72 1.06 6.25 98.45 0
Airtel 0.03 0.03 99.78 0.07 0.10 0.19 0.29 99.37 0
BSNL 0.43 1.47 98.67 0.37 0.77 0.27 0.30 99.00 0
Idea 0.49 0.59 99.39 0.02 0.00 0.28 2.88 99.09 0
Aircel 0.53 1.80 99.48 0.15 0.01 0.61 2.56 99.90 0
BSNL 1.13 1.77 97.02 0.34 1.70 1.02 0.00 31.67 0
Vodafone 0.05 0.14 99.79 0.06 0.04 0.41 0.86 99.06 0
Airtel 0.30 1.05 99.10 0.14 0.00 0.83 2.46 99.05 0
BSNL 1.18 1.77 97.47 NR NR 1.45 2.80 96.65 0
Idea 0.25 0.88 99.09 0.47 0.13 0.29 1.94 99.06 0
Tata 0.08 0.51 99.58 0.20 0.05 0.25 0.84 99.26 0
Aircel 0.59 1.59 98.35 0.23 0.22 0.63 5.69 98.70 0
Airtel 0.10 0.10 99.51 0.02 0.15 0.53 2.88 99.64 0
BSNL 1.63 11.47 97.23 0.15 0.63 1.31 3.96 81.33 0
RTL 0.36 1.56 96.35 0.07 0.04 0.75 2.19 99.84 0
Vodafone 0.02 0.00 99.69 0.00 0.01 0.56 2.29 99.04 0
TN
UPW
UP(E)
KTK
MH
MBI
MP
WB
NE
OR
PB
RAJ

110
Annexure 4.3: Performance of QoS Parameters for Basic (Wire-line) Service
POI
% o
f fa
ult
s r
ep
air
ed
by
next
wo
rkin
g d
ay
% o
f fa
ult
s r
ep
air
ed
wit
hin
3 d
ays
% o
f fa
ult
s r
ep
air
ed
wit
hin
5 d
ays
Po
int
of
Inte
rco
nn
ecti
on
(PO
I) C
on
gesti
on
(N
o.
of
PO
Is n
ot
meeti
ng
th
e
ben
ch
mark
Mete
rin
g a
nd
Billin
gcre
dib
ilit
y -
po
st
paid
Mete
rin
g a
nd
billin
g
cre
dib
ilit
y -
pre
paid
Reso
luti
on
of
billin
g/c
harg
ing
/valid
ity
co
mp
lain
ts
Peri
od
of
ap
ply
ing
cre
dit
/
waiv
er/
ad
justm
en
t to
cu
sto
mer’
s a
cco
un
t fr
om
the d
ate
of
reso
luti
on
of
co
mp
lain
ts
Accessib
ilit
y o
f call
cen
tre/ cu
sto
mer
care
Perc
en
tag
e o
f calls
an
sw
ere
d b
y t
he
op
era
tors
(vo
ice t
o
vo
ice)
wit
hin
60
seco
nd
s
%ag
e re
qu
ests
fo
r
Term
inati
on
/ C
losu
re
of
serv
ice c
om
plied
wit
hin
7 d
ays
Tim
e t
aken
fo
r re
fun
d
of
dep
osit
s a
fter
clo
su
res
≤5
By next
working
day: ≥ 90%
For urban
areas:
100%
For rural and
hilly areas:
100%
≤ 8 Hrs ≥ 55% ≥ 75 % ≤ 0.5% ≤ 0.1% ≤ 0.1%
100%
within 4
weeks
1 week of
resolution of
complaint
≥ 95% ≥ 90%100% within
7 days
100%
within 60
days
1 A&N BSNL 3.29 92.06% 100.00% 100.00% 5 6.93 61.15% NA 0.00% 0.00% 0.00% 100.00% 100.00% 100.00% 92.00% 100.00% 100.00%
2 Reliance 0.26 100.00% 100.00% NA NA 3:17 NA 86.92% 0.00% 0.00% NA 100.00% 100.00% 97.00% 95.00% 100.00% 100.00%
3 TTSL 3.98 92.66% 100.00% 100.00% NA 5.74 90.98% NA NIL 0.08% NA 100.00% NIL 95.28% 93.23% 100.00% 100.00%
4 Vodafone 0.39 100.00% NA NA NA 1:31 95.15% NA 0.00% 0.00% NA NA NA 100.00% 100.00% NA NA
5 Bharti 2.35 91.10% 100.00% NA 0 3.66 94.51% NA 0.00% 0.02% NA 100.00% 100.00% 100.00% 92.00% 100.00% 100.00%
6 BSNL 4.32 92.54% 100.00% 100.00% 53 6.57 69.76% NA 0.00% 0.01% NIL 100.00% 100.00% 96.64% 81.33% 100.00% 100.00%
7 TTSL NA NA NA NA NA NA NA NA NIL NA NA NA NA NA NA NA NA
8 Vodafone 1.20 100.00% NA NA NA 0:56 97.06% NA 0.00% 0.00% NA NA NA 100.00% 100.00% NA NA
9 BSNL 3.49 96.53% 99.86% 100.00% 92 3.28 70.10% NA 0.00% 0.02% NIL 100.00% 100.00% 99.16% 90.33% 100.00% 100.00%
10 Reliance 0.00 NA NA NA NA NA NA 97.24% 0.00% NIL NA NIL NIL 97.00% 95.00% 100.00% 100.00%
11 TTSL 1.11 100.00% 100.00% 100.00% NA 2.28 92.72% NA NIL 0.03% NA 100.00% NIL 97.96% 93.02% NIL NA
12 Vodafone 1.07 100.00% NA NA NA 6:23 95.53% NA 0.00% 0.00% NA NA NA 100.00% 100.00% 100.00% NA
13 BSNL 2.94 95.04% 100.00% 100.00% 0 4.82 66.12% NA 0.00% 0.00% 0.00% 100.00% 100.00% 99.19% 50.67% 100.00% 100.00%
14 Chattisgarh BSNL 3.80 97.62% 99.69% 100.00% 1427 5.83 72.15% NA 0.00% 0.00% NA 100.00% 100.00% 94.69% 45.00% 100.00% 100.00%
15 Reliance 0.04 100.00% 100.00% NA NA 5:45 NA 86.85% 0.00% 0.01% NA 100.00% 100.00% 97.00% 95.00% 100.00% 100.00%
16 TTSL 0.73 98.39% 100.00% 100.00% NA 4.56 99.96% NA NIL 0.00% NA NA NIL 96.96% 93.42% NIL NA
17 Vodafone 0.66 100.00% NA NA NA 2:44 94.75% NA 0.00% 0.00% NA NA NA 100.00% 100.00% NA NA
18 BSNL 4.95 92.24% 100.00% 100.00% 1157 7.99 85.49% NA 0.00% 0.00% 0.00% 100.00% 100.00% 97.72% 84.00% 100.00% 100.00%
19 Reliance 0.18 100.00% 100.00% NA NA 2:20 NA 93.78% 0.00% 0.01% NA 100.00% 100.00% 97.00% 95.00% 100.00% 100.00%
20 TTSL 1.24 94.34% 100.00% 100.00% NA 4.15 98.81% NA NIL 0.08% NA 100.00% NIL 98.61% 93.00% 100.00% NA
21 Vodafone 0.21 100.00% NA NA NA 2:04 100.00% NA 0.00% 0.00% NA NA NA 100.00% 100.00% 100.00% NA
22 Bharti 2.99 94.96% 100.00% NA 0 3.46 90.34% NA 0.00% 0.01% NA 100.00% 100.00% 100.00% 98.00% 100.00% 100.00%
23 MTNL 7.17 86.89% 96.06% NA 17863 4.01 56.31% NA 0.00% 0.04% NA 100.00% DNF 99.85% 99.03% 100.00% 100.00%
24 Reliance 0.76 100.00% 100.00% NA NA 1:56 NA 86.16% 0.00% 0.05% NA 100.00% 100.00% 97.00% 95.00% 100.00% 100.00%
25 TTSL 2.32 95.22% 100.00% 100.00% NA 4.51 57.34% NA NIL 0.05% NA 100.00% NIL 95.87% 93.30% 100.00% NA
26 Vodafone 0.91 100.00% NA NA NA 2:43 97.25% NA 0.00% 0.00% NA NA NA 100.00% 100.00% NA NA
27 Bharti 1.10 96.86% 100.00% NA 0 3.66 91.04% NA 0.00% 0.01% NA 100.00% 100.00% 99.00% 94.00% 100.00% 100.00%
28 BSNL 4.43 95.73% 100.00% 100.00% 7 4.42 77.12% NA 0.00% 0.03% 0.00% 100.00% 100.00% 95.71% 63.67% 100.00% 100.00%
GUJ
AP
ASM
BH
CN
DEL
Performance Monitoring Report of Basic Service (Wireline) for Quarter Ending December, 2013
Sl.
No
.
Nam
e o
f S
erv
ice A
rea
Nam
e o
f S
erv
ice P
rovid
er
Fau
lts in
cid
en
ces (
No
. o
f
fau
lts/1
00 S
ub
s./m
on
th)
Fault Repair
Ren
t R
eb
ate
Mean
Tim
e t
o R
ep
air
(M
TT
R)
Call C
om
ple
tio
n R
ate
(C
CR
)
An
sw
er
to S
eiz
ure
Rati
o Metering and Billing
Response time to the
customer for Assistance
Termination / closure
of service
Benchmarks

111
Annexure 4.3 (Contd.)
29 Reliance 0.00 NA NA NA NA NA NA 79.77% 0.00% NIL NA NIL NIL 97.00% 95.00% 100.00% 100.00%
30 TTSL NA NA NA NA NA NA NA NA NIL NA NA NA NA 99.81% 93.71% NA NA
31 BSNL 3.88 95.06% 99.85% 99.87% 0 6.12 69.38% NA 0.00% 0.00% 0.00% 100.00% 100.00% 98.07% 85.33% 100.00% 100.00%
32 Vodafone NA NA NA NA NA NA NA NA NA NA NA NA NA 100.00% 100.00% NA NA
33 Vodafone NA NA NA NA NA NA NA NA NA NA NA NA NA 100.00% 100.00% NA NA
34 Reliance 0.00 NA NA NA NA NA NA 82.77% 0.00% NIL NA NIL NIL 97.00% 95.00% 100.00% 100.00%
35 TTSL 0.11 100.00% 100.00% 100.00% NA 7.44 99.99% NA NIL 0.05% NA 100.00% NA 97.87% 94.11% NA NA
36 Bharti 4.36 97.26% 100.00% NA 0 2.71 88.91% NA 0.00% 0.01% NA 100.00% 100.00% 100.00% 98.00% 100.00% 100.00%
37 BSNL 4.47 97.52% 100.00% 100.00% 795 6.17 78.29% NA 0.00% 0.00% NIL 100.00% 100.00% 96.53% 51.07% 100.00% 100.00%
38 TTSL NA NA NA NA NA NA NA NA NIL NA NA NA NA NA NA NA NA
39 Vodafone NA NA NA NA NA NA NA NA NA NA NA NA NA 100.00% 100.00% NA NA
40 BSNL 4.35 94.84% 100.00% 100.00% 16 6.44 69.59% NA 0.00% 0.00% 0.00% 100.00% 100.00% 97.08% 68.33% 100.00% 100.00%
41 JHAR BSNL 2.68 98.18% 100.00% 100.00% 45 5.99 75.54% NA 0.00% 0.00% 0.00% 100.00% 100.00% 99.16% 97.33% 100.00% 100.00%
42 Reliance 0.25 100.00% 100.00% NA NA 7:32 NA 81.81% 0.00% 0.02% NA 100.00% 100.00% 97.00% 95.00% 100.00% 100.00%
43 TTSL 0.07 100.00% 100.00% 100.00% NA 5.08 97.61% NA NIL 0.00% NA NA NIL 98.69% 93.72% NA NA
44 Bharti 1.16 96.96% 100.00% NA 0 2.41 90.58% NA 0.00% 0.01% NA 100.00% 100.00% 100.00% 96.00% 100.00% 100.00%
45 BSNL 4.43 91.43% 100.00% 100.00% 4142347 7.79 73.08% NA 0.00% 0.08% 0.00% 100.00% 100.00% 97.15% 98.00% 100.00% 100.00%
46 Vodafone NA NA NA NA NA NA NA NA NA NA NA NA NA 100.00% 100.00% NA NA
47 Vodafone 0.45 100.00% NA NA NA 3:11 70.52% NA 0.00% 0.00% NA NA NA 100.00% 100.00% NA NA
48 Reliance 0.45 100.00% 100.00% NA NA 5:39 NA 90.39% 0.00% 0.03% NA 100.00% 100.00% 97.00% 95.00% 100.00% 100.00%
49 TTSL 1.87 100.00% 100.00% 100.00% NA 2.12 91.91% NA NIL 0.00% NA NA NIL 99.51% 92.76% 100.00% 100.00%
50 Bharti 2.73 93.73% 100.00% NA 0 4.19 98.76% NA 0.00% 0.00% NA 100.00% 100.00% 99.00% 98.00% 100.00% 100.00%
51 BSNL 4.84 91.87% 100.00% NA 167 7.60 60.67% NA 0.00% 0.07% NA 100.00% 100.00% 99.47% 85.67% 100.00% 100.00%
52 Vodafone 0.49 98.55% NA NA NA 1:27 91.98% NA 0.00% 0.00% NA NA NA 100.00% 100.00% NA NA
53 Reliance 0.06 100.00% 100.00% NA NA 6:32 NA 86.75% 0.00% 0.01% NA 100.00% 100.00% 97.00% 95.00% 100.00% 100.00%
54 TTSL 0.44 95.02% 100.00% 100.00% NA 4.49 80.27% NA NIL 0.05% NA 100.00% Nil 96.87% 93.51% 100.00% 100.00%
55 Bharti 2.61 90.64% 100.00% NA 0 3.62 91.00% NA 0.00% 0.02% NA 100.00% 100.00% 99.00% 93.00% 100.00% 100.00%
56 BSNL 4.09 92.93% 100.00% 100.00% 230 6.97 73.36% NA 0.00% 0.00% NA 100.00% 100.00% 96.69% 64.67% 100.00% 100.00%
57 Bharti 0.96 99.20% 100.00% NA 0 2.44 84.20% NA 0.00% 0.01% NA 100.00% 100.00% 100.00% 93.00% 100.00% 100.00%
58 BSNL 5.00 91.00% 100.00% 100.00% 223 7.00 58.00% NA 0.00% 0.00% 0.00% 100.00% 100.00% 95.00% 53.00% 100.00% 100.00%
59 Reliance 0.24 100.00% 100.00% NA NA 6:00 NA 87.55% 0.00% 0.02% NA 100.00% 100.00% 97.00% 95.00% 100.00% 100.00%
60 Vodafone 0.29 96.55% NA NA NA 0:40 92.28% NA 0.00% 0.00% NA NA NA 100.00% 100.00% NA NA
61 TTSL 2.03 94.44% 99.94% 100.00% NA 4.37 98.40% NA NIL 0.08% NA 100.00% Nil 95.08% 93.41% 100.00% 100.00%
62 Vodafone 3.11 100.00% NA NA NA 2:29 96.18% NA 0.00% 0.00% NA NA NA 100.00% 100.00% NA NA
63 Reliance 0.65 100.00% 100.00% NA NA 5:17 NA 87.59% 0.00% 0.02% NA 100.00% 100.00% 97.00% 95.00% 100.00% 100.00%
64 TTSL 2.29 95.83% 100.00% 100.00% NA 4.38 100.00% NA NIL 0.00% NA NA Nil 97.20% 93.50% NA NA
65 Bharti 4.88 95.49% 100.00% NA 0 3.17 89.17% NA 0.00% 0.01% NA 100.00% 100.00% 100.00% 98.00% 100.00% 100.00%
66 BSNL 3.00 95.00% 100.00% 100.00% 202144 3.00 74.00% NA 0.00% 0.04% 0.00% 100.00% 100.00% 96.00% 95.00% 100.00% 100.00%
67 Vodafone 0.13 100.00% NA NA NA 1:53 79.74% NA 0.00% 0.00% NA NA NA 100.00% 100.00% 100.00% NA
68 Bharti 0.34 98.51% 100.00% NA 0 3.04 83.34% NA 0.00% 0.00% NA 100.00% 100.00% 100.00% 94.00% 100.00% 100.00%
69 MTNL 4.79 94.88% 98.39% NA 27721 5.28 56.93% 80.38% 0.00% 0.02% NIL 100.00% NA 96.40% 95.92% 96.69% 100.00%
70 Reliance 0.13 100.00% 100.00% NA NA 4:41 NA 88.53% 0.00% 0.01% NA 100.00% 100.00% 97.00% 95.00% 100.00% 100.00%
71 TTSL 3.83 96.90% 99.98% 100.00% NA 4.52 98.84% NA NIL 0.10% NA 100.00% Nil 95.14% 93.18% 100.00% 100.00%
HP
HR
J&K
KER
KOL
KTK
MUM
MP
MH

112
Annexure 4.3 (Contd.)
72 TTSL NA NA NA NA NA NA NA NA NIL NA NA NA Nil NA NA NA NA
73 Vodafone NA NA NA NA NA 0:01 99.34% NA 0.00% NA NA NA NA 100.00% 100.00% NA NA
74 NE-I BSNL 3.00 98.00% 100.00% 100.00% 10 6.00 78.00% NA 0.00% 0.01% 0.00% 100.00% 100.00% 97.43% 92.33% 100.00% 100.00%
75 NE-II BSNL 2.73 98.63% 100.00% 100.00% 184 6.47 62.04% NA 0.00% 0.00% 0.00% 100.00% 100.00% 96.21% 94.67% 100.00% 100.00%
76 Reliance 0.00 NA NA NA NA NA NA 83.94% 0.00% NIL NA NIL NIL 97.00% 95.00% 100.00% 100.00%
77 TTSL 0.22 100.00% 100.00% 100.00% NA 3.74 99.98% NA NIL 0.00% NA NA Nil 99.61% 94.86% NA NA
78 BSNL 4.34 92.62% 100.00% 100.00% 0 6.15 65.19% NA 0.00% 0.11% 0.00% 100.00% 100.00% 99.31% 91.33% 100.00% 100.00%
79 Vodafone 1.76 89.47% NA NA NA 4:12 91.52% NA 0.00% 0.00% NA NA NA 100.00% 100.00% NA NA
80 Vodafone 0.28 100.00% NA NA NA 0:51 95.73% NA 0.00% 0.00% NA NA NA 100.00% 100.00% 100.00% NA
81 Reliance 0.43 100.00% 100.00% NA NA 6:37 NA 94.09% 0.00% NIL NA NIL 100.00% 97.00% 95.00% 100.00% 100.00%
82 TTSL 0.57 100.00% 100.00% 100.00% NA 5.84 76.94% NA NIL 0.09% NA 100.00% Nil 98.25% 92.22% NA NA
83 Bharti 2.77 95.02% 100.00% NA 0 3.53 96.94% NA 0.00% 0.01% NA 100.00% 100.00% 100.00% 98.00% 100.00% 100.00%
84 Quadrant 3.39 91.40% 99.90% NA 0 6.15 65.19% NA 0.00% 0.11% 0.00% 100.00% 100.00% 99.31% 91.33% 100.00% 100.00%
85 BSNL 4.02 96.80% 100.00% 100.00% 267 5.20 75.27% NA 0.00% 0.00% 0.00% 100.00% 100.00% 96.33% 62.33% 100.00% 100.00%
86 Reliance 0.04 100.00% 100.00% NA NA 5:49 NA 93.46% 0.00% 0.03% NA 100.00% 100.00% 97.00% 95.00% 100.00% 100.00%
87 TTSL NA NA NA NA NA 0.00 99.96% NA NIL 0.00% NA NA Nil 99.29% 92.72% NA NA
88 Vodafone 0.44 100.00% NA NA NA 2:11 96.78% NA 0.00% 0.00% NA NA NA 100.00% 100.00% 100.00% NA
89 Bharti 1.80 98.75% 100.00% NA 0 2.10 87.34% NA 0.00% 0.01% NA 100.00% 100.00% 100.00% 98.00% 100.00% 100.00%
90 Sistema 1.55 98.80% 100.00% 100.00% NA 7.82 55.53% NA 0.00% 0.00% NA 100.00% 100.00% 96.02% 93.00% 100.00% 100.00%
91 BSNL 4.41 97.10% 100.00% 100.00% 462 5.37 72.99% NA 0.00% 0.00% 0.00% 100.00% 100.00% 97.03% 20.00% 100.00% 100.00%
92 Reliance 0.11 100.00% 100.00% NA NA 7:50 NA 88.82% 0.00% 0.01% NA 100.00% 100.00% 97.00% 95.00% 100.00% 100.00%
93 TTSL 0.81 100.00% 100.00% 100.00% NA 4.66 99.96% NA NIL 0.00% NA NA Nil 96.96% 93.42% NA NA
94 Vodafone 1.11 100.00% NA NA NA 0:51 91.74% NA 0.00% 0.00% NA NA NA 100.00% 100.00% NA NA
95 Bharti 2.75 94.25% 100.00% NA 0 3.54 91.19% NA 0.00% 0.01% NA 100.00% 100.00% 100.00% 94.00% 100.00% 100.00%
96 BSNL 3.23 93.21% 100.00% 100.00% 694 7.27 83.48% NA 0.00% 0.00% 0.00% 100.00% 100.00% 97.18% 79.33% 100.00% 100.00%
97 Reliance 0.32 100.00% 100.00% NA NA 7:58 NA 93.05% 0.00% 0.03% NA 100.00% 100.00% 97.00% 95.00% 100.00% 100.00%
98 TTSL 2.61 100.00% 100.00% 100.00% NA 3.38 100% NA NIL 0.00% NA NA Nil 99.33% 93.60% NA NA
99 Vodafone 1.02 100.00% NA NA NA 0:24 94.98% NA 0.00% 0.00% NA NA NA 100.00% 100.00% 100.00% NA
100 Bharti 4.58 98.19% 100.00% NA 0 2.87 95.22% NA 0.00% 0.00% NA 100.00% 100.00% 100.00% 98.00% 100.00% 100.00%
101 BSNL 3.51 95.83% 100.00% 100.00% 312 5.77 75.22% NA 0.00% 0.07% NIL 100.00% 100.00% 97.26% 36.67% 100.00% 100.00%
102 Reliance 0.00 NA NA NA NA NA NA 92.74% 0.00% NIL NA NIL NIL 97.00% 95.00% 100.00% 100.00%
103 TTSL NA NA NA NA NA NA 100% NA NIL 0.00% NA NA Nil 99.27% 93.19% NA NA
104 Vodafone 0.25 100.00% NA NA NA 0:55 97.93% NA 0.00% 0.00% NA NA NA 100.00% 100.00% NA NA
105 Bharti 3.19 98.47% 100.00% NA 0 2.19 96.98% NA 0.00% 0.02% NA 100.00% 100.00% 99.00% 98.00% 100.00% 100.00%
106 BSNL 4.76 94.30% 100.00% 100.00% 783 5.54 78.09% NA 0.00% 0.00% 0.00% 100.00% 100.00% 96.97% 38.67% 100.00% 100.00%
107 Uttaranchal BSNL 4.57 94.83% 99.94% 99.99% 121 5.22 67.81% NA 0.00% Nil 0.00% 100.00% 100.00% 97.51% 66.67% 100.00% 100.00%
108 Reliance 0.00 NA NA NA NA NA NA 81.22% 0.00% NIL NA NIL NIL 97.00% 95.00% 100.00% 100.00%
109 TTSL NA NA NA NA NA NA NA NA NIL NA NA NA Nil 95.93% 94.63% NA NA
110 Vodafone NA NA NA NA NA NA NA NA NA NA NA NA NA 100.00% 100.00% NA NA
111 BSNL 4.63 92.16% 100.00% 100.00% 424 6.32 64.09% NA 0.00% 0.05% 0.00% 100.00% 100.00% 98.85% 100.00% 100.00% 100.00%
Benchmark not met NR - Data Not Reported
RAJ
PB
OR
NE
NA - Not Applicable
WB
UPW
UPE
TN

113
Annexure 4.4: Quality of Service Performance of Broadband Service Providers
Service
ProvisioningPacket Loss
%age of
connections
provided
within 15 days
of registration
of demand
% of faults
repaired by
next working
day (>90%)
% of faults
repaired
within 3
working day
Rent
Rebate
%age of bills
disputed
%age of billing
complaints
resolved
within 4
weeks
%age of cases to
whom refund of
deposits is
made within 60
days of closures
%age of calls
answered by
operator (Voice
to voice) within
60 sec
%age of calls
answered by
operator (Voice
to voice) within
90 sec
No. of Intra
network links
having
Bandwidth
utilisation >90%
during peak
hours (TCBH)
No. of Upstream links
for International
connectivity having
bandwidth utilisation
>90% during peak
hours (TCBH)
% International
bandwidth
utilization during
peak hours
(TCBH) (Enclose
MRTG) <90%
Broadband
Connection
Speed available
(download) from
ISP node to user
Packet loss
(for wired
broadband
access) in
%age
User reference
point at
POP/ISP
Gateway node
to IGSP/NIXI
User reference
point at ISP
Gateway node to
International
nearest NAP port
abroad (terrestrial)
User reference
point at ISP
Gateway node to
International
nearest NAP port
abroad (satellite)
100% >90% >99% in nos. <2% 100%100% within
60 days>60% >80% 0 0 <90% >80% >98% <1% <120 ms <350 ms <800 ms
1 BSNL
1.1 All India 100.00% 93.64% 99.58% 820205 0.07% 100.00% 100.00% 52.10% 57.04% 0 3 81.20% 90.23% 99.71% 1.50% 52 233.7 0
2 MTNL
2.1 Delhi 92.46% 81.83% 95.17% 12082 0.140% 100.00% 100.00% 99.85% 99.91% Nil 1 86.71% 95.00% 99.68% C/DNF C/DNF C/DNF NA
2.2 Mumbai 90.11% 90.56% 96.11% 15304 0.01% 100.00% NA 71.00% 73.34% 0 0 88.91% 80.00% 100.00% 1.00% 70 350 NA
3 Bharti Airtel Ltd.
3.1 Andhra Pradesh 100.00% 92.05% 100.00% 0 0.02% 100.00% 100.00% 87.00% 92.00% 0 0 63.10% 98.53% 100.00% 0.00% 32 48.67 NA
3.2 Delhi 100.00% 95.25% 99.24% 651 0.01% 100.00% 100.00% 96.00% 98.00% 0 0 79.36% 109.00% 99.97% 0.00% 31 79.61 NA
3.3 Gujarat 100.00% 95.42% 99.43% 17 0.02% 100.00% 100.00% 86.00% 93.00% 0 NA NA 102.63% 100.00% 0.01% 42 62.84 NA
3.4 Haryana 100.00% 97.96% 99.80% 3 0.00% 100.00% 100.00% 98.00% 99.00% 0 NA NA 103.00% 99.93% 0.00% 32 79.61 NA
3.5 Karnataka 100.00% 90.64% 99.92% 17 0.01% 100.00% 100.00% 88.00% 93.00% 0 0 63.21% 105.41% 99.99% 0.00% 28 39.33 NA
3.6 Kerala 100.00% 95.25% 100.00% 0 0.01% 100.00% 100.00% 94.00% 95.00% 0 NA NA 102.05% 100.00% 0.00% 47 33.67 NA
3.7 Kolkata 100.00% 94.87% 99.23% 57 0.02% 100.00% 100.00% 97.00% 99.00% 0 0 52.20% 114.00% 100.00% 0.00% 27 61.23 NA
3.8 Madhya Pradesh & CG 100.00% 95.49% 99.35% 126 0.01% 100.00% 100.00% 98.00% 99.00% 0 0 82.90% 101.00% 99.97% 0.00% 75 71.62 NA
3.9 Maharashtra 100.00% 96.60% 99.50% 13 0.02% 100.00% 100.00% 93.00% 95.00% 0 NA NA 106.13% 99.87% 0.04% 41 62.84 NA
3.10 Mumbai 100.00% 98.61% 99.86% 6 0.01% 100.00% 100.00% 91.00% 95.00% 0 0 66.28% 100.00% 99.97% 0.00% 25 62.84 NA
3.11 Punjab 100.00% 97.70% 99.71% 17 0.01% 100.00% 100.00% 98.00% 99.00% 0 0 42.90% 104.00% 99.95% 0.00% 39 84 NA
3.12 Rajasthan 100.00% 99.67% 100.00% 0 0.00% 100.00% 100.00% 98.00% 99.00% 0 NA NA 109.00% 99.99% 0.00% 37 79.61 NA
3.13 Tamilnadu 100.00% 95.08% 99.97% 6 0.01% 100.00% 100.00% 92.00% 95.00% 0 0 59.93% 99.61% 99.99% 0.00% 12 33.67 NA
3.14 UP - East 100.00% 97.25% 99.72% 14 0.00% 100.00% 100.00% 98.00% 99.00% 0 NA NA 108.00% 99.99% 0.00% 34 79.61 NA
3.15 UP - West 100.00% 99.27% 99.80% 3 0.00% 100.00% 100.00% 98.00% 99.00% 0 NA NA 103.00% 99.99% 0.00% 29 79.61 NA
4 Hathway
4.1 Andhra Pradesh 100.00% 97.00% 100.00% 223 1.86% 100.00% 100.00% 89.00% 94.00% 0 0 87.00% 85.00% 99.73% 1.00% 75 320 NA
4.2 Delhi 100.00% 95.00% 99.00% 116 1.27% 100.00% 100.00% 95.00% 98.00% NR NR 61.00% 85.00% 99.28% 1.00% 4 298 NA
4.3 Gujarat 100.00% 90.00% 99.00% 0 0.00% NA NA 83.00% 95.00% 0 0 86.00% 85.00% 99.00% 1.00% 100 270 NA
4.4 Karnataka 100.00% 98.00% 100.00% 13 1.87% 100.00% 100.00% 80.00% 86.00% 0 0 87.00% 85.00% 99.55% 1.00% 75 350 NA
4.5 Maharashtra 100.00% 96.00% 99.00% 1031 0.80% 100.00% 100.00% 74.00% 84.00% 0 0 87.00% 85.00% 99.00% 1.00% 100 280 NA
4.6 Punjab 100.00% 98.00% 99.00% 7 1.78% 100.00% 100.00% 99.00% 99.00% NR 0 70.00% 85.00% 99.00% 1.00% 6 285 NA
4.7 Goa 100.00% 95.00% 100.00% 0 0.00% NA NA 74.00% 94.00% 0 0 84.00% 85.00% 98.00% 1.00% 95 250 NA
4.8 Uttar Pradesh 100.00% 96.00% 99.00% 0 1.06% 100.00% 100.00% DNF DNF NR NA 59.00% 85.00% 100.00% 1.00% 8 301 NA
4.9 Chhatisgarh 100.00% 99.00% 100.00% 0 1.10% 100.00% 100.00% 99.00% 99.00% 0 0 73.00% 85.00% 99.00% 1.00% 8 305 NA
5
Quadrant
Televentures
Ltd.(Formerly HFCL
Infotel Ltd.)
Punjab 100.00% 96.33% 99.82% 7 0.01% 100.00% 100.00% 76.67% 83.67% Nil Nil 80.00% 100.00% 99.93% 0.00% 80 280 NA
6Tata Teleservices
(Maharashtra) Ltd.
Maharashtra & Goa 100.00% 92.49% 100.00% Nil 0.39% 100.00% NA 92.00% 96.50% 0 0 78.00% 94.87% 99.73% 0.00% 30 193 NA
Performance Monitoring Report on Quality of Service of Broadband Service Providers for Quarter Ending December, 2013
Sl. No.Service
Operators/Service area
Faults Repair Billing PerformanceResponse Time to the
Customer for assistanceBandwidth utilisation/throughput
Service
availability
/uptime (for
all users) in
%age
Network latency (for wired broadband access)

114
Annexure 4.4 (Contd.)
7 Beam Cables
Hyderabad 100.00% 91.33% 99.00% 2856 2.00% 100.00% NA 76.52% 85.76% 0 0 66.30% 80.00% 98.66% 1.00% 50 300 NA
8Broadband Pacenet
India Private Ltd.
8.1 Mumbai 100.00% 90.00% 99.00% 55 0.00% 100.00% NA 66.00% 82.00% 0 0 81.00% DNF 99.00% 1.00% 50 280 NA
8.2 Mumbai-Pune 100.00% 92.00% 100.00% 17 NR 100.00% NA 72.00% 83.00% 0 0 79.00% DNF 99.00% 1.00% 50 280 NA
8.3 All India 100.00% 91.00% 99.00% 54 0.00% NA NA 68.00% 83.00% 0 0 81.00% DNF 99.00% 1.00% 75 310 NA
8.4 Madhya Pradesh 100.00% 92.00% 100.00% 0 0.00% 100.00% NA 72.00% 92.00% 0 0 65.00% DNF 99.00% 1.00% 50 280 NA
8.5 Gujarat 100.00% 91.00% 100.00% 15 1.00% 100.00% NA 70.00% 85.00% 0 0 65.00% DNF 99.00% 1.00% 50 280 NA
8.6 Rajasthan 100.00% 91.00% 100.00% 0 0.00% NA NA 72.00% 82.00% 0 0 80.00% DNF 99.00% 1.00% 50 280 NA
8.7 Gujarat 100.00% 92.00% 100.00% 15 1.00% 100.00% NA 67.00% 84.00% 0 0 77.00% DNF 99.00% 1.00% 50 280 NA
9Tikona Digital
Network
All India 100.00% 93.37% 99.47% 1847 0.40% 100.00% 100.00% 80.00% 82.00% 0 0 66.07% 98.92% 99.65% NA NA NA NA
10
Asianet Satellite
Communications
Ltd.
Kerala 100.00% 91.33% 99.54% NR 1.20% 100.00% 100.00% NR NR 0 0 62.96% 90.00% 99.50% 1.00% 50 270 NA
11
Induslnd Media &
Communications
Ltd. (Broadband
Division)
All India 100.00% 97.00% 99.00% 40 0.00% 100.00% 100.00% 100.00% 100.00% 0 0 77.98% 80.00% 96.00% 1.00% 45 260 NA
12Gujarat Telelink Pvt.
Ltd.
Gujarat 100.00% 96.00% 99.00% 64 0.84% 100.00% NA 96.00% 99.00% NA 0 89.00% 91.00% 97.97% 0.00% 11 300 NA
13 D-Vois Broadband
All India 100.00% 93.00% 98.00% NR 0.00% 100.00% NR 99.00% 99.00% 0 0 0.00% 90.00% 99.99% 0.10% 100 100 100
14Tata
Communications14.1 Andhra Pradesh 100.00% 96.00% 99.00% 0.00% 100.00% 100.00% 99.26%
14.2 Assam NA 100.00% 100.00% NA NA 100.00% 99.55%
14.3 Delhi & NCR NA 99.00% 100.00% 0.03% 100.00% 100.00% 99.91%
14.4Gujarat & Daman &
Du100.00% 98.00% 100.00% 0.03% 100.00% 100.00% 99.15%
14.5 Haryana NA 100.00% 100.00% 0.00% 100.00% 100.00% 99.69%
14.6 Himachal Pradesh NA 100.00% 100.00% 0.00% 100.00% 100.00% 99.86%
14.7 Jammu & Kashmir NA 100.00% 100.00% NA NA 100.00% 99.96%
14.8 Karnataka NA 97.00% 99.00% 0.01% 100.00% 100.00% 99.78%
14.9Kerala &
Lakshadweep100.00% 94.00% 100.00% 0.00% 100.00% 100.00% 98.06%
14.10Madhya Pradesh &
ChhattisgarhNA 98.00% 100.00% 0.00% 100.00% 100.00% 98.45%
14.11 Maharashtra & Goa 100.00% 94.00% 98.00% 0.03% 100.00% 100.00% 98.22%
14.12 Mumbai 100.00% 96.00% 99.00% 0.02% 100.00% 100.00% 99.10%
14.13 North Eastern NA 100.00% 100.00% NA NA 100.00% 99.63%
14.14 Orissa NA 100.00% 100.00% 0.00% 100.00% 100.00% 99.48%
14.15 Punjab NA 96.00% 99.00% 0.00% 100.00% 100.00% 99.95%
14.16 Rajasthan NA 93.00% 100.00% 0.00% 100.00% 100.00% 99.86%
14.17Tamil Nadu &
Pondicherry100.00% 96.00% 99.00% 0.04% 100.00% 100.00% 98.61%
14.18 Uttar Pradesh - East NA 96.00% 100.00% 0.00% 100.00% 100.00% 99.80%
14.19 Uttar Pradesh -West NA 100.00% 100.00% NA NA 100.00% 99.95%
14.20 West Bengal NA 100.00% 100.00% NA NA 100.00% 99.72%
14.21 Kolkata 100.00% 95.00% 99.00% 0.02% 100.00% 100.00% 99.03%
14.22 Bihar & Jharkhand 100.00% 100.00% 100.00% 0.00% 100.00% 100.00% 99.92%
80.00% 0.00% 50 245 NA335 94.00% 96.00% 0 0 54.00%

115
Annexure 4.4 (Contd.)
15Ortel
Communications
Orissa 100.00% 92.00% 100.00% NR 0.00% NA NA 100.00% 100.00% 0 0 78.00% 92.33% 99.14% 0.00% 86 257 NA
16Reliance
Communications
All India 100.00% 100.00% 100.00% NA 0.17% 100.00% 100.00% 95.00% 98.00% 0 0 42.69% 89.00% 99.58% 0.55% DNF DNF DNF
17You Broadband India
Pvt Ltd
17.1 All India 95.00% 93.00% 99.00% 491 1.00% 100.00% 100.00% 76.00% 83.00% NA 0 70.62% 87.08% 99.14% 0.00% 10 269 NA
17.2 Maharashtra 97.00% 95.00% 99.00% 85 1.00% 100.00% 100.00% 58.00% 64.00% NA 0 70.42% 86.09% 99.63% 0.00% 9 276 NA
17.3 Gujarat 93.00% 92.00% 99.00% 181 1.00% 100.00% 100.00% 73.00% 76.00% NA 0 70.91% 87.92% 98.78% 0.00% 12 263 NA
17.4 Karnataka 100.00% 90.00% 98.00% 46 1.00% 100.00% 100.00% 86.00% 91.00% NA 0 70.31% 86.81% 98.94% 0.00% 9 265 NA
17.5 Tamilnadu 97.00% 94.00% 99.00% 29 1.00% 100.00% 100.00% 82.00% 93.00% NA 0 71.67% 87.15% 98.81% 0.00% 8 268 NA
17.6 Haryana 99.00% 92.00% 99.00% 15 0.00% 100.00% 99.00% 89.00% 95.00% NA 0 70.48% 88.15% 99.87% 0.00% 8 268 NA
17.7 Andhra Pradesh 99.09% 92.00% 98.00% 135 0.00% 100.00% 100.00% 67.00% 80.00% NA 0 70.28% 86.39% 99.42% 0.00% 10 271 NA
18 Five Networks
All India 100.00% 99.50% 100.00% NA NR 100.00% 100.00% NA NA NA 0 NA 90.00% 99.00% 1.00% NA NA NA
19Noida Software
Technology
All India 100.00% 100.00% NA Nil NA NA NA 85.00% 100.00% NR NA NA 98.00% 99.28% 1.00% 15 200 NA
20Atria Convergence
Tech
All India100.00% 79.00% 96.00% 1593 0.07% 100.00% NA 91.00% 94.00% Nil Nil 89.00% 95.00% 99.70% 1.00% 42 212 Nil
21Citycom Networks
Pvt. Ltd.
All India 100.00% 90.30% 99.00% 0 1.02% 100.00% 100.00% 89.00% 92.00% 0 0 57.00% 86.97% 99.20% 1.00% 4 167 NA
22Digital Network
associates
MH & Goa 100.00% 90.68% 99.34% None 0.64% 100.00% NA 62.25% 81.68% None 0 80.00% 80.00% 99.73% 1.00% 4 255 NR
23Southern Online Bio
technologies Ltd.
Andhra Pradesh 100.00% 90.00% 99.00% 0 0.00% NA NA NA 316.00% 0 0 75.00% 90.00% 99.00% 1.00% 120 350 NA
24 Vasai Cable Pvt Ltd.
Mumbai 100.00% 97.28% 99.82% None 0.56% 100.00% NA 76.10% 90.21% 0 0 80.00% 80.00% 99.19% 1.00% 4 255 NR
25Rajesh Multichannel
Pvt Ltd.
Mumbai 100.00% 97.00% NR 0 0.00% 100.00% NA 92.00% 87.00% 0 0 86.00% NR 99.00% NR NR NR NR
26 Chandranet
Gujarat 100.00% 93.97% 99.92% 154 NR 100.00% 100.00% 80.96% 92.30% 0 0 86.00% 97.00% 99.00% NR NR NR NR
27Home Systems
Private Limited
Mumbai 99.00% 97.00% 99.99% NA 0.00% NA NA 84.66% 92.00% 0 0 75.00% 95.00% 98.00% 0.01% 50 295 NA
28Honesty Net
Solutions Pvt Ltd
Mumbai 100.00% 92.00% 99.10% NA 0.00% 100.00% NA 85.00% 100.00% NA 0 88.00% 87.00% 98.00% 0.00% 69 311 NA
29Siti Cable Network
Ltd
All India 100.00% 92.66% 100.00% 139 0.00% NA NA 68.00% 100.00% 0 3 88.67% 87.00% 99.23% 0.48% 6 51.67 180
30Syscon Infoway
Private Limited
30.1 Maharashtra 100.00% 96.00% 100.00% nil 0.00% 100.00% 100.00% 80.00% 100.00% 0 0 83.33% 99.00% 100.00% 1.00% 10 250 nil
30.2 Mumbai 100.00% 96.00% 100.00% nil 0.00% 100.00% 100.00% 80.00% 100.00% 0 0 85.00% 99.00% 99.00% 1.00% 10 250 NR
DNF= Data not as per Format NR= Data not reported by the Service Provider NA = Not ApplicableC/DNF= Complied the parameter but
Data is not in the required format

116
Annexure 5.1: A -la-carte rates of pay channels for non-CAS areas, as reported to TRAI by the respective Broadcasters
S.No Name of the channel Reported Rates( in INR)
1 Zee TV 13.88
2 Zee Cinema 13.88
3 Cartoon Network 13.37
4 Zee Marathi 08.56
5 Zee News 08.02
6 CNN 01.60
7 Zee Café 08.56
8 Zee Studios 07.49
9 Zee Bangla 08.67
10 Zee Punjabi 01.60
11 Zee Trendz 01.07
12 HBO 16.69
13 POGO 13.37
14 Zee Business 05.14
15 Zee Classic 10.70
16 Zee Action 10.70
17 Zee Premier 11.98
18 Zee Telugu 11.13
19 Zee Kannada 07.98
20 ETC Punjabi 09.63
21 ETC 03.21
22 Zing 05.35
23 Zee Jagran 02.14
24 Zee Smile 06.57
25 24 Ghante 06.42
26 24 Taas 09.09
27 Zee Talkies 16.58
28 WB 06.60
29 Zee 24 Ghantalu 05.60
30 Zee Salaam 15.00
31 9X 20.50
32 Star Plus 18.73
33 Star Gold 17.66
34 Star Movies 17.66
35 Star World 04.87
36 Vijay TV 04.28
37 NGC 06.15
38 Fox Traveller channel 04.71
39 Channel V 01.07

117
Annexure 5.1 (contd.)
S.No Name of the channel Reported Rates( in INR)
40 Life Ok 21.94
41 The MGM 06.42
42 Star Jalsha 12.00
43 ABP Ananda 06.00
44 FX 15.50
45 FOX CRIME 15.50
46 BABY TV 13.25
47 Nat Geo Wild 16.00
48 Nat Geo Adventure 16.00
49 Nat GEO Music 07.40
50 Asianet 12.45
51 Star Pravah 12.00
52 Star Movies Action 15.00
53 Movies OK 17.00
54 NDTV 24X7 09.10
55 NDTV Profit 06.42
56 NDTV Good Times 09.63
57 Suvarna 12.00
58 Asianet Plus 07.00
59 NDTV India 08.02
60 Zee Bangla Cinema 16.20
61 ABP Majha 09.20
62 SET(Sony Entertainment Television) 21.40
63 MAX 18.19
64 Discovery 16.05
65 Animal Planet 05.35
66 AXN 15.52
67 Animax 0.50
68 TLC 09.63
69 SAB TV 14.70
70 SET PIX 12.84
71 Aaj Tak 07.49
72 Headlines Today 03.21

118
Annexure 5.1 (contd.)
S.No Name of the channel Reported Rates( in INR)
73 Tez 02.14
74 Channel 8 (Sony AATH) 10.00
75 Discovery Science 12.00
76 Discovery Turbo 10.00
77 Neo Sports 26.60
78 NEO Prime 35.45
79 Discovery Channel – Tamil 16.05
80 MIX 07.50
81 Discovery Kids 13.25
82 SIX 35.00
83 ET NOW 08.50
84 Times Now 09.10
85 Zoom 08.35
86 The Disney Channel 09.52
87 Disney XD 09.52
88 Hangama TV 08.35
89 IBN 7 07.49
90 IBN Lokmat 07.86
91 Colors 21.40
92 MTV 07.49
93 NICK 06.42
94 VH 1 03.21
95 CNBC TV 18 09.10
96 CNN-IBN 05.35
97 CNBC Awaaz 04.82
98 ETV 10.70
99 ETV 2 05.99
100 ETV Bangla 11.12
101 ETV Marathi 11.12
102 ETV Kannada 11.12
103 ETV Gujarathi 11.12
104 ETV Oriya 11.12
105 ETV UP 11.12
106 ETV Bihar 11.12
107 ETV Urdu 11.12
108 ETV Rajasthan 11.12
109 ETV MP 11.12
110 Bindass 10.00
111 UTV Action 10.00
112 World Movies 10.00

119
Annexure 5.1 (contd.)
S.No Name of the channel Reported
Rates( in INR)
113 UTV Movies 15.00
114 Disney Junior 13.37
115 Nick Jr / Teen Nick 13.37
116 Comedy Central 15.50
117 SONIC 13.00
118 SUN TV 13.26
119 Gemini TV 11.02
120 Udaya TV 12.30
121 K TV 16.06
122 Gemini Comedy 05.68
123 Udaya Movies 15.40
124 Sun Music 07.50
125 Gemini Music 07.50
126 Sun News 01.50
127 Gemini News 08.02
128 Udaya News 07.86
129 Gemini Movies 18.20
130 Chintu TV 13.37
131 Udaya Comedy 16.06
132 Kushi TV 13.37
133 Chutti TV 13.37
134 Udaya Music 07.49
135 Adithya TV 18.19
136 Surya TV 12.31
137 Kiran TV 18.19
138 Sun News English 08.00
139 Gemini Life 11.13
140 SUN TV RI 12.50
141 SUN Life 12.50
142 BBC World 05.35
143 Star Sports 4 35.45
144 Star Sports 1 35.45
145 Star Sports 3 29.96
146 Fox Sports News 09.10
147 Star Sports 2 36.00
148 Raj TV 11.77
149 Raj Digital Plus 08.26
150 Vissa TV 05.01
151 Raj Musix 05.00
152 Raj News (24X7) 04.00

120
Annexure 5.1 (contd.)
S.No Name of the channel Reported Rates( in INR)
153 9XM 07.00
154 9X Jhakaas 05.00
155 9XO 05.00
156 9X Jalwa 05.00
157 Sahara One 20.50
158 Filmy 16.50
159 B4U Movies 06.65
160 MAA TV 06.00
161 MAA Music 07.50
162 MAA Movies 18.50
163 MAA Gold 11.00
164 Dilli Aaj Tak 08.50
165 E-24 15.00
166 Toonami 13.37
167 Tarang 10.70
168 Tarang Music 05.00
169 Prarthana 05.00
170 Ten Sports 16.05
171 Ten Cricket 35.45
172 Ten Action 35.00
173 BIG CBS PRIME 14.00
174 BIG CBS LOVE 11.00
175 BIG CBS SPARK 11.00
176 BIG CBS Spark Punjabi 11.00
177 BIG MAGIC 11.00
178 Bloomberg UTV 08.50
179 9X Tashan 05.00
180 Sarthak TV 09.50
181 Jaya TV 09.00
182 Jaya Plus 04.00
183 Jaya Max 06.00
184 J Movies 06.00
185 Mega TV 05.00
186 Mega Musiq 05.00
187 Mega 24 05.00

121
Annexure 5.2: List of operational private FM Radio Stations in India
S.NO. CITY NAME OF THE COMPANY CHANNEL
IDENTITY
DATE OF
OPERATIONALISATION
1 DELHI CLEAR MEDIA HIT-FM 01.09.2006
2 DELHI DIGITAL RADIO RED-FM 29.04.2003
3 DELHI E.N.I.L. RADIO- MIRCHI 29.04.2003
4 DELHI H.T. MEDIA FEVER 104 30.10.2006
5 DELHI M.B.P.L. RADIO-CITY 29.04.2003
6 DELHI RADIO-ONE LTD. RADIO-ONE [1] 23.09.2006
7 DELHI T.V. TODAY BROADCASTING LTD RADIO- MEOW 28.05.2007
8 DELHI RELIANCE COMMUNICATIONS GROUP BROADCAST NETWORK LTD.
BIG-FM 24-09-2006
9 MUMBAI RELIANCE COMMUNICATIONS GROUP BROADCAST NETWORK LTD.
BIG-FM 14.11.2006
10 MUMBAI DIGITAL RADIO RED-FM 29.04.2002
11 MUMBAI E.N.I.L. RADIO- MIRCHI 29.04.2002
12 MUMBAI H.T. MEDIA FEVER 104 15.01.2007
13 MUMBAI M.B.P.L. RADIO-CITY 21.05.2002
14 MUMBAI T.V. TODAY BROADCASTING LTD RADIO- MEOW 26.01.2008
15 MUMBAI RADIO-ONE LTD. RADIO-ONE [1] 29.04.2003
16 KOLKATA RELIANCE COMMUNICATIONS GROUP BROADCAST NETWORK LTD.
BIG-FM 21.10.2006
17 KOLKATA T.V. TODAY BROADCASTING LTD RADIO- MEOW 04.10.2007
18 KOLKATA ANANDA OFFSET FRIEND 91.9 28.02.2007
19 KOLKATA DIGITAL RADIO RED-FM 03.05.2003
20 KOLKATA E.N.I.L. RADIO- MIRCHI 03.05.2003
21 KOLKATA HITZ FM POWER-FM 03.05.2003
22 KOLKATA INDIA FM AMAR-FM 03.05.2003
23 KOLKATA RADIO-ONE LTD. RADIO-ONE [1] 12.12.2008
24 KOLKATA H.T. MEDIA FEVER 104 23.01.2008
25 CHENNAI RELIANCE COMMUNICATIONS GROUP BROADCAST NETWORK
LTD.
BIG-FM 27.09.2006
26 CHENNAI E.N.I.L. RADIO- MIRCHI 05.05.2003
27 CHENNAI M.B.P.L. RADIO-CITY 10.07.2006
28 CHENNAI MALAR PUBLICATIONS HELLO-FM 02.10.2006
29 CHENNAI MUTHOOT BROADCASTING PVT. LTD.
CHENNAI LIVE 04.01.2008
30 CHENNAI NOBLE BROADCASTING AAHAA-FM 18.01.2007
31 CHENNAI RADIO-ONE LTD. RADIO-ONE [1] 10.01.2007
32 CHENNAI SUN TV SURYANA FM 05.05.2003

122
Annexure 5.2 (Contd.)
S.NO. CITY NAME OF THE COMPANY CHANNEL IDENTITY
DATE OF OPERATIONALISATION
33 AGARTALA POSITIVE RADIO OOLALA FM 07.08.2007
34 AGRA RELIANCE COMMUNICATIONS GROUP BROADCAST NETWORK LTD.
BIG-FM 18.08.2007
35 AGRA SHRI PURAN MULTIMEDIA MANTRA FM 08.07.2007
36 AHMEDABAD E.N.I.L. RADIO- MIRCHI 10.12.2001
37 AHMEDABAD M.B.P.L. RADIO-CITY 25.07.2007
38 AHMEDABAD RADIO-ONE LTD. RADIO-ONE [1] 26.08.2007
39 AHMEDABAD SOUTH ASIA S. FM 20.04.2008
40 AHMEDABAD D. B. CORP. MY-FM 21.07.2007
41 AHMEDNAGAR B.A.G. INFOTAINMENT RADIO- DHAMAL 01.03.2008
42 AHMEDNAGAR M.B.P.L. RADIO-CITY 07.02.2008
43 AJMER RELIANCE COMMUNICATIONS GROUP BROADCAST NETWORK LTD.
BIG-FM 28-08-2007
44 AJMER D. B. CORP. MY-FM 31.08.2007
45 AKOLA M.B.P.L. RADIO-CITY 13.03.2008
46 ALIGARH RELIANCE COMMUNICATIONS GROUP BROADCAST NETWORK LTD.
BIG-FM 08.12.2006
47 ALLAHABAD RELIANCE COMMUNICATIONS GROUP BROADCAST NETWORK LTD.
BIG-FM 29.10.2007
48 ALLAHABAD SOUTH ASIA S. FM 18.03.2008
49 AMRITSAR RELIANCE COMMUNICATIONS GROUP BROADCAST NETWORK LTD.
BIG-FM 01.08.2007
50 AMRITSAR T.V. TODAY BROADCASTING LTD RADIO- MEOW 15.05.2008
51 AMRITSAR D. B. CORP. MY-FM 27-07-2007
52 ASANSOL RELIANCE COMMUNICATIONS GROUP BROADCAST NETWORK LTD.
BIG-FM 29.06.2007
53 ASANSOL SOUTH ASIA S. FM 03.06.2008
54 AURANGABAD E.N.I.L. RADIO- MIRCHI 24.07.2007
55 AURANGABAD SOUTH ASIA S. FM 21.04.2008
56 BANGALURU RELIANCE COMMUNICATIONS GROUP BROADCAST NETWORK LTD.
BIG-FM 09.10.2006
57 BANGALURU E.N.I.L. RADIO- MIRCHI 17.04.2006
58 BANGALURU H.T. MEDIA FEVER 104 06.03.2007
59 BANGALURU INDIA RADIO VENTURES RADIO- INDIGO 01.10.2006
60 BANGALURU KAL RADIO S. FM 06.11.2006
61 BANGALURU M.B.P.L. RADIO-CITY 10.06.2001
62 BANGALURU RADIO-ONE LTD. RADIO-ONE [1] 01.08.2006
63 BAREILLY RELIANCE COMMUNICATIONS GROUP BROADCAST NETWORK LTD.
BIG-FM 30.03.2007
64 BAREILLY SHRI PURAN MULTIMEDIA MANTRA FM 09.04.2007
65 BHOPAL RELIANCE COMMUNICATIONS GROUP BROADCAST NETWORK LTD.
BIG-FM 20.05.2007
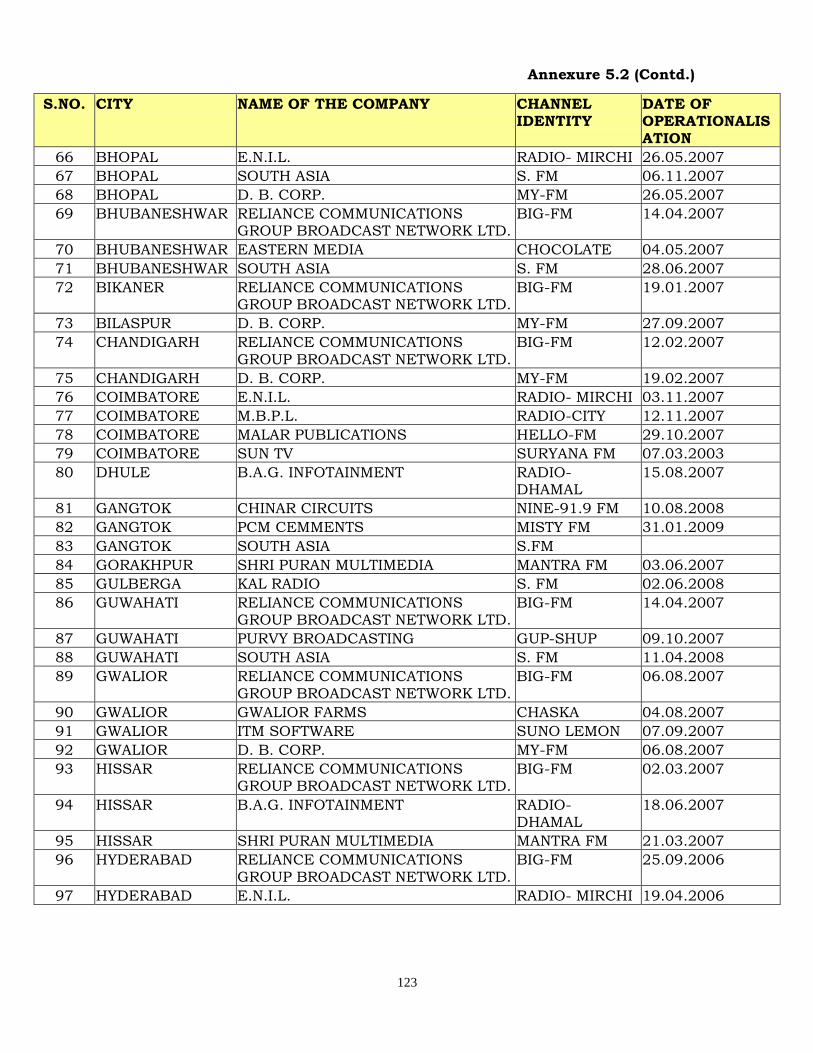
123
Annexure 5.2 (Contd.)
S.NO. CITY NAME OF THE COMPANY CHANNEL IDENTITY
DATE OF OPERATIONALISATION
66 BHOPAL E.N.I.L. RADIO- MIRCHI 26.05.2007
67 BHOPAL SOUTH ASIA S. FM 06.11.2007
68 BHOPAL D. B. CORP. MY-FM 26.05.2007
69 BHUBANESHWAR RELIANCE COMMUNICATIONS GROUP BROADCAST NETWORK LTD.
BIG-FM 14.04.2007
70 BHUBANESHWAR EASTERN MEDIA CHOCOLATE 04.05.2007
71 BHUBANESHWAR SOUTH ASIA S. FM 28.06.2007
72 BIKANER RELIANCE COMMUNICATIONS GROUP BROADCAST NETWORK LTD.
BIG-FM 19.01.2007
73 BILASPUR D. B. CORP. MY-FM 27.09.2007
74 CHANDIGARH RELIANCE COMMUNICATIONS GROUP BROADCAST NETWORK LTD.
BIG-FM 12.02.2007
75 CHANDIGARH D. B. CORP. MY-FM 19.02.2007
76 COIMBATORE E.N.I.L. RADIO- MIRCHI 03.11.2007
77 COIMBATORE M.B.P.L. RADIO-CITY 12.11.2007
78 COIMBATORE MALAR PUBLICATIONS HELLO-FM 29.10.2007
79 COIMBATORE SUN TV SURYANA FM 07.03.2003
80 DHULE B.A.G. INFOTAINMENT RADIO- DHAMAL
15.08.2007
81 GANGTOK CHINAR CIRCUITS NINE-91.9 FM 10.08.2008
82 GANGTOK PCM CEMMENTS MISTY FM 31.01.2009
83 GANGTOK SOUTH ASIA S.FM
84 GORAKHPUR SHRI PURAN MULTIMEDIA MANTRA FM 03.06.2007
85 GULBERGA KAL RADIO S. FM 02.06.2008
86 GUWAHATI RELIANCE COMMUNICATIONS GROUP BROADCAST NETWORK LTD.
BIG-FM 14.04.2007
87 GUWAHATI PURVY BROADCASTING GUP-SHUP 09.10.2007
88 GUWAHATI SOUTH ASIA S. FM 11.04.2008
89 GWALIOR RELIANCE COMMUNICATIONS GROUP BROADCAST NETWORK LTD.
BIG-FM 06.08.2007
90 GWALIOR GWALIOR FARMS CHASKA 04.08.2007
91 GWALIOR ITM SOFTWARE SUNO LEMON 07.09.2007
92 GWALIOR D. B. CORP. MY-FM 06.08.2007
93 HISSAR RELIANCE COMMUNICATIONS GROUP BROADCAST NETWORK LTD.
BIG-FM 02.03.2007
94 HISSAR B.A.G. INFOTAINMENT RADIO- DHAMAL
18.06.2007
95 HISSAR SHRI PURAN MULTIMEDIA MANTRA FM 21.03.2007
96 HYDERABAD RELIANCE COMMUNICATIONS GROUP BROADCAST NETWORK LTD.
BIG-FM 25.09.2006
97 HYDERABAD E.N.I.L. RADIO- MIRCHI 19.04.2006

124
Annexure 5.2 (Contd.)
S.NO. CITY NAME OF THE COMPANY CHANNEL IDENTITY
DATE OF OPERATIONALISATION
98 HYDERABAD KAL RADIO S. FM 06.11.2006
99 HYDERABAD M.B.P.L. RADIO-CITY 30.05.2006
100 INDORE RELIANCE COMMUNICATIONS GROUP BROADCAST NETWORK LTD.
BIG-FM 03.08.2007
101 INDORE E.N.I.L. RADIO- MIRCHI 01.10.2001
102 INDORE SOUTH ASIA S. FM 09.12.2007
103 INDORE D. B. CORP. MY-FM 11.08.2007
104 ITANAGAR POSITIVE RADIO OOLALA FM 05.08.2008
105 JABALPUR B.A.G. INFOTAINMENT RADIO- DHAMAL
01.03.2008
106 JABALPUR E.N.I.L. RADIO- MIRCHI 15.02.2008
107 JABALPUR SOUTH ASIA S. FM 19.03.2008
108 JABALPUR D. B. CORP. MY-FM 15.02.2008
109 JAIPUR E.N.I.L. RADIO- MIRCHI 17.04.2006
110 JAIPUR M.B.P.L. RADIO-CITY 08.09.2006
111 JAIPUR RAJASTHAN PATRIKA RADIO- TADKA 15.08.2006
112 JAIPUR SOUTH ASIA S. FM 06.11.2006
113 JAIPUR D. B. CORP. MY-FM 28.05.2006
114 JALANDHAR RELIANCE COMMUNICATIONS GROUP BROADCAST NETWORK LTD.
BIG-FM 14.04.2007
115 JALANDHAR E.N.I.L. RADIO- MIRCHI 24.04.2007
116 JALANDHAR SHRI PURAN MULTIMEDIA MANTRA FM 14.04.2007
117 JALANDHAR D. B. CORP. MY-FM 19.04.2007
118 JALGOAN B.A.G. INFOTAINMENT RADIO- DHAMAL
22.04.2008
119 JALGOAN M.B.P.L. RADIO-CITY 21.05.2008
120 JAMMU RELIANCE COMMUNICATIONS GROUP BROADCAST NETWORK LTD.
BIG-FM 07.12.2006
121 JAMSHED PUR RELIANCE COMMUNICATIONS GROUP BROADCAST NETWORK LTD.
BIG-FM 07.11.2007
122 JAMSHED PUR SOUTH ASIA S. FM 13.04.2008
123 JAMSHED PUR NEUTRAL PUBLICATION DHOOM FM 18.07.2008
124 JHANSI RELIANCE COMMUNICATIONS GROUP BROADCAST NETWORK LTD.
BIG-FM 19.01.2007
125 JODHPUR RELIANCE COMMUNICATIONS GROUP BROADCAST NETWORK LTD.
BIG-FM 14.12.2007
126 JODHPUR T.V. TODAY BROADCASTING LTD RADIO- MEOW 01.06.2008
127 JODHPUR D. B. CORP. MY-FM 20.12.2007
128 KANNUR ASIANET RADIO PVT. LTD. BEST FM 13.01.2008
129 KANNUR KAL RADIO S. FM 12.03.2008*
130 KANNUR MALAYALLA MANORAMA MANGO FM 30.12.2007
131 KANNUR THE MATHRABHUMI CLUB-FM 30.12.2007

125
Annexure 5.2 (Contd.)
S.NO. CITY NAME OF THE COMPANY CHANNEL IDENTITY
DATE OF OPERATIONALISATION
132 KANPUR RELIANCE COMMUNICATIONS GROUP BROADCAST NETWORK LTD.
BIG-FM 14.06.2007
133 KANPUR E.N.I.L. RADIO- MIRCHI 16.06.2007
134 KANPUR SOUTH ASIA S. FM 28.01.2008
135 KARNAL B.A.G. INFOTAINMENT RADIO- DHAMAL
18.06.2007
136 KARNAL SHRI PURAN MULTIMEDIA MANTRA FM 02.04.2007
137 KOCHI KAL RADIO S. FM 17.05.2008*
138 KOCHI MALAYALLA MANORAMA MANGO FM 18.05.2008
139 KOCHI THE MATHRABHUMI CLUB-FM 17.05.2008
140 KOLHAPUR E.N.I.L. RADIO- MIRCHI 18.09.2007
141 KOLHAPUR PUDHARI PUBLICATION TOMOTO FM 21.09.2007
142 KOTA RELIANCE COMMUNICATIONS GROUP BROADCAST NETWORK LTD.
BIG-FM 21.01.2008
143 KOTA RAJASTHAN PATRIKA RADIO- TADKA 25.02.2008
144 KOTA D. B. CORP. MY-FM 02.02.2008
145 KOZHIKKODE KAL RADIO S. FM 07.12.2007
146 KOZHIKKODE MALAYALLA MANORAMA MANGO FM 29.11.2007
147 LUCKNOW E.N.I.L. RADIO- MIRCHI 13.08.2007
148 LUCKNOW M.B.P.L. RADIO-CITY 10.12.2001
149 LUCKNOW SOUTH ASIA S. FM 06.11.2007
150 MADURAI E.N.I.L. RADIO- MIRCHI 28-09.2007
151 MADURAI KAL RADIO S. FM 05.10.2007
152 MADURAI MALAR PUBLICATIONS HELLO-FM 01.10.2007
153 MANGALORE RELIANCE COMMUNICATIONS GROUP BROADCAST NETWORK LTD.
BIG-FM 24.11.2007
154 MANGALORE E.N.I.L. RADIO- MIRCHI 24.11.2007
155 MANGALORE KAL RADIO S. FM 21.02.2008
156 MUZAFFARPUR B.A.G. INFOTAINMENT RADIO- DHAMAL
01.08.2007
157 MYSORE RELIANCE COMMUNICATIONS GROUP BROADCAST NETWORK LTD.
BIG-FM 14.10.2007
158 MYSORE KAL RADIO S. FM 07.12.2007
159 NAGPUR E.N.I.L. RADIO- MIRCHI 18.10.2007
160 NAGPUR M.B.P.L. RADIO-CITY 21.10.2007
161 NAGPUR SOUTH ASIA S. FM 04.05.2008
162 NAGPUR D. B. CORP. MY-FM 21.10.2007
163 NANDED M.B.P.L. RADIO-CITY 15.05.2008
164 NASIK E.N.I.L. RADIO- MIRCHI 06.07.2007
165 NASIK SOUTH ASIA S. FM 16.04.2008
166 PANAJI RELIANCE COMMUNICATIONS GROUP BROADCAST NETWORK LTD.
BIG-FM 22.05.2007
167 PANAJI E.N.I.L. RADIO- MIRCHI 22.05.2007

126
Annexure 5.2 (Contd.)
S.NO. CITY NAME OF THE COMPANY CHANNEL IDENTITY
DATE OF OPERATIONALISATION
168 PANAJI INDIA RADIO VENTURES RADIO INDIGO 25.06.2007
169 PATIALA RELIANCE COMMUNICATIONS GROUP BROADCAST NETWORK LTD.
BIG-FM 01.08.2007
170 PATIALA B.A.G. INFOTAINMENT RADIO- DHAMAL
18.06.2007
171 PATIALA T.V. TODAY BROADCASTING LTD RADIO- MEOW 01.06.2008
172 PATNA E.N.I.L. RADIO- MIRCHI 02.04.2007
173 PUDUCHERRY (UT)
RELIANCE COMMUNICATIONS GROUP BROADCAST NETWORK LTD.
BIG-FM 01.12.2007
174 PUDUCHERRY (UT)
KAL RADIO S. FM 20.12.2007
175 PUDUCHERRY (UT)
MALAR PUBLICATIONS HELLO-FM 22.12.2007
176 PUNE E.N.I.L. RADIO- MIRCHI 18.10.2002
177 PUNE M.B.P.L. RADIO-CITY 06.04.2008
178 PUNE RADIO-ONE LTD. RADIO-ONE [1] 12.05.2008
179 PUNE SOUTH ASIA S. FM 22.07.2008
180 RAIPUR E.N.I.L. RADIO- MIRCHI 11.01.2008
181 RAIPUR RAJASTHAN PATRIKA RADIO- TADKA 10.02.2009
182 RAIPUR RANEKA FINCOM RANGILA 104.8 15.01.2008
183 RAIPUR D. B. CORP. MY-FM 16.01.2008
184 RAJAHMUNDRY KAL RADIO S. FM 19.01.2008
185 RAJKOT RELIANCE COMMUNICATIONS GROUP BROADCAST NETWORK LTD.
BIG-FM 13.06.2007
186 RAJKOT E.N.I.L. RADIO- MIRCHI 13.06.2007
187 RAJKOT SOUTH ASIA S. FM 18.04.2008
188 RANCHI RELIANCE COMMUNICATIONS GROUP BROADCAST NETWORK LTD.
BIG-FM 24.10.2007
189 RANCHI B.A.G. INFOTAINMENT RADIO- DHAMAL
15.11.2007
190 RANCHI SHRI PURAN MULTIMEDIA MANTRA FM 27.10.2007
191 RANCHI NEUTRAL PUBLICATION DHOOM FM 18.07.2008
192 ROURKELA RELIANCE COMMUNICATIONS GROUP BROADCAST NETWORK LTD.
BIG-FM 06.01.2008
193 ROURKELA EASTERN MEDIA RADIO- CHOCOLATE
22.01.2008
194 SANGLI M.B.P.L. RADIO-CITY 08.02.2008
195 SANGLI PUDHARI PUBLICATION TOMOTO FM 21.09.2009
196 SHILLONG SOUTH ASIA S. FM 13.06.2008
197 SHIMLA RELIANCE COMMUNICATIONS GROUP BROADCAST NETWORK LTD.
BIG-FM 25.06.2009
198 SHIMLA T.V. TODAY BROADCASTING LTD RADIO- MEOW 01.10.2009

127
Annexure 5.2 (Contd.)
S.NO. CITY NAME OF THE COMPANY CHANNEL IDENTITY
DATE OF OPERATIONALISATION
199 SHIMLA B.A.G. INFOTAINMENT RADIO- DHAMAL
30.11.2009
200 SHOLAPUR RELIANCE COMMUNICATIONS GROUP BROADCAST NETWORK LTD.
BIG-FM 08.11.2007
201 SHOLAPUR M.B.P.L. RADIO-CITY 14.11.2007
202 SILIGURI PCM CEMMENTS MISTY FM 14.11.2007
203 SILIGURI SYNTECH INFORMATICS HIGH FM 24.11.2007
204 SILIGURI SOUTH ASIA S. FM 25.10.2008
205 SRI-NAGAR RELIANCE COMMUNICATIONS GROUP BROADCAST NETWORK LTD.
BIG-FM 10.12.2006
206 SURAT RELIANCE COMMUNICATIONS GROUP BROADCAST NETWORK LTD.
BIG-FM 29.08.2007
207 SURAT E.N.I.L. RADIO- MIRCHI 21.08.2007
208 SURAT D. B. CORP. MY-FM 27.08.2007
209 SURAT M.B.P.L. RADIO-CITY 22.08.2007
210 THIRUVANANTHA- PURAM
RELIANCE COMMUNICATIONS GROUP BROADCAST NETWORK LTD.
BIG-FM 29.01.2008
211 THIRUVANANTHA- PURAM
E.N.I.L. RADIO- MIRCHI 29.01.2008
212 THIRUVANANTHA- PURAM
KAL RADIO S. FM 06.02.2008
213 THIRUVANANTHA- PURAM
THE MATHRABHUMI CLUB-FM 29.01.2008
214 THRISSUR ASIANET RADIO PVT. LTD. BEST FM 23.12.2007
215 THRISSUR KAL RADIO S. FM 26.12.2007
216 THRISSUR MALAYALLA MANORAMA MANGO FM 14.12.2007
217 THRISSUR THE MATHRABHUMI CLUB-FM 14.12.2007
218 TIRUCHI KAL RADIO S. FM 17.01.2008
219 TIRUCHI MALAR PUBLICATIONS HELLO-FM 14.01.2008
220 TIRUNELVELI MALAR PUBLICATIONS HELLO-FM 13.10.2007
221 TIRUNELVELI SUN TV SURYANA FM 07.03.2003
222 TIRUPATI RELIANCE COMMUNICATIONS GROUP BROADCAST NETWORK LTD.
BIG-FM 01.08.2007
223 TIRUPATI KAL RADIO S. FM 27.08.2007
224 TUTICORIN KAL RADIO S. FM 05.10.2007
225 TUTICORIN MALAR PUBLICATIONS HELLO-FM 15.10.2007
226 UDAIPUR RELIANCE COMMUNICATIONS GROUP BROADCAST NETWORK LTD.
BIG-FM 03.08.2007
227 UDAIPUR RAJASTHAN PATRIKA RADIO- TADKA 27.08.2007
228 UDAIPUR D. B. CORP. MY-FM 07.07.2007
229 VADODARA RELIANCE COMMUNICATIONS GROUP BROADCAST NETWORK LTD.
BIG-FM 05.06.2007
230 VADODARA E.N.I.L. RADIO- MIRCHI 05.06.2007

128
Annexure 5.2 (Contd.)
S.NO. CITY NAME OF THE COMPANY CHANNEL IDENTITY
DATE OF OPERATIONALISATION
231 VADODARA M.B.P.L. RADIO-CITY 11.06.2007
232 VADODARA SOUTH ASIA S. FM 17.04.2008
233 VARANASI E.N.I.L. RADIO- MIRCHI 14.07.2007
234 VARANASI SHRI PURAN MULTIMEDIA MANTRA FM 20.07.2007
235 VARANASI SOUTH ASIA S. FM 29.12.2007
236 VIJAYWADA E.N.I.L. RADIO- MIRCHI 11.12.2007
237 VIJAYWADA KAL RADIO S. FM 25.12.2007
238 VISHAKAPATNAM RELIANCE COMMUNICATIONS GROUP BROADCAST NETWORK LTD.
BIG-FM 27.10.2007
239 VISHAKAPATNAM E.N.I.L. RADIO- MIRCHI 26.10.2007
240 VISHAKAPATNAM M.B.P.L. RADIO-CITY 29.10.2007
241 VISHAKAPATNAM UDAYA TV VISAKHA FM 06.02.2003
242 WARANGAL KAL RADIO S. FM 28.05.2008
Source: Ministry of Information & Broadcasting

129
Annexure 5.3: List of applicants who have been granted DTH License
1. M/s. Tata Sky Ltd., 3rd Floor, Bombay Dyeing A.O. Building,
Pandurang Budhkar Marg, Worli, Mumbai • 400 025 Tel: 022-6613 3000
Fax-022-6613 3030/6616 3013
2. M/s Dish TV India Ltd. FC-9, Sector-16A, Film City, Noida-201301
Tel: 91-120-2511064-78 Fax: 91-120-2511186
3. SUN Direct TV(P) Ltd.
Murasoli Maran Towers,
73, MRC Nagar, Main Road, MRC Nagar, Chennai • 28
PH: 044-44676767
4. Bharti Telemedia Ltd. Airtel centre, Plot No 16, Udyog Vihar Phase IV,
Gurgaon • 122015 Ph: 0124-4222222
5. Reliance Communications Group Big TV Pvt. Ltd.
3rd Floor, B-Wing,
Reliance Communications Group Centre, Maharaja Ranjit Singh Marg, New Delhi • 110 002
Ph: 011-30332832
6. M/s Bharat Business Channel Ltd. Uplink Centre, Plot No 1D, Udyog Vihar, Industrial Area,
Greater NOIDA, Distt-Gautam Budh Nagar (UP) - 201 306 PH: 0120-6141000

130
Annexure 5.4: List of permitted teleports at various locations in India
[As on 20/03/2013]
Sr.
No
Name of Teleport Address Location Date of
Permission
1 TV TODAY NETWORK LIMITED
TV TODAY NETWORK LIMITED FC-8, SECTOR-16A, NOIDA(UP)
NEW DELHI 22-Nov-00
2 SUN TV LTD. R S NO. 4288/72, 73 & 116, BLOCK NO. 94, MRC NAGAR CHENNAI-600018
CHENNAI 12-Mar-01
3 ENTERTAINMENT TELEVISION NETWORK PVT. LTD
7B, SHAH INDUSTRIAL ESTATE, OFF VEERA DESAI ROAD, ANDHERI W , MUMBAI-400053
MUMBAI 23-May-01
4 USHODAYA ENTERPRISES LTD.
6-3-570, EENADU COMPLEX, SOMAJIGUDA, HYDERABAD-500082
HYDERABAD 23-May-01
5 ESSEL SHYAM
COMMUNICATION LIMITED
C-34, SECTOR-62, ELECTRONIC
CITY, NOIDA-201307
NOIDA 3-Sep-01
6 ASIANET INFRASTRUCTURE PVT. LTD.
ASIANET STUDIO/COMPLEX, PULIYARAKONAM P.O. THIRUVANANTHAPURAM KERALA
THIRUVANANTHAPURAM 17-Oct-01
7 ESSEL SHYAM COMMUNICATION LTD
C-34, ELECTRONIC CITY, SECTOR-62, NOIDA-201307
NOIDA-2 7-Feb-02
8 SAHARA SANCHAR LIMITED SAHARA INDIA COMPLEX, C-2, C-3, SECTOR-XI NOIDA-201301
NOIDA 12-Feb-02
9 TELEVISION EIGHTEEN
INDIA LIMITED
VIDEOCON TOWER, E-1 RANI
JHANSI ROAD, JHANDEWALAN EXTN., NEW DELHI-110055
NEW DELHI 18-Mar-02
10 NEW DELHI TELEVISION LTD. (NDTV)
ARCHANA COMPLEX, GREATER KAILASH-I, NEW DELHI-110048
NEW DELHI 11-Jun-02
11 INDIAVISION COMMUNICATIONS LTD.
SATELLITE TATU'S TOWER, 32/1787, PADIVATTOM, NH BY-PASS ROAD, KOCHI (KERALA) 682024
KOCHI -KERALA 7-Nov-02
12 NOIDA SOFTWARE TECHNOLOGY PARK LTD.
B-23-25, POCKET-C, SURAJPUR INDUSTRIAL AREA, GREATER NOIDA(U.P)
GREATER NOIDA 27-Jan-03
13 DISH TV INDIA LIMITED (Formerly known ASC Enterprises Ltd.)
FC-19, SECTOR-16A, NOIDA-201301 (U.P.)
NOIDA 2-Apr-03
14 POSITIVE TELEVISION PVT. LTD.
7 C, DOCTORS LANE, GOL MARKET, NEW DELHI-110001
GUWAHATI 9-Jun-03
15 CHANNEL GUIDE INDIA LTD.
BOKADIA MANSION, 3RD FLOOR,229, PRINCESS STREET, MUMBAI
MUMBAI 15-Sep-03
16 INDIASIGN PVT. LTD. A-49, SECTOR-18, ELECTRONICS CITY, HARTRON COMPLEX, GURGAON(HARYANA)
GURGAON 18-Nov-03
17 ASSOCIATED BROADCASTING PVT. LTD.
CO.NO.97, ROAD NO.3, BANJARA HILLS, HYDERABAD-500034
HYDERABAD 24-Nov-03
18 AV ENTERTAINMENT PVT. LTD.
240, ZONE-I, M.P.NAGER, BHOPAL(M.P)
BHOPAL 15-Dec-03

131
Annexure 5.4 (Contd.)
Sr.No Name of Teleport Address Location Date of
Permission 19 TELEVISION
EIGHTEEN INDIA LIMITED
EMPIRE COMPLEX, 414, SENAPATI BAPAT MARG, LOWER PAREL, MUMBAI-400013
MUMBAI 19-Mar-04
20 AMRITA ENTERPRISES PVT. LTD.
TCNO.15/1069, AMRITA, GANDHI NAGER, VAZHUTHANCADU, THIRUVANANTHAPURAM-695014
THIRUVANANTHAPURAM 20-Apr-04
21 MAVIS SATCOM LIMITED
NO.48 NP, JAWAHARLAL NEHRU ROAD, EKKATUTHANGAL, CHENNAI-600092
CHENNAI 22-Apr-04
22 TATA COMMUNICATIONS LTD.VSNL
VSNL, TECHNICAL COMPLEX, SDF BUILDING, SALT LAKE, KOLKATTA-700091
KOLKATTA 14-May-04
23 TATA COMMUNICATIONS
LTD. VSNL
VSNL, VSB, KAKKANAD, THIRKKAKARA, ERNAKULAM,
COACHIN-682030
COCHIN 14-May-04
24 TATA COMMUNICATIONS
LTD., VSNL,
THIRUVELLUVAR SATELLITE VSNL EARTH STATION, REDHILLS ROAD,
AMBATTUR, CHENNAI-600053
CHENNAI 14-May-04
25 TATA COMMUNICATIONS LTD., VSNL
VSNL, VSB, BANGLA SAHAB ROAD, NEW DELHI-110001
NEW DELHI 14-May-04
26 TATA COMMUNICATIONS LTD., VSNL
VSNL,VSB, FORT, MG ROAD, MUMBAI-400001
MUMBAI 14-May-04
27 LAMHAS SATELLITE LTD.
SERVICES 161, TOWER-I, INTERNATIONAL INFOTECH PARK, VASHI, NAVI MUMBAI
MUMBAI 10-Aug-04
28 MALAYALAM COMMUNICATIONS LTD.
MALAYALAM COMMUNICATIONS LTD. CHANDRAGIRI 61, VIKRAMPURAM HILLS,KOWDIAR P.O., THIRUVANANTHAPURAM-695003
THIRUVANANTHAPURAM 22-Dec-04
29 SANSKAR INFO TV PVT. LTD.
B-10, MELKAY BUILDING, OPP. MAROL TELEPHONE EXCHANGE, CENTRAL ROAD, MIDC, ANDHERI E, MUMBAI-400093
MUMBAI 23-Feb-05
30 BENNETT COLEMAN AND CO. LTD.
BENNETT, COLEMAN & CO. LTD., THE TIMES OF INDIA BUILDING DR. D.N ROAD, MUMBAI-400001
MUMBAI 2-May-05
31 SENIOR MEDIA LTD. SENIOR MEDIA LTD NO.3, SIRI FORT ROAD, NEW DELHI-49
NEW DELHI 5-May-05
32 LOK PRAKASHAN LTD. LOK PRAKASHAN LTD. 57 CHOWRINGHEE ROAD, HORIZON, 3RD FLOOR, KOLKATA-700071
AHMEDABAD 6-May-05
33 CALCUTTATELEVISION
NETWORK PVT. LTD.
CALCUTTA TELEVISION NETWORK
PVT. LTD. 89 M.B.ROAD BIRATI, KOLKATA-70051
KOLKATA 22-Aug-05
34 KOHINOOR CORPORATION LTD.
BROADCASTING KOHINOOR BROADCASTING CORPORATION LTD. TAGORE COMPLEX, MODEL TOWN, PATIALA-147001, PUNJAB
RAJPURA - PUNJAB 9-Sep-05

132
Annexure 5.4 (Contd.)
Sr.No Name of Teleport Address Location Date of
Permission 35 TELEVISION
EIGHTEEN INDIA LIMITED
VIDEOCON TOWER, E-1 RANI JHANSI ROAD, JHANDEWALAN EXTN., NEW DELHI-110055
NOIDA 14-Sep-05
36 KAMYAB TV PVT. LTD. (Formerly known as MD TV Pvt. Ltd.)
KAMYAB TV PVT. LTD. 168, EKAMRA MARG, UNIT-6 BHUBANESWER-751001
BHUBANESHWER 30-Sep-05
37 KASTURI MEDIA PVT. LTD.
KASTHURI MEDIAS PVT. LTD. NO.286, 3RD MAIN ROAD, J.P. NAGER, BANGLORE-560078
BANGALORE 10-Nov-05
38 SST MEDIA PVT. LTD. 57 J.L NEHRU ROAD HORIZON, 3RD FLOOR, KOLKATA-700071
KOLKATA 30-Nov-05
39 ESSEL SHYAM COMMUNICATION LTD.
ROYAL PALAMS, SURVEY NO. 169,NEAR UNIT 26, AAREY MILK COLONY GOREGAON EAST,
MUMBAI- 400065
MUMBAI 2-Dec-05
40 MM TV LTD. MM TV LTD. POST BOX NO. 106, KANDATHIL VARGHESE MAPPILLAI MEMORIAL SOCIETY BUILDING K.K.ROAD, KOTTAYAM-686001, KERALA
ALAPUZZA 2-Mar-06
41 IN CABLENET ANDHRA LTD.
IN CABLENET ANDHRA LTD. 98, OM PLAZA, DOMALGUDA, HYDERABAD-500029
HYDERABAD 9-Mar-06
42 INDRA TELEVISION LTD.
INDRA TELEVISION LTD. MEGA CITY NO. 338, ROAD NO.3, ARORA COLONY BANJARA HILLS HYDERABAD-500034
HYDERABAD 7-Jun-06
43 SUN TV LTD. R S NO. 4288/72,73 & 116, BLOCK NO. 94, MRC NAGAR CHENNAI-600018
CHENNAI 14-Jul-06
44 MEDIA CONTENT AND COMMUNICATION INDIA PRIVATE LIMITED
DLF CNTRE, 7TH FLOOR, 4 SNANSAD SERVICESMARG, NEW DELHI-110001
NOIDA 20-Sep-06
45 TATA SKY LIMITED TATA SKY LTD. 3RD FLOOR,C-1, WADIA INTERNATIONAL CENTRE BOMBAY DYEING, PANDURANG BUDHAR MARG, WORLI, MUMBAI-400025
NEW DELHI 20-Sep-06
46 SATISH SUGERS LTD. VAISHNAVI BHAVANA, 89/1, 1ST A MAIN ROAD,INDUSTRIAL SUBRUB, 2ND STAGE, YESHWANTHPUR, BANGLORE-560022
BANGALORE 26-Sep-06
47 SHITAL FIBRES LTD. SHITAL FIBRES LTD. A-17, FOCAL
POINT EXTENSION, P.O.BOX NO. 407 AND 449, JALLANDHAR-144004
JALANDHAR 29-Sep-06
48 MH ONE TV NETWORK LTD.
MH ONE TV NETWORK LTD. 2,SSI INDUSTRIAL AREA, GT KARNAL ROAD, DELHI-33
DELHI 23-Nov-06
49 STV ENTERPRISES LTD.
268 MASJID KOTH, NEAR UDAI PARK MARKET, NEW DELHI-110049
NEW DELHI 11-Jan-07
50 AIRR X MEDIA LTD. 502 ASHWIN ATHWA LINES SURAT GUJARAT
SURAT 13-Mar-07

133
Annexure 5.4 (Contd.)
Sr.No Name of Teleport Address Location Date of
Permission 51 BROADCAST
EQUIPMENTS INDIA PVT. LTD.
370-371/2, FIRST FLOOR, HOSPITAL ROAD, JANGPURA, NEW DELHI-110014
NEW DELHI 21-May-07
52 WINNING COMMUNICATIONS LTD.
EDGEWINNING EDGE COMMUNICATIONS LTD. 301, SWARNA JAYANTHI COMPLEX, AMEERPET, HYDERABAD-500038
HYDERABAD 25-May-07
53 INDIASIGN PVT. LTD. GL-34/1 SALTLAKE ELECTRONIC COMPLEX SECTOR-5, KOLKATTA WEST BANGAL
KOLKATA 15-Jun-07
54 INDIASIGN PVT. LTD. CHENNAI 15-Jun-07
55 RACHANA TELEVISION PVT. LTD.
PLOT NO. 564-A-19-III, ROAD NO.92, JUBILEE HILLS, HYDERABAD-500033
HYDERABAD 15-Jun-07
56 ORTEL COMMUNICATIONS LTD.
ORTEL COMMUNICATIONS LTD. B-7/122 A, SAFDARJUNG ENCLAVE, NEW DELHI-110029
BHUBANESHWER 25-Jun-07
57 SOWBHAGYA EXPORTS LTD.
SOWBHAGYA EXPORTS LTD. 77/14 SKD NAGER, SRINAGER COLONY HYDERABAD-500073 ANDHRA PRADESH
HYDERABAD 4-Jul-07
58 ESSEL SHYAM COMMUNICATION LTD.
C-138, NARAINA INDUSTRIAL AREA-I, AROOR NEW DELI-28
KERALA 5-Jul-07
59 PRAGYA VISION PVT. LTD.
FC-13, SECTOR 16A, FILM CITY, NOIDA-201301
NOIDA 5-Sep-07
60 BRAHMAPUTRA TELE- PRODUCTIONS PVT. LTD.
13TH MILE TAMULIKUCHI BYRNIHAT RI -BHOI MEGHALAYA
GUWAHATI 25-Sep-07
61 G. NEXT MEDIA PVT. LTD.
78, OKHALA INDUSTRIAL ESTATE PHASE-III, NEW DELHI-110020
NEW DELHI 5-Oct-07
62 INDIASIGN PVT. LTD. 1343, ROAD NO. 67, JUBILEE HILL, HYDERABAD
HYDERABAD 14-Mar-08
63 TATA COMMUNICATIONS LIMITED
THIRUVALLUR SATELLITE EARTH STATION, 226, RED HILLS ROAD, AMBATTUR, CHENNAI-600053
CHENNAI-2 6-May-08
64 POSITIVE TELEVISION PVT. LTD.
POSSITIVE TELEVISION PVT. LTD. DOCTOR'S LANE, GOL MARKET, NEW DELHI-110001
7C,NOIDA 23-May-08
65 EASTERN MEDIA LTD. A/62,NAYAPALLI, BHUBANESWAR-751003, ORISSA
BHUBANESHWER 2-Jul-08
66 RAJASTHAN PATRIKA PRIVATE LIMITED
KESARGARH, JLN MARG, JAIPUR-302004
JAIPUR 5-Aug-08
67 PRIDE EAST ENTERTAINMENT PVT.
LIMITED
NEWS LIVE, 558, G.S.ROAD, CHRISTIAN BARTI, DISPUR,
GUWAHATI-78
GUWAHATI 13-Aug-08
68 INDIASIGN PVT. LTD. 1343, ROAD NO. 67, JUBILEE HILL, HYDERABAD
HYDERABAD (Location Shifted from Noida)
17-Sep-08
69 VINTAGE STUDIO PVT. LTD.
23/24, EAST PATEL NAGAR, NEW DELHI-110008
NEW DELHI 5-Jan-09
70 SKYLINE TELE MEDIA SERVICES PVT. LTD.
C-4,SHIVALIK, NEAR MALVIYA NAGAR MARKET, NEW DELHI-110017
NOIDA 27-May-09
71 INFORMATION TV PVT. LTD.
275, CAPTAIN GAUR MARG, SRINIVASPURI, NEW DELHI-110065
NEW DELHI 3-Jun-09

134
Annexure 5.4 (Contd.)
Sr.No Name of Teleport Address Location Date of
Permission 72 UNILAZER EXPORTS
AND MANAGEMENT CONSULTANTS LIMITED
PARIJAT HOUSE, 1076, DR. E.MOSES ROAD, WORLI, NAKA, MUMBAI-400018
MUMBAI 26-Jun-09
73 COMSAT SYSTEM PVT. LTD.
PLOT NO.22/A, IDA, MALLAPUR, HYDERABAD-50076
HYDERABAD 14-Oct-09
74 BHARTI TELEPORTS LIMITED
THE GRAND HOTEL, VASANT KUNJ, PHASE-II, NELSON MANDELA ROAD, NEW DELHI-110070
Noida 11-Nov-09
75 SRI VENKATESWARA CHANNEL PVT. LTD.
BHAKTITHIRUNILAYAM, HIMAYATH NAGAR, HYDERABAD
TIRUPATI 11-Nov-09
76 TATA COMMUNICATIONS LIMITED
THIRUVALLUVAR SATELLITE EARTH STATION, 226, RED HILLS ROAD, AMBATTUR, CHENNAI-
600053
CHENNAI -3 13-Jan-10
77 ROYS INSTITUTE OF COMPETITIVE EXAMINATION PVT LTD
11/1 B.T ROAD BELGHORIA KOLKATA-700056 24 PARGANAS NORTH WEST BENGAL
KOLKATA 1-Apr-10
78 INDEPENDENT NEWS SERVICES PVT. LTD.
PLOT NO. 17B & 17C, SECTOR 16A, FILM CITY NOIDA(UP)
NOIDA -2 28-Apr-10
79 RAJ TELEVISION NETWORK LTD.
32, POES ROAD, 2ND STREET, TEYNAMPET, CHENNAI-600018
CHENNAI 5-May-10
80 ESSEL SHYAMCOMMUNICATION LTD.
C-138, NARAINA INDUSTRIAL AREA-I, NEW DELHI-28
NOIDA -3 12-May-10
81 KANSANNEWS PRIVATE LIMITED
HOUSE NO. 18, SECTOR-18, CHANDIGARH
CHANDIGARH 13-May-10
82 TATA COMMUNICATIONS LTD. VSNL
TATA COMMUNICATIONS LTD. VIDESH SANCHAR BHAWAN MAHATMA GANDHI ROAD, MUMBAI-400001
CHENNAI -4 4-Jun-10
83 DISH TV INDIA LTD. PLOT NO.18, SECTOR-16A, NOIDA-201301
NOIDA 6-Apr-11
84 AASTHA BROADCASTING NETWORK LIMITED
AATHA BHAWAN, A-105, SECTOR-5, NOIDA-201301
NOIDA 2-May-11
85 MAHUAA MEDIA PRIVATE LIMITED
FC 17A & 17B, SECTOR 16A, FILM CITY, NOIDA-201301
NOIDA 25-May-11
86 RTR Broadcast Pvt. Ltd. D-38, RDC, Raj Nagar, Ghaziabad Ghaziabad 7-Sep-11
87 Silver Star Communication Ltd.
NO. 24, VI MAIN ROAD, KASTURIBA NAGAR, ADYAR, CHENNAI-600020 INDIA
CHENNAI 2-Nov-11
88 Lamha Satellite Services Ltd
TOWER-I, 6TH FLOOR, INTERNATIONAL INFOTECH PARK, ABOVE VASI RAILWAY STATION, VASI, NAVI MUMBAI-400703.
MUMBAI 13-Feb-12
89 Skyline Tele Media Services Ltd.
FC-23, SECTOR-16A, FILM CITY, NOIDA-201305
NOIDA-2 02-Jul-12
90 Bharti Teleports Limited Plot No 192, Block B, Phase II, NOIDA - 201 305
NOIDA-2 29-Oct-12
Source: Ministry of Information & Broadcasting

135
Index of Tables & Charts
Tables
Table 1.1: Subscriber Base & Teledensity - Rural & Urban ........................................................... 2 Table 1.2: Service Area wise Access (Wireless+Wireline) Subscribers ............................................ 5 Table 1.3: Service Area wise Teledensity....................................................................................... 6 Table 1.4: Growth/Decline in Subscribers ................................................................................... 8 Table 1.5: Market Share of the operators in total rural subscriber base for the quarter ending
Dec-13 ....................................................................................................................... 9 Table 1.6: List of Cellular Mobile (GSM & CDMA) Service Providers currently providing service…10 Table 1.7: Wireless Subscriber Base & Teledensity - Rural & Urban ........................................... 11 Table 1.8: Growth in Wireless Subscribers ................................................................................. 12 Table 1.9: Service Area wise Wireless Subscribers ...................................................................... 13 Table 1.10: Service Area wise Wireless Teledensity ..................................................................... 14
Table 1.11: Rural Wireless Subscribers and Market Share ......................................................... 15 Table 1.12: Group-wise Market Share (in terms of subscription) within GSM Service ................. 16 Table 1.13: Market Share (in terms of subscription) within CDMA Service .................................. 17
Table 1.14: Service Providers providing Wireline service ............................................................. 18 Table 1.15: Wireline Subscriber Base & Teledensity - Rural & Urban ......................................... 19 Table 1.16: Service Provider wise Subscribers (Rural & Urban) & Share of Rural Subscription ... 20 Table 1.17: Service Provider wise growth in Subscribers ............................................................ 21 Table 1.18: Service Area wise Wireline Subscribers (in million) ................................................... 21 Table 1.19: Service Area wise Wireline Teledensity ..................................................................... 22 Table 1.20: Rate of change & Market share of PCOs ................................................................... 23 Table 1.21: Trend of Internet subscriber base ……………………………………………………….....….26
Table 1.22: Internet Subscriber Base & Market share of top 10 SPs ……………………………….….27 Table 1.23: PMRTS Subscriber base - Service Provider wise ....................................................... 34 Table 1.24: VSAT Service Providers currently providing service & their subscriber base ............. 35 Table 2.1: Key Indicators - GSM Service ..................................................................................... 38 Table 2.2: Monthly ARPU - GSM Service .................................................................................... 39 Table 2.3: Composition of ARPU (%) - GSM Service .................................................................... 40 Table 2.4: MOU per subscriber per month - GSM Service ........................................................... 41 Table 2.5: Outgoing SMS per subscriber per month - GSM Service ............................................. 41 Table 2.6: %Break-up of Outgoing minutes from Home Service Area (HSA)- GSM Service .......... 41 Table 2.7: Average subscriber outgo per outgoing minute from HSA - GSM Service .................... 44 Table 2.8: Trends of Key Parameters - GSM Service ................................................................... 45 Table 2.9: Key Indicators - CDMA Full Mobility Service .............................................................. 46 Table 2.10: Monthly ARPU - CDMA Full Mobility Service ............................................................ 47 Table 2.11: Composition of ARPU (%) - CDMA Full Mobility Service ............................................ 48 Table 2.12: MOU per subscriber per month - CDMA Full Mobility Service .................................. 48 Table 2.13: Outgoing SMS per subscriber per month - CDMA Full Mobility Service .................... 48
Table 2.14: %Break-up of Outgoing minutes from Home Service Area (HSA) - CDMA Full Mobility Service ..................................................................................................................... 50
Table 2.15: Average subscriber outgo per outgoing minute from HSA - CDMA Full Mobility Service ................................................................................................................................ 52
Table 2.16: Trends of Key Parameters - CDMA Full Mobility Service ........................................... 52 Table 3.1: Gross Revenue (GR), Adjusted Gross Revenue (AGR), License Fee (LF) & Spectrum
Charges .................................................................................................................... 54 Table 3.2: Service-wise Gross Revenue, Adjusted Gross Revenue, License Fee and Spectrum
Charges .................................................................................................................... 54 Table 3.3: Access Services - Service Provider wise Adjusted Gross Revenue ................................ 56 Table 3.4: Category-wise share in Access Services Adjusted Gross Revenue (AGR)...................... 57 Table 4.1: QoS Summary - 2G Wireless Service .......................................................................... 59 Table 4.2: Parameter wise Analysis of Non-compliance of QoS Benchmarks for 2G Wireless
Service Providers ...................................................................................................... 62 Table 4.3 : QoS Summary - 3G Wireless Service …………………………………………………………... 61 Table 4.4: Parameter wise Analysis of Non-compliance of QoS Benchmarks for 3G Wireless
Service Providers.…………………………………………………………………………… ……….62
Table 4.5: QoS Summary - Wireline Service ............................................................................... 68 Table 4.6: Parameter wise Analysis of Non-compliance of QoS Benchmarks for Wireline Service
Providers .................................................................................................................. 70

136
Table 4.7 : Summary of Performance of Broadband Service Providers against identified parameters ............................................................................................................... 72
Table 4.8: Parameter-wise Analysis of non-compliance of QoS benchmarks for Broadband Service Providers .................................................................................................................. 74
Table 5.1: Key Parameters - Broadcasting & Cable Services ....................................................... 76 Table 5.2 : Migration to Digital Addressable Cable TV Systems ................................................... 77 Table 5.3 : Status of applications for community radio station licenses received from Ministry of
Information and Broadcasting .................................................................................. 79
Charts
Chart 1.1: Trends in Telephone Subscribers and Teledensity in India .......................................... 2 Chart 1.2: Market Share - Rural & Urban .................................................................................... 3 Chart 1.3: Composition of Access subscription - Wireline & Wireless ........................................... 4 Chart 1.4: Composition of Telephone Subscribers at the end of the quarter ................................. 4 Chart 1.5: Net Addition/decline in Telephone Subscription .......................................................... 6 Chart 1.6: Wireless Subscriber Base and Teledensity ................................................................. 11 Chart 1.7: Wireless Market Share - Rural & Urban .................................................................... 12
Chart 1.8: Wireless Subscription: GSM vs CDMA ....................................................................... 15 Chart 1.9: Wireline Subscriber Base and Teledensity ................................................................. 19 Chart 1.10: Composition of Wireline Subscribers - Rural & Urban ............................................. 20 Chart 1.11: Number of PCOs ..................................................................................................... 23 Chart 1.12: Growth in VPTs ....................................................................................................... 24 Chart 1.13: Composition of Internet subscription ...................................................................... 28 Chart 1.14 : Composition of Broadband & Narrowband subscription …………………… ............... 27 Chart 1.15: Trend of subscriber base achieved by top ten ISPs................................................... 28 Chart 1.16: Compostion of Wired Internet Subscribers .............................................................. 29 Chart 1.17: Composition of Wireless Internet Subscribers .......................................................... 29 Chart 1.18: Technology Trend for Internet Access ...................................................................... 30 Chart 1.19: Trend in MoU for Internet Telephony ....................................................................... 35 Chart 1.20: Composition of Broadband Subscription – Technology wise ..................................... 35 Chart 1.21: Composition of Narrowband Subscription – Technology wise ................................... 35 Chart 1.22: Number of PMRTS subscribers & Rate of Growth (%) ............................................... 35 Chart 1.23: Number of VSAT Subscribers & Rate of Growth (%) ................................................. 36 Chart 2.1: Break-up of Outgoing minutes from Home Service Area (HSA) – GSM Service ............ 38 Chart 2.2: Proportion of prepaid subscribers - GSM Service ....................................................... 39
Chart 2.3: Minutes of Usage by Outroamers as a % of Total Minutes of Usage - GSM Service ..... 41 Chart 2.4: Outgoing SMS Usage by Outroamers as a % of Total Outgoing SMS Usage – GSM
Service .................................................................................................................... 41 Chart 2.5: % Subscribers who availed roaming services during the quarter – GSM Service ........ 42 Chart 2.6: % Break-up of minutes of usage of outroamers (usage from outside the Home Service
Area) – GSM Service ................................................................................................ 43 Chart 2.7: % Break-up of outgoing minutes from Home Servie Area (HSA) – CDMA Full Mobility
Service …….……………………………………………………………………………………..…….45 Chart 2.8: Proportion of prepaid subscribers - CDMA Full Mobility Service ................................ 47 Chart 2.9: Minutes of Usage by Outroamers as a % of Total Minutes of Usage - GSM Service ..... 48 Chart 2.10: Outgoing SMS Usage by Outroamers as a % of Total Outgoing SMS Usage – GSM
Service ………………………………………………………………………………………………….49 Chart 2.11: Percentage of subscribers who availed roaming service during the quarter – CDMA
Full Mobility Service ............................................................................................... 50
Chart 2.12: Percentage break-up of minutes of usage of outroamers (usage from outside the Home Service Area) – CDMA Full Mobility Service ............................................................. 50
Chart 3.1: Composition of Gross Revenue .................................................................................. 55 Chart 3.2: Trend in ARPU per month for Access Services ........................................................... 56 Chart 5.1: Maximum number of TV Channels being carried by certain Cable operators in their
networks .................................................................................................................. 77 Chart 5.2 : Comparative position of Revenue from FM Radio Stations as reported to TRAI .......... 79