The ecological footprint: a non-monetary metric of human consumption applied to North America
18
Global Environmental Change 13 (2003) 83–100 The ecological footprint: a non-monetary metric of human consumption applied to North America Maged Senbel, Timothy McDaniels*, Hadi Dowlatabadi School of Community and Regional Planning, University of British Columbia, #433-6333 Memorial Road, Vancouver, BC, Canada V6T 1Z2 Abstract This paper employs ecological footprint analysis as a potential non-monetary metric of human consumption and ecological productivity in a simulation-modeling framework, applied to North America. The ecological footprint provides an indirect basis for considering the long-term ecological risk and sustainability of human settlements, regions or, in this case, a continent. We examine several scenarios for human consumption, ecological productivity and material efficiency, to explore which variables have influence on the ecological budget of North America over the coming century. Only one scenario, which assumes considerable reductions in human consumption, is likely to yield an ecological surplus. Unlike monetary measures of societal well-being, ecological footprint analysis shows that increased economic activity and consumption creates deficits in terms of the balance of ecological productivity and consumption in a region, and may reduce long-term ecological sustainability. Several advantages and disadvantages of this metric are discussed. r 2003 Elsevier Science Ltd. All rights reserved. Keywords: Ecological footprint; Integrated assessment; Sustainability; Ecological risk; Ecological budget; Simulation modeling 1. Introduction As concerns grow over global environmental change, interested parties (including governments, organiza- tions, analysts and citizens) seek new ways to gain insight into profoundly complex global processes. Integrated assessment (IA) modeling frameworks have been developed to explore the dynamics and conse- quences of global environmental change, given sets of assumptions and worldviews (Lave and Dowlatabadi, 1993; Rotmans and Dowlatabadi, 1998). The choice of metrics is a fundamental and value-laden issue for any complex policy question (Fischhoff et al., 1984), and particularly so in interpreting the aggregated findings of IA. Choosing metrics is in turn related to assumptions about preferred approaches to policy analysis for global change. Many existing IA modeling efforts, and evaluations of global change policy options, have used money-based measures of societal welfare, in an attempt at what might be termed globally based social benefit/cost analysis (e.g., Nordhaus, 1994; Pearce et al., 1996). Evaluation of welfare in money terms reflects the choice by economists of efficiency within a utilitarian frame- work as the fundamental paradigm for analyzing global change policy alternatives. Concerns have long been raised about money-based measures of well-being within a utilitarian framework as the chief basis for policy analysis, even for issues that are wholly addressed within one jurisdiction, and for which the winners and losers are found only in the current generation (Kelman, 1981, pp. 33–40). These concerns are greatly exacerbated when comparing scenarios about different future states of the world, which could greatly affect citizens of all countries over many generations (Morgan et al., 1999; McDaniels, 2000). Concerns about the relevance of money as a metric of societal well-being were evident in many of the concerns raised over drafts of the 1996 IPCC working group III document (Bruce et al., 1996). Ecological sustainability, and the ecological implica- tions of human consumption levels, are two aspects of global environmental change that many believe are not well-represented in money-based metrics of global environmental change. This paper employs a new potential metric for IA that serves as an ecologically based measure of human consumption. It also serves as an indirect indicator of the long-term ecological risk and ARTICLE IN PRESS *Corresponding author. Tel.: +1-604-822-9288. E-mail address: [email protected] (T. McDaniels). 0959-3780/03/$ - see front matter r 2003 Elsevier Science Ltd. All rights reserved. doi:10.1016/S0959-3780(03)00009-8
-
Upload
independent -
Category
Documents
-
view
2 -
download
0
Transcript of The ecological footprint: a non-monetary metric of human consumption applied to North America

Global Environmental Change 13 (2003) 83–100
The ecological footprint: a non-monetary metric of humanconsumption applied to North America
Maged Senbel, Timothy McDaniels*, Hadi Dowlatabadi
School of Community and Regional Planning, University of British Columbia, #433-6333 Memorial Road, Vancouver, BC, Canada V6T 1Z2
Abstract
This paper employs ecological footprint analysis as a potential non-monetary metric of human consumption and ecological
productivity in a simulation-modeling framework, applied to North America. The ecological footprint provides an indirect basis for
considering the long-term ecological risk and sustainability of human settlements, regions or, in this case, a continent. We examine
several scenarios for human consumption, ecological productivity and material efficiency, to explore which variables have influence
on the ecological budget of North America over the coming century. Only one scenario, which assumes considerable reductions in
human consumption, is likely to yield an ecological surplus. Unlike monetary measures of societal well-being, ecological footprint
analysis shows that increased economic activity and consumption creates deficits in terms of the balance of ecological productivity
and consumption in a region, and may reduce long-term ecological sustainability. Several advantages and disadvantages of this
metric are discussed.
r 2003 Elsevier Science Ltd. All rights reserved.
Keywords: Ecological footprint; Integrated assessment; Sustainability; Ecological risk; Ecological budget; Simulation modeling
1. Introduction
As concerns grow over global environmental change,interested parties (including governments, organiza-tions, analysts and citizens) seek new ways to gaininsight into profoundly complex global processes.Integrated assessment (IA) modeling frameworks havebeen developed to explore the dynamics and conse-quences of global environmental change, given sets ofassumptions and worldviews (Lave and Dowlatabadi,1993; Rotmans and Dowlatabadi, 1998). The choice ofmetrics is a fundamental and value-laden issue for anycomplex policy question (Fischhoff et al., 1984), andparticularly so in interpreting the aggregated findings ofIA. Choosing metrics is in turn related to assumptionsabout preferred approaches to policy analysis for globalchange.Many existing IA modeling efforts, and evaluations of
global change policy options, have used money-basedmeasures of societal welfare, in an attempt at whatmight be termed globally based social benefit/costanalysis (e.g., Nordhaus, 1994; Pearce et al., 1996).
Evaluation of welfare in money terms reflects the choiceby economists of efficiency within a utilitarian frame-work as the fundamental paradigm for analyzing globalchange policy alternatives. Concerns have long beenraised about money-based measures of well-being withina utilitarian framework as the chief basis for policyanalysis, even for issues that are wholly addressed withinone jurisdiction, and for which the winners and losersare found only in the current generation (Kelman, 1981,pp. 33–40). These concerns are greatly exacerbated whencomparing scenarios about different future states of theworld, which could greatly affect citizens of all countriesover many generations (Morgan et al., 1999; McDaniels,2000). Concerns about the relevance of money as ametric of societal well-being were evident in many of theconcerns raised over drafts of the 1996 IPCC workinggroup III document (Bruce et al., 1996).Ecological sustainability, and the ecological implica-
tions of human consumption levels, are two aspects ofglobal environmental change that many believe are notwell-represented in money-based metrics of globalenvironmental change. This paper employs a newpotential metric for IA that serves as an ecologicallybased measure of human consumption. It also serves asan indirect indicator of the long-term ecological risk and
ARTICLE IN PRESS
*Corresponding author. Tel.: +1-604-822-9288.
E-mail address: [email protected] (T. McDaniels).
0959-3780/03/$ - see front matter r 2003 Elsevier Science Ltd. All rights reserved.
doi:10.1016/S0959-3780(03)00009-8
sustainability of future scenarios regarding societalconsumption choices.The metric, referred to as the ecological footprint, was
developed by Rees and colleagues as a measure of theintrinsic sustainability of urban areas or whole countries(Rees, 1992; Rees and Wackernagel, 1994; Wackernageland Rees, 1996). In simple terms, the ecologicalfootprint (EF) is the notion of carrying capacity turnedon its head and applied to humans. Instead of askinghow many individuals a given area can support, the EFasks how much land and sea area is needed to support acommunity or a region, given certain assumptions aboutbio-productivity and human consumption patterns.Thus, the ecological footprint of a specified populationis the area of land and water ecosystems required on acontinuous basis to produce the resources that thepopulation consumes and to assimilate the wastes thatthe population produces, wherever on Earth the relevantecosystems are located (Rees, 2001).EF methods are evolving and the method has been
used in a number of applied studies. This paper hasseveral objectives. One objective is to consider whetherthe EF is a useful metric for representing the ecologicalimplications and scale of human consumption patterns,and for initial steps toward characterizing the long-termsustainability of these consumption patterns. Theunderlying concepts guiding this approach are discussedin Section 2. A second objective is to document anapplication of the EF within simulation modeling offuture consumption scenarios for North America, asdiscussed in Sections 3 and 4. A third objective is toexplore the implications of various policy or societalchoice scenarios on the EF for North America, in orderto clarify which aspects of current and future lifestyleshave the biggest influence on the ecological budget ofNorth America, as discussed in Section 4. A fourthobjective is to consider the potential advantages anddisadvantages of the use of the EF as a metric forinclusion in IA efforts, as discussed in Section 6.
2. Conceptual framework
The ecological footprint has its roots in the concept ofthe carrying capacity. As defined by biologists, carryingcapacity is the number of individuals of a given speciesthat a given habitat can support without beingpermanently damaged (Odum, 1989, p. 158; Rees,1992, p. 125). If the population of a given speciesexceeds the carrying capacity of a given habitat, theneither the resources required to meet the needs of thatspecies will be depleted, or the wastes produced by thatspecies will build to the point of poisoning members ofthe species, or both, and the population will crash.At the heart of the ecological footprint concept is
recognition that closed-loop ecological systems provide
the productivity needed to support human society(Wackernagel and Rees, 1996, p. 7). The cycles may begeographically close to people’s daily lives, as in the caseof a back-yard vegetable garden fed by composted foodwastes; or they may be far removed, as illustrated by theabsorption of local CO2 emissions by growing forests allover the world. The underlying premise of the ecologicalfootprint is that all human needs are supported by thebiophysical processes of the ecosphere.In the age of global trade, the closed-loop ecosystem
affected by human activity is the entire globe. Hence,ecological footprint analysis estimates how much of thebiophysical output of the earth is required to meet theresource consumption and waste absorption needs of agiven community, region, state or continent (Vitouseket al., 1986; Rees, 1996, 2001). All measures areconverted into hectares of land or water surface. Boththe ecosystem areas required to produce consumablegoods, and the ecosystem areas required to assimilatecertain wastes associated with the production andconsumption of these goods, are considered. Eco-footprint studies sometimes compare the estimateddemand for land/water ecosystems with the readilyavailable supply (e.g., domestic productive land) todetermine whether the study population and regioncould be self-sufficient (Rees, 1992, 1996; Wackernageland Rees, 1996). Such analyses show that many high-income countries (market-oriented consumer societies)are running significant ‘ecological deficits’ with the restof the world.A major contribution of EF as an index of consump-
tion is to reveal the scale of such eco-deficits and to forceexplicit acknowledgement of how they are overcome.There are only two ways to ‘support’ a biophysicaldeficit. The first is by over-exploiting and depletingdomestic natural capital and thereby permanentlyreducing local carrying capacity. The second is byappropriating the biophysical surpluses of other regionseither through commercial trade or by imposing on theglobal commons (e.g., by using the oceans or atmo-sphere as a waste dump or by exploiting open accessfisheries).In the EF framework of Wackernagel and Rees, fossil
fuel consumption is, for simplicity, treated in a mannerthat does not directly consider the issue of whether theEarth may run out of fossil fuel. Rather it simplyconsiders the waste disposal demands needed to absorbCO2 emissions from burning fossil fuel. Appropriatingthe carrying capacity of other areas is captured withinthe framework by resource flows accomplished throughinternational trade. In this manner, previous EFcalculations have chosen ‘‘conservative’’ assumptionsin order to avoid overstating the ecological productivityrequired to meet a given level of consumption. Forexample, metal and mineral consumption is accountedfor in ecological footprint analysis through the energy
ARTICLE IN PRESSM. Senbel et al. / Global Environmental Change 13 (2003) 83–10084
that is required for mineral extraction and the areasoccupied by mining camps and mining infrastructure.The issue of whether the resources are finite is notconsidered in the framework because the limiting factoris the extraction of the resource and not the resourceitself (Wackernagel and Rees, 1996).Rees, Wackernagel and their colleagues have em-
ployed the EF as a simple metric for the study of humanimpact on nature in many different areas (Rees, 1992;Shawkat, 1995; Wackernagel and Rees, 1996; Wack-ernagel et al., 1999; van den Bergh and Verbruggen,1999; Chambers et al., 2000; Costanza, 2000). One of theearliest studies considered the EF of the Lower FraserValley of British Columbia. Using a per capitaCanadian average consumption figure, and multiplyingit by the regional population, they estimated that LowerFraser Valley residents effectively consume the produc-tivity of an area of land that is 19 times the size of theactual region (Wackernagel and Rees, 1996, p. 87). Thatestimate of a Canadian per capita annual EF of 4.27 ha,was subsequently revised by Wackernagel et al. (1997) to7 ha, making the urban footprint of this region of BritishColumbia 30 times larger than the inhabited area.Wackernagel et al. (1997, p. 10) also compared theecological footprints of 52 nations to their ecologicalcapacity. Overall, Canada was shown to have anecological surplus of 1.5 ha/capita and the US has anecological deficit of 2.1 ha/capita.Measures of the potential productivity deficit or
surplus of a region or state have been used in EFanalysis as potential measures of the degree of ecologicalrisk, or, its obverse, ecological sustainability, of a givenarea. Implicit in this reasoning is the notion that theEarth as a whole cannot perpetually sustain ongoingecological deficits, in which ecological productivity ismined and consumed rather than limited to the harvestof a regenerative yield. However, the EF in its currentform does not have more specific indicators of thepotential for ecological disaster such as the widespreadloss of species and ecological services. Per capitaecological footprint calculations also do not includethe provision of fresh water or the neutralization,storage or assimilation of toxic waste. Hence, the EFis only a crude indicator of the total ecological risk orsustainability of a region. Other limitations in previousefforts at EF analysis have been the lack of attention touncertainty in the estimates, and little attempt todetermine how future scenarios of consumption andlifestyle choices may influence these measures. In thewords of Rees, ‘‘ecological footprint analysis was notintended to provide a dynamic window on the future,but rather a snapshot in time. As such it can both helpto assess current reality and to test alternative ‘what if’scenarios on the road to sustainability’’ (Rees, 2000).The influence of different assumptions is apparent in thedegree to which some parameter estimates in EF
calculations have evolved through successive studies.For example, Canada’s estimated productive areachanged from 15.24 ha/capita in the 1996 study (Wack-ernagel and Rees, 1996) to 9.6 ha/capita in the 1997study (Wackernagel et al., 1997) to 14.2 ha/capita in the2000 study (Wackernagel et al., 2002). The markeddifference may be justified in terms of the availability ofmore accurate data, or the differences may be a functionof changing ecosystem productivity, but such justifica-tions are not made explicit in these studies.Some writers have questioned aspects of the EF. One
argument is that EF analysis has assumed greatercertainty about waste absorption processes than ispossible given current scientific knowledge (van Kootenand Bulte, 2000). Like any analysis, there are also manyconceptual assumptions in the aggregation of differenttypes of natural habitat (e.g., forest land, pasture land),and in the productivity of different land types indifferent parts of the world. Economists have ques-tioned the lack of consideration of economic incentivesin assessing ecological productivity in different parts ofthe world. The output variation from country to countrymay have more to do with socio-economic factors thanpurely biophysical or ecological factors (van Kootenand Bulte, 2000). While the study presented in this paperdemonstrates that EF calculations can be made to reflectdifferent socio-economic and management regimes, thelack of social or distributional considerations in EFmodels serve to distance them from the realities of policydevelopment and analysis.On the other hand, the EF has several advantages that
make it a potentially useful metric for IA and othersimulation-modeling efforts. One advantage lies in whatthe EF does not assume, in contrast to what many othermodels take as a standard assumption. The EF does notassume the possibility of substituting ecological produc-tivity for other outputs, such as capital or income. Incontrast, economic models widely assume that substitu-tion across different kinds of variables is widelyachievable at the market clearing price. Hence, the EFhighlights the potential conflicts and difficulties thatcould arise when substitutability of capital or labor forecological productivity proves impossible. A secondadvantage is that, like other aggregate indicators, itreduces and simplifies complex resource use patterns toa single number (Costanza, 2000). The advantage overother aggregate indicators is that EF is easy tocommunicate and understand, as evidenced by thegrowing number of uses of and references to thisconcept.1 It considers, if in only gross terms, the
ARTICLE IN PRESS
1According to the Redefining Progress website individuals in the
following countries are either conducting research or teaching using
the ecological footprint: Argentina, Australia, Austria, Canada, Chile,
China, Columbia, Costa Rica, Denmark, Ecuador, England, Finland,
Germany, Guernsey, Greece, Hong Kong, Ireland, Italy, Japan,
Lithuania, Mexico, the Netherlands, New Zealand, Philippines,
M. Senbel et al. / Global Environmental Change 13 (2003) 83–100 85

ecological issues associated with consumption and wastedisposal, including waste in the form of CO2 and othergreenhouse gas emissions. It provides a graphic, tangibleand conceptually simple unit for tracking sustainability.The higher the ecological deficit, the less sustainable theentity that is being measured. While the same relativesimplicity is true of all aggregate indicators land areaunits are conceptually simpler than dollars or energyunits.
3. Ecological footprint scenario model
3.1. Model structure
The model presented here is a synthesis of (i) theelements of IA, as captured through a simulation model,and (ii) ecological footprint analysis in an uncertaintymodeling environment. Similar to other ecologicalfootprint calculations, the model disaggregates differenttypes of human consumption into land and oceansurface areas needed to produce the resources used inthat consumption. It also separates factors influencingconsumption and ecological production so that they canbe independently manipulated to gain insight into theirrelative significance on EF calculations.The ecological footprint simulation model (EFSM)
uses a 10-year temporal increment and takes advantageof the simplifying homogeneity of ecological footprintinputs. All inputs, with the exception of population andincome, are in hectares. As summarized in Fig. 1, thebasic structure of the model is a supply and demandsystem of accounting with the sum being the netecological surplus or deficit in the study region. On thedemand side (e.g., the top half of Fig. 1), humanconsumption comprises three distinct categories: hous-ing and transportation, food and consumer goods, acategorization used by Wackernagel and Rees (1996).Individual consumption in each of the categories is thenaggregated and multiplied by a projected population atany given year.2 The supply side of the model usesinformation about the land area categories and theirrespective productivity within North America. Weadapted a classification borrowing from both Wack-ernagel and Rees (1996) and Wackernagel et al. (1997).We used Wackernagel et al.’s ecosystem types: energyland, used for sequestering CO2, or for generating otherforms of energy; urban land, developed to house
humans and human institutions; arable land, used forcrop production; pasture land, grazing land for raisinglivestock; forest land, logged for the production oftimber products; marine land, fished for seafood.3
3.2. Methods
The EFSM is constructed using Analytica 1.1.1TM
software. The model is a computational system thatrelates human consumption figures in the local region tothe natural resources available in that local region todetermine its ecological budget over time. It projects arange of values for ecological production and consump-tion over the twenty-first century allowing for uncer-tainty.Three different variables have changeable inputs that
function as choices of future assumptions. We use acombination of choices across the different variables tocreate four distinct scenarios regarding consumptionchoices and resource productivity, although the model iscapable of computing the effects of many differentcombinations of scenarios. We used it to generate arange of possible outcomes and to determine whichinput variables have greater influence on the ecologicalbudget of North America (see Appendix A). Weconducted sensitivity analyses to determine the relativeinfluence of each of the three groups of lifestyle choices,consumption efficiency and ecological production, onthe ecological budget of the local region.Some of the other demand related assumptions should
be clarified. Individual income is a function of the size ofthe economy over the population for the given year. Theeconomy is based on a random walk dynamic prob-ability distributed around an assumed annual growthrate of 2%.4 To account for greater incomes contribut-ing to greater consumption (assuming people spendrather than save their extra income) we divided theincome for each year by the average individual income(adjusted for inflation) in the base year of 1995. Theresult of population-adjusted individual ecologicalfootprint (consumption multiplied by population) andincome-adjusted individual ecological footprint (averageincome divided by base year income) is the totalecological footprint for the entire population of thelocal region for any given year.On the supply side of the model, six kinds of
ecological productivity are characterized, and subjectedto different policy choices. The six areas include fourdifferent land uses: arable, pasture, forest and urban.They also include fossil fuel emissions assimilation areas
ARTICLE IN PRESS
(footnote continued)
Portugal, Scotland, Singapore, Spain, Sweden, Switzerland, Taiwan,
Turkey, Uruguay, and the US (Redefining Progress, 2001). One issue
of Ecological Economics (Vol. 32, No. 3, March 2000) featured a
forum of 12 invited discussion articles on EF.2Population projections are based on a population growth
coefficient that fluctuates every 5 years between a normal distribution
of 2% and 2.2% with a standard deviation of 0.2.
3The notable departures from (Wackernagel and Rees, 1996) are
that energy land includes forms of energy other than fossil energy and
the ‘‘built environment’’ and ‘‘gardens’’ categories are combined. We
also added marine areas.4Both the population and income inputs are borrowed from the
ICAM 2 model developed at Carnegie Mellon University.
M. Senbel et al. / Global Environmental Change 13 (2003) 83–10086
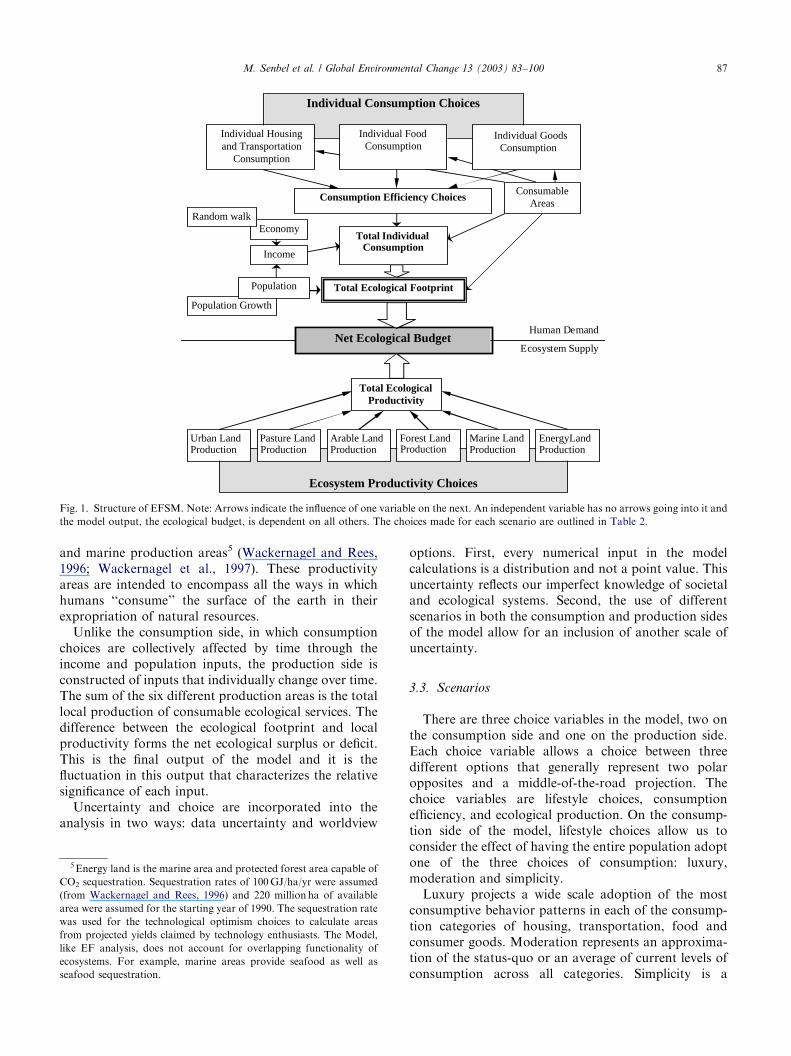
and marine production areas5 (Wackernagel and Rees,1996; Wackernagel et al., 1997). These productivityareas are intended to encompass all the ways in whichhumans ‘‘consume’’ the surface of the earth in theirexpropriation of natural resources.Unlike the consumption side, in which consumption
choices are collectively affected by time through theincome and population inputs, the production side isconstructed of inputs that individually change over time.The sum of the six different production areas is the totallocal production of consumable ecological services. Thedifference between the ecological footprint and localproductivity forms the net ecological surplus or deficit.This is the final output of the model and it is thefluctuation in this output that characterizes the relativesignificance of each input.Uncertainty and choice are incorporated into the
analysis in two ways: data uncertainty and worldview
options. First, every numerical input in the modelcalculations is a distribution and not a point value. Thisuncertainty reflects our imperfect knowledge of societaland ecological systems. Second, the use of differentscenarios in both the consumption and production sidesof the model allow for an inclusion of another scale ofuncertainty.
3.3. Scenarios
There are three choice variables in the model, two onthe consumption side and one on the production side.Each choice variable allows a choice between threedifferent options that generally represent two polaropposites and a middle-of-the-road projection. Thechoice variables are lifestyle choices, consumptionefficiency, and ecological production. On the consump-tion side of the model, lifestyle choices allow us toconsider the effect of having the entire population adoptone of the three choices of consumption: luxury,moderation and simplicity.Luxury projects a wide scale adoption of the most
consumptive behavior patterns in each of the consump-tion categories of housing, transportation, food andconsumer goods. Moderation represents an approxima-tion of the status-quo or an average of current levels ofconsumption across all categories. Simplicity is a
ARTICLE IN PRESS
Ecosystem Productivity Choices
Individual Consumption Choices
Individual Housingand Transportation
Consumption
Total IndividualConsumption
Total Ecological Footprint
Urban Land Pasture Land Arable Land Forest Land Marine Land EnergyLand
Economy
Income
ConsumableAreas
Random walk
Population Growth
Individual FoodConsumption
Population
Net Ecological Budget
Consumption Efficiency Choices
Human Demand
Ecosystem Supply
Total EcologicalProductivity
Individual GoodsConsumption
Production Production Production Production Production Production
Fig. 1. Structure of EFSM. Note: Arrows indicate the influence of one variable on the next. An independent variable has no arrows going into it and
the model output, the ecological budget, is dependent on all others. The choices made for each scenario are outlined in Table 2.
5Energy land is the marine area and protected forest area capable of
CO2 sequestration. Sequestration rates of 100GJ/ha/yr were assumed
(from Wackernagel and Rees, 1996) and 220 million ha of available
area were assumed for the starting year of 1990. The sequestration rate
was used for the technological optimism choices to calculate areas
from projected yields claimed by technology enthusiasts. The Model,
like EF analysis, does not account for overlapping functionality of
ecosystems. For example, marine areas provide seafood as well as
seafood sequestration.
M. Senbel et al. / Global Environmental Change 13 (2003) 83–100 87

voluntary move toward reduced consumption and ashift away from consumerism and material culture.Table 1 summarizes the conditions assumed for eachcategory for each ‘‘Individual Consumption’’ choice.A second ‘‘choice variable’’ on the consumption side
of the model addresses efficiency of consumption. Thisgroup enables projections on the role of technology inaffecting overall consumption. Will technology and theproliferation of information bring about a decoupling ofthe human economy from ecological resources, or willincreased reliance on technology require greater expen-diture of energy and materials? Three choices arepossible: dematerialization, moderate efficiency andenergy intensification. These scenario choices are usedin the model as factors affecting total consumption bythe entire population for a given year.While the analyses presented here are illustrative of
the average consumption and production patterns fordifferent scenarios, in reality these values are notindicative of the distribution of resources among thepopulation. Hence, an equitable society and inequitablesociety may have the same average consumption figures,but of course very different specific welfare levels fordifferent groups within the population.The choice variable on the production side of the
model consists of a choice between intensified produc-tion, business-as-usual, conservation and depletion. Thechoices affect the projected production of ecologicalservices in the six different areas of consumption used inecological footprint analysis. Intensification places a lotof confidence on technology and its ability to furtherincrease the capacity of ecosystems to produce goods forhuman consumption. Business-as-usual follows currentlevels with some fluctuations over time. Conservationprojects a societal move toward protecting naturalecosystems and preserving species health and diversityand depletion sees a steady decline in all ecosystemproductivity.Scenario modelers often deliberately polarize possible
outcomes to demonstrate how choices made today mayhave consequences that may result in radically differentfutures. For example, Bossel compares a future ofpartnership to one of competition. Partnership repre-sents sustainability while competition is a perpetuationof individualism and consumerism (Bossel, 1998). Each
scenario is described and analyzed in great detail,allowing for a thorough exploration of the complexitiesinherent in envisioning our collective future. Gallopinand Raskin use three different scenario groups: ‘‘con-ventional worlds’’, ‘‘barbarisation’’ and ‘‘great transi-tions’’. Each scenario group is further broken down totwo possible outcomes (Gallopin and Raskin, 1998).This approach is comprehensive and affords them aconsiderable range of possible conditions but diminishesthe depth to which each condition could be explored.Common to both studies is a depiction of the desirableand the undesirable.To generate a range of model outputs that encapsu-
lates a wide range of possible scenarios we used acombination of choices from the different scenariogroups. In creating the scenarios we sought to representoptimism on the one hand, and pessimism on the other(Table 2). We also added what a perpetuation of thestatus-quo might look like as well as a set of choices thatmay describe what a sustainable society might look like.Table 2 indicates the set of choices used for each of the
ARTICLE IN PRESS
Table 1
Consumption choices per category of consumption
Individual consumption Luxury Moderation Simplicity
Housing Single family detached house Townhouse Walk-up apartment building
Food Imported food and beverages.
Diet heavily dependent on animal
products
Mostly vegetarian diet.
Occasional meat consumption,
with packaged regional product
Vegetarian locally grown diet with
minimum packaging
Transportation Private auto commuting Public transit and vanpooling Walking and cycling
Consumer goods Icelandic example North American status-quo
figures
World average example
Table 2
Model scenarios
Scenario Choice variable Choice made for
scenario
Technological
optimism
Lifestyle choice Luxury
Consumption
efficiency
Dematerialization
Ecological production Intensified production
Depletion and
scarcity
Lifestyle choice Simplicity
Consumption
efficiency
Moderate efficiency
Ecological production Depletion
Business as usual Lifestyle choice Moderation
Consumption
efficiency
Moderate efficiency
Ecological production Business as usual
Sustainability Lifestyle choice Simplicity
Consumption
efficiency
Dematerialization
Ecological production Conservation
M. Senbel et al. / Global Environmental Change 13 (2003) 83–10088

constructed scenarios. The four constructed scenariosare Technological Optimism, Depletion and Scarcity,Business-as-usual and Sustainability. These scenariosare not mutually exclusive, indeed business as usualplaces a lot of faith in technology and may well lead todepletion. Or the shift to a sustainable society may wellrequire reliance on technological solutions. As Table 2indicates this overlap is accounted for through the use ofthe same options in one or more of the choice variables.This categorization is also useful for applying
ecological budgeting onto self-referencing value systems.For example, if a person believes that the status-quo isviable in the long run, it would be useful for that personto see what kind of an ecological budget that may createin the long term. On the other hand, technologicaloptimists may believe that we are about to experienceunimaginable advances in technology that will seeecological productivity double.
4. Results
Using status-quo conditions as inputs for the model,the ecological footprint of North America was estimatedto be 8.2 ha/capita in 1995, and 8.4 ha/capita in 2000.The most recent comparable estimate by Wackernagelet al. (1997) (using 1993 data and the population-adjusted average for Canada and the US) was 8.1 ha/capita. For comparison, the total actual area (notecologically productive area) of North America is 1.9billion ha or approximately 6 ha per capita. Fig. 2depicts North America’s EF over the next century foreach of the scenarios of consumption. The increase in
per capita EF is exponential for the luxury scenario,much more gradual for the simplicity scenario withmoderation falling almost exactly in between.The differences among the different scenarios at the
base year indicate the extent of major shifts that wouldbe necessary to shift lifestyles from one consumptionregime to another. The only transitional time accountedfor in moving from one scenario to the next is in thehousing stock, where a sudden jump in 2020 (which inreality would be more gradual) represents the replace-ment or renovation of our current housing and buildingstock. The EF is also time-dependent to the extent thatconsumption is linked to a growing population and agrowing economy. Regardless of the consumptionchoice, the ecological footprint of North America islikely to almost double by the year 2030 (Fig. 2).Fig. 3 considers the net ecological budget, or the sum
of EF supply minus demand, over all the scenarios.Even with no CO2 sequestration limits imposed onenergy land productivity, the Business as Usual scenario(shown as moderation business as usual) indicates anecological deficit between the years 2030 and 2040depending on the prevailing lifestyle choices.6
The initial surplus in the ecological budget is the resultof optimistic worldviews that do not consider theabsorption of CO2 to be a required output of ecological
ARTICLE IN PRESS
Ecological Footprint of North America
000.0E+0
2.0E+9
4.0E+9
6.0E+9
8.0E+9
10.0E+9
12.0E+9
1990 2000 2010 2020 2030 2040 2050 2060 2070 2080 2090 2100
Year
Hec
tare
s of
Lan
d an
d O
cean
Simplicity Dematerialization
Simplicity Energy Efficiency
Simplicity Energy Intensification
Moderation Dematerialization
Moderation Energy Efficiency
Moderation Energy Intensification
Luxury Dematerialization
Luxury Energy Efficiency
Luxury Energy Intensification
Actual Land Area of North America
Replacement of housing stock
Fig. 2. Ecological footprint of North America over the next century.
6Wackernagel et al. (1997) estimated that in 1993 North America
was already experiencing a deficit. The different findings here arise
because the Business-as-Usual scenario does not account for CO2
sequestration, and consumption choices are assumed to be uniform
across the entire population. This scenario represents optimism in
terms of the ability of the earth’s atmosphere to absorb all that is
discharged into it without affecting global climate.
M. Senbel et al. / Global Environmental Change 13 (2003) 83–100 89

activity. This position ignores the consequences of achanged atmospheric environment but is incorporatedinto the model as an interpretation of the dominantpolitical point of view. The long-term trend of growingnet ecological deficits over all scenarios except simplicityis a notable result in Fig. 3. The technological optimismscenario shows a deficit for the entire 21st century.If, on the other hand, per capita consumption does
not increase and we continue to have socio-economicstratification, then a doubling of ecological productivitycould guard against a deficit until the end of the 21stcentury. In other words, if we want to maintain NorthAmerica’s current lifestyles and their correspondinglevels of consumption while avoiding ecological deficits,the productive capacity of all ecosystems would have toat least double and be coupled with a reduction ineconomic growth or its accompanying spending.Fig. 4 assumes that all scenarios start with a singular
understanding of a balanced ecological budget in theyear 1990. For EF scientists such as Rees andWackernagel this is already an optimistic point of view.The great divergence of scenarios over time irrespectiveof the starting point demonstrates the degree to whichdifferent choices can affect the future of our ecologicalbudget and in turn our ecological sustainability.
4.1. Sensitivity analysis
We conducted sensitivity analysis in three ways. First,we isolated scenario groups by recording the ecologicalbudget at either extreme of the scenario group while
holding all other variables constant at the middle choice.Having determined that the lifestyle choices scenariogroup is the most significant in terms of effects onecological deficits, we conducted sensitivity analysis onthe consumption categories within the group. Using thesame methods of changing isolated variables andrunning elasticity functions, we determined that housingand transportation choices are the most significant onesin terms of the ecological budget. Total IndividualConsumption was the most influential variable usingthis method of analysis. Consumption efficiency is theleast influential scenario group and seems relativelyinsignificant compared to the other two. These resultsare not surprising if one considers that humans are morelikely to be able to exercise control over ecologicalconsumption than over ecological production. Con-sumption choices lie more within the human sphere ofcontrol while production scenarios require us to exercisecontrol over the functioning of ecosystems.Second, we used an importance correlation function
built into the computer modeling software (Fig. 5). Thisformula tracks the absolute rank-order correlationbetween the sample of output values and the samplefor each uncertain input. It is not affected by extremevalues and skewed distributions and it averages over theentire joint probability distribution. Rank-order corre-lation is measured by computing the ranks of theprobability samples and then computing their correla-tion. By using the rank order of the samples, themeasure of correlation is not affected by skeweddistributions or extreme values, and is, therefore more
ARTICLE IN PRESS
Ecological Budget of North America
-8,E+09
-7,E+09
-6,E+09
-5,E+09
-4,E+09
-3,E+09
-2,E+09
-1,E+09
0,E+00
1,E+09
2,E+09
3,E+091990 2000 2010 2020 2030 2040 2050 2060 2070 2080 2090 2100
Year
Simplicity Intensified Production
Simplicity Business as Usual
Simplicity Depletion
Simplicity Conservation
Moderation Intensified Production
Moderation Business as Usual
Moderation Depletion
Moderation Conservation
Luxury Intensified Production
Luxury Business as Usual
Luxury Depletion
Luxury Conservation
Hec
tare
s of
Lan
d an
d O
cean
Fig. 3. Ecological budget for all scenarios.
M. Senbel et al. / Global Environmental Change 13 (2003) 83–10090
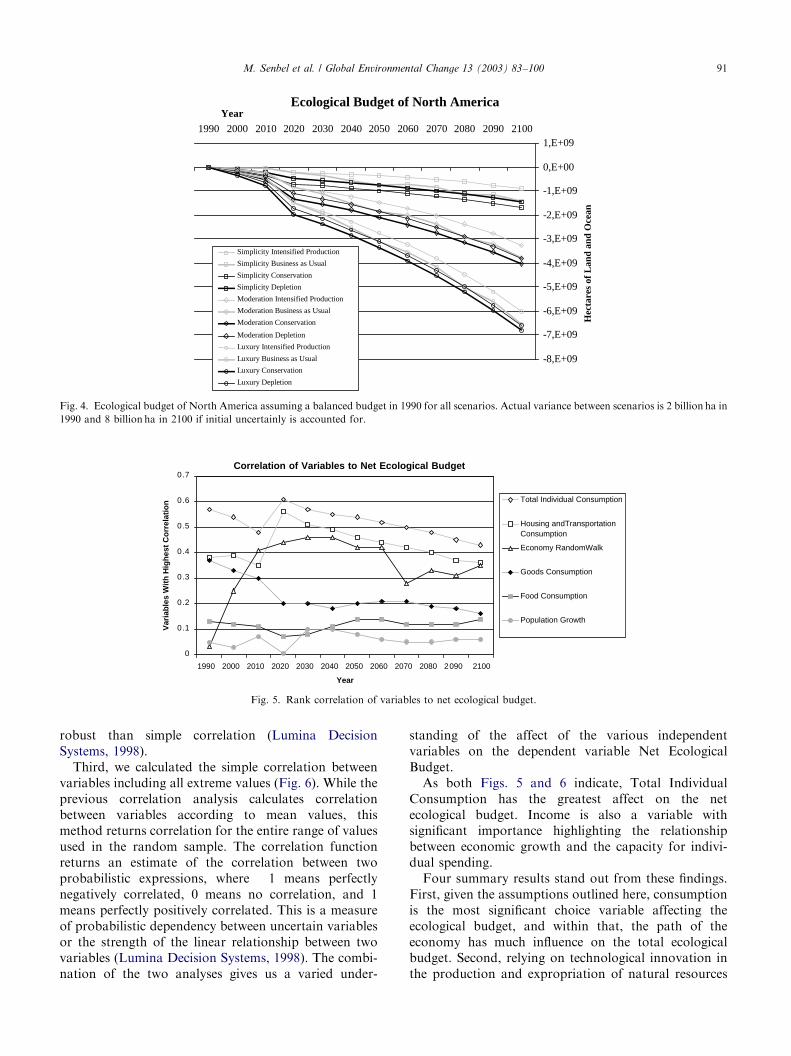
robust than simple correlation (Lumina DecisionSystems, 1998).Third, we calculated the simple correlation between
variables including all extreme values (Fig. 6). While theprevious correlation analysis calculates correlationbetween variables according to mean values, thismethod returns correlation for the entire range of valuesused in the random sample. The correlation functionreturns an estimate of the correlation between twoprobabilistic expressions, where �1 means perfectlynegatively correlated, 0 means no correlation, and 1means perfectly positively correlated. This is a measureof probabilistic dependency between uncertain variablesor the strength of the linear relationship between twovariables (Lumina Decision Systems, 1998). The combi-nation of the two analyses gives us a varied under-
standing of the affect of the various independentvariables on the dependent variable Net EcologicalBudget.As both Figs. 5 and 6 indicate, Total Individual
Consumption has the greatest affect on the netecological budget. Income is also a variable withsignificant importance highlighting the relationshipbetween economic growth and the capacity for indivi-dual spending.Four summary results stand out from these findings.
First, given the assumptions outlined here, consumptionis the most significant choice variable affecting theecological budget, and within that, the path of theeconomy has much influence on the total ecologicalbudget. Second, relying on technological innovation inthe production and expropriation of natural resources
ARTICLE IN PRESS
Ecological Budget of North America
-8,E+09
-7,E+09
-6,E+09
-5,E+09
-4,E+09
-3,E+09
-2,E+09
-1,E+09
0,E+00
1,E+091990 2000 2010 2020 2030 2040 2050 2060 2070 2080 2090 2100
Year
Simplicity Intensified Production
Simplicity Business as Usual
Simplicity Conservation
Simplicity Depletion
Moderation Intensified Production
Moderation Business as Usual
Moderation Conservation
Moderation Depletion
Luxury Intensified Production
Luxury Business as Usual
Luxury Conservation
Luxury Depletion
Hec
tare
s of
Lan
d an
d O
cean
Fig. 4. Ecological budget of North America assuming a balanced budget in 1990 for all scenarios. Actual variance between scenarios is 2 billion ha in
1990 and 8 billion ha in 2100 if initial uncertainly is accounted for.
Correlation of Variables to Net Ecological Budget
0
0.1
0.2
0.3
0.4
0.5
0.6
0.7
1990 2000 2010 2020 2030 2040 2050 2060 2070 2080 2090 2100
Year
Var
iab
les
Wit
h H
igh
est
Co
rrel
atio
n Total Individual Consumption
Housing andTransportationConsumption
Economy RandomWalk
Goods Consumption
Food Consumption
Population Growth
Fig. 5. Rank correlation of variables to net ecological budget.
M. Senbel et al. / Global Environmental Change 13 (2003) 83–100 91

would have to yield twice the current levels ofproduction from the same land and water resources inorder to maintain current consumption without increas-ing deficits over the next century. Third, without thislevel of innovation in productivity, and withoutconsiderable reductions in consumption associated withhousing and transportation choices, North Americanswill increasingly live in a continent of ecological deficits.
5. Advantages and disadvantages of the EF as an IA
metric
What are the advantages and disadvantages of the EFas a potential non-monetary metric of human consump-tion and ecological productivity in IA studies? Thedesirable features of a performance measure for anyspecific objective have been discussed by Keeney (1992)who argues that a good metric should be ‘‘under-standable, operational, and measurable’’ (Keeney, 1992,p. 112–118). Keeney’s comments refer to one objectiveand a single associated performance measure within amultiple objective framework, used to gain insightregarding tradeoffs within specific, well-defined deci-sions. The EF is not a measure for a single objective, butrather a constructed area index that has severalcomponents (such as ecological productivity, ecologicalconsumption of stocks and energy flows), and is morerelevant for understanding broad patterns than specificpolicy decisions. Yet, Keeney’s criteria are useful injudging the merits of the EF as an index, or one ofseveral measures, for IA.Beginning with the ‘‘understandable’’ criterion (which
asks whether the results can be interpreted andassimilated readily by interested parties) previous
experience and studies have shown that the EF conceptis intuitively easy to understand, readily communicated,has been adopted by many researchers (Wackernageland Rees, 1996; Wackernagel et al., 1997; Chamberset al., 2000). The available evidence is that the EF is seenas conceptually simple and appealing, suited to powerfulimagery, and popular with scholars and stakeholdersseeking indirect measures of difficult concepts such theecological implications of consumption (Costanza,2000).Keeney’s definition of ‘‘operational’’ is that the metric
describes the consequences of alternatives with respectto the associated objective, and that it provides a basisfor considering value judgements about the desirabilityof the varying degrees to which the objective could beachieved (Keeney, 1992, p. 114). In our view, the EF ispartially operational under this definition, assuming oneaccepts that measures of the energy and materialsrequired and produced for human consumption activ-ities can be converted to equivalent land areas. Thisassumption and the overall approach reflects therecognition that all Earth’s energy (other than nuclearfission) and thus all biological productivity flows fromthe conversion of energy from the sun on the Earth’ssurface. It is also in the spirit of research showing theextent to which humans appropriate the primaryproductivity of the Earth’s surface (Vitousek et al.,1986). The assumptions embodied in this model forcalculating the EF can be manipulated to reflectdifferent worldviews, different beliefs about uncertain-ties or different assumptions about parameters. Model-ing of the EF is also readily operationalized in that thebasic data sources are readily available, calculations arestraightforward, and creating scenarios about alterna-tive futures is not difficult.
ARTICLE IN PRESS
Fig. 6. Correlation of variables to net ecological budget.
M. Senbel et al. / Global Environmental Change 13 (2003) 83–10092
Conversely, the measure provides only an indirectbasis for considering value judgments about differentlevels of performance in terms of the underlyingobjective. One might initially think that the fundamentalobjective represented by the EF is whether ecologicalproduction and consumption are in balance in a givenlocation, region, or continent. In that vein, one couldmake value judgments about the desirability of whetherecological productive capacity is exceeded at a givenscale. But, following the reasoning in Section 2, and thelogic of distinguishing ends from means in objectivehierarchies (Keeney, 1992) this measure is important noton its own, but rather as a means for showing the extentof ecological risk, and its obverse, ecological sustain-ability, at different geographic scales.The EF does not provide a direct basis for measuring
ecological risk, in terms of potential species loss,impairment of ecological services or ecosystem collapse.These potential ecological disasters often occur throughsurprise, as the result of rapid state-changes in theequilibrium of complex systems, and are influenced byregulatory, waste management and land use patterns.The specific constraints that could lead to growingecological impairment differ by location, and bygeographic scale. The EF gives an indirect measure ofecological risk by considering one influence on manyparameters of ecological risk, but it does not directlymeasure risk or sustainability. For example, a regionwith an ecological surplus could still suffer species loss,ecosystem collapse and impairment of ecological ser-vices, depending on resource management patterns andwaste disposal patterns within and adjacent to theregion.However, we know of no other simple aggregate
approach that does a better job in directly measuringecological risk at any scale, nor any that is also directlytied to human consumption at that scale. Hence, whilethe EF is not a perfectly operational measure ofecological risk and sustainability, it is a useful indirectmeasure in combining both production and consump-tion at large scales.Finally, ‘‘measurable’’ means, in Keeney’s words, that
metric defines the associated objective in more detailthan provided by the objective alone, and that itembodies the value judgments appropriate for theobjective. The results of EF calculations are informativein communicating levels of performance about thecomponents of the index, and do provide details aboutwhat drives the levels of performance, given theassumptions. The EF calculations are open to differentvalue judgments about, say, the relative ecologicalsignificance of consuming stocks of fossil fuel energyversus a constant flow of renewable energy. Hence, theconstructed index represented by the EF could be builton the basis of different value judgments if desired(McDaniels, 1995).
Yet another set of criteria for evaluating the EF as apotential metric for IA arise from the nature andpurposes of IA studies. Such studies are intended tointegrate across human, natural and technologicalsystems, over broad scales of time and area, to gaininsights not apparent by looking at only one of thesesystems in more detail at a limited scale. IA studies areused to develop scenarios for helping to understandassumptions and behaviors leading to alternativefutures, rather than for predictive purposes. Finally,IA studies aspire to be policy relevant, in terms ofproviding insight for real choices.Based on the work discussed in this paper, the EF is a
highly useful measure in terms of its ease in integrationover long time scales and large areas. Its findingsdemonstrate emergent properties of the human andecological systems not apparent by considering thesystems separately. The EF is highly useful as a basis forcharacterizing the implications of scenarios involvingdifferent human consumption patterns and levels ofecological productivity and land use change. Finally, webelieve the EF is policy relevant, but to a limited degree.In one respect, the EF is policy relevant in that it
draws attention and attempts to explicitly represent theecological implications of growing levels of consump-tion within ecologically closed systems, at widelydifferent scales. Through its use of a single metric, theEF integrates across both consumption and productionin ecological land-based terms rather than dollar terms.Its conceptual simplicity and imagery mean that the EFis highly relevant for drawing attention to these littlerecognized aspects of global and regional issues. On theother hand, this simplicity is also a drawback. Likeefforts to express all outcomes in money terms, the EFdoes not provide real insight into tradeoffs that arise inspecific policy contexts in which highly incommensurateobjectives must be traded off. For example, sustain-ability involves issues of economic, ecological and socialfutures. The EF on its own is helpful but not conclusivein directly considering how much of an increase in theEF might be justified in order to create an improvementin, say, social sustainability or equity.In sum, the EF seems well suited as a potential
measure for future IA studies, with some caveats. First,its robustness and the insight it could yield would beimproved if future researchers attempted to tie the levelof ecological risk associated with a given net ecologicalbudget to specific ecological constraints at that geo-graphic scale. Of course, the mainstream of IA has todate not attempted to address these issues to any extent.Most IA studies do not directly consider tradeoffsamong competing objectives as a basis for policyanalysis. Second, use of the EF for direct policy analysisrather than as a simple and insightful summary measurewould be enhanced if the EF were considered as one of aset of measures that together cover the range of multiple
ARTICLE IN PRESSM. Senbel et al. / Global Environmental Change 13 (2003) 83–100 93
objectives in making decisions about global changeissues.
6. Conclusion
Modeling ecological footprint scenarios offers in-sights into the ecological production and consumptionlevels that together comprise different trajectories intothe future. It has the potential to allow study of theimplications of different ideological assumptions interms of implications for long-term ecological sustain-ability. While it appears that an ecological deficit inNorth America is likely through the next century, thereare scenarios that indicate how behaviors could changeto avoid such outcomes. Individual consumption is themost significant factor in determining our ecologicalbudget. The simplicity scenario in which North Amer-icans live in high-density areas with reduced materialand transportation demands leads to a balancedecological budget. However, with no change in percapita consumption and a doubling of resource pro-ductivity through technologies that do not requireincreased consumption, North America could alsomaintain a surplus.The policy implications of these results likewise
require further study. What is the direct ecological riskof a prolonged ecological deficit across a continent?Should governments intervene to insure that local andglobal ecological budgets are balanced? These arecritical questions but ones that cannot be answeredusing EF analysis. The greatest power of EF as anindicator is not its precision or its ability to give cleardirection, but rather in its conceptual simplicity and easeof communication.
Acknowledgements
This research was made possible through a grant fromthe US National Science Foundation to the Center forthe Integrated Study of the Human Dimensions ofGlobal Change (SBR 95-21914) at Carnegie MellonUniversity. Maged Senbel also thanks the KillamFoundation and the Social Sciences and HumanitiesResearch Council of Canada for additional support.
Appendix A. Reviewers’ view
A.1. Assumptions
In constructing EFSM, we made a set of assumptionsthat inform how the model itself will operate and whatdata it will use to feed its inputs. Each of the scenarios ofthe model assumes a set of conditions that may take
place over the next 100 years. The reality will, of course,be a much more complex unfolding of conditions than issuggested by the neat categorization within EFIAM.The scenarios are an abstraction of the different factorsthat determine the ecological footprint of a region overtime. Each of the scenario groups has two polarizedscenarios that are not fantastical extremes, but defen-sible positions on what may be possible. A balance wasstruck between creating radical scenarios that envisiondiverging future paths, to account for uncertainty, andscenarios that are a defensible position on what mayactually unfold.In developing the scenarios we included a range of
views on the health of global and local ecosystems. Indeveloping the variables and scenarios we deliberatelyincluded scenarios that range from technological opti-mism (Beckerman, 1995; Rifkin, 1998) to ecologicalpessimism (Odum, 1989; Baskin, 1997). We do not makean argument for either case but incorporate both pointsof view into the model by creating a scenario built oneach worldview. In translating both worldviews intofuture ecological production and human consumptionfigures, we had to make assumptions based onqualitative descriptions as well as the example of actualprojects and community action.7 Because all numericalinputs in the model are distributions and not pointvalues, precision is neither necessary nor desirable. Themodel is not an attempt to precisely represent reality orpredict it, but is rather a heuristic for considering avariety of perspectives in uncovering what variables aremost significant in a given perspective.
A.2. Individual lifestyles
Housing consumption figures used in this scenariogroup build on Lyle Walker’s Masters thesis at UBC.Walker examined the consumption requirements of fivedifferent housing types including the embodied energyof construction and operation. He also estimated theprojected transportation consumption of residents,living in each of the housing types, by imagining thatentire cities would be built of one housing type oranother (Walker, 1995).EFSM departs from this projection by separating
housing from transportation. We allow for scenarios inwhich housing choices are consumptive but, throughdeliberate mixed-use planning, services and amenitiesare situated in such a way as to allow for reducedtransportation consumption. Transportation choices arelimited to those that individuals make for their personal
ARTICLE IN PRESS
7The architectural and community development example of
Strathcona Community Gardens in Vancouver, demonstrate urban
food provision as well as self-sufficiency in electricity and liquid waste
disposal. Please see Appendix A on assumptions for the simplicity
lifestyle choice.
M. Senbel et al. / Global Environmental Change 13 (2003) 83–10094
transportation needs and not for the transportation ofthe goods that they consume. The latter is included inthe consumption figures in the goods and servicescategory. All inputs for this scenario group are normaldistributions with means as described below and astandard deviation of 20% of the mean.
A.2.1. Luxury
This choice projects an increase in individual humanconsumption across all categories. For the luxury choicein housing consumption we assumed a standard singlefamily detached dwelling. We subtracted Walker’saverage housing estimate from Wackernagel and Rees’total housing estimate (this figure includes non-residen-tial buildings) added Walker’s estimate for single familyhomes. Thus, the total estimated footprint related tohousing choices is 2 ha (Walker, 1995, p. 123).8 Whileconstruction techniques vary across the North Americancontinent, changes in materials are compensated for byhigher embodied energy in those areas where woodframe construction is not used. These figures weretherefore assumed to be representative of housingfootprints in the entire study region of North America.The Luxury choice projects mean transportation
demands of 1 ha per capita. Once again, we tookWalker’s average per capita estimate across all housingtypes for a city of single family homes and subtracted itfrom Wackernagel and Rees’ total transportation figureand added Walker’s footprint estimate for transporta-tion in a city of single family homes. This amounted toan average daily commute of 1 h in a single occupancyvehicle. The transportation footprint under the Luxuryscenario is therefore 1.8 ha per capita (mean) fortransportation consumption footprints.For food consumption we compared figures from
different countries around the world as well as the worldaverage. As shown in Table 3, food demand variesconsiderably around the world. For the luxury choice ofincreased consumption we looked at OECD countriesthat consume more than North Americans for theirdietary needs. Iceland had the largest footprint at thetime of the study but the largest portion is derived frommarine ecosystems which is unlikely to become the casein North America. New Zealand, which also has a verylarge food footprint, is similar to Canada in its heavydependence on pasture land productivity. We thereforeused the New Zealand figures of 7.2 ha/capita for theLuxury scenario in North America.To capture the notion of increased consumerism in
the luxury scenario, we chose a goods and services meanfootprint of 3.0 ha. Although the figure given forCanada in Wackernagel and Rees in 1995 is 1.2 ha, this
figure is closer to 2.0 ha per capita in Wackernagel et al.study. The latter study does not categorize goods andservices specifically however. To reflect the lack of dataand the greater degree of uncertainty, we used a normalprobability distribution with a standard deviation that is20% of the mean figure.
A.2.2. Moderation
The moderation scenario is intended to project acontinuation of status-quo consumption. It rises onlywith a rise in either income or population. For housingconsumption, we assume that the average NorthAmerican will live in a townhouse, or row house. Theshared party walls between residences translate into areduction in the consumption of building materials andin the expenditure of energy for heating. We usedWackernagel and Rees’ 0.9 ha estimate.In addition to the construction material and opera-
tion energy efficiency gains of townhouses over singlefamily homes, the higher density of townhouse designfacilitates the provision of services in close proximity toa greater number of residences. If people choose to takeadvantage of this proximity and substitute using privatecars with public transit then they will have a smallertransportation footprint. This would be most significantin terms of energy land consumption and urban landconsumption. Walker estimated per capita transporta-tion footprints, for a city composed solely of town-houses, to be 0.41 ha (Walker, 1995, p. 132). To includeall other societal transportation needs, such as train andair transport, We adjusted this number using Wakerna-gel and Rees’ figures, which include all forms oftransportation, to obtain a mean footprint of 1.0 haper capita.The Moderation choice projects a continuation of the
current food consumption footprints which are expli-citly provided by Wackernagel et al. (1997). Thepopulation-adjusted average for Canada and the US is
ARTICLE IN PRESS
Table 3
Comparison of food consumption footprints adapted from Wack-
ernagel et al. (1997)
Footprint demand per capita for food in hectares (1993 data)
Ecosystem
area
Energy Arable Pasture Forest Urban Marine Total
Canada 0.36 0.49 1.52 0.03 0 0.96 3.36
USA 0.51 0.35 1.84 0.03 0 0.92 3.66
Canada and
USA average
0.49 0.36 1.8 0.03 0 0.92 3.6
France 0.24 0.27 1.87 0.03 0 1.31 3.72
Japan 0.18 0.19 0.57 0.03 0 3.11 4.08
New Zealand 0.26 0.16 5.53 0.03 0 1.21 7.19
Iceland 0.27 0.19 1.39 0.03 0 5.87 7.76
Germany 0.25 0.32 1.29 0.03 0 0.85 2.74
World Aver. 0.09 0.18 0.57 0.03 0 0.56 1.43
India 0.02 0.13 0.19 0.03 0 0.16 0.53
8The housing footprint figure is the sum of construction and
maintenance of both buildings and infrastructure and the transporta-
tion needs during construction taken from Walker (1995).
M. Senbel et al. / Global Environmental Change 13 (2003) 83–100 95

3.6 ha per capita. The detailed breakdown for differentecosystem areas is shown in Table 3. In determining theactual ecological footprints for goods and services for allchoices we used a combination of data from Wack-ernagel and Rees’ (1995) study and Wackernagel et al.’s(1997) study. In the 1995 study only the footprint ofCanada was computed and even so, that footprint wasrevised from a value of 4.27–6.99 ha.9 The 1997 studyonly distinguishes between energy consumption andbiotic consumption. To extrapolate goods and servicesfigures we compared consumption footprints across thedifferent ecosystem areas.The only land types that were adjusted to significantly
higher figures in the 1997 study are arable land, pastureland and forest land. Arable land and pasture land aredevoted entirely to food and consumer goods. If wesubtract the food footprint from 1997 figures, we get anarable and pasture land footprint for goods and servicesof 0.07 ha. Seventy percent of the forest land footprint inthe 1995 study was consumed for housing and theremainder for goods and services. If we assume an equalpercentage for the 1997 study and add it to the otherland areas we get a total goods and services footprint of2 ha.
A.2.3. Simplicity
For the simplicity scenario we chose reduced con-sumption figures across all ecosystem areas. Walkerestimated 0.75 ha per capita for a city comprised solelyof walk-up apartment buildings. For this scenario choicewe can assume deliberate architectural design strategiesthat further reduce the consumption demands ofbuildings. A study modeling an improved house designdemonstrated a 36% reduction from conventionalhousing footprints while maintaining minimum lifestylechanges and minimum economic construction costs(Shawkat, 1995, p. 100). We therefore assumed a meanhousing footprint of 0.5 ha in the Simplicity scenario.In the simplicity scenario we envision cities to be
composed of a series of complete communities. Goods,services and jobs would all be within walking or cyclingdistance. Save for travelling, residents’ only need formotorized transport would be for the shipping andreceiving of trade goods. The transportation both food,and goods and services, is included in their respectivefootprint calculations. However, to account for somedegree of remote travel and some use of public transitand carpooling we assumed a mean transportationfootprint of 0.5 ha. In constructing this scenario we used
the specific example of lifestyles currently being lived inNorth America to inform what might be possible.However, ecologically productive urban land be-
comes,10 it is unlikely that urban communities will everbe completely self-sufficient (Rees, 1997). The closestapproximation of a self-sufficient community wouldoccur if most of the local consumption was of goodsproduced locally. This would almost eliminate the needfor transportation and the high expenditures of energyassociated with it. Given the nature of development ofNorth America and the location of many Canadian andAmerican cities on land that cannot produce food tomeet the needs of its residents this scenario is not likely.To gain some insight into what might actually be
possible in terms of a reduced food footprint, we onceagain looked at figures from a variety of countriesaround the world (Table 4). While India manages on0.53 ha per person we considered this to be too drastic alifestyle shift for too many North Americans and chosea mean of 1.5 ha. This is still higher than the worldaverage of 1.4 ha but still captures the significantreduction from the status-quo projected by the simpli-city option. For the goods and services footprint weassumed a 50% reduction from current consumptionlevels and used mean of 0.5 ha per person.
A.3. Consumption efficiency
It is uncertain whether technological innovation willbring about an increase in overall efficiency of resourceconsumption and a subsequent decline in demand forecological resources. In 1980 Alvin Toffler made a boldprediction that citizens of information age societies willlive in electronic cottages (Toffler, 1980). Tofflerdescribes a revolution equal in historical magnitude tothe industrial revolution. We would not need newsources of energy. Not only would we require fewermaterial resources, but all our material needs wouldrequire a lot less energy.
ARTICLE IN PRESS
Table 4
Summary of total consumption ecological footprints for each scenario
for each category of consumption
All figures in
ha per capita
Housing Transportation Food Goods and
Services
Luxury 2.5 2.2 6.0 3.0
Moderation 0.9 1 3.6 2
Simplicity 0.5 0.5 1.5 0.5
9The 1995 study used data from 1991 while the 1997 study used data
from 1993 therefore the difference between the two figures is most due
to better data, a revised CO2 footprint based on a lower forest
productivity and the addition of marine footprints. We therefore opted
to use the 1997 study where discrepancies arise.
10The Integral Urban House, written by the Farallones Institute
(1979) provides a thorough exposition of the potential for ecological
productivity in urban housing. It is proposed that through rainwater
harvesting, graywater filtering marshes, composting toilets, fish ponds
and vegetable gardens urban dwellers could be completely self-
sufficient in terms of food and water. However, this has yet to be
demonstrated.
M. Senbel et al. / Global Environmental Change 13 (2003) 83–10096
A World Resources Institute study relating materialthroughput to GDP shows that a modest decoupling ofeconomic activity from natural resource use occurred inthe 1980s. A study of four modern industrial economiesover the last 20 years examines whether or noteconomies become less material intensive as they moveaway from producing goods toward producing services(WRI, 1997, p. 13). The study relates Total MaterialRequirement (a physical account relating economicactivity to natural resources) to GDP, and shows thatafter a period of seeming decline, ‘‘natural resourcecommodities may now be growing in parallel witheconomic growth’’ (WRI, 1997, p. 2). In the US, forexample, per capita GDP increased by 36% from 1975to 1993 while the total material requirements per unit ofGDP dropped by only 33%.11 The question of whetheror not technology leads to a per capita decline inecological demands is an important one that willundoubtedly affect future ecological footprints. Theoptions in this choice variable allow for a range ofpossible answers to this question.
A.3.1. Dematerialization, moderate efficiency and energy
intensification
Distinctions between the three choices are only madein the energy land footprint because the only efficiencygains attributed to technology on the consumption sideof the model are in the use of energy. In the absence ofany decisive evidence regarding a shift away fromnatural resource consumption as we shift toward serviceand information economies, we assumed only a 25%distinction between the different choices in this scenariogroup. For the dematerialization scenario we assumed a25% reduction in the energy land footprint and nochange in any other land area. The moderate efficiencyscenarios projects no change in consumption in anyecological area. Energy intensification projects a 25%increase in energy consumption and no change in otherland or marine areas.
A.4. Ecological production
The major assumptions on the supply side of themodel are a range of confidence levels in the ability ofscience and technology to render scarcity irrelevant. Willwe continue to deplete the natural resources of theplanet through pollution and over exploitation to thepoint were yields and harvests will be substantiallydiminished? Or will technology enable us to overcomethe environmental problems that we have created? Thetwo positions can also be described as unfetteredoptimism and unyielding pessimism in our collectivefuture.
The reality will clearly not be an either–or situation.Learning more about what the extremes entail can helpus determine the significance of either assumption in theoverall ecological budget. This scenario group providesprojections of these extremes. Through iterative runs ofthe model we added a scenario in which we as a societychoose conservation and reduced exploitation of naturalsystems to avoid devastating them and to give them achance to regenerate and bounce back.
A.4.1. Intensified production
In the intensified production scenario, it is assumedthat technology generally, and biotechnology specifi-cally, will be used to their fullest extent to maximize theyields and harvests of ecological systems. This scenariotherefore has a higher mean yield for all ecosystem typesthan other production choices. However, uncertaintiessurrounding the long-term effects of the genetic manip-ulation of species increase the risk of a possible overallreduction in yields. This may especially be the case ifengineered genes are not subjected to prolonged isolatedstudies before they are introduced to open ecosystems(Odum, 1989, p. 210). To account for this risk, theprobability distribution for this scenario has beennegatively skewed, with the mean occurring four fifthsof the way between the two bounds.Energy productivity under this choice ignores the
effects of emissions on climate change. Wackernagel andRees (1995) used land areas required for sequesteringCO2 as the footprint calculation for fossil energydemands. In both the Intensive Production and Busi-ness-As-Usual choices, we projected energy productivitythat does not consider sequestration. While this iscounter to the concept of the ecological footprint, itcaptures the manner in which North America continuesto experience an ecological deficit by ignoring thepossible ecological consequences of polluting the atmo-sphere. These choices depict this worldview.No limits are imposed on the use of fossil fuels
because it is assumed that any excess carbon dioxide willsimply trigger feedback reactions such as the oceansabsorbing more CO2. There are sufficient numbers ofscientists who argue against the certainty of globalclimate change that give this optimist scenario cred-ibility (Beckerman, 1995, p. 82). Another possibility forthe provision of clean and affordable energy under thisscenario is through engineered crop and bacteria species.Scientists have reportedly already developed strains ofE. coli bacteria that can consume organic waste toproduce ethanol (Rifkin, 1998, p. 16).12
The difference between the starting points of differ-ence productivity scenarios represents the difference
ARTICLE IN PRESS
11 In 1975 $ calculated from World Bank figures, World Bank
(1995).
12CO2 emissions from burning ethanol are considered to be
inconsequential for this scenario for the worldview reasons outlined
above.
M. Senbel et al. / Global Environmental Change 13 (2003) 83–100 97

between ignoring the ability of the Earth to absorb CO2,and assuming that that absorption capacity is thethreshold to which we can safely emit CO2. Funda-mental to the Intensive Production scenario is the notionthat there are no limits to growth. The reality of micro-economics will, of course, limit the pace and extent oftechnological innovation to increase production. Thereis no incentive for production by ecological systems toexceed demand by consumers. There is, therefore, amarket limitation imposed on increases in production.However, since our model only tracks local marketdemands and since North America will likely continueto export considerable portions of its local production,we used Worldwatch Institute projections to assume amaximum mean productivity of 200% of current levels(Brown et al., 1999, p. 127). The rate of increase variesdepending on the ecosystem type. For example, agri-cultural yields are not expected to increase dramaticallyin the US as a result of biotechnology because they arealready close to their physiological capacities (Brownet al., 1999, p. 127). Pasture land productivity on theother hand, may increase more rapidly through thegenetic manipulation of animals.13
A.4.2. Business as usual
This scenario projects a continuation of current levelsof resource expropriation. Even if we ignore scenarios ofextreme optimism or pessimism, the middle groundprojection of current trends is filled with uncertainty.We took current productivity averages as reported byWackernagel et al. (1997) and subjected them tofluctuations over time. Our long-term production curveborrows from the economic ‘‘long wave’’, or Kondra-tieff cycle (Fig. 7) (Bossel, 1998, p. 66). This is anecological cycle as well as an economic one. Observedsystems go through periods of innovation, renewal andgrowth, conservation and deterioration leading back toinnovation again. While the duration of the cycle variesfrom system to system, oscillations in the number ofindustrial innovations, interest rate, inflation rate, priceindex and unemployment rate over the past 200 yearsreveal a 50 year cycle (Bossel, 1998, p. 65).The ‘‘temporal dynamics’’ or ‘‘turnover time’’ of an
ecological system refers to the development and replen-ishment of its components over time, and can berepresented by a wave similar to the Kondratieff cycle(Braat and van Lierop, 1987, p. 56). In ecologicalsystems this time period is the duration of the recoveryperiod for ecosystems to regain their pre-depletionproductivity levels. This cycle varies with differentspecies and different ecosystems: days for phytoplank-ton in a pond and decades for trees in a forest (Odum,1989, p. 44). For the purposes of this scenario, taking
into account both economic and ecological fluctuations,we assumed an average cycle of 40 years.14
The present day productivity of ecosystems can bedetermined with relative accuracy as the sum total ofcurrent yields. This is especially the case for arable andpasture land where productivity has been maximized byfarmers for economic efficiency. Forest land and marinearea productivity are more difficult to quantify becauseless is known about the thresholds, beyond whichrespective systems would be unable to replenishthemselves. The temporal lag between the exhaustionand rejuvenation of stocks is affected by many complexand uncertain variables (Pahl-Wostl, 1995, p. 186).Clear cut forests can be, and often are, replanted, but
the wood production of these planted forests issubstantially lower than that of original forests.Coupled with an increased rate of logging, thistranslates into uncertainty regarding the ability offorests to sustain stable yields that meet global demands.In marine ecosystems a high degree of uncertainty existssurrounding the size, location and reproductive capacityof fish stocks at any given time or place.Energy land productivity is even more difficult to
predict because of the considerable uncertainty regard-ing existing reserves of fossil fuels. This is furthercompounded by limits imposed on the use of fossil fuelsby global climate change. Even if a 100 years worth offossil fuel reserves are available we may have toabandon them in favor of cleaner sources. In themeantime, accessible and affordable alternative energysources may well proliferate, substantially increasingenergy land productivity.The Business-As-Usual scenario projects an initial
reduction in energy land productivity as we switch awayfrom fossil fuels to cleaner sources of energy. In the long
ARTICLE IN PRESS
Fig. 7. Long wave used in economics and ecology from Bossel (1998).
13Appendix A shows all the productivity curves assumed in EFIAM.
14The position of each ecosystem output relative to the long wave
was estimated through Worldwatch Institute and World Resource
Institute reports linking past yields to future projections. The cycle is
dependent on the ecosystem type.
M. Senbel et al. / Global Environmental Change 13 (2003) 83–10098

run, we assume an incremental increase in energy landproductivity as we begin to adopt the large-scale use ofsolar and wind energy (Wann, 1996, p. 78). This landwould otherwise be an ecological desert and its usewould therefore not diminish the productivity of otherecosystem areas. World Bank figures, for example, showthe cost of generating electricity from photovoltaicsfalling to that of natural gas or coal by the year 2020(Beckerman, 1995, p. 58). It is assumed that as thetechnologies are developed, so too will our ability to usestored energy for purposes that are currently solelydependent on fossil fuels.
A.4.3. Depletion
This scenario limits fossil energy production throughthe sequestering capabilities of the local region thisincludes both forested land and ocean surface. If weassume a forest absorption capacity of 100GJ/ha/yr(Wackernagel and Rees, 1996, p. 80), and we consideronly those forests protected from logging to be availablefor energy land and not for forest land, we get a forestsequestering capacity of 104 million ha.15
The Worldwatch Institute estimates that oceansabsorb as roughly the same amount of CO2 as landbased resources (McGinn, 1997, p. 82). If we allowNorth America a share of the oceans that can absorb asmuch CO2 as its land, and if we err on the side ofoptimism, we can assume a total absorption capacity ofroughly 220 million ha. The 1993 fossil energy demandsfor North America was 889 million ha (Wackernagelet al., 1997). Thus, for the energy production capacityunder the Depletion scenario we assumed 25% ofconsumption demands. Since the majority of energydemands are satisfied through the use of fossil fuels weprojected a gradual increase in production capacity asconsumption shifts to alternative forms of energy.In terms of arable and pasture lands, some scientists
report that the systematic addition of fertilizers to soilshas a detrimental effect on soil ecology that ultimatelyreduces its ability to support forests, grasslands andcrops (Baskin, 1997, p. 128). Thus, human interventionfurther exacerbates the problem of nutrient depletion insoils. The depletion scenario captures this possibility.
A.4.4. Conservation
This scenario projects a reduction from current levelsof ecological production to avoid the depletion anddevastation of natural ecosystems. We assumed areduction of yields in all categories of ecologicalproductivity to 60% of current levels by the year 2010
and 75% by 2020. This level gradually increases throughthe rest of the 21st century.
References
Baskin, Y., 1997. The Work of Nature. Island Press, Washington, DC.
Beckerman, W., 1995. Small is Stupid: blowing the whistle on the
greens. Gerald Duckworth and Company, Ltd., London.
Bossel, H., 1998. Earth at a Crossroads: Paths to a Sustainable Future.
Cambridge University Press, Cambridge.
Braat, L.C., van Lierop, W.F.J., 1987. Economic-Ecological Model-
ing. Holland, Amsterdam.
Brown, L., Flavin, C., French, H., 1999. State of the World 1999.
W.W. Norton and Company, New York.
Bruce, J.P., Lee, H., Haites, E., 1996. Climate Change 1995,
Contribution of Working Group III to the Second Assessment
Report of the Intergovernmental Panel on Climate Change.
Cambridge University Press, Cambridge.
Chambers, N., Simmons, C., Wackernagel, M., 2000. Ecological
Footprints as an Indicator of Sustainability. Earthscan Publica-
tions Ltd., London.
Costanza, R., 2000. The dynamics of the ecological footprint concept.
Ecological Economics 32, 341–345.
Farallones Institute, 1979. The Integral Urban House. Sierra Club
Books, San Francisco.
Fischhoff, B., Watson, S., Hope, C., 1984. Defining risk. Policy
Sciences 17, 123–139.
Gallopin, G.C., Raskin, P., 1998. Windows on the future: Global
scenarios and sustainability. Environment 40 (3), 7–31.
Keeney, R.L., 1992. Value-Focused Thinking. Harvard University
Press, Boston.
Kelman, S., 1981. Cost-benefit analysis: an ethical critique. Regulation
5, 1.
Lave, L.B., Dowlatabadi, H., 1993. Climate change policy: the effects
of personal beliefs and scientific uncertainty. Environmental
Science and Technology 27 (10), 1962–1972.
Lumina Decision Systems, 1998. Analytica User Guide. Lumina
Decision Systems, Inc., Los Gatos, CA.
McDaniels, T.L., 1995. A multiattribute index for evaluating environ-
mental impacts of electric utilities. Journal of Environmental
Management 46, 57–66.
McDaniels, T., 2000. Creating and using objectives for ecological risk
assessment and management. Environmental Science and Policy 3,
299–304.
McGinn, A.P., 1997. Safeguarding the health of oceans. World-
watch Paper 145, March 1999. Worldwatch Institute, Washington
D.C.
Morgan, M.G., Kandlikar, M., Risbey, J., Dowlatabadi, H., 1999.
Why conventional tools for policy analysis are often inadequate for
problems of global change. Climatic Change 41, 271–281.
Nordhaus, W., 1994. Managing the global commons. The MIT Press,
Cambridge, MA.
Odum, E., 1989. Ecology; and our Endangered Life Support Systems.
Sinauer Associates, Inc., Sunderland, MA.
Pahl-Wostl, C., 1995. The Dynamic Nature of Ecosystems: chaos and
order intertwined. Wiley, England, Chichester.
Pearce, D.W., Cline, W.R., Achanta, A.N., Fankhauser, S., Pachauri,
R.K., Tol, R.S., Vellinga, P., 1996. The social costs of climate
change: greenhouse damage and the benefits of control. In: Bruce,
J.P., Lee, H., Haites, E.F. (Eds.), Climate Change 1995: Economic
and Social Dimensions of Climate Change. Cambridge University
Press, Cambridge, UK.
Redefining Progress, 2001. What we use and what we have: ecological
footprint and ecological capacity. Redefining Progress. http://
www.rprogress,org/progsum/nip/ef/ef projsum.html, January 2001.
ARTICLE IN PRESS
15Protected park land forest areas for the US and Canada were
used, taken from USDA Forest Service, and National Resources
Canada, www.fs.fed.us/database/lar/lartab1.htm and www.NRCan.fc.
ca/cfs/proj/iepb/nfdp/cp95/tablle.htm, respectively.
M. Senbel et al. / Global Environmental Change 13 (2003) 83–100 99

Rees, W., 1997. Is ‘Sustainable City’ an oxymoron? Local Environ-
ment, 2 (3), 303–310.
Rees, W.E., 1992. Ecological footprints and appropriated carrying
capacity: what urban economics leaves out. Environment and
Urbanisation, 4(2).
Rees, W.E., 1996. Revisiting carrying capacity: area based indicators
of sustainability. Population and Environment, 17(3).
Rees, W.E., 2000. Eco-footprint analysis: merits and brickbats.
Ecological Economics 32 (3), 371–374.
Rees, W.E., 2001. Ecological Footprint, Concept of. In: Levin, S.
(Ed.), Encyclopedia of Biodiversity, Vol. 2. Academic Press, San
Diego, pp. 229–244.
Rees, W.E., Wackernagel, M., 1994. Ecological footprints and
appropriated carrying capacity: measuring the natural capital
requirements of the human economy. In: Jansson, A.-M., Hammer,
M., Folke, C., Costanza, R. (Eds.), Investing in Natural Capital:
the Ecological Economics Approach to Sustainability. Island Press,
Washington (Chapter 20).
Rifkin, J., 1998. The Biotech Century: harnessing the gene and
remaking the world. Jeremy P. Tarcher/Putnam, New York.
Rotmans, J., Dowlatabadi, H., 1998. Integrated assessment modeling.
In: Rayner, S., Malone, E.L. (Eds.), Human Choice and Climate
Change, Vol. 3: the Tools for Policy Analysis. Battelle Press,
Columbus, OH, pp. 291–377.
Shawkat, H., 1995. A Sustainable housing: reducing the ecological
footprint of new wood frame single-family detached houses.
University of British Columbia, School of Architecture. Unpub-
lished Masters Thesis, University of British Columbia, Vancouver.
Toffler, A., 1980. The Third Wave. William Morrow and Company,
New York.
van den Bergh, J.C.J.M., Verbruggen, H., 1999. Spatial sustainability,
trade and indicators: an evaluation of the ecological footprint.
Ecological Economics 29, 61–72.
van Kooten, G.C., Bulte, E.H., 2000. The ecological footprint—useful
science or politics? Ecological Economics 32 (3), 385–389.
Vitousek, P.M., Ehrlich, P.R., Erhlich, A.H., Matson, P.A., 1986.
Human appropriation of the products of photosynthesis. Bio-
science 36 (6), 368–373.
Wackernagel, M., Monfreda, C., Peumling, P., 2002. Ecological
footprint of nations: November 2002 update. Redefining progress,
Oakland, California.
Wackernagel, M., Rees, W., 1996. Our Ecological Footprint. New
Society Publishers, Gabriola Island, BC.
Wackernagel, M., Onisto, L., Callejas, A., LopezFalfan, I.S., Mendez
Garcia, J., Suarez Gurrero, A.I., Guerrero, M.G., 1997. Ecological
Footprints of Nations. Centro de Estudios para la Sustentabilidad,
March 10, 1997, Xalapa, Mexico.
Wackernagel, M., Onisto, L., Bello, P., Linares, A.C., Falf!an, I.S.L.,
Garcia, J.M., Guerrero, A.I.S., Guerrero, M.G.S., 1999. National
natural capital accounting with the ecological footprint concept.
Ecological Economics 29, 375–390.
Walker, L.A., 1995. The influence of dwelling type and residential
density on the appropriated carrying capacity of Canadian house-
holds. School of Community and Regional Planning unpublished
Masters Thesis, University of British Columbia, Vancouver.
Wann, D., 1996. Deep Design: pathways to a sustainable future. Island
Press, Washington, DC.
World Resources Institute, 1997. Resource Flows: the Material Flows
of Industrial Economies. World Resources Institute, Washington,
DC.
ARTICLE IN PRESSM. Senbel et al. / Global Environmental Change 13 (2003) 83–100100