
Frequently Asked Question on the Zimbabwe functional currency
Upload
khangminh22Category
view
2download
0
Frequently Asked Questions (FAQs) on Monsoon
Q. What is southwest monsoon? What causes the monsoon? Which are the prominent
monsoon regions, other than India? A. The seasonal reversal of winds and the associated rainfall. This word is derived from the
Arabic word “Mausim”. The annual oscillation in the apparent position of the Sun betweenthe Tropics of Cancer and Capricorn causes the annual oscillation in the position of thethermal equator (region of maximum heating) on the Earth’s surface. This is associatedwith the annual oscillation of temperature, pressure, wind, cloudiness, rain etc. This is thecause of the monsoons. On the Earth’s surface, there are asymmetries of land andOcean. The differential heating of land and Ocean cause variations in the intensity of theannual oscillation of the thermal equator and hence regional variations in the intensity ofmonsoon. The southwesterly wind flow occurring over most parts of India and IndianSeas gives rise to southwest monsoon over India from June to September
Q. What is Forecasting?A. In science, the forecasting means the process of estimation of the value of some variable
at some future time. One of the primary functions of the national Weather services isforecast of weather parameters such as rainfall, temperature, wind, humidity etc. over aregion averaged over a particular time period. For example forecast of daily rainfall(rainfall averaged over a day).
Q. What is Nowcasting? A. A weather forecast in which the details about the current weather and forecasts up to a
few hours ahead (but less than 24 hours) are given. Q. What is short range weather forecasting? A. Short range weather forecasts are weather forecasts valid up to 72 hours ahead. This
forecast range is mainly concerned with the weather systems observed in the latestweather charts and also by considering the generation of new systems within the timeperiod.
Q. What are medium range forecasts? A. These are weather forecasts generally valid for a period of 4 to 10 days (However, up to 7
days in tropics). In this, the average weather conditions and the weather on each day willbe prescribed with progressively lesser details and accuracy than that of the short rangeforecasts.
Q. What is long range forecast? A. As per the World Meteorological Organization (WMO) definition, long range forecast is
defined as the forecast from 30 days’ up to one season’s description of averagedweather parameters. The seasonal forecast comes under long range forecast.
Q. What is extended range forecast? A. This is the forecast range lies between long range (seasonal) and medium range. Thus, it
starts generally from days 10 (however, beyond days 7 in tropics) up to one month.Q. What are the seasons defined by the India Meteorological Department for the
country as a whole? A. Meteorological seasons over India are:
Winter Season: January – February

Pre Monsoon Season: March – MaySouthwest Monsoon Season: June SeptemberPost Monsoon Season: October December
Q. What is maximum temperature? A. It is the highest temperature attained during a day. It often occurs during the afternoon
hours. Q. What is minimum temperature? A. It is the lowest temperature recorded which usually occurs during the early morning
hours. Q. What is atmospheric pressure?A. The pressure of the atmosphere at any point is the weight of the air column which stands
vertically above unit area with the point as its centre. For meteorological purposes,atmospheric pressure is usually measured by means of a mercury barometer where theheight of the mercury column represents the atmospheric pressure. The pressure isexpressed in hPa (Hecta Pascal) which is defined as equal to 106 Newton/m2.
Q. How do we express the quantity of rainfall? A. Liquid rainfall is expressed as the depth to which it would cover a horizontal projection of
the earth’s surface, if there is no loss by evaporation, run–off or infiltration. It isexpressed in terms of mm or cm. It is assumed that the amount of precipitation collectedin the gauge is representative of a certain area around the point where the measurementis made. The choice of the instrument and the site itself, the form and exposure of themeasuring gauge, the prevention of loss of precipitation by evaporation and the effects ofwind and splashing are some of the important points to be considered in the correctmeasurement of precipitation.
Q. What is a thunderstorm? A. A Thunderstorm is defined as a meteorological phenomenon in which one or more
sudden electrical discharges manifested by a flash of light (Lightning) and a sharprumbling sound (thunder) occurs from a cloud of vertical development.
Q. What is a Dust storm? A. A Dust storm is an ensemble of particles of dust or sand energetically lifted to great
heights by a strong and turbulent wind. Often the surface visibility is reduced to low limits;the qualification for a synoptic report is visibility below 1000 m.
Q. What are clouds and how they are classified? A. Clouds are aggregate of very small water droplets, ice crystals, or a mixture of both, with
its base above the earth’s surface. A classification is made in level – high, medium, orlow – at which the various cloud genera are usually encountered. In temperate regionsthe approximate limits are high, 513 km (16500 – 45000 ft); medium, 27 km (6500 –23000 ft); low, 02 km (0 – 6500 ft). The high clouds are Cirrus (Ci), Cirrocumulus (Cc),Cirrostratus (Cs). The medium clouds are Altocumulus (Ac), Altostratus (As) (the latteroften extending higher) and Nimbostratus (Ns) (usually extending both higher and lower);
The low clouds are Stratocumulus (Sc), Stratus (St), Cumulus (Cu), and Cumulonimbus(Cb).

Q. What are land and sea breezes? A. Land and Sea Breezes are local winds caused by the unequal diurnal heating and cooling
of adjacent land and water surfaces; under the influence of solar radiation by day andradiation to the sky at night, a gradient of pressure near the coast is produced. Duringthe day, the land is warmer than the sea and a breeze, the Sea Breeze, blows onshore;at night and in the early morning the land is cooler than the sea and the land breezeblows off shore.
Q. What are the different methods used for long range forecasting? A. In general, three approaches are used. These are (i) statistical method (ii) numerical
weather prediction or dynamical method and (iii) dynamical cum statistical method.
Q. Who is responsible for issuing operational long range forecast in India? Whatmethod is used for the purpose?
A. India Meteorological Department is solely responsible for issuing operational long range
forecast for India. The forecasts are prepared at the National Climate Centre of IMDlocated at Pune. At present, empirical (statistical) methods are used for the preparation ofoperational long range forecasts.
Q. Which are the countries that use empirical models for long range forecasts? A. In addition to India, there are several other countries like United States, United Kingdom,
Australia, South Africa, Brazil etc., which use empirical methods extensively for longrange forecasting. For example, for the long range forecasting of ENSO, manyinternational climate centres use empirical models.
Q. What are the long range forecasts prepared by IMD and when are they issued. A. IMD issues operational long range forecast for the rainfall during SW Monsoon Season
(June September). These forecasts are issued in two stages. The first stage forecast isissued in midApril and consists of quantitative forecast for the season (June toSeptember) rainfall over India as a whole. The second stage forecasts issued by the endof June consist of update for the forecast issued in April, a forecast for July rainfall overthe country as whole and forecasts for seasonal rainfall over broad rainfall homogeneousregions of India.
IMD also prepares forecasts for winter (Jan March) precipitation (issued in the end ofDecember) over Northwest India and northeast monsoon (OctoberDecember) rainfallover Southern Peninsula (issued in October). However, these forecasts are issued onlyto the government.
Looking at the potential of numerical models, IMD has also established an experimentalprediction system based on General Circulation Model (GCM) in addition to its existingoperational forecasting system based on statistical models. For this purpose, IMD usesthe seasonal forecasting model (SFM) developed at the Experimental Climate PredictionCentre (ECPC), Scripps Institute of Oceanography, USA. The skill of the numericalmodel based forecasting system is to be validated for some more years before the samecan be used for operational purpose.
Q. What is the accuracy of the long range forecast for monsoon rainfall issued byIMD?
A. The monsoon prediction in our country is being done with reasonable accuracy. The
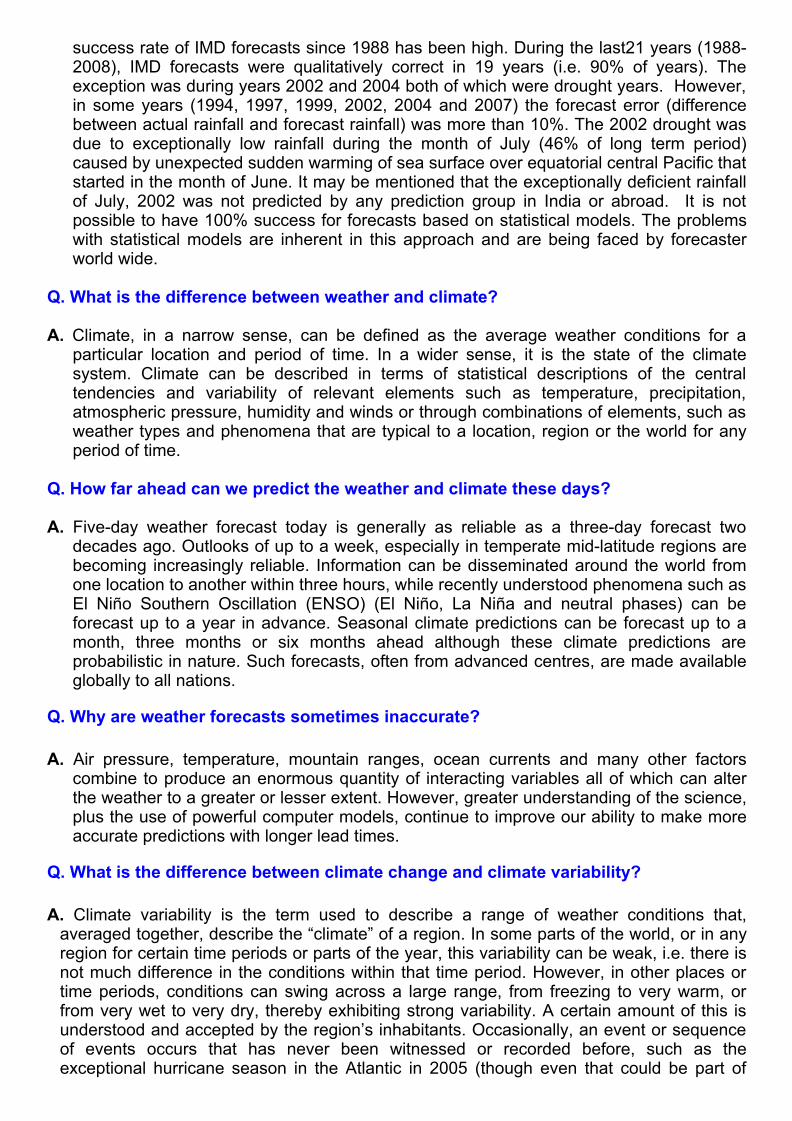
success rate of IMD forecasts since 1988 has been high. During the last21 years (19882008), IMD forecasts were qualitatively correct in 19 years (i.e. 90% of years). Theexception was during years 2002 and 2004 both of which were drought years. However,in some years (1994, 1997, 1999, 2002, 2004 and 2007) the forecast error (differencebetween actual rainfall and forecast rainfall) was more than 10%. The 2002 drought wasdue to exceptionally low rainfall during the month of July (46% of long term period)caused by unexpected sudden warming of sea surface over equatorial central Pacific thatstarted in the month of June. It may be mentioned that the exceptionally deficient rainfallof July, 2002 was not predicted by any prediction group in India or abroad. It is notpossible to have 100% success for forecasts based on statistical models. The problemswith statistical models are inherent in this approach and are being faced by forecasterworld wide.
Q. What is the difference between weather and climate? A. Climate, in a narrow sense, can be defined as the average weather conditions for a
particular location and period of time. In a wider sense, it is the state of the climatesystem. Climate can be described in terms of statistical descriptions of the centraltendencies and variability of relevant elements such as temperature, precipitation,atmospheric pressure, humidity and winds or through combinations of elements, such asweather types and phenomena that are typical to a location, region or the world for anyperiod of time.
Q. How far ahead can we predict the weather and climate these days? A. Fiveday weather forecast today is generally as reliable as a threeday forecast two
decades ago. Outlooks of up to a week, especially in temperate midlatitude regions arebecoming increasingly reliable. Information can be disseminated around the world fromone location to another within three hours, while recently understood phenomena such asEl Niño Southern Oscillation (ENSO) (El Niño, La Niña and neutral phases) can beforecast up to a year in advance. Seasonal climate predictions can be forecast up to amonth, three months or six months ahead although these climate predictions areprobabilistic in nature. Such forecasts, often from advanced centres, are made availableglobally to all nations.
Q. Why are weather forecasts sometimes inaccurate? A. Air pressure, temperature, mountain ranges, ocean currents and many other factors
combine to produce an enormous quantity of interacting variables all of which can alterthe weather to a greater or lesser extent. However, greater understanding of the science,plus the use of powerful computer models, continue to improve our ability to make moreaccurate predictions with longer lead times.
Q. What is the difference between climate change and climate variability? A. Climate variability is the term used to describe a range of weather conditions that,averaged together, describe the “climate” of a region. In some parts of the world, or in anyregion for certain time periods or parts of the year, this variability can be weak, i.e. there isnot much difference in the conditions within that time period. However, in other places ortime periods, conditions can swing across a large range, from freezing to very warm, orfrom very wet to very dry, thereby exhibiting strong variability. A certain amount of this isunderstood and accepted by the region’s inhabitants. Occasionally, an event or sequenceof events occurs that has never been witnessed or recorded before, such as theexceptional hurricane season in the Atlantic in 2005 (though even that could be part of

natural climate variability). If such a season does not recur within say, the next 30 years,we would look back and call it an exceptional year, but not a harbinger of change. For thescientific community to recognize a change in climate, a shift has to occur, and persist forquite a long time. The Intergovernmental Panel on Climate Change (IPCC) is conductingconsiderable efforts in trying to determine, for various hydrometeorological hazards (e.g.tropical cyclones and tornadoes) and for related events (e.g. flash floods), whether theiroccurrence is affected by humaninduced climate change. The IPCC Fourth AssessmentReport provides evidence that climate change affects the frequency and (or) intensity ofsome of those events, but further work is under way to refine those findings and prepare amore comprehensive assessment as part of a Special Report to be published in 2011.
Q. What are El Niño and La Niña? A. El Niño, Spanish for "boy child" (because of the tendency of the phenomenon to arrivearound Christmas), is an abnormal warming of water in the Equatorial Pacific Ocean everythree to five years and can last up to 18 months. Severe cases of El Niño, as in 1997/98,are responsible for drought, flooding, as well as areas of formation for tropical cyclonesand severe winter storms. The 1997/98 El Niño and its associated impacts have beenblamed for the deaths of hundreds of people and caused billions of dollars of damage in anestimated 15 countries especially in the Panama Canal region but also as far away as theeast coast of Africa. La Niña means “the little girl”, the opposite of El Niño, and refers to theabnormal cooling of the ocean temperatures in the same Pacific region.
Q. What are the different Nino regions for measuring El Nino ?
A. For the measurement of strength of El Nino or La Nina the Sea Surface Temperatureanomalies are measured over eastern and central Pacific Ocean at 4 different regions asdepicted below graphically. These four Nino regions are bounded by
NINO12 : 010S, 80W90W NINO3 : 5N5S, 90W150W NINO4 : 5N5S, 150W160E NINO34 : 5N5S, 120W170W
(Source : Climate Prediction Centre, NOAA)
Q. What is Southern Oscillation Index (SOI) and ENSO

A. The Southern Oscillation is the atmospheric component of El Niño. It is an oscillation inair pressure between the tropical eastern and the western Pacific Ocean waters. Thestrength of the Southern Oscillation is measured by the Southern Oscillation Index (SOI).The SOI is computed from fluctuations in the surface air pressure difference between Tahiti(Over Pacific Ocean) and Darwin, (Indian Ocean near Australia). El Niño episodes areassociated with negative values of the SOI, meaning that the pressure at Tahiti is relativelylow compared to Darwin.
Low atmospheric pressure tends to occur over warm water and high pressure occurs overcold water, in part because deep convection over the warm water acts to transport air. ElNiño episodes are defined as sustained warming of the central and eastern tropical PacificOcean. This results in a decrease in the strength of the Pacific trade winds, and a reductionin rainfall over eastern and northern Australia.
ENSO is composed of both El Nino and Southern Oscillation. Thus, the oceaniccomponent called El Niño (or La Niña, depending on its phase) and the atmosphericcomponent, the Southern Oscillation.
Q. What is Walker CirculationThe Walker circulation is named after Sir Gilbert Walker, former DirectorGeneral ofMeteorology in India during the British rule who, in early 20th century, identified a number ofrelationships between seasonal climate variations in Asia and the Pacific region. He hadshown from his many published papers during 1920s and early 1930s that the weather inDjakarta (Indonesia) and Santiago (Chile) was related in such a way that when the pressurewas higher than normal at one place it was lower than normal at the other. As these citiesare about 15 000 km apart it was difficult at that time to visualize a mechanism for theconnection between these distant locations. Later it is understood that what Walker haddiscovered was part of a teleconnection now known as the Southern Oscillation. TheSouthern Oscillation Index (SOI) gives a simple measure of the strength and phase of theSouthern Oscillation, and indicates the state of the Walker circulation.
The easterly trade winds are part of the lowlevel component of the Walker circulation.Typically, during normal condition the trades bring warm moist air towards the Indonesianregion. Here, moving over normally very warm seas, moist air rises to high levels of theatmosphere. The air then travels eastward before sinking over the eastern Pacific Ocean.The rising air is associated with a region of low air pressure, towering cumulonimbus cloudsand rain. High pressure and dry conditions accompany the sinking air.
When the Walker circulation enters its El Niño phase, the SOI is strongly negative and whenit enters its La Nina Phase, the SOI is strongly positive.
Q. How does the ENSO affect monsoon?
A. In a typical ENSO, the strong easterly winds of the equatorial Pacific weaken, whichallows warm eastwardflowing subsurface waters to rise, increasing surface temperatures 12°C and sometimes in the central and Eastern Pacific. Along the West coast of SouthAmerica, El Niño's warm waters persist and deepen, and cold, upwelling, nutrientrich watersfail to reach surface waters; the resulting warm, nutrientpoor waters devastate coastalfisheries. Heavy rain falls along the South American coast, and heavy rainfall also movesfrom the western to central Pacific, causing drier than normal conditions in Indonesia andnearby areas including India.

Q. What isIndianOceanDipole(IOD)
A. The Indian Ocean Dipole (IOD) is a coupled oceanatmosphere phenomenon in theIndian Ocean. It is normally characterized by anomalous cooling of SST in the south easternequatorial Indian Ocean and anomalous warming of SST in the western equatorial IndianOcean. Associated with these changes the normal convection situated over the easternIndian Ocean warm pool shifts to the west and brings heavy rainfall over the east Africa andsevere droughts/forest fires over the Indonesian region.
(Source : JAMSTEC, JAPAN)
Q. What is Madden Julian Oscillation (MJO)? How it influences monsoon activity? A. The Madden Julian Oscillation (MJO) is one of the most important atmosphereoceancoupled phenomena in the tropics, which has profound influence on Indian SummerMonsoon. The MJO is the leading mode of tropical intraseasonal climate variability and ischaracterized by organization on a global spatial scale with a period typically ranging from3060 days, which was discovered by Madden and Julian in 1971 in a published paper. Ithas the following characteristics : MJO is a massive weather event consisting of deep convection coupled with
atmospheric circulation, moving slowly eastward over the Indian and Pacific Oceans. MJO is an equatorial traveling pattern of anomalous rainfall that is planetary in scale. Each cycle lasts approximately 30–60 days. Also known as the 3060 day oscillation,
3060 day wave, or intraseasonal oscillation (ISO). The MJO involves variations in wind, sea surface temperature (SST), cloudiness, and
rainfall. Based on the place of convective activity the period of MJO is divided into 18
phases with each phase roughly last for 7 to 8 days.

Since the MJO is the most important mode of tropical intraseasonal variability withpotentially important influences on monsoon activity in the Asian regions on extended rangetime scale (beyond 7 days to on1 month), the capability of statistical or numerical models incapturing MJO signal is very crucial in capturing the active/break cycle of monsoon. Q. How are low pressure system classified in India? What are the differences between
low, depression and cyclone?A. The lowpressure systems over Indian region are classified based on the maximumsustained winds speed associated with the system and the pressure deficit/ number ofclosed isobars associated with the system. The pressure criteria is used when the systemis over land and wind criteria is used, when the system is over the sea. The system iscalled as low if there is one closed isobar in the interval of 2 hPa. It is called depression, ifthere are two closed isobars, a deep depression, if there are three closed isobars andcyclone if there are four or more closed isobars. The detailed classifications based on windcriteria are given in the Table below. Considering wind criteria, the system with wind speedof 1727 knot is called as depression and the low pressure system with maximumsustained 3 minute surface winds between 2833 knot is called a deep depression. Thesystem with maximum sustained 3 minute surface winds of 34 knot or more is called ascyclone.
System Pressure
deficienthPa
Associated wind speedKnot (Kmph)
Low pressure area 1.0 <17(<32)Depression 1.0 3.0 1727 (32–50)Deep Depression (DD) 3.0 4.5 2833 (51–59)Cyclonic Storm (CS) 4.5 8.5 3447 (6090)Severe Cyclonic Storm (SCS) 8.515.5 4863 (90119)Very Severe Cyclonic Storm(VSCS)
15.565.6 64119 (119220)
Super Cyclonic Storm >65.6 >119 (>220)
Q. What is Satellite Meteorology? A. Satellite Meteorology refers to the study of earth's atmosphere and oceans using dataobtained from remote sensing devices flown onboard satellites orbiting the earth. Satellitemake measurements indirectly by sensing electromagnetic radiations coming from thesurfaces below.
Q. Which satellites are being used to monitor the weather of Indian region ? A. Kalpana1 located at Longitude 74° E and Insat3A located at 93.5° E both geostationarysatellites are being used to monitor the weather of Indian region.
For meteorological observation, INSAT3A carries a three channel Very High ResolutionRadiometer (VHRR) with 2 km resolution in the visible band and 8 km resolution in thermalinfrared and water vapour bands. In addition, INSAT3A carries a Charge Coupled Device(CCD) camera which operates in the visible, near infra Red and short wave infrared bandsproviding a spatial resolution of 1 km. A Data Relay Transponder (DRT) operating in UHFband is incorporated for realtime hydro meteorological data collection from unattendedplatforms located on land and river basins. The data is then relayed in extended Cband to a

central location. Kalpana 1 Satellite has a 3 Channel VHRR and DRT similar to INSAT 3ASatellite. Q. Which products are being derived from operational Indian Geostationary
Meteorological Satellites? A. The following products are being derived from INSAT satellites
Outgoing Longwave radiation (OLR) Sea surface temperature (SST) Quantitative precipitation estimate (QPE) Cloud Motion vectors (CMV) Water Vapour Wind (WVW) Cloud Top Temperature (CTT) Visible Channel Image Infrared Channel Image Colour Composite Channel Image Water vapour Channel Image
Outgoing long wave radiation (OLR) Majority of meteorological sensors operate in long wave range of radiation so that: 1. They operate day and night2. The problem of low albedo is not encountered3. The earth radiation is maximum and thermal IR and ocean emissive is nearly unity. Keeping the above into mind the outgoing flux of long wave radiation at the top ofatmosphere is an important parameter in the earth atmosphere radiation budget. Thisparameter can be derived by physical/statistical algorithm from the narrow band. Sea Surface Temperature (SST): As we know oceans are the major storage of heat in the earth climate systems. Sea SurfaceTemperature (SST) is one of the key controllers of climate variability and acts as a vastthermal reservoir. SST regulates the transfer of long wave radiation to the atmosphere aswell as the latent and sensible heat fluxes into the lower atmosphere. Quantitative Precipitation Estimate (QPE) It is one of the key meteorological parameter. A detailed knowledge of its distribution inspace and time is essential for understanding weather & climate. Information about rainfall isof great value in variety of discipline beside being control to human survival scientifically Thelatent heat released during the process of condensation water into cloud and rain drops isone of the significant energy source responsible for atmospheric heat engine. Q. What are Image Channels?A. The satellites typically scan the earth using different wave lengths (channels). Current
INSAT geostationary meteorological satellites have 3 channel imager with the followingchannels:
i) VISIBLE wavelengths (0.55 0.75 um) (reflected solar radiation).ii) IR (thermal infrared) (10.5 12.5 um). (emission channel. Each point on the earth
emits radiation in proportion to its hotness/coldness. So this channel gives a thermal

image of the earth)iii) WV (watervapour) (5.7 7.1 um). (This is also an emission band. The image shows
differences in water vapour absorption in the atmosphere).
Q. What is the difference between geostationary and polar orbiting satellites?A. A geostationary satellite is positioned above the Equator and orbits the Earth at the samerotation speed as the Earth itself, making it appear stationary from the point of view of anobserver on the Earth’s surface. It flies very high above the surface of the Earth (altitudealmost 36000 kilometers), and thus is able to capture the whole Earth disc at once. A polarorbiting satellite circles the Earth at a nearpolar inclination, meaning that it always passesalmost exactly above the poles. The satellite passes the equator and each latitude at thesame local solar time each day, meaning the satellite passes overhead at essentially thesame solar time throughout all seasons of the year. The low Earth orbit (800 850kilometers) is much closer to Earth than a geostationary orbit, and thus can see a smallerpart of the Earth below than a geostationary satellite, but in finer detail.
Q. What is GPS?A. The Global Positioning System (GPS) is a satellitebased navigation system made up of anetwork of 24 satellites placed into orbit in six orbital planes at an altitude of 20200 Kmabove the earth surface with an orbital period of 12 hrs by the U.S. Department of Defense.GPS works in any weather conditions, anywhere in the world, 24 hours a day. Q. How does GPS receivers determine its 3D position from GPS signal?A. The GPS receiver compares the time a signal was transmitted by a GPS satellite with thetime it was received. The time difference tells the GPS receiver how far away the satelliteis. Now, with distance measurements from a few more satellites, the receiver candetermine the user's position by triangulation. Precise location of interest to geophysistsrequired correction of position errors due to atmospheric delays.
Q. What is a radar?A. Radar is acronym for Radio Detection and Ranging. It uses electromagnetic waves inmicrowave region to detect location (range & direction), height (altitude), intensity (in caseof weather systems) and movement of moving and nonmoving targets.
Q. What is the working principle of radars?A. Radars are used for detection of aircrafts, ships, weather systems and a variety of otherapplications. Our discussion is restricted to weather radars only. Radar transmittertransmits electromagnetic waves through a directional antenna in any given direction in afocused manner. A part of the transmitted energy is absorbed by the atmosphere. Some ofthe energy travels further through the atmosphere and a fraction of it is scattered backwardby the targets and is received by the radar receiver. The amount of received power dependsupon radar parameters like transmitted power, radar wavelength, horizontal and verticalbeam widths, atmospheric characteristics etc., In case of weather echoes like clouds itdepends on physical state (raindrops, snow, hail etc.) and drop size distribution hydrometeors. The amount of return power provides information about the intensity of weathersystems and azimuth and elevation of the antenna gives the location and height of the cloudsystems. The time taken in to and fro journey of the electromagnet waves gives the range(or distance from radar) of the targets. Modern day radars, viz., Doppler Weather Radars,employ Doppler principle to provide information about the speed and direction of the movingtargets.
Copyright © 2022 FDOKUMEN


![rec.autos.vw [W] GENERAL, FREQUENTLY ASKED ...](https://static.fdokumen.com/doc/165x107/63233a18117b4414ec0c3ae3/recautosvw-w-general-frequently-asked-.jpg)