Nitrogen leaching in response to increased nitrogen inputs in subtropical monsoon forests in...
11
Nitrogen leaching in response to increased nitrogen inputs in subtropical monsoon forests in southern China Yunting Fang a,b, *, Per Gundersen b , Jiangming Mo a , Weixing Zhu c a South China Botanical Garden, The Chinese Academy of Sciences, Xingke Road No. 723, Tianhe District, Guangzhou 510650, China b Forest & Landscape Denmark, Faculty of Life Sciences, University of Copenhagen, Hørsholm Kongevej 11, DK-2970 Hørsholm, Denmark c Department of Biological Sciences, State University of New York - Binghamton, Binghamton, NY 13902, USA 1. Introduction Tropical and subtropical forests in southern China play a pivotal role in maintaining local climate conditions and regulating regional soil–atmospheric exchange of carbon (C) and nitrogen (N) (Fang et al., 2001; Zhou et al., 2006). Nitrogen deposition in precipitation greater than 10 kg N ha 1 yr 1 , the threshold above which N leaching often increases in temperate and boreal forests (e.g. MacDonald et al., 2002), has frequently been reported in areas of southern China associated with rapid economic growth (Zhou and Yan, 2001; Chen and Mulder, 2007). This widespread elevated atmospheric N deposition, which may have persisted for more than a decade in some parts of the region (Huang et al., 1994), is expected to change the C and N cycles in forest ecosystems. However, concerns over the impact of increased N deposition are still at the starting stage. Little is known if the currently deposited N would change forest N status, the fate of deposited N, and the rate of N leaching (Fang et al., 2006; Chen and Mulder, 2007). Nitrogen retention varies widely among forest ecosystems, and the understanding of the patterns and mechanisms of N retention are central to our understanding of N cycling in ecosystems. Concerns over adverse effects of N deposition including soil acidification, nutrient imbalance and even forest decline have initiated many studies in temperate forests of North America and Europe in the last decades (Aber et al., 1989, 1998; Gundersen et al., 1998). Measurements along N deposition gradients and from experimental N manipulation studies showed that temperate forests exhibited high efficiency of N retention, which conse- quently could delay the occurrence of potential negative impacts induced by increased N deposition (Aber et al., 1998; Gundersen et al., 1998). In contrast to temperate forests, negative effects of elevated N deposition have been suggested to occur rapidly in Forest Ecology and Management 257 (2009) 332–342 ARTICLE INFO Article history: Received 19 May 2008 Received in revised form 21 August 2008 Accepted 4 September 2008 Keywords: Nitrogen additions Nitrogen deposition Nitrogen leaching Nitrogen retention Nitrogen saturation Subtropical monsoon forest Southern China ABSTRACT Dissolved inorganic nitrogen (DIN) (as ammonium nitrate) was applied monthly onto the forest floor of one old-growth forest (>400 years old, at levels of 50, 100 and 150 kg N ha 1 yr 1 ) and two young forests (both about 70 years old, at levels of 50 and 100 kg N ha 1 yr 1 ) over 3 years (2004–2006), to investigate how nitrogen (N) input influenced N leaching output, and if there were differences in N retention between the old-growth and the young forests in the subtropical monsoon region of southern China. The ambient throughfall inputs were 23–27 kg N ha 1 yr 1 in the young forests and 29–35 kg N ha 1 yr 1 in the old-growth forest. In the control plots without experimental N addition, a net N retention was observed in the young forests (on average 6–11 kg N ha 1 yr 1 ), but a net N loss occurred in the old- growth forest (13 kg N ha 1 yr 1 ). Experimental N addition immediately increased DIN leaching in all three forests, with 25–66% of added N leached over the 3-year experiment. At the lowest level of N addition (50 kg N ha 1 yr 1 ), the percentage N loss was higher in the old-growth forest (66% of added N) than in the two young forests (38% and 26%). However, at higher levels of N addition (100 and 150 kg N ha 1 yr 1 ), the old-growth forest exhibited similar N losses (25–43%) to those in the young forests (28–43%). These results indicate that N retention is largely determined by the forest successional stages and the levels of N addition. Compared to most temperate forests studied in Europe and North America, N leaching loss in these seasonal monsoon subtropical forests occurred mainly in the rainy growing season, with measured N loss in leaching substantially higher under both ambient deposition and experimental N additions. ß 2008 Elsevier B.V. All rights reserved. * Corresponding author at: South China Botanical Garden, The Chinese Academy of Sciences, Xingke Road No. 723, Tianhe District, Guangzhou 510650, China. Tel.: +86 758 2621915; fax: +86 758 2623242. E-mail address: [email protected] (Y. Fang). Contents lists available at ScienceDirect Forest Ecology and Management journal homepage: www.elsevier.com/locate/foreco 0378-1127/$ – see front matter ß 2008 Elsevier B.V. All rights reserved. doi:10.1016/j.foreco.2008.09.004
-
Upload
independent -
Category
Documents
-
view
0 -
download
0
Transcript of Nitrogen leaching in response to increased nitrogen inputs in subtropical monsoon forests in...

Forest Ecology and Management 257 (2009) 332–342
Nitrogen leaching in response to increased nitrogen inputs in subtropicalmonsoon forests in southern China
Yunting Fang a,b,*, Per Gundersen b, Jiangming Mo a, Weixing Zhu c
a South China Botanical Garden, The Chinese Academy of Sciences, Xingke Road No. 723, Tianhe District, Guangzhou 510650, Chinab Forest & Landscape Denmark, Faculty of Life Sciences, University of Copenhagen, Hørsholm Kongevej 11, DK-2970 Hørsholm, Denmarkc Department of Biological Sciences, State University of New York - Binghamton, Binghamton, NY 13902, USA
A R T I C L E I N F O
Article history:
Received 19 May 2008
Received in revised form 21 August 2008
Accepted 4 September 2008
Keywords:
Nitrogen additions
Nitrogen deposition
Nitrogen leaching
Nitrogen retention
Nitrogen saturation
Subtropical monsoon forest
Southern China
A B S T R A C T
Dissolved inorganic nitrogen (DIN) (as ammonium nitrate) was applied monthly onto the forest floor of
one old-growth forest (>400 years old, at levels of 50, 100 and 150 kg N ha�1 yr�1) and two young forests
(both about 70 years old, at levels of 50 and 100 kg N ha�1 yr�1) over 3 years (2004–2006), to investigate
how nitrogen (N) input influenced N leaching output, and if there were differences in N retention
between the old-growth and the young forests in the subtropical monsoon region of southern China. The
ambient throughfall inputs were 23–27 kg N ha�1 yr�1 in the young forests and 29–35 kg N ha�1 yr�1 in
the old-growth forest. In the control plots without experimental N addition, a net N retention was
observed in the young forests (on average 6–11 kg N ha�1 yr�1), but a net N loss occurred in the old-
growth forest (�13 kg N ha�1 yr�1). Experimental N addition immediately increased DIN leaching in all
three forests, with 25–66% of added N leached over the 3-year experiment. At the lowest level of N
addition (50 kg N ha�1 yr�1), the percentage N loss was higher in the old-growth forest (66% of added N)
than in the two young forests (38% and 26%). However, at higher levels of N addition (100 and
150 kg N ha�1 yr�1), the old-growth forest exhibited similar N losses (25–43%) to those in the young
forests (28–43%). These results indicate that N retention is largely determined by the forest successional
stages and the levels of N addition. Compared to most temperate forests studied in Europe and North
America, N leaching loss in these seasonal monsoon subtropical forests occurred mainly in the rainy
growing season, with measured N loss in leaching substantially higher under both ambient deposition
and experimental N additions.
� 2008 Elsevier B.V. All rights reserved.
Contents lists available at ScienceDirect
Forest Ecology and Management
journal homepage: www.elsev ier .com/ locate / foreco
1. Introduction
Tropical and subtropical forests in southern China play a pivotalrole in maintaining local climate conditions and regulatingregional soil–atmospheric exchange of carbon (C) and nitrogen(N) (Fang et al., 2001; Zhou et al., 2006). Nitrogen deposition inprecipitation greater than 10 kg N ha�1 yr�1, the threshold abovewhich N leaching often increases in temperate and boreal forests(e.g. MacDonald et al., 2002), has frequently been reported in areasof southern China associated with rapid economic growth (Zhouand Yan, 2001; Chen and Mulder, 2007). This widespread elevatedatmospheric N deposition, which may have persisted for more thana decade in some parts of the region (Huang et al., 1994), is
* Corresponding author at: South China Botanical Garden, The Chinese Academy
of Sciences, Xingke Road No. 723, Tianhe District, Guangzhou 510650, China.
Tel.: +86 758 2621915; fax: +86 758 2623242.
E-mail address: [email protected] (Y. Fang).
0378-1127/$ – see front matter � 2008 Elsevier B.V. All rights reserved.
doi:10.1016/j.foreco.2008.09.004
expected to change the C and N cycles in forest ecosystems.However, concerns over the impact of increased N deposition arestill at the starting stage. Little is known if the currently depositedN would change forest N status, the fate of deposited N, and therate of N leaching (Fang et al., 2006; Chen and Mulder, 2007).
Nitrogen retention varies widely among forest ecosystems, andthe understanding of the patterns and mechanisms of N retentionare central to our understanding of N cycling in ecosystems.Concerns over adverse effects of N deposition including soilacidification, nutrient imbalance and even forest decline haveinitiated many studies in temperate forests of North America andEurope in the last decades (Aber et al., 1989, 1998; Gundersenet al., 1998). Measurements along N deposition gradients and fromexperimental N manipulation studies showed that temperateforests exhibited high efficiency of N retention, which conse-quently could delay the occurrence of potential negative impactsinduced by increased N deposition (Aber et al., 1998; Gundersenet al., 1998). In contrast to temperate forests, negative effects ofelevated N deposition have been suggested to occur rapidly in

Y. Fang et al. / Forest Ecology and Management 257 (2009) 332–342 333
tropical and subtropical forests (Matson et al., 1999; Chen andMulder, 2007), because most forests under warm and humidclimate tend to cycle N fast and have high N availability but lowavailable phosphorus (P) and other nutrients (Vitousek, 1984).However, this general hypothesis has only been tested in Hawaiianwet tropical forests (Lohse and Matson, 2005) and is questioned byother researchers (Adams et al., 2004). Positioned near the PacificOcean to the east and the Indian Ocean to the south, southernChina has a monsoon climate with a high abundance of heat, light,and water throughout the rainy growing season when a majorfraction of the N deposition also occurs (Zhou and Yan, 2001; Chenand Mulder, 2007; Fang et al., 2008), and a distinct dry season inlate autumn and winter. Elevated N deposition thus coincides withthe most productive season in these forests and may be retained bybiological processes. On the other hand, high water fluxes andfavorable temperature may stimulate soil N transformations andincrease N leaching. In this kind of seasonal subtropical forest, thebalance between biological uptake, hydrologic flow rate andcontact time likely determine the fate of deposited N in the rainyseason, whereas deposited N is likely retained throughout the dryseason where plants remain productive and flows are minimal(Fang et al., 2008).
Traditionally, N retention has been thought to be mainlycontrolled by biological N demand by plants and microbes.Nutrient retention theory predicts that the losses of essentialand limiting nutrients such as N should increase as forestecosystems approach a steady state, the point that output equalsinput (Vitousek and Reiners, 1975). Nitrogen saturation theorypredicts that N leaching should increase in response to elevated Ndeposition, and the response depends largely on the initial N status(Aber et al., 1989, 1998; Gundersen et al., 1998). Thus both theoriespredict that there will be more N leaching from the older forestthan the younger forest under elevated atmospheric N deposition,since the old-growth forests have lower N accretion and higherinitial (inherent) N availability. However, recent evidence from Nfertilization studies in temperate forests indicates that soils, ratherthan plants, are the dominant long-term sink for applied N, byinference, for N from atmospheric deposition (Nadelhoffer et al.,1999; also see Davidson et al., 2003). Several studies show that Nlosses from old-growth forests, or those in which overstorybiomass accumulation has ceased, have been lower than predictedby the nutrient retention theory (Fisk et al., 2002). The results fromthe N addition experiments performed in Hawaiian wet tropicalforests showed that both young and old forests respondedimmediately to elevated N input with increased NO3
�-N leaching
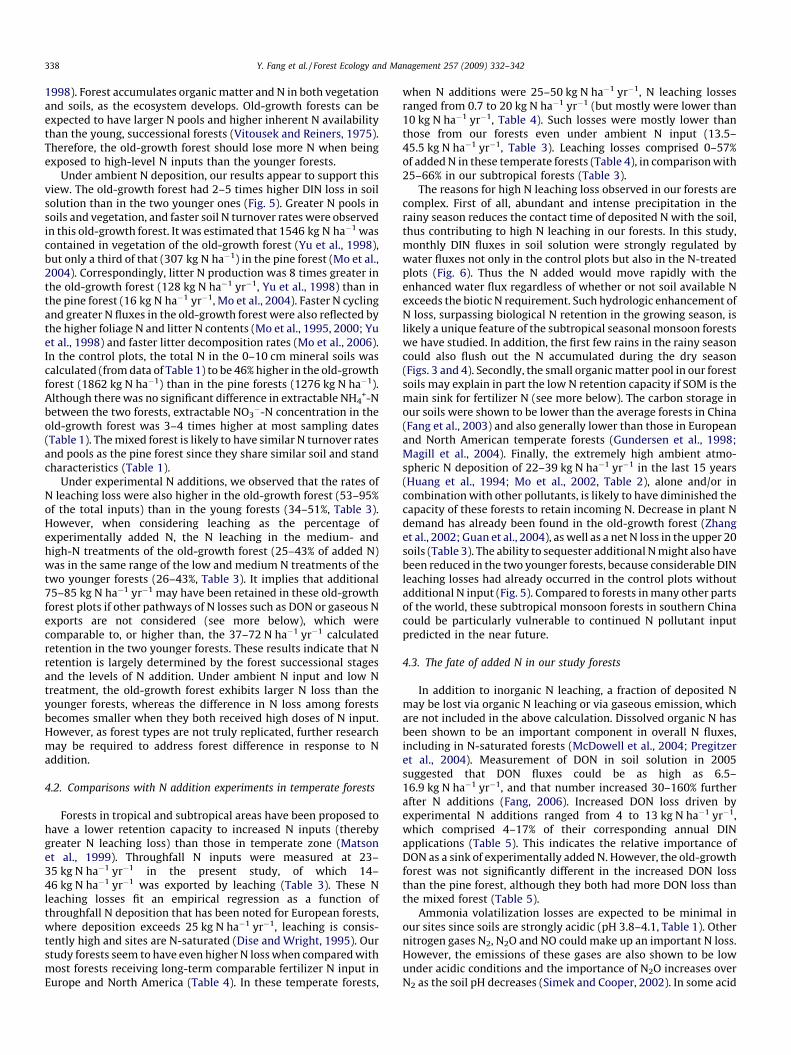
Fig. 1. Location of the study site (DHSBR) in Guangdong
following N addition, but with more NO3� losses in the younger
forest despite its rapid biomass accumulation (Lohse and Matson,2005). These studies highlight the importance of other factors inaddition to plant uptake in regulating N leaching.
To better understand the risks and consequences of Nsaturation in warm and humid climate, where seasonal tropicaland subtropical forests are located, a N addition experiment wasstarted in Dinghushan Biosphere Reserve (DHSBR), southern Chinain July 2003. The DHSBR includes an old-growth evergreenbroadleaved forest and two younger forest types (Fang et al.,2006). Inorganic N at levels of 50–150 kg N ha�1 yr�1 was sprayedmonthly on the forest floor to simulate predicted future increase inN deposition in the region (Zheng et al., 2002). We have previouslyreported the input and output budget of N (from 2004 to 2005) inthese three forest ecosystems under ambient deposition condition(Fang et al., 2008). In this paper, we report N leaching response toexperimental N additions in the first 3-year study (2004–2006), toinvestigate how experimentally added N influenced N output inleaching, and whether there were differences between the old-growth and the younger forests in N retention. The seasonalmonsoon climate also gives us a rare opportunity to test plantcontrols on N retention vs. hydrologic controls on N loss, and tocompare our results with those conducted in temperate forests.
2. Materials and methods
2.1. Site description
This study was conducted in the Dinghushan Biosphere Reservein the middle part of Guangdong province, southern China(1128330E and 238100N, Fig. 1). This reserve is 20 km east ofZhaoqing (330 thousand inhabitants), and about 90 km west ofmetropolitan Guangzhou (10 millions inhabitants). The climate isstrongly seasonal, with 75% of the mean annual rainfall of1927 mm falling from March to August (wet-warm season) andonly 6% from December to February (dry-cool season) (Huang andFan, 1982). Mean annual relative humidity is 80% and mean annualtemperature is 21.0 8C, with average temperatures in the coolestmonth (January) and the warmest month (July) of 12.6 and 28.0 8C,respectively (Huang and Fan, 1982). Total N input in precipitationwas 21–38 kg N ha�1 yr�1 in the 1990s (Huang et al., 1994; Zhouand Yan, 2001; Mo et al., 2002).
The old-growth forest is a regional climax type (monsoonevergreen broad-leaved forest) and has been protected for morethan 400 years by monks in the nearby temples (Wang et al., 1982).
Province, southern China (1128330E and 238100N).

Y. Fang et al. / Forest Ecology and Management 257 (2009) 332–342334
The major species are Castanopsis chinensis, Machilus chinensis,Schima superba, Cryptocarya chinensis, Syzygium rehderianum in thecanopy and sub-canopy layers. Both young forests originated fromthe 1930s clear-cut and subsequent pine plantation (Wang et al.,1982; Fang et al., 2006). The colonization from natural dispersal ofregional broadleaf species has changed the plant composition inthe mixed forest (major species are Pinus massoniana, S. superba,and Castanopsis chinensis), while the pine forest is still dominatedby P. massoniana due to continuous human disturbances before1990 (generally the harvesting of understory and litter, Mo et al.,1995). The old-growth forest had a basal area of almost twice(26.2 m2 ha�1) those in the pine and mixed forests (14.0 and13.8 m2 ha�1), but less litter accumulation in the forest floor (8.9,23 and 20 Mg ha�1 in the old-growth, pine and mixed forests,respectively; Fang et al., 2006). Basal area in the old-growth forestmight be underestimated because particularly large trees were notincluded in our plots.
The three forests have similar elevation, slope aspect anddegree. However, the topography is highly heterogeneouswithin each forest, with slopes ranging from 158 to 358. Thesoil is lateritic red earth formed from sandstone (He et al., 1982).The soil depths vary with forest types. In the old-growth forestthe soil depth ranges from 30 to 70 cm. The soil is about 40 cmdeep in the mixed forest, and generally less than 40 cm in thepine forest. The old-growth forest had significantly higherconcentrations of total C, N and P, but lower soil pH, C/N ratioand bulk density than the pine and mixed forests (Table 1). Soilconditions in the pine and mixed forests did not differsignificantly (Table 1).
2.2. Experimental N treatment
Four N treatments, control, low-N, medium-N and high-N wereestablished in the old-growth forest, and three N treatments(control, low-N, and medium-N) were established in both the pineand mixed forests in 2003. In each forest, three replicate plotswere randomly selected for each level of treatment. There weretotal 9 plots in the pine forest, 9 plots in the mixed forest, and 12plots in the old-growth forest. Each plot measures 10 m � 20 m,with about 10 m buffer strips around each plot. The overall size ofeach forest site within which the plots were nested wasapproximately 0.7 ha. Total applications were 0, 50, 100,150 kg N ha�1 yr�1 for the control, low-N, medium-N and high-N treatments, respectively. Fertilizer additions of dissolvedNH4NO3 began in July 2003 with equal monthly applicationsover the study period. For each N application, fertilizer wasweighed, mixed with 20 L of water, and applied using a backpacksprayer below the canopy. Two passes were made across each plotto ensure an even distribution of fertilizer. The control plotsreceived the same amount of water (20 L per plot each month)without additional N (Fang et al., 2006).
Table 1Characteristic of the mineral soil (0–10 cm) in the pine, mixed and old-growth forests
Parameter Pine forest
Bulk density (g cm�3) 1.16 (0.03)ab
pH (H2O) 4.04 (0.04)a
Total C (%) 2.8 (0.3)b
Total N (%) 0.11 (0.01)b
C/N ratio 25 (1.1)ab
Total P (%) 0.043 (0.003)b
Extractable NH4+ (mg N kg�1) 3.2 (0.4)a
Extractable NO3� (mg N kg�1) 2.5 (0.4)b
S.E. in parentheses, n = 3. For each parameter, means not sharing the same superscript
2.3. Nitrogen deposition and leaching loss
Precipitation, throughfall, surface runoff and soil solution weresampled in the reserve from January 2004 to December 2006. Bulkprecipitation was collected in an open area using two glass funnels(15 cm in diameter), each connected to a 2.5 L sampling bottle witha black polypropylene tube. To avoid potential contamination fromnearby construction activities, the precipitation collectors weremoved to a more protected location in 2006, which may haveunderestimated precipitation N inputs in that year. To samplethroughfall, five collectors made of split longitudinally PVC pipes(intercept area of 0.8 m2 for each collector) were laid out randomlyabout 1.3 m above the ground in each forest. Each collector wasconnected to two 50 L interconnected sealed buckets (to avoidpotential overflow) with polypropylene tubes. One of the collectorsin the old-growth forest was destroyed by a falling tree during aAugust 2005 storm. The amount of stemflow has been found to benegligible (Huang et al., 1994) and was not included in this study.
Soil solution was collected from all plots (except in one of themedium-N plots in the old-growth forest due to its shallow soil androcky substrate). Two replicate zero tension plastic tray lysimetersper plot were installed in April/May 2003, 3–4 months before theexperiment (Fang et al., 2006). Each tray lysimeter was25 cm � 30 cm with rims to help capture and channel the soilsolution. Lysimeter pits were excavated with a shovel. A lysimeterinstallation tunnel was excavated from one side of the pits at 20 cmbelow the soil surface, and a tray lysimeter was inserted into thetunnel 10 cm from the pit edge and raised to the tunnel ceilingwith soil. Each lysimeter was connected to a 5 L bottle using siteslope to facilitate water flow and sampling. We chose 20 cm soildepth because previous studies showed that more than 70% of thefine root biomass (<5 mm) was distributed in the upper 20 cm soilin the mixed and old-growth forests (Wen et al., 1999). However,by this method N leaching was probably slightly overestimated,since a fraction of N was likely to be further retained in the deepersoil. Soil solution at 40 cm depth using a ceramic suction cupmethod was collected in 2004, but the collection was terminateddue to technical difficulties. However, the measurements revealedthat the difference in annual volume-weighted dissolved inorganicnitrogen (DIN) concentrations was minor between the two soildepths (Fang et al., 2008).
Since the plots are situated on steep slopes, one replicate plot ofeach treatment in the pine and old-growth forests had beendelimited hydrologically in the winter of 2002, by installing plasticand concrete barriers to sample and quantify surface runoff. Soilsolution and surface runoff were sampled twice a month (one priorto the N addition and another 15 days after the N addition, Fanget al., 2006) after N additions began.
Samples were filtered within 24–48 h of collection through0.45 mm filters in the DHSBR laboratory, and then stored in plasticbottles at 4 8C until later chemical analysis. Concentrations of
at DHSBR in southern China
Mixed forest Old-growth forest P
1.22 (0.03)a 0.98 (0.06)b 0.026
3.95 (0.01)a 3.83 (0.02)b 0.003
2.6 (0.3)b 4.6 (0.2)a 0.004
0.10 (0.01)b 0.19 (0.01)a 0.001
28 (0.7)a 22.1 (1.3)b 0.05
0.044 (0.004)b 0.059 (0.003)a 0.024
3.0 (0.2)a 2.0 (0.04)a 0.027
2.8 (0.4)b 11.7 (1.0)a <0.001
letter were statistically different at P-value of 0.05. Data from Fang et al. (2006).

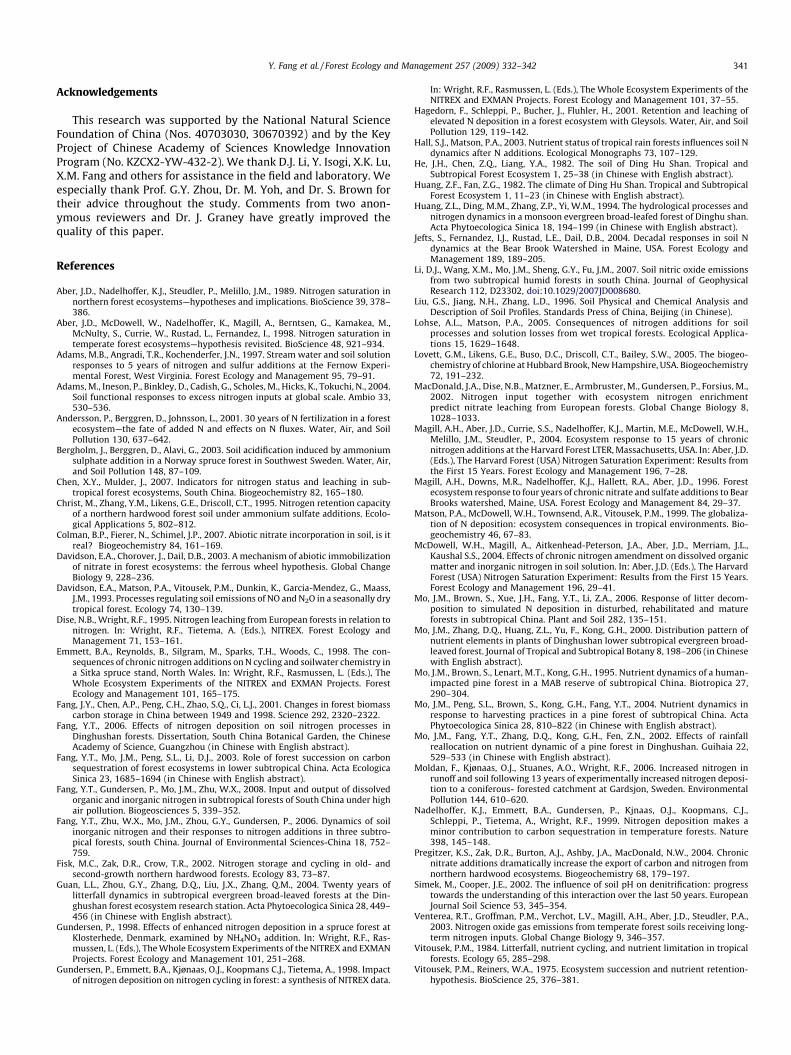
Fig. 2. Monthly precipitation and monthly mean air temperature at DHSBR,
southern China, during this study period.
Y. Fang et al. / Forest Ecology and Management 257 (2009) 332–342 335
inorganic N (NH4+-N and NO3
�-N) was determined for all samples.NH4
+-N was analyzed by the indophenol blue method followed bycolorimetry, and NO3
�-N was analyzed after cadmium reduction toNO2
�-N, followed by sulfanilamide-NAD reaction (Liu et al., 1996).These concentrations were multiplied by the recorded watervolume for the same sample date in the same plot, and thensummed to determine monthly and annual N fluxes in the unit ofkg N ha�1 for each plot.
2.4. Statistical analysis
For concentrations of inorganic N in soil solutions, for eachforest type and in each of the sample year, we performed arepeated measurement ANOVA (RMANOVA) to identify the overallN treatment effects. One-way ANOVA with Tukey’s HSD wasperformed to test the effect of N addition on annual N loss for eachforest type, where N addition and control plots were randomlyassigned. Paired t-test was used to compare the N concentrationsand fluxes between the surface runoff and leaching collected at the20 cm soil depth at the same site, and surface runoffs between thecontrol pine plot and control old-growth plot through time. Weperformed correlation analysis to examine the relationshipsbetween different variables (e.g. N flux, N concentration, andwater flux). Residuals were plotted to examine the equal varianceassumptions for the ANOVA. Because forest type (old-growth,mixed, and pine forests) cannot be ‘‘truly replicated’’, we limitedour statistical comparisons among forests mainly to the controlplots. All analyses were conducted using SPSS 10.0 for Windows.Statistically significant differences were identified when P-values<0.05 unless otherwise stated.
3. Results
3.1. Nitrogen deposition in precipitation and throughfall
Annual precipitations were 1327, 1657, and 1850 mm in 2004,2005 and 2006, respectively, which were lower than the long-termaverage precipitation rate of 1997 mm in the area (Zhou and Yan,2001). The rain in all 3 years fell almost exclusively in the rainyseason (March to August, 79–83% of the annual precipitation,Fig. 2). Deposition rates of inorganic N in precipitation were 34.2,31.6, and 16.9 kg N ha�1 yr�1 in 2004, 2005, and 2006, respectively(Table 2). Lower N deposition in 2006 was probably due to thechange of sampling location (see Section 2). Ammonium accountedfor 47–68% of the inorganic N input in precipitation.
Throughfall amount varied from 1120 to 1560 mm, accountingfor 74–86% of the precipitation amount. There was no significantdifference in throughfall amount among three forest types.Inorganic N in throughfall ranged from 23.6 to 26.8 kg N ha�1 yr�1
�1 in the two young forests, and 29.1–35.4 kg N ha�1 yr�1 in theold-growth forest (Table 2). Throughfall N inputs were relatively
Table 2Annual fluxes of dissolved inorganic N (kg N ha�1 yr�1) in the precipitation and throug
2004 2005
NH4+-N NO3
�-N DIN NH4+-N
Precipitationa 23.2 10.9 34.2 17.8
Throughfall
Pine forest 12.8 (0.6)a 12.6 (1.0)b 24.6 (1.4)b 12.9 (0.7)a
Mixed forest 15.2 (1.0)a 11.6 (0.9)b 26.1 (1.8)b 11.2 (0.7)a
Old-growth forest 16.5 (1.5)a 18.9 (2.1)a 35.4 (3.4)a 14.2 (1.1)a
P 0.104 0.008 0.016 0.075
Note: S.E. in parentheses. For throughfall, n = 5, except in the old-growth forest in 2006, w
superscript letter were statistically different between forests, P < 0.05. aPrecipitation coll
constant in all three forests over the 3 years. In throughfall, NH4+-N
comprised approximately half (41–58%) of the inorganic N, thatpercentage was slightly lower than those in precipitation.
3.2. Nitrogen in leaching soil solution
The amount of soil solution collected at the 20 cm soil depthranged from 351 to 823 mm, accounting for 31–53% of thecorresponding throughfall. Soil solution flux was the highest in theold-growth forest and lowest in the mixed forest (on average 569,440 and 680 mm in the pine, mixed and old-growth forests,respectively, P < 0.05). Both NH4
+-N and NO3�-N concentrations in
the soil solution displayed a strong seasonality, with low values inthe summer months, reflecting possibly both biological N demandand dilution by rainfall (Figs. 3 and 4). However, NH4
+-Nconcentrations (annual averages ranging from 0.1 to 1.2 mg N L�1,Fig. 3) were much lower than the NO3
�-N concentrations (annualaverages ranging from 2.3 to 13.8 mg N L�1, Fig. 4), even though Ntreatments added equal input of NH4
+ and NO3� (2–6 times of the
ambient throughfall input). Repeated measurement ANOVA in thecontrol plots showed that three forests were not significantlydifferent in NH4
+-N concentrations, but NO3�-N concentrations in
the old-growth forest (annual means, 5.7–6.8 mg N L�1) were 2–3times higher than those in the two young forests (2.0–2.9 mg N L�1, P from <0.001 to 0.028). The NO3
�-N concentrationsbetween the two young forests were not statistically different.
Additions of inorganic N increased both NH4+-N and NO3
�-Nconcentrations in soil solutions in all three types of forests, but theincreases in NH4
+-N concentration was far smaller than those inNO3
�-N concentration. Statistically significant effects of N treat-ment on NH4
+-N were observed only in the first two sample yearsin the pine forest (Fig. 3). The response of NO3
�-N depended onforest type. In the pine and old-growth forests, the treatment effect
hfall in the pine, mixed and old-growth forests of DHSBR, southern China
2006
NO3�-N DIN NH4
+-N NO3�-N DIN
13.8 31.6 8.1 8.8 16.9
13.9 (0.6)b 26.8 (1.3)b 13.6 (0.8)a 13.1 (1.0)a 24.8 (1.4)a
11.5 (0.4)c 22.8 (1.0)b 12.6 (0.9)a 12.9 (0.5)a 23.6 (1.2)a
17.4 (0.9)a 31.6 (1.5)a 12.0 (3.1)a 15.3 (1.8)a 29.1 (4.5)a
<0.001 0.001 0.842 0.314 0.331
here n = 4 (see text). In each column, mean throughfall values not sharing the same
ectors were moved to a more protected location in 2006 due to nearby construction.

Fig. 3. Concentrations of ammonium (NH4+) N in the soil solution collected at the
20 cm depth from the pine, mixed and old-growth forests of DHSBR, southern
China; means (n = 3 except in the medium-N treatment of the old-growth forest
where n = 2, see text) with standard error bars. Fertilizer N has been added
continuously on the monthly basis; there was no leaching solution during the dry
season.
Fig. 4. Concentrations of nitrate (NO3�) N in the soil solution collected at the 20 cm
depth from the pine, mixed and old-growth forests of DHSBR, southern China. Data
arrangement same as in Fig. 3.
Y. Fang et al. / Forest Ecology and Management 257 (2009) 332–342336
on NO3�-N concentration was statistically significant in all 3 study
years (RMANOVA, P from <0.001 to 0.013), whereas in the mixedforest it was significant (P = 0.015) only in 2004 (Fig. 4). Annualmean NO3
�-N concentrations in the N-addition plots was 1.5–5.1times higher than in the controls.
Under ambient condition, DIN losses in the leaching solution inthe old-growth forest were 38.7–35.5 kg N ha�1 yr�1, significantlyhigher (P < 0.001, two-way ANOVA using year and forest type asmain factors) than those in the pine and mixed forests (8.9–20.3 kg N ha�1 yr�1, Fig. 5). Additions of N increased DIN fluxes inall three forests, with the N treatment effect statistically significantin the pine forest in all 3 years, and in year 2004 in the mixed andold-growth forests (Fig. 5). Over the 3 years, average DIN loss in thepine forest increased from 15.8 kg N ha�1 yr�1 in the controls to
Fig. 5. Responses of annual leaching of dissolved inorganic nitrogen (DIN) in soil solution
old-growth forests of DHSBR, southern China. Means (n = 3 except in the medium-N tr
asterisk indicates significant treatment effect (P < 0.05) of N addition in the sample ye
34.2 and 58.9 kg N ha�1 yr�1 in the low-N and medium-Ntreatments; in the mixed forest, average DIN loss increased from9.8 to 22.4 and 38.0 kg N ha�1 yr�1. In the old-growth forest,averaged DIN loss was 41.4 kg N ha�1 yr�1 in the controls, andincreased to 71.3, 65.6 and 105.2 kg N ha�1 yr�1 in the N-additionplots (Fig. 5). Ammonium represented 1–17% of DIN export in soilsolution, with lower percentages in the old-growth forests than inthe two young forests, and lower percentages in the N-additionplots than in the control plots.
In all three forests, monthly variation of N leaching lossdepended mainly on downward water movement (Fig. 6, only pineforest data were shown), not the N concentration. The correlationbetween monthly DIN fluxes and monthly water fluxes in soilsolution were significant in all N treatments of the three forestsacross the 3-year study (r2 from 0.53–0.78, P-values from <0.001to 0.036, n = 23). High N losses coincided with the high downward
to N additions. Soil solutions were collected at 20 cm depth in the pine, mixed and
eatment of the old-growth forest where n = 2, see text) with standard error bars;
ar.

Fig. 6. The relationships between monthly fluxes of water and dissolved inorganic
nitrogen (DIN) in the soil solution collected at 20 cm depth in the pine forest across
the 3 years of sampling, grouped by N treatments. Each datum point is the mean of
three replicated plots. N = 23 in each of the N treatments (some months had no
leaching collection), P = 0.003, 0.000 and 0.002 for the control, low-N and medium-
N treatments, respectively.
Y. Fang et al. / Forest Ecology and Management 257 (2009) 332–342 337
water movement from March to August, even though Nconcentrations were low in these months and plant N uptakeswere presumably high (Figs. 2–4 and 6).
3.3. Nitrogen in surface runoff
Surface runoff accounted for 9% and 20% of the throughfall inputin the pine (101–130 mm) and old-growth forests (225–312 mm),respectively. Under ambient condition, both NH4
+-N (P = 0.023)and NO3
�-N (P < 0.001) concentrations in the surface runoff weresignificantly higher in the pine forest plot than in the old-growthforest plot (paired t-test across 33 samplings over 3 years). AverageNH4
+-N concentrations over this period were 1.0 and 0.7 mg N L�1
in the pine and old-growth forests, respectively, and average NO3�-
N concentrations were 2.1 and 1.5 mg N L�1, respectively. NeitherNH4
+-N nor NO3�-N concentrations were significantly altered by N
additions during the study (data not shown). In the control plots, Nlosses via surface runoff were 3.2–4.3 in the pine, and 3.3–3.8 kg N ha�1 yr�1 in the old-growth forests (data not shown), andthus much lower than the corresponding N loss in soil solution
Table 3Average annual total N input (throughfall + experimental additions) and total leaching lo
old-growth forests of DHSBR, southern China
Forest and N
treatment
Total input
(kg N ha�1 yr�1)
Leaching los
(kg N ha�1 y
Pine forest
Control 25.4 19.5
Low-N 75.4 38.5
Medium-N 125.4 62.8
Mixed forest
Control 24.2 13.5
Low-N 74.2 26.7
Medium-N 124.2 41.9
Old-growth forest
Control 32.3 45.5
Low-N 82.3 78.5
Medium-N 132.3 70.3
High-N 182.3 110.1
a Notice the total leaching loss reported here (soil solution collected at the 20 cm deptb Calculated as the percentage of the increased N output due to N addition (i.e. outpu
input.
reported above. This suggested that most of the leaching lossesmoved downward in soil solution, not through surface runoff.Three years of N additions did not significantly affect N export insurface runoff; in the N-addition plots N losses were 2.8–5.6 and4.2–5.9 kg N ha�1 yr�1 in the pine and old-growth forests, respec-tively. Ammonium comprised 18–40% of inorganic N in surfacerunoff, that percentage was lower than those in the precipitation,but higher than those in soil solution 20 cm below the soil surface(data not shown).
3.4. Total N leaching loss and N retention
To evaluate N losses from both downward leaching in soilsolution and surface runoff, we added data from both fluxes tocalculate the total N leaching loss and then estimated the overallecosystem N retention over the 3-year study (Table 3). Becausesurface runoff was not collected for the mixed forest, we used datafrom the pine forest to estimate those in the mixed forest, since thefloor litter amounts and slopes of the terrain were similar betweenthe two forests.
Our results showed that in the control plots without experi-mental N addition, a net N retention was observed in the youngforests (on average 6–11 kg N ha�1 yr�1), but a net N loss occurredin the old-growth forest (�13 kg N ha�1 yr�1, Table 3). In the N-addition plots, from 34% to 95% of the total N input was leachedfrom the surface 20 cm of soil (Table 3). Considering the fate ofexperimentally added N, between 25% and 66% of the addition wasfound in the output. Both under ambient conditions and followingexperimental additions, higher leaching losses were found in thepine and old-growth forests than in the mixed forest (Table 3).Total leaching increased linearly with N input across the 10treatment combinations in the three forests (total leaching = 0.46total input + 10.3, P = 0.004, r2 = 0.66, n = 10), but the percentage Nretained also increased with N input (P = 0.002).
4. Discussion
4.1. Differences in the responses of N leaching among forests
Different types of forest ecosystems have different responses toincreased N deposition, and the timing and magnitude of theresponse depends largely on initial nutrient pools and how closethe system is to N saturation (Gundersen et al., 1998; Aber et al.,
ss (downward leaching + surface runoff) from 2004 to 2006 in the pine, mixed and
s
r�1)a
Leaching loss of
total input (%)
Leaching loss of
added N (%)b
77
51 38
50 43
56
36 26
34 28
141
95 66
53 25
60 43
h plus surface runoff) is different from that reported in Fig. 5 on soil solution alone.
t from N-treated plots minus that from the control plots) out of the experimental N
Y. Fang et al. / Forest Ecology and Management 257 (2009) 332–342338
1998). Forest accumulates organic matter and N in both vegetationand soils, as the ecosystem develops. Old-growth forests can beexpected to have larger N pools and higher inherent N availabilitythan the young, successional forests (Vitousek and Reiners, 1975).Therefore, the old-growth forest should lose more N when beingexposed to high-level N inputs than the younger forests.
Under ambient N deposition, our results appear to support thisview. The old-growth forest had 2–5 times higher DIN loss in soilsolution than in the two younger ones (Fig. 5). Greater N pools insoils and vegetation, and faster soil N turnover rates were observedin this old-growth forest. It was estimated that 1546 kg N ha�1 wascontained in vegetation of the old-growth forest (Yu et al., 1998),but only a third of that (307 kg N ha�1) in the pine forest (Mo et al.,2004). Correspondingly, litter N production was 8 times greater inthe old-growth forest (128 kg N ha�1 yr�1, Yu et al., 1998) than inthe pine forest (16 kg N ha�1 yr�1, Mo et al., 2004). Faster N cyclingand greater N fluxes in the old-growth forest were also reflected bythe higher foliage N and litter N contents (Mo et al., 1995, 2000; Yuet al., 1998) and faster litter decomposition rates (Mo et al., 2006).In the control plots, the total N in the 0–10 cm mineral soils wascalculated (from data of Table 1) to be 46% higher in the old-growthforest (1862 kg N ha�1) than in the pine forests (1276 kg N ha�1).Although there was no significant difference in extractable NH4
+-Nbetween the two forests, extractable NO3
�-N concentration in theold-growth forest was 3–4 times higher at most sampling dates(Table 1). The mixed forest is likely to have similar N turnover ratesand pools as the pine forest since they share similar soil and standcharacteristics (Table 1).
Under experimental N additions, we observed that the rates ofN leaching loss were also higher in the old-growth forest (53–95%of the total inputs) than in the young forests (34–51%, Table 3).However, when considering leaching as the percentage ofexperimentally added N, the N leaching in the medium- andhigh-N treatments of the old-growth forest (25–43% of added N)was in the same range of the low and medium N treatments of thetwo younger forests (26–43%, Table 3). It implies that additional75–85 kg N ha�1 yr�1 may have been retained in these old-growthforest plots if other pathways of N losses such as DON or gaseous Nexports are not considered (see more below), which werecomparable to, or higher than, the 37–72 N ha�1 yr�1 calculatedretention in the two younger forests. These results indicate that Nretention is largely determined by the forest successional stagesand the levels of N addition. Under ambient N input and low Ntreatment, the old-growth forest exhibits larger N loss than theyounger forests, whereas the difference in N loss among forestsbecomes smaller when they both received high doses of N input.However, as forest types are not truly replicated, further researchmay be required to address forest difference in response to Naddition.
4.2. Comparisons with N addition experiments in temperate forests
Forests in tropical and subtropical areas have been proposed tohave a lower retention capacity to increased N inputs (therebygreater N leaching loss) than those in temperate zone (Matsonet al., 1999). Throughfall N inputs were measured at 23–35 kg N ha�1 yr�1 in the present study, of which 14–46 kg N ha�1 yr�1 was exported by leaching (Table 3). These Nleaching losses fit an empirical regression as a function ofthroughfall N deposition that has been noted for European forests,where deposition exceeds 25 kg N ha�1 yr�1, leaching is consis-tently high and sites are N-saturated (Dise and Wright, 1995). Ourstudy forests seem to have even higher N loss when compared withmost forests receiving long-term comparable fertilizer N input inEurope and North America (Table 4). In these temperate forests,
when N additions were 25–50 kg N ha�1 yr�1, N leaching lossesranged from 0.7 to 20 kg N ha�1 yr�1 (but mostly were lower than10 kg N ha�1 yr�1, Table 4). Such losses were mostly lower thanthose from our forests even under ambient N input (13.5–45.5 kg N ha�1 yr�1, Table 3). Leaching losses comprised 0–57%of added N in these temperate forests (Table 4), in comparison with25–66% in our subtropical forests (Table 3).
The reasons for high N leaching loss observed in our forests arecomplex. First of all, abundant and intense precipitation in therainy season reduces the contact time of deposited N with the soil,thus contributing to high N leaching in our forests. In this study,monthly DIN fluxes in soil solution were strongly regulated bywater fluxes not only in the control plots but also in the N-treatedplots (Fig. 6). Thus the N added would move rapidly with theenhanced water flux regardless of whether or not soil available Nexceeds the biotic N requirement. Such hydrologic enhancement ofN loss, surpassing biological N retention in the growing season, islikely a unique feature of the subtropical seasonal monsoon forestswe have studied. In addition, the first few rains in the rainy seasoncould also flush out the N accumulated during the dry season(Figs. 3 and 4). Secondly, the small organic matter pool in our forestsoils may explain in part the low N retention capacity if SOM is themain sink for fertilizer N (see more below). The carbon storage inour soils were shown to be lower than the average forests in China(Fang et al., 2003) and also generally lower than those in Europeanand North American temperate forests (Gundersen et al., 1998;Magill et al., 2004). Finally, the extremely high ambient atmo-spheric N deposition of 22–39 kg N ha�1 yr�1 in the last 15 years(Huang et al., 1994; Mo et al., 2002, Table 2), alone and/or incombination with other pollutants, is likely to have diminished thecapacity of these forests to retain incoming N. Decrease in plant Ndemand has already been found in the old-growth forest (Zhanget al., 2002; Guan et al., 2004), as well as a net N loss in the upper 20soils (Table 3). The ability to sequester additional N might also havebeen reduced in the two younger forests, because considerable DINleaching losses had already occurred in the control plots withoutadditional N input (Fig. 5). Compared to forests in many other partsof the world, these subtropical monsoon forests in southern Chinacould be particularly vulnerable to continued N pollutant inputpredicted in the near future.
4.3. The fate of added N in our study forests
In addition to inorganic N leaching, a fraction of deposited Nmay be lost via organic N leaching or via gaseous emission, whichare not included in the above calculation. Dissolved organic N hasbeen shown to be an important component in overall N fluxes,including in N-saturated forests (McDowell et al., 2004; Pregitzeret al., 2004). Measurement of DON in soil solution in 2005suggested that DON fluxes could be as high as 6.5–16.9 kg N ha�1 yr�1, and that number increased 30–160% furtherafter N additions (Fang, 2006). Increased DON loss driven byexperimental N additions ranged from 4 to 13 kg N ha�1 yr�1,which comprised 4–17% of their corresponding annual DINapplications (Table 5). This indicates the relative importance ofDON as a sink of experimentally added N. However, the old-growthforest was not significantly different in the increased DON lossthan the pine forest, although they both had more DON loss thanthe mixed forest (Table 5).
Ammonia volatilization losses are expected to be minimal inour sites since soils are strongly acidic (pH 3.8–4.1, Table 1). Othernitrogen gases N2, N2O and NO could make up an important N loss.However, the emissions of these gases are also shown to be lowunder acidic conditions and the importance of N2O increases overN2 as the soil pH decreases (Simek and Cooper, 2002). In some acid

Table 4Total N input (throughfall + experimental additions) and leaching loss in the chronic N addition experiments in European and Northeastern American temperate forests
Sites N treatment Form of
added N
Treatment
time (yr)
Total input
(kg N ha�1 yr�1)
Leaching loss
(kg N ha�1 yr�1)
Leaching
loss of total
input (%)
Leaching
loss of added
N (%)
Sources
Europe
Strasan, Sweden Control 0.1 Andersson et al. (2001)
+35 NH4NO3 30 0.4–1.2 1–3
Gardsjon, Sweden Control 15 0.6 4 Moldan et al. (2006)
+40 NH4NO3 13 55 4.2 8 9
Skogaby, Sweden Control 18 0.1 1 Bergholm et al. (2003)
+100 NH4NO3 11 118 28.5 24 28
Klosterhede, Denmark Control 18 0.3 2 Gundersen (1998)
+35 NH4NO3 4 53 4.2 8 11
Aber, UK Control 14 18 129 Emmett et al. (1998)
+35 NH4NO3 5 49 20 41 6
+35 HNO3 49 40 82 57
+75 89 60 67 27
Alptal, Switzerland Control 18 4 22 Hagedorn et al. (2001)
+30 NH4NO3 3 48 8 17 13
Northeastern America
Harvard Hardwood Control 8 0.3 4 Magill et al. (2004)
+50 NH4NO3 15 58 1 2 1
+150 158 50 32 33
Harvard Pine Control 8 0.3 4 Magill et al. (2004)
+50 NH4NO3 15 58 17 29 33
+150 158 80 51 53
Bear Brooks, watershed Control 8 0.3 4 Jefts et al. (2004)
+25.2 (NH4)2SO4 13 33.2 7.3 22 28
Bear Brooks, plot levela Control 5 0.3 6 Magill et al. (1996)
+25 HNO3 4 30 1 3 3
+45 50 4.5 9 9
Fernow Control 15 5.8 39 Adams et al. (1997)
+35 (NH4)2SO4 5 50 9.1 26 9
Michigan Gradientb Control 9.4 2 21 Pregitzer et al. (2004)
+30 NaNO3 8 39.4 12 30 33
Hubbard Brook Control Christ et al. (1995)
+40 (NH4)2SO4 2 0
+160 0
+540 3.6
a means over the study period.b means of the four sites.
Y. Fang et al. / Forest Ecology and Management 257 (2009) 332–342 339
forest soils the emissions were almost entirely as N2O (Wolf andBrumme, 2003). In our acidic study sites, we assume N2O todominate over N2 in denitrification. The annual rates of soil N2Orelease were from 2.2–2.8 kg N ha�1 yr�1 in the control plots(Zhang et al., 2008). Although N treatments significantly increasedN2O emission in the pine and old-growth forests (but not in themixed forest), the average fertilization-derived N2O emission wasonly 0.2–1.2 kg N ha�1 yr�1 or 0.4–2% of the experimental Nadditions (Table 5). These results suggest that N2O is of minorimportance in these subtropical monsoon forests in response toelevated N input.
Production of NO can occur during both nitrification anddenitrification, and could be important in seasonally dry forestslike the ones we have studied, particularly during wet and drytransition time (Davidson et al., 1993). Several researchersreported that NO was a more important gaseous N emittedfrom N-saturated forest than N2O, with emission rate of NObeing 10 times higher than that of N2O (Hall and Matson, 2003;Venterea et al., 2003). For instance, annual NO emissionsestimated from monthly sampling accounted for 3.0–3.7% of N
inputs in the high-N treatment plots and 8.3% of inputs in thelow-N plots at the temperate Harvard Forest site (Venterea et al.,2003). Soil NO emission was considered high under ambient Ndeposition at our study site (4.0–6.9 kg N ha�1 yr�1 in the pineand old-growth forests in 2005, Li et al., 2007). However, thecontribution of soil NO emission to the overall N loss underexperimental N input in our forests needs to be furtherevaluated.
When the losses of DON and N2O-N are included in the budgetcalculation (Table 5), the rates of N loss as added N increase to 56%and 57% in the low- and medium-N treatments of the pine forest,and to 36% and 32% in the mixed forest, respectively. In the old-growth forest, the rates of N loss increase to 82%, 31% and 53% inthe low-N, medium-N, and high-N plots, respectively. Never-theless, this detailed N budget (including DON and N2O-N) doesnot change the pattern of N loss and N retention among forests, andsuggests that the old-growth forest has still retained a substantialamount of added N in the medium- and high-N treatments (69–71 kg N ha�1 yr�1), as those in both younger forests (43–68 kg N ha�1 yr�1, Table 5).

Table 5Estimated distribution of experimentally added N (kg N ha�1 yr�1) in the pine, mixed and old-growth forests of DHSBR, southern China; runoff, soil solution, and soil
extractable N and microbial N are calculated as the difference between N-addition plots and the control plots
Pine Mixed Old-growth
Low-N Medium-N Low-N Medium-N Low-N Medium-N High-N
N addition 50 100 50 100 50 100 150
Surface runoff DINa 1 0 1 0 1 1 1
Solution DINa 18 43 13 28 32 24 64
Surface runoff DONb 0 0 0 0 0 �1 1
Solution DONb 9 13 4 4 7 6 12
N2Oc 0 1 0 0 1 1 1
N retentiond 22 43 32 68 9 69 71
ESINe 1 2 0 1 0 1 1
ESONf 0 3 1 1 3 3 6
Microbial Nf 2 1 1 1 �1 0 1
Plant, SOM and ionexchange siteg 19 38 30 65 8 65 63
a Means over this study period (2004–2006).b DON fluxes were measured in 2005 (Fang, 2006).c N2O emissions from soils were monitored during the period from September 2005 to August 2006 (Zhang et al., 2008).d N retention calculated as N input minus all outputs.e ESIN, extractable soil inorganic N, mean of five sampling dates in the upper 10 cm soil layer in 2004 and 2005 (Fang, 2006).f Extractable soil organic N (ESON) and microbial N was measured for the upper 10 cm soil layer collected in December 2004 (17 months after the first N addition, Fang,
2006).g Calculated as the difference between the retained N and the accumulation in extractable N and microbial N.
Y. Fang et al. / Forest Ecology and Management 257 (2009) 332–342340
Since the old-growth forest was at an advanced stage in the Nsaturation continuum and a net N loss was observed even underambient deposition condition, why did it still retain experimen-tally added N at the same magnitude as younger forests? Part of theadded N may remain in the organic horizon or form new microbialorganic N, but our measurements suggested that neither soilextractable N nor microbial biomass N was the main sink forretained N (Table 5). Thus, a large portion of the retained N (8–65 kg N ha�1 yr�1, Table 5) must have ended up in plant biomass orcomplex soil organic matter.
In the young forest, the tissue N concentration was relativelylow (1.3% in the needles, Mo et al., 1995), thus the plant had thepotential to retain added N. We do not think the same processoccurring in the old-growth forest; tissue N concentration wasalready very high (1.3–2.5% in leaves, Mo et al., 2000) and we haveobserved reduced tree growth during the 3-year study (after 3years of N additions, the absolute basal-area increment was 19–25% lower in the N-addition plots than in the control plots, Y. Fanget al., unpublished data). The mechanisms for N retention have yetto be elucidated, but we suggest that the existing large coarsewoody debris (CWD) and soil organic matter (SOM) are main sinksfor added N in this forest. The old-growth forest has smaller carbonstorage in the organic horizon (3.6 Mg C ha�1) than in the pineforest (12.5 Mg C ha�1), but much greater carbon storage in CWD(13.2 Mg C ha�1) and mineral soils (0–20 cm, 44.6 Mg C ha�1) thanthe pine forest (0.1 and 23.0 Mg C ha�1, respectively, Fang et al.,2003). Soil organic matter has long been considered as a major sinkfor deposited N in temperate forests (Nadelhoffer et al., 1999), andboth biotic immobilization and abiotic incorporation into SOMhave been demonstrated to occur at significant rates under high Ninputs (Aber et al., 1998; Davidson et al., 2003; Magill et al., 2004;Colman et al., 2007). In addition, anion adsorption may also beimportant in retaining N inputs in some forest soils (Lohse andMatson, 2005). Taken together, considerable amounts of experi-mental N input could have been retained in soils in all three forestsas is observed in many temperate forests. More research is neededon the fate and stability of the N retained and the mechanisms of Nretention, especially in the old-growth forest where a net loss isalready happening under ambient N input.
The N retention in our forests may have been underestimated.First of all, N leaching in soil solution collected at the 20 cm depth
is less than that eventually leached from the systems, since afraction of N is likely to be further retained in the deeper soil.Another concern is that soil solution collected using zero tensionlysimeters may not have recovered all the downward leaching.However, the collecting efficiency can be improved by increasingtray area and using rims, as we did in this study. Our resultsshowed that the amount of soil solution collected at the 20 cmdepth ranged from 351 to 823 mm, accounting for 31–53% of thecorresponding throughfall. Together with surface runoff, these twopathways explained 50–73% of the throughfall input in the pineand old-growth forests, which are reasonable estimates for theregion. In 2006, we also analyzed the concentration of chloride ion(Cl�) for all water samples, and found 45–76% of Cl� in throughfallinput was lost via surface runoff plus leaching of soil solution,which indicate an underestimation. However, the short-termmeasurement (1 year) of Cl� may not be enough to achieve abalanced budget due to ‘‘carry over’’ effect from year to year andpossible biological accumulations (Lovett et al., 2005).
5. Conclusions
In this study, dissolved NH4NO3 was applied monthly onto theforest floor of three subtropical monsoon forests in southern Chinaover 3 years, to investigate the influence of increased deposition onN leaching in warm and humid climate. Our results showed thatexperimental N addition immediately increased DIN leaching in allthree forests, with 25–66% of added N leached over the 3-yearexperiment. But the N loss response is largely determined by theforest successional stages and the levels of N addition. Under low Ntreatment, the old-growth forest exhibits larger N loss than theyounger forests, whereas the difference among forests becomessmaller when they both received high doses of N. Compared tomost temperate forests studied in Europe and North America, Nleaching loss in our forests occurred mainly in the rainy growingseason, with measured N loss in leaching substantially higherunder both ambient deposition and experimental N additions. Inthe present study, the detailed N budget including the losses ofDON and N2O-N does not change the pattern of N loss and Nretention among forests, and suggests that all three forests stillretained a substantial amount of added N in ecosystems (9–71 kg N ha�1 yr�1) regardless of large concurrent N loss.
Y. Fang et al. / Forest Ecology and Management 257 (2009) 332–342 341
Acknowledgements
This research was supported by the National Natural ScienceFoundation of China (Nos. 40703030, 30670392) and by the KeyProject of Chinese Academy of Sciences Knowledge InnovationProgram (No. KZCX2-YW-432-2). We thank D.J. Li, Y. Isogi, X.K. Lu,X.M. Fang and others for assistance in the field and laboratory. Weespecially thank Prof. G.Y. Zhou, Dr. M. Yoh, and Dr. S. Brown fortheir advice throughout the study. Comments from two anon-ymous reviewers and Dr. J. Graney have greatly improved thequality of this paper.
References
Aber, J.D., Nadelhoffer, K.J., Steudler, P., Melillo, J.M., 1989. Nitrogen saturation innorthern forest ecosystems—hypotheses and implications. BioScience 39, 378–386.
Aber, J.D., McDowell, W., Nadelhoffer, K., Magill, A., Berntsen, G., Kamakea, M.,McNulty, S., Currie, W., Rustad, L., Fernandez, I., 1998. Nitrogen saturation intemperate forest ecosystems—hypothesis revisited. BioScience 48, 921–934.
Adams, M.B., Angradi, T.R., Kochenderfer, J.N., 1997. Stream water and soil solutionresponses to 5 years of nitrogen and sulfur additions at the Fernow Experi-mental Forest, West Virginia. Forest Ecology and Management 95, 79–91.
Adams, M., Ineson, P., Binkley, D., Cadish, G., Scholes, M., Hicks, K., Tokuchi, N., 2004.Soil functional responses to excess nitrogen inputs at global scale. Ambio 33,530–536.
Andersson, P., Berggren, D., Johnsson, L., 2001. 30 years of N fertilization in a forestecosystem—the fate of added N and effects on N fluxes. Water, Air, and SoilPollution 130, 637–642.
Bergholm, J., Berggren, D., Alavi, G., 2003. Soil acidification induced by ammoniumsulphate addition in a Norway spruce forest in Southwest Sweden. Water, Air,and Soil Pollution 148, 87–109.
Chen, X.Y., Mulder, J., 2007. Indicators for nitrogen status and leaching in sub-tropical forest ecosystems, South China. Biogeochemistry 82, 165–180.
Christ, M., Zhang, Y.M., Likens, G.E., Driscoll, C.T., 1995. Nitrogen retention capacityof a northern hardwood forest soil under ammonium sulfate additions. Ecolo-gical Applications 5, 802–812.
Colman, B.P., Fierer, N., Schimel, J.P., 2007. Abiotic nitrate incorporation in soil, is itreal? Biogeochemistry 84, 161–169.
Davidson, E.A., Chorover, J., Dail, D.B., 2003. A mechanism of abiotic immobilizationof nitrate in forest ecosystems: the ferrous wheel hypothesis. Global ChangeBiology 9, 228–236.
Davidson, E.A., Matson, P.A., Vitousek, P.M., Dunkin, K., Garcia-Mendez, G., Maass,J.M., 1993. Processes regulating soil emissions of NO and N2O in a seasonally drytropical forest. Ecology 74, 130–139.
Dise, N.B., Wright, R.F., 1995. Nitrogen leaching from European forests in relation tonitrogen. In: Wright, R.F., Tietema, A. (Eds.), NITREX. Forest Ecology andManagement 71, 153–161.
Emmett, B.A., Reynolds, B., Silgram, M., Sparks, T.H., Woods, C., 1998. The con-sequences of chronic nitrogen additions on N cycling and soilwater chemistry ina Sitka spruce stand, North Wales. In: Wright, R.F., Rasmussen, L. (Eds.), TheWhole Ecosystem Experiments of the NITREX and EXMAN Projects. ForestEcology and Management 101, 165–175.
Fang, J.Y., Chen, A.P., Peng, C.H., Zhao, S.Q., Ci, L.J., 2001. Changes in forest biomasscarbon storage in China between 1949 and 1998. Science 292, 2320–2322.
Fang, Y.T., 2006. Effects of nitrogen deposition on soil nitrogen processes inDinghushan forests. Dissertation, South China Botanical Garden, the ChineseAcademy of Science, Guangzhou (in Chinese with English abstract).
Fang, Y.T., Mo, J.M., Peng, S.L., Li, D.J., 2003. Role of forest succession on carbonsequestration of forest ecosystems in lower subtropical China. Acta EcologicaSinica 23, 1685–1694 (in Chinese with English abstract).
Fang, Y.T., Gundersen, P., Mo, J.M., Zhu, W.X., 2008. Input and output of dissolvedorganic and inorganic nitrogen in subtropical forests of South China under highair pollution. Biogeosciences 5, 339–352.
Fang, Y.T., Zhu, W.X., Mo, J.M., Zhou, G.Y., Gundersen, P., 2006. Dynamics of soilinorganic nitrogen and their responses to nitrogen additions in three subtro-pical forests, south China. Journal of Environmental Sciences-China 18, 752–759.
Fisk, M.C., Zak, D.R., Crow, T.R., 2002. Nitrogen storage and cycling in old- andsecond-growth northern hardwood forests. Ecology 83, 73–87.
Guan, L.L., Zhou, G.Y., Zhang, D.Q., Liu, J.X., Zhang, Q.M., 2004. Twenty years oflitterfall dynamics in subtropical evergreen broad-leaved forests at the Din-ghushan forest ecosystem research station. Acta Phytoecologica Sinica 28, 449–456 (in Chinese with English abstract).
Gundersen, P., 1998. Effects of enhanced nitrogen deposition in a spruce forest atKlosterhede, Denmark, examined by NH4NO3 addition. In: Wright, R.F., Ras-mussen, L. (Eds.), The Whole Ecosystem Experiments of the NITREX and EXMANProjects. Forest Ecology and Management 101, 251–268.
Gundersen, P., Emmett, B.A., Kjønaas, O.J., Koopmans C.J., Tietema, A., 1998. Impactof nitrogen deposition on nitrogen cycling in forest: a synthesis of NITREX data.
In: Wright, R.F., Rasmussen, L. (Eds.), The Whole Ecosystem Experiments of theNITREX and EXMAN Projects. Forest Ecology and Management 101, 37–55.
Hagedorn, F., Schleppi, P., Bucher, J., Fluhler, H., 2001. Retention and leaching ofelevated N deposition in a forest ecosystem with Gleysols. Water, Air, and SoilPollution 129, 119–142.
Hall, S.J., Matson, P.A., 2003. Nutrient status of tropical rain forests influences soil Ndynamics after N additions. Ecological Monographs 73, 107–129.
He, J.H., Chen, Z.Q., Liang, Y.A., 1982. The soil of Ding Hu Shan. Tropical andSubtropical Forest Ecosystem 1, 25–38 (in Chinese with English abstract).
Huang, Z.F., Fan, Z.G., 1982. The climate of Ding Hu Shan. Tropical and SubtropicalForest Ecosystem 1, 11–23 (in Chinese with English abstract).
Huang, Z.L., Ding, M.M., Zhang, Z.P., Yi, W.M., 1994. The hydrological processes andnitrogen dynamics in a monsoon evergreen broad-leafed forest of Dinghu shan.Acta Phytoecologica Sinica 18, 194–199 (in Chinese with English abstract).
Jefts, S., Fernandez, I.J., Rustad, L.E., Dail, D.B., 2004. Decadal responses in soil Ndynamics at the Bear Brook Watershed in Maine, USA. Forest Ecology andManagement 189, 189–205.
Li, D.J., Wang, X.M., Mo, J.M., Sheng, G.Y., Fu, J.M., 2007. Soil nitric oxide emissionsfrom two subtropical humid forests in south China. Journal of GeophysicalResearch 112, D23302, doi:10.1029/2007JD008680.
Liu, G.S., Jiang, N.H., Zhang, L.D., 1996. Soil Physical and Chemical Analysis andDescription of Soil Profiles. Standards Press of China, Beijing (in Chinese).
Lohse, A.L., Matson, P.A., 2005. Consequences of nitrogen additions for soilprocesses and solution losses from wet tropical forests. Ecological Applica-tions 15, 1629–1648.
Lovett, G.M., Likens, G.E., Buso, D.C., Driscoll, C.T., Bailey, S.W., 2005. The biogeo-chemistry of chlorine at Hubbard Brook, New Hampshire, USA. Biogeochemistry72, 191–232.
MacDonald, J.A., Dise, N.B., Matzner, E., Armbruster, M., Gundersen, P., Forsius, M.,2002. Nitrogen input together with ecosystem nitrogen enrichmentpredict nitrate leaching from European forests. Global Change Biology 8,1028–1033.
Magill, A.H., Aber, J.D., Currie, S.S., Nadelhoffer, K.J., Martin, M.E., McDowell, W.H.,Melillo, J.M., Steudler, P., 2004. Ecosystem response to 15 years of chronicnitrogen additions at the Harvard Forest LTER, Massachusetts, USA. In: Aber, J.D.(Eds.), The Harvard Forest (USA) Nitrogen Saturation Experiment: Results fromthe First 15 Years. Forest Ecology and Management 196, 7–28.
Magill, A.H., Downs, M.R., Nadelhoffer, K.J., Hallett, R.A., Aber, J.D., 1996. Forestecosystem response to four years of chronic nitrate and sulfate additions to BearBrooks watershed, Maine, USA. Forest Ecology and Management 84, 29–37.
Matson, P.A., McDowell, W.H., Townsend, A.R., Vitousek, P.M., 1999. The globaliza-tion of N deposition: ecosystem consequences in tropical environments. Bio-geochemistry 46, 67–83.
McDowell, W.H., Magill, A., Aitkenhead-Peterson, J.A., Aber, J.D., Merriam, J.L.,Kaushal S.S., 2004. Effects of chronic nitrogen amendment on dissolved organicmatter and inorganic nitrogen in soil solution. In: Aber, J.D. (Eds.), The HarvardForest (USA) Nitrogen Saturation Experiment: Results from the First 15 Years.Forest Ecology and Management 196, 29–41.
Mo, J.M., Brown, S., Xue, J.H., Fang, Y.T., Li, Z.A., 2006. Response of litter decom-position to simulated N deposition in disturbed, rehabilitated and matureforests in subtropical China. Plant and Soil 282, 135–151.
Mo, J.M., Zhang, D.Q., Huang, Z.L., Yu, F., Kong, G.H., 2000. Distribution pattern ofnutrient elements in plants of Dinghushan lower subtropical evergreen broad-leaved forest. Journal of Tropical and Subtropical Botany 8, 198–206 (in Chinesewith English abstract).
Mo, J.M., Brown, S., Lenart, M.T., Kong, G.H., 1995. Nutrient dynamics of a human-impacted pine forest in a MAB reserve of subtropical China. Biotropica 27,290–304.
Mo, J.M., Peng, S.L., Brown, S., Kong, G.H., Fang, Y.T., 2004. Nutrient dynamics inresponse to harvesting practices in a pine forest of subtropical China. ActaPhytoecologica Sinica 28, 810–822 (in Chinese with English abstract).
Mo, J.M., Fang, Y.T., Zhang, D.Q., Kong, G.H., Fen, Z.N., 2002. Effects of rainfallreallocation on nutrient dynamic of a pine forest in Dinghushan. Guihaia 22,529–533 (in Chinese with English abstract).
Moldan, F., Kjønaas, O.J., Stuanes, A.O., Wright, R.F., 2006. Increased nitrogen inrunoff and soil following 13 years of experimentally increased nitrogen deposi-tion to a coniferous- forested catchment at Gardsjon, Sweden. EnvironmentalPollution 144, 610–620.
Nadelhoffer, K.J., Emmett, B.A., Gundersen, P., Kjnaas, O.J., Koopmans, C.J.,Schleppi, P., Tietema, A., Wright, R.F., 1999. Nitrogen deposition makes aminor contribution to carbon sequestration in temperature forests. Nature398, 145–148.
Pregitzer, K.S., Zak, D.R., Burton, A.J., Ashby, J.A., MacDonald, N.W., 2004. Chronicnitrate additions dramatically increase the export of carbon and nitrogen fromnorthern hardwood ecosystems. Biogeochemistry 68, 179–197.
Simek, M., Cooper, J.E., 2002. The influence of soil pH on denitrification: progresstowards the understanding of this interaction over the last 50 years. EuropeanJournal Soil Science 53, 345–354.
Venterea, R.T., Groffman, P.M., Verchot, L.V., Magill, A.H., Aber, J.D., Steudler, P.A.,2003. Nitrogen oxide gas emissions from temperate forest soils receiving long-term nitrogen inputs. Global Change Biology 9, 346–357.
Vitousek, P.M., 1984. Litterfall, nutrient cycling, and nutrient limitation in tropicalforests. Ecology 65, 285–298.
Vitousek, P.M., Reiners, W.A., 1975. Ecosystem succession and nutrient retention-hypothesis. BioScience 25, 376–381.

Y. Fang et al. / Forest Ecology and Management 257 (2009) 332–342342
Wang, Z., He, D., Song, S., Chen, D., Tu, M., 1982. The vegetation of DinghushanBiosphere Reserve. Tropical and Subtropical Forest Ecosystem 1, 77–141 (inChinese with English abstract).
Wen, D.Z., We, I.P., Kong, G.H., Ye, W.H., 1999. Production and turnover rate of fineroots in two lower subtropical forest sites at Dinghushan. Acta PhytoecologicaSinica 23, 361–369 (in Chinese with English abstract).
Wolf, I., Brumme, R., 2003. Dinitrogen and nitrous oxide formation in beech forestfloor and mineral soils. Soil Science Society of America Journal 67, 1862–1868.
Yu, Q.F., Wen, D.Z., Zhang, D.Q., 1998. Long-term monitoring of the lower sub-tropical evergreen broad-leaved forest in Dinghushan Biosphere Reserve (VIII)Biological cycle of nutrient elements in the community of Castanopsis chinensis,Cryptocarya concinna. Tropical and Subtropical Forest Ecosystem 8, 53–63 (inChinese with English abstract).
Zhang, W., Mo, J.M., Zhou, G.Y., Yu, G.R., Fang, Y.T., Li, D.J., Lu, X.K., Wang, H., 2008.Emissions of nitrous oxide from three tropical forests in southern
China in response to simulated nitrogen deposition. Plant and Soil 306,221–236.
Zhang, Y.M., Zhou, G.Y., Wen, D.Z., Zhang, D.Q., Zhang, Q.M., 2002. Biomassdynamics of the Castanopsis chinensis-Schima superba-Cryptocarya concinnacommunity of monsoon evergreen broad-leaved forest in Dinghushan Reserve.Tropical and Subtropical Forest Ecosystem 9, 10–17 (in Chinese with Englishabstract).
Zheng, X.H., Fu, C.B., Xu, X.K., Yan, X.D., Huang, Y., Han, S.H., Hu, F., Chen, G.X., 2002.The Asian nitrogen cycle case study. Ambio 31, 79–87.
Zhou, G.Y., Yan, J.H., 2001. The influence of region atmospheric precipitationcharacteristics and its element inputs on the existence and development ofDinghushan forest ecosystems. Acta Ecologica Sinica 21, 2002–2012 (in Chinesewith English abstract).
Zhou, G.Y., Liu, S.G., Li, Z.A., Zhang, D.Q., Tang, X.L., Zhou, C.Y., Yan, J.H., Mo, J.M.,2006. Old-growth forests can accumulate carbon in soils. Science 314, 1417.