Nitrogen budget and gaseous nitrogen loss in a tropical agricultural watershed
15
SYNTHESIS AND EMERGING IDEAS Nitrogen budget and gaseous nitrogen loss in a tropical agricultural watershed Natsuki Yoshikawa Sho Shiozawa Ardiansyah Received: 22 January 2007 / Accepted: 18 October 2007 / Published online: 8 November 2007 Ó Springer Science+Business Media B.V. 2007 Abstract Although agricultural systems in tropical monsoon Asia play a central role in the global nitrogen (N) cycle, details of the N cycle in this region on a watershed scale remain unclear. This study quantified the N budget in a tropical watershed of 221 km 2 on Java Island, where paddy fields cover 28% of the land, by conducting field surveys. The amount of net biochemical gaseous N loss to the atmosphere (X GB ), which is generally difficult to determine, was calculated as the residual of the N balance. Assuming that NH 3 volatilization balances deposition, and hence subtracting NH 4 –N from the N import with atmospheric deposition, the average total import and export of N per year was found to be 46.5 kg ha -1 year -1 over the watershed. Of this, 71% was imported as fertilizer (M F ) and 29% with atmospheric deposition (M AD ). On the export side, 42% was lost as X GB , 37% with incineration of rice residues and wood fuel (X GI ), 13% with river discharge (X D ) and 9% with rice surplus export (X R ). A large portion of X GB , and consequently, a small portion of X D could be explained by the high rate of denitrification resulting from the high temperature and humid climate, and are thought to be common features of tropical watersheds where paddy fields are found. Keywords Nitrogen budget Tropical watershed Gaseous nitrogen loss Denitrification NH 3 volatilization Introduction Human activities have considerably altered the global cycle of nitrogen (N) through artificial N fixation and mobilization. The most substantial human-induced perturbation of the N-cycle is attributed to agricul- tural activities, with exponentially increasing production and application of fertilizer (Schlesinger 1992; Gundersen et al. 1994; Vitousek et al. 1997; Downing et al. 1999; Galloway et al. 1995). Agricultural systems in tropical monsoon Asia play a central role in the global N cycle. Since the green revolution of the 1970s, this region has been experiencing the most rapid agricultural moderniza- tion in the world. N fertilizer consumption has increased approximately 8-fold since 1970, and today N. Yoshikawa (&) Research Center for Natural Hazards and Disaster Recovery, Niigata University, 8050 Ikarashi 2-no-cho, Niigata 950-2181, Japan e-mail: [email protected] S. Shiozawa Department of Biological and Environmental Engineering, The University of Tokyo, Tokyo, Bunkyo-ku, Tokyo 113-8657, Japan Ardiansyah Graduate School of Agricultural and Life Sciences, The University of Tokyo, 1-1-1 Yayoi, Bunkyo-ku, Tokyo 113-8657, Japan 123 Biogeochemistry (2008) 87:1–15 DOI 10.1007/s10533-007-9164-5
-
Upload
independent -
Category
Documents
-
view
0 -
download
0
Transcript of Nitrogen budget and gaseous nitrogen loss in a tropical agricultural watershed

SYNTHESIS AND EMERGING IDEAS
Nitrogen budget and gaseous nitrogen loss in a tropicalagricultural watershed
Natsuki Yoshikawa Æ Sho Shiozawa Æ Ardiansyah
Received: 22 January 2007 / Accepted: 18 October 2007 / Published online: 8 November 2007
� Springer Science+Business Media B.V. 2007
Abstract Although agricultural systems in tropical
monsoon Asia play a central role in the global
nitrogen (N) cycle, details of the N cycle in this
region on a watershed scale remain unclear. This
study quantified the N budget in a tropical watershed
of 221 km2 on Java Island, where paddy fields cover
28% of the land, by conducting field surveys. The
amount of net biochemical gaseous N loss to the
atmosphere (XGB), which is generally difficult to
determine, was calculated as the residual of the N
balance. Assuming that NH3 volatilization balances
deposition, and hence subtracting NH4–N from the N
import with atmospheric deposition, the average total
import and export of N per year was found to be
46.5 kg ha-1 year-1 over the watershed. Of this,
71% was imported as fertilizer (MF) and 29% with
atmospheric deposition (MAD). On the export side,
42% was lost as XGB, 37% with incineration of
rice residues and wood fuel (XGI), 13% with river
discharge (XD) and 9% with rice surplus export (XR).
A large portion of XGB, and consequently, a small
portion of XD could be explained by the high rate of
denitrification resulting from the high temperature
and humid climate, and are thought to be common
features of tropical watersheds where paddy fields are
found.
Keywords Nitrogen budget � Tropical watershed �Gaseous nitrogen loss � Denitrification �NH3 volatilization
Introduction
Human activities have considerably altered the global
cycle of nitrogen (N) through artificial N fixation and
mobilization. The most substantial human-induced
perturbation of the N-cycle is attributed to agricul-
tural activities, with exponentially increasing
production and application of fertilizer (Schlesinger
1992; Gundersen et al. 1994; Vitousek et al. 1997;
Downing et al. 1999; Galloway et al. 1995).
Agricultural systems in tropical monsoon Asia
play a central role in the global N cycle. Since the
green revolution of the 1970s, this region has been
experiencing the most rapid agricultural moderniza-
tion in the world. N fertilizer consumption has
increased approximately 8-fold since 1970, and today
N. Yoshikawa (&)
Research Center for Natural Hazards and Disaster
Recovery, Niigata University, 8050 Ikarashi 2-no-cho,
Niigata 950-2181, Japan
e-mail: [email protected]
S. Shiozawa
Department of Biological and Environmental
Engineering, The University of Tokyo, Tokyo,
Bunkyo-ku, Tokyo 113-8657, Japan
Ardiansyah
Graduate School of Agricultural and Life Sciences,
The University of Tokyo, 1-1-1 Yayoi, Bunkyo-ku,
Tokyo 113-8657, Japan
123
Biogeochemistry (2008) 87:1–15
DOI 10.1007/s10533-007-9164-5

this area represents 23% of the world consumption
(FAOSTAT 2005). Combined with the recent
increase in synthetic fertilizer use, the tropical
climatic regime experiences N cycling at a higher
rate than in temperate regions; high temperatures and
moisture result in a high turnover of biomass and
high microbial activity, leading to fast decomposition
of organic matter and fast transformation of N, and
high N exchange with the atmosphere. Abundant
precipitation also contributes to the rapid N cycle
through hydrological pathways. Despite its impor-
tance, however, the N cycle of tropical monsoon Asia
has so far been treated with great uncertainty in
studies concerned with tracing global N cycles. This
is in part due to the limited number of studies
conducted in tropical areas, and a lack of statistical
and other informative data (Matthews 1994 in the
context of atmospheric N emission; Bouwman and
Boumans 2003 in the context of hydrological N
transport).
Various studies and models have attempted to
predict the N load of rivers and lakes by dynamically
calculating the N load from each type of land use
with given parameters (e.g. Beaujouan et al. 2001;
Payaudeau 2001; Kato et al. 2002). Generally, it is
not difficult to accurately estimate or predict N input
and output due to human activities (fertilizer appli-
cation, harvest, etc.); however, N loss to the
atmosphere due to natural biochemical processes is
difficult to determine. Although N output from rivers
is easy to calculate from the river discharge and N
concentration, no-one knows how much N is lost to
the atmosphere, which may depend largely on the
climate and land use practices. If the amount of N
loss to the atmosphere due to natural processes is
significant, it will also have a major effect on
determining the N load of river water. In general,
measurements of the actual N loss to the atmosphere
at a watershed scale can only be realized by
accurately estimating all the N input and output
components in the N cycle in a watershed and
determining the residual between the two, in the case
where changes in N stock can be neglected when
compared to the amounts of input and output
components.
Various studies have conducted N budget analysis
at the watershed level in temperate regions such as
European countries and the USA, where N contam-
ination of water has long been a social issue.
However, some of these studies focus solely on the
water quality of rivers, without considering N losses
from the watershed (e.g. Smith 1977). Moreover,
many studies acknowledge N losses but are not able
to determine the detailed components, and thus fail to
quantify gaseous N loss (e.g. Roberts 1987; Bech-
mann et al. 1998; Vuorenmaa 2002; Mcisaak et al.
2004). A number of other studies have attempted to
estimate or guesstimate the flux of gaseous N loss
(mainly through denitrification) using literature val-
ues (e.g. Houston et al. 1981; Freifelder et al. 1998;
Kronvang et al. 1999; Quynh et al. 2005). However,
the main causes for the failure in estimating the
gaseous N loss in these studies resides in the nature of
the watersheds or basins. Three major sinks of N are
often identified, namely soil and groundwater storage,
biomass storage, and gaseous emission to the atmo-
sphere, but are not successfully separated.
The objective of this paper is to quantify the N
budget in a tropical watershed lined with paddy
fields, focusing specifically on the contribution of
gaseous N loss to the total N export. Factors of N
import and export were individually quantified using
various methods and available data: river water
sampling and analysis, intensive interviews with
farmers, local meteorological and hydrological data,
local and national statistical data, and analysis of
satellite remote sensing images. Among the factors
for N export, gaseous N loss is difficult to quantify on
a watershed scale, though it is expected to be
significant. In earlier studies on watershed N budgets,
large uncertainties in gaseous N loss remain due to
the lack of information on climatic, ecological and
agricultural variables (Matthews 1994; van Breemen
et al. 2002) as well as the complicated nature of N
transfer within the watershed among each contributor
of N. In this study, although the quantity of gaseous N
loss was calculated as the residual between N import
and export, we attempted to quantify this value by
obtaining accurate values of all the other components
in the N-budget. The study watershed, Cidanau
watershed, Banten province, Indonesia, is suitable
for such a study in that its hydrosphere and biosphere
are completely segmented and isolated by the outer
rim of a caldera, the geological formation of the
watershed. Therefore, N exchange between the
surrounding area and inside the watershed is limited.
These factors made calculation of the N budget of the
whole watershed simple, and hence minimized
2 Biogeochemistry (2008) 87:1–15
123

uncertainties, although the N cycle within the
watershed is complicated and difficult to specify
quantitatively.
Study area
The study was carried out in Cidanau watershed,
situated on the northwestern tip of Java island
(6�80 S–6�170 S latitude, 105�520 E–106�030 E longi-
tude), Indonesia. Western Java has a tropical
monsoon climate characterized by two pronounced
seasons, dry and rainy. The dry season extends
roughly from April to mid-October, and the rainy
season from mid-October to March. The annual mean
atmospheric temperature in Cidanau watershed is
26.5�C, and does not vary significantly throughout
the year. The mean annual precipitation during 1995–
2004 was approximately 2,600 mm fluctuating
between 1,000 and 3,900 mm.
The study watershed is a 221 km2 drainage basin
with forest (58%), paddy fields (28%) swamp forest
(5%), swamp (4%) and residential area (5%) (Fig. 1).
Satellite remote sensing analysis indicated that these
land use proportions have not been subjected to
significant changes from logging or the development
of agricultural fields since the early 1970s (Tsuyuki
et al. 2003).
Cultivated fields in the area consist predominantly
of rainfed paddy fields with a plot-to-plot irrigation
system. Although there are some minor irrigation
canals, beneficiaries of such facilities are rather
limited. The average yield per crop in this watershed,
3.2 ton ha-1 crop-1 based on our survey, is lower
than that of West Java where the average is 5.3 ton
ha-1 crop-1 (Makarim 2000); however, this low
yield is compensated for by the high crop intensity,
roughly 200% (Yoshikawa et al. 2006), owing to the
availability of water.
The watershed was originally a caldera of the
Danau volcanic complex, bounded by a caldera rim
and adjacent high volcanic terrain. Because of this
unique topography, not only the hydrosphere but also
the biosphere is well segmented and isolated, thus
restricting transportation of agricultural products
across the boundary.
The Cidanau River, which functions to drain the
entire watershed, flows out from the caldera through a
waterfall in a narrow valley located in the outer rim
of the caldera, which then flows into the Sunda Strait.
Four major tributaries join the Cidanau River, of
which two stemming rivers, the Ciomas and Cisu-
warna, flow through the Rawa Danau swamp area.
There is an intake weir owned by PT. Krakatau Tirta
Industri (hereafter referred to as KTI), the local water
supply company, located near the mouth of the
Cidanau River, from which runoff discharge is
observed on a daily basis. KTI distributes water to
all industries in Cilegon city as well as domestically
to Serang and Cilegon cities.
Materials and methods
N budget model for the Cidanau watershed
In general, mass conservation of N in any system is
described by
DS ¼ M � X ð1Þ
where M is the mass of total N import into the system
during a specified time period, X is the mass of total
0 2 4 6 81km
Watershed outlet
Springs
Paddy field
Swamp forest
Village
River
Swamp
Forest
100oE 105oE 130oE125oE120oE115oE110oE 135oE 140oE
500 1000km
0 10oS
5oS
5oN
0o
100oE 105oE 130oE125oE120oE115oE110oE 135oE 140oE
500 1000km
0 10oS
5oS
5oN
0o
Java Island
Fig. 1 Map of the Cidanau watershed
Biogeochemistry (2008) 87:1–15 3
123

N export out of the system, and DS is the change in
the mass of N within the system during the same
period. The N budget model quantifies specific
factors that compose the flow terms of M and X,
and storage changes of DS in the watershed.
According to our field survey, we considered a N
budget model for the study watershed that lists the
pathways of N import into and export from the
watershed, as presented in Fig. 2.
Total N import into the watershed (M) consisted of
two factors, chemical fertilizer input (MF) and
atmospheric deposition (MAD) consisting of wet
deposition (MWD) and dry deposition (MDD). In the
study watershed, chemical fertilizer is applied in the
form of urea only for rice growing in paddy fields,
while crops in upland fields received very little
fertilizer. Therefore, MF could be determined from
the total area of cultivated paddy fields in a year in
the watershed and the amount of fertilizer input per
unit area of paddy field per crop cultivation.
For the term of atmospheric deposition (MAD), the
value of wet deposition (MWD) was determined as the
product of the total nitrogen (TN) concentration and
the amount of precipitation in a year, excluding NH4–
N content and including nitrate and organic N
content, from the result of rainfall water analysis.
NHþ4 content in rainfall was excluded from MWD
because we assumed that all NH4–N content in rain is
returned as NH3 volatized from the watershed; hence,
it should not be counted as N input when determining
the N budget in the whole watershed. This point will
be discussed later.
The measurement of dry deposition (MDD) was not
conducted in this study. However, we attempted to
specify its value using the proportion of wet and dry
N depositions observed in West Java cited from the
literature.
Total N export (X), on the other hand, was
considered to occur in four forms, namely riverine
transport (XD), export of rice produced in the
watershed (XR), gaseous N loss attributed to inciner-
ation of crop residues (XGI), and net gaseous N loss
attributed to biochemical processes (XGB).
XD was calculated from the product of the TN
concentration of river water and discharge at the
watershed outlet. XR is N export represented by the
sale of rice outside the watershed. Rice production is
more than self-sufficient in this watershed, and rice
surplus to that consumed by the residents is exported.
Two terms represent gaseous N loss to the
atmosphere, XGI and XGB. XGI results from the
incineration of biomass or anthropogenic processes.
Most farmers burn crop residues such as rice straw
and hull as waste from paddy fields and rice mills.
The N content of these residues is released into the
atmosphere through combustion processes mostly as
N oxide (NO) and N dioxide (NO2), often referred to
as NOx. Incineration of woodfuel is another process
included in XGI.
XGB, on the other hand, represents net gaseous N
loss due to biochemical processes, and may be
composed of two biological processes: denitrification,
which positively contributes to XGB, and biological N
fixation, which negatively contributes to XGB. XGB is
Outside the watershed
Inside the watershed
Fertilizer (MF)
Export of Surplus rice (XR)
River discharge (XD)
HumanLive Stock
Fish
etsaW
deeF
etsaW
dooF
FoodHuman
Live Stock
Fish
etsaW
deeF
etsaW
dooF
Food
N trade between inside and outside the watershed
N transfer within the watershed
N trade between inside and outside the watershed
N transfer within the watershed
Biochemical Gaseous N Loss
Gaseous N Loss (Incineration) (XGI)
Farmland River
Biological N Fixation
Net Biochemical Gaseous N Loss (XGB)
-Wet Dep. (MWD)
Atmospheric Deposition
+ Wet Dep. (MWD)
Wet Dep. (MWD)
Atmospheric Deposition Atmospheric Deposition
+ Dry Dep. (MDD )
Fig. 2 The N budget model
of the study watershed
4 Biogeochemistry (2008) 87:1–15
123

a net value of N2 gas exchange between the
watershed and atmosphere and was not directly
measured but determined as the residual between
the sum of N import and measurable N export terms.
N transport and transformation occurring inside the
watershed through human activity is very compli-
cated, as shown in Fig. 2, with several pathways of N
transfer involving humans, livestock/fish, and farm-
land/river. About 100,000 people residing inside the
watershed rely on the area for food and subsequently
exhaust N, as do the thousands of cattle, goats, and
chickens. It is essentially very difficult to comprehend
all these N transfers since no reliable statistical data
for calculating them exist. Nevertheless, the N budget
model could be simplified here owing to the charac-
teristics of the study watershed, i.e. when solely
considering the trade between the watershed and the
outside world. That is, according to our survey, this
watershed is basically self-sufficient with respect to
food and feed. Moreover, rice production is more than
enough to feed the entire population of the watershed,
and hence no rice is imported. Furthermore, livestock
including cattle, chickens, sheep and goats are grazed
in and around villages, and no commercial feed is
used. Feed for fish in fish breeding ponds is also
provided from within the watershed making use of
locally produced crop residues. Consequently, all crop
and animal products produced in the watershed,
except for the fractional rice export, are consumed
within the watershed, and therefore, have no effect on
the N balance of the area. As a result, human N
transport between the watershed and the outside world
occurs only in the form of fertilizer import, rice
surplus export and incineration of crop residues and
wood fuel.
When conditions of the watershed that affect M or
X (population, fertilizer application, land use/cover,
etc.) have become almost constant for a considerable
time period, N flow reaches an almost steady state.
That is, DS in Eq. 1 becomes much smaller than the
flow terms of M and X in the long-term, with M and X
being almost proportional to time while DS can only
fluctuate seasonally. Thus, M and X become balanced
and Eq. 1 is reduced to
M ¼ X ð2ÞWhile we maintain that Eq. 2 is the basic condition
of the watershed, evaluation of DS will be discussed
later.
Field survey and data for calculating N-budget
Six field surveys were conducted between 2003 and
2005. All consisted of collecting river water samples,
measuring discharge rates at each sampling point,
collecting ground truth data for satellite remote
sensing analysis, and interviewing randomly selected
farmers with regard to the acreage of their paddy field
holding, the quantity of N fertilizer application, and
treatment of rice residues.
River water samples were obtained from a total of
87 locations throughout the watershed on different
days with various water discharge rates. Total N was
determined using a Shimadu Total N Analyzer, and
NO�3 NO�2 and NHþ4 concentrations using a Hitachi
ion chromatograph in our laboratory.
All annual data for the N budget model were
consistently calculated based on the water year
defined as the 12-month period from September 1
through August 31 of the following year, since
typically the lowest stable river water flows occur
between August and September, in mid dry season.
Daily precipitation data between 1995 and 2004 at
rain stations in and around the watershed were
obtained from the Water Resources Management
Agency (BPSDA), Serang office, Banten province,
Indonesia. Representative daily precipitation over the
entire watershed was then calculated using data from
the four rain stations closest to the watershed, and
weight-averaged by applying the Thiessen polygon
method. The annual bulk precipitation of the
watershed in a certain water year t (Pt) is represented
by the sum of daily precipitation in year t multiplied
by the watershed acreage (here: 220 km2).
We used the Cidanau River daily flow data for
1995 through 2004 water years measured by KTI at
the pumping station, which is located at the outlet of
the watershed (Fig. 1), to determine daily and annual
water volumes for the watershed.
Gross acreage of paddy field under cultivation
(GPA) is a crucial measure for calculating the N
budget because it is necessary for determining MF, XR
and XGI. However, in the present study, we were not
able to obtain reliable statistical data. Estimating
GPA is not easy in tropical regions where tempera-
tures are high and constant all year round, and rice
can be sown and grown throughout the year, thus
making triple cropping feasible as long as water is
available. In fact, GPA in the watershed varies widely
Biogeochemistry (2008) 87:1–15 5
123
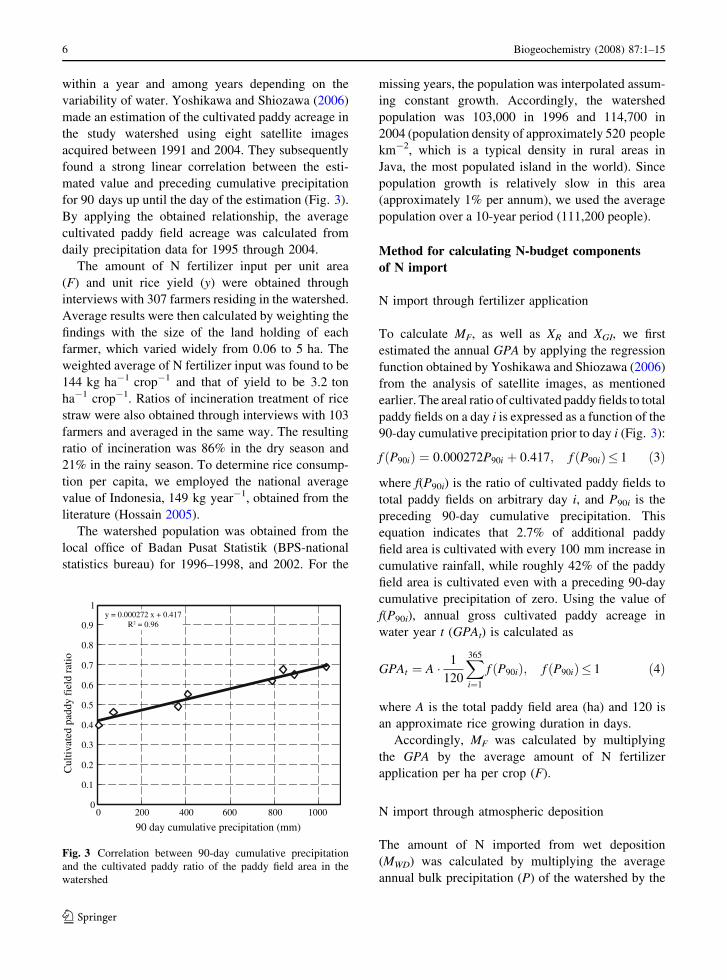
within a year and among years depending on the
variability of water. Yoshikawa and Shiozawa (2006)
made an estimation of the cultivated paddy acreage in
the study watershed using eight satellite images
acquired between 1991 and 2004. They subsequently
found a strong linear correlation between the esti-
mated value and preceding cumulative precipitation
for 90 days up until the day of the estimation (Fig. 3).
By applying the obtained relationship, the average
cultivated paddy field acreage was calculated from
daily precipitation data for 1995 through 2004.
The amount of N fertilizer input per unit area
(F) and unit rice yield (y) were obtained through
interviews with 307 farmers residing in the watershed.
Average results were then calculated by weighting the
findings with the size of the land holding of each
farmer, which varied widely from 0.06 to 5 ha. The
weighted average of N fertilizer input was found to be
144 kg ha-1 crop-1 and that of yield to be 3.2 ton
ha-1 crop-1. Ratios of incineration treatment of rice
straw were also obtained through interviews with 103
farmers and averaged in the same way. The resulting
ratio of incineration was 86% in the dry season and
21% in the rainy season. To determine rice consump-
tion per capita, we employed the national average
value of Indonesia, 149 kg year-1, obtained from the
literature (Hossain 2005).
The watershed population was obtained from the
local office of Badan Pusat Statistik (BPS-national
statistics bureau) for 1996–1998, and 2002. For the
missing years, the population was interpolated assum-
ing constant growth. Accordingly, the watershed
population was 103,000 in 1996 and 114,700 in
2004 (population density of approximately 520 people
km-2, which is a typical density in rural areas in
Java, the most populated island in the world). Since
population growth is relatively slow in this area
(approximately 1% per annum), we used the average
population over a 10-year period (111,200 people).
Method for calculating N-budget components
of N import
N import through fertilizer application
To calculate MF, as well as XR and XGI, we first
estimated the annual GPA by applying the regression
function obtained by Yoshikawa and Shiozawa (2006)
from the analysis of satellite images, as mentioned
earlier. The areal ratio of cultivated paddy fields to total
paddy fields on a day i is expressed as a function of the
90-day cumulative precipitation prior to day i (Fig. 3):
f ðP90iÞ ¼ 0:000272P90i þ 0:417; f ðP90iÞ� 1 ð3Þ
where f(P90i) is the ratio of cultivated paddy fields to
total paddy fields on arbitrary day i, and P90i is the
preceding 90-day cumulative precipitation. This
equation indicates that 2.7% of additional paddy
field area is cultivated with every 100 mm increase in
cumulative rainfall, while roughly 42% of the paddy
field area is cultivated even with a preceding 90-day
cumulative precipitation of zero. Using the value of
f(P90i), annual gross cultivated paddy acreage in
water year t (GPAt) is calculated as
GPAt ¼ A � 1
120
X365
i¼1
f ðP90iÞ; f ðP90iÞ� 1 ð4Þ
where A is the total paddy field area (ha) and 120 is
an approximate rice growing duration in days.
Accordingly, MF was calculated by multiplying
the GPA by the average amount of N fertilizer
application per ha per crop (F).
N import through atmospheric deposition
The amount of N imported from wet deposition
(MWD) was calculated by multiplying the average
annual bulk precipitation (P) of the watershed by the
y = 0.000272 x + 0.417R2 = 0.96
0
0.1
0.2
0.3
0.4
0.5
0.6
0.7
0.8
0.9
1
0 200 400 800600 1000
90 day cumulative precipitation (mm)
Cul
tivat
ed p
addy
fie
ld r
atio
Fig. 3 Correlation between 90-day cumulative precipitation
and the cultivated paddy ratio of the paddy field area in the
watershed
6 Biogeochemistry (2008) 87:1–15
123

sum of the average NO3–N and organic N concen-
trations of rainfall samples, or TN minus the NHþ4component contained in rainfall samples assuming
that all the NH3 volatilized from the watershed is
redeposited onto the watershed.
To estimate the value of dry deposition (MDD), we
employed a proportion of wet and dry N deposition
cited from the literature. Fortunately, Gillett et al.
(1999) have estimated dry deposition at two sites
(Jakarta and Bogor) located in West Java, of which the
Bogor site has a similar wet N deposition value to that
we measured, a similar climate (average annual
precipitation of 3,000 mm) to our study area and
similar land use as their observatory station is
surrounded by paddy field. According to their study,
wet deposition of NO�3 –N was estimated to be
12.7 kg N ha-1 year-1 (NO�3 : 49 meq m-2 year-1),
and dry deposition of NO2–N to be 2.8 kg N ha-1 y-1
(NO�2 : 20 meq m-2 year-1) and HNO3 to be 1.1 kg
N ha-1 year-1 (HNO�3 : 8 meq m-2 year-1). The pro-
portion of dry deposition was 24% in the total
atmospheric deposition. Another experimental study,
conducted in a rural area in Japan during the warm and
rainy season, also demonstrates a similar proportion of
26% (Hayashi et al.). From these studies, it is plausible
that the dry N deposition in our study site contributes
approximately one-quarter to the total atmospheric N
deposition. Although there is very little information on
organic N in dry deposition, we assumed that the same
proportion of organic N is deposited.
Components of N export
N export through river discharge
River water samples were collected at the outlet of the
watershed five times with different discharges.
Although daily river discharge data were available,
TN concentration data were limited to those measured
at the time of our field surveys. Since the TN
concentration of river water is likely to vary depending
on the river discharge, we related the sampled TN
concentrations with the river discharge rate on the day
the samples were obtained, as shown in Fig. 4, to
estimate the daily TN concentration from the daily
discharge; the TN concentration decreases with increas-
ing discharge. The annual N load exported through river
discharge (XD) at the outlet of the watershed was then
calculated by multiplying the daily river discharge (Qi)
on day i by the TN concentration of day i, which was
estimated from the daily river discharge using the
regression function (TNOUTi(Qi)) in Fig. 4:
XD ¼X
Qi � TNOUTiðQiÞ ð5Þ
The resulting average TN concentration (XD=P
Qi)
was 0.44 mg l-1. Although the number of water
samples collected from the outlet for calculation of
the TN concentration was limited, we believe that this
average TN concentration is sufficiently reliable.
Instead of conducting frequent field surveys, we
chose to conduct intensive and extensive sampling of
199 river samples from 87 locations throughout the
watershed during six surveys conducted in both dry
and rainy seasons, including immediately after the
start of the latter. The average TN concentration was
0.46 mg l-1 with a minimum value of 0.04 mg l-1
and maximum of 1.12 mg l-1 (Fig. 5). More than
70% of the samples had a TN concentration between
0.2 and 0.6 mg l-1.
N export through rice sales
N contained in exported rice (XR) was calculated as
XR ¼ ðYR � CRÞ0:07=5:95 ð6Þ
where YR is the amount of rice produced, CR is rice
consumption by the residents of the watershed,
0.00
0.20
0.40
0.60
0.80
1.00
1.20
1.40
0.00 5.00 10.00 15.00 20.00
River discharge(m-3s-1)(Qi)
Lgm( noitartnecnoc
NT
1-()
NT
iT
UO
)
TNOUTi(Qi) = 1.68/Qi
Fig. 4 Relationship between river discharge and the TN
concentration at KTI pumping station. Points represent the
observed data and the curve the regression function
Biogeochemistry (2008) 87:1–15 7
123

0.07 (g/g) is the approximate protein content of
milled rice, and 5.95 is the protein/N conversion
factor (FAO/WHO 1973). YR was found as a product
of GPA and the rice yield of the watershed (y), and CR
as a product of the watershed population and the
average consumption of rice per capita in Indonesia (c).
N loss due to incineration of crop residues
and wood fuel
Most farmers in the watershed burn rice straw to ease
tillage and control rice stem rot following the harvest
of rice during the dry season. However, they plough
the residues back into the paddled paddy fields
or leave them on levies during the rainy season.
According to interviews with 103 randomly selected
farmers, 85% of the rice straw is burned during the
dry season and 21% during the rainy season. All the
rice hulls are also burned regardless of the season.
Hull weight represents approximately 16% of milled
rice, and its N content ranges from 0.43% to 0.55%
with an average of 0.49% at 14% moisture (Juliano
et al. 1985).
The N harvest index (NHI), which is defined as the
ratio of the N content in grains to the total N content
of the plant above ground level, ranges from 53% to
60% with a mean value of 56% for tropical rice (Ying
et al. 1998). In other words, approximately 44% of
the N in an entire plant is contained in rice straw. The
proportion of gross rice production in the dry season
and rainy season was calculated to be approximately
50% for each between 1996 and 2004. The dry season
is one month longer than the rainy season but
cultivation intensity is higher in the latter. Therefore,
N losses through incineration of rice straw (XRS ) and
rice hulls (XRH ) were calculated as
XRS ¼ ðYR � 0:07=5:95Þ � ð1� NHIÞNHI
� ðIRD þ IRRÞ2
ð7ÞXRH ¼ YUR � 0:16 � 0:0049 ð8Þ
where YR and YUR are the total production of milled
rice and that of unhulled rice, respectively, NHI is the
N harvest index, IRD and IRR are the ratios of rice
straw incineration in the dry and wet seasons,
respectively, and 0.0049 (g/g) is the N content of
rice hull.
Another component of N loss due to incineration
is domestic incineration of wood fuel. In rural areas
in Indonesia, people still use wood fuel for cooking,
and in the watershed, the wood fuel they burn is
collected from nearby local villages. According to
the results of an extensive survey of rural West Java
by Soesastro (1984), wood fuel consumption per
capita (cWF) was estimated to be 679 kg year-1
(1.86 kg day-1) on average. Since the typical N
content of wood is 0.2–0.3% with an average of
0.25% (Ludwig et al. 2003), annual gaseous N loss
through wood fuel consumption in the study
watershed was calculated as
XWF ¼ 0:0025cWF � POP ð9ÞThus, the total gaseous N loss through human
activity relating to incineration was determined as the
sum of three components: XRS, XRH and XWF.
N export through net gaseous loss attributed
to biochemical processes
The net gaseous N loss due to natural biochemical
processes, XGB, was obtained as the residual of all
other components of N import and N export that were
quantitatively identified. This was calculated as the
difference between total N import (M) and the sum of
N export through river discharge (XD), surplus rice
sales (XR), and gaseous N loss attributed to residue
incineration (XGI).
0
5
10
15
20
25
30
35
00.0
21.0
42.0
63.0
84. 0
06.0
27. 0
48.0
69. 0
80. 1TN concentration
Freq
uenc
y
Fig. 5 TN concentrations of the river water samples (199
samples collected at 84 locations)
8 Biogeochemistry (2008) 87:1–15
123

Result
Table 1 shows the values of all variables used for
calculating the watershed N budget, and Fig. 6
demonstrates the N flow per ha per year, which was
obtained by dividing the N import and export values
in Table 1 by the area of the watershed (22,100 ha).
The values depending on river discharge data or
rainfall data are presented as 9-year averages for the
1995–2004 water years.
On the import side, N fertilizer application (MF)
constitutes a major contributing factor at 33.1 kgN
ha-1 year-1 or approximately 71% of the total N
import into the watershed. The remainder can be
explained by atmospheric deposition (MAD), contrib-
uting to 13.4 kgN ha-1 year-1 or approximately
29%, of which wet deposition (MWD) and dry
deposition (MDD) are 10.7 kgN ha-1 year-1 (23%)
and 2.7 kgN ha-1 year-1 (6%) respectively. In
total, 46.5 kgN ha-1 year-1 is imported into the
watershed. On the export side, N export through
surplus rice sales (XR) and river discharge (XD) were
found to be relatively small at 4.0 kgN ha-1 year-1
and 5.9 kgN ha-1 year-1 or 9% and 13% of the total
Table 1 The variables used in the analysis
Variable Description Value
M Total N import 1,028 ton N year-1
MF N import through fertilizer application 731 ton N year-1
MAD N import through atmospheric deposition 297 ton N year-1
MWD N import through wet deposition 237ton N year-1
MDD N import through dry depostion 59 ton N year-1
X Total N export 1,028 ton N year-1
XD N export through river discharge 129 ton N year-1
XR N export through rice sales 89 ton N year-1
XGI N export through gaseous loss (incineration) 376 ton N year-1
XRS N export through gaseous loss (incineration of rice straw) 178 ton N y-1
XRH N export through gaseous loss (incineration of rice hulls) 29 ton N year-1
XWF N export through gaseous loss (incineration of wood fuel) 170 ton N year-1
XGB Net N export through gaseous loss (biochemical) 434 ton N year-1
A Paddy field area in the watershed 6,070 ha
GPA Annual gross cultivated paddy acreage 10,980 ha
P Annual average bulk precipitation 2,660 mm
P90i 90-day cumulative precipitation prior to day i 0–1,870 mm
F Average N fertilizer application per ha per crop 66.2 kgN ha-1 crop-1
TNP Average TN concentration of precipitation 0.75 mg l-1
TNOUT TN concentration of river water at the watershed outlet 0.32–1.28 mg l-1
Qi River discharge at the watershed outlet 0.7–79.1 m3 s-1
CR Consumption of rice by residents (milled rice) 16,570 ton year-1
C Consumption of rice per capita (milled rice) 149 kg person-1 year-1
POP Population of the watershed 111,200 persons
YR Annual average production of rice (milled rice) 23,990 ton year-1
YUR Annual average production of rice (unhulled rice) 35,800 ton year-1
Y Rice yield 3.52 ton ha-1 crop-1
NHI Nitrogen harvest index 0.56
IRD Ratio of incineration of rice straw in the dry season 0.85
IRR Ratio of incineration of rice straw in the rainy season 0.21
cWF Wood fuel consumption per capita 679 kg person-1 year-1
Biogeochemistry (2008) 87:1–15 9
123

N import, respectively. On the other hand, the
gaseous N loss attributed to incineration (XGI) was
responsible for a greater fraction of the total N export
at 17.0 kgN ha-1 year-1 or 37%, of which crop
residue incineration (XRS + XRH) accounted for
9.3 kgN ha-1 year-1 or 20%, and wood fuel incin-
eration (XWF) for 7.7 kgN ha-1 year-1 or 17%. The
residual is represented by net gaseous N loss
attributed to biochemical processes (XGB), which
accounted for an outstandingly high fraction of the
total N export, 19.6 kgN ha-1 year-1, constituting
42% of all the N exports out of the watershed.
Discussion
An important observation derived from the sampled
water in the present study was the fact that the
average TN concentration at the outlet of the
watershed (TNOUT) (0.44 mgN l-1) was lower than
that of rainfall (TNP) (0.75 mgN l-1) (Fig. 7). Since
the total discharge of water outflow from the
watershed is 45% less than the amount of total
rainfall due to evapotranspiration, the lower TN
concentration of the river water indicates that the
total amount of N that outflows from the watershed
with river water is lower than the N input with
rainfall. Consequently, N export through river dis-
charge was found to be only 13% of the total N
import. This proportion of N export through river
discharge is smaller than the results of a study in the
northeastern USA (van Breemen et al. 2002), where
N export through river discharge represented an
average of 20% of the total N input, despite the much
larger precipitation and river discharge of our study
watershed.
In general, the difference between N import and N
export represents the N stock change within a system
during the period imports and exports are accounted
for. If environmental settings of the watershed that
control the N budget have not changed greatly for a
long period, the N stock of the whole watershed, i.e.
that in biomass, soil and groundwater, can be
assumed to be in a steady state; that is, assuming
that N stock change is negligible compared with the
amount of N import and export in the long-term, then
N import and export will become balanced, or
M = X.
With respect to the biomass stock in the watershed,
forests and swamp forest, which occupy 58% and 5%
of the land cover, respectively, are responsible for the
largest percentage. The land use and cover in the
study watershed have not been appreciably altered
due to deforestation or afforestation for at least
30 years according to satellite analysis (Tsuyuki
et al. 2003), and the areal extent of forest and swamp
forest has remained constant. Consequently, these
Watershed
MF 33.1 (71%)
MWD 10.7 (23%)
MDD 2.7 (6%)
Atmos. Deposition 13.4 (29%)
M = X 46.5 (100%)
XR 4.0 (9%)
XR 4.0 (9%)
XD 5.9 (13%)
XD 5.9 (13%)
XGB 19.6 (42%)
XGB 19.6 (42%)
XGI 17.0 (37%)
XGI 17.0 (37%)
Fig. 6 Results of N flow into/out of the study area per unit
area of the watershed. Unit is kgN ha-1 year-1 representing
the average of the entire watershed (221 km2), and values in %
represent the percentage of total input. (M, total import; X, total
export; MWD, import with wet deposition; MDD, import with
dry deposition; MF, import with fertilizer; XR, export through
rice sales; XD, export through river discharge; XGI, export
through incineration; XGB, export through net biochemical
gaseous loss; obtained as the residual
0.00
0.10
0.20
0.30
0.40
0.50
0.60
0.70
0.80
All river watersamples
River water atwatershed
outlet
Water ofSprings
Rainfall water
L gm( noitartnecnoc
N1-)
Organic-N
NH4-N
NO2-N
NO3-N
Fig. 7 Average TN concentrations and the different compo-
nents. The average value of river water at the watershed outlet
was calculated on the basis of the function shown in Fig. 4.
Other values were obtained by averaging all water samples in
each category
10 Biogeochemistry (2008) 87:1–15
123

forests can be regarded as basically pristine ‘‘old-
growth’’ forests. Therefore, decomposition of bio-
mass balances production and the amount of biomass
stored in the forest is constant if there is no recent
significant change in N input.
However, it is likely that biomass production has
recently started to exceed its decomposition and the
amount of biomass stored in the forests is currently
increasing. The reason is that the TN concentration in
rainfall water and from dry deposition of ammonia
within the forests must have increased owing to
application of chemical fertilizer in surrounding
paddy fields and the recent increase in NOx in the
atmosphere due to air pollution. The rate of atmo-
spheric N deposition in the watershed is estimated to
be 23.0 kg ha-1 year-1 (including NH3), which
might have been less in the past. The significant
increase in N input in the watershed must have started
when chemical fertilizer was introduced (40–50 years
ago), but this input may have become mostly constant
for at least the last 20 years.
In tropical forest, where decomposition of organic
mater in soil is fast due to the high temperature,
organic mater in soil is mostly stored on the ground
surface. N supply with litterfall, the primary input to
the forest floor, is estimated to be 60–220 kg ha-1
year-1 in lowland tropical forest (Vitousek et al.
1986). On the other hand, basically the same rates of
decomposition of litter on the forest soil surface and
organic matter in soil should occur, resulting in the
mineralization of organic N. The mineralized N is
dissolved in soil water and taken up by roots to again
become biomass of living trees. This N cycling in soil
in tropical forests is much more rapid than in forests
in a temperate climate (Vitousek et al. 1986; Swift
et al. 1989). Therefore, even though a considerable
amount of N is stored in the soil biomass, it is likely
that the biomass and N content in soil had become a
steady state that corresponds to the increased N input
within a short period in the past, considering the high
rate of biochemical N cycling in soil in tropical
forest.
However, biomass of living trees may need a much
longer time to reach steady state after the increase in
N input, and therefore it is important to discuss.
Typically, biomass stock of living trees in a pristine
tropical rain forest is estimated to be roughly
400 tons ha-1 (Cannell 1982). Given the 0.25% of
N in such biomass, N stock is calculated to be
1,000 kgN ha-1. Therefore, the forest biomass per
unit area of the watershed on a whole is approxi-
mately 630 kgN ha-1 year-1 (63% of the land
cover). Supposing that the forest biomass is currently
increasing by a rate of 10% during 30 years, the
annual increment of N in the forests is estimated to be
about 2 kgN ha-1 (630 kgN ha-1 year-1 times 10%
divided by 30 years). This quantity is still sufficiently
small in terms of the residual in the analysis
conducted above, 19.6 kgN ha-1 year-1. Moreover,
the presumption of a 10% increase in biomass stock
during 30 years may be higher than reality for the
trees of the ‘‘old-growth’’ forest. Thus, N stock
change in biomass in these forests is likely to be
negligible in terms of explaining the residual amount.
However, the actual rate of N stock change in forest
is uncertain.
Let us examine the changes in the amounts of
inorganic N stored in soil, water and soil solid in an
absorbed form in the forest compartment of the
watershed. Annual average downward water flux in
the bottom of the root zone (annual precipitation
minus evapotranspiration) is about 1,200 mm year-1
while the infiltration flux at the soil surface is about
2,600 mm year-1 (annual precipitation). If we
assume the volumetric water content of the root zone
is 0.5 and that N exists only within soil water, then
the 1,200 mm year-1 water flux can displace N in a
2.4 m thick soil layer in 1 year. Here we assume a
large capacity of absorption, for example, ten times
of N can change in whole soil including the absorbed
form of N (mainly NHþ4 ) with the change in N
concentration in the soil water (a retardation factor of
10 is assumed for solute movement in soil). Even in
this example, N stored in the 2.4 m layer is displaced
and reaches a steady state within 10 years. This
calculation indicates that inorganic N stored in forest
soil is mostly in steady state owing to the large
downward water flux.
On the soil surface in forest, there is a layer of
accumulated organic matter where the rate of
decomposition of the organic matter must be high
because of the high temperature in a tropical climate,
and therefore the rate of oxygen consumption is high.
This condition should cause the subsoil (near the
surface) to deoxidize and a suitable condition for
denitrification exist. NHþ4 and NH3 deposited from
the atmosphere or N mineralized from an organic
form may turn to NO�3 (nitrification) in the surface
Biogeochemistry (2008) 87:1–15 11
123
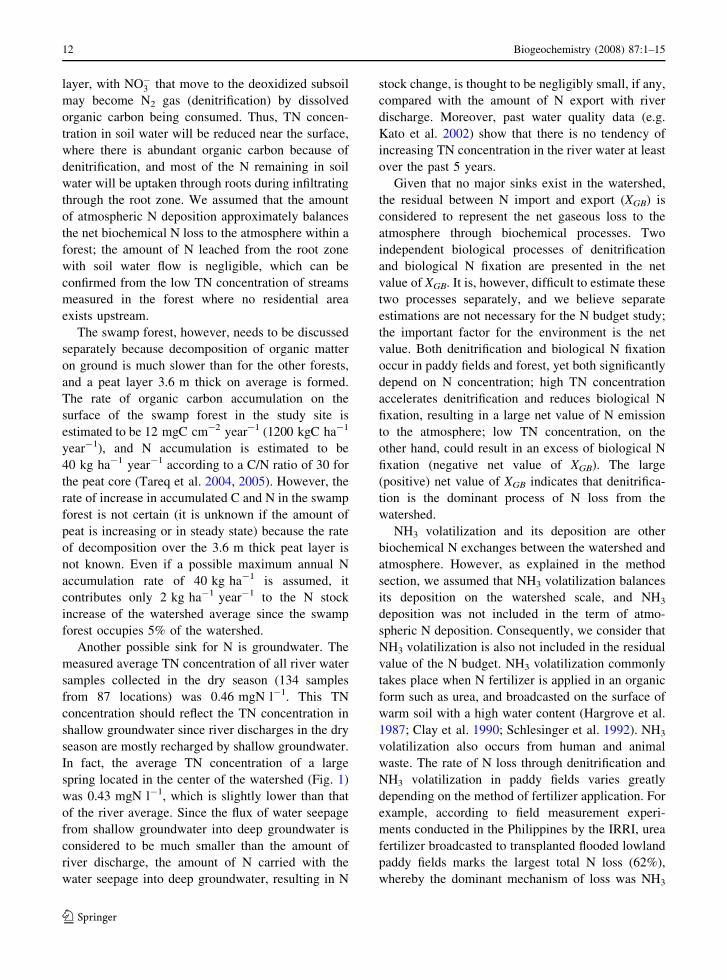
layer, with NO�3 that move to the deoxidized subsoil
may become N2 gas (denitrification) by dissolved
organic carbon being consumed. Thus, TN concen-
tration in soil water will be reduced near the surface,
where there is abundant organic carbon because of
denitrification, and most of the N remaining in soil
water will be uptaken through roots during infiltrating
through the root zone. We assumed that the amount
of atmospheric N deposition approximately balances
the net biochemical N loss to the atmosphere within a
forest; the amount of N leached from the root zone
with soil water flow is negligible, which can be
confirmed from the low TN concentration of streams
measured in the forest where no residential area
exists upstream.
The swamp forest, however, needs to be discussed
separately because decomposition of organic matter
on ground is much slower than for the other forests,
and a peat layer 3.6 m thick on average is formed.
The rate of organic carbon accumulation on the
surface of the swamp forest in the study site is
estimated to be 12 mgC cm-2 year-1 (1200 kgC ha-1
year-1), and N accumulation is estimated to be
40 kg ha-1 year-1 according to a C/N ratio of 30 for
the peat core (Tareq et al. 2004, 2005). However, the
rate of increase in accumulated C and N in the swamp
forest is not certain (it is unknown if the amount of
peat is increasing or in steady state) because the rate
of decomposition over the 3.6 m thick peat layer is
not known. Even if a possible maximum annual N
accumulation rate of 40 kg ha-1 is assumed, it
contributes only 2 kg ha-1 year-1 to the N stock
increase of the watershed average since the swamp
forest occupies 5% of the watershed.
Another possible sink for N is groundwater. The
measured average TN concentration of all river water
samples collected in the dry season (134 samples
from 87 locations) was 0.46 mgN l-1. This TN
concentration should reflect the TN concentration in
shallow groundwater since river discharges in the dry
season are mostly recharged by shallow groundwater.
In fact, the average TN concentration of a large
spring located in the center of the watershed (Fig. 1)
was 0.43 mgN l-1, which is slightly lower than that
of the river average. Since the flux of water seepage
from shallow groundwater into deep groundwater is
considered to be much smaller than the amount of
river discharge, the amount of N carried with the
water seepage into deep groundwater, resulting in N
stock change, is thought to be negligibly small, if any,
compared with the amount of N export with river
discharge. Moreover, past water quality data (e.g.
Kato et al. 2002) show that there is no tendency of
increasing TN concentration in the river water at least
over the past 5 years.
Given that no major sinks exist in the watershed,
the residual between N import and export (XGB) is
considered to represent the net gaseous loss to the
atmosphere through biochemical processes. Two
independent biological processes of denitrification
and biological N fixation are presented in the net
value of XGB. It is, however, difficult to estimate these
two processes separately, and we believe separate
estimations are not necessary for the N budget study;
the important factor for the environment is the net
value. Both denitrification and biological N fixation
occur in paddy fields and forest, yet both significantly
depend on N concentration; high TN concentration
accelerates denitrification and reduces biological N
fixation, resulting in a large net value of N emission
to the atmosphere; low TN concentration, on the
other hand, could result in an excess of biological N
fixation (negative net value of XGB). The large
(positive) net value of XGB indicates that denitrifica-
tion is the dominant process of N loss from the
watershed.
NH3 volatilization and its deposition are other
biochemical N exchanges between the watershed and
atmosphere. However, as explained in the method
section, we assumed that NH3 volatilization balances
its deposition on the watershed scale, and NH3
deposition was not included in the term of atmo-
spheric N deposition. Consequently, we consider that
NH3 volatilization is also not included in the residual
value of the N budget. NH3 volatilization commonly
takes place when N fertilizer is applied in an organic
form such as urea, and broadcasted on the surface of
warm soil with a high water content (Hargrove et al.
1987; Clay et al. 1990; Schlesinger et al. 1992). NH3
volatilization also occurs from human and animal
waste. The rate of N loss through denitrification and
NH3 volatilization in paddy fields varies greatly
depending on the method of fertilizer application. For
example, according to field measurement experi-
ments conducted in the Philippines by the IRRI, urea
fertilizer broadcasted to transplanted flooded lowland
paddy fields marks the largest total N loss (62%),
whereby the dominant mechanism of loss was NH3
12 Biogeochemistry (2008) 87:1–15
123
volatilization (47%) and denitrification was relatively
small (15%) (Buresh et al. 1990). NH3 volatilization
mostly occurs within one week of broadcasting urea
(Fillery et al. 1986). Furthermore, the total N loss
was smaller with the basal incorporation method
(50%); the dominant mechanism being denitrification
(33%) instead of NH3 volatilization (17%). This
suggests that substantial NH3 volatilization occurs
in paddy fields in the study watershed where urea
fertilizer is customarily broadcast after transplanta-
tion of rice.
However, gaseous N generated by the two pro-
cesses, NH3 volatilization and denitrification,
behaves differently. Volatilized NH3 redeposits into
places around the source of volatilization mostly
within several hours or days (Howorth et al. 1996;
Jordan et al. 1996; Boyer et al. 2002; Mcisaac 2004);
it simply diffuses around the source. Mountain areas
covered by forest in a watershed with surrounding
paddy field areas may be a major sink of volatilized
NH3. The relatively high NH4–N concentration (46%
of the TN in the rain water samples) is a possible
reason for redeposition of NH3. Moreover, consider-
ing the inflow of NH3 gas from neighboring areas
outside the watershed as well as outflow from the
watershed, net flow of NH3 gas from the watershed to
the outside should represent only a small portion of
the NH3 volatilization from paddy fields and resi-
dential areas. This is the reason why we assumed
NH3 volatilization balances with its deposition and
did not include it in import nor export terms.
In contrast to NH3 volatilization and deposition,
denitrification emits N ultimately into the atmosphere
(N fixation is not a serial process of denitrification but
an independent process). Therefore, we regard the
resulting value of XGB as predominantly representing
the amount of denitrification in excess to biological N
fixation. This biological net N emission into the
atmosphere is estimated to be more than three times
the N export through river discharge.
High temperatures encourage denitrification, as
well as most biochemical process involving soil
microbes. The average atmospheric temperature in
Indonesia is 26�C, which is roughly 11�C higher than
the Japan average for example. Generally, a 10�C
increase in temperature increases the rate of bio-
chemical reactions within microorganisms 2- or 3-
fold (Campbell et al. 1998), and the same is true for
denitrification. Anaerobic conditions such as flooding
of paddy fields also induce denitrification. High N
loss may therefore be occurring within the watershed
due to the high temperatures and high precipitation of
the climate. The low TN concentration of the river
water (about one quarter of rivers in paddy areas of
Japan), in spite of considerable fertilizer input, is
thought to be the result of a high rate of denitrifica-
tion in the paddy fields and over the whole watershed.
It is roughly estimated that 35% of the total net
biological N loss within the watershed takes place in
the paddy area and 65% in forest. The high rate of
denitrification and low rate of N outflow with river
water flow observed in the study area are thought to
be common features of tropical paddy areas.
In the past, when no chemical fertilizer was
applied and no air pollution due to industry or cars
existed, biological N fixation must have been the
major N input into the watershed and it exceeded
denitrification (especially in paddy fields); the excess
of N fixation might balance the sum of the other N
export terms of river water flow, rice exports, and
atmospheric N emission due to incineration of rice
residue and wood fuel. However, nowadays, chemical
fertilizer application and air pollution have made the
watershed N-rich and the increased TN concentration
over the watershed has decreased biological N
fixation and increased both denitrification and N flow
with river water. Apparently, denitrification has
overwhelmed biological N fixation and become the
dominant process of N loss from this agricultural
watershed.
Conclusion
The major achievement of this study is that it
clarified, for the first time, all components of the N
cycle with good confidence in a tropical watershed in
which the predominant land use is paddy fields. The
finding of the dominance of net gaseous N emission
in the N cycle is particularly worth noting. Biochem-
ical net gaseous N emissions can be assessed as a
residual of the N budget and, therefore, are reliable
only when all other components of the N budget are
accurately accounted for.
This study successfully quantified the net gaseous
N loss. Consequently, it was clarified that the net
gaseous N loss due to natural biological processes
(denitrification) dominates more than 40% of the total
Biogeochemistry (2008) 87:1–15 13
123

N export (and total N import), while N export with
riverine transport represents only one-tenth of the
total N export. Therefore, denitrification occurring in
the watershed is thought to be the major factor
determining the N load of river water. This outcome
is mainly due to the environment of the watershed,
which is characterized by a predominance of paddy
fields, high atmospheric temperatures and abundant
precipitation representative of the tropical climate.
Acknowledgements This work was part of the Cooperative
Project between the University of Tokyo and Bogor
Agricultural University (IPB), the Core University Program
of ‘‘Harmonization between development and environmental
conservation in biological production’’, and was financially
supported by the Japanese Society for the Promotion of Science
(JSPS). We are grateful to Prof. Budi I. Setiawan, IPB, for his
support in our field survey.
References
Bechmann M, Eggestad HO, Vagstad N (1998) Nitrogen bal-
ances and leaching in four agricultural catchments in
southeastern Norway. Environ Pollut 102:493–499
Beaujouan V, Durand P, Ruiz L (2001) Modelling the effect of
the spatial distribution of agricultural practices on nitro-
gen fluxes in rural catchments. Ecol Model 137:93–105
Buresh RJ, De Datta SK (1990) Denitrification losses from
puddle rice soils in the tropics. Biol Fertil Soils 9:1–13
Bouwman AF, Boumans LJM (2002) Estimation of global NH3
volatilization loss from synthetic fertilizers and animal
manure applied to arable lands and grasslands. Global
Biogeochem Cycles 16(2):GB1080. doi:10. 1029/
2000GB001389
Boyer EW, Goodale CL, Jaworski NA, Howarth RW (2002)
Anthropogenic nitrogen sources and relationships to
riverine nitrogen export in the northeastern U.S.A. Bio-
geochemistry 57/58:137–169
Campbell GS, Norman JM (1998) An introduction to envi-
ronmental biophysics, 2nd edn. Springer-Verlag, New
York
Cannell MGR (1982) World forest biomass and primary pro-
duction data. Academic press, London
Clay DE, Malzer GL, Anderson JL (1990) Ammonia volatili-
zation from urea as influenced by soil temperature, soil
water content and nitrification and hydrolysis inhibitors.
Soil Sci Soc Am J 54(1):263–266
Downing JA, McClain M, Twilley R, Melack JM, Elser J,
Rabalais NN, Lewis WM Jr, Turner RE, Corredor J, Soto
D, Yanez-Arancibia A, Kopaska JA, Howarth RW (1999)
The impact of accelerating land-use change on the N-
cycle of tropical aquatic ecosystems: current conditions
and projected changes. Biogeochemistry 46:109–148
FAOSTAT (2005) FAO statistical databases, accessible
through the food and agriculture organization of the
United Nations, http://faostat.fao.org/
FAO/WHO (1973) Energy and protein requirements: report of
a joint FAO/WHO ad hoc expert committee. WHO
Technical Report 522, Geneva. Switzerland
Fillery IRP, De Datta SK (1986) Ammonia volatilization from
Nitrogen source applied to rice fields: I. Methodology,
ammonia flux, and nitrogen-15 loss. Soil Sci Soc Am J
50:80–86
Freifelder RR, Smith SV, Bennett RH (1998) Cows, humans
and hydrology in the nitrogen dynamics of a grazed rural
watershed. J Environ Manage 52:92–111
Galloway JN, Schlesinger WH, Levy II H, Michaels A, Sch-
noor JL (1995) Nitrogen fixation: anthropogenic
enhancement-environmental response. Global Biogeo-
chem Cycles 9:235–252
Gillett RW, Ayers GP, Selleck PW, Mhw T, Harjanto H (2000)
Concentrations of nitrogen and sulfur species in gas and
rainwater from six sites in Indonesia. Water Air Soil
Pollut 120:205–215
Gundersen P, Bashkin V (1994) Nitrogen cycling. In: Moldan
B, Cerny J (eds) Biogeochemistry of small catchments: a
tool for environmental research SCOPE report. Wiley and
Sons, Chichester, pp 255–283
Hargrove WL, Bock BR, Raunikar RA, Urban WJ (1987)
Comparison of a forced-draft technique to nitrogen-15
recovery for measuring ammonia volatilization under field
conditions. Soil Sci Soc Am J 51:124–128
Hossain M (2005) Global rice economy: long-term perspec-
tives. In: FAO (ed) Proceedings of the FAO rice
conference, rice in global markets. FAO, Rome, pp 1–7
Houston JA, Brooker MP (1981) A comparison of nutrient
sources and behaviour in two lowland subcatchmens.
Water Res 15(1):49–57
Howarth RW, Billen G, Swaney D, Townsend A, Jaworski N,
Lajtha K, Downing JA, Elmgren R, Caraco N, Jordan T,
Berendse F, Freney J, Kudeyarov V, Murdoch P, Zhao-
Liang Z (1996) Regional nitrogen budgets and riverine N,
P fluxes for the drainage to the North Atlantic Ocean:
natural and human influences. Biogeochemistry 35:75–139
Jordan TE, Weller DE (1996) Human contributions to terres-
trial nitrogen flux. Bioscience 46:655–664
Juliano BO, Bechtel DB (1985) The rice grain and its gross
composition. In: Juliano BO (ed) Rice chemistry and
technology. American association of cereal chemists. 2nd
edn. St. Paul, Minnesota, pp 17–57
Kato T, Soumura H, Goto A (2002) Water quality forecast
model of Cidanau Watershed, Indonesia, for water man-
agement planning. Rural Environ Eng 43:3–12
Kronvang B, Hoffmann CC, Svesden LM, Windolf J, Jensen
JP, Dorge J (1999) Retention of nutrients in river basins.
Aquatic Ecol 33:29–40
Ludwig J, Marufu LT, Huber B, Andreae MO, Helas G. (2003)
Domestic combustion of biomass fuels in developing
countries: a major source of atmospheric pollutants. J
Atmos Chem 44(1):23–37
Makarim AK (2000) Bridging the rice yield gap in Indonesia
In: Papademetriou MK, Dent FJ, Herath EM (eds)
Bridging the rice yield gap in the Asia-Pacific region.
FAO Publication, Bangkok, pp 112–121
Matthews E (1994) Nitrogenous fertilizers: global distribution
of consumption and associated emissions of nitrous oxide
and ammonia. Global Biogeochem Cycles 8:411–439
14 Biogeochemistry (2008) 87:1–15
123

Mcisaak GF, Hu X (2004) Net N input and riverine N export
from Illinois agricultural watersheds with and without
extensive tile drainage. Biogeochemistry 70:251–271
Payraudeau S, Tournoud MG, Cernesson F, Picot B (2001)
Annual nutrients export modelling by analysis of landuse
and topographic information: case of a small Mediterra-
nean catchment. Water Sci Technol 44(2–3):321–327
Quynh LTP, Billen G, Garnier J, Thery S, Fezard C (2005)
Nutrient (N, P) budgets for the Red River basin (Vietnam
and China). Global Biogeochem Cycles 19:GB2022. doi:
10.1029/2004GB002405
Roberts G (1987) Nitrogen inputs and outputs in a small
agricultural catchement in the eastern part of the United
Kingdom. Soil Use Manage 3(4):148–154
Schleisinger WH, Hartley AE (1992) A global budget for
atmospheric NH3. Biogeochemistry 15:191–121
Smith RV (1977) Domestic and agricultural contributions to
the inputs of phosphorus and nitrogen to Lough Neagh.
Water Res 11:453–459
Swift MJ, Anderson JM (1989) Decomposition. In: Lieth H,
Werger MJA (eds) Tropical rain forest ecosystems, bio-
geographical and ecological studies, ecosystems of the
world 14B. Elsevier science publishers, Amsterdam, pp
547–569
Soesastro MH (1984) Policy analysis of rural household energy
needs in West Java. In: Islam MN, Morse R, Soesastro
MH (eds) Rural energy to meet development needs: Asian
village approaches. Westview Press Inc., Boulder, pp 89–
134
Tsuyuki S, Baba A (2003) Detecting land use change using
remote sensing in Cidanau watershed, Indonesia. In:
Hayashi Y, Manuwoto S, Hartono S (eds) Sustainable
agriculture in rural Indonesia. Gadjah Mada University
Press, Yogyakarta
Tareq SM, Tanaka N, Ohta K (2004) Biomaker signature in
tropical wetland: lignin phenol vegetation index (LPVI)
and its implications for reconstruction the paleoenviron-
ment. Sci Total Environ 324:91–103
Tareq SM, Tanoue E, Tsuji H, Tanaka N, Ohta K (2005)
Hydrocarbon and elemental carbon signatures in a tropical
wetland: biogeochemical evidence of forest fire and veg-
etation changes. Chemosphere 59:1655–1665
Vitousek PM, Sanford RL (1986), Nutrient cycling in moist
tropical forest. Ann Rev Ecol Syst 17:137–167
Vitousek PM, Aber JD, Howarth RW, Likens GE, Matson PA,
Schindler DW, Schlesinger WH, Tilman DG (1997)
Human alteration of the global nitrogen cycle: sources and
consequences. Ecol Appl 7(3):737–750
van Breemen N, Boyer EW, Goodale CL, Jaworski NA,
Paustian K, Seitzinger SP, Lajtha K, Mayer B, Van Dam
D, Howarth RW, Nadelhoffer KJ, Eve M, Billen G (2002)
Where did all the nitrogen go? Fate of nitrogen inputs to
large watersheds in the northeastern U.S.A. Biogeo-
chemistry 57/58:267–293
Vuorenmaa J, Rekolainen S, Lepisto A, Kenttamies K, Kaup-
pila P (2002) Losses of nitrogen and phosphorus from
agricultural and forest areas in Finland during the 1989s
and 1990s. Environ Monit Assess 76:213–248
Ying J, Peng G, Zhou N, Visperas RM, Cassman KG (1998)
Comparison of high-yield rice in tropical and subtropical
environments II. Nitrogen accumulation and utilization
efficiency. Field Crops Res 57:85–93
Yoshikawa N, Shiozawa S (2006) Estimating variable acreage
of cultivated paddy fields from preceding precipitation in
a tropical watershed utilizing Landsat TM/ETM. Agric
Water Manage 85(3):296–304
Biogeochemistry (2008) 87:1–15 15
123