Marys River Watershed Preliminary Assessment
158
Marys River Watershed Preliminary Assessment Prepared by Ecosystems Northwest Corvallis, OR for The Marys River Watershed Council Philomath, OR April 1999 Contributing authors Tasks Kim Mattson Project management / Fish and wildlife John Runyon History Sam Fernald Water quality Andy Gallagher Soils Rebecca Johnson Social Kai Snyder GIS Scott Eden Fish and wildlife Robert Zybach History
-
Upload
khangminh22 -
Category
Documents
-
view
5 -
download
0
Transcript of Marys River Watershed Preliminary Assessment

Marys River Watershed
Preliminary Assessment
Prepared by
Ecosystems NorthwestCorvallis, OR
for
The Marys River Watershed CouncilPhilomath, OR
April 1999
Contributing authors Tasks
Kim Mattson Project management / Fish and wildlife
John Runyon History
Sam Fernald Water quality
Andy Gallagher Soils
Rebecca Johnson Social
Kai Snyder GIS
Scott Eden Fish and wildlife
Robert Zybach History

ii Marys River Preliminary Watershed Assessment Ecosystems Northwest
Table of Contents
ACKNOWLEDGEMENTS................................................................................................................V
INTRODUCTION AND PURPOSE OF THIS DOCUMENT................................................................. 1
CHAPTER 1: WATERSHED CHARACTERIZATION ........................................................................ 2
LOCATION.................................................................................................................................... 2THE W EST SLOPE OF THE WILLAMETTE BASIN................................................................................... 2THREE CHARACTERISTIC AREAS...................................................................................................... 2LAND USE, OWNERSHIP, AND POPULATION....................................................................................... 4SUB-BASINS WITHIN THE WATERSHED............................................................................................... 5
CHAPTER 2: HISTORICAL CONDITIONS ......................................................................................11
THE KALAPUYAN LANDSCAPE: PRE-COLUMBIAN–1845.......................................................................11AMERICAN PIONEERS: 1846–1879 .................................................................................................14TRANSITION TO MODERN TIMES: 1880–1940 ...................................................................................16SUMMARY ...................................................................................................................................19
CHAPTER 3: WATER QUALITY AND QUANTITY ..........................................................................20
WATER QUALITY BACKGROUND......................................................................................................20WHAT IS THE 303(D) LIST? ............................................................................................................24MARYS RIVER WATERS ON 303(D) LIST...........................................................................................25MARYS RIVER WATER QUALITY ......................................................................................................25MUDDY CREEK AND TRIBUTARIES WATER QUALITY ...........................................................................30ROCK CREEK WATER QUALITY.......................................................................................................33OTHER RELEVANT WATER QUALITY STUDIES IN THE W ILLAMETTE BASIN ..............................................36WITHDRAWALS ............................................................................................................................36GROUNDWATER QUALITY ..............................................................................................................40SUMMARY ...................................................................................................................................41
CHAPTER 4: AQUATIC AND TERRESTRIAL HABITAT .................................................................42
FISH DIVERSITY AND SENSITIVE SPECIES .........................................................................................42FISH-BEARING WATERS.................................................................................................................48STREAM CONDITIONS....................................................................................................................48CULVERTS AND FISH BARRIERS......................................................................................................54RIPARIAN ZONES AND W ETLANDS ...................................................................................................56SENSITIVE, NON-FISH SPECIES ......................................................................................................57SUMMARY ...................................................................................................................................62
CHAPTER 5: SOIL QUALITY AND LAND HEALTH ........................................................................63
SOIL GROUPS..............................................................................................................................63LOSS OF PRODUCTIVE LANDS TO URBAN DEVELOPMENT ....................................................................63SOIL EROSION AND DELIVERY TO STREAMS......................................................................................64MASS EROSION............................................................................................................................65FACTORS INFLUENCING SOIL EROSION............................................................................................66STREAMBANK EROSION.................................................................................................................68SEDIMENT SOURCES AND DELIVERY................................................................................................69FERTILIZERS AND PESTICIDES ........................................................................................................70FOREST ROADS ...........................................................................................................................71LIVESTOCK..................................................................................................................................73GOVERNMENT PROGRAMS TO AID WATERSHED MANAGEMENT............................................................74SUMMARY ...................................................................................................................................74
CHAPTER 6: SOCIOCONOMICS ...................................................................................................76
ECONOMIC CHARACTERISTICS........................................................................................................76

Ecosystems Northwest Marys River Preliminary Watershed Assessment iii
POPULATION GROWTH AND DEVELOPMENT PRESSURES.....................................................................83RECREATIONAL RESOURCES AND USE IN THE MARYS RIVER WATERSHED.............................................86SUMMARY ...................................................................................................................................87
CHAPTER 7: PRIORITIZATION OF ISSUES AND RECOMMENDATIONS.......................................89
HISTORICAL ................................................................................................................................89WATER QUALITY AND QUANTITY .....................................................................................................89AQUATIC AND TERRESTRIAL HABITAT ..............................................................................................90SOILS.........................................................................................................................................90SOCIAL AND ECONOMIC CONDITIONS...............................................................................................91RECOMMENDATIONS.....................................................................................................................92ADDITIONAL ASSESSMENTS TO REMOVE UNCERTAINTIES....................................................................92MONITORING TO TRACK PROBLEMS AND ASSESS CHANGE..................................................................93PROJECTS TO ENHANCE WATERSHED CONDITION AND FUNCTION........................................................93EDUCATION AND ADVOCACY ..........................................................................................................93
APPENDIX 1: ANNOTATED BIBLIOGRAPHY, CARTO-BIBLIOGRAPHY, AND RELATED INTERNETRESOURCES................................................................................................................................95
ANNOTATED BIBLIOGRAPHY ...........................................................................................................95CARTO-BIBLIOGRAPHY ................................................................................................................114INTERNET SITES .........................................................................................................................116
APPENDIX 2: PHOTOS ...............................................................................................................118
PHOTO 3A: 1937 AERIAL PHOTO OF THE CONFLUENCE OF MARYS RIVER AND MUDDY CREEK. ................118PHOTO 3B: 1956 AERIAL PHOTO OF THE CONFLUENCE OF MARYS RIVER AND MUDDY CREEK . ...............118PHOTO 3C: 1994 ORTHOPHOTO OF THE CONFLUENCE OF MARYS RIVER AND MUDDY CREEK. ................118PHOTO 4 : A CONTROVERSIAL PHOTO ABOUT WHETHER SALMON EVER USED THE MARYS RIVER.............119
APPENDIX 3: FIGURES NOT IMBEDDED IN TEXT ......................................................................120
FIGURE 3-1: 1852 GENERAL LAND OFFICE SURVEY MAP, OAK CREEK................................................120FIGURE 3-2: 1853 GENERAL LAND OFFICE SURVEY MAP, LOWER MARYS RIVER. .................................121FIGURE 3-3: 1859 CADASTRAL MAP FOR TOWNSHIP 12 SOUTH, RANGE 5 WEST..................................122FIGURE 3-4: LOCATION OF HISTORIC MILL SITES AND LOGGING RAILROADS.........................................123FIGURE 3-5: RELATIONSHIP OF IMPERVIOUS SURFACES TO ENVIRONMENTAL CONDITION. .......................124FIGURE 3-6: 1996 CITY OF PHILOMATH WETLANDS INVENTORY. ........................................................125FIGURE 3-7: WATER QUALITY FOR BEAVER CREEK. .........................................................................126FIGURE 3-8: WATER QUALITY FOR OLIVER CREEK. ..........................................................................127FIGURE 3-9: WATER QUALITY FOR MUDDY CREEK. ..........................................................................128
APPENDIX 4: HYDROLOGY........................................................................................................129
SECTION 1: HYDROLOGIC FLOW DATA FOR THE MARYS RIVER. ..........................................................129SECTION 2: MARYS RIVER SEGMENTS ON 303(D) LIST. ....................................................................130SECTION 3: DEQ WATER QUALITY DATA ........................................................................................133
APPENDIX 5: GEOLOGY AND SOILS .........................................................................................136
SECTION 1: GEOLOGY ................................................................................................................136SECTION 2: EIGHT SOIL GROUPS OF THE MARYS RIVER WATERSHED.................................................139
APPENDIX 6: CONDITIONS OF SELECTED SENSITIVE SPECIES ..............................................143
AMPHIBIANS AND REPTILES..........................................................................................................143BIRDS.......................................................................................................................................143MAMMALS.................................................................................................................................145
APPENDIX 7: GIS AND OTHER MAPS - EACH MAP IS A SEPARATE FILE...............................146
GIS METADATA SOURCES...........................................................................................................147

iv Marys River Preliminary Watershed Assessment Ecosystems Northwest
List of Maps in Appendix 7 Each Map is a Separate File(starting on page 146)
Map 1: Three areas of the watershed: Forested Uplands, Valley Floor, and Urban.
Map 2: Land use.
Map 3: Land ownership.
Map 4: Urban growth boundaries, wetlands, and 303(d) listed waters.
Map 5: Population density.
Map 6: Sub-watersheds.
Map 7: Watershed area in Benton County.
Map 8: Extent of 1996 floods.
Map 9: Pre-settlement vegetation (1850).
Map 9a: 1850 vegetation types in riparian areas of the lower Marys River.
Map 9b: 1997 vegetation types in riparian areas of the lower Marys River.
Map 9c: 1994 USGS digital orthophotos of riparian areas of the lower Marys River.
Map 10: 303(d) listed reaches.
Map 11: Distribution of stocked runs of winter steelhead.
Map 12: Upper extent of fish distribution and stream size classifications.
Map 13: Distribution of stocked runs of coho salmon.
Map 14: Stream reaches where ODFW aquatic habitat surveys have been performed.
Map 15: Riparian vegetation classification along ODFW surveyed stream reaches.
Map 16: 1852 and 1986 vegetation of the Willamette River.
Map 17: 1990 vegetation types.
Map 18: Wetlands.
Map 19: Soil types.
Map 20: Geology.

Ecosystems Northwest Marys River Preliminary Watershed Assessment v
Acknowledgements
Ecosystems Northwest would like to thank the following people who generouslyprovided information or improved this assessment. Many are cited as personalcommunication or provided reviews or other documentation.
Sandra Coveny, Marys River Watershed CouncilRandy Gould, Salem BLMJim Fairchild, residentVan Hunsaker, City of PhilomathMary Naughton, Finley Wildlife RefugeCarl Bond, OSU Professor, retiredChip Hill, OSU fish museumSteve Jacobs, ODFWKim Jones, ODFW, CorvallisSteve Mamoyac, ODFW, CorvallisPaul Scheerer, ODFW, CorvallisDave Buchanan, ODFW. CorvallisSue Ross, City of CorvallisMark Wade, ODFW, SpringfieldDoug Cottam, ODFW, CorvallisRuss Anderson, ODF, PhilomathGordon Reeves, PNW USFS, CorvallisChris Humpke, ODF, PhilomathGary Galovich, ODFW, CorvallisCedric Cooney, ODFWS. DiGiacomo, BLM non-vascular surveyorJohn Plissner, Audubon Society of Corvallis Christmas Bird Count ProgramNelley Stark, watershed residentBobby Taylor, watershed residentDan Sternadel, watershed residentJohn Deming, Benton CountyDoug Sachinger, Benton CountyChip Andrus, ManTech/EPAJeff Mitchell, Philomath High SchoolAmy Schoener, watershed residentEd Radke, Greenberry Irrigation DistrictDan O’Brien, watershed residentJeff Spencer, Natural Resources Conservation Service, TangentFrank Morris, Small Woodlands OwnerMaggie Livesay, OSU ExtensionMark Mellbye, OSU ExtensionRick Fletcher, OSU ExtensionGene Pirelli, OSU ExtensionJim Hecker, NRCSCynthia McArthur, Benton SWCDMathew Fillmore, NRCS

vi Marys River Preliminary Watershed Assessment Ecosystems Northwest
Karen Strohmeyer, Cascade RC& DKaren Bennett, USFSJanet Ohmann, USFSBill Power, BLMGary Blanchard, Starker ForestsJesse Ford, Marys River Watershed CouncilBill Pearcy, Marys River Watershed CouncilKathryn Staley, NRCS and OSUStephen Griffith, ARSEd Styskel, Ecological Services, Inc.Gregg Pettit, DEQMike Anderson DEQBill Ferber, WRDBob Wilson, Benton CountyCharlotte Haynes, OSUChuck Harmon, ODABob Metzger, USFSRandy Kugler, City of PhilomathDale Crum, City of PhilomathKeith Mills, ODFK. McCall, USFSR. Nall, ODFD. Lysne, OSU Research ForestHolly George,Susan Kocher,Phil Heneghan,Ann Rogers.
Renee Davis-Born provided editing assistance that improved the readability of thedocument. Remaining errors are our own.
Additional people helped whose names are not included above. We alsoacknowledge them.

Ecosystems Northwest Marys River Preliminary Watershed Assessment 1
INTRODUCTION AND PURPOSE OF THIS DOCUMENT
This document is the product of a preliminary watershed assessment for the MarysRiver Watershed. The purpose of the document is to describe what is known aboutthe condition of the Marys River Watershed, and to present a list of prioritized issuesfor the Marys River Watershed Council for their use in the development of strategiesfor further assessment and subsequent watershed protection and restoration. Theassessment examined land use history, water quality, aquatic and terrestrial habitats,soil conditions, and social and economic conditions. The assessment followed theguidance provided by the Oregon Watershed Assessment Manual (NonPointSolutions 1998) where practical. In some instances, diversions were made from theAssessment Manual based on discussions and direction from the technical steeringcommittee of the Council. Examples of divergence includes the addition of a chapteron social or economic conditions, inclusion of upslope conditions such as soil erosionprocesses, and the initiation of an annotated bibliography. This assessment, ingeneral, did not collect new data, did not perform channel typing, and did not performaerial photographic assessments of riparian zones. The main focus of theassessment was a synthesis of existing data sets and studies pertaining to the MarysRiver Watershed to provide a better picture of the watershed at this point in time.
An eight-person team performed the assessment with assistance and guidance by thetechnical steering committee. The assessment consisted of three phases. During thefirst phase, a set of issues was identified for the assessment. Presentations weremade to the Marys River Watershed Council, discussions were held with the steeringcommittee, and a facilitated public meeting was held at the Greenberry Grange duringDecember 1998. Input from these activities, together with guidance from theAssessment Manual, was used to produce and prioritize a set of issues. The secondphase consisted of seeking out and gathering existing data pertaining to the MarysRiver Watershed. Data was gathered from government files, aerial photos, GIS maps,unpublished reports and data sets, published literature, theses and dissertations, andfrom consultations with experts from government agencies, research organizations,and residents and others with background knowledge of the basin. The gathered datais largely represented in the annotated bibliography at the end of this document. Thethird phase consisted of constructing a synthesis of the current picture of watershedhealth and assembling the data into a series of figures, GIS maps, photographs, andtables that comprise this document.
In the remainder of this document, the Marys River Watershed is described in terms ofchapters on: 1) watershed characterization, 2) history of human use, 3) water qualityand quantity, 4) aquatic and terrestrial habitats, 5) soils, and 6) social and economicconsiderations. A final chapter presents a prioritized list of issues derived from theprevious six chapters on watershed condition. This list is used to present a set ofrecommended strategies for the Watershed Council in the final chapter.
2 Marys River Preliminary Watershed Assessment Ecosystems Northwest
CHAPTER 1: WATERSHED CHARACTERIZATION
Location
The Marys River Watershed encompasses 310 square miles of forested, agricultural,and urban lands along the east side of the Coast Range in western Oregon. Thewatershed reaches to the highest point in the Coast Range, Marys Peak, at 4,200 feetelevation. Several headwater streams from the Coast Range merge into the MarysRiver, which flows into the Willamette River at the town of Corvallis at 250 feetelevation.
The West Slope of the Willamette Basin
The watershed is one of five major river systems that drains the west side of theWillamette River basin. These “westslope” rivers are quite different from the“eastslope” rivers of the Willamette Basin with respect to a number of characteristics.The westslope drainages are underlain by older geological formations of asedimentary origin, whereas eastslope drainages are commonly of a volcanic origin.Accordingly, westslope stream valleys tend to be mature, with more downcutting andlarger amounts of fine sediment than eastslope valleys. A lack of snow pack in thewestslope headwaters results in different flow patterns; these streams have sustainedhigh winter flows and periods of low flows during summer months. The elevationalextremes are less pronounced on the western slope of the Willamette Basin, andvalleys tend to be wide and flat. Also, much of the area of westslope watersheds is onthe floor of the Willamette Valley, resulting in differences in fish assemblages. Salmonare thought not to have been native to these streams. Even human settlementpatterns were probably influenced by the more accessible, flatter ground of thewestern slopes, which were preferred travel routes by early settlers in the valley. As aresult, the westslope rivers form a unique functional group within the Willamette Basin.
Three Characteristic Areas
From a hydrological, biological, and land-use perspective, the Marys River Watershedmay be considered as having three distinct areas: an upland forest area, a valleyagriculture area, and a downstream urban area (Map 1; all maps are located inAppendix 7). These distinctions may be useful to the reader as they consider theservices and functions that the streams and landscapes perform in each area. Alsoeach area has its own set of management issues and demands that are being madeon them by the landowners and the public.
The upland forest area is located in the western and northwestern portions of thewatershed, where small, relatively fast-flowing streams on forested slopes coalesceinto the headwaters of either the Marys River or Muddy Creek. These streams aregenerally cool and clear and flow over gravels and cobbles. The streams support

Ecosystems Northwest Marys River Preliminary Watershed Assessment 3
cutthroat trout, sculpins, and a variety of amphibians. The landscape is a mix ofsecond growth forests with scattered residences and small farms as shown in Photo 1.
Photo 1: Forest uplands area is composed of a mix of land uses including residences,small farms, and forests. Map 1 (Appendix 7) shows location of this photo in the TumTum sub-watershed.
Streams then enter the valley agriculture area, which is located on the floor of theWillamette Valley, of the Marys River Watershed. As these streams leave the foothillsof the Coast Range, gradient decreases and stream velocity slows. This areaincludes the Marys River near the town of Philomath and most of lower Muddy Creekbasin. The valley area was originally a mix of forests, open prairies, and seasonalwetlands. The flat landscape was formed by a series of catastrophic Pleistocenefloods that occurred in the Columbia River and back-washed fine sediment up into theWillamette Basin. Streams in the valley area are normally warm, tend flow over sandand silt sediments, and are characterized by wetland areas and wide, often hardwood-dominated riparian zones. These streams support a greater variety of warm-waterfishes such as peamouth, sand rollers, Oregon chub, dace, and redside shiners, alongwith many introduced species of fish. These streams are in close proximity to humandevelopment and often are affected by transportation crossings, drainage projects,and reduced riparian cover. This landscape is now mostly in agriculture, pastures,and scattered residences, with remnant forests as shown in Photo 2.
The downstream urban area of the Marys River begins as it enters Philomath andcontinues east, flowing through a developed landscape. This area includes a varietyof riverside parks and developed landscapes, channelization or bank stabilization, andpoint source discharges of stormwater runoff and wastewater effluent. The Marys

4 Marys River Preliminary Watershed Assessment Ecosystems Northwest
River flows through downtown Corvallis before it joins the mainstem of the WillametteRiver.
Photo 2: Valley floor area. This winter scene shows grass-seed agriculture, a fewremnant oak trees; the standing water in the field are drainage ditches. The hills tothe west are the forest uplands. Map 1 (Appendix 7) shows location of this photo inthe Muddy Creek sub-watershed.
Land Use, Ownership, and Population
Land use in the watershed also is a reflection of the three separate areas. Forestry isthe main land use in the upland zone, mixed agricultural and rural residential are themain land use type in the valley zone. The urban growth boundaries of Philomath andCorvallis represent the urban zone (Map 2).
Land ownership in the watershed falls into different patterns in each area (Map 3).Major land owners in the upland forest area consists of industrial forestry firms,Siuslaw National Forest, Bureau of Land Management, the State of Oregon, the Cityof Corvallis, and a mix of other private groups and individuals. The unincorporatedcommunities of Wren, Blodgett, Summit, and Burnt Woods are located in this area.Ownership in the valley area is diverse of types and largely private. Land holdingsinclude large-acreage grass seed farms, large-acreage Christmas tree farms, small-acreage farm enterprises that produce a variety of food and agricultural products, andrural residential homesteads. The Corvallis airport and some light industries are alsolocated in the valley area, as are Finley National Wildlife Refuge and the communitiesof Alpine and Bellfountain. The urban zone is a typical mix of businesses, residences,

Ecosystems Northwest Marys River Preliminary Watershed Assessment 5
and light industries, and includes the Oregon State University campus and the cities ofPhilomath and Corvallis (Map 4).
The population density of the watershed shows development has occurred in severalareas outside the urban growth boundaries of Philomath and Corvallis. Thedistribution of households in the watershed is shifting from rural and farm- associatedholdings to non-farm residences and developments as more people seek rural settingsfor homesites (Map 5). This shift likely has been slowed by state land-use laws thatare effective at controlling growth into lands zoned as agriculture and forestry. Yet abasic issue of concern for the Marys River Watershed is pronounced landscapemodification over a relatively short period of time. Most of the modifications are theindirect results of an increasing human population and its associated homes, roads,cities, and activities. People bring with them increased demands and uses of thewatershed.
Sub-basins within the Watershed
The Marys River Watershed is itself a sub-basin of the larger, 11,500 square milewatershed of the Willamette River. Ninety-five percent of the Marys River Watershedis within Benton County, and Small edges of the watershed fall into Lincoln, Polk andLane counties (Map 7).
The Marys River Watershed may be divided into a series of 24 smaller “sub-basins.”These sub-basins generally follow hydrologic boundaries (Map 6 and Table 1), butsome units include a series of small watersheds that do not drain into a commonstream (e.g., Wren, Blakesley Creek) or include stream segments that are parts of alarger watershed (e.g., North Muddy Creek, Middle Muddy Creek, and South MuddyCreek). Nevertheless, the 24 units are referred to here as sub-basins and provide aconvenient way to refer to areas within the larger watershed.
Sub-basins are grouped by those in the Marys River proper and those in the MuddyCreek drainage basin. About five miles upstream of the mouth, or halfway betweenCorvallis and Philomath, is the confluence of Muddy Creek and the Marys River.Muddy Creek drains 42% of the entire Marys River Watershed. During the high-flowperiods of winter, discharge from Muddy Creek can add an additional two-thirds to thevolume of the Marys River. The separate areas upstream of this junction are quitedistinct. The watershed area drained by the Marys River upstream of its confluencewith Muddy Creek is mostly upland forest area, while the lower reaches of MuddyCreek drain the valley agriculture area. These two major sub-watersheds provide aconvenient way to discuss some of the variation within the watershed.
The difference in stream gradient between the Marys River and Muddy Creek likelyresults in hydrologic and water quality differences between the two sub-basins. Asdescribed earlier, the Marys River drains the upland forest areas and has a steepgradient throughout most of its 20-mile pathway to the valley floor near Philomath.Muddy Creek and its tributaries flow steeply from their Coast Range headwaters for

6 Marys River Preliminary Watershed Assessment Ecosystems Northwest
only a few miles before flattening out on the floor of the Willamette Valley. Thelongitudinal profiles of the Marys River and Muddy Creek are contrasted inFigure 1.
Table 1: Marys River Watershed sub-basin areas and channel lengths.
Sub-basins shown on Map 6 Area (square miles) Channel length (miles)
Marys River sub-basinsUpper Marys 25.8 8.16
Norton Creek 8.7 3.18
Tum Tum River 12.5 12.09
Blakesley Creek 9.2 5.85
Oak Creek/Squaw Creek 16.8 3.48
Wren Creek (Gellatly, LaBare,Read Creeks) 6.4 2.07
Shotpouch Creek 9.9 4.83
Bark Creek 7.6 7.64
Middle Marys River 15.0 3.30
Lasky Creek 3.1 7.74
Mulkey Creek 4.4 6.03
Newton Creek 5.7 5.00
Woods Creek 9.9 4.30
Lower Marys River 8.9 10.45
Greasy Creek 37.2 13.84
Muddy Creek sub-basinsNorth Muddy Creek 18.8 4.70
Evergreen Creek 7.4 4.47
Bull Run Creek 6.5 6.10
Beaver Creek 24.6 4.77
Middle Muddy Creek 15.1 22.99
Reese Creek/Oliver Creek 27.5 4.81
Gray Creek 5.9 2.60
Hammer Creek 15.3 1.87
South Muddy Creek 7.9 7.47
TOTAL Marys River sub-basins and MarysRiver channel 181.0 41.04
TOTAL Muddy Creek sub-basins and MuddyCreek channel 129.0 32.33
GRAND TOTAL Marys River Watershed 310.0

Ecosystems Northwest Marys River Preliminary Watershed Assessment 7
Geology and Landforms
The watershed is bounded on the north, west and southwest by sloping to very steepuplands formed by volcanic, sedimentary and intrusive rocks of the northern CoastRange (Map 20). The rocks of the northern Coast Range are made up of thickvolcanic flows and tuffaceous sedimentary rock of the Eocene Siletz River Volcanics,overlain by the Flournoy sandstone (Appendix 5, Section 1). Several prominent peaksof the Coast Range, including Marys Peak, are igneous rocks that intruded these olderrocks. During the Plio-Pleistocene, streams of the Coast Range excavated theirvalleys as the Coast Range slowly rose (Baldwin 1976).
The drainage divide in the eastern part of the watershed occurs on the nearly levelalluvial and lacustrine terraces of the southern Willamette Valley. The lacustrine andalluvial deposits of the Willamette Valley terraces and floodplains are Quaternaryaged, and include old alluvium, sediments from repeated Missoula Flood eventsduring the late Pleistocene, and recent floodplain deposits. Floodplains and terracesrise stepwise from the Willamette River and its tributaries towards the foothills. Thesestepwise deposits correlate with distinctive geomorphic formations and soils (Appendix5, Section 1).
Hydrology
All streamflow in the Marys River Watershed originate from atmospheric inputs. Meanannual precipitation ranges from 40 inches per year at lower elevations to greater than
Figure 1: Longitudinal gradient profiles for Marys River and Muddy Creek
0100200300400500600700
Dist. (m
iles) 32 28 24 20 16 12 8 4
River Mile
Ele
vatio
n (f
t) Marys RiverMuddy Cr

8 Marys River Preliminary Watershed Assessment Ecosystems Northwest
100 inches per year at the highest elevations in the watershed. Long-termprecipitation records exist for Corvallis at the Marys River mouth and for Summit nearthe headwaters of the Marys River. Monthly averages of precipitation for thesestations show consistently higher precipitation at Summit’s higher elevation (Figure 2).Precipitation peaks in November through January and falls to very low amounts in Julyand August. Precipitation data for the Corvallis station from 1986-1998 show highlevels of inter-seasonal and inter-annual variability (data not shown). These data areavailable from Oregon State University via the internet (http://www.ocs.orst.edu/).
Stream discharge records are available for three stations in the Marys River Watershed:Marys River between Muddy Creek and Philomath (1941-1986), Muddy Creek at the firstroad crossing (1964-1968), and Rock Creek (1946-1952, 1975-1980). Stream stage (waterlevel height) is still being recorded for the Marys River station, but since 1986 nomeasurements have been taken to relate stage to discharge. These data are available viathe Internet from the USGS web page (http://waterdata.usgs.gov/nwis-w/OR/) or the USArmy Corps of Engineers (http://nwp71.nwp.usace.army.mil/graphics/willamette/willtrib/willtrib.html).
Figure 2: Long-term average monthly precipitation records collected near theheadwaters and mouth of the Marys River.
Data from these three stations provide a description of the stream flow from three distinctwatersheds. The Marys River discharge suggests a drainage area that is relatively largeand steep, with high peak flows in the winter and an extended period of baseflow into thespring. Analysis of the discharge averaged by month over the period of record shows
0 . 0 0
2 . 0 0
4 . 0 0
6 . 0 0
8 . 0 0
1 0 . 0 0
1 2 . 0 0
Oct Nov Dec Jan Feb
Mar Apr May Jun Jul
Aug Sep
M o n t h
Pre
cipi
tatio
n (in
ches
)
C o r v a l l i s O S U
S u m m i t

Ecosystems Northwest Marys River Preliminary Watershed Assessment 9
discharge peaking in January (Figure 3), while precipitation peaks in December. This lagbetween precipitation and discharge peaks results from a combination of saturated soilsduring the winter season and late-season snowmelt. These factors delay the runoff peakand extend high flows into February. The period of low flow, primarily during from Julythrough October, is important for its effects on water quality and the stress on fishpopulations.
Much of the Muddy Creek channel flows through low-gradient, agricultural lands andthe hydrographs are less flashy (not peaking as dramatically in a short time) than themainstem of the Marys River. Only a five-year record exists for Muddy Creek, butgeneral trends can be seen in monthly average discharge values (Figure 3). Littlevariability among peak, mean and low flows is evident during the 5-year period ofrecord. Peak flow occurs in January and low flows begin as early as May. Theextended low-flow period extends from June through October. These low flows impactagricultural withdrawals for irrigation as well as aquatic habitat.
Rock Creek is a small sub-basin of Greasy Creek on mostly steep, forested lands.Average monthly values for 11 years of record show runoff peaks in February (Figure3), which correspond with the onset of snow melt. The importance of snow melt in theRock Creek sub-basin also may explain the increased discharge for the Marys River inFebruary and March, which reflects drainage of high-elevation areas of the watershed.Low flow in Rock Creek may occur as early as May and extend well into the fall.
Figure 3: Stream discharge averaged by month for Marys River, Muddy Creek,and Rock Creek showing mean, standard deviation, maximum and minimum.

10 Marys River Preliminary Watershed Assessment Ecosystems Northwest
Flooding in the Marys River Watershed is a primary concern in the lower watershed.A map of the extent of flood waters during the 1996 flood event shows flooding alongMarys River and Greasy Creek upstream of Philomath (Map 8). Most flooding,however, occurred downstream of Philomath and below the confluence with MuddyCreek. In addition to receiving drainage waters from the larger watershed, thesedownstream areas may experience localized flooding from runoff generated byimpervious areas within Corvallis and Philomath. At the Marys River gauging station,major flood events occur at flows exceeding 5485 cfs (Appendix 4, Section 1). Bankfullflow, when water leaves the channel and flows into the floodplain, occurs at 2745 cfs.Marys River discharge exceeded flood stage in 22 of the 45 years of record (Figure 4).In all but four years over the same period, Marys River discharge exceeded bankfulldischarge. With no dams for flood control on the Marys River, floodplain managementwill be an important watershed issue as urban development continues to expand intohistorical floodplain areas.
Figure 4: Marys River Discharge 1941-1986.

Ecosystems Northwest Marys River Preliminary Watershed Assessment 11
CHAPTER 2: HISTORICAL CONDITIONS
This chapter provides an overview of historical conditions for the Marys RiverWatershed. The historical record is summarized here to provide insights into what thearea looked like at the time of Euro-American exploration and settlement and to gainan understanding of how human uses have modified the watershed through time.
For the purpose of this analysis, the history of the Marys River Watershed is dividedinto three periods: the Kalapuyan landscape, the American pioneers, and thetransition to modern times (Table 2). Watershed conditions during each of thesehistorical periods are described based on evidence from written and verbal first-handaccounts of explorers and watershed residents, resource inventories, maps, drawings,and photographs.
Table 2: Periods of social and institutional changes in the Marys Riverwatershed.pre-Columbian–1845 Kalapuyan landscape1846–1879 American pioneers1880–1940 Transition to modern times
These historical periods set the context for the current conditions in the Marys Riverwatershed. By World War II, many of the land use activities and other trends wereestablished.
The Kalapuyan Landscape: pre-Columbian–1845
The indigenous people in the Marys River Watershed and surrounding area at thetime of Euro-American contact called themselves the Kalapuya. It is not known howlong the Kalapuya lived in the Willamette Valley prior to Euro-American contact.Technologies such as roasting of filberts and camas used by these people are thoughtto be at least 9000 years old (Minor and Toepel 1991, Reckendorf and Parsons 1966).At the time of the Lewis and Clark expedition in 1805-1806, at least six nations ofNative Americans, estimated at 10,000-12,000 individuals total, lived in the valley(Boyd 1986). By 1841, only 400 or so Kalapuya survived in the Willamette Valley, withmuch of the population before this period decimated by disease (Wilkes 1845).
Evidence shows that the Kalapuya practiced active resource management in theMarys River Watershed and that these activities were responsible for the landscapeand vegetation encountered by the early explorers. The first recorded history of theKalapuya was on October 4, 1826. In the approximate area of Berry Creek, insouthern Polk County, the McLeod expedition noted a group of Kalapuya digging roots(Davies 1961). At the time of Euro-American settlement, grizzly bears, white-taileddeer, California condors, lamprey eels, Willamette chub, wolverines, cougar, wolves,and elk inhabited the Marys River Watershed (Storm 1941). In 1834, Hudson BayCompany chief trader John Work, following the route of the McLeod expedition, notedextensive broadcast burning in the Willamette Valley (Scott 1923). One of the few

12 Marys River Preliminary Watershed Assessment Ecosystems Northwest
known sketches of the landscape at the time of Euro-American arrival is shown inFigure 5.
The use of fire for vegetation management has been termed "pyroculture" (Gilsen1989). This process involved periodic broadcast burning over large areas of thelandscape to control unwanted plants, including Douglas-fir and possibly poison oak,to the advantage of desired plants, including oak, camas and huckleberries (Boyd1986; Minore 1972; Gilsen 1989). The widespread use of this practice is evidencedby patterns of plants that exist today and by thousands of prehistoric artifacts used toprocess food, medicine, and dyes that occur in the Marys River Watershed andadjacent areas (Aikens 1975, Collins 1951). Vaughn (1890 p. 64) stated: “At that timethere was not a brush or tree to be seen on all those hills, for the Indians kept itburned over every spring, but when the whites came, they stopped the fires for itdestroyed the grass and then the young spruces sprang up and grew as we now seethem.”
Figure 5: Sketch of a Kalapuya man near a Marys River tributary, 1841 (Wilkes 1845).Drawn by A. A. Agate. The drawing shows a somewhat more open landscape in the1840’s.

Ecosystems Northwest Marys River Preliminary Watershed Assessment 13
The following accounts from early explorers provide a picture of the Marys Riverlandscape comprised of open oak savannas, rich grassland prairies, wetlands, andtrees in the streamside areas.
Monday June 1, 1834: The road now lay along an extensive plain, some parts of itswampy, to Laurie [Marys] river where we are camped not far from its discharge into aChannel of the Willamett. Here is an extensive plain on both sides of the river, and themountains to the W. are nearly without wood. Clover was observed today on both thehigh and on the low ground. The soil & herbage has the same appearance as usual.Where we are camped at the usual traverse of the river is too high to be forded, butwe learn from the Indians it is fordable a little higher up. (Wilkes, 1845).
Thursday July 2, 1834: Fine. Continued our course 6 1/2 hours across the plain toRiver Lauries [Marys] river where we camped. The Indians set fire to the dry grass onthe neighboring hill, but none of them came near us. The plain is also on fire on theopposite side of the Willamet. [Marys River]. (Wilkes, 1845).
Monday June 9, 1845: Morning Clear the sun arose in splendid majesty over thesnowy peaks of Mount Jefferson The vally covered in dew like a rain passedthrough some beautifull country for farming and Likewise some very wet land early inthe Day we came to a small river supposed to be the Tom Beoff [Long Tom River].(Palmer 1845).
Mouse [Marys] River joins the Willamette about thirty-five miles above the Lucky-mate[Luckiamute]. It had its origin in the Coast Range, has two principal branches, whichunite near the mountains, passes ten miles over a pebbly bottom, and then becomesmore sluggish to its mouth. This, like the other streams described, has timber upon itsboarders, but less than some; good country, fine prospects, and but a few claimsmade. (Palmer 1845).
1841 (Late Summer): The country in the southern part of the Willamette Valley,stretches out into wild prairie-ground, gradually rising in the distance into lowundulating hills, which are destitute of trees, except scattered oaks; these look morelike orchards of fruit trees, planted by the hand of man, than groves of natural growth,and serve to relieve the eye from the yellow and scorched hue of the plains. Themeandering of the streams may be readily followed by the growth of trees on theirbanks as far as the eye can see. (Wilkes, 1845).
Between the Lucky-mate and Mouse River there is a range of hills, as between otherstreams; but at one place a spur of the Coast Range approaches within ten miles ofthe Willamette; from this issue many small streams which run down it, and through thefine plains to the Lucky-mate upon the one side, and into Mouse River on the other.This is a beautiful region; from the bottom can be seen, at different points, sevensnow-covered peaks of the Cascade Range. The Cascade is within view for a greatdistance, to the north and south; which, together with the beautiful scenery in thevalley, renders it a picturesque place. Thrifty groves of fir and oak are to be seen in

14 Marys River Preliminary Watershed Assessment Ecosystems Northwest
every direction; the earth is carpeted with a covering of luxuriant grass, and fertilizedby streams of clear running rivulets, some of which sink down and others pursue theircourse above ground to the river. Between the forks of Mouse River approaches apart of the Cascade [Coast range], but it leaves a valley up each branch about onemile in width, the soil of which is rich and good prairie for several miles above thejunction. The mountain sides are covered heavily with timber. Thus these beautifulvalleys offer great inducements to those who wish to have claims of good land, withfine grounds for pasturage and timber close at hand. There are no claims made asyet above the forks, These streams furnish good mill sites for each of the first sixmiles, and are well filled with trout. (Palmer 1845).
American Pioneers: 1846–1879
The southern Willamette Valley, with its open prairies, good soil and abundant water,was an attractive area for settlement. Settlement appears to have occurred rapidlyafter 1850. In 1849, Benton County population was 870; the county at this timeextended to the coast and stretched to the California border (Fagan 1885). By 1858,Corvallis was described as a “substantial community of warehouses, stores andresidences” (Phinney, 1942, p. 21). By 1860, the population of Benton county hadgrown to 3,047 (Bureau of Municipal Research and Service, 1959).
During the 1850’s the General Land Office (GLO) surveyed the landbase of much ofthe western United States. These surveys are on record with the Benton County TaxAssessor’s Office and provide an excellent historical record of the Marys Riverlandscape at the time of these early surveys. The surveyors’ notes containinformation about a number of historical features, which can be used to reconstructroads and homesteads, vegetation patterns, stream channels and other features. Acopy of the 1853 GLO survey for a portion of the lower Marys River Watershed(Appendix 3, Figure 2, and Map 9a in Appendix 7) shows the growing town ofMarysville (which later became Corvallis), the road network, homesteads, andvegetation patterns. The historic vegetation thought to exist in 1850 is portrayed inMap 9, which was created by the Oregon Natural Heritage Council.
The following entry from “Oregon Geographic Names” provides details on thewidespread use of the name “Mary” in the basin.
In the early days of the fur traders Marys River, which heads north of Marys Peak, wasknown as Mouse River. In his journal for October 17, 1833, John Work refers to thisstream as River de Souris, or Mouse River, and the context seems to show that thename Souris was already established. Duflot de Mofras used the name Rivere deSouris, Mice River, in 1841, and Joel Palmer called the stream Mouse River in 1845-46. Cal Thrasher, a Benton County pioneer, is authority for the statement that MarysPeak in early days was called Mouse Mountain, a translation of an Indian name. Seeeditorial page of the Corvallis Gazette-Times, September 20, 1935. The name MarysRiver appears in an act passed by the Oregon legislature December 12, 1846, and itwas apparently in public use at that time. There are at least two stories about the

Ecosystems Northwest Marys River Preliminary Watershed Assessment 15
origin of the name Marys River. One is to the effect that it was applied by Adam E.Wimple, and early settler from Oneida County, New York, for his sister, who had neverbeen in Oregon. Wimple murdered his girl wife, Mary, August 1, 1852, whom he hadmarried the year before, and he was hanged at Dallas October 8, 1852. She hadattacked him with a pistol. For narrative of the murder, see the Oregonian, August 8,September 11, 25, 1852. The other story is that the stream was named by WaymanSt. Clair for Mary Lloyd, daughter of John Lloyd, who came to Oregon from ClayCounty, Missouri, in 1845, and in 1846 settled near the present town of Monroe inBenton County. She was said to be the first white woman to cross Marys River, in1846 (George H. Himes). She married John Foster in Benton County, June 20, 1846;died in August, 1854. Lloyd was born in Buncombe County, North Carolina; died inBenton County, Oregon, January 6, 1880. His house is said to have been the farthestsouth in the Willamette Valley at one time. Wayman St. Clair was a member of theterritorial legislature in 1850-51, representing Benton County in the lower house; alsoin 1854. He was an immigrant of 1845. He and John Lloyd were alternate captains ofthe last party that followed the Meek Cutoff. In the winter of 1847 Joseph C. Averybegan to lay out a town at the mouth of Marys River, and the place was calledMarysville. In 1853 the name was changed to Corvallis. Marysville was probablynamed for the stream, although there may have been additional reasons. Mrs. John(Mary) Stewart, one of the first settlers, said that Avery told her he would apply thename Marysville in her honor. See Corvallis Gazette-Times, June 7, 1935. It hasbeen suggested that French-Canadian employees of the Hudsons Bay Company mayhave named the stream Saint Marys River, but there seems to be no contemporaryrecord of the event.
The vegetation in the 1850’s consisted of mostly grass prairies and oak savannas,with scattered conifer forests along the valley floor (Hulse et al. 1998). Somedescriptions noted riparian area vegetation. In 1852, Reverend Ezra Fisher noted “onthe Willamette bottoms [the vegetation consisted of] the balm of Gilead [cottonwoods],white fir [Douglas fir] and soft maple (Storm 1941, p.13). Vegetation common toriparian areas was black cottonwood, Oregon ash, alder, big-leaf maple, willow,Douglas-fir, western redcedar, and some ponderosa pine. Map 9a, which depictshistorical vegetation types along the Marys River reconstructed from the GLO surveys,shows a mix of vegetation communities, with deciduous forests along the floodplainsand a mix of open prairies, conifers, and oaks in the uplands.
The open prairies of the Marys River Watershed offered an attractive landscape foragriculture. In 1846 Lieutenant Niel M. Howison observed: “Continuous ranges ofprairie land free from the encumbrances of trees or other heavy obstacles to the plow,stretch along, ready for the hand of the cultivator” (Storm 1941, p. 10). Records in1880 of livestock list 5,993 cattle, 28,818 sheep; 5,460 hogs; 3,226 horses; and 83mules (The Willamette Valley Project 1936, p. 31). The main field crop was wheat; by1873, wheat yields were estimated at 300,000 bushels.
Ferries were used for a short time during this period to cross the Marys River (Farnell1979). J. C. Avery operated a ferry about a quarter mile above the confluence with

16 Marys River Preliminary Watershed Assessment Ecosystems Northwest
the Willamette River (near the present site of Avery Park) and another individualoperated a ferry about one-half mile further upstream. In 1856, a bridge was built nearthe Avery ferry site, putting the ferry out of business until the bridge was washed out inthe 1861 flood.
The Marys River was used as a transportation highway during the early years ofsettlement. Records show that one settler, Ben Bratton, hauled his wheat to a gristmillon Beaver Creek in a canoe drawn by a yoke of oxen (Farnell 1979). The majortransportation use of the river, however, was for log drives. In 1856 the BentonCounty Court declared the Marys River “navigable for the floating of lumber andsawlogs from about two miles above William Woods [in Blodgett Valley], thence downto Marzger and Co.’s Mill.” This stretch extends from River Mile 35 to River Mile 14(Farnell 1979). Large numbers of logs were moved from the headwaters to as fardownstream as Corvallis. Records from a 1879 foreclosure lawsuit (Friendly v.McCullogh) indicate that at one point a company had 600,000 board feet of sawlogs inthe channel upstream of the Corvallis mill (Farnell, 1979). Log drives down the MarysRiver and its tributaries continued until the 1940’s.
Logging was an important activity to the settlers of the Marys River Watershed.Lumber was used to build homes and businesses. Mills were located near timbersources because horse or ox teams were used for transport. Most of these lumbermills required waterpower to run the operation so they were also located on the MarysRiver or other streams. Seven mills are known to have existed in Benton County in1855, including operations on the mainstem of the Marys River, as well as Beaver andRock creeks (from the Benton County Historical Society Display, Philomath, OR).One of the first sawmills in the watershed was the mill near Harris on the Marys River.This mill, probably built by Danniel H. Byrd in 1853, was used to supply lumber to thefirst houses in the area (Stark et al. 1998). Mills in the watershed would come and goover time as timber was harvested, demand changed, and transportation methodsimproved. The Harris area, for example, had a series of mills at various times: 1853,1880–1880’s, 1917–1929, and again in 1944 (Stark et al. 1998). T.J. Starker’s map(Appendix 3, Figure 4) provides an overview of the locations of sawmills.
Transition to Modern Times: 1880–1940
By the 1880’s, agriculture was an important part of the economy and the primary landuse in the Marys River Watershed. Fagen (1885, p. 227) stated that the watershedwas characterized by “excellent prairie, grass and grain lands…and contains some ofthe finest agricultural land in Oregon, and is well watered and timbered; the hillsadjacent to the valleys are not only favorable for grazing purposes but also produceabundantly, especially of the cereals.” In 1880 Benton County produced 256,832bushels of oats and 497,068 bushels of wheat (Fagan 1885). By the 1890’s farmersdiversified their business interests to include poultry and egg production, extensiveprune orchards, pears, apples, cherries, walnuts and filberts (The Willamette ValleyProject 1936).

Ecosystems Northwest Marys River Preliminary Watershed Assessment 17
The population of the area also grew rapidly during this period. By 1880 the countyhad a population of 6,403, which was nearly double the 1860 population of 3,074;Corvallis had a population of 1800 (Fagan 1885). In 1930, the county’s populationhad grown to 6,555 (Willamette Valley Project 1936). More people were living inCorvallis, although the largest proportion (54%) still lived in the rural areas (WillametteValley Project 1936).
Timber harvest continued to be an important economic activity in the watershed. In1885 Fagan (p. 445) stated: “To the west of the foothills is the Coast Range, whosecommanding heights and deep canyons are clad with timber awaiting the penetratingaxe of the woodsman. There are several sawmills in the [area]. That known asNewhouse Mill is located at the head of Beaver Creek in a grove of remarkable finetimber...” The Kalapuya practice of using fire to control vegetation was limited duringthe period of Euro-American settlement. Grasslands and open, oak-woodlands in thevalley bottoms were being replaced by conifer forests.
Improved technology made it possible to transport logs longer distances and harvestlarger volumes of timber. Improvements in transportation reduced the need for mills tobe located near timber supplies. By 1880, railroads were used for transporting logs.Many of these railroads followed stream courses in the watershed. The steam donkeywas developed in the 1880’s and had replaced the horse and ox by the turn of thecentury (from the Benton County Historical Society Display, Philomath, OR). Thesteam donkey was a stream-powered winch used to skid logs from the slopes toloading areas where they could be transported by water or railroad.
The following are the dates and locations of log drives in the Marys River Watershed(Farnell 1979):
• 1889–1891: Greasy Creek from the confluence of Rock Creek. The logs weredestined for the J.A. Hawkins Sawmill west of Philomath.
• 1902–1944: In 1902 the Corvallis Lumber Company was preparing to drive600,000 board feet of logs down the Marys River to Corvallis. The last log drivedestined for the mill in Corvallis was in 1944.
• 1915–?: The west fork of the Marys River (beginning above River Mile 40). Thesedrives were probably assisted by a wall of water created when a splash dam atRiver Mile 37 was breached.
Logging trucks and other machines allowed the harvest of large volumes of timberwith less effort and the transport of logs over long distances to mills. By the late1930s crawler tractors were replacing steam donkeys. Power chainsaws wereintroduced a few years later. In 1936 the Marys River Watershed had 32 sawmillswith production capacities ranging from 20,000 to 200,000 board feet of timber per day(Willamette Valley Project 1936).
The Marys River Watershed has been a source of water to Corvallis and Philomathsince 1904. By the early 1900's, it was apparent that the Willamette River was too

18 Marys River Preliminary Watershed Assessment Ecosystems Northwest
polluted to use as a drinking water source, so Corvallis began to explore alternativewater sources (Sue Ross, City of Corvallis Public Works, pers. comm.). Several wellswere drilled in Corvallis, but when they either failed or produced inadequate volumesof water, the city began to search for sources in the Marys River Watershed.Eventually, the Rock Creek Watershed on the east side of Marys Peak, known for itspure water, was selected as the drinking water source. Corvallis began buyinghomestead acres in the watershed, but soon ran out of funds. The city then convincedthe U.S. Forest Service to purchase additional acres in the watershed and shareownership of the area, which eventually resulted in a 10,000-acre municipalwatershed, with 2,500 acres of city property and an additional 7,500 acres in USFSownership.
Sources and treatment locations of drinking water for the City of Corvallis havechanged over time. The water from the Rock Creek Watershed was originallytransported in 8-inch diameter redwood pipes to a pressure treatment facility nearPhilomath, where it was filtered and disinfected before being sent on to Philomath andCorvallis. The Rock Creek Treatment Facility was the sole treatment location forwater until 1949, when the Taylor Treatment Plant was built. The Taylor TreatmentPlant was built to treat water pulled from the Willamette River, augmenting the RockCreek Watershed supply in the summer months. During these months, water supplyfrom Rock Creek is low, due to reduced snowmelt runoff from Mary's Peak, andunable to meet increased consumer demand. In 1956 the Rock Creek treatmentfacility near Philomath was replaced with a treatment plant on Marys Peak. Today,the Taylor Plant is Corvallis' primary supply, treating 3–16 million gallons of water perday, while the Rock Creek Facility is secondary, providing 3–4 million gallons of waterper day (Sue Ross, City of Corvallis Public Works, pers. comm.).
The 1930’s were marked by the beginning of the era of intensive natural resourcemanagement in the Willamette Basin for “greater economic and social advancement”(Willamette Valley Project 1936). This State of Oregon initiated a program termed“the Willamette Valley Project,” which had three key elements related to naturalresources:
1) Hydraulic control of the entire basin through the building of dams and storagereservoirs;
2) Agricultural land use designed to encourage more effective farming practices; and3) Forest strategy to encourage the sustained yield of forest resources.
This program was part of a larger works program by the federal government designedto modify the environment of the basin. Most of the actions were focused on theconsequences of floods, including the construction of dams to regulate flow andprojects to control river meandering and erosion. In 1936, 54,000 lineal feet of rip-rapwas installed along the Willamette between Eugene and Harrisburg to stabilize andprotect stream banks. Another key part of this program was “clearing flood channelsto prevent the loss of land by erosion and reduce flood heights” (Willamette ValleyProject 1936, p. 20). A number of waterways in the Willamette Basin were targeted

Ecosystems Northwest Marys River Preliminary Watershed Assessment 19
for removal of logs and other debris from the channel. Under the Flood Control Act of1936, $2,430,000 was authorized for bank protection and channel clearing, including$70,000 for debris removal in the Marys River (Willamette Valley Project 1936).
By the late 1930’s the pattern of land uses in the Marys River Watershed wasbecoming similar to the present situation. Corvallis was a growing urban andeducational center, with a number of sawmills and other industries. Large and smallfarms occupied most of Benton County, primarily valley bottoms along the MarysRiver, Muddy Creek, and the Willamette River. Over 55 percent of the county wasoccupied by farmlands, the second highest in the Willamette Valley (Willamette ValleyProject 1936). Aerial photographs provide an excellent way to view vegetationpatterns and land use activities. A series of aerial photographs beginning in 1937(Appendix 2, Photo 3a-3c) shows a Muddy Creek Watershed with farms occupyingareas that were once grasslands, wetlands, and riparian areas. A substantial loss ofthese natural features and reduced riparian corridors along the river is obvious.
Water pollution was recognized as an issue in the Willamette Basin by the 1930’s, withmost of the sources listed as domestic sewage and discharge of domestic wastes(Willamette Valley Project 1936). Public opinion and policy, however, were notfocused on water quality issues: “Because the rivers of the Valley are not largely usedfor municipal water supply and because evidence of befoulment are not widely forcedupon the senses, the public is tolerant toward stream pollution.” (Willamette ValleyProject 1936, p. 109).
Summary
By the 1930’s, the landscape features of the Marys River Watershed had changeddramatically. Lands that were historically grass prairies, oak savannas, wetlands, andriparian forests had been converted to farmlands, and, to a lesser extent, other landuses. The end of the Kalapuyan practice of using fire to control vegetation resulted inconversion of areas that were once grasslands and open oak woodlands to coniferforests. Human population within the watershed had increased, with peopleconcentrated in Corvallis and Philomath. Stream habitat, especially along themainstem of the Marys River, had been modified through log drives, woody debrisremoval, and bank stabilization projects. Water quality problems from domesticsewage were recognized as an issue, although there was little public action.
Detailed historical investigations of individual streams and sub-basins would provide aadditional understanding ecological change across the landscape. These historicalassessments could focus on collecting and transcribing oral histories from long-timewatershed residents, agency personnel, and other individuals who have observedlandscape changes through time. Zybach and Wisner (1994) provide an approach fororal history interviews and documentation. Further use of the primary historicalsources, such as GLO surveys, would reconstruct historical conditions for individualwatersheds or specific areas, and may be useful in planning habitat enhancementprojects.

20 Marys River Preliminary Watershed Assessment Ecosystems Northwest
CHAPTER 3: WATER QUALITY AND QUANTITY
Water Quality Background
The Clean Water Act of 1972 established the regulatory framework that guides muchof the Federal, State, and local action targeted at monitoring and controlling waterquality of surface water and groundwater (Clean Water Act 1972). As mandated bythe Clean Water Act, beneficial uses are designated for each water body to representthe human or ecological services the water provides. States use different systems todesignate beneficial uses by stream reach or by watershed. In Oregon, beneficialuses are broadly designated for large watershed areas (Oregon Administrative Rules340.41). Designated beneficial uses that apply to the Marys River watershed arelisted below (Table 3).
Table 3: Oregon designated beneficial uses for the MarysRiver Watershed (Oregon Administrative Rules 340.41).Aesthetic QualityAnadromous Fish PassageBoatingFishingHydroelectric PowerIndustrial Water SupplyIrrigationLivestock WateringPrivate Domestic Water SupplyPublic Domestic Water SupplyResident Fish and Aquatic LifeSalmonid Fish RearingSalmonid Fish SpawningWater Contact RecreationWildlife and Hunting
A water quality standard defines the water quality goals of a water body bydesignating uses to be made of the water and by setting criteria necessary to protectthe uses (Clean Water Act 1972). Criteria are numerical values typically expressed asthe concentration of a constituent that protects the most sensitive designated uses bymaintaining water quality. The water quality standards and criteria that apply to MaryRiver and its tributaries are listed below (Table 4), followed by a brief description ofrelevant water quality parameters discussed in this report (Table 5). Oregon listsstandards or criteria for each water quality parameter. The standard or criteria valueis the value at which beneficial uses most affected by the corresponding water qualityparameter are protected.

Ecosystems Northwest Marys River Preliminary Watershed Assessment 21
Table 4: Water quality standards or criteria and water quality limited criteria applying tothe Marys River Watershed (Oregon Administrative Rules 340.41).Water QualityParameter
Beneficial Uses Affected Water Quality Standard or Criteria Water Quality LimitedCriteria
Flowmodification
*Resident fish and aquaticlife*Salmonid spawning andrearing
Creation of conditions that aredeleterious to fish or other aquatic lifeare on allowed
Documented flowconditions that limit fishor other aquatic life orimpair other beneficialuses
DissolvedOxygen
*Resident fish and aquaticlife*Salmonid spawning andrearing
*Cold water aquatic resource:8.0 mg/L 30 d mean minimum6.5 mg/L 7 d mean minimum6.0 mg/L minimum
*Cool water aquatic resource:6.5 mg/L 30 d mean minimum5.0 mg/L 7 d mean minimum4.0 mg/L minimum
Temperature *Resident fish and aquaticlife*Salmonid spawning andrearing
*64ºF (18ºC) 7 day moving average ofdaily maximum unless;*55ºF (13ºC) during times in waters thatsupport anadromous fish spawning
7 day moving averageexceeds standard
Turbidity *Resident fish and aquaticlife* Water supply*Aesthetics
No more than 10% increase overbackground
Systematic or persistentincrease of > 10% inturbidity
pH *Resident fish and aquaticlife*Water contact recreation
6.5 to 8.5 > 10 % samples exceedstandard and at least 2exceedences for seasonof interest
Bacteria *Water contact recreation *126 E. coli /100mL, 30 d. log mean,minimum of 5 samples*406 E. coli/100mL, single sample
*200 Fecal coliform/100ml, geometric mean*400 Fecal coliform/100ml in > 10 % samplesand at least 2exceedences for seasonof interest
Sedimentation *Resident fish and aquaticlife*Salmonid spawning andrearing
Formation bottom or sludge depositsdeleterious to fish, aquatic life, publichealth, recreation, or industry.
Documentation thatsedimentation issignificant limitation tofish or other aquatic life
Total dissolvedgas
*Resident fish and aquaticlife
*Concentration of total dissolved gasnot to exceed 110% of saturation*liberation of dissolved gas not to causeobjectionable odors or be deleterious touses of such waters
* > 10 % samplesexceed standard and atleast 2 exceedences forseason of interest or* survey that identifiesimpairment of beneficialuse
(Table 4 continued on next page)

22 Marys River Preliminary Watershed Assessment Ecosystems Northwest
Table 4 (cont.) : Water quality standards or criteria and water quality limited criteriaapplying to the Marys River Watershed.
Water QualityParameter
Beneficial Uses Affected Water Quality Standard or Criteria Water Quality LimitedCriteria
Chlorophyll a *Water contact recreation*Aesthetics*Fishing*Water supply*Livestock watering
*Natural lakes which thermally stratify0.01 mg/L
*Natural lakes which do not thermallystratify, reservoirs, rivers and estuaries
0.015 mg/L
3 month averageexceeds standard
Aquatic weedsor algae
*Water contact recreation*Aesthetics*Fishing
Development of fungi or other growthshaving deleterious effect on streambottoms, fish, other aquatic life, health,recreation or industry
*Macrophytesdocumented asabundant, invasive non-natives* Periphyton (attachedalgae) or phytoplankton(floating algae)documented as causingother exceedence ofother standards orimpairing beneficial use
Biologicalcriteria
*Resident fish and aquaticlife
Waters shall be of sufficient quality tosupport aquatic species withoutdetrimental changes in residentbiological communities
Data on aquaticcommunity statusshows impairedcondition
Habitatmodification
*Resident fish and aquaticlife*Salmonid spawning andrearing
Creation of conditions that aredeleterious to fish or other aquatic lifeare not allowed
Documentation thathabitat conditions are asignificant limitation tofish or other aquatic life
Toxics *Resident fish and aquaticlife
Full criteria listed in OregonAdministrative Rules 340-41-445(2)(p)(B) Table 20.
*Exceeds standard 10%of the time and for atleast two values*Found in sediments ortissue in concentrationsthat exceed standardsor screening values
Total dissolvedsolids
All beneficial uses Guide concentration Willamette Riverand tributaries 100.0 mg/L
Not to exceed guideconcentration
While no standards exist for nutrients, parameters affected by nutrients such as algaedo have water quality standards. In some cases, the Oregon Department ofEnvironmental Quality (DEQ) has developed in-house concentration levels used toidentify water quality problems, but to date these have not been reported for the MarysRiver Watershed. The following table presents a simple list of water qualityparameters discussed in this report along with a brief description, typical abbreviation,and units of measurement (Stednick 1991).

Ecosystems Northwest Marys River Preliminary Watershed Assessment 23
Table 5: Descriptive list of selected water quality parameters.Parameter Brief description Abbrev-
iationsUnits of measurement
DissolvedOxygen
Amount of oxygen dissolved in water DO milligrams/Liter (mg/L)
Temperature Temperature of water T, Temp Degrees F (or C)
Turbidity Scattering of light in water due toparticulate matter; low lighttransmission is high turbidity
Turb Nephelometric Turbidity Unit(NTU)
Totalsuspendedsolids
Total concentration of particlessuspended in the water column
TSS mg/L
Totaldissolvedsolids
Total concentration of dissolved ionsin water
TDS mg/L
Conductivity Ability of the water to carry anelectrical current; inverse ofresistance to electric current; linearlycorrelated to TDS.
Cond micromhos/cm (umohs/cm)or microSiemens/cm (uS/cm)
pH Hydrogen ion activity showing acidic,neutral or basic water
pH pH units: [-log(Hydrogen ionconcentration)]
Alkalinity Capacity of water to neutralize acid Alk mg/L (as calcium carbonate)
Hardness Total concentration of calcium andmagnesium ions in water
mg/L (as calcium carbonate)
Totalphosphorus
Concentration of all forms ofphosphorus
P, TP mg/L
Phosphate Biologically available form ofphosphorus
PO4 mg/L orthophosphate ion(PO4)
Total nitrogen Concentration of all forms of nitrogen N, TKN mg/L
Nitrate Biologically available form of nitrogen NO3 mg/L nitrate (NO3)
Ammonium Biologically available form of nitrogen NH4 mg/L ammonium (NH4)
Sulfate Concentration of sulfate SO4 mg/L
Chloride Concentration of natural ionic form ofchloride (not chlorine)
Cl mg/L chloride
Magnesium Concentration of magnesium ion Mg mg/L
Sodium Concentration of sodium ion Na mg/L
Potassium Concentration of potassium K mg/L
Bacteria Concentration of bacteria of interestsuch as Escherichia coli or fecalcoliform
E. Coli counts/100 milliliters (/100ml) or Maximum probablenumber/100 ml
Biochemicaloxygendemand
Amount of oxygen required bybacteria while decomposing organicmatter
BOD mg/L

24 Marys River Preliminary Watershed Assessment Ecosystems Northwest
What is the 303(d) list?
Section 303(d) of the Clean Water Act requires each state to develop a list of watersthat do not meet state standards for water quality. The list provides a way forOregonians to identify problems and develop and implement watershed managementplans to protect beneficial uses while achieving federal and state water qualitystandards. The list is meant only as a means of identifying areas of water qualityproblems, not causes. Water quality problems include parameters such as nutrients,bacteria, toxic contaminants, turbidity and temperature. Causes of water qualityproblems are determined when management plans are developed for the watershedsin which the listed segments are located. Potential sources of problems other thanpoint sources (sewage treatment or industrial outfalls) include runoff from sourceareas such as cropland, pasture, confined animal feeding, onsite sewage systems,forest lands, urban areas and industrial areas.
Oregon Department of Environmental Quality (DEQ) compiles the 303(d) list usingexisting scientific data and best professional judgment to assess water quality, anddetermines which waters should be listed. DEQ develops a draft list and presents thelist for public comment. After public comments are reviewed and taken intoconsideration, a final list is developed and sent to U.S. Environmental ProtectionAgency (EPA) for approval. The final list is accompanied by a list of priorities thattarget resources for correcting water quality problems. DEQ must submit an updatedlist to the Environmental Protection Agency (EPA) every two years.
A stream, river, lake or estuary may be removed from the list if there is evidence that:1) it is meeting water quality standards; 2) it is violating water quality standards dueonly to natural conditions (meaning that there is no human-caused influence); 3) itsTotal Maximum Daily Load (TMDL) has been approved; or 4) it was placed on the listin error. (ODEQ, http://waterquality.deq.state.or.us/wq/303dlist/303dfactsheet.htm).For example, the temperature standard can be modified from that listed in Table 4.The State Standard sets the temperature at 64°F statewide unless there is habitat forcold-water fish spawning or bull trout, which require standards of 55°F and 50°F,respectively. If a stream or river violates temperature standards, DEQ would requirethat responsible parties or management agencies develop a water temperaturemanagement plan to address the problem. If temperatures still do not meet waterquality standards after an approved temperature management plan has beenimplemented and if DEQ determines that all feasible steps have been taken toaddress the problem, then the temperature actually attained will become the standardfor that water.

Ecosystems Northwest Marys River Preliminary Watershed Assessment 25
Marys River Waters on 303(d) List
This preliminary assessment concentrates on pollutant categories for which the MarysRiver and its tributaries are either 303(d) listed (see below) or categories that have ahigh potential as pollutant sources, based on data, reports, observations andprofessional judgement and land use. The Marys River is on the 303(d) list for flowmodification, bacteria and temperature from the mouth to Greasy Creek (Map 10).Several potential sources of pollutants are discussed in Chapter 5 and includecropland erosion, fertilizer and pesticide applications, grazing, mass erosion andsurface erosion from forestland and roads. Other parameters were considered andwere found to either be within standards or to have insufficient data to warrant alisting. These parameters include dissolved oxygen, summer bacteria levels,chlorophyll a, and pH; for Greasy Creek and the Tum Tum River, sedimentation wasconsidered but insufficient data did not warrant a listing. Waters considered for 1998303(d) are listed in Appendix 4, Section 2. The following sections detail water qualityfor the three areas of the watershed with the most available data: Marys River, MuddyCreek, and Rock Creek. Additional data from selected locations in other sub-basinsare also included in the final overview of water quality in the Marys River Watershed.
Marys River Water Quality
Three sources of water quality information were reviewed here. The first source is theCity of Corvallis, which has taken samples monthly since 1988. Sampled parametersinclude dissolved oxygen, pH and bacteria. The city’s monitoring sites in the MarysRiver Watershed are the Marys River at Avery Park, Oak Creek at Highway 20, andSquaw Creek at Brooklane Drive (Map 10). The second source of information is thePhilomath Water and Wastewater Treatment Plant which samples the Marys River inPhilomath (City of Philomath 1998). Parameters sampled on a monthly basis includepH, turbidity, temperature and alkalinity. The third source of data is the DEQ, whichhas sampled at the mouth of the Marys River for a host of parameters about every twomonths since 1983 (DEQ 1999, see Appendix 4 Section 3).
Additional water quality data for Oak Creek have been collected by Oregon StateUniversity. Data for the upper Marys River near Wren have been collected by D.Sternadel (pers. comm.). Additional data from these studies have not been readilyavailable and were not analyzed in detail here. Coverage of these data is somewhatlimited, especially for Marys River tributaries. Additional water quality data,systematically collected for smaller streams in the Marys River Watershed, would aidin further assessment. General water quality patterns for the Marys River andtributaries are discussed in the following paragraphs.
Bacteria
Bacteria data are given detailed consideration here because the reach of Marys Riverfrom Greasy Creek to the river mouth is 303(d) listed reach for to Enterococci coliform

26 Marys River Preliminary Watershed Assessment Ecosystems Northwest
(E. Coli) bacteria. Standards for bacteria changed from fecal coliform to E. Coli in1990. Both parameters, however, can be used to identify water-quality limited waters.Fecal coliform exceeds state standards if the geometric mean exceeds 200 per 100 mlin 10% of the samples, or if there are two exceedences of 400 per 100 ml in oneseason of interest (DEQ 1996).
Lack of data limits the ability to fully determine bacteria problems in the Marys RiverWatershed. Specifically, there are too few data from the City of Corvallis’ monthlysampling program to determine 30-day log means for E. Coli as defined by the statestandard. This problem can be circumvented by examining both fecal coliform and E.Coli data. E. Coli counts taken after 1990 and fecal coliform counts taken before andafter 1990 from samples collected from the Marys River at Avery Park show similarpatterns. Average fecal coliform (FC) was 94 counts/100 ml while E. Coli was 102counts/100 ml. The maximums were 825 (FC) and 914 (E. Coli) and the minimumswere 17 (FC) and 4 (E. Coli), with corresponding standard deviations of 127 (FC) and161 (E. Coli). Because the structure of the data was similar and more data areavailable for fecal coliform than for E. Coli from the sampled sites, fecal coliform wasanalyzed in detail to discern patterns in bacteria occurrence.
Geometric means for fecal coliform in the Marys River, Oak Creek, and Squaw Creekwere 56, 309, and 130, respectively. In the Marys River, there were not two valuesgreater than 400 in a single season. A plot of fecal coliform averaged by month showsone peak in the Marys River in May 1996. Because there is a swimming hole locatedjust upstream of the sample site, the Marys River contamination may be a result ofpeople’s swimming activities. Oak Creek clearly exceeds the standard, with peaks inNovember, April and August (Figure 6). In Squaw Creek there were at least twoexceedences of 400 in the same season for summer 1989, spring 1990 and summer1995, resulting in an exceedence of the fecal coliform standard. Squaw Creek followsa similar pattern as Oak Creek, with peaks in November, March and August.
Figure 6: Fecal coliform averaged by month.
The patterns of bacteria concentration in the Marys River and these two smallertributaries suggest that sewage outfalls are not the primary source of bacteria. The
0
2 0 0
4 0 0
6 0 0
8 0 0
1 0 0 0
1 2 0 0
1 4 0 0
1 6 0 0
Oct Dec
Feb Ap
rJun Au
g
Feca
l col
iform
(co
unts
/100
ml)
M a r y s R i v e rO a k C r e e kS q u a w C r e e k

Ecosystems Northwest Marys River Preliminary Watershed Assessment 27
Philomath wastewater treatment plant has the largest single water effluent dischargeinto the Marys River, however records from the plant indicate fecal coliform usually isless than 20 per 100 ml (Dale Crum, pers. comm., Philomath Water WastewaterTreatment Facility). The discharge permit for the plant requires retention ofwastewater May 1-October 31 and allows effluent discharge November 1-April 30.For the most part, no bypass occurs and all wastewater passes through the lagoonsbefore being discharged to the Marys River. Bypass does occur during very wetconditions in winter when sewer pipes in Philomath become filled with water from thesaturated soil that infiltrates cracks in the pipes. This water can mix with untreatedwastewater and backflow into the city streets. Under these circumstances, thisbackflow is ameliorated by pumping water from the sewers into the storm drains andinto the Marys River. DEQ is notified about backflow situations. Very dry fallseasons, when flow in the Marys River remains low, may be another potential time ofconcern. Releases from the treatment plant, which are allowed after November 1,may not have the benefit of dilution by larger flows in the river. The plant has acurrent capacity to treat wastewater from a population of 5000. The 3800 populationin Philomath is expected to reach 5000 in three-five years. As the lagoon systemreaches capacity, effluent may contain greater concentrations of contaminants.Overall, however, the Philomath wastewater treatment plant is not currently a majorsource of bacteria to the Marys River.
Oak Creek and Squaw Creek, on the other hand, are sources of bacteria. The mostlikely source of fecal coliform in Oak Creek is livestock, particularly the Oregon StateUniversity (OSU) animal farms. Dairy farms spray manure slurry on their pastures anda beef barn is located near the stream. Without rainfall, the slurry and manureremains on the fields and in the feedlot. Following rains, manure may be transporteddirectly into Oak Creek. Manure-laden winter runoff may explain the November peakin fecal coliform on Oak Creek. The August peaks in fecal coliform on Oak andSquaw Creek may be explained by low flows that do not dilute bacteriaconcentrations. Additional sources other than the animal farms and beef barn may becontributing bacteria to Oak Creek and Squaw Creek. Manure management,however, remains an important concern for fecal coliform counts in Oak Creek andMarys River.
Temperature
Temperature, like bacteria, deserves special attention in the water quality screeningprocess because the lower Marys River is 303(d)-listed for temperature. Waters areconsidered to be temperature limited if the stream temperature exceeds 64°F for amoving seven-day average. In the absence of moving seven day averages, weconsider simple temperature values as indicative of temperature conditions,recognizing that additional data will need to be collected to determine if temperaturelistings for the Marys River are warranted. Temperature data are available from areport compiled in 1995 by the Friends of Corvallis Urban Streams (Andrus 1995). Onthe warmest summer day of 1996, August 24, the Marys River exceeded 64°F at 5

28 Marys River Preliminary Watershed Assessment Ecosystems Northwest
sites downstream of the Tum Tum River. Temperatures for these sites (in °F) were65.0, 71.8, 74.4, 75.1, and 73.2. Based on observations of streamside vegetation atthese sites, temperature appears to increase more dramatically where there was lessshading by riparian forests. The warmer, flatter reaches in the lower Marys River alsocorrespond with slower stream velocities. On July 28, 1995, temperature exceeded64°F downstream of 35th street on both Oak (70°F) and Squaw (74°F) creeks. Therise in temperature on Squaw Creek was attributed to a 600-foot long reach of streamthat had no riparian shading. While these data do not affirm the seven-day waterquality criteria exceedence, they suggest that temperature may limit water quality onlow gradient, unshaded streams of the Marys River Watershed.
Questions have arisen as to whether the 64°F standard is appropriate for the MarysRiver Watershed. A recent study of temperature in the Marys River and tributaries (C.Andrus, pers. comm.) suggest that the natural temperature regimes in the watershedmay exceed 64°F, even above the valley floor (Figure 7). In mid-August the 7-daymoving average of temperature on the Marys River exceeded 68°F downstream of theGreasy Creek confluence. August temperatures of 70°F measured by the City ofPhilomath confirm this pattern. Besides showing that temperatures are indeed abovethe desired 64°F level, these data suggest that temperature is a function of bothnatural factors, such as elevation in the watershed, and anthropogenic uses. Whileremoval of riparian forests may be unnaturally increasing stream temperatures, thenatural temperature regime of the Marys River Watershed should be determined.
Figure 7: Preliminary results from temperature monitoring sites in 1998.

Ecosystems Northwest Marys River Preliminary Watershed Assessment 29
Dissolved Oxygen, pH, and Alkalinity
The City of Corvallis’ monthly monitoring reveals that the mean of 9.8mg/L of DO isgenerally above the 8.0 mg/L standard for cold-water fisheries. Minimum values of7.3-7.9 mg/L were recorded in August of four different years, however these were rareoccurrences and came at times when the water was likely too warm to support cold-water fishes. Low levels of DO, approximately 6 mg/L, were found near Wren inNovember and December (Sternadel, pers. comm.). DEQ sampling every two monthsshowed that average Marys River DO was 10.1 mg/L. Oak Creek fell within thestandard limits for DO on all dates. Dissolved oxygen measurements on SquawCreek suggested a problem area, with a minimum DO of 3.8 mg/L and with violationsof the state standard on 23 dates during periods of June-September. Additional datawill be required to determine the cause of decreased DO on Squaw Creek.
The general pH standard for the Willamette River Basin is 6.5-8.5. City of Corvallis’data show the Marys River had a mean pH of 7.5 with a maximum of 8.3 and aminimum of 6.3. On only two dates, both in December, pH was below the standard of6.5. The likely high flows associated with these values suggest that stormwater runoffmay have added pollutants to the River or that the buffering capacity of the water wasreduced. Measured at the Marys River mouth, pH ranged from 6.7-7.9; at Philomath,6.5-7.5, and near Wren, 6.5-8.2. pH in Squaw Creek consistently ranged between6.5 and 8.5.
City of Philomath data show Marys River alkalinity from 15-60 mg/L and DEQ-measured alkalinity ranges from 10-68 mg/L.
Nutrients
Nutrients are collected routinely only by DEQ at the mouth of the Marys River(Appendix 4, Section 3). Nitrate plus nitrite (mg/L) ranged from 0.02-1.20. Thequarterly average was highest in the winter (0.60) and lowest in the summer (0.50).Total phosphorus, ranging from 0.05-0.35 mg/L, also peaked in the winter quarter(average = 0.11) and was lowest in the spring and summer quarters (average = 0.07).The only nitrate water quality standard that exists is that of 10 mg/L which exists fordrinking water. Nitrate at moderate concentrations such as 1 mg/L can have effectson aquatic life. For example, moderate elevations in nitrate and phosphorus typicallyenhances algal and aquatic plant growth, which in turn can increase turbidity, createdepletions in dissolved oxygen at night, cause off tastes to drinking water, and havevisual esthetic impacts. While no state standards were exceeded for either nutrient,presence of either nutrient at moderate levels suggest that sources of nutrients exist inthe watershed.

30 Marys River Preliminary Watershed Assessment Ecosystems Northwest
Sediment and Conductivity
Turbidity collected in the Marys River by the City of Philomath show a range of 5 NTUat low flow to 80 NTU during storm runoff. Turbidity measured at the mouth of theMarys River ranged from 2 to 53 NTU and conductivity at the same site ranged from61-166 micromhos. Conductivity at Marys River mouth followed the same pattern asat Rock Creek: highest in the summer when turbidity was low and lowest in the winterwhen turbidity was high (Rock Creek is described later). Upstream in the Marys Rivernear Wren, conductivity was lowest (45) in February and peaked (85) in October(Sternadel, pers. comm.).
Ecosystems Northwest performed a one-day turbidity sampling, using grab samplescollected on the declining limb of a storm hydrograph in February, 1999 (Table 6). Atthe time of sampling, the vertical visibility in the stream was also assessed. Theturbidity was generally lower in the tributaries and increased downstream towards themouth of the Marys River. One exception is the higher turbidities in Greasy Creekthan the Marys River at Highway 34. The storm that was sampled was the secondand smaller of two large storms that occurred during the month of February. Watervisibility during the first storm was much reduced, particularly in the smaller tributaries.
Table 6: Marys River water quality sampling conducted by Ecosystems Northwest on2/25/99.Site Turbidity (NTU) Visibility (inches)Norton Creek @ Hwy 20. 4.9 18Tum Tum River @ Tum Tum Road. 6.0 9-12Rock Creek @ Hwy 34. 6.1 18Greasy Creek @ Grange Hall Road. 11.0 9-12Marys River @ Harris Bridge on Shotpouch Rd. 5.7 9-12Marys River @ Hwy 34. 7.7 9Muddy Creek @ Airport Road. 12.0 9Marys River @ Hwy. 99. 18.0 6
Muddy Creek and Tributaries Water Quality
No data are available to determine the reference, or historic, water quality of theMuddy Creek sub-basin. However, according to the Benton Foothills WatershedAnalysis (BFWA, BLM 1997), the historic or reference water quality of Muddy Creekvaried during wet and dry climatic cycles. The BFWA speculates that high-gradient,upland tributaries experienced pulses of sediment and nutrients during winter stormsand following intense forest fires. As it flowed into the lowlands, Muddy Creekhistorically was a low-velocity stream with an unconfined valley and extensivewetlands. Upslope pulses of sediments likely controlled water chemistry in the past.
Recent information about water quality for the Muddy Creek sub-basin is limited to twosets of data: one collected during baseflow conditions in October 1995, and a secondcollected during storm flow in January and February 1996 (Eilers and Vache 1996).

Ecosystems Northwest Marys River Preliminary Watershed Assessment 31
The baseflow chemistry and stormflow bacteria are summarized in Tables 7 and 8.The stormflow chemistry is shown in Figures 7-9 in Appendix 3.
Pertinent results by water quality category are discussed for Muddy Creek andtributaries, based on Tables 7 and 8 and on other studies as cited.
Table 7: Analytical chemistry results from baseflow sampling of 10 sites in Muddy Creeksub-basin collected on during baseflow conditions during the second week of October 1995(Eilers and Vache 1996). Abbreviations and units are the same as those in Table 5.
Site pH ALK COND TSS TP PO4 NO3 NH4 TKN Ca Mg Na K SO4 Cl SiBeaver Creek @Bellfountain Rd.
7.4 28 63 4 0.06 0.03 0.04 <.02 <.02 4.9 1.9 4.5 0.7 0.8 4 9
Beaver Creek @Beaver Cr. Rd.
7.2 30 63 2.6 0.07 0.03 0.04 <.02 <.02 5.3 1.8 4.2 0.5 0.5 3.5 8
Gleason Creek@ Gleason Rd.
7.4 31 66 3.6 0.07 0.03 0.05 <.02 <.02 5.5 2 4.4 0.5 0.7 3.3 6
Oliver Creek @Bellfountain Rd.
7.3 25 63 3.4 0.09 0.02 0.05 <.02 <.02 4.5 2 4.7 0.9 0.6 5.9 9
Reese Creek @Bellfountain Rd. 7.0 46 112 21 0.44 0.00
9 0.09 1.19 3.1 10 4.4 5.2 3.4 0.5 10 6
Bull Run @Bellfountain Rd. 6.6 16 54 3.2 0.11 0.02 <0.0
2 <.02 0.5 2.9 1.6 4.3 1.6 1.3 6.1 5
Muddy Creek @Airport Rd.
7.3 20 65 8.2 0.11 0.04 0.03 <.02 0.3 4.6 2.2 4.4 1.3 1.2 5.3 7
Muddy Creek @Greenberry Rd.
7.0 22 60 6.8 0.1 0.04 0.05 <.02 0.3 3.7 2 4.4 1.3 0.6 5.5 7
Muddy Creek @Alpine Rd.*
7.2 19 47 8.1 0.06 0.01 0.04 <.02 0.3 2.9 1.7 3.9 0.8 0.4 4 7
Muddy Creek @Bruce Rd. *
7.3 23 60 23 0.1 0.04 0.09 0.04 0.4 3.5 2 4.4 1.3 0.6 5.5 7
*average of duplicate samples
Table 8: Muddy Creek and tributaries water quality data collected during baseflowconditions during the second week of October 1995 and during a stormflow event inJanuary 1996 (Eilers and Vache 1996). TC is total coliform bacteria, FC is fecal coliformbacteria; units are MPN/10 mL.
October 1995* Jan. 3, 1996Sample
TimeTemp(0C)
DO(%)
DO(mg/L) pH
Cond(µS/cm) TC FC
Beaver Creek @ Bellfountain Rd. 1350 10.0 100 11.34 7.17 47 200 200Beaver Creek @ Beaver Cr. Rd. 1510 8.9 97.5 11.30 7.24 64 200 200Gleason Creek @ Gleason Rd. 1445 11 66.6 7.35 7.02 65 400 200Oliver Creek @ Bellfountain Rd. 1520 10.3 98.2 11.01 7.06 63 800 200Reese Creek @ Bellfountain Rd. 1650 10.2 26.5 2.98 6.6 129 800 200Bull Run @ Bellfountain Rd. 1335 10.0 58.0 6.55 6.73 54 1300 200Muddy Creek @ Airport Rd. 1312 9.5 89.3 10.19 7.02 66 1300 200Muddy Creek @ Greenberry Rd. 1500 8.4 103 12.05 7.21 66 1300 200Muddy Creek @ Alpine Rd. 1610 9.6 90.2 10.28 7.03 45 400 200Muddy Creek @ Bruce Rd. 1520 11.3 73.1 8.01 6.73 60 200 200
* Eilers and Vache (1996) mistakenly listed a collection date of October 16, 1996 in their original table. The originaltext lists the collection date as October 1995.

32 Marys River Preliminary Watershed Assessment Ecosystems Northwest
Temperature
Data in Table 8 were collected in October when temperatures are not normally high.Another study of water temperature in Oliver Creek (Robison et al. 1995) showed a 7-day average maximum water temperature of 58.1 F at a site downstream of a clearcut.While both studies suggest that waters in the Muddy Creek sub-basin are cool, BFWA(BLM 1997) cites concerns about temperature in the lower portions of Muddy Creek.
Bacteria
All ten Muddy Creek sites had fecal coliform counts of 200 counts MPN/10 mL. MPNrepresents “most probable number” and is analogous to plate counts used todetermine fecal coliform levels. MPN is typically reported as MPN/100mL, rather than10 mL as in Table 8. It was not verified with the report authors if this unit was listed inerror.
Dissolved Oxygen and pH
Dissolved oxygen was below 8 mg/L at three of the sites in Table 8. The percentsaturation of dissolved oxygen at these same sites was 26-66%. All ten sites in Table7 had pH between 6 and 7.
Nutrients
Table 7 indicates relatively high concentrations of dissolved nutrients in Reese Creekcompared to the other creeks. Reese Creek also showed relatively high total- (TKN)and NH4-nitrogen concentrations. This information, in conjunction with low DO levelsand elevated bacteria levels, suggest the presence of organic constituents. Theseorganics may be from elevated soil erosion, untreated sewage, or animal wastes.However, these data represent a single sample collection and are only a “snapshot” ofthe stream condition.
Sediment
Table 6 shows several sites with elevated suspended solids during baseflow. Inparticular, Reese and Muddy Creek at Bruce Road sites had TSS in excess of 20mg/L. Storm flow sediment data for Oliver, Beaver and Muddy Creek are discussedfurther with soils in Chapter 5.
According to the BLM, water quality in the Muddy Creek basin is “probably moderatelyto highly degraded from reference condition.” A main concern in forested uplandareas is turbidity and suspended sediment, particularly chronic inputs of finesediments from road and trail surfaces. There is an overall trend for increasing

Ecosystems Northwest Marys River Preliminary Watershed Assessment 33
pollutant levels, particularly from rural development in the agricultural lowlands.Suspended sediment and turbidity, stream temperature, dissolved oxygen duringsummer, and coliform bacteria in agricultural lowlands were identified as the greatestconcerns for maintenance of water. “While data are available to characterizesediment and turbidity, there aren’t enough data to verify the potential temperatureand coliform bacteria issues. Reese Creek, Beaver Creek, and mainstem MuddyCreek appear to have the poorest water quality conditions” (BFWA, BLM 1997).
Rock Creek Water Quality
Data from the City of Corvallis watershed including Rock and Griffith creeks provide apicture of water quality in a relatively high-elevation basin with relatively few humanimpacts.
Samples have been taken approximately once a month since 1986 (City of Corvallis1998). The following analyses have been performed: fecal coliform bacteria (FC),temperature (Temp), pH, dissolved oxygen (DO), alkalinity (Alk), conductivity (Cond),turbidity (Turb) and total suspended solids (TSS). Data are available from fivelocations in the City of Corvallis Watershed: Griffith Creek, North Fork Rock Creek,South Fork Rock Creek, the Rock Creek water supply intake, and lower Rock CreekPark. An examination of the average values by month over the period of record forthe four Rock Creek sites showed similar patterns, so only Rock Creek Park andGriffith Creek data are presented here (Figures 8a and 8b). The following paragraphsdiscuss water quality of the Rock Creek sub-basin and refer to the aforementionedfigures.
Temperature
Temperatures in Rock Creek Park and Griffith Creek are coolest in January andFebruary, averaging approximately 43°F, and increasing to just below 60°F in August.These temperatures reflect high elevation and abundant vegetation coverage in theCity of Corvallis watershed. Temperature is not a water quality concern in thesestreams.

34 Marys River Preliminary Watershed Assessment Ecosystems Northwest
Figure 8b: Water quality for Griffith Creek.
0
2
4
6
8
10
12
14
16
Oct Nov Dec Jan Feb Mar Apr May Jun Jul Aug Sep
Tur
b, D
O, p
H, T
SS
0
20
40
60
80
100
120
140
160
Con
d, F
C, T
emp,
Alk
Turb (NTU)
DO (mg/L)
pH
TSS (mg/L)
Cond (uS/cm)
FC (cts/100ml)
Temp (F)
Alk (mg/L).
Figure 8a: Water quality for Rock Creek Park.
0
2
4
6
8
10
12
14
16
Oct Nov Dec Jan Feb Mar Apr May Jun Jul Aug Sep
Tur
b, D
O, p
H, T
SS
0
20
40
60
80
100
120
140
160
Con
d, F
C, T
emp,
Alk
Turb (NTU)
DO (mg/L)
pH
TSS (mg/L)
Cond (uS/cm)
FC (cts/100ml)
Temp (F)
Alk (mg/L).
Ecosystems Northwest Marys River Preliminary Watershed Assessment 35
pH, Alkalinity, Conductivity, and Dissolved Oxygen
There is little seasonal variation in pH (7.2-7.4) in either of the Rock Creek streamsthroughout the year. Alkalinity, which likely reflects dissolved calcium from bedrock,is diluted in winter months (about 30 mg/L) after peaking during summer months (40-70). An increased concentration of ions is also reflected in the rise in conductivityduring the summer after dilution in the winter. This trend is particularly apparent onRock Creek Park where winter conductivity of 81 rises to summer conductivity of 150(Figure 8a). Griffith Creek has both lower alkalinity and conductivity than Rock CreekPark. Dissolved oxygen (DO) remains high throughout the year (8.0 - 11.5 mg/L).Some depression of DO in summer months may simply be due to the warmertemperatures and lower capacity of the water for holding dissolved oxygen.
Sediment
Total suspended solids (TSS) and turbidity in Rock Creek Park and Griffith Creek bothincrease during winter high flows and decrease during summer low flows. TSS peaksat 6.5-8.0 mg/L on all Rock Creek streams except for Griffith Creek, which reachesonly 2.0 mg/L in the winter. Turbidity follows the pattern for suspended solids andpeaks at 5-6 NTU. Again, Griffith Creek peaks at a lower value of 2 NTU. Overall, theCity of Corvallis watershed does not produce large amounts of sediment.
Bacteria
Monthly averages over the 12-year period of record, show that fecal coliform (FC) islowest (70-90 counts/100 ml) in December through April in Rock Creek Park andGriffith Creek (Figures 8a and 8b). Fecal coliform peaks in August and values arehigher in Rock Creek Park (150) than Griffith Creek (96). The higher summer valuesin both streams are likely due to the combined effect of increased concentrationresulting from lower stream flow and greater in-stream production of bacteria in ahigher-temperature environment.
Throughout 1997, weekly samples were collected for fecal coliform analysis at the fiveCity of Corvallis Watershed sites, providing a detailed baseline record of bacterialevels. Monthly averages of these data show the same general patterns in 1997 asthose for the 12-year period of record (Figure 9). Fecal coliform is uniformly low (<5counts/100ml) on all streams from December through April. In spring and summer,FC counts increase on all but North Fork Rock Creek, rising to 150 at Rock CreekPark, 47 on South Fork Rock Creek and 18 on Griffith Creek. On August 20, 1997, anindividual sample of FC was 215 counts/100 ml on Rock Creek Park. The absence ofwastewater outfalls, septic tanks, or large grazing allotments in the watershedindicates the wildlife is a likely source of fecal coliform

36 Marys River Preliminary Watershed Assessment Ecosystems Northwest
in this sub-basin. This is important for the 303(d) listing for bacteria on the MarysRiver because “natural” conditions may result in high background levels of FC.
Figure 9: Fecal coliform bacteria sampled from Rock Creek sub-basin streams, 1997.
Other Relevant Water Quality Studies in the Willamette Basin
Many water quality studies have been conducted in the Willamette Basin that eitherinclude the Marys River Watershed or contain findings that can be extrapolated to theMarys River Watershed. Information about these studies is provided in the annotatedbibliography. Study topics include as non-point source data for urban and agriculturalareas (DEQ 1988), nutrient and water quality data for groundwater and surface water(Bonn et al. 1995), nutrient and pesticides in surface waters (Rainless and Janet1998), sediment, nutrients and pesticides in runoff from cropland (Harward 1980),dioxins and furans in streambed sediments and issue samples (Bonn 1998), and asummary of recent water quality reports on the Willamette River (Tetra Tech 1995).
Withdrawals
Water availability reports were run according to the guidelines of the WatershedAssessment Manual (NonPoint Solutions 1999). These reports are an attempt todetermine if stream basins may be over-allocated with respect to permitted waterwithdrawals. The reports were run through a web site of the Water ResourcesDepartment (Appendix 1). Figures 10 through 12 show the projected mean monthlyinstream flow, the instream rights (amount of flow that should be left in the stream foraquatic life and stream functions), and combined instream rights plus allocated
0
20
40
60
80
100
120
140
160
OctNov Dec Ja
nFe
bMar Ap
rMay Jun Ju
lAu
gSe
p
Month
Fec
al c
olifo
rm (
coun
ts/1
00 m
l)
Rock Cr PkGriffith CrRock Cr IntSouth ForkNorth Fork

Ecosystems Northwest Marys River Preliminary Watershed Assessment 37
consumptive rights (i.e., that which should be left in the stream plus that which isallocated for withdrawals). When combined allocation surpasses streamflow, thestream is over-allocated. Figures 10-12 show highly seasonal instream flows, andover-allocations of flow in all three streams during the low-flow summer months. Alsonote that even without the consumptive withdrawals, the instream rights can exceedthe projected flow. Because not all water rights are exercised to their maximum, theamount of water permitted for withdrawal is likely more that what is actually withdrawn.These results deserve further attention as they suggest that the stream flows areexcessively low in summer to impact aquatic resources and that withdrawalsexacerbate the potential problems. One might want to examine the accuracy of theprojected flows and determine why they are significantly lower than the gaged flowsshown in Figure 3.
Figure 10: Water availability reports for Marys River. This and the next two graphsshow the projected stream flows by month, the amount of instream rights and theinstream rights plus that allocated to water users. Where the combined allocationexceeds instream flow during the summer months, the stream is over-allocated andshort of water for aquatic functions (from water availability reports of the WaterResources Department).
W a t e r A v a i l a b i l i t y f o r M a r y s R i v e r a t m o u t h
0
1 0 0
2 0 0
3 0 0
4 0 0
5 0 0
6 0 0
7 0 0
0 2 4 6 8 1 0 1 2
M o n t h
Flo
w in
cfs
I n s t r e a m f l o w
I n s t r e a m r i g h t s
I n s t r e a m + a l l o c a t e d

38 Marys River Preliminary Watershed Assessment Ecosystems Northwest
Figures 11 and 12: Water availability reports for Muddy Creek (top) and Blakesley Creek(bottom). Maximum stream flows are over 400 cfs in Muddy Creek and 250 cfs inBlakesley Creek. Potential over-allocation of stream flow occurs during summer forboth streams.
W a t e r A v a i l a b i l i t y f o r B l a k e s l e y C r e e k a t m o u t h
0
1 0
2 0
3 0
4 0
5 0
6 0
7 0
8 0
9 0
1 0 0
0 2 4 6 8 1 0 1 2
M o n t h
Flo
w i
n c
fs
I n s t r e a m f l o w
I n s t r e a m r i g h t s
I n s t r e a m +a l l o c a t e d
W a t e r A v a i l a b i l i t y f o r M u d d y C r e e k a t m o u t h
0
1 0
2 0
3 0
4 0
5 0
6 0
7 0
8 0
9 0
1 0 0
0 2 4 6 8 1 0 1 2
M o n t h
Flo
w in
cfs
I n s t r e a m f l o w
I n s t r e a m r i g h t s
I n s t r e a m +a l l o c a t e d

Ecosystems Northwest Marys River Preliminary Watershed Assessment 39
Table 9 depicts the uses of surface water in the watershed. The Rock Creek Facilityfor the municipal watershed produces about 3 million gallons of water daily, which isabout 39% of the water supplied to the City of Corvallis. Table 10 is a list of permittedsurface water withdrawals by sub-basin for the Marys River Watershed.
Table 9: Water rights1 for Marys River Watershed (WRD unpublished data, citedin Wevers et al. 1992).Total diverted Water use (percent by class)
Agricultural Municipal Use Industry Domestic
155 cfs 87 12 <1 <11A water right is the amount of water legally allotted to users, not necessarily the amount actually used.
Table 10: Points of surface water diversion by sub-basin within the Marys RiverWatershed (WRD unpublished data queried in 1998).
Sub-basin Acre-feet CFS Gal/
min Sub-basin Acre-feet CFS Gal/
min
BARK CREEK 4 MUDDY CREEK 446.38 38.23BEAVER CREEK 3.06 5.075 MULKEY CREEK 0.01BLAKESLY CR 0.022 N FK ROCK CREEK 4.7BOONEVILLE CR 0.26 NEWTON CREEK 1028 0.58BROWN CREEK 0.02 NORTON CREEK 1BULL RUN CR 94.85 1.085 OAK CREEK 0.033 0.29DEVITT CREEK 0.9 OLIVER CREEK 123 6.23 3.61EVERGREEN CR 5 0.38 POWELL CREEK 0.01 2.6GELLATLY CR 0.02 RAINBOW CREEK 3.2 0.09GRAY CREEK 20.2 RAMBO CREEK 0.09GREASY CREEK 263.73 4.75 READ CREEK 0.012HAMMER CREEK 2 0.55 REESE CREEK 0.095HARVEY CREEK 0.03 ROCK CREEK 4 1736HAWLEY CREEK 0.08 S FK BULL RUN CR 3HIDE CREEK 0.02 SHOTPOUCH CREEK 0.03HORTON CREEK 3.1 0.36 SQUAW CREEK 382 0.695HULL CREEK 9 STARR CREEK 105.2 0.172HYMES CREEK 0.01 TUM TUM RIVER 742.2 3.9LA BARE CREEK 0.04 W FK MARYS R 0.08LARSEN CREEK 1.38 0.065 WELLS CREEK 0.1 0.05MARYS RIVER 342.36 65.87 53.1 WESTWOOD CREEK 0.16MERCER CREEK 0.14 WESTWOOD CREEK 0.56 0.01MILLER CREEK 0.02 WOODS CREEK 0.076
Acre-feet CFS
Gal/min
TOTALS 3584 138.1 1795

40 Marys River Preliminary Watershed Assessment Ecosystems Northwest
Greenberry Irrigation District
The Greenberry Irrigation District is a government entity that operates under theauthority of the Irrigation District Laws of Oregon. The district is located north ofFinley Wildlife Refuge along most of Muddy Creek to the confluence with the MarysRiver. It is composed of 55 members with about 13,000 acres in land holdings. Thedistrict coordinates and facilitates local water use, and conservation and enhancementefforts. The group is currently in the process of completing an environmentalassessment with the Bureau of Reclamation. They are also negotiating with the FinleyNational Wildlife Refuge to transport some or all of a 5,000 ac/ft water allotment therefuge has in storage in Fern Ridge Reservoir for use on refuge farm land and wetlandenhancement.
Groundwater Quality
Limited data are available on groundwater quality in the Marys River Watershed.Muddy Creek sub-watershed groundwater quality is generally good but there is someevidence of coliform bacteria (USGS 1974). The Benton County EnvironmentalAssessment Priority List records known and suspected health hazards andenvironmental problems in the Benton County. This list includes three onsite sewagedisposal sites, drinking water including low yields and contamination clusters. TheOSU Cooperative Extension Service in Corvallis and Benton Soil and WaterConservation District in Tangent currently are conducting a domestic groundwatertesting and outreach program (M. Livesay, pers. comm.).
Groundwater Studies in the Willamette Basin
Groundwater is recharged primarily from precipitation that falls in the Coast Rangeuplands and foothills, and on the valley floor. Some groundwater flows below the soilsurface and enters the Willamette River and tributaries such as Marys River andMuddy Creek (Gannet and Woodward 1997). Groundwater resources in the MuddyCreek sub-watershed are concentrated in unconsolidated sediments deposited next toMuddy Creek and its tributaries. This aquifer yields moderate to large quantities ofwater (500 gal min-1) sufficient for irrigation (USGS 1974).
Evidence gathered in a 1993-1995 study conducted in Willamette Basin indicates thatthere is concern of nitrate contamination of shallow wells developed in alluviumagricultural areas (Hinkle 1997). The domestic wells sampled in that study were allless than 80 feet deep and were developed in alluvium. Nitrate concentrations rangedfrom less than 0.05 to 26 mg N L-1. Nine percent of wells sampled exceeded the 10-mg N L-1 standard.
Thirteen different pesticides were detected in the 1993-1995 study of shallowgroundwater, but concentrations were low (generally less than 1000 ng L-1), with only

Ecosystems Northwest Marys River Preliminary Watershed Assessment 41
1 detection (dinoseb) exceed USEPA standards (Hinkle, 1997). Atrazine was themost frequently detected pesticide.
Summary
The lack of a systematic, long-term monitoring program in the Marys River Watershedlimits evaluation of water quality. An important consideration for future assessmentefforts will be development of a monitoring program for water quality and quantitythroughout the watershed. Because of natural variation in flow and water qualitycharacteristics, these efforts will be most valuable if they can be maintained forperiods spanning more than a single water year. Future Marys River WatershedCouncil projects could provide important water quality data for which data are nowlimited.
The water quality screening process with a focus on 303(d) listed parameters ofbacteria, temperature and flow modification suggests that the listings accurately reflectMarys River characteristics in relation to Oregon criteria. Bacteria counts showcontamination in Oak Creek, and to a lesser extent in Squaw Creek, Lower MarysRiver, and the tributaries in Muddy Creek. Point sources such as the Philomathsewage treatment lagoons do not appear to be important sources of coliform bacteria,while runoff from livestock operations are likely important sources. Summer increasesin fecal coliform bacteria measured in the City of Corvallis Watershed show thatbacteria can be found in the absence of anthropogenic sources. Temperature datafrom Marys River and major tributaries in 1998 show that temperature did exceed the64°F criteria well upstream of the valley floor. While loss of stream shading wasshown to increase temperature in one location in 1995, the 1998 data show thattemperatures above 64°F may be occurring naturally. For flow modification, a simplecomparison of existing water rights versus averaged stream discharge shows that allMarys River water is over-allocated during low flow periods. This would represent aserious concern if all users took their allotment in a dry year. Other water qualitymeasurements from Marys River and tributaries do not show any areas of seriousconcern. However, nitrogen and phosphorus data from DEQ suggest anthropogenicsources of these nutrients.
Future efforts to more accurately assess the natural versus anthropogenic effects onwater quality in the Marys River Watershed are necessary for understandingenhancement projects that will rectify 303(d)-listed parameters. More extensivespatial and temporal monitoring efforts will be important for identifying possiblesources of other pollutants.

42 Marys River Preliminary Watershed Assessment Ecosystems Northwest
CHAPTER 4: AQUATIC AND TERRESTRIAL HABITAT
This chapter describes what is known about fish and aquatic habitat in the MarysRiver Watershed. It also presents lists of other sensitive species. Much of the datawas obtained from Oregon Department of Fish and Wildlife (ODFW), OregonDepartment of Forestry (ODF), Oregon State University (OSU), Oregon NaturalHeritage Program (ONHP), communications with experts, and a review of theliterature. There are a number of sources of information about the habitat and speciesof the Marys River. However, a still incomplete picture remains because most of theinformation is of a qualitative nature as opposed to a quantitative nature. This isparticularly true for species abundance and distribution.
Fish Diversity and Sensitive Species
The Marys River Watershed is home to as many as 20 native and 14 introduced fishspecies (Table 11).
Table 11: Fish species known to have occurred in the Marys River and itstributaries.Native species: Introduced species:Common name Scientific name Common name Scientific namecutthroat trout * Oncorhynchus clarki Coho salmon * Oncorhynchus kisutchChinook salmon O. tshawytscha Steelhead * 1 O. mykissPacific lamprey Lampetra tridentata Brown trout * Salmo truttabrook lamprey L. richardsoni Brown bullhead Ameiurus nebullosusmountain whitefish * Prosopium williamsoni Mosquitofish Gambusia affinisredside shiner * Richardsonius balteatus Common Carp Cyprinus carpioNorthern squawfish * Ptychocheilus oregonensis Yellow perch Perca flavescensleopard dace * Rhinichthys falcatus Smallmouth bass * Micropterus dolomieuspeckled dace * R. osculus Largemouth bass M. salmoideslargescale sucker * Catostomus macrocheilus White crappie Pomoxis annularismountain sucker * C. platyrhynchus Black crappie P. nigromaculatusOregon chub Oregonichthys crameri Warmouth sunfish * Lepomis gulosussandroller * Percopsis transmontana Bluegill sunfish * L. macrochirusthreespine stickleback * Gasterosteus aculeatus Pumpkinseed L. gibbosuschiselmouth * Acrocheilus alutaceuspeamouth * Mylocheilus caurinusreticulate sculpin * Cottus perplexustorrent sculpin * C. rhotheusPaiute sculpin * C. beldingiprickly sculpin C. asper
Sources:Altman et al. 1997. Review of numerous reports.* Personal communication, C. Hill, Fish Collection Museum, Oregon State University. Presence in Marys River
Watershed established from collected specimens.1 Native status of steelhead is uncertain.
Eight fish species are discussed below because they are considered “sensitive” in thateither they face some known level of challenge to their continued population levels orthe existing information on the condition of their population is limited. The OregonHeritage Foundation has identified that five of these species may occur in the Marys

Ecosystems Northwest Marys River Preliminary Watershed Assessment 43
River Watershed (Table 12). Coho salmon and steelhead, while not thought to haveoccurred naturally in the basin (C. Bond and K. Jones, pers. comm.), are discussed tohighlight some of the conflicting information about their native status. ODFW considerstwo additional species worthy of notice due to lack of information on their status:cutthroat trout and sandrollers.
Table 12: Fish species in the Marys River Watershed with some level of sensitivestatus (Source: Oregon Natural Heritage Program).Common Name Scientific Name Fed.
statusNotes:
winter steelhead O. mykiss LT Introduced, but native status uncertain; see discussion below.
spring chinook O. tshawytscha LT Juveniles observed in basin. Not thought to have supportedspawning runs, but see discussion below.
coho salmon Oncorhynchuskisutch
CIntroduced but no longer thought to occur in the basin; notthought to have been native, but see discussion below.
Oregon chub Oregonichthyscrameri
LE Occurs in Grays Creek in the Finley National Wildlife Refuge.
Pacific lamprey Lampetratridentata
SoCFound in Muddy Creek (BLM 1997) and in Oak Creek (C.Bond, pers. comm.)
SoC=Species of Concern, C=Candidate Species , LT=Listed Threatened LE=Listed Endangered
Steelhead and Rainbow Trout
In March 1999, winter steelhead were listed as “Threatened” under the FederalEndangered Species Act (ESA) in the Upper Willamette River. It is not knownwhether the Marys River will be included in the critical habitat designation by NationalMarine Fisheries Service (NMFS). Although steelhead are listed as introduced inTable 11, discussion is ongoing about whether steelhead were native to the westsidedrainages of the Willamette River (S. Mamoyac, K. Jones, ODFW Corvallis, pers.comm.). The uncertainty about the original range of the steelhead is due to thecomplex life history of this species, lack of definitive survey data, and widespreadstocking of non-native steelhead.
Historically, Willamette Falls at Oregon City was a selective migration barrier, whichwas passable during high flows, to anadromous salmonids. Native winter steelhead,which enter fresh water in March and April (Howell et al. 1985), were able to negotiateWillamette Falls (Collins 1968), as were spring chinook salmon. While no furtherobstacles blocked steelhead from accessing the west slopes of the Willamette, thespecies prefers higher-gradient eastslope streams flowing from the westernCascades. Small numbers of native winter steelhead are thought to have used CoastRange drainages of the Willamette (Wevers et al. 1992). Occasional reports ofsteelhead in the west sub-basins were made prior to the recent ODFW stockingprograms (Dimick and Merryfield 1945; Willis et al. 1960 cited in Wevers et al. 1992).“Wanderers” also may have appeared in the westside streams (K. Jones ODFW,Corvallis, pers. comm., Federal Register Vol. 63 No. 46, Tuesday, March 10, 1998 pp.800). Fish ladders were added at Willamette Falls as early as 1885 to facilitate thepassage of fish species, with major improvements to these ladders in 1971 (Bennett1987; PGE 1994; Cited from Fed. Reg. Vol. 63, No. 46. Tuesday, March 10, 1998 pp.

44 Marys River Preliminary Watershed Assessment Ecosystems Northwest
1800). Fish ladders allowed the successful introduction to the Willamette Basin ofSkamania stock summer steelhead and early-migrating Big Creek stock wintersteelhead, as well as coho salmon.
Steelhead were stocked throughout the Willamette Basin, including the Marys River.ODFW released adult winter steelhead to the Marys River basin from 1968 through1973. These releases consisted of approximately 200 adult fish per year of Big Creekand Klaskanine hatchery stock. From 1985 to 1990, between 15,000 and 30,000 frysteelhead were released annually (Wevers et al. 1992). Releases were made toWoods Creek, Shotpouch Creek, Greasy Creek, and Rock Creek (Map 11).Steelhead redds have been documented in Greasy Creek (RM 0 to 8.8), Rock Creek(RM 0 to 3.7) and South Fork Rock Creek (RM 0 to 2.0). The last knowndocumentation of steelhead in the Marys River was in 1992, when fry wereelectroshocked at the mouth of Rock Creek (S. Mamoyac, pers. comm.). The geneticorigins--whether of the recent stockings, of spawning hatchery stock, or from nativespawning--is uncertain, but ODFW is currently in the process of genetic testing todetermine the origins of young steelhead on the westslope Willamette streams. Earlyresults suggest that they have a mix of both native and hatchery genes (S. Mamoyac,pers. comm.).
Resident rainbow trout are not thought to be native to the westslope drainages of theWillamette River. Releases of Roaring River hatchery rainbow trout have been madein these drainages since the 1920’s to provide a sport fishery. While there is noevidence of natural production of rainbow trout from hatchery releases (Wevers et al.1992), stocked rainbow possibly may have resulted in a small number of returningsteelhead (C. Bond, pers. comm.). The status of Upper Willamette winter steelheadpopulations has prompted changes to the sport fishing for rainbow trout and otherspecies in the Marys River. Stocking of legal-sized trout has been discontinued. Theopening of fishing season for trout has been delayed one month, until early May, anda catch-and-release program is being instituted. No bait fishing will be allowed.
Cutthroat Trout
Cutthroat trout are thought to be the only native trout occurring in the westslopedrainages of the Willamette River. While four life-history types occur in the coastalcutthroat trout (resident, fluvial, adfluvial, and anadromous), only two of these typesoccur naturally in the west slope streams of the Willamette River. Resident cutthroatare those that live the entire year in a single pool or set of pools, are widespread, andare the dominant trout in the headwater streams of western Oregon (Hooton 1997).The likely distribution of resident cutthroat in the watershed is shown in Map 12, butmay underestimate of the full distribution of the cutthroat trout. Larger, fluvial cutthroatcomplete in-river migrations between small spawning tributaries and main riversections such as the Willamette. Populations of fluvial cutthroat in the Marys Riverapparently were large in the recent past, and were observed leaping a dam on thelower river during November 1955 (Nicholas 1978; cited from Wevers 1992). Adfluvial

Ecosystems Northwest Marys River Preliminary Watershed Assessment 45
cutthroat trout may have occurred when fluvial migrations were blocked by the NorthFork impoundment on Rock Creek. Dam personnel found 21” cutthroat in thereservoir bottom after the reservoir was drained to control aquatic vegetation (Trask1995)
The consistent presence of resident cutthroat in a wide array of streams, theoccurrence of multiple age classes, and the numerous independent populations thatexist above impassable barriers to downstream fish suggest that resident cutthroatpopulations are secure in most coastal streams in Oregon (Hooten 1997). Yet,cutthroat trout, which require stream complexity (Table 13), may be declining inwestern Oregon streams where habitat has been lost and pool complexity hasdecreased (Reeves et al. 1997). A lack of information about the status of cutthroat,especially the fluvial types, in the westslope drainages of the Willamette make them astock of concern for the ODFW (Wevers et al. 1992). Fluvial populations generallyinhabit the larger, lower-gradient stream channels, from which they enter theWillamette River. Habitation of the Willamette River exposes cutthroat to hatcherytrout and to the parasite Ceratomyxa shasta, which is widespread in the mainstemWillamette.
A better understanding of the status of cutthroat trout in the Marys River Watershedwould provide a useful gauge of habitat conditions, as cutthroat are a good indicatorspecies of stream condition. As a first step, the refinement of Map 12 should beaccomplished using the surveys already completed by state agencies.
Table 13: General considerations for cutthroat trout habitat requirements.
• Oriented towards pools versus riffles, and use cover such as woody debris (jams and logs) andoverhanging banks.
• Adults prefer intermediate stream velocities (1 ft/sec or slower) and deeper water.
• Fry use slower water and are often associated with complex lateral habitats.
• Juveniles may be outcompeted by juvenile steelhead or coho in areas that lack sufficient cover.
• Optimum temperatures for juveniles is 60°F; the ability to swim is lost at 82°F.
• Juveniles have been known to remain in a single pool for several years or to make significantmigrations within a basin.
• Frequently attain large size in beaver ponds.
The cutthroat homepage: http://www.orst.edu/ Dept/ODFW/conference/cuthab.html. March 1999.
Chinook Salmon
Spring chinook historically were able to negotiate Willamette Falls during high flows(Collins 1968) and are a native anadromous fish to the upper Willamette River. SpringChinook in the upper Willamette were listed as “Threatened” under the ESA in March1999. A decline in the abundance of these fish is attributed to reduced habitat

46 Marys River Preliminary Watershed Assessment Ecosystems Northwest
coverage and quality, and suspected over-harvesting of native fish for a large hatcheryprogram.
A photograph taken in the 1920s shows a string of salmon reportedly caught from theMarys River in the area near Harris covered bridge above the community of Wren(Appendix 4, Photo 4). The two men are the grandfather and father of Bobby Taylor, aWren resident. The large heads, hooked jaws, dark bodies, and the long anal finssuggest they are chinook according to Dr. Carl Bond, OSU professor of fisheries(pers. comm.). Yet Bond, and other experts consulted, do not believe these fish camefrom the Marys River as spring chinook never used the Marys River for spawninghabitat. Taylor relates that, as a child, his father told him that the fish were chinook,which commonly were speared with pitchforks in a pool on the family homestead. Thepool was created by placing rocks into the river and felling a tree across this “dam.”By the 1940’s when his father told the story to Taylor, no salmon inhabited the MarysRiver. Bond reports that his major professor, Roland Dimick, lived in the area in the1920’s and would have known if there were salmon in the Marys River. According toBond, it was Dimick’s opinion that chinook had never used the Marys River or otherwestslope drainages. Bond has also spoken with numerous old-timers on this topicand none reported seeing adult chinook in the river.
Despite this apparent discrepancy over adult use of the Marys River by chinook,juveniles have been observed in the lower mainstem up to Greasy Creek and in OakCreek (S. Mamoyac, Corvallis ODFW, and M. Wade, Springfield ODFW, pers.comm.). It is likely that the Marys River provides over-wintering and rearing habitatfor juvenile chinook spawned in the mainstem of the Willamette or other tributaries.
Coho Salmon
Coho salmon are not native to the Willamette River above Willamette Falls. However,they have been in the basin for almost 80 years as a result of introductions that startedin the1920’s (Wevers et al. 1992). In 1958, ODFW began a larger stocking program,introducing Toutle, Cowlitz or other hatchery-origin coho into several Marys Rivertributaries over a 30-year period. In the first 10 years of this program, nearly fourmillion smolts and fry plus 1700 adults were released. During the next 10 years,nearly 0.9 million fry or fingerlings were released. In the remaining ten years, releasestotaled 1.4 million fry or fingerlings. The area of releases were in Oak Creek,Shotpouch Creek, Rock Creek, and Greasy Creek (Map 13). The stocking programfailed to establish a major fishery in these streams or elsewhere in the UpperWillamette.
Oregon chub
Oregon chub was listed as endangered under the ESA by the US Fish and WildlifeService in 1993. The Oregon chub occurs only in the Willamette and Umpqua basins,

Ecosystems Northwest Marys River Preliminary Watershed Assessment 47
and the Umpqua Oregon chub is taxonomically distinct from Willamette populations(Markle et al. 1991). The preferred habitat of the Oregon chub is quiet water such assloughs and overflow ponds at low elevations in the Willamette Valley (Dimick andMerryfield 1945). Much of the historic range of these fishes has disappeared in theWillamette River and its tributaries because of the construction of flood control dams,channelization of the river and channel cleaning for the purpose of navigation (Sheerer1998). In addition to the loss of habitat, introduced species may inhibit theestablishment of new populations of chub, which colonize during high-flow events. Atapproximately half of the known population sites of Oregon chub, non-native fish arepresent.
Currently twenty-four populations are known to exist, with four of these being newlyestablished from transplants performed by ODFW. One of these new populationsexists in the Muddy Creek drainage on private land. One of the oldest knownpopulations exists in Gray Creek, a tributary of Muddy Creek in the Finley NationalWildlife Refuge. This population is considered stable, at 450-600 individuals. ODFWhas an ongoing investigation into Oregon chub abundance and distribution (Sheerer,pers. comm.). The US Fish and Wildlife Service has produced a Recovery Plan forthe Oregon Chub that outlines the goals and objective for management for therecovery of this unique species.
Pacific lamprey
Pacific lamprey are listed throughout the Columbia River system as a candidatespecies by NMFS (BFWA, BLM 1997). Habitat loss from hydropower projects anddeclines in populations of salmonids are thought to contribute to their decline. Thesefish, which are anadromous, parasitize salmonids in their ocean phase and are unableto negotiate fish ladders and other obstacles. Between 1943 and 1949, the WillametteRiver supported a commercial fishery on these fish with an average annual harvest of233,179 pounds (Wydoski et al. 1979). There is additional information on this specieson the Pacific Marine Fisheries Service internet homepage (http://www.psmfc.org).
Sandroller
Sandrollers (also known as trout perch) have been listed as a “stock of concern” byODFW due to suspected low populations. They are native only to the lower ColumbiaRiver and its tributaries, including the Willamette River. Little is known about thisspecies, though they are thought to hide in daylight hours among large submergedobjects and feed at night over sandy substrates (Wevers et al. 1992). Because oftheir secretive nature, sandroller populations may be underestimated. Sandrollers andOregon chub are considered the two most endemic fish species of the westernCascades/Willamette River basin region, with little to no occurrence in other regions(Hughes et al. 1987). Most of the introduced warm water species listed in Table 10proliferate in the mainstem of the Marys River and in Muddy Creek, and may predate

48 Marys River Preliminary Watershed Assessment Ecosystems Northwest
upon and compete with these invasive species. Much of the historic habitat ofsandrollers has been lost to the draining of wetlands and channelization (Dunette1997).
Fish-bearing Waters
Distributions of fish have not been systematically surveyed in the Marys RiverWatershed. Many tributaries have not been surveyed at all. However, it is reasonableto assume that fish will occur upstream as far as they can go, either to a blockage,and area of steep gradient, or a reach with degraded habitat or low flow.
The upper extent of fish use is currently being determined on private forested lands inOregon as part of the State Forest Practice Administrative Rules. The size of thestream and the upper limit of fish use determine applicable forest harvest rules. Forexample, along small streams (mean discharge of 2 cfs) that are fish bearing, notimber harvesting may occur within 20 feet and only limited harvesting may occurwithin 50 feet. Upstream of areas of fish use, harvesting may occur at the streamedge. The Oregon Department of Forestry (ODF), in conjunction with ODFW, hasundertaken the task of determining the upper extent of fish use as part ofadministering the harvest rules. The intention is to eventually make determinations inthe field for all streams. In the interim, determinations may depend on location ofknown falls or barriers, or estimates based on drainage basin area and a presumedchannel gradient from topographic maps (Map 12).
Cutthroat trout typically occur farther up headwater streams than all other fish speciesin the Coast Range. The distribution shown on Map 12 is a best estimate of the upperextent of cutthroat trout distribution. Copies of the reports and maps of the individualsurveys are available at the ODF district offices (R. Anderson, ODF, Philomath) and atthe ODF Forest Practices Division in Salem (J. Clinton).
Stream Conditions
ODFW Stream Surveys
Stream surveys have been performed on sections of at least 18 tributaries in theMarys River Watershed by state or federal agencies. These types of surveys are verydetailed and usually provide the best information available on stream condition. Thesurveys also provide a good foundation for prioritizing protection, restoration, andenhancement projects. ODFW conducts most of these surveys (Moore et al. 1997),which were performed on private lands in the upper Marys River tributaries between1991 and 1993. In 1996, BLM contracted for surveys to be performed on their lands inGreasy Creek, Reese Creek, Beaver Creek and Oliver Creek. The results of theODFW stream surveys performed on Marys River and Muddy Creek tributary streamsare summarized in Table 14. The locations of the surveyed reaches are shown in

Ecosystems Northwest Marys River Preliminary Watershed Assessment 49
Map 14. The Siuslaw National Forest performed a nearly similar survey on theirownership in Rock Creek in 1995 (Table 15).
A series of characterizations about stream conditions can be drawn from the ODFWsurveys. As a guide to interpretation, channel gradient should first be considered.Most reaches in these surveys are of low gradient (many are 1% or less). Lowgradient streams are characterized by slower flows, less riffles, more shallow pools,and glides. The substrate tends to be composed of mostly finer particle sizes(gravels, sands, and smaller). The streams would tend to be more sinuous and maybe somewhat incised, or cut, into wider floodplains. Cut banks tend to be morecommon, especially if the stream flows through older floodplain deposits. Often, theamount of woody debris is low in such streams. Causes for low in-stream woodydebris include the harvesting of riparian conifers and the removal of wood that mayhave occurred during stream cleaning. Because low gradient streams often providedthe easiest places to build the first roads into the watershed, additional riparian andfloodprone areas are often lost to road placement near streams.
The ODFW stream surveys of Marys River tributary streams show the following:
• Most areas of the watershed (beyond the riparian zone) have been altered fromtheir natural condition by land use practices. Common land use practices alongthe reaches are timber harvest, grazing, agriculture, and residential development.A notable exception is the upper portions of Mulkey Creek, where mature forestsare common.
• The riparian zones appear to be intact, forested zones on most streams, but areusually hardwood dominated. Conifer-dominated riparian zones are rare. Theriparian vegetation consists mostly of deciduous forests of that are “large trees”(over 30-cm stem diameter). There were lesser amounts of mixeddeciduous/conifer forests. Two reaches of riparian zone are shrubs or grasses.The classes of riparian forests are shown in Map 15.
• Large, streamside conifers, which are nearly absent from these streams, are thebest source for in-stream large woody debris. Large conifer logs persist longer andare more resistant to high flows than hardwoods and smaller dimension wood.They capture and retain mobile bedload, and create zones of hydraulic scour thatresult in pool development. Conifers provide additional substrate for invertebratesand trap organic matter that is the food for many of the invertebrates. In short,they enrich stream ecosystems.
• Habitat complexity as assessed by the woody debris index is relatively low for allstreams, an indicator of poor stream habitat for cutthroat trout according to Table13.
• Pool area is high, as expected in low gradient streams.

50 Marys River Preliminary Watershed Assessment Ecosystems Northwest
• Water temperatures did not approach excessive levels for trout during thesesummer surveys. The highest temperature recorded was 63°F (17°C) in NortonCreek Tributary #1. Most maximum temperatures were less than 60°F. The cooltemperatures associated with these streams are the result of adequate riparianshading.
• No reaches had more than 50% open sky; this correlates with the fairly intactriparian canopies. As temperatures did not appear to be a problem, the amount ofcanopy closure above the stream is less important. In fact, some amount of opensky allows greater light to the stream and promotes primary in-stream productivity,which supports a greater food base for the stream community.
• The amount of sand and fine sediment is very high, as expected in low gradientsystems. However, in those reaches with sand and fine sediment covering over80% of the stream bottom, gravel may become limiting for trout spawning, andinhibit desirable aquatic invertebrate production.
• Undercut bank percentages were quite high in some reaches, as expected in lowgradient streams. Undercut banks provide important cover for trout, especially ifwoody debris is lacking. Although high in some reaches, eleven of the 24 reacheshad less than 10% undercut banks. This low availability of undercut banks incombination with low habitat complexity scores contributed to poor trout habitatconditions.

Ecosystems Northwest Marys River Preliminary Watershed Assessment 51
Table 14: Summary of ODFW Aquatic Habitat Inventory data, Marys River Watershed.Stream Sur-
veydate
Reach Avg.UnitGrad(%)
Length(m)
Landuse1
Ripar-ian
Veg.2
Max.waterTemp.(°C)
PoolArea(%)
Habitatcom-
plexityIndex(wood)
Sand &Organic
Sub-strate(%)
GravelSub-strate(%)
Totalwood
pieces
WoodyDebris3
(pcs/100m)
Undercut
Bank(%)
OpenSky
(% of180° )
Avg.Density
ofCanopyClosure
LargeStream-
sideconifers(D=50)
LargeStream-
sideconifers(D=90)
8/93 1 0.1 1000 AG/YT S/G 11.0 19.2 1.4 99 0 120 11.9 50.4 46 1.7 0 08/93 2 0.2 1050 ST/TH D30/S 14.0 5.8 1.8 83 12 351 33.6 38.2 25 2.7 0 08/93 3 0.6 930 ST/ D30/S 13.0 14.5 1.3 84 10 177 19.0 2.6 7 0 0 0
Bark
8/93 4 0.2 1110 ST/ D30/S 14.0 17.9 1.5 84 13 206 18.6 15.6 32 0.52 0 0BigTimber 8/93 1 6.5 320 ST/ D30/S 11.0 8.2 1.6 22 60 50 15.5 22.5 17 3.4 0 0
11/92
1-3 0.3 3960 AG/HG P/DM 16.5 80.7 1.6 38 45 396 10 6.4 21 0 0 0Beaver
8/92 4-6 0.9 6100 AG DM 16.0 34.4 1.6 39 52 698 11.4 6.8 17 0 0 09/92 1-5 0.5 8300 RR/LG DM/SY 16.0 71.3 1.3 72 21 338 4.1 3.6 36 0 0 0Greasy9/92 6-9 0.7 5810 RR/AG DM/SY 16.0 58.9 1.9 31 32 838 14.4 8.3 16 0 0 08/93 1 0.8 460 ST/ D/30 12.0 26.7 1.7 100 0 152 33.3 25.2 14 0.5 2 0Norton
8/93 2-3 1.8 2080 ST/YT M50/G 13.0 48.7 1.6 79 16 375 18.0 51.4 9 2.5 3 0
NortonTrib. #1
8/93 1 1.1 398 ST/AG M50/P 17.0 73.1 1.2 92 3 47 11.8 46.8 26 32 3 0
8/93 1-2 1.4 330 HG/ D50/S 14.0 0.0 1.3 26 43 17 5.1 30.0 34 6.7 0 08/93 3 2.1 2280 YT/ST S/G 13.0 51.6 1.5 59 38 497 21.8 22.0 50 1.1 0 08/93 4,6 4.7 2460 MT/ D30/S 13.0 9.6 1.6 27 47 421 17.1 23.4 19 1.5 0 09/93 7-8 3.9 1340 MT/ M-50 12.0 51.9 1.5 34 45 345 25.7 32.5 12 3.7 1 0
Mulkey
9/93 9 4.4 1500 MT/ D-50/ 11.0 0.0 2.2 37 46 412 27.4 29.7 2 2.4 0 0Peeler 8/93 1 2.6 280 ST/ST D/50 9.0 0.0 1.2 60 31 44 15.9 61.0 11 4.5 4 0
8/92 1-3 1.0 2090 RR/AG DM/SY 16.0 45.5 1.2 20 41 114 5.5 5.9 18 0 0 09/92 5 1.6 3560 SG/CC DM/SY 15.0 27.1 1.4 13 24 146 4.5 2.6 22 0 0 0
Rock
9/92 6 1.3 1330 SG/SG DM/SY 15.0 18.5 1.3 12 26 74 5.6 2.1 22 0 0 08/91 1-2 0.2 5010 HG DM 16.0 43.2 2.0 88 12 0 na 0.5 22 0 0 08/91 2-4 0.9 2330 HG DM 15.0 44.5 1.1 51 41 0 na 1.5 16 0 0 0
W. ForkMarys
8/91 5 5.7 990 SG DM 14.0 3.7 1.2 32 25 0 na 0.5 0 0 0 01Land Use Codes: AG=Agricultural crop or dairy land; TH=Timber harvest; YT=Young Forest Trees; ST=Second growth Timber; LT=Large Timber (30-50 dbh); MT=Mature Timber(50-90 dbh); OG=Old Growth Forest; PT=Partial cut Timber; FF=Forest Fire; BK=Bug Kill; LG=Light Grazing Pressure; HG=Heavy Grazing Pressure; EX=Exclosure; UR=Urban;RR=Rural Residential; IN=Industrial; MI=Mining; WL=Wetland; NU=No Use identified.2Riparian Veg. Codes: N=No Veg.; B=Sagebrush; G=Annual Grasses; P=Perennial grasses, sedges and rushes; S=Shrubs; D=Deciduous Dominated; M=Mixed conifer/deciduous;C=Coniferous Dominated.Second part of Code for size class: 1-3=Seedlings and new plantings; 3-15=Young established trees or saplings; 15-30=Typical sizes for second growth stands; 30-50=Large trees inestablished stands; 50-90=Mature Timber (D50); 90+=Old Growth (D90).3Minimum size requirement is 15 cm in diameter and 3 m in length and rootwads that are within, partially within or suspended over the active channel.
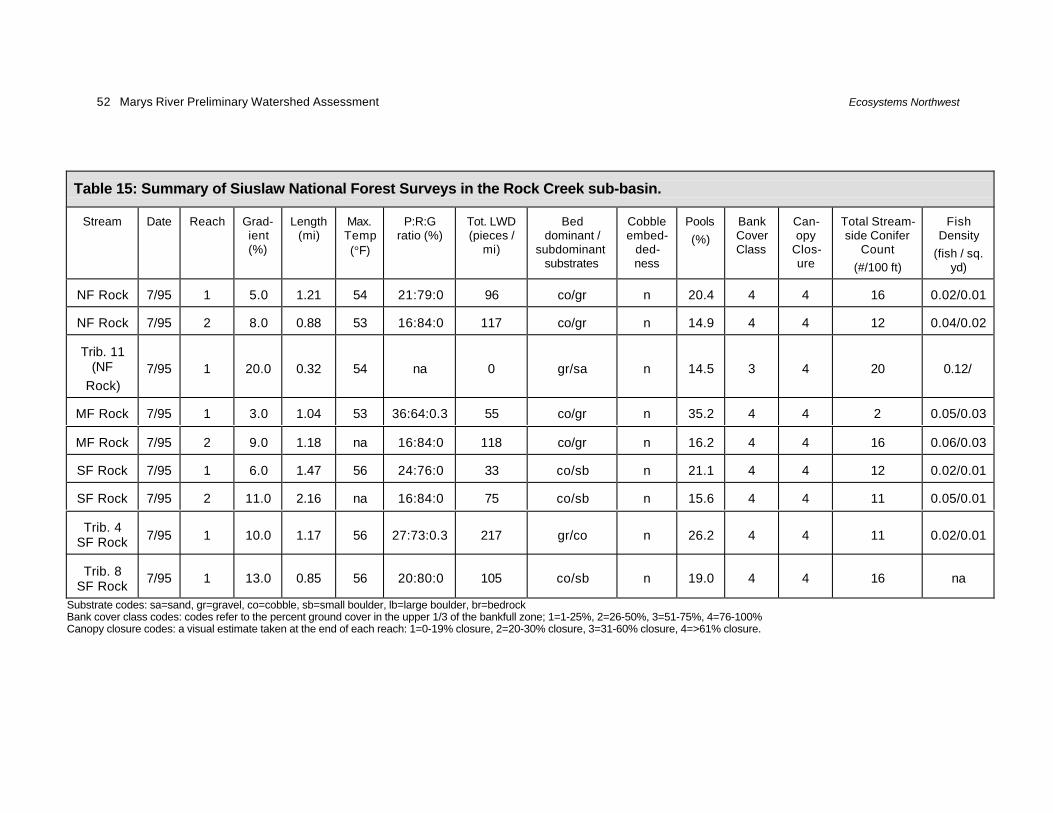
52 Marys River Preliminary Watershed Assessment Ecosystems Northwest
Table 15: Summary of Siuslaw National Forest Surveys in the Rock Creek sub-basin.
Stream Date Reach Grad-ient(%)
Length(mi)
Max.Temp(°F)
P:R:Gratio (%)
Tot. LWD(pieces /
mi)
Beddominant /
subdominantsubstrates
Cobbleembed-
ded-ness
Pools(%)
BankCoverClass
Can-opy
Clos-ure
Total Stream-side Conifer
Count(#/100 ft)
FishDensity
(fish / sq.yd)
NF Rock 7/95 1 5.0 1.21 54 21:79:0 96 co/gr n 20.4 4 4 16 0.02/0.01
NF Rock 7/95 2 8.0 0.88 53 16:84:0 117 co/gr n 14.9 4 4 12 0.04/0.02
Trib. 11(NF
Rock)7/95 1 20.0 0.32 54 na 0 gr/sa n 14.5 3 4 20 0.12/
MF Rock 7/95 1 3.0 1.04 53 36:64:0.3 55 co/gr n 35.2 4 4 2 0.05/0.03
MF Rock 7/95 2 9.0 1.18 na 16:84:0 118 co/gr n 16.2 4 4 16 0.06/0.03
SF Rock 7/95 1 6.0 1.47 56 24:76:0 33 co/sb n 21.1 4 4 12 0.02/0.01
SF Rock 7/95 2 11.0 2.16 na 16:84:0 75 co/sb n 15.6 4 4 11 0.05/0.01
Trib. 4SF Rock 7/95 1 10.0 1.17 56 27:73:0.3 217 gr/co n 26.2 4 4 11 0.02/0.01
Trib. 8SF Rock
7/95 1 13.0 0.85 56 20:80:0 105 co/sb n 19.0 4 4 16 na
Substrate codes: sa=sand, gr=gravel, co=cobble, sb=small boulder, lb=large boulder, br=bedrockBank cover class codes: codes refer to the percent ground cover in the upper 1/3 of the bankfull zone; 1=1-25%, 2=26-50%, 3=51-75%, 4=76-100%Canopy closure codes: a visual estimate taken at the end of each reach: 1=0-19% closure, 2=20-30% closure, 3=31-60% closure, 4=>61% closure.

Ecosystems Northwest Marys River Preliminary Watershed Assessment 53
Siuslaw National Forest Surveys
Stream surveys were conducted in the summer of 1995 on streams in the Rock Creeksub-basin (Table 15). These streams were much higher gradient than the otherstreams surveyed and consequently had much more riffle habitat. Natural fish barrierswere commonly encountered in the survey area. In-stream temperatures were lowerduring summer surveys than other surveys, probably because the amount of canopyshading and streamside conifers was high. Despite the high-quality habitat,surveyors using uncalibrated snorkel surveys observed very low densities of cutthroattrout in all reaches. The municipal watershed of Rock Creek has several waterprojects that may present passage problems to salmonids.
The North Fork Rock Creek dam backs up water for 0.3 miles and blocks anadromousfish passage. This reservoir is drained every five years to control aquatic vegetationand 21-inch cutthroat trout have been found in the reservoir bottom after drainage,suggesting that the dam provides excellent juvenile rearing habitat. Uncalibratedsnorkel surveys were performed on all streams with generally very low abundance of0+ age-class and 1+ age-class cutthroat trout. Two impassable falls wereencountered near the end of the North Fork survey. The fish densities of Tributary 11of North Fork Rock Creek were about one fourth the density expected in a fullyseeded system (Solazzi and Johnson 1993, cited by Trask 1995). Upstream passageon Tributary 11 was blocked by a falls and log jam located just above the end of thesurvey.
Other surveys in the Rock Creek sub-basin identified both human and natural barriersto fish passage. A culvert at County Road 3405 is a potential barrier to trout, but notsalmon or steelhead passage. A concrete water diversion dam footing and a waterintake at River Mile 0.9 are impassable. The South Fork Rock Creek had a diversiondam low in the system at River Mile 0.4 that blocked anadromous fish passage unlessthe head boards were adjusted to create a step-pool approach. At the time of thesurvey, the head boards were not adjusted and the dam was a barrier to upstream fishpassage. Tributary 4 of South Fork Rock Creek had a 4-foot falls near the end of thesurvey that blocked upstream fish passage. Tributary 8 of South Fork Rock Creekhad a steep cascade partway through the survey that blocked upstream fish use.
BLM Stream Surveys
Bureau of Land Management (BLM) surveys on several low-gradient tributaries ofMuddy Creek and the Marys River are summarized in Table 16. According to theanalysis, fish habitat has been degraded or may be in a declining condition. Habitatproblems include a lack of large woody debris, pools, off-channel habitat, and propersubstrate (BFWA, BLM 1997). The habitat conditions for these four streams werecategorized by the BLM as “not properly functioning” or “at risk” in the categories ofLWD, pool area, pool quality, off-channel habitat and channel condition for all thesestreams. Substrate was noted as habitat limiting in Reese Creek. Sediment andturbidity are concerns in the basin because excessive suspended sediment can haveadverse effects on in-stream fish and aquatic invertebrate habitat. Effects of

54 Marys River Preliminary Watershed Assessment Ecosystems Northwest
sediment can include changes to bedload size, channel shape, salmonid reddreproduction rates, primary productivity, and pool distribution. Large increases in theamount of sediment delivered to the stream channel can also alter the structure andwidth of stream banks and the adjacent riparian zones (BFWA, BLM 1997).
Table 16: Stream conditions on BLM managed lands in the Marys River Watershed(assessed using ODFW stream survey protocols).
Sub-basinDominantsubstrate
Complexpools
(%)
LWD(key pieces
per mile)
Poolarea(%)
Totalreach
area (m2)
Total length(m)
BeaverCreek
Gravel/Cobble
1 27 pieces 10.2 7,847 2.9
Oliver Creek Gravel/Cobble
2 39 pieces 12.4 16,523 4.3
ReeseCreek
Silt, Sand,Organics
0 11 pieces 0.5 2,626 1.2
GreasyCreek
Gravel/Cobble
0 13 pieces 13.3 1,728 1.1
Benton Foothills Watershed Analysis, BLM 1997
Culverts and Fish Barriers
Culverts can pose problems for stream systems in two ways. First, they can block fishmovement and effectively isolate populations or prevent access to upstream areasduring migrations by fish. Secondly, culverts can initiate road failures if they areundersized or become blocked during high stream flows. Most of the problem culvertsare those that were installed years ago without regard to stream and fish needs.Today these problem culverts are relatively easy to identify and sometimes the fixesare inexpensive. As a result, a number of culvert surveys have been initiated. Mostof the work to date has been on public lands and roads.
Two state agencies, ODF and ODFW, are surveying culverts for fish passageproblems. In 1998 ODF surveyed all roads on state lands in Benton County forculverts. Some adjacent private lands were also included in the surveys. The surveywas part of a three-county survey that covered some 300 miles of road and includedthe approximately 3000 acres of state lands in the West Fork Marys River sub-basin.The purposes of the surveys were to identify all structures, map their location, anddescribe their conditions. Standard data were collected according to guidelines set bythe Forest Practices Section of ODF. Typical data include diameter, drop of outfall,pool below, gradient, road condition, and ditch conditions. Among the early findingswas a realization that a large number of culverts exist on the landscape, with many ofthese blocking upstream habitat (C. Humpke, ODF, Philomath, pers. comm.).ODFW’s inventories of state and county public roads (except urban areas) include anexamination of culverts for fish passage. These surveys also uncovered problems,which will be prioritized for repairs and restoration (G. Galovich, ODFW, Corvallis,pers. comm.).
Private industrial forest landowners in the Marys River Watershed have initiated theirown surveys of logging roads. These surveys include identification and repair of

Ecosystems Northwest Marys River Preliminary Watershed Assessment 55
problem culverts. For example, Starker Forests has a program of culvert inventoriesin which over 100 culverts have been upgraded to enhance fish conditions or waterquality since the inception of the program (G. Blanchard, Starker Forests, pers.comm.). Private landowners also use survey results to develop methods that lessenwater quality impacts caused by erosion and sediment runoff. Water bars and earthenberms have been used by Starker Forests to keep wheeled traffic off closed roads andprevent drainage water from directly entering streams (G. Blanchard, Starker Forests,pers. comm.). If water is quickly taken off the road system, it has less opportunity toerode ditches and input sediment into streams. Grass seeding, hay bales andsediment fences can also be used to help slow down drainage water and allowsediment to drop out of water from road drainages. These measures can also beused to prevent the massive input of sediment caused by road failures that areassociated with unmaintained or poorly constructed forest roads.
Developing a program to survey culverts on remaining private lands should be a highpriority project for the watershed council. Surveys are relatively easy to perform.Restoration costs can vary depending on whether minor maintenance or completereplacement is needed. However, in many cases, significant benefits can be achievedat relatively low costs. Individual landowners do not need to wait for a basin-wideinventory, but may contact ODFW if they suspect that a culvert is in need of repair.ODFW surveys do not require that a landowner replace problem culverts at their ownexpense (G Galovich, pers. comm.).
Other Fish Passage Obstructions
The Marys River Watershed has no large water storage projects, although there aremunicipal water use dams in the Rock Creek. The South Fork of Rock Creek has aconcrete diversion dam, while on the North Fork a large earth-filled dam creates animpoundment that is the source of about 39% of the domestic water supply for the Cityof Corvallis. The South Fork dam may be passable to large salmonids. Another waterintake on nearby Griffith Creek is also reported to be impassable (J. Fairchild,watershed resident, pers. comm.). A third water intake exists on the Middle Fork RockCreek and was reported as impassable in 1995 (Trask 1995). The removal of thisdam could open up important high-gradient cutthroat spawning habitat. Two smalldams are reported for Oak Creek (Williams et al. 1994), and It is probable that thereare a number of additional small impoundments located throughout the Marys RiverWatershed such as that at Thompson Lake on the headwaters of the Tum Tum River.
The Oregon Streamnet website (http://www.streamnet.org) collects and compilesinformation on both natural and human-made barriers to fish passage for anadromousand resident fish of the Columbia River system. Some data for the Marys RiverWatershed are currently available on the website, and more are expected in the future(C. Cooney, ODFW, pers. comm.).

56 Marys River Preliminary Watershed Assessment Ecosystems Northwest
Riparian Zones and Wetlands
Historical records such as journal entries of explorers and settlers indicate that muchof the riparian forests and wetlands that originally existed along valley bottoms oflarger rivers were cleared for homesteads beginning about 1840 (Storm 1941, seealso Chapter 2). Development of the valley bottom appears to have occurred rapidlybetween 1840 and 1880. Some sense of change in riparian vegetation along thelower Mary River can be gained by comparing the 1850 historic vegetation mapconstructed by the Nature Conservancy (Map 9a) with the current 1997 vegetationmap constructed by ODFW (Map 9b) and a recent orthophoto of the same area (Map9c). By examining old records and public land survey notes, reconstruction of originalriparian conditions of the Willamette River just south of Corvallis was accomplished byBenner and Sedell (1997, Map 16). Clearing of forests, development of pastures andfields, and channelization of waterways eliminated many side channels, seasonal off-channel refuges, and wetlands.
Channelization of headwater streams likely occurred before the 1930’s in the MuddyCreek sub-basin. In addition, much of the loss of riparian zones likely had occurred bythis time. An examination of aerial photos taken in 1937 reveals that much of theMuddy Creek drainage had been developed for agricultural use. The 1937 photosshow straight lines that appear to be evidence of widespread channelization of smalltemporary drainages and streams. Drainage tile lines can be observed in theagricultural field in the 1937 aerial photograph and were known to be widely in use atthat time. Comparison of the 1937 photos to those taken in 1956 and 1993 show thatan additional, but small (probably less than 5%) amount of riparian habitat was lost(Photos 3a-3c, Appendix 2).
A comprehensive map of current riparian vegetation for most of the watershed is notavailable. A characterization of riparian forests from the ODFW stream surveys isshown on Map 15. The Coastal Landscape Analysis and Modeling Study (CLAMS)uses satellite imagery and modeling to develop vegetation layers (Map 17). TheCLAMS project promises to be a useful source of information and possibly analysistools for watershed groups in the Coast Range. More information is available on theCLAMS website (see website bibliography).
Wetland inventories have been performed recently in the Marys River Watershed bythe Oregon Natural Heritage Program (ONHP). Current wetlands are shown in Map18. Their report is available http://www.sscgis.state.or.us/data/sources.html. Theirfindings include the following summaries:
“Most [wetland] sites inventoried in the Willamette Valley are dominated by non-nativespecies. The most common invasive species in bottomland and wetland habitats arereed canary grass (Phalaris arundinacea), roughstalk bluegrass (Poa trivialis),Himalayan blackberry (Rubus discolor), nipplewort (Lapsana communis), English ivy(Hedera helix) and bittersweet nightshade (Solanum dulcamara). These species are verydifficult to keep out of native areas and extremely difficult to control once they haveinvaded an area.”

Ecosystems Northwest Marys River Preliminary Watershed Assessment 57
“Throughout the Willamette Valley, riparian zones and wetlands are actively beingdeveloped [i.e., filled or drained]. This was observed numerous times during the courseof this project. Section 404 (wetland fill permit) violations appear to be commonplace.Privately owned wetlands and riparian areas throughout the Valley deserve increasedprotection from degradation and development.
Wetlands found on sites with high quality remnants have been included in a conservationpriority list. The most important sites on private land are the Calapooia River, MuddyCreek, North Santiam River, Luckiamute River, Kingston Prairie, the Mission Bottomsarea, and the Bull Run Creek fragment. Private lands along many other rivers andcreeks are also worthy of protection. Public lands in the Willamette Valley need to beprotected from degradation. Restoration activities could be attempted at non-nativedominated areas on public lands, although protecting native habitat should clearly takeprecedence over restoration. Small emergent wetland sites are scattered throughout theWillamette Valley, both in and between the priority wetlands. These sites should be afocus of protection along with the forested riparian zones. Hydrological threats to theseareas also need to be addressed. Large native emergent wetlands were not foundoutside of public lands.”
The ONHP report also highlighted the high-quality, extensive riparian zones alongMuddy Creek.
Newton Creek flows through a large wetland area within the urban growth boundary ofPhilomath (Appendix 3, Figure 6). Much of this wetland has been modified by arailroad line and by its use as a log pond by sawmills. The City of Philomath isstudying the wetlands and is planning to identify sites that deserve protection and sitesthat could be developed as part of an industrial park. Currently a 170-acre parcel isfor sale that contains about 100 acres of wetlands and an old log pond that now ishome to about 30-40 adult western pond turtles, a “Species of Concern” on State andFederal lists. The pond is also home to bull frogs, which may be preying on thejuvenile pond turtles.
Sensitive, Non-Fish Species
A complete species list of all animals thought to occur in the Muddy Creek sub-basinat the time of Euro-American arrival has been compiled by Hulse et al. (1997). Thislist included 234 total amphibian, reptile, mammal and bird species. This list isprobably representative for the Marys River Watershed, because the Muddy Creekdrainage includes upland habitats similar to the forested areas of the headwaters ofMarys River. There are eight known extirpated vertebrate species from the MuddyCreek sub-basin: grizzly bear, California condor, lynx, gray wolf, white-tailed deer,yellow-billed cuckoo, black-crowned night heron, and spotted frog (Hulse et al. 1997).According to Storm (1941) beaver were also extirpated from the Marys RiverWatershed by trappers, but were reintroduced to Oak Creek in the 1920’s. Appendix6 has additional information on status of wildlife.
The Oregon Natural Heritage Program (ONHP) has assembled a list of sensitivespecies in Benton County (http//:www.hertitage.tnc.org). Approximately 90 of these

58 Marys River Preliminary Watershed Assessment Ecosystems Northwest
species of plants and animals are thought to occur or at least have potential habitat inthe Marys River Watershed (Table 17). The ONHP list includes species listed by oneor more of the following: federal agencies including the US Fish and Wildlife Serviceand NMFS; state agencies including ODFW and the Oregon Department ofAgriculture; and nonprofit and educational organizations such as Native Plant Societyof Oregon, Oregon State University’s Oregon Flora Project (OSU), and the ONHP.Species that are not listed on federal or state lists, but are listed by another group arealso included in the table. For many of these listed species there is not enough datato determine the status of their populations.
The Federal rank lists species in order of perceived peril as: 1) Listed Endangered(LE), 2) Listed Threatened (LT), 3) Proposed Endangered (PE), 4) ProposedThreatened (PT), 5) Species of Concern (SoC), and 6) Candidates for listing (C).Eight species in Table 17 are either Listed Endangered or Listed Threatened. Thebald eagle is being considered for removal from the federal threatened list, and thegray wolf probably has been extirpated from the watershed. The six remainingfederally listed species include two endangered species: peregrine falcon andKincaid’s lupine; and four threatened species: Northern spotted owl, marbled murrelet,Aleutian goose, and dotted water-flax seed. Two species are proposed for federalendangered listing: Fender’s blue butterfly and Willamette daisy, while one isproposed for a threatened listing: three-colored monkey flower.
The state system is similar to the federal system in regards to threatened andendangered ranks, but replaces “Candidates” and “Species of Concern” with four“Sensitive Species” rankings. These include “Critical” (SC), for species with listingpending; “Vulnerable” (SV), for species where listing is not thought to be imminent andmay be avoided with action; “Peripheral” (SP), for species that are naturally rare orwhose Oregon populations are on the edge of their ranges; and “Undetermined” (SU),for species whose status is unclear from lack of information. The state EndangeredSpecies Act is more limited in scope than the federal ESA and only actively applies tolands owned or managed by the state. Criteria for state listing of a species extends topopulations that are 1) actively undergoing or are in imminent danger of habitatdeterioration, 2) being over-utilized or where over-utilization is likely to occur, or 3) notbeing protected adequately by existing programs. “Sensitive” status is given to anyspecies that might qualify as “Endangered” or “Threatened” in the future. Otherspecies included in the tables with no federal or state status are listed by anothergroup and generally indicate species that may be of concern or about which notenough information is known.

Ecosystems Northwest Marys River Preliminary Watershed Assessment 59
Table 17: Sensitive species that potentially occur or formerly occurred in the MarysRiver Watershed (Oregon Natural Heritage Program).Status abbreviations:LE = Fed. Listed Endangered, PE = Fed. Proposed Endangered, LT = Fed. Listed Threatened, PT = Fed. ProposedThreatened, C = Fed. Candidate Species, SoC = Fed. Species of Concern, SC = State Sensitive Critical, SV = StateSensitive Vulnerable, SP = State Sensitive Peripheral, SU = State Sensitive, Undetermined status. Those species with nolisted status are proposed by Oregon Natural Heritage Program or the Nature Conservancy as species that merit attention.* Corvallis Chapter of the Native Plant Society of Oregon, Species of Concern
Common name Scientific name Fed. status State status
REPTILESNorthwestern pond turtle Clemmys marmorata marmorata SoC SCpainted turtle Chrysemys picta - SCsharptail snake Contia tenuis - SVAMPHIBIANSOregon spotted frog Rana pretiosa C SCsouthern seep salamander Rhyacotriton variegatus SoC SVtailed frog Ascaphus truei SoC SVNorthern red-legged frog Rana aurora aurora SoC SV/SUClouded salamander Aneides ferreus - SVBIRDSperegrine falcon Falco peregrinus LE LEbald eagle Haleaeatus leucophalus LT LTnorthern spotted owl Strix occidentalis caurina LT LTmarbled murrelet Brachyramphus marmoratus LT LTAleutian Canada goose (wintering) Branta canadensis leucopareia LT LEnorthern goshawk Accipiter gentilis SoC SClittle willow flycatcher Empidonax traillii brewsteri SoC SVnorthern pygmy owl Glaucidium gnoma - SCburrowing owl Athene cunicularia - SCwestern meadowlark Sturnella neglecta - SCOregon vesper sparrow Pooecetes gramineus affinis - SCpurple martin Progne subis - SCcommon nighthawk Chordeiles minor - SCstreaked horned lark Eremophila alpestris strigata - SCyellow-breasted chat Icteria virens - SCLewis’ Woodpecker Melanerpes lewis - SCpileated Woodpecker Dryocopus pileatus - SVwestern bluebird Sialia mexicana - SVwhite-tailed kite Elanus leucurus - -dusky Canada goose (wintering) Branta canadensis occidentalis - -acorn woodpecker Melanerpes formicivorus - -MAMMALSgray wolf Canis lupus LE LECanada lynx Lynx canadensis C -white-footed vole Arborimus albipes SoC SUPacific western big-eared bat Corynorhinus townsendii SoC SCfringed myotis Myotis thysanodes - SVAmerican marten Martes americana - SVlong-eared myotis Myotis evotis - SUsilver-haired bat Lasionycteris noctivagans - SUWestern gray squirrel Sciurus griseus - SU

60 Marys River Preliminary Watershed Assessment Ecosystems Northwest
Table 17 (continued)
Common name Scientific name Fed status State status
INSECTSFender's blue butterfly Icaricia icarioides fenderi PE -Fender's rhyacophilan caddisfly Rhyacophila fenderi SoC -Haddock's rhyacophilan caddisfly Rhyacophila haddocki SoC -Roth's blind ground beetle Pterostichus rothi SoC -Vertree's ceraclean caddisfly Ceraclea vertreesi SoC -Siskiyou chloealtis grasshopper Chloealtis aspasma SoC -montane bog dragonfly Tanypteryx hageni - -Mary's Peak ice cricket Grylloblatta spp. - -American acetropis grass bug Acetropis americana - -stink bug Dendrocoris arizonensis - -foliaceous lace bug Derephysia foliacea - -Heidemann's nabid (bug) Hoplistoscelis heidemanni - -Martin's water-measurer Hydrometra martini - -marsh ground beetle Acupalpus punctulatus - -potentilla root borer beetle Chrysobothris potentillae - -Corvallis diving beetle Hydroporus corvallis - -Taylor's checkerspot butterfly Euphydryas editha taylori - -Mulsant's small water strider Mesovelia mulsanti - -true fir pinalitus (bug) Pinalitus solivagus - -Douglas-fir platylygus (bug) Platylygus pseudotsugae - -Alsea ochrotrichian micro caddisfly Ochrotrichia alsea - -Willamette callippe fritillarybutterfly
Speyeria callippe spp. - -
valley silverspot butterfly Speyeria zerene bremneri - -VASCULAR PLANTSKincaid's lupine Lupinus sulphureus LE LEdotted water-flax seed Spirodela punctata LT LTWillamette daisy Erigeron decumbens PE LEthree-colored monkeyflower Mimulus tricolor PT LTpeacock larkspur Delphinium pavonaceum SoC LEWillamette Valley larkspur Delphinium oreganum SoC LEwhite-topped aster Aster curtus SoC LTtall bugbane Cimicifuga elata SoC Cshaggy horkelia Horkelia congesta SoC Cloose-flowered bluegrass Poa laxiflora SoC CNelson's sidalcea Sidalcea nelsoniana - Cwhorled marsh-pennywort Hydrocotyle verticillata - -dwarf isopyrum Isopyrum stipitatum - -thin-leaved peavine Lathyrus holochlorus - -small-flowered lipocarpha Lipocarpha micrantha - -Bradshaw's lomatium Lomatium bradshawii - -Howell's montia Montia howellii - -meadow sidalcea Sidalcea campestris - -humped bladderwort Utricularia gibba - -narrow-leaved milkweed Asclepias fascicularis* - -dotted water-meal Wolffia borealis - -showy milkweeed Asclepias speciosa* - -

Ecosystems Northwest Marys River Preliminary Watershed Assessment 61
Table 17 (continued)
Common name Scientific name Fed status State status
VASCULAR PLANTSWahoo Euonymus occidentalis - -indian rhubarb Peltiphyllum peltatum - -Timwort Cicendia quadrangularis - -Mountain lady-slipper Cypripedium montanum - -adder’s tongue Ophioglossum pusillum - -upland yellow violet Viola nuttalli praemorsa - -Columbia water-meal Wolffia columbiana - -
LE = Listed Endangered PE = Proposed Endangered C = Candidate SpeciesLT = Listed Threatened PT = Proposed Threatened SoC = Species of ConcernAdditional State Sensitive Rankings: SC = sensitive critical, S V = sensitive vulnerable, SP = sensiteve peripheral, SU = sensitive,undetermined status.*Corvallis Chapter Native Plant Society of Oregon, Species of Concern
Special Plants and Fungi
There are four lists currently used by the Natural Heritage Council to rank specialplants and fungi (Table 18). List 1 consisting of the taxa which are endangered orthreatened throughout their range or are presumed extinct. List 2 contains speciesthat are threatened, endangered or possibly extirpated from Oregon, but are stable ormore common elsewhere. List 3 is a review list for species that need moreinformation to determine their status. All fungi in the survey are new and are placedon the review list by the Oregon Natural Heritage Program. List 4 contains taxa ofconcern that are not currently threatened or endangered.
Table 18: Sensitive Special plants and fungi (source: ONHP).
Lichens Mosses Fungi LiverwortsList 1:Sulcaria badia
List 1:Sphaerocarposhians
List 2:MicromitriumtenerumPhyscomitrellapatens
List 3:Bryoria subcanaUsnea hesperina List 3:
Physcomitriumimmersum
List 3:Otidea leporinaPhaeocollybiaradicataRamaria gracilisRhizopogonbrunneinigerRhizopogonexiguusRhizopogonsubcinnamomeusRhizopogonsubradicatusSarcosomalatahense
List 3:BondarzewiamesentericaElaphomycesdecipiensGymnomycesmonosporusHelvella elasticaHelvella maculataLeptonia occidentLeucogastercitrinusMartelliaidahoensis
An unlisted, but extremely rare fungus, Bridgeoporus nobilissimus was recentlylocated on Marys Peak by an off-work Forest Service employee (S. DiGiacomo, BLM

62 Marys River Preliminary Watershed Assessment Ecosystems Northwest
fungi surveys Salem, pers. comm.). This fungus is perhaps both the largest and oneof the most rare species in the Pacific Northwest. It is a perennial that associates withold-growth true fir species and can grow to over three feet in diameter.
Biodiversity
Biodiversity indices developed by the Hulse project for the Muddy Creek drainagesuggests that overall biodiversity has declined prior to Euro-American settlement. Theresearchers attribute the decline to a general pattern of land use change and loss ofhabitat. Given the projected population increases for the Muddy Creek area, whichmay be extrapolated to other areas of the Marys River Watershed, biodiversity isprojected to continue to decline. Stabilization at current levels can only be achievedvia a reduction in human population growth or change in land use allocations (Hulse etal. 1997).
Summary
The rapid rate of settlement and modification of the Marys River Watershed landscapehas resulted in alteration and loss of both aquatic and terrestrial habitats. Habitatmodification and loss, together with direct effects of human populations andcompetitive pressures from introduced species, has contributed to declines in severalspecies.
Some native fish face pressure from habitat loss and competition from introducedspecies. Indicators of habitat loss are reductions in in-stream woody debris and theamount of side channel and off-channel habitats, and an increase in fine sediments inpools. Culverts also pose problems to fish passage in the watershed, particularly tocutthroat that live in mainstem rivers and spawn in tributaries. The population of thefederally endangered Oregon chub in Gray Creek is stable, but faces threats fromintroduced warm water fish, such as the western mosquitofish, and loss of habitat.The sandroller and Pacific lamprey may also face similar threats. Listings of wintersteelhead and spring chinook salmon in the Upper Willamette may affect the MarysRiver.
The watershed area in wetlands and riparian zones appears to have declinedsignificantly from historical levels. Most of the losses of wetland and riparianvegetation probably occurred before the 1930s, and resulted from early settlement,establishment of farms, and channelization of streams. Currently, some of theremaining wetlands may be threatened with additional loss through draining and urbandevelopment. Detailed assessments of the current extent and condition of riparianforests are needed.
Ecosystems Northwest Marys River Preliminary Watershed Assessment 63
CHAPTER 5: SOIL QUALITY AND LAND HEALTH
Soil quality is important through its influence on hydrology, sediment characteristics,nutrient dynamics, slope stability, vegetative cover and land use. Many inherent soilqualities, such as degree of soil development, soil depth, slope and soil texture, arethe result of the soil-forming factors of parent material and relief changed over time byorganisms and climate. Other soil qualities are more dynamic and tend to be stronglyinfluenced by land use and management, and these include soil infiltration capacity,soil organic matter, nutrient content and soil tilth. This chapter assesses therelationships of soil qualities, land use and management, and the impacts onwatershed health and water quality.
Soil Groups
The multiple soil types of the Marys River Watershed are grouped into 8 broad classesbased on soil hazards for erosion, soil wetness and flooding (Map 19 and Appendix 5,Section 2). At 800-1000 feet in elevation(>60 in. precipitation per year), a climatic soilclassification break occurs, with udic soils above this elevation and xeric below. Thesoils that formed in the valley are less leached and have a higher base saturation thanthe soils of the foothills and mountains. This characteristic is due in part to less rainfallat lower elevations and the length of time that the soils have been exposed toweathering (Knezevich 1975.)
The Benton County Soil Survey (Knezevich 1975) is the original source of spatialinformation and interpretations about local soils. Benton County digitized these soilsurvey maps into a Geographic Information System (GIS). Using this information, soilgroupings were created for this preliminary assessment of the Marys River Watershedand reflect the capability class of soils for general land uses. Soil coverage for smallportions of Polk, Lane and Lincoln Counties not shown on the map are available in thepublished soil surveys (USDA-SCS 1982, Patching 1987, Shipman 1997) and in digitalformat from county planning departments.
Loss of Productive Lands to Urban Development Urban and suburban development has occurred primarily on land that had soils withhigh potential agricultural productivity. The City of Corvallis sits on Willamette,Woodburn, Concord, Dayton and Amity soils. Philomath has been built mainly uponAmity, Dayton, Willamette, and Witham soils. Increasing development in the foothillsis occurring on soils that have high potential for forest productivity. Further analysis isneeded to determine the impacts that past development has had on the productive soilbase. Soil information should be used to plan for future development in order toprotect soils with the highest natural productivity potential for agriculture and forestryuses.

64 Marys River Preliminary Watershed Assessment Ecosystems Northwest
Soil Erosion and Delivery to Streams
Soil erosion is a natural process that often is accelerated by human activities.Accelerated soil erosion on cropland, forest roads, and construction sites is a potentialsource of sediment pollution to surface waters. Where moderate to severe erosionoccurs, the productive capacity and value of land can decrease over time. Sedimentscan fill natural depressions and drainages, road ditches, and pools in creeks,destroying fish and wildlife habitat and shortens the life of reservoirs and wetlands.Clay-sized sediments eroded from uplands and stream banks may have nutrients andpesticides bound to them and are a major source of non-point pollution. Theconcentrations of numerous pesticides are positively correlated with the concentrationof suspended sediment in runoff in small streams in the Willamette Basin (Anderson etal. 1997)
Historically soils in the Marys River Watershed were covered by lush vegetation yearround and experienced low rates of soil erosion. Soil loss rate was probably similar tothat measured under established grass crops (0.01-0.11 tons per acre per year).Disturbances such as fire and landslides temporarily denuded vegetation by causinglocalized erosion. Historians have recorded the practice of burning the valley floor andfoothills by the Kalapuyas (see Chapter 2). Frequent, low intensity prairie andsavanna fires probably did not cause a large amount of soil erosion. Periodic fires thatburned in the Coast Range forests may have been more intensive, leaving soilsexposed to severe erosion. Fire history reconstruction for the Oregon Coast Rangeindicates an average fire interval of about 230 years under the current climate (Long etal. 1998).
Under normal rainfall conditions, soil erosion in the Willamette Valley ranges fromslight to severe depending on slope steepness, slope configuration, soil erodibility,and crop management practices (Table 20). Several agricultural practices leave thesoil exposed during the winter rainy season and have been implicated in triggeringsevere soil erosion on sloping land such as Soil Groups B and C (Map 19). Thepotential for severe soil erosion events on agricultural land in the watershed isdocumented in the historical accounts from the winters of 1949 (USDA-SCS 1949),1956 (Torbitt and Sternes 1956), and 1964-1965 (Baum and Keiser 1965). Thehighest rates of soil loss have been the result of episodic intense rainfall duringconditions of low infiltration capacity. During these storms, infiltration was limited bysaturation of the soil, snow cover and frozen ground, and sealing of soil surfaces byraindrop impact on unprotected cropland. Practices contributing to high erosioninclude: fall-plowed cropland not seeded and without sufficient crop residues; fall-conventionally-seeded small grains, legumes, and grasses; and clean-tilled orchardsand Christmas tree farms without cover crops (Young et al. 1980; USDA SCS 1949;Bela 1979).
Perennial grass crops provide good soil cover and are conservative of nutrients, withthe possible exception of the year of crop establishment. Yet, cropped fields thatreceive intermittent concentrated flood flows may experience moderate rill erosion

Ecosystems Northwest Marys River Preliminary Watershed Assessment 65
even with established grass crops. Some lands that receive flood flows such as SoilGroups D and E (Map 19) are subject to slight or moderate erosion when left bareduring winter. Cropping with annual crops such as corn and small grains pose erosionhazards if fields are left bare during winter months. Christmas tree farms requirewinter cover crops or some other form of crop residue to adequately protect soils. No-tillage planting, cover crops, and grassed waterways are currently underutilizedpractices that could drastically reduce sediment concentrations in runoff and keephighly erodible cropland in the watershed.
Table 20: Soil loss from field investigations, small watershed studies, Universal SoilLoss Equation, and Cesium-137 records for soils of the Willamette Valley.Soil loss by land cover type(T ac-1 yr-1) Weather Study type Reference
1030 – 100
AverageFall-seeded and no covercrops
Hard rain on partly frozenand snow covered ground
Field inspectionafter storm
USDA-SCS(1949)
0.1414.0
Grass establishedFall planted (nearly bare)
Normal winter rainfall(2 yr.) Small watershed Simmons (1981)
0.7 - 2.01.6 - 4.62.9 - 8.6
4.8 - 14.1
Pasture/HayOrchard (cover crop)Winter wheat fall-seededup- and-downRow crop up- and-down
Normal weather modeledby USLE
USLE estimatesfor local conditions
Marion CountySWCD (1982)
0.01 - 0.10.05 - 0.5
Grass Winter Wheat
Normal winter rainfall(2 yr.)
Standard erosionplots
Istock andHarward (1980)
0.2 - 4.0 Fall-seeded small grainsand grass
Normal winter rainfall(2 yr.) Small watershed Istock and Lowery
(1980)
1 – 12 Combined crops Long term soil loss rate1945-1979
Cesium-137record
Brown and Kling(1980)
Mass Erosion
Accelerated mass wasting from uplands does not appear to be a major source ofstream sediment in the watershed. While past forest harvesting and roads may haveincreased mass erosion rates above historic conditions, current forest practicesattempt to minimize mass erosion. Efforts are underway to identify areas of high riskof mass erosion. An example of this is a GIS-based digital terrain model, developedby Siuslaw National Forest, which rates risk of mass erosion based on slopesteepness and configuration (K Bennett, USFS, pers. comm.).
A study of an undisturbed Coast Range forest reported an average of 14.5 smallslides per kilometer, with 8% of small streams (USFS Class III and IV) impacted bychannel scour and deposition (Ketcheson and Froehlich 1978). The majority of themeasured slides were on slopes greater than 80%. Concave headwalls with over-thickened colluvial deposits are responsible for a large portion of mass movements inthe Coast Range that reach stream channels. Other high-risk landslide areas includesteep, deeply incised channels and lower portions of long rectilinear slopes(Ketcheson and Froehlich 1978). Headwall failures are usually associated with high

66 Marys River Preliminary Watershed Assessment Ecosystems Northwest
intensity rain falling on saturated soil. These slides deliver coarse material for streamsubstrate and large woody debris that provide complexity to stream habitat, but canalso can adversely affect fish habitat and water quality with excessive fine sediments.
The Benton Foothills Watershed Analysis (BFWA, BLM 1997) identified areas in theMuddy Creek sub-basin with moderate to high slope stability hazard, and areas of“natural instability” associated with slumpy earthflow ground morphology. Areas ratedmoderate or high are steep slopes associated predominantly with Soil Groups G andH (Map 19). The slumpy earthflow ground is associated with Marty, Apt, Slickrock,and Honeygrove soils less than 25% slope, all in Soil Group F. A small area ofapproximately 40 acres in the headwater divide between Gleason Creek and GreasyCreek, was identified as having slopes in excess of 90%. This forestland has beenremoved from the production base (BFWA, BLM 1997).
Discussion of mass erosion in the Benton Foothill Watershed Analysis includes thefollowing: “Historically landslide frequency has been low. Although harvest activities areexpected to increase due to the land use allocation (land allocated to timber harvest in theNorthwest Forest Plan), significant increases in landslide rates are not expected. Clearcutand road-related landslides have increased the rate of sediment introduction to streamchannels. Highest risk of landslides lies along the western margin of the analysis area (MuddyCreek Sub-watershed). The dominant erosion processes are deep-seated slump earth flowsand surface soil erosion. Streams cutting in unstable slump earth-flow terrain below FlatMountain will lead to long term sedimentation. Surface erosion by water and dry raveling is anatural process on hillslopes in excess of 60 %…and is accelerated when… ground cover…are removed. Thinning, regeneration harvest, and spring burning for site preparation leavethe majority of the soil surface protected and undisturbed.” (BFWA, BLM 1997).
Controversy persists about the impact of forest harvesting and roads on the frequencyand magnitude of landslides. Ketcheson and Froehlich (1978) reported slightly fewersmall debris slides in clearcut forest blocks than in undisturbed forest. However theslides in clearcut areas traveled 1.7 times farther and impacted more small streamswith channel scour and deposition than slides in undisturbed forest. Swanson et al.(1977) reported a nearly twofold increase in slides following harvesting over all landsand a four-fold increase following harvesting on the most slide-prone ground. AnOregon Department of Forestry (ODF) landslide survey following the severe storms ofwinter 1995-1996 supports the above findings for stands harvested 0 to 9 years ago,but not for stands aged 10 to 100 years (Dent et al. 1998). The ODF survey wasconducted on forestland where state forest practices had been followed. Landslidesfrom these severe storm events were most frequent on very steep slopes (greaterthan 65%). Most of the sites harvested and reforested from 0 to 9 years experiencedincreased landslide frequency and mass erosion amounts compared to undisturbedforest sites (>100 years old). However, stands that were harvested and reforested inthe past 10 to 30, and 30 to 100 years experienced fewer slides and less masserosion than the undisturbed older forests over 100 years old (K. Mills, ODF, pers.comm.)
Factors Influencing Soil Erosion

Ecosystems Northwest Marys River Preliminary Watershed Assessment 67
Decreased infiltration capacity of the soil, soil compaction, and the presence ofimpervious surfaces contribute in various ways to overland flow and subsequent soilerosion. These factors are discussed as they relate to the soil erosion processes ofsediment detachment and transport. Though these processes and conditions occurnaturally, human activities can increase their impact
Infiltration capacity of a soil is dynamic and decreases with increasing soil moisturecontent and formation of a seal on the soil surface (Farrel and Larson 1972.) At theend of the summer dry season, the upper soil profile is dry and the soil is oftencracked. Infiltration capacity is high under such conditions. However, with the onsetof the winter rainy season, soil profiles wet-up and cracks close. By early winter soilsoften become saturated, and where left bare, the soil surface can develop a seal as aresult of raindrops breaking down soil aggregates and repacking the silt particles intoa thin skin. Occasionally soils freeze or are covered with snow and this also maylower the infiltration capacity (Lowery et al. 1980.)
Overland flow or runoff begins when precipitation exceeds infiltration capacity of thesoil. Where vegetation, forest litter or crop residues protect soils, there is generallylittle surface runoff. Where soils are bare and surface seals have formed, detachedsilt and clay soil particles can be carried off in thin sheet flow and in small rills, and theamount of sediment transported in runoff can be large. Runoff also occurs wheresubsurface water moves downslope over impermeable sub-soil layers and thencomes to the surface on lower slopes. This condition occurs extensively in theWillamette Valley and often is expressed in the occurrence of side-hill seeps. Wherethese lands are farmed and remain bare in the winter, significant erosion can occur.Subsurface drainage such as tiling and ditching has been used to reduce runoff insuch conditions, but this can have the side effects of reducing base flow of streams(Lowery et al. 1982). In late winter and spring, infiltration capacity increases again asplants grow, soils drain and surface seals crack. In addition to increasing erosivecutting action, increased runoff and erosion can alter stream flows and increasestream bank erosion.
Soil compaction, puddling, and rutting can be caused by methods and machinery usedin forestry and construction also. Such soil disturbances can decrease the soilinfiltration capacity and trigger increased runoff and sediment yield. The commonforest harvest practice of groundskidding can disturb significant areas of the harvestedstands (Froehlich 1984). Johnson and Beschta (1980) report that new skid trails haveabout 50% lower infiltration capacity than undisturbed forest soils for soils of the CoastRange. Urban development in Philomath and Corvallis may cause severe soilcompaction and increase runoff. Planting grass on construction sites during winterprotects bare soil from splash erosion. Precautions such as seeding with grass andthen mulching the bare ground or hydro-seeding can significantly reduce soil lossesfrom construction sites. Fabric fencing (silt fence) and straw bales can help slowrunoff and trap sediments.
Ditch clearing may have positive and negative effects on watershed condition.Routine ditch clearing can trigger significant erosion in the ditch and increasesediment delivery to streams. However, periodic road ditch clearing by excavators is
68 Marys River Preliminary Watershed Assessment Ecosystems Northwest
needed to keep ditches and culverts functional. During ditch clearing protectivevegetation is removed with accumulated sediment and there is the potential toundercut stable cutslopes and initiate bank sloughing. Bare ditch bottoms withloosened soil are susceptible to erosive cutting and can yield significant amounts ofsediment until stabilized or vegetation reestablishes. Complimentary practices suchas relief culverts, rock checks and channel liners need to be used with ditch cleaningin places where ditches erode. Soil conservation in agriculture and best managementpractices in forestland are preventive measures that serve to reduce the frequency ofditch cleanings because they reduce the amount of sediment that is transported toroad ditches.
Impervious surfaces include roofs, driveways, parking lots and rock quarries convertprecipitation directly into surface runoff and short-circuit natural hydrologic storage thatmoderates flows. Rainwater is shunted from infiltration and soil storage, and baseflow declines because water is hurried out of the watershed as runoff (Ferguson1994). Stream erosion and elevated sediment levels can follow the increased flows.Benefits of baseflow such as instream flows and aquifer recharge can decline inurbanizing sub-basins as the area of impervious surface increases. A study in thePuget Sound watershed (Appendix 3, Figure 5) has demonstrated negativerelationship between habitat quality and the percent of impervious surfaces in a givenwatershed (May et al. 1997). Streams with significant urban growth in theirwatershed, such as Newton and Oak creeks, may be negatively impacted bydecreased infiltration and dramatically increased runoff.
Streambank Erosion
Active streambank erosion in the watershed is evident in many streams where bankvegetation is denuded. High flows saturate soils and undercut the toes of banks, thenunprotected stream banks slough or cave in large slabs, delivering nutrient-rich soildirectly into the stream. Productive streamside land is lost as a result. Quantitativeinformation on the amount of sediment eroded from stream banks is insufficient tomake an accurate assessment of the problem. A visual survey conducted statewide in1971 revealed that the banks of Marys River, Greasy Creek and Beaver Creek weremoderately eroded (State Soil and Water Conservation Commission 1971). Theamount of sediment delivered to streams from eroding banks was not reported in thatstudy.
A recent qualitative assessment of bank erosion potential was made for Muddy Creekdrainage basin in 1996 (BFWA, BLM 1997). The findings included:
• Reaches in forested uplands have low potential for bank erosion, primarily becausethey have cascading morphology, large cobble and boulder substrate, and resistantbanks with little or no floodplain.
• Moderate bank erosion occurs in “response type channels” in forested uplands.These are incised and moderately unstable, and channels are disconnected fromtheir floodplains.

Ecosystems Northwest Marys River Preliminary Watershed Assessment 69
• “Transition channels,” from the forested uplands to Muddy Creek, have moderate tohigh bank erosion potential. Many of these channels are deeply incised into alluvialmaterials and severe active bank erosion was observed at several locations.
• Transition channels that have protective bank vegetation had more channeldowncutting than widening, and likely only have active bank failure during high flowevents.
• Muddy Creek has high bank erosion potential, but is currently stable because thereis adequate riparian vegetation and low stream energy.
While current forest practices require riparian buffers, there are no similar rules forriparian buffers associated with pastures, cropland and urban land. Land usepractices that can accelerate streambank erosion include:
• Livestock grazing on banks and in creeks• Clean tilling or mowing to the edge of a channel• Streamside recreation• Land uses in the watershed that decrease the infiltration capacity of the land and
storage of runoff, including increasing the amount of impervious surfaces
Sediment Sources and Delivery
Little information is available that relates upslope soil loss or streambank erosionamounts to sediment delivery to the Marys River and its tributaries. Andrus(unpublished report 1995) estimated the suspended sediment yield of the Marys Riverbased on measured sediment concentrations and flow for the years 1942-1951 (Table21). Approximately 90% of the total sediment load occurred during the highest flows(>1000 cfs). Compared to the sediment loads of other streams in the upperWillamette Basin, the Marys River sediment loads were not high. In another study,more than 80% of the soil eroded in a large storm in the Willamette Valley in 1949 wasestimated to have been delivered to streams and/or out to sea (USDA-SCS 1949.)
Table 21. Sediment yield data reported for the Marys River near Philomath forflows from 1942 to1951 (Andrus 1995).
Suspended SedimentDrainage area(mi2)
Mean Flow(cfs) (T yr –1) (T mi-2 yr-1)
159 475 22500 142
Sediment and nutrient yield data are available for a storm in January 1996 for severalcreeks in the Muddy Creek sub-basin (Appendix 3 Figures 7-9; Eilers and Vache1996). These storm data provide evidence that Muddy Creek is storing somesediment in the floodplain. Muddy Creek went over its banks during the February1996 flood, but data regarding flow are not available. Phosphorus concentrationswere closely related to total suspended solids (TSS) for all creeks. Nitrate increasedonly slightly for some streams and slightly decreased for Muddy Creek during thestorm. Peak TSS concentrations were 155.6 mg per liter for Beaver Creek and 193.1mg per liter for Oliver Creek. Muddy Creek TSS increased little during the storm.

70 Marys River Preliminary Watershed Assessment Ecosystems Northwest
Fertilizers and Pesticides
Fertilizer and pesticides are widely used on farms, forest plantations, residentiallawns, golf courses, and highway rights-of-way. Nutrients can enter surface waterattached to sediment or dissolved in runoff and also dissolved in subsurface flow.Grass seed crops in western Oregon receive between 125 and 256 lbs. of nitrogen peracre per year (Horneck and Hart 1988). Young et al. (1999) estimated that theamount of nitrogen applied annually to grass seed fields could be reduced by anaverage of 30% and growers could still optimize crop and economic returns. A majorresearch project is underway to determine long term impacts of grass seed productionon water quality (Griffith et al. 1997, Horwath et al. 1998). Work has focused onpoorly drained soils such as Group E (Map 19), which are well suited to perennialryegrass crops and they have substantial subsurface flow above clayey subsoil.Between crop uptake and denitrification in the poorly drained riparian soils shallow-groundwater NO3-N is reduced to low levels, even when fertilized at nitrates reaching170 lbs. of nitrogen per acre per year. In another study, Young et al. (1999) found thatusing nitrogen fertilizers at recommended rates (90 to 100 lbs. of nitrogen per acre)would result in a low potential for leaching of NO3-N on fine-textured soils where grassseed crops are grown. A wide variety of pesticides are used in the Willamette Valley;Anderson et al. (1997) provide a synopsis of those pesticides used on various crops.
Because there have been few measurements of nutrient losses from uplands and thesubsequent concentrations in surface water, nutrient and chemical transport and theirimpacts on water quality are not adequately known for the watershed.Nitrate concentrations in runoff and shallow wells frequently exceeded 10 mg per literfrom three of six agricultural watersheds in the southern Willamette Valley (Simmons1981). Nitrate losses are highest when runoff events occur shortly after fertilizerapplications, and even then amount to less than 4% of total applied fertilizer.Simmons (1981) reported total phosphorus (TP) losses of 0.36 to 20.9 kg per hectare,and dissolved inorganic phosphorus runoff concentrations 0.1 to 5.1 mg per liter.
Pesticide applications are poorly tracked, but pesticide transport and impact in thewatershed are beginning to be scrutinized. Anderson et al. (1997) collected data tocharacterize the distribution of dissolved pesticide concentrations in small streamsthroughout the Willamette Basin. They reported that a total of 36 pesticides weredetected, with five herbicides including Atrazine and diuron detected frequently.Pesticide concentrations for all those tested were usually less than 1.0 ug per liter,however an unusually high number of concentrations were in the range 1-90 ug perliter. One problem in interpreting these data is that aquatic life toxicity criteria haveonly been established for three of the detected chemicals. Anderson et al. (1997)published several tables on pesticide properties and commonly applied rates for theWillamette Valley.
Significant correlations exist between land use and pesticide detections in surfacewater of the Willamette Valley (Anderson et al. 1997). The amount of forested land ina watershed was negatively associated with pesticide occurrence. In predominantly

Ecosystems Northwest Marys River Preliminary Watershed Assessment 71
agricultural watersheds, the instream concentrations of a few pesticides that wereapplied to a wide variety of crops were significantly correlated with estimates of theamount used.
A pilot study measured herbicide movement in runoff and in shallow subsurface flowto streams from grass seed fields in poorly drained Dayton silt loam soils. Theapplication rates for the herbicide diuron varied from 1.8 lb active ingredient (a.i.) peracre for perennial ryegrass seed crops up to 10 lb a.i. per acre for treatment of rights-of-way and field borders. Diuron was detected at instream concentrations of 1 to 12ug L-1, suggesting that no environmentally significant residues of diuron are likely inaquatic systems next to grass seed fields, though further research is needed (Jenkinset al. 1994). Yet, concentrations of diuron as high as 5-10 mg per liter (a thousand-fold higher concentration than the ug per liter levels discussed earlier) were measuredin very small ponded areas in the Willamette Valley where the herbicide had drainedfollowing application that could have potentially adverse effects on aquatic species(Schuytema and Nebeker 1998.) Such relationships require further study.
Forest Roads
Roads can increase surface erosion, mass wasting, and stream sedimentation.Road density (miles per square mile) has been used as a meter to compare thepotential impacts of roads on different watersheds. One problem with interpretingroad density information is that usually more information is needed about roadconditions, size, traffic and road location in the landscape in order to make anevaluation of road impacts on the watershed. This additional information is often moredifficult to obtain and to interpret. Examples of compiled road density information areshown in Figure 14 and Table 22. Only ODF and BLM partitioned the data by roadtype and by ownership. Of the 4.3 miles per square mile road density reported onstate lands in three townships in the northwest part of the watershed, 84% of theroads were rock roads; 14% were dirt roads that were closed; and 2% were pavedroads maintained by the county or ODOT (Nall, ODF GIS road data, 1995).
Road Density (miles per square mile )
0123456789
Beave
r
Hammer
Lower M
uddy Moss
Oliver
Reese
Upper G
reasy
Upper
Mudd
y
Road Density
Figure 13: Road density in miles per square mile (Benton FoothillsWatershed Analysis, BLM 1997).

72 Marys River Preliminary Watershed Assessment Ecosystems Northwest
Road densities on all forested lands in the Benton Foothills Watershed Area (MuddyCreek sub-basin and part of the Greasy Creek sub-basin) range from 2 to 8 miles ofroad per square mile of land (Figure 13). Seventy percent of these roads are in thefour sub-basins that have the greatest concentration of timber management (Beaver,Hammer, Oliver and Reese creeks). In the Beaver Creek sub-basin, 13% of the roadlength is located in riparian areas. The average road density on BLM lands in thisarea is 3.5 miles mile-2. Several private timber companies have road inventories thatcan be used to calculate road densities, or aerial photograph interpretation can beused to locate roads.
Table 22. Comparative road densities for the Willamette Basin and MarysRiver Watershed.Area Road Description Road Density
(miles / sq. mile)Willamette Basin* All roads 3.8Willamette Basin* BLM roads 3.7Willamette Basin* USFS roads 4.8Marys River Watershed* All roads 3.2Muddy Creek drainage basin(Benton Foothills) ** All forest roads 2 to 8
Muddy Creek drainage basin(Benton Foothills) **
BLM roads 3.5
ODF Data (3 townships in MarysRiver Watershed) ***
All roads (mixed forestand agricultural land) 6.1
ODF Data (3 townships in MarysRiver Watershed) ***
State Forest Lands 4.3
* Willamette River Basin, A Planning Atlas, Version 1.0 (Hulse et al, 1998).** BLM (1997).***R. Nall, pers. comm., ODF-GIS data, 1995 roads data.
Road inspections are a critical part of road management that can identify potentialproblems such as plugged culverts, rutting and sedimentation. Williams et al. (1994)identified cutslopes as a primary source of sediments from forest roads in the OakCreek drainage basin. Regardless of public or private ownership, most landmanagers with large forest holdings conduct road inspections and inventories. StarkerForests Inc. has completed inspection of 240 miles of road in the Marys RiverWatershed. Inspections included noting the condition of roadbeds, culverts, bridges,water bars, ditches, cut banks and fill slopes. Corrective action is taken wherenecessary. Most of the road-related problems are prevented by regular maintenanceof road surfaces, ditches and culverts. A number of dirt roads are “put to bed” byblocking traffic with berms and pits, and by dispersing road drainage water away fromstreams (G. Blanchard, Starker Forests Inc., pers. comm.). In Oregon, the timberindustry has made a commitment to remove or rehabilitate high hazard roads as partof the agreement for the Oregon Plan for Salmon and Watersheds.

Ecosystems Northwest Marys River Preliminary Watershed Assessment 73
Road construction has historically been one of the greatest contributors to “cumulativeeffects to hydrologic processes on forested uplands” (BFWA, BLM 1997). Properdesigns now include locating roads away from streams and erosive sites and planningto minimize the extent, width, and period of use. Guidelines are available to helplocate roads and landings in relation to streams (ODF 1994; Trimble and Sartz 1957).Once constructed, roads must also be properly operated and maintained.Recommendations for reducing road impacts include managing wet weather traffic,decommissioning certain roads, minimizing disruption of natural drainages, upgradingculverts, placing rock on unsurfaced roads, and maintaining ditches and culverts (BLM1997).
Still, current information remains inadequate to fully address the issue of roads andtheir impacts on water quality. Updated information from comprehensive roadinventory conducted last year on state lands, will be available in 1999 and will beintegrated into ODF’s GIS (R. Nall, pers. comm.). Road information is available fromSiuslaw National Forest in their GIS “road coverage” (K. Bennett, USFS, pers.comm.). Roads in agricultural and urban areas can have potential impacts on waterquality also, especially in lowland streams. Further assessment of roads in thewatershed is needed.
Livestock
Livestock issues include management of confined animal feeding operations (CAFOs)and livestock grazing in the riparian zones of streams. About ten CAFOs arepermitted in the watershed or in nearby Benton county (Corvallis and Monroeaddresses) by the Oregon Department of Agriculture (ODA, Chuck Harmon, pers.comm.). The exact locations of these CAFOs are available in a GIS coverage. Ofthese, two are swine operations with around 200 animals each and one is a 300-headbeef operation, and seven are dairies with 125 to 975 animals. Three of the dairieshave more than 400 animals. Water-quality parameters directly impacted by livestockinclude fecal coliform levels, nutrients, habitat modification, sedimentation, and watertemperatures. Grazing and livestock access can deteriorate streambank vegetationand increase bank failures. Overgrazed pastures are potential sediment sourceareas.
The Natural Resources Conservation Service (NRCS) has been working with dairyoperators to improve manure and liquid wastewater separation and storage on thelarge dairies (Jim Hecker, NRCS, pers. comm.). The largest dairy has, over the last 15years, installed separators and tanks, wastewater holding ponds and now usescovered manure piles, recycled water and an automatic barn cleaning system. Otherdairies have not been as progressive and many lack sufficient winter manure andliquid storage capacity. Winter application of manure and wastewater can increasethe likelihood of nutrient and bacterial contamination of surface water.
The Oregon State University dairy barns and other livestock facilities do not have amodernized manure handling and separation system in place. The OSU’s Oak CreekInitiative is an active initiative recently underway to improve the stream and riparian

74 Marys River Preliminary Watershed Assessment Ecosystems Northwest
conditions of the agricultural reach of Oak Creek. Early plans include constructingwetlands to mitigate high nutrient runoff from the beef unit, and addressing ways tominimize contact of rainwater with winter stockpiles of manure. Innovative methodsfor managing manure that can be cost shared include composting, covered anaerobiclagoons, manure transfer pipelines, and implementing prescribed grazing.
Livestock can have significant impacts on riparian zones. Excluding animals fromthese areas with fencing and providing off-stream watering helps to alleviated impacts.The adoption of such practices is in a threshold stage in Benton County, and a targetgoal is three-pasture management demonstration projects in the area to promotethese practices (Jim Hecker, NRCS pers. comm.) Such practices as manuremanagement, filter strips and riparian planting are available to be cost shared up to75% (USDA-EQIP Program).
Government Programs to Aid Watershed Management
A directory of government programs related to watershed health and water qualitywould serve a useful purpose for the citizens in the Marys River Watershed and theState of Oregon. One often repeated frustration of people involved in watershedcouncils and other natural resource management activities is that governmentprograms, rules and regulations are not well integrated or tend to be overly complex.As more people get involved with watersheds and other resource management issues,there is an increasing need for guidance and information about such programs.
Several of brochures and fact sheets are available through the Benton Soil and WaterConservation District and the National Resources Conservation Service among andothers. But it seems that none are very complete. A need has been identified toassemble information on all the government programs concerned with water qualityand to watershed health, including those that can be cost shared. In addition, publicaccess to government regulations would be greatly improved if pertinent informationwere assembled in one directory that was made widely available. A future projectcould be to assemble such an information directory or to advocate for such a project.This project may be best accomplished by first making a statewide template and thenby customizing the directory for basins or watersheds.
Summary
Combined upland practices have had varied effects on soils and streams. Althoughdetailed information is limited, soil erosion appears to be elevated in some areas ofthe watershed as a result of poor soil management practices and roads. Road densityis relatively high in some portions of the basin, but interpretations about impacts tostreams is problematic without a more detailed survey about conditions, traffic andlocations. Accelerated mass wasting from uplands does not appear to be a majorsource of stream sediment in the watershed and the Marys River is thought to betransporting average sediment loads compared to other tributaries of the WillametteRiver. Productive soils have been lost to urban and residential development and

Ecosystems Northwest Marys River Preliminary Watershed Assessment 75
impervious surfaces convert precipitation directly into surface runoff and short-circuitnatural hydrologic storage. Preliminary information on the use of a variety of fertilizersand pesticides by various landowners suggests further study is merited. Someproblems exist with livestock; most problems can be addressed through goodmanagement practices.

76 Marys River Preliminary Watershed Assessment Ecosystems Northwest
CHAPTER 6: SOCIOCONOMICS
The majority of economic data available from state and federal agencies is aggregatedat the county level. The assumption used in the analysis is that the trends for BentonCounty reflect trends for the Marys River watershed. While 95% of the Marys RiverWatershed is in Benton County, only 43% of Benton County is occupied by thewatershed (Map 7). Judging by the location of the watershed in the county, the mix ofland uses within the watershed should be similar to the mix of land uses throughoutthe county. The exact percentage of each land use within the county that occurswithin the watershed could be calculated with additional time and GIS data layers, aproject that the Marys River Watershed Council may consider in the future.
The land use of the Marys River Watershed is primarily agriculture and forestry (Map2). Land ownership within the watershed is dominated by private farms and forests(Map 3), although there are some Forest Service, State, and BLM lands in the westernpart of the watershed, as well as the William L. Finley National Wildlife Refuge on thesoutheastern edge of the watershed. Other public ownerships include Oregon StateUniversity’s MacDonald Forest, the City of Corvallis’ Watershed, and city and countyparks. Private ownership is a mix of farms, industrial and non-industrial privateforests, and rural and suburban residential areas.
Economic Characteristics
The forested lands of Benton County have provided a widely fluctuating timber harvestover time (Figure 14). The harvests in 1962 and 1997 were almost the same (about80 million board feet (MMBF)), while the peak harvest was in 1973 (175 MMBF) andthe low harvest was in 1982 (67 MMBF). The harvest levels since 1991 have beenbelow the overall average level of 111 MMBF from 1962 to 1997.

Ecosystems Northwest Marys River Preliminary Watershed Assessment 77
The harvest levels of different ownership types have changed over time. Forestindustry harvests have risen significantly in the County, while all other ownershipshave either declined or remained steady. A comparison of public and private timberharvests over time shows that public harvests provided the majority of timber in thepast, but now private harvests provide almost all of the timber supply in BentonCounty (Figure 15).
Figure 15: Benton County Timber Harvests on Public and Private Lands
0
20000
40000
60000
80000
100000
120000
140000
1962 1964 1966 1968 1970 1972 1974 1976 1978 1980 1982 1984 1986 1988 1990 1992 1994 1996
Year
Th
ou
san
d b
oar
d f
eet
Private
Public
Figure 14: Benton County Timber Harvest by Landowner
0
20000
40000
60000
80000
100000
120000
140000
160000
180000
200000
1962 1964 1966 1968 1970 1972 1974 1976 1978 1980 1982 1984 1986 1988 1990 1992 1994 1996
Year
Th
ou
san
d b
oar
d fe
et
INDUSTRY
OTHER PRIVATE
STATE
BLM
N. FORESTS
ALL

78 Marys River Preliminary Watershed Assessment Ecosystems Northwest
The other major component of the rural economy is agriculture. Total gross incomefrom farm sales has increased steadily from 1980 to 1997, while the number ofharvested acres has remained fairly steady (Figure 16). Part of the
growth in income over time is due to inflation, but part is due to a shift to morevaluable crops. Sales of livestock and products have increased only slightly over time,while the large increase in total farm sales has been driven almost completely by anincrease in crop sales (Figure 17). Crops now make up 88% of all county farm sales.
Figure 17: Benton County Gross Farm Sales
0
10000
20000
30000
40000
50000
60000
70000
80000
90000
100000
1980
1981
1982
1983
1984
1985
1986
1987
1988
1989
1990
1991
1992
1993
1994
1995
1996
1997
Year
Th
ou
san
ds
$
All Crops
All livestock & products
Total gross income
Figure 16: Benton County Farm Sales and Harvested Acres
0
10000
20000
30000
40000
50000
60000
70000
80000
90000
100000
1980
1981
1982
1983
1984
1985
1986
1987
1988
1989
1990
1991
1992
1993
1994
1995
1996
1997
Year
Th
ou
san
ds
$
0
10000
20000
30000
40000
50000
60000
70000
80000
Acr
es Total gross incomeTotal Acres

Ecosystems Northwest Marys River Preliminary Watershed Assessment 79
In the past, crop sales were evenly distributed among product types. However inrecent years specialty products and grass and legume seeds have becomeincreasingly important to crop sales (Figure 18). Specialty products now make up44% of all crop sales, while grass and legume seeds comprise 30%. In BentonCounty, Christmas trees make up 50% of specialty products. Despite the growth insales of specialty products, the harvested acreage of these products has risen onlyslightly over time, and has the smallest amount of acreage in production (Figure 19).
The greatest amount of acreage is in grass and legume seeds, and the share of totalacreage devoted to those crops has risen from 34% in 1980 to 52% in 1997. Acreagedevoted to grains has dropped significantly over this time period.
Figure 18: Benton County Gross Farm Sales: Crops
0
5000
10000
15000
20000
25000
30000
35000
40000
1980
1981
1982
1983
1984
1985
1986
1987
1988
1989
1990
1991
1992
1993
1994
1995
1996
1997
Year
Th
ou
san
ds
$
Grains
Grass & legume seedsAll Vegetable Crops
Specialty Products
Other crops
F i g u r e 1 9 : B e n t o n C o u n t y H a r v e s t e d A c r e a g e
0
5 0 0 0
1 0 0 0 0
1 5 0 0 0
2 0 0 0 0
2 5 0 0 0
3 0 0 0 0
3 5 0 0 0
4 0 0 0 0
1980
1981
1982
1983
1984
1985
1986
1987
1988
1989
1990
1991
1992
1993
1994
1995
1996
1997
Y e a r
Acr
es
Gra insHay & fo rageG r a s s & l e g u m e s e e d s
A l l v e g e t a b l e sSpec ia l i t y P roduc t s
O t h e r

80 Marys River Preliminary Watershed Assessment Ecosystems Northwest
While forestry and agriculture clearly dominate the rural parts of Benton County andthe Marys River Watershed, they are much less important in the overall Countyeconomy. Most employment in Benton County is in the services, government(including local, state, and federal), manufacturing (other than lumber and woodproducts), and trade sectors (Figure 20). Lumber and wood products is the only majorsector to see declining employment levels from 1975 to 1995.
Figure 21 shows employment in each sector for 1975, 1990, and 1995. Services andother manufacturing have enjoyed the largest gains over time, while most otherindustries have been declining or holding steady. Employment in agriculture, forestry,and fisheries (this includes the growing and harvest of trees, but not the processing)has also increased, although it remains at only 2.6% of total employment.
Figure 20: Benton County Employment
0
1000
2000
3000
4000
5000
6000
7000
8000
9000
Ag, Fo
r, Fish
eries Minin
g
Const
ruction
Lumbe
r & W
ood P
roduct
s
Other M
anufac
turing
Trans,
Com
m, Util. Tra
deFIR
E
Servic
es
Governm
ent
Employment Sector
Em
plo
ymen
t
1 9 7 51 9 9 01 9 9 5
Figure 21: Share of Benton County Employment
0
5
10
15
20
25
30
35
40
Ag, F
or, Fi
sherie
sMinin
g
Construc
tion
Lumbe
r & W
ood P
roduct
s
Other M
anufa
cturing
Trans,
Comm, U
til. Trade FIR
E
Servic
es
Governm
ent
Employment Sector
% T
ota
l Em
plo
ymen
t
1975
1990
1995

Ecosystems Northwest Marys River Preliminary Watershed Assessment 81
In terms of payroll, the changes over time are even more dramatic (Figure 22). Payrollin other manufacturing has skyrocketed, due to the growth in the high tech industry inthe county. Services and government payroll have also increased significantly, whilelumber and wood products is the only sector to decrease between 1990 and 1995.Payroll in each sector as a percent of total county payroll shows that othermanufacturing now makes up over 30%, while government makes up an additional27% (Figure 23). Lumber and wood products, a traditionally high-paying industry,previously comprised over 10% of Benton County payroll, but now accounts for only3.2%.
Figure 22: Benton County Payroll
0
50,000,000
100,000,000
150,000,000
200,000,000
250,000,000
300,000,000
Ag, F
or, Fis
heries Minin
g
Constru
ction
Lumber
& Wood
Produ
cts
Other M
anufa
cturing
Trans,
Comm, U
til. Trade FIR
E
Servic
es
Governm
ent
Employment Sector
Do
llars 1975
1990
1995
Figure 23 : Share o f Benton County Payro l l
0
10
20
30
40
50
60
Ag, Fo
r, Fish
eries Minin
g
Constru
ction
Lumbe
r & W
ood P
roduct
s
Other M
anufa
cturing
Trans,
Comm, U
til. Trade FIR
E
Servic
es
Governm
ent
E m p l o y m e n t S e c t o r
% o
f T
ota
l P
ayro
ll
1 9 7 5
1 9 9 0
1 9 9 5

82 Marys River Preliminary Watershed Assessment Ecosystems Northwest
Consistent with the growth in payroll, total county personal income has risendramatically over the last 30 years (Figure 23). Per capita income in the county showsthe same trend, despite the steady population growth over this time period (U.S. Dept.of Commerce, Bureau of Economic Analysis 1998). In nominal dollars (not adjustedfor inflation), per capita income has risen by an average of 6.3% per year since 1990.Because inflation rates have been around 3% over this time period, Benton Countyresidents' real earning power has increased significantly. Benton County rankedfourth in the state in per capita income, trailing only the three Portland metropolitancounties.
This description of Benton County’s economy makes it clear that most of theemployment and payroll growth is occurring in the urbanized parts of the County. Ifthis trend continues, the implication for the Marys River Watershed is that residents ofthe watershed will be increasingly employed in Corvallis. Long-time watershedresidents may begin seeking employment in the high growth industries in Corvallis,and employees of Corvallis industries may move into rural areas of the watersheds.
Figure 24:Total Personal and Per Capita Income
0
200,000
400,000
600,000
800,000
1,000,000
1,200,000
1,400,000
1,600,000
1,800,000
2,000,000
1969
1971
1973
1975
1977
1979
1981
1983
1985
1987
1989
1991
1993
1995
Year
To
tal C
ou
nty
Per
son
al In
com
e $
0
5,000
10,000
15,000
20,000
25,000
Per
Cap
ita
Inco
me
$
Total CountyIncome
Per CapitaIncome

Ecosystems Northwest Marys River Preliminary Watershed Assessment 83
Population Growth and Development Pressures
Population estimates and projections are available at the county and city level, but canonly be made for the Marys River watershed from U.S. Census figures every 10 years.Data from the 1990 census are now quite dated. The Marys River Watershed Councilwill have much more timely data available after the 2000 census, and will probablywant to update this analysis.
Benton County population increased rapidly in the 1970’s, declined during therecession of the early 80’s, and has climbed steadily since (Figure 25). Statedemographers expect Benton County population to continue to increase at a moderatepace through 2040 (Office of Economic Analysis, 1997; see web site in Appendix 1).However, recent estimates by the Portland State University’s (PSU) Center forPopulation Research and Census (1999; see web site in Appendix 1) show thatBenton County population decreased by 100 people between 1997 and 1998. Most ofthe population loss occurred in Corvallis, where the population dropped from 51,145 in1997 to 49,630 in 1998. At the same time, Philomath’s population increased from3,380 to 3,770. These estimates should be viewed with caution, however, since theyare not based on a census.
Figure 25: Benton County Population Projection
0
20,000
40,000
60,000
80,000
100,000
120,000
1970 1975 1980 1985 1990 1995 2000 2005 2010 2015 2020 2025 2030 2035 2040
Year
Popu
latio
n
Population

84 Marys River Preliminary Watershed Assessment Ecosystems Northwest
Benton County population growth from 1960 to 1996 was concentrated in the cities(Figure 26). While rural areas experienced rapid growth in the 1970’s, their populationdeclined through 1990 and has only risen slightly in subsequent years. Ruralpopulation currently makes up about 30% of total county population. If the recentestimates by PSU are accurate, a shift in growth away from Corvallis toward the ruralareas of Benton County may occur, which would have implications for landdevelopment in the watershed.
The census data from 1990 can be used to describe the rural Benton Countypopulation in detail. An analysis that would coincide with the boundaries of the MarysRiver Watershed would require more time and resources, but the area covered by thePhilomath zip code (97379) will be used as an example. In 1989, there were 6,693people living in this area, comprised of 2,526 households. There were 2,552 housingunits in this area, of which 44% relied on individual wells for their water source. Fifty-five percent of housing units had a septic tank or cesspool, and the remainder were onpublic sewer systems.
Of employed persons in the Philomath area who are 16 years of age and older, thehighest percentage (22%) was employed in durable goods manufacturing.Unfortunately, there is no way to know if these people are employed in ruralmanufacturing such as lumber and wood products, or other manufacturing such ashigh tech in Corvallis. Fifteen percent of workers were employed in retail trade, and14% in educational services. Only 6% were employed in the agriculture, forestry, andfisheries sector. Forty-seven percent of workers spent 20 or more minutes traveling towork, which is probably an indicator of the number living in this area but working inCorvallis or other urban areas.
While census data can be used to show the population density in 1989, more time andresources would be needed to show how that density has changed over time. The
Figure 26: Benton County Populat ion: Rura l and Ci t ies
0
1 0 , 0 0 0
2 0 , 0 0 0
3 0 , 0 0 0
4 0 , 0 0 0
5 0 , 0 0 0
6 0 , 0 0 0
1960 1970 1 9 8 0 1990 1 9 9 6
Y e a r
Pop
ulat
ion Al l Ci t ies
R u r a lCorvall isP h i l o m a t h

Ecosystems Northwest Marys River Preliminary Watershed Assessment 85
1989 population information shows that the densest concentrations of humansimmediately surround the cities within the watershed, along with patches ofdevelopment in the Oak Creek area northwest of Corvallis, and Marys River Estates,northwest of Philomath.
Other studies have looked more closely at development pressures within parts of thewatershed. In a lands need study for the City of Corvallis, ECONorthwest (1998) citedthe growth in population and employment that were creating a demand for housing.Between 1990 and 1996, the City of Corvallis annexed a total of about 300 acres ofland, an average of about 50 acres per year. The city approved 2,629 residentialbuilding permits between 1990 and 1996 (92% of permits issued resulted in units onthe ground). By 2020, the report estimates the housing and land need within theCorvallis urban growth boundary will be 2,750 single family units and 1,250 multiplefamily units, for a total of 4,000 new units.
While most of the residential growth associated with employment growth in Corvalliswill remain within the Corvallis urban growth boundary, there will be an increasingdemand for rural residential development as well. The ECONorthwest report notedthat in the 1980’s and 1990’s, there has been a growing demand for large new homeson large lots, but the supply of buildable land is decreasing (at least temporarily).Thus, even though the study concludes that the City of Corvallis has enough vacantbuildable land inside its urban growth boundary to accommodate expected growth,there will surely be accompanying growth in the rural residential areas outside theurban growth boundary.
Another study that focused on a part of the Marys River Watershed was conducted bya regional research consortium called the Pacific Northwest Ecosystem ResearchConsortium (Hulse et al. 1997). This study focused on the Muddy Creek sub-basin inthe southeastern part of the Marys River Watershed. The Muddy Creek watershedwas chosen as a prototype for the larger Willamette River basin project becauseprevious analyses showed that, between 1970 and 1990, land use change in the basinwas greatest at the periphery of major metropolitan areas. The authors noted that theMuddy Creek sub-basin is near a metro area (Corvallis) that is likely to experiencestrong development pressure within the next 20-30 years.
The Hulse report estimated that 88% of the Muddy Creek sub-basin is privatelyowned. Most is zoned for Exclusive Farm Use (42% of the watershed), ForestConservation (35%) or Secondary Forest uses (11%). Approximately 12% of thewatershed is in public ownership. Despite this, the watershed is projected toexperience significant growth in residential development over the next 15 years. TheBenton County Development Department projects 1000 new people (or 400households) in the sub-basin by the year 2015. Combining this information withpopulation projections from PSU led to a baseline projection (called the “Plan TrendFuture” in the report) of 1,118 new people or 475 new dwellings by 2025. Theresearch team bounded this baseline projection with alternative growth scenarios,ranging from a high development scenario of 1,250 new households by 2025 (adoubling of the 1990 resident population of the watershed) to a high conservationscenario of only 125 new households over 1990 levels.

86 Marys River Preliminary Watershed Assessment Ecosystems Northwest
The research team then estimated the impact of the scenarios on biodiversity andwater quality. They concluded that the high development future would put twice asmany species per year at risk of losing >50 % of their habitat over the next 30 yearscompared to the last 150 years. They recommended seeking a land use/land coverpattern that is more conservative than the Plan Trend Future. In terms of waterquality, they concluded that under the Plan Trend Future, water quality would degradeby the year 2025. A future that tends toward the high conservation scenario isnecessary to maintain water quality at 1990 levels.
Further information about development pressures in the Marys River Watershed wouldrequire more time and resources. The Benton County Development Department cancompile data on building permits over time, by location, and could at least approximatethe watershed boundaries. They do not have this information currently compiled,however, and a formal request would have to be made. In addition, the BentonCounty Assessor’s Office has data on every tax lot in the County. Records could beanalyzed to find dates of lot subdivision, as well as the year any house was built.From this analysis, a database of land and housing development over time could beconstructed.
Recreational Resources and Use in the Marys River Watershed
The predominance of private land in the watershed results in relatively few developedrecreation areas. Corvallis city parks that lie within the watershed include Avery,Sunset, Bruce Starker Arts, Bald Hill, and Walnut parks. The City of Philomath Park,Marys River Park, and East Newton Park are also within the watershed. Facilities andopportunities at all of these parks are listed in the Benton County Recreation Guide(Benton County Parks, undated). Benton County has one park – Bellfountain - in thesouthern part of the watershed, near the Community of Alpine Park, as well as OpenSpace Park west of Corvallis. Visitor use statistics are not kept for Benton CountyParks, although there are data on reservations at park facilities.
In addition to the parks, three public land areas are managed at least in part forrecreation. These are the Forest Service lands to the northeast of Marys Peak, thesouthwestern portion of OSU’s MacDonald Forest, and William L. Finley NationalWildlife Refuge. The Forest Service maintains a road counter 5 ½ miles up MarysPeak Road from Highway 34, which counts traffic headed for the Peak. In the 5 yearsbefore 1997, when user fees were instituted on Marys Peak, visitor use was fairlysteady at 23,000-25,000 vehicles per year (K. McCall, pers. comm.). Not all of theseusers would end up recreating within the Marys River Watershed, but this shows thatthe general visitation trend for this area is fairly flat.
MacDonald Forest has experienced increasing recreational use as Corvallispopulation has grown (Wing 1998). Overall use is now estimated at 100,000 visits peryear (D. Lysne, OSU Research Forest, pers. comm.) and the Oak Creek area (whichis within the watershed) is the most popular area of the forest for recreationists. Arecreation study conducted in this area showed that use at the Oak Creek access

Ecosystems Northwest Marys River Preliminary Watershed Assessment 87
point had increased 25% over 3 years (Wing 1998). Motorized use of MacDonaldForest is only allowed for those working in the forest, so recreation use is limited tohiking, mountain biking, and horseback riding. All official recreation trails have bridgesacross streams, but unofficial trails going from the roads and trails down to thestreams are common in this area. During storm events, these unofficial trails cancontribute to erosion. Unauthorized trails on the steep slopes of McCullough Peakalso cause erosion into the tributaries of Oak Creek during storm events (Lysne 1999).
William L. Finley National Wildlife Refuge offers hiking trails and abundant wildlifeviewing opportunities. Unfortunately, they have no reliable visitor use statistics for thearea.
Private lands in the watershed offer opportunities for waterfowl, big game, and smallgame hunting. Some private lands are also open for general recreation use, often byfree permit from the landowner. The City of Corvallis watershed is open to walk-inhunting, although no other type of recreation is allowed on city lands within theirwatershed. Statistics on hunting and fishing use within the watershed are unavailable.
As population continues to grow in and around the Marys River Watershed, thedemand for outdoor recreation opportunities will also grow. Some public lands receivevery little recreational pressure, while others, like MacDonald Forest, are experiencingproblems from too many recreationists. Private lands have the capability to supplymore recreation opportunities, but given problems with vandalism and illegal dumping,many private landowners are closing their lands to public use.
Because data on visitation are lacking for most of the land in the watershed, it is notpossible to estimate the economic impacts resulting from recreation expenditures.Given the types of recreation opportunities available in the watershed, most visitorsprobably come from the local area and do not have high trip expenditures. Therefore,the economic value of these recreation resources (i.e., the willingness to pay for them)is probably more significant than the economic impacts (resulting from what is actuallypaid). Economic value estimation would require an in-depth survey of recreationusers.
Summary
Much of the data used to describe socioeconomic conditions is only available at thecounty level. Therefore, some caution must be used when interpreting the results forthe Marys River Watershed. The data on agricultural sales and acreage, as well asthe data on timber harvest, primarily describe rural parts of Benton County. If weassume that the portion of Benton County that is in the Marys River Watershed has asimilar distribution of agricultural and forest lands as the part of the county outside ofthe watershed, then the trends shown in these statistics should be fairly representativeof the watershed. The data show that the number of acres in agriculture has beenholding fairly steady over time, while the value of agricultural output has been rising.Agricultural landowners have increased the amount of acreage in grass seeds, whiledecreasing the acreage in grains. Further investigation should look at the differences

88 Marys River Preliminary Watershed Assessment Ecosystems Northwest
in farming practices (e.g., pesticide applications) for grass seed and grains and assessthe implications for water quality.
Timber harvest levels have fluctuated widely over time in Benton County. Today’slevels are lower than the long-term average for the County. Most of the public lands inthe watershed are being managed under the Northwest Forest Plan, and very littleharvest has come from those lands in recent years. An increase in harvest fromprivate lands has resulted, and further investigation should look at the differences inharvest practices of private and public owners.
Changes in the economic structure of the county will also have implications for thewatershed. As Corvallis has grown in both population and economic opportunities,new residents have created a demand for rural residential housing. In addition, moreresidents of the watershed may have found work in Corvallis, Salem, or Eugene,leading to more commuting out of the watershed. Further investigation shoulddocument the number of new dwellings that have been built in the watershed overtime. These data are available from the Benton County Development Department byspecial request. Further analysis should also look at the impact on water supply asmore residences are built.
Finally, few data on recreation use within the watershed exist. Current use does notappear to have major impacts on water quality, and the water resources of thewatershed are not a major recreational attraction. As population continues to grow,however, recreational use should be monitored.

Ecosystems Northwest Marys River Preliminary Watershed Assessment 89
CHAPTER 7: PRIORITIZATION OF ISSUES AND RECOMMENDATIONS
The watershed assessment process has uncovered a wealth of information about theMarys River Watershed. Many of these data are of high quality and have been veryuseful. Still, a recurring problem with the development of a statement of condition forthe Marys River Watershed has been that needed data were often lacking, of ageneral nature, or collected with other objectives in mind. Lack of specific,quantitative information limits the ability to draw unequivocal conclusions about thestatus and trends of the Marys River Watershed resources. Because most watershedissues are complex, data available on the general subject may not address the issuesto a desired level of certainty. For example, spot checks of stream temperature areusually not adequate to draw conclusions about whether or not streams may be toowarm. To address the limitations of the currently available data, issues were identifiedfor which additional assessment or monitoring is necessary. Understanding thelimitations of existing information, a set of general conclusions about the condition ofthe watershed was developed, focusing primarily on the identifiable change inwatershed resources through time and, where possible, identifying the causes ofchange. Where possible, the degree of uncertainty about these conclusions willprovide the reader with a better understanding of the issues and information gaps.
Historical
By the 1930’s, the landscape features of the Marys River watershed had changeddramatically. Lands that were historically grass prairies, oak savannas, wetlands, andriparian forests had been converted to farmlands, and, to a lesser extent, other landuses. In addition, because of the end of the Kalapuyan practice of using fire to controlvegetation, some areas that were once grasslands and open oak woodlands wereconverted to conifer forests. More people lived in the watershed, and wereconcentrated in the larger towns of Corvallis and Philomath. Stream habitat,especially along the mainstem of the Marys River, had been modified through logdrives, woody debris removal, bank stabilization, and removal of riparian vegetation.Water quality problems from domestic sewage were recognized as an issue, althoughthere was little recognition that land use activities could contribute to water qualityconcerns.
Water Quality and Quantity
Portions of the Marys River are on the Oregon Department of Environmental Quality’slist for water quality limited streams, the 303(d) list. These segments are listed fortemperature, bacteria, and/or flow modification. Available stream temperature datashow that the Marys River and some tributaries currently exceed 64°degrees F, whichis the state standard for waters containing salmonids. However, it is not knownwhether the warmer stream temperatures are a natural phenomenon or due to landuse modifications. While there may be naturally high bacteria concentrationsseasonally in the Marys River, Oak Creek and Squaw Creek are chronic problem

90 Marys River Preliminary Watershed Assessment Ecosystems Northwest
areas for bacteria; the source of these bacteria (human, livestock, wildlife) need to beidentified. Water availability reports indicate that both the Marys River and MuddyCreek may experience excessively high water withdrawals during the summer months.No tracking system for withdrawals is in place, so the allocated water withdrawalamounts may not accurately reflect the withdrawals occurring. In addition, there is noinformation concerning withdrawals and stream flow for most tributaries in thewatershed.
Aquatic and Terrestrial Habitat
The rapid rate of settlement and modification of the Marys River Watershed landscapehas resulted in alteration and loss of both aquatic and terrestrial habitats. Habitatmodification and loss, together with direct effects of human populations andcompetitive pressures from introduced species, has contributed to declines in severalspecies. Seven vertebrate species have been lost from the Marys River Watershed.Currently, 97 species are considered to be in some level of “sensitive” status byfederal, state, or other organizations. Many of these sensitive species are listedbecause little quantitative data are available describing their condition.
There is evidence that some native fish are less abundant due to habitat loss andcompetition from introduced species. Indicators of habitat loss are reductions in in-stream woody debris and the amount of side channel and off-channel habitats, and anincrease in fine sediments in pools. A general lack of data on cutthroat abundance anddistribution makes it difficult to draw conclusions regarding the response of cutthroattrout to modifications in habitat. Culverts also pose problems to fish passage in thewatershed, particularly to cutthroat that live in mainstem rivers and spawn intributaries. Many of the culverts that limit fish passage, particularly on the largerindustrial forest ownerships, have been identified or are scheduled for assessment.As a result, watershed areas in need of culvert assessments include small, privateforestlands and agricultural areas. The population of the federally endangered Oregonchub in Gray Creek is stable, but faces threats from introduced warm water fish, suchas the western mosquitofish, and loss of habitat. The sandroller and Pacific lampreymay also face similar threats. Listings of winter steelhead and spring chinook salmonin the Upper Willamette may affect the Marys River.
The watershed area in wetlands and streamside vegetation (riparian zones) hasdeclined significantly from historical levels. Most of the losses of wetland and riparianvegetation probably occurred before the 1930s, and resulted from early settlement,establishment of farms, and channelization of streams. Currently, some of theremaining wetlands may be threatened with additional loss through draining and urbandevelopment. Detailed assessments of the current extent and condition of riparianforests are needed.
Soils
Although detailed information is limited, soil erosion appears to be elevated in some

Ecosystems Northwest Marys River Preliminary Watershed Assessment 91
areas of the watershed as a result of poor soil management practices and roads.Cropping practices that leave soils bare during winter rainy season present thegreatest erosion potential. Better soil conservation practices including no-tillageplanting, cover crops and grassed waterways should be promoted where needed.
Excessive livestock use of riparian zones may be occurring in some areas in theMarys River Watershed, resulting in loss of riparian vegetation and introduction ofbacteria and other pollutants to the streams. Good management practices wouldaddress many problem areas. Manure management, particularly for the confinedfeeding operations, could minimize water quality concerns.
Pesticide use and impacts are difficult to track and accurately assess. While noknown health or ecosystem impacts have occurred in the watershed, further studiesare warranted to better assess this potential issue.
Loss of riparian forests, especially in headwater streams in agricultural areas, is likelyto have been widespread. These losses of riparian forests may promote soil erosionvia accelerated water velocities causing channel incision and erosive downcutting.Formal assessments of existing riparian forests have not been performed.Development of better riparian buffers in agricultural and urban lands should bepromoted to enhance biodiversity and habitat quality, and to reduce streambankerosion.
Road density is relatively high in some portions of the basin, but interpretations aboutimpacts to streams is problematic without a more detailed survey about conditions,traffic and locations.
Social and Economic Conditions
The data show that the number of acres in agriculture has been holding fairly steadyover time, while the value of agricultural output has been rising. Agriculturallandowners have increased the amount of acreage in grass seeds,
while decreasing the acreage in grains. Further investigation should look at thedifferences in farming practices (e.g., pesticide applications) for grass seed and grainsand assess the implications for water quality.
Timber harvest levels have fluctuated widely over time in Benton County. Today’slevels are lower than the long-term average for the County. Most of the public lands inthe watershed are being managed under the Northwest Forest Plan, and very littleharvest has come from those lands in recent years. An increase in harvest fromprivate lands has resulted, and further investigation should look at the differences inharvest practices of private and public owners.
Changes in the economic structure of the county will also have implications for thewatershed. As Corvallis has grown in both population and economic opportunities,new residents have created a demand for rural residential housing. In addition, more

92 Marys River Preliminary Watershed Assessment Ecosystems Northwest
residents of the watershed may have found work in Corvallis, Salem, or Eugene,leading to more commuting out of the watershed. Further investigation shoulddocument the number of new dwellings that have been built in the watershed overtime. These data are available from the Benton County Development Department byspecial request. Further analysis should also look at the impact on water supply asmore residences are built.
Finally, few data on recreation use within the watershed exist. Current use does notappear to have major impacts on water quality, and the water resources of thewatershed are not a major recreational attraction. As population continues to grow,however, recreational use should be monitored.
Recommendations
The following are recommendations for action that could be taken by the Marys RiverWatershed Council. Recommendations are organized into four areas: 1) furtherassessment to remove uncertainties, 2) monitoring programs to refine and trackproblems and assess change, 3) projects directed at enhancement of watershedcondition and function, and 4) education and advocacy on important issues.
Additional Assessments to Remove Uncertainties
1. Finalize the culvert assessments on the remaining private lands in the watershedthat have not been included in other survey programs
2. Develop GIS layers of cutthroat trout distribution in the watershed. Existingsurveys by the Oregon Department of Forestry of upper extent fish use could beused. Prioritize additional areas to survey to develop better knowledge of wherethe high-quality habitat exists and should be protected.
3. Perform more accurate assessments to determine how much water is actuallybeing withdrawn from the Marys River and its tributaries. This information wouldhelp to determine effects on low-flow stream conditions.
4. Assess conditions of riparian areas and relate to land use, stream condition andfish use, and relate this information to land use, stream condition, and fish use.
5. Document the number of new dwellings that have been built in the watershed overtime and look for trends such as construction in riparian zones. These data areavailable from the Benton County Development Department by special request.
6. Assess selected areas that may have more than 6% of land covered by impervioussurfaces. This threshold has been associated with declines in watershedcondition.
7. Collaborate with the ODFW to perform surveys of status and distribution ofsandroller populations within the lower Marys River. Assess the specific habitatneeds and the potential threats from bass and other introduced species.

Ecosystems Northwest Marys River Preliminary Watershed Assessment 93
Monitoring to Track Problems and Assess Change
1. Monitor land use changes within the watershed, as land use is the main driver ofchange in watershed condition.
2. Monitor stream temperature, including measures of streamside parameters thatinfluence temperature. These data will help ascertain the cause of elevatedstream temperatures.
3. Obtain baseline data about stream condition for a suite of nutrients and basic waterchemistry. Include measures of land use in the immediate area and in upstreamareas to help determine relationships with non-point sources.
4. Monitor bacteria levels in Oak Creek and Squaw Creek and identify potentialsources of contamination.
5. Collaborate with the Audubon Society and the non-game division of ODFW tofacilitate the annual monitoring of bird populations in the watershed.
Projects to Enhance Watershed Condition and Function
1. Facilitate completion of culvert surveys on private lands not currently beingsurveyed by other programs. Gather all data related to culverts in the watershedand combine with fish distribution maps to prioritize culvert restoration projects.This effort could be expanded to include ways to restore passage on otherimpoundments in the watershed.
2. Restore habitat used by Oregon chub in Gray Creek. Look for other areas thatmay offer opportunities for habitat restoration such as the Newton Creek area.
3. Develop, with willing landowners, demonstration projects designed to protect andenhance at-risk habitats. Examples of projects include riparian plantings(especially conifers) and wetland enhancement. Soil and water conservationdistricts and irrigation districts may provide a way to coordinate with landowners onprojects.
Education and Advocacy
1. Provide education for watershed residents on the resource values in the MarysRiver Watershed.
2. Provide education (through workshops, written materials and other methods) forwatershed residents on proper resource stewardship. Examples includedescribing methods to improve habitat and to protect water quality for all land uses,and a directory of government programs related to watershed health and waterquality
3. Advocate and provide education on wetland protection along Muddy Creek.Advocate wetland restoration in the Newton Creek area.

94 Marys River Preliminary Watershed Assessment Ecosystems Northwest
4. Advocate and provide education on good manure management at confined feedingoperations to help reduce bacterial contamination in streams.
5. Advocate and provide education on monitoring and reports of pesticide use.
6. Advocate land uses that are compatible with the land capability and that areenvironmentally sound.
7. Educate landowners that land use is closely associated with watershed condition.
The watershed council should develop a vision of the desired future for the MarysRiver Watershed through time. A carefully articulated watershed vision and long-termgoals, agreed to by the watershed council and residents, will offer a road map forfuture protection, enhancement, monitoring and educational activities.
Finally, the goals and objectives of the Marys River Watershed Council should beintegrated with efforts undertaken throughout the larger Willamette River basin. Thisrecommendation includes collaboration with other watershed councils, the Governor’sWatershed Enhancement Board, and the Willamette Restoration Initiative.Collaboration will provide a framework for prioritizing actions and addressingcumulative impacts throughout the basin, and a mechanism to direct financial,institutional, and other resources to deal with issues in the Marys River Watershed.

Ecosystems Northwest Marys River Preliminary Watershed Assessment 95
APPENDIX 1: Annotated Bibliography, carto-bibliography, and related internetresources.
Annotated Bibliography
Aikens C. 1975. Archaeological Studies in the Willamette Valley, Oregon. Universityof Oregon Anthropological Papers, No. 8. Eugene, OR.
Aikens C. 1984. Archaeology of Oregon. USDI BLM, Oregon State Office, Portland.OR. [A synthesis of the knowledge that is available concerning prehistoricOregon. Insights and conclusions regarding the major early historical cultures,archaeological analyses, and problem statements. Good bibliography, regionaltable of contents, no index.]
Altman B, C Benson, I Waite. 1997. Summary of information on aquatic biota andtheir habitats in the Willamette Basin, Oregon, through 1995. Water-ResourcesInvestigations Report 97-4023. U.S. Geological Survey Portland, OR. [Aproduct of the National Aquatic Water Quality Assessment Program (NAWQA)of USGS whose mission is to describe water quality conditions and change.Thorough review of published information with written summaries andsyntheses. Also includes a series of data tables and information richappendices. Report available through USGS in Denver 303-202-4210.]
Anderson C, T Wood, J Morace. 1997. Distribution of Dissolved Pesticides and OtherWater Quality Constituents in small Streams, and their Relation to Land Use, inthe Willamette River Basin, Oregon, 1996. US Dept of the Int. US GeologicalSurvey. Water-Resources Investigations Report 97-4268. Prepared incooperation with the Oregon Dept of Environmental Quality and OregonAssociation of Clean Water Agencies. Portland, OR.
Andrus C. 1995. ManTech Environmental, Corvallis, Oregon. [Unpublished draftreport. Suspended sediment for basins within the Willamette River Watershed.And evaluation of suspended sediment transport before and after reservoirconstruction.]
Baldwin E. 1976. Geology of Oregon. Kendall/Hunt Publishing Company. Dubuque,Iowa [at OSU Valley Library]
Bastasch, R. 1998. Waters of Oregon: A Source Book on Oregon’s Water and WaterManagement. Oregon State University Press, Corvallis, OR 278 p. [A goodintroduction to Oregon’s water rights law, water supply and water use. Can beordered from the Oregon State University book store, cost is $22.95paperback.]
Baum R, V Kaiser. 1965. Damage to Oregon farms and ranches by the recent floods.J. Soil and Water Cons. 20:152-153.

96 Marys River Preliminary Watershed Assessment Ecosystems Northwest
Beckham S, K Toepel, R Minor. 1982. Cultural Resource Overview of the SiuslawNational Forest, Western Oregon. A final report submitted to the SiuslawNational Forest, Corvallis, OR. [This report provides background informationon the setting in which the cultural developments in prehistoric and historictimes have taken place. An ethnographic overview presents information on theaboriginal peoples inhabiting the Coast Range, including the Kalapuya peoplesthat inhabited the area of the Marys River Watershed (the “Chap-en-a-pho orMarysville band). An historical overview summarizes activities that have takenplace in this portion of western Oregon since the arrival of Euro-Americans.]
Bela J. 1979. Geologic Hazards of Eastern Benton County, Oregon. State of Oregon,Department of Geology and Mineral Industries.
Bennett E. 1998. Wren Subwatershed Marys River Watershed Analysis (Draft). InCooperation with the Siuslaw National Forest, Corvallis, OR. [An analysis withGIS maps for the Wren Subwatershed based largely on aerial photointerpretation.]
Bennett C, V Stanbery. 1937. Reference Data Showing Aerial Surveys In Oregon.Oregon State Planning Board, Report on W.P.A. Project No. 265-6905. Salem,OR. [Maps and tabulation sheets showing different areas in Oregon in whichaerial surveys were completed before May 1, 1937. Data regarding type ofsurvey, area covered, and locations of maps and photographs in June, 1937.]
Benton County Historic Resources Commission. 1998. Historic Context Statement forBenton County, Oregon, 1826-1949. Benton County, OR.
BLM. 1997. Benton Foothills Watershed Analysis Area. US Dept. of the Interior.Bureau of Land Management, Salem, OR. [A watershed analysis completed onthe lower elevation areas of Marys River drainage, includes Muddy Creek sub-watershed and upper Greasy Creek sub-watershed areas.]
Bonn B, S Hinkle, D Wentz, and M Uhrich. 1995. Analysis of Nutrient and AncillarySurface and Groundwater of the Willamette Basin, Oregon, 1980-90. U.S.Geological Survey. Water Resources Investigations. Report 95-4036. 85 p.OSU Valley Library TD 223.A343 no 95-4036. [Nutrient and water quality datafor groundwater and surface water. This is an analysis of water quality usingsurface and groundwater data that includes the Marys River data. Surfacewater-nitrate, DO, temperature is compared with land use. Groundwater-nitrateconcentration is elevated in shallow alluvial wells.]
Bonn B. 1998. Dioxins and Furans in Bed Sediment and Fish Tissue of theWillamette Basin, Oregon. U.S. Geological Survey. Water ResourcesInvestigations. Report 97-4082-D. 12 p. [OSU Valley Library TD 223.A343 no97-4082-D Concentrations of toxics are compared with land use types. AtCorvallis (river mile 137) reported levels are below nationwide backgroundlevels.]

Ecosystems Northwest Marys River Preliminary Watershed Assessment 97
Bourdo E. 1956. "A Review of The General Land Office Survey and of Its Use InQuantitative Studies Of Former Forests," Ecology: October: p.754-68.[Provides good information regarding qualitative and quantitative analyses oforiginal survey data for forest type mapping and for information regarding thecomposition and structure of forest types. Reviews legal instructions, thepotentials for fraud and bias in surveys, as well as providing methodology forovercoming-or even taking advantage of-bias. Good bibliography.]
Bowen W. 1978. The Willamette Valley: Migration and Settlement of the OregonFrontier. University of Washington Press, Seattle, WA.
Boyd R. 1986. Strategies of Indian Burning In The Willamette Valley. CanadianJournal of Anthropology. Fall: p.65-86. [Excellent use of historical informationto analyze prehistoric Kalapuyan burning practices in the Willamette Valley andspecific effects on vegetation. Good bibliography, organization, and use offootnotes.]
Brown R and G Kling. 1980. Erosion and sediment as indicated by redistribution ofCESIUM-137. Erosion, Sediment and Water Quality in the High Winter RainfallReport. Special Report 690. Agricultural Experiment Station, Oregon StateUniversity, Corvallis. [OSU VALLEY S105 E55. 690.]
Buchanan D, J Sanders, J Zinn, and J Fryer. 1983. Relative Susceptibility of FourStrains of Summer Steelhead to Infection by Ceratomyxa shasta. Reprintedfrom Transactions of the American Fisheries Society, Vol. 112, No. 4, July1983. [Available from Oregon Department of Fish and Wildlife, Corvallis, OR]
Bureau of Municipal Research and Service. 1958. Population of Oregon Cities,Counties and Metropolitan Areas, 1850 to 1957. University of OregonInformation Bulletin No. 106, Eugene, OR.
Carlson J, M. Finley, R Zybach, P Hays. 1995. Bessie Murphy. Botanizing in BentonCounty, Oregon, 1900-1991. Soap Creek Valley History Project, Monograph#11. Oregon State University Research Forests and College of Forestry,Corvallis, OR.
City of Corvallis. 1998. 1997 Annual Water Quality Report. City of Corvallis PublicWorks Department. Water Quality Report, Corvallis, OR. [Describes processof treating water, annual amount used and source of city water.]
City of Corvallis. 1998a. Watershed Rock Creek Facility.
City of Corvallis. 1998b. Corvallis stream monitoring program.
City of Philomath, 1998. Unpublished water quality data provided by the City ofPhilomath Water Treatment Facility.
Clean Water Act. 1972. 33 U.S.C. s/s 121 et seq. (1977)

98 Marys River Preliminary Watershed Assessment Ecosystems Northwest
Collins L. 1951. The Cultural Position of the Kalapuya in the PacificNorthwest. MS Thesis, University of Oregon, Eugene, OR.
Comacho F, N. Notting. 1997. The Vascular Plant Species List of the McDonald-Dunn Research Forest. In preparation. Oregon State University ForestResearch Laboratory and College of Forestry, Corvallis, OR.
Cook S. 1955. The Epidemic of 1830-1833 in California and Oregon. University ofCalifornia Press, Berkeley, CA. Vol. 43, No. 3: pp. 303-326.
Csuti B, A Kimerling, T O’Neil, M Shaughnessy, E Gaines, M Huso. 1998. Atlas ofOregon wildlife: distribution, habitat, and natural history. Oregon StateUniversity Press, Corvallis, OR [Short descriptions and distribution maps of the426 species of amphibians, reptiles, breeding birds, and mammals that arenative to Oregon plus 15 commonly seen introduced species. Maps werecomplied from a variety of data sources and represent the likely (or predicted)distributions of habitat used by the species of interest. Good first approximationof species distributions.]
Davies K, editor. 1961. Peter Skene Ogden's Snake Country Journal, 1826-27. TheHudson's Bay Record Society, London: pp.143-174. [Appendix B to thisvolume is the daily journal of Alexander McLeod's summer, 1826.]
DEQ. 1988. Non-Point source assessment for urban and agriculturalareas….[Suspended solids and ammonia levels are associated with urban landuses, and suspended solids are associated with agricultural areas.]
DEQ Oregon Department of Environmental Quality. 1996. DEQ’s 1994/1996 303d listof Water Quality Limited Waterbodies & Oregon’s Criteria Used for ListingWaterbodies. Oregon DEQ. Salem, OR.
DEQ. Oregon Department of Environmental Quality. 1999. Summary of Marys Riverwater quality data retrieved from STORET files provided by DEQ.
Dent L, G Robison, K Mills, A Skaugset, and J Paul. 1998. Oregon Department ofForestry 1996 storm impacts monitoring project preliminary report. OregonDept. of Forestry, Philomath, OR.[This is a landslide inventory conducted afterthe big storms of the winter of 1996-1996. Landslide frequency was broken outby years since harvest.]
Dimick R, F Merryfield. 1945. The fishes of the Willamette River System in Relation topollution. Bulletin Series no. 20, June 1945. Engineering Experimental Station.Oregon State University, Corvallis, OR. [The first extensive sampling ofWillamette River fish over most of the mainstem.]
Dunnette D, editor. 1997. River Quality: dynamics and restoration. Edited by ALaenen. CRC Press, Inc. Lewis Publishers, Boca Raton, New York. [A

Ecosystems Northwest Marys River Preliminary Watershed Assessment 99
compilation of information on history and channelization of the Willamette Riverwith maps and bibliography.]
ECONorthwest. 1998. Buildable Land Inventory and Land Need Analysis forCorvallis. Prepared for the City of Corvallis by ECONorthwest, Eugene, OR.[This report analyzes the supply and demand of residential and industrial landwithin the Corvallis Urban Growth Boundary (UGB). It reports demographicand economic trends that influence supply and demand. It provides anestimate of the housing and land need within the Corvallis UGB by 2020. Italso forecasts commercial and industrial land need by sector, as well aspublic/institutional land need. It analyzes supply of vacant land, and adjusts forfactors that keep vacant land from being available. It focuses on long-runfactors, recognizing that in the short-run, other factors (such as unwillingsellers) may be important.]
Eilers J, K Vache. 1996. Water Quality Sampling of Muddy Creek Watershed, BentonCounty, Oregon. Final Report to the Cascade Pacific RC&D, Corvallis, OR.E&S Environmental Chemistry, Inc., Corvallis, OR. [Available at CascadePacific RC&D, 305 SW C ST. Suite 5, Corvallis, OR 97333-4400. This was alimited water quality sampling study in the Muddy Creek sub-watershed. Baseflow conditions were measured and grab samples were conducted during twolarge winter storms.]
Ellis-Sugai B. 1998. Lateral Channel Migration and Bank Erosion along the MarysRiver and Selected Tributaries. A report prepared for the Marys RiverWatershed Council. Siuslaw National Forest, Corvallis OR. [Historical study ofrecords of channel migration in Marys River, Marys River Watershed Councilcopy]
Ely C. 1981. Wild trout inventory, 1979. Information Report Series, Fisheries No. 81-6. Oregon Department of Fish and Wildlife, Portland, OR.
Fagan D. 1885. History of Benton County, Oregon; Including its Geology,topography, Soil and Productions. A. G. Walling, Printer, Portland, Oregon.[Covers Benton County history before 1893 Lincoln County separation. Goodinformation on families, settlement patterns, occupations. Excellent lithographsof Willamette Valley farms, early Lincoln County homesteads. Reproductionsof several important early documents.]
Farnell J. 1979. Marys River and Rickreall Creek Navigability Studies. Division ofState Lands. Salem, OR. [A very good compilation of historical river use onthe Marys River, available from the Division of State Lands, Salem, OR.]
Farnell J. Marys River and Rickreall Creek Navigability Study.Corvallis Public Library. # 386 Farnell. Oregon
Farrel D, W Larson. 1972. Dynamics of the soil-water system during a rainstorm. Soil

100 Marys River Preliminary Watershed Assessment Ecosystems Northwest
Sci. 119:242-249.
Ferguson B. 1994. Stormwater Infiltration. Lewis Publisher. Boca Raton. OSUVALLEY TD 657.5 F47. [Describes many opportunities for using infiltration inmanaging runoff and stormwater.]
Federal Register. 1998. Proposed Rules. Upper Willamette River ESU. Vol. 63, No.46. p. 1800. Tuesday, March 10, 1998. [Short description of what is knownregarding the distribution of native winter steelhead in the Upper Willamettebasin.]
Finger T. 1979. Patterns of interactive segregation in three species of sculpins(Cottus) in western Oregon. Thesis (Ph.D.), Oregon State University, Corvallis,OR. [Study of sculpins in Oak Creek. OSU library ]
Freemark K. 1996. Modeling risks to biodiversity in past, present and futurelandscapes. Biological diversity and computer simulation in the Muddy CreekWatershed, Oregon. Canadian Wildlife Service. Technical report series; no.268. Ottawa: Canadian Wildlife Service, Headquarters, Environment Canada,c1996. [Includes maps and bibliography, OSU library, QH 105.07 F741 1996]
Frissell, CA, WJ Liss, CE Warren, MD Hurley. 1986. A hierarchical framework forstream habitat classification: viewing streams in a watershed context,Environmental Management, 10:199-214. [Good paper, looks at streams atdifferent scales].
Froehlich H. 1984. The interaction of skyline logging and soil and water impacts. Pp.7-11, in Proceedings of the fourth Northwest Skyline Symposium.
Galay, V.J. 1983. Causes of river bed degradation. Water Resources Research,19:1057-1090. [Good paper on how human activities change river behavior]
Gannet M, D Woodward. 1997. Groundwater and Surface-Water Relations in theWillamette Valley Oregon. Pp. 131-139, in River Quality: Dynamics andRestoration. CRC Press Inc.
Gilsen L. 1989. Luckiamute Basin Survey. Oregon State Historic PreservationOffice, Salem, Oregon.
Glassman J, R Brown, and G Kling. 1980. Soil geomorphic relationships in thewestern margin of the Willamette Valley, Oregon. Soil Sci. Soc. Am. J.44:1045-1052.
Gonthier J. 1983. Groundwater Resources of the Dallas—Monmouth Area, PolkBenton, and Marion Counties, Oregon. Water Resources Department, State ofOregon, Groundwater Report No. 28.
Gordon, N D, TA McMahon, and BL Finlayson 1992, Stream Hydrology, An

Ecosystems Northwest Marys River Preliminary Watershed Assessment 101
Introduction for Ecologists, John Wiley & Sons, New York, New York, 526 p.[A good “how-to” book for people who aren’t hydrologists. Good explanations,diagrams, and practical advise on doing field work.]
Gray R, D Dauble. 1979. Biology of the sand roller in the central Columbia River.Trans. Amer. Fish. Soc. 108: 646-649.
Griffith S, T Thomson. 1996. N rate and timing relationships with tissue Nconcentration and seed yield in perennial ryegrass. Pp. 41-42 in, WC Young,Ed., 1996 Seed Production Research at Oregon State University USDA-ARSCooperating. Department of Crop and Soil Science Ext/CrS 110 4/97.
Griffith S, J Owen, W Horwath, P Winington, Jr, J Baham, L Elliot. 1997. Nitrogenmovement and water quality at a poorly drained agricultural and riparian site inthe Pacific Northwest. Soil Sci. Plant Nutr. 43:1025-1030.
Hansen H. 1977. Stock assessment and enhancement of fall salmon species in theWillamette River system. Federal Aid Progress Reports, Fisheries. OregonDepartment of Fish and Wildlife Portland, OR. [Not reviewed. Likely availableat the Clackamas ODFW , 503-657-2000].
Hansen H, R Williams. 1979. Stock assessment and enhancement of fall salmonspecies in the Willamette River system. Federal Aid Progress Reports,Fisheries. Oregon Department of Fish and Wildlife, Portland, OR. [Notreviewed. Likely available at the Clackamas ODFW , 503-657-2000].
Harrison H, C Anderson, F Rinella, T Gosser, T Progue, Jr. 1995, (rev. 1997).Analytical data from Phases I and II of the Willamette River Basin Water QualityStudy, Oregon 1992-1994. USGS Open-file Report 95-373. USGS, Portland,OR. [Includes pesticide, herbicide, volatile organic compounds, organochlorinecompounds, nutrients and trace element information for two water qualitymonitoring stations; collected during 1994; station 443045123273000 (RockCreek), and station 443321123155201 (Marys River).]
Harward M, G Kling, and J Istok. 1980. Erosion, Sediments and Water Quality in theHigh Winter Rainfall Zone of the Northwestern United States. OregonAgricultural Experiment Station Report no 602. [This is a detailed multi-partstudy of sediment, nutrients and pesticides in runoff from cropland. This isknown as the Elkins Road Watershed Studies—small agricultural watershedstudies. Data is given for nutrient and pesticide losses in runoff. Includes theSilverton Hills Erosion Study in Marion County.]
Hinkle S. 1997. Quality of shallow groundwater in alluvial aquifers of WillametteBasin, Oregon, 1993-1995. U.S.G.S. Water Resources Investigations Report97-4082-B. OSU VALLEY.
Hooten B, S Jacobs et al. 1995. Biannual Report on the status of wild fish in Oregon.Oregon Department of Fish and Wildlife, Clackamas, OR.

102 Marys River Preliminary Watershed Assessment Ecosystems Northwest
[ Contains information on over 40 native fish species.]
Hooten, B. 1997. The status of coastal cutthroat trout in Oregon. Pages 57-67 in JDHall, PA Bisson, and RE Greswell, eds. Sea-Run Cutthroat Trout: Biology,Management, and Future Conservation. Oregon Chapter, American FisheriesSociety, Corvallis, OR. [Review of the literature and unpublished data on thecoastal cutthroat trout in Oregon]
Horneck, D and J Hart. 1988. A survey of nutrient uptake and soil test values inperennial ryegrass and turf type tall fescue fields in the Willamette Valley. InSeed Production Research. Ed. W. Young, III. Pp. 13-14, Oregon StateUniversity Extension and USDA-ARS, Corvallis.
Horwath W, L Elliot, J Steiner, J Davis, and S Griffith. 1998. Denitrification incultivated and noncultivated riparian areas of grass cropping systems. J.Environ Qual. 27:225-231.
Huddleston J. 1993. Land use in relation to geomorphic surfaces and soils in theWillamette Valley, Oregon. Pp. 140-047 in, JM Kimble ed., Proceedings of theEighth International Soil Management Workshop. Oregon, California andNevada. July 11-24,1992. [This is a very good discussion that relatesgeomorphology, soils and land use in the Willamette Valley. This paper alsodiscusses land use impacts on water quality. Herb Huddleston is a pedologyprofessor at OSU.]
Hulse D, L Goorjian, D Richey, M Flaxman, C Hummon, D White, K Freemark, JEilers, J Bernert, K Vache, J Kaytes, D Diethelm. 1997. Possible Futures forthe Muddy Creek Watershed, Benton County, Oregon. University of Oregon,Eugene, OR. [This study is a “prototype” for a larger study of the WillametteRiver Basin. The Muddy Creek Watershed was chosen because it hadcharacteristics similar to other critical areas of the Willamette River Basin, suchas being close to an urban area experiencing rapid growth. Backgroundcharacteristics of the watershed are described (history, demographics, etc.),and key indicators are chosen for analysis. The researchers focused onbiodiversity of species, and water quality. Responses of these indicators toalternative growth scenarios were analyzed. Scenarios were based onextensive public input from residents of the watershed, and ranged from highgrowth to high conservation. Analysis showed that the current trend in growthwould lead to a decline of both biodiversity and water quality by 2020. Thisreport also contained a reference to the Willamette Basin Planning Atlas, byPNW-ERC, which depicts some of the critical natural and cultural factorsinfluencing land and water use decisions. Information is provided on naturallandforms, human populations, and human alterations of the landscape, bothcurrent conditions and historical changes since about 1850. Version 1.0 of theAtlas was published in 1998. Copies may be purchased at cost ($125 + $5shipping and handling) from the University of Oregon. Contact DorothyBollman at (541)346-0675.]

Ecosystems Northwest Marys River Preliminary Watershed Assessment 103
Hulse D, A Branscomb, J Duclos, S Gregory, S Payne, D Richey, H Dearborn, DDiethelm, L Ashkenas, P Minear, J Christy, E. Alverson, M Richmond. 1998.Willamette River Basin, A Planning Atlas, Ver. 1.0. Pacific NorthwestEcosystem Research Consortium. The Institute for a Sustainable Environment,University of Oregon, Eugene, OR. [The first in a series of planning guidesdeveloped for the Willamette River Basin, this atlas explores the history andphysical characteristics of the valley. It also contains excellent GIS images.Reviews historic landscape attributes and explores trends in the presenthuman-impacted landscape.]
Istock, J and B Lowery. 1980. Gross Erosion. Erosion, Sediment and Water Qualityin the High Winter Rainfall Report. Special Report 690. Agricultural ExperimentStation, Oregon State University, Corvallis. [OSU VALLEY S105 E55. 690.]
Istock J and M Harward. 1980. Erosion in the Silverton Hills Area, Marion County.Erosion, Sediment and Water Quality in the High Winter Rainfall Report.Special Report 690. Agricultural Experiment Station, Oregon State University,Corvallis. [OSU VALLEY S105 E55. 690.]
Istok J and M Harward. 1982. Clay mineralogy in relation to landscape instability inthe Coast Range of Oregon. Soil Sci. Soc. Am. J. 46:1326-1331. [The types oflandslides and mass erosion events are associated with the mineralogy of soils.The clay fraction of debris avalanches is dominated by nonexpanding layer-silicates that have large particle sizes and small water holding capacities. Theclay fraction of samples from sites undergoing failure by creep and slumpconsisted mainly of smectite, expanding clay.]
Istok J, B Brown, L Boersma, R Katz, and A Murphy. 1984. Statistical analysis ofclimatological data to characterize erosion potential: 5. Joint precipitation andfreezing events in western Oregon. Special Report 690. Agricultural ExperimentStation, Oregon State University, Corvallis. OSU VALLEY S105 E55. 690.
Jackson, R. 1980. McDonald-Dunn Forests: Human Use and Occupation.Submitted to John Beuter, Director of School Forests, Oregon State University,Corvallis, OR. [This is a very detailed accounting of the history of McDonald-Dunn Forest, part of which is within the Marys River Watershed. It includes acultural overview of the McDonald-Dunn Forest that relates the record ofhuman activities, in a prehistoric and historic context, to the broader fabric oflocal, regional, and national history. It includes accounts of native peoples ofthe area with special emphasis on aboriginal land use. It has an inventory ofcultural sites, and traces the major patterns of land ownership and use.]
Jenkins J, L Yu, J Huddleston, and M Melbye. 1994. Herbicide movement in runofffrom grass seed fields in the Peckenpaugh Creek Drainage Basin, Linn County,Oregon, a pilot study. Oregon State University, Corvallis.
Johannessen C, W Davenport, A Millet, S McWilliams. 1971. The vegetation of theWillamette Valley. Ann. Assoc. Amer. Geog. 61: 286-302.

104 Marys River Preliminary Watershed Assessment Ecosystems Northwest
Johnson M and R Betscha. 1980. Logging, infiltration capacity and surface erodibilityin Western Oregon. Journal of Forestry. 78:334-337.
Jones K. 1993, ongoing. Aquatic Inventories Project, Physical Habitat Surveys, FishSurveys. Rickreall and Marys River Basins. ODF&W Aquatic InventoryProject, Oregon Department of Fish and Wildlife, Research Division, Corvallis,OR.[Copies of computer-generated data summaries of stream surveys in the MarysRiver basin. Contained in a 3-ring binder. Available for limited review from K.Jones 541-757-4263, ext 260].
Kauffman J, R Beschta, N Otting, and D Lytjen. 1997. An Ecological Perspective ofRiparian and Stream Restoration in the Western United States. Fisheries22(5):12-24.
Ketcheson G and H Froehlich. 1978. Hydrologic factors and environmental impactsof mass soil movements in the Oregon Coast Range. Water ResourcesResearch Institute. Report number 56. Oregon State University. Corvallis,Oregon.
Knezevich C. 1975. Soil Survey of Benton County, Oregon. Soil ConservationService, United States Department of Agriculture. [Soil maps, soil descriptionsand soil interpretations.]
Laenen, A. (ed.) 1997. The Pacific Northwest Floods of February 6-11, 1996.Proceedings of the Pacific Northwest Water Issues Conference, Portland,Oregon, October 7-8, 1996, American Institute of Hydrology, 318 p.[Compilation of papers presented at a conference on the flood of 1996. Goodinformation on climatic events that triggered the flood, and the effects of theflood on urban, rural and forested areas. Information about this publication canbe obtained at: AIH, 2499 Rice St., Ste. 135, St. Paul, MN 55113-3724, phone(612) 484-8169, fax (612) 484-8357, e-mail [email protected].]
Leopold, L. 1994. A View of the River. Harvard University Press, CambridgeMassachusetts, 298 p. [Good technical information, and a good review of thecurrent knowledge of rivers. Highly recommended. Can be ordered fromuniversity bookstores. Costs approximately $40.]
Leopold, L. 1997. Water, Rivers and Creeks. University Science Books, 55D GateFive Road, Sausalito, California 94965 Fax: (415) 332-5393, 185 p. [Excellentnon-technical book that has information on river hydrology, channel formationand maintenance, riparian zones, and water resources and management.Highly recommended. Intended for those who do not have a specializedbackground in rivers and hydrology. Costs approximately $30.]
Li H, C Schreck, R Tubb, K Rodnick, M Alhgren, A Crook. 1983. The Impact ofSmall-Scale Dams on Fishes of the Willamette River, Oregon and an

Ecosystems Northwest Marys River Preliminary Watershed Assessment 105
Evaluation of Fish Habitat Models. Cooperating authors include OregonCooperative Fishery Research Unit, Oregon State University, Dept. of Fisheriesand Wildlife, Oregon State University, Water Resources Research Institute,United States Bureau of Reclamation, Water Resources Research Institute,WRRI, 0163-9765; -91. WRRI (Series); 91. Oregon State University, CorvallisOR. [A study of fish distributions around impoundments in Rock Creek]
Long C, C Whitlock, P Bartlein, and S Millspaugh. 1998. A 9000-year fire history fromthe Oregon Coast Range, based on a high-resolution charcoal study.Canadian J. of Forest Research. 28:774-787.
Lowery B, M Pronold, J Vomocil. 1980. Relative changes in infiltration. Special Report690. Agricultural Experiment Station, Oregon State University, Corvallis. OSUVALLEY S105 E55. 690
Lotspeich, FB, WS Platts. 1982. An integrated land-aquatic classification system.North American Journal of Fisheries Management. 2:138-149. [Looks at howother variables, such as climate, underlying geology, soils and vegetationinfluence rivers.]
Lowery B, G Kling, and J Vomocil. 1982. Overland flow from sloping land: effects ofperched water tables and subsurface drains. Soil Sci. Soc. Am. J. 46:93-99.
MacDonald, L.H., Smart, A.W. and Wissmar, R.C., 1991, Monitoring Guidelines toEvaluate Effects of Forestry Activities on Streams in the Pacific Northwest andAlaska, Environmental Protection Agency publication EPA/901/9-90-001, 166p. [Good information on the principles and methods of monitoring, andparameters that can/should be monitored.]
Marion County SWCD. 1982. Mid-Willamette Valley foothills erosion study. FinalReport. OSU VALLEY S 624.07 M521.
Markle D, T Pearsons, D Bills. 1989. Taxonomic status and distributional survey ofthe Oregon chub: Corvallis, Oregon State University, Department of Fisheriesand Wildlife, unpublished final report submitted to ODFW, 29 p.
Markle D, T Pearsons, D Bills. 1991. Natural history of Oregonichthys (Pices:Cyprinidae) with a description of a new species from the Umpqua River ofOregon: Copeia 1991, v. 2, p. 277-293. [Relates to the Oregon Chub(Oregonichthys crameri).]
Marys River Basin, Willamette River and Tributaries, Oregon, Review Study. 1971.Transcript of Public Hearing Held at Corvallis, OR, 2 June, 1971. US ArmyEngineer District, Corps of Engineers, Portland, OR. [OSU library TC425.M2A5]

106 Marys River Preliminary Watershed Assessment Ecosystems Northwest
Matin H. 1995. Incipient motion and particle transport in gravel-bed streams. Thesis(Ph.D. -Civil Engineering), Oregon State University, Corvallis, OR. [Notreviewed. This study was executed in Oak Creek]
May C, E Welch, R Horner, J Karr, B Mar. 1997. Quality Indices for UrbanizationEffects in Puget Sound Lowland Streams. Water Resources Series TechnicalReport No. 154. Department of Civil Engineering, University of Washington,Seattle, WA.
McArthur L. 1982. Oregon Geographic Names, fifth edition. Western Imprints, ThePress of the Oregon Historical Society, Portland OR.
McCall, K. 1999. Personal Communication. Recreation Planner, USDA ForestService, Siuslaw National Forest.
Miller D, S Vickerman. 1997. Recommendations to Governor John Kitzhaber.Willamette River Basin Task Force. Salem, OR.
Minor and Toepel 1991. [This was contracted by the Country Fair people in Veneta.The report should be readily available (my copy must have gotten wet and isstill missing) through OSU or UO. Minor and Toeppel have done a number ofreports for BLM (Yaquina Head) and are based in Eugene--may be affiliatedwith UO.]
Minore D. 1972. The Wild Huckleberies of Oregon and Washington--ADwindling Resource. USDA Forest Research Paper - 143. Pacific NorthwestForest and Range Experiment Station, Portland, OR: 14 pp.
Moore K, K Jones, and J Dambacher. 1997. Methods for stream habitat surveys.Information Report 97-4. Portland, OR. [Stream surveying protocols used bythe ODFW and BLM for aquatic habitat surveys. Information Reports areavailable from the ODFW Clackamas Office through Gloria Bourne 541-657-2000]
Montgomery, DR, JM Buffington 1993. Channel classification, prediction of channelresponse, and assessment of channel condition. Report TFW-SH10-93-002,prepared for the SHAMW committee of the Washington StateTimber/Fish/Wildlife Agreement, 84 p. [Excellent paper, lots of examples.]
Moring J, R Youker, R Hooton. Undated. Movement patterns of potadromouscutthroat trout of the Willamette Valley, Oregon. Oregon Department of Fishand Wildlife, Research Division, Corvallis, OR.
Nakamura, F. and F. Swanson. 1993. Effects of coarse woody debris on morphologyand sediment storage of a mountain stream system in western Oregon. EarthSurface Processes and Landforms 18:43-61.

Ecosystems Northwest Marys River Preliminary Watershed Assessment 107
Nicholas J. 1978. A review of literature and unpublished information on cutthroattrout (Salmo clarki clarki) of the Willamette watershed. Information ReportSeries, Fisheries No. 78-1. Oregon Department of Fish and Wildlife, Portland,OR.
NonPoint Solutions. 1997. Oregon Watershed Assessment Manual—Draft, October.[This manual has recently been updated in 1999, but was not reviewed in timeto include here.]
NRCS. [ date?] Stream Corridor Restoration. [This is the new Natural ResourcesConservation Service restoration manual. It’s approximately 900 pages long,and is divided into 3 parts and 9 chapters. Part 1 covers backgroundinformation about rivers, floodplains, and geomorphology. Part 2 is called“Developing a Stream Corridor Restoration Plan”, and Part 3 is called “ApplyingRestoration Principles”. It covers numerous techniques and case histories ofrestoration. It is available on the internet at www. usda.gov/stream_restoration.It can be downloaded off the internet, or it can be ordered in a hard copy formatwith color photos and diagrams. It is also available on a CD. Hard copies canbe ordered from the National Technical Information Service at 1-800-533-NTISor from their website at ww.ntis.gov/yellowbk/Inty821.htm. All of thisinformation is available at the www.usda.gov/stream_restoration website.]
Nunnally, NR. 1985. Application of fluvial relationships to planning and design ofchannel modifications. Environmental Management 9:417-426 [Rathermathematical].
Oman J. 1994. Geologic groups (lithology and age). GIS Layer – grouping of P-types in Oregon Geology map, Arc Info coverage obtained from CorvallisForestry Sciences Laboratory.
Oregon Administrative Rules. Chapter 340. Division 41. March, 1998. Statewide waterquality management plan; beneficial uses, policies, standards and treatmentcriteria for Oregon. Oregon Secretary of State. Oregon.
Oregon Department of Forestry. 1998. Timber Harvest Report. Oregon Departmentof Forestry, Salem, OR. [Separate reports are available for eastern andwestern Oregon. Harvest statistics are reported by county and by landowner.]
Oregon Department of Forestry-Forest Practices. 1994. Water Classification andProtection Rules Landowner/Operator Reference Guide. [An excellentreference for forest practices This voluminous book has sections on waterclassification and riparian management areas; vegetation retention alongstreams, lakes and wetlands; roads and streams; stream crossing structures;harvesting practices; stream alterations, beaver dams and amphibians;chemicals, prescribed burning, and site preparation; and petroleum productsprecautions.]

108 Marys River Preliminary Watershed Assessment Ecosystems Northwest
Oregon Employment Department. Various years. Oregon Covered Employment andPayrolls, by Industry and County. State of Oregon, Employment Department,Research, Tax, and Analysis, Salem, OR.
Oregon Employment Department. Various years. Oregon Covered Employment andPayrolls, by Industry and County. State of Oregon, Employment Department,Research, Tax, and Analysis, Salem, OR. [These figures are based on reportsfor unemployment insurance that every firm in Oregon with at least oneemployee must file. Therefore, they do not cover sole proprietorships, or whatare sometimes called “mom and pop” operations. For this reason, they are notalways a good representation of employment in agriculture, or other industrieswith many small operations. However, for manufacturing, such as lumber andwood processing, the numbers are very accurate. Figures are available at the2-digit Standard Industrial Classification (SIC) code level for the state and eachcounty.]
OSU Extension Service. Various years. Oregon County and State AgriculturalEstimates. Special Report 790. Economic Information Office, Agricultural andResource Economics, Oregon State University, Corvallis, OR. [Due to the lackof good secondary data on agricultural output, the OSU Extension Serviceprovides estimates on sales and harvested acreage of crops and livestock foreach county in the state. These figures include “farm forestry sales”(harvesting timber from agricultural lands), and so would be double countingsome of the harvests reported by the Department of Forestry.]
OSU Extension Service. Various years. Oregon County and State AgriculturalEstimates. Special Report 790. Economic Information Office, Agricultural andResource Economics, Oregon State University, Corvallis, OR.
OSU. 1996. Issues and considerations Ballot Measure 38, Prohibit livestock fromcertain polluted waters. Special Report 966. [This information circular wasintended to present issues around a past ballot measure that was defeated. Itdoes not provide much useful information that applies to livestock issues in thewatershed.]
Pacific Rivers Council. 1996. A Guide to the Restoration of Watersheds and NativeFish in the West. 2nd edition. Pacific Rivers Council, Eugene, OR.
[Palmer 1845] Palmer, J. 1983. Journal of Travels over the Rocky Mountains. YeGalleon Press. Fairfield, WA: 186 pp.
Parsons M, J Istock, and R Brown. 1980. Storm runoff and sediment transport. Pp.74-76, in Erosion, Sediment and Water Quality in the High Winter Rainfall Zoneof the Northwestern United States. Special Report 602. Agricultural ExperimentStation, Oregon State University, Corvallis. OSU VALLEY S105 E55. 602.
Patching W. 1987. Soil Survey of Lane County Area, Oregon. USDA-NaturalResources Conservation Service and Forest Service. [Soil maps, soil

Ecosystems Northwest Marys River Preliminary Watershed Assessment 109
descriptions and soil interpretations.]
Phinney. 1942. [Cite not available. R. Zybach should be contacted the source.Phinney did a lot of historical work during the 1930s in the Willamette Valley.Lots of unpublished interviews, ms. etc.]
Ralph, SC, GC Poole, LL Conquest, RJ Naiman. 1994. Stream channel morphologyand woody debris in logged and unlogged basins of western Washington.Canadian Journal Fisheries and Aquatic Science 51:37-51.
Rinella F and M Janet. 1995. Seasonal and Spatial Variability of Nutrients andPesticides in Streams of the Willamette Basin, Oregon, 1993-95. U.S.Department of the Interior and U.S. Geological Survey. Water ResourcesInvestigations Report 97-4082-C. Portland, Oregon. 54 p. [OSU Valley LibraryTD 223.A343 no 97-4082-c. Nutrient and pesticides in surface waters.Sampling was conducted in six watersheds adjacent to Marys River Watershed.It included mainly sites in the Willamette Basin, high and low flows, urban,forested, agriculture and mixed land uses. Pesticide use data is provided.]
Reckendorf F and R Parsons. 1966. Soil Development Over a Hearth In WillametteValley, Oregon," IN: Northwest Science, Vol. 40: 46-55.
Reckendorf F. 1993. Geomorphology, stratigraphy, and soil interpretations,Willamette Valley, Oregon. Pp. 178-199 in, JM Kimble ed., Proceedings of theEighth International Soil Management Workshop. Oregon, California andNevada. July 11-24,1992
Reed T. 1996. Drift, wood, and grazing cattle: macroinvertebrates in managedstreams. Theses (M.S. -Entomology), Oregon State University, Corvallis, OR.[Not reviewed. This study was executed in Oak Creek.]
Reeves, G, J Hall, and S Gregory. 1997. The impact of land management activitieson coastal cutthroat trout and their freshwater habitats. Pages 138-144 in JDHall, PA Bisson, and RE Greswell, eds. Sea-Run Cutthroat Trout: Biology,Management, and Future Conservation. Oregon Chapter, American FisheriesSociety, Corvallis, OR.
Robison E, J Runyon, C Andrus. 1995. Oregon Department of Forestry CooperativeStream Temperature Monitoring: Project Completion Report for 1994-1995.Prepared for Oregon Department of Environmental Quality. DEQ Contract 003-95. [Limited temperature monitoring of streams flowing through clearcuts.]
Rodnick K. 1983. Seasonal distribution and habitat selection by the redside shiner,Richardsonius balteatus, in a small Oregon stream. MS Thesis, Oregon StateUniversity, Corvallis, OR. [Data collected in Greasy Creek. OSU library LD4330 1983 R6].

110 Marys River Preliminary Watershed Assessment Ecosystems Northwest
Rosgen, D. 1994. A classification of natural rivers. Catena. 22:69-199 [Looks atrivers in different settings, and predicts response. This classification systemhas been adopted by the Forest Service]
Rosgen, D. 1996. Applied River Morphology. Wildland Hydrology, 1481 StevensLake Road, Pagosa Springs, Colorado [This book is a compilation of Rosgen’slife work on stream classification and restoration. $90. Good guidelines forstream restoration.]
Scheerer P, T Cornwell, K Jones. 1998. Oregon Chub Investigations. AnnualProgress Report / Fish Research Project Oregon, Oregon Dept. of Fish andWildlife, Portland, OR.
Schuytema G, A Nebeker. 1998. Comparative toxicity of diuron on survival andgrowth of pacific treefrog, bullfrog, red-legged frog, and African clawed frogembryos and tadpoles. Arch. Environ. Contam. Toxicol. 34:370-376.
Scott L. 1923. John Work’s Journey from Fort Vancouver to Umpqua River, andReturn, in 1834. Oregon Historical Society Quarterly. Vol. 24, No. 3: 238-268.
Seddell J, Froggatt J. 1984. Importance of streamside forests to large rivers: theisolation of the Willamette River, Oregon, U.S.A., from its floodplain bysnagging and streamside forest removal. Verh. Internat. Verein. Limnol. 22:1828-1834.
Seddell J, K Luchessa. 1981. Using the historical record as an aid to salmonidhabitat enhancement. USFS, Forestry Sciences Laboratory, Corvallis, OR.
Simmons F. 1981. Sediment, phosphorus and nitrogen in storm runoff from someWillamette Valley croplands. M.S. Thesis. OSU VALLEY LD 4330 1981 S57.
Shih S. 1990. Hydraulic control of grain size distributions and differential transportrates of bedload gravels Oak Creek, Oregon. Thesis (M.S. -Oceanography),Oregon State University, Corvallis, OR.
Shipman J. 1997. Soil Survey of Lincoln County Area, Oregon. USDA-NaturalResources Conservation Service and Forest Service. [Soil maps, soildescriptions and soil interpretations.]
Simmons F. 1981. Sediment, phosphorus and nitrogen in storm runoff from someWillamette Valley croplands. M.S. Thesis. OSU VALLEY LD 4330 1981 S57.
Solazzi M, S Johnson. 1993. Development and evaluation of techniques torehabilitate Oregon’s wild coho salmon. Oregon Department of Fish andWildlife, Fish Research Project F-125-R, Annual Progress Report, Portland,OR.

Ecosystems Northwest Marys River Preliminary Watershed Assessment 111
Stark N, K Kennedy, P Brown, E Taylor, D Sartain, J Hoyt. 1998. Memories of Wren,Oregon. Wren Historical Society, Wren, OR. [Includes photo of largesalmonids caught in 1920’s Marys River.]
Stark P. 1995. Index to geologic maps of Oregon by U.S. Geological SurveyTopographic Quadrangle Name 1883-1994. Open File Report 0-95-4. OSUVALLEY, Corvallis, OR.
Stark P. 1995. Index to geologic maps of Oregon by U.S. Geological SurveyTopographic Quadrangle Name 1883-1994. Open File Report 0-95-4. OSUVALLEY, Corvallis, OR.
State Soil and Water Conservation Council. 1971. Streambank erosion inOregon. A report to the Fifty-seventh Legislative Assembly.
Stednick, J.D. 1991. Wildland Water Quality Sampling and Analysis. Academic Press.New York. 217p.
Sternadel D. 1999. Unpublished data collected by Dan Sternadel and others in thevicinity of Wren, Oregon.
Storm R. 1941. Effect of the white man’s settlement on wild animals in the MarysRiver Valley. MS Thesis, Oregon State College, Corvallis, OR. [Review ofhistorical journal and narratives of historical wildlife abundance in the CorvallisArea, OSU Library LD4330 1941 84 cop. 2]
Storm R. 1948. The herpetology of Benton County, Oregon. Ph.D. Thesis. OregonState University, Corvallis, OR.
Surfleet C. 1997. Precipitation characteristics for landslide hazard assessment for theCentral Oregon Coast Range. M.S. Thesis. Oregon State University, Corvallis,OR.
Swanson F, M Swanson, C Woods. 1977. Inventory of mass erosion in the MapletonRanger District, Siuslaw National Forest. Final Report, Forest SciencesLaboratory, Corvallis, Oregon.
Taskey R, 1978. Relationships of clay mineralogy to landscape stability in WesternOregon. Ph.D. Dissertation, Oregon State University, Corvallis, OR.[Recommended by draft 1 reviewer but not reviewed here. See also Istok andHarward, 1982.]
Taylor G, and A Bartlett. 1993. The climate of Oregon, climate zone 2, WillametteValley. Special Report 914. Agricultural Experiment Station, Oregon StateUniversity.
Tetra Tech Inc. 1993. Willamette River Basin Water Quality Study. Component 8:Willamette River Basin Nonpoint Source Pollution Component Report. TC8983-

112 Marys River Preliminary Watershed Assessment Ecosystems Northwest
08. Final Report. Tetra Tech, Inc. 15400 NE 90th , Suite 100 Redmond,Washington 98052-3521. [Submitted to ODEQ.]
Tetra Tech Inc. 1995. Willamette River Basin Water Quality Study. A Summary ofRecent Scientific Reports on the Willamette River. Tetra Tech, Inc. 15400 NE90th , Suite 100 Redmond, Washington 98052-3521. [Submitted to ODEQ.DEQ Contract No. 97-094. parameters; biological responses to stressors, pointsources, non-point sources, and ecological systems investigations.]
Torbitt H, G Sternes. 1956. Weather summary, p 2, 13, in Climatological Data,Oregon, January, 62(1). U.S. Department of Commerce, Weather Bureau,Asheville, N.C.
Trask S. 1995. Stream survey of Rock Creek Basin, Marys River Watershed.Contracted by Siuslaw National Forest, Corvallis, OR. [This stream survey wasperformed using Forest Service Level II protocol, by Bio-Surveys of Alsea,OR.]
Trimble Jr, G, R Sartz. 1957. How far from a stream should a logging road belocated? Journal of Forestry. 55:339-341.
USDA-SCS. 1949. Report on survey of erosion damage in Willamette Valley, Oregon.Prepared by Pacific Coast Region.
USDA-SCS. 1982. Soil Survey of Polk County.
US Fish and Wildlife Service. 1998. Oregon Chub (Oregonichthys crameri) RecoveryPlan. Portland, Oregon. 69+ pp. [The most current documentation of knownOregon chub populations and a proposal describing plans for their monitoringand recovery.]
US Geological Survey. 1974. Groundwater in the Corvallis, Albany Area, CentralWillamette Valley, Oregon. USGS Water Supply Paper 2032. U.S.Government Printing Office, Washington D.C.
Vaughn W. c.1890. Early Settlement of Tillamook County. [Unpublished journalentries and memoirs typewritten in 1923, availablethrough the Tillamook Historical Society, Tillamook, Oregon: 83 pp..]
Wevers M, D Nemeth, J Haxton, S Mamoyac. 1992. Coast Range Subbasin FishManagement Plan. Oregon Department of Fish and Wildlife, NorthwestRegion, Corvallis, OR.
Wilkes C. 1845. Narrative of the United States Exploring Expedition During the Years1838, 1839, 1840, 1841, 1842. (Vol. V). Lea & Blanchard, Philadelphia,Pennsylvania.

Ecosystems Northwest Marys River Preliminary Watershed Assessment 113
Willamette Valley Project. 1936. Willamette Valley Project: A regional Plan. OregonState Planning Board, Salem, Oregon.
Wing M. 1998. Using a Geographical Information System to Monitor RecreationImpacts in a Forested Setting. Ph.D. Dissertation, Forest Resources, OregonState University, Corvallis, OR. [Based on a survey of recreationists inMcDonald Forest, annual use estimates are made for different access points.Use is also spatially recorded in a GIS, and recreation routes within the forestcan be queried to show the number and type of recreationists that used eachroute. The Oak Creek area is within the Marys River Watershed, and thisdatabase shows the number of people using this area during each season.Examples are given to show how the system can be used to avoid recreationconflicts, and to minimize the impact of clearcutting on recreationists.]
Willams R. 1983a. Coho salmon in the upper Willamette River, Oregon. A history ofestablishing a run of non-indigenous salmon and prospects for renewed effortsto increase the run. (Draft). Oregon Department of Fish and Wildlife.
Williams R. 1983b. Releases of coho salmon into the upper Willamette River,Oregon. Oregon Department of Fish and Wildlife. Internal Report 833.
Williams K, R Sherer, V Villanueva, A Buckley, J Castro, P Jodice. 1994. Oak CreekWatershed Assessment, OSU Forest Engineering Department, Class Reportfor R. Beschta’s watershed analysis course. [This watershed analysis is one oftwo completed for Oak Creek by this class. It covers mass wasting and surfaceerosion, hillslope surface erosion, hydrology, riparian function, stream channel,fish habitat and water quality. Analysis includes culvert survey and other fieldsurvey data.]
Wydowski R. R Whitney. 1979. Inland Fishes of Washington. University ofWashington Press, Seattle and London. [Life history, description and range forColumbia River system fish]
Young J, G Spycher, J King, C Choquette, and F Simmons. 1980. Surface erodednon-point source pollutants entering selected Upper Willamette River tributariesfrom agricultural lands. Completion Report for Project W-57. Water ResourcesResearch Institute, Oregon State University, Corvallis. OSU VALLEY TD 201075 no.69 Yamaguchi K. 1992. Historical land use and its impact on OakCreek, Oregon. Thesis (M.S.). OSU library call # LD4330 1993 .Y35, OSU,Corvallis, OR.
Young III, W, M Mellbye, G Gingrich, S Griffith, T Chastain, and J Hart. 1999. Definingoptimum nitrogen fertilization practices for perennial ryegrass and tall fescueseed production systems in the Willamette Valley. 1998 Final Report.
Zenk H. 1990. Kalapuyans. In: Suttles, Wayne, ed. Handbook of North AmericanIndians, Vol. 7. Smithsonian Institute, Washington, D.C. [Describes the

114 Marys River Preliminary Watershed Assessment Ecosystems Northwest
language, territory, environment, culture, and history of the Kalapuyans, whoseterritory included the Marys River Watershed.]
Zirges M. 1973. Morphological and meristic characteristics of ten populations ofblackside dace, Rhinichthys osculus nubilus (Girard), from western Oregon.Thesis, Oregon State University, Corvallis OR. [Some Marys River coverage,available at the OSU library LD4330 1973 Z5 cop.2]
Zybach R and G Wisner. 1994. Neal Vanderburg. Family Farming and Saw Millingon Berry Creek, Benton County, Oregon: 1935-1941. [Soap Creek History.]
Carto-bibliography
The following list of select maps has been arranged in chronological order. Thesemaps were selected on the basis of providing useful information for the Mary RiverWatershed, and being generally available for research and resource managementpurposes.
Most entries include the following information: date; map title; names of compilers,draftsmen, originating agencies and publishers, if any; scale; dimensions to thenearest inch; brief description of contents; maplocation(s); and file numbers. A "manuscript" map is defined as one made of hand-applied pencil, ink, watercolor or similar medium, usually on cloth or paper."Blueprints," "photoprocessed," and "published" maps are identified as such, todistinguish between various levels of photographically reproduced records. An"annotated" map is a published, photoprocessed or blueprint map that containsadditional information added by hand.
1851. Drawing of the Willamette Valley. Gibbs, George and Edward A. Starling.Prepared for the Board of Commissioners appointed to form treaties with theIndians of Oregon. Valley Library, Map Room, Oregon State University,Corvallis, OR. 1 sheet.
1852. Township No. 11 South, Range No. 5 West of the Willamette Meridian, Oregon.Contracts with George Hyde dated March 25 and May 27, 1852. Map basedupon General Land Office survey contracts No. 14 and No. 19 for the SurveyorGeneral's Office, Portland, Oregon. 1 inch to 1/2 mile. 15 X 19.
Representative GLO black and white photoprocessed map showing legal surveysubdivisions, rivers, creeks, homes, landowners, roads, trails, swamps, prairies,landslides, buttes, divides, and timber. This map covers the southern portion ofMarys River, but original land survey maps and notes exist for the entire MarysRiver drainage. Accompanied by detailed survey notes. Both maps and notesare available through the Portland BLM office and Benton County Surveyor'sOffice.

Ecosystems Northwest Marys River Preliminary Watershed Assessment 115
1900. Map of the State of Oregon Showing the Classification of Lands and Forests.Drafted by Gilbert Thompson from information provided by A.J. Johnson.Professional Paper No. 4, United States Geological Survey. GovernmentPrinting Office, Washington, D.C. 1 inch to 10 miles. 30 x 37.
Published color map showing pre-1902 forest fire patterns, classified timberlands,transportation routes, cities, towns, and surveyed section lines. Accompaniedby text, tables and photographs in Gannett (1902). Valley Library, Map Room,Oregon State University, Corvallis, OR.
1914. Map of the State of Oregon. Compiled by Theodore Rowland under thedirection of F.A. Elliott. Copyright by F.A. Elliott. Published by the OregonState Board of Forestry, Salem. 1 inch to 6 miles. 54 x 74.
Photoprocessed vegetation type map showing pre-World War I logging boundaries,reforested burns, commercial timberlands, transportation routes,communication lines, cities, towns, and surveyed section lines. Valley Library,Map Room, Oregon State University, Corvallis, OR. Available through OregonWater Resources Department as GIS layers.
1915 Timber Cruise of Benton County, Oregon 1914-1915. Benton CountyCourthouse.
1922. Timber Type Map, Lincoln County. Pearson, Grady & Co. Produced for S.P. &S. Railway.
Hand-colored map with tabular summaries; part of a series completed for westernOregon counties. This map was located in the Oregon Historical Society mapcollection in Portland, where it was photographed in 1991 with color slide filmfor COPE files. The author (Zybach) has a copy of these slides.
1929. Metsker. Benton County, Oregon Landowners. Valley Library, Map Room,Oregon State University, Corvallis, OR.
1936. Forest Type Map, State of Oregon, Northwest Quarter. Compiled by the ForestSurvey Staff under the direction of H.J. Andrews, assisted by Cowlin. LambertProjection published by the USDA Pacific Northwest Forest Experiment Station,Portland, OR. 1 inch to 4 miles. 46 x 62.
1938. Metsker. Benton County, Oregon Landowners. OSU Valley Library MapRoom.
1991. Walker GW, and NS MacLeod. The geologic map of Oregon. U.S. Departmentof Interior, U.S. Geological Survey. [This is a wall map with an extensivebibliography. OSU VALLEY [G 4291 C5 1991.W3] and for sale at OSUbookstore.]

116 Marys River Preliminary Watershed Assessment Ecosystems Northwest
1998. Benton County Surveyor. Benton County, Oregon Geographic InformationSystems (GIS) Layers of County Land Subdivision Surveys, 1853-1998.Available in CD-ROM format with ARC-Info software.
1999 Benton County Tax Assessor. 1999. Cadastral Survey Maps and Records,1846-1999.
Internet sites
Groundwater information:
GRID-onlinehttp://www.wrd.state.or.us
Precipitation:
Oregon climate servicehttp://www.ocs.orst.edu/allzone/allzone2.html
Surface water information:
USGS stream discharge datahttp://waterdata.usgs.gov/nwis-w/OR/
US Army Corps of Engineers stream discharge datahttp://nwp71.nwp.usace.army.mil/graphics/willamette/willtrib/willtrib.html
Oregon Department of Environmental Quality water quality informationhttp://waterquality.deq.state.or.us/wq/
Water rights:
http://www.wrd.state.or.us
WRIS database. [user needs telnet helper software. Water rights maps, attachedreports, surface water diversion data available.]
Fish listings:
The Oregon Planhttp://www.oregon-plan.org
ODFWhttp://www.dfw.state.or.us
Pacific States National Marine Fisheries Councilhttp://www.psmfc.org

Ecosystems Northwest Marys River Preliminary Watershed Assessment 117
National Marine Fisheries Servicehttp://www.nwr.noaa.gov
Cutthroat Homepage. OSU and ODFWhttp://www.orst.edu/dept/odfw/conference/cuthab.html
Species listings:
Natural Heritage Council. The Nature Conservancy.http://www.heritage.tnc.org
ODFWhttp://www.dfw.state.or.us
Hulse Report homepage. [Information on Muddy Creek Watershed as well as currentprojects.]http://ise.uoregon.edu/muddy/muddy_abstract.html
Corp. of Engineers Willamette Valley Projects. [ information of Willamette Valleysensitive species and the western pond turtle.]http://www.nwp.usace.army.mil/op/v/wvphome.htm#WVHome
Human growth and population estimates:
http://www.upa.pdx.edu/CPRC/Final98.PDFPortland State University Center for Population Research and Census. 1999. FinalPopulation Estimates for Oregon, Its Counties, and Incorporated Cities. [This siteprovides official population estimates for Oregon Counties.]
http://www.oea.das.state.or.us/county/co_pop.htmOffice of Economic Analysis. 1997. Long Term Population Forecasts. [Thedemographer with the Office of Economic Analysis provides population andemployment forecasts by county. These estimates are an alternative to the PSUCenter for Population Research and Census, although the PSU numbers areconsidered the “official” population estimates.]
Oregon Blue Book. 1997. City and County Population Estimates.http://www.sos.state.or.us/BlueBook/1997_98/local_gov/citypop.htmU.S. Department of Commerce, Bureau of Economic Analysis. 1998.Regional Accounts Data. http://www.bea.doc.gov/bea/regional/data.htm

118 Marys River Preliminary Watershed Assessment Ecosystems Northwest
APPENDIX 2: Photos
The next three insert sheets contain a time-series of aerial photos. These photosshow subtle changes to the riparian forests between 1937 and 1994. Visualinspection suggests that little to no forest removal occurred along Muddy Creek duringthis time period. Forest removals occurred along the old drainage channels to theeast and along the Marys River to the north. One might speculate that the drainagechannels contained more extensive forests before these photos, similar to thereconstruction of vegetation shown in Map 16. Also, these photos show that most ofthe non-forest area was already in farms by 1937 and that a large network of drainageditches were in place.
Photo 3a: 1937 aerial photo of the confluence of Marys River and Muddy Creek.
Photo 3b: 1956 aerial photo of the confluence of Marys River and Muddy Creek .
Photo 3c: 1994 orthophoto of the confluence of Marys River and Muddy Creek.

Ecosystems Northwest Marys River Preliminary Watershed Assessment 119
Photo 4 : A controversial photo about whether salmon ever used the Marys River.These photos, reportedly taken in the 1920’s on a homestead near Harris (upstream onthe Marys River of Wren) show large salmonids. The men in the photos are the fatherand grandfather of Bobby Taylor of Wren. According to Bobby Taylor, his fatherdescribed to him that chinook salmon were speared out of the Marys River in the 1920susing pitchforks. By the time that Taylor can remember (1940’s) there were no salmonin the Marys River. Several fish biologist consulted do not believe that these salmonlikely came from the Marys River, but from somewhere else (see text in Chapter 4).

120 Marys River Preliminary Watershed Assessment Ecosystems Northwest
APPENDIX 3: Figures not imbedded in text
Figure 3-1: 1852 General Land Office survey map, Oak Creek.

Ecosystems Northwest Marys River Preliminary Watershed Assessment 121
APPENDIX 3: Figures not imbedded in text
Figure 3-2: 1853 General Land Office survey map, Lower Marys River.

122 Marys River Preliminary Watershed Assessment Ecosystems Northwest
APPENDIX 3: Figures not imbedded in text
Figure 3-3: 1859 Cadastral map for township 12 South, Range 5 West.

Ecosystems Northwest Marys River Preliminary Watershed Assessment 123
APPENDIX 3: Figures not imbedded in text
Figure 3-4: Location of historic mill sites and logging railroads (based on T.J.Starker’s map on file at Benton County Historical Society).

124 Marys River Preliminary Watershed Assessment Ecosystems Northwest
APPENDIX 3: Figures not imbedded in text
Figure 3-5: Relationship of impervious surfaces to environmental condition. (May et al. 1997).

Ecosystems Northwest Marys River Preliminary Watershed Assessment 125
APPENDIX 3: Figures not imbedded in text
Figure 3-6: 1996 City of Philomath wetlands inventory (from files of City of Philomath).

126 Marys River Preliminary Watershed Assessment Ecosystems Northwest
Figure 3-7: Water quality for Beaver Creek.

Ecosystems Northwest Marys River Preliminary Watershed Assessment 127
Figure 3-8: Water quality for Oliver Creek.

128 Marys River Preliminary Watershed Assessment Ecosystems Northwest
Figure 3-9: Water quality for Muddy Creek.

Ecosystems Northwest Marys River Preliminary Watershed Assessment 129
APPENDIX 4: Hydrology
Section 1: Hydrologic flow data for the Marys River.
1 724-K5-G31S RIVER STATION RATING TABLE FOR PAGE 1
FACTOR: 0.001 MARYS RIVER DATE: 02/13/99 NEAR PHILOMATH, OR.
DB4 STATION NAME: PHIO USGS STATION #: DB4 TABLE NAME: USGS TABLE # DB4 TABLE DATE: 01/24/88 USGS TABLE DATE: GAGE HEIGHT (FT) .0 .1 .2 .3 .4 .5 .6 .7 .8 .9 DISCHARGE (CFS KCFS MCFS)
1 4 2 6 2 2 8 2 10 2 12 3 15 4 19 4 23 4 27 4 31 5 36 6 42 6 3 48 7 55 8 63 9 72 9 81 9 90 9 99 9 108 9 117 9 126 9 4 135 10 145 10 155 10 165 10 175 10 185 11 196 12 208 12 220 12 232 12 5 244 13 257 13 270 13 283 13 296 13 309 13 322 13 335 13 348 14 362 14
6 376 14 390 15 405 16 421 17 438 17 455 17 472 17 489 17 506 17 523 17 7 540 18 558 18 576 18 594 18 612 18 630 18 648 18 666 19 685 20 705 20 8 725 20 745 20 765 20 785 20 805 20 825 20 845 20 865 20 885 20 905 20 9 925 20 945 20 965 20 985 20 1005 20 1025 20 1045 20 1065 20 1085 20 1105 20 10 1125 20 1145 20 1165 25 1190 25 1215 25 1240 25 1265 25 1290 25 1315 25 1340 25
11 1365 25 1390 25 1415 25 1440 25 1465 25 1490 25 1515 25 1540 25 1565 25 1590 25 12 1615 25 1640 25 1665 25 1690 25 1715 25 1740 25 1765 25 1790 25 1815 25 1840 25 13 1865 25 1890 25 1915 25 1940 25 1965 25 1990 25 2015 25 2040 25 2065 25 2090 25 14 2115 25 2140 25 2165 25 2190 25 2215 25 2240 30 2270 30 2300 30 2330 30 2360 35 15 2395 35 2430 35 2465 35 2500 35 2535 35 2570 35 2605 35 2640 35 2675 35 2710 35
16 2745 40 2785 40 2825 40 2865 40 2905 40 2945 40 2985 40 3025 40 3065 40 3105 40 17 3145 45 3190 50 3240 50 3290 50 3340 50 3390 50 3440 50 3490 50 3540 60 3600 60 18 3660 60 3720 60 3780 70 3850 70 3920 70 3990 70 4060 70 4130 70 4200 70 4270 80 19 4350 90 4440 90 4530 90 4620 90 4710 95 4805 95 4900 140 5040 145 5185 150 5335 150 20 5485 155 5640 160 5800 200 6000 400 6400 600 7000 800 7800 1.0 8800 1.0 9800 1.2 11.01.2
21 12.2
RFC RATING TABLE NOTES:
GAGE DISCONTINUED IN SEP 1985 BANK FULL 16.0 FT FLOOD STAGE 20.0 FT MAX DISCHARGE 13600 CFS, GH 20.72 FT, DATE 12-22-64 MAX GH 20.91 FT, DATE 01-15-74 TABLE EXTENDED BY RFC ABOVE 21.0 FT; EXTENSION POINTS ARE: 21.5 21000. 22.0 40000.

130 Marys River Preliminary Watershed Assessment Ecosystems Northwest
Appendix 4
Section 2: Marys River segments on 303(d) list.
Segment ID 22E-MARY0 (Marys River—Mouth to Greasy Creek) was the onlysegment considered and listed for the following parameters on the 1998 303(d)list.
Parameter: BacteriaCriteria: Water Contact Recreation (fecal coliform-96 Std)Season: Fall-Winter-SpringListing Status: 303(d) ListBasis for Consideration for Listing: DEQ Data; d1 in 305(b) Report (DEQ, 1994); NPSAssessment -segment 456: severe, data (DEQ, 1988); City of Corvallis data 1997.Supporting Data: DEQ Data (Site 402041; RM 0.2): 24% (11 of 45) FWS valuesexceeded fecal coliform standard (400) with a maximum value of 2400 between WY1986 - 1995. City of Corvallis two sites 1996/97 showed no exceedence of E. colistandard of (406).Change from 1994/96 List: No Change
Parameter: Flow ModificationCriteria:Season:Listing Status: 303(d) ListBasis for Consideration for Listing: USGS (1990); IWR (ODFW); WRD Data; ODFW(1990).Supporting Data: Cutthroat populations are suspected to be declining due todegradation and loss of habitat, low flows have been suggested to be the most criticalfactor (ODFW, 93); IWR (70748) is often not met at USGS gage (14171000).Change from 1994/96 List: No Change.
Parameter: TemperatureCriteria: Rearing 64 F (17.8 C)Season: SummerListing Status: 303(d) ListBasis for Consideration for Listing: DEQ Data (Temperature Issue Paper, 1994);ODFW Data Supporting Data: DEQ Data (Site 402041; RM 0.2): 85% (41 of 48)Summer values exceeded temperature standard (64 F) with exceedences each yearand a maximum of 82.4 in WY 1986- 1995.Change from 1994/96 List: No Change
Parameters for which Segment ID 22E-MARY0 (Marys River—Mouth to GreasyCreek) was considered for but not listed for in 1998 on the 303(d) list:
Parameter: BacteriaCriteria: Water Contact Recreation (fecal coliform-96 Std)Season: SummerListing Status: OK—not listed

Ecosystems Northwest Marys River Preliminary Watershed Assessment 131
APPENDIX 4:Section 2: Marys River segments on 303(d) list (cont.)
Marys River water segments considered for 1998 303(d) list, but not listed
Supporting Data: DEQ Data (Site 402041; RM 0.2): 9% (3 of 33) Summer valuesexceeded fecal coliform standard (400) with a maximum value of 460 between WY1986 - 1995.Rationale for not Listing: Did not meet listing criteria.Change from 1994/96 List: No Change.
Chlorophyll aSeason: SummerListing Status: OK—not listedBasis for Consideration for Listing: DEQ Data (Site 402041; RM 0.2): 0% (0 of 43)Summer values exceeded chlorophyll a standard (15 ug/l) between WY 1986-1995.Rationale for not Listing: Did not meet listing criteriaChange from 1994/96 List: No Change
Dissolved Oxygen (DO)Cool-water aquatic resources: DO < 6.5 mg/lListing Status: OK–not listedBasis for Consideration for Listing: DEQ Data; d1 in 305(b) Report (DEQ, 1994); NPSAssessment -segment 456: moderate, data (DEQ, 1988); City of Corvallis data 1997Supporting Data: DEQ Data (Site 402041; RM 0.2): 0% (0 of 95) Annual valuesexceed dissolved oxygen standard (6.5 mg/l) between WY 1986 - 1995 (Cool waterfishery, annual). City of Corvallis showed no exceedence of DO standard for coolwater aquatic resources.Rationale for not Listing: Did not meet listing criteriaChange from 1994/96 List: No Change
Parameter: pHCriteria:Season: SummerListing Status: OKBasis for Consideration for Listing: DEQ Data; City of Corvallis dataSupporting Data: DEQ Data (Site 402041; RM 0.2): 0% (0 of 48) Summer valuesexceeded pH standard (6.5- 8.5) between WY 1986 - 1995. City of Corvallis dataconfirms.Rationale for not Listing: Did not meet listing criteriaChange from 1994/96 List: No Change
Parameter: pHCriteria:Season: Fall-Winter-SpringListing Status: OKBasis for Consideration for Listing: DEQ Data; City of Corvallis data

132 Marys River Preliminary Watershed Assessment Ecosystems Northwest
Supporting Data: DEQ Data (Site 402041; RM 0.2): 0% (0 of 45) FWS valuesexceeded pH standard (6.5-8.5) between WY 1986 - 1995. City of Corvallis dataconfirms finding.Rationale for not Listing: Did not meet listing criteriaChange from 1994/96 List: No Change--------------------------------------------------------
Parameters for which Segment ID 22E-GREA0 (Greasy Creek-mouth toheadwaters) was considered for but not listed for in 1998 on the 303(d) list:
SedimentationNeed DataNPS Assessment - segment 437: moderate, observation (DEQ, 1988)Rationale for not Listing: No supporting data or informationChange from 1994/96 List: No Change.
Parameters for which Segment ID 22E-TUMT0 (Tum Tum River-mouth toheadwaters) was considered for but not listed for in 1998 on the 303(d) list:
Parameter: SedimentationCriteria:Season:Listing Status: Need DataBasis for Consideration for Listing: NPS Assessment - segment 438: moderate,observation (DEQ, 1988).Supporting Data:Rationale for not Listing: No supporting data or informationChange from 1994/96 List: No Change

Ecosystems Northwest Marys River Preliminary Watershed Assessment 133
Appendix 4:Section 3: DEQ water quality data
Oregon DEQ summary ofSTORET DataStoret retrieval date6/17/98
Marys River at 99 W(Corvallis)1987-1997 data
00400 00431 00010 00094 00300 00301 82078
pH T Alk Water Cond DO DO Turb
Date Field Temp Field Saturation Field
(beginning SU mg/L Cent Micromho mg/L % NTU
ending)1/1/99
3/31/99 Number 17 17 17 17 17 17 17Max 7.5 31 11 89 12.6 98 53Min 6.9 10 3 61 9.9 83 7Mean 7.3 23 7 76 11.5 93 20
4/1/996/30/99 Number 23 19 24 24 24 24 19
Max 7.7 40 26 119 11.2 112 17Min 6.7 23 10 70 7.3 81 5Mean 7.4 32 16 91 9.8 97 9
7/1/999/30/99 Number 38 17 38 38 38 38 14
Max 7.9 58 28 151 9.9 115 16Min 7.2 40 15 102 7.0 79 2Mean 7.6 49 21 123 8.3 92 5
10/1/9912/31/99 Number 13 13 13 13 13 13 13
Max 7.7 68 17 166 12.2 95 35Min 7.0 25 5 91 7.7 77 3Mean 7.5 47 11 122 9.7 88 9

134 Marys River Preliminary Watershed Assessment Ecosystems Northwest
Appendix 4 Section 3 (continued)
Oregon DEQ summary ofSTORET DataStoret retrieval date2/15/94
Marys River at 99 W(Corvallis)1983-1993 data
00400 00431 00010 00094 00300 00301 00076
pH T Alk Water Cond DO DO Turb
Date Field Temp Field Saturation Trbdmtr
(beginning SU mg/L Cent Micromho mg/L % Hach FTU
ending)1/1/99
3/31/99 Number 19.0 18 20 20 20 20 19Max 7.5 31 11 107 12.6 99 88Min 6.9 14 3 50 10.2 87 7Mean 7.2 23 8 74 11.0 97 15
4/1/996/30/99 Number 26.0 22 27 27 27 27 22
Max 7.9 40 26 119 11.2 112 17Min 6.7 23 8.5 11 7.3 81 5Mean 7.5 32 17 88 10.0 99 7
7/1/999/30/99 Number 44.0 20 46 46 45 46 20
Max 7.9 64 28 162 9.9 115 19Min 7.2 34 14 91 7.0 79 3Mean 7.6 47 21 122 8.7 93 8
10/1/9912/31/99 Number 17.0 17 17 17 17 17 15
Max 7.7 68 15.5 166 13.0 101 35Min 7.0 19 3 60 7.7 77 3Mean 7.4 33 8.3 95 10.6 89 8

Ecosystems Northwest Marys River Preliminary Watershed Assessment 135
Appendix 4 Section 3 (continued)
Oregon DEQ summary ofSTORET DataStoret retrieval date2/16/94
Marys River at 99 W(Corvallis)1983-1993 data
00310 00335 00680 00610 00630 00625 00665 00671 32209 31615 61639
BOD COD T Org-C
NH3+NH4 NO2+NO3
Tot Kjel Phos-Tot Phos-dis Chlrphyl Fec coli entcocci
Date 5 d lowlevel
C N total N-Total N ortho A MPN mf
(beginning mg/L mg/L mg/L mg/L mg/L mg/L mg/L P mg/L P ug/L /100ml /100ml
ending)1/1/99
3/31/99 Number 18 18 18 19 19 17 19 15 19 16Max 91.0 54 5 0.17 1.20 1.00 0.346 0.092 2400 400Min 0.9 5 1 0.03 0.31 0.03 0.060 0.016 23 5Mean 1.7 5 2 0.05 0.60 0.40 0.110 0.034 240 70
4/1/996/30/99 Number 24 20 20 25 25 25 25 25 18 23 18
Max 1.8 12 4 0.22 0.82 2.00 0.160 0.150 11.3 930 195Min 0.1 5 1 0.02 0.03 0.20 0.031 0.005 8 15 5Mean 1.3 5 2 0.03 0.23 0.30 0.070 0.023 1.7 93 10
7/1/999/30/99 Number 24 16 16 42 42 42 41 43 41 31 23
Max 3.7 13 4 0.06 0.31 1.00 0.184 0.078 15 460 150Min 0.2 5 1 0.02 0.02 0.20 0.050 0.020 0.7 23 10Mean 1.3 5 2 0.02 0.05 0.30 0.070 0.028 3.9 93 60
10/1/9912/31/99 Number 14 13 13 15 15 15 15 13 2 15 12
Max 3.4 14 5 0.05 0.90 0.70 0.240 0.057 2.7 2400 1010Min 0.4 5 1 0.02 0.02 0.20 0.580 0.018 2.4 43 10Mean 1.5 5 2 0.04 0.38 0.30 0.080 0.029 2.4 210 70

136 Marys River Preliminary Watershed Assessment Ecosystems Northwest
APPENDIX 5: Geology and Soils
Section 1: Geology
Coast Range Geology
Siletz River Volcanics (P-type Tsr)
These are the oldest rocks exposed, and they form a band about six miles wideacross the northern part of the watershed. These rocks are massive pillow basalts,tuffs and breccias of the Eocene when Western Oregon was covered by an arm of theocean. Rocks of this formation are resistant and often form topographic highs andcommonly have very steep slopes.
Kings Valley Siltstone (P-type Tsr)
The uppermost part of the Siletz River Volcanics grades into the waterlaid tuffs knownas Kings Valley siltstone Member, which consists of interfingering of sedimentaryrocks with volcanic rocks. The shaly, soft and thin-bedded siltstone is nonresistantand weathers rapidly. They occur in a two to three mile wide band between the SiletzRiver Volcanics and the Flournoy Formation in the northwest corner of the watershed.These rocks are not separated on the geology coverage map Fig.
Flornoy Formation (P-type Tt)
The rhythmically bedded, sandstone and sandy-siltstone of the Flournoy Formationare the second most widespread rocks in the watershed They occur both east andwest of the belt of Siletz River Volcanics in the northern part of the watershed, andpartly form the southwestern divide. The rocks are of the Middle Eocene. This unit issometimes mapped with the Tyee Formation (Walker and MacLeod, 1991) since thetwo are similar.
Spencer Formation (P-type Tss)
The Spencer Formation occurs in the south central part of the watershed, and iscomposed of basaltic and arkosic sandstone that is massive and thick bedded. Fine-to medium- grained arkosic and micaceous sandstone overlies the basaltic sandstone.An exposure of this rock can be seen in the road cut east of Dawson.
Coast Range Intrusive Rocks (P-type Ti)
Intrusive sills and dikes of cap many of the prominent peaks of the Coast Range thathelp define the western and southern watershed divides. Marys Peak and GrassMountain are examples of remnants of thick sills that were previously buried beneatha thick cover of sedimentary rocks. Subsequent uplift of the Coast Range strippedaway the sedimentary cover leaving intrusive gabbro and diorite rocks at the surface.
Bedrock Foothills and Pediments (P-type, included with corresponding types above)

Ecosystems Northwest Marys River Preliminary Watershed Assessment 137
Appendix 5, Section 1: Geology (continued).
The slopes of the Coast Range blend with the western margins of the WillametteValley and the rock types of the Coast Range, discussed above, make up the bedrockfoothills and pediments of the Marys River Watershed. Eolian silts, alluvium andlacustrine deposits may mantle bedrock and colluvium on the lower foothills.
Surficial Geology of the Willamette Valley
Pleistocene Terraces (P-type Qt)(Quaternary higher terraces, Qth) (Bela, 1979)
Terraces flank lowland margins and tributary valleys. The sand and gravel depositsalong the foothills are thin, but in places such as near Corvallis and Philomath they arefound in deposits 100 to 200 feet thick. These gravels are substantially weathered andhave undergone soil development and extensive leaching in the upper part. Theposition of these higher terraces may have been a result of tectonic activity around theWillamette Valley. They are estimated to be between 4 and 0.4 million years (Ma yrs.)
Pleistocene Sands and Gravels (P-types included with Qt)
Deposits of varied thickness of unconsolidated clay, silt and sand underlie the presentlowlands and valley floors. They are of two main types. One is older outwash gravel(23,000 to 22,000 ka) that makes up a large part of the Willamette aquifer (Gannetand Caldwell, in press). Where these deposits are exposed at the surface they arepart of the Winkle and Ingram geomorphic surfaces. The deposits generally have aplanar surface or a slight braided channel appearance. Where these deposits areexposed above flood deposits they show paleosol development and weathering tomore than 40 inches depth.
The younger deposits post-date the Missoula Floods and are estimated to be 12.3 kayrs. Distinctions between these and modern flood plain sediments is not always clearin the southern Willamette Valley, where supposed Pleistocene surfaces havehistorically flooded (O’Conner et al.) Salem and Malabon soils are mapped on theselandscapes.
Pleistocene Lacustrine and Alluvial Deposits (P-types Qs)(Willamette Silts (Allison 1953); Quaternary middle terrace deposits (Bela, 1979) andMissoula Flood deposits)
A large part of the lowland Willamette Valley is covered with thick deposits of silt, clayand sand from numerous floods from Glacial Lake Missoula. The floodwaters surgeddown the Columbia Gorge and left deposits in the Willamette Valley as far south asEugene. Deposits at Irish Bend record at least ten such floods during the latePleistocene 15 to 12.7 ka yrs. The Willamette silt has distinctive features including:rhythmic bedding, a Columbia River Basin provenance, and the presence of oversized

138 Marys River Preliminary Watershed Assessment Ecosystems Northwest
Appendix 5, Section 1: Geology (continued).
erratics that were likely ice-rafted into the Willamette Valley during the flood MissoulaFlood events.
The silt underlies a nearly planar and undissected surface that obscures theunderlying braid plain topography up to altitudes of 320 to 400 feet. In the southernWillamette valley the deposit is thinner than 30 feet. It thins further towards themargins where it blankets lower foothills and terraces with about 40 inches of silt up toabout 400 feet elevation. The well-drained Willamette, and moderately well drainedWoodburn soils are associated with the Willamette silt on the somewhat moredissected Senecal geomorphic surface. The poorly drained Dayton soil is associatedwith these deposits on the undissected and poorly drained Calapooyia geomorphicsurface.
Halocene Alluvial Deposits (P-type Qal)(Quaternary lower terrace deposits, Qral) (Bela, 1979)
These recent floodplain deposits occur on floodplains and channel deposits of theWillamette River and its tributary streams. Deposits of the Willamette are coarserthan tributary streams. These deposits underlie the Horseshoe, Ingram andLukiamute geomorphic surfaces. The current floodplains are inset within 15 to 12.4 kaMissoula flood deposits and 12 ka outwash, and they have been dated as youngerthan 4ka yrs.

Ecosystems Northwest Marys River Preliminary Watershed Assessment 139
Appendix 5
Section 2: Eight Soil Groups of the Marys River Watershed (see also Map 19 of Appendix 7).
Agricultural and Mixed Land Use Soils of the Main Valley Floor and Foothills
Table 5-1. Soil Group A Main valley floor terraces, Level to nearly levelwith few limitations, diverse agriculture and urban uses. Capabilityclasses I and Is and IIw.Map Unit Series Type Slope
classCapabilityClass
AbA Abiqua Silty clay loam 0-3 IWeA Willamette Silt loam 0-3 ISa Salem Gravelly loam 0-3 II sMa Malabon Silty clay loam 0-3 II sAm Amity Silt loam 0-3 II wWoA Woodburn Silt loam 0-3 II wMn McAlpin Silty clay loam 0-3 II w
Main valley floor terraces, and alluvial soils of tributary valleys. Level to nearly level with fewlimitations, diverse agriculture and urban uses. Capability classes I and Is and IIw.
These soils are generally well drained to moderately well drained, have high water holdingcapacity and are very productive with few limitations for agriculture or urban uses. TheWillamette silt loam is a well-known member of this group, which supports a diverseassemblage of intensively farmed crops under both irrigation and dryland management. Muchof the area of Philomath and Corvallis is developed on these soils. Agriculture and urban landuses will continue to compete for these soils, since they have few limitations and are suited toa wide range of land uses. Abiqua and McAlpin are soils of the tributary valleys that aregenerally used for less intensive agriculture such as wheat, hay, Section 3 (continued)pasture and some grass seed production. Malabon soils were placed in this group even though inplaces along Marys River and Muddy Creek they occasionally flood. These areas of Malabon soilsnear streams are being addressed in the soil survey update in Benton County (M. Fillmore, pers.comm.)
Table 5-2. Soil Group B Gently to strongly sloping soils of the terracesand foothills; Slight to moderate erosion hazard; Capability classes IIeand IIIe.Map Unit Series Type Slope
classCapabilityClass
AbB Abiqua Silty clay loam 3-5 II eBeC Bellpine Silty clay loam 3-12 II eBeD Bellpine Silty clay loam 12-20 III eBrB Briedwell Gravelly loam 0-7 III eDnC Dixonville Silty clay loam 3-12 II eDnD Dixonville Silty clay loam 12-20 III eDuC Dupee Silt loam 3-12 III eHaC Hazellair Silt loam 3-12 III eHeC Hazellair Complex 3-12 III eJoC Jory Silty clay loam 2-12 II eJoD Jory Silty clay loam 12-20 III e

140 Marys River Preliminary Watershed Assessment Ecosystems Northwest
PhC Philomath Silty clay 3-12 IV ePrC Price Silty clay loam 3-12 II ePrD Price Silty clay loam 12-20 III eVeB Veneta Silt loam 2-7 II eVeD Veneta Silt loam 7-20 III eWeC Willamette Silt loam 3-12 II eWhB Winchuck Silt loam 2-7 II eWkB Witham Silty clay loam 2-7 III eWoC Woodburn Silt loam 3-12 II e
Gently to strongly sloping soils of the terraces and foothills; Slight to moderate erosion hazard;Capability classes IIe and IIIe.
Land use on this group ranges from intensive and diverse agriculture on the mollisols of themain valleys to less intensive pasture and hay, Christmas trees, wine grapes and plantationforestry on the redder ultisols on the foothills. Conservation practices should be used thatprotect the soil surface from rainfall and that control runoff.
Table 5-3. Soil Group C Steeply sloping soils of old terraces and foothills;high hazard of erosion; Capability classes IVe and Vie.Map Unit Series Type Slope class Capability
ClassApC Apt Sicl 3-12 VI eBeE Bellpine Silty clay loam 20-30 IV eBeF Bellpine Silty clay 30-50 VI eBrD Briedwell Gravelly loam 7-20 IV eDnE Dixonville Silty clay loam 20-30 IV eDnF Dixonville Silty clay loam 30-50 VI eHeD Hazellair Silt loam 12-20 IV eHgC Honeygrove Silty clay loam 3-12 VI eJoE Jory Silty clay loam 20-30 IV eJRE Jory Silty clay loam 2-30 IV ePhE Philomath Silty clay 12-45 VI ePTE Price-Ritner Complex 20-30 IV eVnE Veneta loam 20-30 IV e
Steeply sloping soils of old terraces and foothills; high hazard of erosion; Capability classesIVe and Vie.
These soils are marginal for most agricultural crops because of steep slopes, lack of irrigationwater and soil erosion potential, with a few important exceptions including wine grapes andChristmas trees. Jory soils are prized by winegrowers. These soils are productive forDouglas fir and are used in plantation forestry. There is some suburban developmentoccurring on these soils. Much of what remains of Oregon white oak savanna grows on thesesoils, and may be threatened in the future by competing land uses.
Level and nearly level soils of the floodplains that frequently to rarely flooded, support diverseagriculture, and have slight to moderate risk of erosion from floodwater; Capability classes IIw,IIs, and IVw.
These agricultural soils are predominantly underlying the Ingram geomorphic surface andoccupy parts of the floodplains of Marys River, Muddy Creek and the Willamette River. Thisgroup supports a very intensive agricultural industry. A wide variety of irrigated vegetablecrops, berries, small fruits, mint and hops are grown on these productive soils. Flood damage

Ecosystems Northwest Marys River Preliminary Watershed Assessment 141
to soil and property can be significant. Flood control dams on the Willamette have altered theflood frequency and magnitude on some of these lands. Intensive irrigated agricultural landuse on coarse-textured soils of this group, such as Newberg overlie a shallow aquifer and thispresents concerns for groundwater quality
Table 5-4. Soil Group D Level and nearly level soils of the floodplainsthat are occasionally flooded, usually support diverse agriculture, andhave slight to moderate risk of erosion from floodwater; Capabilityclasses IIw, IIs, and IVw.Map Unit Series Type Slope class Capability
ClassCa Camas Gr. sandy loam 0-3 IV wCh Chahalis Silty clay loam 0-3 II wCm Cloquato Silt loam 0-3 II wCn Coburg Silty clay loam 0-3 II wMs McBee Silty clay loam 0-3 II wNe Nehalam Silty loam 0-3 II wNg Newberg f. sandy loam 0-3 II wNm Newberg Loam 0-3 II wPk Pilchuck f. sandy loam 0-3 IV w
Level and nearly level soils of the floodplains that frequently to rarely flooded, support diverseagriculture, and have slight to moderate risk of erosion from floodwater; Capability classes IIw,IIs, and IVw.
These agricultural soils are predominantly underlying the Ingram geomorphic surface andoccupy parts of the floodplains of Marys River, Muddy Creek and the Willamette River. Thisgroup supports a very intensive agricultural industry. A wide variety of irrigated vegetablecrops, berries, small fruits, mint and hops are grown on these productive soils. Flood damageto soil and property can be significant. Flood control dams on the Willamette have altered theflood frequency and magnitude on some of these lands. Intensive irrigated agricultural landuse on coarse-textured soils of this group, such as Newberg overlie a shallow aquifer and thispresents concerns for groundwater quality.
Table 5-5. Soil Group E Hydric soils. Poorly drained soils of broadflat terraces and depressions, and floodplains of tributary streams.Grass seed farming and other agricultural crops that can withstandseasonally wet soils. Some areas are artificially drained. Includesimportant and potential wetlands and riparian areas.MapUnit
Series Type Slope class CapabilityClass
Ba Bashaw Silty clay loam 0-3 IV wBc Bashaw Clay 0-3 IV wBp Brenner Silt loam 0-3 III wCo Concord Silt loam 0-3 III wCs Conser Silty clay loam 0-3 III wDa Dayton Silt loam 0-3 IV wWa Waldo Silty clay loam 0-3 III wWc Wapato Sitly clay loam 0-3 III w
Hydric soils. Poorly drained soils of broad flat terraces and depressions, and floodplains oftributary streams.

142 Marys River Preliminary Watershed Assessment Ecosystems Northwest
These soils are all naturally poorly drained, some are artificially drained, and most arecurrently farmed wetlands. Dayton soils, locally known as “white ground”, are verydifficult to drain but are well suited to production of rye grass seed and the few otheragricultural crops that can withstand seasonally wet soils. These soils are not suitedto un-sewered development because the soils are wet and have restrictive layers.The Waldo and Bashaw soils are fine-textured soils of tributary floodplains, drainagesand depressions. They are used for grass seed production, pasture, and hybridpoplar. These fine textured bottomland soils are sediment and nutrient sinks, howeverthey can contribute fine sediment and phosphorus to streams where the streambanksare not vegetated and are eroding. Soils of this group include important wetland andriparian areas, such as the Finley National Wildlife Refuge on Muddy Creek.
Forested and Mixed Land Use Soils of the Coast Range and Foothills
Table 5-6. Soil Group F High productivity forestland with lowerosion risk for forest management. Marginal to high-riskagriculture practiced in places. Very strongly sloping (3-30percent). Some soils have high risk of slumping.Map Unit Series Type Slope classASD, ATD Apt Silty clay loam 5-25BLE Blachly Silty clay loam 3-30HND, HOD Honeygrove Silty clay loam 3-25MGD Marty Gravelly loam 3-25PEE Peavine Silty clay loam 3-30RPE Ritner-Price Complex 12-30SLD Slickrock Gravelly loam 3-25
High productivity forest land with low erosion risk for forest management. Marginal to high-risk agriculture practiced in places. Moderately to very strongly sloping (3-30 percent). Somesoils have high risk of slumping.
Group G Moderate to high productivity forestland with high erosion risk for forestmanagement. Not suited to agriculture. Steeply sloping (25-60 percent).
Group H These soils are either unproductive forest soils; or they are low to moderatelyproductive forest soils and are very steeply sloping (greater than 50 to 60 percent) and havesevere limitations to forest management.

Ecosystems Northwest Marys River Preliminary Watershed Assessment 143
APPENDIX 6: Conditions of Selected Sensitive Species
Amphibians and Reptiles
• Clouded salamanders are rare forest dwellers that depend on large downed woodydebris for habitat. Southern torrent salamanders are found in microhabitatsproviding a constant flow of cool water such as small headwater streams above theupper extent of fish use.
• Tailed frogs inhabit cold water streams in the Coast and Cascade mountainranges. Tadpoles rear in clear, fast flowing water.
• Red-legged frogs are seriously declining in the Willamette Valley. Several recentsurveys have failed to detect this species where they were once abundant (Csuti etal. 1997).
• Spotted frogs were once thought to be common west of the Cascades but havedisappeared from the Willamette Valley. Spotted frogs have been severelyaffected by the introduction of bullfrogs and are now found only at sites that do notsupport bullfrogs.
• The western pond turtle was once common to all wetland habitats of the WillametteValley but has since declined by as much as 96-98 % since the beginning of thecentury. Declines are in part due to wetland habitat loss and predation on youngturtles by introduced species such as bullfrogs and bass (Csuti et al. 1997).
• Painted turtles exist in highly disjunct populations in the Willamette valley and maynot exist at all in Benton County (ODFW Sensitive Species List, 1997).
Birds
• Marbled murrelets are listed “Threatened” under ESA throughout their range due toloss and fragmentation of nesting habitat, leading to nest failure. There has been ayearly 4-7 % decline in population for the western United States. These birdsventure 50 miles into the Coast Range from Pacific Ocean to nest in the branchesof large trees. Murrelets are thought to occur in the western portions of thewatershed and probably nest in the Rock Creek watershed (J. Fairchild, pers.comm.).
• Northern spotted owls also prefer large trees for nesting habitat in late-successional mixed coniferous forests with multiple layers and a closed canopy.Harvest of old growth stands and predation by great horned owls have eliminatedthe spotted owl from much of the lower elevation forests of western Oregon (Csutiet al. 1997). The spotted owl is known to occur in the Marys River Watershed.
• The Western meadowlark has been identified as in decline from much of its formerrange--savanna grasslands of the Willamette Valley. Western Meadowlarks aregrassland-associates that have especially declined from the Willamette Valley inthe last 15-20 years.
• The Oregon vesper [savanna] sparrow have been identified as in decline frommuch of its former range--savanna grasslands of the Willamette Valley.
• The Lewis’ woodpecker as recently as the mid-970s were fairly common in theChristmas bird counts in the Corvallis area. They have nearly disappeared inrecent years. Their decline may possibly be related to loss of white-oak savannacommunities (J. Plissner, Audubon Society of Corvallis, pers. comm.).

144 Marys River Preliminary Watershed Assessment Ecosystems Northwest
• Yellow-breasted chats are listed by the state as critical in the Willamette Valley andare declining nationally and regionally (ODFW Sensitive Species List 1997).
• Purple martins are state sensitive birds that have shown declines in the WillametteValley.
• Common nighthawks are state sensitive birds that have shown declines in theWillamette Valley.
• Horned larks are state sensitive birds that have shown declines in the WillametteValley.
• Neo-tropical migratory birds as a group are nationally and internationally decliningand occur throughout the Willamette Valley and Coast Range (ODFW SensitiveSpecies List 1997).
• Osprey, after years of precipitous declines nationally, are now common along theWillamette River. Their rebound is largely due to banning of DDT. Other birds ofprey that appear to be increasing or are abundant include red-tailed hawks, greathorned owls, kestrels, Coopers hawk and sharp shinned hawks. Red tailed hawksand other perching hunters such as the kestrel may benefit from changes in landuse. Grass field and cessation of field burning likely promotes the populations ofmice and insects; fence posts and wires provide abundant perches.
• Mallard ducks have shown recent population increases, due to favorable springnesting conditions locally and in Canada.
• Western bluebirds have sustained nationwide declines. However Corvallis (andPortland) is notable in that recoveries of their populations seem to be occurring.The increase is thought to be a program of nestbox establishment by committedbirders (J Plissner, pers. comm.). A 25-year record of Christmas bird counts ismaintained on EXCEL databases by volunteers in the Corvallis area, whichincludes parts of the Muddy Creek Subbasin. These data are part of a nationwideprogram supported by the National Audubon Society and can provide data on birdpopulation changes (J Plissner, current count coordinator (541) 750-7433).
• The Willamette Valley represents the wintering grounds for the entire population ofdusky goose, a subspecies of the Canada goose. In the early 1960s, the duskygeese were estimated between 10,000 and 15,000. Mortality was increasing dueto hunting pressure on concentrated flocks. The Finley National Wildlife Refuge(NWR) began establishing viable habitat for the grazing dusky geese in order toredistribute the population and decrease mortality rates. These refuges plantedforage foods, wetland plants and provided a sanctuary from disturbances with amandatory no hunting zone and minimal public interventions. The dusky goosepopulation is currently not threatened or endangered and remains stable. In 1997,the total population of dusky geese wintering in the Willamette Valley wasestimated at 21,000 (M. Naughton, Finley NWR, pers. comm.). It not expected thatthe dusky geese will likely recover to huntable populations because of the lostbreeding habitat due to an earthquake in Alaska. In addition to the protecteddusky, a yet larger population of Taveners, cackling, and western Canada geesecongregate on the refuge. These congregations of geese at Finley and the otherrefuges have created concern among the grass seed industry due to the excessivedamage to crops.

Ecosystems Northwest Marys River Preliminary Watershed Assessment 145
Mammals
• The Pacific western big-eared bat is intolerant of human disturbance and yet oftenroosts in buildings, mines and bridges as a substitute for caves. Roosting sites aremore important in determining the distribution of this bat than vegetation type,although most of the bats of the subspecies occurring west of the Cascades preferforested regions. Human disturbance to bats in their natural cave roosts haveimpacted bat populations (ODFW Sensitive Species List 1997).
• The white-footed vole inhabits alder-dominated riparian habitats in coniferousforests. Little is known about population numbers, but this species is veryuncommon.
• Lynx are rare in Oregon, which is the southern limit of their range on the westcoast. They typically inhabit dense boreal forests that have some openings, suchas meadows, bogs, or rocky outcrops. The last confirmed specimen was taken inCorvallis in 1974, but most other occurrences have been from east of the Cascademountains (Csuti et al. 1997).
• Hunters once commonly shot white-tailed deer before the turn of the centuryaccording to journal entries reviewed by Storm (1941). Today Columbia white-taildeer are not even listed as occurring in Benton County by the Wildlife Atlas (Csutiet al. 1997) nor are they on any sensitive species lists. Probably becauseColumbia white-tail deer prefer riparian lowland habitats, they were extirpated soonafter Euro-american settlement.
• Perhaps beaver were the first mammal to be severely affected in the local areadue to trapping during the 1800s. Beaver may have been locally extirpated andwere re-introduced in the Oak Creek area in 1940s by the Game Department of theOregon State College (Storm 1941). They appear to be well established againeither by this re-introduction and by natural re-introductions. Many other mammalswere supposedly reduced by trapping including the marten, mink, and otter (Storm,1941). Otters and mink apparently have recovered somewhat, whereas martenare extremely rare.
• Cougar were considered to be very rare by Storm in the local area (1941). Theirnumbers are now stable enough to provide sport hunting in the more remote areasof the Coast Range. With recent restrictions on the use of dogs to hunt cougars, itappears their numbers may be increasing closer to the urban areas, with aresulting increase in the rate of negative encounters between the public and thelarge cats.
• Elk were once common, and, according to Storm (1941), the early trappers inOregon purposely traveled to the Willamette Valley for the ease of obtaining meat.The abundant elk were quickly driven out of the valley area by the rapid settlementthat started about 1850 and by uncontrolled hunting. Today, elk exist in the MarysRiver Watershed, but tend to be reclusive and are seldom seen by the public. Aherd of approximately 100 Roosevelt elk lives year round in the vicinity of FinleyNWR. They appear to stay on the refuge to avoid hunters and probably theresidential development.

146 Marys River Preliminary Watershed Assessment Ecosystems Northwest
APPENDIX 7: GIS and Other Maps- Each map is a separate file
Map 1: Three areas of the watershed: Forested Uplands, Valley Floor, and Urban (1824 KB).
Map 2: Land use (49 KB).
Map 3: Land ownership.
Map 4: Urban growth boundaries, wetlands, and 303(d) listed waters.
Map 5: Population density.
Map 6: Sub-watersheds.
Map 7: Watershed area in Benton County.
Map 8: Extent of 1996 floods.
Map 9: Pre-settlement vegetation (1850).
Map 9a: 1850 vegetation types in riparian areas of the lower Marys River.
Map 9b: 1997 vegetation types in riparian areas of the lower Marys River.
Map 9c: 1994 USGS digital orthophotos of riparian areas of the lower Marys River.
Map 10: 303(d) listed reaches.
Map 11: Distribution of stocked runs of winter steelhead.
Map 12: Upper extent of fish distribution and stream size classifications.
Map 13: Distribution of stocked runs of coho salmon.
Map 14: Stream reaches where ODFW aquatic habitat surveys have been performed.
Map 15: Riparian vegetation classification along ODFW surveyed stream reaches.
Map 16: 1852 and 1986 vegetation of the Willamette River.
Map 17: 1990 vegetation types.
Map 18: Wetlands.
Map 19: Soil types.
Map 20: Geology

Marys River Preliminary Watershed Assessment Ecosystems Northwest
GIS Metadata Sources
Theme description File Name Scale Source Source Series Acquired From Original Source More Info
1990 Population Age bgpop 1:100,000 USCB TIGER SSCGIS USCB TIGER
1990 Poverty Rate/ Household Income povinc 1:100,000 USCB TIGER SSCGIS USCB TIGER
1996 Floodplain flood Army Corp ofEngineers Benton County Army Corp of
Engineers
303d-Listed Streams str303d 1:100,000 Oregon Dept. ofEnv. Qual SSCGIS Oregon Dept.
of Env. Qual 303d.txt
Aquatic Inventory – Habitats aqhab 1:100,000 ODFW ODFW ODFW aqinv.docAquatic Inventory – Reaches aqinvrch 1:100,000 ODFW ODFW ODFW aqinv.doc
Aspect aspct1 (grid) 30m Marys RiverWatershed Council 30M DEM
Benton County Boundary cntybnd n/a Benton County Benton County Benton County bentco.doc
Benton County Zoning - w/in watershed bczonews n/a Benton County Benton County Benton County
Bridges - Benton County bridges n/a Benton County Benton County Benton County bentco.doc
Census Blocks - w/in watershed blocksws 1:100,000 SSCGIS Public Land SurveySystem (PLSS) SSCGIS USCB TIGER trs-grid.htm
Cities cities_noclp 1:24,000 U.S. DOT SSCGIS U.S. DOTCities - w/in watershed cities 1:24,000 U.S. DOT SSCGIS U.S. DOTCoho Stocking Distribution coho 1:100,000 ODFW ODFW ODFW
Elevation elev (grid) 30m Marys RiverWatershed Council 30M DEM
EPA Comprehensive EnvironmentalResponse, Compensation, and LiabilityAct (CERCLA) Sites – Benton County
epacerc n/a EPA ODFW EPA
EPA Comprehensive EnvironmentalResponse, Compensation, and LiabilityAct (CERCLA) Sites - w/in watershed
epacerc1 n/a EPA ODFW EPA
EPA Intake Sites – Benton County epaintak n/a EPA ODFW EPAEPA Intake Sites - w/in watershed epaintk1 n/a EPA ODFW EPAEPA National Pollution Discharge epanpdes n/a EPA ODFW EPA

Ecosystems Northwest Marys River Preliminary Watershed Assessment
GIS Metadata Sources (continued)Theme description File Name Scale Source Source Series Acquired From Original Source More InfoEPA Resource Conservation andRecovery Act eparcra n/a EPA ODFW EPA
EPA Toxic Release Inventory Sites epatri n/a EPA ODFW EPAEPA Toxic Release Inventory Sites epatri1 n/a EPA ODFW EPAEPA Wells epawells n/a EPA ODFW EPAEPA Wells epawells1 n/a EPA ODFW EPA
Fish distribution fishdof 1:24,000 Oregon Dept.of Forestry ODFW
Floodplain – FEMA fldpln Federal Emergency Management Agency Benton County
Geology geol n/a Corvallis FSL(USFS/OSU) CLAMS geolgrps_po.doc
Hillshade hilshd1(grid) 30m Marys River
Watershed Council 30M DEM
Land Ownership ownershp 1:126,720 Corvallis Forestry Sciences Lab CLAMS
Atterbury Inc.,USFS, OregonWilderness Soc.
ownership.doc
Landuse landuse n/aCoatal LandscapeAnalysis and ModellingStudy
CLAMS
Major Highways hwy_maj 1:100,000 USCB TIGER CLAMS USCB TIGER roads.doc
Marys River Watershed – SSCGIS watershd 1:24:000 Regional EcosystemOffice SSCGIS Regional
Ecosystem Office 5thfld_wshds.txt
Marys River Watershed Boundary wsnew 1:24,000 Benton County Benton County Benton County bentco.docPublic Land publand n/a Benton County Benton County Benton County bentco.docRailroads railroad n/a Benton County Benton County Benton County bentco.docRivers and Streams rivers 1:100,000 EPA River Reach CLAMS USCB TIGER rivers100.docRoad Centerlines cntrline 1:100,000 Benton County TIGER Benton County USCB TIGER bentco.docRoads roads2 1:100,000 USCB TIGER CLAMS USCB TIGER roads.doc
Section Lines sect_ln 1:100,000 SSCGIS Public Land SurveySystem (PLSS) SSCGIS Oregon Water
Resource Dept. trs-grid.htm
Slope slope1 (grid) 30m Marys RiverWatershed Council 30M DEM
Soils – Benton County – w/in watershed soils2 1:24,000 Natural ResourceConservation Service SSURGO Benton County
Natural ResourceConservationService
bentco.doc

Marys River Preliminary Watershed Assessment Ecosystems Northwest
GIS Metadata Sources (continued)Theme description File Name Scale Source Source Series Acquired From Original Source More Info
State Highways – Benton County only statehwys 1:100,000 USCB TIGER CLAMS USCB TIGER roads.doc
Stream Gaging Stations gagesta n/a Marys RiverWatershed Council
U.S. GeologicalSurvey
Taxlots - Benton County parcels n/a Benton County Benton County Benton County bentco.doc
Township and Range – lines tr2ln 1:100,000 SSCGIS Public Land SurveySystem (PLSS) SSCGIS Oregon Water
Resource Dept. trs-grid.htm
Township, Range and Section - lines trs 1:100,000 SSCGIS Public Land SurveySystem (PLSS) SSCGIS Oregon Water
Resource Dept. trs-grid.htm
Township, Range and Section - polys trs2 1:100,000 SSCGIS Public Land SurveySystem (PLSS) SSCGIS Oregon Water
Resource Dept. trs-grid.htm
Urban Growth Boundary ugb n/a City of Corvallis City of Corvallis City of Corvallis
Vegetation - 1988 veg (grid) n/aCoatal LandscapeAnalysis and ModellingStudy
CLAMS CLAMS veg88.doc
Vegetation - Current veg_crnt n/a ODFW ODFW ODFW odfw_veg.doc
Vegetation - Historic veg_hist n/a The NatureConservancy
Oregon NaturalHeritage Program
The NatureConservancy
The NatureConservancy
GLOAppendix.doc
Water water 1:250,000 U.S. Geological Survey TIGER Benton County U.S. GeologicalSurvey bentco.doc
Watershed Boundaries - CLAMS ws_clams n/aCoatal LandscapeAnalysis and ModellingStudy
CLAMS CLAMS
Watershed Sub-basins maryssubs 1:24,000 Benton County Benton County Benton County bentco.doc
Western Oregon Forest Ownership worfor 1:126,720 OSU ForestScience Lab
OSU ForestScience Lab
OSU ForestScience Lab worfor.txt
Western Pond Turtle Distribution turtle n/a ODFW ODFW ODFW
Wetlands - NWI wetlands 1:24,000 USFW National WetlandsInventory ODFW U.S. Fish and
Wildlife Service bentco.doc
Wetlands - NWI wtlnd 1:24,000 USFW National WetlandsInventory ODFW U.S. Fish and
Wildlife Service bentco.doc
Wetlands - ONHP wetlnd 1:24,000 The NatureConservancy
Oregon NaturalHeritage Program Benton County wetlands.htm
Winter Steelhead stwin 1:100:000 ODFW ODFW ODFWZoning zone 1:100,000 SSCGIS SSCGIS zoning.htm

Key to historical vegetation types on Map 9.
The following is the provisional classification of “presettlement” vegetation for the WillametteRiver Basin. The table will be updated as the GIS mapping of historic vegetation continues.This table was prepared by Oregon Natural Heritage Program, The Nature Conservancy ofOregon (28 Oct. 1997).
Key to first letter of veg type:F = Closed forest O = Woodland U = UnvegetatedH = Shrubland P = Prairie W = Water or wetlandN = Composition unknown S = Savanna
Class Abbr. Plant species in Association
CLOSED FOREST:
WETLAND FALW Ash, alder, willow, bigleaf maple swamp, often with vine maple and ninebark.FAW Ash, willow swamp, sometimes w/ ninebark & briars; “very thick”.FFA Ash, mixed deciduous riparian forest with combinations of bigleaf maple, black
cottonwood, red alder, white oak, dogwood, and willow. Douglas & grand fir,ponderosa pine and red cedar may be present in small quantities. Undergrowthincludes willow, hazel, ninebark, vine maple, viburnum and yew. Differs fromFFCL by having fewer conifers.
FFCL Red alder, mixed conifer riparian forest; combinations of red cedar,grand & Douglas fir, hemlock, bigleaf maple, black cottonwood andsometimes ash; undergrowth includes yew, dogwood, vine maple,elder, hazel, willow, salmonberry and nettles. Differs from FFA bylarger conifer component. No oak.
FOA White oak, ash riparian forest, sometimes with ponderosa pine, cottonwood andwillow. No fir.
CLOSEDFOREST:UPLAND FED Inseparable mixture of (1) xeric Douglas fir-chinquapin-madrone forest on S
slopes & ridgetops & (2) more mesic Douglas fir-western hemlock or Douglasfir-bigleaf maple on N slopes & bottoms, sometimes with incense cedar, oak,grand fir, red cedar, yew, red alder and dogwood.
FF Douglas fir or grand fir forest, often with bigleaf maple, alder, vinemaple, dogwood, hazel, yew; sometimes with ash. No other conifers present;no oak.
FFBu FF, but burned, often with scattered trees surviving fireFFHC Douglas fir, with various combinations of western hemlock, red cedar, bigleaf
& vine maple, yew, dogwood, red huckleberry, hazel, Oregon grape;sometimes with oak.
FFHCBu FFHC, but burned, often with scattered trees surviving fire.FFO Douglas fir-white oak forest; undergrowth as in FF, but including oak.FFP Douglas fir-ponderosa pine forest; no oak.FO White oak forest.
SHRUBLAND HW Willow swamp or “willow swale”, sometimes with ninebark, including riparianstands on gravel or sand bars. May contain small amounts of ash.

HZ Hazel brush or thicket.
COMPOSITIONUNKNOWN NSU Swamp, composition unknown
NU Brush, unknown; includes “thickets” if no species or other descriptors aregiven.
NWU Wetland, composition unknown; includes “slough” & “swale” in forest orshrubland; “swale” in prairie = P.
WOODLAND OFHC Conifer-dominated woodland; various combinations of Douglas fir, red cedar,western hemlock, bigleaf maple, white oak, red alder, dogwood.undergrowth includes vine maple, hazel, briars, and yew. No ash present.
OFOZ “Scattering” or “thinly timbered” Douglas fir-white oak (bigleaf maple)woodland, with brushy undergrowth of hazel, other shrubs, young oaks, oakbrush, oak stump sprouts, young Douglas fir, bracken, briars, sometimeswillow. More open than FFO; differs from SOF in having brushy undergrowth.
OFZ Douglas fir woodland or “timber” often with bigleaf maple, alder or dogwood;brushy undergrowth of hazel, vine maple, young Douglas fir, bracken or“ferns”. “Fern openings” sometimes present. No oak, hemlock or cedar. Moreopen than FFO; differs from SF in having brushy undergrowth.
OFZBu OFZ, but burned, often with scattered trees surviving fire
PRAIRIE P Prairie, wet & dry, undifferentiated. Includes “swale” & “glade” if adjacentsegments are prairie. Wet prairie may have scattering of ash trees.
SAVANNA SF Douglas fir savanna.SO White oak savanna.
SOF White oak-Douglas fir savanna, mostly herbaceous undergrowth.SOP White oak-ponderosa pine savanna.
UNVEGETATED UG Gravel bar
WATER;EMERGENTWETLAND,OR AQUATIC BED W Water bodies 1 or more chains across, including rivers, sloughs, ponds,
beaver ponds, lakes & “bayou”.

Eight Soil Type of the Marys River Watershed (see Map 19)
Valley Floor and Foothills
Group A Main valley floor terraces, and alluvial soils of tributary valleys. Level to nearly level with few limitations,diverse agriculture and urban uses. Capability classes I and Is and IIw.
These soils are generally well drained to moderately well drained, have high water holding capacity and are veryproductive with few limitations for agriculture or urban uses. The Willamette silt loam is a well-known member ofthis group, which supports a diverse assemblage of intensively farmed crops under both irrigation and drylandmanagement. Much of the area of Philomath and Corvallis is developed on these soils. Agriculture and urban landuses will continue to compete for these soils, since they have few limitations and are suited to a wide range of landuses. Abiqua and McAlpin are soils of the tributary valleys that are generally used for less intensive agriculturesuch as wheat, hay, pasture and some grass seed production. Malabon soils were placed in this group eventhough in places along Marys River and Muddy Creek they occasionally flood. These areas of Malabon soils nearstreams are being addressed in the soil survey update in Benton County (M. Fillmore, pers. comm.)
Group B Gently to strongly sloping soils of the terraces and foothills; Slight to moderate erosion hazard;Capability classes IIe and IIIe.
Land use on this group ranges from intensive and diverse agriculture on the mollisols of the main valleys to lessintensive pasture and hay, Christmas trees, wine grapes and plantation forestry on the redder ultisols on thefoothills. Conservation practices should be used that protect the soil surface from rainfall and that control runoff.
Group C Steeply sloping soils of old terraces and foothills; high hazard of erosion; Capability classes IVe andVie.
These soils are marginal for most agricultural crops because of steep slopes, lack of irrigation water and soilerosion potential, with a few important exceptions including wine grapes and Christmas trees. Jory soils are prizedby winegrowers. These soils are productive for Douglas fir and are used in plantation forestry. There is somesuburban development occurring on these soils. Much of what remains of Oregon white oak savanna grows onthese soils, and may be threatened in the future by competing land uses.
Group D Level and nearly level soils of the floodplains that frequently to rarely flooded, support diverseagriculture, and have slight to moderate risk of erosion from floodwater; Capability classes IIw, IIs, and IVw.
These agricultural soils are predominantly underlying the Ingram geomorphic surface and occupy parts of thefloodplains of Marys River, Muddy Creek and the Willamette River. This group supports a very intensiveagricultural industry. A wide variety of irrigated vegetable crops, berries, small fruits, mint and hops are grown onthese productive soils. Flood damage to soil and property can be significant. Flood control dams on theWillamette have altered the flood frequency and magnitude on some of these lands. Intensive irrigated agriculturalland use on coarse-textured soils of this group, such as Newberg overlie a shallow aquifer and this presentsconcerns for groundwater quality.
Group E Hydric soils. Poorly drained soils of broad flat terraces and depressions, and floodplains of tributarystreams.
These soils are all naturally poorly drained, some are artificially drained, and most are currently farmed wetlands.Dayton soils, locally known as “white ground”, are very difficult to drain but are well suited to production of ryegrass seed and the few other agricultural crops that can withstand seasonally wet soils. These soils are not suitedto un-sewered development because the soils are wet and have restrictive layers. The Waldo and Bashaw soilsare fine-textured soils of tributary floodplains, drainages and depressions. They are used for grass seedproduction, pasture, and hybrid poplar. These fine textured bottomland soils are sediment and nutrient sinks,however they can contribute fine sediment and phosphorus to streams where the streambanks are not vegetatedand are eroding. Soils of this group include important wetland and riparian areas, such as the Finley NationalWildlife Refuge on Muddy Creek.
Coast Range and Foothills
Group F High productivity forest land with low erosion risk for forest management. Marginal to high-risk agriculturepracticed in places. Moderately to very strongly sloping (3-30 percent). Some soils have high risk of slumping.
Group G Moderate to high productivity forestland with high erosion risk for forest management. Not suited toagriculture. Steeply sloping (25-60 percent).
Group H These soils are either unproductive forest soils; or they are low to moderately productive forest soils and arevery steeply sloping (greater than 50 to 60 percent) and have severe limitations to forest management.