Palos Verdes Peninsula Watershed Management Group
419
ENHANCED WATERSHED MANAGEMENT PROGRAM (EWMP) Submitted By: Palos Verdes Peninsula Watershed Management Group April 12, 2016
-
Upload
khangminh22 -
Category
Documents
-
view
0 -
download
0
Transcript of Palos Verdes Peninsula Watershed Management Group
ENHANCED WATERSHED
MANAGEMENT
PROGRAM (EWMP)
Submitted By:
Palos Verdes Peninsula
Watershed Management Group
April 12, 2016

TABLE OF CONTENTS
1. Introduction and Background ....................................................................................................................... 1-1
1.1. Introduction ............................................................................................................................................ 1-1
1.2. Peninsula Watershed .............................................................................................................................. 1-1
1.3. Water Quality Issues and the History of Water Quality Regulations ..................................................... 1-4
1.3.1. Federal and State Law .................................................................................................................... 1-4
1.4. Water Quality Requirements .................................................................................................................. 1-5
1.5. The Enhanced Watershed Management Program ................................................................................. 1-5
1.5.1. Regulatory Framework ................................................................................................................... 1-5
1.5.2. Purpose of the MS4 Permit ............................................................................................................ 1-6
1.5.3. Watershed Management Emphasis ............................................................................................... 1-6
1.5.4. Watershed Management Goals and Priorities ............................................................................... 1-6
1.5.5. Water Quality Management Approach .......................................................................................... 1-8
1.5.6. California Environmental Quality Act ............................................................................................. 1-9
1.6. Reasonable Assurance Analysis and Watershed Control Measures .................................................... 1-10
1.7. Adaptive Management ......................................................................................................................... 1-11
2. Identification of Water Quality Priorities ..................................................................................................... 2-1
2.1. Waterbody Pollutant Classification ........................................................................................................ 2-1
2.2. Water Quality Characterization .............................................................................................................. 2-6
2.2.1. Summary of Existing TMDLs and Deadlines ................................................................................... 2-6
2.2.2. Summary of Existing 303(d) Listings ............................................................................................... 2-9
2.2.3. Receiving Water Characterization ................................................................................................ 2-10
2.2.4. Characterization of Stormwater and Non-Stormwater Discharge Quality .................................. 2-27
2.2.5. Source Assessment ....................................................................................................................... 2-31
2.2.6. Prioritization ................................................................................................................................. 2-40
3. Selection of Watershed Control Measures ................................................................................................... 3-1
3.1. Minimum Control Measures .................................................................................................................. 3-2
3.1.1. Los Angeles County Flood Control District Minimum Control Measures ....................................... 3-2
3.1.2. Assessment of Minimum Control Measures .................................................................................. 3-2
3.1.3. New and Enhanced Fourth Term MS4 Permit Minimum Control Measures ................................. 3-6
3.1.3.1. Distributed Structural Controls ............................................................................................... 3-6
3.1.3.2. Nonstructural Controls ............................................................................................................ 3-9
3.1.3.3. Nonstormwater Discharge Measures .................................................................................... 3-16
3.2. Targeted Control Measures .................................................................................................................. 3-18
3.2.1. Control Measures identified in TMDLs/Implementation Plans .................................................... 3-18
3.2.2. Nonstructural Targeted Control Measures .................................................................................. 3-20
3.2.3. Structural Targeted Control Measures ......................................................................................... 3-30
3.2.4. Structural BMP Subcategories ...................................................................................................... 3-30

3.2.4.1. Performance Evaluation of Structural Control Measures ..................................................... 3-33
3.2.4.2. Regional BMPs ....................................................................................................................... 3-34
3.2.4.2.1. Existing Regional BMPs ................................................................................................... 3-36
3.2.4.2.2. Planned Regional BMPs .................................................................................................. 3-39
3.2.4.2.3. Proposed Regional BMPs ................................................................................................ 3-46
3.2.4.2.4. Potential Regional BMPs ................................................................................................. 3-53
3.2.4.2.5. Stakeholder Incorporation .............................................................................................. 3-60
4. Reasonable Assurance Analysis .................................................................................................................... 4-1
4.1. Executive Summary ................................................................................................................................ 4-1
4.2. Reasonable Assurance Analysis .............................................................................................................. 4-2
5. Compliance Schedule .................................................................................................................................... 5-1
5.1. Introduction ............................................................................................................................................ 5-1
5.2. Schedules ................................................................................................................................................ 5-4
5.2.1. Nonstructural Best Management Practices Schedule .................................................................. 5-11
5.2.2. Structural Best Management Practice Schedule .......................................................................... 5-12
6. EWMP Implementation Costs and Financial Strategy .................................................................................. 6-1
6.1. EWMP Implementation Costs ................................................................................................................ 6-1
6.1.1. Methodology .................................................................................................................................. 6-1
6.1.2. Conceptual Design Assumptions .................................................................................................... 6-2
6.2. Summary of Costs ................................................................................................................................... 6-3
6.3. Financial Strategy ................................................................................................................................... 6-4
6.3.1. Summary ......................................................................................................................................... 6-4
6.3.2. Potential Funding Options .............................................................................................................. 6-5
6.3.3. Prioritization ................................................................................................................................... 6-9
7. Legal Authority.............................................................................................................................................. 7-1
8. Coordinated Integrated Monitoring Program .............................................................................................. 8-1
9. Adaptive Management Process .................................................................................................................... 9-1
9.1. Modifications .......................................................................................................................................... 9-1
9.1.1. Reporting ........................................................................................................................................ 9-2
9.1.2. Implementation .............................................................................................................................. 9-2
9.2. Receiving Water Limitations ................................................................................................................... 9-2
10. Reporting Program & Assessment .............................................................................................................. 10-1
10.1. Annual Report ................................................................................................................................... 10-1
10.1.1. Data Reporting .............................................................................................................................. 10-2
10.1.2. Chronic Toxicity Reporting ........................................................................................................... 10-2
10.2. Watershed Report ............................................................................................................................ 10-2
10.3. TMDL Reporting ................................................................................................................................ 10-2

LIST OF TABLES
Table 1-1: Jurisdictional Areas within Each Peninsula EWMP Watershed ............................................................. 1-2 Table 2-1: Waterbody/Pollutant Classifications for the Peninsula Watershed Group........................................... 2-5 Table 2-2: TMDLs Applicable to the Peninsula EWMP ........................................................................................... 2-7 Table 2-3: TMDL Compliance Dates Applicable to the Peninsula EWMP ............................................................... 2-8 Table 2-4: 303(d) Listed Pollutants in Peninsula EWMP Watersheds. ................................................................... 2-9 Table 2-5: Peninsula EWMP Area Water Bodies and Beneficial Uses Designated in the Basin Plan ................... 2-11 Table 2-6: Single Sample Compliance Targets ...................................................................................................... 2-14 Table 2-7: Allowable Exceedance Days per Monitoring Location ........................................................................ 2-14 Table 2-8: Number of Exceedance Days per Calendar Year by Monitoring Site and Compliance Period ............ 2-15 Table 2-9: Percentage of Calendar Years in Compliance with Allowable Exceedance Days ................................ 2-16 Table 2-10: Winter Dry Weather Exceedance Days Compared with Reference Beach ....................................... 2-16 Table 2-11: Summer Dry Weather Exceedance Days Compared with Reference Beach ..................................... 2-17 Table 2-12: Wet Weather Exceedance Days Compared with Reference Beach .................................................. 2-17 Table 2-13: Nutrient TMDL Numeric Targets and Load Allocations for Machado Lake ....................................... 2-22 Table 2-14: Percentage of Nutrient CMP Average Monthly Total N and Total P Concentrations Exceeding
TMDL WLAs for the Period August 2, 2011 through June 30, 2013 ................................................. 2-29 Table 2-15: Load generated from County Islands in Machado Lake Watershed compared to Allowable Load .. 2-30 Table 2-16: Typical Sources of Pollutants ............................................................................................................. 2-32 Table 2-17: Number of Illicit Connections and Discharges From 2001-2012 ....................................................... 2-35 Table 2-18: Active CGP Sites According to SMARTS ............................................................................................. 2-37 Table 2-19: Typical Road Infrastructure Sources of Pollutants ............................................................................ 2-39 Table 2-20: Comparison of source annual loadings to Santa Monica Bay ........................................................... 2-39 Table 2-21: Reported SSO discharges from 2006 to 2012 located within the Peninsula WMG .......................... 2-40 Table 2-22: Peninsula EWMP Priority Pollutants ................................................................................................. 2-41 Table 3-1: New and Enhanced Fourth Term MS4 Permit Nonstructural MCMs .................................................. 3-10 Table 3-2: New and Enhanced Nonstormwater Discharge MCMs ....................................................................... 3-16 Table 3-3: Nonstructural Targeted Control Measures (TCMs) ............................................................................. 3-21 Table 3-4: Anticipated Pollutants to be addressed through Nonstructural TCMs. .............................................. 3-22 Table 3-5: Summary of Existing and Planned Regional BMPs .............................................................................. 3-35 Table 5-1: WBPCs Identified in the Peninsula WMG. ............................................................................................. 5-5 Table 5-2: TMDL and 303(d) WBPC Interim (I), Final (F), and Action (A) Compliance Milestones. ........................ 5-6 Table 5-3: Interim and Final Water Quality Objectives. ......................................................................................... 5-7 Table 5-4: Structural TCM Implementation Schedule .......................................................................................... 5-13 Table 6-1: Range of Soft Costs for Regional Projects. ............................................................................................ 6-2 Table 6-2: Regional BMP Design Assumptions for Estimating Costs ...................................................................... 6-2 Table 6-3: Estimated Capital and O&M Costs for Proposed Structural BMPs ....................................................... 6-3 Table 6-4: Fund Availability Summary. ................................................................................................................... 6-4 Table 6-5: Funding Option Priorities. ..................................................................................................................... 6-9 Table 7-1: Water Quality Ordinance Language ...................................................................................................... 7-1

LIST OF FIGURES
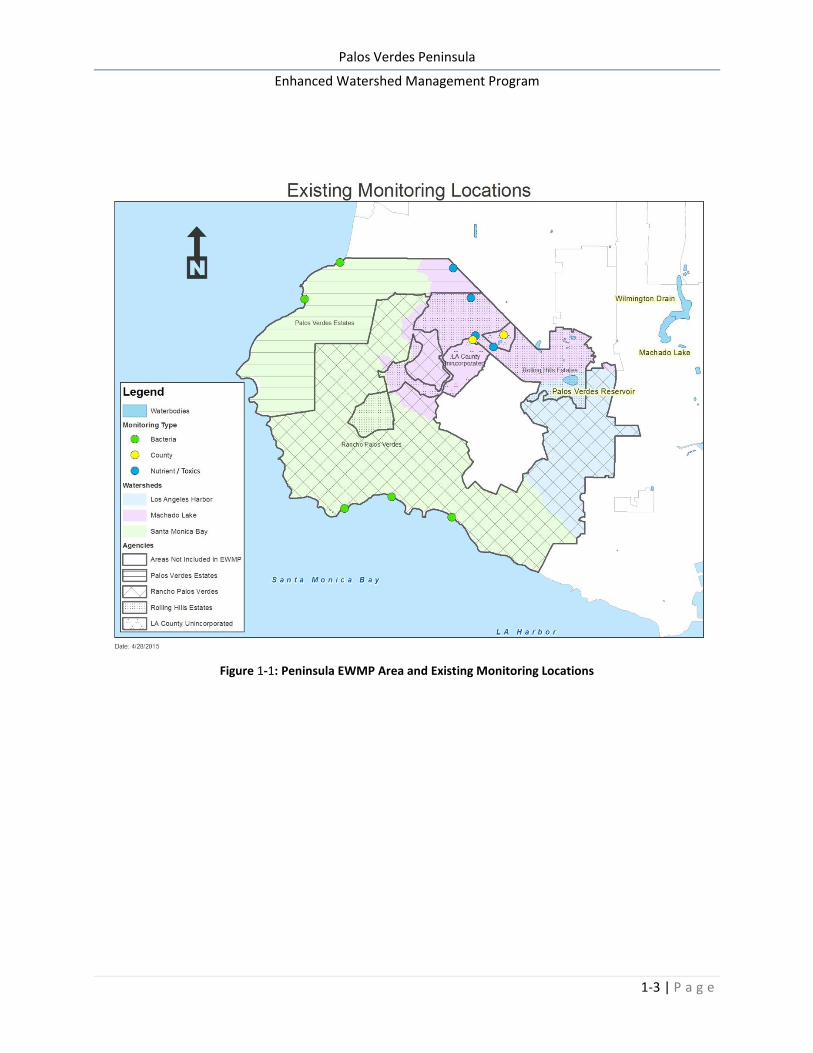
Figure 1-1: Peninsula EWMP Area and Existing Monitoring Locations .................................................................. 1-3 Figure 2-1: Peninsula Watershed Pollutant Venn Diagram. ................................................................................... 2-2 Figure 2-2: Santa Monica Bay Bacteria Monitoring Stations within the Peninsula EWMP area. ......................... 2-13 Figure 2-3: Storm Drains Entering Machado Lake ................................................................................................ 2-19 Figure 2-4: Machado Lake Nutrient TMDL Monitoring Stations .......................................................................... 2-21 Figure 2-5: Machado Lake Monitoring Stations ................................................................................................... 2-21 Figure 2-6: Dominguez Channel, Greater LA, and Long Beach Harbor Waters .................................................... 2-24 Figure 2-7: Ports of LA and LB Water Quality Monitoring Stations ...................................................................... 2-26 Figure 2-8: Peninsula EWMP Area and Existing Monitoring Locations ................................................................ 2-28 Figure 2-9: Unincorporated County Machado Lake monitoring locations. .......................................................... 2-30 Figure 3-1: Peninsula WMG Area Catch Basin Priority Maps 1/3. ......................................................................... 3-7 Figure 3-2: Peninsula WMG Area Catch Basin Priority Maps 2/3. ......................................................................... 3-7 Figure 3-3: Peninsula WMG Area Catch Basin Priority Maps 3/3. ......................................................................... 3-8 Figure 3-4: Palos Verdes Peninsula Land Cover Class ........................................................................................... 3-9 Figure 3-5: Existing, Planned, and Proposed Regional BMPs. .............................................................................. 3-34 Figure 3-6: Casaba Estates Post-Development Design Conditions. ...................................................................... 3-37 Figure 3-7: San Ramon Canyon Project. ............................................................................................................... 3-38 Figure 3-8: Chandler Quarry Project Drainage Area Map .................................................................................... 3-41 Figure 3-9: Chandler Quarry Project Drainage and Water Quality Concept Plan ................................................ 3-42 Figure 3-10: Chandler Quarry Project Infiltration System Concept Design .......................................................... 3-43 Figure 3-11: South Coast Botanic Garden - Potential Regional BMP Opportunities. ........................................... 3-45 Figure 3-12: Canyons Tributary to Botanic Garden .............................................................................................. 3-45 Figure 3-13: Proposed Palos Verdes Landfill Regional BMP Drainage Area. ........................................................ 3-49 Figure 3-14: Proposed Valmonte Regional BMP Drainage Area. ......................................................................... 3-50 Figure 3-15: Proposed Eastview Park Infiltration Project Drainage Area. ............................................................ 3-52 Figure 3-16: Walteria Lake Watershed Arial View................................................................................................ 3-55 Figure 3-17: Torrance Airport Drainage Area. ...................................................................................................... 3-56 Figure 3-18: Conceptual Layout of Torrance Airport Basin .................................................................................. 3-57 Figure 3-19: Bluff Cove ......................................................................................................................................... 3-62 Figure 3-20: Palos Verdes Peninsula Land Conservancy Open Space Preserves .................................................. 3-62 Figure 3-21: RDD 275 – Looking South/Upstream along Crenshaw Boulevard. .................................................. 3-63
LIST OF APPENDICES
Appendix 1 LA County Flood Control District Summary Appendix 2 Minimum Control Measures (MCM) Guidance Documents Appendix 3 Brake Pad Copper Reduction Memo (Draft) Appendix 4 BMP Performance Data Appendix 5 Potential Regional BMP Locations Technical Memorandum Appendix 6 Reasonable Assurance Analysis (RAA) Technical Memorandum Appendix 7 Legal Authority Certifications

DEFINITIONS, ACRONYMS, AND ABBREVIATIONS The following are definitions for terms in this Enhanced Watershed Management Program:
Basin Plan: The Water Quality Control Plan, Los Angeles Region, Basin Plan for the Coastal Watersheds of Los Angeles and Ventura Counties, adopted by the Regional Water Board on June 13, 1994 and subsequent amendments.
Beneficial Uses: The existing or potential uses of receiving waters as designated by the Regional Board in the Basin Plan.
Best Management Practices (BMPs): BMPs are practices or physical devices or systems designed to
prevent or reduce pollutant loading from storm water or non-storm water discharges to receiving
waters, or designed to reduce the volume of storm water or non-storm water discharged to the
receiving water.
Commercial Development: Any development on private land that is not heavy industrial or residential. The category includes, but is not limited to: hospitals, laboratories and other medical facilities, educational institutions, recreational facilities, plant nurseries, car wash facilities; mini-malls and other business complexes, shopping malls, hotels, office buildings, public warehouses and other light industrial complexes.
Commercial Malls: Any development on private land comprised of one or more buildings forming a complex of stores which sells various merchandise, with interconnecting walkways enabling visitors to easily walk from store to store, along with parking area(s). A commercial mall includes, but is not limited to: mini-malls, strip malls, other retail complexes, and enclosed shopping malls or shopping centers.
Disturbed Area: An area that is altered as a result of clearing, grading, and/or excavation.
Dry Weather: Defined as those days with less than 0.1 inch of rainfall and those days occurring more than 3 days after a rain event.
Effluent Limitation: Any restriction imposed on quantities, discharge rates, and concentrations of pollutants, which are discharged from point sources to waters of the U.S. (40 CFR § 122.2).
Environmentally Sensitive Areas (ESAs): An area in which plant or animal life or their habitats are either rare or especially valuable because of their special nature or role in an ecosystem and which would be easily disturbed or degraded by human activities and developments (California Public Resources Code § 30107.5). Areas subject to stormwater mitigation requirements are: areas designated as Significant Ecological Areas by the County of Los Angeles (Los Angeles County Significant Areas Study, Los Angeles County Department of Regional Planning (1976) and amendments); an area designated as a Significant Natural Area by the California Department of Fish and Game’s Significant Natural Areas Program, provided that area has been field verified by the Department of Fish and Game; an area listed in the Basin Plan as supporting the "Rare, Threatened, or Endangered Species (RARE)" beneficial use; and an area identified by a Permittee as environmentally sensitive.
Hillside: Property located in an area with known erosive soil conditions, where the development contemplates grading on any natural slope that is 25% or greater and where grading contemplates cut or fill slopes.
Hydrologic Unit Code (HUC): A standardized watershed classification system in which each hydrologic unit is identified by a unique hydrologic unit code (HUC). The HUC may consist of an eight (8) to twelve (12) digit number. The 8-digit HUC identifies an area based on four levels of classification: region, subregion, hydrologic basin, and hydrologic sub-basin. The Watershed Boundary Dataset includes the 12-digit HUC delineation, which further divides each hydrologic unit into watersheds and sub-watersheds based on scientific information and not administrative boundaries. The Watershed Boundary Dataset is the highest resolution and the most detailed delineation of the watershed boundaries. The mapping precision has been improved to a scale of 1:24,000.
Illicit Connection (IC): Any man-made conveyance that is connected to the storm drain system without a permit, excluding roof drains and other similar type connections. Examples include channels, pipelines, conduits, inlets, or outlets that are connected directly to the storm drain system.
Illicit Discharge (ID): Any discharge into the MS4 or from the MS4 into a receiving water that is prohibited under local, state, or federal statutes, ordinances, codes, or regulations. The term illicit discharge includes any non-storm water discharge, except authorized non-storm water discharges; conditionally exempt non-storm water discharges; and non-storm water discharges resulting from natural flows specifically identified in Part III.A.1.d of the MS4 Permit.
Industrial/Commercial Facility: Any facility involved and/or used in the production, manufacture, storage, transportation, distribution, exchange or sale of goods and/or commodities, and any facility involved and/or used in providing professional and non-professional services. This category of facilities includes, but is not limited to, any facility defined by either the Standard Industrial Classifications (SIC) or the North American Industry Classification System (NAICS). Facility ownership (federal, state, municipal, private) and profit motive of the facility are not factors in this definition.
Industrial Park: A land development that is set aside for industrial development. Industrial parks are usually located close to transport facilities, especially where more than one transport modalities coincide: highways, railroads, airports, and navigable rivers. It includes office parks, which have offices and light industry.
Institutional Controls: Programmatic trash control measures that do not require construction or structural modifications to the MS4. Examples include street sweeping, public education, and clean out of catch basins that discharge to storm drains.
Integrated Pest Management (IPM): An ecosystem-based strategy that focuses on long-term prevention of pests or their damage through a combination of techniques such as biological control, habitat manipulation, modification of cultural practices, and use of resistant varieties.
Low Impact Development (LID): LID consists of building and landscape features designed to retain or filter stormwater runoff.
Low Impact Development (LID) Plan: See “SUSMP” definition.

Maximum Extent Practicable (MEP): In selecting BMPs which will achieve MEP, it is important to remember that municipalities will be responsible to reduce the discharge of pollutants in storm water to the maximum extent practicable. This means choosing effective BMPs, and rejecting applicable BMPs only where other effective BMPs will serve the same purpose, the BMPs would not be technically feasible, or the cost would be prohibitive. The following factors may be useful to consider:
1. Effectiveness: Will the BMP address a pollutant of concern?
2. Regulatory Compliance: Is the BMP in compliance with storm water regulations as well as other environmental regulations?
3. Public acceptance: Does the BMP have public support?
4. Cost: Will the cost of implementing the BMP have a reasonable relationship to the pollution control benefits to be achieved?
5. Technical Feasibility: Is the BMP technically feasible considering soils, geography, water resources, etc.?
After selecting a menu of BMPs, it is of course the responsibility of the discharger to insure that all BMPs are implemented.
National Pollutant Discharge Elimination System (NPDES): The national program for issuing, modifying, revoking and reissuing, terminating, monitoring and enforcing permits, and imposing and enforcing pretreatment requirements, under CWA §307, 402, 318, and 405. The term includes an “approved program.”
Natural Drainage System: A natural drainage system is a drainage system that has not been improved (e.g., channelized or armored). The clearing or dredging of a natural drainage system does not cause the system to be classified as an improved drainage system.
New Development: Land disturbing activities; structural development, including construction or installation of a building or structure, creation of impervious surfaces; and land subdivision.
Non-stormwater Discharge: Any discharge into the MS4 or from the MS4 into a receiving water that is not composed entirely of stormwater.
Nuisance: Anything that meets all of the following requirements: (1) is injurious to health, or is indecent or offensive to the senses, or an obstruction to the free use of property, so as to interfere with the comfortable enjoyment of life or property; (2) affects at the same time an entire community or neighborhood, or any considerable number of persons, although the extent of the annoyance or damage inflicted upon individuals may be unequal.; (3) occurs during, or as a result of, the treatment or disposal of wastes.
Receiving Water: A “water of the United States” into which waste and/or pollutants are or may be discharged.
Receiving Water Limitation: Any applicable numeric or narrative water quality objective or criterion, or limitation to implement the applicable water quality objective or criterion, for the receiving water as
contained in Chapter 3 or 7 of the Water Quality Control Plan for the Los Angeles Region (Basin Plan),
water quality control plans or policies adopted by the State Water Board, or federal regulations,
including but not limited to, 40 CFR § 131.38.

Redevelopment: Land-disturbing activity that results in the creation, addition, or replacement of 5,000 square feet or more of impervious surface area on an already developed site. Redevelopment includes, but is not limited to: the expansion of a building footprint; addition or replacement of a structure; replacement of impervious surface area that is not part of a routine maintenance activity; and land disturbing activities related to structural or impervious surfaces. It does not include routine maintenance to maintain original line and grade, hydraulic capacity, or original purpose of facility, nor does it include emergency construction activities required to immediately protect public health and safety.
Significant Ecological Areas (SEAs): An area that is determined to possess an example of biotic resources that cumulatively represent biological diversity, for the purposes of protecting biotic diversity, as part of the Los Angeles County General Plan.
Areas are designated as SEAs, if they possess one or more of the following criteria:
1. The habitat of rare, endangered, and threatened plant and animal species.
2. Biotic communities, vegetative associations, and habitat of plant and animal species that are either one of a kind, or are restricted in distribution on a regional basis.
3. Biotic communities, vegetative associations, and habitat of plant and animal species that are either one of a kind or are restricted in distribution in Los Angeles County.
4. Habitat that at some point in the life cycle of a species or group of species, serves as a concentrated breeding, feeding, resting, migrating grounds and is limited in availability either regionally or within Los Angeles County.
5. Biotic resources that are of scientific interest because they are either an extreme in physical/geographical limitations, or represent an unusual variation in a population or community.
6. Areas important as game species habitat or as fisheries.
7. Areas that would provide for the preservation of relatively undisturbed examples of natural biotic communities in Los Angeles County.
8. Special areas.
Source Control BMP: Any schedules of activities, prohibitions of practices, maintenance procedures, managerial practices or operational practices that aim to prevent stormwater pollution by reducing the potential for contamination at the source of pollution.
Stormwater: Stormwater runoff, snow melt, runoff, and surface runoff and drainage related to precipitation events [pursuant to 40 CFR § 122.26(b)(13); 55 Fed. Reg. 47990, 47995 (Nov. 16, 1990)].
SUSMP: The Los Angeles Countywide Standard Urban Stormwater Mitigation Plan. The SUSMP shall address the Planning and Land Development conditions and requirements of the MS4 Permit.
Wet Season: The calendar period beginning October 1 through April 15.
Wet Weather: Defined as a day with 0.1 inch or more of rain and 3 days following the rain event.

Acronym/Abbreviation Full Phrase/Definition
µg/L micrograms per Liter
303(d) List California’s Clean Water Act Section 303(d) List
ASBS Areas of Special Biological Significance
Basin Plan Water Quality Control Plan for the Coastal Watersheds of Los Angeles and Ventura Counties
BMP Best Management Practices
CASQA California Stormwater Quality Association
CEQA California Environmental Quality Act
CFR Code of Federal Regulations
CGP The State Board’s Construction General Permit Order No. 2009-0009-DWQ, or as amended.
CIMP The Peninsula Watershed Group Coordinated Integrated Monitoring Program
Cities The Peninsula Watershed Group participating cities, only
County The LACFCD and the LA County DPW
CTR California Toxics Rule
CWA Clean Water Act
CWC California Water Code
DC Development Construction Program
EIR Environmental Impact Report
ELRS Equivalent Load Reduction Strategy
EPA Environmental Protection Agency
ESCP Erosion and Sediment Control Plan
EWMP The Peninsula Watershed Group Enhanced Watershed Management Program
GIS Geographical Information System
gpd gallons per day
HUC Hydrologic Unit Code
ICFP Industrial Commercial Facilities Program
IC/ID Illicit Connection and Illicit Discharge Elimination
IGP The State Board’s Industrial Storm Water General Permit Order No. 2014-0057-DWQ, or as amended.
IPM Integrated Pest Management
LA Load Allocations
LA County DPW Los Angeles County Department of Public Works
LA MS4 Permit The Los Angeles Regional Water Quality Control Board Order No. R4-2012-0175
LACFCD Los Angeles County Flood Control District
LID Low Impact Development
LID Plan Low Impact Development Plan
Peninsula Watershed The area encompassed by the Participating Agencies
MCM Minimum Control Measure

Acronym/Abbreviation Full Phrase/Definition MEP Maximum Extent Practicable
mg/L milligrams per Liter
MGD Million Gallons Per Day
MRP Monitoring and Reporting Program
MS4 Municipal Separate Storm Sewer System
MS4 Permit The Los Angeles Regional Water Quality Control Board Order No. R4-2012-0175
NEPA National Environmental Policy Act
NPDES National Pollutant Discharge Elimination System
NSWD Nonstormwater Discharge
Ocean Plan Water Quality Control Plan for Ocean Waters of California
PAA Public Agency Activities
PAAP Public Agency Activities Program
Participating Agencies The Peninsula Watershed Group participating agencies
PEIR Programmatic Environmental Impact Report
PEP Progressive Enforcement Policy
Permittees The County of Los Angeles and 85 cities within the coastal watersheds of Los Angeles County
PIP Public Information and Participation
PIPP Public Information and Participation Program
PLD Planning and Land Development
PMP Pollutant Minimization Plan
POTW Publicly Owned Treatment Works
QA Quality Assurance
QA/QC Quality Assurance/Quality Control
QSD Qualified SWPPP Developer
QSP Qualified SWPPP Practitioner
RAA Reasonable Assurance Analysis
RAP Reasonable Assurance Program
Regional Board California Regional Water Quality Control Board, Los Angeles Region
RP Responsible Party
RWL Receiving Water Limit
SEA Significant Ecological Area
SIC Standard Industrial Classification
SMARTS State Water Resources Control Board’s Storm Water Multiple Application and Report Tracking System
SQMP Stormwater Quality Management Programs
SSMP Sewer System Management Plan
SSO Sewer Leaks, sanitary sewer overflow
State Board California State Water Resources Control Board

Acronym/Abbreviation Full Phrase/Definition State Listing Policy State Board’s Water Quality Control Policy for Developing California’s Clean
Water Act Section 303(d) List
SUSMP Standard Urban Stormwater Mitigation Plan
SWPPP Stormwater Pollution Prevention Plan
SWQDv Stormwater Quality Design Volume
TAC Technical Advisory Committee
TCM Targeted Control Measure
TMDL Total Maximum Daily Load
TRA Training
TSS Total Suspended Solids
USEPA United States Environmental Protection Agency
WBPC Water Body-Pollutant Combination
WDID Waste Discharge Identification
WLA Waste Load Allocations
WCM Watershed Control Measure
WMG Watershed Management Group
WQBEL Water Quality Based Effluent Limitations
WQO Water Quality Objective
WQP Water Quality Priority
WRP Water Reclamation Plant

Palos Verdes Peninsula
Enhanced Watershed Management Program
1-1 | P a g e
1. INTRODUCTION AND BACKGROUND
1.1. INTRODUCTION
The 2012 Municipal Separate Storm Sewer System Permit1 (MS4 Permit) was adopted on November 8, 2012, by the Los Angeles Regional Water Quality Control Board (Regional Board) and became effective December 28, 2012. The purpose of the MS4 Permit is to protect the beneficial uses of the receiving waters in the Los Angeles County region by regulating municipal stormwater and non-stormwater discharges from the permittees’ MS4s. The Permit allows permittees the flexibility of developing an Enhanced Watershed Management Program (EWMP) to implement the requirements of the Permit. Implementation is to be achieved on a watershed basis through customized strategies, control measures, and BMPs to ensure that discharges from the permittees’ MS4s:
i. Achieve applicable WQBELs, ii. Do not cause or contribute to exceedances of receiving water limitations, and
iii. Do not include non-storm water discharges that are effectively prohibited.
An EWMP further requires multi-benefit regional projects through collaboration among permittees and other partners within participating permittees’ collective jurisdictional area in a WMA.
Following the adoption of the MS4 Permit, the Cities of Palos Verdes Estates, Rancho Palos Verdes, Rolling Hills Estates, along with the County of Los Angeles (Unincorporated County), and Los Angeles County Flood Control District (LACFCD) began to collaborate on the development of an EWMP to address the water quality priorities for the Palos Verdes Peninsula watersheds. This group of Permittees is referred to as the Palos Verdes Peninsula Watershed Management Group (Peninsula WMG). The Peninsula WMG previously submitted a Notice of Intent (NOI) to develop the Peninsula EWMP and an EWMP Work Plan. In addition, the Peninsula WMG has been coordinating with other agencies and watershed management groups in the development of this EWMP, including the City of Los Angeles, the Dominguez Channel EWMP Group, and the Beach Cities EWMP Group.
This Enhanced Watershed Management Program (EWMP) has been developed to implement the requirements of the MS4 Permit on a watershed scale. The goal of these requirements is to reduce the discharge of pollutants from MS4s to the maximum extent practicable.2
1.2. PENINSULA WATERSHED
The geographic scope of the Peninsula EWMP (as shown in Figure 1-1) is comprised of the incorporated Cities of Rancho Palos Verdes, Palos Verdes Estates and Rolling Hills Estates and unincorporated areas of the County of Los Angeles and LACFCD facilities (See Appendix 1 for a description of the LACFCD and its responsibilities within the Peninsula WMG). The City of Rolling Hills is not participating in the Peninsula EWMP; however, the city is participating in the Peninsula WMG Coordinated Integrated Monitoring Program (CIMP).
1California Regional Water Quality Control Board Los Angeles Region. 2012. Order No. R4-2012-0175 NPDES Permit No. CAS004001 Waste Discharge Requirements for Municipal Separate Storm Sewer System (MS4) Discharges within the Coastal Watersheds of Los Angeles County, except those Discharges Originating from the City of Long Beach MS4. 2 Reference: http://www.swrcb.ca.gov/water_issues/programs/stormwater/municipal.shtml

Palos Verdes Peninsula
Enhanced Watershed Management Program
1-2 | P a g e
The Palos Verdes Peninsula is situated in the southwestern portion of Los Angeles County atop the Palos Verdes Hills, which are bounded to the north by the City of Torrance, to the east by the San Pedro area of the City of Los Angeles, and to the south and west by the Pacific Ocean. The Peninsula WMG area is divided into two HUC-12 equivalent watersheds: 1) Santa Monica Bay (SMB) Watershed and 2) the Greater Dominguez Channel Watershed Management Area, which is subdivided into two subwatersheds, the Los Angeles Harbor Subwatershed and the Machado Lake Subwatershed. A change in drainage divides the Peninsula from the northeast to the southwest with the westerly and southwesterly portion draining into Santa Monica Bay and the northeasterly portion draining to Machado Lake and the Los Angeles Harbor subwatersheds. The SMB Watershed accounts for 63% (14.2 square miles) of the total Peninsula WMG area, and includes portions of the cities of Palos Verdes Estates, Rancho Palos Verdes, and Rolling Hills Estates. The Los Angeles Harbor Subwatershed accounts for 15% (3.4 square miles) of the total Peninsula WMG area, and includes portions of the cities of Rancho Palos Verdes and Rolling Hills Estates. The Machado Lake Subwatershed accounts for 22% (4.9 square miles) of the total Peninsula WMG area, and includes portions of the cities of Palos Verdes Estates, Rancho Palos Verdes, Rolling Hills Estates, and the County of Los Angeles. Drainage from the Peninsula WMG agencies is conveyed via natural soft bottom canyons in conjunction with structured storm drain systems. Table 1-1 provides the Peninsula EWMP area identified by watershed and agency, and Figure 1-1 provides a map of the Peninsula EWMP watershed and jurisdictional boundaries, including existing water quality monitoring sites in the Peninsula EWMP area.
Table 1-1: Jurisdictional Areas within Each Peninsula EWMP Watershed
Permittee Rancho Palos Verdes
Palos Verdes Estates
Rolling Hills Estates
County of Los Angeles
Total
Land Area within Santa Monica Bay Watershed (Square Miles)
9.35 4.35 0.46 0 14.2
Land Area within Machado Lake Subwatershed (Square Miles)
1.07 0.39 2.78 0.7 4.9
Land Area within Los Angeles Los Angeles Harbor Subwatershed (Square Miles)
3.02 0 0.34 0 3.4
Total EWMP Area 13.5 4.8 3.6 0.7 22.6
Palos Verdes Peninsula
Enhanced Watershed Management Program
1-3 | P a g e
Figure 1-1: Peninsula EWMP Area and Existing Monitoring Locations

Palos Verdes Peninsula
Enhanced Watershed Management Program
1-4 | P a g e
1.3. WATER QUALITY ISSUES AND THE HISTORY OF WATER QUALITY
REGULATIONS
1.3.1. FEDERAL AND STATE LAW
The Clean Water Act (CWA) establishes the basic structure for regulating discharges of pollutants into the waters of the United States and regulating quality standards for all inland surface waters, estuaries, and coastal waters. The federal Environmental Protection Agency (EPA) is ultimately responsible for implementation of the CWA and its associated regulations. However, the CWA allowed EPA to authorize the NPDES Permit Program to state governments, enabling states to perform many of the permitting, administrative, and enforcement aspects of the NPDES Program. California, like other states, implements the CWA by promulgating its own water quality protection laws and regulations. As long as this authority provides equivalent protections as the federal CWA, EPA can delegate CWA responsibilities to the state while retaining oversight responsibilities. In some cases, California has established requirements that are more stringent than federal requirements.
The 1970 Porter-Cologne Water Quality Control Act granted the California State Water Resources Control Board (SWRCB) and nine California Regional Water Quality Control Boards (Regional Boards) broad powers to protect water quality. This Act and its governing regulations provide the basis for California's implementation of CWA responsibilities. The Los Angeles Regional Water Quality Control Board (Regional Board) is the governing regulatory agency for the Peninsula Watershed.
Section 303(d) of the CWA requires waterbodies not meeting water quality objectives even after all required effluent limitations have been implemented (e.g. through wastewater or stormwater discharge Permit) to be regularly identified. These waters are often referred to as "303(d) listed" or "impaired" waters. Waterbodies that are listed on the 303(d) list typically require development of a Total Maximum Daily Load (TMDL) for the pollutant(s) impairing the use of the water. Development and approval of the 303(d) list is a lengthy state and federal process. A list is not effective until the EPA approves the list. The current EPA-approved 303(d) list for California is the 2010 list.
A TMDL establishes the maximum amount of a pollutant that a waterbody can receive and still meet water quality standards. Depending on the nature of the pollutant, TMDL implementation requires limits on the contributions of pollutants from point sources (waste load allocation), nonpoint sources (load allocation), or both. The Regional Board is responsible for TMDL development in the Peninsula Watershed.
Adoption of a TMDL requires an amendment to the Water Quality Control Plan (known as the Basin Plan) for the Los Angeles Region. The Regional Board's Basin Plan is designed to preserve and enhance water quality and protect the beneficial uses of regional waters. Specifically, the Basin Plan (i) designates beneficial uses for surface and ground waters, (ii) sets narrative and numerical objectives that must be attained or maintained to protect the designated beneficial uses and conform to the state's antidegradation policy, and (iii) describes implementation programs to protect all waters in the Region. The Basin Plan is reviewed and updated as necessary (Regional Board 1994, as amended). Following adoption by the Regional Board, the Basin Plan and subsequent amendments are subject to approval by the State Board, the State Office of Administrative Law (OAL), and the Environmental Protection Agency (EPA).

Palos Verdes Peninsula
Enhanced Watershed Management Program
1-5 | P a g e
1.4. WATER QUALITY REQUIREMENTS
The Regional Board designates "beneficial uses" for waterbodies in the watersheds that it governs and adopts water quality objectives to protect these uses3. In some cases, EPA may also promulgate objectives where it makes a finding that the state's objectives are not protective enough to protect the beneficial use. The nature of the objectives is directly related to the type of beneficial use. For example, the freshwater warm habitat beneficial use protects aquatic organisms resident in warm-water streams. The associated water quality objectives are for those constituents known to affect both the growth and reproduction of aquatic life. These objectives range from physical characteristics such as temperature, dissolved oxygen, and pH to potential toxic constituents including metals and organics. In California, the objectives for metals and a number of organic compounds have been established by the federal EPA rather than the state (California Toxics Rule, 2000). The EPA promulgated numeric water quality criteria for priority toxic pollutants and other water quality standards provisions based on the determination that the numeric criteria were necessary (since the state had been without numeric water quality criteria for many priority toxic pollutants as required by the CWA) to protect human health and the environment. These Federal criteria are legally applicable in the state for inland surface waters, enclosed bays and estuaries for all purposes and programs under the CWA.
1.5. THE ENHANCED WATERSHED MANAGEMENT PROGRAM
1.5.1. REGULATORY FRAMEWORK
In 1972 the National Pollution Discharge Elimination System (NPDES) was created through Section 402 of the Clean Water Act. NPDES prohibits discharges of pollutants from any point source into the nation's waters except as allowed under an NPDES permit, including the MS4 system. The MS4 system includes curbs and gutters, man-made channels, catch basins and storm drains.
The State Water Resources Control Board (State Board) chartered nine Regional Water Quality Control Boards to be responsible for ensuring that counties, cities and other dischargers meet the requirements of the Clean Water Act. To enforce clean water at the local level, municipalities and the County of Los Angeles unincorporated areas are required to obtain a discharge permit from the Regional Board to discharge stormwater, hence the MS4 Permit. The MS4 Permit includes effluent limitations, receiving water limitations, minimum control measures (MCMs), and TMDL provisions, and outlines the process for developing watershed management programs, including the EWMP. The MS4 Permit also incorporates Total Maximum Daily Loads (TMDLs) for impaired surface waters in Los Angeles County. TMDLs represent the amount of a pollutant that can be released into a waterbody to ensure attainment of water quality standards and protection of the waterbody’s beneficial uses.
Development of an EWMP is one of the compliance options outlined in the MS4 Permit to address effluent limitations, receiving water limitations, and TMDLs. The EWMP must also incorporate MCMs, which are programs required to be implemented to address water quality issues.
3 See Regional Board’s 1994 Los Angeles Region Basin Plan, as amended.

Palos Verdes Peninsula
Enhanced Watershed Management Program
1-6 | P a g e
1.5.2. PURPOSE OF THE MS4 PERMIT
MS4s receive stormwater and non-stormwater discharges from various sources, including adjacent municipal MS4s and other public agencies, discharges under NPDES Permit or authorized by the USEPA4, groundwater and natural flow. As the discharges flow over the urban landscape, they may pick up pollutants generated by urban activities, such as metals, bacteria, pesticides, fertilizers and trash. Polluted stormwater and non-stormwater discharges conveyed through the MS4 can ultimately reach receiving waters, resulting in adverse water quality impacts.5
The goal of the MS4 Permit is to reduce the discharge of these pollutants from MS4s to the maximum extent practicable; this may be accomplished through the implementation of WMPs and EWMPs.
1.5.3. WATERSHED MANAGEMENT EMPHASIS
The watershed management approach to permit implementation – described in the current MS4 Permit as a voluntary approach to compliance – is a departure from previous permit structures. The previous MS4 Permit (Order No. 01-182) addressed implementation through jurisdictional Stormwater Quality Management Programs (SQMPs). The Los Angeles countywide SQMP, prepared jointly by the Permittees and approved by the Regional Board in 2001, described the controls to be implemented in order to comply with the special provisions (now referred to as the Minimum Control Measures, or MCMs) of the MS4 Permit. These controls were identical for each Permittee and did not 1) differentiate between watersheds or agencies or 2) target or identify priority pollutants.
The emphasis of the prior SQMP approach was rote program development and implementation. In contrast, management actions under the EWMP are driven by the water quality conditions of the receiving waters and outfalls within the watershed.
The Regional Board outlines several reasons for this shift in emphasis from the previous MS4 Permit. A watershed based structure for permit implementation is consistent with TMDLs developed by the Los Angeles Water Board and USEPA, which are established at a watershed or subwatershed scale and are a prominent part of the MS4 Permit. The participating agencies have already begun collaborating on a watershed scale to develop monitoring and implementation plans required by TMDLs.
1.5.4. WATERSHED MANAGEMENT GOALS AND PRIORITIES
Addressing MS4 discharges on a watershed scale focuses on water quality results by emphasizing the receiving waters and outfalls within the watershed6. The conditions of the receiving waters drive management actions, which in turn focus on the measures to address pollutant contributions from MS4 discharges.
The ultimate goals of the EWMP is to ensure that discharges from the MS4:
1. Achieve applicable Water Quality Based Effluent Limitations (WQBELs) that implement TMDLs, 2. Do not cause or contribute to exceedances of receiving water limitations, 3. Non-stormwater discharges from the MS4 are not a source of pollutants to receiving waters.
4 Including discharges subject to a decision document approved pursuant to the Comprehensive Environmental Response, Compensation, and Liability Act (CERCLA) 5 MS4 Permit Fact Sheet (pg. F7) 6 MS4 compliance is measured at 1) Receiving water monitoring, 2) Stormwater outfall based monitoring, 3) Non-storm water outfall based monitoring, and 4) New Development/Re-development effectiveness tracking.
Palos Verdes Peninsula
Enhanced Watershed Management Program
1-7 | P a g e
This EWMP has also incorporated State agency input from various sources on priority setting and implementation issues. Specific priorities incorporated include, but are not limited to, the following:
The EWMP is consistent with priorities listed in SB 985 and is in accordance with the Storm Water Resource Plan Guidelines7 for all categories with the exception of those which are more applicable to the Peninsula Coordinated Integrated Monitoring Plan and the California Water Service Urban Water Management Plan.
The Peninsula WMG lies within the South Bay subregion of the LA IRWMP and will include its regional projects in the LA IRWMP database.
The Stormwater Strategic Initiative8 identifies prioritization of projects to address issues facing the storm water program. Efforts described within this EWMP have used the same priorities in mind, including, but not limited to optimizing the use of stormwater as a resource and providing consistent and widespread messaging to broaden the understanding of the value of stormwater.
The Strategy to Optimize Resource Management of Storm Water9 identifies four main goals, all of which the EWMP has incorporated: 1) Change the Perspective that Storm Water is a Waste or Hazard, and Treat it as a Valuable Water Resource; 2) Manage Storm Water to Preserve Watershed Processes and Achieve Desired Water Quality and Environmental Outcomes; 3) Implement Efficient and Effective Regulatory Programs; and 4) Collaborate in order to Solve Water Quality and Pollutant Problems with an Array of Regulatory and Non-Regulatory Approaches
The California Water Action Plan10 describes several actions to address the drought in California. The actions which this EWMP has incorporated include: making conservation a California way of life; increasing regional self-reliance and integrated water management across all levels of government; protecting and restoring important ecosystems; managing and preparing for dry periods; expanding water storage capacity and improving groundwater management; and providing safe water for all communities.
The EWMP has incorporated goals in line with the 2010-2012 Strategic Plan11, including:
Collaboration – Advance collaboration to address water quality problems in California; Education/Outreach – Advance the knowledge of stormwater quality professionals and increase
the awareness and knowledge of policy-makers and regulators in California regarding stormwater issues;
Implementation Guidance – Advance the quality of implementation guidance for environmentally beneficial and cost-effective adaptive management approaches to improving stormwater quality in California that emphasize true source control and operational source control over treatment;
Regulatory Review – Advance the development of consistent, proactive, and flexible stormwater policy and regulations consistent with the maximum extent practicable (MEP) standard of pollutant reduction through the incorporation of the latest scientific and economic information to promote the protection of water quality of beneficial uses; and
Scientific Assessment – Advance the understanding of pollutants of concern and their sources, fate, and transport, and the effectiveness of best management practices (BMPs) to control them.
7 Storm Water Resource Plan Guidelines. State Water Resources Control Board. December 15, 2015. 8 Stormwater Strategic Initiative. State Water Resources Control Board. June 25, 2015. 9 Strategy to Optimize Resource Management of Storm Water. State Water Resources Control Board. December 11, 2015. 10 California Water Action Plan. California Natural Resources Agency, California Department of Food and Agriculture, and the California Environmental Protection Agency (Cal/EPA). January 22, 2014. 11 Strategic Plan 2010 – 2012. California Stormwater Quality Association (CASQA). May 2010.

Palos Verdes Peninsula
Enhanced Watershed Management Program
1-8 | P a g e
1.5.5. WATER QUALITY MANAGEMENT APPROACH
The development of this EWMP is a compliance option of the MS4 Permit held by the Permittees. The EWMP includes an evaluation of existing water quality conditions, including characterization of storm water and non-storm water discharges from the MS4 and receiving water quality to support identification and prioritization/sequencing of management actions. At a minimum, water quality priorities within each Watershed Management Area must include achieving applicable water quality based effluent limitations and/or established receiving water limitations.
The MS4 permit requires that this EWMP identifies strategies, control measures, and BMPs to implement through the stormwater management programs on a watershed scale, with the goal of creating an efficient program to focus collective resources on watershed priorities and effectively eliminate the source of pollutants. Customization of the BMPs to be implemented, or required to be implemented, is done with the goal of creating an efficient program to focus individual and collective resources on watershed priorities.
On the basis of the evaluation of existing water quality conditions, waterbody-pollutant combinations are classified into one of the following three categories:
CATEGORY 1 (HIGHEST PRIORITY): Waterbody-pollutant combinations for which water quality based effluent limitations and/or receiving water limitations are included in the MS4 Permit to implement TMDLs.
CATEGORY 2 (HIGH PRIORITY): Pollutants for which data indicate water quality impairment in the receiving water according to the State’s Listing Policy and for which MS4 discharges may be causing or contributing to the impairment.
CATEGORY 3 (MEDIUM PRIORITY): Pollutants for which there are insufficient data to indicate water quality impairment in the receiving water according to the State’s Listing Policy, but which exceed applicable receiving water limitations contained in the MS4 permit and for which MS4 discharges may be causing or contributing to the exceedances.
Sources for the waterbody-pollutant combinations are identified by considering the following:
Review of available data, including historical findings from the participating agencies’ Minimum Control Measure and TMDL programs, watershed model results and other pertinent information, data or studies.
Locations of major MS4 outfalls and major structural controls for stormwater and nonstormwater that discharge to receiving waters.
Other known and suspected sources of pollutants from the MS4 to receiving waters.
Based on the findings of the source assessment, the issues within the watershed are prioritized and sequenced. Factors considered in establishing watershed priorities include:
1. Pollutants for which there are water quality based effluent limitations and/or receiving water limitations with interim or final compliance deadlines within the permit term.
2. Pollutants for which there are water quality based effluent limitations and/or receiving water limitations with interim or final compliance deadlines between October 26, 2012 and December 28, 2017.
3. Pollutants for which data indicate impairment in the receiving water and the findings from the source assessment implicates discharges from the MS4, but no TMDL has been developed.

Palos Verdes Peninsula
Enhanced Watershed Management Program
1-9 | P a g e
In order to achieve the goals of the MS4 Permit, the approach of the EWMP is to:
Prioritize water quality issues resulting from stormwater and non-stormwater discharges from the MS4 to receiving waters,
Identify and implement strategies, control measures, and BMPs that:
o Achieve applicable water quality-based effluent limitations12
o Prevent exceedances of receiving water limitation13
o Prevent non-stormwater discharges that are effectively prohibited14
o Reduce the discharge of pollutants to the maximum extent practicable15
Execute an integrated monitoring program and assessment program16 to determine progress towards achieving applicable limitations and/or action levels
Modify strategies, control measures, and BMPs as necessary based on analysis of monitoring data collected pursuant to the Monitoring and Reporting Program (MRP) to ensure that applicable water quality-based effluent limitations and receiving water limitations and other milestones set forth in the EWMP are achieved in the targeted timeframes.
Provide meaningful input through participation in a permit-wide EWMP technical advisory committee (TAC) that advises and participates in the development of the EWMP from month six through the date of program approval.
The overall approach is adaptive, whereby BMPs will be implemented, their effectiveness monitored and modifications to this EWMP will be made as needed. These modifications will maintain consistency with the assumptions and requirements of applicable TMDL Waste Load Allocations.
1.5.6. CALIFORNIA ENVIRONMENTAL QUALITY ACT
The LACFCD has prepared a Programmatic Environmental Impact Report (PEIR) for all EWMP groups in which they are a part. This PEIR will cover the EWMPs as a whole.
In addition, the stormwater structural controls that will be implemented as a result the EWMP may require discretionary approval subject to review under the California Environmental Quality Act (CEQA). The participating agencies intend to comply with CEQA when implementing structural BMPs. Public agencies responsible for carrying out or approving stormwater structural controls are identified as the lead agency. The environmental review required imposes both procedural and substantive requirements. At a minimum, the lead agency must adhere to the consultation and public notice requirements set forth in the CEQA Guidelines, make determinations whether the proposed stormwater structural control is a “project”, and if so, conduct an initial review of the project and its environmental effects. The lead agency must identify and document the potential environmental impacts of the proposed project in accordance with CEQA, (Public Resources Code Section 21000 et seq.), and the CEQA Guidelines (Title 14 of the California Code of Regulations, Section 15000, et seq.).
12 Pursuant to Part VI.E and Attachments L through R of the Permit pursuant to corresponding compliance schedules 13 Pursuant to Parts V.A and VI.E and Attachments L through R of the Permit 14 Pursuant to Part III.A of the Permit 15 Pursuant to Part IV.A.1 of the Permit 16 Pursuant to Attachment E – MRP, Part IV of the Permit

Palos Verdes Peninsula
Enhanced Watershed Management Program
1-10 | P a g e
Certain classes of projects have been determined not to have significant effect on the environment and are exempt from the provisions of CEQA by statute or category. When a public agency decides that a project is exempt from CEQA, and the public agency approves or determines to carry out the project, the agency may file a Notice of Exemption. For projects deemed not exempt, the lead agency will prepare an Initial Study and decide whether a Negative Declaration will be required for the project, or depending on the potential effects, a further, and more substantial review may be conducted in the form of an Environmental Impact Report (EIR). A project may not be approved as submitted if feasible alternatives or Mitigation Measures are not able to substantially lessen the significant environmental effects of the project. Moreover, environmental review must include provisions for wide public involvement, formal and informal, in order to receive and evaluate public reactions to environmental issues, and when deciding the matter, the lead agency must consider all comments it receives (Cal. Pub. Res. Code § 21091(d)(1); 14 CCR § 15074(b)). The lead agency will use the EIR in determining the environmental effects of the proposed storm water treatment control project, and whether or not to approve the proposed project. If the proposed project is approved, all conditions and mitigations made in the adopted EIR will become part of any subsequent actions taken by the lead agency. The EIR will also be used by permitting agencies, funding agencies and the public to support proposed project decisions.
The National Environmental Policy Act (NEPA) comes into play less often than CEQA, but may be included for storm water treatment control projects involving federal funding. A joint NEPA and CEQA review process is encouraged to improve coordination and avoid redundancies. Like CEQA, NEPA process provides opportunities to address issues related to proposed projects early in the planning stages. NEPA was codified under Title 42 of the United States Code sections 4331 et seq. (42 U.S.C. 4331 et seq.).
1.6. REASONABLE ASSURANCE ANALYSIS AND WATERSHED CONTROL
MEASURES
As part of the EWMP plan, a Reasonable Assurance Analysis (RAA) is conducted on a watershed level. The RAA consists of an assessment, through quantitative analysis or modeling, to demonstrate that the activities and control measures (i.e. BMPs) identified in the Watershed Control Measures section of the EWMP are performed to demonstrate that applicable water quality based effluent limitations and/or receiving water limitations with compliance deadlines during the permit term will be achieved. Watershed Control Measures are subdivided into 1) Minimum Control Measures, 2) Non-Stormwater Discharge Measures 3) TMDL Control Measures and 4) other control measures.
Schedules are developed for strategies, control measures and BMPs to be implemented by each individual Permittee within its jurisdiction and for those that will be implemented by multiple Permittees on a watershed scale. The schedules will measure progress every two years during the permit term and incorporate:
1) Compliance deadlines occurring within the permit term for all applicable interim and/or final water quality based effluent limitations and/or receiving water limitations to implement TMDLs,
2) Interim deadlines and numeric milestones within the permit term for any applicable final water quality based effluent limitation and/or receiving water limitation to implement TMDLs, where deadlines within the permit term were not otherwise specified, and
3) Watershed priorities related to addressing exceedances of receiving water limitations.

Palos Verdes Peninsula
Enhanced Watershed Management Program
1-11 | P a g e
1.7. ADAPTIVE MANAGEMENT
An adaptive management process will be implemented every two years from the date of program approval, adapting the EWMP to become more effective, based on, but not limited to the following:
1. Progress toward achieving the outcome of improved water quality in MS4 discharges and receiving waters through implementation of the watershed control measures,
2. Progress toward achieving interim and/or final water quality based effluent limitations and/or receiving water limitations, or other numeric milestones where specified, according to established compliance schedules,
3. Achievement of interim milestones;
4. Reopening of TMDLs;
5. Re-evaluation of the highest water quality priorities identified for the Watershed Management Area based on more recent water quality data for discharges from the MS4 and the receiving water(s) and a reassessment of sources of pollutants in MS4 discharges,
6. Availability of new information and data from sources other than the Permittees’ monitoring program(s) within the Watershed Management Area that informs the effectiveness of the actions implemented by the Permittees,
7. Regional Water Board recommendations; and
8. Recommendations for modifications to the EWMP solicited through a public participation process
Based on the results of the adaptive management process, modifications necessary to improve the effectiveness of the EWMP will be reported in the Annual Report, and as part of the Report of Waste Discharge (ROWD). Any necessary modifications to the EWMP will be implemented upon acceptance by the Regional Water Board Executive Officer within 60 days of submittal if the Regional Water Board Executive Officer expresses no objections.

Palos Verdes Peninsula
Enhanced Watershed Management Program
2-1 | P a g e
2. IDENTIFICATION OF WATER QUALITY PRIORITIES
2.1. WATERBODY POLLUTANT CLASSIFICATION
One of the goals of this Enhanced Watershed Management Program (EWMP) is to identify and address water quality priorities within the Palos Verdes Peninsula (Peninsula) Watershed. In order to begin prioritizing water quality issues within the Peninsula Watershed, an evaluation of existing water quality conditions, including characterization of stormwater and nonstormwater discharges from the Municipal Separate Storm Sewer System (MS4) and receiving waters has been completed per section VI.C.5.a of the MS4 Permit.
The existing water quality conditions of the Peninsula Watershed were used to classify pollutants into three categories each containing specific subcategories. These categories form the basis for identifying watershed priorities, which include, at a minimum, achieving applicable water quality-based effluent limitations and/or receiving water limitations established pursuant to TMDLs. The three categories and their subcategories are described below:
CATEGORY 1: Waterbody-pollutant combinations for which water quality-based effluent limitations and/or receiving water limitations are established in Part VI.E TMDL Provisions and Attachments L through R of the MS4 Permit.
CATEGORY 1A: Final deadlines within Permit term (after approval of EWMP1 & prior to December 28, 2017)
CATEGORY 1B: Interim deadlines within Permit term (after approval of EWMP2 & prior to December 28, 2017)
CATEGORY 1C: Final deadlines between December 29, 2017 - December 28, 2022
CATEGORY 1D: Interim deadlines between December 29, 2017 - December 28, 2022
CATEGORY 1E: Interim & final deadlines after December 28, 2022
CATEGORY 1F: Past final deadlines (final deadlines due prior to approval of EWMP)
CATEGORY 1G: USEPA established TMDLs with no implementation schedule
CATEGORY 2: Pollutants for which data indicate water quality impairment in the receiving water according to the State Board’s Water Quality Control Policy for Developing California’s Clean Water Act Section 303(d) List (State Listing Policy) and for which MS4 discharges may be causing or contributing to the impairment.
CATEGORY 2A: Non-legacy pollutants
CATEGORY 2B: Bacterial indicators
CATEGORY 2C: Legacy pollutants
CATEGORY 2D: Water quality indicators
1 Upon approval and no later than April 28, 2016. 2 Ibid.

Palos Verdes Peninsula
Enhanced Watershed Management Program
2-2 | P a g e
CATEGORY 3: Pollutants for which there are insufficient data to indicate water quality impairment in the receiving water according to the State’s Listing Policy, but which exceed applicable receiving water limitations contained in this Order and for which MS4 discharges may be causing or contributing to the exceedance.
CATEGORY 3A: Non-legacy pollutants
CATEGORY 3B: Bacterial indicators
CATEGORY 3C: Legacy pollutants
CATEGORY 3D: Water quality indicators
The Peninsula Watershed encompasses portions of the drainage area tributary to Santa Monica Bay, Machado Lake, Wilmington Drain, and the Greater Los Angeles Harbor. The pollutants for which the Peninsula Watershed is listed as impaired for are shown on Figure 2-1.
Figure 2-1: Peninsula Watershed Pollutant Venn Diagram.

Palos Verdes Peninsula
Enhanced Watershed Management Program
2-3 | P a g e
The waterbody-pollutant categories for the Peninsula EWMP Watersheds are summarized below. Unless otherwise indicated, all pollutants are associated with the water column.
Category 1A
Trash– Machado Lake
Category 1B
Marine Debris (Trash and Plastic) – Santa Monica Bay
Category 1C
PCBs (water, sediment, fish tissue)– Machado Lake
DDT (water, sediment, fish tissue)– Machado Lake
Chlordane (water, sediment, fish tissue)– Machado Lake
Dieldrin (water, sediment, fish tissue)– Machado Lake
Odor – Machado Lake
Eutrophic Conditions – Machado Lake
Algae – Machado Lake
Nitrogen- Machado Lake
Phosphorus – Machado Lake
Ammonia- Machado Lake
Chlorophyll a- Machado Lake
Dissolved Oxygen- Machado Lake
Category 1E
Copper(water and sediment)– Inner Harbor, Outer Harbor, Cabrillo Marina, Fish Harbor
Lead (water and sediment)– Inner Harbor, Outer Harbor, Cabrillo Marina, Fish Harbor
Mercury (water and sediment)– Fish Harbor
Zinc (water and sediment)– Inner Harbor, Outer Harbor, Cabrillo Marina, Fish Harbor
PAHs–Inner Harbor, Outer Harbor, Cabrillo Marina, Fish Harbor o Benzo(a)pyrene (water and sediment) o Chrysene (water and sediment) o Benzo[a]anthracene (water and sediment) o Dibenz[a,h]anthracene (water and sediment) o Phenanthrene (water and sediment) o Pyrene (water and sediment)
DDT (water, sediment, fish tissue)– Inner Harbor, Fish Harbor, Cabrillo Marina, Outer Harbor
PCBs(water, sediment, fish tissue)– Inner Harbor, Fish Harbor, Cabrillo Marina, Outer Harbor
Chlordane (water and sediment)– Fish Harbor
Category 1F
Bacteria (Coliform & Enterococcus) – Santa Monica Bay o Dry and Wet
Category 1G (USEPA Established)
DDT (water, sediment, fish tissue) – Santa Monica Bay
PCBs (water, sediment, fish tissue) – Santa Monica Bay
Category 2A
Copper– Wilmington Drain
Lead –Wilmington Drain

Palos Verdes Peninsula
Enhanced Watershed Management Program
2-4 | P a g e
Category 2B
Coliform Bacteria – Wilmington Drain
Category 2C
Chem A (fish tissue) – Machado Lake
Pesticides–Palos Verdes Shoreline Park
Category 2D
Sediment Toxicity (sediment)– Santa Monica Bay Nearshore/Offshore
The majority of data analyzed during the waterbody-pollutant categorization was collected pursuant to a TMDL (see Section 2.2: Water Quality Characterization below), and no mass emissions sampling stations exist within the Peninsula EWMP area. Therefore, most of the priority pollutants fall into the Category 1: Highest Priority classification. These pollutants will be considered with the Highest Priority within the Peninsula EWMP when determining control measures to be implemented in each watershed.
Category 2: High Priority pollutants were obtained from the State’s 303(d) List, and include five listings which are either being addressed by a TMDL or were listed in error. Section 2.2.2: Summary of Existing 303(d) Listings below describes the status of these listings. Category 2 pollutants will be considered with a High Priority within the Peninsula EWMP when determining control measures to be implemented.
There were no Category 3: Medium Priority pollutants identified during the Waterbody Pollutant Categorization; however, monitoring conducted under the Coordinated Integrated Monitoring Plan (CIMP) will be used to identify if there are additional pollutants of concern within the Peninsula EWMP watersheds.
Table 2-1 summarizes the waterbody pollutant combinations for the Peninsula Watershed Group.

Palos Verdes Peninsula
Enhanced Watershed Management Program
2-5 | P a g e
Table 2-1: Waterbody/Pollutant Classifications for the Peninsula Watershed Group.
Category Pollutant Waterbody
SMB(a) ML(b) WD(c) IH(d) OH(e) CM(f) FH(g) SP(h)
1 Trash x Marine Debris x PCBs (water, sediment, fish tissue) x x x x x x DDT (water, sediment, fish tissue) x x x x x x Chlordane (water, sediment, fish tissue) x x Dieldrin (water, sediment, fish tissue) x Odor x Eutrophic Conditions x Algae x Nitrogen x Phosphorus x Ammonia x Chlorophyll a x Dissolved Oxygen x Copper(water and sediment) x x x x Lead (water and sediment) x x x x Mercury (water and sediment) x Zinc (water and sediment) x x x x PAHs x x x x Bacteria (Coliform & Enterococcus) x
2 Copper x Lead x Coliform Bacteria x Chem A (fish tissue) x Pesticides x Sediment Toxicity (sediment) x
3 None Identified
(a) Santa Monica Bay (b) Machado Lake (c) Wilmington Drain (d) Inner Harbor (e) Outer Harbor (f) Cabrillo Marina (g) Fish Harbor (h) Palos Verdes Shoreline Park
Palos Verdes Peninsula
Enhanced Watershed Management Program
2-6 | P a g e
2.2. WATER QUALITY CHARACTERIZATION
In order to characterize existing water quality conditions in the Peninsula EWMP watersheds, and to identify pollutants of concern for prioritization per section VI.C.5.a.ii of the MS4 Permit, available data from TMDLs, the 303(d) list, and available monitoring data collected during the previous ten years were analyzed. The following source documents were utilized during the water quality characterization:
Basin Plan Amendments o Santa Monica Bay Bacteria Dry and Wet Weather TMDLs o Santa Monica Bay Marine Debris TMDL o Santa Monica Bay DDT and PCBs TMDL o Machado Lake Trash TMDL o Machado Lake Pesticides and PCBs TMDL o Machado Lake Nutrient TMDL o Long Beach and Greater Los Angeles Harbor Toxics TMDL3
Monitoring Reports and Data o Port of Los Angeles Ambient Water Quality Monitoring Data (2005-2008) o Southern California Coastal Water Research Project (SCCWRP) Bight Study (2008) o City of Los Angeles Machado Lake Nutrient TMDL Monitoring Data (2011-2012) o County of Los Angeles Machado Lake Nutrient TMDL Monitoring Data (2012) o Palos Verdes Peninsula Coordinated Machado Lake Nutrient TMDL Monitoring Data
(2011-2012) o Los Angeles County Sanitation Districts Santa Monica Bay Bacteria TMDL Monitoring Data
(2003-2013) o Los Angeles County 1994-2000 Integrated Receiving Water Impacts Report
2.2.1. SUMMARY OF EXISTING TMDLS AND DEADLINES
TMDLs assign load allocations (LAs) and waste load allocations (WLAs) to dischargers of a pollutant to ensure that the total amount of that pollutant entering a receiving waterbody will not impair its beneficial uses. The Regional Board is required to incorporate compliance schedules into TMDLs. Applicable TMDL compliance dates were used to identify and classify Peninsula WMG pollutants as Category 1: Highest Priority Pollutants (see Section 2.2: Waterbody Pollutant Characterization). Table 2-2 shows existing TMDLs applicable to the Peninsula EWMP and Table 2-3 shows existing TMDL interim and final compliance dates.
3 As recognized by the footnote in Attachment K-4 of the MS4 Permit, the Peninsula WMG members have entered into an Amended Consent Decree with the United States and the State of California, including the Regional Board, pursuant to which the Regional Board has released the Peninsula WMG members from responsibility for Toxic pollutants in the Dominguez Channel and the Greater Los Angeles and Long Beach Harbors. Accordingly, no inference should be drawn from the submission of this EWMP Work Plan or from any action or implementation taken pursuant to it that the Peninsula WMG has waived any rights under the Amended Consent Decree.

Palos Verdes Peninsula
Enhanced Watershed Management Program
2-7 | P a g e
Table 2-2: TMDLs Applicable to the Peninsula EWMP
TMDL Regional Board Resolution Number
Effective Date and/or Environmental Protection Agency (EPA) Approval Date
Santa Monica Bay Beaches Wet Weather Bacteria TMDL – Group 7
2002-022 Amended by R12-007
July 15, 2003 R12-007 effective July 2, 2014
Santa Monica Bay Beaches Dry Weather Bacteria TMDL – Group 7
2002-004 Amended by R12-007
July 15, 2003 R12-007 effective July 2, 2014
Santa Monica Bay Nearshore and Offshore Debris TMDL
R10-010 March 20, 2012
Machado Lake Trash TMDL 2007-006 March 6, 2008
Machado Lake Nutrient TMDL 2008-006 March 11, 2009 Machado Lake Pesticides and PCBs (Toxics) TMDL R10-008 March 20, 2012
Dominguez Channel and Greater Los Angeles and Long Beach Harbor Waters Toxic Pollutants TMDL
R11-008 March 23, 2012
Santa Monica Bay TMDL for DDTs and PCBs EPA Established March 26, 2012

Palos Verdes Peninsula
Enhanced Watershed Management Program
2-8 | P a g e
Table 2-3: TMDL Compliance Dates Applicable to the Peninsula EWMP
TMDL Segments Constituents Compliance Goal Weather Condition
Compliance Dates and Compliance Milestones
2012 2013 2014 2015 2016 2017* 2018 2019 2020 2032
Santa Monica Bay Beaches Bacteria
Abalone Cove Bluff Cove
Inspiration Point Long Point
Malaga Cove Portuguese Bend
Total Coliform Fecal Coliform Enterococcus
Compliance with Total Allowable
Exceedance Days
Winter Dry
Pre 2012
Final
Summer Dry
Pre 2012
Final
Wet Pre 2013
Final
Santa Monica Bay Nearshore and Offshore Debris
All Trash
Plastic Pellets % Reduction in
Trash from Baseline Wet and Dry
3/20 3/20 3/20 3/20 3/20
20% 40% 60% 80% 100%
Santa Monica Bay DDT and PCBs
Abalone Cove Bluff Cove
Inspiration Point Long Point
Malaga Cove Portuguese Bend
DDT PCBs
Meet WLAs Wet and Dry USEPA Established TMDL – No Implementation Schedule
Machado Lake Trash All Trash % Reduction in
Trash from Baseline Wet and Dry
3/6 3/6 3/6 3/6 3/6
20% 40% 60% 80% 100%
Machado Lake Pesticides and PCBs
All
Chlordane Dieldrin
PCBs DDT
Meet WLAs Wet and Dry
9/30
Final
Machado Lake Nutrient All
Algae Total Nitrogen
Total Phosphorus Ammonia
Chlorophyll a Dissolved Oxygen
Odor
Meet WLA Wet and Dry
3/11 9/11
Interim Final
Long Beach and Los Angeles Harbor Toxics
Inner Harbor Fish Harbor
Cabrillo Marina Outer Harbor
DDT PCBs
Copper Lead Zinc
Mercury PAHs
Chlordane
Meet WLA Wet and Dry
3/23 3/23
Interim Final
*Bold-italic font indicates the end of the MS4 Permit term
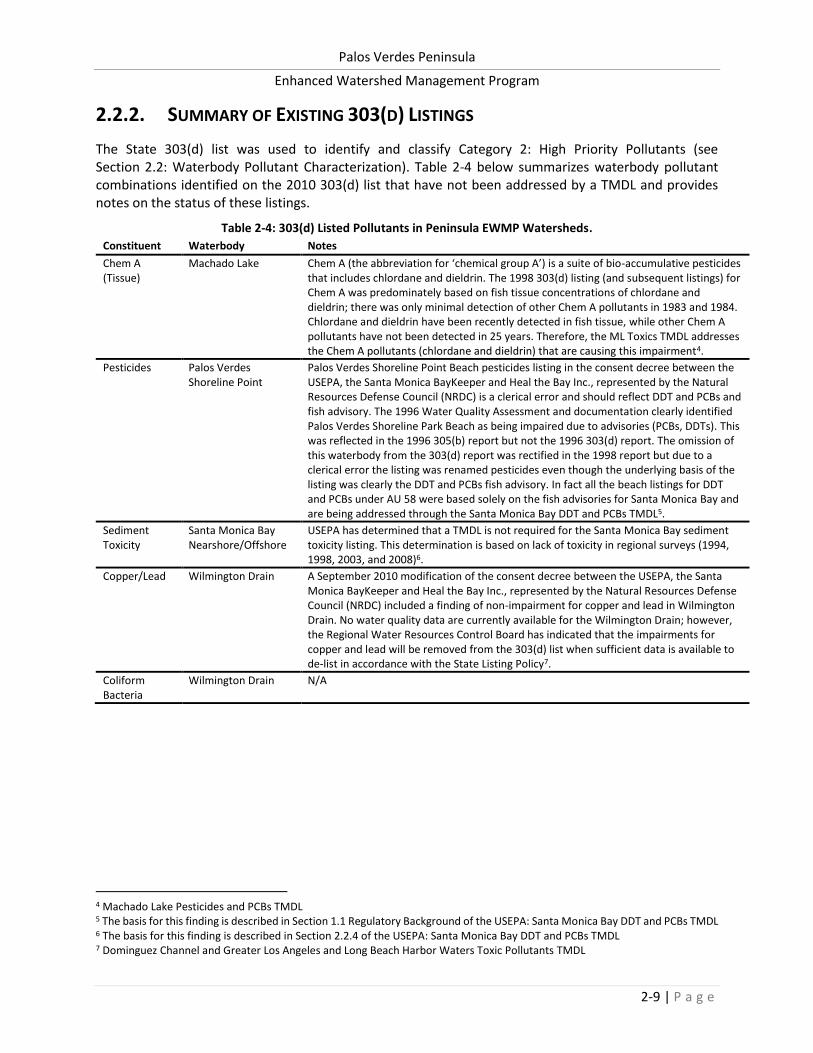
Palos Verdes Peninsula
Enhanced Watershed Management Program
2-9 | P a g e
2.2.2. SUMMARY OF EXISTING 303(D) LISTINGS
The State 303(d) list was used to identify and classify Category 2: High Priority Pollutants (see Section 2.2: Waterbody Pollutant Characterization). Table 2-4 below summarizes waterbody pollutant combinations identified on the 2010 303(d) list that have not been addressed by a TMDL and provides notes on the status of these listings.
Table 2-4: 303(d) Listed Pollutants in Peninsula EWMP Watersheds.
Constituent Waterbody Notes
Chem A (Tissue)
Machado Lake Chem A (the abbreviation for ‘chemical group A’) is a suite of bio-accumulative pesticides that includes chlordane and dieldrin. The 1998 303(d) listing (and subsequent listings) for Chem A was predominately based on fish tissue concentrations of chlordane and dieldrin; there was only minimal detection of other Chem A pollutants in 1983 and 1984. Chlordane and dieldrin have been recently detected in fish tissue, while other Chem A pollutants have not been detected in 25 years. Therefore, the ML Toxics TMDL addresses the Chem A pollutants (chlordane and dieldrin) that are causing this impairment4.
Pesticides Palos Verdes Shoreline Point
Palos Verdes Shoreline Point Beach pesticides listing in the consent decree between the USEPA, the Santa Monica BayKeeper and Heal the Bay Inc., represented by the Natural Resources Defense Council (NRDC) is a clerical error and should reflect DDT and PCBs and fish advisory. The 1996 Water Quality Assessment and documentation clearly identified Palos Verdes Shoreline Park Beach as being impaired due to advisories (PCBs, DDTs). This was reflected in the 1996 305(b) report but not the 1996 303(d) report. The omission of this waterbody from the 303(d) report was rectified in the 1998 report but due to a clerical error the listing was renamed pesticides even though the underlying basis of the listing was clearly the DDT and PCBs fish advisory. In fact all the beach listings for DDT and PCBs under AU 58 were based solely on the fish advisories for Santa Monica Bay and are being addressed through the Santa Monica Bay DDT and PCBs TMDL5.
Sediment Toxicity
Santa Monica Bay Nearshore/Offshore
USEPA has determined that a TMDL is not required for the Santa Monica Bay sediment toxicity listing. This determination is based on lack of toxicity in regional surveys (1994, 1998, 2003, and 2008)6.
Copper/Lead Wilmington Drain A September 2010 modification of the consent decree between the USEPA, the Santa Monica BayKeeper and Heal the Bay Inc., represented by the Natural Resources Defense Council (NRDC) included a finding of non-impairment for copper and lead in Wilmington Drain. No water quality data are currently available for the Wilmington Drain; however, the Regional Water Resources Control Board has indicated that the impairments for copper and lead will be removed from the 303(d) list when sufficient data is available to de-list in accordance with the State Listing Policy7.
Coliform Bacteria
Wilmington Drain N/A
4 Machado Lake Pesticides and PCBs TMDL 5 The basis for this finding is described in Section 1.1 Regulatory Background of the USEPA: Santa Monica Bay DDT and PCBs TMDL 6 The basis for this finding is described in Section 2.2.4 of the USEPA: Santa Monica Bay DDT and PCBs TMDL 7 Dominguez Channel and Greater Los Angeles and Long Beach Harbor Waters Toxic Pollutants TMDL

Palos Verdes Peninsula
Enhanced Watershed Management Program
2-10 | P a g e
2.2.3. RECEIVING WATER CHARACTERIZATION
The Peninsula WMG area drains to three subwatersheds. Existing water quality was evaluated for each of these subwatersheds. In order to characterize the receiving waters to which the Peninsula WMG drains, available monitoring data from the past ten years was analyzed. This section is divided by subwatershed, with a summary of each receiving waterbody’s existing water quality.
Since recent receiving water monitoring data are not currently available from within the Peninsula EWMP Area for pollutants not already categorized as Category 1 or 2, there were no Category 3 (Medium Priority) pollutants identified during the Waterbody Pollutant Categorization; however, monitoring conducted under the Coordinated Integrated Monitoring Plan (CIMP) will be used to identify if there are additional pollutants of concern within the Peninsula EWMP watersheds.
The beneficial uses of the EWMP WMG receiving waters as designated in the Basin Plan are summarized in Table 2-5. The beneficial use acronyms used below are defined as follows:
MUN (Municipal and Domestic Supply): Uses of water for community, military, or individual water supply systems including, but not limited to, drinking water supply.
IND (Industrial Service Supply): Uses of water for industrial activities that do not depend primarily on water quality including, but not limited to, mining, cooling water supply, hydraulic conveyance, gravel washing, fire protection, or oil well re-pressurization.
NAV (Navigation): Uses of water for shipping, travel, or other transportation by private, military, or commercial vessels.
REC1 (Water Contact Recreation): Uses of water for recreational activities involving body contact with water, where ingestion of water is reasonably possible. These uses include, but are not limited to, swimming, wading, water-skiing, skin and scuba diving, surfing, white water activities, fishing, or use of natural hot springs.
REC2 (Non-Contact Water Recreation): Uses of water for recreational activities involving proximity to water, but not normally involving body contact with water, where ingestion of water is reasonably possible. These uses include, but are not limited to, picnicking, sunbathing, hiking, beachcombing, camping, boating, tidepool and marine life study, hunting, sightseeing, or aesthetic enjoyment in conjunction with the above activities.
COMM (Commercial and Sport Fishing): Uses of water for commercial or recreational collection of fish, shellfish, or other organisms including, but not limited to, uses involving organisms intended for human consumption or bait purposes. MAR (Marine Habitat): Uses of water that support marine ecosystems including, but not limited to, preservation or enhancement of marine habitats, vegetation such as kelp, fish, shellfish, or wildlife (e.g., marine mammals, shorebirds).
WILD (Wildlife Habitat): Uses of water that support terrestrial ecosystems including, but not limited to, preservation and enhancement of terrestrial habitats, vegetation, wildlife (e.g., mammals, birds, reptiles, amphibians, invertebrates), or wildlife water and food sources.
BIOL (Preservation of Biological Habitats): Uses of water that support designated areas or habitats, such as Areas of Special Biological Significance (ASBS), established refuges, parks, sanctuaries, ecological reserves, or other areas where the preservation or enhancement of natural resources requires special protection.

Palos Verdes Peninsula
Enhanced Watershed Management Program
2-11 | P a g e
RARE (Rare, Threatened, or Endangered Species): Uses of water that support habitats necessary, at least in part, for the survival and successful maintenance of plant or animal species established under state or federal law as rare, threatened, or endangered.
MIGR (Migration of Aquatic Organisms): Uses of water that support habitats necessary for migration, acclimatization between fresh and salt water, or other temporary activities by aquatic organisms, such as anadromous fish.
SPWN (Spawning, Reproduction, and/or Early Development): Uses of water that support high quality aquatic habitats suitable for reproduction and early development of fish.
SHELL (Shellfish Harvesting): Uses of water that support habitats suitable for the collection of filter-feeding shellfish (e.g., clams, oysters, and mussels) for human consumption, commercial, or sports purposes.
WARM (Warm Freshwater Habitat): Uses of water that support warm water ecosystems including, but not limited to, preservation or enhancement of aquatic habitats, vegetation, fish, or wildlife, including invertebrates.
WET (Wetland Habitat): Uses of water that support wetland ecosystems, including, but not limited to, preservation or enhancement of wetland habitats, vegetation, fish, shellfish, or wildlife, and other unique wetland functions which enhance water quality, such as providing flood and erosion control, stream bank stabilization, and filtration and purification of naturally occurring contaminants.
Table 2-5: Peninsula EWMP Area Water Bodies and Beneficial Uses Designated in the Basin Plan
Water Body
MU
N
IND
GW
R
NA
V
CO
MM
REC
1
REC
2
WA
RM
MA
R
WIL
D
BIO
L
RA
RE
MIG
R
SPW
N
SHEL
L
WET
b
Los Angeles County Coastal Nearshore Zone E E E P E E E Ean Ee Ef Ef Ear
Los Angeles County Coastal Offshore Zone E E E E E E E Ee Ef Ef E Santa Monica Bay Nearshore^ E E E E E E E E Ee Ef Ef E
Machado Lake P* E E E E E E Coastal Streams of Palos Verdes P* I I E E
Canyon Streams of Palos Verdes P* I I E Et
Point Vicente Beach8 E E E E E E P E Los Angeles/Long Beach Inner Harbor E E E E E E Ee P
Los Angeles/Long Beach Fish Harbor E E E E E E E P
Los Angeles/Long Beach Outer Harbor E E E E E E P
E - Existing beneficial use P - Potential beneficial use I - Intermittent beneficial use * - Asterisked MUN designations are designated under SB 88-63 and RB 89-03. Some designations may be considered for exemption
at a later date. b - Water bodies designated as WET may have wetlands habitat associated with only a portion of the water body. Any regulatory
action would require a detailed analysis of the area. ^ - Nearshore is defined as the zone bounded by the shoreline or the 30-foot depth contours, whichever is further from the shoreline.
Longshore extent is from Rincon Creek to the San Gabriel River Estuary. e - One or more rare species utilizes all ocean, bays, estuaries, and coastal wetlands for foraging and/or nesting. f - Aquatic organisms utilize all bays, estuaries, lagoons, and coastal wetlands, to a certain extent, for spawning and early
development. This may include migration into areas which are heavily influenced by freshwater inputs. t - Rare applies only to Agua Magna canyon and Sepluveda Canyon areas. an - Areas of Special Biological Significance (along coast from Latigo Point to Laguna Point) and Big Sycamore Canyon and Abalone
Cove Ecological Reserves and Point Fermin Marine Life Refuge. ar - Areas exhibiting large shellfish populations include Malibu, Point Dume, Point Fermin, White Point and Zuma Beach.
8 Listed as Port Vicente Beach in the Basin Plan.
Palos Verdes Peninsula
Enhanced Watershed Management Program
2-12 | P a g e
SANTA MONICA BAY
The Cities of Rancho Palos Verdes, Rolling Hills, Rolling Hills Estates and Palos Verdes Peninsula have areas which drain directly to Santa Monica Bay. The portion of the Peninsula WMG which drains to Santa Monica Bay consists of approximately 14 square miles, which is about 3.4% of the Santa Monica Bay Watershed (414 sq. mi.). The Santa Monica Bay is impaired for DDT, PCBs, marine debris, and bacteria.
BACTERIA
The Santa Monica Bay Beaches (SMB Beaches) were designated as impaired due to coliform bacteria and included on California’s 1998 Clean Water Act (CWA) 303(d) list of impaired waters. The Regional Board issued the SMB Beaches Bacteria TMDLs (for wet and dry weather), which both became effective on July 15, 2003. To meet the requirements of these TMDLs, a SMB Beaches Bacteria TMDLs Coordinated Shoreline Monitoring Plan (CSMP) was developed by a committee of responsible agencies, including representatives from the Peninsula WMG.
Since 2003, five CSMP sites have been sampled for indicator bacteria along the Palos Verdes Peninsula shoreline by the Los Angeles County Sanitation District (LACSD). The five CSMP sites include SMB 7-1 through 7-5 and are shown on Figure 2-2.
The TMDLs establish multi-part numeric targets based on three bacteriological parameters: Total coliform density, fecal coliform density and enterococcus density, measured in MPN/100mL. Since 2005, each site has been monitored on a weekly basis unless there is an exceedance event. On the second day following an exceedance of the water quality objectives for one or more of the bacterial parameters, an additional sample is taken at the site with the exceedance (Table 2-6). To implement the single sample bacteria objectives, and to set waste load allocations (WLAs) based on the single sample targets, the Regional Board set an allowable number of exceedance days at each shoreline monitoring site. In addition, the TMDLs divide the calendar year into three separate periods for compliance purposes, each with specific requirements. The three compliance periods are as follows:
Summer dry-weather (April 1 – October 31),
Winter dry weather (November 1 – March 31), and
Wet weather (Year-round)
Table 2-6 shows the single sample water quality targets for the three indicator bacteria used to determine compliance, and Table 2-7 presents the allowable number of exceedance days at each monitoring location along the Peninsula WMG shoreline. Data collected from the CSMP are summarized in Table 2-8 and Table 2-9 below. Although there are some exceedances above the allowable exceedance days, they are infrequent (in most cases less than 3 out of 12 years have exceedance days above the allowable limit). In addition, when beach investigations have been conducted, there is no data to indicate these exceedances were caused by contributions from the MS4.

Palos Verdes Peninsula
Enhanced Watershed Management Program
2-13 | P a g e
Figure 2-2: Santa Monica Bay Bacteria Monitoring Stations within the Peninsula EWMP area.

Palos Verdes Peninsula
Enhanced Watershed Management Program
2-14 | P a g e
Table 2-6: Single Sample Compliance Targets9
Constituent Rolling 30-day
Geometric Mean Limit
Single Sample
Limits
Total Coliform* 1,000/100 mL 10,000/100 mL
Fecal Coliform 200/100 mL 400/100 mL
Enterococcus 35/100 mL 104/100 mL
Table 2-7: Allowable Exceedance Days(a) per Monitoring Location10
Sampling Location Winter Dry Weather
Exceedance Days
Allowed(b)
Summer Dry Weather
Exceedance Days
Allowed(c)
Wet Weather (d)
Exceedance Days
Allowed(e)
SMB 7-1 (Malaga Cove)
1 0 2
SMB 7-2 (Bluff Cove)
1 0 0
SMB 7-3 (Long Point)
1 0 1
SMB 7-4 (Abalone Cove)
0 0 1
SMB 7-5 (Portuguese Bend Cove)
1 0 1
(a) Allowable Exceedance days based on weekly sampling (b) Final compliance beginning July 15, 2009 (c) Final compliance beginning July 15, 2006 (d) Wet weather days are those days with rain events of ≥ 0.1 inches of precipitation and the three days following the end of
the rain event. (e) Final compliance beginning July 15, 2013
9 City of Los Angeles and County of Los Angeles, Technical Steering Committee: Santa Monica Bay Beaches Bacterial TMDLs Coordinated Shoreline Monitoring Plan 10 Ibid.

Palos Verdes Peninsula
Enhanced Watershed Management Program
2-15 | P a g e
Table 2-8: Number of Exceedance Days per Calendar Year by Monitoring Site and Compliance Period
SMB 7-1 SMB 7-2 SMB 7-3 SMB 7-4 SMB 7-5
2003
Wet Weather 1 0 1 0 0
Dry Summer 1 0 1 0 0
Dry Winter 1 0 0 0 0
2004
Wet Weather 1 2 3 2 2
Dry Summer 2 1 0 0 2 Dry Winter 1 1 0 0 0
2005
Wet Weather 3 1 8 4 3
Dry Summer 0 0 0 1 0
Dry Winter 0 0 0 0 3
2006 Wet Weather 1 0 2 0 1 Dry Summer 0 0 0 0 0
Dry Winter 1 0 0 0 0
2007
Wet Weather 0 0 0 0 0
Dry Summer 0 0 0 0 0
Dry Winter 0 0 0 0 0
2008
Wet Weather 1 0 0 0 0
Dry Summer 0 0 0 0 0
Dry Winter 0 0 0 0 1
2009
Wet Weather 1 0 1 0 1
Dry Summer 0 0 0 0 1
Dry Winter 0 0 0 1 0
2010
Wet Weather 1 0 0 3 3
Dry Summer 0 0 1 0 0
Dry Winter 0 0 0 0 0
2011
Wet Weather 0 0 0 0 0
Dry Summer 2 0 0 0 2 Dry Winter 0 0 1 0 0
2012
Wet Weather 0 0 0 0 0
Dry Summer 0 0 1 0 0
Dry Winter 0 0 2 0 0
2013 Wet Weather 0 0 0 0 0 Dry Summer 0 1 1 0 0
Dry Winter 0 0 2 0 0
2014
Wet Weather 0 0 0 0 0
Dry Summer 0 0 0 0 0
Dry Winter 0 0 0 0 0
2015
Wet Weather 0 0 2 0 0
Dry Summer 0 0 0 0 0
Dry Winter 0 0 0 0 0

Palos Verdes Peninsula
Enhanced Watershed Management Program
2-16 | P a g e
Table 2-9: Percentage of Calendar Years in Compliance with Allowable Exceedance Days by Compliance Period
Percentage of Years in Compliance with Allowable Exceedance Days for Winter Dry Weather*
Percentage of Years in Compliance with Allowable Exceedance Days for Summer Dry Weather*
Percentage of Years in Compliance with Allowable Exceedance Days for Wet Weather*
SMB 7-1 100% 92% 100% SMB 7-2 100% 92% 100%
SMB 7-3 83% 75% 92%
SMB 7-4 100% 100% 100% SMB 7-5 100% 83% 100%
*Data analyzed from 1/1/2003 – 12/31/2015. Exceedance days occurring before final compliance deadlines were considered in compliance.
The rare dry weather exceedances of the bacterial objectives at SMB 7-1, 7-3, and 7-5 shown in Table 2-9 are likely attributed to natural causes, including, but not limited to: the presence of recreational swimmers, ocean debris, birds, animal carcasses (i.e. birds, marine mammals, etc.), heavy surf, increased wave height, and wind speed. Site SMB 7-3 is also directly adjacent to the Terranea Resort in Rancho Palos Verdes, which subsequently increases the ocean users and generated pollutants. The City of Rancho Palos Verdes has been in correspondence with the Terranea Resort to solve BMP maintenance issues onsite. Furthermore, all five sites within the Peninsula WMG are 100% in compliance with wet weather limits during the same time period. These factors suggest that the MS4 is likely not causing or contributing to dry weather exceedances.
Additionally, the Peninsula WMG sites are in an anti-degradation condition11. The Peninsula WMG monitoring sites historically experience fewer exceedance days than the reference beach (Leo Carrillo) used in the TMDL (see Table 2-10 thru Table 2-12). This is consistent with the TMDL’s approach that acknowledges that historic average wet weather bacteria exceedance rates for each of these subwatersheds are lower than that of the reference beach. Historic wet weather monitoring data (2005 – 2014) at these five sampling locations confirms this understanding, as the long-term exceedance rate at all five sites varies between 4 and 10%, well below the long-term wet weather exceedance rate at the reference beach (26%). In addition, Heal the Bay, which comprehensively analyzes coastline water quality in California, assigning A to F grades based on bacteria-related health risks, consistently awards these beaches an “A+” ranking on its Beach Report Card (Heal the Bay, 2015).
Table 2-10: Winter Dry Weather Exceedance Days SMB 7-1 thru 7-5 Compared with Reference Beach (SMB 1-1) After Final Compliance Deadline Beginning July 15, 2009.
SMB 7-1 SMB 7-2 SMB 7-3 SMB 7-4 SMB 7-5
Reference Beach
2009 0 0 0 0 0 2
2010 0 0 0 0 0 3 2011 0 0 1 0 0 4
2012 0 0 2 0 0 3
2013 0 0 2 0 0 0 2014 0 0 0 0 0 0
2015 0 0 0 0 0 0
11 The antidegradation policy applies to waters that are determined to have high water quality and requires that existing high quality be maintained.

Palos Verdes Peninsula
Enhanced Watershed Management Program
2-17 | P a g e
Table 2-11: Summer Dry Weather Exceedance Days SMB 7-1 thru 7-5 Compared with Reference Beach (SMB 1-1) After Final Compliance Deadline Beginning July 15, 2006.
SMB 7-1 SMB 7-2 SMB 7-3 SMB 7-4 SMB 7-5
Reference Beach
2006 0 0 0 0 0 11
2007 0 0 0 0 0 0 2008 0 0 0 0 0 2
2009 0 0 0 0 1 0
2010 0 0 1 0 0 0 2011 2 0 0 0 2 5
2012 0 0 1 0 0 0
2013 0 1 1 0 0 0 2014 0 0 0 0 0 0
2015 0 0 0 0 0 1(a)
(a) Summer 2015 data for reference beach shown through June 2015
Table 2-12: Wet Weather Exceedance Days SMB 7-1 thru 7-5 Compared with Reference Beach (SMB 1-1) After Final Compliance Deadline Beginning July 15, 2013.
SMB 7-1 SMB 7-2 SMB 7-3 SMB 7-4 SMB 7-5
Reference Beach
2013 0 0 0 0 0 0
2014 0 0 0 0 0 0 2015 0 0 2 0 0 1
Although it is unlikely that the MS4 is causing or contributing to bacteria exceedeances, the RAA estimates an additional 10.3-12.6% reduction by 2021 in bacteria loading during wet weather based on implementation of various nonstructural BMPs, Low Impact Development (LID) ordinances, and a downspout disconnection programs for single family residential homeowners. Although it has not been quantified through the RAA, these control measures will also address dry weather conditions. Additional actions to reduce loading during dry weather will include: execution of the non-stormwater screening and monitoring program (already underway) and implementation of the active illicit discharge identification program required by the new MCMs.
PCBS AND DDT
Concentrations of DDT and PCBs in the surface sediments of the Santa Monica Bay have decreased substantially since the early 1970s; however, they are still present at levels of concern for bioaccumulation and human health12. The MS4 Permit requires routine stormwater sampling at mass emissions stations throughout LA County. Sampling is conducted by the Los Angeles County Flood Control District, and typically includes four wet-weather events and four dry-weather events per year at these mass emission stations. In the Santa Monica Bay Watershed, the Ballona Creek and Malibu Creek mass emission stations are the two closest to the Peninsula EWMP area. Neither of these stations has detected DDT or PCBs since the mid-90s13.
The US EPA issued the Santa Monica Bay DDT and PCBs TMDL in 2012. In order to estimate stormwater loading of these pollutants to the Santa Monica Bay, a study by Curren et al. (2011) was used along with data collected by the City of Los Angeles from 2007-2010. Estimated stormwater loads from Santa Monica 12 USEPA: Santa Monica Bay DDT and PCBs TMDL 13 According to the Santa Monica Bay DDT and PCBs TMDL, there were no detectable concentrations of DDT in stormwater samples from 1994 to 2005 (LADPW, 2005). Similar results were found for DDT in Malibu (1997 to 2005); Los Angeles Department of Public Works (LADPW) has not indicated detectable levels of PCBs in stormwater from Ballona or Malibu since the mid 1990s. The detection levels used in the LA County Mass Emission sampling are 2 & 3 orders of magnitude larger than the California Ocean Plan human health criteria for DDT and PCBs respectively.

Palos Verdes Peninsula
Enhanced Watershed Management Program
2-18 | P a g e
Bay watersheds were found to be lower than TMDL calculated allowable loads to achieve sediment targets; therefore, the waste load allocations for DDT and PCBs are based on existing load estimates, and the MS4 dischargers are essentially in an anti-degradation condition14.
The Peninsula EWMP area drains to the Palos Verdes Shelf portion of Santa Monica Bay, which is an active EPA Superfund site that is subject to Superfund Remedial Action Objectives (RAOs)15. These RAOs include institutional controls, natural recovery, capping, and monitored attenuation, and are expected to result in improved water quality and compliance with EPA established numeric targets for DDT and PCBs in the Santa Monica Bay.
MARINE DEBRIS
The 1998, 2002, and 2006 303(d) lists include debris as an impairment to beneficial uses in the Santa Monica Bay. On October 16, 2008 and August 10, 2009, Regional Board staff conducted site visits along the beaches in the southern and northern parts of the Santa Monica Bay, respectively, to document the trash problem, and subsequently issued the Santa Monica Bay Nearshore and Offshore Marine Debris TMDL, which went into effect on Mar 20, 2012. Compliance with the Santa Monica Bay Debris TMDL is based on installation of structural best management practices such as full capture or partial capture systems, institutional controls, or any best management practices, to attain a progressive reduction in the amount of trash in the Santa Monica Bay16. The agencies within the Peninsula WMG have chosen to comply through the installation of full capture devices in catch basins draining to Santa Monica Bay. These devices are being installed in accordance with the compliance schedule outlined in the TMDL17.
MACHADO LAKE
The Peninsula WMG areas do not drain directly into Machado Lake. Drainage from the Peninsula WMG areas exit the Peninsula in an easterly or northeasterly direction where it is comingled with drainage from the cities of Torrance and Lomita prior to flowing into three of the four major drainage systems entering Machado Lake (Wilmington Drain, Project 77 and Project 510). The portion of the Peninsula WMG which contributes runoff to Machado Lake consists of approximately 5 square miles, which is about 22% of the Machado Lake Subwatershed drainage area (approximately 22.6 sq. mi. total). Machado Lake is impaired for toxics, nutrients, and trash.
The Peninsula WMG agencies contribute runoff to the Wilmington Drain, Project 77, and Project 510 storm drain lines (Figure 2-3). Over 80% of the Machado Lake Subwatershed drains to Machado Lake through Wilmington Drain. Wilmington Drain is listed on the State’s 303(d) List for copper, lead and coliform bacteria. However, the Regional Board has indicated non-impairment for copper and lead, and these constituents will be removed from the 303(d) list when sufficient data is available to de-list in accordance with the State Listing Policy. 18
14 USEPA: Santa Monica Bay DDT and PCBs TMDL 15 Ibid. 16 Santa Monica Bay Nearshore and Offshore Marine Debris TMDL 17 Subject to modifications resulting from the adoption of the statewide amendment. 18 Dominguez Channel and Greater Los Angeles and Long Beach Harbor Waters Toxic Pollutants TMDL

Palos Verdes Peninsula
Enhanced Watershed Management Program
2-19 | P a g e
Figure 2-3: Storm Drains Entering Machado Lake

Palos Verdes Peninsula
Enhanced Watershed Management Program
2-20 | P a g e
NUTRIENTS
Machado Lake is identified on the State’s 303(d) list of impaired water bodies due to eutrophic conditions, algae, ammonia, and odors. These impairments are caused by excessive loading of nutrients, including nitrogen and phosphorus, to the lake. To address these impairments, the Regional Board issued the Machado Lake Eutrophic, Algae, Ammonia, and Odors (Nutrient) TMDL, which became effective March 11, 2009.
In 2011, the City of LA commenced a nutrient monitoring program in Machado Lake in compliance with the Machado Lake Nutrient TMDL. Water samples are collected bi-weekly from two monitoring sites (ML-1 and ML-2) located in the open water portion of the lake, one at the northern end and one at the southern end (see Figure 2-4 and Figure 2-5)19. In addition, in-situ parameters are measured at the time of sample collection. Sampling results are averaged from the two sampling locations when assessing compliance with the load allocations (LAs) and attainment of numeric targets20.
In 2011, monthly average concentrations of total nitrogen were in compliance with the 1st interim limit of 3.50 mg/L, and total phosphorus had two exceedances of the 1st interim limit of 1.25 mg/L. These exceedances occurred during the summer months of July and August. Ammonia did not exceed the final numeric target of 2.15 mg/L in any sample. The final numeric target for Chlorophyll-a (20 μg/L, monthly average) was exceeded in the months of June, July, August and September with the average concentrations of 22.0 μg/L, 48.5 μg/L, 81.5 μg/L and 29.75 μg/L, respectively. Chlorophyll-a concentration varied greatly with lake depth. In 2012, total nitrogen and total phosphorus concentrations were all in compliance with the 1st interim WLA21. Table 2-13 presents numeric targets and interim and final WLAs and LAs for Machado Lake.
19 For more information on the Machado Lake receiving water monitoring, see the Dominguez Channel Watershed Management Area Coordinated Integrated Monitoring Plan. 20 City of Los Angeles Bureau of Sanitation Watershed Protection Division: Machado Lake Nutrients TMDL Annual Report 2011 (#240) 21 City of Los Angeles Bureau of Sanitation Watershed Protection Division: Machado Lake Nutrients TMDL Annual Reports 2011 and 2012 (#240 and #241)

Palos Verdes Peninsula
Enhanced Watershed Management Program
2-21 | P a g e
Figure 2-4: Machado Lake Nutrient TMDL Monitoring Stations
Figure 2-5: Machado Lake Monitoring Stations

Palos Verdes Peninsula
Enhanced Watershed Management Program
2-22 | P a g e
Table 2-13: Nutrient TMDL Numeric Targets and Load Allocations for Machado Lake
Compliance Date Numeric Target WLAs and LAs
(Average Concentration)
March 11, 2009 (1st Interim)
-
Total Phosphorus 1.25 mg/L Total Nitrogen 3.5 mg/L
March 11, 2014 (2nd Interim)
-
Total Phosphorus 1.25 mg/L Total Nitrogen 2.45 mg/L
September 11, 2018 (Final)
Total Phosphorus 0.1 mg/L (monthly average) Total Nitrogen 1.0 mg/L (monthly average) Ammonia 5.95 mg/L (hourly average) 2.15 mg/L (30-day average) Dissolved Oxygen* 5 mg/L (single sample minimum) *Measured at 0.3-m above the sediment) Chlorophyll-a 20 μg/L (monthly average)
Total Phosphorus 0.1 mg/L Total Nitrogen 1.0 mg/L
TOXICS
Machado Lake is identified on the State’s 1998, 2002, 2006, and 2008 Clean Water Act 303(d) lists of impaired water bodies as impaired due to chlordane, DDT, dieldrin, Chem A, and PCBs in tissue22. The Machado Lake Pesticides and PCBs TMDL was issued to address these impairments and became effective March 20, 2012. The Peninsula WMG will address these constituents in the Peninsula EWMP and CIMP.
TRASH
Machado Lake is identified on the State’s 1996, 1998, and 2002 Clean Water Act 303(d) lists of impaired water bodies as impaired due to trash23. Consequently, the Regional Board issued the Machado Lake Trash TMDL, which became effective March 6, 2008. There are two alternatives for responsible jurisdictions to achieve compliance with waste load allocations in the Machado Lake Trash TMDL, either implement full capture systems or implement a Minimum Frequency of Assessment and Collection (MFAC) program. The agencies within the Peninsula WMG have chosen to comply through the installation of full capture devices in catch basins draining to Machado Lake. These devices are being installed in accordance with the compliance schedule outlined in the TMDL.
22 Machado Lake Pesticides and PCBs TMDL 23 Machado Lake Trash TMDL
Palos Verdes Peninsula
Enhanced Watershed Management Program
2-23 | P a g e
GREATER LOS ANGELES HARBOR
The Peninsula WMG areas do not drain directly into the Greater Los Angeles Harbor. Drainage from the Peninsula EWMP area exits the cities of Rancho Palos Verdes and Rolling Hills Estates in an easterly or southeasterly direction and becomes comingled with discharge from the City of LA. The portion of the Peninsula EWMP area which contributes runoff to Greater Los Angeles Harbor consists of approximately 3.4 square miles, which is about 3.1% of the Dominguez Channel Watershed Management Area (approximately 109.4 sq. mi. total) that drains to the Los Angeles Harbor24. Specific Los Angeles Harbor water segments to which the Peninsula WMG contributes runoff include the Inner and Outer Harbor, Fish Harbor, and Cabrillo Marina (Figure 2-6). These segments are impaired by heavy metals and organic pollutants including copper, mercury, lead, zinc, chlordane, and certain Polycyclic Aromatic Hydrocarbons (PAH) compounds. These impairments exist in the water, sediments and fish tissue within the Los Angeles Harbor waters. Fish consumption advisories also currently exist for DDT and PCBs in certain fish species in all of the Los Angeles Harbor waters.
Water quality data was unavailable during the development of this EWMP; however, reports summarizing monitoring efforts in Los Angeles Harbor waters were reviewed. The most recent water quality collection efforts in the Los Angeles Harbor water segments collecting drainage from the Peninsula EWMP area are summarized below.
24 Dominguez Channel and Greater Los Angeles and Long Beach Harbor Waters Toxic Pollutants TMDL

Palos Verdes Peninsula
Enhanced Watershed Management Program
2-24 | P a g e
Figure 2-6: Dominguez Channel, Greater LA, and Long Beach Harbor Waters

Palos Verdes Peninsula
Enhanced Watershed Management Program
2-25 | P a g e
PORT OF LOS ANGELES (POLA)/PORT OF LONG BEACH (POLB) WATER QUALITY SEDIMENT TOXICITY
In 2005, the Los Angeles and Long Beach Harbors initiated enhanced ambient water quality monitoring programs at 30 open-water sampling stations throughout the harbors. Seven monitoring events were conducted from 2005-2008, during which POLA collected mid-water column samples at a minimum of 30 locations. Figure 2-7 shows the locations of the harbor-wide monitoring stations. The seven collection events took place at different times during the year, and included dry and wet weather sampling.
Three samples in the 2005 – 2008 survey exceeded California Toxics Rule (CTR) water quality criteria for dissolved copper in POLA waters: two samples in the Cabrillo Marina region and one sample in Fish Harbor exceeded the CTR chronic criteria of 3.1 ppb, and the concentration in one sample from the Cabrillo Marina (9.91ppb) was over twice the CTR acute criteria of 4.8 ppb25. For most other metals, maximum concentrations throughout the harbor complex were within the CTR chronic criterion for that metal during the course of the study. Cabrillo Marina and Fish Harbor are both semi-enclosed areas with low water circulation where multiple vessels are berthed. The dissolved copper concentrations observed in these locations may be associated with antifouling boat paints which contain copper. The California Department of Pesticide Regulation is currently evaluating alternatives to copper-containing bottom paints for boats26.
The concentrations of organic chemicals were generally below detection level during this study. Detected concentrations for all but one chemical were always below relevant CTR Criteria for the Protection of Saltwater Aquatic Life for chronic exposure. Tributyltin (TBT) was detected in 7 of the 234 samples analyzed for TBT at concentrations that exceeded published National Ambient Water Quality Criteria chronic exposure limit; however, there is no California standard for this pollutant. TBT is a common chemical used in boat anti-fouling paints, and therefore the MS4 is not likely to be a source of TBT.
Of the various chlorinated pesticides (chlordane, dieldrin, and DDT and its metabolites), DDE was detected in only one of more than 100 samples analyzed using routine analytical techniques. PCBs were not detected in POLA waters relevant to the Peninsula EWMP during this study.
PAHs were not detected in any samples during the course of this study when using the standard analytical method. However, PAHs were detected in most samples when the use of a new ultra-low-detection-limit analytical method was employed.
25 AMEC Earth & Environmental, Inc. 2009. Harbor Ambient Water Quality Summary in Support of the Port of Los Angeles and Port of Long Beach Water Resources Action Plan 26 Ibid.

Palos Verdes Peninsula
Enhanced Watershed Management Program
2-26 | P a g e
Figure 2-7: Ports of LA and LB Water Quality Monitoring Stations

Palos Verdes Peninsula
Enhanced Watershed Management Program
2-27 | P a g e
SOUTHERN CALIFORNIA BIGHT SEDIMENT TOXICITY (2008)
Every five years, the Southern California Bight Regional Monitoring Program led by the Southern California Coastal Water Research Project (SCCWRP), City of Los Angeles, Los Angeles County Sanitation Districts, and Orange County Sanitation District collects samples in offshore waters and coastal embayments (estuaries, marinas, ports, and other bay areas) between Point Conception, California, and the United States-Mexico border. Two hundred and twenty-two sites (220) were sampled between July 1 and September 30, 2008, of which six (6) were in Los Angeles Harbor waters relevant to the Peninsula WMG. Two types of toxicity tests were used in this study. A 10-day solid phase sediment toxicity test using the amphipod Eohaustorius estuarius was conducted on all samples. A second test, a sediment water interface (SWI) test using mussel embryos, was also conducted on all embayment samples, including those sites in the Los Angeles Harbor. The responses to these tests were classified into categories consistent with California Sediment Quality Objectives. Results were classified as “Nontoxic,” “Low Toxicity,” “Moderate Toxicity,” or “High Toxicity”. All of the stations in the Los Angeles Harbor waters relevant to the Peninsula EWMP were classified as either “Nontoxic” or “Low Toxicity” in this study27.
2.2.4. CHARACTERIZATION OF STORMWATER AND NON-STORMWATER
DISCHARGE QUALITY
In order to begin to identify the sources of pollutants identified in the Waterbody Pollutant Categorization and prioritize implementation measures to address them, an analysis of stormwater and non-stormwater discharges from the MS4 was conducted.
MACHADO LAKE NUTRIENT TMDL MONITORING
Two nutrient monitoring programs are currently taking place within the Peninsula EWMP area in compliance with the Machado Lake Nutrient TMDL. These monitoring programs, along with a summary of available data are included below.
PALOS VERDES PENINSULA NUTRIENT COORDINATED MONITORING PROGRAM (NUTRIENT CMP)
Beginning in 2011, the cities of Palos Verdes Estates, Rancho Palos Verdes, Rolling Hills, and Rolling Hills Estates have conducted a Nutrient Coordinated Monitoring Program at four outfall locations that ultimately drain to Machado Lake. This monitoring program is conducted in compliance with the Machado Lake Nutrient TMDL. The monitoring locations are shown in Figure 2-8 as “nutrient” and were chosen because they are representative of the drainage from each of the Cities’ land uses on the Peninsula tributary to Machado Lake. The Peninsula agencies chose to demonstrate compliance with the TMDL through concentration based water quality sampling. This sampling is conducted monthly and the results of all samples collected during the month (wet and dry) are averaged to obtain a monthly nitrogen average and a monthly phosphorus average. These average values are then compared against Waste Load Allocations set forth in the Machado Lake Nutrient TMDL.
27 Bay, Steven M., Darrin J. Greenstein, Matthew Jacobe, Carlita Barton, Ken Sakamoto, Diana Young, Kerry Ritter, Kenneth C. Schiff. 2011. Southern California Bight 2008 Regional Monitoring Program: I. Sediment Toxicity. Southern California Coastal Water Research Project
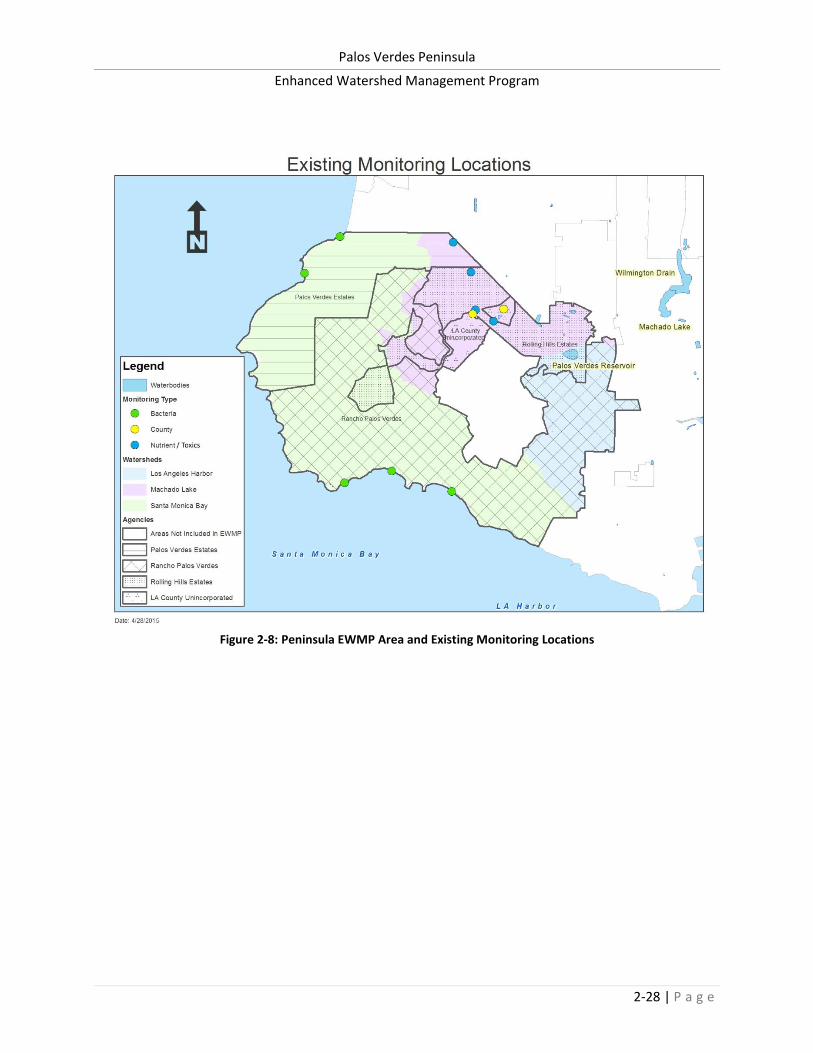
Palos Verdes Peninsula
Enhanced Watershed Management Program
2-28 | P a g e
Figure 2-8: Peninsula EWMP Area and Existing Monitoring Locations

Palos Verdes Peninsula
Enhanced Watershed Management Program
2-29 | P a g e
Three seasons of monitoring have been completed thus far (2011-12, 2012-13, and 2013-14). Between August 2, 2011 and October 15, 2012 (2011-12 season) fifteen months of sampling was conducted. This included twenty-two discrete stormwater sampling events, consisting of twenty dry weather sampling events and two wet weather sampling events28.
From July 1, 2012 through June 30, 2013 (2012-2013 season), a total of twelve months of sampling was conducted. A total of fifteen discrete stormwater sampling events were collected, consisting of thirteen dry weather sampling events, and two wet weather sampling events.
Table 2-14 summarizes the data collected from 2011-2013 and demonstrates that drainage from the Peninsula meets 1st and 2nd interim TMDL compliance targets. As mentioned earlier, in-lake monitoring demonstrates that Machado Lake itself is not meeting the 1st interim targets (3.5 mg/L for Total N and 1.25 mg/L for Total P) during the summer months; however, the Peninsula WMG discharges have met the 2nd interim targets (2.45 mg/L for Total N and 1.25 mg/L for Total P) even during the critical summer dry weather period.
Table 2-14: Percentage of Nutrient CMP Average Monthly Total N and Total P Concentrations Exceeding TMDL WLAs for the Period August 2, 2011 through June 30, 2013
Constituent % Monthly Averages Exceeding 1st Interim TMDL WLA (3/11/09)*
% Monthly Averages Exceeding 2nd Interim TMDL WLA (3/11/14)**
% Monthly Averages Exceeding Final TMDL WLA (9/11/18)***
Total Nitrogen 0% 0% 22%
Total Phosphorus 0% 0% 91%
* Samples are averaged over the course of a month to achieve a monthly average concentration, which is then compared to TMDL WLAs. Dry and wet weather samples are both included in the average calculation. The Machado Lake Nutrient TMDL 1st Interim WLAs for Total N and Total P are 3.5 and 1.25 mg/L respectively
** The Machado Lake Nutrient TMDL 2nd Interim WLAs for Total N and Total P are 2.45 and 1.25 mg/L respectively *** The Machado Lake Nutrient TMDL Final WLAs for Total N and Total P are 1 and 0.1 mg/L respectively
COUNTY OF LOS ANGELES NUTRIENT MONITORING PROGRAM
The Unincorporated County commenced a nutrient monitoring program in compliance with the Machado Lake Nutrient TMDL in June 2012. The Unincorporated County elected and received approval to implement a mass-based approach to measure compliance with the Machado Lake Nutrients TMDL. The program consists of monitoring at all three County Unincorporated land islands in the Machado Lake watershed and determining the Unincorporated County’s annual contribution of nutrients to the receiving water. Two of the three County islands lie within the Peninsula EWMP area. Figure 2-9 shows the County’s water quality and flow monitoring stations within the Peninsula EWMP area.
28 Machado Lake Nutrient TMDL Annual Report 2012

Palos Verdes Peninsula
Enhanced Watershed Management Program
2-30 | P a g e
Figure 2-9: Unincorporated County Machado Lake monitoring locations.
The Unincorporated County land area on the Peninsula that drains to Machado Lake constitutes 35% of the total County land in the Machado Lake Watershed.
Annual Monitoring Results for the first two years of monitoring have been submitted to the Regional Board and the third year monitoring results will be submitted by December 15, 2015. Upon approval of the Peninsula CIMP, the Palos Verdes Nutrient Coordinated Monitoring Program and the Unincorporated County’s Programs will be consolidated. Details of this can be found in the Peninsula CIMP. Table 2-15 shows the allowable waste load allocation for the summation of loads from all three county islands.
Table 2-15: Load generated from all 3 County Islands in Machado Lake Watershed compared to Allowable Load
Constituents Unincorporated County allowable WLAs [kg] Unincorporated County Annual Loads [kg]
Interim (3/11/14) Final (9/11/18) Year 1 Year 2
Total Nitrogen 1,739 710 808 837
Total Phosphorus
887 71 134 129

Palos Verdes Peninsula
Enhanced Watershed Management Program
2-31 | P a g e
2.2.5. SOURCE ASSESSMENT
A preliminary source assessment was conducted to identify potential sources within the watershed for the waterbody pollutant combinations classified as Category 1, 2, or 3 as outlined in MS4 Permit section VI.C.5.a.iii. Per the MS4 Permit, the following available data and documents were considered in the identification of known and suspected sources of the highest water quality priorities:
Findings from the Peninsula WMG’s Illicit Connections and Illicit Discharges Elimination Programs
Findings from the Peninsula WMG’s Industrial/Commercial Facilities Control Programs
Findings from the Peninsula WMG’s Development Construction Programs
Findings from the Peninsula WMG’s Public Agency Activities Programs
TMDL Source Investigations
Findings from Applicable Monitoring Programs
TMDL Implementation Plans
Other pertinent data, information, or studies related to pollutant sources and conditions that contribute to the highest water quality priorities
Locations of the Peninsula Agencies’ MS4s, including, at a minimum, all major outfalls and major structural controls for stormwater and non-stormwater that discharge to receiving waters
Other known and suspected sources of pollutants in non-stormwater or stormwater discharges from the MS4 to receiving waters within the Peninsula EWMP area
The pollutants addressed in this section are toxics, metals, nutrients, bacteria, and trash. To generally describe the potential sources in the watershed, pollutant sources have been divided into the following categories: NPDES sources, road infrastructure, atmospheric deposition, and wastewater from sanitary sewer and SSOs. Typical sources of these pollutants are summarized in Table 2-16.

Palos Verdes Peninsula
Enhanced Watershed Management Program
2-32 | P a g e
Table 2-16: Typical Sources of Pollutants29
Potential Source
Pollutants
Key References
Ba
cte
ria
Nu
trie
nts
Me
tals
TSS
/
Tu
rbid
ity
Tra
sh
N P D E S S o u r c e s
Residential land areas ● ● ● ● 1, 2, 3, 4, 5, 6
Agricultural activities (i.e., animal operations, land applications) ● ● ● 7, 8, 9 Construction activities ● ● ● 7,9
Industrial/municipal activities ● ● 6, 10
POTW discharges ● 11 Landscaping, fertilizers ● 7, 9
Pet waste ● ● 9, Wildlife ● 7, 1
Native geology ● ● 7, 1
Land surface erosion ● ● 7 Detergents ● 9
Car washing ● 7, 9
R o a d I n f r a s t r u c t u r e Transportation sources (i.e., copper brake pads, tire wear) ● 7, 9, 12, 13
Pavement erosion ● ● 7, 14
A t m o s p h e r i c D e p o s i t i o n Construction activities ● 7, 9
Roofing ● 7 Resuspension of historic emissions in road dusts and soil particles ● 15
Land surface erosion ● 16
S a n i t a r y S e w e r a n d S S O s Sewer Leaks, sanitary sewer overflows (SSOs), illicit discharges, septic systems
● ● ● 7, 5,17
POTW discharges ● ● 12 1. LARWQCB (Los Angeles Regional Water Quality Control Board). 2002 & 2006. Total Maximum Daily Load to Reduce Bacterial
Indicator Densities at Santa Monica Bay Beaches During Wet Weather. California Regional Water Quality Control Board, Los Angeles Region, Los Angeles, CA.
2. City of San Diego. 2009. Aerial Deposition Study, Phase III. Source Evaluation of TMDL Metals in the Chollas Creek Watershed. Final Report. San Diego, CA.
3. Gregorio, D., and S.L. Moore, 2004. Discharge into state water quality protection areas in southern California. http://www.sccwrp.org/Homepage/RecentPublications.aspx
4. San Diego County. 2011. 2009-2010 Urban Runoff Monitoring Annual Report. January 2011. 5. SDRWQCB (San Diego Regional Water Quality Control Board). 2010. Revised TMDL for Indicator Bacteria, Project I - Twenty
Beaches and Creeks in the San Diego Region. Resolution No. R9-2010-0001. 6. Lattin, G.L., C.J. Moore, A.F. Zelkers, S.L. Moore, S.B. Weisberg. 2004. A Comparison of Neustonic Plastic and Zooplankton at
Different Depths near the Southern California Shore. Marine Pollution Bulletin 7. County of Los Angeles. 2010. Multi-pollutant TMDL Implementation Plan for the Unincorporated County Area of Los Angeles
River Watershed. County of Los Angeles, Los Angeles, CA 8. City of San Diego. 2011. Mission Bay and La Jolla Watershed Urban Runoff Management Program. Fiscal Year 2010 Annual
Report. 9. USEPA (U.S. Environmental Protection Agency). 2011. Sanitary sewer overflows and peak flows. 10. Gregorio, D., and S.L. Moore, 2004. Discharge into state water quality protection areas in southern California.
http://www.sccwrp.org/Homepage/RecentPublications.aspx 11. Sabin, L.D., K.C. Schiff, J. Hee Lim, and K.D. Stolzenback. 2004. Atmospheric dry deposition of trace metals in the Los Angeles
coastal region. Southern California Coastal Research Project, Costa Mesa, CA. 12. Schueler, T., and H.K. Holland. 2000. The Practice of Watershed Protection. Center for Watershed Protection, Ellicott City, MD. 13. Stein, E.D., L.L. Tiefenthaler, and K. Schiff. 2006. Watershed-based Sources of Polycyclic Aromatic Hydrocarbons in Urban Storm
Water. Environmental Toxicology and Chemistry 25(2):373–385
29 City of San Diego and Caltrans 2012. Tecolote Watershed Comprehensive Load Reduction Plan. Final Report. San Diego, CA.

Palos Verdes Peninsula
Enhanced Watershed Management Program
2-33 | P a g e
14. Caltrans (California Department of Transportation). 2003. A Review of the Contaminants and Toxicity Associated with Particles in Stormwater runoff. August 2003.
15. Sabin, L. and K. Schiff. 2007. Metal Dry Deposition Rates along a Coastal Transect in Southern California. Technical Report #509. Southern California Coastal Research Project, Costa Mesa, CA
16. Sutula, M., K. Kamer, and J. Cable. 2004. Sediment as a nonpoint source of nutrients to Malibu Lagoon, California. Southern California Coastal Research Project. Technical Report.
17. SWRCB (State Water Resources Control Board). 2011. NPDES Permits (including Storm Water). Excel spreadsheet download. Accessed December 6, 2011.
NPDES SOURCES
There are two categories of pollutants sources, point sources and non-point sources. Point source discharges are regulated through National Pollutant Discharge Elimination System (NPDES) permits. Point sources include stormwater and urban runoff through the MS4 and other NPDES discharges. Stormwater runoff in the watershed is regulated through several types of permits including MS4 permits, a statewide stormwater permit for Caltrans; a statewide Construction General Permit (CGP); and a statewide Industrial General Permit (IGP). The NPDES IGP regulates stormwater discharges and authorized non-stormwater discharges from ten specific categories of industrial facilities, including manufacturing facilities, oil and gas mining facilities, landfills, and transportation facilities. Furthermore, the NPDES CGP regulates stormwater discharges from construction sites that result in land disturbances equal to or greater than one acre. Point source discharges from IGP, CGP, residential, commercial and transportation activities can be a significant source of pollutant loads.
Non-point sources, by definition, include pollutants that reach waters from a number of land uses and are not regulated through NPDES permits. Non-point sources include existing contaminated sediments within the watershed and direct air deposition to the waterbody surface. These sources can enter the MS4 and contribute pollutants through it to receiving waterbodies.
The following provides additional discussion regarding the presence of pollutants in stormwater runoff within the watershed.
TOXICS
The most significant toxic pollutants including legacy pollutants are PAH compounds, PCBs, DDT, chlordane and dieldrin.
Polycyclic aromatic hydrocarbons (PAHs) are a group of organic contaminants that form from the incomplete combustion of hydrocarbons. Most PAHs entering the environment are formed during the burning of (coal, oil, wood, gasoline, garbage, tobacco and other organic material). PAHs are an environmental concern because they are toxic to aquatic life and because several are suspected human carcinogens. Research has shown that the dominant source of origin is pyrogenic (combustion of organic matter) in the Los Angeles Region, and PAHs are often deposited through atmospheric deposition and delivered to waterbodies in stormwater runoff7. Other non-point sources may include leaking motor oil, tire wear and vehicular exhaust.
Polychlorinated biphenyls (PCBs) are mixtures of synthetic organic chemicals that were commonly used for various applications from approximately 1929 until 1979 when the U.S. banned PCB manufacturing, processing, distribution, and use. PCBs are a ubiquitous environmental contaminant and, like DDT, they have persisted in the aquatic environment and continue to accumulate in fish tissue even though
Palos Verdes Peninsula
Enhanced Watershed Management Program
2-34 | P a g e
production of PCBs was banned 25 years ago. PCBs may also still exist in products made before 1977 such as transformers, old fluorescent lighting fixtures, household caulking, paints and waxes30.
DDT, chlordane and dieldrin are organochlorine pesticides that were historically used in agricultural activities have resulted in contamination of the aquatic environment. In 1970, 1.2 million pounds of DDT were applied in California primarily to agricultural areas31. Although banned in the U.S. as an insecticide in 1972, DDT and its breakdown products have persisted accumulating at high concentrations, and adhering strongly to soil particles. Chlordane had both non-agricultural and agricultural applications in the U.S, including its use on corn, citrus, deciduous fruits, nuts and vegetables. Non-agricultural uses included treating of pests in residential lawns and gardens as well as structural pests such as termites. Dieldrin is also an organochlorine pesticide and was widely used from 1950-1970 as a structural pesticide for the control of termites as well as an agricultural pesticide for cotton, corn and citrus crops. Chlordane and dieldrin have similar properties to DDT and therefore, have a strong binding affinity to soil particles and are persistent compounds.
Legacy pesticides and insecticides have been banned from use for many years, yet they continue to persist in the environment and cause water quality impairments. Soils historically treated with DDT, chlordane and dieldrin continue to be a present source of pollutants in the environment. In addition, from 1947 to 1971 large quantities of DDT were discharged from the Montrose Chemical plant in Los Angeles, which manufactured DDT, to the Los Angeles County Joint Water Pollution Control Plant (JWPCP) and discharges to the coastal waters of the Palos Verdes Shelf. PCBs also entered the JWPCP from several industrial sources in the Los Angeles area. Contamination of DDT and PCBs in the sediments of Santa Monica Bay, largely centered on the Palos Verdes shelf, have led to a large number of fish advisories for much of Santa Monica Bay and a commercial fishing ban in the area around the Palos Verdes shelf, which is an active USEPA Superfund site32. Possible delivery mechanisms of legacy pollutants may include fluxes from currently contaminated sediments into overlying waters and atmospheric deposition33.
USEPA’s Santa Monica Bay DDT and PCBs TMDL relies on a limited dataset to establish stormwater load allocations, relying on a single study (Curren et al., 2011) from a single creek (Ballona Creek, which is outside the Peninsula Cities WMG Area) to establish MS4 wasteload allocations throughout the entire SMB Watershed. It does not present sufficient data to assign MS4 contributions to the DDT and PCB concentrations observed in SMB, especially in light of the resident load of DDT and PCBs on the Palos Verdes Shelf associated with legacy discharges from Montrose via the Sanitation District’s outfall.
30 USEPA: Santa Monica Bay DDT and PCBs TMDL 31 LARWQCB (Los Angeles Regional Water Quality Control Board). 2010. Machado Lake Pesticides and PCBs TMDL. California Regional Water Quality Control Board, Los Angeles Region, Los Angeles, CA. 32 USEPA: Santa Monica Bay PCBs and DDT TMDL 33 LARWQCB (Los Angeles Regional Water Quality Control Board & U.S. Environmental Protection Agency, Region 9). Dec. 2010. Dominguez Channel and Greater Los Angeles and Long Beach Harbor Waters Toxic Pollutants Total Maximum Daily Loads Draft. California Regional Water Quality Control Board, Los Angeles Region, Los Angeles, CA.

Palos Verdes Peninsula
Enhanced Watershed Management Program
2-35 | P a g e
BACTERIA
Specific sources of bacteria are associated with anthropogenic and non-anthropogenic sources which may include:
Environmental – soils, decaying vegetation,
Animal wastes – birds, dogs, cats, horses, opossums, raccoons etc.
Equestrian activities - horse waste such as manure, urine and soiled bedding are organic, biodegradable materials, and many of their physical, biological and chemical properties can be harmful to water quality. Many of the nutrients ingested by horses return to the environment in feces and urine which are then carried by runoff to streams and lakes. Some activities, such as heavy grazing or pasture use, remove the soil's vegetative cover and can expose the soil surface. Exposed soil is easily transported by runoff to the water bodies. Equestrian activities are a common practice within the watershed in public and private facilities. Horses are kept at public municipal stables, licensed privately owned operated stables and single-family residential properties. Organic debris from gardens, landscaping, parks, food waste and illegal dumping from recreational vehicle holding tanks among others, can be a source of elevated levels of total coliform bacteria.
Sanitary sewer leaks and spills; illicit connections of sanitary lines to the storm drain system;
Illegal connections and discharges are also very likely sources of bacteria in stormwater discharge.
Table 2-17 includes data based on Annual NPDES Reports submitted to the Regional Board from 2001-2012, for illicit connections and illicit discharges. There is currently no data available identifying the constituents associated with the IC/IDs recorded during this period.
Table 2-17: Number of Illicit Connections and Discharges From 2001-201234
Permittee Illicit Connections Illicit Discharges
Rancho Palos Verdes 10 103
Palos Verdes 2 151
Rolling Hills Estates 5 78
Total 17 332
As mentioned previously, the Peninsula is currently in an anti-degradation condition for bacteria in Santa Monica Bay. Monitoring sites historically experience fewer exceedance days than the reference system used to determine allowable exceedance days in the Santa Monica Bay Beaches Bacteria TMDL. Therefore, the Peninsula beaches are currently in an antidegradation condition, which means it was determined that water quality is currently sufficient for protecting beneficial uses and requires that existing high quality be maintained.
34 Details on the Unincorporated County’s illicit connections and discharges can be found in the Unincorporated County’s Annual Report, which can be found online at http://dpw.lacounty.gov/wmd/NPDESRSA/AnnualReport/report_directory.cfm.

Palos Verdes Peninsula
Enhanced Watershed Management Program
2-36 | P a g e
NUTRIENTS
Excessive input of nutrients (such as nitrogen and phosphorus) is the primary cause of eutrophication of surface waters, in which excess nutrients stimulate algal growth which leads to increased turbidity, decreased levels of oxygen, and odor problems. Possible sources of nutrients include runoff from residential and commercial areas due to landscaping activities and use of fertilizer for lawns and gardens, this includes organic debris. Activities such as washing cars, parking lots and driveways can contribute nutrients to the watershed since many of the detergents used contain phosphorus. Other sources of nutrients include food wastes and domestic animal waste. These pollutants build up and are then washed into the waterways through the storm drain system when it rains. These kinds of loads are typically highest during the first major storm flush and even after extended periods of dry weather when pollutants have accumulated. Other major categories of nutrients sources include:
Manure - Within the portion of the peninsula which drain to Machado Lake equestrian activities are very common within the watershed in private and public stables and even residential areas. Horse manure, if improperly managed, has the potential to pose a significant source of nutrients in runoff. Based on the Palos Verdes Peninsula Sub-watershed Coordinated Implementation Plan developed in compliance with the Machado Lake Nutrient TMDL (2011), it is estimated that in the Peninsula WMG’s jurisdiction there are approximately 550 horses and 60 cattle within areas tributary to Machado Lake. Cattle and horses are similar in terms of nutrient generation, therefore the average 1,000-pound horse/cattle produces over 102 pounds of total nitrogen and 18.8 pounds of total phosphorous per year35. Based on this data, the amount of total nitrogen and phosphorous produced by these large animals is estimated to be 66,300 pounds per year of total nitrogen and 12,215 pounds per year of total phosphorous.
Golf courses – golf courses are a major source of nutrients since fertilization activities and watering rates are generally much greater than in residential and commercial areas. The excess nutrients accumulated in the soils can be transported to waterways through excessive irrigation or stormwater runoff. There are approximately 5 golf courses within the Peninsula WMG.
Air deposition of nitrogen due to air pollution, the predominate species being NHO3 (nitric acid), NO2 (nitrogen dioxide) and NH3 (ammonia)36.
35 Wheeler and Zajaczkowski. Horse Stable Manure Management, Publication G-97. Penn State College of Agricultural Sciences Cooperative Extension, Agricultural and Biological Engineering 36 Palos Verdes Peninsula Subwatershed Coordinated Implementation Plan. 2011.

Palos Verdes Peninsula
Enhanced Watershed Management Program
2-37 | P a g e
METALS
Although naturally occurring, concentrations of heavy metals such as cadmium, copper, lead, and zinc are a concern in many watersheds because of potential industrial and urban discharges. These types of sources include Industrial General Permit (IGP) covered facilities, Construction General Permit (CGP) covered facilities, and other types of urban activities.
a. IGP Activities
Less than 2% of the Peninsula WMG land use acreage is designated for industrial use. According to the Stormwater Multiple Application and Report Tracking System (SMARTS) database, the three previously active industrial permits in Rolling Hills Estates have been terminated as of August 2015, which results in zero active industrial permits in the Peninsula Watershed.
b. CGP Activities
Discharges covered under the CGP also have the potential to contribute metals loading from construction sites. Sediment delivered from construction sites can contain metals from construction materials and heavy equipment. Additionally, metals can leach out of building materials and construction waste exposed to stormwater37.
According to the Stormwater Multiple Application and Report Tracking System (SMARTS) database, there are approximately eight current active construction permits and zero violations recorded for inspections conducted from 2002-2012.
Table 2-18: Active CGP Sites According to SMARTSa
Permittee Total
Rancho Palos Verdes 5
Palos Verdes 0
Rolling Hills Estates 3
County Unincorporated 0
a As of May 1, 2014
37 Raskin, L., M.J. Singer, and A. DePaoli. 2004. Final Report to the State Water Resources Control Board Agreement number 01-269-250. University of California, Davis, CA.

Palos Verdes Peninsula
Enhanced Watershed Management Program
2-38 | P a g e
OTHER URBAN ACTIVITIES
General wear and tear of automotive parts can be a significant source of metals. For example, brake wear and tire wear can release copper, lead, and zinc into the environment and contribute concentrations of metals to roads and in turn stormwater runoff. Motor oil and automotive coolants spills are another potential source of metals. Pesticides, algaecides, wood preservatives, galvanized metals, and paints used across the watershed can also contain these metals.
The fertilizers used for lawn and landscape maintenance are also a source of metals and organic chemicals. Fertilizers, herbicides, and pesticides contain metals such as cadmium, copper, mercury, zinc, lead, iron, and manganese, which are also distributed when applying fertilizers and pesticides38.
TRASH
The major source of trash in the Peninsula WMG results from litter, which is intentionally or accidentally discarded in watershed drainage areas. Transport mechanisms include storm drain, wind action and direct disposal into waterbodies. Several studies have shown that commercial operations generate more pollutants than residential operations, and as much as three times the amount generated from light industrial operations39.
ROAD INFRASTRUCTURE SOURCES
Runoff from highways and roads carries a significant load of pollutants. Pollutants originate from cars, roadway degradation, and landscaping surrounding the highways. Typical contaminants associated with these include sediment, heavy metals, oils and grease, debris, fertilizers, and pesticides, among others40. The use and wear of cars is one of the most prevalent sources of roadway pollutants. A study found that cars are the leading source of metal loads in stormwater, producing over 50 percent of copper, cadmium, and zinc loads41. Vehicle brake pads constitute the single largest source of copper42. Simultaneously, tires, and engine parts are also a significant source of metals pollutants; almost 50 percent of tire wear accounts for over 50 percent of the total cadmium and zinc loads43. Roadways can also be a source of nutrients from air deposition of nitrogen and from parkway landscaping runoff which is known to contain nutrients from common application of fertilizers
38 County of Los Angeles. 2010. Multi-pollutant TMDL Implementation Plan for the Unincorporated County Area of Los Angeles River Watershed. County of Los Angeles, Los Angeles, CA 39 LARWQCB. 2007. Trash Total Maximum Daily Loads for the Los Angeles River Watershed. Los Angeles, CA. 40 Caltrans (California Department of Transportation). 2003. Discharge characterization study report. California Department of Transportation, Sacramento, CA. 41 Schueler, T., and H.K. Holland. 2000. The Practice of Watershed Protection. Center for Watershed Protection, Ellicott City. 42 TDC Environmental 2004, Copper Sources in Urban and Shoreline Activities. San Francisco, CA. 43 Davis A.P., M. Shokouhian, and S. Ni. 2001. Loading estimates of lead, copper, cadmium, and zinc in urban runoff from specific sources. Chemosphere.

Palos Verdes Peninsula
Enhanced Watershed Management Program
2-39 | P a g e
Table 2-19: Typical Road Infrastructure Sources of Pollutants44
Source Cadmium Chromium Copper Iron Nickel Lead Zinc PAHs Nutrients Synthetic Organic
Chemicals
Gasoline Exhaust Motor oil and grease
Antifreeze Undercoating
Brake Linings
Tires Asphalt
Concrete
Diesel Oil Engine wear
Fertilizers, pesticides, and herbicides
ATMOSPHERIC DEPOSITION
Atmospheric deposition is the direct and indirect transfer of pollutants from the air to surface waters. Pollutants in the atmosphere deposit onto solid surfaces and then are washed off by rain, becoming part of the stormwater runoff that reaches the watershed. Atmospheric deposition of pollutants either directly to a waterbody surface or indirectly to land in the watershed can be a large source of contamination. Typical pollutants associated with atmospheric deposition are metals, PAHs, PCBs, and, to a lesser extent, nutrients. These pollutants enter the atmosphere from point sources (i.e., industrial facility emitting metals into the air) and mobile sources such as trucks and automobiles. A comparison of trace metals contributions from aerial deposition, sewage treatment plans, industrial activities, and power plants is shown in Table 2-20.
Table 2-20: Comparison of source annual loadings to Santa Monica Bay (metric tons/year)45
Metal Aerial Deposition Non-Aerial Sources
Sewage Treatment Plants Industrial Power Plants Chromium 0.5 0.6 0.02 0.14
Copper 2.8 16 0.03 0.01
Lead 2.3 <0.01 0.02 <0.01
Nickel 0.45 5.1 0.13 0.01
Zinc 12.1 21 0.16 2.4
Nutrients are also atmospherically deposited. According to a research study conducted in 2004, the annual loading of nitrogen through atmospheric deposition in the nearby Los Angeles River watershed is 5,559 tons per year46.
44 Nixon, H., and J.D. Saphores. 2007. Impacts of motor vehicle operation on water quality: Clean-up costs and policies. Transportation Research Part D. Transport and Environment. 45 Stolzenbach, K.D. 2006. Atmospheric Deposition Grades B+ to C-. Southern California Environmental Report Card 2006. University of California, Los Angeles, Institute of the Environment, Los Angeles, CA. 46 Lu, R., K. Schiff, S. Solzenbach, and D. Keith. 2004. Nitrogen Deposition on Coastal Watersheds in the Los Angeles Region. Southern California Coastal Water Research Project Annual Report. 2003-2004. pp. 73– 81.
Palos Verdes Peninsula
Enhanced Watershed Management Program
2-40 | P a g e
SANITARY SEWER AND SANITARY SEWER OVERFLOWS (SSOS)
Sanitary sewer systems and septic systems are potential sources of contaminants. Aging systems in need of repair or replacement, severe weather, improper system operation and maintenance (O&M), clogs, and root growth can contribute to sanitary sewer leaks and overflows. When sanitary sewers overflow or leak, they can release raw sewage into the environment, which can contain pollutants such as suspended solids, pathogenic organisms, toxic pollutants, oil and grease; but in particular, high concentrations of bacteria and nutrients19.
According to the SSO database in the California Integrated Water Quality System (CIWQS) a total of 144 SSOs have been recorded within the Peninsula WMG since 2006. Table 2-21 includes information of the reported SSO discharges.
Table 2-21: Reported SSO discharges (Category 1-3) from 2006 to 2012 located within the Peninsula WMG
Permittee Total SSOs Total Volume (gal)
Rancho Palos Verdes 71 28,105
Palos Verdes Estates 60 31,350 Rolling Hills Estates 13 3,395
Total 144 62,850
OUTFALLS
Stormwater outfalls are point sources of stormwater runoff into receiving waterbodies and are regulated by the NPDES MS4 permit. The locations of all MS4 major outfalls that contribute significant discharges to receiving waters are being investigated through the CIMP, and will be evaluated further during development of the EWMP. Source investigations of significant discharges will be conducted per MS4 Permit requirements.
2.2.6. PRIORITIZATION
MS4 Permit section VI.C.5.a.iv outlines factors that should be considered when developing the sequence of addressing Category 1, 2, and 3 pollutants within the Peninsula EWMP watersheds. Based on Section 2.2.5: Source Assessment and the Reasonable Assurance Analysis (RAA), a sequence for addressing these pollutants will be developed based on the following priorities:
Highest: TMDLs o TMDL pollutants with past due interim or final limits o TMDL pollutants with interim and final limits that fall within the MS4 Permit term, or the
time period: September 6, 2012 – December 28, 2017 o Pollutants that are in the same class as a TMDL pollutant
Second Highest: Other Receiving Water Considerations o Pollutants on the 303(d) List for which MS4 discharges are a suspected source based on
findings from the source assessment o Pollutants that exceed receiving water limitations and the findings from the source
assessment indicate the MS4 as a source (these pollutants will be determined based on monitoring data collected as part of the CIMP).
Table 2-22 summarizes the priority pollutants for the Peninsula EWMP based on their association with MS4 discharges (based on the Source Assessment) and the prioritization criteria described above.

Palos Verdes Peninsula
Enhanced Watershed Management Program
2-41 | P a g e
Table 2-22: Peninsula EWMP Priority Pollutants
Category Class Pollutant Waterbody Potentially
Associated with MS4
Priority
Category 1
Trash Trash/Marine Debris Santa Monica Bay and Machado Lake Yes Highest
Bacteria Coliform and Enterococcus Santa Monica Bay Yes Highest
Historic Organics
PCBs Santa Monica Bay, Machado Lake and Los Angeles Harbor Yes Second Highest
DDT Santa Monica Bay, Machado Lake and Los Angeles Harbor Yes Second Highest
Chlordane Machado Lake and Los Angeles Harbor Yes Second Highest Dieldrin Machado Lake Yes Second Highest
Nutrients
Nitrogen Machado Lake Yes Second Highest
Phosphorus Machado Lake Yes Second Highest Ammonia Machado Lake Yes Second Highest
Chlorophyll a* Machado Lake Yes Second Highest
Dissolved Oxygen* Machado Lake Yes Second Highest Odor* Machado Lake Yes Second Highest
Eutrophic Conditions* Machado Lake Yes Second Highest Algae* Machado Lake Yes Second Highest
Metals
Copper Los Angeles Harbor Yes Second Highest
Lead Los Angeles Harbor Yes Second Highest Mercury Los Angeles Harbor Yes Second Highest
Zinc Los Angeles Harbor Yes Second Highest
PAHs
PAHs Los Angeles Harbor Yes Second Highest Benzo(a)pyrene Los Angeles Harbor Yes Second Highest
Chrysene Los Angeles Harbor Yes Second Highest
Benzo[a]anthracene Los Angeles Harbor Yes Second Highest Dibenz[a,h]anthracene Los Angeles Harbor Yes Second Highest
Phenanthrene Los Angeles Harbor Yes Second Highest Pyrene Los Angeles Harbor Yes Second Highest
Category 2 Metals
Copper Machado Lake (Wilmington Drain) Yes Second Highest
Lead Machado Lake (Wilmington Drain) Yes Second Highest Bacteria Coliform Bacteria Machado Lake (Wilmington Drain) Yes Highest
* These “constituents” are not pollutants, but rather describe water quality conditions associated with excessive nutrients; therefore they have been
categorized in the same class as other nutrients. Highest: TMDL pollutants with past deadlines or interim/final deadlines that fall within the MS4 Permit term and those constituents in the same class Second Highest: Pollutants for which data indicate impairment or exceedances of receiving water limitations and the findings from the source assessment implicates
discharges from the MS4

Palos Verdes Peninsula
Enhanced Watershed Management Program
3-1 | P a g e
3. SELECTION OF WATERSHED CONTROL MEASURES
This chapter identifies Watershed Control Measures (WCMs) to be implemented through the Participating Agencies’ jurisdictional stormwater management programs, and collectively on a watershed scale. The WCMs are structural and/or nonstructural controls designed with the following objectives:
Prevent or eliminate nonstormwater discharges to the MS4 that are a source of pollutants from the MS4 to receiving waters.
Implement pollutant controls necessary to achieve all applicable interim and final water quality-based effluent limitations and/or receiving water limitations pursuant to corresponding compliance schedules.
Ensure that discharges from the MS4 do not cause or contribute to exceedances of receiving water limitations.
The goal is to create an efficient program that focuses individual and collective agency resources on water quality priorities (WQPs). The WCMs are categorized as:
Minimum Control Measures (MCMs)
Nonstormwater Discharge (NSWD) Measures
Targeted Control Measures (TCMs), which are designed to achieve applicable water quality-based effluent limitations and receiving water limitations.
Each WCM category may be further categorized as either structural or nonstructural as well as either existing or proposed. Combined with Chapter 4 (RAA) and Chapter 5 (Compliance Schedules), the EWMP addresses the nature, scope, and timing of implementation for each WCM and provides interim milestones for the WCMs to achieve TMDL compliance. Also discussed are the responsibilities of each Permittee.
Based on results from the RAA for the 90th percentile year (TMDL Year 1995), the captured and retained volume of stormwater runoff estimated is 750 acre-ft. This includes captured and retained stormwater runoff due to LID implementation, downspout disconnection incentive, existing/planned BMPs, and proposed regional BMPs.
Please note that this estimate does not reflect an estimate of recharged groundwater, but is simply an estimate of the reduced amount of stormwater runoff leaving the Peninsula EWMP Area as a result of BMP implementation as discussed herein.

Palos Verdes Peninsula
Enhanced Watershed Management Program
3-2 | P a g e
3.1. MINIMUM CONTROL MEASURES
The Minimum Control Measures (MCMs) are baseline WCMs required for all Permittees. The MCMs are defined in the MS4 Permit (excluding modifications set forth in an approved EWMP) and are generally implemented individually by each Permittee. The objectives of the MCMs are to 1) result in a significant reduction in pollutants discharged into receiving waters and 2) satisfy the requirements of 40 CFR §122.26(d)(2)(iv). The MCMs are separate from Targeted Control Measures, which are developed by the Peninsula WMG and included in the EWMP to specifically address WQPs.
The MS4 Permit allows the modification of several MCMs programs, so long as the modified actions are set forth in the approved EWMP and are consistent with 40 CFR §122.26(d)(2)(iv). The modifications are based on an assessment to identify opportunities for focusing resources on WQPs. The term “modifications” refers only to instances where language from the MS4 Permit MCM provisions is removed and/or replaced. Any control measures that are strictly enhancements of the existing programs (i.e. do not conflict with the MS4 Permit MCM provisions) are included in the separate category of Targeted WCMs.
The following sections include a summary of the assessment of each MCM program as well as a determination as to whether each Participating Agency will implement the MCM provisions either 1) as explicitly stated in the corresponding section of the MS4 Permit or 2) with modifications to focus resources on WQPs. The Agencies may consider additional MCM modifications through the Adaptive Management Process. Implementation of the MCMs will begin following the approval of this EWMP by the Regional Board Executive Officer in accordance with MS4 Permit §VI.D.1.b.
3.1.1. LOS ANGELES COUNTY FLOOD CONTROL DISTRICT MINIMUM CONTROL
MEASURES
The LACFCD will implement the MCMs as defined from §VI.D.1 to §VI.D.4 of the MS4 Permit.
3.1.2. ASSESSMENT OF MINIMUM CONTROL MEASURES (PARTICIPATING AGENCIES, EXCLUDING LACFCD)
Pursuant to MS4 Permit §VI.C.5.b.iv.(1).(a), the following section is an assessment of the MS4 Permit MCMs, intended to identify opportunities for focusing resources on WQPs. This section applies to all participating agencies, excluding the LACFCD.
DEVELOPMENT CONSTRUCTION PROGRAM
ASSESSMENT
Although controlling sediment is not a WQP, the reduction of sediment through an effective Development Construction Program will address WQPs. This is because sediment mobilizes other pollutants, including many of the WQP pollutants. As such the Development Construction Program is an integral component of each agency’s jurisdictional stormwater management program.
Compared to the third term MS4 Permit, the current Permit expands the provisions for the Development Construction Program. This expansion includes additional or enhanced requirements for plan review, site tracking, inspection frequencies, inspection standards, BMP implementation and employee training. If implemented effectively, these enhancements will aid in the control of sediment within the Watershed,

Palos Verdes Peninsula
Enhanced Watershed Management Program
3-3 | P a g e
and consequently, will address WQPs. No modifications to the provisions of the Development Construction Program are proposed.
DETERMINATION
The Agencies will implement the MCMs as defined in §VI.D.8 of the MS4 Permit. Guidance documents, some of which can be found in Appendix 2, have been prepared as an optional aid in the development and implementation of a jurisdictional program.
INDUSTRIAL/COMMERCIAL FACILITIES PROGRAM
ASSESSMENT
The MS4 Permit provisions for the Industrial/Commercial Facilities Program provide opportunities for customization to address WQPs. Specifically, §VI.D.6.e.i.4 states that industrial inspection frequencies may be modified through the EWMP development process.
DETERMINATION
The Agencies will implement the MCMs as defined in §VI.D.6.d and §VI.D.6.e of the MS4 Permit.
Guidance documents have been prepared for the Program, some of which can be found in Appendix 2, intended to assist in the development and implementation of a jurisdictional program.
ILLICIT CONNECTION AND ILLICIT DISCHARGES ELIMINATION PROGRAM
ASSESSMENT
The purpose of the IC/ID Elimination Program is to detect, investigate and eliminate IC/IDs to the MS4. In order to address WQPs, a potential modification to MS4 Permit provisions would be the inclusion of a systematic approach for the detection of illicit discharges. However such an approach is addressed through nonstormwater outfall based screening monitoring as outlined in the MRP. Also, such activities do not conflict with the MS4 Permit provisions for an IC/ID Elimination Program, and as such would be classified as a Targeted Control Measure. As such there is no need to modify the base provisions of the program.
DETERMINATION
The Agencies will implement the MCMs as defined in §VI.D.10 of the MS4 Permit. To assist in the development and implementation of a jurisdictional program, guidance documents have been prepared, some of which can be found in Appendix 2.
PLANNING AND LAND DEVELOPMENT PROGRAM
ASSESSMENT
Following MS4 Permit §VI.C.5.b.iv.1.a, the Planning and Land Development Program was not assessed for potential modifications.
DETERMINATION
The Agencies will implement the MCMs as defined in §VI.D.7 of the MS4 Permit. To assist in the development and implementation of a jurisdictional program, guidance documents have been prepared, some of which can be found in Appendix 2.
Palos Verdes Peninsula
Enhanced Watershed Management Program
3-4 | P a g e
PUBLIC AGENCY ACTIVITIES PROGRAM
ASSESSMENT
The Public Agency Activities Program is divided into several sub-programs. Many of the MS4 Permit provisions within the sub-programs consist of baseline BMPs that are not amenable to modification. The sub-programs that are amendable to a prioritized approach – such as street sweeping and catch basin cleaning frequencies – already provide this opportunity (frequencies are based on an agency’s assessment of trash and debris generation). The provisions of the public construction activities sub-program are considered an integral component of the jurisdictional stormwater program, for the reasons explained in the assessment of the Development Construction Program provisions. In summary there is no need to modify the MS4 Permit provisions of the program.
DETERMINATION
The Agencies will implement the MCMs as defined in §VI.D.9 of the MS4 Permit. To assist in the development and implementation of a jurisdictional program, guidance documents have been prepared, some of which can be found in Appendix 2.
PUBLIC INFORMATION AND PARTICIPATION PROGRAM
ASSESSMENT
The MS4 Permit allows an agency to implement the requirements of the Public Information and Participation Program (PIPP) 1) by participating in a County-wide effort, 2) by participating in a Watershed Group effort, 3) individually within its jurisdiction or 4) through a combination of these approaches. The Agencies will implement the PIPP following a combination of approaches.
The MS4 Permit provisions for the PIPP are not particularly prescriptive, thus allowing the Agencies the flexibility to focus efforts on WQPs through the development of the program. As such, there is no need to modify the MS4 permit provisions of the program.
DETERMINATION
The table below provides clarification on elements of the MS4 Permit provisions for the PIPP:
Permit section Clarification
§VI.D.5.c.(i) Public Participation
Each agency will participate in a County-wide sponsored PIPP to provide a means for public reporting of clogged catch basin inlets and illicit discharges/dumping, faded or missing catch basin labels, and general stormwater and nonstormwater pollution prevention information.
§VI.D.5.c.(ii) Organize Events
Organization of events targeted to residents and population subgroups to educate and involve them in stormwater and non-stormwater pollution prevention and clean-up will be addressed individually by each City or jointly on a watershed level.
§VI.D.5.d Residential Outreach Program
Each City will work in conjunction with a County-wide sponsored PIPP to implement the Residential Outreach Program. Elements of the program that will not be administered or implemented as a county-wide effort (currently the provision to provide educational materials to K-12 school children) will be addressed individually by each City or jointly on a watershed level. Through the adaptive management process, PIPP participation may develop into a Peninsula WMG or individual effort, or some combination of these approaches.
To assist in the development and implementation of a jurisdictional program, guidance documents have been prepared, some of which can be found in Appendix 2.

Palos Verdes Peninsula
Enhanced Watershed Management Program
3-5 | P a g e
PROGRESSIVE ENFORCEMENT AND INTERAGENCY COORDINATION
ASSESSMENT
MS4 Permit §VI.D.2, the Progressive Enforcement and Interagency Coordination Program which is applicable to the Industrial/Commercial Facilities, Planning and Land Development, Development Construction, and Illicit Discharges Illicit Connections programs, was not assessed for potential modifications.
DETERMINATION
The Agencies will establish and implement a progressive enforcement policy consistent with §VI.D.2 of the MS4 Permit.
THIRD TERM MS4 PERMIT MINIMUM CONTROL MEASURES
Until the EWMP is approved by the Executive Officer of the Regional Board, the MCM provisions of the prior third term MS4 permit continue to be implemented by the participating agencies. Some of the MCMs of the fourth term MS4 Permit are relatively unchanged carry-overs from the prior third term permit. The remaining MCMs are either enhancements of the third term MCMs or entirely new provisions. These new and enhanced fourth term MCMs are described in the following section.
Palos Verdes Peninsula
Enhanced Watershed Management Program
3-6 | P a g e
3.1.3. NEW AND ENHANCED FOURTH TERM MS4 PERMIT MINIMUM
CONTROL MEASURES (PARTICIPATING AGENCIES, EXCLUDING LACFCD)
Part VI.D of the MS4 Permit (the MCM provisions) introduces many new provisions and program elements to be developed and incorporated within each participating agency’s jurisdictional stormwater program. This section briefly describes the new and enhanced MCMs required for the Agencies, excluding those required for the LACFCD in §VI.D.4. An MCM is considered new if it was not required by the third term MS4 Permit and is considered enhanced if it is an enhancement of a related provision of the third term MS4 Permit. The new and enhanced provisions of the MS4 Permit have been assumed to result in a load reduction of 5%.1 Descriptions of each new and enhanced provision are included in the following sections.
The details of each provision may be found in the relevant sections of the MS4 Permit, which are referenced below. Unless an alternate date is provided in the MS4 Permit or in this section, the adoption date for the MCMs coincides with the approval of the EWMP by the Regional Board’s Executive Officer.
3.1.3.1. DISTRIBUTED STRUCTURAL CONTROLS
The new and enhanced MCMs consist primarily of nonstructural control measures, with the marked exception of the Planning and Land Development provisions, described as follows.
PLANNING AND LAND DEVELOPMENT
MS4 Permit §VI.D.7
The Low Impact Development (LID) and hydromodification provisions of the Planning and Land Development program are a significant enhancement from the third term MS4 Permit. The implementation of structural LID BMPs at new developments throughout the watershed will appreciably decrease the effective impervious area, reduce flow, and reduce pollutant loads. These benefits will increase in effectiveness over time as more existing developments are redeveloped and bound to the Planning and Land Development requirements.
TRASH EXCLUDER INSTALLATION
MS4 Permit §VI.D.9.h.vii.(1)
In areas that are not subject to a trash TMDL, the Public Agency Activities Program includes a requirement to install excluders (or equivalent devices) on or in Priority A [see §VI.D.9.h.iii.(1)] area catch basins or outfalls to prevent the discharge of trash to the MS4. The deadline is no later than four years after the effective date of the Permit. However, the Peninsula WMG does not contain any Priority A area catch basins or outfalls in areas not subject to trash TMDLs (see Figure 3-1, Figure 3-2, and Figure 3-3) and is therefore not mandated by the MS4 Permit to install trash excluders in catch basins not in areas subject to a Trash TMDL.
This provision will be supplanted by the statewide trash amendments, which include the installation of full-capture devices in the priority land use areas of high density residential, industrial, commercial, mixed urban and public transportation stations. However, according to the Trash Amendment Staff Report, the Peninsula WMG does not contain any priority land uses within areas not already subject to TMDLs within these defined parameters (see Figure 3-1, Figure 3-2, and Figure 3-3).
1 In addition to the 5% reduction assumed for new and enhanced provisions, a 2.5% load reduction has been assumed
for the Nonstructural Targeted Control Measures, as described in Section 3.2.2.

Palos Verdes Peninsula
Enhanced Watershed Management Program
3-7 | P a g e
Figure 3-1: Peninsula WMG Area Catch Basin Priority Maps 1/3 (LACFCD).
Figure 3-2: Peninsula WMG Area Catch Basin Priority Maps 2/3 (LACFCD).

Palos Verdes Peninsula
Enhanced Watershed Management Program
3-8 | P a g e
Figure 3-3: Peninsula WMG Area Catch Basin Priority Maps 3/3 (LACFCD).

Palos Verdes Peninsula
Enhanced Watershed Management Program
3-9 | P a g e
Figure 3-4: Palos Verdes Peninsula Land Cover Class (Source: State Water Resources Control Board. Final Staff Report for Trash Amendments, April 2015, Figure 10.)
As a result of this evidence, the Peninsula WMG is not required to install trash excluders in catch basins not in areas subject to a Trash TMDL. Installation of trash excluders for areas subject to trash TMDLs is discussed in Section 3.2.1.
3.1.3.2. NONSTRUCTURAL CONTROLS
Table 3-1 lists the new and enhanced nonstructural MCMs as well as the new and enhanced NSWD measures. Each of the listed controls are described below Table 3-1.

Palos Verdes Peninsula
Enhanced Watershed Management Program
3-10 | P a g e
Table 3-1: New and Enhanced Fourth Term MS4 Permit Nonstructural MCMs (Participating Agencies, Excluding LACFCD)
BMP effectiveness with respect to WQPs2 Agency
Minimum Control Measure Priority
Pollutant Reduction
Sediment reduction
Volume or flow
reduction LACFCD County
Palos Verdes Estates
Rolling Hills Estates
Rancho Palos Verdes
Planning and Land Development
Amend development regulations to facilitate LID implementation
◆ ◆ ◆ ✗ ✗ ✗ ✗ ✗
Post-construction BMP tracking, inspections and enforcement ❑ ❑ ❑ ✗ ✗ ✗ ✗ ✗
Industrial/Commercial Facilities
Business assistance program and BMP notification ❑ ❑ ❑ ✗ ✗ ✗ ✗ ✗
Construction
Enhanced construction plan review program ❑ ◆ ❑ ✗ ✗ ✗ ✗ ✗
Enhanced inspection standards and BMP requirements ❑ ◆ ❑ ✗ ✗ ✗ ✗ ✗
Increased inspection frequencies ❑ ◆ ❑ ✗ ✗ ✗ ✗ ✗
Enhanced staff training program ❑ ◆ ❑ ✗ ✗ ✗ ✗ ✗
Illicit Connection Illicit Discharge Detection/Elimination
Enhanced IC/ID enforcement and written procedures ❑ ❑ ❑ ✗ ✗ ✗ ✗ ✗
Enhanced staff/contractor training ❑ ❑ ❑ ✗ ✗ ✗ ✗ ✗
Public Information and Participation
Stormwater resources on Agency website ❑ ❑ ❑ ✗ ✗ ✗ ✗ ✗
Enhanced public education ❑ ❑ ❑ ✗ ✗ ✗ ✗ ✗
Public Agency Activities
Enhanced BMP requirements for fixed facility/field activities ❑ ❑ ❑ ✗ ✗ ✗ ✗ ✗
Reprioritization of catch basins and clean-out frequencies ◆ ◆ ◇ ✗ ✗ ✗ ✗ ✗
Integrated Pest Management Program ❑ ◇ ◇ ✗ ✗ ✗ ✗ ✗
Enhanced measures to control infiltration from sanitary sewers ◆ ◇ ◇ ✗ ✗ ✗ ✗ ✗
Inspection and maintenance of Permittee owned treatment controls
❑ ❑ ❑ ✗ ✗ ✗ ✗ ✗
Enhanced inspector/staff training ❑ ❑ ❑ ✗ ✗ ✗ ✗ ✗
✗– To be implemented by agency within current MS4 Permit term. MCM – Minimum Control Measure. NSWD – Nonstormwater discharge measure.
◆ Primary pollutant reduction ❑ Secondary pollutant reduction ◇Pollutant not addressed
2 BMP effectiveness ratings based on similar BMPs listed in Tetra Tech’s CLRP for Chollas Creek Watershed in San Diego County, 2012.

Palos Verdes Peninsula
Enhanced Watershed Management Program
3-11 | P a g e
PLANNING AND LAND DEVELOPMENT PROGRAM
AMEND DEVELOPMENT REGULATIONS TO FACILITATE LID IMPLEMENTATION
MS4 Permit §VI.C.4.c.i, §VI.D.7.d.i
The Participating Agencies have developed and adopted LID ordinances and Green Street Policies. These measures will facilitate LID implementation.
POST-CONSTRUCTION BMP TRACKING, INSPECTIONS AND ENFORCEMENT
MS4 Permit: §VI.D.7.d.iv
The Participating Agencies must track post-construction BMPs, conduct BMP verification and maintenance inspections and follow the Progressive Enforcement Policy in cases of non-compliance. This will improve the effectiveness of the Planning and Land Development program.
INDUSTRIAL/COMMERCIAL FACILITIES PROGRAM
BUSINESS ASSISTANCE PROGRAM AND BMP NOTIFICATION
MS4 Permit: §VI.D.6.c
Measures introduced:
Notify industrial/commercial owner/operators of applicable BMP requirements.
Implement a Business Assistance Program to provide technical information to businesses to
facilitate their efforts to reduce the discharge of pollutants in stormwater. The business assistance
program described in the third term MS4 Permit was an optional provision.
These new and enhanced measures will increase the effectiveness of the Industrial/Commercial Facilities Program.
DEVELOPMENT CONSTRUCTION PROGRAM
ENHANCED CONSTRUCTION PLAN REVIEW PROGRAM
MS4 Permit: §VI.D.8.h, §VI.D.8.i
In general the MS4 Permit introduces provisions that conform to the SWRCB’s Construction General Permit. For construction sites one acre or greater, measures include the following:
Construction activity operators must submit Erosion and Sediment Control Plans (ESCPs) prior to grading permit issuance, developed and certified by a QSD to SWPPP standards.
Operators must propose minimum BMPs that meet technical standards. The Agencies must provide these standards consistent with MS4 Permit requirements.
WMG Agencies are required to review and approve ESCPs/CGP SWPPPs.
Develop procedures and checklists to review and approve relevant construction plans.
These new and enhanced measures will increase the effectiveness of the Development Construction Program, which in turn is expected to reduce TSS loading into the MS4. TSS reduction is an integral component in addressing WQPs.

Palos Verdes Peninsula
Enhanced Watershed Management Program
3-12 | P a g e
ENHANCED INSPECTION STANDARDS/BMP REQUIREMENTS AT CONSTRUCTION SITES
MS4 Permit: §VI.D.8.d, §VI.D.8.i, §VI.D.8.j
Measures introduced:
Ensure BMPs from the ESCPs are properly installed and maintained.
Ensure the minimum BMPs for sites less than one acre are installed and maintained.
Develop and implement standard operating procedures for stormwater inspections of construction sites.
Require activity-specific BMPs for paving projects.
These new and enhanced measures will increase the effectiveness of the Development Construction Program, which in turn is expected to reduce TSS loading into the MS4. TSS reduction is an integral component in addressing WQPs.
INCREASED INSPECTION FREQUENCIES
MS4 Permit: §VI.D.8.j
The inspection frequency for construction sites one acre or more has significantly increased. The third term MS4 Permit required a minimum of one inspection during the rainy season. The current MS4 Permit requires monthly inspections year-round, as well as mandatory inspections based on the phase of construction. This enhanced measure will increase the effectiveness of the Development Construction Program, which in turn is expected to reduce TSS loading into the MS4. TSS reduction is an integral component in addressing WQPs.
ENHANCED STAFF/CONTRACTOR TRAINING
MS4 Permit §VI.D.7.d.iv.(b), §VI.D.8.l, §VI.D.9.k, §VI.D.10.f
Measures introduced:
Prescriptive staff training requirements to the Development Construction Program. For example, relevant staff involved with the Construction Program must be knowledgeable in procedures consistent with the State Water Board sponsored Qualified SWPPP Practitioner/Developer (QSP/QSD) program.
Inspections of structural BMPs under the Development Construction Program must be conducted by personnel trained on Construction General Permit requirements.
Outside contractors are bound to the same training standards as in-house staff
These new and enhanced provisions will increase the overall effectiveness of the jurisdictional stormwater management programs.
Palos Verdes Peninsula
Enhanced Watershed Management Program
3-13 | P a g e
ILLICIT CONNECTION AND ILLICIT DISCHARGE (IC/ID) ELIMINATION PROGRAM
ENHANCED IC/ID ENFORCEMENT AND WRITTEN PROGRAM PROCEDURES
MS4 Permit: §VI.D.2, §VI.D.10
Measures introduced:
Develop and implement a Progressive Enforcement Policy that applies to the IC/ID Elimination, Development Construction, Planning and Land Development and Industrial/Commercial Facilities Programs. The Progressive Enforcement Policy is an augmentation of the policy listed in the third term MS4 Permit, which was restricted to the Industrial/Commercial Facilities Program.
Maintain written procedures for receiving complaints, conducting investigations and responding to spills.
Training of all field staff including contractors to identify and report illicit discharges and connections
These new and enhanced measures will increase the effectiveness of the IC/ID Elimination program, as well as the related enforcement components of the Development Construction, Planning and Land Development and Industrial/Commercial Facilities Programs.
ENHANCED STAFF/CONTRACTOR TRAINING
MS4 Permit §VI.D.7.d.iv.(b), §VI.D.8.l, §VI.D.9.k, §VI.D.10.f
Measures introduced:
Prescriptive staff training requirements to the Illicit Connections and Illicit Discharges Elimination Program. For example, new staff members must be provided with IC/ID training within 180 days of starting employment.
Contractors performing privatized/contracted municipal services such as, but not limited to, storm and/or sanitary sewer system inspection and repair, street sweeping, trash pick-up and disposal, and street and right-of-way construction and repair are trained regarding IC/ID identification and reporting.
Outside contractors are bound to the same training standards as in-house staff.
These new and enhanced provisions will increase the overall effectiveness of the jurisdictional stormwater management programs.

Palos Verdes Peninsula
Enhanced Watershed Management Program
3-14 | P a g e
PUBLIC INFORMATION AND PARTICIPATION PROGRAM
STORMWATER RESOURCES ON AGENCY WEBSITE
MS4 Permit: §VI.D.5.d.i.(4)
Measures introduced:
The MS4 Permit introduces a requirement to maintain a stormwater webpage or provide links to stormwater websites via the agency’s website. The website (in-house or linked) will include:
o Educational material and o Opportunities for the public to participate in stormwater pollution prevention and clean-
up activities.
These new and enhanced measures will increase the effectiveness of the Public Information and Participation program.
ENHANCED PUBLIC EDUCATION
MS4 Permit: §VI.D.5.d.i.(4)
Measures introduced:
Educate the public on Integrated Pest Management
Distribution of educational materials at point-of-purchase
These new and enhanced measures will increase the effectiveness of the Public Information and Participation program.
PUBLIC AGENCY ACTIVITIES PROGRAM
ENHANCED BMP REQUIREMENTS FOR FIXED FACILITY/FIELD ACTIVITIES
MS4 Permit: §VI.D.9.e
Measures introduced:
Implement effective source control BMPs for 65 specific pollutant-generating activities such as mudjacking, shoulder grading and spall repair.
Contractually require hired contractors to implement and maintain the activity specific BMPs. Conduct oversight of contractor activities to ensure the BMPs are implemented and maintained.
These new and enhanced measures will increase the effectiveness of the Public Agency Activities program.
REPRIORITIZATION OF CATCH BASINS AND CLEAN-OUT FREQUENCIES
MS4 Permit: §VI.D.9.h.iii
In areas not subject to a trash TMDL, measures introduced include the following:
Determine priority areas and update the map of catch basins with GPS coordinates and priority.
Include the rationale or data to support the priority designations.
These new and enhanced measures will increase the effectiveness of the Public Agency Activities program.
Palos Verdes Peninsula
Enhanced Watershed Management Program
3-15 | P a g e
INTEGRATED PEST MANAGEMENT PROGRAM
MS4 Permit: §VI.D.9.g
The MS4 Permit introduces entirely new, prescriptive requirements to implement an Integrated Pest Management (IPM) Program for public agency activities and at public facilities. These requirements include adopting and verifiably implementing policies, procedures and/or ordinances that support the IPM program including maintaining an inventory and tracking application of pesticides. Intertwined with the IPM provisions are additional requirements to control and minimize the use of fertilizers. These new and expansive measures will increase the effectiveness of the Public Agency Activities program and address WQPs.
ENHANCED MEASURES TO CONTROL INFILTRATION FROM SANITARY SEWERS
MS4 Permit: §VI.D.9.ix
The MS4 Permit introduces specific requirements to control infiltration from the sanitary sewer into the MS4. The measures include adequate plan checking, preventative maintenance, spill response, enforcement, interagency coordination and staff/contractor education. The requirements are being fulfilled through implementation of a Sewer System Management Plan in accordance with the Statewide General Waste Discharge Requirements for Sanitary Sewer Systems.
INSPECTION AND MAINTENANCE OF PERMITTEE OWNED TREATMENT CONTROLS
MS4 Permit: §VI.D.9.x
The MS4 Permit introduces requirements to implement an inspection and maintenance program for all Permittee owned treatment control BMPs, including post-construction treatment control BMPs. This measure will increase the effectiveness of the Public Agency Activities program and installed structural BMPs.
ENHANCED STAFF/CONTRACTOR TRAINING
MS4 Permit §VI.D.7.d.iv.(b), §VI.D.8.l, §VI.D.9.k, §VI.D.10.f
Measures introduced:
Prescriptive staff training requirements to the Public Agency Activities Program. For example, training programs must address the least toxic methods of pest prevention and control, including Integrated Pest Management (IPM).
Employees in targeted positions (whose interactions, jobs, and activities affect storm water quality) must be adequately trained on the requirements of the overall storm water management program.
Outside contractors are bound to the same training standards as in-house staff
These new and enhanced provisions will increase the overall effectiveness of the jurisdictional stormwater management programs.

Palos Verdes Peninsula
Enhanced Watershed Management Program
3-16 | P a g e
3.1.3.3. NONSTORMWATER DISCHARGE MEASURES
The Participating Agencies will require dischargers that drain to their respective MS4s to implement the Nonstormwater Discharge (NSWD) Measures as defined in §III.A of the MS4 Permit. If the Participating Agencies identify nonstormwater discharges from the MS4 as a source of pollutants that cause or contribute to exceedances of receiving water limitations, the WCMs will be modified and implemented – subject to the adaptive management process – to effectively eliminate the source of pollutants consistent with MS4 Permit §III.A and §VI.D.10. In these instances, potential WCMs may include prohibiting the nonstormwater discharge to the MS4, requiring the responsible party to 1) incorporate additional BMPs to reduce pollutants in the nonstormwater discharge or conveyed by the nonstormwater discharge or 2) divert to a sanitary sewer for treatment, or strategies to require the nonstormwater discharge to be separately regulated under a general NPDES permit.
It is important to note that the nonstormwater Outfall Based Screening and Monitoring Program (MRP §IX) introduces additional NSWD measures through the intensive procedures required for the identification of NSWDs from MS4 outfalls.
NEW FOURTH TERM PERMIT NONSTORMWATER DISCHARGE MEASURES
Parts III.A and VI.B (MRP IX) of the MS4 Permit introduce new provisions and program elements that address NSWDs. This section briefly describes these new and enhanced NSWD measures. A NSWD measure is considered new if it was not required by the third termMS4 Permit and is considered enhanced if it is an enhancement of a related provision of the third termMS4 Permit.
Table 3-2 below lists the new and enhanced nonstructural NSWD measures. The following pages describe each of the listed controls. The details of each provision may be found in the relevant sections of the MS4 Permit, which are included. Unless an alternate date is provided in the MS4 Permit or in this section, the adoption date for the NSWD measures coincides with the approval of the EWMP by the Regional Board’s Executive Officer.
Table 3-2: New and Enhanced Nonstormwater Discharge MCMs (Participating Agencies, Excluding LACFCD)
BMP effectiveness with respect to WQPs3
Agency
Minimum Control Measure Priority
Pollutant Reduction
Sediment reduction
Volume or flow
reduction
LACFCD County Palos
Verdes Estates
Rolling Hills
Estates
Rancho Palos
Verdes
Dry weather runoff reduction Outfall screening and source investigations
◆ ❑ ◆ ✗ ✗ ✗ ✗ ✗
Enhanced conditions for NSWDs, including irrigation reduction
◆ ◆ ◆ ✗ ✗ ✗ ✗ ✗
MCM – Minimum Control Measure NSWD – Nonstormwater discharge measure
✗– To be implemented by agency within current MS4 Permit term
◆ Primary pollutant reduction
❑ Secondary pollutant reduction
◇Pollutant not addressed
3 BMP effectiveness ratings based on similar BMPs listed in Tetra Tech’s CLRP for Chollas Creek Watershed in San Diego County, 2012.

Palos Verdes Peninsula
Enhanced Watershed Management Program
3-17 | P a g e
OUTFALL SCREENING AND SOURCE INVESTIGATIONS
MS4 Permit: §VI.B (MRP §IX)
Measures introduced:
Screen outfalls within jurisdictional boundaries to determine significant outfalls.
Investigate nonstormwater flows to identify potential discharge sources.
Eliminate or divert illicit discharges or conditionally exempt discharges found to be a source of pollutants.
The outfall screening and source investigation provisions of the MS4 Permit constitute an entirely new, expansive addition to each agency’s IC/ID Elimination Program. Implementing these new provisions will significantly support the control of unauthorized nonstormwater discharges.
ENHANCED CONDITIONS FOR EXEMPT NONSTORMWATER DISCHARGES
MS4 Permit: §III.A
The NSWD prohibitions of the MS4 Permit, which include specific measures to reduce irrigation runoff, are a significant enhancement from the third term MS4 Permit. Measures introduced include the following:
Require the implementation of BMPs following established BMP manuals for discharges from non-emergency fire fighting activities and drinking water supplier distribution systems. Require specific BMPs for lake dewatering, landscape irrigation, pool and fountain discharges and non-commercial car washing.
Require notification, monitoring (i.e. sampling) and reporting for drinking water supplier discharges and lake dewatering greater than 100,000 gallons.
Require advance notification to the agency from the discharger for any discharge of 100,000 gallons or more into the MS4.
Minimize discharge of landscape irrigation through implementation of an ordinance specifying water efficient landscaping standards.
Promote water conservation programs to minimize the discharge of landscape irrigation water into the MS4. This includes the following, where applicable:
o Coordinate with local water purveyor(s) to promote: Landscape water efficiency requirements for existing landscaping, Drought tolerant, native vegetation, and Less toxic options for pest control and landscape management.
o Develop and implement a coordinated outreach and education program to minimize the discharge of irrigation water and pollutants associated with irrigation water.
If monitoring results indicate that a conditionally exempt NSWD is a source of pollutants that causes or contributes to exceedances of applicable receiving water limitations and/or water quality-based effluent limitations, the Permittee must either:
o Effectively prohibit the nonstormwater discharge to the MS4, or o Impose additional conditions, subject to approval by the Regional Water Board Executive
Officer, or o Require diversion of the NSWD to the sanitary sewer, or o Require treatment of the NSWD prior to discharge to the receiving water.
Implementing these enhanced provisions will significantly support the control of unauthorized nonstormwater discharges.

Palos Verdes Peninsula
Enhanced Watershed Management Program
3-18 | P a g e
3.2. TARGETED CONTROL MEASURES
Targeted Control Measures (TCMs) are additional control measures beyond the baseline MCMs and NSWD measures of the MS4 Permit that are intended to target the Peninsula WMG’s WQPs. TCMs may be divided into two categories: nonstructural and structural. The selection of structural and nonstructural control measures to address WQPs within the Peninsula WMG is a vital component of the EWMP planning process.
The Participating Agencies have already proposed and implemented a number of structural and nonstructural control measures in the watershed that collectively may contribute to considerable pollutant load reductions. These existing and planned WCMs provide a head start in the planning process to address WQPs within the Peninsula WMG. There are many different types of structural and nonstructural control measures that provide varying benefits from their implementation. The following sections describe Planned TCMs to be implemented, Potential TCMs that may be implemented (implementation is conditional upon factors such as site constraints, governing body approval, etc.) as well types of structural BMPs available to the Peninsula WMG.
3.2.1. CONTROL MEASURES IDENTIFIED IN TMDLS/IMPLEMENTATION PLANS
This section describes the nonstructural control measures that have been previously identified in TMDLs and corresponding implementation plans and the status of their implementation. For those TMDLs that do not sufficiently identify control measures, or if implementation plans have not yet been developed, control measures are identified in the planned Targeted Control Measures as described in the following sections in this chapter. For more information on the TMDLs refer to Section 2: Water Quality Priorities.
SANTA MONICA BAY BEACHES BACTERIA TMDL
To meet the requirements of Santa Monica Bay Beaches Bacteria TMDL, a Coordinated Shoreline Monitoring Plan (CSMP) was developed by a committee of responsible agencies, including representatives from the Peninsula WMG. The Peninsula WMG monitoring sites historically experience fewer exceedance days than used in the TMDL, and are therefore in an anti-degradation condition4. As a result, control measures in the approved Implementation Plan include continued implementation of MCMs to protect or enhance existing water quality, and investigation when an excessive number of exceedances occurs at a monitoring site.
SANTA MONICA BAY NEARSHORE AND OFFSHORE DEBRIS TMDL
Compliance with the Santa Monica Bay Debris TMDL is based on installation of structural best management practices such as full capture or partial capture systems, institutional controls, or any best management practices, to attain a progressive reduction in the amount of trash in the Santa Monica Bay5. The agencies within the Peninsula WMG have chosen to comply through the installation of full capture devices in catch basins draining to Santa Monica Bay. These devices are being installed in accordance with the compliance schedule outlined in the TMDL6.
4 The antidegradation policy applies to waters that are determined to have high water quality and requires that existing high quality be maintained. 6 Reconsideration of the TMDL or the WQBEL in the Permit to conform to the Statewide Trash Policy would result in a modification to the implementation of these control measures.

Palos Verdes Peninsula
Enhanced Watershed Management Program
3-19 | P a g e
SANTA MONICA BAY DDT &PCBS TMDL
The MS4 Permit requires routine stormwater sampling at mass emissions stations throughout LA County. Sampling is conducted by the Los Angeles County Department of Public Works, and typically includes four wet-weather events and four dry-weather events per year at these mass emission stations. In the Santa Monica Bay Watershed, the Ballona Creek and Malibu Creek mass emission stations are the two closest to the Peninsula EWMP area. Neither of these stations has detected DDT or PCBs since the mid-90s7.
Estimated stormwater loads from Santa Monica Bay watersheds were found to be lower than TMDL calculated allowable loads to achieve sediment targets; therefore, the waste load allocations for DDT and PCBs are based on existing load estimates, and the MS4 dischargers are essentially in an anti-degradation condition8.
MACHADO LAKE TRASH TMDL
There are two alternatives for responsible jurisdictions to achieve compliance with waste load allocations in the Machado Lake Trash TMDL, either implement full capture systems or implement a Minimum Frequency of Assessment and Collection (MFAC) program. The agencies within the Peninsula WMG have chosen to comply through the installation of full capture devices in catch basins draining to Machado Lake. These devices are being installed in accordance with the compliance schedule outlined in the TMDL9.
7 According to the Santa Monica Bay DDT and PCBs TMDL, there were no detectable concentrations of DDT in stormwater samples from 1994 to 2005 (LADPW, 2005). Similar results were found for DDT in Malibu (1997 to 2005); Los Angeles Department of Public Works (LADPW) has not indicated detectable levels of PCBs in stormwater from Ballona or Malibu since the mid 1990s. The detection levels used in the LA County Mass Emission sampling are 2 & 3 orders of magnitude larger than the California Ocean Plan human health criteria for DDT and PCBs respectively. 8 USEPA: Santa Monica Bay DDT and PCBs TMDL 9 Reconsideration of the TMDL or the WQBEL in the Permit to conform to the Statewide Trash Policy would result in a modification to the implementation of these control measures.

Palos Verdes Peninsula
Enhanced Watershed Management Program
3-20 | P a g e
3.2.2. NONSTRUCTURAL TARGETED CONTROL MEASURES
Pursuant to Part VI.C.1.a of the MS4 Permit, the Peninsula WMG has developed customized strategies, control measures and BMPs to implement the requirements of the MS4 Permit. Addressing WQPs will be based on a multi-faceted strategy initially focused on source control. If pollutants are not generated or released, they will not be available for transport to the receiving waters. In addition, if soils can be stabilized, sediment controlled, and dry-weather runoff and initial flushes of stormwater runoff eliminated or greatly reduced, the major transportation mechanisms will be eliminated or greatly reduced, and fewer pollutants will reach the receiving waters.
Many of the highest WQPs, such as copper, lead, and zinc, are released into the atmosphere, resulting in widespread aerial deposition onto impervious surfaces in the Watershed. In addition, these pollutants are discharged directly onto streets, highways, parking lots, and driveways from motor vehicle components such as brakes, wheel weights, and tires. The Participating Agencies have concluded that the most cost-effective and long-lasting way to address WQPs is to develop and support state-wide or regional measures that will encourage or require, if necessary, product or material substitution at the manufacturing stage. This can be a complex and time-consuming process, but the payoff in water quality improvement can be tremendous.
The nonstructural TCMs described below supplements the MCM efforts with targeted source control measures such as incentives for irrigation control and upgraded street sweeping equipment, designed with the objective of achieving interim and final water quality-based effluent limitations and/or receiving water limitations. Implementation of the nonstructural TCMs described below constitutes a load reduction of 2.5% in the RAA (higher reductions may be realized).
Table 3-3 lists planned and potential nonstructural TCMs for each participating agency. The BMP effectiveness from Table 3-3 is based on similar BMPs listed in Tetra Tech’s CLRP for Chollas Creek Watershed in San Diego County, 2012.
The responses for each agency under Table 3-3 are defined as follows:
✗ Planned TCM. Under the presumption that 1) the TCM will likely not require approval of the governing body and 2) the governing body approves adequate staff/budget (if necessary), the
TCM will be implemented.
P Potential TCM. The TCM is under consideration by the agency, however implementation is contingent upon yet to be determined factors. These factors include approval by the governing body, additional time needed to inform the governing body and/or relevant staff and approval of service contracts. As such implementation cannot be assured at this time. If the Potential TCM is not adopted by the agency within the first two years of the implementation of the EWMP, it will be reconsidered through the adaptive management process.
C Completed TCM. The TCM is preexisting (has been in effect for several years or more).
Table 3-4 lists the anticipated pollutants to be addressed through each Nonstructural TCM. The pages following Table 3-4 describe each of the listed controls.
It is important to note that the LACFCD are operating regional stormwater programs and consequently incorporating localized institutional TCMs may not be feasible. As such their exclusion from such TCMs is justified.

Palos Verdes Peninsula
Enhanced Watershed Management Program
3-21 | P a g e
Table 3-3: Nonstructural Targeted Control Measures (TCMs)
Targeted Control Measure
BMP effectiveness with respect to WQPs10 Agency
Priority Pollutant Reduction
Sediment reduction
Volume or flow reduction
LACFCD County
Unincorporated Palos Verdes
Estates Rancho Palos
Verdes Rolling Hills
Estates
Planning and Land Development
LID and Green Streets Staff Training ❑ ❑ ❑ N/A C C C C
Industrial/Commercial Facilities
Clean Bay Restaurant Program ◆ ◇ ❑ N/A ✗ C ✗
Downspout Disconnect Program ❑ ❑ ◆ N/A C C C C
Dry weather runoff reduction
Irrigation Reduction Incentives Program ◆ ◆ ◆ N/A C C C C
Public Information and Participation
Targeted Outreach ◆ ◆ ◆ C C C C C
Horse Manure Management ◆ ◇ ◇ N/A ✗ N/A C C
Public Agency Activities
Enhanced Street Sweeping ◆ ◆ ◇ N/A ✗ C C
Adopt Sewer System Management Plan (SSMP) ◆ ◇ ◇ N/A C C C C
Increased Street Sweeping Frequency or Routes ◆ ◆ ◇ N/A C C
Erosion Repair and Slope Stabilization Program ❑ ◆ ◇ N/A N/A ✗ ✗ ✗
Jurisdictional SW Management
Prepare guidance documents to aid in implementation of MS4 Permit MCMs
❑ ❑ ❑ C C C C C
Initiatives
Brake Pad Replacement Program ◆ ◆ ◇ ✗ ✗ ✗ ✗ ✗
Lead Reduction Program ◆ ◆ ◇ ✗ ✗ ✗ ✗ ✗
Zinc Reduction Program ◆ ◆ ◇ Watershed Group
Apply for grant funding for stormwater quality/capture projects
◆ ◆ ◆ C C C C C
Ordinances
Water Efficient Landscaping ◆ ◇ ◆ N/A C C C C
Private Road and Parking Lot Sweeping ◆ ◆ ◇ N/A P
Green Building Ordinance ◆ ❑ ❑ N/A C
Enhanced Irrigation Runoff Reduction Program ◆ ❑ ◆ N/A C C C C ✗– Planned TCM P – Potential TCM C – Completed/Implemented TCM
◆ Primary pollutant reduction ❑ Secondary pollutant reduction ◇ Pollutant not addressed
10 BMP effectiveness ratings based on similar BMPs listed in Tetra Tech’s CLRP for Chollas Creek Watershed in San Diego County, 2012.

Palos Verdes Peninsula
Enhanced Watershed Management Program
3-22 | P a g e
Table 3-4: Anticipated Pollutants to be addressed through Nonstructural TCMs.
Targeted Control Measure
Category 1 Category 2
SMB Bacteria
SMB Debris SMB DDT
& PCBs ML Trash
ML Pesticides & PCBs
ML Nutrients
Harbor Toxics
Copper (WD)
Lead (WD)
Coliform Bacteria
(WD)
Chem A (ML)
Pesticides (SP)
Sediment Toxicity (SMB)
LID and Green Streets Staff Training
√ √ √ √ √ √ √ √ √ √ √ √ √
Clean Bay Restaurant Program
√ √ √ √ √
Downspout Disconnect Program
√ √ √ √ √ √
Irrigation Reduction Incentives Program
√ √ √ √ √ √ √ √
Targeted Outreach √ √ √ √ √ √ √ √ √ √ √ √ √
Horse Manure Management
√ √ √
Enhanced Street Sweeping √ √ √ √ √ √ √ √ √ √ √
Adopt Sewer System Management Plan
√ √ √ √ √
Increased Street Sweeping Frequency or Routes
√ √ √ √ √ √ √ √ √ √ √
Erosion Repair and Slope Stabilization Program
√ √ √ √ √ √ √
Prepare Guidance Documents
√ √ √ √ √ √ √ √ √ √ √ √ √
Brake Pad Replacement Program
√ √
Lead Reduction Program √ √
Zinc Reduction Program √
Apply for Grant Funding √ √ √ √ √ √ √ √ √ √ √ √ √
Water Efficient Landscaping
√ √ √ √ √ √ √ √ √
Private Road and Parking Lot Sweeping
√ √ √ √ √ √
Green Building Ordinance √ √ √ √ √ √ √ √ √ √ √ √ √
Enhanced Irrigation Runoff Reduction Program
√ √ √ √ √ √ √ √
SMB – Santa Monica Bay; ML – Machado Lake; WD – Wilmington Drain; Harbor – Los Angeles Harbor; SP – Palos Verdes Shoreline Park
Palos Verdes Peninsula
Enhanced Watershed Management Program
3-23 | P a g e
PLANNING AND LAND DEVELOPMENT
LID AND GREEN STREETS STAFF TRAINING
This TCM focuses on training the agency staff how to facilitate LID and Green Streets implementation. Training will be conducted for relevant staff in LID and Green Streets implementation prior to the onset of the programs. The elements of the training follow the provisions listed in MS4 Permit §VI.D.7. Additionally, the agencies will educate governing bodies, including the Planning Commissions, in LID and Green Streets implementation. Each agency is currently implementing this program.
INDUSTRIAL/COMMERCIAL FACILITIES
CLEAN BAY RESTAURANT CERTIFICATION PROGRAM
The Clean Bay Restaurant Certification Program, established by the Santa Monica Bay Restoration Commission (SMBRC), works to educate restaurants on clean restaurant practices, including proper disposal of wastes and spill prevention. Through the program, agencies incentivize restaurants to go above and beyond local stormwater regulations to help prevent pollution. The certification program recognizes food service establishments that receive a score of 100% on the program’s criteria checklist by providing a window decal and public recognition from the Mayor.
This program is applicable to those agencies located within the Santa Monica Bay watershed. The program is currently being implemented by the City of Rancho Palos Verdes and is planned to be implemented by the cities of Palos Verdes Estates and Rolling Hills Estates by July 2016.
DOWNSPOUT DISCONNECT PROGRAM
This TCM plans to encourage owners and operators of existing developments to retrofit their downspouts through a downspout disconnect or rain barrel program. This program is currently being implemented for the Peninsula WMG through the West Basin Municipal Water District.
DRY WEATHER RUNOFF REDUCTION
IRRIGATION REDUCTION INCENTIVES PROGRAM
This measure will provide incentives such as rebates for irrigation reduction (i.e. runoff reduction) practices such as xeriscaping and turf conversion. All agencies are currently involved in this effort through the West Basin Municipal Water District rebate incentives program.
PUBLIC INFORMATION AND PARTICIPATION
TARGETED OUTREACH
Within the Public Information and Education Program, elements such as material use/development and advertisements will address WQPs. Additionally, the surrounding communities will be informed throughout EWMP implementation regarding proposed regional projects and their importance. The development of this effort will be ongoing and may be regarded as a Peninsula WMG effort. The agencies have already begun incorporating targeted outreach elements and will have the content and materials completed by December 2016. Targeted outreach campaigns may include the following:
Low Impact Development (LID) Outreach to residents
Fossil Fuel Reduction Outreach to residents
Downspout Disconnection Outreach to residents
K-12 School Outreach

Palos Verdes Peninsula
Enhanced Watershed Management Program
3-24 | P a g e
HORSE MANURE MANAGEMENT
Where residential horse keeping is allowed, the Peninsula WMG agencies implement and enforce Horse Manure Management requiring the proper handling and disposal of horse manure to prevent its accumulation, runoff, or leaching. Additionally, public outreach pamphlets are handed out throughout the Peninsula. These efforts work to address pollutants generated from existing equestrian facilities which are a known source of nutrient discharge. In Rolling Hills Estates, the Model Equestrian Center project is intended to serve an educational function as well as improve water quality from the facility.
The cities of Rancho Palos Verdes and Rolling Hills Estates have already begun implementation of this program. The County of LA plans to begin implementation by December 2016.
PUBLIC AGENCY ACTIVITIES
ENHANCED STREET SWEEPING
Improved street and median sweeping technology enhances the potential for wet weather pollutant load reductions for bacteria, metals, non-metal toxics, and nutrients. Increasing the sweeping frequency, increasing the area of impervious cover swept, or upgrading the sweeping equipment can result in an increase in pollutant load removal11. Most of the Peninsula Agencies contract street sweeping to private companies. These companies have already phased in regenerative sweepers.
Regenerative air sweepers have the ability to clean a larger path than vacuum sweepers, can remove smaller debris more efficiently and release less exhaust and particulates back into the environment. Generally speaking, regenerative air systems are more environmentally friendly than are vacuum sweepers. Regenerative air sweepers are similar to vacuum sweepers in that there is a suction tube located on one side of the sweeping head. However, the key difference between regenerative and vacuum sweepers is that, unlike vacuum sweepers which exhaust the particulate-laden used air back into the atmosphere, regenerative air sweepers work on a closed loop system. In most applications, they also are a better choice than are vacuum sweepers. As the regenerative air sweepers circulate the air on a continuous basis. 12
The cities of Palos Verdes Estates and Rancho Palos Verdes have already begun implementation of this program. The County of LA plans to begin incorporating regenerative sweepers in its street cleaning program by December 2016.
ADOPT SEWER SYSTEM MANAGEMENT PLAN (SSMP)
All agencies are enrolled in the statewide Waste Discharge Requirements for Sanitary Sewer Systems, which required the development and implementation of a SSMP in mid 2009. The goal of the SSMP is to reduce and prevent sanitary sewer overflows (SSOs), as well as mitigate any SSOs that do occur. This goal also addresses WQPs. Elements of the SSMP include:
Sanitary sewer system operation and maintenance program
Design and performance provisions
Overflow emergency response plan
FOG Control Program
System Evaluation and Capacity Assurance Plan
11 City of San Diego: San Diego River Watershed Comprehensive Load Reduction Plan – Appendix A: BMP Representation Summary (2012) 12 An Overview of Power Sweeping Equipment Technology (www.worldsweeper.com)

Palos Verdes Peninsula
Enhanced Watershed Management Program
3-25 | P a g e
INCREASED STREET SWEEPING FREQUENCY OR ROUTES
This TCM will work to increase the street sweeping frequency, jurisdiction-wide or in high trash-generating areas and/or include additional routes (e.g. center medians and intersections).
EROSION REPAIR AND SLOPE STABILIZATION PROGRAM
The Erosion Repair and Slope Stabilization Program will result in public property and right of way erosion repair and slope stabilization. This TCM will work to implement landscaping, erosion control, and sediment control on significant sources of exposed dirt on public property.
The cities of Palos Verdes Estates, Rancho Palos Verdes, and Rolling Hills Estates plan to begin implementation of this program by December 2016.
JURISDICTIONAL STORMWATER MANAGEMENT
PREPARE GUIDANCE DOCUMENTS TO AID IMPLEMENTATION OF MS4 PERMIT MCMS
Guidance documents and template forms have been developed to aid in implementation of the MS4 Permit MCMs, some of which can be found in Appendix 2. These documents were developed to address two issues: 1) the MS4 Permit introduces many new and enhanced MCM provisions that do not have preexisting guidance documentation and 2) the model Stormwater Quality Management Program (SQMP) – which was required in the third term MS4 Permit and served as a guide to permit implementation – is now obsolete. Unlike the SQMP in the third term permit, the Agencies are not bound to the guidance and forms provided. The guidance was developed as a resource for the agencies to improve the effectiveness of the jurisdictional stormwater management programs.

Palos Verdes Peninsula
Enhanced Watershed Management Program
3-26 | P a g e
INITIATIVE
BRAKE PAD REPLACEMENT PROGRAM
The recent efforts of the California Stormwater Quality Association (CASQA) and Sustainable Conservation led to the passage of the SB 346 legislation in 2010 and signed by the Governor on September 25, 2010. This legislation is a milestone that will significantly reduce the level of copper in metropolitan area waters throughout the state. SB 346 requires incremental reduction in the amount of copper in vehicle brake pads, which constitute the single largest source of copper in metropolitan environments13. Already in effect, new codes required on brake pads sold in California will provide information on copper content and a notice that on and after January 1, 2014 any motor vehicle brake friction materials sold in California must contain no more than 0.1 percent by weight of the following materials: cadmium and its compounds, chromium (VI) salts, lead and its compounds, mercury and its compounds, and asbestiform fibers.
According to industry data on brake pad copper content, “SB 346 should reduce annual statewide copper emissions by more than 1.2 million pounds per year and should reduce brake pad copper levels by about 95%”14. Additionally, based on available information, which was largely developed through a lengthy collaboration among brake pad manufacturers, government agencies, and environmental groups in the Brake Pad Partnership, a preliminary estimate of copper runoff reduction due to this piece of legislation was developed. In 2012, TDC Environmental LLC prepared a draft detailed memo (TDC memo) describing the expected percent reduction of Copper reductions (see Appendix 3). The TDC memo identifies 3 possible implementation scenarios:
Scenario 1 (One Step Reduction) – All new vehicles and replacement brake pads are reformulated to contain less than 0.5% Copper by January 1, 2021 (first SB 346 compliance deadline).
Scenario 2 (Two Step Reduction) – New vehicle brake pads are reformulated to contain less than 5% copper by January 1, 2021 and less than 0.5% Copper by 2025. It would be assumed that all higher Copper replacement brakes would be sold within two years of each compliance date.
Scenario 3 (Aftermarket Exemption) – New vehicle brake pads are reformulated to contain less than 5% copper by January 1, 2021 and less than 0.5% copper by 2025. This scenario assumes that higher Copper replacement brakes would continue to be sold indefinitely.
All scenarios were then analyzed over a fourteen-year period. The TDC memo determines the following copper reductions by the year 2032:
Scenario 1: 61% Copper reduction
Scenario 2: 61% Copper reduction
Scenario 3: 55% Copper reduction
The Greater Harbors Toxics TMDL final compliance deadline is in 2032; therefore, using Scenario 3 (the most conservative approach), a reduction of 55% has been assumed in the RAA model.
13 Moran, Kelly. 2011. Brake Pad Copper Reduction – MRP Section C.13.c. Report 2011 14 Ibid.

Palos Verdes Peninsula
Enhanced Watershed Management Program
3-27 | P a g e
LEAD REDUCTION PROGRAM
The SB 346 legislation was passed by the Senate, approved by the Governor, and filed with the Secretary of State on October 11, 2010. This bill prohibits the manufacture, sale, or installation in California of a wheel weight that contains more than 0.1% lead. Additionally, this bill requires that if the department identifies an alternative to lead contained in wheel weights as a chemical of concern, then the lead alternative would remain subject to the evaluation process, as prescribed, to determine how best to limit exposure or to reduce the level of hazard posed by the lead alternative.
Through the implementation of SB 757, a reduction in lead will be observed for the Peninsula WMG.
ZINC REDUCTION PROGRAM
The Department of Toxic Substances Control (DTSC) adopted new Safer Consumer Product Regulations that became effective October 1, 2013. These regulations contain a process for identifying and prioritizing Chemicals of Concern in Priority Products containing these constituents, as well as a process for eliminating or reducing the adverse impacts of Chemicals of Concern in Priority Products. It will apply to most consumer products placed into the stream of commerce in California. It specifically applies to adverse environmental impacts, including adverse water quality impacts, and it contains a petition process for identification and prioritization of chemicals and projects. CASQA, supported by Peninsula WMG, has started the process of conducting research and building a file of critical information to support the designation of zinc in tires as a future priority product/constituent combination.
Measures:
As a watershed group, plan to work with others to use the Department of Toxic Substances
Control’s Safer Consumer Product Regulations to reduce the zinc in tires, which is one of the
greatest sources of zinc in urban areas.
APPLY FOR GRANT FUNDING FOR STORMWATER CAPTURE PROJECTS
Agencies have and will continue to initiate Individual or multi-jurisdictional efforts to apply for grant funding for stormwater quality/capture projects.
ORDINANCES
WATER EFFICIENT LANDSCAPING ORDINANCE
The Peninsula WMG agencies currently implement and enforce water efficient landscaping ordinances to promote the design, installation, and maintenance of landscaping in a manner that conserves water resource and minimizes irrigation water runoff.
Additionally, the Peninsula Agencies jointly developed and have been distributing a tri-fold color brochure promoting Native & Drought Tolerant Plant Gardens and Landscapes on the Palos Verdes Peninsula. This brochure was developed with input from the Palos Verdes Peninsula Land Conservancy, Los Angeles County Fire Department and South Coast Botanic Garden staff.
PRIVATE ROAD AND PARKING LOT SWEEPING ORDINANCE
This TCM aims to adopt and implement an ordinance that requires sweeping of private parking lots. The control measure would work to proactively enforce the existing stormwater ordinance regarding sediment laden stormwater discharges (or potential discharges) for private roads and parking lots and follow the Progressive Enforcement Policy. This may include observing site conditions prior to rain events and visual monitoring of stormwater discharges.

Palos Verdes Peninsula
Enhanced Watershed Management Program
3-28 | P a g e
GREEN BUILDING ORDINANCE
The City of Rancho Palos Verdes, the largest of the Peninsula WMG agencies, implements a Green Building Construction ordinance, effective January 1, 2014, that establishes incentives such as expedited plan review and fee reductions, and outlines procedures for participation in the agency’s voluntary green building program. This program encourages the design and development of single-family, multifamily residential, commercial, institutional and mixed-use projects that are sited, designed, constructed and operated to enhance the well-being of occupants, and to minimize negative impacts on the community and natural environment. In addition, all of the Peninsula WMG agencies have adopted or customized the 2010 California Green Building Standards Code.
The Green Building Ordnance is based on a point system in which a developer earns points for incorporating certain aspects of the program into their design. Some of the specific stormwater quality aspects of this program are identified below:
Category Stormwater Benefit
Stormwater Control:
Permeable Paving Material
Filtration and/or Bio-Retention Features
Non-Leaching Roofing Materials
Smart Stormwater Street Design
Rainwater Harvesting System
Vegetated Roof
Encourages incorporation of stormwater BMPs which directly benefits stormwater quality
Irrigation Control:
Plants Grouped by Water Needs
Resource Efficient Landscapes
High-Efficiency Irrigation System
Reduces irrigation demand which subsequently reduces dry weather flows
Impervious Area Reduction:
Construction Footprint Minimal Turf in Landscape
Trees
Reduces impervious areas which subsequently reduces stormwater runoff
Non-toxic Materials Reduces exposed toxic materials during and after construction
Vandalism Deterrence Practices and Vandalism Management Plan
Reduces the potential for vandalism which subsequently reduces the potential for exposed contaminants associated with vandalism (i.e. spray paint, trash, etc.)
Pedestrian, bicycle, and public transit access Reduces vehicle use which subsequently reduces pollutants associated with vehicles (i.e. organics, oil, grease, metals, etc.)
Structural Pest Controls Reduces likeliness of needing pest-control which subsequently reduces potential for related contaminants to be exposed to stormwater
Green Building Education Increases environmental awareness including stormwater quality

Palos Verdes Peninsula
Enhanced Watershed Management Program
3-29 | P a g e
ENHANCED IRRIGATION RUNOFF REDUCTION PROGRAM
Reductions to irrigation runoff help to achieve runoff volume reduction and associated pollutant load reductions. This BMP, which doubles as a water conservation initiative, incorporates good landscaping practices to limit irrigation runoff. Measures to reduce irrigation runoff can be implemented wherever landscapes are irrigated. Residential, commercial, recreational, and industrial land uses can be targeted by incentive policies and programs. The Peninsula WMG agencies already implement Water Efficient Landscaping ordinances. Additional implementation methods to be considered during EWMP development might include:
Municipal Landscape Retrofit Program to convert municipal landscaping to drought tolerant, low irrigation landscaping
Turf Conversion Program to facilitate the conversion of lawns and gardens to drought tolerant, low irrigation landscaping
The County of LA and the cities of Palos Verdes Estates, Rancho Palos Verdes, and Rolling Hills Estates are currently implementing this program.

Palos Verdes Peninsula
Enhanced Watershed Management Program
3-30 | P a g e
3.2.3. STRUCTURAL TARGETED CONTROL MEASURES
Structural TCMs are Structural BMPs that, in combination with MCMs, are designed with the objective to achieve interim and final water quality-based effluent limitations and/or receiving water limitations. Structural TCMs are an important component of the Peninsula WMG’s load reduction strategy. These BMPs are constructed to capture runoff and filter, infiltrate, or treat stormwater. If properly maintained, these BMPs can have high pollutant removal efficiencies (see the Performance Evaluation of Structural BMPs element of this section); however, they tend to be more expensive than nonstructural BMPs. The two prevailing approaches for implementing Structural BMPs are regional and distributed approaches. Both serve important purposes and should be considered in combination to determine the best possible implementation strategy to meet the Peninsula WMG’s water quality goals.
DISTRIBUTED BMPS
Distributed Structural BMPs are generally built at the site-scale. They are intended to treat stormwater runoff at the source and usually capture runoff from a single parcel or a small area consisting of multiple parcels and public rights of way.
REGIONAL BMPS
Regional BMPs refer to large structural BMPs that receive flows from neighborhoods or large areas and may provide additional benefits such as for flood control or groundwater recharge15.
3.2.4. STRUCTURAL BMP SUBCATEGORIES
Structural BMPs fall under a variety of subcategories that correspond to their function and water quality benefit. Some of the most common of these subcategories are described below. These subcategories will be used throughout the EWMP to describe existing, planned, and potential regional and distributed BMPs.
INFILTRATION BMPS
Infiltration BMPs allow for stormwater to percolate through the native soils and recharge the underlying groundwater table, subsequently decreasing the volume of water discharged to the downstream waterbodies. These BMPs must be constructed in areas where the native soils have percolation rates and groundwater levels appropriate for infiltration.
INFILTRATION BASIN
An infiltration basin consists of an earthen basin with a flat bottom. An infiltration basin retains stormwater runoff in the basin and allows the retained runoff to percolate into the underlying soils. The bottom of an infiltration basin is typically vegetated with dryland grasses or irrigated turf grass.
INFILTRATION TRENCH
An infiltration trench is a long, narrow, rock-filled trench with no outlet other than for overflow. Runoff is stored in the void space between stones and infiltrates through the bottom and sides of the trench. Infiltration trenches provide the majority of their pollutant removal benefits through volume reduction. Pretreatment is important for limiting amounts of coarse sediment entering the trench which can clog and render the trench ineffective.
15 San Diego River Watershed Comprehensive Load Reduction Plan (2012)

Palos Verdes Peninsula
Enhanced Watershed Management Program
3-31 | P a g e
BIORETENTION WITH NO UNDERDRAIN
Bioretention facilities with no underdrain are landscaped shallow depressions that capture and infiltrate stormwater runoff. These facilities function as a soil and plant-based filtration device that removes pollutants through a variety of physical, biological, and chemical treatment processes. The facilities normally consist of a ponding area, mulch layer, engineered media, and vegetation. As stormwater passes down through the media, pollutants are filtered, adsorbed, and biodegraded by the soil and vegetation.
DRYWELL
Drywells are similar to infiltration trenches in their design and function; however, drywells generally have a greater depth to footprint area ratio and can be installed at relatively deep depths. A drywell is a subsurface storage facility designed to temporarily store and infiltrate runoff. A drywell may be either a small excavated pit filled with aggregate or a prefabricated storage chamber or pipe segment.
POROUS PAVEMENT
Porous pavements (concrete, asphalt, and pavers) contain small voids that allow water to pass through to a gravel base. They come in a variety of forms; they may be a modular paving system (concrete pavers, grass-pave, or gravel-pave) or poured in place pavement (porous concrete, permeable asphalt). Porous pavements treat stormwater and remove sediments and metals within the pavement pore space and gravel base. While conventional pavement results in increased rates and volumes of surface runoff, properly constructed and maintained porous pavements allow stormwater to percolate through the pavement and enter the soil below. This facilitates groundwater recharge while providing the structural and functional features needed for the roadway, parking lot, or sidewalk. The paving surface, subgrade, and installation requirements of porous pavements are more complex than those for conventional asphalt or concrete surfaces.
BIOTREATMENT BMPS
Biotreatment BMPs treat stormwater through a variety of physical, chemical, and biological processes prior to being discharged to the MS4 system. These BMPs should be considered where Infiltration BMPs are infeasible.
BIORETENTION WITH UNDERDRAINS
Bioretention stormwater treatment facilities are landscaped shallow depressions that capture and filter stormwater runoff. These facilities function as a soil and plant-based filtration device that removes pollutants through a variety of physical, biological, and chemical treatment processes. The facilities normally consist of a ponding area, mulch layer, engineered media, and vegetation. As stormwater passes down through the media, pollutants are filtered, adsorbed, biodegraded, and sequestered by the soil and vegetation. Bioretention with underdrain systems are utilized for areas containing native soils with low permeability or steep slopes, where the underdrain system routes the treated runoff to the storm drain system.

Palos Verdes Peninsula
Enhanced Watershed Management Program
3-32 | P a g e
VEGETATED SWALES
Vegetated swales are open, shallow channels with low-lying vegetation covering the side slopes and bottom that collect and slowly convey runoff flow to downstream discharge points. Vegetated swales provide pollutant removal through settling and filtration in the vegetation (usually grasses) lining the channels. In addition, although it is not their primary purpose, vegetated swales also provide the opportunity for volume reduction through subsequent infiltration and evapotranspiration and reduce the flow velocity. Where soil conditions allow, volume reduction in vegetated swales can be enhanced by adding a gravel drainage layer underneath the swale allowing additional flows to be retained and infiltrated. Where slopes are shallow and soil conditions limit or prohibit infiltration, an underdrain system or low flow channel for dry weather flows may be required to minimize ponding and convey treated and/or dry weather flows to an acceptable discharge point. An effective vegetated swale achieves uniform sheet flow through a densely vegetated area for a period of several minutes (depending on design standard used).
WET DETENTION BASIN
Wet detention basins are constructed, naturalistic ponds with a permanent or seasonal pool of water (also called a “wet pool” or “dead storage”). Aquascape facilities, such as artificial lakes, are a special form of wet pool facility that can incorporate innovative design elements to allow them to function as a stormwater treatment facility in addition to an aesthetic water feature. Wet ponds require base flows to exceed or match losses through evaporation and/or infiltration, and they must be designed with the outlet positioned and/or operated in such a way as to maintain a permanent pool. Wet ponds can be designed to provide extended detention of incoming flows using the volume above the permanent pool surface.
DRY EXTENDED DETENTION BASIN
Dry extended detention basins are basins whose outlets have been designed to detain the stormwater runoff to allow particulates and associated pollutants to settle out. Dry extended detention basins do not have a permanent pool; they are designed to drain completely between storm events. They can also be used to provide hydromodification and/or flood control by modifying the outlet control structure and providing additional detention storage. The slopes, bottom, and forebay of Dry extended detention basins are typically vegetated.
PRE TREATMENT BMPS
Pre-treatment BMPs are typically not used as primary treatment; however, they are highly recommended for preliminary treatment in order to prolong the life and prevent clogging of the downstream system in a treatment train.
MEDIA FILTERS
Media filters are usually designed as multi-chambered stormwater practices; the first is a settling chamber, and the second is a filter bed filled with sand or another filtering media. As stormwater flows into the first chamber, large particles settle out, and then finer particles and other pollutants are removed as stormwater flows through the filtering medium. They can also be used as pre-treatment, with their location prior to any infiltration or biotreatment BMP.

Palos Verdes Peninsula
Enhanced Watershed Management Program
3-33 | P a g e
CATCH BASIN INSERTS
Catch basins inserts typically include a grate or curb inlet and a sump to capture sediment, debris, and pollutants. Filter fabric can also be included to provide additional filtering of particles. The effectiveness of catch basin inserts, their ability to remove sediments and other pollutants, depends on its design and maintenance. Some inserts are designed to drop directly into existing catch basins, while others may require retrofit construction. Similar to media filters, catch basin filters can also be used as a pre-treatment BMP for infiltration and biotreatment BMPs.
RAINFALL HARVEST
Rainfall Harvest BMPs capture rainwater to be reused in lieu of discharging directly to the MS4.
ABOVE GROUND CISTERNS
Cisterns are large above ground tanks that store stormwater collected from impervious surfaces for non-potable domestic consumption. Above ground cisterns are used to capture runoff. Mesh screens are typically used to filter large debris before the stormwater enters the cistern. The collected stormwater could potentially be used for landscape irrigation and some interior uses, such as toilets and washing machines. The collection and consumption of the stormwater results in pollution control, volume reduction, and peak flow reduction from the site.
UNDERGROUND DETENTION
Underground detention systems function similarly to above ground cisterns in that they collect and use stormwater from impervious surfaces. These systems are concealed underground and can allow for larger stormwater storage and capture additional impervious surfaces not easily captured in an above ground system (e.g. parking lots and sidewalks).
DIVERSION SYSTEMS
LOW FLOW DIVERSION
Flow diversion systems collect and divert runoff. Flow diversion structures can primarily be used in two ways. First, flow diversion structures may be used to direct dry weather flows to a treatment facility, preventing the runoff from reaching a receiving water body. This is typically done with low flow runoff, which occurs during periods of dry weather. Second, flow diversion structures can also be modified by incorporating them into other BMPs. For example, diverted flow can be fed into a regional BMP. Properly designed stormwater diversion systems are very effective for preventing stormwater from being contaminated and for routing contaminated flows to a proper treatment facility.
3.2.4.1. PERFORMANCE EVALUATION OF STRUCTURAL CONTROL MEASURES
The performance of existing and planned BMPs in the Peninsula EWMP area is evaluated through the RAA as described in section VI.C.5.b.iv(5) of the MS4 Permit, both in terms of volume capture (based on BMP design criteria) and predicted effluent quality. An analysis of BMP Performance data has been summarized in Appendix 4. Refer to Section 4 (Reasonable Assurance Analysis) for more detail on the RAA.

Palos Verdes Peninsula
Enhanced Watershed Management Program
3-34 | P a g e
3.2.4.2. REGIONAL BMPS
A summary of existing, planned, and proposed Regional BMPs within the Peninsula EWMP area is summarized below in Figure 3-5 and Table 3-5.
All proposed regional BMPs will either retain or capture and treat water up to the design storm specified for that project, including nonstormwater flows during dry weather.
It is important to note that the EWMP is subject to adaptive management during the implementation phase (see Section 9 of this EWMP). The Participating Agencies may notify the Regional Board that alternative, equivalent actions are proposed in place of the actions described herein. It is important for the Participating Agencies to have flexibility during the implementation phase if proposed Regional BMPs are found to be infeasible or less desirable than alternatives. Regional BMPs will be subject to feasibility studies and/or alternatives analyses. In some cases, the actions proposed herein may be determined to be less preferred compared to other alternatives. If a preferred alternative action is identified and selected, the responsible agency will notify the Regional Board of the newly selected alternative(s) and demonstrate its equivalency.
Figure 3-5: Existing, Planned, and Proposed Regional BMPs.

Palos Verdes Peninsula
Enhanced Watershed Management Program
3-35 | P a g e
Table 3-5: Summary of Existing and Planned Regional BMPs
Project Name Map
Reference ID
Jurisdiction Watershed Existing,
Planned, or Proposed
BMP Type Design
Volume/ Flowrate
85th Percentile, 24-hr
Volume(a)
Retains 85th Percentile,
24-hr Storm? Design Basis
Drainage Area to
BMP
Percent Drainage Area Per
Jurisdiction(b)(c)
Casaba Estates (Butcher Ranch)
R1 RHE Los Angeles
Harbor Existing Bioretention
5.1 ac-ft Per Storm
1.8 ac-ft Per Storm
Yes 50-year
(5.2 inch) 28.62 Acres RHE: 100%
San Ramon Canyon R2 RPV Santa
Monica Bay Existing Diversion Unknown(d) Unknown(d) No >0.25 inch Unknown(d) RPV: 100%
Chandler Quarry Project
R3 RHE Machado
Lake Existing/
Planned(e) Infiltration
System 200 ac-ft(f) Per Storm
43.7 ac-ft Per Storm
Yes 50-year
(5.2 inch) 707 Acres RHE: 100%
South Coast Botanic Garden Regional BMP
R4 UA Machado
Lake Planned/
Proposed(g) Various(g) 20 cfs(h)
7.5 ac-ft Per Storm
No 0.1 in/hr ~134 Acres(j) RHE: 24% UA: 76%
Palos Verdes Landfill Regional BMP
R5 RHE Machado
Lake Proposed(k) TBD 125 cfs(h)(i)
87.6 ac-ft Per Storm
No 90th Percentile,
Critical Year ~1,415 Acres(j)
RPV: 38% RHE: 41% UA: 21%
Valmonte Regional BMP
R6 RHE Machado
Lake Proposed(k) TBD 30 cfs(h)(i)
20.3 ac-ft Per Storm
No 90th Percentile,
Critical Year ~400 Acres(j)
PVE: 19% RPV: 24% RHE: 57%
Eastview Park Infiltration Project
R7 RPV Los Angeles
Harbor Proposed(k) Infiltration
124.5 ac-ft(l) Per Year
17.7 ac-ft Per Storm
Yes 90th Percentile,
Critical Year ~350 Acres(j) RPV: 100%
Notes:
RPV-Rancho Palos Verdes; PVE-Palos Verdes Estates; RHE-Rolling Hills Estates; UA-LA County, Unincorporated
(a) Volume determined using a conservative impervious percentage of 70% and the highest 85th Percentile, 24-hr storm depth associated with the location (County of Los Angeles Department of Public Works. Analysis of 85th Percentile 24-hour Rainfall Depth Analysis Within the County of Los Angeles. February 2004).
(b) Percentages are based on the drainage area within the Peninsula EWMP Watershed. Agencies outside of the EWMP boundary were not taken into consideration. (c) Percentages are estimated and are subject to change. (d) Due to the nature of this project its benefits could not be quantified in the RAA model. (e) Chandler Quarry is an existing regional infiltration BMP which is undergoing redevelopment. The redevelopment project is currently under construction and has been conditioned
by the City to continue to preserve the hydraulic and water quality function of the existing regional BMP. (f) Based on the 50-year design storm. (g) The South Coast Botanic Garden has planned BMPs and opportunities for proposed BMPs. (h) Due to infiltration infeasibility, these BMPs were designed as flow-through BMPs rather than volume-based BMPs. (i) This value represents one of three design alternatives. Refer to Section 3.2.4.2.3 for information on each design alternative. (j) Maximum drainage area determined through GIS analysis. This project would also treat drainage area from the City of Rolling Hills. (k) Alternative BMPs may be implemented upon further analysis. (l) This volume is the total annual capture volume for the 90th percentile, critical year. The design storm used in this analysis was 1-inch, which is greater than the 85th Percentile, 24-
hr storm depth of 0.9-inch.

Palos Verdes Peninsula
Enhanced Watershed Management Program
3-36 | P a g e
3.2.4.2.1. EXISTING REGIONAL BMPS
CASABA ESTATES (FORMERLY BUTCHER RANCH)16
The Casabas Estates project is currently under construction; however, construction of the regional BMP has been completed. The project is approximately 8.55 acres located in Rolling Hills Estates. It is bounded on the north by Rolling Hills Country Club and Kramer Tennis Club, on the south by Palos Verdes Drive North, easterly by Monticello Drive, and westerly by Palos Verdes Drive East. The project consists of residential lots, one new Commercial Recreational lot, parking lots, private roads, and private equestrian facilities.
The project involved re-grading a portion of the pre-existing ravine to remove standing water conditions. This inundated area was rehabilitated into a vegetated riparian area designed as a bioretention system to retain and infiltrate runoff from the site. The project receives runoff from offsite (through an existing 24” diameter culvert under Palos Verdes Drive East) and onsite watersheds (a total of 28.62 acres). The new riparian area was designed to retain and infiltrate onsite and offsite runoff in a volume greater than the pre-existing design storage capacity for the 50-year storm event (5.1 acre-feet). This is greater than the 85th percentile, 24-hr storm event; therefore, the project was modeled in the RAA as a Regional EWMP Project. See Figure 3-6 for post-development design conditions.
The Casaba Estates project would have multiple benefits in addition to the stormwater quality benefits that will be observed. These additional benefits may include, but are not limited to, the following:
Beneficial Use Protection. This project will result in higher water quality which will help to protect recreational beneficial uses and support public health (and wellness) in Machado Lake and the Greater LA Harbor.
Neighborhood Greening and Public Recreation. This project will include green space within this development which can positively impact the aesthetics, as well as property values, of urbanized areas. Property value tends to increase when an urban neighborhood has green space or trees in sight (CNT, 2010). Green infrastructure and green space can also alleviate urban heat-island effects by reducing temperatures by about 5oF through shade and evaporation (CNT, 2010).
Water Conservation/Supply. The stormwater retained onsite will recharge the groundwater which is being used for potable or non-potable purposes by the City of Lomita and the golf course, thus offsetting reliance on imported water supply.
16 Bolton Engineering Corp. Hydrology and Hydraulic Calculations. September 13, 2010.

Palos Verdes Peninsula
Enhanced Watershed Management Program
3-37 | P a g e
Figure 3-6: Casaba Estates (formerly Butcher Ranch) Post-Development Design Conditions (Bolton Engineering Corp. Hydrology and Hydraulic Calculations. September 13, 2010).

Palos Verdes Peninsula
Enhanced Watershed Management Program
3-38 | P a g e
SAN RAMON CANYON
The San Ramon Canyon project is located in the City of Rancho Palos Verdes. The project was completed in October 2014. The project consists of the construction of a mid-canyon inlet structure connected to a 3,900-foot long, 54-inch pipe that outlets below the oceanfront bluff, bypassing a highly erodible section of the canyon (see Figure 3-7). The project inlet is located slightly upstream of the upper switchback along Palos Verdes Drive East and will substantially reduce the amount of flow being delivered to an existing, and overwhelmed, storm drain at Palos Verdes Drive South/25th Street. This project will improve water quality by substantially reducing erosion and minimizing debris and sediment transport to this drain by diverting all stormwater runoff from a greater than ¼ inch rain event to the underground pipe, diverting it from the erosive canyon. Due to the nature of this project its benefits could not be quantified in the RAA model. However, as mentioned above, this project is expected to significantly improve the quality of the downstream receiving water and is expected to address PCBs, DDT, and Sediment Toxicity.
The San Ramon Canyon project will have multiple benefits in addition to the stormwater quality benefits that will be observed. These additional benefits may include, but are not limited to, the following:
Beneficial Use Protection. This project will help to protect recreational beneficial uses, support public health (and wellness) in Santa Monica Bay
Habitat. This project will restore and protect the existing streambed and the surrounding ecosystem to encourage infiltration and biologic uptake.
Flood Management. This project will decrease flood risk by reducing runoff rate and volume.
Water Conservation/Supply. The stormwater retained onsite will recharge the groundwater which is being used for potable or non-potable purposes by the City of Lomita and the golf course, thus offsetting reliance on imported water supply.
Figure 3-7: San Ramon Canyon Project.
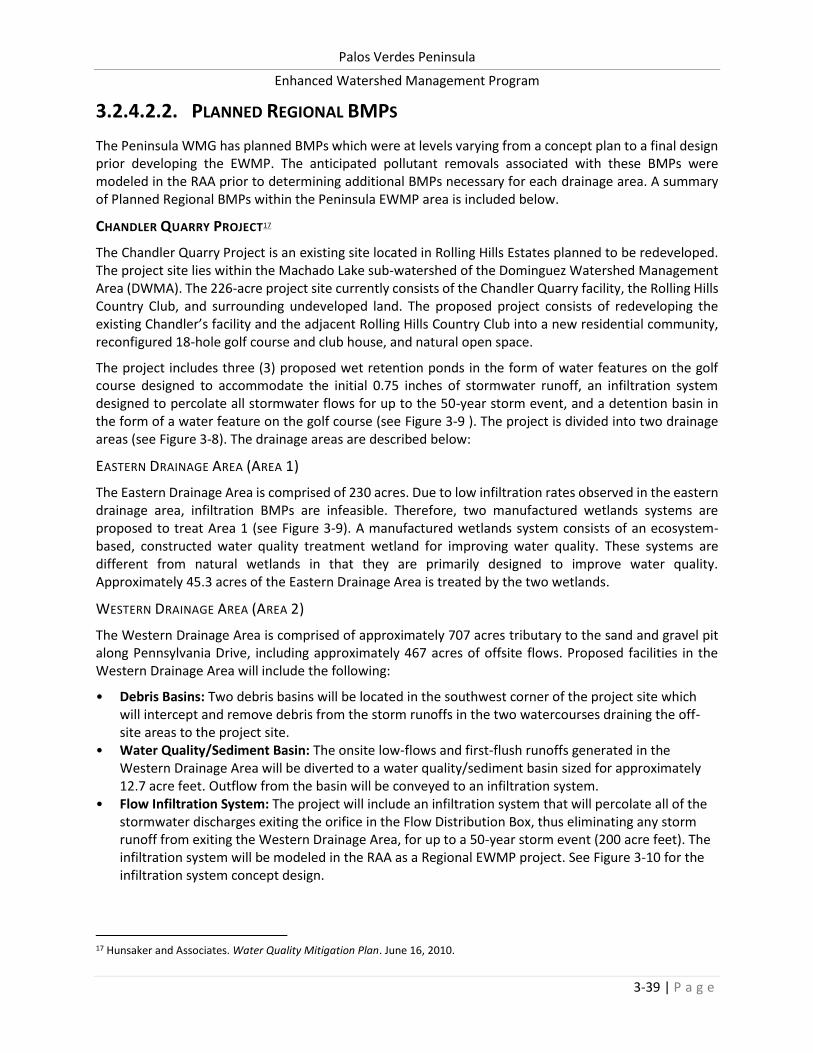
Palos Verdes Peninsula
Enhanced Watershed Management Program
3-39 | P a g e
3.2.4.2.2. PLANNED REGIONAL BMPS
The Peninsula WMG has planned BMPs which were at levels varying from a concept plan to a final design prior developing the EWMP. The anticipated pollutant removals associated with these BMPs were modeled in the RAA prior to determining additional BMPs necessary for each drainage area. A summary of Planned Regional BMPs within the Peninsula EWMP area is included below.
CHANDLER QUARRY PROJECT17
The Chandler Quarry Project is an existing site located in Rolling Hills Estates planned to be redeveloped. The project site lies within the Machado Lake sub-watershed of the Dominguez Watershed Management Area (DWMA). The 226-acre project site currently consists of the Chandler Quarry facility, the Rolling Hills Country Club, and surrounding undeveloped land. The proposed project consists of redeveloping the existing Chandler’s facility and the adjacent Rolling Hills Country Club into a new residential community, reconfigured 18-hole golf course and club house, and natural open space.
The project includes three (3) proposed wet retention ponds in the form of water features on the golf course designed to accommodate the initial 0.75 inches of stormwater runoff, an infiltration system designed to percolate all stormwater flows for up to the 50-year storm event, and a detention basin in the form of a water feature on the golf course (see Figure 3-9 ). The project is divided into two drainage areas (see Figure 3-8). The drainage areas are described below:
EASTERN DRAINAGE AREA (AREA 1)
The Eastern Drainage Area is comprised of 230 acres. Due to low infiltration rates observed in the eastern drainage area, infiltration BMPs are infeasible. Therefore, two manufactured wetlands systems are proposed to treat Area 1 (see Figure 3-9). A manufactured wetlands system consists of an ecosystem-based, constructed water quality treatment wetland for improving water quality. These systems are different from natural wetlands in that they are primarily designed to improve water quality. Approximately 45.3 acres of the Eastern Drainage Area is treated by the two wetlands.
WESTERN DRAINAGE AREA (AREA 2)
The Western Drainage Area is comprised of approximately 707 acres tributary to the sand and gravel pit along Pennsylvania Drive, including approximately 467 acres of offsite flows. Proposed facilities in the Western Drainage Area will include the following:
• Debris Basins: Two debris basins will be located in the southwest corner of the project site which will intercept and remove debris from the storm runoffs in the two watercourses draining the off-site areas to the project site.
• Water Quality/Sediment Basin: The onsite low-flows and first-flush runoffs generated in the Western Drainage Area will be diverted to a water quality/sediment basin sized for approximately 12.7 acre feet. Outflow from the basin will be conveyed to an infiltration system.
• Flow Infiltration System: The project will include an infiltration system that will percolate all of the stormwater discharges exiting the orifice in the Flow Distribution Box, thus eliminating any storm runoff from exiting the Western Drainage Area, for up to a 50-year storm event (200 acre feet). The infiltration system will be modeled in the RAA as a Regional EWMP project. See Figure 3-10 for the infiltration system concept design.
17 Hunsaker and Associates. Water Quality Mitigation Plan. June 16, 2010.
Palos Verdes Peninsula
Enhanced Watershed Management Program
3-40 | P a g e
The Chandler Quarry project would have multiple benefits in addition to the stormwater quality benefits that will be observed. These additional benefits may include, but are not limited to, the following:
Beneficial Use Protection. This project will result in higher water quality which will help to protect recreational beneficial uses and support public health (and wellness) in Machado Lake and the Greater LA Harbor.
Neighborhood Greening and Public Recreation. This project will increase the green space within this development which can positively impact the aesthetics, as well as property values, of urbanized areas. Property value tends to increase when an urban neighborhood has green space or trees in sight (CNT, 2010). Green infrastructure and green space can also alleviate urban heat-island effects by reducing temperatures by about 5oF through shade and evaporation (CNT, 2010). Recreation opportunities also can be increased by increased green space and decrease the amount of cars on the road, subsequently decreasing the associated pollutants.
Water Conservation/Supply. The stormwater retained onsite will recharge the groundwater which will be used by the golf course for non-potable purposes, thus offsetting reliance on imported water supply.
Public Education/Awareness. This project will incorporate stormwater infrastructure within an area which is highly used by the public creating an awareness of stormwater quality and its importance. These onsite BMPs may serve as public education opportunities in the form of on-site educational materials, such as placards and interpretive signage.
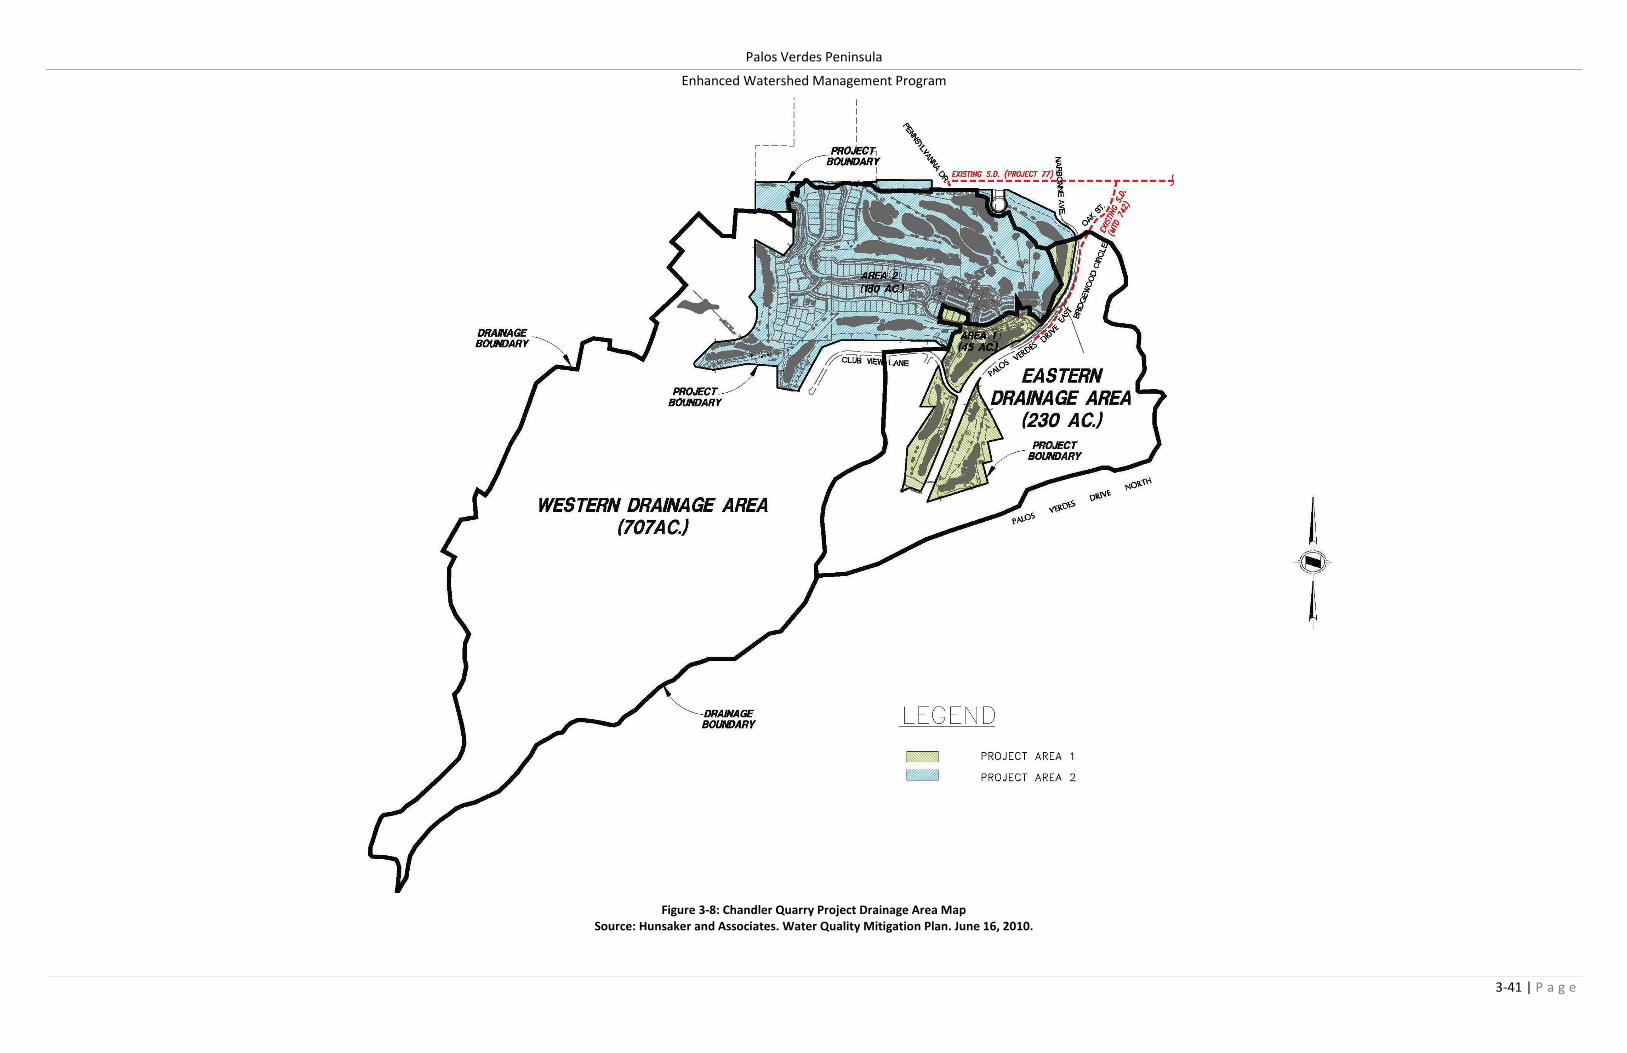
Palos Verdes Peninsula
Enhanced Watershed Management Program
3-41 | P a g e
Figure 3-8: Chandler Quarry Project Drainage Area Map Source: Hunsaker and Associates. Water Quality Mitigation Plan. June 16, 2010.

Palos Verdes Peninsula
Enhanced Watershed Management Program
3-42 | P a g e
Figure 3-9: Chandler Quarry Project Drainage and Water Quality Concept Plan
Source: Hunsaker and Associates. Water Quality Mitigation Plan. June 16, 2010.

Palos Verdes Peninsula
Enhanced Watershed Management Program
3-43 | P a g e
Figure 3-10: Chandler Quarry Project Infiltration System Concept Design Source: Hunsaker and Associates. Water Quality Mitigation Plan. June 16, 2010.

Palos Verdes Peninsula
Enhanced Watershed Management Program
3-44 | P a g e
BOTANIC GARDEN REGIONAL BMP PROJECT
The South Coast Botanic Garden (SCBG) has developed a “Vision Plan” for the SCBG, which works with the SCBG’s current strengths and highlights and provides a framework for future facility projects, programs and other improvements. A key part of the Vision Plan focuses on returning the garden’s stream corridor back to the original form and configuration of the Creek Garden and Lake. As a part of the Vision Plan, many enhancements are being considered for the garden.
The Vision Plan is conceptual and has yet to be finalized. Currently, the existing lake is scheduled to be dredged no later than 2018. Many additional opportunities are being considered. For example, as outlined in Figure 3-11, the garden’s existing creek could potentially be developed into an engineered wetland, swale, or stormwater capture facility. The existing lake could provide an opportunity for stormwater capture and possible reuse for irrigation. Additionally, an existing open space area upstream of the lake provides an opportunity for an engineered wetland, swale, or stormwater capture facility. Also, there are three natural canyons upstream of the SCBG (see Figure 3-12). An existing catch basin provides an opportunity to divert these upstream flows to a Regional BMP.
Due to the conceptual nature of the project, it was conservatively modeled as a swale in the RAA. Once the design is finalized, the RAA may be updated as part of the adaptive management process.
The South Coast Botanic Garden Regional BMP could have multiple benefits in addition to stormwater quality. These additional benefits may include, but are not limited to, the following:
Beneficial Use Protection. This project will result in higher water quality which will help to protect recreational beneficial uses and support public health (and wellness) in Machado Lake.
Increased Green Space. This project will increase the green space at the SCBG which will decrease exposed soil.
Water Conservation/Supply. The stormwater reused onsite could offset reliance on imported water supply.
Public Education/Awareness. This project will incorporate stormwater infrastructure within an area which is highly used by the public creating an awareness of stormwater quality and its importance. These onsite BMPs may serve as public education opportunities in the form of on-site educational materials, such as placards and interpretive signage. The SCBG offers tours available to the public where they will inform the attendees of the existence and importance of the onsite BMPs. During 2014, approximately 114,000 people visited the Botanic Garden, representing the scale of the potential educational impact. Additionally, the Botanic Gardens is open to the public for free the third Tuesday of each month.

Palos Verdes Peninsula
Enhanced Watershed Management Program
3-45 | P a g e
Figure 3-11: South Coast Botanic Garden - Potential Regional BMP Opportunities.
Figure 3-12: Canyons Tributary to Botanic Garden

Palos Verdes Peninsula
Enhanced Watershed Management Program
3-46 | P a g e
3.2.4.2.3. PROPOSED REGIONAL BMPS
Proposed regional BMPs were necessary in addition to those already existing and planned in order to achieve the TLRs. Prior to running the RAA model, a desktop GIS analysis was performed to determine potential areas available to locate Regional BMPs. This was done by screening areas within 1,000 feet of a 36" storm drain or open channel waterbody (such as a natural canyon) currently designated as open space (as well as other potentially useful zoning designations). The sites were then grouped by jurisdiction and listed in order by land use. The land use with the highest accessibility is listed first. Within each land use designation, the sites were listed from largest to smallest. The land uses are ranked as follows:
OPEN SPACE AND RECREATION: Sites designated for open space, parks, and recreational activities were ranked with the highest potential for future regional BMPs. This ranking is based on the fact that these types of areas have a high likelihood of being publically owned eliminating or reducing any high land acquisition costs, they generally have a high percentage of landscaped area available, and they have a greater opportunity for multiple benefits.
MUNICIPAL INSTITUTION: Sites owned by a municipality and designated for government use were ranked with the second highest potential for future Regional BMPs. This ranking is based on the institution being municipally-owned and presenting a higher likelihood of collaboration than a privately owned facility. Although this may be the case, many Municipal Institutions may not be willing to take on maintenance responsibilities which could result in the necessity of land acquisition or maintenance agreements.
GOLF COURSES/COUNTRY CLUBS: Sites designated as golf courses or country clubs were ranked with the third highest potential for future Regional BMPs. This ranking is based on the fact that these types of areas generally have a high percentage of landscaped area available and have a greater opportunity for multiple benefits. Although this may be the case, land acquisition for these sites is expected to be a difficult and costly process.
EDUCATIONAL USE: Sites designated for educational use were ranked with the fourth highest potential for future Regional BMPs. These sites generally have a high percentage of landscaped area available and have a greater opportunity for multiple benefits; however, gaining cooperation is expected to be difficult.
COMMERCIAL USE: Sites designated as commercial areas were ranked with the fifth highest potential for future regional BMPs. This ranking is based on the fact that these types of areas generally have a high percentage of parking available which could potentially be retrofitted for infiltration opportunities. Although this may be the case, land acquisition for these sites is expected to be a difficult and costly process.
The available sites were then further assessed by the Peninsula WMG to determine locations for Regional BMPs. The site selection process took into account the following characteristics:
GIS DATA GIS data was further analyzed to screen projects based on criteria such as land use, topography, hydrologic features, streets and roads, existing storm drain infrastructure, and storm drain invert depth.
PROJECT BENEFITS Projects with potential multiple benefits were prioritized due to the increase in the overall benefit and support for these projects. Benefits to take into consideration included, but were not limited to, the following: Water quality benefits Water supply benefits

Palos Verdes Peninsula
Enhanced Watershed Management Program
3-47 | P a g e
Recreational use Multi-agency benefits Publically owned Storage availability Funding available Project readiness Flood control benefits Proximity to pollutant sources or impaired waters Adjacent to existing storm drain
PROJECT CONSTRAINTS
Potential project constraints were a key component in site selection. It is important to take into consideration any constraints that may result in project infeasibility prior to the design phase. Constraints that were taken into consideration include: High groundwater Potential for deleterious geotechnical impacts (land movement) Low infiltration rates Existing soil contamination/proximity to existing soil contamination Brownfields18 Existing groundwater contamination/proximity to existing groundwater contamination Potential for soil instability (liquefaction zones, hillside areas) Existing private ownership (requires land acquisition) Cost Effectiveness (determined through RAA) Historical landmarks
These locations served as a starting point for the RAA, which was the final step to determine where BMPs were needed and the pollutant removal that could be observed through implementation of a BMP Additional information regarding the initial selection process can be found in the Potential Regional BMP Locations Technical Memorandum (Appendix 5).
As described in Appendix 6, BMPs were identified in a prioritized manner. Prioritization was based on cost (low cost BMPs were prioritized); BMP effectiveness for the pollutants of concern (BMPs that had greater treatment efficiency for the pollutant of concern in a particular analysis region were prioritized over other BMPs); and implementation feasibility as determined by desktop screening. In general, non-structural BMPs were prioritized over structural BMPs due to their lower relative cost, and then structural BMPs were identified that would result in the greatest load reduction per dollar. This was accomplished by targeting land uses with the greatest percent imperviousness and highest pollutant loads and by using BMPs with the greatest performance, particularly for the controlling pollutant. The Proposed BMPs resulting from the selection process are described below.
18 With certain legal exclusions and additions, the term "brownfield site" means real property, the expansion, redevelopment, or reuse of which may be complicated by the presence or potential presence of a hazardous substance, pollutant, or contaminant (Environmental Protection Agency).
Palos Verdes Peninsula
Enhanced Watershed Management Program
3-48 | P a g e
MACHADO LAKE WATERSHED BMPS
The Machado Lake Watershed has limited developed areas capable of implementing green street-type BMPs (due to limited areas with storm drains and available right-of-way for such projects), and are effectively prevented from implementing large scale infiltration projects due to the presence of geotechnical hazards, specifically land subsidence, and lack of available space. Additionally, the Machado Lake Watershed is held to very low WQBELs, particularly for phosphorus. Because of the low WQBELs, traditional biofiltration BMPs would not satisfy the reductions necessary to meet the TMDL limits. As a result, the potentially feasible projects that could be implemented in this area are large scale, flow-through treatment projects, such as a treatment facility with storage or a sub-surface flow wetland (SSF wetland).
PALOS VERDES LANDFILL REGIONAL BMP
A potential location for a project of this type is on or adjacent to the closed Palos Verdes Landfill main site, which is approximately 240 acres. This location was selected due to the fact that two large storm drain main lines join immediately upstream of the landfill at Hawthorne Boulevard (see Figure 3-13). Collectively, these storm drains collect runoff from approximately 1,415 acres of land within the RHECH and Wilmington Drain subwatersheds. Due to impaired groundwater and subsurface contamination at this inactive landfill which is under the oversight of DTSC, infiltration BMPs could not be considered, instead more costly treatment BMPs were evaluated. If feasible, treatment at this location could consist of either a storage-and-treatment facility or a Subsurface Flow (SSF) wetland lined with an impervious barrier. Although significantly more work is needed to investigate the feasibility, cost-effectiveness, and design details of such a BMP, the following examples of projects are sufficient to demonstrate reasonable assurance of compliance:
SSF Wetland with a design treatment rate of 15 cfs and an equalization storage volume of 50 million gallons. Assuming a hydraulic residence time of five days and a basin depth of six feet, the total footprint of such a project would be approximately 60 acres.
Treatment Facility with a treatment rate of 10 cfs (4,500 gpm) and storage of 50 million gallons, which could potentially be used for reuse.
Treatment Facility with a treatment rate of 125 cfs (56,000 gpm) and storage of two million gallons, which could potentially be used for reuse.
The Palos Verdes Landfill project would have multiple benefits in addition to the stormwater quality benefits that will be observed. These additional benefits may include, but are not limited to, the following:
Beneficial Use Protection. This project will result in higher water quality which will help to protect recreational beneficial uses and support public health (and wellness) in Machado Lake and the Greater LA Harbor.
Neighborhood Greening and Public Recreation. This project will increase the green space within this development which can positively impact the aesthetics, as well as property values, of urbanized areas. Property value tends to increase when an urban neighborhood has increased green space (CNT, 2010). Green infrastructure and green space can also alleviate urban heat-island effects by reducing temperatures by about 5oF through shade and evaporation (CNT, 2010). Recreation opportunities also can be increased by green space which may decrease the amount of cars on the road, subsequently decreasing the associated pollutants.
Public Education/Awareness. This project will incorporate stormwater infrastructure within an area which can be designed for high public use, creating an awareness of stormwater quality and its importance. This onsite BMP may serve as public education opportunities in the form of on-site educational materials, such as placards and interpretive signage.

Palos Verdes Peninsula
Enhanced Watershed Management Program
3-49 | P a g e
Figure 3-13: Proposed Palos Verdes Landfill Regional BMP Drainage Area.

Palos Verdes Peninsula
Enhanced Watershed Management Program
3-50 | P a g e
VALMONTE REGIONAL BMP
Treatment consisting of either a storage-and-treatment facility or a SSF wetland is proposed at the downstream end of the analysis region, adjacent to or immediately upstream of the Valmonte compliance monitoring location (see Figure 3-14). Approximately 400 acres are tributary to this area. Although significantly more work is needed for easement or land acquisition and to investigate the feasibility, cost-effectiveness, and design details of such a BMP, the following examples of projects are sufficient to demonstrate reasonable assurance of compliance:
SSF Wetland with a design treatment rate of 2 cfs and an equalization storage volume of 40 million gallons.
Treatment Facility with a treatment rate of 10 cfs (4,500 gpm) and storage of 15 million gallons.
Treatment Facility with a treatment rate of 30 cfs (13,500 gpm) and storage of 3.5 million gallons.
Figure 3-14: Proposed Valmonte Regional BMP Drainage Area.

Palos Verdes Peninsula
Enhanced Watershed Management Program
3-51 | P a g e
LOS ANGELES HARBOR WATERSHED BMPS
EASTVIEW PARK INFILTRATION PROJECT
Eastview Park is a large park space near the southeast corner of the intersection of Western Avenue and Westmont Drive in Rancho Palos Verdes (see Figure 3-15). A large storm drain main runs adjacent to the park, draining approximately 350 acres. Unlike most areas of the Peninsula, Eastview Park is located in a flat area with less concern for geotechnical hazards such as land subsidence. Therefore, If feasible, treatment at this location could consist of a subsurface infiltration BMP capable of capturing the 1-inch design storm19 is proposed. Assuming a depth of 6 feet, the project footprint would be approximately 3.5 acres. Multiple benefits include pollutant load reduction and groundwater recharge. Significantly more work is needed to investigate the feasibility, cost-effectiveness, and design details of such a BMP. In the case that infiltration is not a feasible option or unforeseen constraints affect the project, alternative BMPs could be proposed in the Los Angeles Harbor Watershed.
The Eastview Park Infiltration project would have multiple benefits in addition to the stormwater quality benefits that will be observed. These additional benefits may include, but are not limited to, the following:
Beneficial Use Protection. This project will result in higher water quality which will help to protect recreational beneficial uses and support public health (and wellness) at the Greater LA Harbor.
Neighborhood Greening and Public Recreation. This project will increase the green space within this development which can positively impact the aesthetics, as well as property values, of urbanized areas. Property value tends to increase when an urban neighborhood has green space or trees in sight (CNT, 2010). Green infrastructure and green space can also alleviate urban heat-island effects by reducing temperatures by about 5oF through shade and evaporation (CNT, 2010). Recreation opportunities also can be increased by increased green space which may decrease the amount of cars on the road, subsequently decreasing the associated pollutants.
Water Conservation/Supply. The stormwater retained onsite will recharge the groundwater which could potentially be used for potable or non-potable purposes in the future, thus offsetting reliance on imported water supply.
Public Education/Awareness. This project will incorporate stormwater infrastructure within an area which is highly used by the public creating an awareness of stormwater quality and its importance. The onsite BMP may serve as public education opportunities in the form of on-site educational materials, such as placards and interpretive signage.
19 The 1.25-inch storm was selected for load reduction purposes and is larger than the 85th percentile storm
(approximately 0.85-inch).

Palos Verdes Peninsula
Enhanced Watershed Management Program
3-52 | P a g e
Figure 3-15: Proposed Eastview Park Infiltration Project Drainage Area.
Palos Verdes Peninsula
Enhanced Watershed Management Program
3-53 | P a g e
3.2.4.2.4. POTENTIAL REGIONAL BMPS
In addition to the existing, planned, and proposed BMPs, several opportunities will be considered for implementation. In many cases, significantly more work is needed to investigate the feasibility, cost-effectiveness, and design details of these BMPs; however, they will be considered during the implementation phase of the EWMP. As further information is gathered, the Participating Agencies may be inclined to select the below opportunities as alternative or supplemental to the proposed BMPs listed above.
The EWMP is subject to adaptive management during the implementation phase (see Section 9 of this EWMP) and it is important for the Participating Agencies to have flexibility during the implementation phase if proposed Regional BMPs are found to be infeasible or less desirable than alternatives.
POTENTIAL MACHADO LAKE WATERSHED BMPS
WALTERIA FLOOD CONTROL BASIN
The Walteria Flood Control Basin (Walteria Basin) is a man-made basin located in the City of Torrance. The basin was built in 1962 by LACFCD. Walteria Basin has a perimeter of approximately one mile and extends to an approximate depth of 100 feet. Walteria Basin’s watershed is approximately 2,287 acres. By jurisdictional area, the basin’s watershed is 92.05% Torrance and 7.95% Palos Verdes Estates (see Figure 3-16Error! Reference source not found.).
The primary function of Walteria Basin is to provide flood protection. During storm and dry weather conditions Walteria Basin receives runoff from the surrounding watershed. Water in the basin is discharged during the dry season to pump out accumulated dry weather flows and after storm events to maintain flood protection for the adjacent communities. The discharge is pumped through the Project No. 584 storm drain and flows through the drainage network where it eventually discharges to Wilmington Drain. Wilmington Drain is a soft-bottom open channel maintained by LACFCD. Surface water in Wilmington Drain can flow via gravity or an unmanned pump station into Machado Lake. To ensure the downstream capacity is available for other storm flows, the Walteria basin is only pumped down after runoff in the watershed subsides.
In October 2014, a Special Study Monitoring Program was commenced analyzing Walteria Basin (Special Study). The objective of the Special Study is to:
Compare the mass of pollutants entering Walteria Basin and the mass of pollutants discharged.
Assess inflow and outflow compared to TMDL waste load allocations.
As part of the Special Study, LACFCD is monitoring the 4 inlets to Walteria Basin. The City of Torrance is monitoring the discharges from Walteria Basin during pumping events. The Special Study will span 2 years, and preliminary results will be available late 2015.
Pending results of the Special Study, an appropriate Regional BMP will be identified. A variety of BMPs are currently being investigated including:
Application of aluminum sulfate to Walteria Basin.
A diversion of the outflows from Walteria Basin to the Torrance airport for infiltration to groundwater.
Use of water collected in Walteria to irrigate a nearby park or open space.
Palos Verdes Peninsula
Enhanced Watershed Management Program
3-54 | P a g e
As the Special Study is completed in late 2016, funding and selection of appropriate BMPs will be determined. A BMP implementation strategy for Walteria Basin will be refined and reported through adaptive management.
The Walteria Flood Control Basin project would have multiple benefits in addition to the stormwater quality benefits that will be observed. These additional benefits may include, but are not limited to, the following:
Beneficial Use Protection. This project will result in higher water quality which will help to protect recreational beneficial uses and support public health (and wellness) in Machado Lake and the Greater LA Harbor.
Public Education/Awareness. This project will incorporate stormwater infrastructure within an area which can be designed for high public use, creating an awareness of stormwater quality and its importance. This onsite BMP may serve as public education opportunities in the form of on-site educational materials, such as placards and interpretive signage.
Neighborhood Greening and Public Recreation. This project will increase the green space within this development which can positively impact the aesthetics, as well as property values, of urbanized areas. Property value tends to increase when an urban neighborhood has increased green space (CNT, 2010). Green infrastructure and green space can also alleviate urban heat-island effects by reducing temperatures by about 5oF through shade and evaporation (CNT, 2010). Recreation opportunities also can be increased by green space which may decrease the amount of cars on the road, subsequently decreasing the associated pollutants.

Palos Verdes Peninsula
Enhanced Watershed Management Program
3-55 | P a g e
Figure 3-16: Walteria Lake Watershed Arial View.

Palos Verdes Peninsula
Enhanced Watershed Management Program
3-56 | P a g e
TORRANCE AIRPORT BASIN
An alternative BMP that the Peninsula WMG will take into consideration is an infiltration system near the Torrance Airport, located within the Machado Lake Watershed, but outside of the Peninsula WMG watershed (see Figure 3-17). The parties draining to this BMP include the cities of Los Angeles, Torrance, Carson, Lomita, Rolling Hills, Rolling Hills Estates, Rancho Palos Verdes, Redondo Beach, and Palos Verdes Estates, and unincorporated Los Angeles County.
There are three potential sites for treatment; A1, A2, and A3. Stormwater runoff from the Peninsula WMG could be treated at sites A2 and A3 from a diversion structure Div4 (see Figure 3-18). Although this project was not modeled in the RAA, it would be designed for the 85th percentile, 24-hour storm.
The Peninsula WMG is currently moving forward with an investigation to determine the feasibility, cost-effectiveness, and design details for this project and it will be further considered during the implementation phase of the EWMP. If feasible, this BMP could potentially solve the difficult challenges the Peninsula WMG faces with infiltration infeasibility and stringent phosphorus goals.
The Torrance Airport Infiltration System would have multiple benefits in addition to the stormwater quality benefits that could be observed. These additional benefits may include, but are not limited to, the following:
Beneficial Use Protection. This project will result in higher water quality which will help to protect recreational beneficial uses and support public health (and wellness) in Machado Lake and the Greater LA Harbor.
Flood Management. This project will decrease flood risk by reducing runoff rate and volume.
Water Conservation/Supply. The stormwater retained onsite will recharge the groundwater which will be used by the golf course for non-potable purposes, thus offsetting reliance on imported water supply.
Figure 3-17: Torrance Airport Drainage Area.

Palos Verdes Peninsula
Enhanced Watershed Management Program
3-57 | P a g e
Figure 3-18: Conceptual Layout of Torrance Airport Basin
Source: Enhanced Watershed Management Program for the Machado Lake Watershed. City of Torrance. March 2016.
VALMONTE LOW FLOW DIVERSION BMP
An alternative BMP that the Peninsula WMG will take into consideration is a low flow diversion system within the Valmonte Subwatershed, located within the Machado Lake Watershed, or in another location within the Peninsula Watershed. Although this BMP was not modeled in the RAA, historical data suggests that a low flow diversion BMP could have significant effects on the stormwater quality of this area, and there is a sanitary sewer line adjacent to the site which could potentially receive the diverted flow. Due to the nature of this project, which would effectively be a dry weather/low flow diversion, its benefits could not be quantified in the RAA model.
Although significantly more work is needed to investigate the feasibility, cost-effectiveness, and design details of such a BMP, a low flow diversion system will be considered during the implementation phase of the EWMP. A Low Flow Diversion BMP would have multiple benefits in addition to the stormwater quality benefits including, but are not limited to, beneficial use protection. This project will result in higher water quality which will help to protect recreational beneficial uses and support public health (and wellness) in Machado Lake.

Palos Verdes Peninsula
Enhanced Watershed Management Program
3-58 | P a g e
FERN CREEK STREAM RESTORATION
Fern Creek, located within the City of Rolling Hills Estates, has been identified has having areas susceptible to ponding conditions. Restoring the creek would likely result in subsequent nutrient reductions in the downstream areas. Due to the unknown condition of the stream and status of ownership/easements, the project was not included in the RAA model; however, further investigation will be considered as part of this EWMP. The Fern Creek Stream Restoration would have multiple benefits in addition to the stormwater quality benefits including, but are not limited to, beneficial use protection. This project will result in higher water quality which will help to protect recreational beneficial uses and support public health (and wellness) in Machado Lake.
MACHADO LAKE RESTORATION
This project is comprised of three components; Wilmington Drain Multi-use; Machado Lake Ecosystem Rehabilitation; and a Supplemental Water Supply Pipeline. One of the main goals of this project is to improve the water quality conditions to meet the existing and future TMDL requirements of Machado Lake. Currently, the LACFCD and City of Los Angeles collaborated on the Wilmington Drain Multi-use component, while the City of Los Angeles is leading the Machado Lake Ecosystem Rehabilitation and Supplemental Water Supply Pipeline. The Peninsula WMG may consider collaborating where feasible on the Supplemental Water Supply Pipeline.
The Supplemental Water Supply Pipeline Component will include installation of a new 16-inch (or smaller) supplemental water pipeline to deliver microfiltration (MF)/reverse osmosis (RO) treated water to Machado Lake for lake replenishment during the dry season. Once completed, the Supplemental Water Supply Pipeline Component will result in a significant increase in the water quality of Machado Lake during dry weather. As a result of this project, the health of the waterbody will be improved significantly and could result in a reconsideration of the WQBELs in the existing TMDL.
The Machado Lake Restoration would have multiple benefits in addition to the stormwater quality benefits including, but are not limited to, beneficial use protection. This project will result in higher water quality which will help to protect recreational beneficial uses and support public health (and wellness) in Machado Lake.
REOPENER FOR THE MACHADO LAKE NUTRIENT TMDL
As the Participating Agencies work diligently to comply with the Machado Lake Nutrient TMDL, it is becoming apparent that the effluent limitations are very difficult to achieve. A TMDL reopener to allow reevaluation of the TMDL prior to final compliance is an avenue which the Peninsula WMG plans to support. In the instance that a TMDL reopener results in higher WQBELs, alternative BMPs such as traditional biofiltration may be sufficient to reach compliance.

Palos Verdes Peninsula
Enhanced Watershed Management Program
3-59 | P a g e
POTENTIAL SANTA MONICA BAY WATERSHED BMPS
MALAGA COVE WATER REUSE20
The City of Palos Verdes Estates has implemented dewatering measures to prevent nuisance rising groundwater from damaging homes and businesses in Malaga Cove. The nuisance groundwater removed from these dewatering sites is currently discharged into the local storm drain system and/or to the nearby Pacific Ocean. This project proposes to divert this water to an existing golf course and potentially a school in Palos Verdes Estates for irrigation use. While the source of the rising groundwater is most likely infiltrated stormwater and irrigation water, this project would serve as a dry weather/low flow diversion rather than as stormwater capture or treatment project. Although this potential project has not been included in the load reductions modeled in the RAA, it has the potential to contribute to additional pollutant removal by reducing or eliminating non-stormwater discharges and low flow wet weather flows from the drainage area.
More work is needed to investigate the feasibility, cost-effectiveness, and design details of such a BMP; however, this project will be considered during the implementation phase of the EWMP. The Malaga Cove Water Reuse project would have multiple benefits in addition to the stormwater quality benefits that will be observed. These additional benefits may include, but are not limited to, the following:
Beneficial Use Protection. This project will result in higher water quality which will help to protect recreational beneficial uses and support public health (and wellness) at Machado Lake and the Santa Monica Bay.
Water Conservation/Supply. Stormwater retained in capture-and-use BMPs can be reused for irrigation and other on-site, non-potable uses, thus promoting water conservation and offsetting reliance on the potable water supply.
ABALONE COVE WATER REUSE21
The City of Ranchos Palos Verdes has implemented dewatering measures to prevent nuisance groundwater from damaging homes and businesses. In the City of Rancho Palos Verdes, continuous-withdrawal dewatering wells have been installed to slow the progression of the Abalone Cove Landslide and the Portuguese Bend Landslide. The nuisance groundwater removed from these dewatering sites is currently discharged into the local storm drain system and/or to the nearby Pacific Ocean. This potential project proposes to divert this water to existing golf courses in Rancho Palos Verdes for irrigation use. Although this potential project has not been included in the load reductions modeled in the RAA, it has the potential to contribute to additional pollutant removal by reducing or eliminating non-stormwater discharges and low flow wet weather flows from the drainage area.
More work is needed to investigate the feasibility, cost-effectiveness, and design details of such a BMP; however, this project will be considered during the implementation phase of the EWMP. The Abalone Cove Water Reuse project would have multiple benefits in addition to the stormwater quality benefits that will be observed. These additional benefits may include, but are not limited to, the following:
Beneficial Use Protection. This project will result in higher water quality which will help to protect recreational beneficial uses and support public health (and wellness) at Machado Lake and the Santa Monica Bay.
Water Conservation/Supply. Stormwater retained in capture-and-use BMPs can be reused for irrigation and other on-site, non-potable.
20 RMC. “Abalone Cove Project and Malaga Cove Plaza Project Conceptual Evaluation.” August 06, 2009. 21 Information gathered from a feasibility study which is currently being conducted for this project.

Palos Verdes Peninsula
Enhanced Watershed Management Program
3-60 | P a g e
3.2.4.2.5. STAKEHOLDER INCORPORATION
STAKEHOLDER MEETINGS
In addition to participating in the various Technical Advisory Committees and Subcommittees, the Peninsula WMG has actively encouraged stakeholder input on the Peninsula EWMP development. Two workshops were held to engage stakeholders in the Peninsula EWMP development process and solicit input. Key stakeholders were identified and invited to participate. These stakeholders include:
Key City Staff including, but not limited to, the following: o Administrators o Public Works o Stormwater Managers
City Council Members and Water Quality and Flood Protection Oversight Committee
Governmental Organizations Staff including, but not limited to, the following: o California Water Service Company (CalWater) o LA County Parks o LA County Sanitation Districts o Regional Water Quality Control Board o US EPA o West Basin Municipal Water District
Non-Governmental Environmental Organizations Staff including, but not limited to, the following: o California Coastal Conservancy o Council for Watershed Health o Environment Now o Heal the Bay o Los Angeles Waterkeeper o Natural Resources Defense Council (NRDC) o Palos Verdes Botanic Garden o Palos Verdes Peninsula Land Conservancy
(PVPLC) o Palos Verdes Peninsula Unified School
District o Santa Monica Bay Restoration Commission o The Nature Conservancy o Watershed Conservation Authority o Water Replenishment District of Southern California
Non-Governmental Organizations Staff including, but not limited to, the following: o LA County Parks o Palos Verdes Golf Course o Palos Verdes Peninsula News o South Coast Botanic Garden (SCBG) o Trump National Golf Club
Palos Verdes Peninsula Residents

Palos Verdes Peninsula
Enhanced Watershed Management Program
3-61 | P a g e
The first public workshop was held on May 8, 2014. This workshop presented an overview of the EWMP development process and the CIMP. Potential Watershed Control Measures were discussed and attendees were encouraged to provide feedback via email or a comment card that was distributed at the workshop.
Following the first workshop three separate meetings were held with specific stakeholders who expressed interest in providing more detailed input into the Peninsula EWMP. On December 8, 2014 the Peninsula WMG met with the South Coast Botanic Garden (SCBG) staff for a site walk. Different BMP options were discussed, one of which was incorporated into the RAA (see Sections 3.2.4.2.2 and 4). On February 12, 2015 the Peninsula WMG met with staff from the Palos Verdes Peninsula Land Conservancy (PVPLC). Options to incorporate the resources and knowledge available through the PVPLC were presented (see detailed discussion below). On March 31, 2015 the Peninsula WMG met with staff from the Palos Verdes Golf Club. Opportunities to capture and reuse stormwater to irrigate the Golf Course were discussed (see detailed discussion below).
The second public workshop was held on May 6, 2015. This workshop covered the Peninsula EWMP including the proposed BMPs and how Stakeholder input was incorporated. The attendees were encouraged to continue to send feedback and suggestions. Working towards better stormwater quality is a continued effort and collaboration with individuals and organizations with similar goals is essential to achieving that quality.
The following sections describe projects which are being considered as a result of Stakeholder input. These opportunities are being considered for future inclusion. Once a finalized approach has been determined, the BMPs will be modeled as appropriate during adaptive management.
PALOS VERDES PENINSULA LAND CONSERVANCY
During the Peninsula EWMP Stakeholder Meeting held in May 2014, the PVPLC expressed an interest in participating in the Peninsula EWMP. To follow up, the Peninsula WMG invited the PVPLC to attend a focused meeting on February 12th, 2015 regarding opportunities to work together. As a result, a relationship with the PVPLC and the Peninsula WMG has been established.
The Palos Verdes Peninsula Land Conservancy (PVPLC) was founded in 1988 by a group of concerned area residents to preserve open space on the Palos Verdes Peninsula, restore the habitat and allow public access to the preserved lands in perpetuity. The focus of the PVPLC is to create and manage large blocks of natural open space.
There are many opportunities to work with the PVPLC to incorporate drought-tolerant, native plants within the watershed. Projects were not specifically identified to be included in the EWMP at this time; however, the PVPLC has projects currently committed to within the watershed and their relationship with the Peninsula WMG could be beneficial in incorporating their expertise into future plans. Benefits for incorporating drought-tolerant, native plants include reduced non-stormwater flow, reduced nutrients, and reduced sediment discharge. The sediment discharge reduction would be observed through incorporating drought-tolerant, native plants in areas which currently have exposed sediment. Since sediment is a large contributor to pollutant transport, erosion reduction could be highly beneficial.
In addition to providing drought tolerant landscape alternatives, the PVPLC is also interested in accepting stormwater as an alternative irrigation supply.

Palos Verdes Peninsula
Enhanced Watershed Management Program
3-62 | P a g e
Figure 3-20 shows areas which the PVPLC has designated for protection. In addition to these areas, the PVPLC has purchased a portion of Malaga Canyon in Rancho Palos Verdes and are in the process of obtaining final contracts and easements to begin restoration. The PVPLC is committed to restoring 5 acres per year of land, which they generally exceed. A potential project that the PVPLC is currently involved within includes the deconstruction of homes within the Bluff Cove area due to geotechnical concerns (see
Figure 3-19). This area would be restored to natural conditions following deconstruction.
Figure 3-20: Palos Verdes Peninsula Land Conservancy Open Space Preserves
PALOS VERDES GOLF COURSE REGIONAL BMP PROJECT
The Palos Verdes Golf Course is city-owned and operated by a concessionaire, and located within Palos Verdes Estates. The facility is dual-plumbed to allow for a secondary source of water for irrigation purposes. The golf course is in the process of weighing options for their secondary source of water.
Since stormwater capture is not a consistent supply, the best available source that could potentially benefit the Peninsula WMG and meet the requirements of the golf course is the baseline flow within the RDD 275 subdrainage area. RDD 275 is monitoring location identified in the Peninsula CIMP and is in the RHE subwatershed. The RDD 275 subdrainage area is comprised of 860 acres, excluding Ranchview and Chadwick Canyons, and consists primarily of hardened conveyances. The subdrainage area includes the
Figure 3-19: Bluff Cove

Palos Verdes Peninsula
Enhanced Watershed Management Program
3-63 | P a g e
Rolling Hills Estates downtown commercial area; residential areas in Rancho Palos Verdes, Rolling Hills, and County unincorporated; equestrian properties; a private K-12 academy; and arterial roadways (Silver Spur Road and Crenshaw Boulevard). Baseline dry weather flow has been observed where the RDD 275 subdrainage area daylights in a trapezoidal ditch along Crenshaw Boulevard (see Figure 3-21), and estimates of flow rate have been made from within the manhole at RHE City Hall which is a current monitoring location.
The Palos Verdes Golf Course has requested and analyzed samples of water within the RDD 275 subdrainage area and determined that with treatment and/or blending the water quality is satisfactory as a secondary source for irrigation. The Palos Verdes Golf Course, the Peninsula WMG will move forward with gathering accurate flow data to determine if the flow available will meet the irrigation demands of the Palos Verdes Golf Course.
Although this potential project has not been included in the load reductions modeled in the RAA, it has the potential to contribute to additional pollutant removal by reducing or eliminating non-stormwater discharges and low flow wet weather flows from the drainage area.
Figure 3-21: RDD 275 – Looking South/Upstream along Crenshaw Boulevard.
CALWATER PROJECT
CalWater reached out to the Peninsula WMG following a stakeholder meeting held in May 2014. They expressed an interest in working with the Peninsula WMG in the implementation of a regional BMP. Although finalized projects have not been determined, the Peninsula WMG has established an important relationship with CalWater for future collaboration on projects to reach a common goal.

Palos Verdes Peninsula
Enhanced Watershed Management Program
4-1 | P a g e
4. REASONABLE ASSURANCE ANALYSIS
4.1. EXECUTIVE SUMMARY
The MS4 Permit requires that a Reasonable Assurance Analysis (RAA) be conducted for the waterbody-pollutant combinations addressed by this EWMP. The RAA involves the identification and evaluation of potential BMP implementation scenarios with respect to the MS4 Permit-specified effluent and receiving water limits for the priority pollutants of concern for the Peninsula WMG. The RAA demonstrates achievement of these effluent and receiving water limits for each waterbody-pollutant combination addressed in this EWMP. The RAA presented herewith conforms to Part VI.C.5.b.iv (5) of the MS4 Permit, which states:
Permittees shall conduct a Reasonable Assurance Analysis for each waterbody-pollutant combination addressed by the [EWMP]. [The] RAA shall be quantitative and performed using a peer-reviewed model in the public domain. Models to be considered for the RAA, without exclusion, are the Watershed Management Modeling System (WMMS), Hydrologic Simulation Program-FORTRAN (HSPF), and the Structural BMP Prioritization and Analysis Tool (SBPAT)…. The objective of the RAA shall be to demonstrate the ability of [the EWMP] to ensure that Permittees’ MS4 discharges achieve applicable water quality based effluent limitations and do not cause or contribute to exceedances of receiving water limitations.
In early 2014, the Regional Board also developed a guidance document titled, “Guidelines for Conducting Reasonable Assurance Analysis in a Watershed Management Program, Including an Enhanced Watershed Management Program.” Although the guidance document presents guidelines and not necessarily strict requirements, the RAA presented herewith has been developed to conform to the Regional Board guidance document where appropriate.
The RAA approach leverages the strengths of the publicly available, MS4 Permit-approved, GIS-based SBPAT model program that has been developed for the region1. The following describes the rationale for utilization of this model for the RAA. A non-modeling based methodology was applied for the dry weather RAA (refer to Attachment 4.A for a detailed description).
SBPAT is a public domain, “open source,” GIS-based water quality analysis tool intended to: 1) facilitate the identification, prioritization, and selection of BMP project opportunities and technologies in urbanized watersheds; and 2) quantify benefits, costs, variability, and potential compliance risk associated with stormwater quality projects. The decision to use SBPAT for the Peninsula WMG RAA in the manner described below was partially based on the model capabilities and the unique characteristics of the Peninsula WMG, specifically:
1. Modeling of SMB hydrologic and watershed processes – SBPAT utilizes EPA’s Stormwater Management Model (SWMM) as the hydrologic engine, and SBPAT has been calibrated to local rainfall and SMB streamflow gauges, confirming the ability to predict stormwater runoff volumes on an annual basis;
1 SBPAT is specifically referenced in the MS4 Permit Part VI.C.5.b.iv and was presented at the first two Permit Group TAC RAA Subcommittee meetings.

Palos Verdes Peninsula
Enhanced Watershed Management Program
4-2 | P a g e
2. SMB pollutants of concern and their compliance metric expression – SBPAT has been utilized for planning applications related to Bacteria TMDL compliance (and specifically exceedance-day predictions, based on SMB criteria), including a demonstrated linkage of watershed bacteria loading to beach exceedance days;
3. Availability of new open space water quality loading data – Recently developed Event Mean Concentration (EMC) data are consistent with, and easily incorporated into, SBPAT and were developed in SMB as part of this RAA-development effort;
4. Capability to conduct opportunity and constraints investigations – SBPAT is capable of supporting structural BMP placement, prioritization, and cost-benefit quantification, and has been applied for such purposes previously in other SMB watersheds;
5. Characterization of water quality variability – SBPAT is capable of quantifying model output variability and confidence levels, which is a component of the Regional Board’s recent RAA guidance; and
6. Supports quantification of interim milestones, consistent with methods addressing both structural and non-structural BMPs – SBPAT can model interim design scenarios by adjusting BMP input parameters to represent steps in BMP phasing. SBPAT can also model some non-structural wet weather BMPs, such as LID incentives and LID ordinance implementation for redevelopment projects.
4.2. REASONABLE ASSURANCE ANALYSIS
The Reasonable Assurance Analysis for the Peninsula WMG is included in Appendix 6.

Palos Verdes Peninsula
Enhanced Watershed Management Program
5-1 | P a g e
5. COMPLIANCE SCHEDULE
This Chapter provides the compliance schedule for the Peninsula WMG. The compliance schedule will be used to measure progress toward addressing the highest WQPs and achieving interim and final WQBELs and RWLs.
5.1. INTRODUCTION
Sections VI.C.2 and VI.C.3 of the MS4 Permit describe how compliance with receiving water limits (RWLs) is to be attained for various water body-pollutant combinations (WBPC) identified during the EWMP development process. Specifically, the following categories of WBPCs are to be addressed by the EWMP:
WBPCs Addressed through a TMDL (Category 1 pollutants)
303(d)-listed WBPCs (Category 2 Pollutants) o Pollutants in the same class as those identified in a TMDL and for which the waterbody is 303(d)-
listed (Section VI.C.2.a.i) o Pollutants not in the same class as those identified in a TMDL, but for which the waterbody is
303(d)-listed (Section VI.C.2.a.ii).
Non 303(d)-listed WBPCs (Category 3 pollutants) o Pollutants for which there are exceedances of RWLs, but for which the waterbody is not 303(d)-
listed (Section VI.C.2.a.iii).
Table 5-1 displays the WBPCs identified in the EWMP and summarizes which category of WBPC they fall into. These identified WBPCs are the Water Quality Priorities for the Peninsula WMG. Requirements for achieving RWLs for each category are described in the following sections.
REQUIREMENTS FOR WATERBODY-POLLUTANT COMBINATIONS ADDRESSED BY A TMDL (CATEGORY 1
POLLUTANTS) AND 303(D) LISTED POLLUTANTS IN THE SAME CLASS AS THOSE ADDRESSED BY A TMDL
For WBPCs addressed by a TMDL, adherence to all requirements and compliance dates set forth in the approved EWMP will constitute compliance with applicable interim TMDL-based water quality based effluent limits and interim receiving water limits outlined in Permit Part VI.E and Attachments L-R. Most of the WBPCs addressed through a TMDL have corresponding interim and/or final compliance milestones that fall within the term of the Permit. However, there are a few WBPCs being addressed by a TMDL for which interim compliance milestones need to be developed within the term of the Permit. Table 5-2 summarizes the applicable TMDL compliance dates and those that have been developed for the EWMP.
During the adaptive management process, if a WBPC within the Peninsula WMG is added to the State’s 303(d) list that falls within the same class as those being addressed by a TMDL, the WBPC will be added to the list of Water Quality Priorities and the following actions will be completed per Permit Section VI.C.2.a.i:
It will be demonstrated that Watershed Control Measures (WCMs) selected to achieve the applicable TMDL provisions will also adequately address MS4 contributions of the pollutant(s) within the same class. Assumptions and requirements of the corresponding TMDL provisions must be applied to the additional pollutant(s), including interim and final requirements and deadlines for their achievement, such that the MS4 discharges of the pollutant(s) will not cause or contribute to exceedances of receiving water limitations.

Palos Verdes Peninsula
Enhanced Watershed Management Program
5-2 | P a g e
The WBPC will be included in the Reasonable Assurance Analysis (RAA)
Milestones and dates for their achievement will be developed consistent with those in the applicable TMDL.
REQUIREMENTS FOR 303(D) LISTED WATER BODY POLLUTANT COMBINATIONS (CATEGORY 2 POLLUTANTS)
NOT IN THE SAME CLASS AS THOSE ADDRESSED BY A TMDL
Currently, coliform bacteria in the Wilmington Drain Subwatershed is the only 303(d)-listed pollutant within the Peninsula WMG that is not being addressed by a TMDL1. This WBPC is not in the same class as any existing TMDL within the Dominguez Channel Watershed Management Area portion of the Peninsula EWMP Area. Although a definitive linkage between coliform bacteria in Wilmington Drain and MS4 discharges from the Peninsula WMG has not been demonstrated, the MS4 system may cause or contribute to this impairment. Therefore, the following actions have been completed as part of the EWMP to address coliform bacteria in Wilmington Drain:
This WBPC was included in the RAA.
WCMs were selected to address contributions of indicator bacteria from MS4 discharges coming from the Peninsula WMG, such that these MS4 discharges will not cause or contribute to the exceedance of the receiving water limits coliform bacteria.
Milestones and dates for BMP implementation have been identified to control MS4 discharges such that they do not cause or contribute to exceedances of receiving water limitations within a timeframe that is as short as practicable, taking into account the technological, operational, and economic factors that affect the design, development, and implementation of the WCMs that are necessary.
Milestones relate to a specific water quality endpoint (e.g., percent load reduction) and dates relate either to taking a specific action or meeting a numeric water quality endpoint.
If the identified dates are beyond the term of the Permit, the following will apply per Permit Section VI.C.2.a.ii(5): o In drainage areas where retention of all nonstormwater runoff and all stormwater runoff from
the 85th percentile, 24-hour storm event will be achieved, efforts will continue to target implementation of WCMs identified in the EWMP, including WCMs to eliminate nonstormwater discharges that are a source of pollutants to receiving waters.
o For areas where retention of the volume described above is technically infeasible and where the Regional Board determines that MS4 discharges cause or contribute to the water quality impairment, development of a stakeholder-proposed TMDL may be initiated upon approval of the EWMP. For MS4 discharges from these drainage areas to the receiving waters, any extension of this compliance mechanism beyond the term of the Permit will be consistent with the implementation schedule in a TMDL for the WBPC(s) adopted by the Regional Board.
1 A 303 (d) listing for copper and lead also exists for the Wilmington Drain, however, a September 2010 modification of the consent decree between the USEPA, the Santa Monica BayKeeper and Heal the Bay Inc., represented by the Natural Resources Defense Council (NRDC) included a finding of non-impairment for copper and lead in Wilmington Drain. No water quality data are currently available for the Wilmington Drain; however, the Regional Water Resources Control Board has indicated that the impairments for copper and lead will be removed from the 303(d) list when sufficient data is available to de-list in accordance with the State Listing Policy. Therefore, these WBPCs will not be addressed through this EWMP.

Palos Verdes Peninsula
Enhanced Watershed Management Program
5-3 | P a g e
REQUIREMENTS FOR NON 303(D)-LISTED WATER BODY-POLLUTANT COMBINATIONS (CATEGORY 3
POLLUTANTS)
Permit Section C.2.a.iii discusses the requirements for pollutants for which there are exceedances of RWLs, but for which the waterbody is not 303(d)-listed. At this time, there have not been any Category 3 pollutants identified within the Peninsula WMG. As part of the adaptive management process, should any WBPCs be identified as a Category 3 pollutant during implementation of the CIMP and the MS4 is identified as a source of the pollutant(s), the following actions will be taken to modify the EWMP:
WCMs will be identified to address contributions of the pollutant(s) from MS4 discharges to the receiving water(s), such that the MS4 discharges of the pollutant(s) will not cause or contribute to the exceedance of the RWLs.
The RAA will be revised for the identified WBPCs.
Enforceable milestones and dates for their achievement will be identified to control MS4 discharges such that they do not cause or contribute to exceedances of receiving water limitations within a timeframe as short as possible, taking into account the technological, operation, and economic factors that affect design, development, and implementation of the control measures that are necessary. o The time between dates will not exceed one year o Milestones will relate to a specific water quality endpoint and dates will relate either to taking a
specific action or meeting a milestone
If the identified dates are beyond the term of the Permit, the following will apply per Permit Section VI.C.2.a.ii(5): o In drainage areas where retention of all nonstormwater runoff and all stormwater runoff from
the 85th percentile, 24-hour storm event will be achieved, efforts will continue to target implementation of WCMs identified in the EWMP, including WCMs to eliminate nonstormwater discharges that are a source of pollutants to receiving waters.
o For areas where retention of the volume described above is technically infeasible and where the Regional Board determines that MS4 discharges cause or contribute to the water quality impairment, development of a stakeholder-proposed TMDL may be initiated upon approval of the EWMP. For MS4 discharges from these drainage areas to the receiving waters, any extension of this compliance mechanism beyond the term of the Permit will be consistent with the implementation schedule in a TMDL for the WBPC(s) adopted by the Regional Board.

Palos Verdes Peninsula
Enhanced Watershed Management Program
5-4 | P a g e
5.2. SCHEDULES
According to Permit Section VI.C.5.c, TMDL compliance schedules must be incorporated into the EWMP to demonstrate that WCMs selected during EWMP development will adequately address these WBPCs in a timely manner so that MS4 discharges of the pollutants will not cause or contribute to exceedances of RWLs.
Permit Section VI.C.5.c states that the EWMP must incorporate TMDL schedules outlined in Permit Attachments L through R and, where necessary, develop interim milestones and dates for their achievement during the Permit term2. These schedules must be used to measure progress towards addressing the highest water quality priorities and achieving applicable water quality-based effluent limitations (WQBELS) and/or RWLs.
These schedules must meet the following criteria:
Schedules must be adequate for measuring progress on a watershed scale once every two years.
Schedules must be developed for all WCMs that will be implemented individually and on a watershed scale.
Schedules must also incorporate the following:
Applicable interim and/or final TMDL compliance deadlines occurring within the Permit term identified in Permit Part VI.E and Attachments L through R
Interim milestones and dates for their achievement within the Permit term must be developed for any applicable TMDL(s) where deadlines within the Permit term are not otherwise specified
Interim milestones and dates for their achievement within the Permit term must be developed for Water Quality Priorities not addressed through a TMDL (Category 2 and 3 WBPCs) based on the following criteria: o Milestones must be based on measureable criteria or indicators, to be achieved in the receiving
waters and/or MS4 discharges, o A schedule with dates for achieving the milestones must be developed, and o A final date for achieving the receiving water limitations as soon as possible must be determined.
The Peninsula WMG has identified Category 1 and 2 WBPCs as summarized in Table 5-1 below. As the table shows, all the Water Quality Priorities for the Peninsula WMG are being addressed through a TMDL, with the exception of coliform bacteria in Wilmington Drain. This WBPC is listed on the State's 303(d) list and does not fall within the same class as any TMDL pollutant within its watershed as described above.
Table 5-2 and Table 5-3 below outline the compliance milestones and corresponding water quality objectives to be achieved by the Peninsula EWMP. Bold-italic font indicates where a milestone or interim and/or final water quality objective was developed for the EWMP to meet the requirements described above. In many cases, there is no baseline established due to lack of monitoring data. In these instances, a baseline load was determined during RAA modeling and the compliance milestone is connected to a percentage reduction from this to be determined (TBD) baseline load.
2 The MS4 Permit term is assumed to be December 28, 2012 thru December 28, 2017.

Palos Verdes Peninsula
Enhanced Watershed Management Program
5-5 | P a g e
Table 5-1: WBPCs Identified in the Peninsula WMG.
Category Class Pollutant Waterbody WBPC Type(a)
Category 1
Trash Trash/Marine Debris Santa Monica Bay and Machado Lake TMDL
Bacteria Coliform and Enterococcus Santa Monica Bay TMDL
Historic Organics
PCBs Santa Monica Bay, Machado Lake and Los Angeles Harbor TMDL
DDT Santa Monica Bay, Machado Lake and Los Angeles Harbor TMDL
Chlordane Machado Lake and Los Angeles Harbor TMDL
Dieldrin Machado Lake TMDL
Nutrients
Total Nitrogen Machado Lake TMDL
Total Phosphorus Machado Lake TMDL
Ammonia Machado Lake TMDL
Chlorophyll a(b) Machado Lake TMDL
Dissolved Oxygen(b) Machado Lake TMDL
Odor(b) Machado Lake TMDL
Eutrophic Conditions(b) Machado Lake TMDL
Algae(b) Machado Lake TMDL
Metals
Copper Los Angeles Harbor TMDL
Lead Los Angeles Harbor TMDL
Mercury Los Angeles Harbor TMDL
Zinc Los Angeles Harbor TMDL
PAHs
PAHs Los Angeles Harbor TMDL
Benzo(a)pyrene Los Angeles Harbor TMDL
Chrysene Los Angeles Harbor TMDL
Benzo[a]anthracene Los Angeles Harbor TMDL
Dibenz[a,h]anthracene Los Angeles Harbor TMDL
Phenanthrene Los Angeles Harbor TMDL
Pyrene Los Angeles Harbor TMDL
Category 2 Metals Copper and Lead3 Machado Lake (Wilmington Drain) 303(d)
Bacteria Coliform Bacteria Machado Lake (Wilmington Drain) 303(d) (a) TMDL - WBPC addressed through a TMDL; 303(d) - WBPC listed on the State's 303(d) List (b) These “constituents” are not pollutants, but rather describe water quality conditions associated with excessive nutrients; therefore they have been categorized in the same class as other nutrients.
3 A September 2010 modification of the consent decree between the USEPA, the Santa Monica BayKeeper and Heal the Bay Inc., represented by the Natural Resources Defense Council (NRDC) included a finding of non-impairment for copper and lead in Wilmington Drain. The Regional Water Resources Control Board has indicated that the impairments for copper and lead will be removed from the 303(d) list when sufficient data is available to de-list in accordance with the State Listing Policy.

Palos Verdes Peninsula
Enhanced Watershed Management Program
5-6 | P a g e
Table 5-2: TMDL and 303(d) WBPC Interim (I), Final (F), and Action (A) Compliance Milestones.
TMDL/ 303(d) Segments Constituents
Compliance Goal Weather Condition
Dates and Milestones
2012 2013 2014 2015 2016 2017* 2018 2019 2020 2032 2040
Santa Monica Bay Beaches
Bacteria
Abalone Cove Bluff Cove
Inspiration Point Long Point
Malaga Cove Portuguese Bend
Total Coliform Fecal Coliform Enterococcus
Compliance with Total Allowable
Exceedance Days
Winter Dry 12/28
F - - - - - - - - - -
Summer Dry 12/28
F - - - - - - - - - -
Wet 12/28
F - - - - - - - - - -
Santa Monica Bay Nearshore and Offshore
Debris
All Trash
Plastic Pellets
% Reduction in Trash from
Baseline Wet and Dry - - - -
3/20 20%
3/20 40%
3/20 60%
3/20 80%
3/20 100%
- -
Santa Monica Bay DDT &PCBs
Abalone Cove Bluff Cove
DDT PCBs
Meet WLAs Wet and Dry - - - - - 12/28
A - - - - -
Machado Lake Trash
All Trash % Reduction in
Trash from Baseline
Wet and Dry 3/6 20%
3/6 40%
3/6 60%
3/6 80%
3/6 100%
- - - - - -
Machado Lake Pesticides and
PCBs All
Chlordane Dieldrin
PCBs DDT
Meet WQBELs Wet and Dry - - - - - 12/28
A
9/30 F
- -
Machado Lake Nutrient
All
Algae Total Nitrogen
Total Phosphorus Ammonia
Chlorophyll a Dissolved Oxygen
Odor
Meet WLA Wet and Dry - - 3/11
I - - -
9/11 F
- - - -
Long Beach and Greater LA Harbor
Toxics
Inner Harbor Fish Harbor
Outer Harbor Cabrillo Marina
DDT PCBs
Copper Lead Zinc
Mercury PAHs
Chlordane
Meet WLA Wet and Dry 12/28
I - - - -
12/28 A
(Mercury & Chlordane)
- - - 3/23
F -
303(d) Wilmington Drain Coliform Bacteria
Determine allowable
exceedance days Wet and Dry - - -
1/30 & 6/28 A
7/1 A
1/30 A
12/28 A
12/28 A
- - 6/28
F

Palos Verdes Peninsula
Enhanced Watershed Management Program
5-7 | P a g e
Table 5-3: Interim and Final Water Quality Objectives.
Waterbody Pollutant Interim/Action Milestone Water Quality Objective (Final) Source
Cabrillo Marina
PCBs 0.199 mg/kg 0.000025 g/yr
Dominguez Channel and Greater Los Angeles and Long Beach Harbor Waters Toxics TMDL
DDT 0.186 mg/kg 0.000028 g/yr
Total Copper 367.6 mg/kg 0.0196 kg/yr
Lead 72.6 mg/kg 0.289 kg/yr
Zinc 281.8 mg/kg 0.74 kg/yr
Total PAHs 36.12 mg/kg 0.00016 kg/yr
Fish Harbor
PCBs 36.6 mg/kg 0.0019 g/yr
DDT 40.5 mg/kg 0.0003 g/yr
Total Copper 558.6 mg/kg 0.00017 kg/yr
Lead 116.5 mg/kg 0.54 kg/yr
Zinc 430.5 mg/kg 1.62 kg/yr
Total PAHs 2102.7 mg/kg 0.007 kg/yr
Chlordane Assess monitoring data collected through
CIMP to determine WCMs to address potential contributions of chlordane from
the Peninsula WMG and develop implementation schedule4
0.5 ug/kg
Mercury Annual Load: 0.15 mg/kg
Inner Harbor
PCBs 2.107 mg/kg 0.059 g/yr
DDT 0.341mg/kg; 0.051 g/yr
Total Copper 154.1 mg/kg 1.7 kg/yr
Lead 145.5mg/kg 34 kg/yr
Zinc 362.0 mg/kg 115.9 kg/yr
Total PAHs 90.30 mg/kg 0.88 kg/yr
4 The Peninsula WMG will practice good science techniques by utilizing accurate monitoring data obtained through implementation of the Peninsula CIMP to determine the best approach for reaching final water quality objectives.

Palos Verdes Peninsula
Enhanced Watershed Management Program
5-8 | P a g e
Table 5-3 (Cont.): Interim and Final Water Quality Objectives.
Waterbody Pollutant Interim/Action Milestone Water Quality Objective (Final) Source
Machado Lake
Trash Percentage Reduction from Baseline
(See Schedule) Zero Trash Machado Lake Trash TMDL
PCBs
Assess monitoring data collected through CIMP to determine WCMs to address
potential contributions of chlordane from the Peninsula WMG and develop
implementation schedule5
Three year average: 59.8 ug/kg
Machado Lake Pesticides and PCBs TMDL DDT
Three year average: DDT (all congeners) 4.16 ug/kg; DDE (all congeners) 3.16
ug/kg; DDD (all congeners) 4.88 ug/kg; Total DDT 5.28 ug/kg
Chlordane Three year average: 3.24 ug/kg
Dieldrin Three year average: 1.9 ug/kg
Total Nitrogen 2.45 mg/L Monthly Average: 1 mg/L
Machado Lake Nutrient TMDL
Total Phosphorus 1.25 mg/L Monthly Average: 0.1 mg/L
Ammonia
Addressed through same schedule as Nutrient TMDL
5.95 mg/L - 1 hr average; 2.15 mg/L - 30 day average
Chlorophyll a 20 ug/L - monthly average
Dissolved Oxygen >5 mg/L
Odor N/A
Eutrophic Conditions
N/A
Outer Harbor
PCBs 0.310 mg/kg 0.02 g/yr
Dominguez Channel and Greater Los Angeles and Long Beach Harbor Waters Toxics TMDL
DDT 0.097 mg/kg 0.005 g/yr Total Copper 104.1 mg/kg 0.91 kg/yr
Lead 46.7 mg/kg 26.1 kg/yr
Zinc 150 mg/kg 81.5 kg/yr Total PAHs 4.022 mg/kg 0.105 kg/yr
5 The Peninsula WMG will practice good science techniques by utilizing accurate monitoring data obtained through implementation of the Peninsula CIMP to determine the best approach for reaching final water quality objectives.

Palos Verdes Peninsula
Enhanced Watershed Management Program
5-9 | P a g e
Table 5-3 (Cont.): Interim and Final Water Quality Objectives.
Waterbody Pollutant Interim/Action Milestone Water Quality Objective (Final) Source
Santa Monica Bay
Bacteria
SM (SMB 7-1)
Winter Dry: 1 SM (SMB 7-1)
Winter Dry: 1
Santa Monica Bay Bacteria Dry and Wet Weather TMDLs
Summer Dry: 0 Summer Dry: 0
Wet: 2 Wet: 2
SB (SMB 7-2)
Winter Dry: 1 SB (SMB 7-2)
Winter Dry: 1
Summer Dry: 0 Summer Dry: 0
Wet: 0 Wet: 0
S1 (SMB 7-3)
Winter Dry: 1 S1 (SMB 7-3)
Winter Dry: 1
Summer Dry: 0 Summer Dry: 0
Wet: 1 Wet: 1
S2 (SMB 7-4)
Winter Dry: 0 S2 (SMB 7-4)
Winter Dry: 0
Summer Dry: 0 Summer Dry: 0
Wet: 1 Wet: 1
S3 (SMB 7-5)
Winter Dry: 1 S3 (SMB 7-5)
Winter Dry: 1
Summer Dry: 0 Summer Dry: 0
Wet: 1 Wet: 1
Marine Debris Percentage Reduction from Baseline
(See Schedule) Zero Trash
Santa Monica Bay Marine Debris TMDL Zero Plastic Pellets
PCBs Assess monitoring data collected through
CIMP to determine WCMs to address potential contributions of chlordane from
the Peninsula WMG and develop implementation schedule6
Three year average: 140.25 g/yr total MS4 loading from SMB
Santa Monica Bay DDT and PCBs TMDL
DDT Three year average: 27.08 g/yr total MS4
loading from SMB Santa Monica Bay DDT and PCBs TDML
6 The Peninsula WMG will practice good science techniques by utilizing accurate monitoring data obtained through implementation of the Peninsula CIMP to determine the best approach for reaching final water quality objectives.

Palos Verdes Peninsula
Enhanced Watershed Management Program
5-10 | P a g e
Table 5-3 (Cont.): Interim and Final Water Quality Objectives.
Waterbody Pollutant Interim/Action Milestone Water Quality Objective (Final) Source
Wilmington Drain Bacteria
6/28/2015: Determine WCMs to address potential contributions of coliform bacteria from the Peninsula WMG and develop implementation schedule.
7/01/2016: Assess 1st year of monitoring data collected through CIMP to verify existing load assumptions and assess the contribution of coliform bacteria from the Peninsula WMG.
1/30/ 2017: Begin implementation of additional WCMs (if needed).
12/28/2018: Assess effectiveness of WCMs in Annual Report.
6/28/2040: Achieve compliance with wet-weather and dry-weather WLA.
Target Load (allowable exceedance days) was developed using the Arroyo Sequit subwatershed as a reference system during RAA modeling by performing the following steps:
(1) Calculate the subwatershed’s baseline (natural condition) loading, assuming the land use distribution of the Arroyo Sequit subwatershed (approximately 95% open space) to represent an “allowable” annual load that reflects the reference condition;
(2) Calculate “existing” (pre-EWMP implementation) loading using existing land uses and BMPs to represent the current load; and
(3) Subtract the two load estimates to determine the target load reduction needed to achieve reference watershed conditions.

Palos Verdes Peninsula
Enhanced Watershed Management Program
5-11 | P a g e
5.2.1. NONSTRUCTURAL BEST MANAGEMENT PRACTICES SCHEDULE
A 7.5% load reduction is assumed to result from the cumulative effect of nonstructural BMPs. These nonstructural BMPs consist of Minimum Control Measures (MCMs), Nonstormwater Discharge (NSWD) Measures and Nonstructural Targeted Control Measures (TCMs) as described in Chapter 3. Their implementation over the MS4 Permit term is as follows:
NONSTRUCTURAL MINIMUM CONTROL MEASURES SCHEDULE
The MCMs will be implemented by the Participating Agencies upon approval of the EWMP by the Regional Board Executive Officer or by the implementation dates provided in the MS4 Permit, where applicable. The scope of the MCM programs has expanded significantly from the prior third term MS4 Permit. This change is not entirely unexpected as a period of over ten years separates the adoption of the third and fourth term permits. Consequently significant pollutant reductions are anticipated through effective implementation of the new nonstructural MCMs.
New MCM provisions are described in this EWMP, Section 3.1. Guidance documents have been prepared as an optional aid in MCM development/implementation, some of which can be found in Appendix 2.
NONSTRUCTURAL NON STORMWATER DISCHARGE MEASURES SCHEDULE
The NSWD measures will be implemented by the Participating Agencies upon approval of the EWMP by the Regional Board Executive Officer or by the implementation dates provided in the MS4 Permit, where applicable. The scope of the NSWD measures has expanded from the prior third term MS4 Permit. In particular, NSWD source investigations are now tied into a systematic outfall screening program required by the MS4 Permit Monitoring and Reporting Program and additional conditions have been placed on common exempt NSWDs, such as potable water discharges and irrigation runoff. Consequently significant pollutant reductions are anticipated through the resulting reductions in NSWD flows.
NSWD measures new to the Participating Agencies are described in EWMP Section 3.2.
NONSTRUCTURAL TARGETED CONTROL MEASURES SCHEDULE
Descriptions of each nonstructural TCM and the specific Participating Agencies implementing each TCM is included in Section 3.3. The table also lists whether the TCM is a planned or a potential control measure. Potential control measures are contingent upon unknown factors such as governing body approval and as such implementation within the MS4 Permit term cannot be guaranteed. Many TCMs are ongoing and will be achieved through continued efforts. Planning efforts for nonstructural TCMs which are not already in effect will begin once the EWMP is approved.

Palos Verdes Peninsula
Enhanced Watershed Management Program
5-12 | P a g e
5.2.2. STRUCTURAL BEST MANAGEMENT PRACTICE SCHEDULE
STRUCTURAL MINIMUM CONTROL MEASURE SCHEDULE
Significant pollutant reductions are anticipated through each Participating Agency’s effective implementation of the new structural LID BMP requirements of the Planning and Land Development Program. These new MCM provisions are described in EWMP Section 3.1. Guidance documents have been prepared as an optional aid in MCM development/implementation, some of which can be found in Appendix 2.
The Planning and Land Development Program will be implemented by the Participating Agencies no later than June 28, 2014.
STRUCTURAL TARGETED CONTROL MEASURE SCHEDULE
The RAA (Chapter 4) demonstrates the cumulative effectiveness of BMPs to be implemented, supports BMP selection, and provides target load reduction (TLR) goals optimized across the entire watershed.
The plan depicted in the RAA is considered a potential initial scenario. Through the adaptive management process, the Participating Agencies may select different types and/or locations of BMPs. The implementation schedule for the Structural TCMs necessary for compliance can be found in Table 5-4.

Palos Verdes Peninsula
Enhanced Watershed Management Program
5-13 | P a g e
Table 5-4: Structural TCM Implementation Schedule
Project Name(a)
Jurisdiction % Drainage
Area Per Jurisdiction(b)(c)
Parties Responsible for Implementation
Watershed Existing,
Planned, or Proposed
Schedule(d) Targeted
Compliance Milestone(e)
Site Investigation and Preliminary
Engineering
Environmental Review
Council Review
Design Construction
Casaba Estates
RHE RHE: 100% RHE Los Angeles
Harbor Existing Completed February 2013 Various
San Ramon Canyon
RPV RPV: 100% RPV Santa
Monica Bay Existing Completed November 2014 Santa Monica Bay DDT and
PCBs
Chandler Quarry
RHE RHE: 100% RHE Machado
Lake Planned Currently in Construction Anticipated to be Complete by 2018
Machado Lake Nutrient TMDL
Final Compliance Date Sept 11,
2018
South Coast Botanic Garden Regional BMP
UA RHE: 24% UA: 76%
UA Machado
Lake Proposed
Proposition 1 Grant Application Submitted Fall 2015. Anticipated to be Complete by 2018.
Palos Verdes Landfill Regional BMP
RHE RPV: 38% RHE: 41% UA: 21%
RPV, RHE, UA(e) Machado
Lake Proposed May 2017 August 2017 August 2017 Dec 2017 Sept 2018
Valmonte Regional BMP
RHE PVE: 19% RPV: 24% RHE: 57%
PVE, RPV, RHE(e) Machado
Lake Proposed May 2017 August 2017 August 2017 Dec 2017 Sept 2018
Eastview Park Infiltration Project
RPV RPV: 100% RPV(e) Los Angeles
Harbor Proposed 2027 2028 2028 2026 – 2028 March 2032
Long Beach and Greater LA
Harbor Toxics TMDL Final
Compliance Date March 23, 2032
Notes:
RPV-Rancho Palos Verdes; PVE-Palos Verdes Estates; RHE-Rolling Hills Estates; UA-LA County, Unincorporated
(a) Only projects for which the TLRs are dependent on the schedules were included in this table. (b) Percentages are based on the drainage area within the Peninsula EWMP Watershed. Agencies outside of the EWMP boundary were not taken into consideration. Percentages are
estimated and are subject to change. (c) Schedules are preliminary and are subject to change depending on investigation results and other outside factors. (d) Reductions are anticipated for various pollutants; however, the Targeted Compliance Milestone represents the water quality objective for which the project will be designed to
achieve. This does not necessarily imply that the BMP will address the pollutant identified more effectively than other pollutants present. (e) The parties responsible for implementation are preliminary and contingent upon the results of further analysis.

Palos Verdes Peninsula
Enhanced Watershed Management Program
6-1 | P a g e
6. EWMP IMPLEMENTATION COSTS AND FINANCIAL
STRATEGY
The purpose of this section is to present the financial strategy to represent the strategic options available to the permittees for financing the program costs associated with EWMP. This section provides an order-of-magnitude estimate of the financial resources and an outline for the financial strategy associated with those costs that may be required to attain the goals of the EWMP. The financial strategy is defined as the options available to the WMG to finance the EWMP implementation, including a prioritization of these options.
6.1. EWMP IMPLEMENTATION COSTS
Planning-level estimates of costs associated with implementation of the proposed structural BMPs within the Peninsula WMG area are provided herein based on results from the RAA (Section 4). This section includes an evaluation of the overall economic impacts the proposed projects and programs may have on the community. The estimated costs will be refined as EWMP implementation progresses with the use of actual BMP implementation costs. Costs associated with implementation of non-structural programs are not provided herein.
Cost opinions are presented as an aid for decision makers, and contain considerable uncertainties. Given the iterative and adaptive nature of the EWMP and the many variables associated with the projects, the budget forecasts are order-of magnitude estimates, and are subject to change based on BMP effectiveness assessments, results of outfall and receiving water monitoring, and additional studies such as site specific objectives which could modify water quality objectives for a specific water body-pollutant combination.
6.1.1. METHODOLOGY
Costs estimated for structural BMPs include capital as well as “soft” costs, which include considerations such as contingency and permitting. Capital costs were determined using a line item unit cost approach, which separately accounts for each material cost element required for the installation of a given BMP. Quantities for each line item were calculated based on BMP storage/treatment volumes and typical design configurations. Unit costs were taken from RS Means,1 past projects based in Southern California, and vendors. Land acquisition costs were not considered as part of this analysis.
Soft costs are project costs that cannot be calculated on a unit cost basis. For conceptual cost estimating, these costs are generally calculated as a percentage of total capital costs.
1 RS Means is a unit cost database that is updated annually (http://meanscostworks.com/). When costs from literature are not available project’s design criteria and unit costs from the database were used to estimate the project’s cost.

Palos Verdes Peninsula
Enhanced Watershed Management Program
6-2 | P a g e
The soft costs considered for each BMP were:
Contingency – Costs intended to compensate for any estimating inaccuracy based on assumptions or measured values, unanticipated market conditions, scheduling delays and acceleration issues, lack of bidding competition, and subcontractor defaults.
Construction Management – The costs associated with management and oversight of the construction of the BMP, from project initiation until completion of the contract.
Mobilization and Demobilization – The costs associated with activation/deactivation of equipment and manpower resources for transfer to/from a construction site until completion of the contract.
Permitting – Cost, including permit fees and personnel hours, of obtaining required permits for BMP installation. Examples of permits needed may include erosion and sediment control, stormwater, construction, and public space permits.
Engineering and Planning – Costs associated with BMP and site design, as well as access for maintenance, environmental mitigation, buried objects, safety/security, traffic control, limited space, and site restoration.
The expected costs for each of these soft costs as percent of total project capital costs are presented in Table 6-1. These percentages were based on literature, best professional judgment, and data from past projects.
Table 6-1: Range of Soft Costs for Regional Projects.
Cost Item Low Cost Assumption
(% of Capital Cost) High Cost Assumption
(% of Capital Cost)
Contingency 10% 20%
Construction Management 8% 15%
Mobilization and Demobilization 3% 5%
Permitting 3% 5%
Engineering and Planning 10% 20%
6.1.2. CONCEPTUAL DESIGN ASSUMPTIONS
As stated in Section 4, a variety of regional BMP design options are available to achieve compliance. For the purposes of cost estimating, a single conceptual design was assumed for each proposed regional BMP.2 The cost analysis performed maximizes the effectiveness of funds by analyzing the most cost-effective design for each analysis region. Table 6-2 summarizes the significant design assumptions for each of these BMPs.
Table 6-2: Regional BMP Design Assumptions for Estimating Costs
Analysis Region
BMP Description Design Storm
Tributary Area (acres)
Greater LA Harbor
Sub-surface infiltration basin (concrete, pre-cast chambers) at Eastview Park. Assumed storage depth of 6 ft, designed to capture a volume of 20.8 acre-ft 1.25 in 345
RHECH + Wilmington
Sub-surface flow wetland with 50 million gallons (MG), or 150 acre-feet, equalization storage volume. The wetland is assumed to have a depth of 6 ft, 4 ft of which contains media. The storage tank is assumed to have a depth of 6 ft. The treatment flow rate is assumed to be 15.2 cfs.
0.02 in/hr 1,414
Valmonte
Sub-surface flow wetland with 40 MG (120 acre-feet) equalization storage volume. The wetland is assumed to have a depth of 6 ft, 4 ft of which contains media. The storage tank is assumed to have a depth of 6 ft. The treatment flow rate is assumed to be 2.0 cfs.
0.01 in/hr 397
2 Cost estimates are not provided for planned regional BMPs, including Chandler Quarry and the Botanic Garden Project.

Palos Verdes Peninsula
Enhanced Watershed Management Program
6-3 | P a g e
Additional design details were assumed for the purpose of the cost estimation presented herein, including, but not limited to:
The percentage of excavated material requiring hauling;
The type and length of BMP inflow and outflow conveyance structures;
The type and quantity of vegetation required for the post-BMP condition;
The type of pre-treatment used for each BMP.
6.2. SUMMARY OF COSTS
Table 6-3 presents the estimated capital cost to construct or implement each structural BMP and associated annual O&M costs. In order to account for possible variations in BMP design, BMP configurations, and site-specific constraints, as well as for uncertainties in available BMP unit costs from literature or estimated BMP unit costs, a range of costs is presented.
Table 6-3: Estimated Capital and O&M Costs for Proposed Structural BMPs
BMP Capital Cost Annual O&M
Low Cost High Cost Low Cost High Cost
Greater LA Harbor Underground Infiltration Basin at Eastview Park
$12,800,000 $16,600,000 $190,000 $200,000
Sub-Surface Flow Wetland at the Palos Verdes Landfill
$57,800,000 $86,400,000 $860,000 $1,000,000
Sub-Surface Flow Wetland at Valmonte $19,400,000 $26,500,000 $290,000 $320,000
Total $90,000,000 $129,500,000 $1,340,000 $1,520,000
Annual O&M for underground infiltration basins includes cleaning and removal of debris after major storm events, mowing and maintenance of surface vegetated areas, and sediment cleanout. Annual O&M costs were assumed to be 2 percent of the capital cost for infiltration basins.
O&M necessary for maintaining sub-surface flow wetlands includes landscape maintenance, pest control, sediment and pre-treatment cleanout. O&M for sub-surface flow wetlands was estimated at 2 percent of capital costs annually.
Clearly the capital and operation and maintenance costs of these regional projects are very significant. In the case of the two projects which are flow-through treatment systems without groundwater recharge, an end use for this treated stormwater should be identified (e.g. irrigation of local parks and golf courses).
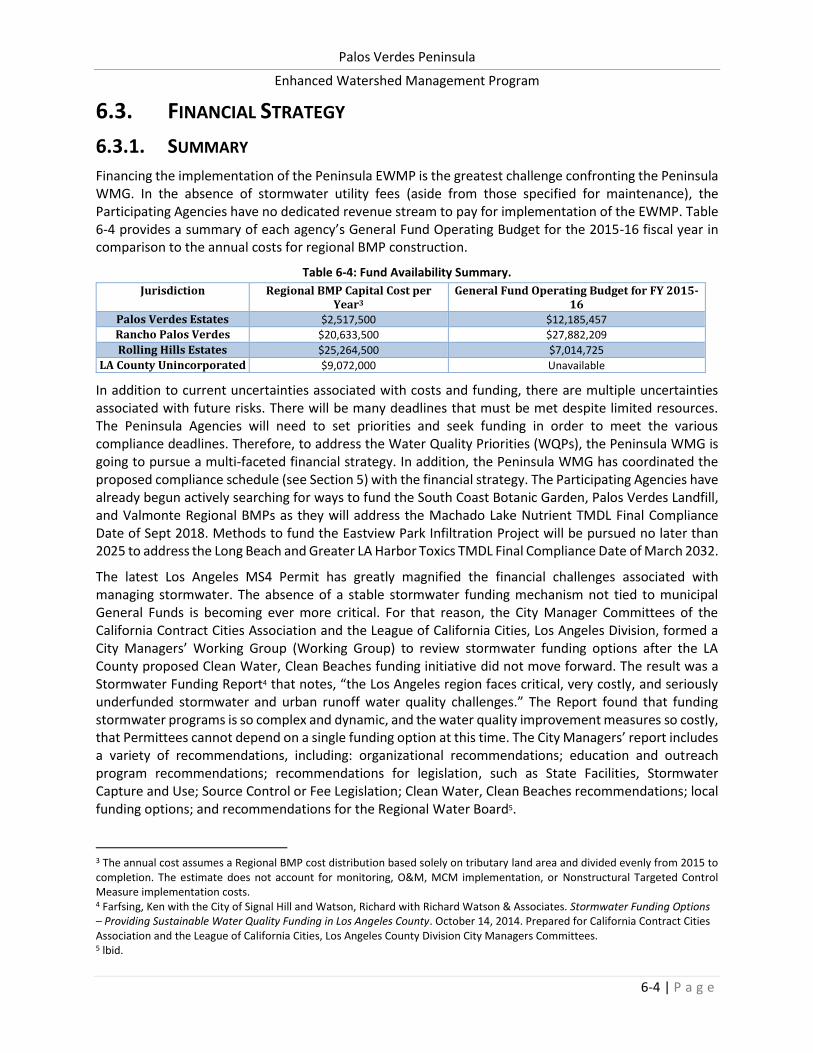
Palos Verdes Peninsula
Enhanced Watershed Management Program
6-4 | P a g e
6.3. FINANCIAL STRATEGY
6.3.1. SUMMARY
Financing the implementation of the Peninsula EWMP is the greatest challenge confronting the Peninsula WMG. In the absence of stormwater utility fees (aside from those specified for maintenance), the Participating Agencies have no dedicated revenue stream to pay for implementation of the EWMP. Table 6-4 provides a summary of each agency’s General Fund Operating Budget for the 2015-16 fiscal year in comparison to the annual costs for regional BMP construction.
Table 6-4: Fund Availability Summary.
Jurisdiction Regional BMP Capital Cost per Year3
General Fund Operating Budget for FY 2015-16
Palos Verdes Estates $2,517,500 $12,185,457
Rancho Palos Verdes $20,633,500 $27,882,209
Rolling Hills Estates $25,264,500 $7,014,725
LA County Unincorporated $9,072,000 Unavailable
In addition to current uncertainties associated with costs and funding, there are multiple uncertainties associated with future risks. There will be many deadlines that must be met despite limited resources. The Peninsula Agencies will need to set priorities and seek funding in order to meet the various compliance deadlines. Therefore, to address the Water Quality Priorities (WQPs), the Peninsula WMG is going to pursue a multi-faceted financial strategy. In addition, the Peninsula WMG has coordinated the proposed compliance schedule (see Section 5) with the financial strategy. The Participating Agencies have already begun actively searching for ways to fund the South Coast Botanic Garden, Palos Verdes Landfill, and Valmonte Regional BMPs as they will address the Machado Lake Nutrient TMDL Final Compliance Date of Sept 2018. Methods to fund the Eastview Park Infiltration Project will be pursued no later than 2025 to address the Long Beach and Greater LA Harbor Toxics TMDL Final Compliance Date of March 2032.
The latest Los Angeles MS4 Permit has greatly magnified the financial challenges associated with managing stormwater. The absence of a stable stormwater funding mechanism not tied to municipal General Funds is becoming ever more critical. For that reason, the City Manager Committees of the California Contract Cities Association and the League of California Cities, Los Angeles Division, formed a City Managers’ Working Group (Working Group) to review stormwater funding options after the LA County proposed Clean Water, Clean Beaches funding initiative did not move forward. The result was a Stormwater Funding Report4 that notes, “the Los Angeles region faces critical, very costly, and seriously underfunded stormwater and urban runoff water quality challenges.” The Report found that funding stormwater programs is so complex and dynamic, and the water quality improvement measures so costly, that Permittees cannot depend on a single funding option at this time. The City Managers’ report includes a variety of recommendations, including: organizational recommendations; education and outreach program recommendations; recommendations for legislation, such as State Facilities, Stormwater Capture and Use; Source Control or Fee Legislation; Clean Water, Clean Beaches recommendations; local funding options; and recommendations for the Regional Water Board5.
3 The annual cost assumes a Regional BMP cost distribution based solely on tributary land area and divided evenly from 2015 to completion. The estimate does not account for monitoring, O&M, MCM implementation, or Nonstructural Targeted Control Measure implementation costs. 4 Farfsing, Ken with the City of Signal Hill and Watson, Richard with Richard Watson & Associates. Stormwater Funding Options – Providing Sustainable Water Quality Funding in Los Angeles County. October 14, 2014. Prepared for California Contract Cities Association and the League of California Cities, Los Angeles County Division City Managers Committees. 5 lbid.
Palos Verdes Peninsula
Enhanced Watershed Management Program
6-5 | P a g e
6.3.2. POTENTIAL FUNDING OPTIONS
The financial strategy to fund the EWMP requires the utilization of multiple funding options. The Peninsula WMG will work together to maximize cost-effectiveness and each individual agency will be responsible for seeking funding for its share in EWMP implementation through a Memorandum of Understanding (MOU) which will be established by December 2016. The sections below outline multiple approaches to funding and allows each jurisdiction to consider and select the funding options that best fit the specific preferences of their agency. For each funding option, a brief description is included that includes benefits and challenges associated.
Resource: Stormwater Funding Report6
ORGANIZATIONAL
The Peninsula WMG will consider forming a core group of elected officials to form a committee, including members from the environmental community, the business community, and other stakeholders to improve communication and to reach consensus on fee issues. Each agency has committed funding for continuing work on the Stormwater Funding Options study with the California Contract Cities Association (CCCA).
Additionally, the Peninsula WMG plans to engage with the Sanitation Districts to discuss future partnerships in stormwater programs.
EDUCATION AND OUTREACH
The Peninsula WMG plans to implement public outreach on a watershed-based level. With these efforts the Participating Agencies will have direct communications with the Governor and the Legislature on the funding needs.
LEGISLATION
Legislative action has dramatically changed the face of contemporary stormwater management. This includes passage of laws, adoption of regulations, and interpretation of laws and enforcement of regulations by the courts at local, state and federal levels. These legislative activities impact all aspects of stormwater management by local governments, as well as the private sector, such as developers who provide basic infrastructure as a part of their developments, industrial facilities that discharge stormwater from their properties, and those conducting ground disturbing construction activities. The Peninsula WMG has considered pursuing legislation in the following areas:
Schools and Public Facilities (i.e. environmental liability waivers; state architect guidance on schools, etc.)
Stormwater Capture and Reuse (i.e. provide a clear path to monetize the capture and use of stormwater)
Source Control or Fee Legislation (i.e. pursue reduction of zinc in tires and/or a per-tire zinc reduction fee)
Special Assessment Districts (i.e. explore the special assessment district concept for funding stormwater projects)

Palos Verdes Peninsula
Enhanced Watershed Management Program
6-6 | P a g e
The challenges associated with legislation include time and resources. Incorporating new legislation requires a significant amount of time and political influence. Although these options have great potential, they will likely not be available in the short term.
FEDERAL AND STATE GRANTS
Federal and State Grant programs are made available for agencies to receive funding for projects which fall under the guidelines of the grant. The most recent example would be the Proposition 1 Stormwater Grant Program which has dedicated $200 million for LID, greet streets, and regional projects.
Challenges associated with grants include, but are not limited to, the following:
Matching Funds. Almost all grants include matching requirements, which can be up to 50% of the total project costs. Additionally, grant development and administration can take up significant resources, particularly from the small agencies associated with the Peninsula WMG.
Shovel ready projects are typically preferred. Grant programs are generally structured to favor projects that are not “shovel ready” while projects without substantially complete design plans are much less likely to be selected.
Grants are competitive. Each grant program has a set allocation of funds that are available within a defined region (i.e. statewide). As regulatory pressures are increased throughout California and the United States, the competition for securing this type of funding will significantly increase.
Not all projects apply. Project eligibility is dependent on the grant program which may not support the project type as needed.
Grants do not provide long-term O&M funding. In general, grants are structured to help fund project construction costs. Separate funding streams for the operations and maintenance costs would be needed.
The Peninsula WMG is applying for Proposition 1 to fund their catch basin inserts for the Santa Monica Bay Debris TMDL; however, the regional projects outlined in this EWMP were not at an eligible stage.
Although grants are a great option for extra project revenue, it is not a reliable source to depend on as it is unlikely to provide full EWMP implementation or long-term funding.
A general process7 for obtaining funds through Federal and State Grants is as follows:
1. The Agency will prepare an application for financial assistance which consists of general, financial, technical, and environmental components.
2. The Agency will submit the application to the State Water Board using the Financial Assistance Application Submittal Tool (FAAST) system.
3. The grant executer reviews the application. If accepted, the project will be added to the project list. In some cases, a second application round with additional information may be required.
4. The grant executer prepares an initial Financial Assistance Agreement based on requested funds. 5. The Agency submits the Final Budget Approval package once the project has been bid on and
construction costs finalized. 6. The initial Financial Assistance Agreement is updated with the construction costs and executed. Upon
execution, construction costs are eligible for reimbursement, less the matching funds. 7. Upon project completion, the agency would submit a final project report.
7 This process may vary and is dependent on the grant.

Palos Verdes Peninsula
Enhanced Watershed Management Program
6-7 | P a g e
CLEAN WATER, CLEAN BEACHES
The Participating Agencies will consider a property owner/voter sentiment survey based on new factors and changed circumstances, including a list of specific projects, optional fee amounts and an “opt out” provision. Additionally, the Participating Agencies will explore the formation of the Urban Water Conservation District under the 1931 Act by determining the governance structure under 1931 Act. If it is Board of Supervisors governance, a protest hearing may be considered to vote for a stormwater capture and infiltration fee to fund other program aspects not covered under the 1931 Act Water Conservation District.
Moving forward with a regional stormwater fee vote (such as the LA County Clean Water, Clean Beaches funding initiative) would likely not occur until after June 2015, which means that the first funds would likely not be available until property tax payments are received in 2017. In addition, these amounts may not be sufficient to pay for and maintain expensive stormwater treatment and/or diversion systems if the Peninsula WMG had to depend on such projects to come into compliance with receiving water limitations (RWLs) and water quality-based effluent limitations (WQBELs) specified in the MS4 Permit.
LOCAL STORMWATER FEES
The agencies may consider local stormwater fees, including service related fees or property based fees. Incentives, such as streamlining approval processes and expediting reviews, could be incorporated.
Service related fees could be used to fund portions of stormwater programs. Examples of such fees could include fees associated with new and redevelopment, drainage, environmental impacts, solid waste, water conservation, inspections, or storm drain/BMP maintenance
Property based fees include regular fees associated with land ownership (e.g., stormwater parcel tax) and may be calculated based on factors such as parcel size, impervious surface, land use, water use, etc.
There are extensive challenges associated with implementing these programs. One such challenge is Proposition 218, which requires public approval through a formal ballot initiative for the establishment of new or increases to existing fees associated with stormwater. However, new legislation such as AB2403 may successfully modify the legislative definition of water to include stormwater which could reduce or eliminate the need for a ballot measure to implement stormwater fees. This and other efforts to reform Proposition 218 to include stormwater as a utility may reduce these challenges in the future. As such, coordination with legal counsel will be necessary to determine the most feasible, appropriate, and beneficial approach.
LOCAL FUNDING OPTIONS
The agencies may consider local funding options to address stormwater funding. Local funding options would typically be pursued within individual agencies. Local funding options include:
Revising street sweeping contracts to provide NPDES trash control programs;
Adoption of water conservation fees to provide funding for reducing irrigated runoff to conserve water and reduce dry weather discharges;
Local, statewide, or regional fees on car rentals to contribute to copper and zinc clean-up costs and incorporate stormwater quality features into street and highway projects funded by bonds and other street funds;
Increase in commercial facility inspection fees

Palos Verdes Peninsula
Enhanced Watershed Management Program
6-8 | P a g e
Local funding options may be useful for short-term funding; however, it is unlikely that they will result in amounts significant enough to cover any substantial portion of EWMP implementation costs.
CLEAN WATER STATE REVOLVING FUND
The Clean Water State Revolving Fund (CWSRF) program is a federal-state partnership that provides low-cost financing (at half of the most recent General Obligation Bond Rate at the time of funding approval – 1.6% in March 2015) with terms up to 30 years for a wide range of water quality infrastructure projects. The CWSRF could be used to fund individual projects or groups of projects as there is no maximum funding limit. The CWSRF can be used for a variety of projects including stormwater measures to manage, reduce, treat, or recapture stormwater or subsurface drainage water; water conservation, efficiency, and reuse; and watershed pilot projects meeting criteria in CWA §122.
Repayment begins one year after completion of construction, which results in the need for existing revenue to pay back the loans. However, this could give the agencies time to develop more long-term strategies (e.g., local stormwater fees).
The process for obtaining funds through the CWSRF is as follows:
1. The Agency will prepare an application for financial assistance which consists of general, financial, technical, and environmental components.
2. The Agency will submit the application to the State Water Board using the Financial Assistance Application Submittal Tool (FAAST) system.
3. The State Division of Financial Assistance (DFA) reviews the application. If accepted, the project will be added to the project list.
4. DFA prepares an initial Financial Assistance Agreement based on estimated construction costs. At this stage, soft costs, including those incurred prior to the agreement are eligible for reimbursement.
5. The Agency submits the Final Budget Approval package once the project has been bid on and construction costs finalized.
6. The initial Financial Assistance Agreement is updated with the construction costs and executed. Upon execution, construction costs are eligible for reimbursement.
7. Based on the Final Budget Approval package, a construction completion date is established, which sets the initial date for repayment, one year from the construction completion date. Upon project completion, the agency would submit a final project report.
TRANSPORTATION BONDS
Another consideration is future transportation bonds. This can be pursued by encouraging the Metropolitan Transportation Authority (MTA) to include funding stormwater quality features, such as Green Streets, in future bonds and encourage Council of Governments to develop strategic transportation plans that include mitigations designed to address water quality issues from transportation projects.
RECOMMENDATIONS FOR THE REGIONAL WATER QUALITY CONTROL BOARD
Regional Board members and key staff should be available to provide continual education to the agencies regarding the Regional Board’s regulatory programs. The Regional Board should request funding for a staff position that would be responsible to identify and distribute information on the available federal, state, non-profit, corporate and other sources of funds; and establish an on-line resource center to assist the cities in complying with the stormwater permit requirements.

Palos Verdes Peninsula
Enhanced Watershed Management Program
6-9 | P a g e
6.3.3. PRIORITIZATION
During the early years of implementation, the Permittees anticipate having to depend largely on local fees such as commercial facility inspection fees and General Fund expenditures to fund the implementation of the nonstructural WCMs.
The Peninsula WMG will seek opportunities to leverage the limited funds available. It will do this by financially supporting the efforts of others, such as the California Stormwater Quality Association (CASQA), to seek State approval of true source control measures such as implementation of the Safer Consumer Product Regulations adopted by the Department of Toxic Substances Control in 2013. The Group will also support programs to increase water conservation, reduce dry-weather discharges to the storm drain system, and reduce TSS during wet weather. Successfully accomplishing these efforts could reduce the funds needed in the long term to capture and/or treat stormwater discharges to comply with TMDLs and address other WQPs.
Legislative solutions will be necessary to clarify the application of Proposition 218 to fees for the capture and use of stormwater in light of a recent 6th Appellate Court decision and to ensure that any State water bond put on the ballot in fall 2015 contains funding for stormwater quality projects. The Group will also support local and statewide efforts to amend Proposition 218 to have stormwater fees treated in the same manner as water, sewage, and refuse fees. The Peninsula WMG and/or the Participating Agencies will also seek grants (i.e. IRWMP, Proposition 84, etc.) to implement stormwater BMPs.
In the long term, financing the WCMs for the Peninsula Watershed will require establishing dependable revenue streams for local water quality programs. Accomplishing this formidable task will require the cooperation of many entities, including business and environmental organizations and the Regional Board. Participating Agencies will begin utilizing existing funds to implement the EWMP as well as pursue additional funding in accordance with Table 6-5 below.
Table 6-5: Funding Option Priorities.
Agency Funding Priorities Integration with Existing
Infrastructure Improvement Plans
County 1. Federal and State Grants 2. Seek allocation in the General Fund; investigate bond and loan
opportunities (i.e. CWSRF) 3. Continued participation in stormwater funding advocacy efforts
led by the League of California Cities and California Contract Cities
Development of a stormwater capital improvement plan for existing public facilities by December 2018
Update infrastructure design guidelines with sustainable practices, including stormwater capture BMPs by December 2018
LACFCD 1. Federal and State Grants 2. Seek allocation in the Flood Fund
Development of a stormwater capital improvement plan for existing public facilities by December 2018
RPV 1. Federal and State Grants 2. Local Funding Options & Stormwater Fees 3. Continued participation in stormwater funding advocacy efforts
led by the League of California Cities and California Contract Cities
Development of a stormwater capital improvement plan for existing public facilities by December 2018
PVE 1. Federal and State Grants 2. Local Funding Options & Stormwater Fees 3. Continued participation in stormwater funding advocacy efforts
led by the League of California Cities and California Contract Cities
Development of a stormwater capital improvement plan for existing public facilities by December 2018
RHE 1. Federal and State Grants 2. Local Funding Options & Stormwater Fees 3. Continued participation in stormwater funding advocacy efforts
led by the League of California Cities and California Contract Cities
Development of a stormwater capital improvement plan for existing public facilities by December 2018

Palos Verdes Peninsula
Enhanced Watershed Management Program
7-1 | P a g e
7. LEGAL AUTHORITY
MS4 Permit §VI.C.5.b.iv.6 This section covers information such as documentation and references/links to water quality ordinances for each participating agency. These documents demonstrate adequate legal authority to implement and enforce Watershed Control Measures (WCMs) identified in this plan and as required in Section VI.D.5.b.iv.6 of the MS4 Permit. The goal of these WCMs is to create an efficient program that focuses on the watershed priorities by meeting the following objectives:
Prevent or eliminate non-storm water discharges to the MS4 that are a source of pollutants from the MS4 to receiving waters.
Implement pollutant controls necessary to achieve all applicable interim and final water quality-based effluent limitations and/or receiving water limitations pursuant to corresponding compliance schedules.
Ensure that discharges from the MS4 do not cause or contribute to exceedances of receiving water limitations.
The WCMs include the minimum control measures, nonstormwater discharge measures and targeted control measures (i.e. controls to address TMDL and 303(d) listings). As the requirement to incorporate these WCMs is an element of the MS4 Permit, the legal authority to implement them results from each agency’s legal authority to implement the NPDES MS4 Permit.
A copy of each participating agency's legal authority certification from their chief legal counsel can be found in Appendix 7. Table 7-1 includes the water quality ordinance for each agency with a reference link. Additionally, the participating agencies have developed and adopted LID ordinances and Green Street Policies which provides legal authority to enforce the Planning and Land Development Program.
Table 7-1: Water Quality Ordinance Language
City Water Quality Ordinance Reference
Rancho Palos Verdes
Chapter 13.10 - STORM WATER AND URBAN RUNOFF POLLUTION CONTROL
https://www.municode.com/library/ca/rancho_palos_verdes/codes/code_of_ordinances?nodeId=TIT13PUSE_CH13.10STWAURRUPOCO
13.10.020 Purpose – This chapter is also intended to provide the city with the legal authority necessary to control discharges to and from those portions of the municipal storm water system over which it has jurisdiction as required by the municipal NPDES permit.
Palos Verdes Estates
Chapter 13.08 – STORM DRAINS AND STORM WATER MANAGEMENT AND POLLUTION CONTROL
http://www.codepublishing.com/ca/palosverdesestates/
13.08.040 Construction and Application – The provisions of this chapter shall be construed to assure consistency with the requirements of the federal Clean Water Act and acts amendatory thereof or supplementary thereto, applicable implementing regulations, and existing or future NPDES permits, and any amendment, revision or re-issuance thereof. Any person who violates any provision of this chapter may also be in violation of such federal act, NPDES permit, or other federal or state law, and subject to the sanctions thereof.
Rolling Hills Estates
Chapter 8.38 - STORMWATER AND URBAN RUNOFF POLLUTION CONTROL
https://www.municode.com/library/ca/rolling_hills_estates/codes/code_of_ordinances?nodeId=TIT8HESA_CH8.38STURRUPOCO_8.38.010TI
8.38.030 Purpose and Intent – This chapter is also intended to provide the city with legal authority as required by the municipal NPDES permit.
LACFCD Flood Control District Code, Chapter 21 - Stormwater and Runoff Pollution Control
https://library.municode.com/HTML/16274/level2/FLCODICO_CH21STRUPOCO.html#FLCODICO_CH21STRUPOCO_21.01PUIN
21.01 - Purpose and Intent - The purpose and intent of this chapter is to regulate the stormwater and non-stormwater discharges to the facilities of the Los Angeles County Flood Control District for the protection of those facilities, the water quality of the waters in and downstream of those facilities, and the quality of the water that is being stored in water-bearing zones underground.

Palos Verdes Peninsula
Enhanced Watershed Management Program
8-1 | P a g e
8. COORDINATED INTEGRATED MONITORING PROGRAM
The Participating Agencies have developed a customized Coordinated Integrated Monitoring Program (CIMP). The CIMP, based on the provisions set forth in Attachment E, Part IV of the MS4 Permit, assesses progress toward achieving the water quality-based effluent limitations (WQBELs) and receiving water limitations (RWLs) per the compliance schedules, and progress toward addressing water quality priorities. The customized CIMP is designed to address the Primary Objectives detailed in Attachment E, Part II.A of the MS4 Permit and includes the following program elements:
Receiving Water Monitoring
Storm Water Outfall Monitoring
Non-Storm Water Outfall Monitoring
New Development/Re-Development Effectiveness Tracking
Regional Studies
The CIMP is currently under separate review by the Regional Water Quality Control Board.
Palos Verdes Peninsula
Enhanced Watershed Management Program
9-1 | P a g e
9. ADAPTIVE MANAGEMENT PROCESS
Adaptive management is the process by which new information about the state of the watershed is incorporated into the EWMP. The EWMP is adaptively managed following the process described in Permit §IV.C.8. The process is implemented by the participating agencies every two years from the date of EWMP approval by the Regional Water Board (or by the Executive Officer on behalf of the Regional Water Board). The purpose of the adaptive management process is to improve the effectiveness of the EWMP based on – but not limited to – consideration of the following:
1. Progress toward achieving interim and/or final water quality-based effluent limitations and/or
receiving water limitations in §VI.E and Attachments L through R of the MS4 Permit, according
to established compliance schedules;
2. Progress toward achieving improved water quality in MS4 discharges and achieving receiving
water limitations through implementation of the watershed control measures based on an
evaluation of outfall-based monitoring data and receiving water monitoring data;
3. Achievement of interim milestones;
4. Reopening of TMDLs;
5. Re-evaluation of the water quality priorities identified for the Watershed Management Area
(WMA) based on more recent water quality data for discharges from the MS4 and the receiving
water(s) and a reassessment of sources of pollutants in MS4 discharges;
6. Availability of new information and data from sources other than the MS4 Permittees’
monitoring program(s) within the WMA that informs the effectiveness of the actions
implemented by the Permittees;
7. Regional Water Board recommendations; and
8. Recommendations for modifications to the Enhanced Watershed Management Program
solicited through a public participation process.
9.1. MODIFICATIONS
Based on the results of the adaptive management process, the participating agencies may find that modifications of the EWMP are necessary to improve effectiveness. Modifications may include new compliance deadlines and interim milestones, with the exception of those compliance deadlines established in a TMDL.

Palos Verdes Peninsula
Enhanced Watershed Management Program
9-2 | P a g e
9.1.1. REPORTING
Modifications are reported in the Annual Report, as required pursuant to Part XVIII.A.6 of the Permit Monitoring and Reporting Program (No. CI-6958), and as part of the Report of Waste Discharge (ROWD) required pursuant to Part II.B of Attachment D – Standard Provisions. The background and rational for these modifications are included by addressing the following points:
Identify the most effective control measures and describe why the measures were effective and
how other control measures will be optimized based on past experiences.
Identify the least effective control measures and describe why the measures were deemed
ineffective and how the control measures will be modified or terminated.
Identify significant changes to control measures during the prior year and the rationale for the
changes.
Describe all significant changes to control measures anticipated to be made in the next year and
the rationale for the changes. Those changes requiring approval of the Regional Water Board or
its Executive Officer shall be clearly identified at the beginning of the Annual Report.
Include a detailed description of control measures to be applied to New Development or Re-
development projects disturbing more than 50 acres.
Provide the status of all multi-year efforts that were not completed in the current year and will
continue into the subsequent year(s).
Provide the status of multi-year/future regional BMPs, both planned and proposed.
Provide the status of efforts to secure funding for structural TCMs both for capital investments
and O&M.
9.1.2. IMPLEMENTATION
Modifications are implemented upon approval by the Regional Water Board Executive Officer or within 60 days of submittal if the Regional Water Board Executive Officer expresses no objections.
9.2. RECEIVING WATER LIMITATIONS
The adaptive management process fulfills the requirements in MS4 Permit §V.A.4 to address continuing exceedances of receiving water limitations.
Palos Verdes Peninsula
Enhanced Watershed Management Program
10-1 | P a g e
10. REPORTING PROGRAM & ASSESSMENT
10.1. ANNUAL REPORT Permit MRP §XV.A
Each year on or before December 15th, the participating agencies will submit, either jointly or individually, an annual report to the Regional Water Board Executive Officer. The annual report will present a summary of information that will allow the Regional Board to assess implementation and effectiveness of the watershed management program1.
The reporting process is intended to meet the following objectives:
Each agency's participation in the Enhanced Watershed Management Program and Coordinated Integrated Monitoring Program.
The impact of each agency's storm water and non-storm water discharges on the receiving water.
Compliance with receiving water limitations, numeric water quality-based effluent limitations, and non-storm water action levels.
The effectiveness of control measures in reducing discharges of pollutants from the MS4 to receiving waters.
Whether the quality of MS4 discharges and the health of receiving waters is improving, staying the same, or declining as a result watershed management program efforts, and/or TMDL implementation measures, or other Minimum Control Measures.
Whether changes in water quality can be attributed to pollutant controls imposed on new development, re-development, or retrofit projects.
Annual Report will identify data collected and strategies, control measures and assessments implemented for each watershed within the participating agency's jurisdiction. The report will include summaries for each of the following seven sections as required by the MS4 Permit:
1) Stormwater Control Measures - Summary of New Development/Re-development Projects, actions to comply with TMDL provisions
2) Effectiveness Assessment of Stormwater Control Measures - Summary of rainfall data, provide assessment and compare water quality data, summary to whether or not water quality is improving
3) Non-Stormwater Control Measures - Summary of outfalls screening 4) Effectiveness Assessment of Non-Storm Water Control Measures - Summary of the effectiveness
of control measures implemented 5) Integrated Monitoring Compliance Report - Report with summary of all identified exceedances
of outfall-based stormwater monitoring data, we weather receiving water monitoring data, dry weather receiving water data and non-storm water outfall monitoring data
6) Adaptive Management Strategies - Summary of effective, less effective control measures 7) Supporting Data and Information - Monitoring data summary
The participating agencies will submit annual reports as required by the MS4 Permit. The Regional Board is currently preparing a reporting format. Once available, the reporting form will be incorporated into the EWMP as an appendix. 1 Annual reports will cover summary from previous fiscal year beginning June 1st through July 30th.

Palos Verdes Peninsula
Enhanced Watershed Management Program
10-2 | P a g e
10.1.1. DATA REPORTING Permit MRP §XIV.L
Analytical data reports will be submitted on a semi-annual basis. Data will be sent electronically to the Regional Water Board's Storm Water site at [email protected]. These data reports will summarize:
Exceedances of applicable WQBELs, receiving water limitations, or any available interim action levels or other aquatic toxicity thresholds.
Basic information regarding sampling dates, locations, or other pertinent documentation.
10.1.2. CHRONIC TOXICITY REPORTING Permit MRP §XII.K
Aquatic toxicity monitoring results will be submitted to the Regional Board on an annual basis as part of the integrated monitoring compliance report as well as in the semi-annual basis data report submittal.
10.2. WATERSHED REPORT Permit MRP §XVII.A
The participating agencies will submit biennial watershed reports as required by the MS4 Permit to the Regional Water Board Executive Officer. This biennial report, which will be included in the annual report in odd years, will include information related to the following sections:
Watershed Management Area
Subwatershed (HUC-12) Description
Permittees Drainage Area within the Subwatershed
Per MS4 Permit § XVII.B, the participating agencies may reference the Enhanced Watershed Management Program (EWMP) in the odd-year report, when the required information is already included or addressed in this EWMP, to satisfy baseline information requirements.
The Regional Board is currently preparing a reporting format. Once available, the reporting form will be incorporated into the EWMP as an appendix.
10.3. TMDL REPORTING Permit MRP §XIX
The participating agencies will also submit an annual report to the Regional Water Board Executive Officer regarding progress of TMDL implementation within the watershed.
The TMDLs that will be addressed in the report are listed below:
Santa Monica Bay Beaches Wet Weather Bacteria TMDL – Group 7
Santa Monica Bay Beaches Dry Weather Bacteria TMDL – Group 7
Santa Monica Bay Nearshore and Offshore Debris TMDL
Machado Lake Trash TMDL
Machado Lake Nutrient TMDL
Machado Lake Pesticides and PCBs (Toxics) TMDL
Dominguez Channel, Greater Los Angeles, and Long Beach Harbor Waters Toxic Pollutants TMDL
Santa Monica Bay TMDL for DDTs and PCBs
The Regional Board is currently preparing a reporting format. Once available, the reporting form will be incorporated into the EWMP as an appendix.
REFERENCES Agency Region 9. 2011. Dominguez Channel and Greater Los Angeles and Long Beach Harbor Waters Toxic Pollutants Total Maximum Daily Load. Los Angeles, Ca.
AMEC Earth & Environmental, Inc. 2009. Harbor Ambient Water Quality Summary in Support of the Port of Los Angeles and Port of Long Beach Water Resources Action Plan.
Bay, Steven M., Darrin J. Greenstein, Matthew Jacobe, Carlita Barton, Ken Sakamoto, Diana Young, Kerry Ritter, Kenneth C. Schiff. 2011. Southern California Bight 2008 Regional Monitoring Program: I. Sediment Toxicity. Southern California Coastal Water Research Project.
Board. 2009. Port of Los Angeles and Port of Long Beach Water Resources Action Plan Final Report, August 2009.
Bolton Engineering Corp. Hydrology and Hydraulic Calculations. September 13, 2010.
California Environmental Protection Agency. Final California 2010 Integrated Report (303(d) List/305(b) Report). August 2013. http://www.waterboards.ca.gov/water_issues/programs/tmdl/2010state_ir_reports/category5_report.shtml.
California Regional Water Quality Control Board Los Angeles Region and U.S. Environmental Protection
California Regional Water Quality Control Board Los Angeles Region. 2012. Order No. R4-2012-0175 NPDES Permit No. CAS004001 Waste Discharge Requirements for Municipal Separate Storm Sewer System (MS4) Discharges within the Coastal Watersheds of Los Angeles County, except those Discharges Originating from the City of Long Beach MS4. November 8.
California Regional Water Quality Control Board Los Angeles Region. 2007. Machado Lake Trash Total Maximum Daily Load. Los Angeles, Ca.
California Regional Water Quality Control Board Los Angeles Region. 2008. Machado Lake Eutrophic, Algae, Ammonia, and Odors (Nutrient) Total Maximum Daily Load.
California Regional Water Quality Control Board Los Angeles Region. 2010. Machado Lake Pesticides and PCBs Total Maximum Daily Load. Los Angeles, CA.
California Regional Water Quality Control Board Los Angeles Region. 2010. Santa Monica Bay Nearshore and Offshore Debris Total Maximum Daily Load. Los Angeles, Ca.
California Regional Water Quality Control Board, Los Angeles Region. 2007. Trash Total Maximum Daily Loads for the Los Angeles River Watershed. Los Angeles, CA.
California Regional Water Quality Control Board, Los Angeles Region. Total Maximum Daily Load to Reduce Bacterial Indicator Densities at Santa Monica Bay Beaches During Dry Weather. 2002 & 2006. California Regional Water Quality Control Board, Los Angeles Region, Los Angeles, CA.
http://www.waterboards.ca.gov/water_issues/programs/tmdl/2010state_ir_reports/category5_report.shtml
http://www.waterboards.ca.gov/water_issues/programs/tmdl/2010state_ir_reports/category5_report.shtml
California State Water Resources Control Board. Water Quality Control Policy for Developing California’s Clean Water Act Section 303(d) List. September 2004.
California Stormwater Quality Association. 2007. Municipal Stormwater Program Effectiveness Assessment Guidance. California: California Stormwater Quality Association: 2007. Print.
Caltrans (California Department of Transportation). 2003. A Review of the Contaminants and Toxicity Associated with Particles in Stormwater runoff. August.
Caltrans (California Department of Transportation). 2003. Discharge Characterization Study Report. California Department of Transportation, Sacramento, CA.
CDM. Los Angeles River and Tributaries Total Maximum Daily Load for Metals Final Implementation Plan for Reach 2 Participating Jurisdictions. October 11, 2010.
City of Los Angeles and County of Los Angeles, Technical Steering Committee. 2014. Santa Monica Bay Beaches Bacterial TMDLs Coordinated Shoreline Monitoring Plan. Submitted November 12, 2003. Revised April 7, 2014.
City of Los Angeles Bureau of Sanitation Watershed Protection Division. 2011. Machado Lake Nutrient TMDL Annual Report 2011.
City of Los Angeles Bureau of Sanitation Watershed Protection Division. 2012. Machado Lake Nutrient TMDL 2012 Annual Report.
City of San Diego and Caltrans 2012. Tecolote Watershed Comprehensive Load Reduction Plan. Final Report. San Diego, CA.
City of San Diego. 2009. Aerial Deposition Study, Phase III. Source Evaluation of TMDL Metals in the Chollas Creek Watershed. Final Report. San Diego, CA.
City of San Diego. 2011. Mission Bay and La Jolla Watershed Urban Runoff Management Program. Fiscal Year 2010 Annual Report.
City of San Diego. 2012. San Diego River Watershed Comprehensive Load Reduction Plan. Phase II. San Diego, CA.
County of Los Angeles Department of Public Works, 2000. Los Angeles County 1994-2000 Integrated Receiving Water Impacts Report. July 31.
County of Los Angeles Department of Public Works. 2013. Year 1 Nutrient Monitoring for the County of Los Angeles Unicorporated Area of the Machado Lake Watershed.
County of Los Angeles Department of Public Works. 2014. Los Angeles County 1994-2000 Integrated Receiving Water Impacts Report. Table 4-12, Summary of 1994-2000 Land Use Results by Site.
County of Los Angeles. 2010. Multi-pollutant TMDL Implementation Plan for the Unincorporated County Area of Los Angeles River Watershed. County of Los Angeles, Los Angeles, CA

County of San Diego. 2011. 2009-2010 Urban Runoff Monitoring Annual Report. January 2011.
Davis A.P., M. Shokouhian, and S. Ni. 2001. Loading estimates of lead, copper, cadmium, and zinc in urban runoff from specific sources. Chemosphere.
Detection and Elimination Minimum Control Measure. Web 7 April 2014.
Donigian, A. S., Jr. 2000. Lecture 19: Calibration and verification issues, Slide L19-22. HSPF training workshop handbook and CD. Presented and prepared for the U.S. EPA Office of Water and Office of Science and Technology, Washington, D.C.
Environmental Protection Agency. “Silver.” R.E.D. Facts, June 1993. Web. October 2013. http://www.epa.gov/oppsrrd1/REDs/factsheets/4082fact.pdf.
Environmental Protection Agency. EPA Consumer Fact Sheet on: Antimony. March 2010. Web. October 2013. http://www.epa.gov/ogwdw000/pdfs/factsheets/ioc/antimony.pdf.
Environmental Protection Agency. Mercury. November 2013. Web. October 2013. http://www.epa.gov/mercury/.
Environmental Protection Agency. National Environmental Policy Act (NEPA). March 2010. Web. October 2013. http://www2.epa.gov/nepa.
Environmental Protection Agency. Polycyclic Aromatic Hydrocarbons, January 2008. Web. October 2013. http://www.epa.gov/osw/hazard/wastemin/minimize/factshts/pahs.pdf.
Farfsing, Ken with the City of Signal Hill and Watson, Richard with Richard Watson & Associates. Stormwater Funding Options – Providing Sustainable Water Quality Funding in Los Angeles County. October 14, 2014. Prepared for California Contract Cities Association and the League of California Cities, Los Angeles County Division City Managers Committees.
Geosyntec Consultants, 2008. A User’s Guide for the Structural BMP Prioritization and Analysis Tool (SBPAT v1.0): Technical Appendices. December.
Geosyntec Consultants, 2012. San Luis Rey River Watershed Comprehensive Load Reduction Plan. October.
Gregorio, D., and S.L. Moore, 2004. Discharge into State Water Quality Protection Areas in Southern California. http://www.sccwrp.org/Homepage/RecentPublications.aspx
Hunsaker and Associates. Water Quality Mitigation Plan. June 16, 2010.
LARWQCB (Los Angeles Regional Water Quality Control Board & U.S. Environmental Protection Agency, Region 9). Dec 2010.
Lattin, G.L., C.J. Moore, A.F. Zelkers, S.L. Moore, S.B. Weisberg. 2004. A Comparison of Neustonic Plastic and Zooplankton at Different Depths near the Southern California Shore. Marine Pollution Bulletin

Los Angeles Department of Public Works. Stormwater Monitoring Reports, 2002-2012. Web. October 2013. http://dpw.lacounty.gov/wmd/NPDES/report_directory.cfm.
Los Angeles Regional Water Quality Control Board (LARWQCB). Los Angeles River Watershed Bacteria Total Maximum Daily Load. Staff Report, California Regional Water Quality Control Board Los Angeles Region. July 15, 2010.
Los Angeles Regional Water Quality Control Board (LARWQCB). Total Maximum Daily Loads for Metals, Los Angeles River and Tributaries. Staff Report, Los Angeles Regional Water Quality Control Board prepared in coordination with Environmental Protection Agency Region 9. June 2, 2005.
Los Angeles River Jurisdictional Group 1. Metals TMDL Implementation Plan. October 11, 2010.
Lu, R., K. Schiff, S. Solzenbach, and D. Keith. 2004. Nitrogen Deposition on Coastal Watersheds in the Los Angeles Region. Southern California Coastal Water Research Project Annual Report. 2003-2004. pp. 73– 81.
Moran, Kelly D. 2008. “Consumer Products Cause Water Pollution - Lessons from Brake Pads.” Western
Moran, Kelly. 2011. “Brake Pad Copper Reduction – MRP Section C.13.c. Report 2011.” Memo to Arleen Feng, ACCWP. TDC Environmental. San Mateo, CA. 18 July. Web. 7 April 2014.
Nixon, H., and J.D. Saphores. 2007. Impacts of motor vehicle operation on water quality: Clean-up costs and policies. Transportation Research Part D. Transport and Environment.
Northgate Environmental Management, Inc. 2012. 2011-2012 Yearly Stormwater Monitoring Report Machado Lake Nutrient TMDL Sampling Peninsula Cities, California.
Northgate Environmental Management, Inc. 2013. 2012-2013 Yearly Stormwater Monitoring Report Machado Lake Nutrient TMDL Sampling Peninsula Cities, California.
Palos Verdes Peninsula Subwatershed Machado Lake Nutrient TMDL Coordinated Implementation Plan. 2011.
Raskin, L., M.J. Singer, and A. DePaoli. 2004. Final Report to the State Water Resources Control Board Agreement number 01-269-250. University of California, Davis, CA.
Regional Pollution Prevention Network. PowerPoint presentation. Web. 7 April 2014.
Sabin, L. and K. Schiff. 2007. Metal Dry Deposition Rates along a Coastal Transect in Southern California. Technical Report #509. Southern California Coastal Research Project, Costa Mesa, CA
Sabin, L.D., K.C. Schiff, J. Hee Lim, and K.D. Stolzenback. 2004. Atmospheric Dry Deposition of Trace Metals in the Los Angeles Coastal Region. Southern California Coastal Research Project, Costa Mesa, CA.
SCCWRP, 2005. Microbiological Water Quality at Reference Beaches in Southern California During Wet Weather (SCCWRP Technical Report 448). August.
SCCWRP, 2007a. Assessment of Water Quality Concentrations and Loads from Natural Landscapes (SCCWRP Technical Report 500). February.
SCCWRP, 2007b. Sources, Patterns and Mechanisms of Storm Water Pollutant Loading From Watersheds and Land Uses of the Greater Los Angeles Area, California, USA (SCCWRP Technical Report 510), March.
Schueler, T., and H.K. Holland. 2000. The Practice of Watershed Protection. Center for Watershed Protection, Ellicott City.
SDRWQCB (San Diego Regional Water Quality Control Board). 2010. Revised TMDL for Indicator Bacteria, Project I - Twenty Beaches and Creeks in the San Diego Region. Resolution No. R9-2010-0001.
State Water Resources Control Board. 2015. Web. http://www.swrcb.ca.gov.
State Water Resources Control Board. Water Quality Control Plan: Los Angeles Region Basin Plan for the Coastal Watersheds of Los Angeles and Ventura Counties. 2015. Web. http://www.waterboards.ca.gov/losangeles/water_issues/programs/basin_plan/.
Stein, E.D., L.L. Tiefenthaler, and K. Schiff. 2006. Watershed-based Sources of Polycyclic Aromatic Hydrocarbons in Urban Storm Water. Environmental Toxicology and Chemistry 25(2):373–385
Stein, Eric D., Tiefenthaler, Liesl L. and Schiff, Kenneth C. Technical Report 510: Sources, Patterns and Mechanisms of Stormwater Pollutant Loading from Watersheds and Land Uses of the Greater. March, 2007.
Stolzenbach, K.D. 2006. Atmospheric Deposition Grades B+ to C-. Southern California Environmental Report Card 2006. University of California, Los Angeles, Institute of the Environment, Los Angeles, CA.
Sutula, M., K. Kamer, and J. Cable. 2004. Sediment as a Nonpoint Source of Nutrients to Malibu Lagoon, California. Southern California Coastal Research Project. Technical Report.
SWRCB (State Water Resources Control Board). 2011. NPDES Permits (including Storm Water). Excel spreadsheet download. Accessed December 6, 2011.
TDC Environmental. 2004. Copper Sources in Urban and Shoreline Activities. San Francisco, CA.
United States Department of Agriculture (USDA), 2009. National Engineering Handbook (210-VI-NEH), Chapter 7. Natural Resource Conservation Service.
United States Environmental Protection Agency and the Los Angeles Regional Water Quality Control
United States Environmental Protection Agency Region IX. 20012. Santa Monica Bay Total Maximum Daily Loads for DDTs and PCBs.
United States Environmental Protection Agency. 2005. Stormwater Phase II Final Rule: Construction Site Runoff Control Minimum Control Measure. Web 7 April 2014.
United States Environmental Protection Agency. 2005. Stormwater Phase II Final Rule: Illicit Discharge
United States Environmental Protection Agency. 2005. Stormwater Phase II Final Rule: Public Education and Outreach Minimum Control Measure. Web. 7 April 2014.
United States Environmental Protection Agency. 2011. Sanitary Sewer Overflows and Peak Flows.
Ventura County Flood Control District, 2003. Stormwater monitoring report, 1997‐2003.
Wheeler and Zajaczkowski. Horse Stable Manure Management, Publication G-97. Penn State College of Agricultural Sciences Cooperative Extension, Agricultural and Biological Engineering.

APPENDIX 1
LA COUNTY FLOOD CONTROL DISTRICT SUMMARY

HOA.1069965.1
In 1915, the Los Angeles County Flood Control Act established the LACFCD and
empowered it to manage flood risk and conserve stormwater for groundwater recharge. In
coordination with the United States Army Corps of Engineers the LACFCD developed and
constructed a comprehensive system that provides for the regulation and control of flood
waters through the use of reservoirs and flood channels. The system also controls debris,
collects surface storm water from streets, and replenishes groundwater with storm water and
imported and recycled waters. The LACFCD covers the 2,753 square-mile portion of Los
Angeles County south of the east-west projection of Avenue S, excluding Catalina Island. It
is a special district governed by the County of Los Angeles Board of Supervisors, and its
functions are carried out by the Los Angeles County Department of Public Works. The
LACFCD service area is shown in Figure 1.A -1.
Unlike cities and counties, the LACFCD does not own or operate any municipal sanitary
sewer systems, public streets, roads, or highways. The LACFCD operates and maintains
storm drains and other appurtenant drainage infrastructure within its service area. The
LACFCD has no planning, zoning, development permitting, or other land use authority
within its service area. The permittees that have such land use authority are responsible
under the Permit for inspecting and controlling pollutants from industrial and commercial
facilities, development projects, and development construction sites. (Permit, Part II.E, p.
17.)
The MS4 Permit language clarifies the unique role of the LACFCD in storm water
management programs: “[g]iven the LACFCD’s limited land use authority, it is appropriate
for the LACFCD to have a separate and uniquely-tailored storm water management
program. Accordingly, the storm water management program minimum control measures
imposed on the LACFCD in Part VI.D of this Order differ in some ways from the minimum
control measures imposed on other Permittees. Namely, aside from its own properties and
facilities, the LACFCD is not subject to the Industrial/Commercial Facilities Program, the
Planning and Land Development Program, and the Development Construction Program.
However, as a discharger of storm and non-storm water, the LACFCD remains subject to the
Public Information and Participation Program and the Illicit Connections and Illicit
Discharges Elimination Program. Further, as the owner and operator of certain properties,
facilities and infrastructure, the LACFCD remains subject to requirements of a Public
Agency Activities Program.”
(Permit, Part II.F, p. 18.)
Consistent with the role and responsibilities of the LACFCD under the Permit, the EWMPs
and CIMPs reflect the opportunities that are available for the LACFCD to collaborate with
permittees having land use authority over the subject watershed area. In some instances, the
opportunities are minimal, however the LACFCD remains responsible for compliance with
certain aspects of the MS4 permit as discussed above.
In some instances, in recognition of the increased efficiency of implementing certain programs
regionally, the LACFCD has committed to responsibilities above and beyond its obligations
under the 2012 Permit. For example, although under the 2012 Permit the Public Information and

HOA.1069965.1
Participation Program is a responsibility of each Permittee, the LACFCD is committed to
implementing certain regional elements of the PIPP on behalf of all Permittees at no cost to the
Permittees. These regional elements include:
Maintaining a countywide hotline (888-CLEAN-LA) and website (www.888cleanla.com)
for public reporting and general stormwater management information at an estimated
annual cost of $250,000. Each Permittee can utilize this hotline and website for public
reporting within its jurisdiction.
Broadcasting public service announcements and conducting regional advertising
campaigns at an estimated annual cost of $750000.
Facilitating the dissemination of public education and activity specific stormwater
pollution prevention materials at an estimated annual cost of $100,000.
Maintaining a stormwater website at an estimated annual cost of $10,000.
The LACFCD will implement these elements on behalf of all Permittees starting July 2015 and
through the Permit term. With the LACFCD handling these elements regionally, Permittees can
better focus on implementing local or watershed-specific programs, including student education
and community events, to fully satisfy the PIPP requirements of the 2012 Permit.
Similarly, although water quality monitoring is a responsibility of each Permittee under the 2012
Permit, the LACFCD is committed to implement certain regional elements of the monitoring
program. Specifically, the LACFCD will continue to conduct monitoring at the seven existing
mass emissions stations required under the previous Permit. The LACFCD will also participate
in the Southern California Stormwater Monitoring Coalition’s Regional Bioassessment Program
on behalf of all Permittees. By taking on these additional responsibilities, the LACFCD wishes
to increase the efficiency and effectiveness of these programs.

HOA.1069965.1
Figure 1.A-1 Los Angeles County Flood Control District Service Area

HOA.1069965.1
Figure 1.A-2 Los Angeles County Flood Control District Areas in Peninsula WMG

APPENDIX 2
MINIMUM CONTROL MEASURES (MCM)
GUIDANCE DOCUMENTS

APPENDIX 2-DC
DEVELOPMENT CONSTRUCTION PROGRAM

Minimum Control Measures Development Construction Program
DC-1
Development Construction Program
The Cities are required to develop, implement and enforce a construction program that includes the provisions listed in MS4 Permit §VI.D.8 (LB §VII.K). This document provides guidance to assist the Participating Agencies in implementing a construction program in compliance with the MS4 Permit.
Objectives Permit §VI.D.8.a
The objectives of the construction program are to:
Prevent illicit construction-related discharges of pollutants into the MS4 and receiving waters.
Implement and maintain structural and non-structural BMPs to reduce pollutants in stormwater runoff from construction sites.
Reduce construction site discharges of pollutants to the MS4 to the MEP.
Prevent construction site discharges to the MS4 from causing or contributing to a violation of water quality standards.
Erosion and Sediment Control Ordinance Permit §VI.D.8.b
The construction program requires an established, enforceable erosion and sediment control ordinance for all construction sites that disturb soil.
Applicability Permit §VI.D.8.c
The construction program addresses construction activity as defined in Table DC-1.
Table DC-1: Definitions
Construction Activity
Definition Any construction or demolition activity, clearing, grading, grubbing, or excavation or any other activity that results in land disturbance.
Examples Grading, vegetation clearing, soil compaction, paving, repaving and linear underground/overhead projects (LUPs) that result in land disturbance.
Exclusions Emergency construction required to immediately protect public health and safety, routine maintenance as defined below and agricultural activities.
Routine Maintenance (construction program exclusion)
Definition Projects required to maintain the integrity of structures, including but not limited to the following:
Examples Maintaining the original line and grade, hydraulic capacity, or original purpose of the facility.
Performing restoration work to preserve the original design grade, integrity and hydraulic capacity of flood control facilities.
Performing road shoulder work, regrading dirt/gravel roadways/shoulders and cleaning out ditches.
Update existing lines (includes replacing with new materials or pipe) and facilities to comply with applicable codes, standards, and regulations regardless if such projects result in increased capacity.
Repair leaks
Exclusion New lines (i.e. not associated with existing facilities and not part of a project to update or replace existing lines) or facilities constructed to comply with applicable codes, standards and regulations.
The greater part of the construction program is dedicated to construction sites that disturb one acre or more of soil (with the exception of agricultural activities). This coincides with the size threshold for coverage under the State Water Resources Control Board’s NPDES General Permit for Storm Water Discharges Associated with Construction and Land Disturbance Activities. The program provisions exclusive to sites less than one acre are addressed first.

Minimum Control Measures Development Construction Program
DC-2
Construction Sites Less than One Acre Permit §VI.D.8.d
BMPs (< 1 acre)
Through the use of the erosion and sediment control ordinance and/or building permit, construction sites are required have in place an effective combination of erosion and sediment control BMPs from Table DC-2 to prevent erosion and sediment loss and the discharge of construction wastes.
Table DC-2: Applicable Set of BMPs for All Construction Sites
BMP Type BMP
Erosion Controls Scheduling
Preservation of Existing Vegetation
Sediment Controls
Silt Fence
Sand Bag Barrier
Stabilized Construction Site Entrance/Exit
Nonstormwater Management Water Conservation Practices
Dewatering Operations
Waste Management
Material Delivery and Storage
Stockpile Management
Spill Prevention and Control
Solid Waste Management
Concrete Waste Management
Sanitary/Septic Waste Management
Inventory (< 1 acre)
All construction sites with soil disturbing activities that require a permit, regardless of size, are identified and stored in an inventory. Existing permit databases or other tracking systems may be used to file this information. The list of permitted sites is provided to the Regional Water Board upon request.
Inspections (< 1 acre)
Construction sites are inspected on as needed based on the evaluation of the factors that are a threat to water quality. In evaluating the threat to water quality, the following factors are considered: soil erosion potential, site slope, project size and type, sensitivity of receiving water bodies, proximity to receiving water bodies, nonstormwater discharges, past record of noncompliance by the operators of the construction site and any water quality issues relevant to the particular MS4.
Enforcement (< 1 acre)
The Progressive Enforcement Policy (MS4 Permit §VI.D.2) is implemented to ensure that construction sites are brought into compliance with the erosion and sediment control ordinance within a reasonable time period.
Construction Sites One Acre or Greater
Operators of public and private construction sites within a city’s jurisdiction are required to select, install, implement, and maintain BMPs that comply with the erosion and sediment control ordinance.
Construction Site Inventory / Electronic Tracking System Permit §VI.D.8.g
An electronic system is used to inventory all issued grading permits, encroachment permits, demolition permits, building permits, or construction permits (and any other municipal authorization to move soil and/ or construct or destruct that involves land disturbance). A database management system or GIS
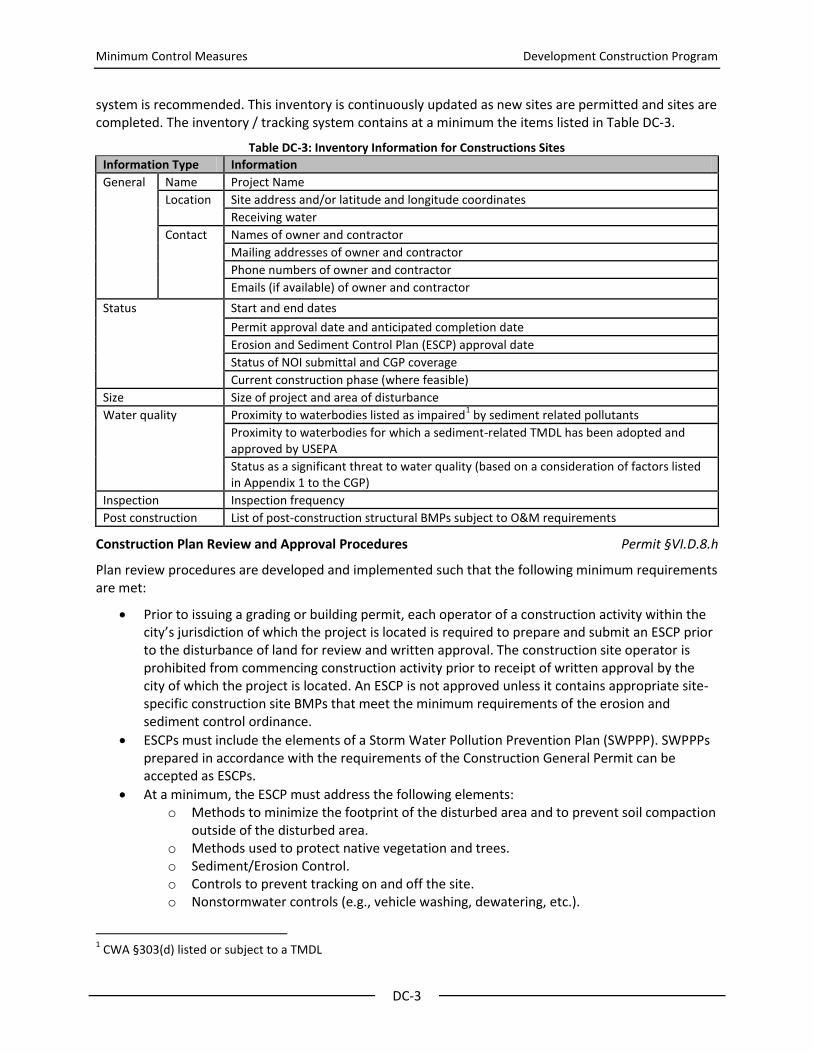
Minimum Control Measures Development Construction Program
DC-3
system is recommended. This inventory is continuously updated as new sites are permitted and sites are completed. The inventory / tracking system contains at a minimum the items listed in Table DC-3.
Table DC-3: Inventory Information for Constructions Sites
Information Type Information
General Name Project Name
Location Site address and/or latitude and longitude coordinates
Receiving water
Contact Names of owner and contractor
Mailing addresses of owner and contractor
Phone numbers of owner and contractor
Emails (if available) of owner and contractor
Status Start and end dates
Permit approval date and anticipated completion date
Erosion and Sediment Control Plan (ESCP) approval date
Status of NOI submittal and CGP coverage
Current construction phase (where feasible)
Size Size of project and area of disturbance
Water quality Proximity to waterbodies listed as impaired1 by sediment related pollutants
Proximity to waterbodies for which a sediment-related TMDL has been adopted and approved by USEPA
Status as a significant threat to water quality (based on a consideration of factors listed in Appendix 1 to the CGP)
Inspection Inspection frequency
Post construction List of post-construction structural BMPs subject to O&M requirements
Construction Plan Review and Approval Procedures Permit §VI.D.8.h
Plan review procedures are developed and implemented such that the following minimum requirements are met:
Prior to issuing a grading or building permit, each operator of a construction activity within the city’s jurisdiction of which the project is located is required to prepare and submit an ESCP prior to the disturbance of land for review and written approval. The construction site operator is prohibited from commencing construction activity prior to receipt of written approval by the city of which the project is located. An ESCP is not approved unless it contains appropriate site-specific construction site BMPs that meet the minimum requirements of the erosion and sediment control ordinance.
ESCPs must include the elements of a Storm Water Pollution Prevention Plan (SWPPP). SWPPPs prepared in accordance with the requirements of the Construction General Permit can be accepted as ESCPs.
At a minimum, the ESCP must address the following elements: o Methods to minimize the footprint of the disturbed area and to prevent soil compaction
outside of the disturbed area. o Methods used to protect native vegetation and trees. o Sediment/Erosion Control. o Controls to prevent tracking on and off the site. o Nonstormwater controls (e.g., vehicle washing, dewatering, etc.).
1 CWA §303(d) listed or subject to a TMDL

Minimum Control Measures Development Construction Program
DC-4
o Materials Management (delivery and storage). o Spill Prevention and Control. o Waste Management (e.g., concrete washout/waste management; sanitary waste
management). o Identification of site Risk Level as identified per the requirements in Appendix 1 of the
Construction General Permit.
The ESCP must include the rationale for the selection and design of the proposed BMPs, including quantifying the expected soil loss from different BMPs.
The ESCP must be developed and certified by a Qualified SWPPP Developer (QSD).
All structural BMPs must be designed by a licensed California Engineer.
The landowner or the landowner’s agent must sign a statement on the ESCP as follows (see Attachment DC-A for sample OC-1 template):
“I certify that this document and all attachments were prepared under my direction or supervision in accordance with a system designed to ensure that qualified personnel properly gather and evaluate the information submitted. Based on my inquiry of the person or persons who manage the system or those persons directly responsible for gathering the information, to the best of my knowledge and belief, the information submitted is true, accurate, and complete. I am aware that submitting false and/ or inaccurate information, failing to update the ESCP to reflect current conditions, or failing to properly and/ or adequately implement the ESCP may result in revocation of grading and/ or other permits or other sanctions provided by law.”
Prior to issuing a grading or building permit, the city of which the project is located verifies that the construction site operators have existing coverage under applicable permits, including, but not limited to the State Water Board’s Construction General Permit, and State Water Board 401 Water Quality Certification.
A checklist is used to conduct and document review of each ESCP (see Attachment DC-B for the ESCP Checklist sample template).
BMP Implementation Level Permit §VI.D.8.i
The Cities will implement technical standards for the selection, installation and maintenance of construction BMPs for all construction sites within its jurisdiction.
The BMP technical standards require:
The use of BMPs that are tailored to the risks posed by the project. Sites are ranked from Low Risk (Risk 1) to High Risk (Risk 3). Project risks are calculated based on the potential for erosion from the site and the sensitivity of the receiving water body. Receiving water bodies that are listed on the Clean Water Act (CWA) Section 303(d) list for sediment or siltation are considered High Risk. Likewise, water bodies with designated beneficial uses of SPWN, COLD, and MIGR are also considered High Risk. The combined (sediment/receiving water) site risk is calculated using the methods provided in Appendix 1 of the Construction General Permit. At a minimum, the BMP technical standards include requirements for High Risk sites as defined in Table DC-7.
The use of BMPs for all construction sites, sites equal or greater to 1 acre, and for paving projects per Table DC-6 and Table DC-8.
Detailed installation designs and cut sheets for use within ESCPs.
Maintenance expectations for each BMP, or category of BMPs, as appropriate.
Permittees are encouraged to adopt respective BMPs from latest versions of the California BMP Handbook, Construction or Caltrans Stormwater Quality Handbooks, Construction Site Best
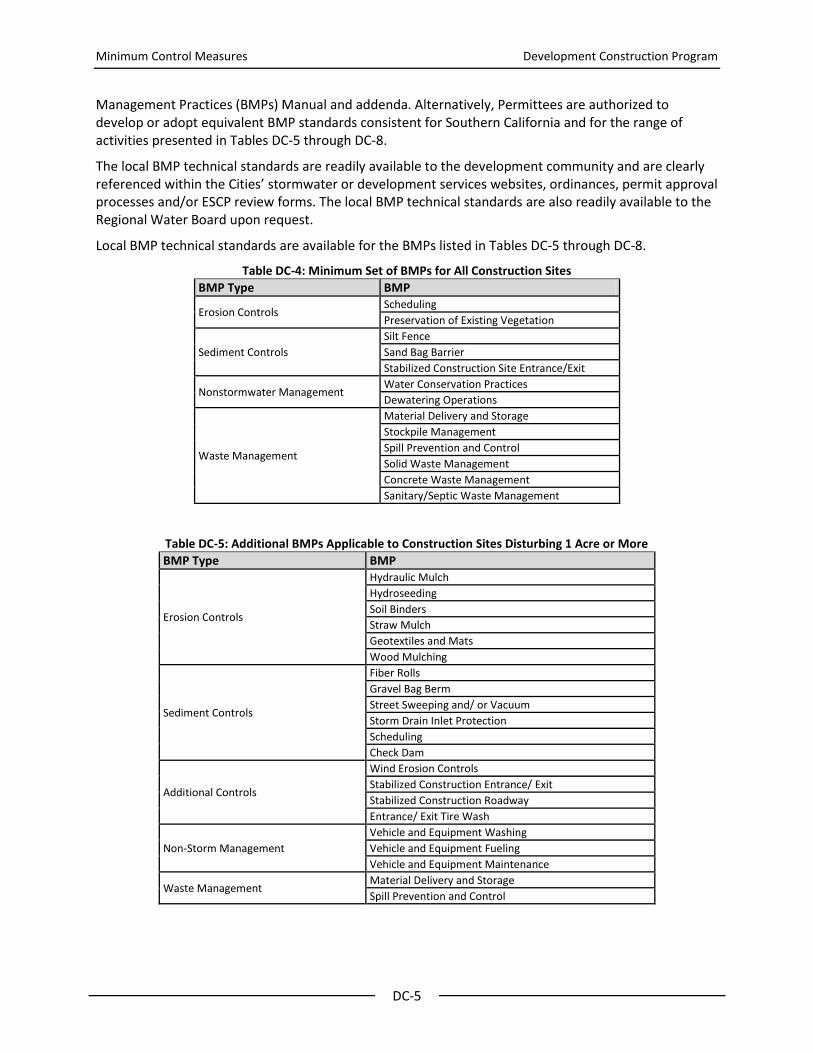
Minimum Control Measures Development Construction Program
DC-5
Management Practices (BMPs) Manual and addenda. Alternatively, Permittees are authorized to develop or adopt equivalent BMP standards consistent for Southern California and for the range of activities presented in Tables DC-5 through DC-8.
The local BMP technical standards are readily available to the development community and are clearly referenced within the Cities’ stormwater or development services websites, ordinances, permit approval processes and/or ESCP review forms. The local BMP technical standards are also readily available to the Regional Water Board upon request.
Local BMP technical standards are available for the BMPs listed in Tables DC-5 through DC-8.
Table DC-4: Minimum Set of BMPs for All Construction Sites
BMP Type BMP
Erosion Controls Scheduling
Preservation of Existing Vegetation
Sediment Controls
Silt Fence
Sand Bag Barrier
Stabilized Construction Site Entrance/Exit
Nonstormwater Management Water Conservation Practices
Dewatering Operations
Waste Management
Material Delivery and Storage
Stockpile Management
Spill Prevention and Control
Solid Waste Management
Concrete Waste Management
Sanitary/Septic Waste Management
Table DC-5: Additional BMPs Applicable to Construction Sites Disturbing 1 Acre or More
BMP Type BMP
Erosion Controls
Hydraulic Mulch
Hydroseeding
Soil Binders
Straw Mulch
Geotextiles and Mats
Wood Mulching
Sediment Controls
Fiber Rolls
Gravel Bag Berm
Street Sweeping and/ or Vacuum
Storm Drain Inlet Protection
Scheduling
Check Dam
Additional Controls
Wind Erosion Controls
Stabilized Construction Entrance/ Exit
Stabilized Construction Roadway
Entrance/ Exit Tire Wash
Non-Storm Management
Vehicle and Equipment Washing
Vehicle and Equipment Fueling
Vehicle and Equipment Maintenance
Waste Management Material Delivery and Storage
Spill Prevention and Control

Minimum Control Measures Development Construction Program
DC-6
Table DC-6: Additional Enhanced BMPs for High Risk Sites
BMP Type BMP
Erosion Controls
Hydraulic Mulch
Hydroseeding
Soil Binders
Straw Mulch
Geotextiles and Mats
Wood Mulching
Slope Drains
Sediment Controls
Silt Fence
Fiber Rolls
Sediment Basin
Check Dam
Gravel Bag Berm
Street Sweeping and/or Vacuum
Sand Bag Barrier
Storm Drain Inlet Protection
Additional Controls
Wind Erosion Controls
Stabilized Construction Entrance/Exit
Stabilized Construction Roadway
Entrance/Exit Tire Wash
Advanced Treatment Systems*
Nonstormwater Management
Water Conservation Practices
Dewatering Operations (Ground water dewatering only under NPDES Permit No. CAG994004)
Vehicle and Equipment Washing
Vehicle and Equipment Fueling
Vehicle and Equipment Maintenance
Waste Management
Material Delivery and Storage
Stockpile Management
Spill Prevention and Control
Solid Waste Management
*Applies to public roadway projects.

Minimum Control Measures Development Construction Program
DC-7
Table DC-7: Minimum Required BMPs for Roadway Paving or Repair Operation (For Private or Public Projects)
# BMP
1. Restrict paving and repaving activity to exclude periods of rainfall or predicted rainfall unless required by emergency conditions.
2. Install gravel bags and filter fabric or other equivalent inlet protection at all susceptible storm drain inlets and at manholes to prevent spills of paving products and tack coat.
3. Prevent the discharge of release agents including soybean oil, other oils, or diesel to the stormwater drainage system or receiving waters.
4. Minimize non stormwater runoff from water use for the roller and for evaporative cooling of the asphalt.
5. Clean equipment over absorbent pads, drip pans, plastic sheeting or other material to capture all spillage and dispose of properly.
6. Collect liquid waste in a container, with a secure lid, for transport to a maintenance facility to be reused, recycled or disposed of properly.
7. Collect solid waste by vacuuming or sweeping and securing in an appropriate container for transport to a maintenance facility to be reused, recycled or disposed of properly.
8. Cover the “cold-mix” asphalt (i.e., pre-mixed aggregate and asphalt binder) with protective sheeting during a rainstorm.
9. Cover loads with tarp before haul-off to a storage site, and do not overload trucks.
10. Minimize airborne dust by using water spray or other approved dust suppressant during grinding.
11. Avoid stockpiling soil, sand, sediment, asphalt material and asphalt grindings materials or rubble in or near stormwater drainage system or receiving waters.
12. Protect stockpiles with a cover or sediment barriers during a rain.
Construction Site Inspection Permit §VI.D.8.j
The Cities’ legal authority is used to implement procedures for inspecting public and private construction sites. The inspection procedures are implemented as follows:
Inspection Frequency
Inspect the public and private construction sites as specified in Table DC-8.
All phases of construction are inspected as follows: o Prior to Land Disturbance – Prior to allowing an operator to commence land
disturbance, each Permittee shall perform an inspection to ensure all necessary erosion and sediment structural and non-structural BMP materials and procedures are available per the erosion and sediment control plan.
o During Active Construction, including Land Development2 and Vertical Construction3 – In accordance with the frequencies specified in Table DC-8, inspections are performed to ensure all necessary erosion and sediment structural and non-structural BMP materials and procedures are available per the erosion and sediment control plan throughout the construction process.
o Final Landscaping / Site Stabilization4 – At the conclusion of the project and as a condition of approving and/or issuing a Certificate of Occupancy, the constructed site is inspected to ensure that all graded areas have reached final stabilization and that all
2 Activities include cuts and fills, rough and finished grading; alluvium removals; canyon cleanouts; rock undercuts; keyway
excavations; stockpiling of select material for capping operations; and excavation and street paving, lot grading, curbs, gutters and sidewalks, public utilities, public water facilities including fire hydrants, public sanitary sewer systems, storm sewer system and/or other drainage improvement. 3
The build out of structures from foundations to roofing, including rough landscaping. 4
All soil disturbing activities at each individual parcel within the site have been completed.
Minimum Control Measures Development Construction Program
DC-8
trash, debris, and construction materials, and temporary erosion and sediment BMPs are removed.
Based on the required frequencies above, each construction project is inspected a minimum of three times.
Table DC-8: Inspection Frequencies for Sites One Acre or Greater
Site Inspection Frequency Shall Occur
All sites 1 acre or larger that discharge to a tributary listed by the state as an impaired water for sediment or turbidity under the CWA §303(d)
(1) when two or more consecutive days with greater than 50% chance of rainfall are predicted by NOAA
5, (2) within 48
hours of a ½-inch rain event and at (3) least once every two weeks
Other sites 1 acre or more determined to be a significant threat to water quality
6
All other construction sites with 1 acre or more of soil disturbance not meeting the criteria above
At least monthly
Inspection Standard Operating Procedures
Standard operating procedures are implemented, and revised as necessary, that identify the inspection procedures followed by the Cities’ inspectors (see Attachment DC-C for suggested standard operating procedures). Inspections of construction sites – and the standard operating procedures – include, but are not limited to:
1. Verification of active coverage under the Construction General Permit for sites disturbing 1 acre or more, or that are part of a planned development that will disturb 1 acre or more and a process for referring non-filers to the Regional Water Board.
2. Review of the applicable ESCP and inspection of the construction site to determine whether all BMPs have been selected, installed, implemented, and maintained according to the approved plan and subsequent approved revisions (see Attachment DC-B for the ESCP Checklist sample template).
3. Assessment of the appropriateness of the planned and installed BMPs and their effectiveness. 4. Visual observation and record keeping of nonstormwater discharges, potential illicit discharges
and connections, and potential discharge of pollutants in stormwater runoff. 5. Development of a written or electronic inspection report generated from an inspection checklist
used in the field (see Attachment DC-D and DC-E for the Large Site and Small Site7 Inspection Forms, respectively).
6. Tracking of the number of inspections for the inventoried construction sites throughout the reporting period to verify that the sites are inspected at the minimum frequencies listed in Table DC-8.
Enforcement Permit §VI.D.8.k
The Progressive Enforcement Policy is implemented to ensure that construction sites are brought into compliance with all stormwater requirements within a reasonable time period.
5 www.srh.noaa.gov/forecast
6 In evaluating the threat to water quality, the following factors shall be considered: soil erosion potential; site slope; project
size and type; sensitivity of receiving water bodies; proximity to receiving water bodies; nonstormwater discharges; past record of non-compliance by the operators of the construction site; and any water quality issues relevant to the particular MS4. 7 A “large site” refers to a site greater than or equal to 1 acre while a “small site” refers to a site less than one acre.

Minimum Control Measures Development Construction Program
DC-9
Permittee Staff Training Permit §VI.D.8.l
Staff whose primary job duties are related to implementing the construction stormwater program are adequately trained. The Cities may conduct in-house training or contract with consultants. Training is provided to the following staff positions of the MS4:
Plan Reviewers and Permitting Staff – Staff and consultants are trained as qualified individuals, knowledgeable in the technical review of local erosion and sediment control ordinance, local BMP technical standards, ESCP requirements, and the key objectives of the State Water Board QSD program. The training is provided either internally to staff or staff is required to obtain QSD certification.
Erosion Sediment Control/Stormwater Inspectors – Inspectors are either 1) knowledgeable in inspection procedures consistent with the State Water Board sponsored program QSD, 2) a Qualified SWPPP Practitioner (QSP) or 3) a designated person on staff trained in the key objectives of the QSD/QSP programs supervises inspection operations. The training is provided either provided internally to staff or staff is required to obtain QSD/QSP certification. Each inspector is knowledgeable of the local BMP technical standards and ESCP requirements.
Third-Party Plan Reviewers, Permitting Staff, and Inspectors – If outside parties are utilized to conduct inspections and/or review plans, these staff are trained per the requirements listed above. Outside contractors can self-certify, providing they certify they have received all applicable training required in MS4 Permit §VI.D.8 and have documentation to that effect.

ATTACHMENT DC-A

OWNER’S CERTIFICATION
Minimum BMPs for ALL Construction Sites
Plan Check #__________________________
FORM
OC1
Project Name _______________________________ BUILDING/GRADING PERMIT NUMBER
Project Location _______________________________
Owner Name _______________________________ Contractor Name _______________________________
Address _______________________________ Address _______________________________
Phone _______________________________ Phone _______________________________
FAX/Email _______________________________ FAX/Email _______________________________
The National Pollutant Discharge Elimination System (NPDES) is the portion of the Clean Water Act that applies to the protection of receiving waters. Under permits from the Los Angeles Regional Water Quality Control Board (RWQCB),
certain activities are subject to RWQCB enforcement. To meet the requirements of the Los Angeles County Municipal Stormwater Permit (CAS004001), minimum requirements for sediment control, erosion control and construction activities
must be implemented on each project site. Minimum requirements include:
EROSION CONTROL: Erosion from slopes and channels shall be controlled by implementing an effective combination of BMPs, such as the limiting of grading activities during the wet season; inspecting graded areas during
rain events; planting and maintenance of vegetation on slopes; and covering erosion susceptible slopes. SEDIMENT CONTROL: Eroded sediments from areas disturbed by construction and from stockpiles of soil shall be
retained on site to minimize sediment transport from the site to streets, drainage facilities and/or adjacent properties via runoff, vehicle tracking or wind.
NON-STORMWATER MANAGEMENT: Non-stormwater runoff from equipment and vehicle washing and any other
activity shall be contained at the project site. WASTE MANAGEMENT: Construction related materials, wastes, spills or residues shall be retained on site to
minimize transport from the site to streets, drainage facilities or adjoining properties by wind or runoff. Runoff from
equipment and vehicle washing shall be contained at construction sites unless treated to remove sediment and pollutants.
Examples of Minimum BMPs include: (1) Soil piles must be covered with tarps or plastic, (2) leaking equipment must be repaired immediately, (3) refueling must be conducted away from catch basins, (4) catch basins must be protected when working nearby, (5) vacuum all concrete saw cutting, (6) never wash concrete waste into the street, (7) keep the site clean, sweep the gutters at the end of each working day and keep a trash receptacle on site.
As the architect/engineer of record, I have selected appropriate BMPs to effectively minimize the negative impacts of this project’s construction activities on stormwater quality. The project owner and contractor are aware that the selected
BMPs shall be installed, monitored, and maintained to ensure their effectiveness. The BMPs not selected for implementation are redundant or deemed not applicable to the proposed construction activity.
Architect/Engineer of Record Name Architect/Engineer of Record Signature
Title Date
I certify that this document and all attachments were prepared under my direction or supervision in accordance with a
system designed to ensure that qualified personnel properly gather and evaluate the information submitted. Based on my inquiry of the person or persons who manage the system or those persons directly responsible for gathering the
information, to the best of my knowledge and belief, the information submitted is true, accurate, and complete. I am
aware that submitting false and/ or inaccurate information, failing to update the ESCP to reflect current conditions, or failing to properly and/ or adequately implement the ESCP may result in revocation of grading and/ or other permits or
other sanctions provided by law.
Landowner or Landowner's Agent Name Landowner or Landowner's Agent Signature
Title Date

ATTACHMENT DC-B

Erosion and Sediment Control
Plan (ESCP)
Review Checklist
These requirements apply to all activities involving 1 acre or greater of soil disturbance with the exception of agricultural activities. Applicable activities include but are not limited to grading, vegetation clearing, soil compaction, paving, re-
paving and linear underground/overhead projects (LUPs).
Prior to issuing a grading or building permit, each operator of a construction activity within its jurisdiction must prepare
and submit an ESCP prior to the disturbance of land.
Contact Name: Tracking #:
Contact Title: Site Name:
Company Name: Site Address:
Mailing Address: Type of Facility:
City, State, Zip: Submittal Date:
Phone Number: Plan Return Date:
Fax Number: Disturbed Area:
First Review ESCP Received on:
Review Completed on:
Fourth Review ESCP Received on:
Review Completed on:
Second Review ESCP Received on:
Review Completed on:
Fifth Review ESCP Received on:
Review Completed on:
Third Review
ESCP Received on:
Review Completed on:
Sixth Review
ESCP Received on:
Review Completed on:

ESCP Review Checklist
Page 1
ESCP REQUIREMENT SATISFACTION
COMMENTS YES NO N/A
General Information
Contact information (e.g., name, address, phone, email, etc.) provided for the owner and contractor.
Basic site information including location, status, size of the project and area of disturbance is provided.
Proof of existing coverage under applicable permits, including, but not limited to the State Water Board’s Construction General Permit, and State Water Board 401 Water Quality Certification.
Meets the minimum requirements of the jurisdictional erosion and sediment control ordinance.
Includes the elements of a Storm Water Pollution Prevention Plan (SWPPP) prepared in accordance with the requirements of the Construction General Permit.
Developed and certified by a Qualified SWPPP Developer (QSD).
Identifies the proximity all water bodies, water bodies listed as impaired by sediment-related pollutants, and water bodies for which a sediment-related TMDL has been adopted and approved by the USEPA.
Identifies any significant threat to water quality status, based on consideration of factors listed in Appendix 1 to the Construction General Permit.
The project start date and anticipated completion date is provided.
Includes Identification of site Risk Level as identified per the requirements in Appendix 1 of the Construction General Permit.
Contains a language signed by the landowner or the landowner’s agent stating as follows: “I certify that this document and all attachments were prepared under my direction or supervision in accordance with a system designed to ensure that qualified personnel properly gather and evaluate the information submitted. Based on my inquiry of the person or persons who manage the system or those persons directly responsible for gathering the information, to the best of my knowledge and belief, the information submitted is true, accurate, and complete. I am aware that submitting false and/ or inaccurate information, failing to update the ESCP to reflect current conditions, or failing to properly and/ or adequately implement the ESCP may result in revocation of grading and/ or other permits or other sanctions provided by law.”

Page 2
ESCP REQUIREMENT SATISFACTION
COMMENTS YES NO N/A
Best Management Practices
All structural BMPs are designed by a licensed California Engineer.
Includes Sediment/Erosion Control.
Includes controls to prevent tracking on and off the site.
Includes non-stormwater controls (e.g., vehicle washing, dewatering, etc.).
Includes Materials Management (delivery and storage).
Includes Spill Prevention and Control.
Includes Waste Management (e.g., concrete washout/waste management; sanitary waste management).
Includes methods to minimize the footprint of the disturbed area and to prevent soil compaction outside of the disturbed area.
Includes methods used to protect native vegetation and trees.
Includes the rationale for the selection and design of the proposed BMPs, including quantifying the expected soil loss from different BMPs.
Post-Construction Structural BMPs subject to Operation and Maintenance Requirements are identified.
Site Plan
Full sized plans showing the site with all proposed BMPs and water quality notes have been signed and stamped with wet ink application by the appropriate individual.
Plan includes a title block containing at least the project name, address, and owner.
All figures, maps, plot plans, etc. have a legend, including a North arrow and scale.
All facilities are labeled for the intended function.
All areas of outdoor activity are labeled.
All structural BMPs are indicated.
Drainage flow information depicted.
Project location shown.
Site boundary indicated.

ATTACHMENT DC-C

(CITY NAME) STORMWATER INSPECTION REPORT FOR CONSTRUCTION SITES SITES ONE ACRE OR GREATER
Project Name: Address:
Area disturbed: WDID: SWPPP on-site: Yes No
Risk level: Low (Risk 1) Medium (Risk 2) High (Risk 3) Erosion & Sediment Control Plan (ESCP) on-site: Yes No
Phase: Prior to Land Disturbance Active construction Site stabilization
Developer/Contractor: Phone number:
Contact: Title:
Inspector: Date:
Inspection: Routine (monthly and for each phase of construction)
Follow-up Response to complaint
For sites discharging to a waterbody impaired for sediment/turbidityi
Routine biweekly Predicted rainfall Recent rainfall
CHECKLIST FOR STORMWATER BMP (BEST MANAGEMENT PRACTICE) COMPLIANCE
PHASE 1 AND 2: PRIOR TO LAND DISTURBANCE AND DURING ACTIVE CONSTRUCTION
Comment Yes No N/A
Comment Yes No N/A
Ero
sio
n
Co
ntr
ol 1. Erosion controls are implemented in accordance
with the ESCP
Was
te M
anag
emen
t
9. Effective material delivery and storage practices are implemented
2. Erosion observed
10. Spill prevention and control practices are implemented
Sed
ime
nt
Co
ntr
ol
3. Sediment controls are implemented in accordance with the ESCP
11. Stockpile controls are implemented in accordance
with the ESCP
4. Sediment discharge observed
12. Solid waste controls are implemented in
accordance with the ESCP
Ad
dit
ion
al C
on
tro
ls 5. Tracking controls (tire washout, stabilized
entrances, exits and roadways) are implemented in accordance with the ESCP
No
nst
orm
wat
er
M
anag
eme
nt
13. Vehicle and equipment washing, fueling and maintenance controls are implemented in accordance with the ESCP
6. Sediment in roads observed 14. Nonstormwater discharges observed
7. Wind erosion controls are implemented in accordance with the ESCP
15. Dewatering operations covered under NPDES Permit CAG994004
8. Wind erosion observed 16. Water conservation practices are implemented PHASE 3: FINAL LANDSCAPING/SITE STABILIZATION
Comment Yes No N/A
Comment Yes No N/A
1. Graded areas have reached final stabilization 3. Temporary erosion and sediment BMPs are removed
2. Trash, debris and construction materials are removed 4. Post-construction BMPs are installed
COMMENTS AND CORRECTIVE ACTIONS (IF REQUIRED):
ENFORCEMENT: None required Corrective Action Notice (complete section below) Other (see comments)
CORRECTIVE ACTION NOTICE (IF REQUIRED)
If corrective actions have been noted above, then the responsible party (facility owner, occupant or person responsible) is in noncompliance with the City’s Stormwater Quality Ordinance. The responsible party may be subject to enforcement actions under this program if the corrective actions are not implemented by:
__________________________ Corrective Action Due Date
ACKNOWLEDGEMENT OF RECEIPT OF CORRECTIVE ACTION NOTICE
___________________________________ ___________________________________ ____________________ Site Representative Signature Printed Name Date
WHITE – SITE COPY / YELLOW – CITY COPY TURN OVER →→→

i For sites discharging to a tributary listed by the state as an impaired waterbody for sediment or turbidity under CWA § 303(d), or determined to be a threat to water quality, inspections must be conducted (1) when two or more consecutive days with greater than 50% chance of rainfall are predicted by NOAA and (2) within 48 hours of a ½-inch rain event and (3) at least once every two weeks.
ATTACHMENT DC-D

CITY STORMWATER QUALITY PROGRAM CONSTRUCTION SITE INSPECTION REPORT FOR SITES LESS THAN ONE ACRE
Project: Address:
Contact: Title:
Contractor: Phone:
Inspector: Date:
CHECKLIST FOR STORMWATER BMP (BEST MANAGEMENT PRACTICE) COMPLIANCE
Question Yes No N/A Question Yes No N/A
Ero
sio
n
Co
ntr
ol
1. Effective erosion controls implemented.
No
n-
Sto
rmw
ater
M
anag
eme
nt 5. Water conservation practices are implemented.
2. Erosion observed. 6. Dewatering operations covered under NPDES Permit CAG994004
Sed
imen
t
Co
ntr
ol
3. Effective sediment controls implemented.
Was
te
Man
agem
en
t
7. Effective material delivery/storage practices and spill prevention/control practices are implemented.
4. Sediment discharge observed. 8. Effective waste management controls are implemented.
COMMENTS AND CORRECTIVE ACTIONS (IF REQUIRED):
ENFORCEMENT: None required Corrective Action Notice (complete section below) Other (see comments)
CORRECTIVE ACTION NOTICE (IF REQUIRED)
If corrective actions have been noted above, then the responsible party (facility owner, occupant or person responsible) is in noncompliance with the City’s Stormwater Quality Ordinance. The responsible party may be subject to enforcement actions under this program if the corrective actions are not implemented by:
__________________________ Corrective Action Due Date
ACKNOWLEDGEMENT OF RECEIPT OF CORRECTIVE ACTION NOTICE
___________________________________ ___________________________________ ____________________ Site Representative Signature Printed Name Date

APPENDIX 2-ICF
INDUSTRIAL/COMMERCIAL FACILITIES PROGRAM

Minimum Control Measures Industrial/ Commercial Facilities Program
ICF-1
Industrial/Commercial Facilities Program
Each Participating Agency is required to implement an industrial/commercial facilities program that includes the provisions listed in Permit § VI.D.6 (LB §VII.G). This document provides guidance that the Participating Agencies can follow to implement an industrial/commercial facilities program in compliance with the Permit.
Introduction Permit § VI.D.6.a
The Industrial/Commercial Facilities Program is designed to prevent illicit discharges into the MS4 and receiving waters, reduce industrial/commercial discharges of stormwater to the maximum extent practicable, and prevent industrial/commercial discharges from the MS4 from causing or contributing to a violation of receiving water limitations. The program consists of the following components:
Track,
Educate,
Inspect, and
Ensure compliance with municipal ordinances at industrial/commercial facilities determined to be critical sources of pollutants in stormwater.
Track Critical Industrial/Commercial Sources Permit § VI.D.6.b
The critical sources to be tracked are listed in Table ICF-1.
Table ICF-1: Critical Sources
Facility Category Facility
Commercial Facilities Restaurants
Automotive service facilities (including those located at automotive dealerships)
Retail Gasoline Outlets
Nurseries and Nursery Centers (Merchant Wholesalers, Nondurable Goods, and Retail Trade)
Industrial Facilities USEPA “Phase I” Facilities1
Other federally-mandated facilities2
Municipal landfills
Hazardous waste treatment, disposal, and recovery facilities
Industrial facilities subject to § 313 “Toxic Release Inventory” reporting requirements of the Emergency Planning and Community Right-to-Know Act of 1986 (EPCRA)3
General Facilities All other commercial or industrial facilities determined to potentially contribute a substantial pollutant load to the MS4.
Critical source facilities are tracked in an electronic database management system. The information stored for each critical source in the inventory is listed in Table ICF-2.
1 as specified in 40 CFR §122.26(b)(14)(i)-(xi)
2 as specified in 40 CFR §122.26(d)(2)(iv)(C)
3 42 U.S.C. § 11023

Minimum Control Measures Industrial/ Commercial Facilities Program
ICF-2
Table ICF-2: Inventory Information for Critical Sources
Information Category Information
General Name Facility Name
Location Facility address
Facility latitude and longitude coordinates
Receiving water
Contact Owner/operator name
Mailing address
Phone number
Email (if available)
Business Type Standard Industrial Classification (SIC) code and/or North American Industry Classification System (NAICS) code
Narrative description of the activities performed and/or principal products produced
Water quality
Status of exposure of materials to stormwater
Pollutants generated by facility activities (A-ICF-1)
Identification of whether the facility is tributary to a waterbody segment with impairments4 for pollutants that are also generated by the facility.
Prioritization High, medium or low. The default priority is medium.
NPDES Permit For applicable facilities, identify coverage under the State Water Board’s General NPDES Permit for the Discharge of Stormwater Associated with Industrial Activities (Industrial General Permit) or other individual or general NPDES permits or any waiver issued by the Regional or State Water Board pertaining to stormwater discharges.
For Industrial General Permit facilities, identify whether the facility has filed a No Exposure Certification with the State Water Board.
Update Inventory
The critical sources inventory is updated at least annually. The update is accomplished through the collection of new information from sources such as field activities and readily available inter/intra-agency records (e.g. business licenses, pretreatment permits, sanitary sewer connection permits and the State Water Resources Control Board’s Storm Water Multiple Application and Report Tracking System (SMARTS).
4 CWA § 303(d) listed or subject to a TMDL

Minimum Control Measures Industrial/ Commercial Facilities Program
ICF-3
Educate Industrial/Commercial Sources Permit § VI.D.6.c
At least once during the five-year period of the MS4 Permit, the owner/operator of each of the inventoried critical sources is notified of the BMP requirements applicable to the facility/source.
Business Assistance Program
The Business Assistance Program provides technical information to businesses to facilitate their efforts to reduce the discharge of pollutants in stormwater. Assistance is targeted to select business sectors or small businesses upon a determination that their activities may be contributing substantial pollutant loads to the MS4 or receiving water. Assistance may include technical guidance and provision of educational materials. The Program includes at least one of the following components:
Technical Guidance – Provide on-site technical assistance, telephone, or e-mail consultation regarding the responsibilities of businesses to reduce the discharge of pollutants, procedural requirements, and available guidance documents. Guidance methods include but are not limited to:
o Technical guidance through the critical source inspection program. During an inspection the inspector provides to the business owner/operator 1) on-site technical assistance and 2) contact information for continued consultation. The inspector may also refer staff to relevant fact sheets from the CASQA Industrial and Commercial BMP Handbook.
o Technical guidance initiated with businesses through an informational letter, email, webpage or social media. The notice provides contact information of relevant stormwater staff for business assistance as well as hyperlinks to available guidance documents such as the CASQA Industrial and Commercial BMP Handbook.
Educational Materials – Distribute stormwater pollution prevention educational materials to operators of 1) auto repair shops, car wash facilities, restaurants and 2) mobile sources including automobile/equipment repair, washing, or detailing, power washing services, mobile carpet, drape, or upholstery cleaning services, swimming pool, water softener, and spa services, portable sanitary services and commercial applicators and distributors of pesticides, herbicides and fertilizers, if present. Material sources and distribution methods include but are not limited to:
o Distribution method – The presence of these businesses within an agency’s jurisdiction may be determined through business licenses or other readily available inter/intra-agency records.
o Material sources – Educational materials are available at USEPA’s Nonpoint Source (NPS) Outreach Toolbox at http://cfpub.epa.gov/npstbx/index.html. The toolbox is a database of nationwide public education materials that is intended for use by state and local campaigns. The toolbox contains a variety of resources to help develop an effective and targeted outreach campaign.
Source Control BMPs Permit § VI.D.6.f
Effective source control BMPs for the activities listed in Table ICF-3 are implemented at commercial and industrial facilities, unless the pollutant generating activity does not occur.

Minimum Control Measures Industrial/ Commercial Facilities Program
ICF-4
Significant Ecological Areas (SEAs) Permit § VI.D.6.g
For critical sources that discharge to MS4s that discharge to SEAs, each Permittee will require operators to implement additional pollutant-specific controls to reduce pollutants in stormwater runoff that are causing or contributing to exceedances of water quality standards.
Progressive Enforcement Permit § VI.D.6.h
Each Permittee will implement its Progressive Enforcement Policy to ensure that Industrial / Commercial facilities are brought into compliance with all stormwater requirements within a reasonable time period. See Part VI.D.2 of the MS4 Permit for requirements for the development and implementation of a Progressive Enforcement Policy.
Table ICF-3: Source Control BMPs at Commercial and Industrial Facilities
Pollutant-Generating Activity BMP Description
BMP Fact Sheet*
Unauthorized Non-Storm water Discharges
Effective elimination of non-stormwater discharges SC-10
Accidental Spills/ Leaks Implementation of effective spills/ leaks prevention and response procedures SC-11
Vehicle/ Equipment Fueling Implementation of effective fueling source control devices and practices SC-20
Vehicle/ Equipment Cleaning Implementation of effective equipment/vehicle cleaning practices and appropriate wash water management practices
SC-21
Vehicle/ Equipment Repair Implementation of effective vehicle/ equipment repair practices and source control devices SC-22
Outdoor Liquid Storage Implementation of effective outdoor liquid storage source controls and practices SC-31
Outdoor Equipment Operations Implementation of effective outdoor equipment source control devices and practices SC-32
Outdoor Storage of Raw Materials
Implementation of effective source control practices and structural devices SC-33
Storage and Handling of Solid Waste
Implementation of effective solid waste storage/ handling practices and appropriate control measures
SC-34
Building and Grounds Maintenance
Implementation of effective facility maintenance practices SC-41
Parking/ Storage Area Maintenance
Implementation of effective parking/ storage area designs and housekeeping/ maintenance practices
SC-43
Stormwater Conveyance System Maintenance
Implementation of proper conveyance system operation and maintenance protocols SC-44
Pollutant-Generating Activity BMP Description from Regional Water Board Resolution No. 98-08
Sidewalk Washing 1. Remove trash, debris, and free standing oil/grease spills/leaks (use absorbent material, if necessary) from the area before washing; and 2. Use high pressure, low volume spray washing using only potable water with no cleaning agents at an average usage of 0.006 gallons per square feet of sidewalk area.
Street Washing Collect and divert wash water to the sanitary sewer – publically owned treatment works (POTW). Note: POTW approval may be needed.
* Source: CASQA Industrial and Commercial Stormwater BMP Handbook, 2003

Minimum Control Measures Industrial/ Commercial Facilities Program
ICF-5
Table ICF-4: Potential Pollutants from Industrial Activities*
Activity or Facility Type
Potential Pollutants
Sed
imen
ts
Nu
trie
nts
Met
als
Org
anic
s an
d
Toxi
can
ts*
*
Flo
atab
le M
ater
ials
Oxy
gen
-Dem
and
ing
Sub
stan
ces
Oil
and
Gre
ase
Bac
teri
a
Pes
tici
des
Vehicle & Equipment Fueling X X
Vehicle & Equipment Washing and Steam Cleaning X X X X X X
Vehicle & Equipment Maintenance and Repair X X X
Outdoor Loading & Unloading of Materials X X X X X X X
Outdoor Container Storage of Liquids X X X X X X
Outdoor Process Equipment Operations and Maintenance
X X X X
Outdoor Storage of Raw Materials, Products, and Byproducts
X X X X X X X
Waste Handling & Disposal X X X X X X
Contaminated or Erodible Surface Areas X X X X X X X X
Building and Grounds Maintenance X X X X X X X
Building Repair, Remodeling, and Construction X X X X
Parking/Storage Area Maintenance X X X X
* Source: CASQA Industrial and Commercial Stormwater BMP Handbook, 2003 ** This includes all toxic pollutants other than pesticides.

Minimum Control Measures Industrial/ Commercial Facilities Program
ICF-6
Table ICF-5: Potential Pollutants by Industrial/Commercial Facility Type*
Activity or Facility Type
Potential Pollutants
Sed
imen
ts
Nu
trie
nts
Met
als
Org
anic
s an
d
Toxi
can
ts*
*
Flo
atab
le M
ater
ials
Oxy
gen
-Dem
and
ing
Sub
stan
ces
Oil
and
Gre
ase
Bac
teri
a
Pes
tici
des
Vehicle mechanical repair, maintenance, fueling, or cleaning X X X X X X
Airplane mechanical repair, maintenance, fueling, or cleaning X X X X X X
Boat mechanical repair, maintenance, fueling, or cleaning X X X X X X
Equipment repair, maintenance, fueling, or cleaning X X X X X X
Automobile and other vehicle body repair or painting X X X
Mobile automobile or other vehicle washing X X X X X
Automobile (or other vehicle) parking lots and storage X X X
Retail or wholesale fueling X X X X
Pest control services X
Eating or drinking establishments X X X X X X X
Mobile carpet, drape or furniture cleaning X X
Cement mixing or cutting X
Masonry X
Painting and coating X X X
Botanical or zoological gardens and exhibits X X X X X X
Landscaping X X X X X X
Nurseries and greenhouses X X X X X X
Golf courses, parks and other recreational areas/facilities X X X X X X
Cemeteries X X X X X X
Pool and fountain cleaning X X X X X X
Marinas X X X X X X
Port-a-Potty servicing X X X X
* Source: Orange County Drainage Area Management Plan, 2003 ** This includes all toxic pollutants other than pesticides.

ATTACHMENT ICF-A

CITY STORMWATER PROGRAM INDUSTRIAL/COMMERCIAL FACILITY INSPECTION REPORT
Facility: Address:
Contact: Title:
Email: Phone:
Inspector: Date:
Inspection Type: Routine Follow-up Response to Complaint BMP materials provided and explained: Yes No
SIC/NAICS code and/or business type:
Industrial Facilities Only
(1) Covered under IGP (WDID is current) or other NPDES Permit: Yes No (2) NEC filed: Yes No SWPPP on-site: Yes No
If (1) and (2) above are “No”, notified contact of need for IGP coverage and will refer facility to Regional Board: Yes No
CHECKLIST FOR STORMWATER BMP (BEST MANAGEMENT PRACTICE) COMPLIANCE
BMP Yes No N/A BMP Yes No N/A
Veh
icle
& E
qu
ipm
en
t
Mai
nte
nan
ce
1. Fueling - Effective fueling source control devices & practices
Faci
lity
Mai
nte
nan
ce
8. Building & grounds maintenance – Effective maintenance practices
2. Cleaning – Effective cleaning practices & wash water management practices
9. Parking & storage area maintenance – Effective designs & housekeeping/maintenance practices
3. Repair – Effective repair practices & source control devices
10. Stormwater conveyance system maintenance – Proper operation & maintenance protocols
Equ
ipm
en
t
Op
erat
ion
s 4. Outdoor equipment operations – Effective source control devices & practices
11. Sidewalk washing – Remove debris & free standing oil/grease. Use high pressure/low volume spray washing with potable water, no cleaning agents & average rate of 0.006 gal/ft
2.
Sto
rage
& H
and
ling 5. Outdoor liquids – Effective source controls &
practices
Spill
s, L
eaks
&
Dis
char
ges
12. Accidental spills/leaks – Effective spill/leak prevention & response procedures
6. Outdoor raw materials – Effective source control practices & structural devices
13. Unauthorized nonstormwater discharges – Effective elimination
7. Solid waste – Effective storage & handling practices & appropriate control measures
COMMENTS AND CORRECTIVE ACTIONS (IF REQUIRED) Include description of activities performed and/or principal products produced
ENFORCEMENT: None required Corrective Action Notice (complete section below) Other (see comments)
CORRECTIVE ACTION NOTICE (IF REQUIRED)
If corrective actions have been noted above, then the responsible party (facility owner, occupant or person responsible) is in noncompliance with the City’s Stormwater Quality Ordinance. The responsible party may be subject to enforcement actions under this ordinance if the corrective actions are not implemented by:
__________________________ Corrective Action Due Date
ACKNOWLEDGEMENT OF RECEIPT OF CORRECTIVE ACTION NOTICE
___________________________________ ___________________________________ ____________________ Site Representative Signature Printed Name Date

APPENDIX 2-ICID
ILLICIT CONNECTIONS & ILLICIT DISCHARGES
ELIMINATION PROGRAM

Minimum Control Measures Illicit Connections & Illicit Discharges Elimination Program
ICID-1
Illicit Connections & Illicit Discharges Elimination Program
Each Participating Agency is required to develop and implement an Illicit Connections & Illicit Discharge Elimination (IC/ID) Program that includes the requirements listed in Permit §VI.D.10.a (LB §VII.M). This document provides guidance to assist the Cities in implementing an IC/ID program in compliance with the Permit.
Introduction Permit §VI.D.10.a
Illicit connections and illicit discharges (IC/IDs) as defined in Table ICID-1 are potential significant sources of pollutants into and from the MS4. The Illicit Connection and Illicit Discharge (IC/ID) Program provides a comprehensive process for detecting, investigating and eliminating IC/IDs in an efficient and timely manner. The program consists of the following components:
Procedures for conducting source investigations for IC/IDs
Procedures for eliminating the source of IC/IDs
Procedures for public reporting of illicit discharges
Spill response plan and
IC/ID education and training for City staff.
The purpose of this program is to effectively prohibit illicit discharges into the MS4.
Table ICID-1: IC/IDs Defined
Prohibition Definition Examples
Illicit Connections Any man-made conveyance that is connected to the MS4 without a permit, excluding roof drains and other similar type connections.
Unpermitted channels, pipelines, conduits, inlets or outlets that are connected directly to the MS4.
Illicit Discharges Any discharge into the MS4 or from the MS4 into a receiving water that is prohibited under local, state, or federal statutes, ordinances, codes or regulations. This includes any non-stormwater discharge, except those authorized in MS4 Permit §III.A.10.2.
Sanitary wastewater, Vehicle wash water, wash-down from grease traps, motor oil, antifreeze and fuel spills into or from the MS4.
Legal Authority
Adequate Legal Authority is required to prohibit IC/IDs to the MS4 and enable enforcement capabilities to eliminate the sources of IC/IDs.
Illicit Discharge Source Investigation and Elimination Permit §VI.D.10.b
The purpose of the IC/ID Program is accomplished in part by developing clear, step-by-step written procedures for conducting investigations of illicit discharges.
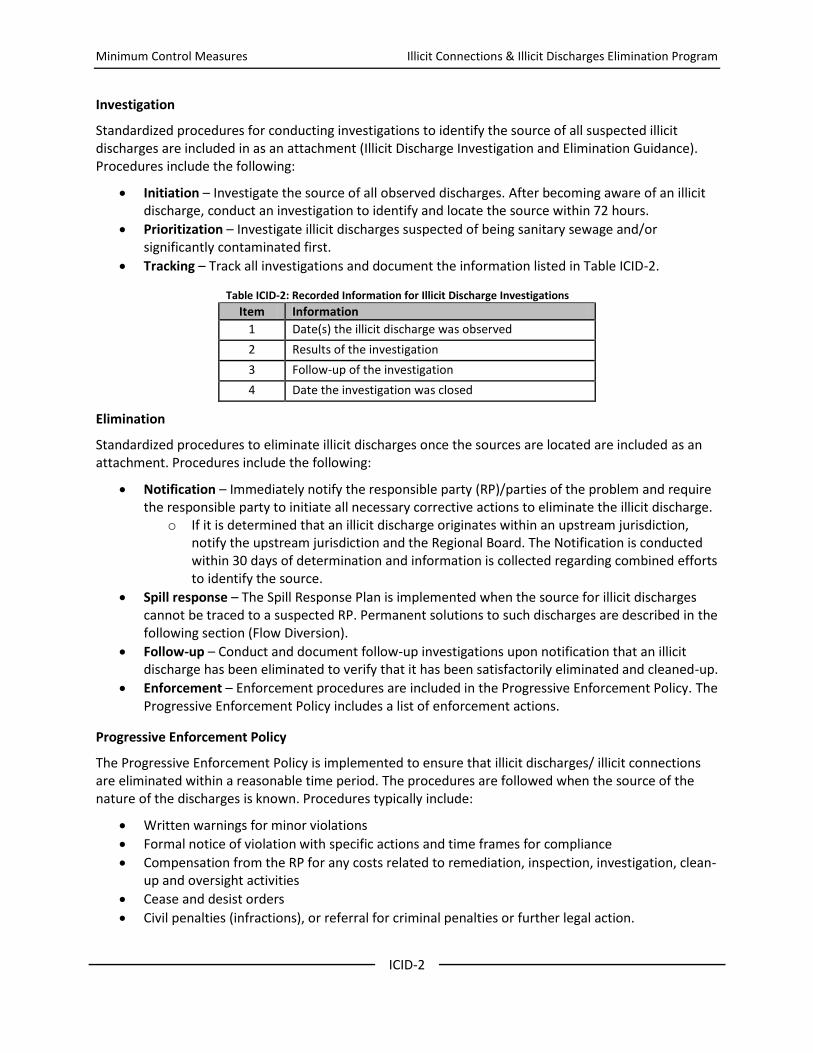
Minimum Control Measures Illicit Connections & Illicit Discharges Elimination Program
ICID-2
Investigation
Standardized procedures for conducting investigations to identify the source of all suspected illicit discharges are included in as an attachment (Illicit Discharge Investigation and Elimination Guidance). Procedures include the following:
Initiation – Investigate the source of all observed discharges. After becoming aware of an illicit discharge, conduct an investigation to identify and locate the source within 72 hours.
Prioritization – Investigate illicit discharges suspected of being sanitary sewage and/or significantly contaminated first.
Tracking – Track all investigations and document the information listed in Table ICID-2.
Table ICID-2: Recorded Information for Illicit Discharge Investigations
Item Information
1 Date(s) the illicit discharge was observed
2 Results of the investigation
3 Follow-up of the investigation
4 Date the investigation was closed
Elimination
Standardized procedures to eliminate illicit discharges once the sources are located are included as an attachment. Procedures include the following:
Notification – Immediately notify the responsible party (RP)/parties of the problem and require the responsible party to initiate all necessary corrective actions to eliminate the illicit discharge.
o If it is determined that an illicit discharge originates within an upstream jurisdiction, notify the upstream jurisdiction and the Regional Board. The Notification is conducted within 30 days of determination and information is collected regarding combined efforts to identify the source.
Spill response – The Spill Response Plan is implemented when the source for illicit discharges cannot be traced to a suspected RP. Permanent solutions to such discharges are described in the following section (Flow Diversion).
Follow-up – Conduct and document follow-up investigations upon notification that an illicit discharge has been eliminated to verify that it has been satisfactorily eliminated and cleaned-up.
Enforcement – Enforcement procedures are included in the Progressive Enforcement Policy. The Progressive Enforcement Policy includes a list of enforcement actions.
Progressive Enforcement Policy
The Progressive Enforcement Policy is implemented to ensure that illicit discharges/ illicit connections are eliminated within a reasonable time period. The procedures are followed when the source of the nature of the discharges is known. Procedures typically include:
Written warnings for minor violations
Formal notice of violation with specific actions and time frames for compliance
Compensation from the RP for any costs related to remediation, inspection, investigation, clean-up and oversight activities
Cease and desist orders
Civil penalties (infractions), or referral for criminal penalties or further legal action.

Minimum Control Measures Illicit Connections & Illicit Discharges Elimination Program
ICID-3
Flow Diversion
In the event that an ongoing illicit discharge cannot be eliminated (following the full execution of legal authority and in accordance with the Progressive Enforcement Policy) or the RPs cannot be identified, the discharge is either treated or diverted to the sanitary sewer. In either instance, the Regional Board is notified within 30 days of such determination. Notification includes the following information:
Written plan that describes the efforts that have been undertaken to eliminate the discharge.
Description of actions to be undertaken.
Anticipated cost and
Schedule for completion.
Identification and Response to Illicit Connections Permit §VI.D.10.c
Illicit connections can be concentrated sources of pollutants either through direct discharge or infiltration of sewage or other prohibited discharges into the MS4. To reduce this source of pollutants, the following program is implemented for the identification of illicit connections. Key components of this program include investigating and responding in order to actively prevent and eliminate illicit connections.
Investigation
Standardized procedures for identifying illicit connections are included as an attachment (Illicit Connection Investigation Guidance). Procedures include the following:
Initiation – Investigate within 21 days from the discovery or upon receiving a report of a suspected illicit connection. The elements of the investigation are listed in Table ICID-3.
Tracking – Track all investigations and document the information listed in Table ICID-3.
Response
If the source investigation concludes that a connection to the MS4 is both 1) permitted or documented and 2) discharging only stormwater or nonstormwater allowed under WMP NSWD SECTION or other individual or general NPDES Permits/WDRs, then the investigation is closed and no further action is taken. Upon confirmation of a connection to the MS4 is illicit, one of two options is taken:
1. Permit or document the connection. The permitted or documented connection may only discharge stormwater and nonstormwater allowed under WMP NSWD SECTION or other individual or general NPDES Permits/WDRs. Retaining a record of the connection and its investigation qualifies as documentation.
2. Eliminate the connection. The connection is eliminated within 180 days of completion of the investigation, using formal enforcement authority if necessary.
Table ICID-3: Recorded Information for Illicit Connection Investigations
Item Information
1 Any relevant illicit discharge information from Table ICID-2
2 Source of the connection
3 Nature and volume of the discharge through the connection
4 RP for the connection (if identified)
5 Response including any formal enforcement taken

Minimum Control Measures Illicit Connections & Illicit Discharges Elimination Program
ICID-4
Public Reporting of Non-Stormwater Discharges and Spills Permit §VI.D.10.d
Central Point of Contact
Public reporting of illicit discharges or water quality impacts associated with discharges into or from MS4s through a central contact point are promoted, publicized, and facilitated. This includes phone numbers and an internet site for complaints and spill reporting. The reporting hotline is provided to staff to leverage the field staff that has direct contact with the MS4 in detecting and eliminating illicit discharges.
The LACFCD, in collaboration with the County, provides the central point of contact and through the 888-CLEAN-LA reporting hotline and internet site.
Open Channels
Signage is posted adjacent to open channels (see MS4 Permit IV.D.9.h.vi.(4)). The signage includes information regarding dumping prohibitions and public reporting of illicit discharges.
Complaints
Written procedures are maintained that document how complaint calls are received, and tracked to ensure that all complaints are adequately addressed in the attached form (Record Keeping & Documentation). Following the adaptive management process outlined in the MS4 Permit, the procedures are periodically evaluated to determine whether changes or updates are needed to ensure that the procedures accurately document the employed methods. After the evaluation, any identified changes will be made to the procedures.
Documentation is maintained for all complaint calls. This includes recording the location of the reported spill or IC/ ID and the actions undertaken in response the complaint, including referrals to other agencies.
Spill Response Plan Permit §VI.D.10.e
A spill response plan (Attachment ICID-E) is implemented for all sewage and other spills that may discharge into its MS4. The spill response plan identifies agencies responsible for spill response and cleanup, telephone numbers and e-mail address for contacts, and contains the following:
Agency Coordination – Coordinate with spill response teams throughout all appropriate departments, programs and agencies so that maximum water quality protection is provided.
Spill Response – Respond to spills for containment within 4 hours of becoming aware of the spill, except where such spills occur on private property, in which case respond within 2 hours of gaining legal access to the property. Initiate investigation of all public and employee spill complaints within one business day of receiving the complaint to assess validity.
Reporting – Spills that may endanger health or the environment are reported to appropriate public health agencies and the California Emergency Management Agency (Cal EMA).
Illicit Connection and Illicit Discharge Education and Training Permit §VI.D.10.f
A training program regarding the identification of IC/IDs is implemented for all municipal field staff, who, as part of their normal job responsibilities (e.g., street sweeping, storm drain maintenance, collection system maintenance, road maintenance), may come into contact with or otherwise observe an illicit discharge or illicit connection to the MS4. Contact information, including the procedure for reporting an illicit discharge, is readily available to field staff.

Minimum Control Measures Illicit Connections & Illicit Discharges Elimination Program
ICID-5
Applicable Staff
Table ICID-4 is a list of field programs where program staff may come into contact with or otherwise observe an illicit discharge or illicit connection to the MS4. Appropriate field staff, supervising staff and contractors involved in these programs require training in IC/ID identification and reporting following the schedule provided in Table ICID-5.
Contracted Staff
Contractors that provide these municipal services may attend city training or certify to the Participating Agency and retain documentation that staff has received applicable training. Otherwise this provision is accomplished through a contractual requirement for contracted staff to receive the training.
Table ICID-4: Municipal Field Programs
Main Field Program Types Sub-Category Types/Activities
Lake Management Fertilizer & Pesticide Management
Mowing, Trimming/Weeding, Planting
Managing Landscape Waste
Controlling Litter
Erosion Control
Controlling Illegal Dumping
Bacteria Control
Monitoring
Landscape Maintenance Mowing, Trimming/Weeding, Planting
Irrigation
Fertilizer & Pesticide
Managing Landscape Waste
Erosion Control
Roads, Streets, and Highways Operations and Maintenance
Sweeping & Cleaning
Street Repair & Maintenance
Bridge & Structure Maintenance
Fountains, Plazas, and Sidewalk Maintenance and Cleaning
Surface Cleaning
Graffiti Cleaning
Sidewalk Repair
Controlling Litter
Fountain Maintenance
Solid Waste Handling Solid Waste Collection
Waste Reduction & Recycling
Hazardous Waste Collection
Litter Control
Water and Sewer Utility O&M Water Line Maintenance
Sanitary Sewer Maintenance
Spill/Leak/Overflow Control
Fire Department Activities Emergency/Post-Emergency Fire Fighting Activities
Fire Fighting Training
Fire Station Activities

Minimum Control Measures Illicit Connections & Illicit Discharges Elimination Program
ICID-6
Training Schedule
The training schedule for all applicable staff is listed in Table ICID-5.
Table ICID-5: IC/ID Program Training Schedule
Category Schedule
Current Staff Twice during the term of the MS4 Permit
New Staff Within 180 days of starting employment
Training Elements
The IC/ID elements addressed by the training program are listed in Table ICID-6.
Table ICID-6: Minimum IC/ID Training Program Elements
Item Information
1 IC/ID identification, including definitions and examples
2 Investigation
3 Elimination
4 Clean-up
5 Reporting
6 Documentation
Documentation
Documentation of training program activities and training modules are retained and made available for review by the Regional Board.

ATTACHMENT ICID-A

ILLICIT CONNECTION/ ILLICIT DISCHARGE INVESTIGATION REPORT
Response Time:
1-6 hrs. 13 hrs. 24 hrs. 48 hrs.
RESPONSE
Date: Time: Inspector:
INVESTIGATION
Location/ Address:
Reason for Investigation: Complaint Discharge/Spill Response Visual Monitoring
Other: ___________________________________
Type of Material: Hazardous Wastewater Oil/Grease Soil/ Sediment Trash Sewage
Fuel (Gas/Diesel) Chemicals Other _________________________
Estimated Quantity: Gallons Lbs.
Entered Storm Drain System: Yes No
Storm Drain Location: ________________________
Entered Receiving Waters: Yes No
Name of Receiving Water: ___________________________
Ob
serv
atio
ns
Field Testing: Yes No
Details:
Sample Collected: Yes No
Details:
Direct/ Constructed Connections Found: Yes No
Details:
RESPONSIBLE PARTY
Name:
Address: Phone/ email:
Repeat Violation? Yes No
OUTREACH MATERIAL
Outreach Material Distributed: None General Information BMP Brochure Other ________________
ENFORCEMENT
Enforcement: None Written Warning Notice of Violation Citation/Infraction Cease and Desist Order
Oth
er
Act
ion
s
FOLLOW-UP VISIT
Date: Time: Inspector:
Discharge Stopped? Yes No Proper Clean-Up Action Taken: Yes No
Further Action Required: Yes No
Details:

ATTACHMENT ICID-B

ILLICIT CONNECTION/ ILLICIT DISCHARGE REPORTING & RESPONSE
Received by:
Date: Time Received:
REPORTING PARTY
Name: Anonymous: Yes No
Address: Phone/email:
INCIDENT
Date: Time:
Location/ Address:
Land Use: Residential Commercial Industrial Public
Type of Material: Hazardous Wastewater Oil/Grease Sediment Trash Other _____________ Unknown
Estimated Quantity: Gallons Lbs.
Entered Storm Drain System/ Receiving Waters? Yes No
De
scri
pti
on
/ D
eta
ils
Agencies Contacted:
Office of Emergency Services HazMat Team LA County Regional Board Other
Source Investigation Conducted?
Yes No
Source Identified?
Yes No
Direct/ Constructed Connections Found? Yes No
ALLEGED RESPONSIBLE PARTY
Name:
Address: Phone/ email:
Vehicle License No:
ACTION & CLOSURE
Referred to: Date:
Department: Phone/ email:
Act
ion
s Ta
ken
/ D
eta
ils
Date Closed:

APPENDIX 2-PAAP
PUBLIC AGENCY ACTIVITIES PROGRAM

Minimum Control Measures Public Agency Activities Program
PA-1
Public Agency Activities Program
Each Participating Agency is required to develop and implement a program for public agency facilities and activities that includes the requirements listed in MS4 Permit §VI.D.9. This document provides guidance to assist the Cities in implementing a public agency activities program in compliance with the MS4 Permit.
1. Objectives Permit §VI.D.9.a
The objectives of the Public Agency Activities program are to:
Minimize stormwater pollution impacts from Permittee-owned or operated facilities.
Minimize stormwater pollution impacts from public agency activities.
Identify opportunities to reduce stormwater pollution impacts from areas of existing development.
MS4 Permit requirements for Public Agency Facilities and Activities consist of the following components which will be discussed in more detail in the sections below:
Public Construction Activities Management
Public Facility Inventory
Inventory of Existing Development for Retrofitting Opportunities
Public Facility and Activity Management
Vehicle and Equipment Wash Areas
Landscape, Park, and Recreational Facilities Management
Storm Drain Operation and Maintenance
Streets, Roads, and Parking Facilities Maintenance
Emergency Procedures
Municipal Employee and Contractor Training
2. Public Construction Activities Management Permit §VI.D.9.b
Each Participating Agency is required to develop and implement a Development Construction Program that meets the requirements the Development Construction Section of this WMP, and Part VI.D.8 of the MS4 Permit at municipally owned or operated (i.e., public or Permittee sponsored) construction projects. In addition, each Participating Agency is required to develop and implement a Planning and Land Development Program that meets the requirements in the Planning and Land Development Section of this WMP, and the MS4 Permit at municipally owned or operated (i.e., public or Permittee sponsored) construction projects.
3. Public Facility Inventory Permit §VI.D.9.c
The Public Agency Activities Program requires the maintenance of an inventory of all Permittee-owned or operated (i.e., public) facilities that are potential sources of stormwater pollution. The incorporation of facility information into a GIS is recommended. Sources that are tracked include but are not limited to the following:
Animal control facilities
Chemical storage facilities
Composting facilities

Minimum Control Measures Public Agency Activities Program
PA-2
Equipment storage and maintenance facilities (including landscape maintenance-related operations)
Fueling or fuel storage facilities (including municipal airports)
Hazardous waste disposal facilities
Hazardous waste handling and transfer facilities
Incinerators
Landfills
Materials storage yards
Pesticide storage facilities
Fire stations
Public restrooms
Public parking lots
Public golf courses
Public swimming pools
Public parks
Public works yards
Public marinas
Recycling facilities
Solid waste handling and transfer facilities
Vehicle storage and maintenance yards
Stormwater management facilities (e.g., detention basins)
All other Permittee-owned or operated facilities or activities that are determined to contribute a substantial pollutant load to the MS4.
The following minimum fields of information are included in the inventory for each Permittee-owned or operated facility:
Name of facility
Name of facility manager and contact information
Address of facility (physical and mailing)
A narrative description of activities performed and potential pollution sources.
Coverage under the Industrial General Permit or other individual or general NPDES permits or any applicable waiver issued by the Regional or State Water Board pertaining to stormwater discharges.
The inventory is updated at least once during the 5-year MS4 Permit term. The update are accomplished through collection of new information obtained through field activities or through other readily available inter and intra-agency informational databases (e.g., property management, land-use approvals, accounting and depreciation ledger account, and similar information).
4. Inventory of Existing Development for Retrofit Opportunities Permit §VI.D.9.d
The Public Agency Activities Program requires the development of an inventory of retrofitting opportunities. Retrofit opportunities are identified within the public right-of-way or in coordination with a TMDL implementation plan(s). The goals of the existing development retrofitting inventory are to address the impacts of existing development through regional or sub-regional retrofit projects that reduce the discharges of stormwater pollutants into the MS4 and prevent discharges from the MS4 from causing or contributing to a violation of water quality standards as defined in the MS4 Permit.

Minimum Control Measures Public Agency Activities Program
PA-3
Existing areas of development are screened to identify candidate areas for retrofitting using watershed models or other screening level tools. The areas of existing development identified during the screening process are then evaluated and ranked to prioritize retrofitting candidates. Criteria for this evaluation may include, but is not limited to the following:
Feasibility, including general private and public land availability;
Cost effectiveness;
Pollutant removal effectiveness;
Tributary area potentially treated;
Maintenance requirements;
Landowner cooperation;
Neighborhood acceptance;
Aesthetic qualities;
Efficacy at addressing concern; and
Potential improvements to public health and safety.
The results of this evaluation are considered in the following programs:
Highly feasible projects expected to benefit water quality are given a high priority to implement source control and treatment control BMPs in the WMP.
High priority retrofit projects are considered as candidates for off-site mitigation projects per LA MS4 Permit §VI.D.7.c.iii(4)(d) (LB §VII.J.4.iii(4)).
Where feasible, the existing development retrofit program is coordinated with flood control projects and other infrastructure improvement programs per LA MS4 Permit §VI.D.9.e.ii(2) (LB §VII.L.5.ii(2)).
Site specific retrofit projects are encouraged through cooperation with private landowners. The following practices are considered in cooperating with private landowners to retrofit existing development:
Demonstration retrofit projects;
Retrofits on public land and easements that treat runoff from private
developments;
Education and outreach;
Subsidies for retrofit projects;
Requiring retrofit projects as enforcement, mitigation or ordinance compliance;
Public and private partnerships;
Fees for existing discharges to the MS4 and reduction of fees for retrofit implementation.

Minimum Control Measures Public Agency Activities Program
PA-4
5. Public Facility and Activity Management Permit §VI.D.9.e
5.1. Industrial General Permitted Facilities Permit §VI.D.9.e.i & §VI.D.9.e.v
All Permittee owned or operated facilities where industrial activities are conducted that require coverage are required to obtain coverage under the Industrial General Permit by submitting a Notice of Intent (NOI) to the State Water Resources Control Board (State Board) and preparing a Stormwater Pollution Prevention Plan (SWPPP). Facilities that may require coverage are listed by category in 40 Code of Federal Regulations (CFR) Section 122.26(b)(14), and include:
Facilities subject to stormwater effluent limitations guidelines, new source performance standards, or toxic pollutant effluent standards (40 CFR Subchapter N)
Manufacturing facilities
Mining and oil and gas facilities
Hazardous waste treatment, storage, or disposal facilities
Landfills, land application sites, and open dumps that receive industrial waste
Recycling facilities
Steam electric generating facilities
Transportation facilities
Sewage treatment plants
Certain facilities if materials are exposed to stormwater
Municipally owned or operated facilities that have obtained coverage under the IGP implement and maintain BMPs consistent with the associated SWPPP, and are therefore not required to implement and maintain the activity specific BMPs as described in the sections below.
6. Flood Management Projects Permit §VI.D.9.e.ii
The following measures are implemented for municipally owned or operated flood management projects:
Procedures are developed to assess the impacts of flood management projects on the water quality of receiving water bodies;
Existing structural flood control facilities area evaluated to determine if retrofitting the facility to provide additional pollutant removal from stormwater is feasible.
6.1. Contracted Public Agency Activities Permit §VI.D.9.e.iv
Any contractors hired to conduct Public Agency Activities, including, but not limited to the following must be contractually obligated to implement and maintain the activity specific BMPs outlined in the sections below:
Storm and/or sanitary sewer system inspection and repair,
Street sweeping,
Trash pick-up and disposal, and
Street and right-of-way construction and repair
It is the responsibility of each Permittee to ensure that these BMPs are being properly implemented and maintained through oversight of contracted activities. Example contractor/lessor contract language is provided in attachment PA-A.

Minimum Control Measures Public Agency Activities Program
PA-5
6.2. BMPS for Municipal Activities Permit §VI.D.9.e.iii & Permit §VI.D.9.e.vi
Municipal maintenance and field staff are the ones responsible for implementing effective source control BMPs1, such as those described in Table PA-1 (or an equivalent set of BMPs) when such activities occur at municipally owned or operated facilities and field operations (i.e. project sites). These sites include, but are not limited to the facility types identified in the Public Facility Inventory, and at any area that includes the activities described in Table PA-1, or that have the potential to discharge pollutants in stormwater. The Caltrans Stormwater Quality Handbook Maintenance Staff Guide (Caltrans Handbook)2 is an additional resource that describes BMPs to prevent the stormwater-related pollutants most likely to come from common maintenance facility operations and field activities. It provides a straightforward working-level approach to implementing BMPs for common maintenance activities by categorizing these activities into Families, and associating each Family with certain types of BMPs in Activity Cut Sheets. The activities described in Sections 5-10 below are representative of typical municipal operations, and correspond to the activities and BMPs listed in Table PA-1. Where appropriate, each section will identify the appropriate Maintenance Activity Family and corresponding Caltrans Activity Cut Sheets from this table for ease of reference.
Although Table PA-1 and the CalTrans Handbook are excellent references for selecting BMPs for some of the most common municipal activities, they may not represent a comprehensive inventory of activities encountered by maintenance staff and field personnel. Likewise, for those BMPs that are not adequately protective of water quality standards, additional site-specific BMPS may be needed. For example, the implementation of additional BMPs is required where stormwater from the storm drain system discharges to a water body subject to a TMDL, a Clean Water Act §303(d) listed water body, or a significant ecological area (SEA). Attachment PA-B contains a map of SEAs in LA County and Attachment K of the LA MS4 Permit contains a matrix of Permittees and TMDLs.
1 BMP is defined by the California Stormwater Quality Association as “any program, technology, process, siting criteria,
operating method, measure, or device which controls, prevents, removes, or reduces pollution”. Source Control BMPs are operational practices that prevent pollution by reducing potential pollutants at the source. They typically do not require maintenance or construction, and may consist of programmatic controls such as street sweeping. Treatment Control BMPs are methods of treatment to remove pollutants from stormwater, and can include constructed treatment devices such as an infiltration basin. 2 The handbook is available at
http://www.dot.ca.gov/hq/env/stormwater/special/newsetup/_pdfs/management_ar_rwp/CTSW-RT-02-057.pdf and may also be found by entering the words “Caltrans Stormwater Quality Handbook Maintenance Staff Guide” in a web search engine.

Minimum Control Measures Public Agency Activities Program
PA-6
Table PA-1: General and Activity Specific BMPs and Their Associated Caltrans Handbook Activity Cut Sheet
Maintenance Activity Family BMP Caltrans Activity Cut Sheet Number
General BMPs Scheduling and Planning
B-4
Spill Prevention and Control
Sanitary/Septic Waste Management
Material Use
Safer Alternative Products
Vehicle/Equipment Cleaning, Fueling and Maintenance
Illicit Connection Detection, Reporting and Removal
Illegal Spill Discharge Control
Maintenance Facility Housekeeping Practices
Flexible Pavement Asphalt Cement Crack and Joint Grinding/ Sealing B-9
Asphalt Paving B-10
Structural Pavement Failure (Digouts) Grinding and Paving B-11
Emergency Pothole Repairs B-13
Sealing Operations B-14
Rigid Pavement Portland Cement Crack and Joint Sealing B-15
Mudjacking and Drilling B-16
Concrete Slab and Spall Repair B-17
Slope/ Drains/ Vegetation Shoulder Grading B-19
Nonlandscaped Chemical Vegetation Control B-21
Nonlandscaped Mechanical Vegetation Control/Mowing B-23
Nonlandscaped Tree and Shrub Pruning, Removal B-24
Fence Repair B-25
Drainage Ditch and Channel Maintenance B-26
Drain and Culvert Maintenance B-28
Curb and Sidewalk Repair B-30
Litter/ Debris/ Graffiti Sweeping Operations B-32
Litter and Debris Removal B-33
Emergency Response and Cleanup Practices B-34
Graffiti Removal B-36
Landscaping Chemical Vegetation Control B-37
Manual Vegetation Control B-39
Landscaped Mechanical Vegetation Control/ Mowing B-40
Landscaped Tree and Shrub Pruning, Removal B-41
Irrigation Line Repairs B-42
Irrigation (Watering), Potable and Nonpotable B-43
Environmental Storm Drain Stenciling B-44
Roadside Slope Inspection B-45
Roadside Stabilization B-46
Stormwater Treatment Devices B-48
Traction Sand Trap Devices B-49
Public Facilities Public Facilities B-50
Bridges Welding and Grinding B-52
Sandblasting, Wet Blast with Sand Injection, Hydroblasting B-54
Painting B-56
Bridge Repairs B-57
Other Structures Pump Station Cleaning B-59
Tube and Tunnel Maintenance and Repair B-61
Tow Truck Operations B-63
Toll Booth Lane Scrubbing Operations B-64
Electrical Sawcutting for Loop Installation B-65

Minimum Control Measures Public Agency Activities Program
PA-7
Maintenance Activity Family BMP Caltrans Activity Cut Sheet Number
Traffic Guidance Thermoplastic Striping and Marking B-67
Paint Striping and Marking B-68
Raised/ Recessed Pavement Marker Application/Removal B-70
Sign Repair and Maintenance B-71
Median Barrier and Guard Rail Repair B-73
Emergency Vehicle Energy Attenuation Repair B-75
Storm Maintenance Minor Slides and Slipouts Cleanup/ Repair B-78
Management and Support Building and Grounds Maintenance B-80
Storage of Hazardous Materials (Working Stock) B-82
Material Storage Control (Hazardous Waste) B-84
Outdoor Storage of Raw Materials B-85
Vehicle and Equipment Fueling B-86
Vehicle and Equipment Cleaning B-87
Vehicle and Equipment Maintenance and Repair B-88
Aboveground and Underground Tank Leak and Spill Control B-90
7. Vehicle and Equipment Wash Areas Permit §VI.D.9.f
This section corresponds to Maintenance Activity Family Management and Support and corresponding Caltrans Activity Cut Sheet B-87.
Vehicle and equipment cleaning at a municipal facility may introduce a number of potential pollutants into the storm drain system. Municipal maintenance and field staff are responsible for implementing and maintaining the activity specific BMPs listed in Table PA-1 for all fixed vehicle and equipment washing; including fire fighting and emergency response vehicles. In addition, maintenance and field staff are responsible for preventing discharges of wash water from entering the storm drain system. Table PA-2 shows the potential pollutants associated with vehicle and equipment cleaning.
Table PA-2: Potential Pollutants Generated from Cleaning Activities
Activity Potential Pollutants
Vehicle and Equipment Cleaning Sediment Nutrients Trash Metals Oil & Grease Organics
Discharges of wash waters to the storm drain system are prevented by implementing the following measures at existing facilities with vehicle or equipment wash areas:
Wash water is self-contained and hauled away for proper disposal offsite.
Wash areas are equipped with a clarifier, or an alternative pre-treatment device, and water is plumbed to the sanitary sewer in accordance with applicable waste water provider regulations.
Wastewater from all new vehicle and equipment wash facilities, or redeveloped or replaced existing facilities is prevented from discharging to the MS4 by equipping the facility with a clarifier, or an alternative pre-treatment device, and plumbing water to the sanitary sewer in accordance with applicable waste water provider regulations, or by self-containing all water water/wash water and hauling to a point of legal disposal.
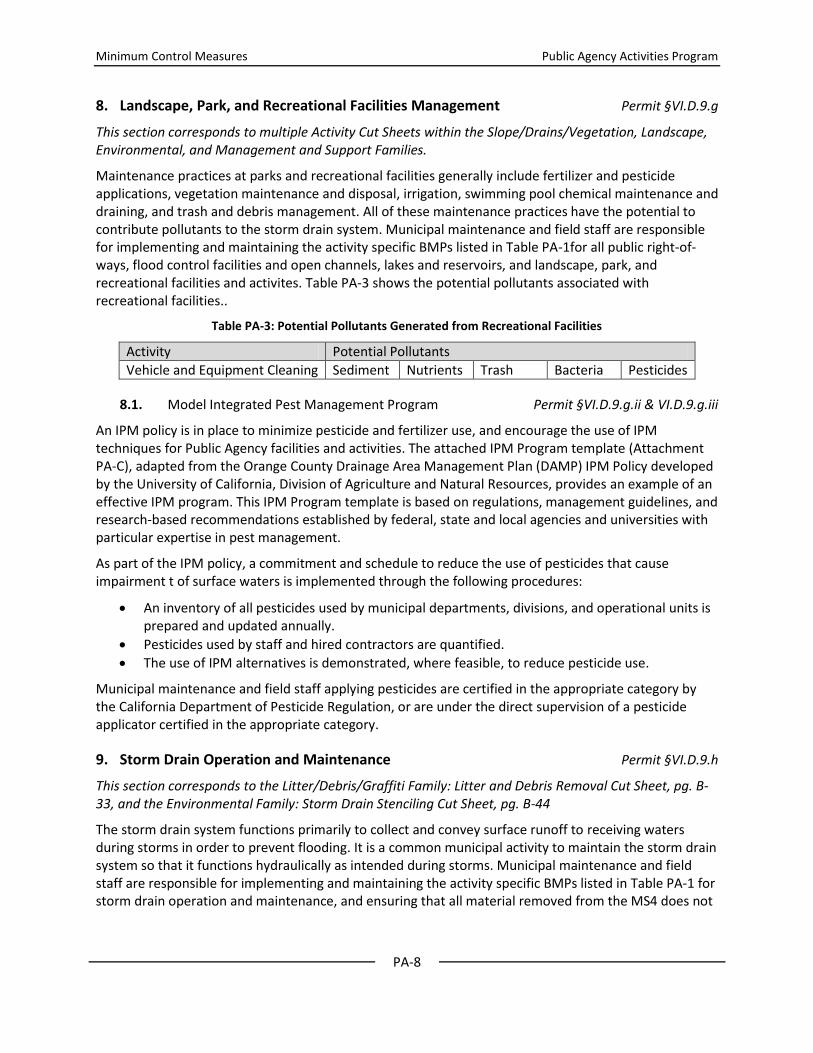
Minimum Control Measures Public Agency Activities Program
PA-8
8. Landscape, Park, and Recreational Facilities Management Permit §VI.D.9.g
This section corresponds to multiple Activity Cut Sheets within the Slope/Drains/Vegetation, Landscape, Environmental, and Management and Support Families.
Maintenance practices at parks and recreational facilities generally include fertilizer and pesticide applications, vegetation maintenance and disposal, irrigation, swimming pool chemical maintenance and draining, and trash and debris management. All of these maintenance practices have the potential to contribute pollutants to the storm drain system. Municipal maintenance and field staff are responsible for implementing and maintaining the activity specific BMPs listed in Table PA-1for all public right-of-ways, flood control facilities and open channels, lakes and reservoirs, and landscape, park, and recreational facilities and activites. Table PA-3 shows the potential pollutants associated with recreational facilities..
Table PA-3: Potential Pollutants Generated from Recreational Facilities
Activity Potential Pollutants
Vehicle and Equipment Cleaning Sediment Nutrients Trash Bacteria Pesticides
8.1. Model Integrated Pest Management Program Permit §VI.D.9.g.ii & VI.D.9.g.iii
An IPM policy is in place to minimize pesticide and fertilizer use, and encourage the use of IPM techniques for Public Agency facilities and activities. The attached IPM Program template (Attachment PA-C), adapted from the Orange County Drainage Area Management Plan (DAMP) IPM Policy developed by the University of California, Division of Agriculture and Natural Resources, provides an example of an effective IPM program. This IPM Program template is based on regulations, management guidelines, and research-based recommendations established by federal, state and local agencies and universities with particular expertise in pest management.
As part of the IPM policy, a commitment and schedule to reduce the use of pesticides that cause impairment t of surface waters is implemented through the following procedures:
An inventory of all pesticides used by municipal departments, divisions, and operational units is prepared and updated annually.
Pesticides used by staff and hired contractors are quantified.
The use of IPM alternatives is demonstrated, where feasible, to reduce pesticide use.
Municipal maintenance and field staff applying pesticides are certified in the appropriate category by the California Department of Pesticide Regulation, or are under the direct supervision of a pesticide applicator certified in the appropriate category.
9. Storm Drain Operation and Maintenance Permit §VI.D.9.h
This section corresponds to the Litter/Debris/Graffiti Family: Litter and Debris Removal Cut Sheet, pg. B-33, and the Environmental Family: Storm Drain Stenciling Cut Sheet, pg. B-44
The storm drain system functions primarily to collect and convey surface runoff to receiving waters during storms in order to prevent flooding. It is a common municipal activity to maintain the storm drain system so that it functions hydraulically as intended during storms. Municipal maintenance and field staff are responsible for implementing and maintaining the activity specific BMPs listed in Table PA-1 for storm drain operation and maintenance, and ensuring that all material removed from the MS4 does not

Minimum Control Measures Public Agency Activities Program
PA-9
reenter the system by dewatering solid material in a contained area and disposing of liquid material in accordance with any of the following measures:
Self-containing and hauling off for legal disposal; or
Applying to the land without runoff; or
Equipping with a clarifier or alternative pre-treatment device and plumbing to the sanitary sewer in accordance with applicable waste water provider regulations.
Table PA-4 shows potential pollutants generated during storm drain operation and maintenance.
Table PA-4: Potential Pollutants Generated from Storm Drain Operation and Maintenance
Activity
Potential Pollutants
Sed
imen
t
Nu
trie
nts
Tras
h
Met
als
Bac
teri
a
Oil
& G
reas
e
Org
anic
s
Pes
tici
des
Oxy
gen
De
man
din
g
Sub
stan
ces
Inspection and Cleaning of Conveyance Structures × × × × × ×
Controlling Illicit Connections and Discharges × × × × × × × × ×
Controlling Illegal Dumping × × × × × × × × ×
Maintenance of Inlet and Outlet Structures × × × ×
9.1. Catch Basin Cleaning Permit §VI.D.9.h.iii
There is no preferred method for cleaning catch basins as long as the method used is successful in removing accumulated sediment and debris. The methods used are determined in the field with the goal of minimizing the amount of escaped material, and preventing this material from entering the storm drain system. A template catch basin cleaning log is provided in Attachment PA-D.
9.1.1. Catch Basins Cleaning in Areas not Subject to a Trash TMDL
In areas that are not subject to a trash TMDL, catch basin inlets are prioritized based on the amount of trash generated, and inspected according to the schedule in Table PA-5.
Table PA-5: Inspection Frequencies for Catch Basin Inlets
Trash Generating Frequency Priority Inspection Frequency
Consistently generates the highest volumes of trash and/or debris
A A minimum of three times during the wet season (October-April) and once during the dry season every year
Consistently generates moderate volumes of trash and/or debris
B A minimum of once during the wet season and once during the dry season every year
Generates low volumes of trash and/or debris
C A minimum of once per year
An inventory of catch basins is maintained and updated regularly. This inventory includes the following components:
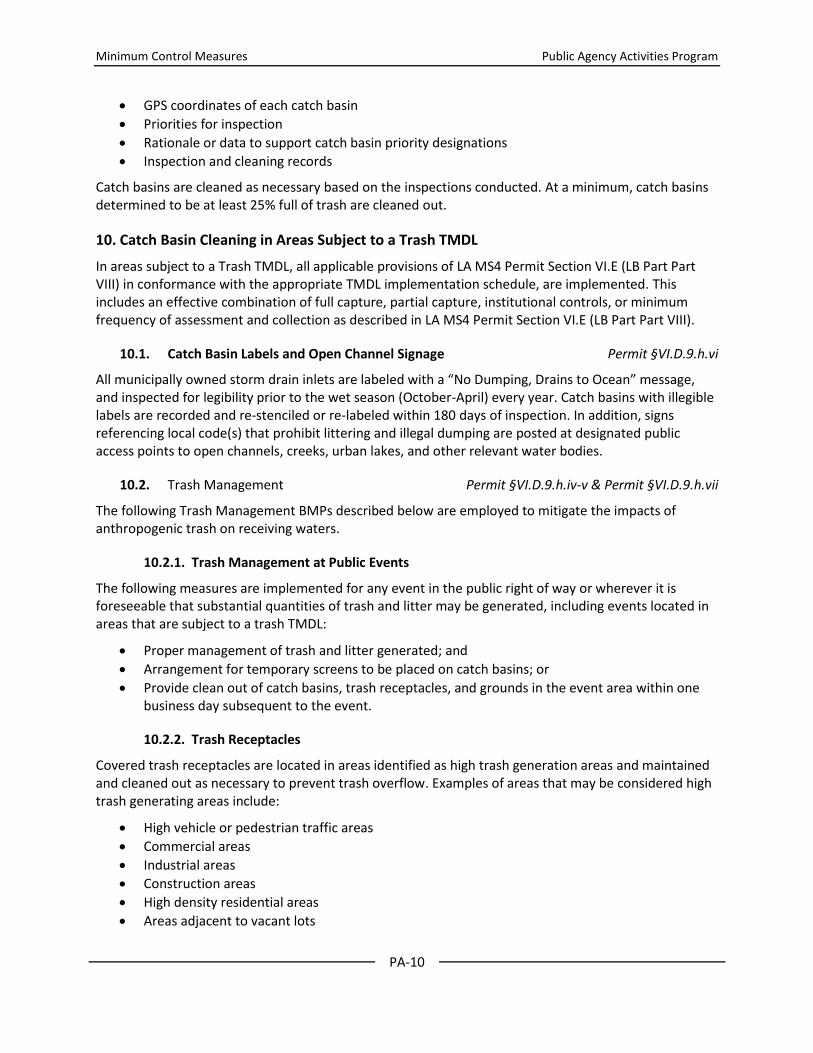
Minimum Control Measures Public Agency Activities Program
PA-10
GPS coordinates of each catch basin
Priorities for inspection
Rationale or data to support catch basin priority designations
Inspection and cleaning records
Catch basins are cleaned as necessary based on the inspections conducted. At a minimum, catch basins determined to be at least 25% full of trash are cleaned out.
10. Catch Basin Cleaning in Areas Subject to a Trash TMDL
In areas subject to a Trash TMDL, all applicable provisions of LA MS4 Permit Section VI.E (LB Part Part VIII) in conformance with the appropriate TMDL implementation schedule, are implemented. This includes an effective combination of full capture, partial capture, institutional controls, or minimum frequency of assessment and collection as described in LA MS4 Permit Section VI.E (LB Part Part VIII).
10.1. Catch Basin Labels and Open Channel Signage Permit §VI.D.9.h.vi
All municipally owned storm drain inlets are labeled with a “No Dumping, Drains to Ocean” message, and inspected for legibility prior to the wet season (October-April) every year. Catch basins with illegible labels are recorded and re-stenciled or re-labeled within 180 days of inspection. In addition, signs referencing local code(s) that prohibit littering and illegal dumping are posted at designated public access points to open channels, creeks, urban lakes, and other relevant water bodies.
10.2. Trash Management Permit §VI.D.9.h.iv-v & Permit §VI.D.9.h.vii
The following Trash Management BMPs described below are employed to mitigate the impacts of anthropogenic trash on receiving waters.
10.2.1. Trash Management at Public Events
The following measures are implemented for any event in the public right of way or wherever it is foreseeable that substantial quantities of trash and litter may be generated, including events located in areas that are subject to a trash TMDL:
Proper management of trash and litter generated; and
Arrangement for temporary screens to be placed on catch basins; or
Provide clean out of catch basins, trash receptacles, and grounds in the event area within one business day subsequent to the event.
10.2.2. Trash Receptacles
Covered trash receptacles are located in areas identified as high trash generation areas and maintained and cleaned out as necessary to prevent trash overflow. Examples of areas that may be considered high trash generating areas include:
High vehicle or pedestrian traffic areas
Commercial areas
Industrial areas
Construction areas
High density residential areas
Areas adjacent to vacant lots

Minimum Control Measures Public Agency Activities Program
PA-11
10.2.3. Additional Trash Management Practices
In areas that are not subject to a trash TMDL, additional trash management practices will be employed no later than five years after the effective date of the LA MS4 Permit (4 years after the effective date of the LB MS4 Permit). Trash excluders or equivalent devices must be installed on or in catch basins or outfalls to prevent the discharge of trash to the MS4 or receiving waters, unless the installation of such BMP(s) alone will cause flooding (not due to lack of maintenance). Alternatively, additional trash BMPs that provide substantially equivalent removal of trash may be implemented. Additional BMPs may include, but are not limited to:
Increased street sweeping
Adding trash cans near trash generation sites
Prompt enforcement of trash accumulation
Increased trash collection on public property
Increased litter prevention messages or trash nets within the MS4
The BMPs chosen will provide equivalent trash removal performance as excluders, and will be demonstrated though the annual report. When outfall trash capture is provided, revision of the schedule for inspection and cleanout of catch basins will also be reported in the annual report.
The State Water Resources Control Board (State Water Board) is considering the adoption of amendments to the Water Quality Control Plans for Ocean Waters of California and for the Inland Surface Water, Enclosed Bays, and Estuaries of California for Trash (Trash Amendments) citing a strong need for statewide consistency in trash management. The proposed Trash Amendments will include five elements: (1) Water Quality Objective, (2) Prohibition of Discharge, (3) Implementation, (4) Compliance Schedule, and (5) Monitoring, which will outline NPDES Permittee requirements for trash management. The development of the Trash Amendments will continue to be monitored, and any additional required trash management practices in areas not subject to a trash TMDL will be implemented per the guidance provided by these amendments.
10.3. Storm Drain Maintenance Permit §VI.D.9.h.viii
The following BMPs constitute the Storm Drain Maintenance Program:
Municipally-owned open channels and drainage structures are visually inspected for debris at least annually.
Trash and debris from is removed from open channel storm drains a minimum of once per year, before the storm season.
The discharge of contaminants is minimized during MS4 maintenance and clean outs;
Material removed is properly disposed of by containing and hauling away for legal disposal
10.4. Infiltration from Sanitary Sewer to MS4/ Permit §VI.D.9.h.ix Preventive Maintenance
Thorough, routine, preventive surveys and maintenance of both municipally owned and operated Storm Drain Systems as well as Sanitary Sewer Systems infiltration and seepage of contaminants from the sanitary sewer system into the storm drain system is prevented. Sanitary Sewer System routine preventative maintenance is described in the Sewer System Management Plan (SSMP), which is a component of the Statewide General Waste Discharge Requirements (WDR) for Sanitary Sewer Systems.

Minimum Control Measures Public Agency Activities Program
PA-12
Where necessary, controls implemented to limit infiltration of seepage from sanitary sewers to the MS4 include:
Adequate plan checking for construction and new development;
Incident response training for its municipal employees that identify sanitary sewer spills;
Code enforcement inspections;
MS4 maintenance and inspections;
Interagency coordination with sewer agencies; and
Proper education of its municipal staff and contractors conducting field operations on the MS4 or its municipal sanitary sewer (if applicable).
10.5. Permittee Owned Treatment Control BMPs Permit §VI.D.9.h.x
All municipally owned treatment control BMPs, including post-construction BMPs, are regularly inspected and maintained to ensure their proper operation. Any residual water generated during BMP maintenance is disposed of using one of the following procedures:
Hauled away and legally disposed of; or
Applied to the land without runoff; or
Discharged to the sanitary sewer system; or
Treated or filtered to remove bacteria, sediments, nutrients, and meet the limitations set in Table PA-6 below prior to discharge to the storm drain system.
Table PA-6: Discharge Limitations for Dewatering Treatment BMPs
Parameter Units Limitation
Total Suspended Solids Mg/L 100
Turbidity NTU 50
Oil and Grease Mg/L 10
10.6. Streets, Roads, and Parking Facilities Maintenance Permit §VI.D.9.i
This section corresponds to multiple Activity Cut Sheets within the Flexible Pavement, Rigid Pavement, Litter/Debris/Graffiti, Traffic Guidance, and Management and Support Families.
Streets and roads may collect litter and debris from nearby activities, as well as from vehicular traffic. They also require routine maintenance that may generate waste materials. Table PA-7 shows potential pollutants generated from street, road, and parking facilities maintenance.
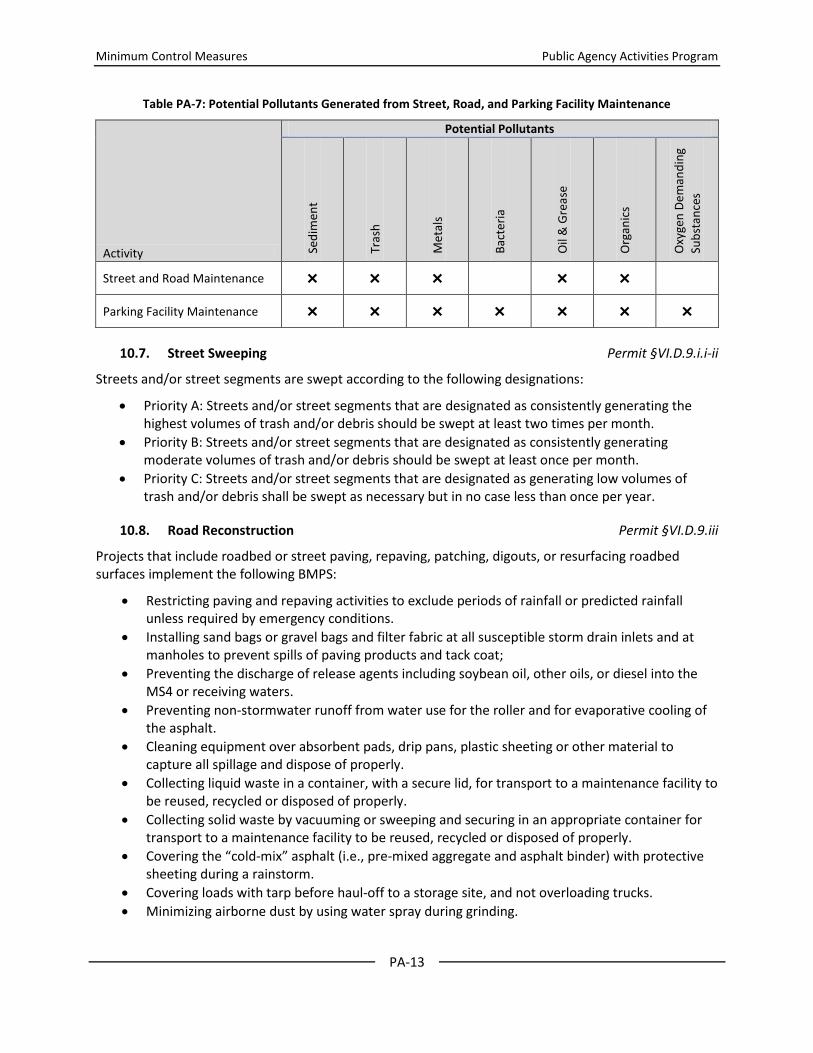
Minimum Control Measures Public Agency Activities Program
PA-13
Table PA-7: Potential Pollutants Generated from Street, Road, and Parking Facility Maintenance
Activity
Potential Pollutants
Sed
imen
t
Tras
h
Met
als
Bac
teri
a
Oil
& G
reas
e
Org
anic
s
Oxy
gen
De
man
din
g
Sub
stan
ces
Street and Road Maintenance × × × × ×
Parking Facility Maintenance × × × × × × ×
10.7. Street Sweeping Permit §VI.D.9.i.i-ii
Streets and/or street segments are swept according to the following designations:
Priority A: Streets and/or street segments that are designated as consistently generating the highest volumes of trash and/or debris should be swept at least two times per month.
Priority B: Streets and/or street segments that are designated as consistently generating moderate volumes of trash and/or debris should be swept at least once per month.
Priority C: Streets and/or street segments that are designated as generating low volumes of trash and/or debris shall be swept as necessary but in no case less than once per year.
10.8. Road Reconstruction Permit §VI.D.9.iii
Projects that include roadbed or street paving, repaving, patching, digouts, or resurfacing roadbed surfaces implement the following BMPS:
Restricting paving and repaving activities to exclude periods of rainfall or predicted rainfall unless required by emergency conditions.
Installing sand bags or gravel bags and filter fabric at all susceptible storm drain inlets and at manholes to prevent spills of paving products and tack coat;
Preventing the discharge of release agents including soybean oil, other oils, or diesel into the MS4 or receiving waters.
Preventing non-stormwater runoff from water use for the roller and for evaporative cooling of the asphalt.
Cleaning equipment over absorbent pads, drip pans, plastic sheeting or other material to capture all spillage and dispose of properly.
Collecting liquid waste in a container, with a secure lid, for transport to a maintenance facility to be reused, recycled or disposed of properly.
Collecting solid waste by vacuuming or sweeping and securing in an appropriate container for transport to a maintenance facility to be reused, recycled or disposed of properly.
Covering the “cold-mix” asphalt (i.e., pre-mixed aggregate and asphalt binder) with protective sheeting during a rainstorm.
Covering loads with tarp before haul-off to a storage site, and not overloading trucks.
Minimizing airborne dust by using water spray during grinding.

Minimum Control Measures Public Agency Activities Program
PA-14
Avoiding the stockpiling of soil, sand, sediment, asphalt material and asphalt grindings materials or rubble in or near MS4 or receiving waters.
Protecting stockpiles with a cover or sediment barriers during a rain.
10.9. Parking Facilities Maintenance Permit §VI.D.9.iv
Municipally owned parking lots that are uncovered and exposed to stormwater are kept clear of debris and excessive oil buildup by inspecting lots at least 2 times per month and cleaning at least once per month.
10.10. Emergency Procedures Permit §VI.D.9.j
Participating Agencies may conduct repairs of essential public service systems and infrastructure in emergency situations with a self-waiver of the provisions of the MS4 Permit as follows:
Cities will abide by all other regulatory requirements, including notification to other agencies as appropriate.
Where the self-waiver has been invoked, Cities will submit to the Regional Water Board Executive Officer a statement of the occurrence of the emergency, an explanation of the circumstances, and the measures that were implemented to reduce the threat to water quality, no later than 30 business days after the situation of emergency has passed.
Minor repairs of essential public service systems and infrastructure in emergency situations (that can be completed in less than one week) are not subject to the notification provisions. Appropriate BMPs to reduce the threat to water quality will be implemented.
11. Municipal Employee and Contractor Training Permit §VI.D.9.k
An annual training program on the requirements of the overall stormwater management program is implemented for all municipal field staff whose interactions, jobs, and activities affect stormwater quality prior to June 30 every year. The Cities also ensure that contractors performing privatized/contracted municipal services have appropriate training in the stormwater management program. The goals of the annual training are to:
Promote a clear understanding of the potential for municipal activities to pollute stormwater
Identify opportunities to require, implement, and maintain appropriate BMPs in their line of work
In addition to the annual stormwater program training, the Cities implement an annual training program to train all of their employees and contractors who use or have the potential to use pesticides or fertilizers (whether or not they normally apply these as part of their work). Training programs address:
The potential for pesticide-related surface water toxicity
Proper use, handling, and disposal of pesticides
Least toxic methods of pest prevention and control, including IPM
Reduction of pesticide use
Outside contractors can self-certify, providing they certify they have received all applicable training required in the MS4 Permit and have documentation to that effect.

APPENDIX 2-PIP
PUBLIC INFORMATION AND PARTICIPATION

Minimum Control Measures Public Information and Participation Program
PIP-1
Public Information and Participation Program
Introduction Permit §VI.D.5.a
Each Participating Agency is required to develop and implement a Public Information and Participation Program (PIPP) that includes the requirements listed in Permit §VI.D.5.a. This document provides guidance that the Participating Agencies can follow to implement a PIPP in compliance with the Permit.
The objectives of the PIPP are to:
Measurably increase the knowledge of the target audiences about the MS4, the adverse impacts of stormwater pollution on receiving waters and potential solutions to mitigate the impacts.
Measurably change the waste disposal and stormwater pollution generation behavior of target audiences by developing and encouraging the implementation of appropriate alternatives.
Involve and engage a diversity of socio-economic groups and ethnic communities in Los Angeles County to participate in mitigating the impacts of stormwater pollution.
PIPP Implementation Permit §VI.D.5.b
The PIPP is implemented using the following approaches:
By participating in a County-wide PIPP,
By participating in one or more Watershed Group sponsored PIPPs, and
Individually within its jurisdiction.
Cities participating in a County-wide or Watershed Group PIPP provide contact info for their staff responsible for stormwater public education activities to the designated PIPP coordinator. Changes in contact information are provided within 30 days of the date that the change occurred.
Public Participation Permit §VI.D.5.c
Public Reporting
The means for public reporting of clogged catch basin inlets and illicit discharges/dumping, faded or missing catch basin labels, and general stormwater and non-stormwater pollution prevention information is provided through the use of the countywide 888-CLEAN-LA hotline. In addition, each participating agency:
Includes the reporting information – updated when necessary – in public information and the government pages of the telephone book as they are developed or published.
Identifies staff or departments who will serve as the contact person(s) and will make this information available on its website.
Provides current, updated hotline contact information to the general public within its jurisdiction.

Minimum Control Measures Public Information and Participation Program
PIP-2
Events
Events are organized to target residents and population subgroups. The purpose of the events is to educate and involve the community in stormwater and non-stormwater pollution prevention activities, such as education seminars, clean-ups, and community catch basin stenciling.
Residential Outreach Program Permit §VI.D.5.d
With the exception of item 5, which is no longer an element of the countywide PIP Program, each agency implements the following activities for the Residential Outreach Program as part of a countywide program:
1. Conduct stormwater pollution prevention public service announcements and advertising campaigns
2. Prepare public education materials that include information on the proper handling (i.e., disposal, storage and/or use) of:
a. Vehicle waste fluids
b. Household waste materials (i.e., trash and household hazardous waste, including personal care products and pharmaceuticals)
c. Construction waste materials
d. Pesticides and fertilizers (including integrated pest management (IPM) practices to promote reduced use of pesticides)
e. Green waste (including lawn clippings and leaves)
f. Animal wastes
3. Distribute activity specific stormwater pollution prevention public education materials at the following points of purchase:
a. Automotive parts stores
b. Home improvement centers / lumber yards / hardware stores/paint stores
c. Landscaping / gardening centers
d. Pet shops / feed stores
4. Maintain stormwater websites or provide links to stormwater websites via each participating agency’s website. This includes educational material and opportunities for the public to participate in stormwater pollution prevention and clean-up activities listed in Part VI.D.4 of the Permit.
5. Provide independent, parochial, and public schools within each participating agency’s jurisdiction with materials to educate school children (K-12) on stormwater pollution. Material may include videos, live presentations and other information. A useful source of materials to work with, or leverage, is other statewide agencies and associations. These associations include the State Water Board’s “Erase the Waste” educational program and the California Environmental Education Interagency Network (CEEIN) to implement this requirement.
6. When implementing the above activities, use effective strategies to educate and involve ethnic communities in stormwater pollution prevention through culturally effective methods.

APPENDIX 2-PLD
PLANNING AND LAND DEVELOPMENT PROGRAM

Minimum Control Measures Planning and Land Development Program
PLD-1
Planning and Land Development Program
The Participating Agencies are required to implement a Planning and Land Development program that includes the provisions listed in the MS4 Permit, §VI.D.7. This document provides guidance that the participating agencies can follow to implement a Planning and Land Development program in compliance with the MS4 Permit.
Introduction Permit §VI.D.7.a
The Planning and Land Development Program for all New Development and Redevelopment projects subject to the MS4 Permit includes measures to:
Lessen the water quality impacts of development by using smart growth practices such as compact development, directing development towards existing communities via infill or redevelopment, and safeguarding of environmentally sensitive areas.
Minimize the adverse impacts from stormwater runoff on the biological integrity of Natural Drainage Systems and the beneficial uses of water bodies in accordance with requirements under CEQA (Cal. Pub. Resources Code §21000 et seq.).
Minimize the percentage of impervious surfaces on land developments by minimizing soil compaction during construction, designing projects to minimize the impervious area footprint, and employing Low Impact Development (LID) design principles to mimic pre-development hydrology through infiltration, evapotranspiration and rainfall harvest and use.
Maintain existing riparian buffers and enhance riparian buffers when possible.
Minimize pollutant loadings from impervious surfaces such as roof tops, parking lots, and roadways through the use of properly designed, technically appropriate BMPs (including Source Control BMPs such as good housekeeping practices), LID Strategies, and Treatment Control BMPs.
Properly select, design and maintain LID and Hydromodification Control BMPs to address pollutants that are likely to be generated, reduce changes to pre-development hydrology, assure long-term function, and avoid the breeding of vectors.1
Prioritize the selection of BMPs to remove stormwater pollutants, reduce stormwater runoff volume, and beneficially use stormwater to support an integrated approach to protecting water quality and managing water resources in the following order of preference: o On-site infiltration, bioretention and/or rainfall harvest and use. o On-site biofiltration, off-site groundwater replenishment, and/or off-site retrofit.
1 Treatment BMPs when designed to drain within 96 hours of the end of rainfall minimize the potential for the breeding of
vectors. See California Department of Public Health Best Management Practices for Mosquito Control in California (2012) at
http://www.westnile.ca.gov/resources.php

Minimum Control Measures Planning and Land Development Program
PLD-2
Applicability Permit §VI.D.7.b
New Development Projects
The New Development and Redevelopment categories below will require a Standard Urban Stormwater Mitigation Plan (SUSMP), also known as a Low Impact Development (LID) Plan, containing stormwater mitigation measures in compliance with MS4 Permit requirements. Development projects subject to conditioning and approval for the design and implementation of post-construction controls to mitigate stormwater pollution, prior to completion of the project(s), are listed below:
1. All development projects (including single family hillside homes) equal to 1 acre or greater of disturbed area and adding more than 10,000 square feet of impervious surface area
2. Industrial parks with 10,000 square feet or more of surface area 3. Commercial malls with 10,000 square feet or more surface area 4. Retail gasoline outlets with 5,000 square feet or more of surface area 5. Restaurants (SIC 5812) with 5,000 square feet or more of surface area 6. Parking lots with 5,000 square feet or more of impervious surface area, or with 25 or more parking
spaces 7. Automotive service facilities (SIC 5013, 5014, 5511, 5541, 7532-7534 and 7536-7539) with 5,000
square feet or more of surface area 8. Projects located in or directly adjacent to, or discharging directly to a Significant Ecological Area
(SEA), where the development will: a. Discharge stormwater runoff that is likely to impact a sensitive biological species or habitat; and b. Create 2,500 square feet or more of impervious surface area
9. Redevelopment projects in subject categories that meet Redevelopment thresholds identified below
Redevelopment Projects
Redevelopment projects subject to agency conditioning and approval for the design and implementation of post-construction controls to mitigate stormwater pollution, prior to completion of the project(s), are:
1. Land-disturbing activity that results in the creation or addition or replacement of 5,000 square feet or more of impervious surface area on an already developed site on development categories identified above.
2. Where Redevelopment results in an alteration to more than fifty percent of impervious surfaces of a previously existing development, and the existing development was not subject to post-construction stormwater quality control requirements, the entire project must be mitigated.
3. Where Redevelopment results in an alteration of less than fifty percent of impervious surfaces of a previously existing development, and the existing development was not subject to post-construction stormwater quality control requirements, only the alteration must be mitigated, and not the entire development.
4. Redevelopment does not include routine maintenance activities that are conducted to maintain original line and grade, hydraulic capacity, original purpose of facility or emergency Redevelopment activity required to protect public health and safety. Impervious surface replacement, such as the reconstruction of parking lots and roadways which does not disturb additional area and maintains the original grade and alignment, is considered a routine maintenance activity. Redevelopment does not include the repaving of existing roads to maintain original line and grade.
5. Existing single-family dwelling and accessory structures are exempt from the Redevelopment requirements unless such projects create, add, or replace 10,000 square feet of impervious surface area.

Minimum Control Measures Planning and Land Development Program
PLD-3
Special Provisions
1. Street and road construction of 10,000 square feet or more of impervious surface area a. These projects will follow an approved green streets manual to the maximum extent
practicable. Street and road construction applies to standalone streets, roads, highways, and freeway projects, and also applies to streets within larger projects. The Agencies will require a Standard Urban Mitigation Plan (SUSMP), also known as a Low Impact Development (LID) Plan, containing stormwater mitigation measures in compliance with the approved green streets manual requirements.
2. Single family hillside homes will require a less extensive plan. To the extent that an agency may lawfully impose conditions, mitigation measures or other requirements on the development or construction of a single-family home in a hillside area as defined in the applicable agency’s Code and Ordinances, the Agencies will require that during the construction of a single-family hillside home, the following measures are implemented: a. Conserve natural areas b. Protect slopes and channels c. Provide storm drain system stenciling and signage d. Divert roof runoff to vegetated areas before discharge unless the diversion would result in slope
instability e. Direct surface flow to vegetated areas before discharge unless the diversion would result in
slope instability.
New Development/ Redevelopment Permit §VI.D.7.c Project Performance Criteria
Integrated Water Quality/Flow Reduction/Resources Management Criteria
All New Development and Redevelopment projects identified above will control pollutants, pollutant loads, and runoff volume emanating from the project site by: (1) minimizing the impervious surface area and (2) controlling runoff from impervious surfaces through infiltration, bioretention and/or rainfall harvest and use. Projects will retain on-site the Stormwater Quality Design Volume (SWQDv) defined as the runoff from the 0.75-inch, 24-hour rain event or the 85th percentile, 24-hour rain event, as determined from the Los Angeles County 85th percentile precipitation isohyetal map2, whichever is greater. Exceptions include technical infeasibility, opportunity for regional groundwater replenishment, local ordinance equivalence, or hydromodification, as described in the sections below. When evaluating the potential for on-site retention, the Agencies will consider the maximum potential for evapotranspiration from green roofs and rainfall harvest and use.
Alternative Compliance for Technical Infeasibility or Opportunity for Regional Groundwater Replenishment
In instances of technical infeasibility or where a project has been determined to provide an opportunity to replenish regional groundwater supplies at an offsite location, the Agencies may allow projects to comply with the MS4 Permit through the alternative compliance measures as described below:
1. To demonstrate technical infeasibility, the project applicant must demonstrate that the project cannot reliably retain 100 percent of the SWQDv on-site, even with the maximum application of green roofs and rainwater harvest and use, and that compliance with the applicable post-construction requirements would be technically infeasible by submitting a site-specific hydrologic
2 Found at <http://ladpw.org/wrd/publication/engineering/Final_Report-Probability_Analysis_of_85th_Percentile_24-hr_Rainfall1.pdf>

Minimum Control Measures Planning and Land Development Program
PLD-4
and/or design analysis conducted and endorsed by a registered professional engineer, geologist, architect, and/or landscape architect. Conditions where technical infeasibility may result including those indicated in Table PLD- 1 below. To utilize alternative compliance measures to replenish groundwater at an offsite location, the project applicant will demonstrate (i) why it is not advantageous to replenish groundwater at the project site, (ii) that groundwater can be used for beneficial purposes at the offsite location, and (iii) that the alternative measures will also provide equal or greater water quality benefits to the receiving surface water than the Water Quality/Flow Reduction/Resource Management Criteria.
Table PLD- 1: Technical Infeasibility Criteria 1. The infiltration rate of saturated in-situ soils is less than 0.3 inch per hour and it is not technically feasible to amend the
in-situ soils to attain an infiltration rate necessary to achieve reliable performance of infiltration or bioretention BMPs in
retaining the SWQDv on-site.
2. Locations where seasonal high groundwater is within 5 to 10 feet of the surface,
3. Locations within 100 feet of a groundwater well used for drinking water,
4. Brownfield development sites where infiltration poses a risk of causing pollutant mobilization,
5. Other locations where pollutant mobilization is a documented concern. Pollutant mobilization is considered a
documented concern at or near properties that are contaminated or store hazardous substances underground.
6. Locations with potential geotechnical hazards
7. Smart growth and infill or Redevelopment locations where the density and/ or nature of the project would create
significant difficulty for compliance with the on-site volume retention requirement.
Alternative Compliance Measures
When a project applicant has demonstrated that it is technically infeasible to retain 100 percent of the SWQDv on-site, or is proposing an alternative offsite project to replenish regional groundwater supplies, the agency will require one of the following mitigation options:
1. On-site Biofiltration
If using biofiltration due to demonstrated technical infeasibility, then the project must biofiltrate 1.5 times the portion of the SWQDv that is not reliably retained on-site, as calculated by Equation 1 below.
– Equation 1
Where:
Bv = biofiltration volume
SWQDv = the stormwater runoff from a 0.75 inch, 24-hour storm or the 85th
percentile storm3, whichever is greater.
Rv = volume reliably retained on-site
3 Found at <http://ladpw.org/wrd/publication/engineering/Final_Report-Probability_Analysis_of_85th_Percentile_24-
hr_Rainfall1.pdf>
The MS4 Permit does not mention flowrate based
biotreatment BMPs; however, proprietary biotreatment
systems are often sized using flowrate rather than
volume. Additionally, in cases where a pump is needed
prior to entering the biotreatment BMP, the system
requires sizing based on the controlled flow from the
pump. Therefore, if it is infeasible to size a
biotreatment BMP with volume-based calculations, the
flowrate may be substituted in lieu of volume. Similarly,
the flow rate must be determined using the design
storm of 0.75 inch, 24-hour storm event or the 85th
percentile storm1, whichever is greater.

Minimum Control Measures Planning and Land Development Program
PLD-5
Conditions for On-site Biofiltration include the following: a. Biofiltration systems will meet the design specifications provided in Attachment H to the MS4
Permit unless otherwise approved by the Regional Water Board Executive Officer. b. Biofiltration systems discharging to a receiving water that is included on the Clean Water Act
section 303(d) list of impaired water quality-limited water bodies due to nitrogen compounds or related effects will be designed and maintained to achieve enhanced nitrogen removal capability. See Attachment H of the MS4 Permit for design criteria for underdrain placement to achieve enhanced nitrogen removal.
2. Offsite Infiltration
Offsite infiltration when implemented will use infiltration or bioretention BMPs to intercept a volume of stormwater runoff equal to the SWQDv, less the volume of stormwater runoff reliably retained on-site, at an approved offsite project and provide pollutant reduction (treatment) of the stormwater runoff discharged from the project site in accordance with the Water Quality Mitigation Criteria. The required offsite mitigation volume will be calculated by Equation 2 below.
Equation 2
Where:
= mitigation volume
= runoff from the 0.75 inch, 24-hour storm event or the 85th percentile storm4, whichever is greater
= the volume of stormwater runoff reliably retained on-site.
3. Groundwater Replenishment Projects
Regional projects to replenish regional groundwater supplies at offsite locations may be proposed, provided the groundwater supply has a designated beneficial use in the Basin Plan. Regional groundwater replenishment projects must use infiltration, groundwater replenishment, or bioretention BMPs to intercept a volume of stormwater runoff equal to the SWQDv for New Development and Redevelopment projects, subject to conditioning and approval for the design and implementation of post-construction controls, within the approved project area. The projects must provide pollutant reduction (treatment) of the stormwater runoff discharged from development projects, within the project area, subject to conditioning and approval for the design and implementation of post-construction controls to mitigate stormwater pollution in accordance with the Water Quality Mitigation Criteria. Regional groundwater replenishment projects being implemented in lieu of onsite controls will mitigate the volume as calculated using Equation 2 above. Regional groundwater replenishment projects will be located in the same sub-watershed (defined as draining to the same HUC-12 hydrologic area in the Basin Plan) as the New Development or Redevelopment projects which did not implement on-site retention BMPs. Locations outside of the HUC-12 but within the HUC-10 subwatershed area may be considered if there are no opportunities within the HUC-12 subwatershed or if greater pollutant reductions and/or groundwater replenishment can be achieved at a location within the expanded HUC-10 subwatershed. The use of a mitigation, groundwater replenishment, or retrofit project outside of the HUC-12 subwatershed is subject to the approval of the Executive Officer of the Regional Water Board.
4 Found at <http://ladpw.org/wrd/publication/engineering/Final_Report-Probability_Analysis_of_85th_Percentile_24-
hr_Rainfall1.pdf>

Minimum Control Measures Planning and Land Development Program
PLD-6
4. Offsite Project -Retrofit Existing Development
Use infiltration, bioretention, rainfall harvest and use and/or biofiltration BMPs to retrofit an existing development, with similar land uses as the New Development or land uses associated with comparable or higher stormwater runoff event mean concentrations (EMCs) than the new development. Comparison of EMCs for different land uses will be based on published data from studies performed in southern California. The retrofit plan will be designed and constructed to:
a. Intercept a volume of stormwater runoff equal to the mitigation volume (Mv) as described above in Equation 2, except biofiltration BMPs will be designed to meet the biofiltration volume or flowrate as described in Equation 1, and
b. Provide pollutant reduction (treatment) of the stormwater runoff from the project site as described in the Water Quality Mitigation Criteria.
5. Conditions for Offsite Projects Project applicants seeking to utilize these alternative compliance provisions may propose other offsite projects, which the agency in which the project is located may approve if they meet the requirements of this subpart. a. Location of offsite projects. Offsite projects will be located in the same sub-watershed (defined
as draining to the same HUC-12 hydrologic area in the Basin Plan) as the New Development or Redevelopment project. Locations outside of the HUC-12 but within the HUC-10 subwatershed area may be considered if there are no opportunities within the HUC-12 subwatershed or if greater pollutant reductions and/or groundwater replenishment can be achieved at a location within the expanded HUC-10 subwatershed. The use of a mitigation, groundwater replenishment, or retrofit project outside of the HUC-12 subwatershed is subject to the approval of the Executive Officer of the Regional Water Board.
b. Project applicant must demonstrate that equal benefits to groundwater recharge can be met on the project site.
c. A prioritized list of potential offsite mitigation, groundwater replenishment and/or retrofit projects will be developed within each agency, and when feasible, the mitigation will be directed to the highest priority project within the same HUC-12 or if approved by the Regional Water Board Executive Officer, the HUC-10 drainage area, as the New Development project.
d. Infiltration/bioretention will be the preferred LID BMP for offsite mitigation or groundwater replenishment projects. Offsite retrofit projects may include green streets, parking lot retrofits, green roofs, and rainfall harvest and use. Biofiltration BMPs may be considered for retrofit projects when infiltration, bioretention or rainfall harvest and use is technically infeasible.
e. The agency in which the project is located will develop a schedule for the completion of offsite projects, including milestone dates to identify, fund, design, and construct the projects. Offsite projects will be completed as soon as possible, and at the latest, within 4 years of the certificate of occupancy for the first project that contributed funds toward the construction of the offsite project, unless a longer period is otherwise authorized by the Executive Officer of the Regional Water Board. For public offsite projects, the agency in which the project is located must provide in their annual reports a summary of total offsite project funds raised to date and a description (including location, general design concept, volume of water expected to be retained, and total estimated budget) of all pending public offsite projects. Funding sufficient to address the offsite volume must be transferred to the agency (for public offsite mitigation projects) or to an escrow account (for private offsite mitigation projects) within one year of the initiation of construction.
f. Offsite projects must be approved by the agency in which the project is located and may be subject to approval by the Regional Water Board Executive Officer, if a third-party petitions the

Minimum Control Measures Planning and Land Development Program
PLD-7
Executive Officer to review the project. Offsite projects will be publicly noticed on the Regional Water Board’s website for 30 days prior to approval.
g. The project applicant must perform the offsite projects as approved by either the agency or the Regional Water Board Executive Officer or provide sufficient funding for public or private offsite projects to achieve the equivalent mitigation stormwater volume.
6. Regional Stormwater Mitigation Program
An agency or agency group may apply to the Regional Water Board for approval of a regional or sub-regional stormwater mitigation program to substitute in part or wholly for New and Redevelopment requirements for the area covered by the regional or sub-regional stormwater mitigation program. Upon review and a determination by the Regional Water Board Executive Officer that the proposal is technically valid and appropriate, the Regional Water Board may consider for approval such a program if its implementation meets all of the following requirements:
a. Retains the runoff from the 85th percentile, 24-hour rain event or the 0.75 inch, 24-hour rain event, whichever is greater;
b. Results in improved stormwater quality; c. Protects stream habitat; d. Promotes cooperative problem solving by diverse interests; e. Is fiscally sustainable and has secure funding; and f. Is completed in five years including the construction and start-up of treatment facilities.
7. Water Quality Mitigation Criteria
All New Development and Redevelopment projects that have been approved for offsite mitigation or groundwater replenishment projects will also provide treatment of stormwater runoff from the project site. These projects will design and implement post-construction stormwater BMPs and control measures to reduce pollutant loading as necessary to: a. Meet the pollutant specific benchmarks listed in Table PLD2 at the treatment systems outlet or
prior to the discharge to the MS4, and b. Ensure that the discharge does not cause or contribute to an exceedance of water quality
standards at the agency’s downstream MS4 outfall. The project proponent may be allowed to install flow-through modular treatment systems including sand filters, or other proprietary BMP treatment systems with a demonstrated efficiency at least equivalent to a sand filter. The sizing of the flow through treatment device will be based on a rainfall intensity of 0.2 inches per hour, or the one year, one-hour rainfall intensity as determined from the most recent Los Angeles County isohyetal map, whichever is greater.
Table PLD- 2: Benchmarks Applicable to New Development Treatment BMPs.
Conventional Pollutants Pollutant Suspended Solids mg/L Total P mg/L Total N mg/L TKN mg/L
Effluent Concentration 14 0.13 1.28 1.09
Metals
Pollutant Total Cd µg/L Total Cu µg/L Total Cr µg/L Total Pb µg/L Total Zn µg/L
Effluent Concentration 0.3 6 2.8 2.5 23
New developments and redevelopments will not cause or contribute to an exceedance of applicable water quality-based effluent limitations established in the MS4 Permit pursuant to Total Maximum

Minimum Control Measures Planning and Land Development Program
PLD-8
Daily Loads (TMDLs).
8. Hydromodification (Flow/ Volume/ Duration) Control Criteria
All New Development and Redevelopment projects located within natural drainage systems will implement hydrologic control measures, to prevent accelerated downstream erosion and to protect stream habitat in natural drainage systems. The purpose of the hydrologic controls is to minimize changes in post-development hydrologic stormwater runoff discharge rates, velocities, and duration. This will be achieved by maintaining the project’s pre-project stormwater runoff flow rates and durations.
Description
Hydromodification control in natural drainage systems will be achieved by maintaining the Erosion Potential (Ep) in streams at a value of 1, unless an alternative value can be shown to be protective of the natural drainage systems from erosion, incision, and sedimentation that can occur as a result of flow increases from impervious surfaces and prevent damage to stream habitat in natural drainage system tributaries5. Hydromodification mitigation approaches should meet the criteria below:
a. Hydromodification control may include one, or a combination of on-site, regional or sub-regional hydromodification control BMPs, LID strategies, or stream and riparian buffer restoration measures. Any in-stream restoration measure shall not adversely affect the beneficial uses of the natural drainage systems.
b. Natural drainage systems that are subject to the hydromodification assessments and controls, as described in this section, include all drainages that have not been improved (e.g., channelized or armored with concrete, shotcrete, or rip-rap) or drainage systems that are tributary to a natural drainage system, except as provided in Exemptions to Hydromodification Controls, see below. The clearing or dredging of a natural drainage system does not constitute an “improvement.”
c. Until the State Water Board or the Regional Water Board adopts a final Hydromodification Policy or criteria, the Hydromodification Control Criteria described in this section will be implemented to control the potential adverse impacts of changes in hydrology that may result from New Development and Redevelopment projects located within natural drainage systems.
Exemptions to Hydromodification Controls
New Development and Redevelopment projects may be exempt from implementation of hydromodification controls where assessments of downstream channel conditions and proposed discharge hydrology indicate that adverse hydromodification effects to beneficial uses of Natural Drainage Systems are unlikely. Conditions for exemptions include the following: a. Projects involving replacement, maintenance or repair of an agency’s existing flood control
facility, storm drain, or transportation network. b. Redevelopment Projects in the center of urban areas that do not increase the effective
impervious area or decrease the infiltration capacity of pervious areas compared to the pre-project conditions.
c. Projects that have any increased discharge directly or via a storm drain to a sump, lake, area under tidal influence, into a waterway that has a 100-year peak flow (Q100) of 25,000 cfs or more, or other receiving water that is not susceptible to hydromodification impacts.
d. Projects that discharge directly or via a storm drain into concrete or otherwise engineered (not natural) channels (e.g., channelized or armored with rip rap, shotcrete, etc.), which, in turn,
5 See Attachment J of the MS4 Permit, “Determination of Erosion Potential”

Minimum Control Measures Planning and Land Development Program
PLD-9
discharge into receiving water that is not susceptible to hydromodification impacts. e. LID BMPs implemented on single family homes are sufficient to comply with hydromodification
criteria. Hydromodification Control Criteria The Hydromodification Control Criteria to protect natural drainage systems are as follows:
a. Except for exemptions described above, projects disturbing an area greater than 1 acre but less than 50 acres within natural drainage systems will be presumed to meet pre-development hydrology if one of the following demonstrations is made:
i. The project is designed to retain on-site, through infiltration, evapotranspiration, and/or harvest and use, the stormwater volume from the runoff of the 95th percentile, 24-hour storm, or
ii. The runoff flow rate, volume, and velocity for the post-development condition do not exceed the pre-development condition for the 2-year, 24-hour rainfall event and the duration for the post-development condition is not less than the pre-development condition for the 2-year, 24-hour rainfall event. This condition may be substantiated by simple screening models, including those described in Hydromodification Effects on Flow Peaks and Durations in Southern California Urbanizing Watersheds (Hawley et al., 2011) or other models acceptable to the Executive Officer of the Regional Water Board, or
iii. The Erosion Potential (Ep) in the receiving water channel will approximate 1, as determined by a Hydromodification Analysis Study and the equation presented in Attachment J of the MS4 Permit. Alternatively, agencies can opt to use other work equations to calculate Erosion Potential with Executive Officer approval.
b. Projects disturbing 50 acres or more within natural drainage systems will be presumed to meet pre-development hydrology based on the successful demonstration of one of the following conditions:
i. The site infiltrates on-site at least the runoff from a 2-year, 24hour storm event, or ii. The runoff flow rate, volume, and velocity for the post-development condition does not
exceed the pre-development condition for the 2-year, 24-hour rainfall event and the duration for the post-development condition is not less than the pre-development condition for the 2-year, 24-hour rainfall event. These conditions must be substantiated by hydrologic modeling acceptable to the Regional Water Board Executive Officer, or
iii. The Erosion Potential (Ep) in the receiving water channel will approximate 1, as determined by a Hydromodification Analysis Study and the equation presented in Attachment J of the MS4 Permit.
The MS4 Permit states projects will meet
Hydromodification Control Criteria if
"The...duration for the post-development
condition do[es] not exceed the pre-
development condition for the 2-year, 24-hour
rainfall event." The runoff duration (Tc) is
generally associated with longer values resulting
in lower concern for hydromodification impacts.
Implementation of LID BMPs generally results in
runoff not immediately (or not at all) discharging
from the site, increasing the time of
concentration. Thus, the interpretation
presented herein is that Hydromodification
Control Criteria would be met if the runoff
duration for the post-development condition is
not less than the pre-development condition for
the 2-year, 24-hour rainfall event.
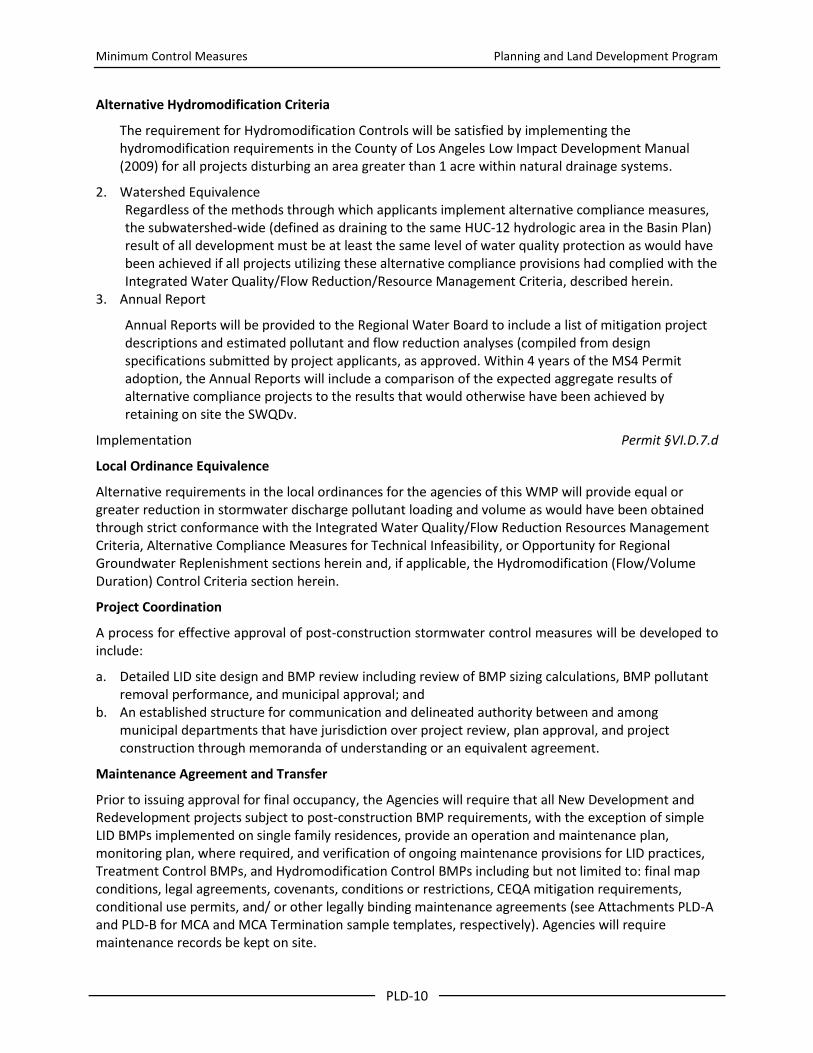
Minimum Control Measures Planning and Land Development Program
PLD-10
Alternative Hydromodification Criteria
The requirement for Hydromodification Controls will be satisfied by implementing the hydromodification requirements in the County of Los Angeles Low Impact Development Manual (2009) for all projects disturbing an area greater than 1 acre within natural drainage systems.
2. Watershed Equivalence Regardless of the methods through which applicants implement alternative compliance measures, the subwatershed-wide (defined as draining to the same HUC-12 hydrologic area in the Basin Plan) result of all development must be at least the same level of water quality protection as would have been achieved if all projects utilizing these alternative compliance provisions had complied with the Integrated Water Quality/Flow Reduction/Resource Management Criteria, described herein.
3. Annual Report
Annual Reports will be provided to the Regional Water Board to include a list of mitigation project descriptions and estimated pollutant and flow reduction analyses (compiled from design specifications submitted by project applicants, as approved. Within 4 years of the MS4 Permit adoption, the Annual Reports will include a comparison of the expected aggregate results of alternative compliance projects to the results that would otherwise have been achieved by retaining on site the SWQDv.
Implementation Permit §VI.D.7.d
Local Ordinance Equivalence
Alternative requirements in the local ordinances for the agencies of this WMP will provide equal or greater reduction in stormwater discharge pollutant loading and volume as would have been obtained through strict conformance with the Integrated Water Quality/Flow Reduction Resources Management Criteria, Alternative Compliance Measures for Technical Infeasibility, or Opportunity for Regional Groundwater Replenishment sections herein and, if applicable, the Hydromodification (Flow/Volume Duration) Control Criteria section herein.
Project Coordination
A process for effective approval of post-construction stormwater control measures will be developed to include:
a. Detailed LID site design and BMP review including review of BMP sizing calculations, BMP pollutant removal performance, and municipal approval; and
b. An established structure for communication and delineated authority between and among municipal departments that have jurisdiction over project review, plan approval, and project construction through memoranda of understanding or an equivalent agreement.
Maintenance Agreement and Transfer
Prior to issuing approval for final occupancy, the Agencies will require that all New Development and Redevelopment projects subject to post-construction BMP requirements, with the exception of simple LID BMPs implemented on single family residences, provide an operation and maintenance plan, monitoring plan, where required, and verification of ongoing maintenance provisions for LID practices, Treatment Control BMPs, and Hydromodification Control BMPs including but not limited to: final map conditions, legal agreements, covenants, conditions or restrictions, CEQA mitigation requirements, conditional use permits, and/ or other legally binding maintenance agreements (see Attachments PLD-A and PLD-B for MCA and MCA Termination sample templates, respectively). Agencies will require maintenance records be kept on site.

Minimum Control Measures Planning and Land Development Program
PLD-11
Verification at a minimum will include the developer's signed statement accepting responsibility for maintenance until the responsibility is legally transferred; and either: a. A signed statement from the public entity assuming responsibility for BMP maintenance; or b. Written conditions in the sales or lease agreement, which require the property owner or tenant to
assume responsibility for BMP maintenance and conduct a maintenance inspection at least once a year; or
c. Written text in project covenants, conditions, and restrictions (CCRs) for residential properties assigning BMP maintenance responsibilities to the Home Owners Association; or
d. Any other legally enforceable agreement or mechanism that assigns responsibility for the maintenance of BMPs.
All development projects subject to post-construction BMP requirements will provide a plan for the operation and maintenance of all structural and treatment controls. The plan will be submitted for examination of relevance to keeping the BMPs in proper working order. Where BMPs are transferred to agency for ownership and maintenance, the plan will also include all relevant costs for upkeep of BMPs in the transfer. Operation and Maintenance plans for private BMPs will be kept on-site for periodic review by agency inspectors. A tracking system and an inspection and enforcement program will be maintained for New Development and Redevelopment post-construction stormwater as shown in Table PLC-3. Enforcement action will be taken per the established Progressive Enforcement Policy as appropriate based on the results of the inspection. See Section for requirements for the development and implementation of a Progressive Enforcement Policy (Appendix A-3-1_PEP).
Table PLD-3: Tracking, Inspection, and Enforcement Program Components Program Description Components
GIS or other Electronic System
A GIS or other electronic system will be implemented for tracking projects that have been conditioned for post-construction BMPs.
Municipal Project ID State WDID No. Project Acreage BMP Type and Description BMP Location (coordinates) Date of Maintenance Agreement Date of Acceptance
Maintenance Records Inspection Date and
Summary Corrective Action Date Certificate of
Occupancy Issued Replacement or Repair Date
Inspections6
Inspect all development sites upon completion of construction and prior to the issuance of occupancy certificates.
Proper installation of: LID measures, Structural BMPs, Treatment control BMPs, and Hydromodification control BMPs.
Operation and Maintenance
7
Verify proper operation and maintenance of post-construction BMPs. Inspection at least once every 2 years after project completion.
Follow a Post-construction BMP Maintenance Inspection checklist (See Attachment PLD-C)
Assess operation and maintenance conditions relating to post-construction BMPs, including BMP repair, replacement, or re-vegetation.
6 The inspection may be combined with other inspections provided it is conducted by trained personnel.
7 For post-construction BMPs operated and maintained by parties other than the agency in which the BMP(s) is located, the
agency will require the other parties to document proper maintenance and operations.

Minimum Control Measures Planning and Land Development Program
PLD-12
Plan Certification
Each SUSMP/LID Plan should contain proper certifications. The following approach is suggested for SUSMP/LID Plan submittals:
Form signed by the property owner/applicant stating the category in which the project falls under to easily define the NPDES requirements (see Attachment PLD-D for Form PC sample template).
Form signed by the property owner/applicant certifying that the BMPs will be implemented, monitored, and maintained per SUSMP/LID Plan requirements (see Attachment PLD-E for Form P1 sample template).
Form signed and stamped by a California registered civil engineer stating the proposed structural BMPs and certifying the methods and requirements are in compliance with the MS4 Permit requirements (see Attachment PLD-F for Form P2 sample template).

ATTACHMENT PLD-A
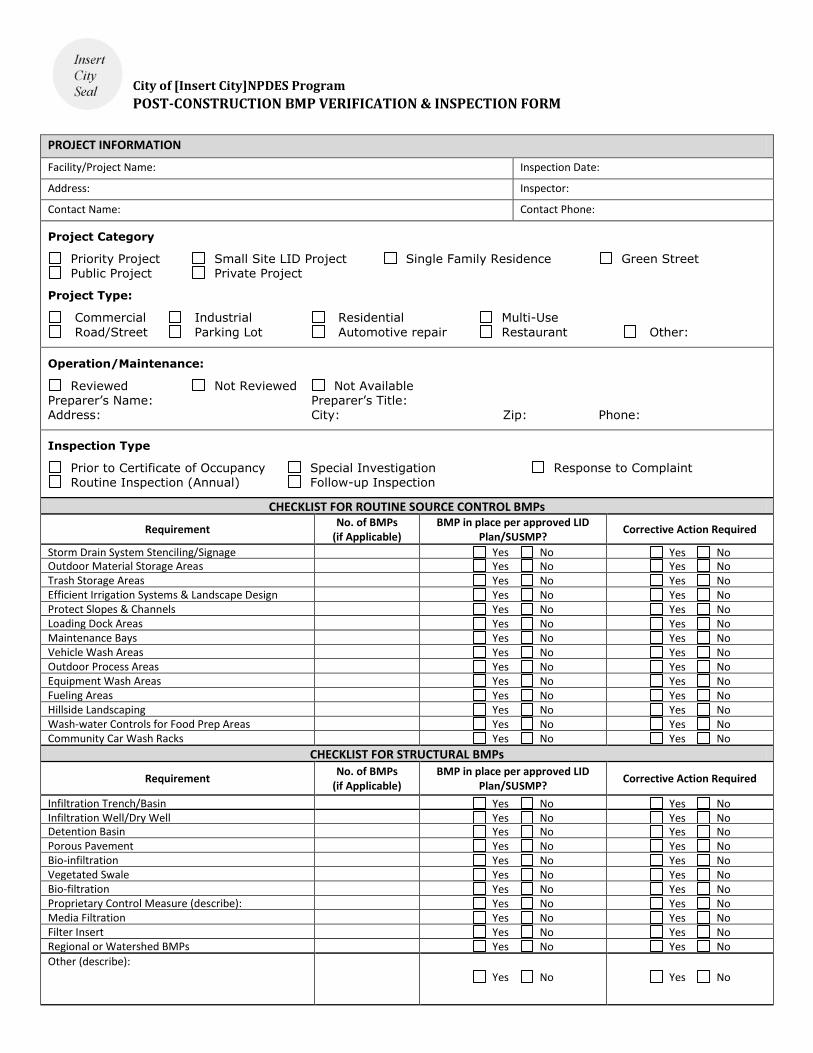
City of [Insert City]NPDES Program
POST-CONSTRUCTION BMP VERIFICATION & INSPECTION FORM
PROJECT INFORMATION
Facility/Project Name: Inspection Date:
Address: Inspector:
Contact Name: Contact Phone:
Project Category
Priority Project Small Site LID Project Single Family Residence Green Street Public Project Private Project
Project Type:
Commercial Industrial Residential Multi-Use
Road/Street Parking Lot Automotive repair Restaurant Other:
Operation/Maintenance:
Reviewed Not Reviewed Not Available Preparer’s Name: Preparer’s Title: Address: City: Zip: Phone:
Inspection Type
Prior to Certificate of Occupancy Special Investigation Response to Complaint Routine Inspection (Annual) Follow-up Inspection
CHECKLIST FOR ROUTINE SOURCE CONTROL BMPs
Requirement No. of BMPs
(if Applicable) BMP in place per approved LID
Plan/SUSMP? Corrective Action Required
Storm Drain System Stenciling/Signage Yes No Yes No Outdoor Material Storage Areas Yes No Yes No Trash Storage Areas Yes No Yes No Efficient Irrigation Systems & Landscape Design Yes No Yes No Protect Slopes & Channels Yes No Yes No Loading Dock Areas Yes No Yes No Maintenance Bays Yes No Yes No Vehicle Wash Areas Yes No Yes No Outdoor Process Areas Yes No Yes No Equipment Wash Areas Yes No Yes No Fueling Areas Yes No Yes No Hillside Landscaping Yes No Yes No Wash-water Controls for Food Prep Areas Yes No Yes No Community Car Wash Racks Yes No Yes No
CHECKLIST FOR STRUCTURAL BMPs
Requirement No. of BMPs
(if Applicable) BMP in place per approved LID
Plan/SUSMP? Corrective Action Required
Infiltration Trench/Basin Yes No Yes No
Infiltration Well/Dry Well Yes No Yes No Detention Basin Yes No Yes No
Porous Pavement Yes No Yes No
Bio-infiltration Yes No Yes No Vegetated Swale Yes No Yes No
Bio-filtration Yes No Yes No
Proprietary Control Measure (describe): Yes No Yes No
Media Filtration Yes No Yes No
Filter Insert Yes No Yes No
Regional or Watershed BMPs Yes No Yes No
Other (describe):
Yes No Yes No
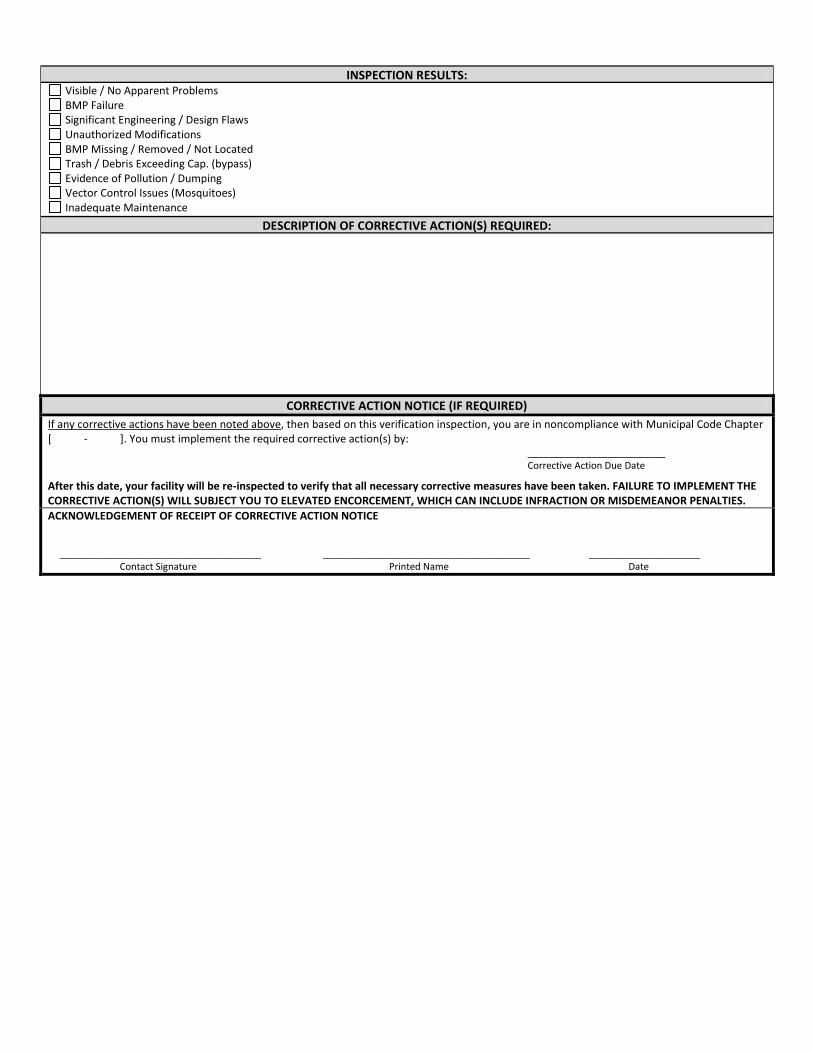
INSPECTION RESULTS: Visible / No Apparent Problems BMP Failure Significant Engineering / Design Flaws Unauthorized Modifications BMP Missing / Removed / Not Located Trash / Debris Exceeding Cap. (bypass) Evidence of Pollution / Dumping Vector Control Issues (Mosquitoes) Inadequate Maintenance
DESCRIPTION OF CORRECTIVE ACTION(S) REQUIRED:
CORRECTIVE ACTION NOTICE (IF REQUIRED)
If any corrective actions have been noted above, then based on this verification inspection, you are in noncompliance with Municipal Code Chapter [ - ]. You must implement the required corrective action(s) by: __________________________ Corrective Action Due Date
After this date, your facility will be re-inspected to verify that all necessary corrective measures have been taken. FAILURE TO IMPLEMENT THE CORRECTIVE ACTION(S) WILL SUBJECT YOU TO ELEVATED ENCORCEMENT, WHICH CAN INCLUDE INFRACTION OR MISDEMEANOR PENALTIES.
ACKNOWLEDGEMENT OF RECEIPT OF CORRECTIVE ACTION NOTICE
______________________________________ _______________________________________ _____________________ Contact Signature Printed Name Date

APPENDIX 3
BRAKE PAD COPPER REDUCTION MEMO (DRAFT)

tdc 4020 Bayview Avenue • San Mateo CA 94403 • (650) 627-8690
tdcenvironmental
DRAFT MEMO
TO: Richard Watson, Richard Watson & Associates, Inc. DATE: Jan. 3, 2013
FROM: Kelly D. Moran, Ph.D. PROJECT: 86 SUBJECT: Estimate of Urban Runoff Copper Reduction in Los Angeles County from
the Brake Pad Copper Reductions Mandated by SB 346 Summary This memorandum provides an estimate of urban runoff copper reductions from the brake pad copper reductions mandated by SB 346. The estimate is designed for urban runoff management planning purposes in Los Angeles County. The estimate relies on available information, which was largely developed through the lengthy collaboration among brake pad manufacturers, government agencies, and environmental groups in the Brake Pad Partnership (BPP). Since certain elements of the brake pad copper reduction schedule are unknown at this time due to the proprietary nature of product formulation and sales data, the estimates rely on a series of reasonable assumptions that were developed on the basis of available data. Three scenarios (see Table 1) were developed to span the reasonable range of industry product modification schedules.
Table 1. Copper Reduction Scenario Summary
Year* Scenario 1 - One Step Reduction
Scenario 2 - Two Step Reduction
Scenario 3 - Aftermarket Exemption from 0.5%
Copper
2014 <0.5% copper brake pads start appearing on new vehicles
<5% copper brake pads start appearing on new vehicles
<5% copper brake pads start appearing on new vehicles
2015 2016 2017
2018 <0.5% copper brake pads start appearing on new vehicles
<0.5% copper brake pads start appearing on new vehicles
2019 2020
2021 All new vehicle brake pads <0.5% copper
All new vehicle brake pads <5% copper
All new vehicle brake pads <5% copper
2022
2023 All replacement pads <0.5% copper
All replacement pads <5% copper
All replacement pads <5% copper
2024
2025 All new vehicle brake pads <0.5% copper
All new vehicle brake pads <0.5% copper
2026
2027 All replacement pads <0.5% copper
2028 *Key Los Angeles River Metals TMDL compliance dates are highlighted.

Brake Pad Copper Reduction – SB 346 Implementation Status DRAFT January 3, 2013 Page 2
For each scenario, quantitative estimates of urban runoff copper reductions were generated through spreadsheet calculations. The resulting estimates summarized in Table 2 are in the form of a percentage reduction in copper in urban runoff in years of interest for TMDL compliance in Los Angeles County (2020, 2024, and 2028) and in 2032.
Table 2. Estimated Urban Runoff Copper Reduction from Brake Pads Alone
Year Scenario 1 - One Step Reduction
Scenario 2 - Two Step Reduction
Scenario 3 - Aftermarket Exemption from 0.5%
Copper 2020 29% 17% 17% 2024 60% 45% 39% 2028 61% 60% 49% 2032 61% 61% 55%
The most significant uncertainties in these estimates are in brake pad copper reduction schedules, brake pad copper contents, and watershed response times (which are affected by watershed-specific characteristics and variation in annual rainfall volumes).
Background A simple action—vehicle drivers hitting the brakes—released about 600,000 kilograms (1.3 million pounds) of copper into California’s environment in 2010. Each time vehicle brakes engage, a tiny amount of fine dust wears off of the vehicle’s brake pads. When it rains, some of this dust washes into urban runoff. Scientific studies indicate that dust generated by vehicle brakes is by far the most significant source of copper in urban watersheds. In California’s most urbanized watersheds, brake pad copper is estimated to comprise more than 60% of all copper in urban runoff (Donigian 20091).
A California law enacted in 2010, SB 346 (Kehoe) set in place a program that will nearly eliminate copper use in brake pads. SB 346 requires that brake pads sold in California contain no more than 5% copper by weight by 2021, and no more than 0.5% by 2025. According to a representative industry analysis, as of 2006 brake pads contained an average of about 8% copper by weight (BPP 2008). The law also limits dangerous—but fortunately less common—brake pad pollutants, by prohibiting sale of brake pads containing more than trace amounts of lead, mercury, asbestos, cadmium, and hexavalent chromium in 2014. To avoid replacing one environmental problem with another, SB 346 requires manufacturers to examine new formulations carefully and to select alternatives that pose less potential hazard to public health and the environment. Consumer safety will be ensured through a limited deadline extension process for the 2025 0.5% copper requirement (available starting only when a manufacturer demonstrates that no alternative brake friction materials will be safe and available) and by provisions allowing continued sales of replacement brake pads for older vehicles. Starting in 2014, a brake pad copper content certification and labeling system established by SB 346 will provide for ready identification of brake pads with the lowest copper content. Following California’s model, the State of Washington also enacted restrictions on brake pad copper content in 2010 (Washington State 2010). Washington’s law provides slightly different exemptions than California’s law—notably a much narrower exemption for 1 See references list at the end of the memorandum.

Brake Pad Copper Reduction – SB 346 Implementation Status DRAFT January 3, 2013 Page 3
“aftermarket” brake pads that replace the “original equipment” brake pads sold with new vehicles. Washington law also has another important difference from California law—it requires manufacturers to provide Washington State Department of Ecology with periodic reports of brake pad copper, antimony, nickel, and zinc content, starting in 2013.
Due to the importance of California’s vehicle market and the interconnection of vehicle parts distribution systems throughout North America, brake pad manufacturers expect that it is unlikely that any manufacturer will produce California-specific or Washington-specific products (MEMA 2012a). Instead, copper reduction will be integrated throughout the entire North American brake pad market (MEMA 2012a). In the two years since SB 346 was enacted, the vehicle industry has actively engaged in implementing the law (Moran 2011). Compliance certification markings, box markings, and certified chemical analysis methods have been adopted (SAE 2011; SAE 2012; MEMA 2012b). Washington State has adopted regulations specifying testing, marking, and reporting requirements (Washington Department of Ecology 2012). Although quantitative information about brake pad copper reductions is not yet available, strong industry attention to low-copper and copper-free brake pads and promotion of these pads by companies already offering them (Honeywell undated; FDP Brake 2010-2012; Williams undated; Fastmagna.com 2010; Bendix 2012; Phoenix 2010; ALCO 2012; Wilson 2012; Crowe 2012; Aftermarket News 2012; Murphy 2012) provides evidence that implementation is underway and is proceeding in accordance with the process and time frames anticipated by the Brake Pad Partnership (BPP 1996-2012).
Summary of Available Information This section summarizes the available information that forms the basis for the brake copper reduction estimates. Brake Pad Copper Reduction Schedule. In 1999, the Brake Manufacturer’s Council committed to offer new low-copper brake pad materials to customers within 5 years of any BPP decision that brake pads are a major copper source (Lawrence 1999). This commitment was triggered by the BPP in late 2008. As discussed above, many manufacturers are currently offering low copper and copper-free brake pads to customers. The timelines in SB 346 and Washington state law provided eight years after the 2013 reformulation commitment for vehicle manufacturers to re-engineer all vehicle platforms to incorporate the new brake pad formulations (BPP 1996-2012). This timeframe was specifically selected to allow vehicle manufacturers to complete the required brake system re-engineering in conjunction with their regular re-engineering of vehicle platforms. Both laws provide for a second overlapping vehicle re-engineering cycle to reach the 2025 0.5% copper standard, which required technology that was not in sight when the laws were adopted in 2010 (but that is now commercially available as documented above). Brake Pad Copper Content. Through the BPP, brake pad manufacturers reported brake pad copper content annually from 1998-2006 for the highest sales volume new vehicles (BPP 2008). In 2006, original equipment brake pads contained an overall average of 8.2% copper by weight. This average represents a mixture of high-copper brake pads (10-20% copper) and brake pads with no intentionally added copper. In 2008, manufacturers collected formulation type data to estimate the fraction of the market

Brake Pad Copper Reduction – SB 346 Implementation Status DRAFT January 3, 2013 Page 4
comprised of no-copper brake pads (Phipps 2008). Because the BPP reporting covered only original equipment brake pads (those sold on new vehicles), the BPP developed a separate estimate of the copper content in aftermarket (replacement) brake pads (Rosselot 2009). Until Washington State’s reporting begins, BPP data are the best available information about brake pad copper content. Brake Pad Replacement Frequency. Brake pad material wears off gradually over the course of the lifetime of the pad. To support the work of the BPP, manufacturers shared propriety market survey data characterizing the replacement frequencies of original equipment and aftermarket brake pads (BPP 1996-2012; AAIA 2008). These data showed that on average, original equipment brake pads are replaced when a vehicle is 3-4 years old. Because older vehicles are driven fewer miles per year (FHWA 2009; Santos 2011), their aftermarket brake pads are only replaced at a rate of about 21% per year (AAIA 2008). Vehicle Fleet Characterization. The California Department of Finance periodically publishes summaries of vehicle registration data (DOF 2009). These summaries provide vehicle age distributions and the fraction of vehicle registrations by type (light-duty, heavy-duty, motorcycle, trailer). In addition to these data, information from the Southern California Association of Governments’ transportation monitoring and information system (SCAG 2012) and the BPP (BPP 1996-2012 and Rosselot 2010) provide the basis for assuming that neglecting contributions from vehicles other than light-duty vehicles will not introduce significant error in the copper reduction estimate.
Copper in Urban Runoff. The Brake Pad Partnership (BPP) completed peer-reviewed scientific studies to characterize brake pad emissions (BMC PEC 2006; Haselden 2004; Schlautman 2006), examine all environmental copper sources (Rosselot 2006a; Rosselot 2006b), and develop quantitative estimates of the brake pad copper contribution to total stormwater copper loads using linked air and watershed models (Pun 2006a; Pun 2006b; Donigian 2007; Donigian 2009).
The BPP’s “Upper Colma” modeling watershed is most similar to watersheds in Los Angeles region because of its combination of high urbanization, high traffic levels, and location surrounded by other urban areas. In this watershed, brake pad copper was estimated to comprise 58-66% of total anthropogenic copper.
BPP modeling estimated watershed response time to brake pad copper reductions (Donigian 2009). For the Los Angeles region, watershed response time is assumed to be similar to the BPP’s estimates for highly urbanized watersheds with concrete lined channels. In the most highly impervious watersheds, watershed response time is relatively quick, with >70% copper reductions estimated the first year after a change in brake pad reformulation and nearly 90% reduction in 5 years. Concrete channels were found to further reduce these watershed response time. Computational Assumptions The copper reduction estimates rely on a series of reasonable assumptions that were developed on the basis of available data. These assumptions are detailed in Table 3.

Brake Pad Copper Reduction – SB 346 Implementation Status DRAFT January 3, 2013 Page 5
Table 3. Assumptions Used in Development of Copper Reduction Estimates
Assumption Basis References Brake Pad Copper Reduction Schedule Assumptions – Original Equipment Brake Pads By January 1, 2021, all original equipment brake pads will contain less than 5% copper. By January 1, 2025, all original equipment brake pads will contain less than 0.5% copper
Requirements of SB 346 SB 346
Extension requests for 0.5% copper requirement will be relatively limited.
Difficulty of extension process and short time frame for each extension, long time frame for development of alternatives, industry press and informal communications indicating that alternatives are becoming available.
SB 346; BPP 1996-2012; Honeywell undated; FDP Brake 2010-2012; Williams undated; Fastmagna.com 2010; Bendix 2012; Phoenix 2010; ALCO 2012; Wilson 2012; Crowe 2012; Aftermarket News 2012
Lower copper brake pads will be phased in on new vehicles at a constant rate over an 8-year period prior to each compliance deadline.
Estimates from brake pad and vehicle manufacturers, who have consistently explained that they plan to introduce new brake pads when completing the cyclical re-engineering of vehicle platforms. Recent industry press and brake pad manufacturer announcements have been consistent with the statements made during development of legislation.
MEMA 2010; BPP 1996-2012; Honeywell undated; FDP Brake 2010-2012; Williams undated; Fastmagna.com 2010; Bendix 2012; Phoenix 2010; ALCO 2012; Wilson 2012; Crowe 2012; Aftermarket News 2012; Murphy 2012
Washington State will require new vehicle brake pads to contain less than 0.5% copper by January 1, 2025 (same schedule as California).
Washington State law establishes the same compliance date as California law for brake pads less than 5% copper, but does not establish a firm date for requiring brake pads less than 0.5% copper. Washington must conduct a review to set the compliance date. Washington’s review will start in 2015. When the review is complete, manufacturers will have 8 years to comply. Washington’s review process and decision will take 1-2 years, setting up timing for implementation on 1/1/25. To establish the compliance date, Washington must find that <0.5% copper pads are available. Market information indicates this may already be true. Formulation data that must be reported to Washington in 2013 is likely to provide a scientific basis for Washington’s decision. The industry and the two states have worked to harmonize the implementation of the California and Washington laws.
Washington State 2010; Moran 2011; ; Honeywell undated; FDP Brake 2010-2012; Williams undated; Fastmagna.com 2010; Bendix 2012; Phoenix 2010; ALCO 2012; Wilson 2012; Crowe 2012; Aftermarket News 2012; Murphy 2012
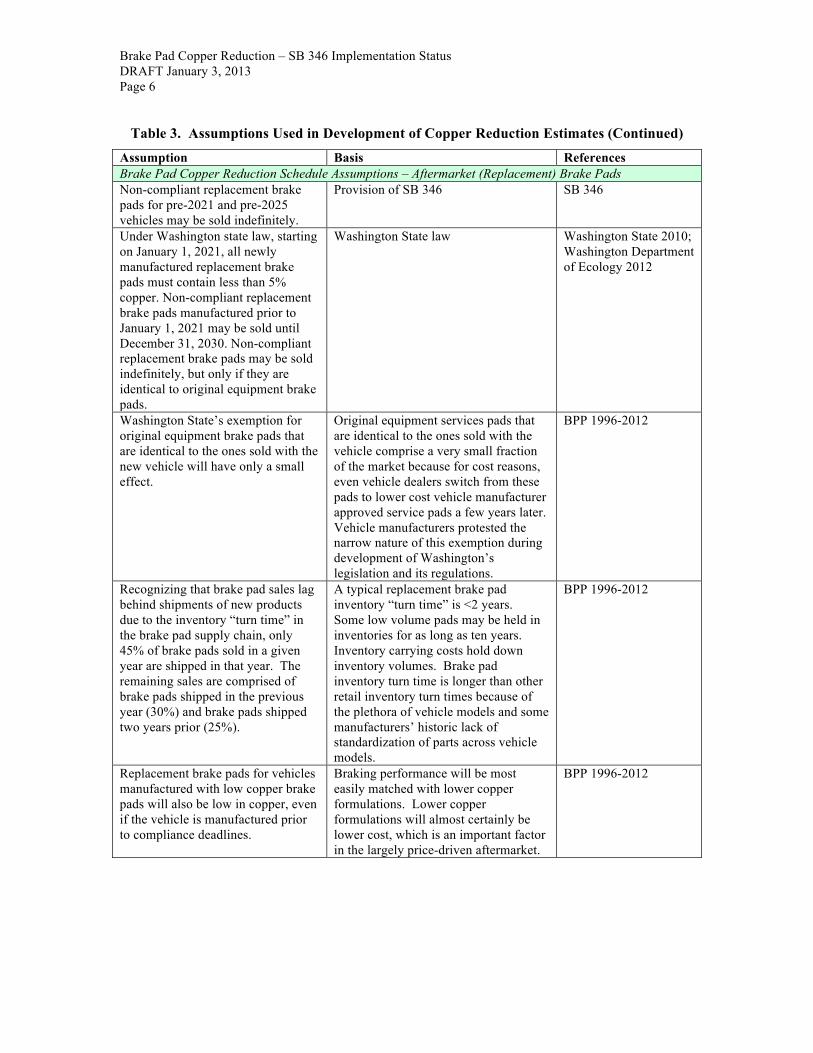
Brake Pad Copper Reduction – SB 346 Implementation Status DRAFT January 3, 2013 Page 6
Table 3. Assumptions Used in Development of Copper Reduction Estimates (Continued)
Assumption Basis References Brake Pad Copper Reduction Schedule Assumptions – Aftermarket (Replacement) Brake Pads Non-compliant replacement brake pads for pre-2021 and pre-2025 vehicles may be sold indefinitely.
Provision of SB 346 SB 346
Under Washington state law, starting on January 1, 2021, all newly manufactured replacement brake pads must contain less than 5% copper. Non-compliant replacement brake pads manufactured prior to January 1, 2021 may be sold until December 31, 2030. Non-compliant replacement brake pads may be sold indefinitely, but only if they are identical to original equipment brake pads.
Washington State law Washington State 2010; Washington Department of Ecology 2012
Washington State’s exemption for original equipment brake pads that are identical to the ones sold with the new vehicle will have only a small effect.
Original equipment services pads that are identical to the ones sold with the vehicle comprise a very small fraction of the market because for cost reasons, even vehicle dealers switch from these pads to lower cost vehicle manufacturer approved service pads a few years later. Vehicle manufacturers protested the narrow nature of this exemption during development of Washington’s legislation and its regulations.
BPP 1996-2012
Recognizing that brake pad sales lag behind shipments of new products due to the inventory “turn time” in the brake pad supply chain, only 45% of brake pads sold in a given year are shipped in that year. The remaining sales are comprised of brake pads shipped in the previous year (30%) and brake pads shipped two years prior (25%).
A typical replacement brake pad inventory “turn time” is <2 years. Some low volume pads may be held in inventories for as long as ten years. Inventory carrying costs hold down inventory volumes. Brake pad inventory turn time is longer than other retail inventory turn times because of the plethora of vehicle models and some manufacturers’ historic lack of standardization of parts across vehicle models.
BPP 1996-2012
Replacement brake pads for vehicles manufactured with low copper brake pads will also be low in copper, even if the vehicle is manufactured prior to compliance deadlines.
Braking performance will be most easily matched with lower copper formulations. Lower copper formulations will almost certainly be lower cost, which is an important factor in the largely price-driven aftermarket.
BPP 1996-2012

Brake Pad Copper Reduction – SB 346 Implementation Status DRAFT January 3, 2013 Page 7
Table 3. Assumptions Used in Development of Copper Reduction Estimates (Continued)
Assumption Basis References Replacement brake pads containing lower levels copper that are designed for vehicles manufactured with high copper brake pads will phase in at a constant rate starting in 2014. The end of the phase in period will be determined by Washington’s compliance deadlines.
Since safety standard apply to new vehicles—and not to brake pads—there is no specific regulatory constraint on aftermarket brake pad formulations. Drivers for the aftermarket include cost, safety, and customer acceptance. Since copper is an expensive ingredient, cost considerations point toward early reformulation. Aftermarket manufacturers have a history of making products available to fit new vehicles within a few months of the vehicle’s initial manufacture, suggesting that they will make products available on a schedule that phases in over the same general time period as the phase in for original equipment brake pads. Press releases and industry websites indicate that brake pads containing <5% copper and brake pads containing less than 0.5% are both already available. Manufacturers may be less motivated to introduce new products for old vehicles, which present the need to design pads with characteristics similar to those provided by high copper brake pads.
BPP 1996-2012; Honeywell undated; FDP Brake 2010-2012; Williams undated; Fastmagna.com 2010; Bendix 2012; Phoenix 2010; ALCO 2012; Wilson 2012; Crowe 2012; Aftermarket News 2012; Murphy 2012
Brake Pad Copper Content Assumptions 82% of Original Equipment brake pads contain copper; these pads contain 10-20% copper by weight. 18% of Original Equipment brake pads are semi-metallic, containing <0.5% copper. These pads contain a low level of copper (0.1%) due to the presence of traces of copper in other ingredients.
Analysis of brake pad formulation data collected in Brake Manufacturers’ Council annual surveys and BPP Steering Committee discussions of brake pad copper content by formulation type.
MEMA 2010; Phipps 2008; BPP 1996-2012
Original equipment brake pads currently contain an overall average of 8.2% copper by weight
Brake pad copper content data collected in Brake Manufacturers’ Council annual surveys for the BPP. Although this is the best available data set, the survey was not designed for use in loading estimates. The most recent survey was in 2006. Newer data are currently unavailable.
BPP 2008
Brake pads meeting the <5% copper requirement will contain an average of 4% copper by weight. Brake pads meeting the <0.5% copper requirement will contain an average of 0.1% copper by weight.
Due to variation in materials input and manufacturing processes for brake pads (which are heterogeneous materials), to ensure compliance, products will need to be designed with copper content well below compliance levels. Since copper does not serve a useful design purpose below 1% concentrations, brake pads containing less than 0.5% copper will only contain trace copper introduced via impurities in other ingredients (e.g., recycled metals).
BPP 1996-2012
Aftermarket brake pads currently contain an overall average of 5% copper by weight.
Estimate made for the Brake Pad Partnership based on the very limited available data on aftermarket brake pads. Copper content is lower due to the high cost of copper as an ingredient and the cost sensitivity of the aftermarket.
Rosselot 2009
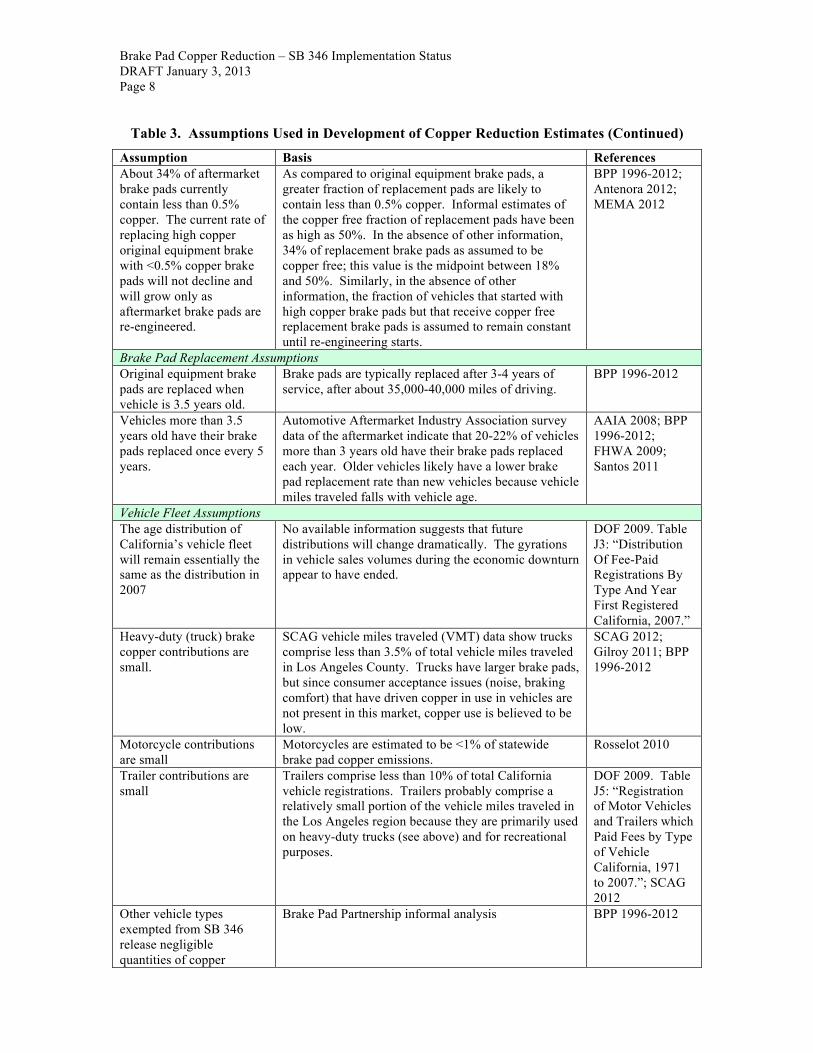
Brake Pad Copper Reduction – SB 346 Implementation Status DRAFT January 3, 2013 Page 8
Table 3. Assumptions Used in Development of Copper Reduction Estimates (Continued)
Assumption Basis References About 34% of aftermarket brake pads currently contain less than 0.5% copper. The current rate of replacing high copper original equipment brake with <0.5% copper brake pads will not decline and will grow only as aftermarket brake pads are re-engineered.
As compared to original equipment brake pads, a greater fraction of replacement pads are likely to contain less than 0.5% copper. Informal estimates of the copper free fraction of replacement pads have been as high as 50%. In the absence of other information, 34% of replacement brake pads as assumed to be copper free; this value is the midpoint between 18% and 50%. Similarly, in the absence of other information, the fraction of vehicles that started with high copper brake pads but that receive copper free replacement brake pads is assumed to remain constant until re-engineering starts.
BPP 1996-2012; Antenora 2012; MEMA 2012
Brake Pad Replacement Assumptions Original equipment brake pads are replaced when vehicle is 3.5 years old.
Brake pads are typically replaced after 3-4 years of service, after about 35,000-40,000 miles of driving.
BPP 1996-2012
Vehicles more than 3.5 years old have their brake pads replaced once every 5 years.
Automotive Aftermarket Industry Association survey data of the aftermarket indicate that 20-22% of vehicles more than 3 years old have their brake pads replaced each year. Older vehicles likely have a lower brake pad replacement rate than new vehicles because vehicle miles traveled falls with vehicle age.
AAIA 2008; BPP 1996-2012; FHWA 2009; Santos 2011
Vehicle Fleet Assumptions The age distribution of California’s vehicle fleet will remain essentially the same as the distribution in 2007
No available information suggests that future distributions will change dramatically. The gyrations in vehicle sales volumes during the economic downturn appear to have ended.
DOF 2009. Table J3: “Distribution Of Fee-Paid Registrations By Type And Year First Registered California, 2007.”
Heavy-duty (truck) brake copper contributions are small.
SCAG vehicle miles traveled (VMT) data show trucks comprise less than 3.5% of total vehicle miles traveled in Los Angeles County. Trucks have larger brake pads, but since consumer acceptance issues (noise, braking comfort) that have driven copper in use in vehicles are not present in this market, copper use is believed to be low.
SCAG 2012; Gilroy 2011; BPP 1996-2012
Motorcycle contributions are small
Motorcycles are estimated to be <1% of statewide brake pad copper emissions.
Rosselot 2010
Trailer contributions are small
Trailers comprise less than 10% of total California vehicle registrations. Trailers probably comprise a relatively small portion of the vehicle miles traveled in the Los Angeles region because they are primarily used on heavy-duty trucks (see above) and for recreational purposes.
DOF 2009. Table J5: “Registration of Motor Vehicles and Trailers which Paid Fees by Type of Vehicle California, 1971 to 2007.”; SCAG 2012
Other vehicle types exempted from SB 346 release negligible quantities of copper
Brake Pad Partnership informal analysis BPP 1996-2012

Brake Pad Copper Reduction – SB 346 Implementation Status DRAFT January 3, 2013 Page 9
Table 3. Assumptions Used in Development of Copper Reduction Estimates (Continued)
Assumption Basis References Vehicle Miles Traveled (VMT) Assumptions Brake pad wear is proportional to VMT
Information provided by brake pad manufacturers to the Brake Pad Partnership.
Phipps 2006
VMT will not change significantly in coming years.
SCAG data showing VMT was basically flat from 2002 through 2009. Increasing gasoline prices and legislation, regulation, and planning activities to reduce VMT because of climate change should stabilize—and may actually reduce—future VMT.
SCAG 2012
The relative fraction of vehicle miles traveled on highways (as compared to city streets) will not change significantly in coming years.
Brake Pad manufacturer data show that brake pad wear rates on city streets are 5-10 times greater than emissions on highways, due to lower use of brake pads per mile traveled on highways. As long as the relative proportion of vehicle miles traveled on theses two types of road does not change, this does not affect load estimates.
Phipps 2006
Urban Runoff Assumptions Urban Runoff Copper Fraction = 62%
In the most highly urbanized watersheds, brake pad copper comprises 58-66% of total anthropogenic copper.
Donigian 2009
Watershed response time in Los Angeles County = 1 year
In the most highly impervious San Francisco Bay area watersheds without concrete channels, watershed response time is relatively quick, with >70% copper reductions estimated the first year after brake pad reformulation and nearly 90% reduction in 5 years. Modeling suggests that channelized watersheds experience a slightly quicker wash out period than the natural channels modeled in the San Francisco Bay area. Weather introduces uncertainty into predicted copper reduction schedules. Wet weather and large storms mobilize copper in watersheds, increasing the speed of copper reductions. Dry years reduce the washout, increasing the length of time that it takes for brake pad copper reductions to be fully reflected in waterways. Modelers found that dry water year scenarios slightly increased washout time, by at most a few years.
Donigian 2009

Brake Pad Copper Reduction – SB 346 Implementation Status DRAFT January 3, 2013 Page 10
Brake Pad Copper Reduction Scenarios The following three scenarios were developed on the basis of available information to bracket the range of potential rates of brake pad copper reduction. Each scenario is based on a different potential pathway for the market transition to the brake pads containing less than 0.5% copper. Scenario 1 (One-Step Reduction) – Virtually all original equipment (new vehicle) and aftermarket (replacement) brake pads are reformulated to <0.5% copper by January 1, 2021 (first SB 346 copper compliance deadline). Virtually all aftermarket brake pads containing higher copper levels that remain in distributor and retailer inventories are sold within two years of this date. Brake pad, brake systems, and new vehicle manufacturers would greatly reduce their engineering costs for the transition to low copper brake pads if they can move directly to brake pads with less than 0.5% copper. This scenario describes the copper reductions that would occur if brake pad manufacturers complete product reformulation in a single cycle, thus avoiding two rounds of re-engineering of their products and their manufacturing processes. The primary basis for this scenario is the assumption that all manufacturers can quickly develop products containing less than 0.5% copper that meet all manufacturing, cost, and customer requirements. Although available information about product formulation changes is currently limited, there is some evidence suggesting that this scenario may occur. The original equipment brake pad industry appears to be attempting to move directly to the lowest copper brake pads (Moran 2011). At least three major vehicle manufacturers have requested that suppliers provide brake pads with less than 0.5% copper for their new vehicle models (Murphy 2012). Press releases and communications with industry members indicate that companies are currently bringing to market brake pads with less than 0.5% copper that are designed to replicate the braking performance properties of higher copper formulations. These new brake pads will be appearing in some 2014 vehicle models (BPP 1996-2012; Murphy 2012). For aftermarket brake pads, this scenario assumes that Washington State requirements will drive the market transition. Unlike California law, Washington law has very narrow exemptions for aftermarket brake pads (Washington State 2010). Due to the complexity of brake pad distribution chains, if higher copper brake pads enter national distribution systems after Washington’s compliance deadlines, manufacturers and retailers will have trouble avoiding non-compliance with Washington requirements (BPP 2008-2010). Consequently, brake manufacturers have stated their intent to implement brake pad copper reductions nationally (MEMA 2012a). The primary exemption for aftermarket brake pads under Washington law is an allowance for “inventory runoff” of brake pads manufactured prior to the compliance deadline (Washington State 2010). To ensure compliance, brake pad manufacture date must be marked on pads; this date marking is part of the nationwide brake pad compliance marking system (SAE 2012). Typical replacement brake pad inventory turnover time is less than two years (Brake Pad Partnership 1996-2012). Thus, after two years, most brake pads more than two years old have been sold.

Brake Pad Copper Reduction – SB 346 Implementation Status DRAFT January 3, 2013 Page 11
Another consideration for the aftermarket is that copper is far more expensive than other brake pad ingredients (BPP 1996-2012). Since price is the primary customer interest in the aftermarket, manufacturers have a financial incentive to eliminate copper in aftermarket brake pads.
This scenario also may avoid the need for purchase of special chemical analysis equipment for manufacturers to monitor products for compliance with the 5% copper standard. In brake pad materials (friction materials), copper concentration measurements around 5% copper pose unique chemical analysis challenges that do not occur at the 0.5% level (Brake Pad Partnership 1996-2012). Developing manufacturing process controls for this copper concentration would cause manufacturers to incur one-time costs that have only short-term benefits. The primary shortcomings of this scenario are:
(1) Some manufacturers may not successfully develop brake pads containing less than 0.5% copper that meet all manufacturing, cost, and customer requirements soon enough to transition all of their products by the above dates.
(2) Some manufacturers may delay transitions until legal deadlines. (3) Washington State may provide broader exemptions when it implements its
requirement for brake pads to contain less than 0.5% copper, delaying the aftermarket transition to the lowest copper brake pads.
This scenario is optimistic. It is included to show the earliest reasonable dates for achievement of brake copper reductions.
Scenario 2 (Two-Step Reduction) – Virtually all original equipment (new vehicle) brake pads are reformulated to <5% copper by January 1, 2021 and <0.5% copper by 2025 (SB 346 compliance deadlines), with minimal use of exemptions and extensions. Virtually all higher copper aftermarket (replacement) brake pads remaining in inventories are sold within two years of each compliance date. This scenario assumes that brake pad manufacturers will implement a two-step transition to the lowest copper brake pads, based on legal deadlines. Under this scenario, in the first step manufacturers would replace current high copper products with products containing less than 5% copper. Manufacturers would delay introduction of products with less than 0.5% copper for several years, which would provide additional time for development of formulations containing less than 0.5% copper. The 5% standard is included in California and Washington laws because when the laws were adopted, brake pad manufacturers indicated that most companies were capable of producing brake pads meeting the 5% standard (BPP 2008-2010). The long transition time provided in the laws before all new vehicles are required to meet the 5% standard was to provide adequate time for re-engineering of the braking systems of every new vehicle that currently uses higher copper brake pads (MEMA 2010). When the laws were passed, manufacturers indicated that companies would need to develop new formulation approaches to formulate brake pads with less than 0.5% copper while meeting all manufacturing, cost, and customer requirements. SB 346 provided an
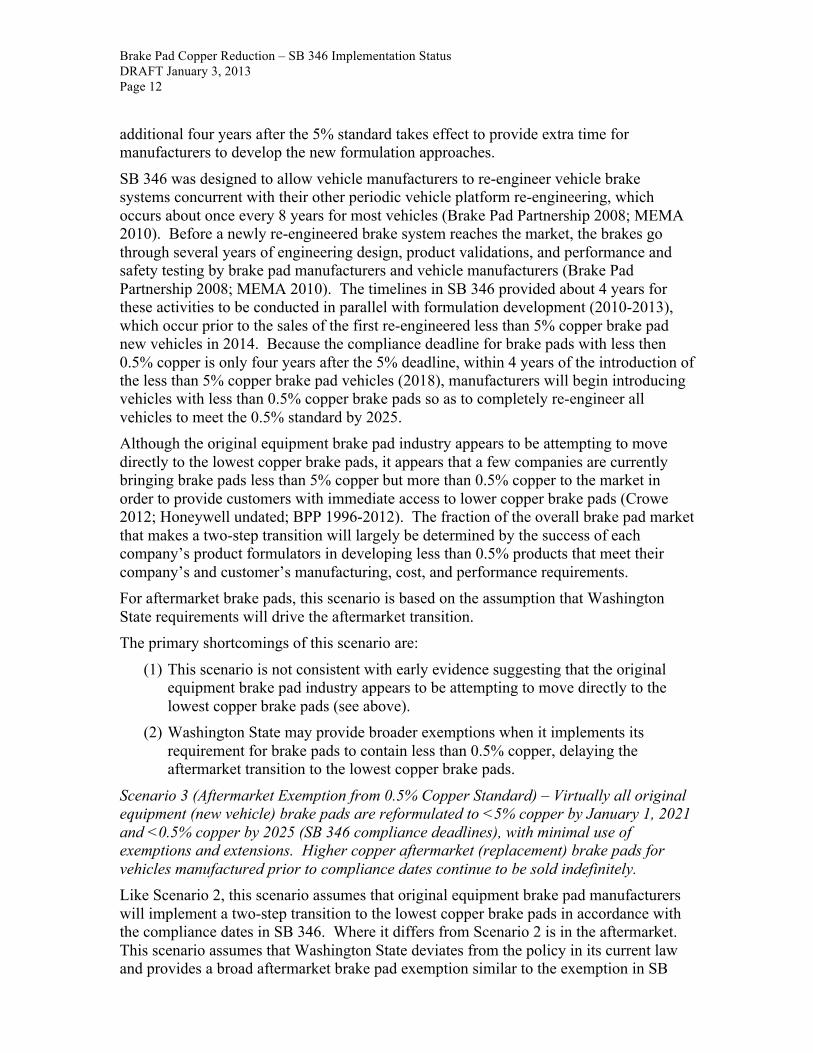
Brake Pad Copper Reduction – SB 346 Implementation Status DRAFT January 3, 2013 Page 12
additional four years after the 5% standard takes effect to provide extra time for manufacturers to develop the new formulation approaches.
SB 346 was designed to allow vehicle manufacturers to re-engineer vehicle brake systems concurrent with their other periodic vehicle platform re-engineering, which occurs about once every 8 years for most vehicles (Brake Pad Partnership 2008; MEMA 2010). Before a newly re-engineered brake system reaches the market, the brakes go through several years of engineering design, product validations, and performance and safety testing by brake pad manufacturers and vehicle manufacturers (Brake Pad Partnership 2008; MEMA 2010). The timelines in SB 346 provided about 4 years for these activities to be conducted in parallel with formulation development (2010-2013), which occur prior to the sales of the first re-engineered less than 5% copper brake pad new vehicles in 2014. Because the compliance deadline for brake pads with less then 0.5% copper is only four years after the 5% deadline, within 4 years of the introduction of the less than 5% copper brake pad vehicles (2018), manufacturers will begin introducing vehicles with less than 0.5% copper brake pads so as to completely re-engineer all vehicles to meet the 0.5% standard by 2025. Although the original equipment brake pad industry appears to be attempting to move directly to the lowest copper brake pads, it appears that a few companies are currently bringing brake pads less than 5% copper but more than 0.5% copper to the market in order to provide customers with immediate access to lower copper brake pads (Crowe 2012; Honeywell undated; BPP 1996-2012). The fraction of the overall brake pad market that makes a two-step transition will largely be determined by the success of each company’s product formulators in developing less than 0.5% products that meet their company’s and customer’s manufacturing, cost, and performance requirements. For aftermarket brake pads, this scenario is based on the assumption that Washington State requirements will drive the aftermarket transition. The primary shortcomings of this scenario are:
(1) This scenario is not consistent with early evidence suggesting that the original equipment brake pad industry appears to be attempting to move directly to the lowest copper brake pads (see above).
(2) Washington State may provide broader exemptions when it implements its requirement for brake pads to contain less than 0.5% copper, delaying the aftermarket transition to the lowest copper brake pads.
Scenario 3 (Aftermarket Exemption from 0.5% Copper Standard) – Virtually all original equipment (new vehicle) brake pads are reformulated to <5% copper by January 1, 2021 and <0.5% copper by 2025 (SB 346 compliance deadlines), with minimal use of exemptions and extensions. Higher copper aftermarket (replacement) brake pads for vehicles manufactured prior to compliance dates continue to be sold indefinitely. Like Scenario 2, this scenario assumes that original equipment brake pad manufacturers will implement a two-step transition to the lowest copper brake pads in accordance with the compliance dates in SB 346. Where it differs from Scenario 2 is in the aftermarket. This scenario assumes that Washington State deviates from the policy in its current law and provides a broad aftermarket brake pad exemption similar to the exemption in SB

Brake Pad Copper Reduction – SB 346 Implementation Status DRAFT January 3, 2013 Page 13
346 when it implements its requirement for brake pads to contain less than 0.5% copper. The exemption in SB 346 is a permanent exemption for all aftermarket brake pads designed to fit vehicles manufactured prior to California’s compliance deadlines in 2021 and 2025. Such an exemption would delay the aftermarket transition to the lowest copper brake pads by allowing high copper replacement brake pads to be sold for vehicles manufactured prior to compliance deadlines.
Under this scenario, aftermarket brake pad manufacturers would maintain the current copper content in their brake pads that are made for use in vehicles manufactured prior to 2021 and 2025. This would avoid the need for manufacturers to develop lower copper brake pads that meet the same performance characteristics as the higher copper brake pads. Since this exemption is based on the premise that aftermarket brake pads should be designed to be similar to the original equipment brake pads, this scenario assumes that aftermarket brake pads for vehicles that originally have low copper or copper free brake pads will have the same copper content as the originals.
The primary shortcomings of this scenario are: (1) This scenario is not consistent with early evidence suggesting that the original
equipment brake pad industry appears to be attempting to move directly to the lowest copper brake pads (see above).
(2) When establishing regulatory requirements, states ordinarily rely on the precedents established in their state’s own authorizing legislation.
Results Using the assumptions in Table 3, copper reductions were estimated for three scenarios. An attached Excel spreadsheet contains the calculations. The results are presented in Tables 4, 5, and 6. The tables present the estimated average on-road brake pad copper content, the estimated reduction as compared to current (baseline) levels, and the estimated subsequent reduction in copper levels in urban runoff. To account for the watershed lag time, the urban runoff copper reductions are estimated to occur one year after the brake pad copper reductions.
Although every effort was made to develop scenarios that bracket the range of possible copper reduction schedules and to base reduction estimates on reasonable assumptions, these estimates may not account for all possibilities. For example, if high copper brake pads continue to be used in the small populations of exempted vehicles (e.g., motorcycles), the ultimate reduction levels could be slightly less than the anticipated maximum reduction of 61%. In the relatively unlikely event that DTSC allows substantial extensions, the pace of reductions could be slower than estimated in any of the scenarios.
Although these estimates are based on the best available information, they are uncertain. The most significant uncertainties are in brake pad copper reduction schedules, brake pad copper contents, and watershed response times (which are affected by watershed-specific characteristics and variation in annual rainfall volumes). As the brake pad reformulation process unfolds, data will become available from Washington State and brake pad certification organizations that can reduce most of these uncertainties.

Brake Pad Copper Reduction – SB 346 Implementation Status DRAFT January 3, 2013 Page 14
Table 4. Scenario 1 - Estimated Urban Runoff Copper Reduction from Brake Pads
Year*
Scenario 1 - One Step Reduction
On-Road Average Brake
Pad Copper
Estimated Brake Pad Copper Reduction
Estimated Urban Runoff Copper
Reduction from Brake Pads Alone
Baseline (2013 and prior years) 6.1% --
2019 3.2% 47% 2020 29% 2023 0.2% 97% 2024 59% 2027 0.1% 98% 2028 61% 2031 0.1% 98% 2032 61%
*Key Los Angeles River Metals TMDL compliance dates are highlighted.
Table 5. Scenario 2 - Estimated Urban Runoff Copper Reduction from Brake Pads
Year*
Scenario 2 - Two Step Reduction
On-Road Average Brake
Pad Copper
Estimated Brake Pad Copper Reduction
Estimated Urban Runoff Copper
Reduction from Brake Pads Alone
Baseline (2013 and prior years) 6.1% --
2019 4.4% 28% 2020 17% 2023 1.6% 73% 2024 45% 2027 0.2% 96% 2028 60% 2031 0.1% 98% 2032 61%
*Key Los Angeles River Metals TMDL compliance dates are highlighted.

Brake Pad Copper Reduction – SB 346 Implementation Status DRAFT January 3, 2013 Page 15
Table 6. Scenario 3 - Estimated Urban Runoff Copper Reduction from Brake Pads
Year*
Scenario 3 - Aftermarket Exemption from 0.5% Copper On-Road Average
Brake Pad Copper
Estimated Brake Pad Copper Reduction
Estimated Urban Runoff Copper Reduction from
Brake Pads Alone Baseline (2013 and
prior years) 6.1% -- 2019 4.4% 28% 2020 17% 2023 2.3% 63% 2024 39% 2027 1.2% 80% 2028 49% 2031 0.7% 88% 2032 55%
*Key Los Angeles River Metals TMDL compliance dates are highlighted.
Recommendations
1. When data from implementation of SB 346 and Washington State law become available, consider updating these copper reduction estimates. Washington State’s collection of brake pad formulation data every 3 years starting in 2013 and certification agency records, which will be available by 2014, will provide the first data on brake pad copper content since 2006. Starting in 2014, certification agencies will make available lists of brake pads certifications. These lists can be used to determine the fraction of brake pads that are on the market that meet the 5% and 0.5% copper standards. This information can be used not only to update the estimates, but also to refine the assumptions to reduce some of the most important uncertainties in the copper reduction estimates.
2. To reduce peak copper levels, examine the potential for controlling localized high-copper discharges. Copper levels in urban runoff are a combination of baseline copper sources (largely brake pads), localized high-copper sources (e.g., copper roofs, copper-emitting industry), and irregular discharges of copper-containing wastewaters. While copper roofs are relatively uncommon, they have relatively high copper runoff concentrations (which may exceed 1,000 micrograms per liter) (TDC Environmental 2004). Event-based discharges may also contain high copper, particularly in dry weather. Examples of dry weather event-based discharges are: water from emptying pools, spas, and fountains (copper from copper pipe corrosion and algaecides) and improper discharge of solutions used to create a green patina on a copper roof (TDC Environmental 2004; LWA 2006). San Francisco Bay Area municipalities created resources for development of possible management strategies for other major copper sources (LWA 2006). These resources identify a specific set of potential control measures for each major copper source, define activity and effectiveness metrics for control measure implementation, and lay out a recommended sequence for implementation of

Brake Pad Copper Reduction – SB 346 Implementation Status DRAFT January 3, 2013 Page 16
control measures for each source category. The strategies for architectural copper (Section 2) and pool, spa, and fountain algaecides (Section 3, strategies CP-1 through CP-3) are of greatest potential interest for Los Angeles River Copper TMDL compliance. To facilitate effective implementation, each strategy involves a phased implementation process, starting with collecting information and conducting targeted education programs. Subsequently, strategies move from voluntary programs to focused regulatory. Strategy designs, which focus on controlling discharges at the source, aim to minimize both disruption to affected private entities and government implementation costs. To monitor effectiveness, the strategies include tracking and reporting of strategy-specific indicators.
References Aftermarket News Staff (2012). “Federal-Mogul Reports Increased First Quarter 2012
Sales Driven By Record OE Sales.” Aftermarket News. April 24. ALCO Brakes (2012). “ALCO Brakes unveil its new 100% copper free next gen TCX
Ceramic.” Press release for AAPEX 2012 Conference.
Antenora, A. (2012). “Brake Manufacturers Point Out They Are Part of the Solution to Reducing Copper in U.S. Watersheds.” Aftermarket News. February 17.
Automotive Aftermarket Industry Association (AAIA) (2008). “Replacement Rates by Vehicle Age, 2006.”
Bendix (2012). “Bendix Advances Commitment to Environmental Leadership.” Fact Sheet.
Brake Manufacturers Council Product Environmental Committee (BMC PEC) (2006). Generating a Representative Sample of Brake Pad Wear Debris. January 27.
Brake Pad Partnership (BPP) (1996-2012). Information shared with author at Brake Pad Partnership Steering Committee meetings and related industry information provided directly to author.
Brake Pad Partnership (BPP) (2008). Copper Use Monitoring Program Results for Model Years 1998-2006. Prepared by Sustainable Conservation for the Brake Pad Partnership Steering Committee. February 10.
California Department of Finance (DOF) (2009). California Statistical Abstract. California Senate Bill (SB) 346 (Kehoe) (2010). Hazardous Materials: Motor Vehicle
Brake Friction Materials. Statutes of 2010, Chapter 307. Crowe, P. (2012). “Copper-Free Eco-Friction Brake Pad Launched.” Hybrid Cars: Auto
Alternatives for the 21st Century http://www.hybridcars.com/news/copper-free-eco-friction-brake-pad-launched-47507.html. June 25.
Donigian, A.S. and B. R. Bicknell (2007). Modeling the Contribution of Copper from Brake Wear Debris to the San Francisco Bay. Prepared by AQUA TERRA Consultants for the Brake Pad Partnership. October 2.
Brake Pad Copper Reduction – SB 346 Implementation Status DRAFT January 3, 2013 Page 17
Donigian, A.S., B. R. Bicknell and E. Wolfram (2009). Modeling the Contribution of Copper from Brake Wear Debris to the San Francisco Bay. Phase 2. Prepared by AQUA TERRA Consultants for the Brake Pad Partnership.
FDP Brake (2010-2012). “EcoStop Disc Brake Pads.” http://www.fdpbrakes.com/products-ecostop.shtml Accessed December 19, 2012.
Federal Highway Administration (FHWA) (2009). Changes in the U.S. Household Vehicle Fleet. National Household Travel Survey Brief.
Honeywell Friction Materials (undated). “ New generation of Low-Met. and NAO friction materials that meets the new copper legislation.” http://www.honeywell-frictionmaterials.com/index.php?id=1096 Accessed December 10, 2012
Fastmagna.com (2010). “Lucas Products” http://www.fastmagna.com/products/lucas/index.php Accessed December 19, 2012
Gilroy, R. (2011). “Mining for Copper’s Replacement: Friction suppliers begin searching for an alternative to copper in brakes following new state laws.” Light and Medium Truck. http://www.lmtruck.com/articles/printnews.aspx?storyid=1488
Haselden, A.; C. Christoforou; and M. Schlautman (2004). Characterization of Airborne Brake Wear Debris. Prepared by Clemson University for the Association of Bay Area Governments (Brake Pad Partnership). December.
Larry Walker Associates and TDC Environmental (2006). Copper Management Strategy Development Resources. Prepared for the San Francisco Bay Clean Estuary Partnership. September.
Lawrence, J. Executive Director, Brake Manufacturers Council, Motor and Equipment Manufacturers Association (MEMA) (1999). Letter to the Brake Pad Partnership.
Moran, K. D. (2011). “Brake Pad Copper Reduction – SB 346 Implementation Status.” Memorandum prepared for CASQA.
Motor and Equipment Manufacturers Association (MEMA) (2010). “The Standard Development Process Timeline and Brake Copper Reduction – Iterative, Overlapping Cycles of Development.” Timeline prepared for the California legislature.
Motor and Equipment Manufacturers Association (MEMA) (2012a). “Copper in Brake Friction” http://www.aftermarketsuppliers.org/Councils/Brake-Manufacturers-Council-BMC/Copper-in-Brake-Friction
Motor and Equipment Manufacturers Association (MEMA) (2012b). 3-Stage Certification Logo. March 14.
Murphy, T. (2012). “Auto Industry Will Brake for Salmon” Wardsauto.com. http://wardsauto.com/suppliers/auto-industry-will-brake-salmon June 28.
Performance Friction (2012). “Carbon Metallic OEM Brake Pads.” http://www.performancefriction.com/oem/oem-brake-pads.aspx Accessed December 19, 2012.
Phipps, M. (2008). “An Analysis of the 2006 Copper Monitoring Results.” Prepared for the Brake Pad Partnership.
Brake Pad Copper Reduction – SB 346 Implementation Status DRAFT January 3, 2013 Page 18
Phipps, M. and B. Peters (2006). “City Versus Highway Disc Brake Pad Wear Rates.” Memorandum to Connie Liao, Brake Pad Partnership. January 3.
Phoenix Friction (2010). “HDM Fleet Duty Brake Pads: Value and Performance.” Fact Sheet.
Pun, B.; K. Lohman, and C. Seigneur (2006a). Air Deposition Modeling of Copper from Brake Pad Wear Debris in Castro Valley Creek Watershed. Prepared by Atmospheric Environmental Research, Inc. for the Brake Pad Partnership. July.
Pun, B. (2006b). “Estimates of Copper Air Deposition to Watersheds in Bay Area Watersheds.” Memorandum prepared by Atmospheric Environmental Research, Inc. for the Brake Pad Partnership. November 7.
Rosselot, K. (2006a). Copper Released from Brake Lining Wear in the San Francisco Bay Area. Prepared by Process Profiles for the Brake Pad Partnership. January.
Rosselot, K. (2006b). Copper Released from Non-Brake Sources in the San Francisco Bay Area. Prepared by Process Profiles for the Brake Pad Partnership. January.
Rosselot, K. (2009). “Estimating the Relative Contribution of Aftermarket and OE Pads to Copper Releases from Brake Pad Wear Debris.” Prepared by Process Profiles for the Brake Pad Partnership.
Rosselot, K. (2010). “Estimating the Relative Contribution of Copper from Motorcycle Brakes.” Prepared by Process Profiles for the Brake Pad Partnership.
Santos, A.; N. McGuckin; H.Y. Nakamoto; D. Gray; and S. Liss (2011). “Summary of Travel Trends: 2009,” National Household Travel Survey. U.S. Department of Transportation Federal Highway Administration. FHWA-PL-ll-022. Table 22.
Schlautman, M. and A. Haselden (2006). Chemical Characterization of the Non-Airborne Fraction of the Representative Brake Pad Wear Debris Sample. Prepared by Clemson University for the Association of Bay Area Governments (Brake Pad Partnership). April.
Society of Automotive Engineers (SAE) (2011). Measurement of Copper and Other Elements in Brake Friction Materials. SAE Technical Standard J2975.
Society of Automotive Engineers (SAE) (2012). Friction Coefficient Identification and Environmental Marking System for Brake Linings. SAE Technical Standard J866.
Southern California Association of Governments (SCAG) (2012). Regional Transportation Monitoring and Information System, Vehicle Miles traveled data, http://scag.ms2soft.com/tms/ accessed September 23, 2012.
TDC Environmental (2004). Copper Sources in Urban Runoff and Shoreline Activities. Prepared for the Clean Estuary Partnership. November.
Ventis, T. (2012). “Putting the Brakes on Copper.” Service Station and Garage Management Magazine.
Washington Department of Ecology (2012). Better Brakes Rule. Chapter 173-901 Washington Administrative Code. Publication 12-04-027. September.

Brake Pad Copper Reduction – SB 346 Implementation Status DRAFT January 3, 2013 Page 19
Washington State (2010). Washington Senate Bill 6557 (Senate Environment, Water & Energy Committee). Brake Friction Material. Statutes of 2010, Chapter 70.285 RCW.
Williams Global Friction Technology Group (undated). “Williams High Performance Braking Systems – Environmental” http://www.wpfri.com/Enviromental.html Accessed December 19, 2012
Wilson, A., Senior Vice President of Government Affairs, Motor & Equipment Manufacturers Association (2012). Quote in Associated Press news story “Brake manufacturers gearing up to meet Washington Law” December 8.
APPENDIX 4
BMP PERFORMANCE DATA

Performance Evaluation of Structural BMPs
It is important to take the performance of stormwater BMPs into consideration during the planning and implementation process. The statistical analysis presented herein has many applications, including supporting BMP prioritization and the RAA analysis. As future applications are undertaken, the results can be analyzed in more detail. This section provides an analysis of specific BMPs to determine the pollutant removal effectiveness of those BMPs. The International Stormwater BMP Database 1 (IBD) project website was used to analyze different BMP types for their effectiveness in removing specific pollutants. The website features a database of over 530 BMP studies, performance analysis results, BMP performance tools, monitoring guidance and other study-related publications.
Research on characterizing BMP performance suggests that effluent quality is more representative to stormwater treatment than percent removal, which assumes a linear influent-to-effluent relationship (Strecker et al. 2001). Schueler (1996) also found in his evaluation of detention basins and stormwater wetlands that BMP performance is often limited by an achievable effluent quality, or "irreducible pollutant concentration"; acknowledging that a practical lower limit exists at which stormwater pollutants can be removed by any given technology. While there is likely a relationship between influent and effluent water quality pertaining to specific BMPs and specific constituent concentrations, analyses conducted to date do not support fixed percent removal values relative to influent quality for the following reasons (WWE and Geosyntec, 2007):
1. Percent removal depends heavily on influent quality, and in the majority of cases, higher observed influent pollutant concentrations actually result in higher percent removals. In other words, observed effluent concentrations for most BMPs are relatively consistent; therefore, the use of a pre-set percent removal would under-predict BMP performance when influent concentrations are high and over-predict BMP performance when influent concentrations are low;
2. The variability in percent removal is often more broad than the variability in effluent pollutant concentration;
3. A high percent removal may still result in a high pollutant concentration, thereby leading to a false determination that BMPs are performing well; and
4. Different percent removals can be calculated within the same dataset (i.e., when looking at individual pairs of influent/effluent samples).
For the reasons stated above, percent removal is not used to quantify BMP performance. Instead raw effluent data has been used to estimate the "irreducible pollutant concentration" attributable to each BMP that will be analyzed as part of the RAA.
As with the estimation of land use event mean concentrations (EMCs), final effluent values used to predict BMP performance were determined from the data contained in the IBD using a combination of
1 Geosyntec Consultants, Wright Water Engineers. International Stormwater Best Management Practices (BMP) Database Pollutant Category Summary Statistical Addendum: TSS, Bacteria, Nutrients, and Metals. July 2012.

regression-on-order statistics and the “bootstrap” method2. Log-normality was also assumed for BMP effluent concentrations. This assumption has been confirmed previously through goodness-of-fit tests on the BMP effluent concentration data (Geosyntec, 2008). Statistics for effluent concentrations based on available water quality performance data were developed for the BMPs and constituents listed in Table B-1 below. All constituents are addressed for all BMPs that provide treatment (i.e., excluding those identified as “volume reduction only”). Dissolved phosphorus and orthophosphate datasets were combined to provide a larger dataset and because the majority of orthophosphate is typically dissolved and many datasets either report dissolved phosphorus or orthophosphate, but not both.
Table B-1: BMPs and Constituents Analyzed.
BMPs Constituents
Constructed Wetland/Retention Pond (with Extended Detention)
Constructed Wetland/Retention Pond (without Extended Detention)
Dry Extended Detention Basin
Hydrodynamic Separator
Media Filter
Subsurface Flow Wetland
Treatment Plant
Bioswale
Bioretention with underdrain
Bioretention (volume reduction only)
Cistern (volume reduction only)
Green Roof (volume reduction only)
Porous Pavement (volume reduction only)
Low Flow Diversion (volume reduction only)
Total suspended solids (TSS)
Total phosphorus (TP)
Dissolved phosphorus as P (DP)b
Ammonia as N (NH3)
Nitrate as N (NO3)
Total Kjeldahl nitrogen as N (TKN)
Dissolved copper (DCu)
Total copper (TCu)
Total lead (TPb)
Dissolved zinc (DZn)
Total zinc (TZn)
Fecal Coliform (FC)
Table B-2 summarizes the number of effluent data points (individual storm events) and percent non-
detects for the pollutants and BMP types of interest for which sufficient data were available. A large
percentage of non-detects can bias the effluent statistics derived from the dataset (e.g., total lead for
bioretention shows a 60% non-detect ratio).
2 The bootstrap approach randomly samples the dataset several thousand times and computes the desired statistic
from the subset of data.

Table Table B-3 summarizes arithmetic averages and Table B-4 summarizes the arithmetic standard deviations of the BMP effluent concentrations that will be used in the RAA.
Consistent with IBD documentation (WWE and Geosyntec, 2007), BMP effluent concentrations are assumed to be limited by an “irreducible effluent concentration,” or a minimum achievable concentration (Schuler, 1996). Lower limits are currently set at the 10th percentile effluent concentration of BMP data in the IBD for each modeled BMP type for which the BMP data show statistically significant reductions between influent and effluent means. If the differences are not statistically significant or there is a statistically significant increase, the 90th percentile is used as the minimum achievable effluent concentration, which essentially assumes no treatment except when influent to the BMP is very high. Table B-5 summarizes the irreducible effluent concentration estimates that are used in the RAA to prevent treatment from occurring when influent concentrations are equal to or below these values.

Table B-2: Summary of Number of Data Points and Percent Non-Detects for BMP Effluent Concentration Data from the International BMP Database
BMP TSS TP DP NH3 NO3 TKN DCu TCu TPb DZn TZn FC
Bioretention Count 193 249 164 184 259 201 NA 39 48 15 48 29
%ND 10% 5% 4% 18% 3% 2% NA 18% 60% 0% 35% 0%
Vegetated Swales (Bioswales) Count 354 364 249 225 372 324 82 309 308 72 373 92
%ND 1% 1% 0% 17% 1% 0% 4% 3% 39% 6% 23% 0%
Hydrodynamic Separators (not updated - original SBPAT analysis, 2008)
Count 199 170 58 69 59 77 89 99 95 99 174 31
%ND 7% 3% 33% 28% 3% 5% 17% 0% 8% 18% 7% 3.2%
Media Filters Count 409 403 244 215 391 374 186 361 341 221 433 185
%ND 7% 6% 14% 24% 2% 6% 7% 12% 21% 19% 13% 0%
Detention Basins Count 299 275 116 94 213 185 170 198 209 163 189 190
%ND 1% 3% 16% 6% 7% 4% 32% 31% 50% 17% 15% 0%
Retention Ponds Count 723 654 618 423 626 496 213 536 646 212 593 137
%ND 4% 3% 6% 8% 6% 3% 26% 21% 30% 15% 7% 0%
Wetland Basins/Retention Ponds (combined)
Count 1028 932 862 681 872 680 228 684 767 227 770 158
%ND 4% 3% 6% 7% 7% 2% 25% 20% 28% 14% 8% 0%

Table B-3: International BMP Database Arithmetic Mean Estimates of BMP Effluent Concentrations
BMP TSS TP DP NH3 NO3 TKN DCu TCu TPb DZn TZn FC
mg/L mg/L mg/L mg/L mg/L mg/L ug/L ug/L ug/L ug/L ug/L #/100 mL
Constructed Wetland / Retention Pond (with Extended Detention)
1 38.3 0.19 0.11 0.18 0.42 1.20 5.3 6.7 7.2 22.1 35.3 1.01E+04
Constructed Wetland / Retention Pond (without Extended Detention)
2
32.9 0.17 0.09 0.17 0.38 1.20 5.3 6.2 12.0 22.6 38.0 9.89E+03
Dry Extended Detention Basin3 42.3 0.37 0.26 0.16 0.61 2.40 6.5 11.4 14.4 33.7 78.4 1.41E+04
Hydrodynamic Separator4 98.1 0.50 0.06 0.30 0.67 2.07 13.1 16.7 12.7 78.4 107.4 2.68E+04
Media Filter5 22.3 0.14 0.07 0.18 0.74 0.98 8.3 11.0 4.6 34.7 37.6 5.89E+03
Sub-surface Flow Wetland6 18.1 0.06 0.06 0.09 0.27 0.87 4.6 4.6 0.7 20.9 25.8 PR=90%
Treatment Plant7 2.0 0.00 0.00 0.00 0.27 0.01 1.0 1.0 4.4 5.0 5.0 2.00E+00
Vegetated Swale (Bioswale)8 27.1 0.28 0.17 0.09 0.43 0.87 9.6 10.1 6.4 33.3 33.3 8.00E+04
Bioretention9 18.1 0.14 0.07 0.18 0.37 0.98 8.3 8.8 4.2 34.7 37.6 5.89E+03
Bioretention w/o underdrain Volume reductions only
Cistern Volume reductions only
Green Roof Volume reductions only
Porous Pavement Volume reductions only
Infiltration Basin Volume reductions only 1 Based on retention pond IBD category (basis per Geosyntec 2008)
2 Based on combined wetland basin and retention pond IBD categories (basis per Geosyntec 2008)
3 Strictly detention basin category from the IBD
4 From Geosyntec, 2008
5 Includes non-bio media filters (e.g., sand filters)
6 Lowest of all IBD categories; except for Fecal Coliform where 90% removal is used. The 90% removal is based on USEPA, 1993, which states that SSF wetlands are generally
capable of a 1 to 2 log reduction in fecal coliforms. 7 Secondary Drinking Water Standards or Minimum of all BMP types, whichever is less
8 Strictly from vegetated swale category from the IBD
9 Effluent quality assigned to treated underdrain discharge is based on the better performing characteristics of the “media filter” and “bioretention” categories for each
pollutant.

Table B-4: International BMP Database Arithmetic Standard Deviations of BMP Effluent Concentrations
BMP TSS TP DP NH3 NO3 TKN DCu TCu TPb DZn TZn FC
mg/L mg/L mg/L mg/L mg/L mg/L ug/L ug/L ug/L ug/L ug/L #/100 mL
Constructed Wetland / Wetpond (with Extended Detention)
76.80 0.253 0.357 0.234 0.787 0.688 4.288 9.710 12.96 42.46 61.96 3.23E+04
Constructed Wetland / Wetpond (without Extended Detention)
71.14 0.228 0.313 0.375 0.750 0.848 4.196 8.849 123.0 41.88 85.57 3.08E+04
Dry Extended Detention Basin 87.36 0.673 0.439 0.183 1.173 5.029 6.656 19.96 56.01 64.68 137.9 4.15E+04
Hydrodynamic Separator 236.5 1.237 0.093 0.880 1.198 3.737 11.98 11.98 25.70 137.4 137.4 2.16E+05
Media Filter 40.73 0.168 0.099 0.382 0.852 1.213 13.75 17.20 10.02 142.2 100.3 1.27E+04
Sub-surface Flow Wetland 30.66 0.145 0.088 0.145 0.552 0.594 3.504 3.504 1.845 12.84 17.16 5.37E+02
Treatment Plant 2.00 0.003 0.003 0.006 0.552 0.030 3.000 3.000 10.97 15.00 15.00 1.00E+00
Vegetated Swale (Bioswale) 35.12 0.311 0.239 0.145 0.905 0.872 7.749 9.429 15.36 28.49 34.86 1.19E+06
Bioretention 30.66 0.168 0.099 0.382 0.552 1.213 13.75 11.12 4.84 100.3 100.3 1.27E+04
Bioretention w/o underdrain Volume reductions only
Cistern Volume reductions only
Green Roof Volume reductions only
Porous Pavement Volume reductions only
Infiltration Basin Volume reductions only

Table B-5: International BMP Database Arithmetic Irreducible of BMP Effluent Concentrations
BMP TSS TP DP NH3 NO3 TKN DCu TCu TPb DZn TZn FC
mg/L mg/L mg/L mg/L mg/L mg/L ug/L ug/L ug/L ug/L ug/L #/100 mL
Constructed Wetland / Wetpond (with Extended Detention)
1.358 0.034 0.010 0.019 0.011 0.499 1.387 1.387 0.429 1.000 2.933 4
Constructed Wetland / Wetpond (without Extended Detention)
1.300 0.030 0.009 0.012 0.010 0.520 1.267 1.267 0.400 1.075 3.000 5.4
Dry Extended Detention Basin 5.460 0.089 0.523 0.336 0.026 3.650 1.153 1.274 0.435 8.396 8.396 19.6
Hydrodynamic Separator 5.543 0.023 0.172 0.014 1.299 3.576 3.340 3.340 1.351 17.793 17.793 3295
Media Filter 1.487 0.026 0.010 0.013 0.064 0.210 0.995 1.298 0.372 1.000 2.000 13.1
Sub-surface Flow Wetland 1.268 0.025 0.006 0.009 0.008 0.141 1.000 1.000 0.089 1.000 2.933 4
Treatment Plant 0.500 0.001 0.001 0.001 0.008 0.001 0.100 0.100 0.255 0.500 0.500 1
Vegetated Swale (Bioswale) 2.000 0.079 0.040 0.009 0.056 0.141 2.708 2.708 0.434 5.720 5.720 9.53E+04
Bioretention 1.605 0.026 0.010 0.013 0.050 0.210 0.995 1.524 0.836 1.000 2.000 13.1
Bioretention w/o underdrain Volume reductions only
Cistern Volume reductions only
Green Roof Volume reductions only
Porous Pavement Volume reductions only
Infiltration Basin Volume reductions only
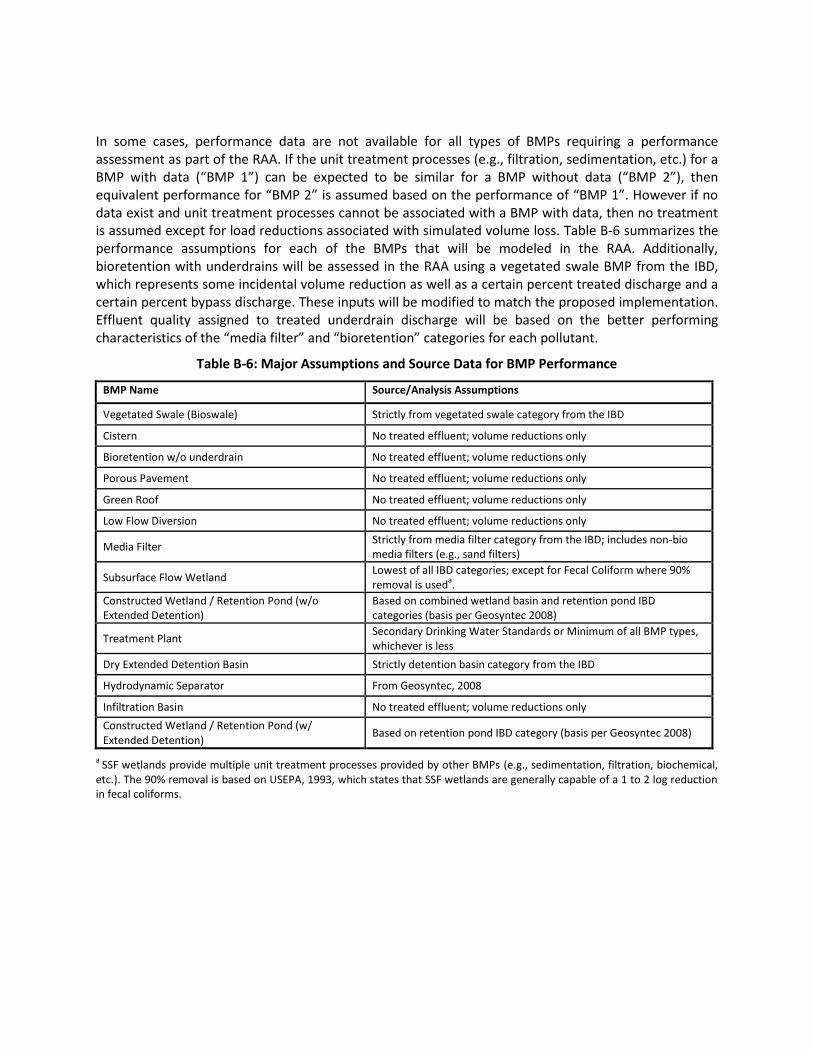
In some cases, performance data are not available for all types of BMPs requiring a performance assessment as part of the RAA. If the unit treatment processes (e.g., filtration, sedimentation, etc.) for a BMP with data (“BMP 1”) can be expected to be similar for a BMP without data (“BMP 2”), then equivalent performance for “BMP 2” is assumed based on the performance of “BMP 1”. However if no data exist and unit treatment processes cannot be associated with a BMP with data, then no treatment is assumed except for load reductions associated with simulated volume loss. Table B-6 summarizes the performance assumptions for each of the BMPs that will be modeled in the RAA. Additionally, bioretention with underdrains will be assessed in the RAA using a vegetated swale BMP from the IBD, which represents some incidental volume reduction as well as a certain percent treated discharge and a certain percent bypass discharge. These inputs will be modified to match the proposed implementation. Effluent quality assigned to treated underdrain discharge will be based on the better performing characteristics of the “media filter” and “bioretention” categories for each pollutant.
Table B-6: Major Assumptions and Source Data for BMP Performance
BMP Name Source/Analysis Assumptions
Vegetated Swale (Bioswale) Strictly from vegetated swale category from the IBD
Cistern No treated effluent; volume reductions only
Bioretention w/o underdrain No treated effluent; volume reductions only
Porous Pavement No treated effluent; volume reductions only
Green Roof No treated effluent; volume reductions only
Low Flow Diversion No treated effluent; volume reductions only
Media Filter Strictly from media filter category from the IBD; includes non-bio media filters (e.g., sand filters)
Subsurface Flow Wetland Lowest of all IBD categories; except for Fecal Coliform where 90% removal is used
a.
Constructed Wetland / Retention Pond (w/o Extended Detention)
Based on combined wetland basin and retention pond IBD categories (basis per Geosyntec 2008)
Treatment Plant Secondary Drinking Water Standards or Minimum of all BMP types, whichever is less
Dry Extended Detention Basin Strictly detention basin category from the IBD
Hydrodynamic Separator From Geosyntec, 2008
Infiltration Basin No treated effluent; volume reductions only
Constructed Wetland / Retention Pond (w/ Extended Detention)
Based on retention pond IBD category (basis per Geosyntec 2008)
a SSF wetlands provide multiple unit treatment processes provided by other BMPs (e.g., sedimentation, filtration, biochemical,
etc.). The 90% removal is based on USEPA, 1993, which states that SSF wetlands are generally capable of a 1 to 2 log reduction in fecal coliforms.

APPENDIX 5
POTENTIAL REGIONAL BMP LOCATIONS
TECHNICAL MEMORANDUM

Technical Memorandum Date: November 20, 2014 To: Peninsula EWMP Agencies From: John L. Hunter and Associates Subject: Task 4.2 Potential Regional BMP Locations

Table of Contents
I. Introduction .......................................................................................................................................... 1
II. Existing Regional BMPs ......................................................................................................................... 1
III. Planned Regional BMPs .................................................................................................................... 6
IV. Potential Regional BMPs ................................................................................................................. 10
V. Potential Sites for Future Regional BMPs ........................................................................................... 14
VI. Right-of-Way BMPs ......................................................................................................................... 23
List of Figures
Figure 1: Existing & Planned Regional BMPs. ............................................................................................... 2
Figure 2: Casaba Estates (formerly Butcher Ranch) Post-Development Design Conditions (Bolton Engineering Corp. Hydrology and Hydraulic Calculations. September 13, 2010). ........................................ 4
Figure 3: San Ramon Canyon Project Map.................................................................................................... 5
Figure 4: Chandler Quarry Project Drainage Area Map (Hunsaker and Associates. Water Quality Mitigation Plan. June 16, 2010). ................................................................................................................... 7
Figure 5: Chandler Quarry Project Drainage and Water Quality Concept Plan (Hunsaker and Associates. Water Quality Mitigation Plan. June 16, 2010). ............................................................................................ 8
Figure 6: Chandler Quarry Project Infiltration System Concept Design (Hunsaker and Associates. Water Quality Mitigation Plan. June 16, 2010). ....................................................................................................... 9
Figure 7: South Coast Botanic Garden - Potential Regional BMP Opportunities. ....................................... 11
Figure 8: RDD 275 – Looking South/Upstream along Crenshaw Boulevard. .............................................. 12
Figure 9: Potential Sites for Regional BMPs. ............................................................................................... 16
Figure 10: Areas potentially available for right-of-way BMPs. ................................................................... 23
List of Tables
Table 1 Summary of Existing Regional BMPs ................................................................................................ 1
Table 2: Potential EWMP Regional Project Site List .................................................................................... 18
Table 3: Project Sites Removed From Potential EWMP BMP List ............................................................... 21
Table 2: Potential Locations for Right-of-way BMPs .................................................................................. 24

Technical Memorandum
Potential Regional BMP Locations
1 | P a g e
I. Introduction
Determining Regional BMPs and potential locations for Regional BMPs is an essential component of the Palos Verdes Peninsula Enhanced Watershed Management Program (Peninsula EWMP). This technical memorandum, which will be incorporated into the Peninsula EWMP, presents existing and planned Regional BMPs as well as potential Regional BMP sites. The lists herein are preliminary and intended as an initial step towards addressing Water Quality Priorities (WQPs) identified in the Palos Verdes Peninsula EWMP Work Plan. A feasibility analysis will be performed for the potential sites in a future technical memorandum once screened by the Peninsula Watershed Management Group (WMG).
Existing and Planned Regional BMPs as well as potential Regional BMP sites will also be evaluated for their suitability as Regional EWMP Projects1. Regional EWMP Projects will be determined based on an analysis using a combination of computer modeling and desktop-level screening. Additionally, all potential Regional BMPs will be evaluated (i.e. quantification of costs and water quality benefits) using the Structural BMP Prioritization and Analysis Tool (SBPAT). SBPAT is a publicly available, Permit-approved, GIS-based model that has been developed for the region2. SBPAT evaluates BMP performance based on a hydrologic/hydraulic assessment, water quality evaluation, and a cost analysis.
II. Existing and Planned Regional BMPs
A summary of existing and planned Regional BMPs within the Peninsula EWMP area is summarized below in Table 1.
Table 1 Summary of Existing and Planned Regional BMPs
Project Name Map
Reference ID Jurisdiction
Existing or Planned
BMP Type Treatment Volume per
Storm
Design Basis
Drainage Area to BMP
Chandler Quarry Project
R1 RHE Existing/ Planned
Infiltration System
12.7 acre feet* 50-year 707 Acres
Casaba Estates (Butcher Ranch)
R2 RHE Existing Bioretention 5.1 acre feet 50-year 28.62 Acres
Malaga Cove Water Reuse
R3 PVE Planned^ Capture &
Reuse Unknown
Unknown
Unknown
Abalone Cove Water Reuse
R4 RPV Planned^ Capture &
Reuse Unknown
Unknown
Unknown
San Ramon Canyon R5 RPV Existing# Diversion Unknown >0.25” Unknown
RPV-Rancho Palos Verdes, PVE-Palos Verdes Estates, RHE-Rolling Hills Estates *Based on the 50-year design storm ^A feasibility study is currently being conducted for this project #Project is currently under construction
1 The term “Regional BMP” should be distinguished from “Regional EWMP BMP” as defined by the MS4 Permit (referred to herein as EWMP BMP). The MS4 Permit defines an EWMP BMP as a “multi-benefit regional projects that, wherever feasible, retain (i) all non-stormwater runoff and (ii) all stormwater runoff from the 85th percentile, 24-hour storm event for the drainage areas tributary to the projects, while also achieving other benefits including flood control and water supply, among others”. Regional BMPs may not necessarily meet the MS4 Permit definition for an EWMP project; however, may still be included in the Peninsula EWMP as control measures implemented to meet water quality goals. 2 SBPAT is specifically referenced in the MS4 Permit Part VI.C.5.b.iv and was presented at the first two Permit Group TAC RAA Subcommittee meetings.

Technical Memorandum
Potential Regional BMP Locations
2 | P a g e
Figure 1: Existing & Planned Regional BMPs.

Technical Memorandum
Potential Regional BMP Locations
3 | P a g e
a. Existing Regional BMPs
Casaba Estates subdivision (formerly Butcher Ranch)3
The Casabas Estates project is currently under construction. The project is approximately 8.55 acres located in Rolling Hills Estates. It is bounded on the north by Rolling Hills Country Club and Kramer Tennis Club, on the south by Palos Verdes Drive North, easterly by Monticello Drive, and westerly by Palos Verdes Drive East. The project consists of residential lots, one new Commercial Recreational lot, parking lots, private roads, and private equestrian facilities.
The project involved re-grading a portion of the pre-existing ravine to remove standing water conditions. This inundated area was rehabilitated into a vegetated riparian area designed as a bioretention system to retain and infiltrate runoff from the site. The project receives runoff from offsite (through an existing 24” diameter culvert under Palos Verdes Drive East) and onsite watersheds (a total of 28.62 acres). The new riparian area was designed to retain and infiltrate onsite and offsite runoff in a volume greater than the pre-existing design storage capacity for the 50-year storm event (5.1 acre-feet). This is greater than the 85th percentile, 24-hr storm event; therefore, the project will be modeled in the RAA as a Regional EWMP Project. See Figure 2 for post-development design conditions.
3 Bolton Engineering Corp. Hydrology and Hydraulic Calculations. September 13, 2010.

Technical Memorandum
Potential Regional BMP Locations
4 | P a g e
Figure 2: Casaba Estates (formerly Butcher Ranch) Post-Development Design Conditions (Bolton Engineering Corp. Hydrology and Hydraulic Calculations. September 13, 2010).
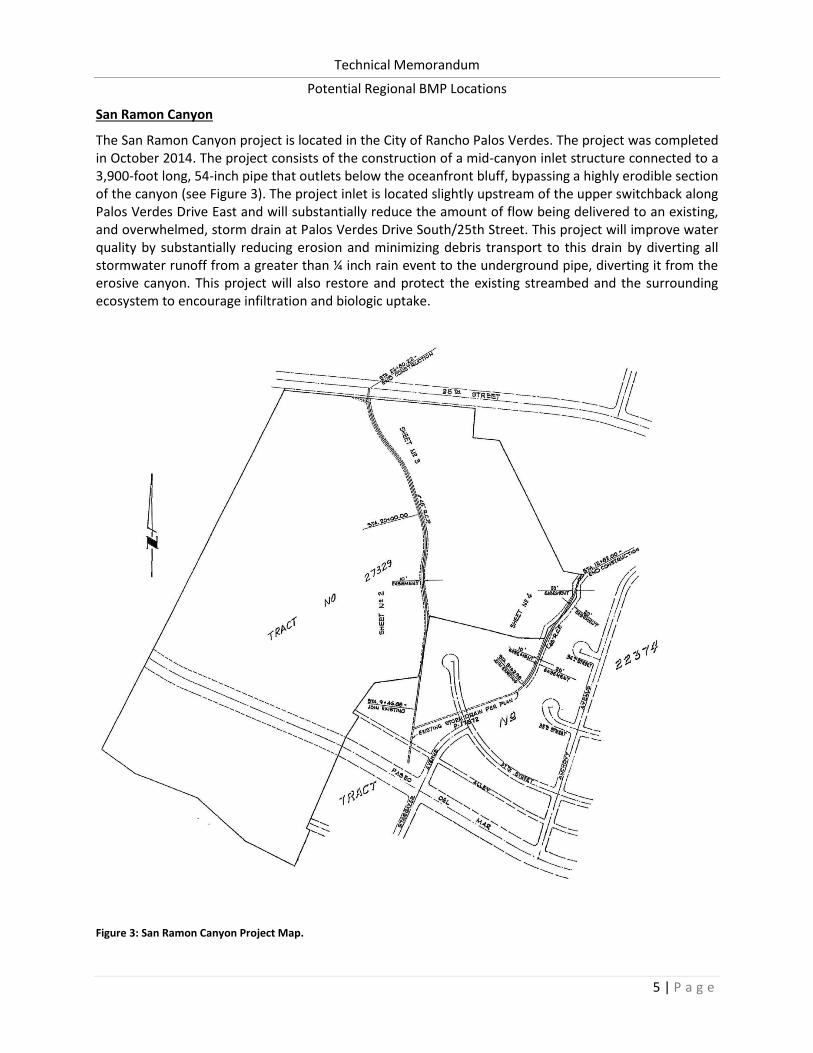
Technical Memorandum
Potential Regional BMP Locations
5 | P a g e
San Ramon Canyon
The San Ramon Canyon project is located in the City of Rancho Palos Verdes. The project was completed in October 2014. The project consists of the construction of a mid-canyon inlet structure connected to a 3,900-foot long, 54-inch pipe that outlets below the oceanfront bluff, bypassing a highly erodible section of the canyon (see Figure 3). The project inlet is located slightly upstream of the upper switchback along Palos Verdes Drive East and will substantially reduce the amount of flow being delivered to an existing, and overwhelmed, storm drain at Palos Verdes Drive South/25th Street. This project will improve water quality by substantially reducing erosion and minimizing debris transport to this drain by diverting all stormwater runoff from a greater than ¼ inch rain event to the underground pipe, diverting it from the erosive canyon. This project will also restore and protect the existing streambed and the surrounding ecosystem to encourage infiltration and biologic uptake.
Figure 3: San Ramon Canyon Project Map.

Technical Memorandum
Potential Regional BMP Locations
6 | P a g e
b. Planned Regional BMPs
A summary of proposed Regional BMPs within the Peninsula EWMP area is summarized below.
Chandler Quarry Project4
The Chandler Quarry Project is an existing site located in Rolling Hills Estates planned to be redeveloped. The project site lies within the Machado Lake sub-watershed of the Dominguez Watershed Management Area (DWMA). The 226-acre project site currently consists of the Chandler Quarry facility, the Rolling Hills Country Club, and surrounding undeveloped land. The proposed project consists of redeveloping the existing Chandler’s facility and the adjacent Rolling Hills Country Club into a new residential community, reconfigured 18-hole golf course and club house, and natural open space.
The project includes three (3) proposed wet retention ponds in the form of water features on the golf course designed to accommodate the initial 0.75 inches of stormwater runoff, an infiltration system designed to percolate all stormwater flows for up to the 50-year storm event, and a detention basin in the form of a water feature on the golf course (see Figure 5).
The project is divided into two drainage areas (see Figure 4). The drainage areas are described below:
Eastern Drainage Area (Area 1): Approximately 45.3 acres of the project area is in the Eastern Drainage Area. Due to low infiltration rates observed in the eastern drainage area, infiltration BMPs are infeasible. Therefore, two manufactured wetlands (NTS) systems are proposed to treat water quality flow which drain Area 1 (see Figure 5). An NTS System consists of an ecosystem-based, constructed water quality treatment (WQT) wetland for improving water quality. Constructed WQT wetlands are different from natural wetlands in that they are primarily designed to improve water quality.
Western Drainage Area (Area 2): The Western Drainage Area is comprised of approximately 707 acres tributary to the sand and gravel pit along Pennsylvania Drive, including approximately 467 acres of offsite flows. Proposed facilities in the Western Drainage Area will include the following:
• Debris Basins: Two debris basins will be located in the southwest corner of the project site which will intercept and remove debris from the storm runoffs in the two watercourses draining the off-site areas to the project site.
• Water Quality/Sediment Basin: The onsite low-flows and first-flush runoffs generated in the Western Drainage Area will be diverted to a water quality/sediment basin. Outflow from the basin will be conveyed to an infiltration system.
• Flow Infiltration System: The project will include an infiltration system that will percolate all of the stormwater discharges exiting the orifice in the Flow Distribution Box, thus eliminating any storm runoff from exiting the Western Drainage Area, for up to a 50-year storm event (approximately 12.7 acre feet). The size of the infiltration pad is based on the maximum flow (242 cfs) spreading throughout the infiltration pad and percolating into the underlining material through the bottom of the pad. The infiltration system will be modeled in the RAA as a Regional EWMP project. See Figure 6 for the infiltration system concept design.
4 Hunsaker and Associates. Water Quality Mitigation Plan. June 16, 2010.

Technical Memorandum
Potential Regional BMP Locations
7 | P a g e
Figure 4: Chandler Quarry Project Drainage Area Map (Hunsaker and Associates. Water Quality Mitigation Plan. June 16, 2010).

Technical Memorandum
Potential Regional BMP Locations
8 | P a g e
Figure 5: Chandler Quarry Project Drainage and Water Quality Concept Plan (Hunsaker and Associates. Water Quality Mitigation Plan. June 16, 2010).
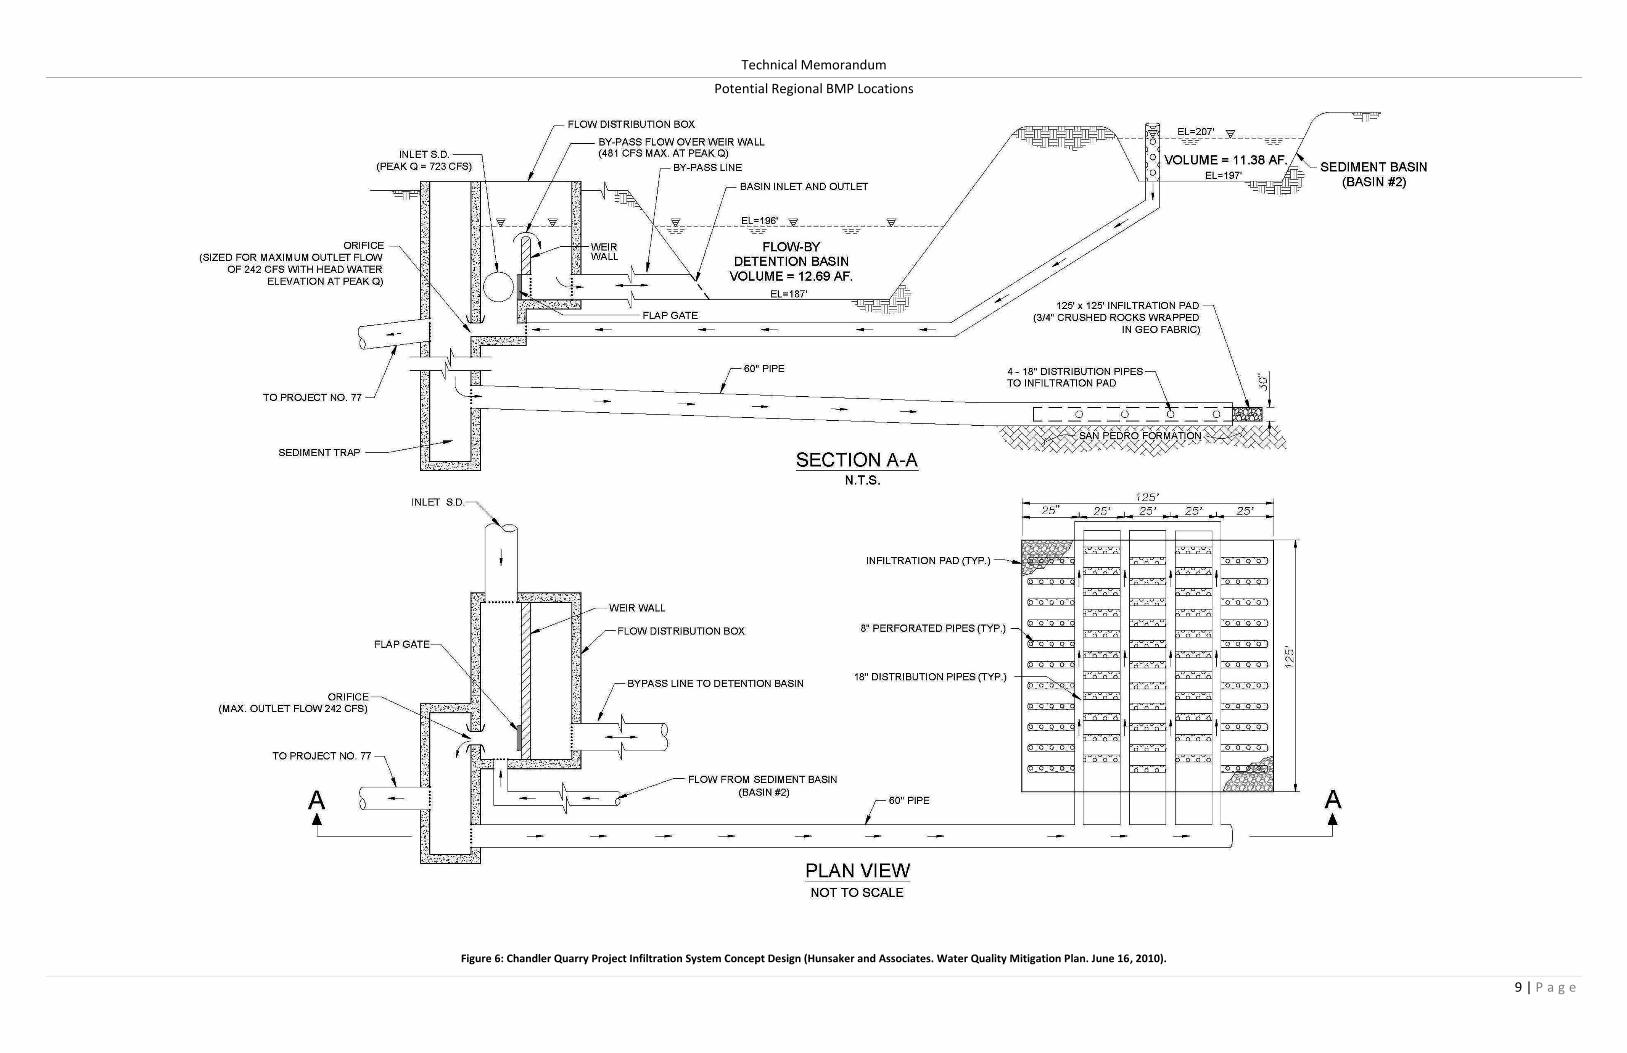
Technical Memorandum
Potential Regional BMP Locations
9 | P a g e
Figure 6: Chandler Quarry Project Infiltration System Concept Design (Hunsaker and Associates. Water Quality Mitigation Plan. June 16, 2010).

Technical Memorandum
Potential Regional BMP Locations
10 | P a g e
Malaga Cove Water Reuse5
The City of Palos Verdes Estates has implemented dewatering measures to prevent nuisance groundwater from damaging homes and businesses. The nuisance groundwater removed from these dewatering sites is currently discharged into the local storm drain system and/or to the nearby Pacific Ocean. This project proposes to divert this water to an existing golf course and potentially a school in Palos Verdes Estates for irrigation use.
Abalone Cove Water Reuse6
The City of Ranchos Palos Verdes has implemented dewatering measures to prevent nuisance groundwater from damaging homes and businesses. In the City of Rancho Palos Verdes, continuous-withdrawal dewatering wells have been installed to slow the progression of the Abalone Cove Landslide and the Portuguese Bend Landslide. The nuisance groundwater removed from these dewatering sites is currently discharged into the local storm drain system and/or to the nearby Pacific Ocean. This project proposes to divert this water to existing golf courses in Rancho Palos Verdes for irrigation use.
III. Potential Regional BMPs
In addition to the existing and planned projects summarized above, the following stakeholder-identified Regional BMPs are being considered for inclusion in the Peninsula EWMP:
Botanic Gardens Regional BMP Project
The South Coast Botanic Garden (SCBG) has developed a “Vision Plan” for the SCBG, which focuses on returning the stream corridor back to the original form and configuration of the Creek Garden and Lake. As a part of the Vision Plan, additional enhancements are being considered as part of this project. One such enhancement includes the southern end of the corridor which would be designed and planted in the form of a natural California wash. This wash would be sufficient to accommodate periods of intense rain from the garden and run-on from the neighboring developments to the south.
The Vision Plan is conceptual and has yet to be finalized. Various opportunities are being considered, as outlined in Figure 7: an existing creek which could potentially be developed into an engineered wetland, swale, or stormwater capture facility; an existing lake which provides an opportunity for stormwater capture and possible reuse for irrigation; an existing open space which provides an opportunity for an engineered wetland, swale, or stormwater capture facility; and an existing catch basin which provides an opportunity to divert upstream flows to a Regional BMP.
5 RMC. “Abalone Cove Project and Malaga Cove Plaza Project Conceptual Evaluation.” August 06, 2009. 6 Information gathered from a feasibility study which is currently being conducted for this project.

Technical Memorandum
Potential Regional BMP Locations
11 | P a g e
Figure 7: South Coast Botanic Garden - Potential Regional BMP Opportunities.

Technical Memorandum
Potential Regional BMP Locations
12 | P a g e
Palos Verdes Golf Course Regional BMP Project
The Palos Verdes Golf Course is city-owned and privately operated, located within Palos Verdes Estates. The facility is dual-plumbed to allow for a secondary source of water for irrigation purposes. The golf course is in the process of weighing options for their secondary source of water.
Since stormwater capture is not a consistent supply, the best available source that could potentially benefit the Peninsula WMG is the ambient flow within the RDD 275 subdrainage area. This subdrainage area is comprised of 860 acres, excluding Ranchview and Chadwick Canyons, and consists primarily of hardened conveyances. The subdrainage area includes the Rolling Hills Estates downtown commercial area; residential areas in Rancho Palos Verdes, Rolling Hills, and County unincorporated; equestrian properties; a private K-12 academy; and arterial roadways (Silver Spur Road and Crenshaw Boulevard). Baseline dry weather flow has been observed where the RDD 275 subdrainage area daylights in a trapezoidal ditch along Crenshaw Boulevard (see Figure 8).
The Palos Verdes Golf Course has requested samples of water within the RDD 275 subdrainage area to determine if the water quality is satisfactory for irrigation purposes. Pending approval of water quality from the Palos Verdes Golf Course, the Peninsula WMG will move forward with gathering accurate flow data to determine if the flow available will meet the irrigation demands of the Palos Verdes Golf Course.
Figure 8: RDD 275 – Looking South/Upstream along Crenshaw Boulevard.
Technical Memorandum
Potential Regional BMP Locations
13 | P a g e
CalWater Project
CalWater reached out to the Peninsula WMG following a stakeholder meeting held in May 2014. They expressed an interest in working with the Peninsula WMG in the implementation of a regional BMP; however, specifics have not yet been developed. There is potential for CalWater to work in collaboration with the Palos Verdes Golf Course Regional BMP Project, pending discussion. Further information is to be determined.
Land Conservancy Project
During the Peninsula EWMP Stakeholder Meeting held in May 2014, the Palos Verdes Land Conservancy expressed an interest in participating in the Peninsula EWMP. Many ideas involved incorporation of native, drought tolerant plants throughout the Peninsula EWMP Watershed. Additional details are pending future discussion.

14 | P a g e
IV. Potential Sites for Future Regional BMPs
A preliminary desktop GIS analysis has been performed for the Peninsula WMG to determine potential areas to locate Regional BMPs. This was done by screening areas within 1,000 feet of a 36" storm drain or open channel waterbody (such as a natural canyon) currently designated as open space (as well as other potentially useful zoning designations). The overall size of each site was used to calculate the maximum amount of stormwater volume which could be stored at the site and the maximum amount of drainage area that could be diverted to the site assuming the entire site were redeveloped to incorporate infiltration.
The equations used were derived from the Orange County Technical Guidance Document (OC TGD)7 and can be found below:
DCV=CdATRIBUTARY× (𝟏
12)
DMAX=KDESIGNT× (1
12)
Assume KDESIGN = 0.3 in/hr
DMAX=0.3×48×1
12=1.2 feet
ABMP=DCV
DMAX
ATRIBUTARY=ABMP×1.2
Cd× (1
12)
C=(0.75×IMP)+ 0.15=0.9
Assume 100% imperviousness
Assume d=1.1
ATRIBUTARY=ABMP×1.2
0.9 ×1.1×(𝟏
12)
DCV=ABMP×1.2
Where:
DCV: Design Capture Volume (acre-ft) ATRIBUTARY: Area Tributary to BMP (acres) T: Drawdown Time
C: Runoff Coefficient DMAX: Maximum Effective Depth ABMP: Footprint Area of BMP (acres)
d: Rainfall Depth KDESIGN: Design Infiltration Rate IMP: Percent Impervious
7 Orange County. Technical Guidance Document for the Preparation of Conceptual/Preliminary and/or Project Water Quality Management Plans (WQMPs). May 19, 2011.
Driving Equation No. 1
0.3 in/hr is the lowest infiltration rate where infiltration is deemed feasible per the MS4 Permit.
Driving Equation No. 2
1.1 inches is the highest depth on the LA County 85th Percentile Isohyetal Map for the watershed.
ABMP has been assumed to be the total site area to determine the maximum tributary area that can be diverted to the site and the maximum volume the site can treat. Final Equation No. 2
Final Equation No. 1

15 | P a g e
Figure 9 and Table 2 indicate the locations of sites potentially available for future Regional BMPs. These locations can serve as a starting point during the implementation phase of the EWMP. They have been grouped by jurisdiction and listed in order by land use. The land use with the highest accessibility is listed first. Within each land use designation, the sites have been listed from largest to smallest. Note that with Regional BMPs there are opportunities for multiple agencies to benefit from the same site. The land uses are ranked as follows:
Open Space and Recreation: Sites designated for open space, parks, and recreational activities were ranked with the highest potential for future regional BMPs. This ranking is based on the fact that these types of areas have a high likelihood of being publically owned eliminating or reducing any high land acquisition costs, they generally have a high percentage of landscaped area available, and they have a greater opportunity for multiple benefits.
Municipal Institution: Sites owned by a municipality and designated for government use were ranked with the second highest potential for future Regional BMPs. This ranking is based on the institution being municipally-owned and presenting a higher likelihood of collaboration than a privately owned facility. Although this may be the case, many Municipal Institutions may not be willing to take on maintenance responsibilities which could result in the necessity of land acquisition or maintenance agreements.
Golf Courses/Country Clubs: Sites designated as golf courses or country clubs were ranked with the third highest potential for future Regional BMPs. This ranking is based on the fact that these types of areas generally have a high percentage of landscaped area available and have a greater opportunity for multiple benefits. Although this may be the case, land acquisition for these sites is expected to be a difficult and costly process.
Educational Use: Sites designated for educational use were ranked with the fourth highest potential for future Regional BMPs. These sites generally have a high percentage of landscaped area available and have a greater opportunity for multiple benefits; however, gaining cooperation is expected to be difficult.
Commercial Use: Sites designated as commercial areas were ranked with the fifth highest potential for future regional BMPs. This ranking is based on the fact that these types of areas generally have a high percentage of parking available which could potentially be retrofitted for infiltration opportunities. Although this may be the case, land acquisition for these sites is expected to be a difficult and costly process.

Technical Memorandum
Potential Regional BMP Locations
16 | P a g e
Figure 9: Potential Sites for Regional BMPs.
The available sites will be further assessed by the Peninsula WMG to determine location(s) for Regional BMP(s). Note that the sites presented do not represent the only sites available for the WMG. The ultimate site selection process will take into account the following characteristics:
Location in relation to RAA results: The RAA provides an estimation of runoff reduction to be provided in each area in order to meet water quality objectives. The sites should be selected taking this into consideration.
GIS Data: GIS data should be further analyzed to screen projects based on criteria such as land use, topography, hydrologic features, streets and roads, existing storm drain infrastructure, and storm drain invert depth.
Project benefits: It is preferred that a project contains multiple benefits in order to increase the overall benefit and support for the project. Benefits to take into consideration include, but are not limited to, the following:
Water quality benefits
Water supply benefits
Recreational use
Multi-agency benefits

Technical Memorandum
Potential Regional BMP Locations
17 | P a g e
Publically owned
Storage availability
Funding available
Project readiness
Flood control benefits
Proximity to pollutant sources or impaired waters
Adjacent to existing storm drain
Project constraints: Not every project will be feasible; therefore, it is important to take into consideration any constraints that may result in project infeasibility. These constraints include, but are not limited to, the following:
High groundwater
Potential for deleterious geotechnical impacts (land movement)
Low infiltration rates
Existing soil contamination/proximity to existing soil contamination
Brownfields8
Existing groundwater contamination/proximity to existing groundwater contamination
Potential for soil instability (liquefaction zones, hillside areas)
Existing private ownership (requires land acquisition)
Cost Effectiveness (determined through RAA)
Historical landmarks
8 With certain legal exclusions and additions, the term "brownfield site" means real property, the expansion, redevelopment, or reuse of which may be complicated by the presence or potential presence of a hazardous substance, pollutant, or contaminant (Environmental Protection Agency).
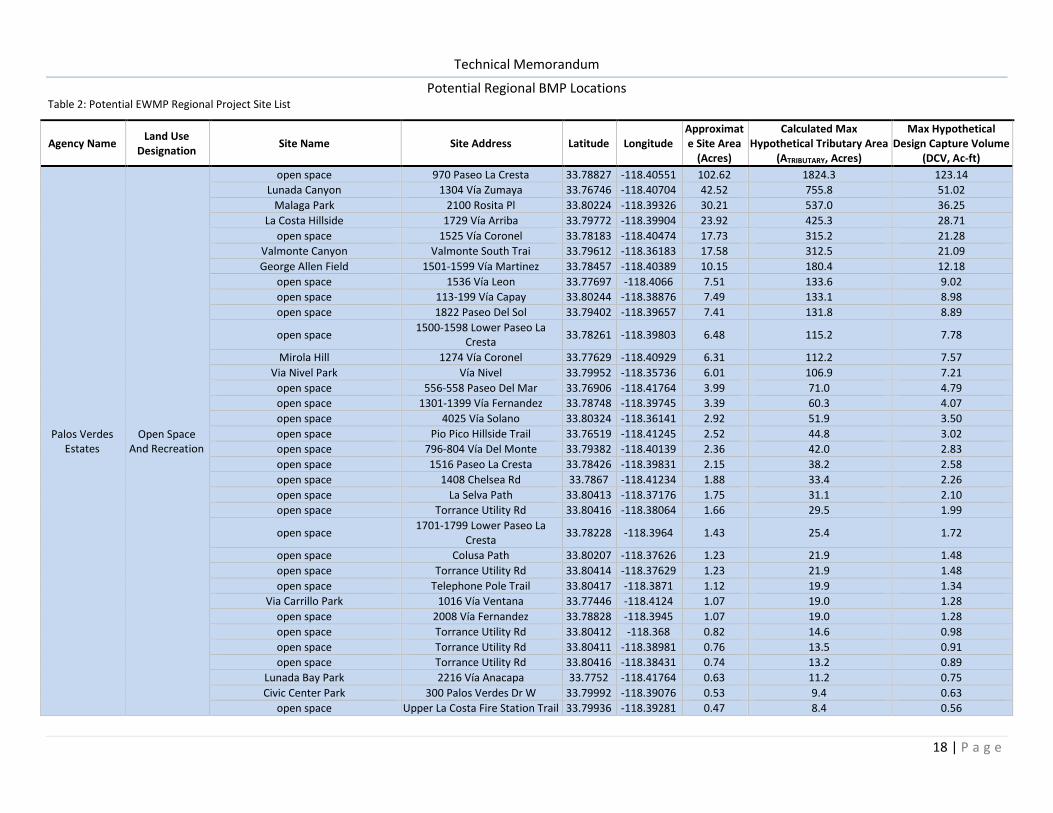
Technical Memorandum
Potential Regional BMP Locations
18 | P a g e
Table 2: Potential EWMP Regional Project Site List
Agency Name Land Use
Designation Site Name Site Address Latitude Longitude
Approximate Site Area
(Acres)
Calculated Max Hypothetical Tributary Area
(ATRIBUTARY, Acres)
Max Hypothetical Design Capture Volume
(DCV, Ac-ft)
Palos Verdes Estates
Open Space And Recreation
open space 970 Paseo La Cresta 33.78827 -118.40551 102.62 1824.3 123.14
Lunada Canyon 1304 Vía Zumaya 33.76746 -118.40704 42.52 755.8 51.02
Malaga Park 2100 Rosita Pl 33.80224 -118.39326 30.21 537.0 36.25
La Costa Hillside 1729 Vía Arriba 33.79772 -118.39904 23.92 425.3 28.71
open space 1525 Vía Coronel 33.78183 -118.40474 17.73 315.2 21.28
Valmonte Canyon Valmonte South Trai 33.79612 -118.36183 17.58 312.5 21.09
George Allen Field 1501-1599 Vía Martinez 33.78457 -118.40389 10.15 180.4 12.18
open space 1536 Vía Leon 33.77697 -118.4066 7.51 133.6 9.02
open space 113-199 Vía Capay 33.80244 -118.38876 7.49 133.1 8.98
open space 1822 Paseo Del Sol 33.79402 -118.39657 7.41 131.8 8.89
open space 1500-1598 Lower Paseo La
Cresta 33.78261 -118.39803 6.48 115.2 7.78
Mirola Hill 1274 Vía Coronel 33.77629 -118.40929 6.31 112.2 7.57
Via Nivel Park Vía Nivel 33.79952 -118.35736 6.01 106.9 7.21
open space 556-558 Paseo Del Mar 33.76906 -118.41764 3.99 71.0 4.79
open space 1301-1399 Vía Fernandez 33.78748 -118.39745 3.39 60.3 4.07
open space 4025 Vía Solano 33.80324 -118.36141 2.92 51.9 3.50
open space Pio Pico Hillside Trail 33.76519 -118.41245 2.52 44.8 3.02
open space 796-804 Vía Del Monte 33.79382 -118.40139 2.36 42.0 2.83
open space 1516 Paseo La Cresta 33.78426 -118.39831 2.15 38.2 2.58
open space 1408 Chelsea Rd 33.7867 -118.41234 1.88 33.4 2.26
open space La Selva Path 33.80413 -118.37176 1.75 31.1 2.10
open space Torrance Utility Rd 33.80416 -118.38064 1.66 29.5 1.99
open space 1701-1799 Lower Paseo La
Cresta 33.78228 -118.3964 1.43 25.4 1.72
open space Colusa Path 33.80207 -118.37626 1.23 21.9 1.48
open space Torrance Utility Rd 33.80414 -118.37629 1.23 21.9 1.48
open space Telephone Pole Trail 33.80417 -118.3871 1.12 19.9 1.34
Via Carrillo Park 1016 Vía Ventana 33.77446 -118.4124 1.07 19.0 1.28
open space 2008 Vía Fernandez 33.78828 -118.3945 1.07 19.0 1.28
open space Torrance Utility Rd 33.80412 -118.368 0.82 14.6 0.98
open space Torrance Utility Rd 33.80411 -118.38981 0.76 13.5 0.91
open space Torrance Utility Rd 33.80416 -118.38431 0.74 13.2 0.89
Lunada Bay Park 2216 Vía Anacapa 33.7752 -118.41764 0.63 11.2 0.75
Civic Center Park 300 Palos Verdes Dr W 33.79992 -118.39076 0.53 9.4 0.63
open space Upper La Costa Fire Station Trail 33.79936 -118.39281 0.47 8.4 0.56

Technical Memorandum
Potential Regional BMP Locations
19 | P a g e
Table 2: Potential EWMP Regional Project Site List
Agency Name Land Use
Designation Site Name Site Address Latitude Longitude
Approximate Site Area
(Acres)
Calculated Max Hypothetical Tributary Area
(ATRIBUTARY, Acres)
Max Hypothetical Design Capture Volume
(DCV, Ac-ft)
Palos Verdes Estates
Open Space And Recreation
open space 1401-1499 Plaza Francisco 33.77 -118.40429 0.41 7.3 0.49
open space Torrance Utility Rd 33.80412 -118.36587 0.38 6.8 0.46
Plaza Andres 1413-1499 Vía Andres 33.77301 -118.40448 0.31 5.5 0.37
open space 278-288 Palos Verdes Dr W 33.8004 -118.38914 0.29 5.2 0.35
open space 2214-2216 Thorley Pl 33.7745 -118.42026 0.19 3.4 0.23
Educational Institution
Palos Verdes Intermediate School 1800 Palos Verdes Dr W 33.778 -118.41322 41.19 732.2 49.43
Malaga Cove School 301-359 Vía Almar 33.80142 -118.39474 10.51 186.8 12.61
Lunada Bay ES 520 Paseo Lunado 33.76769 -118.41735 7.28 129.3 8.73
Montemalaga ES 1201-1299 Vía Nogales 33.79036 -118.39509 6.88 122.3 8.26
Valmonte Early Learning Academy 3801 Vía La Selva 33.80178 -118.36435 6.76 120.2 8.11
Palos Verdes HS 600 Cloyden Rd 33.77927 -118.41967 5.82 103.5 6.98
Farnham Martin Park Vía Campesina 33.7985 -118.38941 0.41 7.3 0.49
Golf Course/ Country Club
Palos Verdes Golf Club and Malaga Dunes
3000-3298 Paseo Del Campo 33.79846 -118.37672 217.14 3860.3 260.57
Commercial Use
Coronel Plaza 1-35 Coronel Plaza 33.78418 -118.39161 0.74 13.1 0.89
Montemalaga Plaza 2340-2398 Vía Acalones 33.79153 -118.38933 0.68 12.1 0.82
Plaza Blanca 1440-1444 Vía Coronel 33.77682 -118.40488 0.44 7.8 0.53
Rancho Palos Verdes
Open Space And Recreation
Deane Dana Friendship Park (County Owned)
1805 West 9th Street 33.73211 -118.32319 99.28 1765.0 119.14
Fred Hesse Jr. Community Park 29301 Hawthorne Boulevard 33.76703 -118.39373 28.71 510.4 34.45
Grandview Park 717 Vía La Cuesta 33.79264 -118.3826 21.31 378.8 25.57
Rancho Palos Verdes
Open Space And Recreation
Malaga Canyon Malaga Canyon Trail 33.79127 -118.37721 21.20 376.9 25.44
Canada Park (Miraleste Recreation and Parks
District Owned) Canada Trail 33.75194 -118.32049 15.80 281.0 18.96
Harter Park (Miraleste Recreation and Parks
District Owned) Palos Verdes Drive East 33.74655 -118.32143 11.68 207.7 14.02
Frascati Canyon Park (Miraleste Recreation and Parks
District Owned) Palos Verdes Drive East 33.74451 -118.32204 10.45 185.7 12.54
Eastview Park 1700 Westmont Drive 33.76152 -118.30996 9.83 174.8 11.80
Upper Point Vicente Peak & Rancho Caninos Dog Park
Nike Trail 33.74427 -118.4043 6.00 106.7 7.20
Del Cerro Park 2 Park Place 33.75697 -118.36858 3.94 70.0 4.73
Dodson MS 28014 S Montereina Dr 33.76602 -118.31559 11.59 206.1 13.91

Technical Memorandum
Potential Regional BMP Locations
20 | P a g e
Table 2: Potential EWMP Regional Project Site List
Agency Name Land Use
Designation Site Name Site Address Latitude Longitude
Approximate Site Area
(Acres)
Calculated Max Hypothetical Tributary Area
(ATRIBUTARY, Acres)
Max Hypothetical Design Capture Volume
(DCV, Ac-ft)
Rancho Palos Verdes
Educational Use
Ridgecrest Intermediate School 28915 Northbay Rd 33.76686 -118.37939 11.00 195.6 13.20
Point Vicente ES 30500-30698 Rue De La Pierre 33.75594 -118.40777 7.92 140.9 9.51
Soleado ES 27608-27660 Flaming Arrow Dr 33.77412 -118.36767 7.51 133.5 9.01
Vista Grande ES 6956 Purple Ridge Dr 33.77072 -118.40188 7.17 127.5 8.61
Mira Catalina ES 3262-3358 Crest Rd 33.74007 -118.33555 5.84 103.8 7.01
Crestwood Street ES 1946 W Crestwood St 33.74909 -118.31239 3.11 55.3 3.73
Silver Spur ES 5400-5598 Diversey Dr 33.78899 -118.37515 2.45 43.5 2.93
Municipal Institution
Rancho Palos Verdes City Hall 30940 Hawthorne Boulevard 33.74482 -118.40658 6.15 109.3 7.38
Los Verdes Golf Course & Ryan Park (County Owned)
7000 Los Verdes Drive 33.75405 -118.40027 172.92 3074.1 207.50
Golf Course/ Country Club
Parking lot/open space 642 Silver Spur Rd 33.77262 -118.37044 16.76 298.0 20.11
Rolling Hills Estates
Commercial Use Palos Verdes Reservoir 2300 Bridle Trail 33.77208 -118.32196 32.00 569.0 38.40
Palos Verdes Reservoir 2300 Bridle Trail 33.77208 -118.32196 32.00 569.0 38.40
Open Space And Recreation
Highridge Park Highridge Trail 33.76718 -118.38215 10.68 189.9 12.82
open space 501 Indian Peak Rd 33.77171 -118.37631 4.23 75.3 5.08
open space 26040-26474 Hawthorne Blvd 33.78656 -118.35956 2.72 48.4 3.27
Silver Spur Park 4700 Palos Verdes Dr N 33.79133 -118.36344 2.56 45.5 3.07
Rockbluff Park 4400 Palos Verdes Dr N 33.78797 -118.35922 1.70 30.2 2.04
open space Highridge Rd 33.7647 -118.38143 1.41 25.1 1.69
Pepperwood Park Crenshaw Boulevard 33.78321 -118.35244 0.53 9.4 0.64
Educational Use
Dapplegray ES Phillip's Canyon Trail 33.77552 -118.33836 37.57 667.8 45.08
Palos Verdes Peninsula HS9 27118 Silver Spur Road 33.78042 -118.37196 23.71 421.4 28.45
Rancho Vista ES Summer Morning's Spur Trail 33.78699 -118.35599 7.65 136.0 9.18
Peninsula Heritage School 26944 Rolling Hills Rd 33.77687 -118.34281 1.87 33.2 2.24
Rolling Hills Country Day School Bridle Trail 33.78243 -118.35119 0.99 17.5 1.18
Municipal Institution
Chandler Park & RHE City Hall10 4045 Palos Verdes Dr N 33.78412 -118.35296 4.50 80.0 5.40
Unincorporated
Open Space And Recreation
South Coast Botanic Garden 26300 Crenshaw Boulevard 33.78298 -118.34507 81.76 1453.5 98.11
Educational Use Chadwick School 26800 South Academy Drive 33.77697 -118.36075 28.73 510.8 34.48
9 Potential opportunity for multi-benefit project. Lower soccer field receives runoff from a significant portion of property. 10 High Priority. May need to be cautious regarding infiltration due to nearby PV Landfill. Pending further analysis.

Technical Memorandum
Potential Regional BMP Locations
21 | P a g e
The first round of sites identified were compared to in-house information provided by the agencies. Through this information several sites were removed from
the list for positional EWMP BMPs. Table 3 lists the sites removed from the initial lists, reasons for removal, and alternative BMP options (if any).
Table 3: Project Sites Removed From Potential EWMP BMP List
Agency Name
Land Use Designation
Site Name Site Address Latitude Longitude Approximate Site
Area (Acres) Reasons for Removal Alternative BMP Option
Palos Verdes Estates
Open Space And
Recreation
Malaga Hills Del Sol Fire Rd 33.79603 -118.38789 67.11 Rising Groundwater Biotreatment/Capture & Reuse
Olmsted Place 63 Malaga Cove Plaza 33.80012 -118.39002 0.33 Rising Groundwater Biotreatment/Capture & Reuse
Memorial Garden Vía Corta 33.80063 -118.39111 0.29 Rising Groundwater Biotreatment/Capture & Reuse
Municipal Institution
Palos Verdes Estates City Hall 361-399 Tejon Pl 33.79963 -118.3915 2.68 Rising Groundwater Biotreatment/Capture & Reuse
Rancho Palos
Verdes
Open Space And
Recreation
Portugese Bend Reserve Peppertree Trail 33.74446 -118.35958 425.40 Geotechnical Hazards Biotreatment/Capture & Reuse
Filiorum and Three Sisters Reserve
Ocean Terrace Drive 33.75409 -118.38111 399.25 Geotechnical Hazards Biotreatment/Capture & Reuse
Forrestral Nature Reserve Forrestal Drive 33.74145 -118.34811 166.82 Geotechnical Hazards Biotreatment/Capture & Reuse
Agua Amarga Reserve Kings Harbor Drive 33.76311 -118.39538 87.27 Geotechnical Hazards Biotreatment/Capture & Reuse
San Ramon Reserve Palos Verdes Drive East 33.73169 -118.33816 66.16 Geotechnical Hazards Biotreatment/Capture & Reuse
Alta Vicente Reserve 30940 Hawthorne Blvd 33.74429 -118.4049 65.06 Geotechnical Hazards Biotreatment/Capture & Reuse
Privately Owned 7040 Vía Del Mar 33.74763 -118.40285 46.06 Privately Owned Biotreatment/Capture & Reuse
Ladera Linda Park 32200 Valor Pl 33.73924 -118.35012 33.46 Geotechnical Hazards Biotreatment/Capture & Reuse
Vista Del Norte Reserve Indian Peak Road 33.76973 -118.37363 30.66 Geotechnical Hazards Biotreatment/Capture & Reuse
Privately Owned 4903 Browndeer Ln 33.77713 -118.36651 10.98 Privately Owned
Geotechnical Hazards None - Removed
Privately Owned 1 Peppertree Dr 33.74077 -118.37041 10.68 Privately Owned None - Removed
Privately Owned 4100 Maritime Rd 33.73312 -118.35464 6.17 Privately Owned None - Removed
Privately Owned 28013 Seashell Way 33.76974 -118.36469 3.14 Privately Owned None - Removed
Vanderlip Park 6500 Seacove Drive 33.73966 -118.39118 0.89 Geotechnical Hazards Biotreatment
Capture & Reuse
Educational Use
Salvation Army College for Officer Training
30840 Hawthorne Blvd 33.74406 -118.39854 32.57 Private Institution None - Removed
Marymount California University
30800 Palos Verdes Drive East
33.73448 -118.33403 16.60 Private Institution None - Removed
Commercial Use
Southern California Edison 5739 Crestridge Rd 33.76688 -118.37292 3.66 Private Utility
Hazardous Substance Potential None - Removed
Cal Water Maintenance Facility
5837 Crest Rd 33.76073 -118.37787 3.62 Private Utility
Hazardous Substance Potential None - Removed
Southern California Edison 5741 Crestridge Rd 33.76964 -118.37631 0.67 Private Utility
Hazardous Substance Potential None - Removed

Technical Memorandum
Potential Regional BMP Locations
22 | P a g e
Table 3: Project Sites Removed From Potential EWMP BMP List
Agency Name
Land Use Designation
Site Name Site Address Latitude Longitude Approximate Site
Area (Acres) Reasons for Removal Alternative BMP Option
Rolling Hills Estates
Open Space And
Recreation
PV Landfill 26201 Crenshaw Blvd 33.78845 -118.34887 172.13
Department of Toxic Substances Control (DTSC)
30-month project for the Model Equestrian Center
None - Removed
Ernie Howlett Park & RHE City Yard
Batting Cage Trail 33.79383 -118.35249 39.11 On Top of Inert Landfill Habitat Restoration
open space 31 Peartree Ln 33.76311 -118.38886 23.86 Sensitive Environmental Area
(Headwaters of Agua Amarga Canyon) Habitat Restoration
open space 27575 Indian Peak Rd 33.77416 -118.37796 11.93 Hillside with Known Slope Stability
Issues Nearby Biotreatment/Capture & Reuse
Commercial Use
open space 627 Deep Valley Dr 33.77038 -118.37217 1.45 Hillside – Possible Slope Stability
Issues Biotreatment/Capture & Reuse

Technical Memorandum
Potential Regional BMP Locations
23 | P a g e
V. Right-of-Way BMPs
Right-of-way BMPs are systems of multiple distributed BMPs placed within a street right-of-way. These BMPs are designed to reduce the volume of stormwater discharge into the MS4 and treat stormwater runoff from adjacent streets and developments. Common right-of-way BMPs include bioretention, biofiltration, and permeable pavement. These BMPs can be implemented alone or in conjunction with one another.
A preliminary assessment has been performed to assess areas potentially available for right-of-way BMPs. This was done with a preliminary desktop GIS analysis by screening highways, arterial roads, and secondary (collector) roads within 200 feet of a catch basin location. Figure 10 and Table 4 indicate the locations for right-of-way BMPs. These locations are provided as a way to narrow down the options prior to the implementation phase.
Figure 10: Areas potentially available for right-of-way BMPs.

Technical Memorandum
Potential Regional BMP Locations
24 | P a g e
Table 4: Potential Locations for Right-of-way BMPs
Agency Name
Type Full Name Length (feet)
Latitude Longitude
Palos Verdes Estates
Secondary - Collector Cloyden Rd 1,951 33.804248 -118.390527
Secondary - Collector Granvia Altamira 6,457 33.781524 -118.417974
Primary - Arterial Palos Verdes Blvd 160 33.782064 -118.392378
Primary - Arterial Palos Verdes Blvd N 504 33.804029 -118.390561
Primary - Arterial Palos Verdes Dr N 9,881 33.803109 -118.390594
Primary - Arterial Palos Verdes Dr W 19,788 33.801283 -118.387481
Secondary - Collector Paseo Del Campo 82 33.773368 -118.416169
Secondary - Collector Paseo Del Mar 9,797 33.795589 -118.368397
Secondary - Collector Paseo Lunado 1,778 33.773605 -118.423283
Secondary - Collector Via Campesina 9,313 33.768925 -118.41413
Secondary - Collector Via Coronel 2,119 33.794786 -118.372412
Secondary - Collector Via Corta 569 33.780418 -118.414287
Primary - Arterial W Palos Verdes Dr 523 33.800069 -118.390351
Primary - Arterial Palos Verdes Drive North center median & street from the PVE/RHE boundary up to the Palos Verdes Golf Course, terminating prior to the Palos Verdes West & Palos Verdes Drive South triangular intersection.11
8,500 33.795713 -118.366623
Rancho Palos Verdes
Primary - Arterial 25th St 2,877 33.728347 -118.33644
Primary - Arterial Crenshaw Blvd 4,303 33.767744 -118.371205
Primary - Arterial Crest Rd 18,290 33.758373 -118.390213
Secondary - Collector Granvia Altamira 1,129 33.781643 -118.392363
Primary - Arterial Hawthorne Blvd 23,630 33.785371 -118.366229
Secondary - Collector Highridge Rd 2,096 33.77599 -118.38365
Secondary - Collector Indian Peak Rd 1,958 33.770142 -118.37278
Secondary - Collector Miraleste Dr 7,963 33.749757 -118.324664
Secondary - Collector Montemalaga Dr 4,199 33.790374 -118.382143
Secondary - Collector Palos Verdes Dr E 30,193 33.759798 -118.330268
Primary - Arterial Palos Verdes Dr S 24,222 33.733908 -118.350437
Primary - Arterial Palos Verdes Dr W 7,890 33.75798 -118.412981
Secondary - Collector Silver Spur Rd 4,216 33.78475 -118.372839
Primary - Arterial Western Ave 6,798 33.759573 -118.312564
11 High priority. There are a number of storm drains crossing this center median and there are catch basins all along the median on both sides suggesting a possible opportunity for green street modifications.

Technical Memorandum
Potential Regional BMP Locations
25 | P a g e
Agency Name
Type Full Name Length (feet)
Latitude Longitude
Rancho Palos Verdes (Los Angeles)
Secondary - Collector W Summerland Ave 48 33.747043 -118.309505
Rancho Palos Verdes (Rolling Hills)
Secondary - Collector Eastfield Dr 47 33.759742 -118.330347
Rolling Hills Estates
Primary - Arterial Crenshaw Blvd 3,030 33.767697 -118.36722
Primary - Arterial Hawthorne Blvd 10,379 33.762021 -118.392763
Secondary - Collector Highridge Rd 5,664 33.770067 -118.381005
Secondary - Collector Indian Peak Rd 2,191 33.771945 -118.375658
Secondary - Collector Palos Verdes Dr E 8,675 33.784803 -118.319881
Primary - Arterial Palos Verdes Dr N 17,085 33.77921 -118.347496
Secondary - Collector Rolling Hills Rd 3,783 33.783279 -118.340673
Secondary - Collector Silver Spur Rd 8,401 33.785698 -118.37258
Rolling Hills Estates (Rolling Hills)
Secondary - Collector Portuguese Bend Rd 113 33.776319 -118.343863
Unincorporated (Ocean View)
Primary - Arterial Crenshaw Blvd 9,488 33.775253 -118.359204
Primary - Arterial Palos Verdes Dr N 1,661 33.779995 -118.348685

APPENDIX 6
REASONABLE ASSURANCE ANALYSIS (RAA)
TECHNICAL MEMORANDUM

3415 S. Sepulveda Blvd., Suite 500
Los Angeles, CA 90034 PH 310.957.6100
FAX 310.957.6101
www.geosyntec.com
Peninsula EWMP - RAA Summary
T e c h n i ca l M emo r a n d u m
Date: May 11, 2015 (Draft)
January 21, 2016 (Revised Final)
To: John L. Hunter & Associates
From: Ken Susilo, PE, D.WRE, Brandon Steets, PE, Christopher Wessel, PE,
and Curtis Fang, Geosyntec Los Angeles
Subject: Peninsula EWMP – RAA Summary
Geosyntec Project: LA0304
1 RAA APPROACH AND METHODOLOGY
1.1 Introduction
Following the 2012 adoption of the National Pollutant Discharge Elimination System (NPDES)
Municipal Separate Storm Sewer System (MS4) Permit (Permit), the City of Palos Verdes Estates,
City of Rancho Palos Verdes, City of Rolling Hills Estates, County of Los Angeles, and Los
Angeles County Flood Control District (LACFCD) agreed to collaborate on the development of
an Enhanced Watershed Management Program (EWMP) to address the water quality priorities for
the Palos Verdes Peninsula watersheds. This group of Permittees is referred to as the Palos Verdes
Peninsula Watershed Management Group (Peninsula WMG).
On June 27, 2014, the Peninsula WMG submitted the Peninsula EWMP Work Plan to the Los
Angeles Regional Water Quality Control Board (Regional Board) (Peninsula EWMP Group,
2014). The EWMP Work Plan detailed the proposed Reasonable Assurance Analysis (RAA)
approach to address the identified Category 1, 2, and 3 water body pollutant combinations
(WBPCs). This memorandum is intended to provide a summary of the RAA approach for both wet
and dry weather, including any refinements to the approach since the June submittal, as well as to
present quantitative and qualitative analyses to demonstrate reasonable assurance that the load
reduction targets will be met by the compliance deadlines for the identified WBPCs.
1.2 Geographical Scope of RAA
The RAA was performed for the Peninsula WMG area, as shown in Figure 1. This area includes
two HUC-12 watersheds – Santa Monica Bay (SMB) and Dominguez Channel. Within the
Dominguez Channel Watershed Management Area (WMA), three different subwatersheds are
present with different WBPCs – Greater LA Harbor (GLA Harbor), Machado Lake, and
Wilmington Drain which is tributary to Machado Lake. In order to perform the RAA, analysis
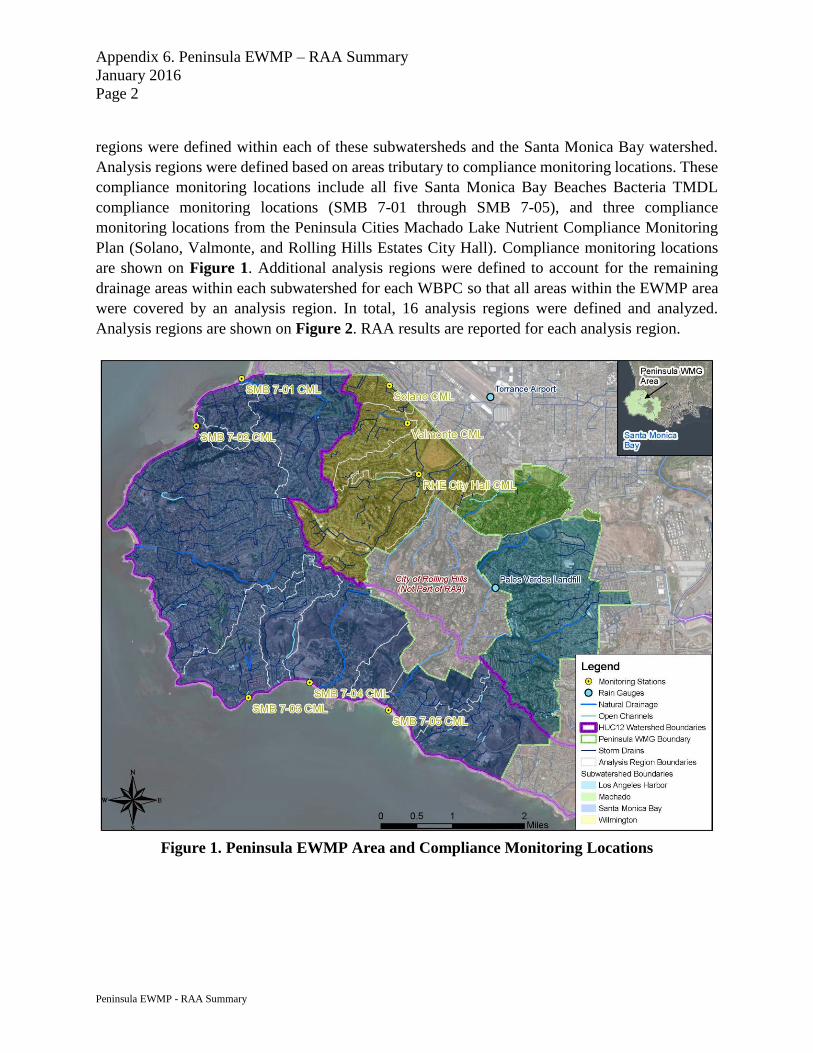
Appendix 6. Peninsula EWMP – RAA Summary
January 2016
Page 2
Peninsula EWMP - RAA Summary
regions were defined within each of these subwatersheds and the Santa Monica Bay watershed.
Analysis regions were defined based on areas tributary to compliance monitoring locations. These
compliance monitoring locations include all five Santa Monica Bay Beaches Bacteria TMDL
compliance monitoring locations (SMB 7-01 through SMB 7-05), and three compliance
monitoring locations from the Peninsula Cities Machado Lake Nutrient Compliance Monitoring
Plan (Solano, Valmonte, and Rolling Hills Estates City Hall). Compliance monitoring locations
are shown on Figure 1. Additional analysis regions were defined to account for the remaining
drainage areas within each subwatershed for each WBPC so that all areas within the EWMP area
were covered by an analysis region. In total, 16 analysis regions were defined and analyzed.
Analysis regions are shown on Figure 2. RAA results are reported for each analysis region.
Figure 1. Peninsula EWMP Area and Compliance Monitoring Locations
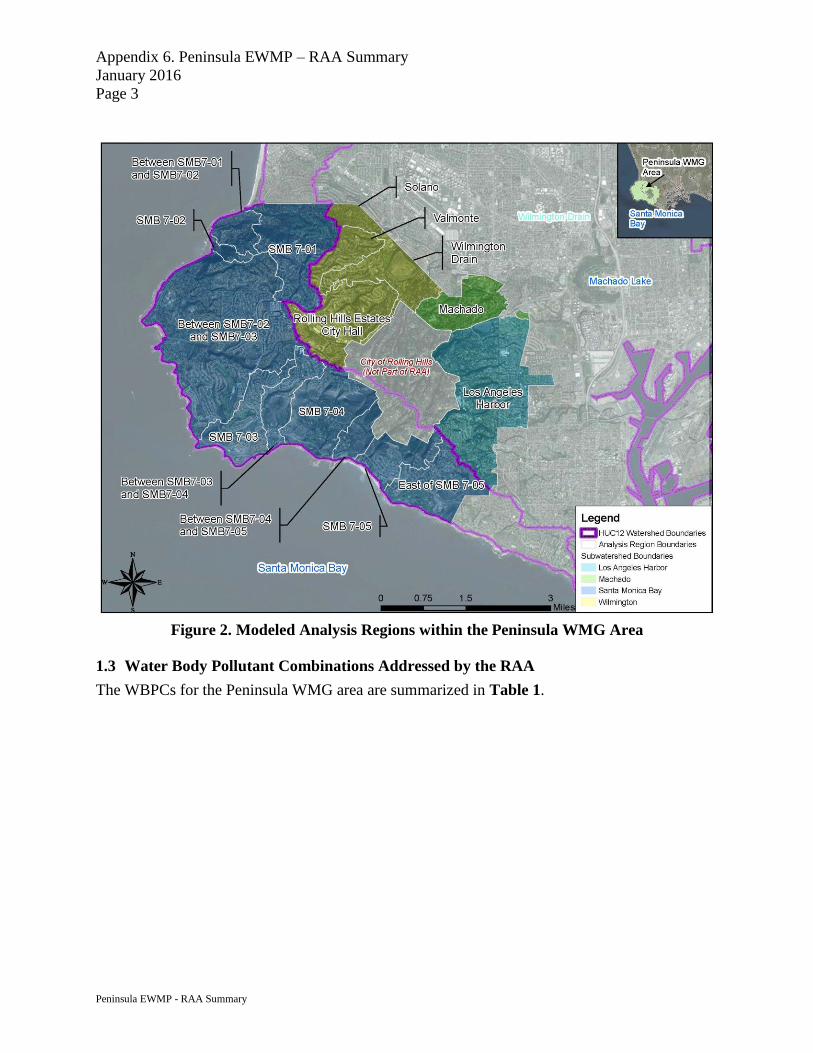
Appendix 6. Peninsula EWMP – RAA Summary
January 2016
Page 3
Peninsula EWMP - RAA Summary
Figure 2. Modeled Analysis Regions within the Peninsula WMG Area
1.3 Water Body Pollutant Combinations Addressed by the RAA
The WBPCs for the Peninsula WMG area are summarized in Table 1.

Appendix 6. Peninsula EWMP – RAA Summary
January 2016
Page 4
Peninsula EWMP - RAA Summary
Table 1. Water Body Pollutant Combinations1
Category Class Pollutant Waterbody WBPC Type
Category
1
Trash Trash/Marine Debris Santa Monica Bay and Machado Lake TMDL
Bacteria Coliform and
Enterococcus Santa Monica Bay TMDL
Historic
Organics
PCBs Santa Monica Bay, Machado Lake and
Los Angeles Harbor TMDL
DDT Santa Monica Bay, Machado Lake and
Los Angeles Harbor TMDL
Chlordane Machado Lake and Los Angeles Harbor TMDL Dieldrin Machado Lake TMDL
Nutrients
Total Nitrogen Machado Lake TMDL Total Phosphorus Machado Lake TMDL
Ammonia Machado Lake TMDL Chlorophyll2 Machado Lake TMDL
Dissolved Oxygen2 Machado Lake TMDL Odor2 Machado Lake TMDL
Eutrophic Conditions2 Machado Lake TMDL Algae2 Machado Lake TMDL
Metals
Copper Los Angeles Harbor TMDL Lead Los Angeles Harbor TMDL
Mercury Los Angeles Harbor TMDL Zinc Los Angeles Harbor TMDL
PAHs
PAHs Los Angeles Harbor TMDL Benzo(a)pyrene Los Angeles Harbor TMDL
Chrysene Los Angeles Harbor TMDL Benzo[a]anthracene Los Angeles Harbor TMDL
Dibenz[a,h]anthracene Los Angeles Harbor TMDL Phenanthrene Los Angeles Harbor TMDL
Pyrene Los Angeles Harbor TMDL
Category
2
Metals3
Copper Machado Lake
(Wilmington Drain) 303(d)
Lead Machado Lake
(Wilmington Drain) 303(d)
Bacteria Coliform Bacteria Machado Lake
(Wilmington Drain) 303(d)
Category
3
No recent (past 10 years) receiving water monitoring data are currently available from within the
Peninsula EWMP Area; therefore, no Category 3 WBPCs can be identified at this time 1 WBPCs in bold are modeled as part of the RAA. 2 These “constituents” are not pollutants, but rather describe water quality conditions associated with excessive
nutrients; therefore they have been categorized in the same class as other nutrients. 3 Copper and lead in Wilmington Drain were not modeled as part of the RAA, as the Regional Board has indicated
non-impairment for copper and lead in the Dominguez Channel and Greater Los Angeles and Long Beach Harbor
Waters Toxic Pollutants TMDL.

Appendix 6. Peninsula EWMP – RAA Summary
January 2016
Page 5
Peninsula EWMP - RAA Summary
Of the WBPCs listed in Table 1, a subset has been quantitatively modeled as part of the RAA. For
pollutants with statistically robust datasets that can be used to adequately and quantitatively predict
loading rates and BMP effectiveness, the quantitative RAA was conducted using Permit-approved
modeling tools. Where available datasets were inadequate to support direct quantitative
predictions, or where insufficient information is available to link Peninsula WMG MS4 discharges
to these WBPCs, modeling was not performed. As monitoring data are collected per the Peninsula
Coordinated Integrated Monitoring Program (CIMP), the RAA will be updated, as necessary, per
the adaptive management process. Modeled pollutants are shown in bold in Table 1 and include:
Fecal Coliform – representative of all fecal indicator bacteria for both the Santa Monica
Bay and Wilmington Drain subwatersheds.
Total Nitrogen – modeled as the sum of Total Kjehldahl Nitrogen and Nitrate as nitrogen.
Nitrite as nitrogen is not included in this summation, as nitrite concentrations are assumed
to be negligible in stormwater, as evidenced by MS4 monitoring data from the Peninsula
and Los Angeles County.1 This pollutant was modeled for those analysis regions tributary
to Machado Lake (including Wilmington Drain).
Total Phosphorus – modeled for those analysis regions tributary to Machado Lake
(including Wilmington Drain).
Total Copper – modeled for the analysis region tributary to the GLA Harbor.
Total Lead – modeled for the analysis region tributary to the GLA Harbor.
Total Zinc - modeled for the analysis region tributary to the GLA Harbor.
For Machado Lake, the total nitrogen target set by the TMDL and assessed as part of this RAA
incorporates all forms of nitrogen, including ammonia. As stated in the TMDL, the total nitrogen
target expressed as a monthly average (1.0 mg/L) is protective of chronic aquatic life exposure for
ammonia. Therefore, is it assumed that the attainment of the total nitrogen target will result in
attainment of the ammonia target, and separate modeling of ammonia is not conducted herein.2 In
addition, the other “constituents” listed in Table 1 as nutrient impairments for Machado Lake are
not pollutants, but rather describe disturbed ecological endpoints associated with excessive
nutrients; therefore, they have been categorized in the same class as other nutrients, and have been
1 Annual nutrient reporting for the Machado Lake Nutrient TMDL by the Peninsula WMG found nitrite in MS4
discharges above the detection limit in less than 3 percent of their total samples (Northgate Environmental
Management, Inc., 2014). In addition, the Los Angeles County land use event mean concentrations show that nitrite
as nitrogen accounts for 2.2 – 3.4 percent of total nitrogen in urban stormwater (County of Los Angeles, 2000). 2 Additionally, based on the 1994-2000 Los Angeles County land use EMC data set (Los Angeles County, 2000),
median ammonia concentrations in stormwater samples from all urban land uses are 0.4 mg/L or less, which is well
below typical chronic and acute ammonia criteria values.

Appendix 6. Peninsula EWMP – RAA Summary
January 2016
Page 6
Peninsula EWMP - RAA Summary
assumed to be addressed by the demonstration of reasonable assurance of meeting the total
nitrogen and total phosphorus standards for Machado Lake.
Copper and lead in Wilmington Drain were not analyzed, as the Regional Board has indicated non-
impairment for copper and lead, and that these pollutants will be removed from the 303(d) list
when sufficient data is available to de-list in accordance with the State Listing Policy. 3
2 REASONABLE ASSURANCE ANALYSIS APPROACH
2.1 Consistency with Regional Board Guidance
The approach described herein, including model selection, data inputs, critical condition selection
(90th percentile year), calibration performance criteria, and output types, was selected for
consistency with the Regional Board RAA Guidance Document (Regional Board, 2014).
2.2 Consistency with Permit Limits
The Permit specifies the TMDL receiving water limits (RWLs) and water quality based effluent
limits (WQBELs) applicable to each Permittee. The Peninsula RAA was conducted to demonstrate
reasonable assurance of compliance with these limits and other RWLs and WQOs for non-TMDL
WBPCs. In instances where critical conditions were not explicitly defined (e.g., a critical condition
of “wet weather” without an associated rainfall or flow-based criterion), steps were taken to
establish a link between the expressed Permit limit and the modeled pollutant concentrations and
loads. Table 2 summarizes these steps for each modeled WBPC with a Permit-established limit.
3 Dominguez Channel and Greater Los Angeles and Long Beach Harbor Waters Toxic Pollutants TMDL.

Appendix 6. Peninsula EWMP – RAA Summary
January 2016
Page 7
Peninsula EWMP - RAA Summary
Table 2. Permit Limits for Modeled Pollutants (Final Limits shown for Category 1 WBPCs)
Waterbody Pollutant RWL/WQBEL Note on Modeling Assumptions
SMB
Fecal Coliform
(as surrogate for
all marine fecal
indicator bacteria)
Allowable Exceedance
Days per season per year,
all of which are based on
anti-degradation
Allowed loads are assumed to be equivalent to
baseline loads for all anti-degradation-based SMBBB
TMDL monitoring locations, resulting in Target
Load Reductions of zero, as detailed in Section 2.5.
Machado
Lake
Total Nitrogen 1.0 mg/L
(monthly avg)
Since the critical condition is only defined as “wet
weather,” these monthly limits were applied to the
wettest month of the 90th percentile year to establish
the allowed load for each pollutant. An annual basis
was then used for modeling to be consistent with all
other WBPCs in this EWMP.1
Total Phosphorus 0.1 mg/L
(monthly avg)
Wilmington
Drain
Fecal Coliform
(as surrogate for
e. coli bacteria)
400 MPN/100mL, with a
19% allowed exceedance
rate2
A maximum number of “discharge days” were set
based on the assumption that 19% of wet weather
days during a 90th percentile wet year would be
allowed to exceed the REC1 single sample
objectives, consistent with the Los Angeles River
Bacteria TMDL. A target load reduction was then
established based on this allowed number of
discharge days. Section 2.5.2 provides additional
details on this process.
GLA Harbor
(Inner
Harbor)
Copper 1.7 kg/yr Permit limits are expressed as allowed annual
loading of sediment-associated pollutants per year
for the entire watershed, with the “wet weather”
critical condition not precisely defined (e.g., based
on a rainfall or flowrate value). To translate these
watershed-wide allowed loads to the smaller
Peninsula WMA, an allowed concentration is
needed. Since allowed sediment-based
concentrations are not provided in the Permit or
TMDL (rather, through the TMDL’s linkage
analysis, the numeric targets [sediment quality
criteria] were translated into allowed MS4 loads
through pollutant and sediment fate/transport
modeling of the Harbor), for RAA modeling
purposes, MS4 discharge limits are assumed to be
the California Toxics Rule (CTR) chronic criteria for
saltwater. To compute allowed annual loads for the
WMA, the CTR criteria concentrations were applied
to 90th percentile annual runoff volumes to establish
the allowed load for each pollutant.
Lead 34.0 kg/yr
Zinc 115.9 kg/yr
GLA Harbor
(Outer
Harbor)
Copper 1.7 kg/yr
Lead 34.0 kg/yr
Zinc 115.9 kg/yr
GLA Harbor
(Fish
Harbor)
Copper 1.7 kg/yr
Lead 34.0 kg/yr
Zinc 115.9 kg/yr
GLA Harbor
(Cabrillo
Marina)
Copper 1.7 kg/yr
Lead 34.0 kg/yr
Zinc 115.9 kg/yr
1 Since the TLR was established for the wettest month of the 90th percentile year, then applied to the entire modeled
year, it is inherently protective of water quality for each month of the entire 90th percentile year given the higher
nutrient loads during wet weather. 2 Since this is a Category 2 WBPC, no TMDL limit exists. The single sample maximum REC 1 Basin Plan Objective
is therefore applicable (the old fecal coliform objective is used due to limited data availability for E. coli), with an
assumed wet weather exceedance rate based on other freshwater TMDLs in the region.

Appendix 6. Peninsula EWMP – RAA Summary
January 2016
Page 8
Peninsula EWMP - RAA Summary
As stated in Table 2, the critical condition for both the Machado Lake Nutrient TMDL and the
Greater Los Angeles Harbor Toxics and Metals TMDL was defined simply as “wet weather”. It
was therefore assumed that the 90th percentile year is the critical year for these two TMDLs.
For bacteria in Wilmington Drain, which is a Category 2 WBPC and therefore does not have a
TMDL (or a TMDL-based limit), it was assumed that 19% of wet weather days could be
considered allowable discharge days (i.e., days when MS4 discharge-caused exceedances were
allowed), based on other freshwater TMDLs in the region, which use the reference stream dataset.4
Since the dominant rain gauge in the Wilmington Drain subwatershed (Palos Verdes Landfill
gauge) had 82 wet weather days in TMDL year 1995, it was assumed that 16 discharge days are
allowed in the Wilmington Drain subwatershed.5 Further details on the methods and assumptions
related to baseline loads and allowed loads for bacteria in Wilmington Drain can be found in
Section 2.5.2.
2.3 Reasonable Assurance Analysis Approach - Dry Weather
Demonstrating “reasonable assurance” of compliance with applicable dry weather Permit limits
requires a methodology that accounts for many factors that cannot be accurately modeled based
on urban runoff processes alone (Thoe et al, 2015), despite the extensive dry weather monitoring
datasets that are available. Therefore, to perform the RAA for dry weather for the Peninsula WMG
Area, a semi-quantitative methodology has been developed to follow a permit compliance
structure, which applies independent lines of evidence for demonstrating that MS4 discharges are
not causing or contributing to receiving water exceedances. The following criteria form the dry
weather RAA methodology. If one criterion is met for each compliance monitoring location, then
“reasonable assurance” is considered to be demonstrated.
1. If a dry weather diversion, infiltration, or disinfection system is located at the downstream
end of the analysis region, “reasonable assurance” is considered to be demonstrated. To
meet this criterion, any such system should have records to show that it is consistently
operational, well maintained, and effectively removing bacteria in the treated effluent (in
the case of disinfection facilities). Diversion or infiltration systems should demonstrate
consistent operation and maintenance so that all freshwater surface discharges to the
receiving water are effectively eliminated during year-round dry weather days. For this
criterion to be met, supporting records from the non-stormwater outfall screening program
should be supplied.
4 For example, this value is consistent with the Los Angeles River Bacteria TMDL, which allows a 19 percent wet
weather exceedance percentage (of REC1 freshwater single sample objectives) based on SCCWRP reference stream
monitoring data. 5 0.19 x 82 wet weather days = 15.6 discharge days.

Appendix 6. Peninsula EWMP – RAA Summary
January 2016
Page 9
Peninsula EWMP - RAA Summary
2. For the Santa Monica Bay Beaches Bacteria TMDL compliance monitoring locations, if
the allowed summer-dry and winter-dry single sample exceedance days have been
achieved for four out of the past five years and the last two years, then the existing water
quality conditions at this compliance monitoring location are acceptable, and “reasonable
assurance” is considered to be demonstrated.
3. If non-stormwater MS4 outfall discharges have been eliminated within the analysis region,
“reasonable assurance” is considered to be demonstrated. For this criterion to be met,
supporting records from the non-stormwater outfall screening program should be supplied.
This methodology was presented to Regional Board staff on April 9, 2014, and verbal feedback
received at the time was supportive.
2.4 RAA Approach – Wet Weather
The wet-weather RAA process consists generally of the following steps:
Identify WBPCs for which the RAA will be performed;
Identify the MS4 service area (exclude lands of agencies not party to this EWMP such as
the City of Rolling Hills, Federal land, State land, etc.);
For each analysis region (Figure 2), develop target load reductions (TLRs) for 90th
percentile year based on Permit and Regional Board guidance;
Identify structural and non-structural BMPs that were either implemented after applicable
TMDL effective dates or are planned for implementation in the future;
Evaluate the performance of these BMPs in terms of annual pollutant load reductions;
Compare these estimates with the TLRs; and
Revise the BMP implementation scenario until TLRs are met.
TLRs (discussed in more detail below) represent a numerical expression of the Permit compliance
metrics (e.g., bacteria allowable exceedance days (“AEDs”) for wet weather) that can be modeled
and can serve as a basis for confirming that the EWMP is in compliance with the Permit. Thus, if
the structural and non-structural BMPS by which the TLRs are achieved in the EWMP are
appropriately implemented, compliance with the MS4 Permit will be reasonably demonstrated and
assured.

Appendix 6. Peninsula EWMP – RAA Summary
January 2016
Page 10
Peninsula EWMP - RAA Summary
2.4.1 SBPAT Model
The recommended RAA approach leverages the strengths of the publicly available, Permit-
approved, Geographical Information System (GIS)-based model that has already been developed
for the region: SBPAT (Regional Board, 2014 and Regional Board, 2012).6
SBPAT is a public domain, “open source,” GIS-based water quality analysis tool intended to: 1)
facilitate the identification, prioritization, and selection of BMP project opportunities and
technologies in urbanized watersheds; and 2) quantify benefits, costs, variability, and potential
compliance risk associated with stormwater quality projects. The decision to use SBPAT for the
Peninsula WMG RAA in the manner described below was partially based on the model capabilities
and the unique characteristics of the Peninsula WMG, specifically:
1. Modeling of SMB hydrologic and watershed processes – SBPAT utilizes EPA’s
Stormwater Management Model (SWMM) as the hydrologic engine, and SBPAT has been
calibrated to local rainfall and SMB streamflow gauges as well as the calibrated
Dominguez Channel LSPC model, confirming the ability to predict stormwater runoff
volumes on an annual basis;
2. SMB pollutants of concern and their compliance metric expression – SBPAT has been
utilized for planning applications related to Bacteria TMDL compliance (i.e., exceedance
day-based prediction), including a demonstrated linkage of watershed bacteria loading to
beach exceedance days;
3. Availability of new open space water quality loading data – Recently developed Event
Mean Concentration (EMC) data are consistent with, and easily incorporated into, SBPAT
and were developed as part of this RAA-development effort;
4. Capability to conduct opportunity and constraints investigations – SBPAT was
specifically designed to support structural BMP placement, prioritization, and cost-benefit
quantification, and has been previously applied for such purposes in over ten other Los
Angeles region watersheds;
5. Characterization of water quality variability – SBPAT is capable of quantifying model
output variability and confidence levels, which is a component of the Regional Board’s
RAA guidance (Regional Board, 2014); and
6. Supports quantification of interim milestones, consistent with methods addressing
both structural and non-structural BMPs – SBPAT can model interim design scenarios
by adjusting BMP input parameters to represent steps in BMP phasing. SBPAT can also
model some non-structural wet weather BMPs, such as LID incentives and LID ordinance
implementation for redevelopment projects.
6 SBPAT is specifically referenced in the MS4 Permit Part VI.C.5.b.iv and was presented at the first two Permit Group
TAC RAA Subcommittee meetings.
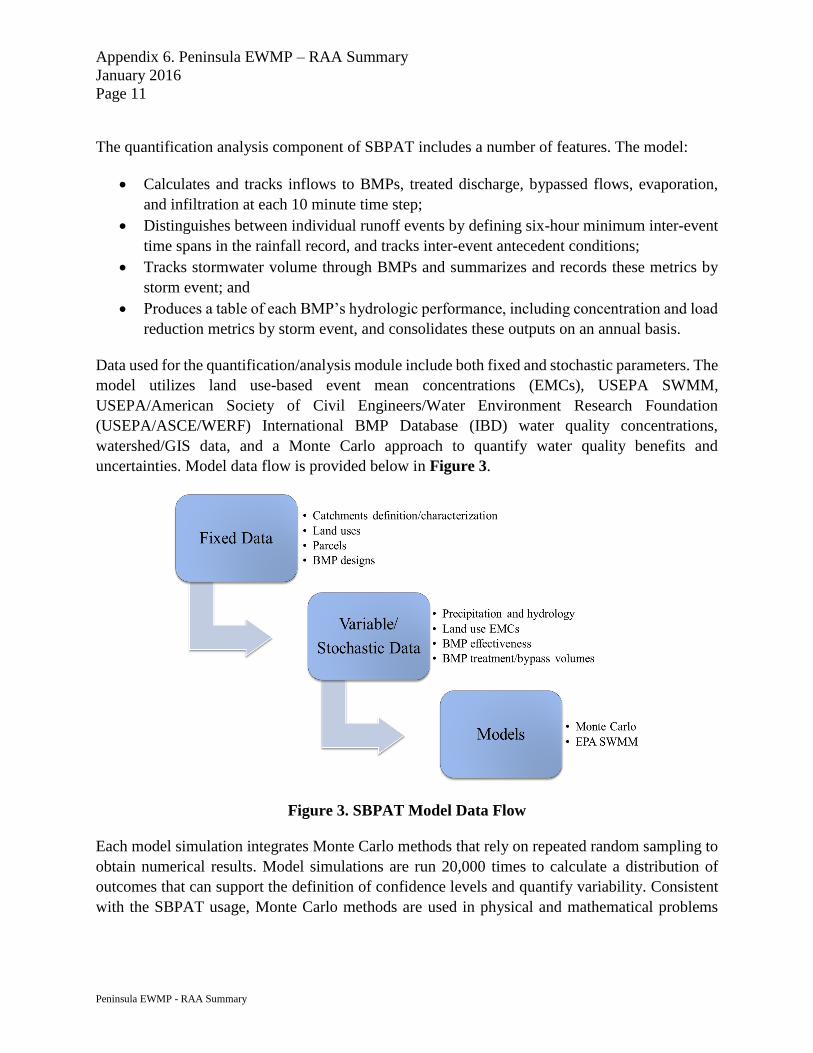
Appendix 6. Peninsula EWMP – RAA Summary
January 2016
Page 11
Peninsula EWMP - RAA Summary
The quantification analysis component of SBPAT includes a number of features. The model:
Calculates and tracks inflows to BMPs, treated discharge, bypassed flows, evaporation,
and infiltration at each 10 minute time step;
Distinguishes between individual runoff events by defining six-hour minimum inter-event
time spans in the rainfall record, and tracks inter-event antecedent conditions;
Tracks stormwater volume through BMPs and summarizes and records these metrics by
storm event; and
Produces a table of each BMP’s hydrologic performance, including concentration and load
reduction metrics by storm event, and consolidates these outputs on an annual basis.
Data used for the quantification/analysis module include both fixed and stochastic parameters. The
model utilizes land use-based event mean concentrations (EMCs), USEPA SWMM,
USEPA/American Society of Civil Engineers/Water Environment Research Foundation
(USEPA/ASCE/WERF) International BMP Database (IBD) water quality concentrations,
watershed/GIS data, and a Monte Carlo approach to quantify water quality benefits and
uncertainties. Model data flow is provided below in Figure 3.
Figure 3. SBPAT Model Data Flow
Each model simulation integrates Monte Carlo methods that rely on repeated random sampling to
obtain numerical results. Model simulations are run 20,000 times to calculate a distribution of
outcomes that can support the definition of confidence levels and quantify variability. Consistent
with the SBPAT usage, Monte Carlo methods are used in physical and mathematical problems

Appendix 6. Peninsula EWMP – RAA Summary
January 2016
Page 12
Peninsula EWMP - RAA Summary
when it is difficult to obtain a closed-form expression or when a deterministic algorithm is not
desired. A schematic of SBPAT’s Monte Carlo process is provided in Figure 4.
Model documentation, as well as links to related technical articles and presentations, is provided
at www.sbpat.net.
Figure 4. SBPAT Monte Carlo Method Components
2.4.2 Spatial Domain
The spatial domain of the RAA includes all land within the Peninsula WMG area (Figure 1).
Adjustments have been made to account for contributions from agencies not party to this EWMP
(e.g., City of Rolling Hills, State/Federal, etc.), and will be described in more detail later.
SBPAT utilizes a customized version of SWMM for continuously simulating study area hydrology
and BMP hydraulics. Long‐term, hourly rainfall data and average monthly evapotranspiration
values are used along with land use-linked catchment imperviousness and soil properties to
estimate runoff volumes. Revised and recalibrated SBPAT database values and EWMP-defined

Appendix 6. Peninsula EWMP – RAA Summary
January 2016
Page 13
Peninsula EWMP - RAA Summary
BMP information are used to estimate the volume of runoff generated from watershed areas and
captured by BMPs. Storm events are individually tracked for the entire simulation so that the
volumes of runoff infiltrated, evapotranspired, captured, and released (if applicable) by BMPs are
estimated for every storm event. Hourly rainfall data from Los Angeles County rainfall gauges at
Palos Verdes Landfill (Station ID 1252) and Torrance Municipal Airport (Station ID 1158) were
used in the Peninsula EWMP RAA. For each modeled analysis region, the rain gauge nearest the
analysis region was used. Rain gauges are shown on Figure 1.
The priority WBPCs for the Peninsula EWMP Area, combined with data availability, establishes
the specific WBPCs addressed by the RAA. As previously described, SBPAT links the long‐term
hydrologic output from SWMM to a stochastic Monte Carlo water quality model to develop
statistical descriptions of stormwater quantity and quality. Through this approach, the predicted
runoff volumes for each storm are randomly sampled from the long‐term storm event runoff
volume record produced by SWMM. Land use-based wet weather pollutant EMC values (see
Attachment A) and BMP effluent concentrations (see Attachment B) for each storm are then
randomly sampled from their lognormal statistical distributions. The runoff volumes (including
volumes treated and bypassed by BMPs), land use EMCs, and BMP effluent concentrations are
combined to determine the total pollutant loads and load reductions (i.e., difference between
existing and post‐BMP load estimates) for each sampled storm event. This procedure is then
repeated 20,000 times, each time recording the volume, pollutant concentrations, loads, and load
reductions for each selected storm event. The statistics of these recorded results are then used to
characterize the low (25th percentile), average (mean), and high (75th percentile) values for the
annual volume, pollutant loads, and pollutant concentrations in stormwater runoff from the
modeled area, with and without BMPs implemented to calculate load reductions.
The International Stormwater BMP Database (IBD) is a comprehensive source of BMP
performance information (www.bmpdatabase.org), comprised of data from a peer-reviewed
collection of studies that have monitored the effectiveness of a variety of BMPs in treating water
quality pollutants for a variety of land use types. Water quality performance data from the IBD
were used to develop effluent concentrations (averages and standard deviations) of the BMPs and
constituents listed in Table 3. As with land use EMCs, the effluent quality of BMPs is highly
variable. To account for this variability in SBPAT, effluent quality data were analyzed and
descriptive statistics were generated for use in the Monte Carlo statistical sampling technique.
Attachment B contains detailed information on the BMP effluent statistics.

Appendix 6. Peninsula EWMP – RAA Summary
January 2016
Page 14
Peninsula EWMP - RAA Summary
Table 3. BMPs and Constituents Modeled in SBPAT1
BMPs Constituents
Constructed Wetland / Retention Pond (with Extended
Detention)
Constructed Wetland / Retention Pond (without Extended
Detention)
Dry Extended Detention Basin
Hydrodynamic Separator
Media Filter
Subsurface Flow Wetland
Treatment Plant
Bioswale
Bioretention with underdrain
Bioretention (volume reduction only)3
Cistern (volume reduction only)3
Green Roof (volume reduction only)3
Porous Pavement (volume reduction only)3
Low Flow Diversion (volume reduction only)3
Fecal Coliform (FC)
Total lead (TPb)
Total suspended solids (TSS)
Total phosphorus (TP)
Dissolved phosphorus as P (DP)2
Ammonia as N (NH3)
Nitrate as N (NO3)
Total Kjeldahl nitrogen as N (TKN)
Dissolved copper (DCu)
Total copper (TCu)
Dissolved zinc (DZn)
Total zinc (TZn)
1 All constituents are addressed for all BMPs that provide treatment (i.e., excluding those identified as “volume
reduction only”). 2 Dissolved phosphorus and orthophosphate datasets were combined to provide a larger dataset and because the
majority of orthophosphate is typically dissolved and many datasets either report dissolved phosphorus or
orthophosphate, but not both. 3 For these BMPs, it is assumed that 100% of pollutant loads associated with the volume of water infiltrated is treated
by the BMP. Water that bypasses or overflows from the BMP is assumed to receive no treatment.
2.4.3 Critical Condition Definition
As shown in Table 2, all WBPCs in this RAA were evaluated using annual TLRs (i.e., the TLRs
are expressed as load reductions relative to a baseline critical year). Consistent with the Permit-
limits (in those instances where critical periods and time units were specified)7 and the Regional
Board RAA Guidance (Regional Board, 2014), the 90th percentile critical year was used for every
WBPC. The critical year was determined by evaluating the total annual rainfall and the total
number of wet weather days8 at two representative rain gauges in the Peninsula WMG area.
Historical rainfall data between 1987 and 2012 were analyzed. Rainfall analyses were performed
for bacteria “TMDL years” (i.e., November 1 – October 31) in order to provide consistency with
TMDLs and the CIMP. Based on both total annual rainfall and total number of wet days, 1995 was
7 As stated in Table 2, critical periods are specifically defined as “wet weather” in the Dominguez Channel and Greater
Los Angeles and Long Beach Harbor Waters Toxic Pollutants TMDL and Machado Lake Nutrient TMDL. No other
time units were specified for these critical conditions. 8 Consistent with the SMB Beaches Bacteria TMDL (and all other Los Angeles region bacteria TMDLs), “wet
weather” days are defined as days with at least 0.1” of rainfall and the three days immediately following.

Appendix 6. Peninsula EWMP – RAA Summary
January 2016
Page 15
Peninsula EWMP - RAA Summary
found to be greater than or equal to the 90th percentile year for both rain gauges. 1995 was therefore
selected as the critical year to be modeled in the RAA, preserving consistency with other EWMPs
within the SMB Watershed. Table 4 summarizes the rainfall data for 1995.
Table 4. 1995 Rainfall Summary at Peninsula Precipitation Gauges
Wet
Days
Total Rainfall
(in)
Palos Verdes Landfill
(Station ID 1252) 82 29.52
Torrance Municipal Airport
(Station ID 1158) 81 27.81
A summary of annual rainfall data for each gauge above is provided in Attachment D.
2.4.4 Hydrologic Calibration
2.4.4.1 Santa Monica Bay Watershed
In the Peninsula Cities EWMP SMB Watershed, the hydrology component of SBPAT was
calibrated for the only SMB subwatershed where all data requirements (daily flow, hourly
precipitation, and daily beach bacteria concentrations) were met - the Topanga Creek
subwatershed, which is located between SMB jurisdictions 1 and 2. No other SMB subwatersheds
meet the calibration data requirements.
Since primary output for SBPAT includes annual volumes and pollutant loads, the calibration
focused on accurate prediction of annual discharge volumes from the Topanga Creek subwatershed
outlet, with estimated baseflow removed. Hourly rainfall data were used for the nearby Lechuza
Patrol Station #72 gauge (gauge reference ID 352b) in Malibu, with these data adjusted upward
based on an annual rain depth ratio between the higher elevation Topanga Fire Station #69 gauge
(gauge reference ID 6) and the coastal Lechuza gauge. Los Angeles County’s Topanga Creek
streamflow gauge (gauge reference ID F54C-R) was used to estimate measured annual discharge
volumes for comparison with modeled volumes. The effective impervious percentage for the open
space land use category and the saturated hydraulic conductivity of all mapped soil types served
as calibration parameters.
The hydrology component of SBPAT was calibrated for SMB based on data for Topanga Creek,
a HUC-12 subwatershed located within the eastern portion of the North Santa Monica Bay Coastal
Watersheds. Since primary output for SBPAT includes annual volumes and pollutant loads, the
calibration focused on accurate prediction of annual discharge volumes based on hourly rainfall
data, as compared with stream flow data. The effective impervious percentage for the open space
land use category and the saturated hydraulic conductivity of all mapped soil types served as
calibration parameters. Calibration resulted in a vacant undifferentiated land use effective
imperviousness value of 1% and for saturated hydraulic conductivity, required the evaluation of

Appendix 6. Peninsula EWMP – RAA Summary
January 2016
Page 16
Peninsula EWMP - RAA Summary
various multipliers that would result in increased model runoff (i.e., each soil type’s original
hydraulic saturated conductivity was multiplied by the same value). The calibration was performed
iteratively with multipliers ranging from 0.1 to 2.0 until the average annual modeled volume
produced an acceptable error value when compared to the average annual observed volumes.
Figure 5 presents the hydrologic calibration results.9 The emphasis of the calibration effort
focused on accurate, unbiased prediction of “non-extreme” annual conditions (annual volumes
exceeding a 25-year frequency, 4% probability, were excluded from the calibration effort). Based
on available data, the period of calibration was 12 years, between 2001 and 2012, with water years
2005 and 2008 excluded due to outlying streamflow measurement results.10 These calibrated input
parameter values were used throughout all SMB watersheds in the wet weather RAAs. Figure 6
presents these same results in a flow duration curve format, which compares the distribution of
annual discharge volume magnitudes throughout the period analyzed between the modeled and
observed data.
Figure 5. Annual Runoff Volumes for Topanga Subwatershed: Modeled vs. Observed
9 The calibration process presented in the Peninsula EWMP Work Plan (Peninsula EWMP Group, 2014) was refined
to produce the calibration process and results presented herein. 10 The stream gauge annual volume measurement in 2008 was unexplainably high (corresponding to a runoff
coefficient greater than one), and the 2005 year included a 15-day period of near-record rainfall levels that were
anomalously high (where the mean annual rainfall depth fell between December 27 and January 10, and major
landslides were reported in coastal Ventura County).
0
1000
2000
3000
4000
5000
6000
0 1000 2000 3000 4000 5000 6000
An
nu
al
Mo
del
ed F
low
s A
fter
Ca
lib
rati
on
(a
cre-f
t)
Topanga Annual Observed Flows (no baseflow) (acre-ft)

Appendix 6. Peninsula EWMP – RAA Summary
January 2016
Page 17
Peninsula EWMP - RAA Summary
Figure 6. Annual Runoff Volumes for Topanga Subwatershed: Modeled vs. Observed
(Flow Duration Curve Format)
Following calibration, average relative prediction error (or the percent differences between the
average annual observed and modeled annual runoff volume) was calculated to be -0.24%.
According to the Regional Board’s RAA Guidance (Regional Board, 2014, which is based on
Donigian, 2000), SBPAT model performance with respect to hydrology as a result of this
calibration is categorized as “very good.”
2.4.4.2 Dominguez Channel Watershed Management Area
In the Dominguez Channel WMA portion of the Peninsula WMG Area, including GLA Harbor
and Machado Lake subwatersheds, no stream gauges were identified in or downstream of the
Peninsula WMG area to use for calibration purposes. Therefore, in lieu of local measured
streamflow data, the county-wide calibrated Los Angeles County Loading Simulation Program
C++ (LSPC) model was used as a calibration dataset for SBPAT. As future monitoring data
become available, this calibration may be reassessed as part of the EWMP adaptive management
process.
The LSPC model was previously calibrated by California Watershed Engineering (CWE) within
the Dominguez Channel Watershed to LACFCD stream gauge S28 using the calibration
parameters in Table 3.0 of the RAA Guidelines (Regional Board, 2014). This gauge is not within
the Peninsula EWMP Area; however, it provides the nearest flow data for calibration of the LSPC
model for the Peninsula EWMP Area. A ten-year calibration period was used (2003-2012). The
0
1,000
2,000
3,000
4,000
5,000
6,000
0 10 20 30 40 50 60 70 80 90 100
An
nu
al
Ru
noff
Volu
me
(ac-
ft)
Percent of Results Below Y-Axis Value (%)
Measured Data (No Baseflow) - LACDPW Gauge ID F54C-R Modeling Output

Appendix 6. Peninsula EWMP – RAA Summary
January 2016
Page 18
Peninsula EWMP - RAA Summary
percent difference for both daily and monthly runoff volumes between the LSPC model and the
stream gauge was less than 10%, which is in the ‘very good’ category in the RAA guidelines
(CWE, 2015). The mean annual runoff volume in the LSPC model (7,210 acre-ft) was within 12%
of the stream gauge volume (8,210 acre-ft), which is in the ‘good’ range in the RAA Guidelines.
For modeling of the Peninsula WMG Area, the LSPC model was altered to only include the portion
of this area, while keeping all other model parameters unchanged. Because SBPAT only includes
storm response and LSPC includes dry weather flows, the dry weather flows were first removed
from the LSPC annual volumes using the Web-based Hydrograph Analysis Tool for porous
aquifers with ephemeral streams; this tool was developed by Purdue University to separate base
flows and runoff. Because dry weather flows are minimal in the Dominguez Channel WMA in the
LSPC model, this resulted in a decrease in volume of only 6%.
The SBPAT calibration of the Peninsula portion of the Dominguez Channel WMA focused on
accurate prediction of annual discharge volumes predicted by the LSPC model for TMDL years
1989-2011. The calibration parameters were the saturated hydraulic conductivity and the
imperviousness, which were changed by a uniform multiplier for all land uses and subcatchments
to match the LSPC predictions. The difference in mean annual volume between LSPC and the
calibrated SBPAT model was 0.09% for the GLA Harbor subwatershed, 0.47% for the Wilmington
Drain subwatershed, and 3.24% for the remaining Machado subwatershed. All of these are in the
‘very good’ category for calibration in the RAA Guidelines.
2.4.5 Water Quality Calibration
The RAA Guidelines require water quality calibration based on available monitoring data from
each analysis region over the most recent 10 years. However, in the Peninsula EWMP Area, water
quality monitoring data are not available for the applicable pollutants for freshwater (i.e., mass
emission-type) monitoring stations, so a conventional water quality calibration isn’t possible at
this time. In the future as new local monitoring data become available, this may be reevaluated as
part of the EWMP adaptive management process. In the meantime, to meet current model
verification needs for the RAA, SBPAT’s log-normal land use EMC statistics were compared with
the original land use monitoring datasets upon which they’re based. This land use based
comparison is consistent with the calibration method applied for the original county-wide LSPC
model (Los Angeles County Department of Public Works, 2010).
The land use EMCs used in SBPAT (Table A-1) were calculated from Los Angeles County data
between 1996 and 2000 (Los Angeles County, 2000) and land use-specific data collected by
SCCWRP (SCCWRP, 2007) between 2000 and 2005 (for fecal coliform data). An example of the
pollutant distribution for single family residential land use from the SCCWRP results and the
distributions used in SBPAT are shown in Figure 7 for fecal coliform bacteria. As shown by the
percentiles, the pollutant EMC distribution is well representative of measured data. The example
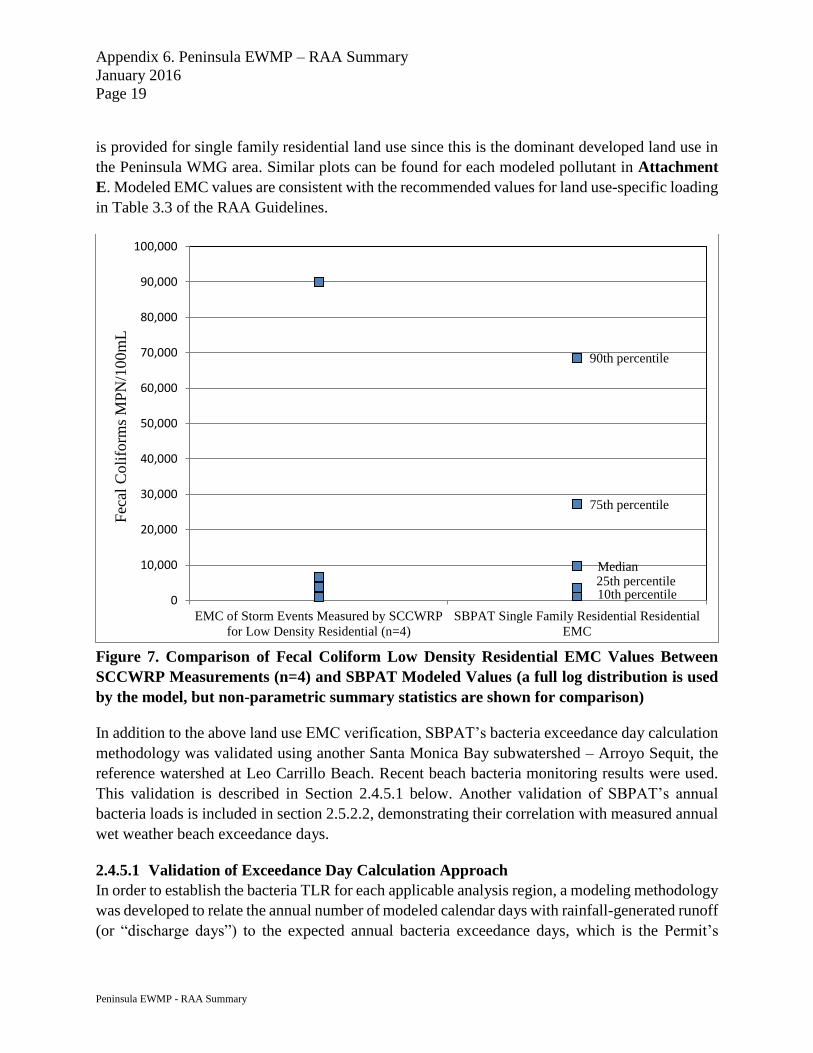
Appendix 6. Peninsula EWMP – RAA Summary
January 2016
Page 19
Peninsula EWMP - RAA Summary
is provided for single family residential land use since this is the dominant developed land use in
the Peninsula WMG area. Similar plots can be found for each modeled pollutant in Attachment
E. Modeled EMC values are consistent with the recommended values for land use-specific loading
in Table 3.3 of the RAA Guidelines.
Figure 7. Comparison of Fecal Coliform Low Density Residential EMC Values Between
SCCWRP Measurements (n=4) and SBPAT Modeled Values (a full log distribution is used
by the model, but non-parametric summary statistics are shown for comparison)
In addition to the above land use EMC verification, SBPAT’s bacteria exceedance day calculation
methodology was validated using another Santa Monica Bay subwatershed – Arroyo Sequit, the
reference watershed at Leo Carrillo Beach. Recent beach bacteria monitoring results were used.
This validation is described in Section 2.4.5.1 below. Another validation of SBPAT’s annual
bacteria loads is included in section 2.5.2.2, demonstrating their correlation with measured annual
wet weather beach exceedance days.
2.4.5.1 Validation of Exceedance Day Calculation Approach
In order to establish the bacteria TLR for each applicable analysis region, a modeling methodology
was developed to relate the annual number of modeled calendar days with rainfall-generated runoff
(or “discharge days”) to the expected annual bacteria exceedance days, which is the Permit’s
25th percentileMedian
10th percentile
75th percentile
90th percentile
0
10,000
20,000
30,000
40,000
50,000
60,000
70,000
80,000
90,000
100,000
EMC of Storm Events Measured by SCCWRP
for Low Density Residential (n=4)
SBPAT Single Family Residential Residential
EMC
Fec
al C
oli
form
s M
PN
/100m
L
Appendix 6. Peninsula EWMP – RAA Summary
January 2016
Page 20
Peninsula EWMP - RAA Summary
WQBEL expression for the SMB Beaches Bacteria TMDL and other Los Angeles region bacteria
TMDLs. To be consistent with the Santa Monica Bay Beaches Bacteria TMDL for wet weather,
which established allowed exceedance day waste load allocations based on monitoring results from
the Leo Carrillo reference beach, this modeling methodology was first tested on Leo Carrillo and
its Arroyo Sequit subwatershed for the same critical year as the TMDL (TMDL year 1993).11 The
goal of this analysis was to validate the modeling methodology by comparing its predicted
exceedance days for Leo Carrillo with the 17 exceedance days from the TMDL, for TMDL year
1993. This analysis occurred in three steps:
1. The calibrated SBPAT model, using the nearby Lechuza Patrol Station gauge for TMDL
year 1993 (consistent with the TMDL), resulted in 59 discharge days for Arroyo Sequit.
2. Based on 2003 to 2013 Leo Carrillo monitoring data, 27% of samples collected on days
with >=0.10-inch of rainfall exceeded the single sample recreational Water Quality
Objectives. In other words, on 27% of days when runoff discharges might be expected,
FIB concentrations at the beach exceeded the objectives.
3. Multiplying 59 discharge days by the 27% exceedance percentage results in 16 predicted
wet weather exceedance days for Leo Carrillo for TMDL year 1993. This result is within
6% of the 17 exceedance days that were determined through the original analysis in the
SMBBB wet weather TMDL, therefore validating the proposed exceedance day
calculation methodology.
2.5 Wet Weather Baseline Loads and Target Load Reductions
Baseline loads for the WBPCs and critical periods described in Section 1.3 were computed using
SBPAT. Baseline loads for each WBPC are summarized in Table 5.
The processes for establishing target load reductions (TLRs) for the modeled WBPCs are described
in the following section. Because USEPA’s Santa Monica Bay DDT and PCBs TMDL effectively
implements an anti-degradation approach to set MS4 WLAs to maintain and protect the receiving
waters and meet water quality standards, the existing MS4 PCB and DDT loads from the Peninsula
EWMP Area are reasonably assumed to be in compliance with the applicable WLAs. Therefore, a
target load reduction of zero has been set for PCBs and DDT. However, in spite of this zero
required load reduction, the BMPs proposed in this EWMP are expected to reduce sediment and
sediment-associated pollutants such as DDTs and PCBs, so the anticipated BMP load reductions
for DDTs and PCBs will meet the TMDL WLA.
11 Note that in the SMB Beaches Bacteria TMDL, TMDL year 1993 was defined as the critical year. However, based
on more recent rainfall records, 1995 has been determined to be the 90th percentile year, and so is used for the RAA.
See Section 2.4.3 and Attachment E.

Appendix 6. Peninsula EWMP – RAA Summary
January 2016
Page 21
Peninsula EWMP - RAA Summary
Once three years of water quality data are collected under the Peninsula CIMP, further source
assessment will be considered and the categorization and prioritization of PCBs and DDT as MS4-
related pollutants of concern will be reevaluated. If the CIMP monitoring data show that Peninsula
discharges are not in compliance with the TMDL, an RAA will be conducted for these pollutants
and the EWMP will be revised accordingly.
2.5.1 Santa Monica Bay Bacteria
In the SMB portion of the Peninsula WMG area, all SMB Beaches Bacteria TMDL compliance
monitoring locations have been assigned exceedance day allowances in the Permit based on an
anti-degradation approach. As such, no TLR is required (TLR = 0) for each subwatershed tributary
to these compliance monitoring locations (SMB 7-1, SMB 7-2, SMB 7-3, SMB 7-4, and SMB 7-
5), consistent with the TMDL’s approach that acknowledges that historic average wet weather
bacteria exceedance rates for each of these subwatersheds are lower than that of the reference
beach. Historic wet weather monitoring data (2005 – 2014) at these five sampling locations
confirms this understanding, as the long-term exceedance rate at all five sites varies between 4 and
10%, well below the long-term wet weather exceedance rate at the reference beach (26%). In
addition, Heal the Bay, which comprehensively analyzes coastline water quality in California,
assigning A to F grades based on bacteria-related health risks, consistently awards these beaches
an “A+” ranking on its Beach Report Card (Heal the Bay, 2015).
Although the SMB Beaches Bacteria TMDL requires only that beach water quality at anti-
degradation compliance locations be maintained, the Peninsula WMG will seek to implement non-
structural and LID-based BMPs within the SMB portion of their EWMP area which will protect
and potentially improve water quality at these beaches and is consistent with the J7 Implementation
Plan for the SMB Beaches Bacteria TMDL. These measures, though not required for Permit
compliance, are quantified in Section 4 below.
2.5.2 Wilmington Drain Bacteria
Within the Wilmington Drain portion of the Peninsula WMG area, a TLR approach was developed
based on allowable exceedance days. Wilmington Drain is 303(d)-listed for bacteria and its targets
were developed consistent with the reference system allowable exceedance approach implemented
for other Los Angeles region freshwater TMDLs. Wilmington Drain has a REC-1 beneficial use
designation and no High Flow Suspension; therefore, it is comparable with reference streams in
this regard.
2.5.2.1 Target Load Reduction Calculation Methodology for Bacteria
After validation of the modeling methodology using the reference watershed, it was applied to all
analysis regions within the Wilmington Drain subwatershed to predict baseline exceedance days
for the 90th percentile year, or TMDL year 1995. Once baseline discharge days were estimated for

Appendix 6. Peninsula EWMP – RAA Summary
January 2016
Page 22
Peninsula EWMP - RAA Summary
each analysis region, the number of allowed discharge days was established by the application of
a site-specific empirical factor. For Wilmington Drain, it was assumed that 19% of wet weather
days could be considered allowable discharge days, based on the reference stream dataset. Since
the dominant rain gauge in the Wilmington Drain subwatershed (Palos Verdes Landfill gauge) had
82 wet weather days in TMDL year 1995, it was assumed that 16 discharge days are allowed in
the Wilmington Drain subwatershed. This approach is consistent with the approach in the Malibu
Creek Watershed Bacteria TMDL and all other Los Angeles region freshwater bacteria TMDLs
for developing wet weather waste load allocations expressed as allowable exceedance days
(Regional Board, 2012b).
To determine the TLR necessary for each analysis region to meet the allowed discharge days, a
hypothetical retention BMP was modeled at the outlet of each analysis region. This approach was
presented to Regional Board staff on June 6, 2014 and verbal feedback received during the meeting
was supportive. This same bacteria TLR approach has been applied consistently in the following
WMPs/EWMPs: City of Walnut WMP, Los Angeles River Upper Reach 2 WMP, North Santa
Monica Bay Coastal Watersheds EWMP, Santa Monica Bay Jurisdictional Group 2 and 3 EWMP,
and the Beach Cities Watershed Management Area EWMP.
For each analysis region’s outlet retention BMP, an in-stream diversion system was iteratively
sized (based on a diversion flow rate) to produce a bypass frequency (or number of discharge days)
during TMDL year 1995 that matched the allowed discharge days. Each theoretical diversion
system diverted runoff to an infinitely large retention BMP where the diverted water was fully
captured. The load reduction resulting from this BMP scenario (i.e., baseline analysis region load
minus analysis region load with the diversion system and retention BMP in place) became the TLR
for each analysis region. “Reasonable assurance” of compliance with the allowed discharge days
was then considered to have been met when actual and proposed BMPs combined to achieve the
TLR for each analysis region.
In summary, the following approach was implemented to calculate a bacteria TLR for each
Wilmington Drain modeled analysis region (see Attachment C for an example calculation):
1. Each analysis region is modeled in SBPAT for the 90th percentile year (TMDL year 1995).
2. The existing, baseline condition (i.e., without any outlet retention BMP) is modeled for
each analysis region, resulting in a mean baseline fecal coliform (FC) load for the 90th
percentile year (baseline load).
3. The allowable number of discharge days for each analysis region is calculated to be 16
(19% of 82 wet weather days).
4. An in-stream diversion to a large, theoretical retention BMP at the outlet of each analysis
region is iteratively sized so that it only bypasses during the number of allowable discharge
days determined in Step 3.

Appendix 6. Peninsula EWMP – RAA Summary
January 2016
Page 23
Peninsula EWMP - RAA Summary
5. Each diversion and retention BMP is then modeled in SBPAT to produce a mean FC load
for the 90th percentile year (allowed load).
6. For each analysis region, the difference between the baseline load (step 2) and the allowed
load (step 5) results in a TLR for the 90th percentile year, which is the load reduction
required to meet the 16 allowable exceedance days for wet weather.
Inherent in this methodology is the assumption that 100% of discharge days result in an exceedance
day.
2.5.2.2 Validation of Using Annual Loads to Predict Exceedance Day Reductions
A second methodology validation step was performed to demonstrate that modeled annual fecal
coliform loads are indeed predictive of the compliance metric, or annual exceedance days for all
fecal indicator bacteria. For bacteria modeling, verifying the linkage between modeled fecal
coliform loads (i.e., discharged from the watershed outlets) and total observed wet weather
exceedance days (in the receiving water, based on REC1 daily maximum water quality objectives)
is critical to establish reasonable assurance that compliance monitoring locations will be in
compliance with the Permit limits. To establish this linkage, an analysis was conducted using
shoreline monitoring data at Topanaga Canyon12 (SMB 1-18) between 2005 and 2013. Figure 8
illustrates a reasonable correlation between modeled annual fecal coliform loads and observed
annual exceedance days.
12 This subwatershed is 88% open space and was selected for water quality validation due to it being the hydrologic
calibration subwatershed as well as because it had daily shoreline monitoring data, which was necessary in order to
have a sufficiently robust dataset of annual wet weather exceedance days. See additional explanation in Section
2.4.4.1.

Appendix 6. Peninsula EWMP – RAA Summary
January 2016
Page 24
Peninsula EWMP - RAA Summary
Figure 8. Correlation between Modeled Fecal Coliform Loads and
Observed Exceedance Days
2.5.3 Greater Los Angeles Harbor Heavy Metals
Heavy metals (total copper, total lead, and total zinc) are listed as Category 1 WBPCs in GLA
Harbor due to the Dominguez Channel and GLA Harbor Toxics and Metals TMDL. For this
TMDL, the final WQBELs are expressed in the Permit (Attachment N) as annual allowed loading
of copper, lead and zinc “in the sediment deposited to” the Harbor per year, without a precise
definition of the “wet weather” critical condition (e.g., daily rainfall depth or streamflow threshold
values). To translate these watershed-wide allowed loads to the smaller Peninsula WMA, an
allowed concentration is needed. Since allowed sediment-based concentrations are not provided
in the Permit or TMDL (rather, through the TMDL’s linkage analysis, the numeric targets
[sediment quality criteria] were translated into allowed MS4 loads through pollutant and sediment
fate/transport modeling of the Harbor), for RAA modeling purposes, MS4 discharge limits are
assumed to be the California Toxics Rule (CTR) chronic criteria for saltwater. To compute allowed
annual loads for the WMA, the CTR criteria concentrations were applied to 90th percentile annual
runoff volumes to establish the allowed load for each pollutant.
The following approach was implemented to calculate a TLR for each metal in the GLA Harbor
analysis region of the Peninsula WMG area:
y = 59.557e0.0276x
R² = 0.8266
0
50
100
150
200
250
0 5 10 15 20 25 30 35 40 45
Mo
del
ed F
C L
oa
ds
(10
^1
2 M
PN
)
Total Observed Exceedance Days
Appendix 6. Peninsula EWMP – RAA Summary
January 2016
Page 25
Peninsula EWMP - RAA Summary
1. The GLA Harbor analysis region is modeled in SBPAT for the 90th percentile year (TMDL
year 1995).
2. The existing, baseline condition (i.e., without any BMPs) is modeled in SBPAT, resulting
in a mean baseline pollutant load for the 90th percentile year.
3. The target load is calculated by multiplying the CTR concentration of each pollutant by the
baseline runoff volume for the 90th percentile year.
4. The difference between the baseline load (step 2) and the target load (step 3) results in a
TLR for the 90th percentile year, which is the load reduction required to meet the allowable
TMDL concentration.
Because a significant portion of the GLA Harbor analysis region is disconnected via densely
vegetated canyons, both the baseline loads and allowed loads were modeled by assuming a portion
of this analysis region as being tributary to undersized vegetated swales. This modeling procedure
was similar to the downspout disconnect modeling procedure described in Section 3.3.3.
Inherent in this methodology is the assumption that CTR saltwater criteria must be met in the MS4
discharge as an annual average. However, because the Permit sets final WQBELs as allowed
annual mass loads “in the sediment deposited in” the Harbor, and given that only a fraction of the
metal loads discharged by the MS4s are bound to particulates in the depositional size range (i.e.,
medium and course sediments), estimated TLRs may be updated in the future based on monitoring
data that analyzes the fraction of MS4 discharged metals mass that actually may deposit in the
Harbor.
Baseline loads were computed for 1995 for each of the modeled pollutants, and are summarized
in Table 5.
Of the three heavy metal WBPCs discussed below, copper was found to require the greatest TLR
and is consequently the controlling pollutant for design/sizing of structural BMPs. Attachment C
provides an example calculation for this TLR process.
2.5.3.1 Copper
The TMDL provisions of the Permit set a copper WQBEL for the Harbor based on the chronic
California Toxics Rule (CTR) criteria for the protection of aquatic life in saltwater, which is 3.1
ug/L. Therefore, a WQBEL of 3.1 ug/L was used as the allowable concentration for copper.
The copper TLR (as a percentage of baseline load for the 90th percentile year) was calculated to
be 79.9%. This value is shown in Table 5. Total copper was found to be the controlling WBPC in
the GLA Harbor subwatershed of the Peninsula.

Appendix 6. Peninsula EWMP – RAA Summary
January 2016
Page 26
Peninsula EWMP - RAA Summary
2.5.3.2 Lead
The TMDL provisions of the Permit set a lead WQBEL for the Harbor based on the chronic CTR
criteria for the protection of aquatic life in saltwater, which is 8.1 ug/L. Therefore, a WQBEL of
8.1 ug/L was used as the allowable concentration for lead.
The lead TLR (as a percentage of baseline load for the 90th percentile year) was calculated to be
3.6%. This value is shown in Table 5.
2.5.3.3 Zinc
The TMDL provisions of the Permit set a zinc WQBEL for the Harbor based on the chronic CTR
criteria for the protection of aquatic life in saltwater, which is 81 ug/L. Therefore, a WQBEL of
81 ug/L was used as the allowable concentration for zinc.
The zinc TLR (as a percentage of baseline load for the 90th percentile year) was calculated to be
8.9%. This value is shown in Table 5.
2.5.4 Machado Lake Nutrients
Nutrients (total nitrogen and total phosphorus) are listed as Category 1 WBPCs in Machado Lake
due to the Machado Lake Nutrient TMDL. The Permit (Attachment N) expresses WQBELs as
monthly average concentrations for each of these pollutants, calculated using both dry and wet
weather monitoring data. As a result, a TLR methodology was established to account for both dry-
and wet-weather loading, based on recent monitoring data collected under the Palos Verdes
Peninsula Coordinated Monitoring Plan in Compliance with the Machado Lake Nutrient TMDL
(Rolling Hills Estates, et. al., 2011). The following approach was implemented to calculate
baseline loads for both total nitrogen and total phosphorus in each analysis region of the Peninsula
WMG area tributary to Machado Lake:
1. Based on monitoring data from August 2011 through February 2015 (i.e., all sample results
available as of February 2015), a long-term average wet weather concentration and a long-
term average dry weather concentration were computed for each compliance monitoring
location (Rolling Hills Estates City Hall, Valmonte, and Solano)13 for both total nitrogen
and total phosphorus. Combined average concentrations for total nitrogen and total
phosphorus were also calculated to be representative of analysis regions not tributary to a
compliance monitoring location.
13 The Lariat monitoring location was not used to define a separate analysis region since the majority of its tributary
area is within the City of Rolling Hills, which is excluded from the RAA. The area within the Peninsula WMG area
that is tributary to the Lariat compliance monitoring location was included in the Wilmington Drain analysis region.

Appendix 6. Peninsula EWMP – RAA Summary
January 2016
Page 27
Peninsula EWMP - RAA Summary
2. Based on daily rainfall totals at the Palos Verdes Landfill rain gauge for TMDL year 1995,
days with at least 0.25” of rainfall were defined as wet days, while all other days were
defined as dry days. This definition is consistent with the approved Machado Lake Nutrient
TMDL Compliance Monitoring Plan and the Peninsula Cities’ CIMP.
3. For all of TMDL year 1995, days defined as wet days were assigned the applicable average
wet day concentration from Step 1 and days defined as dry days were assigned the
applicable average dry day concentrations from Step 1. This process was done for both
total nitrogen and total phosphorus for each compliance monitoring location (as well as
analysis regions not tributary to a compliance monitoring location).
4. Based on these created daily concentration records, average monthly concentrations were
estimated for each analysis region for each pollutant.
5. The highest average monthly concentration was assumed to represent the baseline
concentration for each analysis region for each pollutant. These were found to be from the
wettest month of the year, January. This assumption was made since the objective was to
demonstrate compliance for the entire 90th percentile year.14 The average concentrations
produced by this step were multiplied by the annual runoff volume from the 90th percentile
year to estimate the total baseline load.
6. Next, allowed annual loads were calculated by multiplying the allowed concentrations (the
WQBELs) by the annual runoff volume from the 90th percentile year to estimate the
allowed load for each analysis region.
7. Finally, the TLRs were calculated as the difference between the baseline loads and allowed
loads for each analysis region.
Calculated baseline loads and TLRs are summarized in Table 5. Attachment C provides an
example TLR calculation for nutrients.
2.5.4.1 Total Nitrogen
The Permit establishes a final WQBEL for total nitrogen of 1.0 mg/L (monthly average
concentration). Within the Machado Lake analysis regions, the total nitrogen TLR was found to
range from 0% to 15.3%. Table 5 summarizes the calculated total nitrogen TLRs for each analysis
region.
2.5.4.2 Total Phosphorous
The Permit establishes a final WQBEL for total phosphorus of 0.1 mg/L (monthly average
concentration). Within the Machado Lake analysis regions, the total phosphorus TLR was found
14 Since monitoring data has demonstrated that wet weather concentrations are significantly higher than dry weather
concentrations, achieving compliance for the wettest month of the 90th percentile year is assumed to result in
compliance for the remaining (drier) months of the year.

Appendix 6. Peninsula EWMP – RAA Summary
January 2016
Page 28
Peninsula EWMP - RAA Summary
to range from 34.6% to 80.7%. Table 5 summarizes the calculated total phosphorus TLRs for each
analysis region.
2.5.5 Wet Weather TLR Summary
By implementing the steps described above, TLRs were developed for each analysis region. TLRs
for the controlling pollutant in each analysis region are depicted in Figure 9, and Table 5
summarizes the baseline loads and TLRs for each modeled pollutant and identifies the controlling
pollutant (in bold) for each analysis region. As stated previously, all Santa Monica Bay analysis
regions are defined as anti-degradation sites and hence are assigned a TLR of zero for bacteria.
Figure 9. Target Load Reductions for the Controlling Pollutant for
Each Modeled Analysis Region

Appendix 6. Peninsula EWMP – RAA Summary
January 2016
Page 29
Peninsula EWMP - RAA Summary
Table 5. Target Load Reductions for Each Modeled Analysis Region (1995)
Watershed Analysis
Region Pollutant1
Baseline Condition for the Critical Year Allowed Conditions for the Critical Year3 Target Load Reduction for the
Critical Year3
Runoff
Volume
Avg Pollutant
Concentration2 Load
Runoff
Volume
Avg Pollutant
Concentration Load Absolute Load
As % of
Baseline Load
Santa
Monica Bay
SMB7-1 FC 691.0 af 25,900 MPN/100ml 221x1012 MPN 691.0 af 25,900 MPN/100ml 221x1012 MPN Anti-Deg 0.0%
SMB7-1_7-2 FC 223.2 af 25,900 MPN/100ml 71.4x10¹² MPN 223.2 af 25,900 MPN/100ml 71.4x10¹² MPN 0x1012 MPN 0.0%
SMB7-2 FC 60.6 af 18,200 MPN/100ml 13.6x10¹² MPN 60.6 af 18,200 MPN/100ml 13.6x10¹² MPN Anti-Deg 0.0%
SMB7-2_7-3 FC 2765.5 af 23,600 MPN/100ml 806x1012 MPN 2765.5 af 23,600 MPN/100ml 806x1012 MPN 0x1012 MPN 0.0%
SMB7-3 FC 623.7 af 22,500 MPN/100ml 173x1012 MPN 623.7 af 22,500 MPN/100ml 173x1012 MPN Anti-Deg 0.0%
SMB7-3_7-4 FC 370.3 af 20,300 MPN/100ml 92.8x10¹² MPN 370.3 af 20,300 MPN/100ml 92.8x10¹² MPN 0x1012 MPN 0.0%
SMB7-4 FC 674.5 af 15,700 MPN/100ml 131x1012 MPN 674.5 af 15,700 MPN/100ml 131x1012 MPN Anti-Deg 0.0%
SMB7-4_7-5 FC 161.6 af 4,800 MPN/100ml 9.60x10¹² MPN 161.6 af 4,800 MPN/100ml 9.60x10¹² MPN 0x1012 MPN 0.0%
SMB7-5 FC 589.8 af 14,100 MPN/100ml 103x1012 MPN 589.8 af 14,100 MPN/100ml 103x1012 MPN Anti-Deg 0.0%
SMB7-5_East FC 985.5 af 15,400 MPN/100ml 187x1012 MPN 985.5 af 15,400 MPN/100ml 187x1012 MPN 0x1012 MPN 0.0%
Machado
Lake Machado
TP 886.4 af
0.31 mg/L 906 lbs 886.4 af
0.10 mg/L 296 lbs 610 lbs 67.3%
TN 0.99 mg/L 8310 lbs 1.0 mg/L 8,310 lbs 0 lbs 0.0%
Machado
Lake via
Wilmington
Drain
RHECH
FC
1394.3 af
27,100 MPN/100ml 465x1012 MPN
1394.3 af
11,734 MPN/100ml 201x1012 MPN 264x1012 MPN 56.7%
TP 0.15 mg/L 1490 lbs 0.10 mg/L 975 lbs 515 lbs 34.6%
TN 1.15 mg/L 15,000 lbs 1.0 mg/L 13,030 lbs 1,970 lbs 13.1%
Solano
FC
198.2 af
30,200 MPN/100ml 73.8x10¹² MPN
198.2 af
11,869 MPN/100ml 29.0x10¹² MPN 44.8x10¹² MPN 60.7%
TP 0.24 mg/L 212 lbs 0.10 mg/L 87 lbs 125 lbs 58.9%
TN 1.10 mg/L 1,940 lbs 1.0 mg/L 1,763 lbs 177 lbs 9.1%
Valmonte
FC
446.5 af
26,900 MPN/100ml 148x1012 MPN
446.5 af
12,858 MPN/100ml 70.7x10¹² MPN 77.3x10¹² MPN 52.2%
TP 0.52 mg/L 506 lbs 0.10 mg/L 97 lbs 409 lbs 80.7%
TN 1.18 mg/L 4,880 lbs 1.0 mg/L 4,131 lbs 749 lbs 15.3%
Additional
Wilmington
Drain
FC
833.5 af
26,200 MPN/100ml 270x1012 MPN
833.5 af
13,912 MPN/100ml 143x1012 MPN 127x1012 MPN 46.9%
TP 0.31 mg/L 1,390 lbs 0.10 mg/L 456 lbs 934 lbs 67.3%
TN 0.99 mg/L 14,950 lbs 1.0 mg/L 14,950 lbs 0 lbs 0.0%
GLA Harbor GLA Harbor
TCu
2518.8 af
17.85 µg/L 127.3 lbs
2518.8 af
3.59 ug/L 25.5 lbs 101.8 lbs 79.9%
TPb 8.49 µg/L 60.5 lbs 8.18 ug/L 58.3 lbs 2.2 lbs 3.6%
TZn 90.27 µg/L 643.9 lbs 82.2ug/L 586.4 lbs 57.5 lbs 8.9% 1
Pollutants in bold are the controlling pollutants in each analysis region. 2 With the exception of Total Phosphorus and Total Nitrogen for Machado Lake, pollutant concentrations are estimated as the total annual load divided
by the total annual runoff volume. The pollutant concentrations presented for the Machado Lake Nutrient TMDL are based on monitoring data and the
TLR approach explained herein. 3 RAA demonstration is made based on the achievement of the TLR values in terms of absolute load removed by the proposed suite of BMPs in each
analysis region. The allowed conditions in terms of runoff volume and concentration are shown for informational purposes only.

Appendix 6. Peninsula EWMP – RAA Summary
January 2016
Page 30
Peninsula EWMP - RAA Summary
3 MODELING EXISTING, PLANNED, AND PROPOSED BEST MANAGEMENT
PRACTICES (BMPS)
The section below specifically discusses the general BMP planning goals, methods used to identify
and prioritize BMP opportunities, and inputs and assumptions for the modeled and non-modeled
non-structural and structural (regional EWMP,15 regional, and distributed) BMPs.
3.1 BMP Objectives
The objectives of the non-structural and structural BMPs are foremost to meet the TLRs in each
analysis region, as cost efficiently as possible, in order to demonstrate reasonable assurance that
compliance with the Water Quality Based Effluent Limits and Receiving Water Limits from the
Permit will be achieved. Additional goals include reduction of other pollutants to downstream
water bodies, decreased reliance on potable water for irrigation due to onsite harvest/use and
infiltration projects, increase in groundwater recharge due to infiltration projects, and reduction in
dry weather runoff.
3.2 Methods to Identify and Prioritize Opportunities
In order to demonstrate reasonable assurance, BMPs were identified in a prioritized manner.
Prioritization was based on cost (low cost BMPs were prioritized); BMP effectiveness for the
pollutants of concern (BMPs that had greater treatment efficiency for the pollutant of concern in a
particular analysis region were prioritized over other BMPs); and implementation feasibility as
determined by desktop screening. In general, non-structural BMPs were prioritized over structural
BMPs due to their lower relative cost, and then structural BMPs were identified that would result
in the greatest load reduction per dollar. This was accomplished by targeting land uses with the
greatest percent imperviousness and highest pollutant loads and by using BMPs with the greatest
performance, particularly for the controlling pollutant.
The RAA was performed according to the following steps:
1. Calculate load reductions associated with existing BMPs;
2. Assume non-modeled non-structural programmatic load reduction for MCMs (5% of
baseline pollutant load);
3. Assume non-modeled non-structural programmatic load reduction for non-structural
Targeted Control Measures (TCMs) (2.5% of baseline pollutant load). TCMs are those
MCMs that are enhanced above and beyond their minimum level;
4. Calculate load reductions for public retrofit incentives and redevelopment;
15 Regional EWMP projects are sized to meet the 85th percentile, 24-hour design event criteria.

Appendix 6. Peninsula EWMP – RAA Summary
January 2016
Page 31
Peninsula EWMP - RAA Summary
5. Calculate load reductions attributable to planned and proposed regional BMPs after
evaluating existing plans and parcel screening analyses;
6. Meet the TLR by backfilling the remaining load reduction with regional BMPs.
BMP load reductions were evaluated for the period between the TMDL effective dates and final
compliance deadlines for each applicable TMDL. These dates are summarized in Table 6. For
Category 2 WBPCs in the Wilmington Drain subwatershed, the dates for the Machado Lake
Nutrient TMDL were assumed to apply.
Table 6. TMDL Effective Dates and Final Compliance Dates
TMDL TMDL Effective Date Final Compliance Deadline
SMB Beach Bacteria TMDL 2003 2013
Machado Lake Nutrient TMDL 2008 2018
Greater Los Angeles Harbor
Toxics and Metals TMDL 2012 2032
3.3 Non-Structural BMPs
Non-structural BMPs have been categorized as follows. Specific model inputs are summarized in
tabular format in the next section, along with model inputs for distributed BMPs, since they share
consistent assumptions (Table 8).
3.3.1 Non-Modeled Programmatic BMPs
These source controls include a combination of BMPs such as new or enhanced pet waste controls
(ordinance, signage, education/outreach, mutt mitts, etc.), human waste source tracking and
remediation (e.g., leaking sewer investigations, etc.), new or enhanced equestrian facility outreach,
enhanced street sweeping (e.g., 100% vacuum sweepers, increased frequency, etc.), increased
catch basin and storm drain cleaning, and other new or enhanced non-structural BMPs that target
the pollutants addressed in this EWMP. A 5% load reduction credit was applied for the cumulative
effect of all non-structural programmatic BMPs, and a 2.5% load reduction credit was applied for
the cumulative effect of all non-structural TCMs, which are MCMs that are enhanced above and
beyond their minimum level. The result is a combined credit of 7.5% load reduction for all
pollutants to represent the cumulative benefit from all of non-modeled programmatic BMPs.
In addition, a separate load reduction is assumed for copper due to the elimination of copper in
brake pads. In 2010, California Senate Bill 346 (SB 346) was enacted to eliminate nearly all use
of copper in brake pad manufacturing. In 2013, TDC Environmental prepared a draft detailed study
for the California Stormwater Quality Association (CASQA) describing the expected percent
reduction for copper as a result of the passage of SB 346 (TDC Environmental, 2013). The TDC
study identifies three possible implementation scenarios, the least aggressive of which estimates
that a 55% load reduction in copper will be achieved by 2032 due to the brake pad phase out.
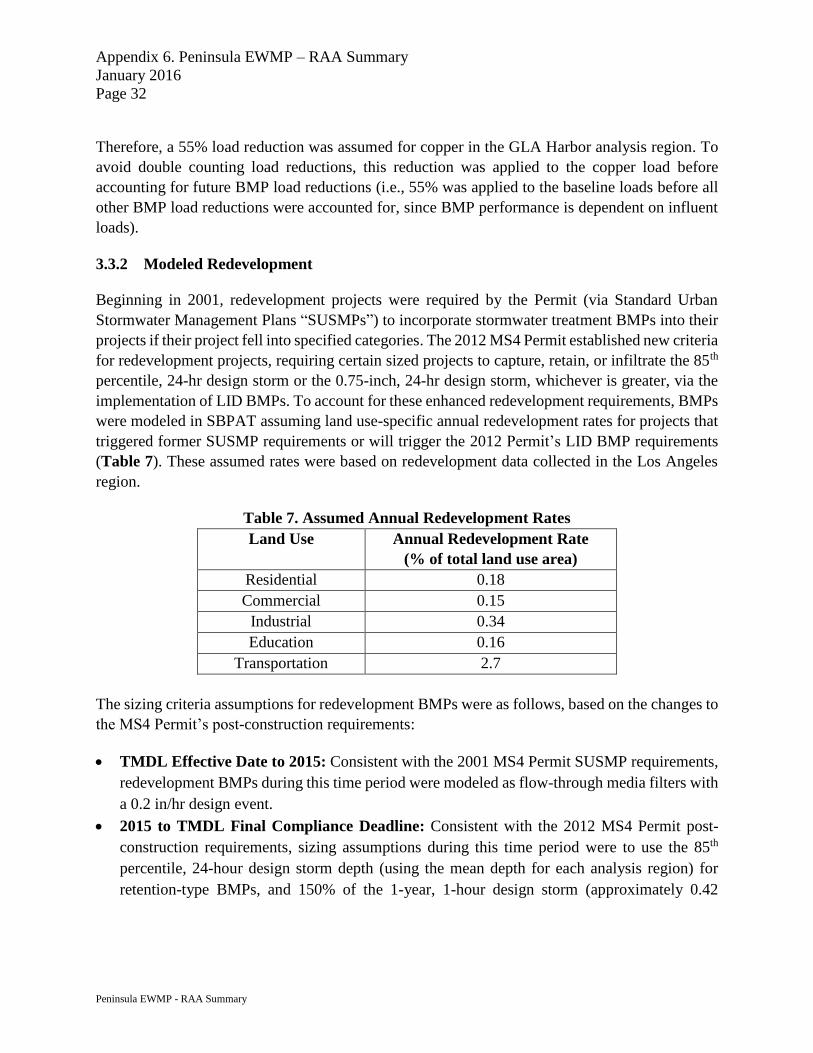
Appendix 6. Peninsula EWMP – RAA Summary
January 2016
Page 32
Peninsula EWMP - RAA Summary
Therefore, a 55% load reduction was assumed for copper in the GLA Harbor analysis region. To
avoid double counting load reductions, this reduction was applied to the copper load before
accounting for future BMP load reductions (i.e., 55% was applied to the baseline loads before all
other BMP load reductions were accounted for, since BMP performance is dependent on influent
loads).
3.3.2 Modeled Redevelopment
Beginning in 2001, redevelopment projects were required by the Permit (via Standard Urban
Stormwater Management Plans “SUSMPs”) to incorporate stormwater treatment BMPs into their
projects if their project fell into specified categories. The 2012 MS4 Permit established new criteria
for redevelopment projects, requiring certain sized projects to capture, retain, or infiltrate the 85th
percentile, 24-hr design storm or the 0.75-inch, 24-hr design storm, whichever is greater, via the
implementation of LID BMPs. To account for these enhanced redevelopment requirements, BMPs
were modeled in SBPAT assuming land use-specific annual redevelopment rates for projects that
triggered former SUSMP requirements or will trigger the 2012 Permit’s LID BMP requirements
(Table 7). These assumed rates were based on redevelopment data collected in the Los Angeles
region.
Table 7. Assumed Annual Redevelopment Rates
Land Use Annual Redevelopment Rate
(% of total land use area)
Residential 0.18
Commercial 0.15
Industrial 0.34
Education 0.16
Transportation 2.7
The sizing criteria assumptions for redevelopment BMPs were as follows, based on the changes to
the MS4 Permit’s post-construction requirements:
TMDL Effective Date to 2015: Consistent with the 2001 MS4 Permit SUSMP requirements,
redevelopment BMPs during this time period were modeled as flow-through media filters with
a 0.2 in/hr design event.
2015 to TMDL Final Compliance Deadline: Consistent with the 2012 MS4 Permit post-
construction requirements, sizing assumptions during this time period were to use the 85th
percentile, 24-hour design storm depth (using the mean depth for each analysis region) for
retention-type BMPs, and 150% of the 1-year, 1-hour design storm (approximately 0.42

Appendix 6. Peninsula EWMP – RAA Summary
January 2016
Page 33
Peninsula EWMP - RAA Summary
in/hr)16 for flow-through type BMPs. Redevelopment BMPs were modeled as 50% biofiltration
(i.e., bioretention with underdrains, which is a flow-through type of BMP) and 50%
bioretention.
2015 is used as a transition date since the LID post-construction requirements from the 2012 MS4
Permit are required to be in full effect via local LID ordinances by this time.
In order to estimate load reductions associated with these redevelopment BMPs, the land use
percentages shown in Table 7 were multiplied by the respective land use areas in each analysis
region, resulting in an assumed area treated by LID BMPs each year. This area was multiplied by
the applicable number of years, since new BMPs are assumed to be implemented each year. The
total land use area assumed to be redeveloped for each analysis region was then modeled as being
treated by the BMPs described above and the total load reduction was quantified.
3.3.3 Modeled Public Retrofit Incentives
Public retrofit incentives include programs directed at incentivizing the public to decrease the
amount of stormwater runoff from their property, specifically via downspout disconnects. Public
incentives for retrofitting existing development were modeled in SBPAT between 2015, when the
EWMP will begin to be implemented, and the respective TMDL final compliance date. Public
retrofit incentives were assumed to be a downspout disconnection program, modeled as bioswales
sized to a design storm intensity of 0.2 in/hr. Assumptions included that 10 percent of all single
family residential areas would be converted to disconnected downspout systems, and that, based
on GIS analysis, 38 percent of the single family residential area consists of rooftops that can be
effectively disconnected. Therefore, 3.8 percent of all single family residential neighborhoods
were modeled as treated by bioswales in order to account for public retrofit incentives.
16 150% of the 1-year, 1-hour design storm was used per Section VI.D.7.c.iii of the Permit.

Appendix 6. Peninsula EWMP – RAA Summary
January 2016
Page 34
Peninsula EWMP - RAA Summary
Table 8. Public Retrofit Incentives and Redevelopment
Implementation
Level BMP Type
Design
Storm
Longitudinal
Slope
(ft/ft)
Manning
n
Hydraulic
Residence
Time
(min)
Water
Quality
Flow Depth
(in)
Effective
Retention
Depth (in)
Infiltration Rate
(in/hr)
Redevelopment
(Start Date - 2015) Media Filter
0.2
(in/hr) - - - - - -
Redevelopment
(2015-Final)
Bioretention 0.75 – 1.1
(in) - - - - 12 0.15
Biofiltration1 0.42
(in/hr) 0.03 0.25 10 4 2
Based on
Catchment-specific
soil type
Public Retrofit
(2015-Final) Bioswale
0.2
(in/hr) 0.03 0.25 10 4 2
Based on
Catchment-specific
soil type 1
Modeled as a bioswale using bioretention EMCs.

Appendix 6. Peninsula EWMP – RAA Summary
January 2016
Page 35
Peninsula EWMP - RAA Summary
3.4 Distributed Green Street BMPs
Distributed green street BMPs include infrastructure such as bioswales, biofiltration, and
bioretention, typically constructed in the public right-of-way, designed to treat stormwater before
it enters the storm drain system. Based on iterative model results in the Peninsula WMG area, it
was determined that in analysis regions where additional BMPs were required, distributed BMPs
were not found to be implementable because of site-specific constraints which include (but are not
limited to) soil conditions, steep slopes, lack of appropriate collection infrastructure, and minimal
right-of-way for BMP construction; nor were these BMPs found to be cost effective means of
achieving reasonable assurance of compliance in contrast to regional BMP opportunities that were
available. Therefore, regional BMPs were relied upon for compliance demonstration.
3.5 Regional BMP Design Parameters and Criteria
Existing (constructed between 2003 and 2014), planned, and proposed regional BMPs were
modeled in SBPAT based on conceptual design information, where available. Figure 10 provides
an overview of all of these regional BMPs within the Peninsula EWMP Area. The following
sections outline the regional BMPs that were modeled as well as their drainage areas, design details
in SBPAT, and any relevant assumptions.

Appendix 6. Peninsula EWMP – RAA Summary
January 2016
Page 36
Peninsula EWMP - RAA Summary
Figure 10. Regional Projects within the Peninsula EWMP Area
3.5.1 Machado Analysis Region
Two regional BMPs are planned within the Machado analysis region (see Figure 11). These
include the Chandler Quarry Project and the Casaba Estates Project:
Chandler Quarry. As described in Section 3 of the Peninsula EWMP, the Chandler
Quarry Project is a planned redevelopment project that will treat runoff from a significant
area of land in Rolling Hills Estates. The western drainage area of the Project (“Chandler
Quarry West”) will capture and retain runoff from 707 acres of upstream land for up to the
50-year, 24-hour storm (5.2 inches). The Chandler Quarry West project will consist of two
debris basins for pretreatment of off-site flows, a sedimentation basin for pretreatment of
on-site flows, and a large-scale infiltration basin to infiltrate all incoming water from the
tributary area. The eastern drainage area of the Project (“Chandler Quarry East”) will treat
approximately 45.3 acres of tributary land via manufactured wetland systems. The

Appendix 6. Peninsula EWMP – RAA Summary
January 2016
Page 37
Peninsula EWMP - RAA Summary
Chandler Quarry West project was modeled as an infiltration basin designed to fully
capture and infiltrate a design storm of 5.2 inches. The Chandler Quarry East project was
modeled as a flow-through BMP designed to treat the one-year, one-hour rainfall intensity
(0.28 in/hr) with a hydraulic residence time of 10 minutes.
Date to be implemented: No later than 2018.
Casaba Estates. The Casaba Estates project is currently under construction. The project is
approximately 8.55 acres in size, located in Rolling Hills Estates adjacent to the
intersection of Palos Verdes Drive North and Palos Verdes Drive East. The project involves
the creation of a vegetated riparian area designed as a bioretention system to retain and
infiltrate runoff from the tributary area. The project receives runoff from offsite (through
an existing 24” diameter culvert under Palos Verdes Drive East) and onsite watersheds. In
total, 28.62 acres of mixed-use land will be treated by the project. The project was modeled
as a bioretention BMP with an underdrain and subsurface infiltration. The assumed design
storm intensity was the one-year, on-hour storm in the project area (0.28 in/hr).
Date to be implemented: In construction.
Figure 11. Regional Projects within the Machado Analysis Region

Appendix 6. Peninsula EWMP – RAA Summary
January 2016
Page 38
Peninsula EWMP - RAA Summary
3.5.2 Wilmington Drain and Rolling Hills Estates City Hall Analysis Regions
Due to high TLRs within the Rolling Hills Estates City Hall (RHECH) and Wilmington Drain
analysis regions, attributed in large part to the stringent WQBEL for total phosphorus (0.1 mg/L),
significant load reductions are required to demonstrate reasonable assurance of compliance in
these areas. A regional BMP is currently planned at the Botanic Garden within the Wilmington
Drain analysis region (see Figure 12), and another regional BMP is proposed for TMDL
compliance (see Figure 13). The proposed BMP is downstream of the RHECH compliance
monitoring location, and has been sized to treat significant runoff from the Wilmington Drain
analysis region in addition to all runoff from the RHECH analysis region.
Botanic Garden Project. The South Coast Botanic Garden (SCBG), which is immediately
downstream of the Lariat compliance monitoring location, has developed a “Vision Plan”
for improvements to the facility, which focuses on returning the stream corridor within the
garden back to its original form and reconfiguring the Creek Garden and Lake. Currently,
the existing lake is scheduled to be dredged no later than 2018. Additional enhancements
are being considered, including upgrades to the southern end of the stream corridor to
transform the area into a natural California wash. This wash would be sufficient to
accommodate periods of intense rain from the garden and run-on from the neighboring
developments to the south. The Vision Plan is conceptual and has yet to be finalized,
though various opportunities are being considered: an existing creek which could
potentially be developed into an engineered wetland, bioswale, or stormwater capture
facility; an existing lake which provides an opportunity for stormwater capture and possible
reuse for irrigation; an existing open space which provides an opportunity for an engineered
wetland, bioswale, or stormwater capture facility; and an existing catch basin which
provides an opportunity to divert upstream flows to a Regional BMP. As the scope of the
project is currently being developed by stakeholders, the SCBG project was conservatively
modeled as a vegetated bioswale designed to treat a rainfall intensity of 0.1 in/hr across the
upstream tributary area within the Peninsula WMG area. This drainage area did not include
the City of Rolling Hills, which in practice could comprise the majority of the area tributary
to SCBG Project. As the scope of the project progresses, this project may be updated in the
model as part of the adaptive management process. It is assumed that the performance
metrics for this project described herein will be met or exceeded when the project is
designed and implemented.
Date to be implemented: Dredging of existing lake, no later than 2018. Additional
enhancements are to be determined.
Proposed Regional BMP at the Landfill. These two analysis regions have limited
developed areas capable of implementing green street-type BMPs (due to lack of curb-and-
gutter and available right-of-way for such projects), and are effectively prevented from
implementing large scale infiltration projects due to the presence of geotechnical hazards

Appendix 6. Peninsula EWMP – RAA Summary
January 2016
Page 39
Peninsula EWMP - RAA Summary
and lack of available space. As a result, the potentially feasible projects that could be
implemented in these areas are large scale, flow-through treatment projects, such as a
treatment facility with storage or a sub-surface flow wetland (SSF wetland). A project of
this type is proposed to be located on or adjacent to the closed Palos Verdes Landfill main
site, which is approximately 240 acres. This location was selected due to the fact that two
large storm drain main lines join immediately upstream of the landfill at Hawthorne Blvd.
Collectively, these storm drains collect runoff from approximately 1,415 acres of land
within the RHECH analysis region and the Wilmington Drain analysis region. If feasible,
treatment at this location could consist of either a storage-and-treatment facility or a SSF
wetland. Although significantly more work is needed to investigate the feasibility, cost-
effectiveness, and design details of such a BMP, the following examples of projects
concepts demonstrate reasonable assurance of compliance:
o SSF Wetland with a design treatment rate of 15 cfs and an equalization storage
volume of 50 million gallons. Assuming a hydraulic residence time of five days
and a basin depth of six feet, the total footprint of such a project would be
approximately 60 acres.
o Treatment Facility with a treatment rate of 10 cfs (4,500 gpm) and storage of 50
million gallons.
o Treatment Facility with a treatment rate of 125 cfs (56,000 gpm) and storage of two
million gallons.
Because the possible design combinations of such a project are numerous, an optimization
study would need to be complete before determining what type of BMP to implement and
how it should be designed. Upon finalization of design, the RAA will be updated in
accordance with the adaptive management process to reflect such changes. Final design
standards for the project must meet or exceed the performance metrics outlined herein to
achieve compliance.
Date to be implemented: 2018.

Appendix 6. Peninsula EWMP – RAA Summary
January 2016
Page 40
Peninsula EWMP - RAA Summary
Figure 12. Planned Regional Project at the Botanic Garden within the Wilmington Drain
Analysis Region

Appendix 6. Peninsula EWMP – RAA Summary
January 2016
Page 41
Peninsula EWMP - RAA Summary
Figure 13. Proposed Regional Project for the Wilmington Drain and RHECH Analysis
Regions
3.5.3 Valmonte Analysis Region
A regional BMP is proposed within the Valmonte analysis region (see Figure 14). As is the case
in the Wilmington Drain and RHECH analysis regions, a high TLR for total phosphorus exists
within the analysis region due to the stringent WQBEL for total phosphorus (0.1 mg/L), resulting
in significant load reduction requirements in order to demonstrate reasonable assurance of
compliance. In addition, this analysis region also has limited developed areas capable of
implementing green street-type BMPs (due to lack of curb-and-gutter and available right-of-way
for such projects), and is effectively prevented from implementing large scale infiltration projects
due to the presence of geotechnical hazards and lack of available space. As a result, the only
potentially feasible projects that could be implemented in this area are large scale, flow-through
treatment projects, such as a treatment facility with storage or a SSF wetland.

Appendix 6. Peninsula EWMP – RAA Summary
January 2016
Page 42
Peninsula EWMP - RAA Summary
Proposed Regional BMP at Valmonte. Treatment consisting of either a storage-and-
treatment facility or a SSF wetland is proposed at the downstream end of the analysis
region, adjacent to or immediately upstream of the Valmonte compliance monitoring
location. Approximately 400 acres are tributary to this area. Although significantly more
work is needed to investigate the feasibility, cost-effectiveness, and design details of such
a BMP, the following examples of projects are sufficient to demonstrate reasonable
assurance of compliance:
o SSF Wetland with a design treatment rate of 2 cfs and an equalization storage
volume of 40 million gallons.
o Treatment Facility with a treatment rate of 10 cfs (4,500 gpm) and storage of 15
million gallons.
o Treatment Facility with a treatment rate of 30 cfs (13,500 gpm) and storage of 3.5
million gallons.
Because the possible design combinations of such a project are numerous, an optimization
study would need to be complete before determining what type of BMP to implement and
how it should be designed. Upon finalization of design, the RAA will be updated in
accordance with the adaptive management process to reflect such changes. Final design
standards for the project must meet or exceed the performance metrics outlined herein to
achieve compliance.
Date to be implemented: 2018.
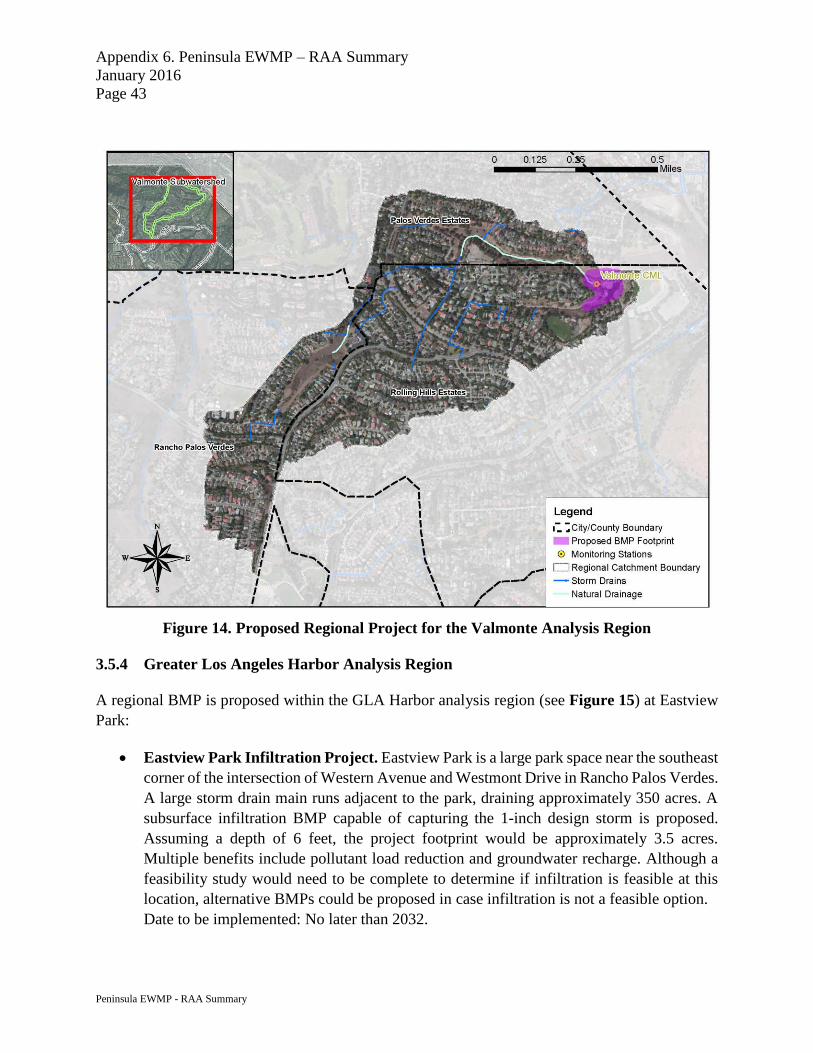
Appendix 6. Peninsula EWMP – RAA Summary
January 2016
Page 43
Peninsula EWMP - RAA Summary
Figure 14. Proposed Regional Project for the Valmonte Analysis Region
3.5.4 Greater Los Angeles Harbor Analysis Region
A regional BMP is proposed within the GLA Harbor analysis region (see Figure 15) at Eastview
Park:
Eastview Park Infiltration Project. Eastview Park is a large park space near the southeast
corner of the intersection of Western Avenue and Westmont Drive in Rancho Palos Verdes.
A large storm drain main runs adjacent to the park, draining approximately 350 acres. A
subsurface infiltration BMP capable of capturing the 1-inch design storm is proposed.
Assuming a depth of 6 feet, the project footprint would be approximately 3.5 acres.
Multiple benefits include pollutant load reduction and groundwater recharge. Although a
feasibility study would need to be complete to determine if infiltration is feasible at this
location, alternative BMPs could be proposed in case infiltration is not a feasible option.
Date to be implemented: No later than 2032.
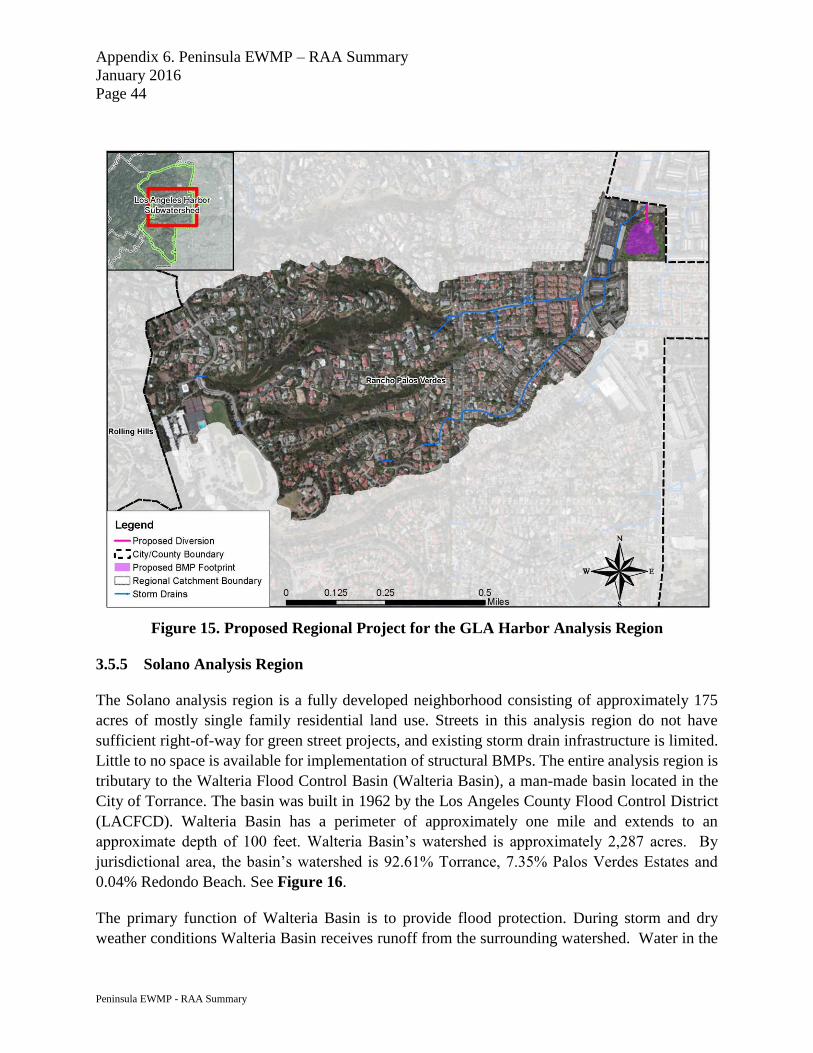
Appendix 6. Peninsula EWMP – RAA Summary
January 2016
Page 44
Peninsula EWMP - RAA Summary
Figure 15. Proposed Regional Project for the GLA Harbor Analysis Region
3.5.5 Solano Analysis Region
The Solano analysis region is a fully developed neighborhood consisting of approximately 175
acres of mostly single family residential land use. Streets in this analysis region do not have
sufficient right-of-way for green street projects, and existing storm drain infrastructure is limited.
Little to no space is available for implementation of structural BMPs. The entire analysis region is
tributary to the Walteria Flood Control Basin (Walteria Basin), a man-made basin located in the
City of Torrance. The basin was built in 1962 by the Los Angeles County Flood Control District
(LACFCD). Walteria Basin has a perimeter of approximately one mile and extends to an
approximate depth of 100 feet. Walteria Basin’s watershed is approximately 2,287 acres. By
jurisdictional area, the basin’s watershed is 92.61% Torrance, 7.35% Palos Verdes Estates and
0.04% Redondo Beach. See Figure 16.
The primary function of Walteria Basin is to provide flood protection. During storm and dry
weather conditions Walteria Basin receives runoff from the surrounding watershed. Water in the

Appendix 6. Peninsula EWMP – RAA Summary
January 2016
Page 45
Peninsula EWMP - RAA Summary
basin is discharged during the dry season to pump out accumulated dry weather flows and after
storm events to maintain flood protection for the adjacent communities. The discharge is pumped
through the Project No. 584 stormdrain and flows through the drainage network where it eventually
discharges to Wilmington Drain. Wilmington Drain is a soft-bottom open channel maintained by
the LACFCD. Surface water in Wilmington Drain can flow via gravity or an unmanned pump
station into Machado Lake. To ensure the downstream capacity is available for other storm flows,
the Wateria basin is only pumped down after runoff in the watershed subsides.
In October 2014, the LACFCD and the City of Torrance commenced a Special Study Monitoring
Program analyzing Walteria Basin (Special Study). The objective of the Special Study is to:
Compare the mass of pollutants entering Walteria Basin and the mass of pollutants
discharged.
Assess inflow and outflow compared to TMDL waste load allocations.
As part of the Special Study, the LACFCD is monitoring the 4 inlets to Walteria Basin. The City
of Torrance is monitoring the discharges from Walteria Basin during pumping events. The Special
Study will span 2 years, and preliminary results will be available late 2015. Pending results of the
Special Study, an appropriate Regional Project will be identified. A variety of BMPs are currently
being investigated including:
Application of aluminum sulfate to Walteria Basin.
A diversion of the outflows from Walteria Basin to the Torrance airport for infiltration to
groundwater.
Use of water collected in Walteria to irrigate a nearby park or open space.
As the Special Study is completed in late 2016, funding and selection of appropriate BMPs will be
determined. A BMP implementation strategy for Walteria Basin will be refined and reported
through adaptive management.

Appendix 6. Peninsula EWMP – RAA Summary
January 2016
Page 46
Peninsula EWMP - RAA Summary
Figure 16. Walteria Basin Drainage Area
4 RAA RESULTS/DEMONSTRATION OF COMPLIANCE
4.1 Wet Weather
Although quantitative analyses were conducted for each analysis region separately, cumulative
load reductions for entire subwatersheds (Santa Monica Bay, Machado Lake, and GLA Harbor)
are also summarized below. In all cases, cumulative load reductions exceed the cumulative target
load reductions for each subwatershed WBPC. Therefore, it is recognized that although
compliance is currently based on sampling within select analysis regions, consideration may be
made in the future for subwatershed compliance as a whole before any non-compliant findings are
determined.
In Santa Monica Bay, total bacteria load reductions for the various analysis regions were estimated
to be between 10.3 and 12.6 percent (by 2021), based on implementation of various non-structural
BMPs, establishment of LID ordinances to incorporate LID BMPs into qualifying redevelopment

Appendix 6. Peninsula EWMP – RAA Summary
January 2016
Page 47
Peninsula EWMP - RAA Summary
projects, and implementation of a downspout disconnect program for single family residential
homeowners. These load reductions are summarized in Table 11. Since TLRs are equivalent to
zero throughout all of SMB (see Section 2.5.1), reasonable assurance of compliance has been
demonstrated throughout this watershed.
In spite of the zero required load reduction for PCBs and DDT in Santa Monica Bay for the
Peninsula EWMP Group, the BMPs proposed in this EWMP are expected to reduce sediment and
sediment-associated pollutants such as DDTs and PCBs, so the non-quantified but greater-than-
zero anticipated BMP load reductions for DDTs and PCBs will meet the TMDL WLA. Therefore,
compliance with the TMDL-based permit limits for DDTs and PCBs has been demonstrated
through this narrative RAA evaluation.
Within the Machado Lake subwatershed, including the Wilmington Drain subwatershed,
reasonable assurance of compliance with all WBPC target loads was demonstrated for each
analysis region. Due to the high TLRs established within this subwatershed, particularly for total
phosphorus, Permit compliance was demonstrated by the proposed implementation of significant
regional projects throughout the Machado Lake subwatershed by the end of TMDL year 2018, in
addition the various existing and non-structural BMPs accounted for. These include flow-through
treatment BMPs to treat the majority of the RHECH analysis region and the Wilmington Drain
analysis region, in addition to already-planned projects at Chandler Quarry, Casaba Estates, and
the Botanic Gardens. Load reductions were also assumed for the Solano analysis region, based on
pending results from a special study being conducted by the Los Angeles County Flood Control
District and the City of Torrance for Walteria Lake. For the Machado Lake subwatershed as a
whole, TLRs and total estimated load reductions are summarized in Table 9.
Table 9. RAA Results for the Machado Lake Watershed, Reported as Percent of Baseline
Load for the 1995 Critical Year
WBPC Target Load
Reduction (%)
Modeled BMP Load
Reduction (%) RAA Demonstrated?
Wilmington Drain -
Bacteria 53.5% 70.2% Yes
Machado Lake – Total
Nitrogen 6.4% 54.9% Yes
Machado Lake – Total
Phosphorus 57.6% 60.4% Yes
Within the GLA Harbor subwatershed, reasonable assurance of compliance with all WBPC target
loads was demonstrated. Permit compliance was demonstrated by the proposed implementation of
a single regional project at Eastview Park by the end of TMDL year 2032, in addition the various
existing and non-structural BMPs accounted for. TLRs and total estimated load reductions are
summarized in Table 10 for this subwatershed.

Appendix 6. Peninsula EWMP – RAA Summary
January 2016
Page 48
Peninsula EWMP - RAA Summary
Table 10. RAA Results for the GLA Harbor Subwatershed, Reported as Percent of
Baseline Load for the 1995 Critical Year
WBPC Target Load
Reduction (%)
Modeled BMP Load
Reduction (%) RAA Demonstrated?
Total Copper 79.9% 81.9% Yes
Total Lead 3.6% 50.0% Yes
Total Zinc 8.9% 44.5% Yes
Results of the RAA for each analysis region are presented in Table 11 below in terms of percentage
of baseline loads. The values provided correspond to the load reductions attributable to the BMP
types following the applicable final compliance deadline. As shown, the TLR is met in all analysis
regions, with varying levels of non-structural and regional BMPs. Detailed results for all BMPs in
terms of volume, concentration, and load for each WBPC and analysis region can be found in the
electronic data files submitted along with the Peninsula EWMP. An example illustrating the
modeling results of applicable pollutant concentrations at the downstream outlet of the watershed
system is included in Attachment C.

Appendix 6. Peninsula EWMP – RAA Summary
January 2016
Page 49
Peninsula EWMP - RAA Summary
Table 11. RAA Results for Final Compliance Deadlines, Reported as Percent of Baseline Load (1995 Critical Year)
Watershed Analysis
Region Pollutant4
Target Load
Reduction
BMP Load Reduction
Non-Modeled
Programmatic
BMPs
Public
Incentives +
Redevelopment
Existing/
Planned
BMPs
Proposed
BMPs
Cumulative
Load
Reduction
Santa
Monica Bay
SMB7-1 Fecal Coliform 0.0% 7.5% 4.5% 0.0% 0.0% 12.0%
SMB7-1_7-2 Fecal Coliform 0.0% 7.5% 4.8% 0.0% 0.0% 12.3%
SMB7-2 Fecal Coliform 0.0% 7.5% 4.0% 0.0% 0.0% 11.5%
SMB7-2_7-3 Fecal Coliform 0.0% 7.5% 4.5% 0.6% 0.0% 12.6%
SMB7-3 Fecal Coliform 0.0% 7.5% 3.3% 0.1% 0.0% 10.9%
SMB7-3_7-4 Fecal Coliform 0.0% 7.5% 4.3% 0.0% 0.0% 11.8%
SMB7-4 Fecal Coliform 0.0% 7.5% 2.8% 0.0% 0.0% 10.3%
SMB7-4_7-5 Fecal Coliform 0.0% 7.5% 3.0% 0.0% 0.0% 10.5%
SMB7-5 Fecal Coliform 0.0% 7.5% 3.6% 0.0% 0.0% 11.1%
SMB7-5_East Fecal Coliform 0.0% 7.5% 3.3% 0.0% 0.0% 10.9%
Machado
Lake Machado
Total Phosphorus 67.3% 7.5% 1.7% 60.6% 0.0% 69.9%
Total Nitrogen 0.0% 7.5% 1.5% 67.7% 0.0% 76.7%
Machado
Lake via
Wilmington
Drain
Solano1
Fecal Coliform 60.7% 7.5% 2.8% 0.0% 50.4% 60.7%
Total Phosphorus 58.9% 7.5% 2.3% 0.0% 49.1% 58.9%
Total Nitrogen 9.1% 7.5% 2.4% 0.0% - 9.9%
Valmonte
Fecal Coliform 52.2% 7.5% 2.7% 0.0% 84.7% 94.8%
Total Phosphorus 80.7% 7.5% 2.0% 0.0% 74.5% 84.1%
Total Nitrogen 15.3% 7.5% 1.9% 0.0% 73.8% 83.2%
RHECH +
Wilmington
Drain2
Fecal Coliform 53.1% 7.5% 1.9% 3.2% 56.1% 68.7%
Total Phosphorus 50.4% 7.5% 1.2% 1.4% 40.4% 50.5%
Total Nitrogen 6.6% 7.5% 1.1% 1.3% 33.8% 43.7%
GLA Harbor GLA Harbor
Total Copper 79.9% 46.1%3 2.3% 13.2% 20.3% 81.9%
Total Lead 3.6% 7.5% 2.8% 15.4% 24.2% 50.0%
Total Zinc 8.9% 7.5% 2.6% 14.0% 20.4% 44.5% 1 The proposed regional BMP performance for Solano is assumed to meet the TLR. This BMP was not modeled, however, since the Solano analysis
region will be part of the compliance plan for the Walteria Lake drainage area. 2 Results from RHECH and Wilmington Drain have been combined due to the proposed BMP that will treat runoff from both analysis regions. 3 The non-modeled programmatic BMPs for copper includes an assumed 55% reduction in total copper load due to brake pad phase out, to be
achieved by 2032, in accordance with the estimates produced by Kelly Moran and TDC Environmental (TDC Environmental, 2013). 4 Pollutants in bold are the controlling pollutants in each analysis region.

Appendix 6. Peninsula EWMP – RAA Summary
January 2016
Page 50
Peninsula EWMP - RAA Summary
4.2 Dry Weather
Table 13 outlines the qualitative analysis conducted for each of the analysis regions.
In the Santa Monica Bay watershed, since all beach compliance monitoring locations have anti-
degradation-based RWLs for winter-dry seasons, winter-dry target load reductions are zero and
reasonable assurance has been demonstrated. Additionally, historic summer-dry and winter-dry
weather monitoring data at these beach compliance monitoring locations show water quality to be
better than that of the reference beach based on long-term average exceedance rates, further
supporting this dry weather reasonable assurance demonstration. Dry weather exceedance rates at
these beaches have historically ranged from 0 – 3% across both seasons. Since final compliance
deadlines for dry weather have passed for this WBPC, a RAA is not required; however, this
paragraph has been provided for information purposes.
For all analysis regions within the Machado Lake tributary area, compliance with the Nutrient
TMDL WQBELs was previously demonstrated by averaging wet and dry weather monitoring
results together. Since wet weather is the critical condition in the Machado Lake Nutrient TMDL,
and historic monitoring data shows consistently higher nutrient concentrations at MS4 outfalls
during wet weather, if winter (wet plus dry weather) compliance is demonstrated (as shown in
section 4.1), then summer (dry only) compliance will follow as well. To support this, monitoring
data to date have shown average dry weather concentrations at the RHECH compliance monitoring
location to be in compliance with the TMDL WQBELs, and dry weather flows to be non-existent
in the Solano analysis region and Botanic Garden (Lariat) area (see Table 12 for a summary of
dry weather data collected to date). Therefore, dry weather reasonable assurance is demonstrated
for these two analysis regions and future BMPs that are proposed to address wet weather (e.g.,
RHECH + Wilmington, Valmonte) will also provide additional dry weather benefit by infiltrating
or treating dry weather flows, where they are present.
Table 12. Machado Lake Nutrient TMDL Compliance Monitoring, Dry Weather
Compliance Monitoring Location Total Nitrogen (mg/L) Total Phosphorus (mg/L)
RHE City Hall 0.97 0.10
Valmonte 0.61 0.56
Solano1 0 0
Lariat1 0 0 1 No dry weather flows have been recorded at these locations during the monitoring period.
Throughout all watersheds, the Peninsula WMG’s overall dry weather compliance approach is
consistent with the Permit requirements to eliminate 100% of non-exempt dry weather MS4
discharges. The Group’s approach for achieving this is to implement a suite of non-structural
source controls that will include: water conservation incentives, enhanced water conservation

Appendix 6. Peninsula EWMP – RAA Summary
January 2016
Page 51
Peninsula EWMP - RAA Summary
ordinance inspection and enforcement,17 enhanced IDDE efforts and source investigations, and
enhanced education/outreach. By eliminating flows, this is equivalent to 100 percent load
reduction for all pollutants, thereby demonstrating reasonable assurance of meeting all applicable
Permit limits during dry weather. Elimination of discharges is a pathway for compliance with
RWLs and WQBELs in the MS4 Permit (per Section VI.E.2.e.i.(3)); without discharges there can
be no “cause or contribute” to receiving water issues.
Table 13. Dry Weather RAA Evaluation
Analysis
Region
Effective Diversion/
Disinfection at
Analysis Region
Outlet?
Water Quality Data
Demonstrates
Compliance?
NSW MS4
Discharges
Absent?1
Reasonable
Assurance
Demonstrated?
SMB7-1 No Yes - Yes
SMB7-2 No Yes - Yes
SMB7-3 No Yes - Yes
SMB7-4 No Yes - Yes
SMB7-5 No Yes - Yes
Machado No No No No
Solano No Yes Yes Yes
RHECH Proposed2 Yes No Yes
Lariat No Yes Yes Yes
Valmonte Proposed2 No Yes Yes
Wilmington Proposed2 No Yes Yes
GLA Harbor No No No No 1 Based on the outfall screening conducted between September 2014 and December 2014, as
summarized in the Peninsula Outfall Screening Report (Peninsula WMG, 2015). 2 The proposed BMPs described for the Valmonte analysis region (Section 3.5.3) and RHECH plus
Wilmington Drain analysis region (Section 3.5.2) would treat dry weather flows, and would thereby
result in reasonable assurance of compliance during dry weather.
4.3 Multiple Benefits
Not only is reasonable assurance demonstrated for the WQBEL and RWLs in the Permit, but some
of the proposed projects also provide multiple benefits beyond pollutant load reduction. Some of
these potential benefits are described below. More information can be found in Section 3.2.4.2 of
the EWMP.
17 Each of the EWMP Group cities has water conservation ordinances, and intends to enhance existing efforts to
inspect and enforce these requirements, to reduce sources of dry weather runoff such as irrigation overspray. And
where feasible, incentives (e.g., smart controller rebates, turfgrass replacement) will be provided to incentivize water
conservation behavior changes.

Appendix 6. Peninsula EWMP – RAA Summary
January 2016
Page 52
Peninsula EWMP - RAA Summary
4.3.1 Beneficial Use Protection
The reduction of MS4-generated bacteria loads throughout the Peninsula EWMP Area will help to
protect recreational beneficial uses and support public health (and wellness) at Santa Monica Bay
Beaches, Machado Lake, and GLA Harbor.
4.3.2 Neighborhood Greening and Public Recreation
Increased green space can positively impact the aesthetics, as well as property values, of urbanized
areas. Property value tends to increase when an urban neighborhood has green space or trees in
sight (CNT, 2010). Green infrastructure and green space can also alleviate urban heat-island effects
by reducing temperatures by about 5oF through shade and evaporation (CNT, 2010).
Recreation opportunities also can be increased by increased green space. For example, public trails
are being planned for incorporation into the BMP design at the Botanic Gardens. Other proposed
BMPs will also seek to incorporate recreational benefits into project designs, as feasible.
4.3.3 Water Conservation/Supply
Stormwater retained in capture-and-use BMPs can be reused for irrigation and other on-site, non-
potable uses, thus promoting water conservation and offsetting reliance on the potable water
supply (SWRCB, 2012a).
4.3.4 Public Education/Awareness
Public education and outreach engages the public’s interest in preventing stormwater pollution and
is achieved most effectively through an understanding of the varying levels of public background
knowledge about stormwater management and pollution prevention (EPA, 2014).
Public outreach is a major facet of the public retrofit incentives element of the RAA approach,
which is directed at incentivizing the public to decrease the amount of stormwater runoff from
their property, specifically via downspout disconnects. Outreach for this incentive may occur in
the form of direct conversations, a variety of media, and/or short training courses, for example.
Structural BMPs proposed in the EWMP may also serve as public education opportunities in the
form of on-site educational materials, such as placards and interpretive signage posted at
construction and completed sites.
5 LIMITATIONS
The professional opinions and recommendations expressed in this memorandum are made in
accordance with generally accepted standards of practice and were based largely on source
information provided by others. No other warranty is either express or implied. Geosyntec is
responsible for the recommendations contained in this report based on the data and information
relating only to the specific projects modeling discussed herein. Geosyntec is not responsible for
use of the information contained in this report for purposes other than those expressly stated in this

Appendix 6. Peninsula EWMP – RAA Summary
January 2016
Page 53
Peninsula EWMP - RAA Summary
report namely the RAA in support of the Peninsula EWMP. In the event that there are changes in
modeling assumptions, including the design or location of projects that do not conform to the
projects as described herein, Geosyntec is not responsible for these changes. Geosyntec is not
responsible for any conclusions or recommendations made by others based upon the data or
conclusions contained herein unless given the opportunity to review them and concur with them
in writing.
Appendix 6. Peninsula EWMP – RAA Summary
January 2016
Page 54
Peninsula EWMP - RAA Summary
6 REFERENCES
Donigian, A. S., Jr. 2000. Lecture 19: Calibration and verification issues, Slide L19-22. HSPF
training workshop handbook and CD. Presented and prepared for the U.S. EPA Office of Water
and Office of Science and Technology, Washington, D.C.
Geosyntec Consultants, 2008. A User’s Guide for the Structural BMP Prioritization and Analysis
Tool (SBPAT v1.0): Technical Appendices. December.
Heal the Bay, 2015. Beach Report Card. http://brc.healthebay.org/
Los Angeles Regional Water Quality Control Board (Regional Board), 2014. Guidelines for
conducting reasonable assurance analysis in a watershed management program, including an
enhanced watershed management program. March 25.
Los Angeles Regional Water Quality Control Board (Regional Board), 2012. Order No. R4-2012-
0175 NPDES Permit No. CAS004001 Waste Discharge Requirements for Municipal Separate
Storm Sewer System (MS4) Discharges within the Coastal Watersheds of Los Angeles County,
except those Discharges Originating from the City of Long Beach MS4. November 8.
Los Angeles Regional Water Quality Control Board (Regional Board), 2012b. Attachment A to
Resolution No. R12-009. Amendment to the water quality control plan for the Los Angeles Region
to revise the TMDL for bacteria in the Malibu Creek Watershed. Adopted June 7.
Palos Verdes Peninsula Watershed Management Group (Peninsula WMG), 2014. Enhanced
Watershed Management Program Work Plan. June.
Palos Verdes Peninsula Watershed Management Group (Peninsula WMG), 2015. Peninsula
Outfall Screening Report, April.
Rolling Hills Estates, Rolling Hills, Rancho Palos Verdes, and Palos Verdes Estates, 2011. Palos
Verdes Peninsula Coordinated Monitoring Plan in Compliance with the Machado Lake Nutrient
TMDL. February 1.
TDC Environmental, 2013. Estimate of Urban Runoff Copper Reduction in Los Angeles County
from the Brake Pad Copper Reductions Mandated by SB 346. Prepared for Richard Watson &
Associates, Inc. January 3.
United States Department of Agriculture (USDA), 2009. Part 630, Hydrology National
Engineering Handbook. Chapter 7: Hydrologic Soil Groups.

ATTACHMENT A
SBPAT LAND USE DATA

Appendix 6. Peninsula EWMP – RAA Summary
January 2016
Page A-1
Peninsula EWMP - RAA Summary
Table A-1. SBPAT EMCs for Peninsula EWMP Watersheds
Arithmetic Estimates of the Lognormal Summary Statistics (means with standard deviations in parentheses)a
Land Use TSS
mg/L
TP
mg/L
DP
mg/L
NH3
mg/L
NO3
mg/L
TKN
mg/L
Diss Cu
ug/L
Tot Cu
ug/L
Tot
Pb
ug/L
Diss Zn
ug/L
Tot
Zn
ug/L
Fecal Col.
#/100mL
Single Family Residential 124.2
(184.9)
0.40
(0.30)
0.32
(0.21)
0.49
(0.64)
0.78
(1.77)
2.96
(2.74)
9.4
(9.0)
18.7
(13.4)
11.3
(16.6)
27.5
(56.2)
71.9
(62.4)
31,100b
(94,200)
Commercial 67.0
(47.1)
0.40
(0.33)
0.29
(0.25)
1.21
(4.18)
0.55
(0.55)
3.44
(4.78)
12.3
(10.2)
31.4
(25.7)
12.4
(34.2)
153.4
(96.1)
237.1
(150.3)
51,600
(173,400)c
Industrial 219.2
(206.9)
0.39
(0.41)
0.26
(0.25)
0.6
(0.95)
0.87
(0.96)
2.87
(2.33)
15.2
(14.8)
34.5
(36.7)
16.4
(47.1)
422.1
(534.0)
537.4
(487.8)
3,760
(4,860)
Education (Municipal) 99.6
(122.7)
0.30
(0.17)
0.26
(0.2)
0.4
(0.99)
0.61
(0.67)
1.71
(1.13)
12.2
(11.0)
19.9
(13.6)
3.6
(4.9)
75.4
(52.3)
117.6
(83.1)
11,800d
(23,700)
Transportation 77.8
(83.8)
0.68
(0.94)
0.56
(0.82)
0.37
(0.68)
0.74
(1.05)
1.84
(1.44)
32.40
(25.5)
52.2
(37.5)
9.2
(14.5)
222.0
(201.7)
292.9
(215.8)
1,680
(456)
Multi-Family Residential 39.9
(51.3)
0.23
(0.21)
0.20
(0.19)
0.50
(0.74)
1.51
(3.06)
1.80
(1.24)
7.40
(5.70)
12.1
(5.60)
4.5
(7.80)
77.5
(84.1)
125.1
(101.1)
11,800e
(23,700)
Agriculture (row crop) 999.2
(648.2)
3.34
(1.53)
1.41
(1.04)
1.65
(1.67)
34.40
(116.30)
7.32
(3.44)
22.50
(17.50)
100.1
(74.8)
30.2
(34.3)
40.1
(49.1)
274.8
(147.3)
60,300
(153,000)
Vacant / Open Space 216.6
(1482.8)
0.12
(0.31)
0.09
(0.27)
0.11
(0.25)
1.17
(0.79)
0.96
(0.9)
0.60
(1.90)
10.6
(24.4)
3.0
(13.1)
28.1
(12.9)
26.3
(69.5)
484f
(806) a EMC statistics are calculated based on 1996-2000 data for Los Angeles County land use sites (Los Angeles County, 2000), except for agriculture
which are based on Ventura County MS4 EMCs (Ventura County, 2003) and fecal coliform which are based on 2000-2005 SCCWRP Los Angeles
region land use data (SCCWRP, 2007b). These EMC datasets are summarized in the SBPAT User’s Guide (Geosyntec, 2012). b The fecal coliform EMC for the single-family residential land use is based on SCCWRP dataset for “low-density residential.” c The default log distribution best fit summary statistics for this land use-pollutant combination produced an unreasonably high deviation, therefore
the arithmetic estimate of the log mean was held constant while the log summary statistics were recomputed based on the log CoV for SFR
(SCCWRP’s LDR EMC).
d Multi Family Residential EMC used since educational land use site not available in the SCCWRP fecal coliform dataset. e The fecal coliform EMC for the multi-family residential land use is based on SCCWRP dataset for “high-density residential.” f Open space fecal coliform EMC statistics based on E. coli data (divided by 0.85 to adjust to fecal coliform) for Arroyo Sequit reference watershed,
or 11 samples collected between December 2004 and April 2006. Data used by Regional Board for Santa Clara River Bacteria TMDL and taken
from (SCCWRP, 2005) and (SCCWRP 2007a).

Appendix 6. Peninsula EWMP – RAA Summary
January 2016
Page A-2
Peninsula EWMP - RAA Summary
Table A-2: Data Summary for SBPAT Default LA County Land Use EMC Datasetsa
Land Use TSS TP DP NH3 NO3 TKN Diss
Cu
Tot
Cu
Tot
Pb
Diss
Zn
Tot
Zn
Fecal
Col.
Commercial Count 31 32 33 33 33 36 40 40 40 40 40 5
% ND 0% 3% 3% 21% 21% 3% 15% 0% 45% 10% 0% 20%
Industrial Count 53 55 56 57 56 57 61 61 61 61 61 6
% ND 0% 5% 9% 19% 5% 0% 15% 0% 43% 7% 0% 0%
Transportation Count 75 71 71 74 75 75 77 77 77 77 77 2
% ND 0% 1% 4% 27% 20% 0% 1% 0% 52% 6% 0% 0%
Education Count 51 49 49 52 51 51 54 54 54 54 54 NA
% ND 0% 0% 2% 35% 24% 0% 19% 0% 76% 39% 9% NA
Multi-Family
Residential
Count 45 38 38 46 46 50 54 54 54 54 54 7
% ND 2% 3% 3% 24% 26% 0% 37% 7% 72% 41% 9% 0%
Single Family
Residential
Count 41 42 42 44 43 46 48 48 48 48 48 4
% ND 0% 0% 0% 16% 30% 0% 40% 4% 52% 81% 44% 0%
Agriculture
(row crop)
Count 20 18 18 21 19 17 18 21 21 21 21 5
% ND 0% 0% 0% 0% 5% 0% 0% 0% 0% 10% 0% 0%
Vacant / Open
Space
Count 48 46 44 48 50 50 52 52 57 52 52 11
% ND 2% 41% 57% 67% 2% 0% 90% 38% 88% 96% 77% 0%
a EMC data are based on 1996-2000 data for Los Angeles County land use sites (Los Angeles County, 2000), except for agriculture which are based
on Ventura County MS4 EMCs (Ventura County, 2003) and fecal coliform which are based on 2000-2005 SCCWRP Los Angeles region land use
data (SCCWRP, 2007b). These EMC datasets are summarized in the SBPAT User’s Guide (Geosyntec, 2012). Open space fecal coliform EMC
based on 2004-2006 SCCWRP data for Arroyo Sequit reference watershed, taken from (SCCWRP, 2005) and (SCCWRP 2007a).

ATTACHMENT B
SBPAT BMP EFFLUENT DATA

Appendix 6. Peninsula EWMP – RAA Summary
January 2016
Page B-1
Peninsula EWMP - RAA Summary
Table B-1. Summary of Number of Data Points and Percent Non-Detects
for BMP Effluent Concentration Data from the International BMP Database
BMP TSS TP DP NH3 NO3 TKN DCu TCu TPb DZn TZn FC
Bioretention Count 193 249 164 184 259 201 NA 39 48 15 48 29
%ND 10% 5% 4% 18% 3% 2% NA 18% 60% 0% 35% 0%
Vegetated Swales
(Bioswales)
Count 354 364 249 225 372 324 82 309 308 72 373 92
%ND 1% 1% 0% 17% 1% 0% 4% 3% 39% 6% 23% 0%
Hydrodynamic Separators
(not updated - original
SBPAT analysis, 2008)
Count 199 170 58 69 59 77 89 99 95 99 174 31
%ND 7% 3% 33% 28% 3% 5% 17% 0% 8% 18% 7% 3.2%
Media Filters Count 409 403 244 215 391 374 186 361 341 221 433 185
%ND 7% 6% 14% 24% 2% 6% 7% 12% 21% 19% 13% 0%
Detention Basins Count 299 275 116 94 213 185 170 198 209 163 189 190
%ND 1% 3% 16% 6% 7% 4% 32% 31% 50% 17% 15% 0%
Retention Ponds Count 723 654 618 423 626 496 213 536 646 212 593 137
%ND 4% 3% 6% 8% 6% 3% 26% 21% 30% 15% 7% 0%
Wetland Basins/Retention
Ponds (combined)
Count 1028 932 862 681 872 680 228 684 767 227 770 158
%ND 4% 3% 6% 7% 7% 2% 25% 20% 28% 14% 8% 0%

Appendix 6. Peninsula EWMP – RAA Summary
January 2016
Page B-2
Peninsula EWMP - RAA Summary
Table B-2. International BMP Database Arithmetic Mean Estimates of BMP Effluent Concentrations
BMP TSS TP DP NH3 NO3 TKN DCu TCu TPb DZn TZn FC
mg/L mg/L mg/L mg/L mg/L mg/L ug/L ug/L ug/L ug/L ug/L #/100 mL
Constructed Wetland /
Retention Pond (with
Extended Detention)1
38.3 0.19 0.11 0.18 0.42 1.20 5.3 6.7 7.2 22.1 35.3 1.01E+04
Constructed Wetland /
Retention Pond (without
Extended Detention)2
32.9 0.17 0.09 0.17 0.38 1.20 5.3 6.2 12.0 22.6 38.0 9.89E+03
Dry Extended Detention
Basin3 42.3 0.37 0.26 0.16 0.61 2.40 6.5 11.4 14.4 33.7 78.4 1.41E+04
Hydrodynamic Separator4 98.1 0.50 0.06 0.30 0.67 2.07 13.1 16.7 12.7 78.4 107.4 2.68E+04
Media Filter5 22.3 0.14 0.07 0.18 0.74 0.98 8.3 11.0 4.6 34.7 37.6 5.89E+03
Sub-surface Flow Wetland6 18.1 0.06 0.06 0.09 0.27 0.87 4.6 4.6 0.7 20.9 25.8 PR=90%
Treatment Plant7 2.0 0.00 0.00 0.00 0.27 0.01 1.0 1.0 4.4 5.0 5.0 2.00E+00
Vegetated Swale (Bioswale)8 27.1 0.28 0.17 0.09 0.43 0.87 9.6 10.1 6.4 33.3 33.3 8.00E+04
Bioretention9 18.1 0.14 0.07 0.18 0.37 0.98 8.3 8.8 4.2 34.7 37.6 5.89E+03
Bioretention w/o underdrain Volume reductions only
Cistern Volume reductions only
Green Roof Volume reductions only
Porous Pavement Volume reductions only
Infiltration Basin Volume reductions only 1 Based on retention pond IBD category (basis per Geosyntec 2008) 2 Based on combined wetland basin and retention pond IBD categories (basis per Geosyntec 2008) 3 Strictly detention basin category from the IBD 4 From Geosyntec, 2008 5 Includes non-bio media filters (e.g., sand filters) 6 Lowest of all IBD categories; except for Fecal Coliform where 90% removal is used. The 90% removal is based on USEPA, 1993, which states that SSF wetlands
are generally capable of a 1 to 2 log reduction in fecal coliforms. 7 Secondary Drinking Water Standards or Minimum of all BMP types, whichever is less 8 Strictly from vegetated swale category from the IBD 9 Effluent quality assigned to treated underdrain discharge is based on the better performing characteristics of the “media filter” and “bioretention” categories for
each pollutant.
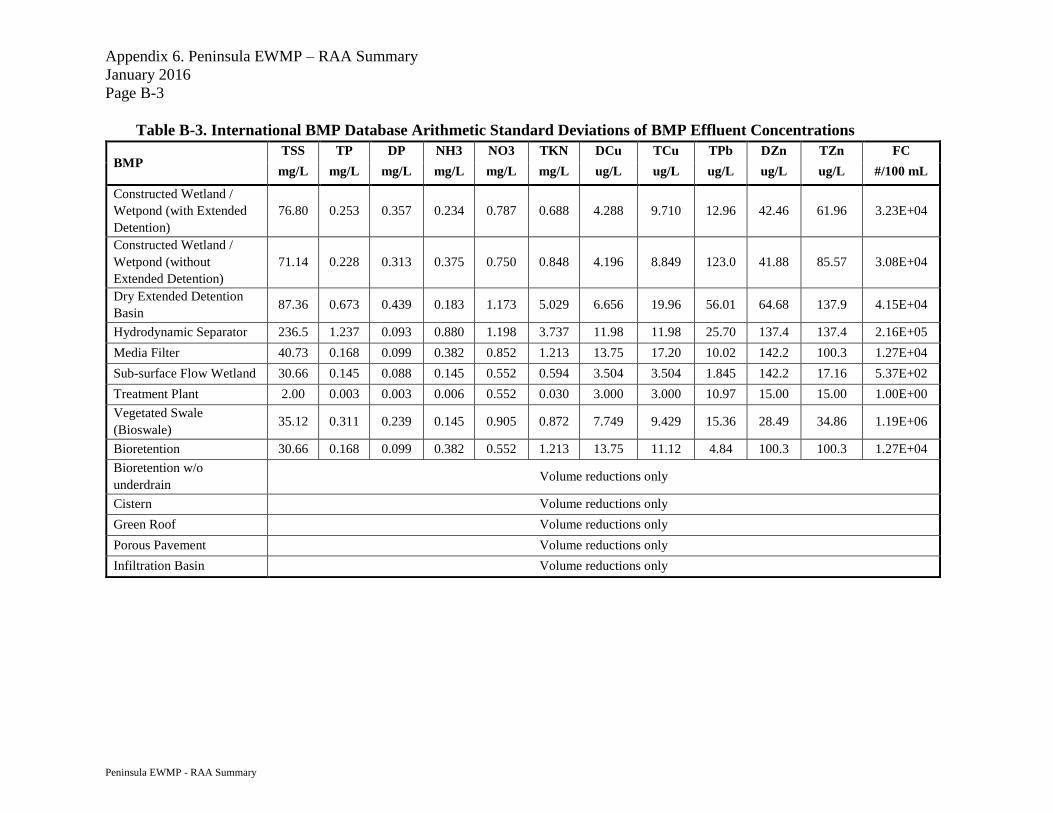
Appendix 6. Peninsula EWMP – RAA Summary
January 2016
Page B-3
Peninsula EWMP - RAA Summary
Table B-3. International BMP Database Arithmetic Standard Deviations of BMP Effluent Concentrations
BMP TSS TP DP NH3 NO3 TKN DCu TCu TPb DZn TZn FC
mg/L mg/L mg/L mg/L mg/L mg/L ug/L ug/L ug/L ug/L ug/L #/100 mL
Constructed Wetland /
Wetpond (with Extended
Detention)
76.80 0.253 0.357 0.234 0.787 0.688 4.288 9.710 12.96 42.46 61.96 3.23E+04
Constructed Wetland /
Wetpond (without
Extended Detention)
71.14 0.228 0.313 0.375 0.750 0.848 4.196 8.849 123.0 41.88 85.57 3.08E+04
Dry Extended Detention
Basin 87.36 0.673 0.439 0.183 1.173 5.029 6.656 19.96 56.01 64.68 137.9 4.15E+04
Hydrodynamic Separator 236.5 1.237 0.093 0.880 1.198 3.737 11.98 11.98 25.70 137.4 137.4 2.16E+05
Media Filter 40.73 0.168 0.099 0.382 0.852 1.213 13.75 17.20 10.02 142.2 100.3 1.27E+04
Sub-surface Flow Wetland 30.66 0.145 0.088 0.145 0.552 0.594 3.504 3.504 1.845 142.2 17.16 5.37E+02
Treatment Plant 2.00 0.003 0.003 0.006 0.552 0.030 3.000 3.000 10.97 15.00 15.00 1.00E+00
Vegetated Swale
(Bioswale) 35.12 0.311 0.239 0.145 0.905 0.872 7.749 9.429 15.36 28.49 34.86 1.19E+06
Bioretention 30.66 0.168 0.099 0.382 0.552 1.213 13.75 11.12 4.84 100.3 100.3 1.27E+04
Bioretention w/o
underdrain Volume reductions only
Cistern Volume reductions only
Green Roof Volume reductions only
Porous Pavement Volume reductions only
Infiltration Basin Volume reductions only

Appendix 6. Peninsula EWMP – RAA Summary
January 2016
Page B-4
Peninsula EWMP - RAA Summary
Table B-4. International BMP Database Arithmetic Irreducible of BMP Effluent Concentrations
BMP TSS TP DP NH3 NO3 TKN DCu TCu TPb DZn TZn FC
mg/L mg/L mg/L mg/L mg/L mg/L ug/L ug/L ug/L ug/L ug/L #/100 mL
Constructed Wetland /
Wetpond (with Extended
Detention)
1.358 0.034 0.010 0.019 0.011 0.499 1.387 1.387 0.429 1.000 2.933 4
Constructed Wetland /
Wetpond (without Extended
Detention)
1.300 0.030 0.009 0.012 0.010 0.520 1.267 1.267 0.400 1.075 3.000 5.4
Dry Extended Detention
Basin 5.460 0.089 0.523 0.336 0.026 3.650 1.153 1.274 0.435 8.396 8.396 19.6
Hydrodynamic Separator 5.543 0.023 0.172 0.014 1.299 3.576 3.340 3.340 1.351 17.793 17.793 3295
Media Filter 1.487 0.026 0.010 0.013 0.064 0.210 0.995 1.298 0.372 1.000 2.000 13.1
Sub-surface Flow Wetland 1.268 0.025 0.006 0.009 0.008 0.141 1.000 1.000 0.089 1.000 2.933 4
Treatment Plant 0.500 0.001 0.001 0.001 0.008 0.001 0.100 0.100 0.255 0.500 0.500 1
Vegetated Swale (Bioswale) 2.000 0.079 0.040 0.009 0.056 0.141 2.708 2.708 0.434 5.720 5.720 9.53E+04
Bioretention 1.605 0.026 0.010 0.013 0.050 0.210 0.995 1.524 0.836 1.000 2.000 13.1
Bioretention w/o underdrain Volume reductions only
Cistern Volume reductions only
Green Roof Volume reductions only
Porous Pavement Volume reductions only
Infiltration Basin Volume reductions only

ATTACHMENT C
EXAMPLE RAA CALCULATIONS

Appendix 6. Peninsula EWMP – RAA Summary
January 2016
Page C-1
Peninsula EWMP - RAA Summary
Example TLR Calculations
Bacteria
To better illustrate the bacteria TLR calculation process, the following example scenario was
developed for the Valmonte compliance monitoring location for TMDL year 1995.
Steps 1-4: Calculate the exceedance frequency and allowable discharge days
The SMB Beaches Bacteria TMDL defines a wet weather day as a calendar day with
precipitation greater than 0.1 inches, and the three days following such day. The allowable
number of discharge days is calculated by multiplying the number of wet weather days by the
freshwater exceedance rate for bacteria (19%). The results of this analysis are shown in the table
below.
Number of wet
weather days in
Valmonte
Allowable Discharge Days
(Based on wet weather
exceedance frequency of 19%)
82 16
Steps 5-6: Model the analysis region in SBPAT and size a retention BMP to only bypass during
the allowable discharge days
The analysis region was modeled in SBPAT and resulted in 59 discharge days (i.e., midnight –
midnight 24-hour periods when discharge occurred). To reduce the baseline 59 discharge days to
the allowable 16 discharge days, the diversion flowrate to a hypothetical retention BMP was
iteratively sized until 16 discharge days occurred in the model. This process resulted in a
retention BMP with a diversion flow rate of 31.1 cubic feet per second (cfs).
Steps 7: Model the hypothetical retention BMP and the baseline condition in SBPAT and
compare the FC loads to determine the TLR
The baseline condition for the Valmonte analysis region and the hypothetical retention BMP
with a diversion flow rate of 31.1 cfs were modeled in SBPAT for TMDL year 1995. The table
below shows the results of this modeling.
Average baseline FC
load (10^12 MPN)
Average FC load
assuming hypothetical
retention BMP
(10^12 MPN)
Target Load
Reduction
(10^12 MPN)
Target Load
Reduction
(%)
147.9 70.7 77.3 52.2%

Appendix 6. Peninsula EWMP – RAA Summary
January 2016
Page C-2
Peninsula EWMP - RAA Summary
Nutrients - Total Phosphorus
To better illustrate the nutrient TLR calculation process, the following example scenario was
developed for the Valmonte analysis region for TMDL year 1995 for Total Phosphorus (TP).
Step 1: Determine average wet weather and dry weather discharge concentration
The Machado Lake Nutrients Compliance Monitoring Plan defines a wet weather day as a
calendar day with total precipitation exceeding 0.25 inches. Based on this definition, all available
monitoring data from August 2011 to February 2015 was defined as wet weather data or dry
weather data. The average TP concentration at Valmonte was then computed for both wet
weather and dry weather as summarized in the table below:
Wet Weather TP
Concentration (mg/L)
Dry Weather TP
Concentration (mg/L)
0.559 0.446
Steps 2 - 3: Based on the daily rainfall data from TMDL year 1995, assign average wet day or
dry day concentrations to each day of the year
Each day of TMDL year 1995 was defined as either a wet day or dry day, based on historical
rainfall data. After this, the average wet weather TP concentration was assigned to all wet days
for the year, and the average dry weather TP concentration was assigned to all dry days for the
year. This was done for every day of TMDL year 1995.
Step 4: Determine the average monthly concentration for each month
Based on the data record created in Step 3, the average TP concentration was calculated for each
month. Of the 12 calculated monthly concentrations, the highest monthly TP concentration was
assumed to be the critical condition, since the goal is to demonstrate compliance for the entire
90th percentile year. This concentration was estimated to be 0.519 mg/L, based on 20 wet
weather days and 11 dry weather days during the month of January.
Step 5 - 7: Calculate the baseline load, target load, and TLR
Based on the average monthly concentration from Step 4 and the WQBEL concentration of 0.1,
the baseline load and target load were calculated as the 90th percentile annual volume multiplied
by the respective concentrations. The TLR was calculated as the difference between these two
loads. The results are shown in the table below:
Baseline TP Load (lbs) Target TP Load
(lbs)
Target Load
Reduction (lbs)
Target Load
Reduction
(%)
506.0 97.5 408.5 80.7%

Appendix 6. Peninsula EWMP – RAA Summary
January 2016
Page C-3
Peninsula EWMP - RAA Summary
Metals - Lead
To better illustrate the metal TLR calculation process, the following example scenario was
developed for the Los Angeles Harbor analysis region for TMDL year 1995 for lead.
Steps 1-2: Model the analysis region in SBPAT to estimate the baseline load
The analysis region was modeled in SBPAT to obtain baseline runoff and lead loading. The
results are shown in the table below:
Baseline Lead Load
(lbs)
Average Runoff
((ac-ft))
60.5 2518.8
Steps 3: Compute the target loading based on MS4 TMDL limit.
The CTR criteria for lead is 8.1 ug/L. The target load was computed by multiplying the
concentration with the runoff volume obtained from Step 2. The result was 55.5 lbs.
Step 4: Compute TLR based on baseline and target loading.
The table below shows the computation results:
Baseline Load (lbs) Target Load
(lbs)
Target Load
Reduction (lbs)
Target Load
Reduction (%)
60.6 55.5 5.1 8.4%

Appendix 6. Peninsula EWMP – RAA Summary
January 2016
Page C-4
Peninsula EWMP - RAA Summary
Example BMP Performance
As discussed in the Peninsula EWMP, BMPs were modeled in SBPAT in order to demonstrate a
reasonable assurance of achieving the estimated target load reductions for each analysis region.
Modeled BMPs included programmatic, distributed, and regional BMPs, as discussed in Section
3 of the EWMP. Although a variety of BMPs are modeled in SBPAT, the different BMPs achieve
pollutant load reduction via one of two primary methods: volume loss (e.g., via capture and use,
infiltration, and/or evapotranspiration) or volume treatment (e.g., via filtration). Both types of
BMPs were modeled as part of the Peninsula EWMP.
An example of daily influent and effluent18 BMP performance results is provided here for a flow-
through based BMP and an infiltration-based BMP for the 90th percentile critical year (1995). Flow
volume, pollutant concentration, and load results were generated from the quantification analysis
component of the SBPAT model, which:
Calculates and tracks inflows to BMPs, treated discharge, bypassed flows, evaporation,
and infiltration at each 10 minute time step;
Distinguishes between individual runoff events by defining six-hour minimum inter-event
time in the rainfall record, yet tracks inter-event antecedent conditions;
Tracks volume through BMPs and summarizes and records these metrics by storm event;
and
Produces a table of each BMP’s hydrologic performance, including concentration and load
metrics by storm event, and consolidates these outputs on an annual basis.
Figure C-1 shows the modeled influent and effluent fecal coliform results for the flow-through
regional SSF wetland proposed at the Palos Verdes Landfill, which is proposed to treat flows from
the Wilmington Drain and Rolling Hills Estates City Hall (RHECH) analysis regions (See Section
3.5.2). Similarly, Figure C-2 shows the modeled influent and effluent total copper results for the
infiltration-based Eastview Park regional BMP, which is proposed to treat flows from the Greater
Los Angeles (GLA) Harbor analysis region (See Section 3.5.4).19 These are the controlling
pollutants for each of the analysis regions shown in this example.
The flow-through BMP example (Figure C-1) demonstrates that pollutant load reduction here is
primarily achieved through concentration reduction (i.e., treatment), with minor contribution from
volume reduction (the only volume loss is due to soil storage and evapotranspiration). The
infiltration-based BMP example (Figure C-2) demonstrates that pollutant load reduction here is
18 Effluent results are a combination of treated BMP effluent and untreated bypass for each BMP. The determination
of what flows are treated and what flows are bypassed is a function of BMP design parameters, rainfall-runoff patterns,
and antecedent conditions. 19 This example was used due to the fact that it was the only large-scale infiltration BMP modeled in the Peninsula
EWMP Area.

Appendix 6. Peninsula EWMP – RAA Summary
January 2016
Page C-5
Peninsula EWMP - RAA Summary
primarily due to volume reduction achieved through infiltration (which completely removes this
water volume and associated pollutant mass). In these figures, concentrations are shown as zero
when there is no volume (for example, when influent is completely infiltrated for a storm such that
there is no effluent discharge from the BMP).

Appendix 6. Peninsula EWMP – RAA Summary
January 2016
Page C-6
Peninsula EWMP - RAA Summary
Figure C-1. Time-Series Results of Flow-Through Regional BMP Proposed for
Wilmington Drain/ RHECH Analysis Regions
0.0E+00
5.0E+06
1.0E+07
1.5E+07
2.0E+07
2.5E+07
3.0E+07
11/1/1994 12/11/1994 1/20/1995 3/1/1995 4/10/1995 5/20/1995 6/29/1995
Flo
w V
olu
me
(cf)
Date
Wilmington + RHECH Flow-Through BMP
Influent Effluent
0.E+00
5.E+03
1.E+04
2.E+04
2.E+04
3.E+04
3.E+04
4.E+04
4.E+04
11/1/1994 12/11/1994 1/20/1995 3/1/1995 4/10/1995 5/20/1995 6/29/1995
FC
Co
nce
ntr
atio
n (
MP
N/1
00
mL
)
Date
Influent Effluent
0.0E+00
5.0E+13
1.0E+14
1.5E+14
2.0E+14
2.5E+14
3.0E+14
11/1/1994 12/11/1994 1/20/1995 3/1/1995 4/10/1995 5/20/1995 6/29/1995
FC
Lo
ad (
MP
N)
Date
Influent EFfluent

Appendix 6. Peninsula EWMP – RAA Summary
January 2016
Page C-7
Peninsula EWMP - RAA Summary
Figure C-2. Time-Series Results of Infiltration-Based Regional BMP Proposed for GLA
Harbor Analysis Region
0.0E+00
1.0E+06
2.0E+06
3.0E+06
4.0E+06
5.0E+06
6.0E+06
7.0E+06
11/1/1994 12/11/1994 1/20/1995 3/1/1995 4/10/1995 5/20/1995 6/29/1995
Flo
w V
olu
me
(cf)
Date
GLA Harbor Infiltration-Based BMP
Influent Effluent
0.E+00
5.E+00
1.E+01
2.E+01
2.E+01
3.E+01
11/1/1994 12/21/1994 2/9/1995 3/31/1995 5/20/1995 7/9/1995
TC
u C
once
ntr
atio
n (
ug/L
)
Date
Influent Effluent
0.0E+00
1.0E+00
2.0E+00
3.0E+00
4.0E+00
5.0E+00
6.0E+00
7.0E+00
8.0E+00
11/1/1994 12/11/1994 1/20/1995 3/1/1995 4/10/1995 5/20/1995 6/29/1995
TC
u L
oad
(lb
)
Date
Influent EFfluent

Appendix 6. Peninsula EWMP – RAA Summary
January 2016
Page C-8
Peninsula EWMP - RAA Summary
Example Compliance Demonstration
Figure C-3 provided an example illustration of the volume, pollutant load, and pollutant
concentration reductions achieved by the total combination of existing and proposed structural and
non-structural BMPs in the Peninsula EWMP Area. On the far left side of Figure C-3, the modeled
runoff volume, bacteria load, and bacteria concentration for the baseline condition in the
Wilmington + RHECH analysis region are presented. Moving to the right along the x-axis of
Figure C-3, each set of bars demonstrates the cumulative effectiveness of the various BMP types
on effluent volume, concentration, and load. For example, since a 7.5 percent pollutant load and
concentration reduction is assumed for the non-modeled programmatic BMPs in the Peninsula
EWMP Area, the second set of bars demonstrates a 7.5 percent reduction in bacteria concentration
and load, while the runoff volume remains unchanged. Moving to the next set of bars, the
cumulative effect of the public retrofit incentives and redevelopment BMPs results in a slight
reduction in runoff volume, bacteria concentration, and bacteria load.
For the Wilmington + RHECH analysis region, the example demonstrates that the estimated
allowed load (i.e., the baseline load minus the target load reduction) is achieved during the critical
year by the cumulative effect of the modeled BMPs, as described in Section 33.5.2. Programmatic
BMPs, public incentives and redevelopment, existing/planned BMPs, and proposed BMPs are all
expected to reduce runoff volume, bacteria concentrations, and bacteria loads compared to existing
(baseline) conditions, with the largest percent concentration and load reduction achieved by the
proposed BMPs.
The order of the BMPs in Figure C-3 does not represent a proposed schedule or suggested order
of implementation, but is provided as an example to demonstrate how all BMPs collectively
achieve pollutant load reduction until compliance demonstration is achieved (i.e., when the target
load reductions are met or exceeded by the modeled BMP load reductions).

Appendix 6. Peninsula EWMP – RAA Summary
January 2016
Page C-9
Peninsula EWMP - RAA Summary
Figure C-3. RAA Modeling Example Illustration: Total Annual Volumes, Annual Average
Concentrations, and Total Annual Loads Shown for Multiple Modeled BMP Scenarios
2227.8
2227.82224.6 2198.0 2178.3
26800
24700 2430023700
10500
735.1
680.0665.7
642.4
283.1
0%
10%
20%
30%
40%
50%
60%
70%
80%
90%
100%
Baseline Non-Modeled
Programmatic
BMPs Eff.
Public Incentives +
Redevelopment
Eff.
Existing/ Planned
BMPs Eff.
Proposed BMPs
Eff.
% o
f B
ase
lin
e C
on
dit
ion
RAA Modeling Illustration for Analysis Region Wilmington + RHECH
Runoff Volume (ac-ft) Average Bacteria Conc. (MPN/100mL) Bacteria Load (10^12 MPN)
Allowed Bacteria Load = 345 * 1012 MPN

ATTACHMENT D
ANNUAL RAINFALL RECORDS USED IN THE PENINSULA RAA

Appendix 6. Peninsula EWMP – RAA Summary
January 2016
Page D-1
Peninsula EWMP - RAA Summary
Percentile
Torrance Municipal Airport
D1158
Palos Verdes Landfill
D1252
Precipitation Total Number of Wet Days Precipitation Total Number of Wet Days
Year Precip. (in) Year Days Year Precip (in) Year Precip. (in)
96.4% 1998 30.5 1998 109 1998 34.4 1998 107
92.8% 2005 28.0 1995 81 1995 29.5 2005 86
89.2% 1995 27.8 2005 78 2005 27.7 1995 82
85.7% 1993 24.2 1993 73 2010 21.7 2010 78
82.1% 1992 20.8 1999 68 2011 20.5 2011 75
78.5% 2010 18.0 1992 67 2001 20.1 1992 68
75.0% 2001 16.6 2010 66 1993 19.5 1999 65
71.4% 2003 16.6 1987 62 1992 19.4 1993 64
67.8% 2011 15.8 2011 61 2003 18.7 1996 64
64.2% 1986 15.2 1994 60 1986 17.9 2004 63
60.7% 1997 13.2 1988 59 2000 13.6 1994 58
57.1% 2008 12.0 1996 59 1996 13.3 1988 55
53.5% 1991 11.5 1989 58 2008 12.7 2006 54
50.0% 2000 11.3 2003 57 2004 12.3 1989 53
46.4% 1988 10.8 2006 55 1991 10.5 2003 52
42.8% 2004 10.8 2004 54 1988 10.2 1986 51
39.2% 2009 10.4 2001 52 1997 10.2 2001 51
35.7% 1996 10.2 1997 51 1994 9.4 2000 47
32.1% 2006 9.3 1986 48 2009 9.3 2009 47
28.5% 1987 9.1 2009 48 2006 9.1 2008 45
25.0% 1994 8.9 2007 47 1987 8.1 1991 40
21.4% 1999 8.2 2000 46 1999 8.1 1997 39
17.8% 1989 7.9 2008 44 1990 5.6 2007 39
14.2% 2012 7.7 1991 38 1989 5.4 1987 38
10.7% 1990 5.5 1990 32 2002 5.3 2002 36
7.1% 2002 4.2 2002 32 2012 5.2 1990 30
3.5% 2007 3.9 2012 25 2007 3.5 2012 12

ATTACHMENT E
COMPARISON OF SINGLE FAMILY RESIDENTIAL MONITORING
DATA AND CORRESPONDING EMC DATA USED IN SBPAT

Appendix 6. Peninsula EWMP – RAA Summary
January 2016
Page E-1
Peninsula EWMP - RAA Summary
Figure E-1: Comparison of SFR monitoring data and SBPAT modeling data for fecal coliform
Figure E-2: Comparison of SFR monitoring data and SBPAT modeling data for total nitrogen
25th percentile
Median
10th percentile
75th percentile
90th percentile
0
10,000
20,000
30,000
40,000
50,000
60,000
70,000
80,000
90,000
100,000
EMC of Storm Events Measured by SCCWRP
for Low Density Residential (n=4)
SBPAT Single Family Residential Residential
EMC
Fec
al C
oli
form
s M
PN
/10
0m
L
10th percentile25th percentile
Median
75th percentile
90th percentile
0
1
2
3
4
5
6
To
tal
Nit
rate
mg
/L
Samples Collected from LA
County for Single Family
Residential (n=33)
SBPAT Single Family
Residential EMC

Appendix 6. Peninsula EWMP – RAA Summary
January 2016
Page E-2
Peninsula EWMP - RAA Summary
Figure E-3: Comparison of SFR monitoring data and SBPAT modeling data for TKN
Figure E-4: Comparison of SFR monitoring data and SBPAT modeling data for total phosphorus
10th percentile25th percentile
Median
75th percentile
90th percentile
0
2
4
6
8
10
12
14
16T
KN
mg
/L
Samples Collected from LA
County for Single Family
Residential (n=38)
SBPAT Single Family
Residential EMC
10th percentile25th percentile
Median
75th percentile
90th percentile
0
0.2
0.4
0.6
0.8
1
1.2
1.4
1.6
To
tal
Ph
osp
horu
s m
g/L
Samples Collected from LA
County for Single Family SBPAT Single Family
Residential EMC

Appendix 6. Peninsula EWMP – RAA Summary
January 2016
Page E-3
Peninsula EWMP - RAA Summary
Figure E-5: Comparison of SFR monitoring data and SBPAT modeling data for total copper
Figure E-6: Comparison of SFR monitoring data and SBPAT modeling data for total lead
10th percentile
25th percentile
Median
75th percentile
90th percentile
0
10
20
30
40
50
60
70
80T
ota
l C
op
per
ug
/L
Samples Collected from LA
County for Single Family SBPAT Single Family
Residential EMC
10th percentile25th percentile
Median
75th percentile
90th percentile
0
10
20
30
40
50
60
70
80
90
100
To
tal
Lea
d u
g/L
Samples Collected from LA
County for Single Family
SBPAT Single Family
Residential EMC
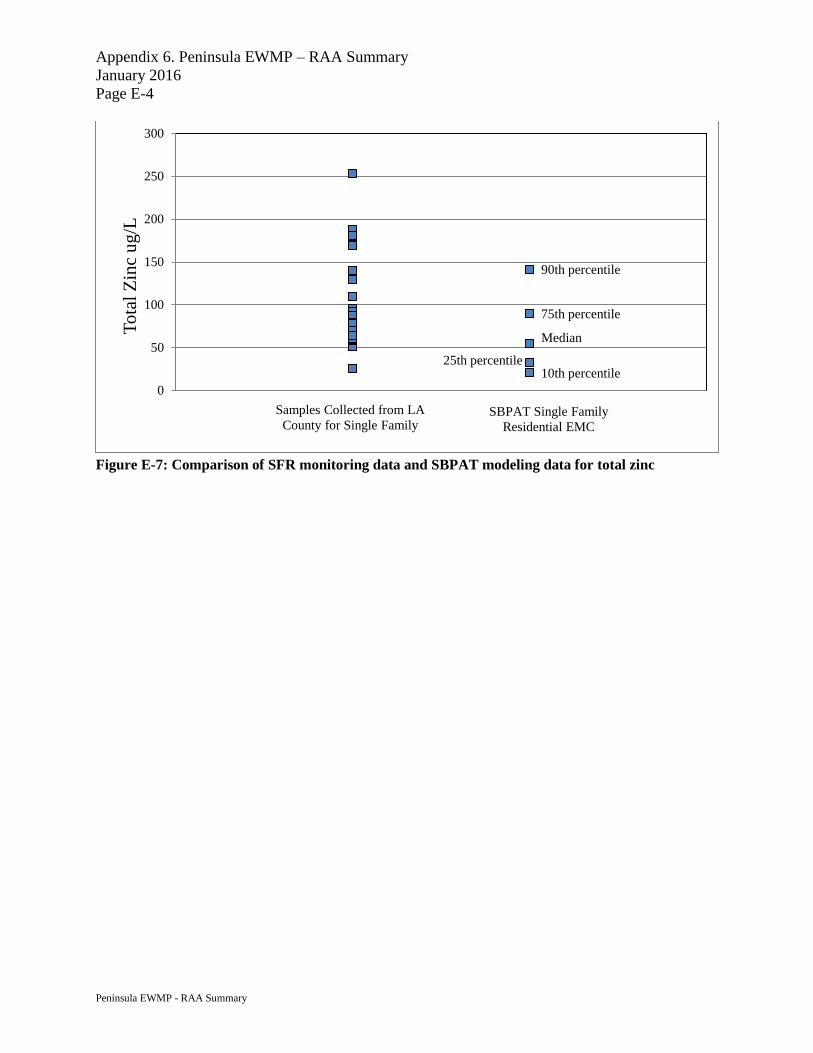
Appendix 6. Peninsula EWMP – RAA Summary
January 2016
Page E-4
Peninsula EWMP - RAA Summary
Figure E-7: Comparison of SFR monitoring data and SBPAT modeling data for total zinc
10th percentile25th percentile
Median
75th percentile
90th percentile
0
50
100
150
200
250
300T
ota
l Z
inc
ug
/L
Samples Collected from LA
County for Single Family SBPAT Single Family
Residential EMC

APPENDIX 7
LEGAL AUTHORITY CERTIFICATIONS
a~t'~ ~~"' *~'~Fi~~ ~Nk
~~ •~ ~~ ~f
~.~A21FOR~~A ~:
JOHN F. KRATTLI
County Counsel
COUNTY OF LOS ANGELESOFFICE OF THE COUNTY COUNSEL
648 KENNETH HAHN HALL OP ADMINISTRATION
500 WEST TEMPLE STREET
LOS ANGELES. CALIFORNIA 90012-2713
December 16, 2013
Mr. Samuel Unger, P.E., Executive OfficerCalifornia Regional Water Quality Control Board —Los Angeles Region320 West 4th Street, Suite 200Los Angeles, CA 90013-2343
Attention: Mr. Ivar Ridgeway
TELEPHONE
(213) 974-1923
FACSIMILE
(213)687-7337
TDD
(213)633-0901
Re: Certification By Legal Counsel For County of Los Angeles'Annual Report
Dear Mr. Unger:
Pursuant to the requirements of Part VI(A)(2)(b) of Order No. R4-2012-0175 (the "Order"), the Office of the County Counsel of the County of LosAngeles makes the following certification in support of the Annual Report of theCounty of Los Angeles ("County"):
Certification Pursuant To Order Part VI(A~(2)(b~
"Each Permittee must submit a statement certified by its chief legalcounsel that the Permittee has the legal authoNity within its jurisdiction toimplement and enforce the requirements contained in 40 CFR ~'122.26(d)(2)(i)(A-F) and this Order. "
The County has the legal authority within its jurisdiction to implement andenforce each of the requirements contained in 40 CFR § 122.26(d)(2)(i)(A-F) andthe Order.
Order Part VI(A~(2~b~i~
"Citation of applicable municipal ordinances or other appropriate_ legalauthorities and their relationship to the requirements of 40 CFR~122.26(d) (2) (i) (A-F) and this Order"
HOA.10300691

California Regional Water Quality Control Board, Los Angeles RegionDecember 16, 2013Page 2
Citations Of Applicable Ordinances Or Other Leal Authorities
Although many portions of State law, the Charter of the County of LosAngeles and the Los Angeles County Code are potentially applicable to theimplementation and enforcement of these requirements, the primary applicablelaws and ordinances are as follows:
Los Angeles County Code, Title 12, Chapter 12.80 STORMWATERAND RUNOFF POLLUTION CONTROL, including:
§ 12.80.010 - § 12.80.360 Definitions
§ 12.80.370 Short title.
§ 12.80.380 Purpose and intent.
§ 12.80.390 Applicability of this chapter.
§ 12.80.400 Standards, guidelines and criteria.
§ 12.80.410 Illicit discharges prohibited.
§ 12.80.420 Installation or use of illicit connections prohibited.
§ 12.80.430 Removal of illicit connection from the storm drain system.
§ 12.80.440 Littering and other discharge of polluting or damagingsubstances prohibited.
§ 12.80.450 Stormwater and runoff pollution mitigation for constructionactivity.
§ 12.80.460 Prohibited discharges from industrial or commercial activity.
§ 12.80.470 Industrial/commercial facility sources required to obtain aNPDES permit.
§ 12.80.480 Public facility sources required to obtain a NPDES permit.
§ 12.80.490 Notification of uncontrolled discharges required.
§ 12.80.500 Good housekeeping provisions.
§ 12.80.510 Best management practices for construction activity.
HOA.1030069.1

_.._..
California Regional Water Quality Control Board, Los Angeles RegionDecember 16, 2013Page 3
§ 12.80.520 Best management practices for industrial and commercialfacilities.
§12.80.530 Installation of structural BMPs.
§ 12.80.540 BMPs to be consistent with environmental goals.
§ 12.80.550 Enforcement—Director's powers and duties.
§ 12.80.560 Identification for inspectors and maintenance personnel.
§ 12.80.570 Obstructing access to facilities prohibited.
§12.80.580 Inspection to ascertain compliance—Access required.
§ 12.80.590 Interference with inspector prohibited.
§ 12.80.600 Notice to correct violations—Director may take action.
§12.80.610 Violation a public nuisance.
§ 12.80.620 Nuisance abatement Director to perform work when—Costs.
§12.80.630 Violation—Penalty.
§12.80.635 Administrative fines.
§ 12.80.640 Penalties not exclusive.
§ 12.80.650 Conflicts with other code sections.
§ 12.80.660 Severability.
§ 12.80.700 Purpose.
§ 12.80.710 Applicability.
§ 12.80.720 Registration required.
§ 12.80.730 Exempt facilities.
§ 12.80.740 Certificate of inspection—Issuance by the director.
§ 12.80.750 Certificate of inspection—Suspension or revocation.
HOA.1030069.1

California Regional Water Quality Control Board, Los Angeles RegionDecember 16, 2013Page 4
§ 12.80.760 Certificate of inspection—Termination.
§ 12.80.770 Service fees.
§ 12.80.780 Fee schedule.
§ 12.80.790 Credit for overlapping inspection programs.
§ 12.80.800 Annual review of fees.
Los Angeles County Code, Title 12, Chapter 12.84 LOW IMPACTDEVELOPMENT STANDARDS, including:
§ 12.84.410 Purpose.
§ 12.84.420 Definitions.
§ 12.84.430 Applicability.
§ 12.84.440 Low Impact Development Standards.
§ 12.84.445 Hydromodification Control.
§ 12.84.450 LID Plan Review.
§ 12.84.460 Additional Requirements.
Los Angeles County Code, Title 22 PLANNING AND ZONING, Part 6ENFORCEMENT PROCEDURES, including:
§22.60.330 General prohibitions.
§22.60.340 Violations.
§22.60.350 Public nuisance.
§ 22.60.3 60 Infractions.
§ 22.6 0.3 70 Injunction.
§22.60.380 Enforcement.
HOA1030069.1

California Regional Water Quality Control Board, Los Angeles RegionDecember 16, 2013Page 5
§22.60.390 Zoning enforcement order and noncompliance fee.
Los Angeles County Code, Title 26 BUILDING CODE, including:
§26.103 Violations And Penalties
§26.104 Organization And Enforcement
§26.105 Appeals Boards
§26.106 Permits
§26.107 Fees
§26.108 Inspections
California Government Code §6502
California Government Code §23004
Relationship Of Applicable Ordinances Or Other Leal Authorities ToThe Requirements of 40 CFR § 122.26(d (2)(i)(A-F) And The Order
Although, depending upon the particular issue, 'there may be multipleways in which particular sections of the County's ordinances and State law relateto the requirements contained in 40 CFR § 122.26(d)(2)(i)(A-F) and the Order, thetable below indicates the basic relationship with Part VI(A)(2)(a) of the Order:
Order Part VI(A)(2)(a) Items Primary Applicable Ordinance/Statute
i. Control the contribution of pollutants to its § 12.80.410 [illicit discharge prohibited];MS4 from storm water discharges associated §12.80.450 [construction]with industrial and construction activity andcontrol the quality of storm water discharged § 12.80.460 [industrial and commercial)
from industrial and construction sites. This§ 12.80.470 and .480 [industrial and
requirement applies both to industrial and commercial NPDES requirements]construction sites with coverage under anNPDES permit, as well as to those sites that § 12.84.440 [LID standards]
do not have coverage under an NPDES§ 12.84.445 [hydromodification control]
permit.§
12.84.450 [LID Plan Review]
§22.60.330 [general prohibitions]
HOA.1030069. ]

California Regional Water Quality Control Board, Los Angeles RegionDecember 16, 2013Page 6
Order Part VI(A)(2)(a) Items Primary Applicable Ordinance/Statute
§22.60.340 [violations]
§22.60.350 [public nuisance]
§22.60.360 [infractions]
§22.60.370 [injunction]
§22.60.380 [enforcement.]
§22.60.390 [zoning enforcement order]
§26.103 [violations and penalties]
§26.104 [enforcement]
§26.106 [permits]
§26.108 [inspections]
ii. Prohibit all non-storm water discharges § 12.80.410 [illicit discharge prohibited]through. the MS4 to receiving waters nototherwise authorized or conditionally exemptpursuant to Part III.A.
iii. Prohibit and eliminate illicit discharges § 12.80.410 [illicit discharge prohibited];and illicit connections to the MS4.
§ 12.80.420 [illicit connections prohibited]
iv. Control the discharge of spills, dumping, § 12.80.410 [illicit discharge prohibited];or disposal of materials other than storm
§ 12.80.440 [littering and other pollutingwater to its MS4. prohibited]
HOA.1030069.1

California Regional Water Quality Control Board, Los Angeles RegionDecember 16, 2013Page 7
Order Part VI(A)(2)(a) .Items Primary Applicable Ordinance/Statute
v. ̀Require compliance with conditions in § 12.80.490 [notification of uncontrolledPermittee ordinances, permits, contracts or discharge]orders (i.e., hold dischargers to its MS4
§ 12.80.570 [obstructing access to facilities]accountable for their contributions ofpollutants and flows). §12.80.580 [compliance inspection]
§
12.80.610 [violation a nuisance]
§ 12.620 [nuisance abatement]
§12.80.635 [violation penalty]
§
12.80.640 [penalties not exclusive]
§
12.84.440 [LID standards]
§ 12.84.445 [hydromodification control]
§
12.84.450 [LID Plan Review]
§22.60.330 [general prohibitions]
§22.60.340 [violations]
§22.60.350 [public nuisance]
§22.60.360 [infractions]
§22.60.370 [injunction]
§22.60.380 [enforcement.]
§22.60.390 [zoning enforcement order]
§26.103 [violations and penalties]
§26.104 [enforcement]
§26.106 [permits]
§26.108 [inspections]
vi. Utilize enforcement mechanisms to Same as item v., aboverequire compliance with applicableordinances, permits, contracts, or orders.
HOA.1030069. I

California Regional Water Quality Control Board, Los Angeles RegionDecember 16, 2013Page 8
Order Part VI(A)(2)(a) Items Primary Applicable Ordinance/Statute
vii. Control the contribution of pollutants California Government Code §6502 andfrom one portion of the shared MS4 to §23004another portion of the MS4 throughinteragency agreements among Copermittees.
viii. Control of the contribution of pollutants California Government Code §6502 andfrom one portion of the shared MS4 to §23004another portion of the MS4 throughinteragency agreements with other owners ofthe MS4 such as the State of CaliforniaDepartment of Transportation.
ix. Carry out all inspections, surveillance, § 12.80.490 [notification of uncontrolledand monitoring procedures necessary to discharge]determine compliance and noncompliance
§ 12.80.570 [obstructing access to facilities]with applicable municipal ordinances,permits, contracts and orders, and with the § 12.80.580 [compliance inspection]
provisions of this Order, including the§ 12.80.610 [violation a nuisance]
prohibition of non-storm water dischargesinto the MS4 and receiving waters. This § 12.80.620 [nuisance abatement]
means the Permittee must have authority to §12.80.635 [violation penalty]enter, monitor, inspect, take measurements,review and copy records, and require regular § 12.80.640 [penalties
not exclusive]
reports from entities discharging into its MS4. §22.60.380 [enforcement.]
§26.106 [permits]
§26.108 [inspections]
HOA.1030069. I

California Regional Water Quality Control Board, Los Angeles RegionDecember 16, 2013Page 9
Order Part VI(A)(2)(a) Items Primary Applicable Ordinance/Statute
x. Require the use of control measures to § 12.80.450 [construction mitigation]prevent or reduce the discharge of pollutants
§ 12.80.500 [good housekeeping practices]to achieve water quality standards/receivingwater limitations. § 12.80.510 [construction BMPs]
§ 12.80.520 [industrial/commercial BMPs]
§ 12.84.440 [LID standards]
§
12.84.450 [LID Plan Review)
§22.60.330 [general prohibitions]
§22.60.380 [enforcement.]
` §22.60.390 [zoning enforcement order]
§26.106 [permits]
§26.108 [inspections]
xi. Require that structural BMPs are properly § 12.80.530 [installation of structural BMPs]operated and maintained. §22,60.380 [enforcement.]
§22.60.390 [zoning enforcement order]
§26.106 [permits]
§26.108 [inspections]
xii. Require documentation on the operation § 12.80.530 [installation. of structural BMPs]and maintenance of structural BMPs and their §22 60.380 [enforcement.]effectiveness in reducing the discharge ofpollutants to the MS4. §22.60.390 [zoning enforcement order]
§26.106 [permits]
§26.108 [inspections]
HOA.1030069.1

California Regional Water Quality Control Board, Los Angeles RegionDecember 16, 2013Page 10
Order Part VI(A)(2)(b)(ii)
"Identification of the local administrative and legal procedures availableto mandate compliance with applicable municipal ordinances identified insubsection (i) above and therefore with the conditions of this Order, and astatement as to whether enforcement actions can be completed administratively orwhether they must be commenced and completed in the judicial system."
The local administrative and legal procedures available to mandatecompliance with the above ordinances are specified in those ordinances,particularly in:
§ 12.80.550 Enforcement—Director's powers and duties.
§ 12.80.600 Notice to correct violations—Director may take action.
§ 12.80.610 Violation a public nuisance.
§ 12.80.620 Nuisance abatement—Director to perform work when—Costs.
§12.80.630 Violation—Penalty.
§ 12.80.635 Administrative fines.
§ 12.80.640 Penalties not exclusive.
§ 12.84.450 LID Plan Review.
§ 12.84.460 Additional Requirements.
Title 26, § 103 Violations And Penalties
Title 26, § 104 Organization And Enforcement
Title 26, § 1 OS Appeals Boards
Title 26, § 106 Permits
Title 22 PLANNING AND ZONING, Part 6 ENFORCEMENTPROCEDURES, including:
§22.60.330 General prohibitions.
HOA.1030069.1

California Regional Water Quality Control Board, Los Angeles RegionDecember 16, 2013Page 11
§22.60.340 Violations.
§22.60.350 Public nuisance.
§22.60.360 Infractions.
§ 22.60 3 70 Injunction.
§22.60.380 Enforcement.
§22.60.390 Zoning enforcement order and noncompliance fee.
The County attempts to first resolve each enforcement actionadministratively. However, the above cited ordinances also provide the Countywith the authority to pursue such actions in the judicial system as necessary.
Very truly yours,
JOHN F. KRATTLICounty Counsel
~.
By -~ ~~^DITH A. FRIES
Principal Deputy County CounselPublic Works Division
JAF:jyj
HOA. 1030069. I
~oF~osA~ COUNTY OF LOS ANGELESJ~ F'cF` OFFICE OF THE COUNTY COUNSEL~~p ~. Y. r, ~,~~ ki d! ¢ 648 KENNETH HAHN HALL OF ADMINISTRAT]ON
~y '"" ~~ ~~ 500 WEST TEMPLE STREET ~
~~AUpoRN~~~ LOS ANGELES, CALIFORNIA 90012-2713
JOHN F. KRATTLI
County Counsel December 16, 2013
Mr. Samuel Unger, P.E., Executive OfficerCalifornia Regional Water Quality Control Board —Los Angeles Region320 West 4th Street, Suite 200Los Angeles, CA 90013-2343
Attention: Mr. Ivar Ridgeway
TELEPHONE
(213)974-1923
FACSIMILE
(213)687-7337
TDD
(213)633-0901
Re: Certification By Legal Counsel For Los Angeles County FloodControl District's Annual Report
Dear Mr. Unger:
Pursuant to the requirements of Part VI(A)(2)(b) of Order No. R4-2012-0175 (the "Order"), the Office of the County Counsel of the County ofLos Angeles makes the following certification in support of the Annual Report ofthe Los Angeles County Flood Control District ("LACFCD"):
Certification Pursuant To Order Part VI(A~(2Z(b~
"Each Permittee must submit a statement certified by its chief legalcounsel that the Permittee has the legal authority within its jurisdiction toimplement and enforce the requirements contained in 40 CFR ~122.26(d) (2) (i) (A-F) and this Order. "
LACFCD has the legal authority within its jurisdiction to implement andenforce each of the requirements contained in 40 CFR § 122.26(d)(2)(i)(A-F) andthe Order.
Order Part VI(A)(2)(b)(i)
"Citation of applicable municipal ordinances or other appropriate legalauthorities and their relationship to the requirements of 40 CFR~122.26(d) (2) (i) (A-F) and this Order"
HOA.1030623.2

California Regional Water Quality Control Board, Los Angeles RegionDecember 16, 2013Page 2
Citations Of Applicable Ordinances Or Other Leal Authorities
Although many portions of State law, the Charter of the County of LosAngeles, the Los Angeles County Code and LACFCD's Flood Control DistrictCode ("Code") are potentially applicable to the implementation and enforcementof these requirements, the primary applicable laws and ordinances are as follows:
Los Angeles County Code, Title 12, Chapter 12.80 STORMWATERAND RUNOFF POLLUTION CONTROL, including:
§ 12.80.010 - § 12.80.360 Definitions
§ 12.80.370 Short title.
§12.80.380 Purpose and intent.
§12.80.390 Applicability of this chapter.
§ 12.80.400 Standards, guidelines and criteria.
§ 12.80.410 Illicit discharges prohibited.
§ 12.80.420 Installation or use of illicit connections prohibited.
§12.80.430 Removal of illicit connection from the storm drain system.
§ 12.80.440 Littering and other discharge of polluting or damagingsubstances prohibited.
§ 12.80.450 Stormwater and runoff pollution mitigation for constructionactivity.
§ 12.80.460 Prohibited discharges from industrial or commercial activity.
§ 12.80.470 Industrial/commercial facility sources required to obtain aNPDES permit.
§ 12.80.480 Public facility sources required to obtain a NPDES permit.
§ 12.80.490 Notification of uncontrolled discharges required.
§ 12.80.500 Good housekeeping provisions.
§ 12.80.510 Best management practices for construction activity.
HOA.1030623.2

California Regional Water Quality Control Board, Los Angeles RegionDecember 16, 2013Page 3
§ 12.80.520 Best management practices for industrial and commercialfacilities.
§ 12.80.530 Installation of structural BMPs.
§ 12.80.540 BMPs to be consistent with environmental goals.
§ 12.80.550 Enforcement—Director's powers and duties.
§ 12.80.560 Identification for inspectors and maintenance personnel.
§ 12.80.570 Obstructing access to facilities prohibited.
§12.80.580 Inspection to ascertain compliance—Access required.
§ 12.80.590 Interference with inspector prohibited.
§ 12.80.600 Notice to correct violations—Director may take action.
§12.80.610 Violation a public nuisance.
§ 12.80.620 Nuisance abatement—Director to perform work when—Costs.
§12.80.630 Violation—Penalty.
§12.80.635 Administrative fines.
§ 12.80.640 Penalties not exclusive.
§ 12.80.650 Conflicts with other code sections.
§ 12.80.660 Severability.
§ 12.80.700 Purpose.
§ 12.80.710 Applicability.
§ 12.80.720 Registration required.
§ 12.80.730 Exempt facilities.
§ 12.80.740 Certificate of inspection—Issuance by the director.
§ 12.80.750 Certificate of inspection—Suspension or revocation.
HOA.1030623.2
California Regional Water Quality Control Board, Los Angeles RegionDecember 16, 2013Page 4
§ 12.80.760 Certificate of inspection—Termination.
§ 12.80.770 Service fees.
§ 12.80.780 Fee schedule.
§ 12.80.790 Credit for overlapping inspection programs.
§ 12.80.800 Annual review of fees.
Los Angeles County Code, Title 12, Chapter 12.84 LOW IMPACTDEVELOPMENT STANDARDS, including:
§ 12.84.410 Purpose.
§ 12.84.420 Definitions.
§ 12.84.430 Applicability.
§ 12.84.440 Low Impact Development Standards.
§ 12.84.445 Hydromodification Control.
§ 12.84.450 LID Plan Review.
§ 12.84.460 Additional Requirements.
Los Angeles County Code, Title 22 PLANNING AND ZONING, Part 6ENFORCEMENT PROCEDURES, including:
§22.60.330 General prohibitions.
§22.60.340 Violations.
§22.60.350 Public nuisance.
§ 22.60.3 60 Infractions.
§ 22.6 0.3 70 Injunction.
§22.60.380 Enforcement.
HOA. 1030623.2

California Regional Water Quality Control Board, Los Angeles RegionDecember 16, 2013Page 5
§22.60.390 Zoning enforcement order and noncompliance fee.
Los Angeles County Code, Title 26 BUILDING CODE, including:
§26.103 Violations And Penalties
§26.104 Organization And Enforcement
§26.105 Appeals Boards
§26.106 Permits
§26.107 Fees
§26.108 Inspections
LACFCD Code Chapter 21 - STORMWATER AND RUNOFFPOLLUTION CONTROL including:
§21.01 Purpose and Intent
§21.03 Definitions
§21.05 Standards, Guidelines, and Criteria
§21.07 Prohibited Discharges
§21.09 Installation or Use of Illicit Connections Prohibited
§21.11 Littering Prohibited
§21.13 Evidence of Compliance With Permit Requirements for Industrialor Commercial Activity
§21.15 Notification of Uncontrolled Discharges Required
§21.17 Requirement to Monitor and Analyze
§21.19 Conflicts With Other Code Sections
§21.21 Severability
§21.23 Violation a Public Nuisance
HOA.1030623.2

California Regional Water Quality Control Board, Los Angeles RegionDecember 16, 2013Page 6
California Government Code §6502
California Government Code §23004
California Water Code §8100 et. seq.
Relationship Of Applicable Ordinances Or Other Leal Authorities ToThe Requirements of 40 CFR &122.26(d)~2)(i~A-F) And The Order
Although, depending upon the particular issue, there may be multipleways in which particular sections of the County of Los Angeles' ordinances,LACFCD's ordinances, and statutes relate to the requirements contained in 40CFR § 122.26(d)(2)(i)(A-F) and the Order, the table below indicates the basicrelationship with Part VI(A)(2)(a) of the Order:
Order Part VI(A)(2)(a) Items Primary Applicable Ordinance/Statute
i. Control the contribution of pollutants to its Los Angeles County Code:MS4 from storm water discharges associated § 12.80.410 [illicit discharge prohibited];with industrial and construction activity andcontrol the quality of storm water discharged § 12.80.450 [construction]
from industrial and construction sites. This § 12.80.460 [industrial and commercial]requirement applies both to industrial andconstruction sites with coverage under an § 12.80.470 and .480 [industrial and
NPDES permit, as well as to those sites that commercial NPDES requirements]
do not have coverage under an NPDES § 12.84.440 [LID standards]permit.
§ 12.84.445 [hydromodification control]
§ 12.84.450 [LID Plan Review]
§22.60.330 [general prohibitions]
§22.60.340 [violations]
§22.60.350 [public nuisance]
§22.60.360 [infractions]
§22.60.370 [injunction]
§22.60.380 [enforcement.]
§22.60.390 [zoning enforcement order]
§26.103 [violations and penalties]
HOA. ] 030623.2
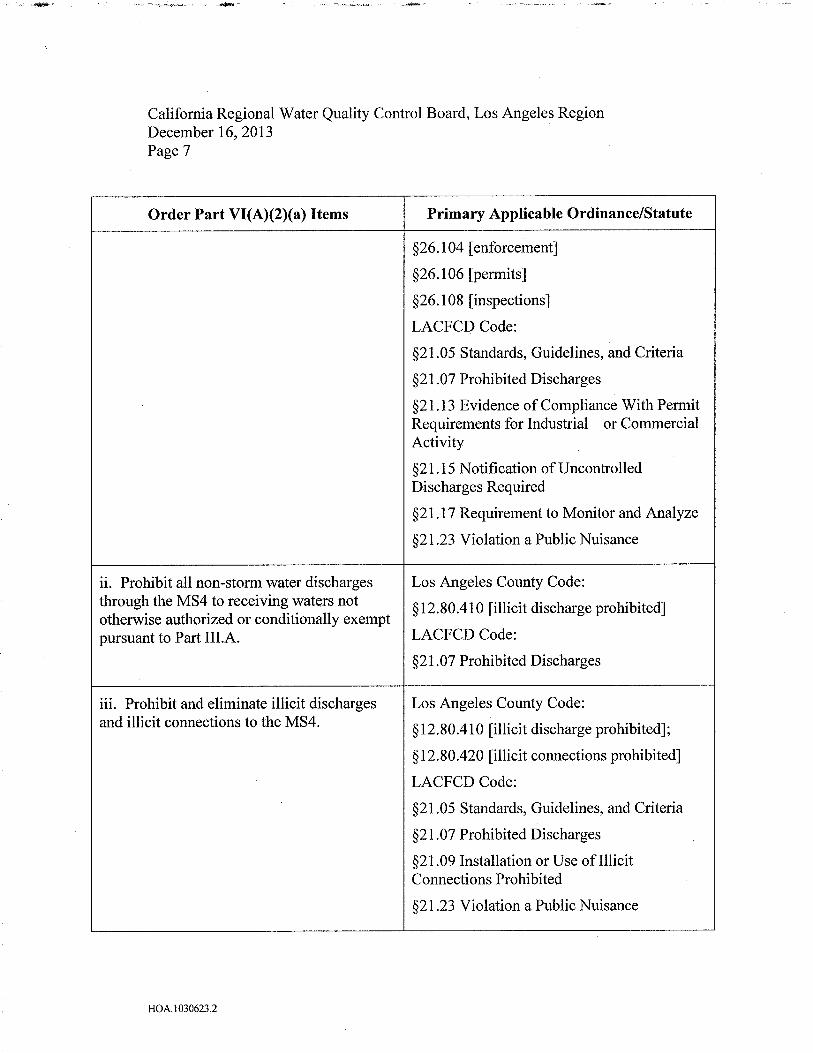
California Regional Water Quality Control Board, Los Angeles RegionDecember 16, 2013Page 7
Order Part VI(A)(2)(a) Items Primary Applicable Ordinance/Statute
§26.104 [enforcement]
§26.106 [permits]
§26.108 [inspections)
LACFCD Code:
§21.05 Standards, Guidelines, and Criteria
§21.07 Prohibited Discharges
§21.13 Evidence of Compliance With PermitRequirements for Industrial or CommercialActivity
§21.15 Notification of UncontrolledDischarges Required
§21.17 Requirement to Monitor and Analyze
§21.23 Violation a Public Nuisance
ii. Prohibit all non-storm water discharges Los Angeles County Code:through the MS4 to receiving waters not
§ 12.80.410 [illicit discharge prohibited]otherwise authorized or conditionally exemptpursuant to Part III.A. LACFCD Code:
§21.07 Prohibited Discharges
iii. Prohibit and eliminate illicit discharges Los Angeles County Code:and illicit connections to the MS4.
§ 12.80.410 [illicit discharge prohibited];
§ 12.80.420 [illicit connections prohibited]
LACFCD Code:
§21.05 Standards, Guidelines, and Criteria
§21.07 Prohibited Discharges
§21.09 Installation or Use of IllicitConnections Prohibited
§21.23 Violation a Public Nuisance
HOA.1030623.2

California Regional Water Quality Control Board, Los Angeles RegionDecember 16, 2013Page 8
Order Part VI(A)(2)(a) Items Primary Applicable Ordinance/Statute
iv. Control the discharge of spills, dumping, Los Angeles County Code:or disposal of materials other than storm
§ 12.80.410 [illicit discharge prohibited];water to its MS4.
§ 12.80.440 [littering and other pollutingprohibited]
LACFCD Code:
§ 19.07 Interference With or PlacingObstructions, Refuse, ContaminatingSubstances, or Invasive Species in FacilitiesProhibited
§21.05 Standards, Guidelines, and Criteria
§21.07 Prohibited Discharges
§21.09 Installation or Use of IllicitConnections Prohibited
§21.11 Littering Prohibited
§21.13 Evidence of Compliance With PermitRequirements for Industrial or CommercialActivity
§21.15 Notification of UncontrolledDischarges Required
§21.17 Requirement to Monitor and Analyze
§21.23 Violation a Public Nuisance
v. Require compliance with conditions in Los Angeles County Code:Permittee ordinances; permits, contracts or
§ 12.80.490 [notification of uncontrolledorders (i.e., hold dischargers to its MS4 discharge]accountable for their contributions ofpollutants and flows). §12.80.570 [obstructing access to facilities]
§
12.80.580 [compliance inspection]
§ 12.80.610 [violation a nuisance]
§ 12.620 [nuisance abatement]
§12.80.635 [violation penalty]
HOA.10306232

California Regional Water Quality Control Board, Los Angeles RegionDecember 16, 2013Page 9
Order Part VI(A)(2)(a) Items Primary Applicable Ordinance/Statute
§ 12.80.640 [penalties not exclusive]
§ 12.84.440 [LID standards]
§ 12.84.445 [hydromodification control]
§ 12.84.450 [LID Plan Review]
§22.60.330 [general prohibitions]
§22.60.340 [violations]
§22.60.350 [public nuisance]
§22.60.360 [infractions]
§22.60.370 [injunction]
§22.60.380 [enforcement.]
§22.60.390 [zoning enforcement order]
§26.103 [violations and penalties]
§26.104 [enforcement]
§26.106 [permits]
§26.108 [inspections]
LACFCD Code:
§ 19.11 Violation a Public Nuisance
§21.05 Standards, Guidelines, and Criteria
§21.07 Prohibited Discharges
§21.09 Installation or Use of IllicitConnections Prohibited
§21.11 Littering Prohibited
§21.13 Evidence of Compliance With PermitRequirements for Industrial or CommercialActivity
§21.15 Notification of UncontrolledDischarges Required
§21.17 Requirement to Monitor and Analyze
HOA.1030623.2
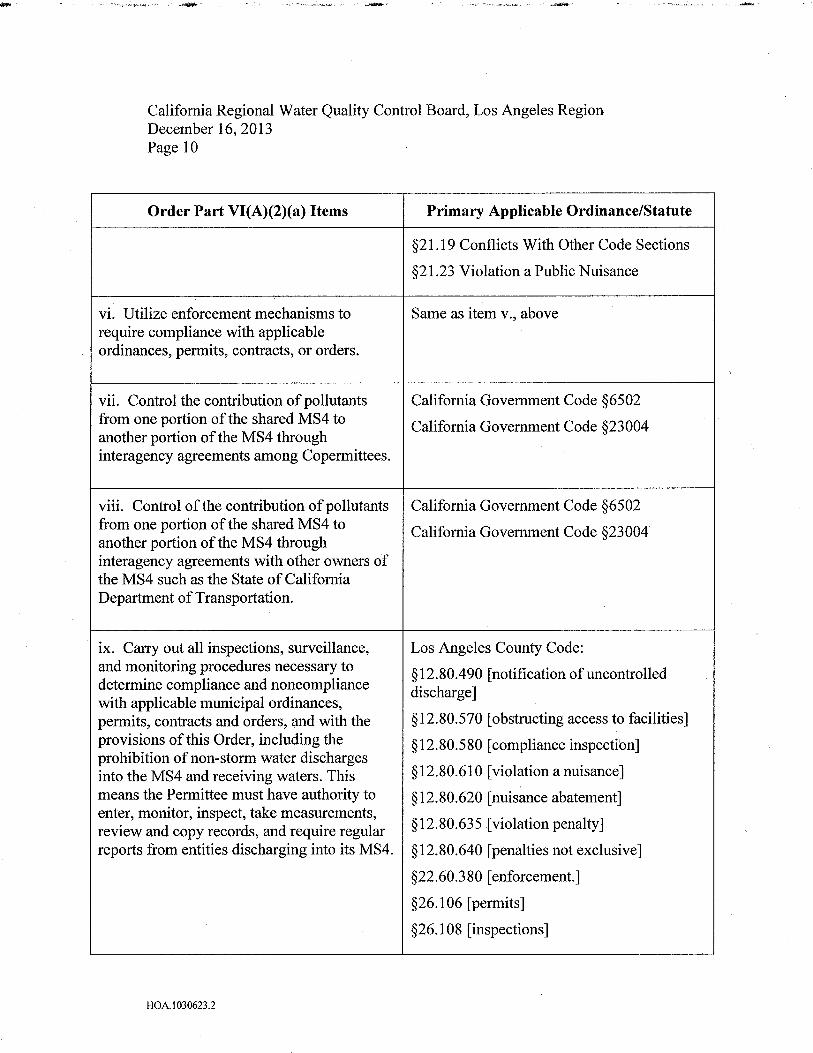
California Regional Water Quality Control Board, Los Angeles RegionDecember 16, 2013Page 10
Order Part VI(A)(2)(a) Items Primary Applicable Ordinance/Statute
§21.19 Conflicts With Other Code Sections
§21.23 Violation a Public Nuisance
vi. Utilize enforcement mechanisms to Same as item v., aboverequire compliance with applicableordinances, permits, contracts, or orders.
vii. Control the contribution of pollutants California Government Code §6502from one portion of the shared MS4 to California Government Code §23004another portion of the MS4 through ,interagency agreements among Copermittees.
viii. Control of the contribution of pollutants California Government Code §6502from one portion of the shared MS4 to California Government Code §23004another portion of the MS4 throughinteragency agreements with other owners ofthe MS4 such as the State of CaliforniaDepartment of Transportation.
ix. Carry out all inspections, surveillance, Los Angeles County Code:and monitoring procedures necessary to
§ 12.80.490 [notification of uncontrolleddetermine compliance and noncompliance discharge]with applicable municipal ordinances,permits, contracts and orders, and with the § 12.80.570 [obstructing access to facilities]
provisions of this Order, including the §12.80.580 [compliance inspection]prohibition of non-storm water dischargesinto the MS4 and receiving waters. This § 12.80.610 [violation a nuisance]
means the Permittee must have authority to§ 12.80.620 [nuisance abatement]
enter, monitor, inspect, take measurements,§
12.80.635 .[violation penalty]review and copy records, and require regularreports from entities discharging into its MS4.
§ 12.80.640 [penalties not exclusive]
§22.60.380 [enforcement.]
§26.106 [permits]
§26.108 [inspections]
HOA.1030623.2

California Regional Water Quality Control Board, Los Angeles RegionDecember 16, 2013Page 11
Order Part VI(A)(2)(a) Items Primary Applicable Ordinance/Statute
LACFCD Code:
§21.05 Standards, Guidelines, and Criteria
§21.07 Prohibited Discharges
§21.09 Installation or Use of IllicitConnections Prohibited
§21.1.1 Littering Prohibited
§21.13 Evidence of Compliance With PermitRequirements for Industrial or CommercialActivity
§21.15 Notification of UncontrolledDischarges Required
§21.17 Requirement to Monitor and Analyze
§21.23 Violation a Public Nuisance
x. Require the use of control measures to Los Angeles County Code:prevent or reduce the discharge of pollutants
§ 12.80.450 [construction mitigation]to achieve water quality standards/receivingwater limitations. § 12.80.500 [good housekeeping practices]
§ 12.80.510 [construction BMPs]
§ 12.80.520 [industrial/commercial BMPs]
§ 12.84.440 [LID standards]
§
12.84.450 [LID Plan Review]
§22.60.330 [general prohibitions]
§22.60.380 [enforcement.]
§22.60.390 [zoning enforcement order]
§26.106 [permits]
§26.108 [inspections]
LACFCD Code:
§21.05 Standards, Guidelines, and Criteria
HOA.1030623.2

California Regional Water Quality Control Board, Los Angeles RegionDecember 16, 201.3Page 12
Order Part VI(A)(2)(a) Items Primary Applicable Ordinance/Statute
§21.07 Prohibited Discharges
§21.09 Installation or Use of IllicitConnections Prohibited
§21.11 Littering Prohibited
§21.13 Evidence of Compliance With PermitRequirements for Industrial or CommercialActivity
§21.15 Notification of UncontrolledDischarges Required
§21.17 Requirement to Monitor and Analyze
§21.23 Violation a Public Nuisance
xi. Require that structural BMPs are properly Los Angeles County Code:operated and maintained.
§ 12.80.530 [installation of structural BMPs]
§22.60.380 [enforcement.]
§22.60.390 [zoning enforcement order]
§26.106 [permits]
§26.108 [inspections]
LACFCD Code:
§21.05 Standards, Guidelines, and Criteria
§21.07 Prohibited Discharges
§21.09 Installation or Use of IllicitConnections Prohibited
§21.11 Littering Prohibited
§21.13 Evidence of Compliance With PermitRequirements for Industrial or CommercialActivity
§21.15 Notification of UncontrolledDischarges Required
§21.17 Requirement to Monitor and Analyze
HOA.1030623.2

.~ ,~, _
California Regional Water Quality Control Board, Los Angeles RegionDecember 16, 2013Page 13
Order Part VI(A)(2)(a) Items Primary Applicable Ordinance/Statute
§21.23 Violation a Public Nuisance
xii. Require documentation on .the operation Los Angeles County Code:and maintenance of structural BMPs and their §12.80.530 [installation of structural BMPs]effectiveness in reducing the discharge ofpollutants to the MS4. §22.60380 [enforcement.]
§22.60390 [zoning enforcement order]
§26.106 [permits]
§26.108 [inspections]
LACFCD Code:
§21.05 Standards, Guidelines, and Criteria
§21.07 Prohibited Discharges
§21.09 Installation or Use of IllicitConnections Prohibited
§21.11 Littering Prohibited
§21.13 Evidence of Compliance With PermitRequirements for Industrial or CommercialActivity
§21.15 Notification of UncontrolledDischarges Required
§21.17 Requirement to Monitor and Analyze
§21.23 Violation a Public Nuisance
Order Part VI(A)(2~(b)(ii~
"Identification of the local administrative and legal procedures availableto mandate compliance with applicable municipal ordinances identified insubsection (i) above and therefore with the conditions of this Order, and astatement as to whether enfoNCement actions can be completed administratively orwhether they must be commenced and completed in the judicial system."
~:c~nr~~xi~ry~cxa

California Regional Water Quality Control Board, Los Angeles RegionDecember 16, 2013Page 14
The local administrative and legal procedures available to mandatecompliance with the above ordinances are specified in those ordinances,particularly in:
Los Angeles County Code:
§ 12.80.550 Enforcement—Director's powers and duties.
§ 12.80.600 Notice to correct violations—Director may take action.
§ 12.80.610 Violation a public nuisance.
§ 12.80.620 Nuisance abatement—Director to perform work when—Costs.
§12.80.630 Violation—Penalty.
§ 12.80.635 Administrative fines.
§ 12.80.640 Penalties not exclusive.
§ 12.84:450 LID Plan Review.
§ 12.84.460 Additional Requirements.
Title 26, § 103 Violations And Penalties
Title 26, § 104 Organization And Enforcement
Title 26, § 1 OS Appeals Boards
Title 26, § 106 Permits
§22.60.330 General prohibitions.
§22.60.340 Violations.
§22.60.350 Public nuisance.
§22.60.360 Infractions.
§22.60.3 70 Inj unction.
§22.60.380 Enforcement.
HOA.1030623.2
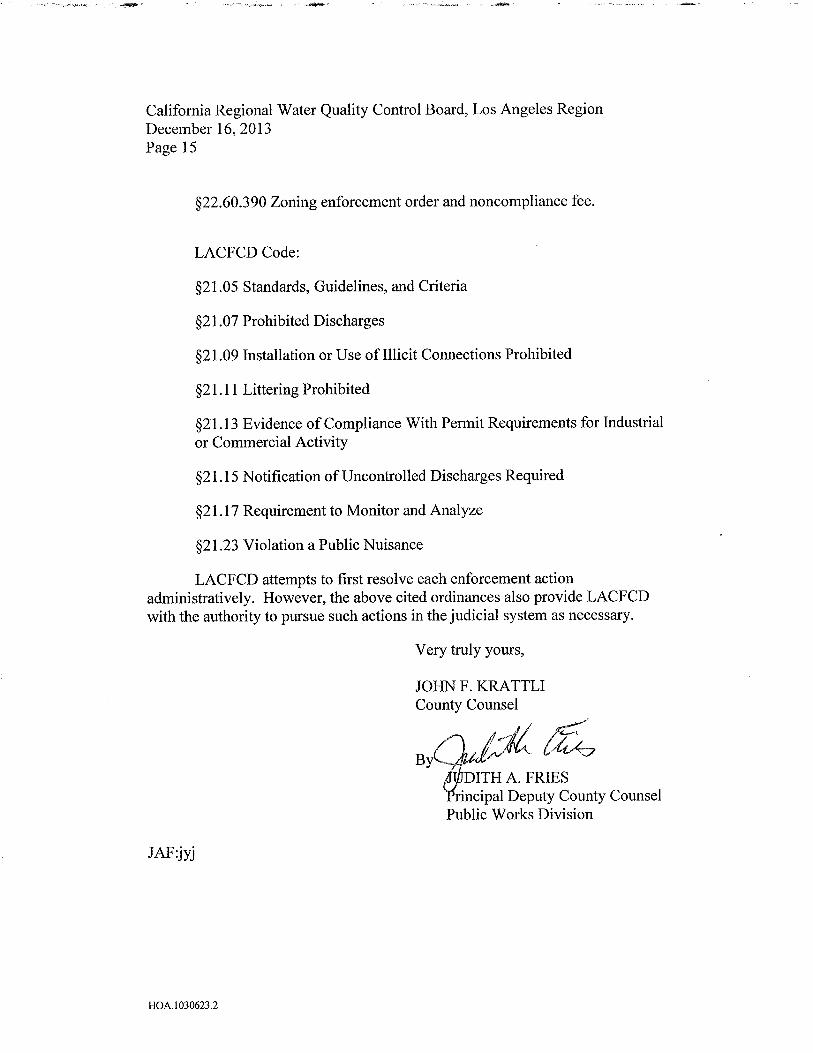
California Regional Water Quality Control Board, Los Angeles Region
December 16, 2013Page 15
§22.60.390 Zoning enforcement order and noncompliance fee.
LACFCD Code:
§21.05 Standards, Guidelines, and Criteria
§21.07 Prohibited Discharges
§21.09 Installation or Use of Illicit Connections Prohibited
§21.11 Littering Prohibited
§21.13 Evidence of Compliance With Permit Requirements for Industrial
or Commercial Activity
§21.15 Notification of Uncontrolled Discharges Required
§21.17 Requirement to Monitor and Analyze
§21.23 Violation a Public Nuisance
LACFCD attempts to first resolve each enforcement actionadministratively. However, the above cited ordinances also provide LACFCD
with the authority to pursue such actions in the judicial system as necessary.
Very truly yours,
JOHN F. KRATTLICounty Counsel
By ~~
DITH A. FRIESrincipal Deputy County Counsel
Public Works Division
JAF:jyj
HOA.1030623.2


~;~►~~ RICHARDS WATSON GERSHON~~CC~ ATTQRNEYS AT LAW —A PROFESSIONAL CORPORATION
355 South Grand Avenue, 4oth F(oor, Los Angeles, California goo7i-3io1Telephone 2i3.6z6.8484 Facsimile z13.6z6.0078
RICHARD RICHARDS December 4, 2014(igi6-i98S)
GLENN R, WATSON
c~9~7-Z°'°~ VIA ELECTRONIC TRANSMISSIONHARRY L. GERSHON
(i9zz-zoo7)
STEVEN L. DORSEY Mr. Samuel UngerWILLIAM L. STRAU52
Executive OfficerMITCHELL E. ABBOTTGREGORY W. STEPANICICH
QUINN M. BARROW Los Angeles Regional Quality Control BoardCAROL W, LYNCH
GREGORY M, KUNERT 320 West 4th Street Suite 200THOMAS M, )IMBO
STE ENEHTKAUFMANN Los Angeles, CA 90013KEVIN G. ENNIS
ROBIN p, HARRIS ,Sun et' ,waterboards.ca. J€,~VMICHAEL ESTRADA
4AUREN CE 5. WIENERB. TILD EN KIM
SASKIA T. ASAMURA Re: Legal Authority of the City of Rancho Palos Verdes to Implement andKAVSER O. SUME
jAMESrL. MARKMAN Enforce the Requirements of 40 CFR 122.26(d)(2)(i)(A-F) and RWQCBCRAIG A. STEELET. PETER PIERCE Order R4-2012-0175, NPDES Permit CAS004001
7EREN CE R. BOGALISA BOND
JANET E. COLESONROXANNE M. OIA2 Dear Mr. Unger.JIM G. 6RAVSON
ROY A. CLARKEMICHAEL F. YOSHIBAREGINA N. DANNER The City of Rancho Palos Verdes (the "City"), by and through its City Attorney,PAULA GUTIERRE2 BAE2A
BRUCE W. GALLOWAYDIANA K. CHUANG hereby submits the following certification ("Statement"), pursuant to SectionPATRICK K. BOBKO
NORMAN A. DUPONT VI.A.2.b ofOrder R4-2012-0175 (NPDES Permit CAS004001), issued by theDAVID M. SNOWLOLIV A. ENRIQUEZ California Regional Water Quality Control Board Los Angeles Region ("RWQCB")KIRSTEN R. BOWMAN ~
GIN ETTA L. GIOVINCOTRISHA ORTIZ on November 8, 2012 and entitled "Waste Discharge Requirements for Municipal
CANDICE K. LEE)ENNIFERPETRUSIS Separate Storm Sewer System ("MS4") Discharges within the Coastal Watersheds ofSTEVEN L. FLOWER
TOUSSAINT 5. BAILEY Los Angeles County Except Those Discharges Originating from the City of LongAMY ~REYSON ~DEBORAH R. HAKMAN
Beach MS4~~ (the ~~Permit~~).D. CRAIG FOXMARICELA E. MARROQUINKATHERINE 1, WISINSKI
SERITA R. YOUNGSHIRI KLIMA The City is one of the co-permittees under the Permit. Section VI.A.2.b of the Permit
DIANA H. VARATSEAN 8, GIBBONS requires the City to provide the RWQCB with a statement by its chief legal counselJULIE A. HAMILL ~
AMANDA L, sT N certifying that the City has the legal authority to implement and enforce each of theSTEPHANIE CAO
SPENCER B. KALLICK current requirements set forth in 40 C.F.R. § 122.26(d)(2)(i)(A-F) and the Permit. ThePATRICK D, SKAHAN
STEPHEN D. LEE purpose of this Statement is to describe the City's compliance with Section VI.A.2.bVOUSTINA N. A21Z
NICHOLAS R. GHIRELLDI of the Permit. As discussed in further detail herein, it is our opinion that the City hasCHRISTINA L. BROWNING
the necessary legal authority to implement the Permit and to control and prohibitOF COUNSEL
ROCHELLE 9ROWNE discharges of pollutants into the Municipal Separate Storm Sewer System ("MS4").SAVRE WEAVER
TERESA HO-URANO However this Statement is not nor should it be construed as a waiver of any rightsGENA M. STINNETT ~ 1 1
that the City. may have relating to the Permit.SAN FRANCISCO OFFICE
TELEPHON E !{15.421.8484
ORANGE COUNTY OFFICE 1. Legal Authority Statement
TELEPHONE ]1[}.990.0901
TEMECU LA OFFICETELEPHONE 951.695.233 In our opinion, the City has the necessary legal authority to comply with the legal
requirements imposed upon it under the Permit, consistent with the requirements setforth in the U.S. Environmental Protection Agency's regulations promulgated underthe Clean Water Act, and, specifically, 40 C.F.R. § 122.26(d)(2)(i)(A-F), and to the
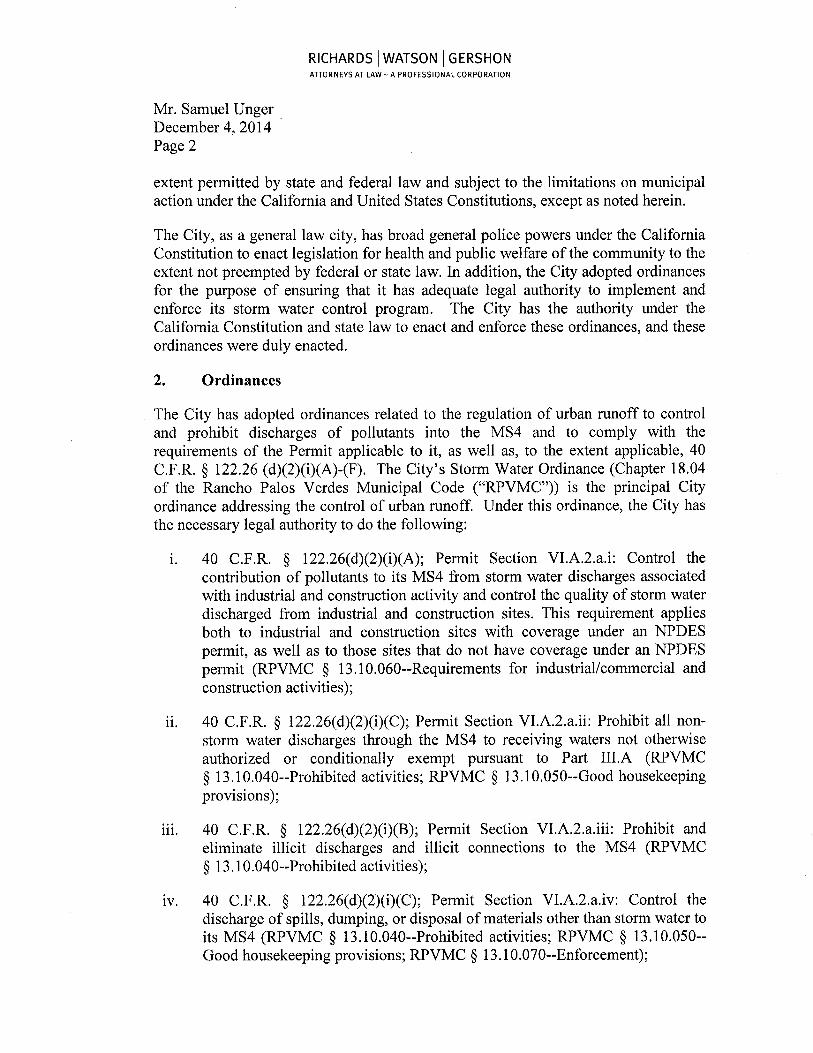
RICHARDS ~ WATSON ~ GERSHONATTORNEYS AT LAW -A PROFESSIONAL CORPORATION
Mr. Samuel UngerDecember 4, 2014Page 2
extent permitted by state and federal law and subject to the limitations on municipalaction under the California and United States Constitutions, except as noted herein.
The City, as a general law city, has broad general police powers under the CaliforniaConstitution to enact legislation for health and public welfare of the community to theextent not preempted by federal or state law. In addition, the City adopted ordinancesfor the purpose of ensuring that it has adequate legal authority to implement andenforce its storm water control program. The City has the authority under theCalifornia Constitution and state law to enact and enforce these ordinances, and theseordinances were duly enacted.
2. Ordinances
The City has adopted ordinances related to the regulation of urban runoff to controland prohibit discharges of pollutants into the MS4 and to comply with therequirements of the Permit applicable to it, as well as, to the extent applicable, 40C.F.R. § 122.26 (d)(2)(i)(A)-(F). The City's Storm Water Ordinance (Chapter 18.04of the Rancho Palos Verdes Municipal Code ("RPVMC")) is the principal Cityordinance addressing the control of urban runoff. Under this ordinance, the City hasthe necessary legal authority to do the following:
i. 40 C.F.R. § 122.26(d)(2)(i)(A); Permit Section VI.A.2.a.i: Control thecontribution of pollutants to its MS4 from storm water discharges associatedwith industrial and construction activity and control the quality of storm waterdischarged from industrial and construction sites. This requirement appliesboth to industrial and construction sites with coverage under an NPDESpermit, as well as to those sites that do not have coverage under an NPDESpermit (RPVMC § 13.10.060--Requirements for industrial/commercial andconstruction activities);
ii. 40 C.F.R. § 122.26(d)(2)(i)(C); Permit Section VI.A.2.a.ii: Prohibit all non-storm water discharges through the MS4 to receiving waters not otherwiseauthorized or conditionally exempt pursuant to Part III.A (RPVMC§ 13.10.040--Prohibited activities; RPVMC § 13.10.050--Good housekeepingprovisions);
iii. 40 C.F.R. § 122.26(d)(2)(i)(B); Permit Section VI.A.2.a.iii: Prohibit andeliminate illicit discharges and illicit connections to the MS4 (RPVMC§ 13.10.040--Prohibited activities);
iv. 40 C.F.R. § 122.26(d)(2)(i)(C); Permit Section VI.A.2.a.iv: Control thedischarge of spills, dumping, or disposal of materials other than storm water toits MS4 (RPVMC § 13.10.040--Prohibited activities; RPVMC § 13.10.050--Good housekeeping provisions; RPVMC § 13.10.070--Enforcement);

RICHARDS (WATSON ~ GERSHONATTORNEYS AT LAW -A PROFESSIONAL CORPORATION
Mr. Samuel UngerDecember 4, 2014Page 3
v. 40 C.F.R. § 122.26(d)(2)(i)(E); Permit Section VI.A.2.a.v: Requirecompliance with conditions in Permittee ordinances, permits, contracts ororders (i. e., hold dischargers to its MS4 accountable for their contributions ofpollutants and flows) (RPVMC § 13.10.070--Enforcement);
vi. 40 C.F.R. § 122.26(d)(2)(i)(E)-(F); Permit Section VI.A.2.a.vi: Utilizeenforcement mechanisms to require compliance with applicable ordinances,permits, contracts, or orders (RPVMC § 13.10.070--Enforcement);
vii. 40 C.F.R. § 122.26(d)(2)(i)(D); Permit Section VI.A.2.a.vii: Control thecontribution of pollutants from one portion of the shared MS4 to anotherportion of the MS4 through interagency agreements among Copermittees(RPVMC § 13.10.040--Prohibited activities; RPVMC § 13.10.070--Enforcement);
viii. 40 C.F.R. § 122.26 (d)(2)(i)(D); Permit Section VI.A.2.a.viii: Control of thecontribution of pollutants from one portion of the shared MS4 to anotherportion of the MS4 through interagency agreements with other owners of theMS4 such as the State of California Department of Transportation (RPVMC§ 13.10.040--Prohibited activities; RPVMC § 13.10.070--Enforcement);
ix. 40 C.F.R. § 122.26(d)(2)(i)(F); Permit Section VI.A.2.a.ix: Carry out all
inspections, surveillance, and monitoring procedures necessary to determine
compliance and noncompliance with applicable municipal ordinances,permits, contracts and orders, and with the provisions of this Order, including
the prohibition of non-storm water discharges into the MS4 and receiving
waters. This means the Permittee must have authority to enter, monitor,
inspect, take measurements, review and copy records, and require regular
reports from entities discharging into its MS4 (RPVMC § 13.10.065--
Standard urban stormwater mitigation plan (SUSMP) requirements for new
development and redevelopment projects);
x. 40 C.F.R. § 122.26(d)(2)(i)(E); Permit Section VI.A.2.a.x: Require the use of
control measures to prevent or reduce the discharge of pollutants to achieve
water quality standards/receiving water limitations (RPVMC § 13.10.065--
Standard urban stormwater mitigation plan (SUSMP) requirements for new
development and redevelopment projects; RPVMC § 13.10.040--Prohibited
activities; RPVMC § 13.10.070--Enforcement);
xi. 40 C.F.R. § 122.26(d)(2)(i)(E); Permit Section VI.A.2.a.xi: Require thatstructural BMPs are properly operated and maintained (RPVMC § 13.10.065--Standard urban stormwater mitigation plan (SUSMP) requirements for new
development and redevelopment projects); and

RICHARDS ~ WATSON ~ GERSHONATTORNEYS AT LAW -A PROFESSIONAL CORPORATION
Mr. Samuel UngerDecember 4, 2014Page 4
xii. 40 C.F.R. § 122.26(d)(2)(i)(E); Permit Section VI.A.2.a.xii: Requiredocumentation on the operation and maintenance of structural BMPs and theireffectiveness in reducing the discharge of pollutants to the MS4 (RPVMC§ 13.10.065--Standard urban stormwater mitigation plan (SUSMP)requirements for new development and redevelopment projects; RPVMC§ 13.10.050--Good housekeeping provisions; RPVMC § 13.10.070--Enforcement).
3. Implementation
Some of the City's ordinances are implemented through permit programs and othersare implemented as regulatory programs. Under each ordinance, one or more Citybodies, departments, or department directors are authorized and directed in eachordinance to take the actions contemplated by the ordinance (e.g., to considerevidence and make findings, to issue or deny permits, to impose conditions onprojects, to inspect, to take enforcement action, etc.).
The City's Storm Water Ordinance (RPVMC Chapter 13.10) is the principal Cityordinance addressing the control of urban runoff. This ordinance is regulatory, andapplies to specified new and existing residential and business communities andassociated facilities and activities, as well as new development and redevelopment,and all other specified new and existing facilities and activities that threaten todischarge pollutants within the boundaries of the City and within its regulatoryjurisdiction, whether or not a City permit or approval is required. The City's StormWater Ordinance also contains discharge prohibitions and requirements for theimplementation of BMPs and other requirements necessary to implement the Permit.
Other City departments require compliance with the City's Storm Water Ordinance asa condition for issuance of relevant City permits. City departments may also imposespecific conditions of approval consistent with the City's Storm Water Ordinance.All City environmental ordinances are also implemented, in part, through theapplication of the CEQA process to proposed projects.
4. Administrative and JudiciaVLegal Procedures
In addition to the above authority, the City has in place various legal andadministrative procedures to assist in enforcing the various urban runoff relatedOrdinances, including the following:
A. Administrative Remedies
• General Penalties (RPVMC Chapter 1.08—General Penalty).• Administrative Penalties and Citations (RPVMC Chapter 1.08—
General Penalty; RPVMC Chapter 1.16—AdministrativePenalties).

RICHARDS ~ WATSON ~ GERSHONATTORNEYS AT LAW -A PROFESSIONAL CORPORATION
Mr. Samuel UngerDecember 4, 2014Page 5
B. Nuisance Remedies
• Public nuisance under State law.• City nuisance abatement procedures (RPVMC Chapter 1.08—
General Penalty; RPVMC Chapter 1.16—AdministrativePenalties).
C. Criminal Remedies
• Misdemeanor citations/prosecution (RPVMC Chapter 1.12—Arrest Procedure).
D. Equitable Remedies
• Injunctive relief under State law and the Municipal Code (RPVMCChapter 1.08—General Penalty; RPVMC Chapter 1.16—Administrative Penalties).
• Declaratory relief under State law.
E. Other Civil Remedies
• Federal law claims (e.g., Clean Water Act and ResourceConservation and Recovery Act Citizen Suits).
• Remedies under the California Government Code.
Violations of the City's Storm Water Ordinance are deemed a "public nuisance," in
which case enforcement actions can be completed administratively or judicially.
Please contact me if you have any questions or if you need any additional information
regarding the City's legal authority to enforce the Permit.
Very truly yours,
~~~
Carol W. LynchCity Attorney
cc: Carolynn Petru, Acting City ManagerMichael Throne, Director of Public WorksRan Dragoo, Senior EngineerAndy Winje, Associate EngineerCandice K. Lee, Esq.Norman A. Dupont, Esq.
82001-0004\I770549v 1. doc