Embedded Obfuscated Barcodes for Identi cation of Genuine ...
Upload
independentCategory
view
3download
0
CHINESE JOURNAL OF CHEMICAL PHYSICS VOLUME 21, NUMBER 4 AUGUST 27, 2008
ARTICLE
Effect of Cation Proportion on Structural and Magnetic Properties ofNi-Zn Ferrites Nano-Size Particle Prepared By Co-Precipitation Technique
Santosh S. Jadhava∗, Sagar E. Shirsathc, B. G. Tokshac, S. J. Shuklab, K. M. Jadhavc
a. DSM College of Arts Commerce and Science, Jintur, Dist. Parbhani 431509, (M.S.) Indiab. Postgraduate and Research Centre of Physics, Department of Physics, Deogiri College, Aurangabad,Indiac. Department of Physics, Dr. Babasaheb Ambedkar Marathwada University, Aurangabad 431005,(M.S.) India
(Dated: Received on February 7, 2008; Accepted on June 12, 2008)
Ferrites having general formula Ni1−xZnxFe2O4 with x=0.0, 0.1, 0.2, 0.3, 0.4, 0.5, 0.6, and 0.7 were preparedby wet chemical co-precipitation method. The structural and magnetic properties were studied by meansof X-ray diffraction, magnetization, and AC susceptibility measurements. The X-ray analysis confirmed thesingle-phase formation of the samples. The lattice parameter obtained from XRD data was found to increasewith Zn content x. The cation distribution was studied by X-ray intensity ratio calculations. Magnetizationresults exhibit collinear ferrimagnetic structure for x≤0.4, and which changes to non-collinear for x >0.4.Curie temperature TC obtained from AC susceptibility data decreases with increasing x.
Key words: Ferrites, Magnetization, Yafet-Kittel angle, Curie temperature
I. INTRODUCTION
For the last few years, the soft ferrites having fineparticle size have been extensively studied due to theirwide range of technological applications. The structuralas well as magnetic properties of the ferrites have beenfound to depend upon the particle size, which dependsentirely on the method of synthesis [1]. The chemicalmethods of synthesis of ferrites require low tempera-ture and consequently produce powders with fine par-ticle size having high homogeneity. The wet chemicalco-precipitation [2], sol-gel [3], hydrothermal synthesis[4], citrate precursor [5], and combustion synthesis [6]are the few chemical methods of synthesis which canyield the ferrite powder with fine particle size of fewnanometers.
Among the soft ferrites, Ni-Zn ferrites are of com-mercial importance due to their high frequency appli-cations in different devices such as radio frequency coils,transformer cores, high quality filters, rod antennas,and read-write heads for high speed digital tape andoperating devices [7]. Such a large number of potentialapplications of Ni-Zn ferrite is possible due to their highresistivity, low dielectric loss, high Curie temperature,high permeability, etc. [8]. Owing to impact of fineparticles on properties of Ni-Zn ferrites and consideringits possible consequent effects on the technological ap-plications, it was decided to study the structural andmagnetic properties of Ni-Zn ferrites prepared by wetchemical co-precipitation technique.
∗Author to whom correspondence should be addressed. E-mail:[email protected]
II. EXPERIMENTS
The samples of Zn substituted nickel ferrite(Ni1−xZnxFe2O4 with x=0.0-0.7) were prepared byair oxidation of an aqueous suspension containingN2+, Zn2+, and Fe3+ cations in proper proportions.The starting solutions were prepared by mixing ap-propriate amounts of FeSO4·7H2O, NiSO4·7H2O, andZnSO4·7H2O (all 99.9% pure supplied by s.d. fine, In-dia). A two molar NaOH solution is used as precipi-tating agent and H2O2 was used as an oxidant, whichhelps to convert Fe2+ to Fe3+ by the following reaction[9], Fe2++ H2O2→Fe3++OH−+OH·.
The details of method of preparation were reportedin our previous work [10]. The samples were filtered,and washed several times by distilled water. The wetsamples of Ni-Zn system were annealed at 800 ◦C for12 h.
The X-ray powder diffraction patterns were recordedon a Philips X-ray diffractometer (Model Joel-DX-8030)at room temperature in a 2θ scanning range from 20◦ to80◦. The magnetic data for these samples were obtainedwith the help of high field hysteresis loop technique [11].The low field AC susceptibility measurements on pow-dered samples were carried out in the temperature rangeof 300-800 K using a double coil setup [12] operating ata frequency of 263 Hz and in an r.m.s. field of 7 Oe.
III. RESULTS AND DISCUSSION
Figure 1 depicts the X-ray diffraction patterns ofthe typical samples for x=0.0 and 0.7 of the seriesNi1−xZnxFe2O4. All the peaks of the XRD patternswere indexed using Bragg’s law. The analysis of X-ray
DOI:10.1088/1674-0068/21/04/381-386 381 c©2008 Chinese Physical Society

382 Chin. J. Chem. Phys., Vol. 21, No. 4 Santosh S. Jadhav et al.
TABLE I Lattice constant (a), X-ray density (dx), particle size (t) of Ni1−xZnxFe2O4.
x a/A dx/(gm/cm3) t/nm Ceramic particle size/µm
Wet chemical Standard ceramic [13-15] XRD SEM [27,28]
0.0 8.352 8.330 5.302 48 42 14.2
0.1 8.362 5.313 57 50 8.3
0.2 8.374 8.350 5.320 57 50 6.9
0.3 8.390 8.411 5.319 48 41 5.4
0.4 8.401 8.387 5.338 52 45 13.1
0.5 8.407 8.387 5.352 42 38 10.2
0.6 8.410 8.395 5.314 39 32 8.9
0.7 8.415 5.303 43 36 12.5
FIG. 1 XRD patterns for the samples and of the seriesNi1−xZnxFe2O4.
diffraction identified that all the samples have single-phase cubic spinel structure. The values of lattice con-stant were obtained from XRD data with an accuracyof ±0.002 A and are given in Table I. The variation oflattice constant a with Zn content x is shown in Fig.2.The linear increase in lattice constant with Zn contentobeys Vegard’s law [13] and the increase in lattice con-stant is due to the replacement of smaller radius ionsNi2+ (0.74 A) by larger radius ions Zn2+ (0.84 A). Fewresearchers have reported similar behavior for Ni-Zn fer-rite prepared by the standard ceramic method [14-16].A comparison of the values of lattice constant obtainedby the standard ceramic method (Table I) with thoseobtained in the present investigation shows considerablechange.
The values of X-ray density of ferrite samples werecalculated from the molecular weight and the volumeof the unit cell are given in Table I. It is observed fromX-ray density values that X-ray density decreases withan increase in Zn content, which may be due to theincrease in lattice constant.
The particle size of all the samples were obtainedfrom broadening of XRD peaks by using the Scherrerequation [13], and are given in Table I. It is evident from
FIG. 2 Variation of lattice constant a with Zn content x ofthe series Ni1−xZnxFe2O4.
Table I that the particle size is of the order of nanome-ter dimension. The particle size was also confirmed bySEM data (Fig.3). There are very few reports availableon particle size measurements of ceramically preparedNi-Zn samples. The comparison of particle size of thesamples prepared by co-precipitation technique in thepresent work and that of ceramically prepared samplesfrom literature is given in Table I.
The bond length RA (the shortest distance betweenA-site cations and oxygen ion) and RB (the shortestdistance between B-site cations and oxygen ion) werecalculated using the following relation [17],
RA = a√
3(δ − 18) (1)
RB = a
(3δ2 − δ
2+
116
)1/2
(2)
where, a is lattice constant, δ is oxygen position param-eter. The values of bond length RA and RB are given inTable II. It is evident from Table II that the bond lengthRA and RB increases with Zn content. The increase inbond length can be attributed to the increase in latticeconstant with Zn content. According to Levine [18],there exists an inverse relationship between the covalentcharacter of the spinel and bond lengths. In the present
DOI:10.1088/1674-0068/21/04/381-386 c©2008 Chinese Physical Society

Chin. J. Chem. Phys., Vol. 21, No. 4 Structural and Magnetic Properties of Ni-Zn Ferrites 383
2 µm 2 µm 2 µm(a) (b) (c)
FIG. 3 Scanning electron micrograph for the samples x=0.2 (a), 0.4 (b) and 0.6 (c) of the series Ni1−xZnxFe2−xO4.
FIG. 4 Variation of hopping lengths in octahedral (LA) andtetrahedral (LB) sites with the Zn content x of the seriesNi1−xZnxFe2O4.
study, the bond lengths RA and RB increase with Zncontent, therefore, there is a decrease of iono-covalentcharacter of the spinel with Zn content. Similar resultswere reported in the case of Li-Cu [19], Li-Cd [20], andCu-Zn [21].
The distance between magnetic ions, the hoppinglengths in tetrahedral sites (LA) and in octahedral sites(LB) were also calculated using the relation reported inthe literature [22] and are given in Table II. Figure 4shows the relation between the hopping lengths in octa-hedral and tetrahedral sites as a function of Zn content.The distance between the magnetic ions increases as theZn content increases. This may be explained on the ba-sis of difference in ionic radii of the constituent ions.
In the present series Ni1−xZnxFe2O4, the distributionof cations over the available tetrahedral (A) and octa-hedral [B] site was obtained by using X-ray intensityratio calculation. The calculated intensity ratios werecompared with the observed intensity ratios to deter-mine the cation distribution. The planes (220), (400),(422) and (440) are chosen to calculate intensity ratio,because it is observed that these planes are sensitive tocation distribution. The temperature and absorptionfactors are not taken into account in our calculations
TABLE II Hopping length (LA), (LB), and bond lengths(RA), (RB) of Ni1−xZnxFe2O4, lengths are all in A.
x LA LB RA RB
0.0 3.614 2.951 1.894 2.040
0.1 3.622 2.958 1.898 2.045
0.2 3.628 2.962 1.901 2.048
0.3 3.633 2.966 1.904 2.051
0.4 3.638 2.971 1.906 2.053
0.5 3.642 2.974 1.908 2.056
0.6 3.642 2.974 1.908 2.056
0.7 3.640 2.972 1.907 2.055
because they do not affect the intensity ratio calcula-tions at room temperature [23].
Considering the site preference energy of the cations,Zn2+ ions have strong preference towards tetrahedral[A] site whereas Ni2+ and Fe3+ have no definite sitepreference. Taking this into account and giving var-ious values of concentration of Ni2+, Zn2+ and Fe3+
at tetrahedral (A) site and octahedral [B] site, intensi-ties for various planes were calculated and their ratiostaken. The calculated intensity ratios were then com-pared with the observed intensity ratios. The resultsindicate that an observed and calculated intensity ratiodoes not match perfectly to any combination of cations.The combination of cations for which observed and cal-culated intensity ratios agree most closely is taken asthe most correct cation distribution and is given in Ta-ble III. Table III indicates that Zn2+ occupies tetrahe-dral (A) site, and Ni2+ occupies octahedral [B] site, andFe3+ occupies both tetrahedral and octahedral sites.These results of cation distribution are in agreementwith the earlier reports [24].
The magnetic properties like saturation magnetiza-tion (σs) and magneton number (nB) were studied us-ing the high field hysteresis loop technique [11]. Themagnetization data were recorded at room temperature.The values of saturation magnetization (σs) and mag-neton number (nB) (the saturation magnetization per
DOI:10.1088/1674-0068/21/04/381-386 c©2008 Chinese Physical Society
384 Chin. J. Chem. Phys., Vol. 21, No. 4 Santosh S. Jadhav et al.
TABLE III Cation distribution and X-ray intensity ratiosof Ni1−xZnxFe2O4.
x A-site B-site I(400)/I(422) I(220)/I(400)
Obs. Cal. Obs. Cal.
0.0 Zn0.0Fe1.0 Ni1.0Fe1.0 1.22 1.21 0.20 0.26
0.1 Zn0.1Fe0.9 Ni0.9Fe1.1 1.30 1.38 0.21 0.30
0.2 Zn0.2Fe0.8 Ni0.8Fe1.2 1.38 1.37 0.22 0.31
0.3 Zn0.3Fe0.7 Ni0.7Fe1.3 1.47 1.27 0.22 0.29
0.4 Zn0.4Fe0.6 Ni0.6Fe1.4 1.56 1.53 0.23 0.32
0.5 Zn0.5Fe0.5 Ni0.5Fe1.5 1.66 1.41 0.24 0.30
0.6 Zn0.6Fe0.4 Ni0.4Fe1.6 1.76 1.73 0.24 0.31
0.7 Zn0.7Fe0.3 Ni0.3Fe1.7 1.87 1.85 0.25 0.25
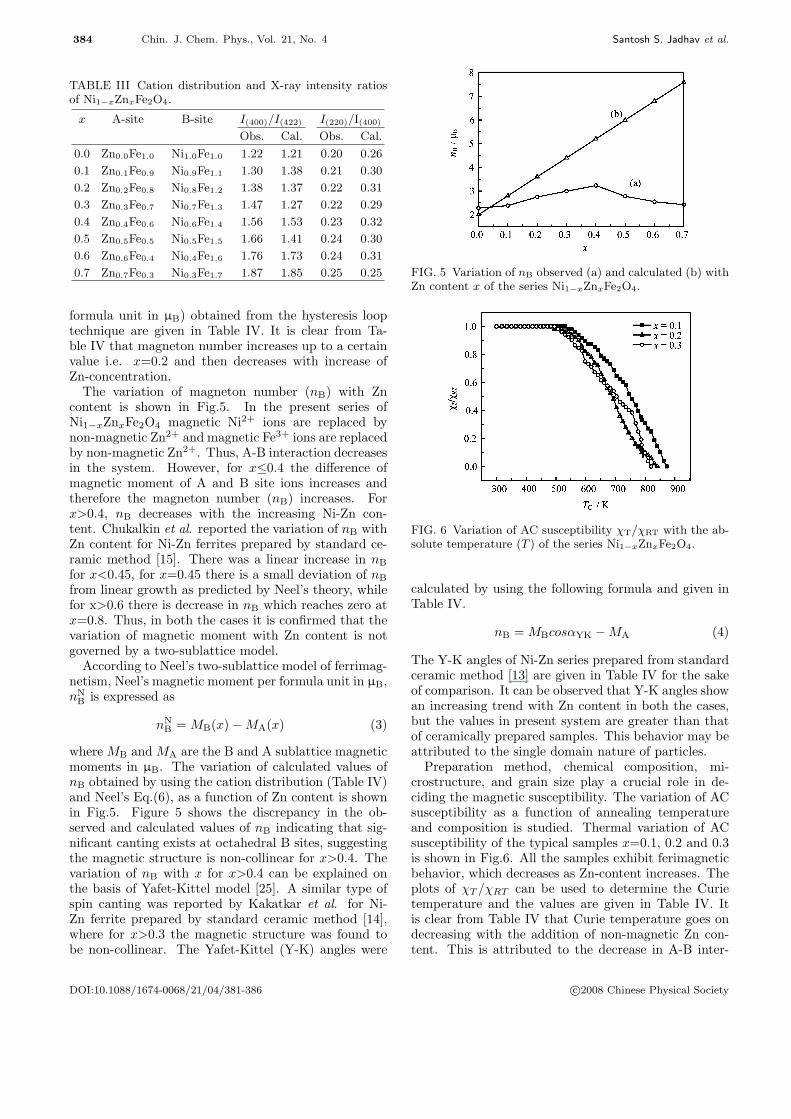
formula unit in µB) obtained from the hysteresis looptechnique are given in Table IV. It is clear from Ta-ble IV that magneton number increases up to a certainvalue i.e. x=0.2 and then decreases with increase ofZn-concentration.
The variation of magneton number (nB) with Zncontent is shown in Fig.5. In the present series ofNi1−xZnxFe2O4 magnetic Ni2+ ions are replaced bynon-magnetic Zn2+ and magnetic Fe3+ ions are replacedby non-magnetic Zn2+. Thus, A-B interaction decreasesin the system. However, for x≤0.4 the difference ofmagnetic moment of A and B site ions increases andtherefore the magneton number (nB) increases. Forx>0.4, nB decreases with the increasing Ni-Zn con-tent. Chukalkin et al. reported the variation of nB withZn content for Ni-Zn ferrites prepared by standard ce-ramic method [15]. There was a linear increase in nB
for x<0.45, for x=0.45 there is a small deviation of nB
from linear growth as predicted by Neel’s theory, whilefor x>0.6 there is decrease in nB which reaches zero atx=0.8. Thus, in both the cases it is confirmed that thevariation of magnetic moment with Zn content is notgoverned by a two-sublattice model.
According to Neel’s two-sublattice model of ferrimag-netism, Neel’s magnetic moment per formula unit in µB,nN
B is expressed as
nNB = MB(x)−MA(x) (3)
where MB and MA are the B and A sublattice magneticmoments in µB. The variation of calculated values ofnB obtained by using the cation distribution (Table IV)and Neel’s Eq.(6), as a function of Zn content is shownin Fig.5. Figure 5 shows the discrepancy in the ob-served and calculated values of nB indicating that sig-nificant canting exists at octahedral B sites, suggestingthe magnetic structure is non-collinear for x>0.4. Thevariation of nB with x for x>0.4 can be explained onthe basis of Yafet-Kittel model [25]. A similar type ofspin canting was reported by Kakatkar et al. for Ni-Zn ferrite prepared by standard ceramic method [14],where for x>0.3 the magnetic structure was found tobe non-collinear. The Yafet-Kittel (Y-K) angles were
FIG. 5 Variation of nB observed (a) and calculated (b) withZn content x of the series Ni1−xZnxFe2O4.
FIG. 6 Variation of AC susceptibility χT/χRT with the ab-solute temperature (T ) of the series Ni1−xZnxFe2O4.
calculated by using the following formula and given inTable IV.
nB = MBcosαYK −MA (4)
The Y-K angles of Ni-Zn series prepared from standardceramic method [13] are given in Table IV for the sakeof comparison. It can be observed that Y-K angles showan increasing trend with Zn content in both the cases,but the values in present system are greater than thatof ceramically prepared samples. This behavior may beattributed to the single domain nature of particles.
Preparation method, chemical composition, mi-crostructure, and grain size play a crucial role in de-ciding the magnetic susceptibility. The variation of ACsusceptibility as a function of annealing temperatureand composition is studied. Thermal variation of ACsusceptibility of the typical samples x=0.1, 0.2 and 0.3is shown in Fig.6. All the samples exhibit ferimagneticbehavior, which decreases as Zn-content increases. Theplots of χT /χRT can be used to determine the Curietemperature and the values are given in Table IV. Itis clear from Table IV that Curie temperature goes ondecreasing with the addition of non-magnetic Zn con-tent. This is attributed to the decrease in A-B inter-
DOI:10.1088/1674-0068/21/04/381-386 c©2008 Chinese Physical Society

Chin. J. Chem. Phys., Vol. 21, No. 4 Structural and Magnetic Properties of Ni-Zn Ferrites 385
TABLE IV Saturation magnetization (σs), magneton number (nB), Curie temperature (TC) and Yafet Kittle angle (θYK)of Ni1−xZnxFe2O4.
x σs/(emu/gm) nB/µB θYK/(◦) TC/K
Obs. Cal. Wet chemical Standard ceramic [13] ACSa DCRb TEPc[15] CP [27,28]
0.0 65.27 2.28 2.00 0◦ 877
0.1 65.27 2.38 2.80 0◦ 872 862 854
0.2 64.03 2.75 3.60 24◦30′ 839 840 785 779
0.3 62.34 2.99 4.40 35◦12′ 18◦25′ 820 820 762
0.4 59.83 3.23 5.20 45◦36′ 21◦31′ 796 797 768 623
0.5 56.57 2.78 6.00 52◦57′ 24◦54′ 734 733 612
0.6 56.57 2.55 6.80 59◦27′ 704 704 617 603
0.7 54.39 2.42 7.60 68◦30′ 672 671 582a AC susceptibility.b DC resistivity.c Thermoelectric power.
action resulting from the replacement of magnetic Fe3+
by non-magnetic Zn2+. The decrease in TC is uniformand linear. The comparison of Curie temperature of thesamples prepared by co-precipitation technique in thepresent work and ceramically prepared samples fromliterature is given in Table IV. The variation of Curietemperature with Zn content is represented in Fig.7.
According to Neel’s model A-B interaction is the mostdominant in ferrites, therefore, the Curie temperaturesof the ferrites are determined from the overall strengthof A-B interaction. The strength of A-B interactionis a function of the number of FeA+-O2−-FeB3+ link-ages, which, in turn, depends upon the number of Fe3+
ions in the formula unit and their distribution amongsttetrahedral (A) and octahedral [B] sites. In the presentsystem Ni2+ (2 µB) ions are replaced by Zn2+ (0 µB).This results in decreasing the A-B interaction, whichleads to a decrease in Curie temperature (TC).
The Curie temperatures are nearly the same as ob-served from DC resistivity plots [26]. The values ofCurie temperatures of the samples prepared by wetchemical co-precipitation method are higher than thoseprepared by ceramic method. Thus the ferrite sampleshaving high Curie temperatures may be prepared by wetchemical co-precipitation method which is attributed tonano particle nature.
IV. CONCLUSION
Samples of Ni-Zn spinel ferrite with x=0.0-0.7 weresuccessfully prepared by wet chemical co-precipitationtechnique with relatively low cost. The fine particle na-ture results from the co-precipitation technique. TheXRD peaks are broader as compared to ceramic sam-ples, which indicates nanoparticle nature. A change inthe structural parameter is observed compared with theceramic samples. The lattice constant increases with Zncontent. The observed and calculated magneton num-
FIG. 7 Variation of Curie temperature TC with Zn contentx of the series Ni1−xZnxFe2O4.
ber shows discrepancy in their values for x>0.4. TheCurie temperature TC decreases with increase of Zn con-tent. Having finer particles led in turn to enhancedmagnetic properties of the ferrite samples. The systemwith incorporation of Zn ions in Ni matrix exhibits in-teresting magnetic behavior. The substitution of Zn2+
in nickel ferrite reduces the magnetic properties as Znis non-magnetic and occupies tetrahedral A-sites. Thereduction in the particle size leads us to conclude thatthe properties of the present samples are superior tothat of their bulk counter part. The A-B interactionis found to weaken with increase in non-magnetic Zncontent which is echoed through the decrease in Curietemperature.
[1] P. P. Hankare, P. D. Kamble, M. R. Kadam, K. S. Rane,and P. N. Vasambekar, Mater. Lett. 61, 2769 (2007).
DOI:10.1088/1674-0068/21/04/381-386 c©2008 Chinese Physical Society

386 Chin. J. Chem. Phys., Vol. 21, No. 4 Santosh S. Jadhav et al.
[2] B. A. Mulla and V. S. Darshane, Ind. J. Chem. 22A,143 (1983).
[3] J. Azadmanjiri, H. K. Salehani, M. R. Barati, and F.Farzan, Mater. Lett. 61, 84 (2007).
[4] L. Satyanarayana, K. Madhusudan Reddy, and S. V.Manorama, Mater. Chem. Phys. 21, 82 (2003).
[5] A. K. Singh, A. K. Singh, T. C. Goel, and R. G. Mendi-ratta, J. Magn. Magn. Mater. 281, 276 (2004).
[6] A. F. Junior, E. C. de O. Lima, M. A. Novak, and P.R. Wells Jr, J. Magn. Magn. Mater. 308, 198 (2007).
[7] G. X. Xi, L. Yang, and M. Lu, Mater. Lett. 60, 3582(2006).
[8] A. Verma, T. C. Goel, and R. G. Mendiratta, J. Magn.Magn. Mater. 192, 271 (1999).
[9] V. Uskokovic and M. Drofenik, Colloids Surf. A Physic-ochem. Eng. Aspects 266, 168 (2005).
[10] K. M. Jadhav, V. B. Kawade, K. B. Modi, G. K. Bichile,and R. G. Kulkarni, Phys. B, 291, 379 (2000).
[11] S. D. Likhite, C. R. K. Murthy, and P. W. Sahastra-budhe, Proc. Ind. Acad. Sci. 87(a), 255 (1978).
[12] C. R. K. Murthy, S. D. Likhite, and N. P. Sastry, PhilipsMag. 23, 503 (1971).
[13] B. D. Cullity, Elements of X-ray Diffraction, Reading,Massachusetts: Addison-Wesley Publ. Comp. Inc., 99,(1956).
[14] S. V. Kakatkar, S. S. Kakatkar, R. S. Patil, A. M.Sankpal, S. S. Suryawanshi, D. N. Bhosale, and S. R.Sawant, Phys. Stat. Sol (b). 198, 853 (1996).
[15] Y. G. Chukalkin and V. R. Shirts, Phys. Stat. Sol (a).160, 185 (1993).
[16] D. Ravinder and G. Rangamohan, Mater. Lett. 44, 139(2000).
[17] E. W. Gorter, Philips Res. Rep. 9, 295 (1954).[18] B. F. Levine, Phys. Rev. USA B7, 2591 (1970).[19] S. A. Jadhav, J. Magn. Magn. Mater. 224, 167 (2001).[20] K. Radha and D. Ravinder, Ind. J. Pure Appld. Phys.
33, 74 (1995).[21] S. R. Sawant and S. S. Suryawanshi, Curr. Sci. 57, 12
(1998).[22] B. Vishwanathan and V. R. K. Murthy, Ferrite Material
Science and Technology, New Delhi: Narsoa PublishingHouse, (1990).
[23] P. Porta, F. S. Stone, and R. G. Turner, J. Solid StateChem. 11, 135 (1974).
[24] S. A. Patil, B. V. Bhise, and A. K. Ghatage, Mater.Chem. Phys. 65, 38 (2000).
[25] Y. Yafet and C. Kittel, Phys. Rev. 90, 295 (1952).[26] S. Santosh. Jadhav, Ph. D. Thesis, NandedS: R. T. M.
University, (2006).[27] A. K. M. Akther Hossain, S. T. Mahmud, M. Seki, T.
Kawai, and H. Tabata, J. Magn. Magn. Mater. 312,210 (2007).
[28] Ram Kadam, Ph. D. Thesis, Aurangabad: Dr. B. A.M. University, (2005).
DOI:10.1088/1674-0068/21/04/381-386 c©2008 Chinese Physical Society
Copyright © 2022 FDOKUMEN