Self-standing elastomeric composites based on lithium ferrites and their dielectric behavior
8
Self-standing elastomeric composites based on lithium ferrites and their dielectric behavior S. Soreto Teixeira, 1 M. P. F. Grac¸a, 1 M. Dionisio, 2 M. Ilc ıkova, 3 J. Mosnacek, 3 Z. Spitalsky, 3 I. Krupa, 3,4 and L. C. Costa 1 1 I3N and Physics Department, University of Aveiro, 3810-193 Aveiro, Portugal 2 REQUIMTE, Departamento de Qu ımica, Faculdade de Ci ^ encias e Tecnologia, Universidade Nova de Lisboa, 2829-516 Caparica, Portugal 3 Polymer Institute, Slovak Academy of Sciences, D ubravsk a cesta 9, Bratislava, Slovakia 4 Center for Advanced Materials, Qatar University, P.O. Box 2713, Doha, Qatar (Received 25 October 2014; accepted 25 November 2014; published online 9 December 2014) Lithium ferrite (LiFe 5 O 8 ) is an attractive material for technological applications due to its physical properties, which are significantly dependent on the preparation method and raw materials. In this work, LiFe 5 O 8 crystallites were obtained by controlled heat-treatment process at 1100 C, of a ho- mogeneous mixture of Li 2 O-Fe 2 O 3 powders, prepared by wet ball-milling and using lithium and iron nitrates as raw materials. The main goal was the preparation of a flexible and self-standing tick composite film by embedding lithium ferrite particles in a polymeric matrix, taking advantage of the good mechanical properties of the polymer and of the electrical and dielectric properties of the ferrite. The selected polymer matrix was styrene-b-isoprene-b-styrene copolymer. To prepare the composites, the lithium ferrite particles were chemically modified in order to functionalize their surface. To analyse the influence of the particles surface modification, different composites were made, with modified and unmodified particles. The structure of the obtained composites was stud- ied by FTIR, XRD, TGA, and DSC techniques. The dielectric properties were analysed, in the fre- quency range between 10 Hz and 1 MHz and in function of temperature in the range between 73 C and 127 C. These properties were related with the structure and concentration of the par- ticles in the matrix network. The composites with the modified particles present higher dielectric constant, maintaining values of loss tangent sufficiently low (<10 2 ) that can be considered inter- esting for technological applications. V C 2014 AIP Publishing LLC. [http://dx.doi.org/10.1063/1.4903735] I. INTRODUCTION Cubic lithium ferrites, such as LiFe 5 O 8 , belong to the class of soft magnetic materials with high Curie temperature (620 C), square hysteresis loop, and high magnetization. 1 These ferrites are very attractive materials for several appli- cations, because of its low preparation cost. 2 They are mainly used as a substitute for the well-known yttrium iron garnet (YIG), in mass-scale microwave devices for high- density magnetic recording, magnetic fluids, ferrofluid tech- nology, magnetocaloric refrigeration, magnetic resonance imaging enhancement, and magnetically guided drug deliv- ery. 3–5 The lithium ferrite (LFO) is also a promising cathode material in rechargeable Li-ion batteries. 6,7 The lithium ferrite ceramics can be prepared by different methods. It is known that preparation routes which involve high temperatures are not desirable because there is a possibil- ity of lithium volatilization. LFO particles can be synthesized by solid state reaction, by using lithium and iron nitrates as raw materials. The electrical and magnetic properties of this ferrite prepared by this method were already published. 8,9 In this article, the study of molecular dynamic of a thermo- plastic elastomer, a triblock copolymer with polystyrene end blocks and poly(styrene-isoprene) mid-block (SIS), commer- cially known as kraton, with the inclusion of lithium ferrite par- ticles to form a composite is presented. Before embedding the lithium ferrite powders into the polymeric matrix, the surface of particles were modified, first with silane and after with cho- lesteryl chloroformate. This method evidenced to improve the particles dispersion in the SIS polymer matrix. 10 The ABA type copolymers, such as polystyrene-polyiso- prene-polystyrene, are widely used in industry. In this work, SIS polymer, which is a thermoplastic elastomer presenting useful properties such as flexibility, high tensile strength, and low swelling in water, was used because the mention properties are required for actuation response under applied electric field. Thus, this kind of combination provides the soft and rubbery matrix of isoprene characteristic with the glassy domain of styrene. 11 The repetition of the styrene seg- ment increases the modulus and the yield strength when compared to that of polyisoprene alone. Furthermore, the physical crosslinks give origin to a copolymer that exhibits elastomeric properties of a cross-linked rubber that can be easily obtained by conventional methods. 12 The morphology of SIS can be divided into three different types: lamellar, cy- lindrical, and micellar, depending on the styrene content. There are techniques that can provide different morphologies such as melting, shearing, different casting solvents, 13 and solvents using different polymer compositions 14 which is the most widely used. In general, polymeric materials are very complex sys- tems, when compared with low molecular weight compounds. 0021-8979/2014/116(22)/224102/8/$30.00 V C 2014 AIP Publishing LLC 116, 224102-1 JOURNAL OF APPLIED PHYSICS 116, 224102 (2014)
-
Upload
independent -
Category
Documents
-
view
0 -
download
0
Transcript of Self-standing elastomeric composites based on lithium ferrites and their dielectric behavior
Self-standing elastomeric composites based on lithium ferrites and theirdielectric behavior
S. Soreto Teixeira,1 M. P. F. Graca,1 M. Dionisio,2 M. Ilc�ıkova,3 J. Mosnacek,3 Z. Spitalsky,3
I. Krupa,3,4 and L. C. Costa1
1I3N and Physics Department, University of Aveiro, 3810-193 Aveiro, Portugal2REQUIMTE, Departamento de Qu�ımica, Faculdade de Ciencias e Tecnologia, Universidade Nova de Lisboa,2829-516 Caparica, Portugal3Polymer Institute, Slovak Academy of Sciences, D�ubravsk�a cesta 9, Bratislava, Slovakia4Center for Advanced Materials, Qatar University, P.O. Box 2713, Doha, Qatar
(Received 25 October 2014; accepted 25 November 2014; published online 9 December 2014)
Lithium ferrite (LiFe5O8) is an attractive material for technological applications due to its physical
properties, which are significantly dependent on the preparation method and raw materials. In this
work, LiFe5O8 crystallites were obtained by controlled heat-treatment process at 1100 �C, of a ho-
mogeneous mixture of Li2O-Fe2O3 powders, prepared by wet ball-milling and using lithium and
iron nitrates as raw materials. The main goal was the preparation of a flexible and self-standing tick
composite film by embedding lithium ferrite particles in a polymeric matrix, taking advantage of
the good mechanical properties of the polymer and of the electrical and dielectric properties of the
ferrite. The selected polymer matrix was styrene-b-isoprene-b-styrene copolymer. To prepare the
composites, the lithium ferrite particles were chemically modified in order to functionalize their
surface. To analyse the influence of the particles surface modification, different composites were
made, with modified and unmodified particles. The structure of the obtained composites was stud-
ied by FTIR, XRD, TGA, and DSC techniques. The dielectric properties were analysed, in the fre-
quency range between 10 Hz and 1 MHz and in function of temperature in the range between
�73 �C and 127 �C. These properties were related with the structure and concentration of the par-
ticles in the matrix network. The composites with the modified particles present higher dielectric
constant, maintaining values of loss tangent sufficiently low (<10�2) that can be considered inter-
esting for technological applications. VC 2014 AIP Publishing LLC.
[http://dx.doi.org/10.1063/1.4903735]
I. INTRODUCTION
Cubic lithium ferrites, such as LiFe5O8, belong to the
class of soft magnetic materials with high Curie temperature
(620 �C), square hysteresis loop, and high magnetization.1
These ferrites are very attractive materials for several appli-
cations, because of its low preparation cost.2 They are
mainly used as a substitute for the well-known yttrium iron
garnet (YIG), in mass-scale microwave devices for high-
density magnetic recording, magnetic fluids, ferrofluid tech-
nology, magnetocaloric refrigeration, magnetic resonance
imaging enhancement, and magnetically guided drug deliv-
ery.3–5 The lithium ferrite (LFO) is also a promising cathode
material in rechargeable Li-ion batteries.6,7
The lithium ferrite ceramics can be prepared by different
methods. It is known that preparation routes which involve
high temperatures are not desirable because there is a possibil-
ity of lithium volatilization. LFO particles can be synthesized
by solid state reaction, by using lithium and iron nitrates as
raw materials. The electrical and magnetic properties of this
ferrite prepared by this method were already published.8,9
In this article, the study of molecular dynamic of a thermo-
plastic elastomer, a triblock copolymer with polystyrene end
blocks and poly(styrene-isoprene) mid-block (SIS), commer-
cially known as kraton, with the inclusion of lithium ferrite par-
ticles to form a composite is presented. Before embedding the
lithium ferrite powders into the polymeric matrix, the surface
of particles were modified, first with silane and after with cho-
lesteryl chloroformate. This method evidenced to improve the
particles dispersion in the SIS polymer matrix.10
The ABA type copolymers, such as polystyrene-polyiso-
prene-polystyrene, are widely used in industry. In this work,
SIS polymer, which is a thermoplastic elastomer presenting
useful properties such as flexibility, high tensile strength,
and low swelling in water, was used because the mention
properties are required for actuation response under applied
electric field. Thus, this kind of combination provides the
soft and rubbery matrix of isoprene characteristic with the
glassy domain of styrene.11 The repetition of the styrene seg-
ment increases the modulus and the yield strength when
compared to that of polyisoprene alone. Furthermore, the
physical crosslinks give origin to a copolymer that exhibits
elastomeric properties of a cross-linked rubber that can be
easily obtained by conventional methods.12 The morphology
of SIS can be divided into three different types: lamellar, cy-
lindrical, and micellar, depending on the styrene content.
There are techniques that can provide different morphologies
such as melting, shearing, different casting solvents,13 and
solvents using different polymer compositions14 which is the
most widely used.
In general, polymeric materials are very complex sys-
tems, when compared with low molecular weight compounds.
0021-8979/2014/116(22)/224102/8/$30.00 VC 2014 AIP Publishing LLC116, 224102-1
JOURNAL OF APPLIED PHYSICS 116, 224102 (2014)

A large number of macromolecular chains are responsible
for a great number of conformations with consequences at
the level of chain flexibility. Temperature has an important
influence in that flexibility, and consequently, this behaviour
is reflected in some other properties, such as the electrical
and dielectric, that can be studied by impedance spectros-
copy (IS).
From a practical point of view, impedance spectroscopy
can provide the measurement of the complex permittivity,
e�ðxÞ ¼ e0ðxÞ � i e00ðxÞ or derived quantities.15 One of those
quantities is the dielectric modulus,16 M¼ e�1, which is a
complex quantity M*(x)¼M0(x)þ iM00(x), being often
used in high conducting materials. The macroscopic proper-
ties, impedance Z*(x)¼Z0(x)� iZ00(x), or admittance,
Y¼ Z�1, that is, Y*(x)¼Y0(x)þ iY00(x) can also express the
properties of the material. The interrelations between these
quantities are simple when the sample geometric characteris-
tics are known.17
II. EXPERIMENTAL
A. Lithium ferrite powder preparation
LiFe5O8 powders were prepared by solid state method.
The raw materials were iron (III) nitrate (Fe(NO3)3.9H2O)
and lithium nitrate (LiNO3). After weighting the
Fe(NO3)3.9H2O and LiNO3 powders, taking into account the
stoichiometry of the lithium ferrite that presents a molar ratio
between the lithium and iron ions of 1:5, the powders were
homogenized in a planetary ball mill system (Fritsch-
Pulverisette 7.0), at 250 rpm for 1 h. Agata vessels and balls
were used with equal volume. After this first mixture, 10 ml
of ethanol was added, and this wet mixture was milled dur-
ing 3 h, at 500 rpm. In order to control the system tempera-
ture, every hour, the milling was stopped for 5 min. After
this process, the vessels with the powders were placed in a
furnace at 80 �C, for 24 h, to promote the evaporation of the
ethanol. After this procedure, several heat-treatments were
done at temperatures between 500 and 1200 �C.
The composite formation is described by several steps
that included the modification of the lithium ferrite particles,
first with 3-aminopropyl triethoxysilane, then with choles-
teryl chloroformate and the final preparation to obtain the
nanocomposites.
B. Raw materials
(3-aminopropyl) triethoxysilane, cholesteryl chlorofor-
mate (both Sigma-Aldrich, USA), triethylamine (Fluka,
Switzerland), solvents such as acetone (Analytical Grade)
and toluene (Sigma-Aldrich, USA) were used as received.
Tetrahydrofuran (THF; POCH, Poland) was dried over so-
dium wires and freshly distilled before reaction. The polymer
matrix styrene-b-isoprene-b-styrene (SIS; KRATON D1165,
KRATON, USA) was supplied in the form of pellets.
C. Modification of the lithium ferrite surface particles
The modification of LiFe5O8 particles was performed in
two steps according to Mrlik et al.18 Briefly, the particles
were modified with 3-aminopropyl triethoxysilane to
introduce amino functionality onto the particle’s surface that
enabled to anchor the cholesteryl chloroformate in the fol-
lowing steps.
1. Modification of LiFe5O8 particles with3-aminopropyl triethoxysilane
The LFO particles (0.19 g) were placed into the two-
neck round-bottom flask and 45 ml of toluene was added.
The mixture was stirred by using the mechanical glass stirrer
for 30 min at 110 �C. Then (3-aminopropyl)triethoxy silane
(6.64 ll, 3.778� 10�5 mol) was dissolved in 5 ml of toluene
added drop wise into the reaction flask. Further, the mixture
was refluxed for 8 h at 110 �C under argon atmosphere.
The modified particles were filtered, and washed by
100 ml toluene, 70 ml ethanol, and 70 ml acetone (three
times). The purified particles were dried in an oven, at
100 �C, and pressure of 300 mbar for 2 h.
2. Modification of LiFe5O8 particles with cholesterylchloroformate
The silane modified particles were placed into the three-
neck round-bottom, the flask was evacuated and back-filled
with argon (three times) and dry THF (200 ml) was added.
The cholesteryl chloroformate (0.02 g, 4.45� 10�5 mol) was
dissolved in the dry THF and added into reaction mixture fol-
lowed by addition of triethylamine (4 ml, 29 mmol). The reac-
tion mixture was stirred by using mechanical stirrer for 8 h.
The modified particles were filtered and washed with acetone
(three times, 50 ml) and dried in vacuum oven at 100 �C for
3 h. Then the pressure was decreased to 100 mbar for 1 h.
D. Composite preparation
The SIS was dissolved in toluene and the particles were
added. The solution was mixed by using high speed shear
blade mixing device at 1200 rpm for 2 h. After that the com-
posite solution was casted into the polytetrafluoroethylene
chambers where the solvent was evaporated at room temper-
ature and atmospheric pressure.
To completely remove the residual solvent, the compos-
ite was placed into the oven and the temperature was
increased to 80 �C at 10 �C step by day. Then the pressure
was decreased to 2 mbar by 100 mbar step by day. Finally,
the temperature was increased to 100 �C for 30 min and the
pressure kept at 2 mbar.
Two different concentrations of lithium ferrite were
made, 1% and 8% (% wt.), for modified and unmodified par-
ticles. The obtained samples, in square sheet geometry,
presents a thickness lower than 300 lm. At this stage, the
composites were ready to be analysed by Fourier Transform
Infrared (FTIR) spectroscopy, thermal gravimetric analysis
(TGA), differential scanning calorimetry (DSC), X-ray dif-
fraction (XRD), and IS.
E. Measurement techniques
The initial measurements by infrared spectroscopy
(FTIR) were performed with a Nicolet Impact 400 instru-
ment in ATR mode using a germanium crystal.
224102-2 Soreto Teixeira et al. J. Appl. Phys. 116, 224102 (2014)

TGA measurements were performed with a Mettler
Toledo TGA/SDTA 851 instrument in a nitrogen flow
(30 ml/min) using a heating rate of 10 �C min�1 in a temper-
ature range from 25 �C up to 800 �C. Indium and aluminium
were used for temperature calibration. Two parallel runs
were performed for each sample.
DSC was used for the determination of the glass transi-
tion temperature (Tg) in a Setaram DSC 131 calorimeter fit-
ted with a liquid nitrogen cooling accessory. Dry high purity
N2 gas was purged through the sample during measurements.
Samples were cooled to �40 �C and the thermograms were
collected in a subsequent heating run at 10 �C min�1.
XRD patterns data were obtained in a Siemens D5000
diffractometer (CuKa radiation, k¼ 1.54056 A) at 40 kV and
30 mA, with a curved graphite monochromator, an automatic
divergence slit (irradiated length 20.00 mm), a progressive
receiving slit (height 0.05 mm), and a flat plane sample
holder in a Bragg-Brentano parafocusing optic configuration.
Intensity data were collected by the step counting method
(step 0.02� in 1 s) in the 2h angle range of 10�–60�.For the electrical measurements, the samples were
inserted into two stainless steel electrodes (diameter 10 mm)
of a parallel plate capacitor. The electrical measurements
were carried out isothermally using an Alpha-N broadband
impedance analyzer (Novocontrol GmBH), in a range of fre-
quency from 10�1 up to 106 Hz. The temperature was
increased from �73 �C up to 127 �C in temperature steps of
10 �C. The sample cell (BDS 1200) was mounted in a cryo-
stat (BDS 1100) and exposed to a heated gas stream evapo-
rated from a liquid nitrogen dewar. The temperature control
was performed within 60.5 �C with the Quattro Cryosystem
from Novocontrol. The acquisition and control of data soft-
ware were performed by WinData and theoretical adjusts
were performed by WinFit from Novocontrol.
III. RESULTS AND DISCUSSION
LiFe5O8 particles were covalently modified with choles-
teryl chloroformate to improve its interaction with SIS poly-
mer matrix. As was already proved, due to chemical and
sterical composition, the cholesteryl modification improves
interactions with aliphatic polymer chains when used for
modification of fillers in polymer composites.19 When used
in SIS matrix, it improved, namely, interactions with
polyisoprene chains of styrene-b-isoprene-b-styrene copoly-
mer.20 In addition, the cholesteryl modification was observed
to improve sedimentation stability and resistance to corro-
sion when used for modification of magnetic particles.21
LFO particles were modified in two steps, as shown in
the scheme presented in Figure 1.
In this process, first, the silanization was performed to
introduce amine functional groups on the particles surface.
The successful modification was confirmed by FTIR spec-
troscopy, as can be seen in Figure 2(a), where the neat par-
ticles did not exhibit any characteristic absorption bands,
while in the spectra of silane modified particles it was
showed a new absorption band centred at 1400 cm�1 that
corresponds to C-N vibration from (3-aminopropyl) triethox-
ysilane and absorption of C-H aliphatic at 1388 cm�1,
respectively. Other characteristic bands appear at
1165 cm�1, corresponding to the vibration of C-O bond and
Si-O vibrations at 1100 cm�1.
In the second step (Fig. 1), the silane modified LiFe5O8
particles were used for the reaction with cholesteryl chloro-
formate to obtain covalently bonded cholesteryl groups onto
the particles surface. The modification was confirmed by
FTIR spectra (Fig. 2(b)). It can be clearly seen that after
modification a new absorption band appears at
2800–3000 cm�1, corresponding to C-H vibration from cho-
lesteryl groups. New absorption bands also appear at around
1600 cm�1 and 1258 cm�1. The former is related to C¼O
vibrations and the latter is C-O-C stretching bands of choles-
teryl groups.
Figure 3 shows the XRD patterns of all samples and of
the lithium ferrite base powder (heat-treated at 1100 �C). The
main diffraction peaks of the lithium ferrite are visible in all
of the composite samples, being more intensive in the 8%
unmodified one. The existence of relative low intensity peaks
in the modified samples can be associated with the powders
surface functionalization. Assuming that amorphous matrix
will have similar intensity peak as unmodified 1 wt. %, it can
be seen that when modified particles are used, the peak inten-
sity is decreased, pointing to better dispersed particles.21 The
same behaviour is observed in the sample with 8 wt. %.
The TGA analysis of the composites samples (Figure 4)
shows that the decomposition of the polymer starts at tem-
peratures above 300 �C, indicating the maximum of the
working composite temperature. From this analysis, the
FIG. 1. Scheme containing the modifi-
cation of LiFe5O8 particles with triethyl-
amine and cholesteryl chloroformate.
224102-3 Soreto Teixeira et al. J. Appl. Phys. 116, 224102 (2014)

amount of lithium ferrite incorporated in the matrix is pre-
sented in Table I. As it can be seen, the mass quantities of
lithium ferrite embedded in the polymer matrix are the
expected one, i.e., 1% and 8%. Since the samples used for
the TGA analysis, in all compositions, were obtained from
the center of the dried sheets, the difference between mass
percentage of ceramic powder, obtained by TGA and the the-
oretical one indicates that the particles distribution in the
polymer network is not completely uniform.
The thermograms obtained by DSC measurements
(Figure 5) show that samples undergo no changes on their
thermal behaviour upon the treatment to which they were
submitted. Moreover, the only thermal phenomenon detected
is the heat flux step assigned to the signature of the glass
transition (Tg) that does not changes significantly upon sev-
eral thermal cycles. In all samples, it is visible two glass
transition temperatures, the first one detected at around
�59 �C and the second one at around 66 �C. It must be men-
tioned that those glass transition temperatures for the
different compositions were estimated by the on-set values.
These two glass transitions were obtained due to the compo-
sition of the copolymer (polyisoprene and polystyrene). Also
these glass transitions were observed by Ilc�ıkov�a et al.20 by
dynamic mechanical analysis, however at relatively higher
temperatures (Tg1¼�39.8 �C and Tg2¼ 110.7 �C). The dif-
ference in the glass transitions temperatures can be explained
by the existence of the plasticized effect which is related to
increasing of lithium ferrite particles mostly in the second
relaxation process.
It is also visible that the heat flow variation, at Tg region,
is higher for the composites containing modified particles.
For further analysis of the glass transition phenomenon,
impedance spectroscopy measurements were performed,
since this method can provide information about the mobility
of the a-process that is behind the dynamic glass transition.
The temperature dependence of a relaxation exhibits the typ-
ical curvature of cooperative processes.
Figure 6(a) shows the temperature dependence of the
dielectric constant for samples with modified and unmodified
particles. For both concentrations in weight, the composites
containing modified particles present the highest values of
dielectric constant (e0), achieving at 300 K and 1 kHz a value
FIG. 3. XRD patterns of composite samples with 1 and 8 (% weight) modi-
fied and unmodified lithium ferrite particles and lithium ferrite base powder
(1100 �C heat-treated).
FIG. 4. TGA thermogram for composites with concentration in weight of
1% and 8% of modified and unmodified LiFe5O8 powder.
FIG. 2. (a) Fourier Transform Infrared (ATR, Ge) spectra of unmodified particles (LFO), triaminopropyl triethoxy silane (Silane), and particles modified by sil-
ane (LFO-silane); (b) Fourier Transform Infrared (ATR, Ge) spectra of cholesteryl chloroformate (cholesteryl chloroformate) and particles modified by silane
(LFO-cholesteryl chloroformate).
224102-4 Soreto Teixeira et al. J. Appl. Phys. 116, 224102 (2014)

of 3.65 (Fig. 6(b)). For the composites with unmodified par-
ticles, e0 increases with the rise of the concentration of
LiFe5O8 particles. At room temperature (RT) and 1 kHz,
LiFe5O8 ceramics exhibit a dielectric constant value of 54.8
The difference between those two values should be related to
the influence of the polymeric network. As expected, the pure
SIS copolymer network shows a smaller dielectric constant
value (�2.7 at 300 K—Fig. 6(b)). In our opinion, the mecha-
nism which leads the polarization is different for modified and
unmodified particles. In the modified ones, the polymeric net-
work has the main contribution for the polarization. On the
other hand, for unmodified particles, the dielectric behaviour
is mostly due to the particles contribution.
The dielectric losses (Table I) have similar values for
the samples with or without the surface modification process.
The slightly difference is due to the increase of the LiFe5O8
particles amount embedded in the polymeric matrix. In gen-
eral, the maximum of dielectric loss decreases with the tem-
perature as it can be seen in Figure 7, for the sample with
composition of 8% of modified particles.
Figure 8 shows the imaginary part of the complex per-
mittivity, as a function of frequency for a 8% lithium ferrite
unmodified particles dispersed in the polymeric matrix at
T¼ 97 �C.
A first analysis of these data was done by fitting the real
(e0) and imaginary (e00) parts of the permittivity with the
Havriliak–Negami (HN) function22
e� ¼ e1 þr
ixe0
þX
n
Den
1þ ixsHNnð ÞaHNn� �bHNn
; (1)
where n is the number of the relaxation processes, De is the
dielectric strength, aHN and bHN correspond to the shape pa-
rameters (0< aHN < 1; bHN < 1), sHN is the relaxation time,
related to the frequency of the loss peak maximum, and e1is the high frequency dielectric constant. It is known that at
higher temperatures, experimental data are influenced by a
low frequency conductivity contribution, and an additional
term r=ixe0 must be added. e0 represents the vacuum per-
mittivity and r the DC conductivity.23
In this figure it is also shown, for a representative tem-
perature, how the fitting process simulates the e00 spectrum
considering the sum of three relaxation processes and con-
ductivity. The process located at higher frequency is desig-
nated as b2 being assigned to a secondary, or sub-glass
relaxation due to relatively local reorientational motions of
dipoles. The process exhibiting a maximum at intermediate
frequencies is designated as a2 being attributed to the coop-
erative process underlying the dynamical glass transition
occurring at higher temperatures. The low frequency tail is
due to the conductivity.
For cooperative processes, the temperature dependence
for the relaxation time obeys the Vogel–Fulcher–Tamman
(VFT) law24
s ¼ s0 expB
T � T0
� �; (2)
where B is a constant, s0 is the relaxation time for infinite
temperature, and T0 is defined as the Vogel temperature,
30–70 �C below Tg. By replacing the VFT law in the activa-
tion energy expression, a new Eq. (3) was obtained, where Ris the ideal gas constant, 8.314 J/mol.
TABLE I. Composites parameters comparison in 1 and 8% wt. of LFO: tan dmax, and dielectric constant at 1 kHz, Tg by DSC and IS, Ea, and fragility index
(m).
1%—modified 8%—modified 1%—unmodified 8%—unmodified
Composition, TGA (%) 1.62 7.83 1.40 8.67
Tan dmax (10�3), f¼1 kHz 4.9, T¼�38 �C 7.1, T¼�43 �C 4.7, T¼�43 �C 5.6, T¼�43 �C
7.4, T¼ 77 �C 6.8, T¼ 87 �C
e’f¼1 kHz, T¼300 K 3.1 3.6 3.0 3.1
Tg1,DSC ( �C) �58.80 6 0.09 �59.64 6 0.12 �59.67 6 0.13 �57.46 6 0.05
Tg2,DSC ( �C) 67.44 6 0.11 65.13 6 0.48 66.03 6 0.99 64.34 6 0.02
Tga2,IS ( �C) 6 DTga2 55.80 6 0.18
Eaa2 6 DEaa2 (kJ/mol) 390.8 6 0.2
Fragilitya2 (ma2 6 Dma2) 62.06 6 0.07
Eab2 6 DEab2 (kJ/mol) 31.2 6 1.0 52.4 6 1.3 21.3 6 2.2 56.7 6 2.9
Tga1,IS ( �C) 6 DTga1 �67.67 6 7.88 �63.16 6 10.62 �63.72 6 37.32 �63.24 6 0.02
Eaa1 6 DEaa1 (kJ/mol) 252.8 6 24.7 357.4 6 23.2 347.3 6 32.1 352.99 6 0.05
Fragilitya1 (ma1 6 Dma1) 64 6 13 89 6 10 87 6 59 88 6 1
FIG. 5. DSC thermograms showing Tg for each concentration and type of
LiFe5O8 particles in the polymeric matrix.
224102-5 Soreto Teixeira et al. J. Appl. Phys. 116, 224102 (2014)

Ea Tð Þ ¼ R@lns@ 1=Tð Þ ¼
RB
1� T0
T
� �2: (3)
The dynamic glass transition (main transition or a process) is
commonly accompanied by different secondary processes (band c processes).25 The dynamic in polymeric materials
involves a hierarchy of relaxation processes which goes from
very local motions, due to b, c processes which activation
energy usually varies between 21 and 63 kJ/mol and segmen-
tal mobility exhibiting cooperative, due to a process or even
relaxation processes involving large or complete polymeric
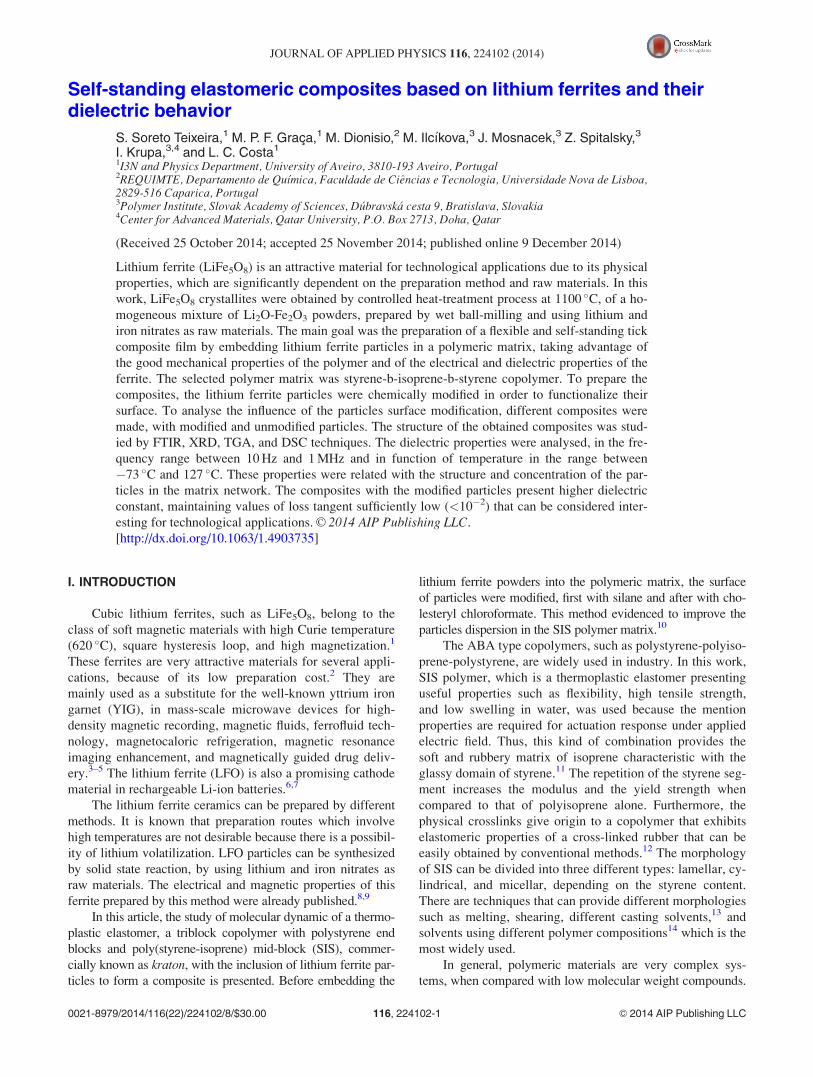
segments, Rouse dynamics or reputation.26 For all samples,
it can be observed three relaxation processes: one can be
assigned to a secondary relaxation and the others to coopera-
tive processes. The secondary relaxation, known as b pro-
cess, shows linear temperature dependence, Arrhenius
behavior in the relaxation map (Figure 9). The values of the
activation energy were similar and higher than activation
energy assigned to c processes (around 38 kJ/mol). These
secondary processes were called b1 and b2, respectively.
The a relaxation shows a non-linear dependence of
relaxation time as a function of the inverse of temperature
thus obeying the VFT equation. The activation energy of this
process, at Tg is higher than for secondary relaxation proc-
esses, around 100 kJ/mol. It is important to note that the
relaxation map (Figure 9) also includes the relaxation times
obtained from isochronal plot of the dielectric loss of a2,
which is an alternative procedure to extract the relaxation
times when the isothermal loss peaks are ill-defined, as it is
obtained for the a2-process. The agreement with the relaxa-
tion times obtained from the HN fits of the isothermal loss
curves is excellent, confirmed by according of both the data
adjusts for b-process: isochronal (fill dark squares) and iso-
thermal (open triangles) in Figure 9. This validates the use of
isochronal data especially when the respective loss peaks
maxima are poorly defined in the frequency domain or out of
the accessible frequency range.27–29
Analyzing the results of the molecular mobility studies,
for the samples with 8% in weight, modified and unmodified
FIG. 7. Tan d plot (composite with 8% wt. of modified particles).
FIG. 8. Dielectric loss curve and best fit, showing three relaxation processes
for the sample with 8% of lithium ferrite unmodified particles dispersed in
the polymeric matrix at T¼ 97 �C.
FIG. 6. (a) Real part of the permittivity in dependence of the temperature (1 kHz); (b) dielectric constant (T¼ 300 K; f¼ 1 kHz) dependence of LFO particles
concentration in weight.
224102-6 Soreto Teixeira et al. J. Appl. Phys. 116, 224102 (2014)
particles, we obtained nearby values for activation energy of
b2 process, 55 kJ/mol. For the composite containing 1% in
weight of unmodified particles the b2 process needs less
energy, around 21 kJ/mol. This increment can be justified by
the fact of the lithium ferrite particles which are not aggre-
gated with the polymer in the matrix composite and the
dipoles from polymer (segmental particles) and lithium fer-
rite particles have more mobility, reaching easily the barrier
of energy.
The a1 and a2 processes have similar values of Tg
obtained by the DSC analysis and IS extrapolation.
However, by DSC, a1 glass temperatures are slightly higher,
�59.67 up to �57.46 �C. From the extrapolation of the VFT
equation to s¼ 100 s,30,31 a glass transition temperature for
this process is estimated to be in the range between �67.67
and �63.16 �C. Consequently, the dielectric results also evi-
denced the restricted mobility of the copolymer chains in
agreement with the previous DSC results, which revealed a
Tg increase, associated with a small and broad heat flux step.
Concerning the difference between the Tg values estimated
by IS and determined from DSC (see Table I), it is not sur-
prising since the relaxation time at the calorimetric glass
transition temperature is not 100 s, as it was assumed, for
many polymeric systems.32,33
Both compositions with 8% wt. of lithium ferrite par-
ticles have small Tg values which can be explained by the ex-
istence of the plasticized effect related to the increasing of
that particles. So that it leads to an increasing of the space
between the polymer chains, avoiding the packing of the
chains lowering the glass transition.
The second a process for all samples was very difficult
to adjust and just a few data were obtained. So, the error for
estimating the relaxation time for each temperature is higher
than using isochronal data method. As these systems have
Tg’s very similar, we made only one adjust using data points
from all a2 relaxation process compositions and isochronal
data for the composition holding 8% wt. modified particles
are also included.
Evaluating the activation energy, a2 relaxation process
has a higher value than the a1 relaxation process, due to the
motion of the different phases (polyisoprene and polystyrene
components) of the copolymer.
The temperature dependence of relaxation times allowed
also to estimate the fragility index (m) that is a measure of
the abruptness of a given rubber material to vitrify in a small
temperature range (how the flow properties vary on
approaching the glass transition). The fragility index is cal-
culated according to Angell’s equation34
m ¼ @ log s
@ Tg=T� �
T¼Tg
¼ Ea Tgð Þln10 RTgð Þ
; (4)
where Tg can be estimated by replacing s in Eq. (2) by 100 s.
One sees that for the a1 relaxation process, the compos-
ite containing 1% wt. of modified particles in the polymeric
matrix has a smaller value of fragility (m¼ 64) than the re-
spective composite with unmodified particles (m¼ 86)
(Table I). So, this means that the modification of lithium fer-
rite particles surface turns the material stronger and contrib-
utes to an improvement in the mechanical material
properties.
IV. CONCLUSIONS
Composites have two glass transition temperatures due
to the constitution of the copolymer: Tg1 (around �58 �C, by
DSC and �65 �C by IS) related to the polyisoprene phase
and Tg2 (around 66 �C, by DSC and 56 �C by IS). A compari-
son with SIS, which has higher Tg’s, show that the inclusion
of particles contribute to the plasticized effect, being more
evident in composites with modified particles.
According to the analysis of the dependence of the
relaxation time with the temperature, we can observe three
relaxation processes for all composites. There are two a-
processes which have a VFT behaviour, obtaining two Tg’s,
in agreement with the DSC results, and one b-process, which
has an Arrhenius behaviour. The activation energy of the
second a-process is slightly higher than for the first one sug-
gesting that the cooperative movements due to the polysty-
rene phase are smaller than to the polyisoprene phase. The
modification of the lithium ferrites, before the introduction
into the polymer matrix, makes the material mechanically
stronger. The fragility index for the same % in weight is
smaller in composites containing modified particles, con-
firming this behaviour. The particles with modificated sur-
face contribute to an increase of the dielectric constant,
making the material stronger, improving their mechanical
properties which is a request to be used in several electronic
applications.
1M. N. Iliev, V. G. Ivanov, N. D. Todorov, V. Marinova, M. V. Abrashev,
R. Petrova, Y.-Q. Wang, and A. P. Litvinchuk, Phys. Rev. B 83, 174111
(2011).2R. P. Patil, P. P. Hankare, K. M. Garadkar, and R. Sasikala, J. Alloys
Compd. 523, 66 (2012).3N. G. Jovic�, A. S. Masadeh, A. S. Kremenovic, B. V. Antic, J. L. Blanusa,
N. D. Cvjeticanin, G. F. Goya, M. V. Antisari, and E. S. Bozin, J. Phys.
Chem. C 113, 20559 (2009).4M. Sugimoto, J. Am. Ceram. Soc. 82, 269 (1999).5S. Dey, A. Roy, D. Das, and J. Ghose, J. Magn. Magn. Mater. 270, 224
(2004).
FIG. 9. Relaxation map for second 8% modified composite sample.
224102-7 Soreto Teixeira et al. J. Appl. Phys. 116, 224102 (2014)

6Y. T. Lee, C. Yoon, Y. S. Lee, and Y.-K. Sun, J. Power Sources 134, 88
(2004).7X. Wang, L. Gao, L. Li, H. Zheng, Z. Zhang, W. Yu, and Y. Qian,
Nanotechnology 16, 2677 (2005).8S. S. Teixeira, M. P. F. Graca, and L. C. Costa, J. Non. Cryst. Solids 358,
1924 (2012).9S. S. Teixeira, M. P. F. Graca, L. C. Costa, and M. a. Valente, Mater. Sci.
Eng., B 186, 83 (2014).10M. Ilc�ıkov�a, J. Mosn�acek, M. Mrl�ık, T. Sedl�acek, K. Csomorov�a, K.
Czanikov�a, and I. Krupa, Polym. Adv. Technol. 25, 1293 (2014).11K. Thongsak, R. Kunanuruksapong, A. Sirivat, and W. Lerdwijitjarud,
Mater. Sci. Eng., A 527, 2504 (2010).12W. Lee, H. Kim, and E. Kim, Curr. Appl. Phys. 6, 718 (2006).13Y. Wang, J. Shen, and C. Long, Polymer 42, 8443 (2001).14H. H. Winter, D. B. Scott, W. Gronski, S. Okamoto, and T. Hashimoto,
Macromolecules 26, 7236 (1993).15J. P. Runt and J. J. Fitzgerald, in Impedance Measurement Technology,
edited by M. C. H. McKubre and D. D. Macdonald (American Chemical
Society, Washington, 2005).16J. Belattar, M. P. F. Grac¸a, L. C. Costa, M. E. Achour, and C. Brosseau,
J. Appl. Phys. 107, 124111 (2010).17F. Kremer and A. Schonhals, Broadband Dielectric Spectroscopy
(Springer-Verlag, Berlin, 2003).18M. Mrl�ık, M. Ilc�ıkov�a, V. Pavl�ınek, J. Mosn�acek, P. Peer, and P. Filip,
J. Colloid Interface Sci. 396, 146 (2013).19H. Valentov�a, M. Ilc�ıkov�a, K. Czanikov�a, Z. �Spitalsk�y, M. �Slouf, J.
Nedbal, and M. Omastov�a, J. Macromol. Sci. Part B 53, 496 (2014).20M. Ilc�ıkov�a, M. Mrl�ık, T. Sedl�acek, D. Chorv�at, I. Krupa, M. �Slouf, K.
Koynov, and J. Mosn�acek, Polymer 55, 211 (2014).
21M. Mrlik, M. Ilcikova, M. Sedlacik, J. Mosnacek, P. Peer, and P. Filip,
Colloid Polym. Sci. 292, 2137 (2014).22S. Havriliak and S. Negami, J. Polym. Sci., Part C: Polym. Symp. 14, 99
(2007).23M. T. Viciosa, A. M. Nunes, A. Fernandes, P. L. Almeida, M. H. Godinho,
and M. D. Dion�ısio, Liq. Cryst. 29, 429 (2002).24C. Leo�n, K. L. Ngai, and C. M. Roland, J. Chem. Phys. 110, 11585
(1999).25G. Williams, N. McCrum, and B. Read, Anelastic and Dielectric Effects in
Polymeric Solids (Wiley, New York, 1967).26M. Dionısio, N. M. Alves, and J. F. Mano, e-Polymers 2004, 44
(2004).27L. Hartmann, F. Kremer, P. Pouret, and L. Le�ger, J. Chem. Phys. 118,
6052 (2003).28I. K. Smith, S. R. Andrews, G. Williams, and P. A. Holmes, J. Mater.
Chem. 7, 203 (1997).29M. T. Viciosa, C. Rodrigues, S. Ferna, O. F. Mano, M. Dioni, and M. T.
Duarte, J. Polym. Sci., Part B: Polym. Phys. 45, 2802 (2007).30R. B€ohmer, K. L. Ngai, C. A. Angell, and D. J. Plazek, J. Chem. Phys. 99,
4201 (1993).31C. T. Moynihan, P. B. Macedo, C. J. Montrose, P. K. Gupta, M. A.
DeBolt, J. F. Dill, B. E. Dom, P. W. Drake, A. J. Easteal, P. B. Elterman,
R. P. Moeller, H. Sasabe, and J. A. Wilder, Ann. N.Y. Acad. Sci. 279, 15
(1976).32N. Alves, G. Ribelles, G. Tejedor, and J. Mano, Macromolecules 37, 3735
(2004).33J. M. Saiter, J. Grenet, E. Dargent, A. Saiter, and L. Delbreilh, Macromol.
Symp. 258, 152 (2007).34C. A. Angell, J. Non. Cryst. Solids 131–133, 13 (1991).
224102-8 Soreto Teixeira et al. J. Appl. Phys. 116, 224102 (2014)