Fracture Properties of Hydrogenated Amorphous Silicon Carbide Thin Films
Upload
independentCategory
view
1download
0
This content has been downloaded from IOPscience. Please scroll down to see the full text.
Download details:
IP Address: 210.22.115.162
This content was downloaded on 31/10/2013 at 21:27
Please note that terms and conditions apply.
Crystallization and magnetic properties of amorphous iron–chromium oxide nanoparticles
synthesized by sonochemistry
View the table of contents for this issue, or go to the journal homepage for more
2012 Adv. Nat. Sci: Nanosci. Nanotechnol. 3 015017
(http://iopscience.iop.org/2043-6262/3/1/015017)
Home Search Collections Journals About Contact us My IOPscience

IOP PUBLISHING ADVANCES IN NATURAL SCIENCES: NANOSCIENCE AND NANOTECHNOLOGY
Adv. Nat. Sci.: Nanosci. Nanotechnol. 3 (2012) 015017 (5pp) doi:10.1088/2043-6262/3/1/015017
Crystallization and magnetic propertiesof amorphous iron–chromium oxidenanoparticles synthesized bysonochemistryDang Phu Nguyen, Quoc Tuan Tran, Xuan Sy Trinh, Thanh Cao Hoang,Hoang Nam Nguyen and Hoang Hai Nguyen
Center for Materials Science, Faculty of Physics, Hanoi University of Science, Vietnam NationalUniversity, 334 Nguyen Trai, Thanh Xuan, Hanoi, Vietnam
E-mail: [email protected]
Received 10 October 2011Accepted for publication 6 January 2012Published 14 March 2012Online at stacks.iop.org/ANSN/3/015017
AbstractAmorphous iron–chromium oxide Fe2−x Crx O3 (x = 0, 0.05, 0.10, 0.15, 0.20) nanoparticleswere synthesized by sonochemical method at 80 ◦C. Crystallization process of the annealedsamples showed a strong ferromagnetic behavior due to the existence of the maghemite phase.The effect of chromium replacing iron in the crystallization process of Fe2−x Crx O3
nanoparticles was systematically studied by adjusting initial concentration of Cr3+. Theactivation energy of the samples deduced from thermal analysis and increased with dopingchromium showed that the existence of chromium can significantly slow down the ageingeffect of the amorphous iron oxide.
Keywords: crystallization process, amorphous iron oxide, sonochemistry, phase transition,magnetic properties.
Classification number: 5.02
1. Introduction
Iron oxide nanoparticles have attracted much interestbecause of their wide application abilities in biologicalseparation [1], drug delivery [2], magnetic liquids [3],diagnostic imaging [4], solar energy transformation [5, 6],magnetic devices [7] and the electronics industry [8].Amorphous iron oxide nanoparticles having a large surfacearea with a large number of unsaturated bonds, leads to thembeing very good candidates for catalytic activities [9, 10] aswell as sensors [11]. Amorphous iron oxide nanoparticleshave been synthesized by various methods such as electro-chemical [12], microwave heating [13], but the mostpopular method to synthesize them is sonochemistry [14–16].Amorphous formation requires a high cooling rate and thesonochemical technique can produce a cooling rate of morethan ten million degrees per second [17].
Understanding the crystallization process of amorphousiron oxide nanoparticles is important for applications. The
amorphous state is metastable and changes to the crystallinestate via crystallization process, during which a long-rangeorder can be formed and the physical and chemical propertiesof materials should change accordingly. The crystallizationprocess does not occur at a unique temperature but hingeson temperature and time. Usually, one determines thecrystallization temperature from thermal analyses where thecrystallization rate reaches maximum. At lower temperatures,the crystallization process happens with much lower rates,which used to be ignored in experiments. From the viewpointof application abilities, the stability of materials underambient conditions is important. In other words, the change ofproperties of materials with time, i.e. the ageing effects shouldbe well investigated. In a previous report, the crystallizationas well as the magnetic properties of iron oxide nanoparticlesprepared by sonochemical method were reported [18], butthe ageing effects and how to overcome them were notproposed. In this article, chromium was introduced intoamorphous iron oxide nanoparticles to slow down the ageing
2043-6262/12/015017+05$33.00 1 © 2012 Vietnam Academy of Science & Technology
Adv. Nat. Sci.: Nanosci. Nanotechnol. 3 (2012) 015017 D P Nguyen et al
Figure 1. XRD pattern of as-prepared Fe2−x Crx O3 sample andsample annealed at 600 ◦C with various content x of chromium.
Table 1. Chemical composition of the as-prepared Fe2−x Crx O3. Theerror bond in composition is ±0.5%. The lattice parameters a and care of the corundum type structure of the hematite phase.
Sample 1 2 3 4 5
x 0 0.05 0.10 0.15 0.20Concentration 0 0.06 0.098 0.17 0.24
from EDSa (Å) 5.045 5.042 5.039 5.036 5.035c (Å) 13.068 13.067 13.065 13.063 13.062
effect. We systematically investigated the crystallization andmagnetic properties of the iron-chromium oxide nanoparticlesby changing the content of chromium.
2. Experimental
The process of synthesis of amorphous iron–chromiumoxide Fe2−x Crx O3 nanoparticles by sonochemical reactionhas been described elsewhere [18] with some modifica-tions. Briefly, 80 ml solution of a 0.01 M ferric chlorideFeCl3 · 6H2O, 1 weight percent polyethylenglycol 2000, 1 Murea and Cr(NO3)3 · 9H2O was prepared in a 150 ml flask.The composition ratio of chromium x = 0, 0.05, 0.10, 0.15,0.20 was controlled by the amount of added Cr(NO3)3 · 9H2O.The solution in the flask was ultrasonicated with a power of400 W and frequency of 20 kHz emitted by a Sonic VCX 750ultrasound emitter in 4 h. The temperature of reaction waskept at 80 ◦C. The reacted solution was cooled down to roomtemperature and amorphous iron-chromium oxide powder wascollected by using a centrifuge. After washing five times withdistilled water and air-drying at 75 ◦C, the final samples werethen subjected for further characterization.
The thermal behavior of the as-prepared powder wasinvestigated by STD 2960 differential scanning calorimetry
Figure 2. XRD patterns of sample with x = 0.10 after annealed attemperature of 240, 270, 300 and 600 ◦C.
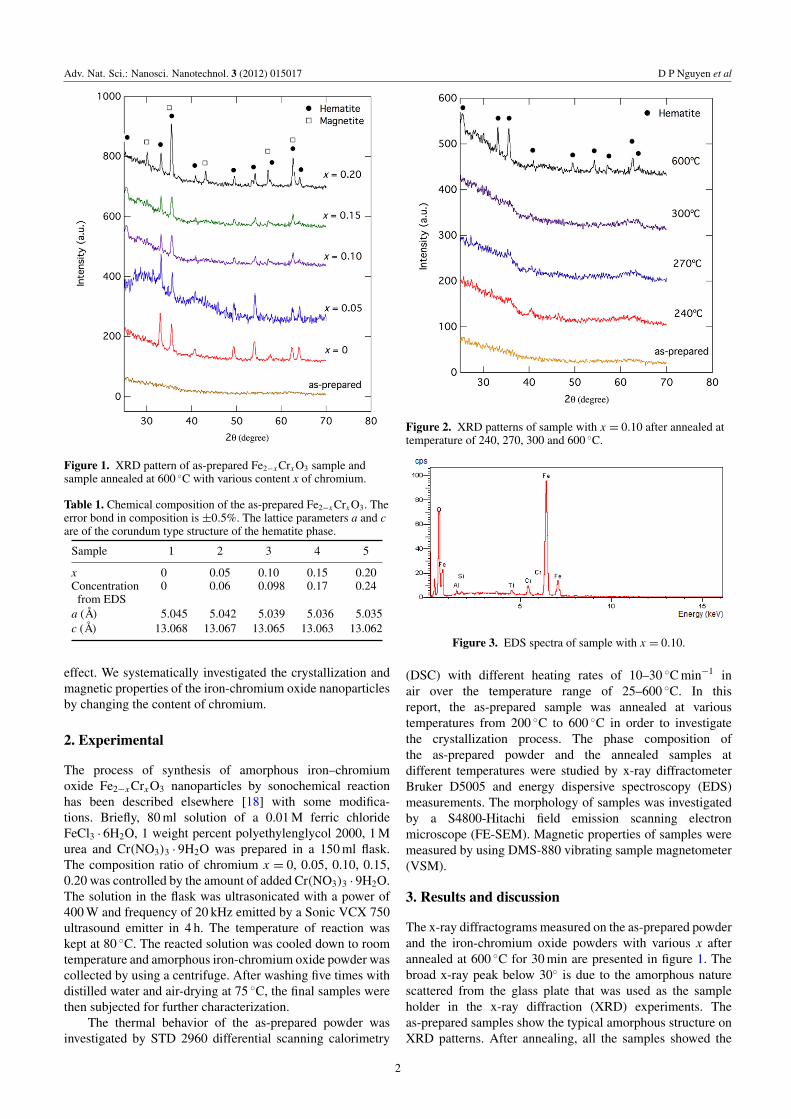
Figure 3. EDS spectra of sample with x = 0.10.
(DSC) with different heating rates of 10–30 ◦C min−1 inair over the temperature range of 25–600 ◦C. In thisreport, the as-prepared sample was annealed at varioustemperatures from 200 ◦C to 600 ◦C in order to investigatethe crystallization process. The phase composition ofthe as-prepared powder and the annealed samples atdifferent temperatures were studied by x-ray diffractometerBruker D5005 and energy dispersive spectroscopy (EDS)measurements. The morphology of samples was investigatedby a S4800-Hitachi field emission scanning electronmicroscope (FE-SEM). Magnetic properties of samples weremeasured by using DMS-880 vibrating sample magnetometer(VSM).
3. Results and discussion
The x-ray diffractograms measured on the as-prepared powderand the iron-chromium oxide powders with various x afterannealed at 600 ◦C for 30 min are presented in figure 1. Thebroad x-ray peak below 30◦ is due to the amorphous naturescattered from the glass plate that was used as the sampleholder in the x-ray diffraction (XRD) experiments. Theas-prepared samples show the typical amorphous structure onXRD patterns. After annealing, all the samples showed the
2

Adv. Nat. Sci.: Nanosci. Nanotechnol. 3 (2012) 015017 D P Nguyen et al
As-prepared sample Annealed sample
Figure 4. FE-SEM images of the sample with x = 0.10.
Figure 5. Temperature dependence of magnetization under theapplied field of 200 Oe of the iron-chromium oxide nanoparticlesFe2−x Crx O3 with various x.
presence of the hematite Fe2O3 phase (JCPDS 73-2234). Thesample with x = 0.20 showed the coexistence of the hematiteFe2O3 and the magnetite Fe3O4 phases (JCPDS 79-0418). Thelattice parameters of the corundum type structure deducedfrom the XRD results are shown in table 1. Both the latticeparameters a and c decreased slightly with increasing thechromium content. This can be understood by the decrease ofionic radius when iron ions were replaced by chromium ionin their lattice [19]. Figure 2 presents the XRD diffractograms
Figure 6. Magnetic field dependence of the magnetization at roomtemperature of samples with various x after annealing to hightemperature.
of the sample with x = 0.10 at various annealed temperatures.The broad and weak peaks shown in XRD patterns indicatedthat the crystallization gradually processed upon annealingup to 300 ◦C. The diffraction peak at 41.2◦ can be assignedto the α-Fe2O3 structure while peaks at 35.6 and 62.5◦
can be assigned to either the α-Fe2O3 or γ -Fe2O3 one(JCPDS 39-1346). With increasing annealed temperature to600 ◦C, the sample showed clear diffraction peaks of thehematite phase.
3

Adv. Nat. Sci.: Nanosci. Nanotechnol. 3 (2012) 015017 D P Nguyen et al
Figure 7. DSC data of the sample with various Cr contents x.
The composition of chromium in samples was controlledby the amount of initial added Cr(NO3)3 · 9H2O and wasdetermined from EDS data. Typically, the EDS analysis ofthe sample with x = 0.10 is shown in figure 3 and the resultsof the EDS analyses are shown in table 1. The chromiumconcentration in the as-prepared sample is almost equal to theconcentration of the precursors.
The morphology of the as-prepared samples and thesample with x = 0 annealed at 600 ◦C investigated bytransmission electron microscopy (TEM) [18] shows thatthe particle size increased from ∼5 nm for the unannealedsample to ∼22 nm for the annealed sample. In this report, weinvestigated the morphology of the sample with x = 0.10 byFE-SEM. The results are shown in figure 4. It also can be seenthat the size of sample increased after annealing, however, thedifferences are not clear.
The temperature dependence of the magnetization undera magnetic field of 200 Oe of the iron-chromium samplesis shown in figure 5. The heating curve started fromroom temperature where amorphous as-prepared sampleswere in non-ferromagnetic state. In this state, long-rangedorder of the magnetic moment of Fe and Cr ions was notpresent. Therefore, the samples did not show ferromagneticinteraction. For the sample with x = 0, the magnetizationshowed a sudden increase at around 230 ◦C, reached amaximum of 0.61 emu g−1 at 414 ◦C, then decreased toalmost zero at high temperature around 600 ◦C. The strongincrease at above 230 ◦C suggests that the crystallizationprocess of a ferromagnetic phase occurs at those temperatures.Above 600 ◦C, thermal agitation dominated the ferromagneticinteraction, at which point the sample was non-ferromagnetic.The cooling curve starting at 600 ◦C back to room temperaturewas monotonically increasing with temperature. The sampleswith x = 0.05, 0.10 and 0.15 behaved similarly with onepeak of magnetization, but the onset temperature of thepeak slightly increased with increasing x. The samplewith x = 0.20, however, has different behavior with veryhigh magnetization of 9.6 emu g−1 at the maximum of themagnetization peak located at about 510 ◦C. After coolingfrom 600 ◦C, the magnetization curve at room temperatureof samples with various x were measured, as shown in
Figure 8. Changes in the temperature at which the exothermicpeaks of Fe2−x Crx O3 became maximum as increasing x.
figure 6. All of the samples show ferromagnetic interaction.The saturated magnetization increases with the content ofchromium. The sample with x = 0 shows a small value ofsaturated magnetization of 4.4 emu g−1. Upon doping Cr intosample, the saturated magnetization increases significantly to15.1, 17.1 and 25.7 emu g−1 for samples with x = 0.05, 0.10and 0.15, respectively. The sample with x = 0.20 shows thehighest saturated magnetization of 32.1 emu g−1.
The crystalline iron oxides are maghemite γ -Fe2O3,hematite α-Fe2O3 or magnetite Fe3O4. The maghemite isferrimagnetic with saturation magnetization of 60 emu g−1.The hematite is antiferromagnetic and sometimes has lowsaturation magnetization of about a few emu g−1 [20] orsometimes has high saturation magnetization [21]. Theorigin of the ferromagnetic property of hematite wasexplained by the disorders in the materials or a largenumber of point defects, which was demonstrated by Ramanspectroscopy [18, 20, 21]. The magnetite has the highestsaturation magnetization of 80 emu g−1. Because the XRDdata of samples with x = 0, 0.05, 0.10, 0.15 after coolingdown from 600 ◦C consists only of the hematite phase and themagnetite phase does not exist, the crystallized ferromagneticphase in these samples can be assigned to the maghemitephase γ -Fe2O3. At the end of the peaks of magnetization onheating curves of these samples presented in figure 6, there isa transition from maghemite γ -Fe2O3 to hematite α-Fe2O3.The XRD pattern of sample x = 0.20, however, consists ofthe magnetite as well as the hematite phase. The high valueof magnetization of sample x = 0.20 during heating can beexplained by the co-existence of the magnetite phase withthe maghemite phase at high temperature. The maghemitephase then changed to hematite phase at higher temperaturebut the magnetite phase did not. After cooling down fromhigh temperature to room temperature, this sample showedthe co-existence of magnetite as well as hematite phaseresulting in high value of saturation magnetization at roomtemperature.
The thermal behavior of samples with various xinvestigated by DSC measurements is shown in figure 7.Increasing x led to the increase of all exothermic peaks. Thevalue of T1 and T2 changed strongly when x reached up to 0.10
4

Adv. Nat. Sci.: Nanosci. Nanotechnol. 3 (2012) 015017 D P Nguyen et al
Figure 9. DSC data of sample x = 0.10 with the heating rate of10–30 ◦C min−1.
20.0 20.1 20.2 20.3 20.4 20.5 20.6 20.7 20.8 20.9
-10.4
-10.2
-10.0
-9.8
-9.6
-9.4
-9.2
ln(β
/T2 p)
1/kbT
p
E Linear Fit of E
Equation y = a + b*x
Adj. R-Square 0.99214
Value Standard Error
E Intercept 18.2071 1.24345
E Slope -1.37136 0.06096
Figure 10. The activation energy calculation with the Kissingermodel for the sample x = 0.10.
while the values of T3 kept increasing in the whole range ofx as shown in figure 8. We expect that the activation energyof the amorphous iron-chromium oxide samples increaseswith the content of chromium. Figure 9 presents the dynamicprocess of the sample x = 0.10 with the heating rates of10–30 K min−1. Comparing to the sample with x = 0, allthe exothermic peaks of sample x = 0.10 occurred at highertemperatures. Using the Kissinger model [22], the activationenergies corresponding to the second peak were estimatedas shown in figure 10. Accordingly, the activation energiesEa of the peak T1, T2 and T3 of the sample with x = 0.10are 140, 156 and 170 kJ mol−1 while these values of samplex = 0 are 105, 130 and 186 kJ mol−1, respectively. In order toinvestigate the ageing effect of the amorphous ion-chromiumoxide materials, the activation energy of the first peaks isimportant. The time of completing the crystallization can beexpress as t ∝ exp(Ea/RT ) which shows that the rate ofcrystallization at room temperature is much lower than thatat T1. In the sample with x = 0, if the time of reaction at T1 isin the order of a few seconds, then the reaction time at roomtemperature is around a year. Using the above values of theactivation energy for peak T1, one can estimate the reaction
time at T1 of sample x = 0.10, which is around 15 years orincreases around 15 times.
4. Conclusion
Amorphous iron–chromium oxide nanoparticles have beenprepared by sonochemistry. The crystallization process andmagnetic properties were investigated systematically with thecontent of Cr. The ageing effect of the amorphous iron oxidematerials can be slowed down with the presence of Cr by afactor of 15 times.
Acknowledgments
This work was financially supported by the NationalFoundation of Science and Technology Development(NAFOSTED Grant No 103.02.68.09) and the key projectQGTD.10.29 of Vietnam National University in Hanoi. Theauthors would like to thank Professor Gubicza Jeno for theuseful discussion.
References
[1] Leslie-Pelecky D L, Labhasetwar V and Kraus R H 2005Nanobiomagnetics Advanced Magnetic Nanostructureed D J Sellmyer and R S Skomsli (New York: Kluwer)
[2] Thach C V, Hai N H and Chau N 2008 J. Korean Phys. Soc.52 1332
[3] Rosenzweig R E 1985 Ferrohydrodynamics (Cambridge:Cambridge University Press)
[4] Berry C C and Curtis A S G 2003 J. Phys. D: Appl. Phys.36 R198
[5] Machala L, Zboril R and Gedanken A 2007 J. Phys. Chem. B111 4003
[6] Danzfuss B and Stimming U 1984 J. Electroanal. Chem.164 89
[7] Casas L, Roig A, Rodrguez E, Molins E, Tejada J and Sort J2001 J. Non-Cryst. Solids 285 37
[8] Zboril R, Mashlan M and Petridis D 2002 Chem. Mater.14 969
[9] Perkas N, Koltypin Y, Palchik O, Gedanken A andChandrasekaran S 2001 Appl. Catal. A 209 125
[10] Srivastava D N, Perkas N, Gedanken A and Felner I 2002J. Phys. Chem. B 106 1878
[11] Neri G, Bonavita A, Milone C, Pistone A and Galvagno S2003 Sensors Actuators B 92 326
[12] Pascal C, Pascal J L, Favier F, Elidrissi Moubtassim M L andPayen C 1999 Chem. Mater. 11 141
[13] Liao X, Zhu J, Zhong W and Chen H Y 2001 Mater. Lett.50 341
[14] Pinkas J, Reichlova V, Zboril R, Moravec Z, Bezdicka P andMatejkova J 2008 Ultrason. Sonochem. 15 257
[15] Srivastava D N, Perkas N, Gerdanken A and Felner I 2002J. Phys. Chem. B 106 1878
[16] Shafi K V P M, Ulman A, Yan X, Yang N-L, Estournes C,White H and Rafailovic M 2001 Langmuir 17 5093
[17] Suslick K S, Choe S B, Cichowlas A A and Grinsta M W 1991Nature 353 414
[18] Phu N D, Sy T X, Cao H T, Nam N H and Hai N H 2012J. Non-Cryst. Solids 358 537
[19] Levinstein H, Robbins M and Capio C 1972 Mater. Res. Bull.7 27
[20] Ramesh R, Ashok K, Bhalero G M, Ponnusamy S andMuthamizhchel-van C 2010 Cryst. Res. Technol. 45 965
[21] Wu J, Mao S, Ye Z-G, Xie Z and Zheng L 2010 Appl. Mater.Interfaces 2 1561
[22] Kissinger H E 1957 Anal. Chem. 29 1702
5
Copyright © 2022 FDOKUMEN