Eco-friendly processes for the synthesis of amorphous calcium ...
Upload
khangminh22Category
view
4download
0
Crystallisation of Amorphous Fenofibrate and Potential of
the Polymer Blend Electrospun Matrices to Stabilise in its
Amorphous Form
Pratchaya Tipduangta, B.Pharm
Thesis submitted for the degree of Doctor of Philosopy
University of East Anglia
School of Pharmacy
November 2016
This copy of the thesis has been supplied on condition that anyone who consults it is understood to recognise that its
copyright rests with the author and that use of any information derived there from must be in accordance with current UK
Copyright Law. In addition, any quotation or extract must include full attribution

i
Abstract
Fenofibrate was chosen as the drug of interest in this study because of its poor water-
solubility, highly unstable amorphous state and unpredictable crystallisation behaviour.
The crystallisation behaviour of amorphous fenofibrate is essential information that
primarily corresponds to the physical stability of solid dispersion formulations. This project
aims to probe how to control the crystallisation of amorphous fenofibrate, enhance its
aqueous solubility and improve its physical stability by using electrospun polymer blend
matrices. A range of characterisation technologies including MTDSC, ATR-FTIR, PXRD,
SCXRD, SEM, TEM, HS-PLM, nano-TA and ss-NMR were used to characterise the
physicochemical properties of both the crystallisation process of fenofibrate, and
fenofibrate solid dispersions. The amorphous fenofibrate was crystallised using
heterogeneous nucleation techniques, including surface disruption and impurity addition
(talc). The presence or absence of an open top surface (OTS) was found to be one of the
key factors which dictated the crystallisation of the amorphous fenofibrate into specific
polymorphs. The use of thermal treatment in addition to OTS was able to finely tune the
selectivity of the crystallisation of fenofibrate to form I or/and form IIa. The use of a low
percentage of talc as heterogeneous nuclei resulted in the crystallisation of the new
fenofibrate polymorph III. The polymer blend fibres prepared by electrospinning were
phase separated solid dispersions that improved the aqueous solubility of the fenofibrate in
comparison to the fenofibrate crystals. The drug-polymer and polymer-polymer miscibility
were found to be the key parameters that affected the physical stability of the incorporated
amorphous drug and the phase separation in the formulations. Additionally, the in situ
phase separation of the hydrophilic and hydrophobic polymers in the blends led to modified
drug release. The drug release rate could be fine-tuned by altering the ratio of the polymers.
The new knowledge generated by this work relates to the following areas: 1) an improved
understanding of the crystallization process of fenofibrate and its polymorphic control; 2)
the use of polymer blend matrices in electrospun fibres that leads to the stabilization of
amorphous drugs when they are incorporated in those fibres; and 3) the modification of the
drug release profiles via the use of hydrophilic and hydrophobic polymer blend matrices
for electrospinning.

ii
Acknowledgement
It has been a long journey through my PhD at the school of Pharmacy, University of East Anglia. I
have made new friends, networks and developed my research skills. I would like to use this
opportunity to show my appreciation to the people who have continuously supported me through
this fantastic journey. First of all, I would like to express my gratitude to my supervisors, Dr. Sheng
Qi and Dr. Laszlo Fabian, for their excellent supervision, numerous brilliant ideas, continuous
encouragement, giving their precious time for discussions and patiently assisting me through my
PhD. Besides, I am very grateful to have received the invaluable assistance of Prof. Peter Belton for
devoting his time to numerous discussions and helping me with my solid state NMR and FTIR work.
Many thanks to Dr. Li Ying Wang and Prof. Huiru Tang from the Wuhan Institute of Physics and
Mathematics for helping with the solid state NMR experiments. Special thanks to Dr. Klaus Wellner
from the Institute of Food Research, Norwich Research Park, for helping with the FTIR imaging
and Mr. Khaled Takieddin for the single crystal data analysis. Furthermore, I would like to
acknowledge financial support from the EU INTERREG IVA 2 Mers Seas Zeeen Cross-border
Cooperation Programme. I would also like to express my gratitude to Associate Prof. Jakkapan
Sirithunyalug, Faculty of Pharmacy, and Assistant Prof. Sukum Eitssayeamin, Department of
Physics, Faculty of Science, Chiang Mai University, for their invaluable help on setting up the
instruments and discussions on practical challenges. Besides, I am very grateful for the help of Dr.
Siok Yee Chan, Dr. Maria De Fatima Gomes Pina, Dr. Kate Bowman, Dr Jonathan Moffat and Dr.
Ziyi Yang who showed me a warm welcome to the UEA drug delivery group and gave assistance
throughout the first year of my PhD.
I would like to extend my thanks to all my friends whom I met in the UK and who shared precious
memories with me throughout my PhD at UEA: Ms Mariko Hori, Dr. Chan Yodle, Dr. Chatuphon
Charoenkitpaiboon, Dr. Sasiri Chaichana, Mr. Kai Hui Leong, Dr. Choon Fu Goh, Dr. Varin, Mr.
Chaya Vaddhanaphuti, Ms. Yang Xiao and Mr. Xin Liao. Regarding my thesis writing, I would like
to thank Dr. Elise Wright, Dr. Gill Price and Dr. Jolyon Dodgson for helping me improve my writing.
Thanks to all my colleagues in the School of Pharmacy and the Drug Delivery Group: Mr. Muqdad
Alhijaj, Ms. Cholpon Rustem Kyzy, Ms. Valeria Gabrielli, Mr. Karol Nartowski and Ms. Susana
Campos E Menezes Jorge Ramalhate.
Last but not least, I would not have been able to achieve this endeavour without the unconditional
love, continuous support and encouragement from my beloved parents, Associate Prof. Pramote
Tipduangta and Mrs. Wassana Tipduangta, and my grandparents, Mr. Marnit Bhurimratana and Mrs.
Pimpa Bhurimratana. A special thanks to Ms. Kanokwan Heng-ia for her consistent encouragement.
iii
Table of Contents
Abstract ................................................................................................................................ i
Acknowledgement .............................................................................................................. ii
Table of Contents ............................................................................................................... iii
List of Figures .................................................................................................................... ix
Abbreviations .................................................................................................................... xx
1. Chapter 1 Introduction .................................................................................................... 1
1.1 Background ............................................................................................................... 1
1.2 Amorphous materials ................................................................................................ 2
1.3 Crystalline materials ................................................................................................. 5
1.3.1 Crystallisation ................................................................................................ 6
1.3.2 Nucleation ...................................................................................................... 6
1.3.2.1 Primary nucleation .................................................................................. 7
1.3.2.2 Secondary nucleation ............................................................................ 11
1.3.3 Crystal Growth ............................................................................................. 11
1.3.3.1 Crystal growth theories ......................................................................... 11
1.3.3.2 Kinetic of crystal growth in supersaturated solution ............................. 12
1.3.3.3 Kinetics of crystal growth from melts ................................................... 13
1.3.4 Polymorphism .............................................................................................. 14
1.3.4.1 Monotropism and enantropism ............................................................. 15
1.3.5 Factors affecting crystallisation ................................................................... 18
1.3.6 Crystallisation behaviour of organic compounds ......................................... 20
1.4 Solid dispersions ................................................................................................. 21
1.4.1 Classification of solid dispersions ................................................................ 23
1.4.1.1 Non-molecular solid dispersion ............................................................ 23
1.4.1.2 Molecular dispersions (solid solutions) ................................................ 25
1.4.2 Thermodynamic stability of molecular dispersions ..................................... 27
1.4.2.1 Glass transition ...................................................................................... 27
1.4.2.2 Molecular mobility and structural relaxation ........................................ 29
1.4.2.3 Theoretical miscibility estimation of drug and polymer ....................... 30
1.4.2.4 Interaction of drug and polymer ............................................................ 32
1.4.3 External factors affecting physical stability of molecular dispersions ......... 33
1.4.3.1 Temperature .......................................................................................... 33
1.4.3.2 Moisture uptake..................................................................................... 33
1.4.4 Solid dispersions containing polymer blends ............................................... 34
1.4.4.1 Polymer-polymer miscibility ................................................................ 35
1.4.4.2 Effect of drug incorporation in polymer blended systems .................... 36
1.4.4.3 Applications of polymer blends in drug delivery .................................. 37

iv
1.4.5 Methods for preparing solid dispersions ...................................................... 38
1.4.5.1 Melting based methods ......................................................................... 38
1.4.5.2 Solvent evaporation based methods ...................................................... 42
1.5 Electrospinning ................................................................................................... 44
1.5.1 Factors influencing electrospinning ............................................................. 46
1.5.1.1 Solution factors ..................................................................................... 46
1.5.1.2 Apparatus parameters ............................................................................ 48
1.5.1.3 Environmental humidity during electrospinning process...................... 49
1.5.2 Coaxial electrospinning................................................................................ 50
1.5.3 Applications of electrospinning in drug delivery ......................................... 51
1.5.4 Future outlook for electrospinning in pharmaceutical industry ................... 53
1.6 Aims of the project .............................................................................................. 55
1.7 References ............................................................................................................... 57
2.Chapter 2 Materials and methods................................................................................... 66
2.1 Introduction ............................................................................................................. 66
2.2 Materials ................................................................................................................. 66
2.2.1 Fenofibrate (FF) ............................................................................................... 66
2.2.2 Paracetamol (PCM) .......................................................................................... 67
2.2.3 Talc .................................................................................................................. 69
2.2.4 Polyvinyl pyrrolidone (PVP) ........................................................................... 69
2.2.5 Eudragit E ........................................................................................................ 71
2.2.6 Soluplus ............................................................................................................ 72
2.2.7 Hypromellose acetate succinate (HPMCAS) ................................................... 73
2.3 Electrospinning general set up ................................................................................ 75
2.4 General introduction to physicochemical characteristic techniques ....................... 75
2.4.1 Differential scanning calorimetry (DSC) ......................................................... 76
2.4.1.1 Basic principle........................................................................................... 76
2.4.1.2 DSC experimental conditions ................................................................... 78
2.4.2 Modulated temperature differential scanning calorimetry (MTDSC) .............. 78
2.4.2.1 Basic principle........................................................................................... 78
2.4.2.2 MTDSC experimental conditions ............................................................. 80
2.4.3 Thermogravimetric analysis (TGA) ................................................................. 81
2.4.3.1 Basic principle........................................................................................... 81
2.4.3.2 Thermogravimetric analysis operating conditions .................................... 81
2.4.4 Dynamic vapour sorption (DVS) ..................................................................... 81
2.4.4.1 Basic principle........................................................................................... 81
2.4.4.2 DVS operating conditions ......................................................................... 82
2.4.5 Attenuated total reflectance Fourier transforms infrared spectroscopy (ATR-
FTIR)......................................................................................................................... 83

v
2.4.5.1 Basic principle........................................................................................... 83
2.4.5.2 ATR-FTIR experimental conditions ......................................................... 84
2.4.6 FTIR microscopy ............................................................................................. 85
2.4.6.1 Basic principle........................................................................................... 85
2.4.6.2 FTIR microscopy experimental conditions ............................................... 85
2.4.7 Single crystal and powder X-ray diffraction .................................................... 86
2.4.7.1 Basic principle........................................................................................... 86
2.4.7.2 Single crystal X-ray diffraction experimental operating conditions ......... 87
2.4.7.3 Single crystal structure solving ................................................................. 88
2.4.7.4 Powder X-ray diffraction experimental operating conditions ................... 88
2.4.8 Scanning electron microscopy (SEM) ............................................................. 88
2.4.8.1 Basic principles ......................................................................................... 88
2.4.8.2 SEM experimental operating conditions ................................................... 89
2.4.9 Transmission electron microscopy (TEM) ....................................................... 89
2.4.9.1 Basic principles ......................................................................................... 89
2.4.9.2 Transmission electron microscope operating conditions .......................... 89
2.4.10 Hot stage polarised light microscopy (HS-PLM) ........................................... 90
2.4.10.1 Basic principle......................................................................................... 90
2.4.10.2 HS-PLM operating conditions ................................................................ 90
2.4.11 Atomic force microscopy (AFM) .................................................................. 90
2.4.11.1 Basic principle......................................................................................... 90
2.4.11.2 Local thermal analysis (LTA) ................................................................. 91
2.4.11.3 AFM contact mode and LTA operating conditions ................................ 93
2.4.12 Solid state nuclear magnetic resonance spectroscopy (ss-NMR) ................... 93
2.4.12.1 Basic principle......................................................................................... 93
2.4.12.2 ss-NMR operating conditions ................................................................. 95
2.6 In vitro dissolution study ........................................................................................ 95
2.6.1 Preparation of dissolution media ...................................................................... 96
2.6.2 In vitro dissolution operating conditions.......................................................... 96
2.6.3 Ultraviolet-visible spectroscopy (UV-VIS) for measurement of drug release. 96
2.6.3.1 Basic principle........................................................................................... 96
2.7 Kinetic models ........................................................................................................ 97
2.7.1 Kinetics models of drug release ........................................................................... 97
2.7.1.1 Power law ...................................................................................................... 97
2.7.1.2 Biphasic released model ................................................................................ 98
2.7.1.3 Statistical analysis for models selection ............................................................ 98
2.7.2 Mathematic models for study kinetics of moisture sorption ................................ 99
2.8 References ............................................................................................................. 101

vi
3. Chapter 3 Crystallisation behaviour of amorphous FF: Triggers of crystallisation and
polymorphic transformation ............................................................................................ 106
3.1 Introduction ........................................................................................................... 106
3.2 Methodology ......................................................................................................... 108
3.2.1 Materials ........................................................................................................ 108
3.2.2 Preparation of FF crystallisation samples ...................................................... 108
3.2.3 Characterisation methods ............................................................................... 108
3.3 Results ................................................................................................................... 109
3.3.1 Verification of existence of FF IIa ................................................................. 109
3.3.2 Differentiation of form IIa by single crystal structure analysis ..................... 113
3.3.3 Effect of crystal growth temperatures on FF crystallisation with OTS .......... 118
3.3.4 Effect of crystal growth temperatures on FF crystallisation in the bulk ........ 122
3.3.5 Physical stability of FF IIa ............................................................................. 124
3.3.6 Effect of OTS on FF crystal growth mode switching .................................... 129
3.4 Discussion ............................................................................................................. 130
3.4.1 Origin of FF IIa crystallisation and FF cross-nucleation ............................... 130
3.4.2 Optimal crystal growth condition of form IIa ................................................ 132
3.5 Conclusion ............................................................................................................ 132
3.6 References ............................................................................................................. 132
4. Chapter 4: New Low Melting-point Polymorph of FF Prepared via Talc Induced
Heterogeneous Nucleation .............................................................................................. 134
4.1 Introduction ........................................................................................................... 134
4.2 Methodology ......................................................................................................... 135
4.2.1. Sample preparation ................................................................................... 135
4.2.2 Characterisation methods ........................................................................... 135
4.3 Results ................................................................................................................... 135
4.3.1 Identification and optimization of new form III crystallisation ..................... 135
4.3.2 Physicochemical characterisation of FF form III ........................................... 137
4.3.3 Crystal structure of FF form III ...................................................................... 140
4.3.4 Verifying epitaxial relationship of talc and FF form III ................................ 142
4.3.5 Investigation into physicochemical stability of FF form III .......................... 143
4.4 Discussion ............................................................................................................. 146
4.5 Conclusion ............................................................................................................ 148
4.5 References ............................................................................................................. 148
5. Chapter 5: Fenofibrate loaded solid dispersions prepared by electrospinning and their
moisture sorption behaviour ........................................................................................... 149
5.1 Introduction ........................................................................................................... 149
5.2 Methodology ......................................................................................................... 150
5.2.1 Stock solution preparation ............................................................................. 150

vii
5.2.2 Sample preparation ........................................................................................ 150
5.2.3 Characterisation methods ............................................................................... 151
5.2.4 Moisture sorption and kinetic model study .................................................... 151
5.2.5 In vitro drug release study .............................................................................. 151
5.2.6 Solubility parameter estimation ..................................................................... 151
5.2.7 Theoretical Tg calculation using GT equation................................................ 152
5.2.8 Physical stability study................................................................................... 153
5.3 Results ................................................................................................................... 153
5.3.1 Physical characterisation of placebo and FF loaded electrospun fibres and cast
films ........................................................................................................................ 153
5.3.2 In vitro drug release of fresh FF polymer blend electrospun fibres and their
physical stability at 0% RH for six months ............................................................. 168
5.3.3 Physical stability of FF polymer fibrous formulation under 0%RH .............. 169
5.3.4 Kinetics of moisture sorption of placebo and drug loaded dispersions .......... 169
5.3.5 Structure deformation caused by moisture sorption ....................................... 182
5.4 Discussion ............................................................................................................. 190
5.4.1 Effect of moisture sorption on drug-polymer binary dispersions .................. 190
5.4.2 Effects of moisture sorption on ternary drug-polymer blend system ............. 192
5.4.4 Effect of preparation method and polymer-drug miscibility on physical
stability of dispersions ............................................................................................ 197
5.5 Conclusion ............................................................................................................ 198
5.6 References ............................................................................................................. 199
6. Chapter 6: Electrospun Polymer Blend Nanofibers for Tunable Drug Delivery: The
Role of Transformative Phase Separation on Controlling the Release Rate ................... 201
6.1 Introduction ........................................................................................................... 201
6.2 Methodology ......................................................................................................... 202
6.2.1 Preparation of cast film, spin-coated films and electrospun fibers of PVP-
HPMCAS blends ..................................................................................................... 202
6.2.2 Preparation of drug loaded electrospun fibres ............................................... 203
6.2.3 Tg estimation using GT equation.................................................................... 203
6.2.4 Characterisation methods ............................................................................... 203
6.2.5 Fibrous morphology study ............................................................................. 203
6.2.6 Disintegration and wettability studies of electrospun fibre mats ................... 204
6.2.7 In vitro drug release studies of drug loaded electrospun fibre mats ............... 204
6.2.8 Release data analysis and statistical evaluation ............................................. 204
6.3 Results ................................................................................................................... 204
6.3.1 Processing effect on phase separation of PVP-HPMCAS blends .................. 204
6.3.2 Effect of drug incorporation on phase separation of electrospun blend fibres212
6.3.3 Transformation of phase separation of electrospun blend fibres upon wetting
................................................................................................................................ 218

viii
6.3.4 In vitro drug release kinetics of electrospun blend fibres .............................. 222
6.4 Discussion ............................................................................................................. 225
6.4.1 Improved apparent miscibility of polymer blends by processing and drug
incorporation ........................................................................................................... 225
6.4.2 Effect of wetting and dissolution on phase separation and their impact on drug
release ..................................................................................................................... 227
6.5 Conclusion ............................................................................................................ 227
6.6 References ............................................................................................................. 228
7. Chapter 7: Concluding remarks and future outlook .................................................... 230
7.1 Crystallisation of amorphous FF ........................................................................... 230
7.2 Solid dispersions for stabilising amorphous FF .................................................... 231
7.3 Phase separation behaviour: A key to stabilise amorphous drugs in complex blends
and achieving modified drug release performance ..................................................... 232
7.4 Future outlook ....................................................................................................... 233
7.5 References ............................................................................................................. 234

ix
List of Figures
Figure 1.1 Structure of amorphous materials (a) and schematic diagram illustrating
thermodynamic disorder and kinetic disorder of solid state (b). This figure is adapted
from reference (28). ............................................................................................................ 3
Figure 1.2 Diagram illustrating the changing enthalpy or volume according to
temperature in different material states.This figure was adapted from reference (32). ...... 5
Figure 1.3 Molecular arrangement of materials with different solid states: the uniform
molecular arrangement with long range order in crystalline materials (a) and (b), which
are polymorph, and the irregular short range ordered of amorphous materials (c). ............ 6
Figure 1.4 Free energy diagram of homogeneous nucleation describing the existence of a
critical nucleation barrier. Figure adapted from reference (43). ......................................... 8
Figure 1.5 Interfacial tension at the boundary of the solid surface, foreign deposit and
liquid phase. This figure is adapted from reference (1). ..................................................... 9
Figure 1.6 Kossel’s model of monomatic height layer crystal growth at the surface of the
crystal. This figure is reproduced from reference (60). .................................................... 12
Figure 1.7 Diagram of energy vs. temperature of monotropic (a) and enantiotropic (b)
polymorphs (79). ............................................................................................................... 16
Figure 1.8 Phase diagram of a eutectic mixture of compounds A and B. ........................ 24
Figure 1.9 Diagram showing the formation of the crystalline molecular dispersions:
substitutional molecular dispersion (a) and interstitial molecular dispersion (b). The solute
molecules are highlighted in black. This figure is adapted from reference (12). .............. 26
Figure 1.10 Schematic diagram illustrating the structures of an amorphous solid
dispersion with polymer matrices: the conventional model (a) and the new model
proposed by Ouyang (b). Adapted from reference (114). ................................................. 27
Figure 1.11 Schematic diagram of a hot-melt extruder, reproduced from reference (168).
.......................................................................................................................................... 39
Figure 1.12 Schematic diagram of injection moulding process, reproduced from
reference (172). ................................................................................................................. 40
Figure 1.13 Schematic diagram of fused deposition modelling printer, reproduced from
reference (177). ................................................................................................................. 41
Figure 1.14 Schematic diagram of a spray dried unit, adapted from reference (185). ..... 43
Figure 1.15 Schematic diagram of spin-coating procedure preparing a thin film on a
substrate. ........................................................................................................................... 44
Figure 1.16 Diagram of electrospinning setup (a) and Taylor cone formation (b). ......... 45
Figure 1.17 Scanning electron micrographs of electrospun polystyrene fibres on
stationary Aluminium foil of 80 rpm and applied voltage of 15 kV with different
concentrations of polystyrene /dimethylformamide solutions (a) 10%, (b) 23%, (c) 27%,
(d) 32% and (e) 40% (w/v), reproduced from reference (209). ........................................ 47

x
Figure 1.18 Coaxial electrospinning set up with modified capillary and structure of core-
shell electrospun fibres under transition electron microscopy. This figure is adapted from
reference (218). ................................................................................................................. 50
Figure 1.19 Schematic of wire electrode a free surface electrospinning apparatus. This
figure is reproduced from reference (238). ....................................................................... 54
Figure 2.1 Molecular structure of FF ………………………………………………. 66
Figure 2.2 DSC thermogram of crystalline FF, a mixture of form I and II and amorphous
FF. This figure is reproduced from reference (13). ........................................................... 67
Figure 2.3 Molecular structure of PCM ........................................................................... 68
Figure 2.4 Packing arrangement of talc crystalline structure. The crystal parameters are
obtained from the reference (26). ...................................................................................... 69
Figure 2.5 Molecular structure of the PVP monomer unit ............................................... 71
Figure 2.6 Molecular structure of mono unit of Eudragit E ............................................. 72
Figure 2.7 Molecular structure of Soluplus ...................................................................... 73
Figure 2.8 Structural formula of HPMCAS ..................................................................... 74
Figure 2.9 A custom -made single spinneret electrospinning with a rotating collector ... 75
Figure 2.10 Schematic diagram of power-compensated DSC (a) and heat flux DSC (b).
This figure is reproduced from reference (61). ................................................................. 77
Figure 2.11 Example of standard DSC thermogram of PCM .......................................... 78
Figure 2.12 Sine wave heating in MTDSC (solid line) and linear heating in conventional
DSC (broken line) ............................................................................................................. 79
Figure 2.13 A flow chart illustrating an MTDSC signal deconvolution (adapted from
reference (62)) ................................................................................................................... 80
Figure 2.14 Diagram illustrating inner structure of Q5000 SA DVS. This diagram
reproduces from TA Instrument brochure. ....................................................................... 82
Figure 2.15 A schematic diagram demonstrating the principle of attenuated total
reflectance ......................................................................................................................... 84
Figure 2.16 Preferred orientation of PXRD sulfathiazole form III is reduced by grinding.
This figure was reproduced from reference (89)............................................................... 87
Figure 2.17 Schematic diagram of atomic force microscopic setup. This figure is
reproduced from reference (103) ...................................................................................... 91
Figure 2.18 Schematic diagram of the principle of local thermal analysis, adapted from
reference (105). ................................................................................................................. 92
Figure 2.19 Schematic images of microprobe (a) and a nano thermal probe (b). ............ 93
Figure 2.20 Energy levels of nuclei split into two different states after applying an
external magnetic field. ..................................................................................................... 94

xi
Figure 3.1 Characteristic data of FF IIa including DSC, ATR-FTIR and PXRD. (a) Melting
points of OTS-FF 40°C in comparison to the reference form I. (b) ATR-FTIR spectra of
reference form I, OTS-FF 40°C, the subtracted spectrum of OTS-FF 40°C and 40%
intensity of the reference form I and B-FF RT in different regions, including 3400-1600
and 1800-1300 cm-1. (c) PXRD pattern of B-FF RT in comparison to form I. 110
Figure 3.2 DSC of B-FF that was scratched from the coverslip. The form IIa in the B-FF
immediately converted to the stable form I after the mechanical trigger of scratching. . 111
Figure 3.3 Partial ATR-FTIR spectra (1760-1500 cm-1) that were acquired on the upper
and lower surfaces of (a) OTS-FF 40°C and (b) OTS-FF RT. The two carbonyl stretching
position for the C17-O3 peaks at 1727 and 1714 cm-1 reflect a mixture between FF forms I
and IIa, whereas the carbonyl stretching of C17-O3 peak at 1714 cm-1 indicates FF form IIa.
........................................................................................................................................ 113
Figure 3.4 (a) ORTEP structure of form IIa; (b) overlay of molecular conformations in FF
form I (black), form IIa (blue) and form IIb (red)........................................................... 114
Figure 3.5 Intermolecular interactions in form I: (a) layers formed by CH…O interactions
and (b) offset of π-π interactions and CH…O linked dimers that connect the layers. .... 115
Figure 3.6 (a) Layers formed by CH…O interactions and π-π stacking in form IIa; (b)
interactions perpendicular to the layers of form IIa; (c) packing diagram of form IIa; and
(d) packing diagram of form I. ........................................................................................ 116
Figure 3.7 (a) Form IIa short interactions and (b) form IIa pi-pi interactions. .............. 116
Figure 3.8 Intermolecular CH…O interactions in form IIb (a) forming a tape motif, (b)
cross-linking the tapes via dimeric rings similar to those in form I and (c) packing of form
IIb. ................................................................................................................................... 118
Figure 3.9 (a) Images of OTS-FF growth at different temperatures and (b) PLM images of
B-FF growth at different temperatures and the change in crystal growth rate associated with
the temperature effect. .................................................................................................... 119
Figure 3.10 (a) DSC thermogram demonstrating melting enthalpies of OTS-FF, which
were incubating at different temperatures during their crystallisation, and (b) changes in
the melting enthalpies of FF forms I and IIa with incubating temperature. .................... 120
Figure 3.11 Partial ATR-FITR spectra (1800-1500 cm-1) of (a) OTS-FF and (b) B-FF that
were crystallised at various growth temperatures (70, 60, 50, 40 °C and room temperature).
........................................................................................................................................ 121
Figure 3.12 PXRD patterns of (a) OTS-FF and (b) B-FF at different crystal growth
temperatures. ................................................................................................................... 122
Figure 3.13 ATR-FTIR spectra of (a) B-FF 60 and 70°C in comparison to the reference
form I spectrum (1800-600 cm-1) and (b) the subtracted spectra of B-FF 60 and 70°C from
the form I spectrum at 3400 to 2600 cm-1. ...................................................................... 123

xii
Figure 3.14 PXRD analysis of six months physical stability under ambient conditions of
OTS-FF, which was crystallised at 40°C, fresh (A), one month (B), three months (C), six
months (D) and intact crystalline form I (E). .................................................................. 125
Figure 3.15 (a) DSC thermogram demonstrating different heating rates being applied to
OTS-FF at 40°C (which generated FF form IIa rich crystals) and (b) changes in melting
enthalpies of forms I and IIa with the heating rates used in the DSC experiments......... 125
Figure 3.16 (a) Isothermal DSC thermograms of a post polymorphic transformation of FF
form IIa rich crystals by melt-recrystallisation when annealing at 76 °C and (b) DSC
heating of form IIa after annealing at 76 °C. .................................................................. 126
Figure 3.17 (a) Isothermal MTDSC thermogram of OTS-FF IIa rich crystals at 60 and
70°C for 120 min and (b) DSC heating of a OTS-FF 40°C sample after isothermal MTDSC
at 60 and 70°C. ................................................................................................................ 127
Figure 3.18 Change in ester carbonyl stretching peak intensity during variable temperature
ATR-FTIR of OTS-FF40°C: the indicator peak at 1714 cm-1(form IIa) shifted to 1727 cm-
1 (form I). This is an indication of the transformation of form IIa to form I after annealing
at 70°C for 3 hrs. ............................................................................................................. 128
Figure 3.19 PXRD pattern of B-FF physical stability for six months under ambient
conditions: fresh (A), one month (B), three months (C) and dix months (D). ................ 128
Figure 3.20 Changes in ATR-FTIR spectra of B-FF after removing coverslips and placing
on the variable temperature ATR-FTIR for 3 hr at 70°C. It should be noted that the
characteristic peak of FF form II at 1714 cm-1 gradually shifted to 1721 cm-1 that indicated
the polymorphic conversion of form II to I. .................................................................... 129
Figure 3.21 Images of FF crystal growth mode being switched from form IIa to form I after
top coverslip removal. (a-c) FF form IIa crystals grown between sandwiched coverslips at
room temperature over 17 minutes (a = initial, b = 5 min, c = 15 min); (d-f) following top
cover slip removal, form IIa crystal growth was terminated and form I crystallisation
occurred throughout the remaining amorphous FF (d = initial, e = 5 min, f = 15 min ); and
(g) spherulite and needle-like crystalline regions were distinguished as two separate
domains using ATR-FTIR in which the ester carbonyl stretching peaks at 1714 and 1727
cm-1 indicates the presence of forms IIa and I, respectively............................................ 130
Figure 4.1 DSC thermograms of FF crystallised from melt containing (A) 1% w/w, (B) 5%
w/w, (C) 10% w/w and (D) 20% w/w talc………………………………………………136
Figure 4.2 Optical images of crystalline FF-containing 1% talc that was obtained from the
melt-cooling process: (A) crystallisation initiated by mechanical shock resulting in a
mixture of forms I and IIa with form I being the dominatant form and (B) non-disruptive
spontaneous crystallisation of form III in the presence of talc. ...................................... 137
Figure 4.3 SEM images of (A and B) talc powders, (C and D) FF powder polymorph I as
received and (E and F) form III crystallized in presence of 1% talc. .............................. 137
xiii
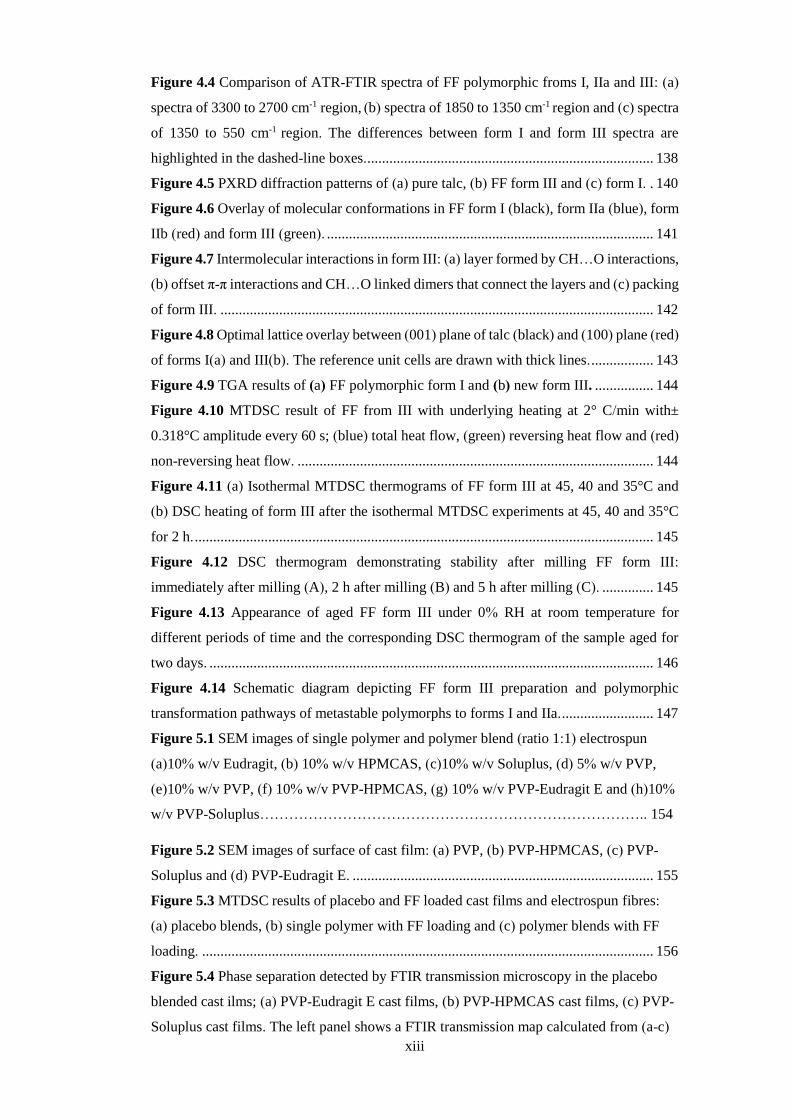
Figure 4.4 Comparison of ATR-FTIR spectra of FF polymorphic froms I, IIa and III: (a)
spectra of 3300 to 2700 cm-1 region, (b) spectra of 1850 to 1350 cm-1 region and (c) spectra
of 1350 to 550 cm-1 region. The differences between form I and form III spectra are
highlighted in the dashed-line boxes. .............................................................................. 138
Figure 4.5 PXRD diffraction patterns of (a) pure talc, (b) FF form III and (c) form I. . 140
Figure 4.6 Overlay of molecular conformations in FF form I (black), form IIa (blue), form
IIb (red) and form III (green). ......................................................................................... 141
Figure 4.7 Intermolecular interactions in form III: (a) layer formed by CH…O interactions,
(b) offset π-π interactions and CH…O linked dimers that connect the layers and (c) packing
of form III. ...................................................................................................................... 142
Figure 4.8 Optimal lattice overlay between (001) plane of talc (black) and (100) plane (red)
of forms I(a) and III(b). The reference unit cells are drawn with thick lines. ................. 143
Figure 4.9 TGA results of (a) FF polymorphic form I and (b) new form III. ................ 144
Figure 4.10 MTDSC result of FF from III with underlying heating at 2° C/min with±
0.318°C amplitude every 60 s; (blue) total heat flow, (green) reversing heat flow and (red)
non-reversing heat flow. ................................................................................................. 144
Figure 4.11 (a) Isothermal MTDSC thermograms of FF form III at 45, 40 and 35°C and
(b) DSC heating of form III after the isothermal MTDSC experiments at 45, 40 and 35°C
for 2 h. ............................................................................................................................. 145
Figure 4.12 DSC thermogram demonstrating stability after milling FF form III:
immediately after milling (A), 2 h after milling (B) and 5 h after milling (C). .............. 145
Figure 4.13 Appearance of aged FF form III under 0% RH at room temperature for
different periods of time and the corresponding DSC thermogram of the sample aged for
two days. ......................................................................................................................... 146
Figure 4.14 Schematic diagram depicting FF form III preparation and polymorphic
transformation pathways of metastable polymorphs to forms I and IIa. ......................... 147
Figure 5.1 SEM images of single polymer and polymer blend (ratio 1:1) electrospun
(a)10% w/v Eudragit, (b) 10% w/v HPMCAS, (c)10% w/v Soluplus, (d) 5% w/v PVP,
(e)10% w/v PVP, (f) 10% w/v PVP-HPMCAS, (g) 10% w/v PVP-Eudragit E and (h)10%
w/v PVP-Soluplus…………………………………………………………………….. 154
Figure 5.2 SEM images of surface of cast film: (a) PVP, (b) PVP-HPMCAS, (c) PVP-
Soluplus and (d) PVP-Eudragit E. .................................................................................. 155
Figure 5.3 MTDSC results of placebo and FF loaded cast films and electrospun fibres:
(a) placebo blends, (b) single polymer with FF loading and (c) polymer blends with FF
loading. ........................................................................................................................... 156
Figure 5.4 Phase separation detected by FTIR transmission microscopy in the placebo
blended cast ilms; (a) PVP-Eudragit E cast films, (b) PVP-HPMCAS cast films, (c) PVP-
Soluplus cast films. The left panel shows a FTIR transmission map calculated from (a-c)

xiv
in which the ratio of the integral peak area of the methyl stretching/OH stretching. The
righ panel demonstrates a visible image of the area of the map and the bottom panel is the
representative FTIR spectra that was used to construct the FTIR mapping .................... 158
Figure 5.5 ATR-FTIR of raw materials and cast films of FF-polymer: (a) PVP, (b) FF-
PVP, (c) HPMCAS, (d) FF-HPMCAS, (e) Eudragit, (f) FF-Eudragit, (g) Soluplus, (h) FF-
Soluplus and (i) amorphous FF. ...................................................................................... 159
Figure 5.6 Differences between Tgs as predicted by GT equation and experimental
observation. ..................................................................................................................... 160
Figure 5.7 Polymer blended cast films with FF loading: (a) FF-PVP-HPMCAS, (b) FF-
PVP-Eudragit E and (c) FF-PVP-Soluplus cast films. The FF PVP-HPMCAS films show
different transparent and opaque areas. The opaque area has crystallised FF on the surface
of the cast films, whereas the FF-PVP-Eudragit E and FF-PVP-Soluplus cast films
demonstrate transparent areas. ........................................................................................ 162
Figure 5.8 SEM images of freshly prepared placebo and drug-loaded electrospun fibres
as well as freshly prepared placebo and FF loaded cast films ........................................ 164
Figure 5.9 Phase separation detected by FTIR transmission microscopy in FF loaded cast
films (a) FF-PVP cast films, (b) FF-PVP-Eudragit E cast films, (c) FF-PVP-HPMCAS
cast films and (d) FF-PVP-Soluplus cast films. The left panel shows a FTIR transmission
map calculated from the integral of the =CH-H stretching at 3070 and 3054 cm-1 are the
characteristic peaks of FF form I. The righ panel demonstrates a visible image of the area
of the map and the bottom panel is the representative FTIR spectra that was used to
construct the FTIR mapping. .......................................................................................... 166
Figure 5.10 ATR-FTIR spectra of FF-PVP, FF-PVP HPMCAS, FF-PVP-Eudragit E and
FF-PVP Soluplus cast films for both top and bottom sides of the films. ........................ 167
Figure 5.11 ATR-FTIR spectra of FF loaded polymer blend fibrous film: (a) FF-PVP, (b)
FF-PVP-Soluplus, (c) FF-PVP-Eudragit, (d) FF-PVP-HPMCAS and (e) amorphous FF.
These spectra demonstrate that the FF in the polymer blended fibrous mats is in the
amorphous state because of the absence of the FF crystalline marker peaks at 3070 and
3054 cm-1. ....................................................................................................................... 167
Figure 5.12 In vitro drug release profiles of FF loaded PVP single phase, polymer blend
fibres with different PVP:Eudragit, HPMCAS or Soluplus ratios at 1:1 and FF form I
powder in pH 1.2 media with 0.5%w/v SLS. .................................................................. 168
Figure 5.13 Physical stability monitoring by MTDSC of FF loaded electrospun fibres
stored at 0%RH for six months: (a) FF-PVP, (b) FF-PVP-Eudragit E, (c) FF-PVP-
HPMCAS and (d) FF-PVP-Soluplus. ............................................................................. 169
Figure 5.14 Sorption isotherms of FF and PCM loaded and placebo electrospun fibres of
blends and single polymers: (a) PVP, (b) PVP-HPMCAS, (c) PVP-Eudragit E and (d)
PVP-Soluplus. ................................................................................................................. 170
xv
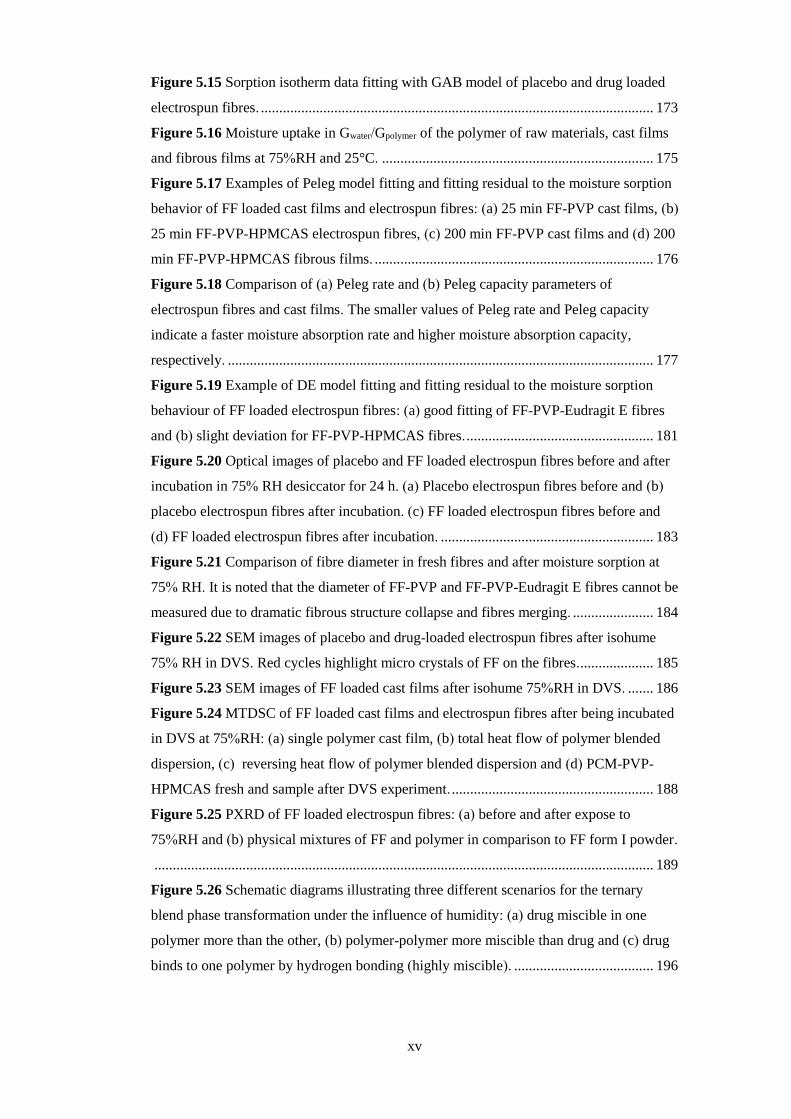
Figure 5.15 Sorption isotherm data fitting with GAB model of placebo and drug loaded
electrospun fibres. ........................................................................................................... 173
Figure 5.16 Moisture uptake in Gwater/Gpolymer of the polymer of raw materials, cast films
and fibrous films at 75%RH and 25°C. .......................................................................... 175
Figure 5.17 Examples of Peleg model fitting and fitting residual to the moisture sorption
behavior of FF loaded cast films and electrospun fibres: (a) 25 min FF-PVP cast films, (b)
25 min FF-PVP-HPMCAS electrospun fibres, (c) 200 min FF-PVP cast films and (d) 200
min FF-PVP-HPMCAS fibrous films. ............................................................................ 176
Figure 5.18 Comparison of (a) Peleg rate and (b) Peleg capacity parameters of
electrospun fibres and cast films. The smaller values of Peleg rate and Peleg capacity
indicate a faster moisture absorption rate and higher moisture absorption capacity,
respectively. .................................................................................................................... 177
Figure 5.19 Example of DE model fitting and fitting residual to the moisture sorption
behaviour of FF loaded electrospun fibres: (a) good fitting of FF-PVP-Eudragit E fibres
and (b) slight deviation for FF-PVP-HPMCAS fibres. ................................................... 181
Figure 5.20 Optical images of placebo and FF loaded electrospun fibres before and after
incubation in 75% RH desiccator for 24 h. (a) Placebo electrospun fibres before and (b)
placebo electrospun fibres after incubation. (c) FF loaded electrospun fibres before and
(d) FF loaded electrospun fibres after incubation. .......................................................... 183
Figure 5.21 Comparison of fibre diameter in fresh fibres and after moisture sorption at
75% RH. It is noted that the diameter of FF-PVP and FF-PVP-Eudragit E fibres cannot be
measured due to dramatic fibrous structure collapse and fibres merging. ...................... 184
Figure 5.22 SEM images of placebo and drug-loaded electrospun fibres after isohume
75% RH in DVS. Red cycles highlight micro crystals of FF on the fibres. .................... 185
Figure 5.23 SEM images of FF loaded cast films after isohume 75%RH in DVS. ....... 186
Figure 5.24 MTDSC of FF loaded cast films and electrospun fibres after being incubated
in DVS at 75%RH: (a) single polymer cast film, (b) total heat flow of polymer blended
dispersion, (c) reversing heat flow of polymer blended dispersion and (d) PCM-PVP-
HPMCAS fresh and sample after DVS experiment. ....................................................... 188
Figure 5.25 PXRD of FF loaded electrospun fibres: (a) before and after expose to
75%RH and (b) physical mixtures of FF and polymer in comparison to FF form I powder.
........................................................................................................................................ 189
Figure 5.26 Schematic diagrams illustrating three different scenarios for the ternary
blend phase transformation under the influence of humidity: (a) drug miscible in one
polymer more than the other, (b) polymer-polymer more miscible than drug and (c) drug
binds to one polymer by hydrogen bonding (highly miscible). ...................................... 196
xvi
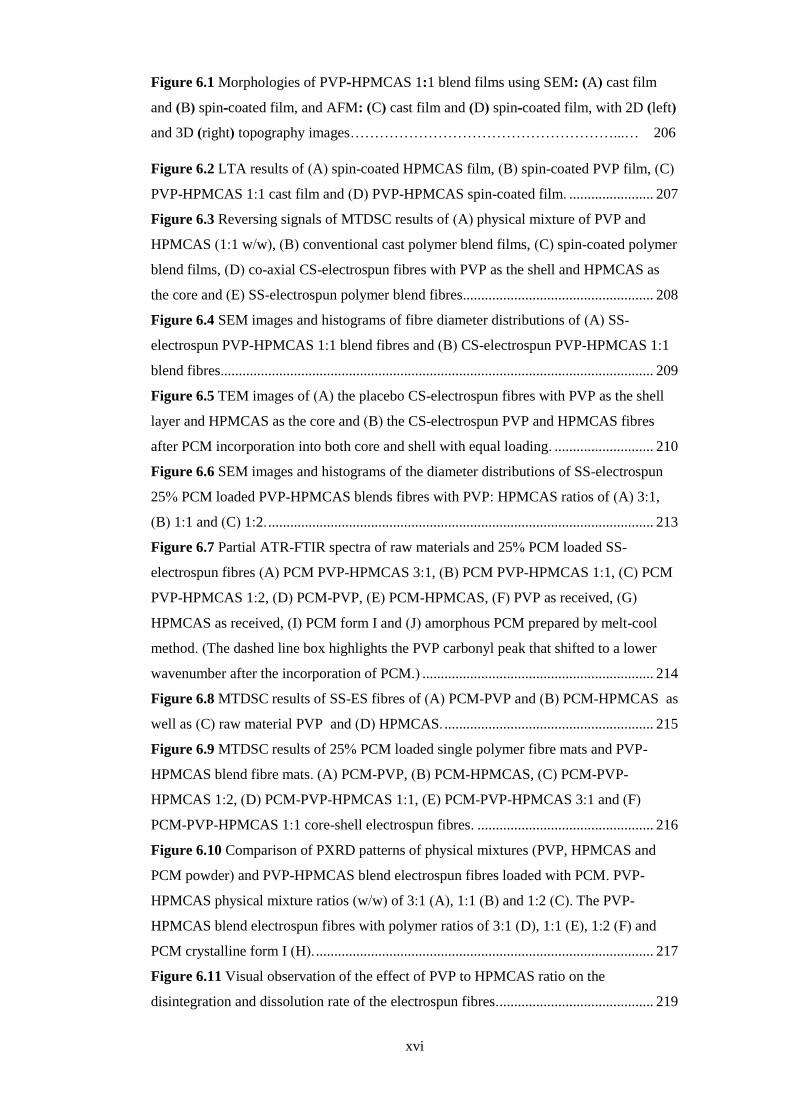
Figure 6.1 Morphologies of PVP-HPMCAS 1:1 blend films using SEM: (A) cast film
and (B) spin-coated film, and AFM: (C) cast film and (D) spin-coated film, with 2D (left)
and 3D (right) topography images………………………………………………...… 206
Figure 6.2 LTA results of (A) spin-coated HPMCAS film, (B) spin-coated PVP film, (C)
PVP-HPMCAS 1:1 cast film and (D) PVP-HPMCAS spin-coated film. ....................... 207
Figure 6.3 Reversing signals of MTDSC results of (A) physical mixture of PVP and
HPMCAS (1:1 w/w), (B) conventional cast polymer blend films, (C) spin-coated polymer
blend films, (D) co-axial CS-electrospun fibres with PVP as the shell and HPMCAS as
the core and (E) SS-electrospun polymer blend fibres.................................................... 208
Figure 6.4 SEM images and histograms of fibre diameter distributions of (A) SS-
electrospun PVP-HPMCAS 1:1 blend fibres and (B) CS-electrospun PVP-HPMCAS 1:1
blend fibres...................................................................................................................... 209
Figure 6.5 TEM images of (A) the placebo CS-electrospun fibres with PVP as the shell
layer and HPMCAS as the core and (B) the CS-electrospun PVP and HPMCAS fibres
after PCM incorporation into both core and shell with equal loading. ........................... 210
Figure 6.6 SEM images and histograms of the diameter distributions of SS-electrospun
25% PCM loaded PVP-HPMCAS blends fibres with PVP: HPMCAS ratios of (A) 3:1,
(B) 1:1 and (C) 1:2. ......................................................................................................... 213
Figure 6.7 Partial ATR-FTIR spectra of raw materials and 25% PCM loaded SS-
electrospun fibres (A) PCM PVP-HPMCAS 3:1, (B) PCM PVP-HPMCAS 1:1, (C) PCM
PVP-HPMCAS 1:2, (D) PCM-PVP, (E) PCM-HPMCAS, (F) PVP as received, (G)
HPMCAS as received, (I) PCM form I and (J) amorphous PCM prepared by melt-cool
method. (The dashed line box highlights the PVP carbonyl peak that shifted to a lower
wavenumber after the incorporation of PCM.) ............................................................... 214
Figure 6.8 MTDSC results of SS-ES fibres of (A) PCM-PVP and (B) PCM-HPMCAS as
well as (C) raw material PVP and (D) HPMCAS. ......................................................... 215
Figure 6.9 MTDSC results of 25% PCM loaded single polymer fibre mats and PVP-
HPMCAS blend fibre mats. (A) PCM-PVP, (B) PCM-HPMCAS, (C) PCM-PVP-
HPMCAS 1:2, (D) PCM-PVP-HPMCAS 1:1, (E) PCM-PVP-HPMCAS 3:1 and (F)
PCM-PVP-HPMCAS 1:1 core-shell electrospun fibres. ................................................ 216
Figure 6.10 Comparison of PXRD patterns of physical mixtures (PVP, HPMCAS and
PCM powder) and PVP-HPMCAS blend electrospun fibres loaded with PCM. PVP-
HPMCAS physical mixture ratios (w/w) of 3:1 (A), 1:1 (B) and 1:2 (C). The PVP-
HPMCAS blend electrospun fibres with polymer ratios of 3:1 (D), 1:1 (E), 1:2 (F) and
PCM crystalline form I (H). ............................................................................................ 217
Figure 6.11 Visual observation of the effect of PVP to HPMCAS ratio on the
disintegration and dissolution rate of the electrospun fibres. .......................................... 219

xvii
Figure 6.12 Visual observation of shrinkage of SS-electrospun PVP-HPMCAS fibre mats
after immersion into pH 1.2 dissolution media for 3 min. .............................................. 220
Figure 6.13 Partial ATR-FTIR spectra of wetted PCM loaded PVP-HPMCAS fibre mats
with translucent coating and opaque centre as illustrated in the image insert: A and C are
spectra taken from translucent areas of the formulations with PVP-HPMCAS 1:1 and 1:2,
respectively, and B and D are their corresponding opaque central areas. Dashed boxes
highlight signature peaks of PVP and HPMCAS at 1660 and 1072 cm-1, respectively. . 220
Figure 6.14 Partial ATR-FTIR spectra of PCM loaded PVP-HPMCAS blended fibre
mats with polymer ratios of (A) 1:1 and (B) 1:2 when sampled at different time intervals
during dissolution experiments. Dashed boxes represent signature peaks of PVP, PCM
and HPMCAS at 1660, 1512 and 1072cm-1, respectively. .............................................. 221
Figure 6.15 In vitro drug release profiles of PCM loaded PVP single phase, polymer
blend fibres with different PVP: HPMCAS ratios and coaxial electrospun fibre. .......... 222
Figure 7. 1 Summary of polymorphic conversions between different polymorphs of
FF................................................................................................................................... 231
Figure 7. 2 (A) Uneven drug distribution in phase separated FF-PVP-Soluplus and FF-
PVP-Eudragit E solid dispersions that results in a stabilisation of the amorphous drug at
75% RH. (B) Nanophase separation in PCM-PVP-HPMCAS fibres that transforms into a
macroscopic phase separation when they are wetted. This phase separation resulted in a
modified release of the drug so that the immediate release is from the PVP-rich phase
while the HPMCAS-rich phase provides a sustained release. ........................................ 233
xviii
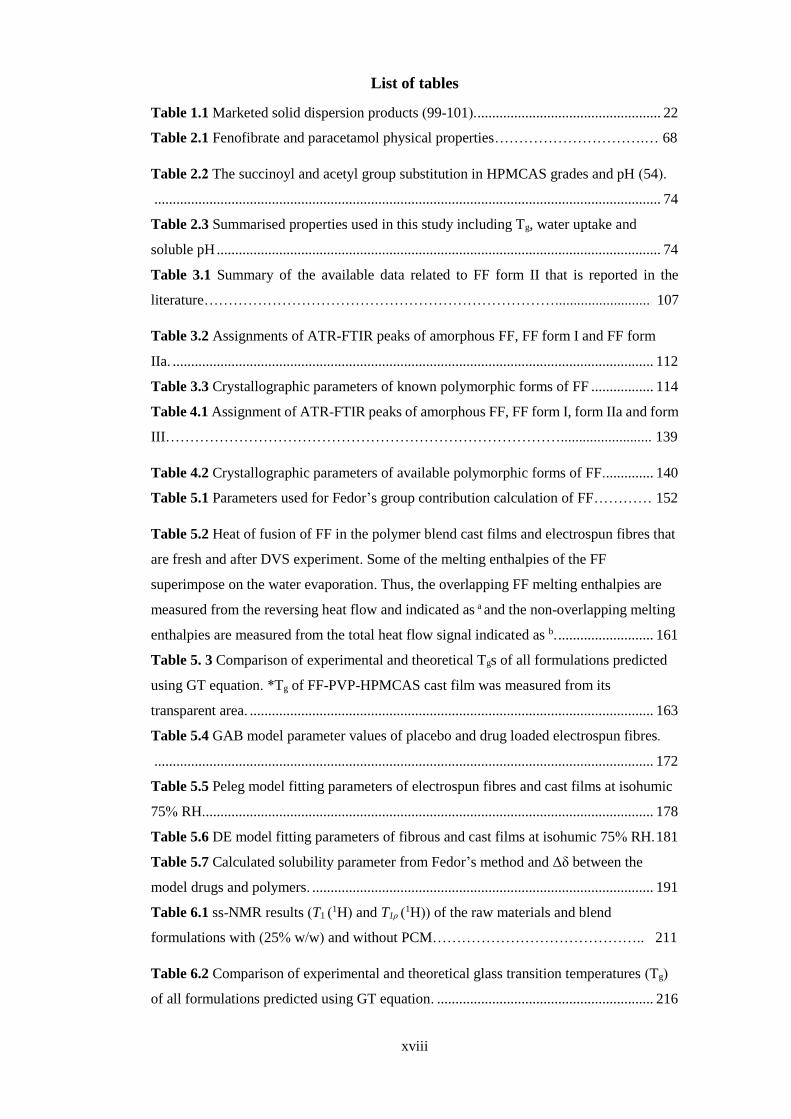
List of tables
Table 1.1 Marketed solid dispersion products (99-101). .................................................. 22
Table 2.1 Fenofibrate and paracetamol physical properties………………………….… 68
Table 2.2 The succinoyl and acetyl group substitution in HPMCAS grades and pH (54).
.......................................................................................................................................... 74
Table 2.3 Summarised properties used in this study including Tg, water uptake and
soluble pH ......................................................................................................................... 74
Table 3.1 Summary of the available data related to FF form II that is reported in the
literature……………………………………………………………….......................... 107
Table 3.2 Assignments of ATR-FTIR peaks of amorphous FF, FF form I and FF form
IIa. ................................................................................................................................... 112
Table 3.3 Crystallographic parameters of known polymorphic forms of FF ................. 114
Table 4.1 Assignment of ATR-FTIR peaks of amorphous FF, FF form I, form IIa and form
III………………………………………………………………………......................... 139
Table 4.2 Crystallographic parameters of available polymorphic forms of FF. ............. 140
Table 5.1 Parameters used for Fedor’s group contribution calculation of FF………… 152
Table 5.2 Heat of fusion of FF in the polymer blend cast films and electrospun fibres that
are fresh and after DVS experiment. Some of the melting enthalpies of the FF
superimpose on the water evaporation. Thus, the overlapping FF melting enthalpies are
measured from the reversing heat flow and indicated as a and the non-overlapping melting
enthalpies are measured from the total heat flow signal indicated as b. .......................... 161
Table 5. 3 Comparison of experimental and theoretical Tgs of all formulations predicted
using GT equation. *Tg of FF-PVP-HPMCAS cast film was measured from its
transparent area. .............................................................................................................. 163
Table 5.4 GAB model parameter values of placebo and drug loaded electrospun fibres.
........................................................................................................................................ 172
Table 5.5 Peleg model fitting parameters of electrospun fibres and cast films at isohumic
75% RH. .......................................................................................................................... 178
Table 5.6 DE model fitting parameters of fibrous and cast films at isohumic 75% RH. 181
Table 5.7 Calculated solubility parameter from Fedor’s method and Δδ between the
model drugs and polymers. ............................................................................................. 191
Table 6.1 ss-NMR results (T1 (1H) and T1ρ (1H)) of the raw materials and blend
formulations with (25% w/w) and without PCM…………………………………….. 211
Table 6.2 Comparison of experimental and theoretical glass transition temperatures (Tg)
of all formulations predicted using GT equation. ........................................................... 216

xix
Table 6.3 Kinetic parameters obtained from fitting 60 min dissolution experimental data
of PCM loaded nanofibers to power law and first order biphasic model. ....................... 224

xx
Abbreviations
AFM Atomic force microscopy
API Active pharmaceutical ingredient
ATR-FTIR Attenuated Total reflectance fourier transform infrared
Cp Heat capacity
DE Double exponential
DSC Differential scanning calorimetry
DVS Dynamic vapour sorption
ES Electrospinning
FF Fenofibrate
FDM Fusion deposit model
GAB Guggenheim-Anderson-de Boer
GT Gordon-Taylor
HPMCAS Hymomellose acetate succinate
IM Injection moulding
OTS Open top surface
PCM Paracetamol
PVP Polyvinyl pyrrolidone
PXRD Powder X-ray diffraction
MTDSC Modulated temperature differential scanning calorimetry
Mw Molecular weight
SEM Scanning electron microscopy
ss-NMR Solid state nuclear magnetic resonance
TEM Transition electron microscopy
Tg Glass transition temperature

1
1. Chapter 1 Introduction
1.1 Background
Crystallisation is a transformation process from a liquid phase to an organised solid state
structure (1). The liquid phase can be a supersaturated solution or supercooled liquid from
melts which has high enthalpy and specific volume. Hence, it is thermodynamically
favourable for a phase transition into a crystalline state when the temperature is lower than
the melting point in supercooled liquid, and the concentration is greater than solubility in
the supersaturated solution, which is more stable and has a lower energy state (1).
Crystallisation begins with an aggregation of several molecules (nuclei) that act as seeds
for the subsequent step of regular molecular assemble into crystalline structures. The
supersaturated or supercooled liquid can crystallise into more than one possible crystalline
structure (1-3), so called polymorphism. Therefore, controlling crystallisation into the
desired polymorph is extremely important for the pharmaceutical industry. This can be used
as a means to increase the aqueous solubility of poorly water-soluble compounds including
active pharmaceutical ingredients (API) (3, 4). There are several factors that directly affect
the resulting polymorphs of the crystallising substances. These include the interfaces of the
crystallising substances, temperatures and foreign additives (5-8). However, up to now, the
precise control of the crystallisation of certain polymorphs has remained a challenging task
for the pharmaceutical industry, as there seems to be no universal rule that can be applied
and each API needs to be investigated on a case by case basis.
Fenofibrate (FF) was chosen to be the main model drug in this project. Its amorphous form
shows high driving forces to crystallise under the whole range of temperatures (9).
However, amorphous FF is difficult to crystallise spontaneously because it has a high
nucleation barrier (9, 10). Thus, it displays highly unstable and unpredictable crystallisation
behaviour. Polymorphs of FF have been reported, but the knowledge of how to manipulate
its crystallisation into a particular polymorph has not been fully established (11). In
addition, FF is a biopharmaceutical classification system (BCS) class II drug that has high
permeability and low solubility. The limited aqueous solubility of FF is another problem
that needs to be addressed. This project probed both aspects of this API. The crystallisation
control of amorphous FF was studied first.
Solid dispersion is one of the effective strategies that significantly improves the
bioavailability of poorly water-soluble drugs. This concept was introduced more than half
a century ago by Chiou and Riegelman (12). The APIs can exist in the solid dispersion
matrices in crystalline form, amorphous suspension or molecular dispersions. The
molecular dispersions have been reported to provide a better effectiveness for enhancing
the aqueous solubility of the poorly water-soluble APIs in comparison to the crystalline

2
solid dispersion (13, 14). However, many of the commonly used molecular dispersion
carriers are hygroscopic, which is favourable to uptake moisture. Thus, this potentially
causes phase separation of the APIs during storage and eventually recrystallization. An
attempt to use solid dispersion to increase the aqueous solubility issue of FF was then
investigated in the second half of the project (15, 16).
Solid dispersions containing a polymer blend is a potential method that can efficiently
increase the stability of amorphous drugs (17, 18). Blending hydrophilic and hydrophobic
polymers can enhance the stability of the formulations by reducing the moisture uptake
(18). Additionally, polymer blends have been used to formulate the modified release
formulations used in drug delivery. The drug release rate from the solid dispersion matrices
can be tailored by altering the proportion of water soluble and water insoluble polymers
(19-21). These studies focused more on the applications of polymer blends, but a few had
an emphasis on understanding the ternary blends of polymers and API because the ternary
components of the polymer blends in the solid dispersion is a complex system. Hence, this
project aims to gain a better understanding of polymer blended solid dispersions.
This project used electrospinning as the main stream preparation method for the solid
dispersions. Electrospinning is a novel approach that renders polymer matrices into nano
to micro sized fibrous structured (22-24). The small fibrous matrices of electrospun fibres
offer benefits by increasing the surface area to volume ratio that results in enhancing the
solubility of poorly water-soluble APIs with an ultrafast drug release (25-27). Therefore,
electrospinning has the potential to be a platform for a solid dispersion containing polymer
blended to stabilise the APIs in their amorphous state.
1.2 Amorphous materials
Amorphous is an isotropic non-crystalline solid state in which the structure has no order,
including translational, orientational, conformational at any significant length scale (28,
29). However, amorphous APIs demonstrate complex structures caused by local anisotropy
(28). This local anisotropy induces a short range order at the local scale. The distance of
the short range order is within the nearest neighbour or the next nearest neighbour, which
is usually less than 20-25 Å (28). The pairwise distribution function of amorphous
piroxicam, which is obtained from the cryomilling of its crystalline form I, demonstrated
its near neighbour interactions that correspond to the atom-atom distance of approximately
4.9-12.3 Å (30). Hence, the amorphous APIs show short-range order at the local scale
because of the local anisotropic effect, but for the overall macroscopic picture, they are
isotropic. The structure of amorphous materials is illustrated in Figure 1.1a.
A perfect crystal ideally represents a solid state that is organised and regular. The Figure
1.1b describe an appearance on the disorder in solid state due to the increase in

3
configuration entropy which refers to the thermodynamic disorder. An increase of the
disorder in the solid state transform the crystal to meso-phase and eventually amorphous
state which has no order its the structure. The degree of disorder increases (projected by a
dashed arrow Figure 1.1b) as a result of losing the long-range order of the crystal. The
kinetic disorder can be studied using powder X-ray diffraction. Crowley and Sheth
demonstrated that grinding caused the crystal diffraction peaks of indomethacin and
piroxicam to broaden (30, 31). Continual grinding leads to a broad baseline with no
diffracted peak (halo pattern). The broadening of the diffracted peak reflects the increase
of disorder in the solid state until it develops the highest disorder, which leads to an
amorphous state. Additionally, thermal analysis can be used as a means to discriminate
between crystalline and amorphous materials (28, 32). A solid state with a combination of
order parameters (crystalline and meso-phase state) will exhibit a melting transition. An
amorphous material will present a glass transition, which indicates no long-range order
(Figure 1.1b).
Figure 1.1 Structure of amorphous materials (a) and schematic diagram illustrating
thermodynamic disorder and kinetic disorder of solid state (b). This figure is adapted from
reference (28).
Figure 1.2 illustrates a schematic plot of the enthalpy or a specific volume of a solid
compound as a function of temperature. The enthalpy or specific volume of a crystalline
material demonstrate a small change upon heating because the molecules are packed in a
lattice structure (32). After the temperature reaches its melting point, the molecules detach
from the crystalline structure and transform into a liquid state that results in increased
enthalpy and specific volume of the molecules. On cooling, the enthalpy and volume of the
liquid follow the equilibrium of the supercooledliquid. However, a further cooling leads to
the slope of the enthalpy and the specific volume deviating to the non-equilibrium state.
The viscosity of the supercooled liquid significantly increases to 1012 from 10-3 Pa.s (32).
Thermodynamic disorder
Kin
eti
c d
iso
rde
r(X
-ray
dif
fra
ctio
n p
ea
k b
oa
rde
nin
g)
Perfect Crystal
Amorphous
Long-ranged order
Short-ranged order
No distinguishable difference in X-ray diffraction
Observed Melting transition
Observed Glass transition
Meso-phase
Medium-ranged order
a b

4
The temperature where the slope changes is defined as the glass transition temperature (Tg),
which is a characteristic property of amorphous materials. The enthalpy and specific
volume of the amorphous state are greater than a supercool liquid because it is in the non-
equilibrium state. Therefore, the amorphous state inherents a high energy level and
molecular motion (29, 32).
From the pharmaceutical perspective, the greater the enthalpy and specific volume of an
amorphous state in comparison to the crystalline complement, demonstrates a potential
benefit for enhancing the solubility and bioavailability of APIs (29, 32-34). Kim et al.
reported that when amorphous atorvastatin was prepared from spray-drying and
supercritical antisolvent there was a significant improvement in its aqueous solubility (34).
The crystalline atorvastatin showed a saturated aqueous solubility at 140 µg.ml-1, while the
maximum saturated solubility of its amorphous form was approximatly 460 µg.ml-1.
Hancock and Parks reported an increase in the aqueous solubility of amorphous
indomethacin over its crystalline α and γ polymorphs by approximately 2.8-4.5 fold (33).
The short-range order in the amorphous structure, which require less energy to break down,
and its high internal energy level are the factors that enhance the aqueous solubility of the
amorphous materials (35).
However, the high internal energy can also lead to spontaneous conversion to the crystalline
state. Wu et al. reported a crystallisation of amorphous indomethacin at a temperature
below its Tg (36). Additionally, a similar observation for amorphous nifedipine showed that
it was crystallised at its Tg, as reported by Zhu et al. (37). Moreover, a solvent-mediated
conversion also occurs in amorphous atorvastatin and indomethacin during their
dissolution (33, 34). Consequently, the drugs’ aqueous solubility decreased. Hence, the
amorphous state can potentially increase the aqueous solubility of APIs, but it also contains
a risk of recrystallization to its thermodynamic stable crystalline state.

5
Figure 1.2 Diagram illustrating the changing enthalpy or volume according to temperature
in different material states.This figure was adapted from reference (32).
The amorphous materials can be obtained various ways. Some materials naturally exist in
an amorphous state, such as pharmaceutical polymers including PVP, hypromellose
(HPMC) and ethyl cellulose. This is due to their long chain structure that is oriented
randomly and entangled with each other (38). Moreover, crystalline materials can be
transformed into an amorphous state after being processed by milling, rapid precipitation
by anti-solvent addition, solvent evaporation and melt-cooling (5, 30, 31, 34, 36, 37, 39).
Melt-cooling is the most well studied and effective approach to prepare an amorphous form
from its crystal (36, 37, 40). However, it has not been applied to heat unstable compounds.
Additionally, the multicomponent formulations of API and polymer can result in the
amorphous state of the drug (12). This method is known as a solid dispersion, which will
be discussed in detail in section 1.4.
1.3 Crystalline materials
Solid state materials that have a regular atomic/molecular arrangement with long range
ordered are defined as crystals. Crystalline materials have a lower enthalpy and specific
volume in comparison to the amorphous state, which implies that they are more
thermodynamically stable (29, 32). Frequently, the same compound may exhibit more than
one possible crystalline structure (2, 3). This phenomenon is called polymorphism, which
will be discussed in detail in section 1.3.4. The differences in the structure arrangements
usually affect the physicochemical properties of the materials, such as melting point,
solubility, density, compressibility, bioavailability stability and reflective index (2, 3).
Enth
alpy
or
Volu
me
Temperature
TmTg
Liquid state
Non-equilibrium state

6
Figure 1.3 illustrates the molecular arrangements of crystals with polymorphs in
comparison to the amorphous form.
Figure 1.3 Molecular arrangement of materials with different solid states: the uniform
molecular arrangement with long range order in crystalline materials (a) and (b), which
are polymorph, and the irregular short range ordered of amorphous materials (c).
1.3.1 Crystallisation
Crystallisation is defined as a phase transformation from a non-crystal state, either liquid
phase or amorphous state, to its corresponding crystalline solid phase (1, 2). This process
involves both thermodynamics and kinetics. Crystallisation is composed of two essential
steps, which are a nucleation step followed by crystal growth. The nucleation step is a
thermodynamic process. Clusters or nuclei are formed as a result of changes in the Gibb’s
free energy at the molecular level (∆G), which contributes to the sum of the surface free
energy (∆Gs) change and volume free energy change (∆Gv), and the relationship is given in
equation 1.1 (41). Nucleation occurs when the size molecular aggregation surpasses the
critical radius, which is known as the nucleation barrier (1).
∆𝐺 = ∆𝐺𝑣 + ∆𝐺𝑠………………………………..(1.1)
Crystal growth is the subsequent step after nucleation. This step involves the kinetics of
molecular diffusion to the site of nucleation, and the molecules integrate into uniform
structures (1, 41).
1.3.2 Nucleation
Nucleation is a transition process in which the supersaturation liquid begins to form a new
phase in the solid state. It can be categorised into primary nucleation and secondary
nucleation (1). The nucleation that spontaneously occurs in the mother phase is defined as
the primary nucleation, and this can be further sub-categoried into homogeneous and
heterogeneous nucleation. In homogeneous nucleation, clusters appear randomly
a cb

7
throughout the whole sample, while heterogeneous nucleation occurs at preferential sites,
for example, at the boundaries, surface, walls of containers, edges and impurities.
Heterogeneous nucleation is more likely to occur than homogeneous nucleation because
the surface energy at the preferential sites is low. Thus, this enhances the nucleation
process. The secondary nucleation refers to a crystal of the solute that is used as a seed for
the nucleation.
1.3.2.1 Primary nucleation
1.3.2.1.1 Homogeneous nucleation
The spontaneous appearance of a new phase in homogeneous matrices is referred to
homogeneous nucleation. The homogeneous nucleation is a spontaneous molecular
aggregation that involves the intermolecular bonding of the compound (1). Nucleation
occurs when molecular aggregation surpasses the critical radius. After this point, the Gibb’s
free energy of the nucleation decreases with increase nucleus size until it reaches a negative
value then nucleation proceeds. Consequently, the nucleation takes place as a new phase
(solid phase) in the non-crystalline phase. The classical nucleation theory (CNT) is
described using equation 1.2 (41, 42).
∆𝐺 = −4
3𝜋𝑟3∆𝐺𝑣 + 4𝜋𝑟2𝛾𝑆𝐿…………………… (1.2)
where ∆G is the overall Gibb’s free energy of the nucleation process and r is the radius of
the nuclei. CNT assumes that the nuclei are in a spherical shape, which substitutes as the
term 4/3πr3. ∆Gv is a change in the volume free energy. These are demonstrated in the first
term on the right-hand side of equation 1.2. The second term on the right side presents the
interfacial energy between the solid and liquid phases (ΔGs) where γSL is the interfacial
tension per unit area of the liquid phase. The Gibb’s free energy reaches its maximum value
(ΔGcrit) when r is equal to the critical radius (rc). This is called the nucleation barrier. The
ΔGcrit can be expressed in equation 1.3.
∆𝐺crit =16𝜋𝛾3𝑣2
3(𝑘𝑇𝑙𝑛𝑆)2 ………………………………(1.3)
In which v is the frequency of the molecular transportation at the solid-liquid interface, γ is
the interfacial tension per unit area, k is the Boltzmann's constant (J.K-1), T is the absolute
temperature of nucleation and S represents the degree of supersaturation. Clusters that have
a radius smaller than rc dissolve rather than continue to grow as crystals because they
minimise their free energy level (1). Therefore, the ΔGcrit is the minimum free energy level
required for the nucleation step, which is given in equation 1.3. If the cluster radius
exceeds the rc, the Gibb’s free energy continuously decreases until it goes below zero

8
(Figure 1. 4). After this point, nucleation occurs spontaneously since the Gibb’s free energy
of the system is negative.
Figure 1. 4 Free energy diagram of homogeneous nucleation describing the existence of a
critical nucleation barrier. Figure adapted from reference (43).
The nucleation rate (J) is the number of nuclei that form in the supersaturation phase per
unit time in a specific volume. According to CNT theory, the factors, such as interfacial
energy, mobility, thermodynamic driving force and molecular recognition, can influence J
(1, 44). The rate of nucleation in the homogeneous nucleation can be described as:
𝐽 = 𝐴 𝑒𝑥𝑝 [16𝜋𝛾3𝑣2
3𝑘3𝑇3(ln 𝑆)2] ………………….………………..(1.4)
where A is a frequency factor, γ is the interfacial tension, v is the frequency of molecular
transportation at the solid-liquid interface, k is the Boltzmann constant, T is the absolute
temperature of nucleation and S is the degree of supersaturation. In terms of the melt-
supercooling, a similar expression of J in the homogeneous nucleation can be applied.
However, the sharp increase in the viscosity upon the supercooling stage and nuclei not
being a spherical shape leads to the unique characteristics of the nucleation of the melt (1,
45). A modified viscosity term is added to the equation by Turnbull and Fisher (45).
𝐽 = 𝐴 𝑒𝑥𝑝 [16𝜋𝛾3
3𝑘𝑇𝑚∆𝐻𝑓2𝑇𝑟(∆𝑇𝑟)2 +
∆𝐺′
𝐾𝑇] ……………………..(1.5)
where ΔG’ is the activation energy of the molecular motion required for nucleation, γ is
the interfacial energy between the crystalline drug and the melt, ΔHf is the heat of fusion,
T is the absolute temperature of the nucleation process, Tm is the melting temperature of
the drug in Kevin, Tr is the reduced temperature obtained from T/Tm and ΔTr is 1-Tr.

9
1.3.2.1.2 Heterogeneous nucleation
In fact, homogeneous nucleation is rarely happened. It only occurs in small volume
containers that are less than 100 µL and under a carefully controlled environment (3, 46).
A larger volume of a solution frequently contains foreign bodies, i.e., atmospheric dust,
which can potentially act as active hetero-nuclei to induce the crystallisation process (1).
Therefore, most nucleation occurs via heterogeneous nucleation. The Gibb’s free energy of
heterogeneous nucleation (ΔGhetero) is a proportion of the Gibb’s free energy of the
homogeneous nucleation (ΔGhomo) to the factor S(θ), as described in equation 1.6.
∆𝐺ℎ𝑒𝑡𝑒𝑟𝑜 = ∆𝐺ℎ𝑜𝑚𝑜 . 𝑆(𝜃) …………………………..(1.6)
Heterogeneous nucleation always occurs at preferential sites, such as the wall of a
container, phase boundaries and impurity sites. The effect of the interfacial tension at these
sites plays an important role in the nucleation process. The contact angle of the foreign
phase and the solid surface is defined as θ, which corresponds to a wetting of the solid-
liquid interface (1). The relationship of the contact angle (θ) to the interfacial tension is
described in equation 1.7.
Figure 1.5 Interfacial tension at the boundary of the solid surface, foreign deposit and
liquid phase. This figure is adapted from reference (1).
𝑐𝑜𝑠𝜃 =𝛾𝑆𝐿−𝛾𝐹𝑆
𝛾𝐹𝐿…………………………………….(1.7)
where γSL is the interfacial tension of the solid-liquid phase, γFL is the interfacial tension of
the foreign deposit-solid phase and γFL is the interfacial tension of the foreign deposit-liquid
phase. The relationship between cosθ and S(θ) can be explained using equation 1.8 (47).
𝑆(𝜃) = (2+cos 𝜃).(1−cos 𝜃)2
4……………………………(1.8)
θ
Liquid (L)
Solid surface (S)
Foreign deposit (F)
γFL
γFS γSL

10
This equation suggests that if the contact angle (θ) is 180°, then S(θ) is equal to 1. When θ
is less than 180°, the factor S(θ) will be between 0 and 1. This indicates that the nucleation
process is favorable in a presence of a heterogeneous phase in the supercooled liquid
because it requires less overall Gibb’s free energy than the homogeneous nucleation
process (1).
The heterogeneous nucleation demonstrates several advantages over the homogeneous
nucleation. It is a standard approach to crystallising organic and inorganic compounds (7,
48-53), since the heterogeneous nucleation shows a better process control than the
homogeneous nucleation. Particularly, heterogeneous nucleation using impurity additives
is an efficient and controllable process. Consequently, it is one of the approaches that is
used to crystallise materials at the industrial scale (2). In addition, another advantage of
heterogeneous nucleation when using impurity additives is that it can control the
crystallisation into a particular polymorphic form (7, 8, 50, 51). Chadwick et al.
successfully used the heterogeneous approach via the addition of an impurity to induce a
supersaturation solution of PCM to crystallise to a particular polymorph (7). They used 4-
aminophenylacetic acid, which has a similar crystalline unit cell to the PCM form II, to
induce the supersaturate solution of PCM to crystallise into its form II. The authors also
showed that by using different impurities, such as L-histidine, graphite and D-mannitol,
which had no structural relations, resulted in the stable paracetamol form I (7). Therefore,
the structure of the additive strongly influences the polymorph it induces.
Lang et al. and Price et al. demonstrated the use of heterogeneous nucleation polymeric
additives to control the crystallisations of APIs (8, 51). The supersaturated solutions of
PCM, 5-methyl-2-[(2-nitrophenyl)amino]-3-thiophenecarbonitrile (ROY), carbamazepine
and sulfamethoxazole crystallised into their specific polymorphs in the presence of
particular polymers. For example, adding 2-ethoxyethyl methacrylate (EMMA) into a PCM
supersaturated solution resulted in the PCM polymorph II crystallisation. While the use of
methyl acrylic acid (MAA) and N-methacryloylmorpholine (MAM) showed high
selectivity to the monoclinic form I of PCM (8). Price and colleagues suggested that the
functional group of a monomer unit in the polymer chain is the primary driving force to
stabilise a given crystal nucleus. Subsequently, it results in the controlled production of a
particular polymorph (8).
However, there is no universal rule that can be applied to the impurity additives to control
the crystallisation into a specific polymorph. The experiments in this area have been mostly
based on trial and error (7, 51). One additive may show a polymorphic control effect in one
substance, but applying the same additive to another compound may not result in the same
effect. Therefore, the selective polymorph crystallisation phenomenon is explained by the
interface interaction and intermolecular interaction between the impurity and compound

11
molecules that favour the crystallisation into a specific polymorph (7, 8). This effect needs
to be considered case by case.
1.3.2.2 Secondary nucleation
The term “secondary nucleation” is defined as nucleation that occurs in the presence of a
solute crystal (seed) in its supersaturation solution. The seeds serve as a trigger to form a
new solid phase in the liquid phase (1). Secondary nucleation is broadly used in the
industrial scale production of crystalline organic and inorganic materials, such as KCl,
MgSO4 and α-glucose (54-56). The seeding technique offers advantages of a narrow crystal
size distribution when there is not much secondary nucleation and the easy initiation of
difficult crystallisations (57). The seeds are deliberatly added into the supersaturation
solution, which is continuously agitated. The seeds spread through the reactor and induce
crystallisation from the supersaturated solution. The active seeds were reported to be
between 200-500 µm. The seeds that were smaller than 100 µm did not produce secondary
nucleation (1). Moreover, the seeds act as a template for the crystal to grow into the specific
polymorph (57).
1.3.3 Crystal Growth
Crystal growth is the step after nucleation. The molecules regularly arrange themselves into
a solid crystalline structure that has a lower free energy in comparison to a supersaturated
liquid (1, 41). Crystal growth is composed of two main processes, which are a diffusion
step and a surface crystal integration step. Theories of crystal growth and crystal growth
kinetic will be discussed in this section.
1.3.3.1 Crystal growth theories
The concept of the solute molecules adsorbed on the crystal surface in a layer by layer
manner was introduced by Volmer in 1939 (1, 47). Volmer’s adsorption layer theory
suggested that there is a mobile self-adsorbed layer on the crystal surface that has a
thickness of approximately 1 nm but does not exceed 10 nm (1, 58). The crystallising
substances arrive at the surface of the crystal and integrate to the kink of the crystalline
surface. Once the whole surface is complete, the next layer of the crystal initiates from a
monolayer island (two-dimensional nucleation). The two-dimensional nucleation occurs in
a similar manner to the homogeneous nucleation, but it requires only half the energy to
form in comparison to an ordinary homogeneous nucleation (1). Later, Kossel proposed
another model of crystal growth by layers with regards to Volmer’s theory. The flat crystal
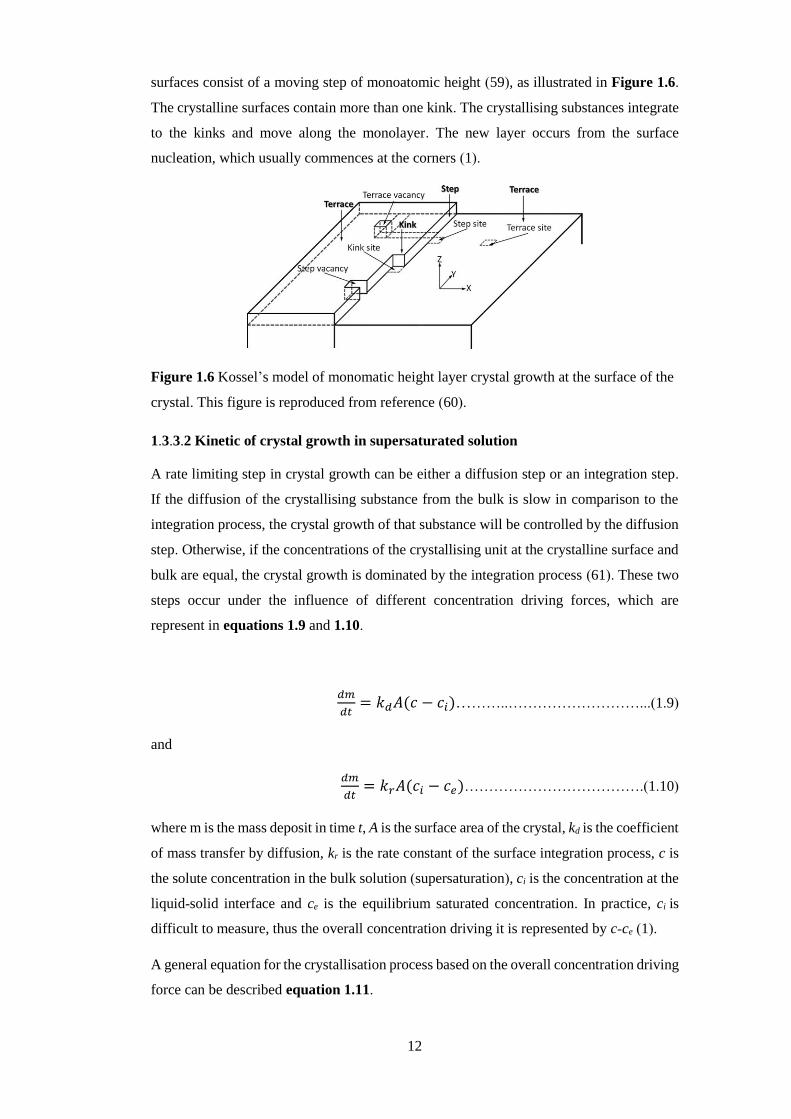
12
surfaces consist of a moving step of monoatomic height (59), as illustrated in Figure 1.6.
The crystalline surfaces contain more than one kink. The crystallising substances integrate
to the kinks and move along the monolayer. The new layer occurs from the surface
nucleation, which usually commences at the corners (1).
Figure 1.6 Kossel’s model of monomatic height layer crystal growth at the surface of the
crystal. This figure is reproduced from reference (60).
1.3.3.2 Kinetic of crystal growth in supersaturated solution
A rate limiting step in crystal growth can be either a diffusion step or an integration step.
If the diffusion of the crystallising substance from the bulk is slow in comparison to the
integration process, the crystal growth of that substance will be controlled by the diffusion
step. Otherwise, if the concentrations of the crystallising unit at the crystalline surface and
bulk are equal, the crystal growth is dominated by the integration process (61). These two
steps occur under the influence of different concentration driving forces, which are
represent in equations 1.9 and 1.10.
𝑑𝑚
𝑑𝑡= 𝑘𝑑𝐴(𝑐 − 𝑐𝑖)………..………………………...(1.9)
and
𝑑𝑚
𝑑𝑡= 𝑘𝑟𝐴(𝑐𝑖 − 𝑐𝑒)……………………………….(1.10)
where m is the mass deposit in time t, A is the surface area of the crystal, kd is the coefficient
of mass transfer by diffusion, kr is the rate constant of the surface integration process, c is
the solute concentration in the bulk solution (supersaturation), ci is the concentration at the
liquid-solid interface and ce is the equilibrium saturated concentration. In practice, ci is
difficult to measure, thus the overall concentration driving it is represented by c-ce (1).
A general equation for the crystallisation process based on the overall concentration driving
force can be described equation 1.11.

13
𝑑𝑚
𝑑𝑡= 𝐾𝐺𝐴(𝑐 − 𝑐𝑒 )𝑔…………………………………(1.11)
𝐾𝐺 =𝑘𝑑𝑘𝑟
𝑘𝑑+𝑘𝑟……………………………………(1.12)
where, KG is the overall crystal coefficient, A is the surface area of the crystal and g is the
order of the crystal growth process (54). KG is obtained from the equation 1.12. The large
kr results in the rapid surface crystal integration. Thus, KG is approximate to kd, when the
crystallisation is controlled by the diffusion step. In contrast, a huge kd implies low
diffusion resistance (KG≈kr), hence, the crystallisation is controlled by the surface
integration (1).
1.3.3.3 Kinetics of crystal growth from melts
The previous crystal growth kinetic section applied to the crystal growth in a supersaturated
solution. The crystal grow rate from melts is influenced by the heat flow from the crystal
surface to the bulk liquid instead of the concentration gradient (1). The crystallisation
process from melts always follows the liberation of the heat of crystallisation. Thus, the
surface of the crystal has a slightly higher temperature than the bulk supercooled liquid
(62). The heat flow in the melts can be described by equation 1.13.
𝑑𝑞
𝑑𝑡= ℎ𝐴(𝑇𝑖 − 𝑇)……………………………………(1.13)
where dq/dt is the heat flow, h is the film coefficient of the heat transfer, which is the
thermal conductivity of the substance as a function of film thickness, A is the area of the
growing solid surface, T is the temperature of the supercooled liquid and Ti is the
temperature at the liquid-solid interface. It is noted that Ti and Tm is a similar value. The
driving force of the heat transfer across the stagnant film close to the crystal surface is Ti-
T. As seen from equation 1.13. The heat flow equation is similar to the mass transfer by
diffusion in equation 1.11. Therefore, the crystal growth rate of the melts can be explained
by equation 1.14.
𝑑𝑚
𝑑𝑡= 𝐾′𝐺𝐴(𝑇𝑚 − 𝑇)𝑔′……………………………….(1.14)
where m is the mass deposit in time t, A is the surface area of the crystal, K’G is the overall
crystal coefficient of the melts, Tm is the melting temperature of the substance and g’ is the
exponent, which has a value in the range of 1.5 to 2.5 (1). The overall driving force of the
crystal growth is the degree of the supercooling that is equal to Tm-T.

14
1.3.4 Polymorphism
Polymorphism in material sciences is defined as the ability of the same atoms or molecules
to exist in more than one distinct crystalline structure. The differences in the crystalline
structure arrangement affect their physical and chemical properties, i.e., melting point,
compressibility and solubility (2-4). In the cases of solvates and hydrates, the organic
solvent or water molecule alters the original crystalline structure of the organic compound.
This is called a “pseudopolymorph” because it contains two types of molecules.
The polymorphisms are divided into two sub-types, which are conformational polymorph
and packing polymorph. The conformation polymorph is the existence of the different
conformers of the same molecule (2). The difference in molecular conformation leads to a
new crystalline structure. Ritonavir is an example of a conformational polymorph. Two
polymorphs of ritonavir exhibited “cis” and “trans” conformation around the carbamate
linkage resulting in two different crystal structures. These two polymorphs demonstrate
markedly different solubility properties (63). In the packing polymorph, the molecules
illustrate an identical conformation, but they have a different molecular arrangement. This
results in a different crystalline structure. The cause of the different crystalline structure is
due to the way that the molecules interact with each other. PCM is an example of a packing
polymorph (64, 65).
The polymorphism phenomenon is common and widely observed in APIs. Approximately
90% of commercial APIs exhibit polymorphism (3). Thus, careful attention is required to
select the right polymorphic form for the formulation. Metastable polymorphs have higher
free energy, which can be used to enhance the aqueous solubility of the lipophilic drug
(35). For example, the metastable polymorphs of phenobarbital, spironolactone and
carbamazepine demonstrate better aqueous solubility in comparison to their stable
polymorph (66-68). However, using the metastable polymorph of APIs carries a risk of
polymorphic transformation to their stable polymorphs upon storage or during dissolution
(67, 69, 70). The metastable anhydrous carbamazepine showed in situ transformation by
converting to dihydrate after being suspended in an aqueous medium for one hour.
However, this transformation was inhibited by adding PEG or HPMC into the formulation
(67). The in situ conversion is a potential problem that can impede the use of metastable
polymorphs for pharmaceutical commercial products. Therefore, the thermodynamically
stable polymorph is commonly used as an API in dosage forms.

15
1.3.4.1 Monotropism and enantropism
Polymorphic conversion of polymorphs is an important issue that needs to be fully
understood. A new API polymorph that has a bioavailability remarkablly lower than that
of the original form can have serious effects on the therapeutic levels of the dosage form
(71). The polymorphic system can be categorised into two classes, which are monotropism
and enantiotropism.
Monotropism is a system that presents only one stable polymorph at any temperature and
pressure. A metastable polymorphic form will convert to the more stable form on ageing
or at an elevated temperature (2, 3). Figure 1.7a shows an energy-temperature diagram of
a monotropic polymorph of polymorph 1 and 2. The Gibb’s free energy of polymorph 1 is
lower than that of polymorph 2 in the whole range of the temperatures until the melting
point of polymorph 1. This is an indication that polymorph 1 is the stable polymorph while
polymorph 2 is the metastable polymorph. The intercept of the stable and metastable
polymorphs can be obtained from an extrapolated value (virtual transition point) beyond
the melting point of the stable polymorph. Examples of APIs that demonstrate a monotropic
relationship among their polymorphs are ritonavir (63), PCM (72), itraconazole (73), FF
and sulfanilamide (74).
On the other hand, enantiotropism is a system in which each polymorph shows its stable
domain at a different range of temperatures at a given pressure. One polymorphic form
interconverts to another polymorph when it passes a transition temperature (2, 3). As seen
from the energy-temperature diagram in Figure 1.7b, before the transition temperature,
polymorph 1 has a lower Gibb’s free energy than polymorph 2. However, after the
transition temperature, the Gibb’s free energy of polymorph 2 becomes lower than
polymorph 1. This reflects that polymorph 2 is the stable polymorph after the Gibb’s free
energy of polymorph 2 is lower than that of polymorph 1. There are some APIs that have
enantiotropism, for instance, norfloxacin (75), sulfathiazole (76), cisplatin (77) and
benfluorex hydrochloride (78).

16
Figure 1.7 Diagram of energy vs. temperature of monotropic (a) and enantiotropic (b)
polymorphs (79).
There are some rules that aid the understanding, characterisation and classification of a
polymorphic system. This allows for a distinction between the monotropic and
enantiotropic systems. The most frequently used prediction rules were proposed by Burger
and Ramberger to classify the relationship between two polymorphs (80): they are the heat
of transition rule, the heat of fusion rule, density rule and infrared rule (80).
The heat of transition rule states that if an endothermal transition is observed at
a temperature, it may be assumed that the transition temperature is below that point.
Hence, the two polymorphs are enantiotropic (80). On the contrary, if an
exothermal transition is observed at a temperature, it is assumed that there is no
transition point below that point, or the transition temperature is higher than the
exothermal event. Otherwise, the two polymorphs are monotropic (80). The heat
of transition rule has been applied to a broad range of compounds and demonstrates
an extremely precise prediction (99% accuracy). Barbas et al. showed evidence of
a small endothermic event for a solid-solid transition that occurred at 196°C, which
was before the melting enthalpies of norfloxacin at 211 and 220°C for the A and B
forms, respectively (75). Therefore, this transition demonstrates an enantiotropic
behaviour of norfloxacin.
The heat of transition is often difficult to observe by DSC (80). Thus, the difference
between the heat of fusion for the two polymorphs can be used to clarify the heat
of transition rule. The heat of fusion rule states that “if the high melting point
polymorph demonstrates the smaller heat of fusion. The two form are usually
enantiotropic. Conversely, if the high melting point polymorph shows the higher
heat of fusion. The two form are monotropic ” (80). An exception applies to this
rule when the melting point between the two polymorphs is greater than 30K or
ab
17
the enthalpy of the two polymorphs is significantly diverse (2). This rule
demonstrates essentially the highly accurate predictability (81). The enantiotropic
behaviours of carbamazepine forms III (175°C) and I (189°C) were determined
using the heat of fusion rule. Behme and Brooke reported the melting enthalpies of
carbamazepine to be 29.3 and 26.4 J/mol for forms III and I, respectively (82). The
authors concluded that forms III and I of carbamazepine were enantiotropic.
The density rule is based on the packing principle of non-hydrogen bonding
compounds. The most thermodynamically stable polymorph demonstrates a higher
density than the less stable polymorph. This is due to a stronger van der Waals
interaction in the stable polymorph. This rule shows high precision and accuracy
in a polymorph pair that has a density difference greater than 2% (81). The
substances that show polymorphic density differences less than 1% may due to
experimental error or hydrogen bonds may be present in the structure (3, 81). An
exception is noted when the hydrogen bond dominates the crystal packing. It
results in large voids in the crystalline structure with a resulting low density (2).
The metastable form II of PCM shows a higher density than the stable form I.
Nelyubina et al. explained that the PCM form II demonstrates a greater number of
weak non-specific interactions (C-H…O, C-H..π and H..H contact), which
provides a high density to the polymorph II (83).
The infrared rule can be applied to the polymorphs that involve hydrogen bonds
in their crystalline structure. The rule states that if the first absorption band in the
infrared spectrum of a hydrogen-bonded molecular crystal is higher for one
modification than for the other, that form may be assumed to have a larger entropy.
Therefore, the polymorph that absorbs infrared at a higher frequency is less stable
at 0 K (80). This rule is based on the principle of a strong hydrogen bonding being
associated with a decrease in the entropy and an increase in the frequencies mode.
The strength of the hydrogen bond corresponds to the intramolecular OH and NH
bonds. Thus, the infrared frequencies decrease in relation to the strength of the
hydrogen bonds (2, 80). Burger and Ramberger noted that a compound that
contains a CO-NH group, i.e., PCM, does not follow this rule. Moynihan and co-
workers reported the N-H stretching of monoclinic (form I) and orthorhombic
(form II) at 3326 and 3324 cm-1 (84). There were no significant differences between
these polymorphs. Therefore, PCM is an exception to the infrared rule. Otherwise,
it shows 90% accuracy for the polymorph type prediction (81), for example,
sulfamoxole, sulfamethoxypyridine, theophylline and tolbutamide (81).

18
The monotropic system behaves in a similar way to the amorphous state as the metastable
crystalline polymorphs eventually convert the stable polymorph over the whole range of
the temperature. While for the enantiotropic system, each polymorph has its own stability
temperature region. Thus, controlling the temperature may aid the stability of the desired
polymorphic forms. In practice, monotropism and enantiotropism are intrinsic properties
that can be anticipated but cannot be altered (3).
The metastable crystalline polymorphs and the amorphous state are both thermodynamic
unstable and demonstrate different physical properties than the stable crystalline state. The
conversion to the lower energy state for these substances is inevitable. To utilise the
metastable crystalline polymorphs and amorphous state, the stabilization of these two
metastable states is required (4, 67). The amorphous state intrinsically has higher free
energies than the metastable crystalline polymorph (9, 29). Consequently, it has a better
efficiency for improving the solubility than the metastable polymorphs. In addition, a vast
body of literature has been devoted to understanding and establishing an approach to
stabilise the amorphous state (29, 32). Thus, there is a better understanding of the stabilising
methods in relation to the metastable crystalline polymorphs (4). Solid dispersion is one of
the most popular approaches to stabilise drugs in their amorphous form (12, 13, 85). The
details of solid dispersion will be discussed in detail the section 1.4.
1.3.5 Factors affecting crystallisation
There are several factors that influence the thermodynamic and kinetic aspects of
crystallisation. These factors are the temperature, interface of supercooled liquid and
impurity additives.
Temperature
Temperature is an important factor that involves both thermodynamic and kinetic aspects
of crystallisation. The thermodynamic aspects of nucleation are influenced by
temperatures, as seen in the relationship in equations 1.4 and 1.5. A suitable temperature
leads to the maximum nucleation rate, which is in between Tg and Tm (44). On the other
hand, the temperature also affects the kinetic aspect of crystal growth (1). As seen in
equations 1.13 and 1.14, it is a driving force for crystal growth from the melts. The high
supercooling degree (T-Tm) leads to a fast crystallisation (10).
In addition, different polymorphs can be obtained from the supercooled liquid that
crystallises at different temperature ranges. Gunn et al. reported that the nifedipine α form
only crystallised above 120°C. It was noted that even the amorphous nifedipine, which
contained crystals of the α form, was cooled to a temperature under 110°C. It crystallised

19
as a β form or X form (37). In another study, Tao and co-workers used different polymorphs
of mannitol crystals, including α, β and δ, as seeds in the amorphous mannitol. The authors
observed that the amorphous mannitol crystallised in the β form above 160°C. While only
the α-form of mannitol was observed at crystallisation below 140°C. The polymorph that
crystallised in the amorphous mannitol was irrespective of the initial seeds (5). Therefore,
it is a temperature-dependent switching polymorph effect.
Interfaces of supercooled liquid
The interface during the crystallisation of a supercooled liquid plays an important role for
the crystal growth kinetics and polymorphs. The open top surface (OTS) is the interface of
the supercooled liquid that is in contact with the air and humidity. The thin layer of
molecules on the OTS demonstrates a faster mobility in comparison to the bulk (5, 36). As
a consequence, the OTS enhances the crystal growth. Zhu et al. reported β nifedipine
growth at the surface was an order of magnitude faster than in the bulk (between two
coverslips) (37). In another study from the same group, Wu et al. observed that the
amorphous indomethacin between coverslips had no crystallisation over six months. The
partial crystallisation of indomethacin between sandwiched coverslips demonstrated a very
slow crystal growth rate at 15µm per month. While the OTS indomethacin was covered
with indomethacin crystals within 12 hours (36). It is noted that the stable indomethacin γ
form was the only polymorph that grew on the surface of the amorphous indomethacin.
On the other hand, the other interface of the supercooled liquid, which is in contact with
the substrate, can influence the polymorph of the sample. This phenomenon is call
substrate-induced phase (86). It is caused where the surface of the substrate influences the
molecular orientation of the supersaturated liquid. Silicon substrates have been reported for
stabilising metastable polymorphs of PCM and phenytoin (6, 87, 88). Yeager et al. reported
the dip coating of the silicon substrates in PCM yielded the PCM in form II on the substrate.
The PCM form II was stable on the substrate for several months without a transformation
to the stable form I (87). Ehmann et al. obtained the metastable PCM form III on a silicon
wafer substrate that was prepared from a spin coating method followed by a rapid heat
treatment after the sample preparation (88). Reischl et al. prepared a new polymorph of the
anticonvulsant drug, phenytoin, by a drop casting on glass substrates. The new phenytoin
polymorph showed a better solubility than the original crystalline powder (6).
Impurity additives
Impurity additives demonstrate various effects on the crystallisation process. The effect of
impurity induced heterogeneous nucleation and the control of the polymorph of the crystals
were discussed earlier. Another aspect of impurity additives that contradicts the previous

20
application is an inhibition of the crystallisation. One to three percent of polymer additives
in amorphous APIs can inhibit their crystallisation (44, 89-92). Trasi et al. studied the effect
of different polymers, including polyvinyl pyrrolidone (PVP), hypromellose acetate
succinate (HPMCAS), Eudragit E and polyacrylic acid (PAA), on the nucleation and crystal
growth of amorphous PCM (44). The authors observed that PVP and PAA were effective
PCM crystal growth inhibitors while HPMCAS and Eudragit E demonstrated poor crystal
growth inhibition. PVP and PAA demonstrate hydrogen bonds with the PCM. Thus, the
hydrogen bonding between the drug and polymer is a key factor that inhibited the PCM
crystal growth (44, 90). HPMCAS was an excellent PCM nucleation inhibitor (44). The
authors suggested that the largest monomer size of HPMCAS among those polymers used
in their study resulted in the inhibition of the PCM nucleation. Additionally, Konno et al.
used PVP and HPMCAS to inhibit the crystallisation of amorphous felodipine (89). These
polymers equally decreased the nucleation rate of felodipine. The authors speculated that
the polymer additive increases the kinetic of the nucleation barrier of felodipine (89).
Therefore, the polymer additive demonstrated a strong crystalline inhibition in the
amorphous APIs through impeding the nucleation and crystal growth. Adding one to three
percent of polymer can be a potential way to stabilise the amorphous API without changing
the thermodynamic driving force of the crystallisation process (40).
1.3.6 Crystallisation behaviour of organic compounds
Baird and co-workers performed a study on the crystallisation behaviour of 51 organic
compounds (93). They categorised the compounds into three groups based on the absence
or presence of crystallisation in the heat/cool/reheat cycle of DSC experiments. Class I
compounds exhibited a partial or complete crystallisation in the cooling cycle. Examples
of class I compounds are caffeine, carbamazepine, indoprofen and theophylline. The
crystallisation class II molecules occurred upon the reheat cycle. PCM, celecoxib,
droperidol and flurbiprofen demonstrated crystallisation during the reheat program. Thus,
they were assigned to be the class II compounds. The class III compounds did not show
any evidence of drug recrystallization during the cooling or reheating programs in the DSC
experiments, even when using a slow heat-cooling rate (1°C.min-1), such as ritonavir,
itraconazole, ketoconazole, loratadine and FF.
The APIs are small organic molecules in which the crystallisation tendency is related to the
intermolecular interaction that is potentially provided by their functional groups (29). If the
molecules demonstrate hydrogen donors and acceptors in their molecular structure, they
are capable of establishing an inter-molecular hydrogen bond. For example, the monoclinic
and orthombic PCM crystal structures are formed through the intermolecular hydrogen

21
bonding between the drug molecules (64, 65). These bonds are NH..O and OH..O. This
strong molecular interaction results in the amorphous PCM requiring a small amount of
mobility to crystallise spontaneously (9). In contrast, some molecules have only hydrogen
acceptors, i.e., a carbonyl group, in their structure. These molecules lack strong inter-
molecular bonds. Consequently, they can at most form a dipole-dipole, van der Waals
forces or weak hydrogen bond between the carbonyl group and the acidic C-H group (94).
FF, the model compound used in this project, is a good example of the molecules in this
aspect because its structure contains only a carbonyl group. The crystalline packing of FF
occurs through the intermolecular weak hydrogen bond of CH…O (95). The amorphous
FF exhibits a high molecular mobility and high enthalpic driving force over the entire
temperature range. However, Baird et al. and Amstad et al. observed that the supercooled
FF did not spontaneously crystallise (10, 93). This is because it has high configurational
entropy that implies a low probability of the molecules properly orienting for the initiation
of nucleation (9). Therefore, nucleation was a rate limiting step of FF crystallisation that is
the likely causes for the weak interactions of the drug molecules (10). In addition, Amstad
et al. reported that the crystal growth of FF had a diffusion-limit that was influenced by the
temperature (10). However, the controlled crystallisation of FF into its specific polymorphs
is still poorly understand.
To fill this knowledge gap, the use of heterogeneous nucleation can be a potential way to
control the crystallisation of amorphous FF. Controlling factors that affects crystallisation
including the temperature, OTS of the sample and type of impurity, which may shed light
on possible means to control amorphous FF crystallisation or even dictate it to crystallise
into a specific polymorph.
1.4 Solid dispersions
Solid dispersions were first introduced by Sekiguchi and Obi in 1961 (12, 96). Solid
dispersions refer to solid matrices that consist of at least two components: a drug and an
inert carrier. The carriers of the solid dispersion can be either crystalline or amorphous
materials where the drug can be molecular dispersion, amorphous clusters or micro drug
crystals embedded in the matrices (12). The solid dispersions offer advantages related to
particle size reduction, enhanced wettability and the drug in the amorphous state (35).
Amorphous drugs have high internal energy and favour dissolution. As one of the many
examples, Jung and co-workers prepared a solid dispersion of the poorly water soluble drug
itraconazole with Eudragit E and AEA® (97). The authors observed a 141-146 fold aqueous
solubility increase in comparison to the crystalline itraconazole. Another poorly water
soluble drug, felodipine, was prepared as solid dispersions with PVP, HPMC and

22
poloxamer. The dissolution rates of the felodipine solid dispersions with these polymers
were remarkable improved in a range between 60-80 fold in comparison to its crystals (98).
Since, the solid dispersions demonstrate many promising results in enhancing the
bioavailability of poorly water-soluble drugs (12-14, 99), the solid dispersion technology
has been applied in the pharmaceutical industry and some solid dispersion products have
been commercialised (99-101). Table 1.1 summarises a list of the marketed solid
dispersion products.
Table 1.1 Marketed solid dispersion products (99-101).
Trade name Carrier Manufacturing
method
Company
Gris-PEG® (Griseofulvin) PEG Melt process Novartis
Sporanox® (Itraconazole) HPMC Spray layering Janseen
Cesamet® (Nabilone) Povidone Unknown Meda pharm
Kaletra® (Lopinavir and
Ritonavir)
PVP-VA Melt-extrusion Abbott
Isoptin® SRE-240
(Verapamil)
HPMC/HPC Melt-extrusion Soliqs
Nivadil®(Nivaldipine) HPMC Unknown Astellas
LCP-Tacro® (Tracolimus) HPMC Melt-extrusion Life-cycle
Pharma
Intelence® (Etravirine) HPMC Spray drying Tibotec
Certican® (Everolimus) HPMC Spray drying Novartis
Afeditab® (Nifedipine PEG and
Poloxamer
Melt/absorb on
carrier
Elan Corp.
Fenoglide® (Fenofibrate) PEG and
Poloxamer
Melt process Santarus
Ozudurex®
(Dexamethasone)
PLGA Melt-extrusion Allergan
Rezulin®(Troglitazone) HPMC Unknown Pfizer
Zelboraf®(Vermurafenib) HPMCAS Unknown Genentech
Incivek®(Telaprevir) HPMCAS Unknown Vertex
Pharmaceuticals
Crestor®(Rosuvastatin) HPMC Unknown Astrazeneca
Prograf®(Tacrolimus) HPMC Unknown Astellas

23
1.4.1 Classification of solid dispersions
Solid dispersions can be broadly classified into two classes according to the physical state
of the APIs, which are non-molecular solid dispersion and molecular solid dispersion (solid
solution) (13). The non-molecular solid dispersions demonstrate two separate phases of
either amorphous or crystalline drugs and carriers, whereas the molecular solid dispersions
show a single phase of drugs and carriers. The following section will discuss the structures
and definitions of each solid dispersion class along with their advantages and
disadvantages.
1.4.1.1 Non-molecular solid dispersion
1.4.1.1.1 Eutectic mixtures
A eutectic mixture is formed after two components are mixed in the proper ratio at a
suitable temperature as illustrated in Figure 1.8. The compounds A and B are in a miscible
liquid phase at the eutectic ratio while other ratios demonstrate phase separation of either
solid A with liquid B or solid B with liquid A. The eutectic mixture is formed by the loose
molecular interaction of the binary components, which do not include a chemical bond
formation (12). As the temperature continuously decreases at the eutectic proportion, both
the A and B components rapidly crystallise together.
An application of eutectic mixtures is to form solid dispersion matrices of crystalline drug
and water-soluble crystalline polymer. The practically water-insoluble FF was reported to
form a eutectic mixture PEG 8000 at a ratio of 25:75 (drug:polymer) (102). The authors
estimated that a few micron-sized crystalline FF particles were entrapped in the PEG 8000
matrices, and this was a result of a significant increase in the dissolution of the drug.
Additionally, FF also formed a eutectic mixture with acetylsalicylic acid at the ratio of
0.958:0.042 (drug: acetylsalicylic acid). FF solubility increased three-fold compared to the
untreated FF (103). Yong and co-workers reported that a eutectic mixture of poorly aqueous
ibuprofen and menthol was successfully formed at a ratio of 4:6 for the drug and menthol
(104). Ibuprofen’s aqueous solubility was significantly increased by 2.5 fold in the eutectic
mixture proportion. These examples of eutectic mixtures show a promising means of
improving the water solubility of poorly water-soluble APIs. The increase in the drug
dissolution can be explained by the Noyes-Whitney equation (equation 1.15).
𝑑𝑚
𝑑𝑡= 𝐷𝐴 (
𝐶𝑠−𝐶
ℎ) ………………..……………...(1.15)
where dm/dt is a rate of drug dissolution in the medium per unit of time, D is the diffusion
coefficient, A is the surface area, Cs is the saturated concentration in the medium, C is the

24
bulk concentration solution and h is the thickness of the diffusion layer. Thus, the reduction
in the drug particle size from forming a eutectic mixture results in an increase in the surface
area (A). As a consequence, the rate at which the drug dissolves in the media increases.
A eutectic mixture for a solid dispersion is more physically stable than an amorphous solid
dispersion because both the drug and carrier are in the crystalline state (105). Moreover,
the preparation of the eutectic mixture solid dispersions is simple by physically mixing the
two components and heating them. The eutectic mixture solid dispersion increased the
wettability and particle size reduction of the APIs (12). However, the eutectic mixture solid
dispersions are inferior when improving the aqueous solubility of poorly water soluble
drugs in comparison to the molecular dispersion. As the drugs are in crystalline states,
which still requires energy to dissolve (13), the eutectic mixture is not a method of choice
for preparing a solid dispersion.
Figure 1.8 Phase diagram of a eutectic mixture of compounds A and B.
1.4.1.1.2 Solid dispersions containing crystalline drug
A solid dispersion containing a crystalline drug is a binary system in which the crystalline
API is dispersed in an amorphous carrier. It shows the advantages of improving the
wettability of the crystalline drug and minimising the aggregation of the drug crystals (12,
106). Brettmann et al. prepared a solid dispersion crystalline albendazole suspended in PVP
matrices via free surface electrospinning (106). This formulation improved the wettability
and reduced the crystalline albendazole aggregation resulting in the dissolution
enhancement in comparison to the crystalline drug powder. Kawabata et al. demonstrated
that the crystalline solid dispersions of tranilast in HPMC improved the physicochemical
properties and solubility of the drug (107). The solid dispersion containing the crystalline
tranilast formulation significantly improved the dissolution of the drug, in which the drug
release reached 97% within 10 minutes. Whereas the crystalline drug dissolved only 10%
over 60 minutes. Moreover, the solid dispersion containing crystalline tranilast
Temperature
Composition
100% A 100% B
Solid A+B
Solid A + liquid
Solid B + liquid
liquid
Eutectic point
25
demonstrated a better photostability when expose to UV in comparison to its amorphous
formulation. This is because the crystalline drug is more chemically stable than its
amorphous state (107). However, the crystalline drugs still require some energy to break
down their crystals before dissolving. There are solid dispersions containing crystalline
drugs that are less efficient when improving the solubility in comparison to the system in
which API exists at their molecular level or amorphous state.
1.4.1.2 Molecular dispersions (solid solutions)
Molecular dispersions refer to a one-phase system in which the API and carrier
homogeneously mix at the molecular level or near molecular level as the amorphous state
(108). It provides superior advantages in comparison to the non-molecular solid dispersion
class. A molecular dispersion is more efficient when improving the solubility of the APIs
because it maximises the surface area of the formulations, since the API molecules are
reduced to the absolute size at the molecular level or in the amorphous state (13). Thus, no
further energy is required to break down the API crystalline structure before it dissolves.
The drug dissolution rate depends on the dissolution of the carriers (14). As soon as the
carrier molecules dissolve, the drug molecules release to the media (13, 109). Therefore,
the molecular dispersed solid dispersions provide a faster release than the non-molecular
solid dispersions. The molecular dispersions can be further subcategorised according to the
carrier types (crystalline and amorphous molecular dispersions).
1.4.1.2.1 Crystalline molecular dispersions
Crystalline molecular dispersion is a homogeneous single phase of API in the crystalline
matrices. The solubility of API in the crystalline carrier is usually low. Goldberg et al.
suggested that the molecular dispersions of sulfathiazole in urea were formed at the drug
content of 5% w/w (110). The structures of crystalline molecular dispersions can be further
classified according to how the solutes (drug molecules) are entraped in the solvent
structure (crystalline matrices): these classes are substitutional and interstitial molecular
dispersions. The solute molecules substitute in the lattice of the solvent molecules due to
their sizes being similar (Figure 1.9a), and this refers to the substitutional molecular
dispersion. Whereas in an interstitial molecular dispersion, the solute molecules are
significantly smaller than the solvent molecules, approximately less than 20% of the
solvent size (12). Hence, the solute is entrapped in the interstitial space between the solvent
lattices (Figure 1.9b). For example, the molecular dispersion of API in PEG is classified
as an interstitial molecular dispersion due to the difference in the size between the two
components (111).

26
Figure 1.9 Diagram showing the formation of the crystalline molecular dispersions:
substitutional molecular dispersion (a) and interstitial molecular dispersion (b). The solute
molecules are highlighted in black. This figure is adapted from reference (12).
1.4.1.2.2 Amorphous molecular dispersions
Amorphous molecular dispersions use amorphous carriers as matrices. The APIs are
molecularly dispersed in chains of the amorphous carriers (12). Naturally existing
amorphous polymers are common matrices used in amorphous molecular dispersions, i.e.,
PVP, polyvinyl pyrrolidone co-vinyl acetate (PVP-VA), HPMC and poly(meth)acrylate
have been intensively studied (97, 112, 113). The structure of the amorphous molecular
dispersion has been proposed to be the APIs irregularly trapped in between polymer chains
that impedes the drug mobility from the high energy barrier of the polymer chain network,
and as a consequence, it minimizes the API mobility and enhances the stability (13) (Figure
1.10a). However, the recrystallization of the drugs in polymer matrices has been
continuously reported. A new model for the molecular dispersion structure, which was
obtained from a computer modeling approach, was purposed by Ouyang (114). The model
suggests that drug molecules that are on the surface of the coiled polymer chain (as
illustrated in Figure 1.10b) are easy to mobilise and aggregate, and this may result in the
physical instability of the solid dispersion (114). The thermodynamic stability of the
amorphous drug in a molecular dispersion has also been widely studied and identified as
the cause of the physical instability of the molecular dispersions.
a b
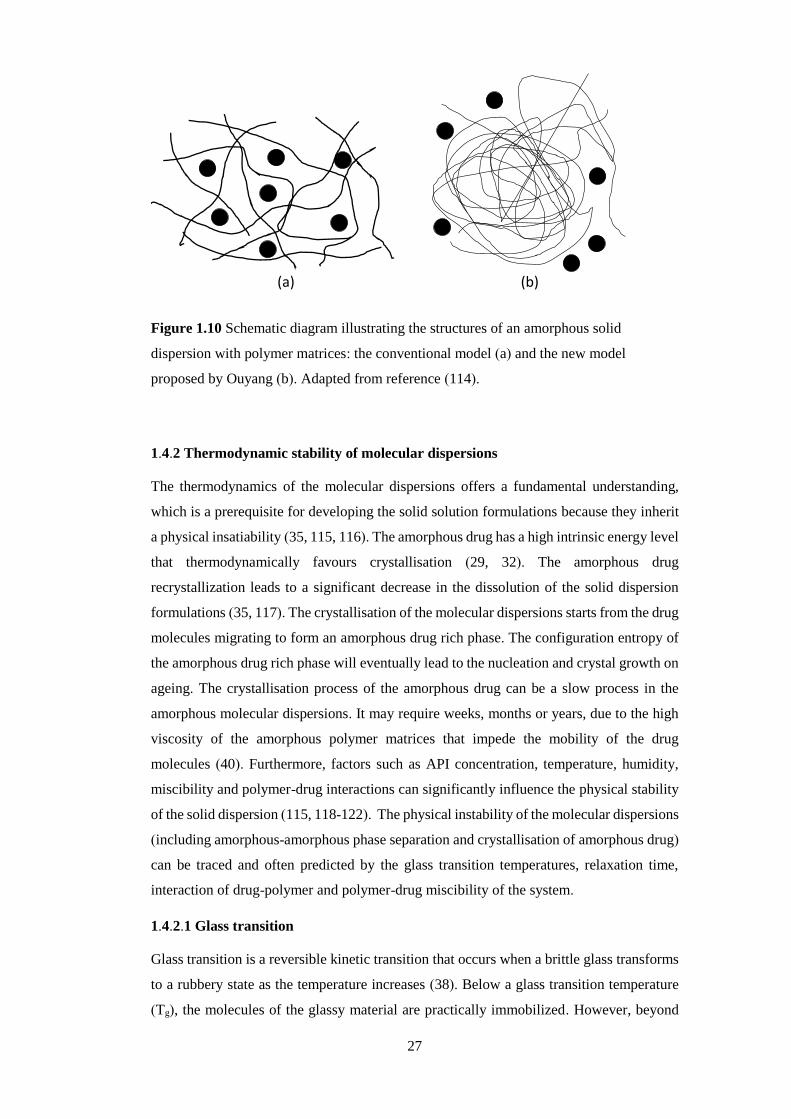
27
Figure 1.10 Schematic diagram illustrating the structures of an amorphous solid
dispersion with polymer matrices: the conventional model (a) and the new model
proposed by Ouyang (b). Adapted from reference (114).
1.4.2 Thermodynamic stability of molecular dispersions
The thermodynamics of the molecular dispersions offers a fundamental understanding,
which is a prerequisite for developing the solid solution formulations because they inherit
a physical insatiability (35, 115, 116). The amorphous drug has a high intrinsic energy level
that thermodynamically favours crystallisation (29, 32). The amorphous drug
recrystallization leads to a significant decrease in the dissolution of the solid dispersion
formulations (35, 117). The crystallisation of the molecular dispersions starts from the drug
molecules migrating to form an amorphous drug rich phase. The configuration entropy of
the amorphous drug rich phase will eventually lead to the nucleation and crystal growth on
ageing. The crystallisation process of the amorphous drug can be a slow process in the
amorphous molecular dispersions. It may require weeks, months or years, due to the high
viscosity of the amorphous polymer matrices that impede the mobility of the drug
molecules (40). Furthermore, factors such as API concentration, temperature, humidity,
miscibility and polymer-drug interactions can significantly influence the physical stability
of the solid dispersion (115, 118-122). The physical instability of the molecular dispersions
(including amorphous-amorphous phase separation and crystallisation of amorphous drug)
can be traced and often predicted by the glass transition temperatures, relaxation time,
interaction of drug-polymer and polymer-drug miscibility of the system.
1.4.2.1 Glass transition
Glass transition is a reversible kinetic transition that occurs when a brittle glass transforms
to a rubbery state as the temperature increases (38). Below a glass transition temperature
(Tg), the molecules of the glassy material are practically immobilized. However, beyond
(a) (b)

28
this transition temperature, the molecules are liberated and increase their mobility (32). Tg
is a step change in heat capacity that can be observed from a differential scanning
calorimeter (DSC) and dynamic mechanical analysis (DMA) (32). It is a characteristic
property of amorphous materials, and it is always lower than the melting point of the
materials.
In a blend system, a Tg is an indication of the miscibility between the two components (or
more). The immiscible the binary mixture demonstrates a double Tg of the individual
materials. On the other hand, a single Tg indicates a homogeneous mix of binary
components. The theoretical prediction of the Tg in the homogeneous system can be
estimated using the Gordon-Taylor (GT) equation (123, 124). This equation assumes that
the two components are miscible, and the free volume is additive (125). This equation was
firstly developed for the polymer blends, but it has been proven to be capable of predicting
the drug-polymer blends (123, 124). The GT is described as
𝑇𝑔12=
𝑊1𝑇𝑔1+𝐾𝑊2𝑇𝑔2
𝑊1+𝐾𝑊2 …………….……………..(1.16)
where W1 and W2 are fractions of the two components, Tg1 and Tg2 are glass transition
temperatures in Kelvin of each material and K is a constant that can be obtain from the
Simha-boyer rule (126).
𝐾 ≈𝑇𝑔1𝜌1
𝑇𝑔2𝜌2 ……...…………………………..(1.17)
where ρ is the true density of the component. Additionally, K can be calculated using the
Couchman-Karasz model. K is defined as
𝐾 ≈∆𝐶𝑝2
∆𝐶𝑝1 ………………………………...(1.18)
where ΔCp1 and ΔCp2 are the different heat capacity changes at Tg for each component
(127). Moreover, the GT model can be modified to calculate a Tg of the tertiary blends
(123).
The discrepancy between the experimental values and the predicted values indicates an
interaction of the two components. A positive deviation refers to a strong intermolecular
interaction of the two components, such as hydrogen bonding. Whereas a negative
deviation implies that the like-molecules have a greater interaction among themselves
rather than forming an interaction between different molecules (119, 124). Additionally,
moisture uptake in the solid dispersion can cause a decrease in the Tg due to water having
a plasticising effect.

29
1.4.2.2 Molecular mobility and structural relaxation
The glassy state is a non-equilibrium state in which the enthalpy, entropy and the volume
deviates from the supercooled liquid. Thus, the amorphous form embeds high enthalpy and
configuration entropy in comparison to their crystalline counterpart (32). Upon storage, the
glass relaxes by releasing its extra enthalpy and configurational entropy to reach a new
equilibrium. The structural relaxation is a process in which the amorphous material releases
its extra energy and the time duration for this process is called the relaxation time (128).
The relaxation behaviour is important because it correlates to the molecular mobility of the
system. Molecular mobility is an essential parameter to determine the stability in the
molecular dispersion system. High molecular mobility leads to the phase separation and
crystallisation of the amorphous drug. To determine the relaxation time, the Adam-Gibbs-
Vogel model is used
𝜏 = 𝜏0𝑒𝑥𝑝 [𝐷𝑇0
𝑇(1−𝑇0
𝑇𝑓)
] …………………………………(1.19)
where τ is the molecular relaxation time constant, τ0 is the relaxation time at the high-
temperature limit, D is the material parameter associated with the material fragility and T0
is the zero temperature mobility. Tf is the fictive temperature, and when above Tg, the Tf is
equal to the experimental temperature. While when below Tg, the Tf in most cases is similar
to the Tg (129, 130).
There are two types of relaxation found in amorphous materials: alpha relaxation (global
molecular mobility) and beta relaxation (local molecular mobility) (32, 128). The alpha
relaxation refers to neighbouring molecules changing their relative position. The time in
which the molecules diffuse through the inter-particulate distance is defined as the
relaxation time, which increases when near Tg (128). Hence, the alpha relaxation involves
the whole molecule via global molecular mobility and it is responsible for the glass
transition. While, the beta relaxation links to a local mobility that is related to the molecular
mobility below the Tg. The beta relaxation is faster than the alpha relaxation because it
involves only intra-molecule movement, such as part of the side chain moving in an
amorphous polymer or atoms spinning in small organic compounds (128).
The global and local mobility of amorphous polymers and small organic molecules, such
as APIs, can be observed by using analytical techniques, including dielectric relaxation
spectroscopy, thermal stimulated current, solid state nuclear magnetic resonance (ss-
NMR), DMA and DSC (128). These methods based on different analytical principles
provide information on both the alpha and beta relaxation of the molecules. The dielectric
relaxation spectroscopy is based on a measurement of the reorientation of dipoles under the

30
electrical field and variable frequency. It is a direct determination of the relaxation times,
including both alpha and beta relation. The NMR approach measures the emitted and the
absorbed radio frequencies of the nuclei under a magnetic field, which is the origin of
molecular motion. Its merit is that there is a correlation between the chemical stability and
local mobility. DSC relies on the thermally induced transition, which involves both alpha
and beta relaxation (128).
The molecular mobility of the APIs is linked to their crystallisation. Thus, it is an important
factor that governs the stability of the amorphous phase. Typically, pharmaceutical
molecular dispersions are composed of at least two components. The multicomponents
demonstrate a more complex relaxation behaviour than a single component system. In
molecular dispersions, a small reorientation motion, which shows the heterogeneity of the
system, is observed as beta-relaxation below the Tg as well as alpha-relaxation (131). This
molecular mobility leads to nucleation and crystal growth (132). Furthermore, the
processing parameters also affect the mobility of the molecular dispersions (133, 134).
Briefly, preferable molecular dispersions should demonstrate a high conformation entropy
and low mobility because it is physically stable.
1.4.2.3 Theoretical miscibility estimation of drug and polymer
Solubility parameter approach
The solubility parameter (δ) is based on the principle of cohesive energy. The cohesive
energy is defined as the energy that binds the atoms and molecules together (135). The
values of the cohesive energy are the energy that is required to separate an atom or molecule
to an infinite distance. The cohesive energy reflects the overall intermolecular interaction,
including hydrogen bonding, van der Waals interaction, covalent bonding, dipole moment
interaction and ionic bonding (136).
There have been several methods developed to calculate the δ, such as Hoy, Fedor and
Hoftyzer and Van Kevelen (135, 137-139). The errors in the estimation values between the
different approaches are less than 10% (135). Fedor’s method is a simple method to predict
the δ with high accuracy. The δ estimation of Fedor’s approach is based on the addition of
the atoms and group contribution to the heat of vaporization and molar volume (137). The
equation below expresses the δ as a square root of the cohesive energy density.
δ = (∑ Ev
∑ Vm)
1/2
………………..……………(1.20)
where Ev is the heat of vaporization and Vm is the molar volume. The values of Ev and Vm
of the atoms or groups are reported in the literature (135, 137). The δ are reported with the
unit of MPa1/2.
31
The solubility parameter was initially developed for a simple liquid mixture. The
application of the solubility parameter extends to different areas including foods, polymers
and pharmaceutics (136, 138, 140, 141). The application of solubility parameters in the
pharmaceutical area is used for predicting unknown properties of materials, evaluating
processing effects on the material properties and predicting the incompatibility and
interactions of the drug and the polymer (136). To predict the theoretical drug-polymer
miscibility, the solubility parameters have been used and have shown a potential
application to predicting accurately the miscibility of the drug-polymer (136, 142-144).
The similar values of the solubility parameters imply a good miscibility of the two
components. Foster et al. categorised the miscibility of the drug-polymer based on their Δδ
into three groups, which are miscible (Δδ<2), partial miscible (Δδ 2-10) and immiscible
(Δδ>10) (140). Therefore, the theoretical miscibility estimation, such as solubility
parameter, can be an approximate guideline to predict the miscibility of the drug and
polymer in a solid solution system (136, 144, 145).
Melting point depression approach
The melting point depression approach has been used to study the polymer-polymer and
API-polymer interactions (144, 146, 147). The principle behind this approach is that if the
crystalline API and amorphous polymer are miscible, then interactions, such as hydrogen
bonding, will occur between the components (144). The chemical potential of the mixture
would be lower than the pure component (146). This results in melting point depression.
Conversely, if drug and polymer are immiscible with no interaction occurring between the
two compounds, then the melting point depression is not expected.
The melting point depression is a simple method that can estimate the interaction of the
drug and polymer. The drug and polymer are physically mixed and are slowly heated by
DSC with a slow underlying heating rate (1-2 C°.min-1) to allow the interaction of the drug
and polymer to occur. Marsac et al. demonstrated the application of the melting point
depression to predict the miscibility of PVP-felodipine and PVP-nifedipine (144, 148). The
melting points of these two drugs were depressed as the ratio of PVP increase. Additionally,
the data from the melting point depression experiments can be used to estimate the Flory-
Huggins interaction parameter of the drug and polymer (Χ), which is used to calculate the
solid solubility of the drug in the polymer (144, 148).

32
1.4.2.4 Interaction of drug and polymer
In addition to immobilising drugs in polymers with a high Tg and storing them at least at
50K below the Tg of the system (29), another practical approach to preventing the
amorphous drug recrystallization is to establish an interaction between the drug and the
polymer, such as dipole-dipole, van de Waals and hydrogen bonding. The interaction
between the drug and the polymer is a potential strategy to enhance the physical stability
in a molecular dispersion (118).
Forming a hydrogen bond requires a hydrogen donor and a hydrogen acceptor group in the
drug and the polymer structure. The polymers that contain a carbonyl group (hydrogen
donor group) can establish a hydrogen bond with APIs that contains a hydroxyl or amide
group (hydrogen donor group) (89, 112, 113, 121, 122, 142, 144). Taylor et al. and
Matsumoto et al. observed the hydrogen bonding of indomethacin with both PVP and PVP-
VA through the carbonyl group of the polymers and hydroxyl group of the drug (112, 113).
PCM also demonstrated a hydrogen bond with PVP via the carbonyl-hydroxyl route (24).
In addition, felodipine tolbutamide, lacidipine and nifedipine can establish hydrogen bonds
with PVP through their amide group (89, 142). The hydrogen bonding between drug and
polymer promotes a miscibility between the blend couple resulting in an increase in the Tg
of the blend and restricting the mobility of the drug molecules (124).
The molecules often contain atoms that have different electronegativity. Consequently, the
electrons in the molecules are pulled to the atom that has the highest electronegativity, i.e.,
fluorine, oxygen, chlorine and bromine. This leads to a non-uniform electron distribution
in the molecules (molecular dipoles) (149, 150). Therefore, some regions of the molecule
have positive electric charges while other regions have negative electric charges. APIs and
polymers also contain highly electronegativity atoms in their molecules. Hence, the dipole-
dipole interactions between the drug and polymer molecules are expected. On the other
hand, the molecules that have no dipole moment, exhibit a van de Waals interaction. The
van de Waals interaction is a universal force among organic molecules. However, it is a
very weak interaction (148).
The interaction of ketoconazole with PVP is an example of a dipole-dipole interaction of
the drug and polymer (148, 151). Both ketoconazole and PVP lack a hydrogen donor group.
Thus, they cannot form a hydrogen bond with each other. This was confirmed by an
absence of a PVP carbonyl peak shift to the lower wave number (148). Marsac speculated
that the interaction of PVP and ketoconazole occurred via a dipole-dipole interaction
because it has a large dipole moment (6.03 Debye), which is likely to be an interaction with
the polar molecule of PVP (3.91 Debye). A van de Waals interaction is another possible

33
interaction between ketoconazole and PVP because the large molecular size of the drug
may contribute to this interaction (148).
1.4.3 External factors affecting physical stability of molecular dispersions
Storage temperature and moisture are external factors that influence the physical stability
of molecular dispersions. They accelerate the molecular mobility of APIs and carriers,
which consequently links to the physical instability of the molecular dispersion including
its phase separation and amorphous drug recrystallization (118, 121, 122).
1.4.3.1 Temperature
Temperature is a parameter that affects pharmaceutical products in many ways, including
the degradation of APIs and excipients, storage conditions and manufacturing process. In
the molecular dispersion, it directly links to the mobility of the molecules. A higher
temperature implies, a higher molecular mobility (128). Storing solid dispersions at
elevated temperatures increases the molecular mobility of the API in the formulation
resulting in a phase separation and recrystallization of the drug in the molecular dispersions.
In fragile glass materials, the temperature T0 from equation 1.19, in which the molecules
have zero mobility, is approximately 50 K below their Tg (29, 32). Therefore, it is
recommended to store amorphous APIs at least at 50K below their Tg to enhance the
stability of the molecular dispersion formulations (29).
1.4.3.2 Moisture uptake
Moisture uptake is one of the important factors influencing the stability of pharmaceutical
products during the manufacturing process and storage (152). In the molecularly dispersed
formulations, it is important to study the moisture sorption behaviour of drugs and carriers
because moisture enhances the mobility of the amorphous drug and polymer resulting in a
phase separation and API recrystallization (153, 154). Many commonly used matrices, such
as PVP, PVP-VA and PEG, are hygroscopic.
As an example, moisture uptake by PVP has been widely studied (118, 121, 122, 154).
Moisture absorption by PVP based molecular dispersions can lead to phase separation of
the amorphous drug and its recrystallization (118, 121, 122). The hydrogen bonding
between the drug-polymer can be degraded by moisture. Marsac et al. observed that the
hydrogen bond between felodipine and PVP was degraded at a humidity >75% RH. The
humidity induced the immiscibility of the drug and polymer resulting in the crystallisation
of the amorphous felodipine (121). However, Vasanthavada et al. and Forster et al.
observed a reduction in the moisture uptake in solid dispersion formulations, in which the
hydrogen bonding was presented. The non-degraded hydrogen bond in an indomethacin-

34
PVP resulted in the solid dispersion absorbed 7.4% w/w moisture, which was lower than
the degraded hydrogen bond in the solid dispersion of lacidipine-PVP, nifedipine-PVP and
tolbutamide-PVP, as their moisture uptakes were 13, 11.6 and 11.7%, respectively (142).
The authors explained that the moisture uptake by PVP was due to its free carbonyl group
binding to water molecules. The formation of hydrogen bonds in the drug-polymer reduces
the number of the free carbonyl groups in the polymer. Hence, there is a smaller number of
hydrogen acceptor groups in the polymer that are available for water to interact with, which
results in a decrease in the moisture uptake of the solid dispersion (142). Consequently, the
non-degraded hydrogen bonding of the API and polymer enhanced the stability of the
amorphous drug in the molecular dispersions.
The kinetics of the moisture absorption by the pharmaceutical system can be influenced by
a number of factors, including the hygroscopicity of the material, the density of the
matrices, the surface area and the geometry of the system (119). Moisture uptake normally
includes two main steps that are at the adsorption and absorption stages. The adsorption
stage is when moisture covers the surface of the material. The absorption stage is when the
moisture penetrates into the material resulting in hydration and swelling. It is important to
understand the kinetics of the moisture absorption. As the stability of the formulation
directly relates to its rate and capacity for moisture uptake. The kinetic sorption models can
be used to predict the moisture sorption and describe their moisture sorption behaviours.
The Peleg, Guggenheim-Anderson-De-Bour and double exponential models have been
wildly used to investigate the kinetics of moisture absorption processes of food and
pharmaceutical materials (120).
1.4.4 Solid dispersions containing polymer blends
Polymer blends have been wildly applied to various industries, such as plastics, food
packaging and biomedical, to alter the physicochemical properties of the materials (155-
158). The use of synthetic and natural polymer blends in the biomedical area has increased
over recent decades (159). In pharmaceutical research, polymer blends have been used in
a range of formulations with different functionalities, including as emulsifying agents,
flocculating agents, coatings and solid dispersion matrices for controlled release or specific
site release (17, 19, 117, 160, 161). The polymer blended approach was selected in this
study for the formulation of solid dispersions because it demonstrates many advantages,
including improving the polymers properties (enhance spinnability of eletrospun fibres)
(162), reducing moisture uptake of the formulations (18) and can be used for modified
release formulations (21, 163). To formulate a polymer blended solid dispersion, an

35
understanding of the polymer-polymer miscibility and the effect of the API on the polymer
blends are needed, which will be discussed in this section.
1.4.4.1 Polymer-polymer miscibility
The fundamental theory of polymer blending is based on the thermodynamics of the
mixing of a binary system. This process can be described using equation 1.21.
∆𝐺𝑚 = ∆𝐻𝑚 − 𝑇∆𝑆𝑚 …………………………(1.21)
where, ΔGm is the change in the Gibb’s free energy of the mixing process, T is the absolute
temperature of the mixing process, ΔHm is the enthalpy of the mixing and ΔSm is the entropy
of the mixing. The negative value of ΔGm refers to a spontaneous process in the mixing.
The ΔSm is determined from the possible arrangements of the molecules, and it is always a
positive value. The heat of mixing is frequently positive for non-polar compounds.
However, an exception applies when the compound is attracted to another, such as
hydrogen bonding (38). Therefore, the sign of the ΔGm relies on the heat of the mixing.
A similar thermodynamic theory for the mixing applies to the polymer blends. The polymer
blends can be homogeneous or heterogeneous depending on their miscibility. Complete
miscibility leads to homogeneous blends of the components. In contrast, partial miscible or
immiscible of the blends results in a heterogeneous mixture. A positive value of ΔGm
indicates a phase separation of the two polymers. It is noted that the polymers are long
chain structures with high molecular weights. This nature leads to a low entropy of mixing
for the polymers in comparison to other low molecular weight compounds (38). Thus, this
enhances the immiscibility in the polymer blends. The immiscible polymers demonstrate a
clear boundary between the two phases that consequently increases the brittleness of the
blend materials (164, 165).
Flory-Huggin theory is a hypothetical lattice in space theory that is used to explain the
thermodynamics of the polymer-solvent interaction on the basis of the Gibb’s free energy
laws (166). It can be applied to estimate the miscibility of the solvent-solvent, solvent-
polymer, polymer-polymer and drug-polymer mixes (144, 147, 148). The thermodynamic
mixing of the polymer-polymer as based on the Flory-Huggins lattice theory can be
described as
∆𝐺𝑚 = 𝑅𝑇(𝑛1𝑙𝑛∅1 + 𝑛2𝑙𝑛∅2 + 𝑛1∅2𝜒12)…………………..(1.22)
where ΔGm is the Gibb’s free energy change in the polymer-polymer mixing, R is the gas
constant, T is the temperature in Kevin, n1 is the mole fraction of the polymer1, n2 is the
number of the mole fraction of the polymer2, ϕ1 is the volume fraction of the polymer1, ϕ2

36
is the volume fraction of the polymer2 and Χ12 is Flory-Huggin interaction of polymer1
and polymer 2 (166). The Flory-Huggins parameter (Χ) can be determined from
experiments, including the solubility parameter and melting point depression (144, 147,
148).
As an example of using Flory-Huggins to predict the miscibility of a polymer-polymer pair,
Nishi et al. used Flory-Huggins theory to estimate the miscibility of poly(vinylidene
fluoride) and poly(methyl methacylate) (147). The Χ values of these polymers were
determine using the melting depression approach, which is -0.295 at 160°C. This value
indicates that poly(vinylidene fluoride) and poly(methyl methacylate) are miscible at
160°C.
1.4.4.2 Effect of drug incorporation in polymer blended systems
The polymer blends are frequently immiscible or partially miscible because of their low
entropy of mixing (38). Incorporating API into the polymer blends creates ternary blends
in which it is possible that the drug may enhance the miscibility between the polymer
blends. However, if the heterogeneous blend still exists. The drug miscibility of each
polymer needs to be taken into account because it affects the distribution of the API in the
case of a phase separation in the polymer matrices (18, 167). Six and co-workers prepared
an immiscible polymer blend from Eudragit E and PVP-VA with itraconazole loading via
a hot-melt extrusion (167). The authors observed that the double Tg of these two polymers
decreased because the drug was inducted into each polymer phase. The PVP-VA phase
demonstrated a lower degree of Tg depression. This contributes to an uneven API partition
due to the polymer-drug miscibility. Yang et al. also observed similar results for the phase
separation of PVP-VA/Eudragit E blends with felodipine loading, which showed as a
double Tg (18). The authors performed the theoretical calculation for felodipine in each
phase and discovered that the drug is likely distributed to the PVP-VA phase rather than
the Eudragit E phase. This contributes to felodipine having a better miscibility to PVP-VA
as it can form a hydrogen bond between the NH of the drug and the carbonyl group of the
polymer (89).
Drug-polymer miscibility plays a key role in controlling the drug distribution between the
two phase separated phases. The API is likely to partition into the phase that is more
miscible, for example, the polymer phase that can form a hydrogen bond between the drug
and polymer (18, 89). Based on this concept, the drug can be guided to one phase rather
than the other phase. Therefore, controlling the drug distribution can be used to benefit the
physical stability of the solid dispersion containing partially miscible or immiscible
polymer blends. A lyophilic drug, which cannot form a hydrogen bond, is likely to be

37
miscible with the hydrophobic polymer. Consequently, incorporating this drug into the
polymer blend matrices of the hydrophilic and phobic polymer results in an uneven drug
distribution to the hydrophobic polymer phase. Hence, the drug in this phase can be
protected from moisture that increases the physical stability of the amorphous drug.
1.4.4.3 Applications of polymer blends in drug delivery
Polymer blends demonstrate numerous applications in drug delivery, including film coating
for modified release, increased mucoadhesion of the buccal tablets and solid dispersion
matrices (19, 21, 161). In the particular area of solid dispersions containing polymer blends,
they demonstrate equivalent or superior benefits in comparison to the ordinary binary solid
dispersions, including improving the aqueous solubility of poorly water soluble drugs,
increasing the physical stability of the amorphous drug in solid dispersions and alternating
the drug release profiles (17). Bley et al. reported that there was no significant difference
in the aqueous solubility enhancement of carbamazepine and nifedipine in PEG 1500 in
comparison to carbamazepine and nifedipine in a polymer blended solid dispersion of PEG
1500 with PVP-VA or PVP (17). This is because a molecular dispersion can be achieved
in both binary solid dispersions (drug-carrier) and ternary solid dispersions (drug-carriers).
Thus, solid dispersions containing polymer blends show an equivalent potential to enhance
the solubility of water insoluble APIs.
Another common application is blending hydrophilic and hydrophobic polymers to
enhance the physical stability of the solid dispersion formulations by reducing their
moisture uptake (18, 161). Alshahrani et al. demonstrated that the polymer blend solid
dispersion of hypromellose acetate succinate (HPMCAS)/Soluplus with carbamazepine
loading, which was prepared by hot-melt extrusion, reduced the moisture uptake of the
formulation under an accelerated stress condition at 40°C/75%RH (161). Consequently,
the polymer blend solid dispersion formulations showed a lower crystallinity in comparison
to the binary carbamazepine-Soluplus formulation, which had a higher moisture uptake
than the blends. Yang et al. used the immiscible blend pair of PVP-VA and Eudragit E to
reduce the moisture uptake in their solid dispersion with felodipine (18). The moisture
sorption of the PVP-VA/Eudragit E blend extrudate was decreased four times in
comparison to the PVP-VA alone, which lead to the stability enhancement of the
formulations.
Solid dispersions containing polymer blends have also been used to alter the release profile
of the formulation, such as a biphasic drug release and sustained release. Yu et al. prepared
a polymer blend of PVP and ethyl cellulose (EC) using coaxial electrospinning, which
manipulated a core-shell structure phase separation in the electrospun fibre structures (21).

38
This resulted in biphasic drug loading, in which the outer layer of PVP released the API as
a burst release and then there was a sustained release from the EC phase. Quinten et al.
prepared polymer blended matrices tablets from HPMC and EC for the sustained released
purpose. The matrix tablets of HPMCAS/EC at a 1:1 ratio showed metoprolol sustained
released profiles over 24 hours (163).
1.4.5 Methods for preparing solid dispersions
There are various ways to prepare solid dispersions of APIs and carriers. These methods
can be categorised into two primary methods, which are melting based and solvent
evaporation based methods. The melting based method involves heating to melt an API and
a carrier to obtain solid dispersions, whereas both the API and carrier are dissolved in a
mutual solvent in the solvent evaporation based method, and subsequently the solvent is
removed to obtain solid dispersions. This section will describe the general methods of solid
dispersion preparations along with discussions of their advantages and disadvantages. It
should be noted that the electrospinning method, which is the primary method used in this
study will be introduced in detail in section 1.5.
1.4.5.1 Melting based methods
The melting based method was the original approach that Sekiguchi and Obi used to
produce the fast release solid dispersions in 1961 (96). The principle of the melting based
method is that the carrier and API are melted. The increased mobility of the molten liquid
allows the two components to mix homogeneously. Afterwards, the molten matrices of the
API and the carrier are cooled to solidify them. The solid dispersion prepared by the fusion
method often requires pulverisation to break down the solid matrices. The conventional
fusion method has several disadvantages, including thermal degradation of the API and a
phase separation that causes insufficient mixing of the API and the carrier (35).
Hot-melt extrusion (HME) is a modern melting based method that combines mixing with
the heating process to enhance the product homogeneity (168, 169). Hot-melt extruders are
composed of four major compartments: a feeder hopper, a mixing screw, a heating barrel
and a die, as seen in Figure 1.11. The API and carrier are frequently premixed before
loading into the hopper. The screw is the most important part of the hot-melt extruder
because it drives the API and carrier through a mixing process in the heating barrel where
high temperatures and screw shearing enhance the homogeneity of the mixing (168, 169).
As a result, HME is an efficient mixing process in comparison to the conventional melting
based method due to the twin screws mixing. The homogeneously mixed matrices of the
API and carrier are forced through the die, where the matrices’ shapes are dictated. In

39
addition, HME does not require the use of organic solvents, which makes it more
environmentally friendly than processes such as spray drying.
Figure 1.11 Schematic diagram of a hot-melt extruder, reproduced from reference (168).
HME is widely used in the pharmaceutical industrial as a technology to prepared solid
dispersion formulations because it is robust and feasible to scale up to mass production.
Thus, many commercial solid dispersion products are manufactured by HME, i.e., Kaletra®
(Abbott), Isoptin SRE ® (Abbott) and Ozdurex® (Allergan) (99, 169, 170). The advantage
of a fast residence time may allow HME to process thermal labile API. DiNuzio et al.
prepared a solid dispersion of thermosensitive hydrocortisone with PVP-VA with a lab
scale hot-melt extruder (171). The residence of mixing was 5 min, with which
hydrocortisone did not show any degradation. However, the residence time may increase
due to the screw length in industrial scale extruders. Thus, HME is not recommended as
the first choice preparation for thermal labile APIs.
In addition, HME can be equipped with downstream processes, including pelletization,
milling and injection moulding (168, 169). As an example, injection moulding (IM) is a
downstream unit that is used to produce final dosage forms for pharmaceutical products.
IM is a versatile and rapid manufacturing technology that has been used widely in the
plastics industry to produce objects that have different geometries and sizes (172, 173). An
IM machine consists of two major compartments, including an injection unit and a
clamping unit, as seen in Figure 1.12. The HME can serve as an injection unit in which
thermoplastic or thermoset materials are heated, mixed and injected into the clamping unit
(168, 169). The clamping unit is the terminal stage of the IM process. It has a two half parts
that combine into a three-dimensional shape of the desired object. The IM cycle begins
with the heat soften materials being injected into the closed mould cavity with the high
pressure generated from the screw of the injection unit. The clamp unit tightly shuts to

40
maintain pressure during the injection step. After the injection, the melts cool down and
solidify in the mould cavity shape. Subsequently, the final product is ejected from the
mould and a new cycle starts. Hence, IM is a continuous manufacturing process.
Figure 1.12 Schematic diagram of injection moulding process, reproduced from
reference (172).
IM has been applied to the pharmaceutical industry as a down-stream process to produce
final dosages from HME (168, 169). IM can produce various geometries of products,
including films, tablets, rods and rings. Therefore, it can be applied to manufacture various
types of dosage forms for different drug delivery systems, such as the oral route, implant
device and intravaginal inserts (163, 174, 175). The tablets that are produced from IM can
be instantly released or sustain-released depending on the polymers that are used as the
tablet matrices. The instant release tablets used low viscosity HPMC, polyvinyl alcohol and
sodium starch glycolate as the tablet matrices (176), while sustained-release tablets are
produced from a blend between EC and HPMC (163). However, there are several
drawbacks to IM that need to be considered, including the involvement of heat in the
process. Hence, IM is not suitable for manufacturing thermal-labile APIs. Even though IM
allows the production of a variety of shapes, changing the object shape requires a different
mould, which is inconvenient and carving a mould is rather expensive. Therefore, IM is a
technology that has potential to be used for industrial scale manufacturing process for
thermal-insensitive pharmaceutical products because it is a continuous process with high
product reproducibility.
Fused deposition modelling (FDM) is a heated base technology that has been applied to
constructing a 3D object (177, 178). It produces a 3D object by depositing, layer-by-layer,
semi-molten materials on the stage. A schematic graphic of an FDM apparatus is shown in
Figure 1.13. The thermoplastic filaments, i.e., PVA or PCL, are used as materials for FDM
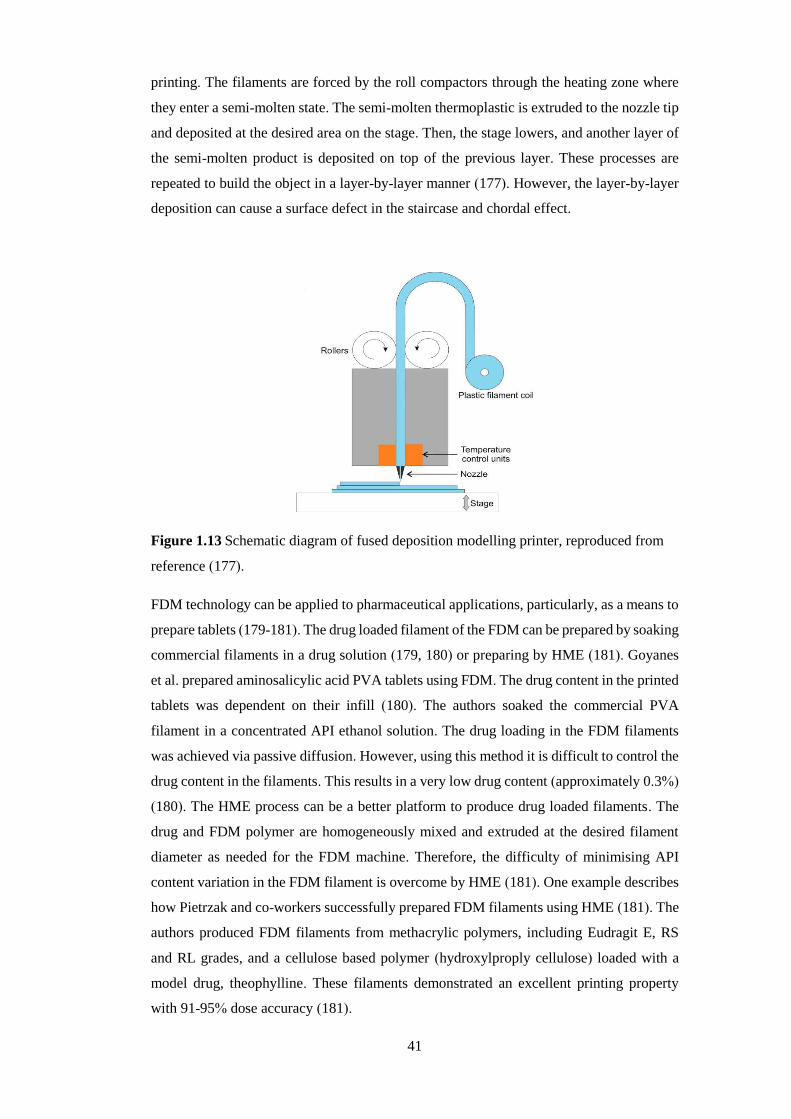
41
printing. The filaments are forced by the roll compactors through the heating zone where
they enter a semi-molten state. The semi-molten thermoplastic is extruded to the nozzle tip
and deposited at the desired area on the stage. Then, the stage lowers, and another layer of
the semi-molten product is deposited on top of the previous layer. These processes are
repeated to build the object in a layer-by-layer manner (177). However, the layer-by-layer
deposition can cause a surface defect in the staircase and chordal effect.
Figure 1.13 Schematic diagram of fused deposition modelling printer, reproduced from
reference (177).
FDM technology can be applied to pharmaceutical applications, particularly, as a means to
prepare tablets (179-181). The drug loaded filament of the FDM can be prepared by soaking
commercial filaments in a drug solution (179, 180) or preparing by HME (181). Goyanes
et al. prepared aminosalicylic acid PVA tablets using FDM. The drug content in the printed
tablets was dependent on their infill (180). The authors soaked the commercial PVA
filament in a concentrated API ethanol solution. The drug loading in the FDM filaments
was achieved via passive diffusion. However, using this method it is difficult to control the
drug content in the filaments. This results in a very low drug content (approximately 0.3%)
(180). The HME process can be a better platform to produce drug loaded filaments. The
drug and FDM polymer are homogeneously mixed and extruded at the desired filament
diameter as needed for the FDM machine. Therefore, the difficulty of minimising API
content variation in the FDM filament is overcome by HME (181). One example describes
how Pietrzak and co-workers successfully prepared FDM filaments using HME (181). The
authors produced FDM filaments from methacrylic polymers, including Eudragit E, RS
and RL grades, and a cellulose based polymer (hydroxylproply cellulose) loaded with a
model drug, theophylline. These filaments demonstrated an excellent printing property
with 91-95% dose accuracy (181).

42
FDM is a potential platform to produce solid state formulations with precise API contents.
Therefore, it is a suitable concept for producing personalised medicine, in which the drug
content can be modified for the individual patient. Furthermore, FDM is a benchtop
machine with a reasonable price. Thus, it is a promising technology for future medication.
The FDM process is limited by the printing temperature for the materials, for example,
PVA and PCL soften above 200°C (178, 179). The high temperature of the FDM process
might not be suitable for printing low degradation temperature APIs.
1.4.5.2 Solvent evaporation based methods
An organic solvent is frequently used as a medium to dissolve the API and the carrier to
enhance the mixing. Subsequently, a solvent removal process is conducted to obtain solid
dispersions (13, 85). The solvent method is particularly suitable for producing solid
dispersions of thermo-sensitive drugs. However, the significant disadvantage of this
method is the environmental hazard caused by the toxicity of a large volume of organic
solvents for disposal (168). In addition, the solvent residue in the solid dispersions is
another concern due to its toxicity to humans. It can also plasticize the solid dispersions
resulting in physical instability.
Spray dying is a processing method that transforms the solution or suspension into solid
products. It is commonly used in various fields, such as food, ceramic, paint, fertiliser and
pharmaceutical industries (182, 183). It is frequently employed as a solid dispersion
preparation method for improving BCS class II and IV drugs (34, 97). For preparing solid
dispersions, organic solvents are commonly used. The API and the carrier are dissolved in
their mutual solvent. A schematic diagram for spray dried unit is depicted in Figure 1.14.
In the first chamber, the solution for spray drying is fed to an atomiser at a pre-heated
temperature by a peristatic pump. The solution is sprayed into microsized droplets by an
atomiser and then these droplets are dispersed in the hot inert gas inlet (dry nitrogen).
Consequently, the droplets rapidly solidify into micropaticles, usually within a milisecond
(182-184). These microparticles are convected to the second chamber where they are
collected into a particle vessel by a cyclone.

43
Figure 1.14 Schematic diagram of a spray dried unit, adapted from reference (185).
Spray drying has been successfully used to prepare amorphous particles of poorly water-
soluble APIs, such as atorvastatin, albendazole, griseofulvin, hydrocortisone,
indomethacin, testosterone and piroxicam (34, 186). The spray dried particle size is in the
range of micrometres, which results in an increased surface area of the solid dispersion
formulations. Spray drying demonstrates a continuous process that is cost-effective and
easy to scale up (182, 183). Thus, it is commonly used for industrial scale manufacturing.
Therefore, spray drying has been used to manufacture some of the marketed solid
dispersion products, including Intelence® and Certican® (99).
In comparison to spray drying, spin coating has no heating element in the process. It has
been widely used in many industrial areas, such as microelectronic applications, protective
coating (against UV, starching, corrosion and humidity) and paint coating (187-189). A
substrate is placed on the spinning chuck and then small droplets of drug and carrier
solution are applied to the spinning substrate. The substrate attaches to the spinning chuck
by vacuum force during the spinning process. The high-speed spinning creates centrifuge
forces that cause a strong sheer to the solution. As a consequence, the droplets spread
radially on the substrate. This process occurs with subsequent solvent evaporation, which
results in a thin film of a few microns thickness after completing the solvent removal
process (188). A schematic diagram of the spin coating is illustrated in Figure 1.15.
First chamber
Second chamber
Particle vessel

44
Figure 1.15 Schematic diagram of spin-coating procedure preparing a thin film on a
substrate.
In pharmaceutical research, it has been used to study the crystallisation of an amorphous
drug (190) and to prepare a drug eluting coating contact lens (191). Qi et al. prepared
amorphous felodipine using a spin coating technique and investigated the crystallisation of
the amorphous drug under a high humidity condition (190). Paudel et al. suggested that the
data that was obtained from varying the time, rotation speed and processing temperature of
the formulation prepared by spin coating can provide essential information about the phase
structure during the spray drying process (182). In addition, spin coating has been used as
a preparation method to understand the behaviour of solid dispersions. Konno et al.
reported that a thin film solid dispersion of felodipine with a polymer, such as PVP, HPMC
and HPMCAS, can inhibit the crystallisation of the amorphous drug (89). The application
of spin coating in the pharmaceutical field is limited only to lab research, and the industrial
application of spin coating in the pharmaceutical industries has not been established.
1.5 Electrospinning
Electrospinning is a processing technique using electrostatic forces to fabricated non-
woven micro to nano sized fibres from either a molten or solution polymer. Electrospun
polymeric fibres demonstrate a broad range of applications in filtration, nanosensors,
protective clothes, tissue engineering and drug delivery (25, 27, 192-195). In general, an
electrospinning apparatus consist of four main compartments that are a solution reservoir,
solution flow regulator, high voltage supplier and collector, as illustrated in Figure 1.16a.
A solution reservoir typically connects to a capillary where the polymeric solution is
continuously forced through by a flow regulator to form a pendant drop. A positive
electrode from the high voltage source attaches to a metal part of the capillary. The
electrospinning process starts after mutual charges are applied to the polymeric solution.
As a consequence, when increasing the electrical field, the pendant drop transforms into a
Substrate
Solution droplet
Solvent evaporate
Chuck
Dry thin film on the substrate

45
conical shape due to repulsive forces between the mutual charges, which is known as a
Taylor cone (Figure 1.16b). The solution jet emits from the apex of the Taylor cone where
the polymeric solution accelerates toward to the collector. The solution jet undergoes a
chaotic movement that causes the electrical field to oscillate. Therefore, it increases the
path length to the collector resulting in enhanced solvent evaporation and a reduction in the
diameter of the jet before solidifying as a nano to micro fibre at the collector (22).
Figure 1.16 Diagram of electrospinning setup (a) and Taylor cone formation (b).
Electrospinning is a promising method to prepare solid dispersions. It demonstrates
potential benefits over the other solid dispersion preparation methods (25-27, 133). In
comparison to the melting based methods and spray drying, electrospinning has no heating
element. Thus, it is suitable for preparing solid dispersions of thermosensitive APIs. The
process of solvent evaporation for the electrospinning takes only a few microseconds (193,
196). As a consequence, the API is immediately entrapped in polymer matrices in a
molecularly dispersion manner. Hence, electrospinning can be used to achieve molecular
dispersions. The non-woven solid dispersion electrospun fibres are the final products that
can be used directly after preparation and do not require any additional downstream
processing, i.e., oral mats, transdermal patches and wound healing scaffolds (25-27, 197-
199). However, the solid dispersions that are produced from HME require IM as a terminal
process to shape the final products or pulverise the extrudates before compressing into
tablets (168, 169, 176). Therefore, electrospinning is a single step process to achieve the
final products.
In addition, electrospinning technology shows many benefits in pharmaceutical drug
delivery research, which are evident from the large increase in the number of
electrospinning research articles (27). The electrospinning setting is simple which can be a
custom-made apparatus, in comparison to HME, IM and spray drying (193, 200).
Therefore, it comes with accessible prices. Electrospinning requires a small amount of
Capillary
Taylor cone
Liquid Jet
Capillary
Pendant drop
Apply electrical voltage
High Voltage Supplier
Drug reservoir
Syringe Pump Collector
a b

46
material (milligrams to grams) for sample preparation for each batch. This shows
advantages over HME and spray drying that require a greater quantity of the starting
materials for sample preparation. Hence, electrospinning can be a reasonable choice for
preparing expensive research specimens, for example, new drug candidate compounds,
DNA, RNA and cells. In addition, using a special spinneret can modify the structure of the
electrospun fibres at the nanoscale. This technique is called coaxial electrospinning and
allows the rendering of a core-shell structure for the electrospun fibres in a nanometer range
(21, 160, 201).
However, there are limitations associated with the electrospinning process. The
optimisation process of electrospinning depends on many factors, i.e., type of polymer,
solvent, molecular weight, concentration, feeding rate, applied voltage and distance from
the spinneret to the collector (202). It requires an expertise and time to optimise these
conditions. The conventional lab scale electrospinning has a significant drawback in terms
of the low production rate, which impedes it from being scaled up into industrial scale
production (203). Considering lab scale electrospinning, it can produce grams of
electrospun fibres per hour. Free surface electrospinning is a solution to the low production
rate of electrospinning. It could potentially increase the production to a kilogram per hour
with a continuous electrospinning fabrication process (203), which will be discussed later
in section 1.5.4.
1.5.1 Factors influencing electrospinning
There are three main categories of factors that can significantly affect the electrospinning
process and the resulting fibre morphology. They are solution factors, apparatus parameters
and environmental humidity. Therefore, attention must be carefully paid to the optimisation
of these electrospinning parameters (22, 192, 204).
1.5.1.1 Solution factors
The electrospinning solution is defined as the solutions that contain a spinnable polymer in
a spinnable solvent. To determine whether a solution is suitable for the electrospinning
process, the physical properties, such as concentration, molecular weight, solvent volatility,
conductivity and dielectric, need to be taken into account (193, 202). Most solvents can
provide sufficient conductivity for electrospinning. However, if prioritising relative to
spinnability and significant fibrous morphology change, the polymeric concentration,
molecular weight and solvent volatility are the important factors that need to be considered
(204-206).
Polymer concentration and polymer molecular weight
At given apparatus parameters (voltage, flow rate and distance), the spinnability of the
polymer solution is determined by the concentration. The polymer chains entanglement

47
needs to be sufficient to maintain the fibrous structure against the contraction force from
the surface tension that try to minimise the surface area. Otherwise, the contraction forces
from the surface tension will occur and leave beaded defects on the fibrous structure (202).
In the case of a very dilute solution, insufficient chain entanglement leads to the liquid jet
breaking down into small droplets; this process is identified as electrospray (207).
Increasing the concentration of the polymeric solution results in fewer beaded defects,
enlarges the fibrous diameter and overall the fibres become uniform in diameter (208). As
the concentration is proportional to viscosity, the highly concentrated solution prevents
fibre formation due to inefficient solution flow control through the capillary (22). Figure
1.17 illustrates the effect of polymer concentration on fibrous architecture formation.
Figure 1.17 Scanning electron micrographs of electrospun polystyrene fibres on
stationary Aluminium foil of 80 rpm and applied voltage of 15 kV with different
concentrations of polystyrene /dimethylformamide solutions (a) 10%, (b) 23%, (c) 27%,
(d) 32% and (e) 40% (w/v), reproduced from reference (209).
The molecular weight of the polymer chain is another factor that demonstrates an impact
on the spinnability. The medium molecular weight PVP K-30 needs a concentration of at
least 30% w/v in ethanol to form electrospun fibres, but the higher molecular weight grade
PVP K-90 requires only 5% w/v in the same solvent to fabricate polymer fibres (23, 26,
210). The high molecular weight polymers enhance the polymer chain entanglement
resulting in a reduction in the concentration that forms electrospun fibres.
Solvent volatility
The choice of solvent is another important factor contributing to the spinnability of the
polymer in the electrospinning process. To form solid fibres, volatile solvents are used as

48
the vehicle. The solvents used in electrospinning are expected to evaporate completely from
the fibres before the fibres deposit on the collector (193, 211). Solvents with different
volatilities influence the morphology and spinnability of the polymer at given
concentrations. Wannatong and coworkers reported that polystyrene demonstrated
different fibrous morphologies and percent yields among the six solvents used in their study
(205). Tetrahydrofuran was the solvent of choice for polystyrene, which offered the highest
percentage yield and uniform cylindrical fibrous structure. Moreover, the solvent volatility
was reported to influence the formation of micro-nano pores on the electrospun fibres (212,
213). Megelski et al. and Luo et al. successfully prepared porous electrospun fibres from
polystyrene and polymethyl silsesquioxane by using tetrahydrofuran for the polystyrene
fibres and a mixture of propanol and methanol for the polymethyl silsesquioxane (212,
213). Organic solvents are often used as the vehicle for the preparation of solid dispersions
from electrospinning because they are mutual solvents for drugs and polymers. In addition,
organic solvents offer fast solvent evaporation that rapidly embeds the drug in the polymer
matrices.
1.5.1.2 Apparatus parameters
In addition to the solution parameters, apparatus parameters are another set of factors that
influence the spinnability. They can be classified as applied voltage, flow rate, capillary-
collector distance and capillary modification. These parameters will be discussed in the
following sections.
Applied voltages
To transform a pendant drop to a Taylor cone, a sufficient applied voltage is a prerequisite.
A Taylor cone is formed after the charges overcome the surface tension of the
electrospinning solution (193, 200). Both positive and negative high voltage suppliers can
be used. It is noted that the particular details of the electrospinning set up are different
between a positive and negative high voltage supplier (202). An insufficient voltage leads
to a surface tension rebound that causes beaded fibres. The required voltage needs to be
maintained slightly above the point at which a stable Taylor cone is obtained to ensure the
stability of the electrospinning process and to reduce the fibre diameter distribution. The
increase in applied voltage results in an increase in the electrical field. Consequently, the
fluid jet is accelerated and this increases the time of flight to the collector due to a higher
degree of blending instability (200). This results in a decrease in the diameters of the
electrospun fibres. However, the over executed high voltages decrease the Taylor volume
until it moves to the side of the capillary (214). This phenomenon is caused by imbalances
between the fluid fed through the capillary and the liquid jet that travels to the collector
side. As a consequence, the side Taylor cone influences the solution flow that leads to
increasing beading defects on the fibres (22, 214).

49
Feeding rate
The amount of polymer solution in the electrospinning process is determined by the feeding
rate. Gravity and pumps have been used to control the solution feeding from the reservoir
(202). Pumps are frequently used because they offer a precise and adjustable feeding rate.
The feeding rate influences the stability of the Taylor cone. At the given voltage, the fluid
is drawn to a collector as it is influenced by an electrical field. To stabilise the Taylor cone,
sufficient fluid needs to be fed through the capillary constantly. A high feed rate leads to
an increased diameter of the electrospun fibres and bead defects because the amount of
fluid has increased (215). An overly excuted feed rate causes a dripping of the solution
because of the imbalance in the fluid feeding and fluid drawing to the collector. Therefore,
a slow feed rate is preferable in electrospinning (22). Moreover, an electrospinning solution
that prepares in organic solvents offers a quicker feed rate than a solution in an aqueous
solvent because the volatility of the organic solvents is higher than that of the aqueous
solvents.
Spinneret to collector distance
The distance from the spinneret to the collector is another factor that affects the spinnability
and morphology of the electrospun fibres (22). An appropriate distance is required to allow
the liquid to completely dry before depositing on the collector. The distance in the
electrospinning depends on the volatility of the solvent. A highly volatile solvent, such as
dichloromethane, requires a short distance while water requires a longer distance to
evaporate completely from the fibrous matrices (194, 216).
1.5.1.3 Environmental humidity during electrospinning process
Environmental humidity plays a significant role in the electrospinning process. It can
reduce the solvent volatility and cause a clogging at the tip of the spinneret (210).
Additionally, high humidity causes water condensation on the electrospun fibres, which
affects the morphology of the fibres (210, 217). In the case of a hydrophilic polymer, such
as PVP, the electrospun fibres fuse and form transparent films at a relative humidity greater
than 60%RH (210).. On the contrary, hydrophobic polystyrenes in a THF solution were
electrospun at different relative humidities. Circular pores with sizes between 60-190 nm
were formed on the surface of the polystyrene at a relative humidity greater than 25%. The
average pore size increased upon higher relative humidities. The authors explained that the
moisture condenses into tiny droplets on the surface of the electrospun fibres during the
flight of the liquid jets toward to the collector. After the small water droplets dry, they leave
imprints as circular pores on the surface of the electrospun fibres (217).

50
1.5.2 Coaxial electrospinning
The modification of the spinnerets for the electrospinning can affect the physical properties
and structure of the electrospun fibres. A phase-separated layer (known as the core-shell
structure) can be created inside an electrospun fibre by using a modified capillary (coaxial
needle) (20, 21, 160, 218). This needle is composed of at least two different diameters of
needles overlaying each other. The apparatus set up is similar to the conventional
electrospinning but requires another flow regulator unit as seen in Figure 1.18. One
solution is fed through the core layer and the other one is fed at the shell layer. The outer
layer solution is typically a spinnable polymer to form structural electrospun fibres while
the core solution can be flexible and non-spinnable because it will be embedded in a core
of electrospun fibres. The two solutions meet at the tip of the coaxial needle and are pulled
by the electrostatic force toward the collector. The liquid jet solidifies, and the core-shell
structure fibres are obtained (20, 160, 218). Additionally, the thickness of the outer and
inner layers can be modified by adjusting the feeding rate of the external and the internal
solutions (160).
Figure 1.18 Coaxial electrospinning set up with modified capillary and structure of core-
shell electrospun fibres under transition electron microscopy. This figure is adapted from
reference (218).
The use of core-shell structured electrospun fibres expands many novel applications in
tissue engineering and drug delivery (160, 201, 219). Chen et al. prepared coaxial
electrospun fibres from collagen (shell) and polyurethane (PU) (core). The core-shell
electrospun fibres of PU-collagen demonstrated a better cell viability than the pure collagen
and PU electrospun fibres (219). The authors explained that the outer layer of the collagen
mimicked the extracellular matrices, which enhanced cell viability, while the core PU

51
maintained the three-dimensional fibrous structure, which provides a good environment for
the cell growth. In comparison with collagen fibres, it swollen into a hydrogel which is not
a suitable condition for cell proliferation (219). In addition, core-shell electrospun fibres
can be used as modified release devices for the oral drug delivery route (160, 201). The
details of this application will be discussed in the next section.
However, there are several concerns about the coaxial electrospinning process. In
comparison to the single spinneret electrospinning, it requires a much slower solution
feeding rate of approximately less than 1 ml.hr-1 (21, 160, 201), which is due to the core
and shell solutions needing to slowly meet at the tip of the spinneret to form the core-shell
structure before being accelerated toward to the collector. Consequently, the coaxial
electrospinning has a very low production rate. Moreover, the core-shell structure is
difficult to characterise. Transition electron microscopy is the only technique used to
investigate the core-shell structure (20, 218, 219). This technique is based on the atomic
density of the material. Particularly if the atomic densities of the core and shell are similar,
it is very difficult to distinguish between the core and the shell structures.
1.5.3 Applications of electrospinning in drug delivery
Electrospinning has already demonstrated a wide range of applications in biomedical areas,
such as tissue engineering, wound dressing and pharmaceutical drug delivery (25, 192, 196,
220). Electrospinning gained interest in pharmaceutics a decade ago. Many pharmaceutical
researchers have been using the electrospinning technique to produce devices or solid
dosage forms for various types of drug delivery system, such as transdermal patches,
wound scaffolds and oral fibrous films (21, 23, 24, 26, 160, 198, 199, 221-228).
Oral drug delivery
Electrospinning is a high potential technology that can produce molecular dispersions. This
contributes to the ultrafast solvent evaporation that enhances the homogeneity of the drug
and the carrier (26, 133, 229, 230). The advantages of molecular dispersion of APIs in
electrospun fibrous matrices is improving the solubility of poorly water-soluble drugs and
stabilising them. Yu et al. prepared electrospun fibres of ibuprofen, a poorly water-soluble
drug, with a hydrophilic matrix PVP. The ibuprofen PVP electrospun fibres significantly
improved the drug solubility in comparison to the physical mixture. In addition, ibuprofen
completely dissolved within 30 minutes (26). Ignatious and co-workers showed that
polyethylene oxide electrospun with nabumetone enhanced the aqueous solubility of the
drug in comparison to its crystalline form. Furthermore, the electrospun fibrous formulation
demonstrates a faster drug release rate than the nanocrystals formulation (25).

52
The molecular dispersion of API in electrospun matrices enhances the stability of the
electrospun formulations. Brettmann et al. observed the different domain sizes of drug-
polymer phase separation in the solid dispersion that was prepared by HME and
electrospinning (133). The hot melt extrudate showed a domain size greater than 100 nm
while the electrospun fibrous formulations exhibited domain sizes between 2 and 11 nm.
In another study by the same group, the authors demonstrated that high drug loading
electrospun fibres of indomethacin and aliskiren at 50% were stable under a storage
condition of 40°C with a low humidity condition (231). Lopez et al. demonstrated that
electrospining can stabilise indomethacin and griseofulvin in their amorphous form in PVP
matrices for over eight months in a desiccator filled with silica gel (232).
Electrospining can be used to prepare various types drug delivery devices for the oral route,
including immediate release, targeted release, sustained release and biphasic release,
depending on the types of polymer matrices used. Hydrophilic polymers, including PVP,
PEO and PVA, are used as matrices for immediate-release oral fibrous films for an oral
route (21, 25, 26, 224, 233). These polymers quickly dissolve and release API when they
are in contact with an aqueous media. The solid dispersion of PCM and PVP, which are
prepared by electrospinning, demonstrated a faster drug release in comparison to the same
formulation produced from freeze-drying, vacuum drying and heat drying methods (24).
This follows from electrospun fibres having a high surface area to volume ratio.
The targeted release of electrospun fibres can be prepared using an enteric coated polymer
or pH dependence dissolvable polymer, such as Eudragit L100 or Eudragit L100-55 (162,
201, 234). Yu’s group prepared diclofenac sodium electrospun fibrous mats for colon
targeted drug delivery using Eudragit L100-55 and Eugragit L100 as the fibre matrices.
These polymers dissolve at a pH greater than 6.8. The authors observed that the diclofenac
sodium loaded Eudragit L100-55 and Eugragit L100 electrospun fibres released the API at
less than 5% in an acidic pH. While at the optimal pH, the diclofenac showed a complete
release within 30 min (201, 234).
Therefore, electrospinning can be a potential way to produce molecular dispersions of FF,
the main model drug in this study. This is due to the electrospinning stabilising FF
molecules in the fibrous polymeric matrix as molecularly dispersed or in their amorphous
state resulting in improvements in the physical stability of the molecular dispersion
formulations. Moreover, the molecular dispersions of FF electrospun fibres may
significantly improve its aqueous solubility and also provide a fast release because of its
high surface area to volume ratio.
In addition, the modified release of electrospun formulations can be obtained by blending
immediate release polymers and sustained release polymers in an appropriate ratio (21,

53
160). Yu et al. prepared electrospun fibres from coaxial electrospinning technology by
varying the ratio of PVP and EC. The authors successfully achieved a biphasic release from
PVP to EC in the proportion 1:1 (21). Jiang et al. reported a similar observation in which a
biphasic drug release from electrospun fibres was obtained by blending PVP and Zein at
the proportion 1:1 (160). These authors used the coaxial electrospinning to manipulate the
core-sheath fibre structure. This technique has a very low production rate and requires
special equipment for the double layer spinnerets. Therefore, the ideal system for the
biphasic electrospun formulation would be a homogeneous phase of drug and polymer
during storage that provides high stability. Upon dissolution, the in situ phase separation
occurs between the hydrophilic and the hydrophobic polymers. The hydrophilic polymer
provides immediate release while the API is slowly released from the hydrophobic
polymer.
Topical drug delivery applications
In topical drug delivery, electrospun fibres can be used as a potential means for transdermal
and wound healing scaffold applications. Verreck et al. prepared electrospun matrices from
non-biodegradable polyurethane (PU) for a transdermal patch application. The transdermal
PU electrospun patch demonstrated the prolonged-release of the model drug itraconazole
and ketanserin (197). Alhusein et al. prepared three-layered electrospun fibrous wound
scaffolds from a sandwich of poly(ethylene-co-vinyl acetate) between PCL layers that
contained an antibiotic, tetracycline (198). The scaffold could maintain the antibiotic
release for 14 days.
Wound healing scaffolds demonstrate more complicated functions than the oral route
dosage forms, including requiring different APIs to be released in various periods. Thakur
et al. prepared electrospun scaffolds from poly-l-lactic acid that contained lidocaine
(analgesic) and mupirocin (antibiotic). Lidocaine was instantly released at the early stage
to subdue pain. Subsequently, mupirocin, an antiseptic, had sustained released from the
scaffolds to minimise the risk of bacterial infection (227). In addition, the scaffolds from
the electrospun fibres also offer advantages of absorbing wound secretions and providing
air ventilation (235). These functions promote cell proliferation at the wounded area.
1.5.4 Future outlook for electrospinning in pharmaceutical industry
Electrospinning has recently attracted the attentions of pharmaceutics as a novel method
for drug delivery, as shown by the numerous research studies and patent applications that
rocketed in the past decade (25, 192, 220, 221, 236). It is a versatile technique that allows
the production of various types of drug delivery devices, as aforementioned. Despite the
fact that no commercial pharmaceutical product from electrospinning is available up to
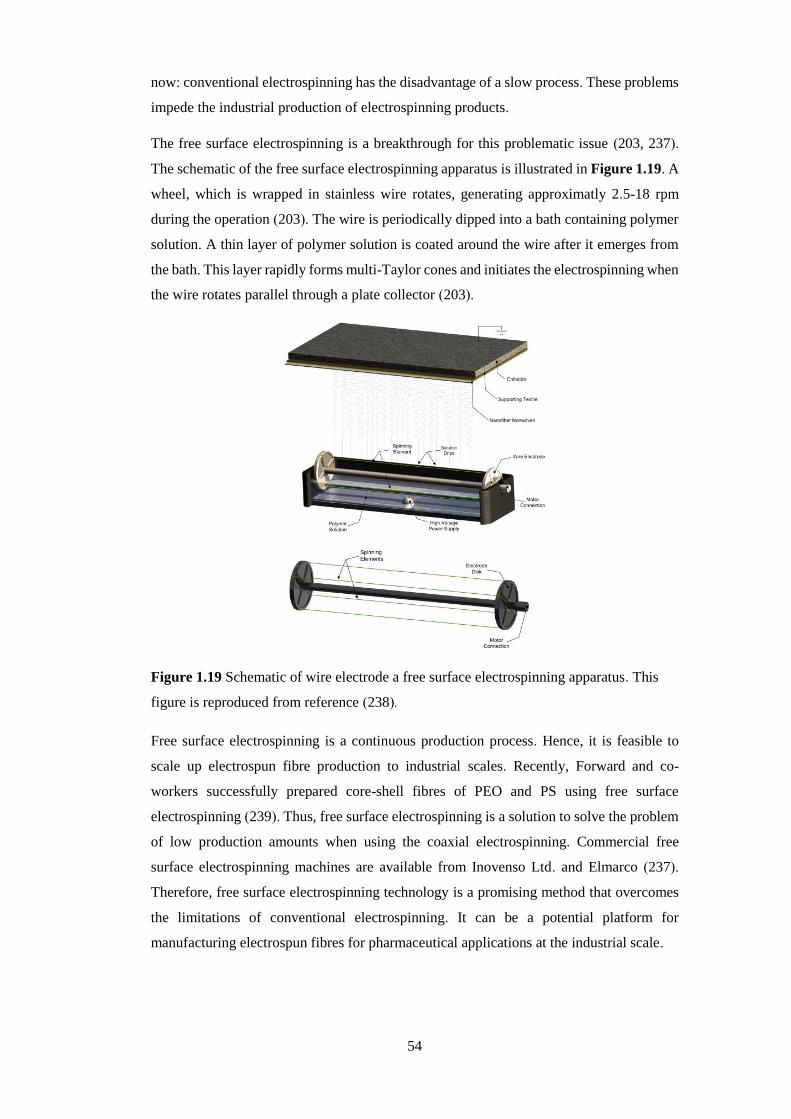
54
now: conventional electrospinning has the disadvantage of a slow process. These problems
impede the industrial production of electrospinning products.
The free surface electrospinning is a breakthrough for this problematic issue (203, 237).
The schematic of the free surface electrospinning apparatus is illustrated in Figure 1.19. A
wheel, which is wrapped in stainless wire rotates, generating approximatly 2.5-18 rpm
during the operation (203). The wire is periodically dipped into a bath containing polymer
solution. A thin layer of polymer solution is coated around the wire after it emerges from
the bath. This layer rapidly forms multi-Taylor cones and initiates the electrospinning when
the wire rotates parallel through a plate collector (203).
Figure 1.19 Schematic of wire electrode a free surface electrospinning apparatus. This
figure is reproduced from reference (238).
Free surface electrospinning is a continuous production process. Hence, it is feasible to
scale up electrospun fibre production to industrial scales. Recently, Forward and co-
workers successfully prepared core-shell fibres of PEO and PS using free surface
electrospinning (239). Thus, free surface electrospinning is a solution to solve the problem
of low production amounts when using the coaxial electrospinning. Commercial free
surface electrospinning machines are available from Inovenso Ltd. and Elmarco (237).
Therefore, free surface electrospinning technology is a promising method that overcomes
the limitations of conventional electrospinning. It can be a potential platform for
manufacturing electrospun fibres for pharmaceutical applications at the industrial scale.

55
1.6 Aims of the project
FF is a poorly water-soluble drug. The factors controlling its crystallisation from the
supercooled amorphous state have not been determined. The amorphous FF shows a high
driving force for crystallisation over the entire range of temperatures. However, it has a
high entropic barrier for crystallisation and high configuration entropy. This mean that the
amorphous FF is difficult to crystallise spontaneously because it has a low probability to
form an optimal orientation and conformation, which is favoured for the homogeneous
nucleation (9, 10). Thus, nucleation is the rate-limiting step for FF crystallisation.
Heterogeneous nucleation using impurity additives can be a potential means to control the
crystallisation of the amorphous FF. In addition, the temperature and surface availability
of the supercooled FF during the crystallisation are important factors that possibly affect
the polymorphism of FF. Therefore, manipulating these factors may be a promising way to
crystallise amorphous FF into particualar polymorphs.
To further improve the drug delivery of FF, solid dispersions can be an efficient
approach.The solid dispersions containing polymer blends, which are produced from the
electrospinning technique, could be a potential approach to address the problem of being
poorly water soluble and the physical instability of amorphous FF. The electrospinning
process is capable of preparing the molecular solid dispersions to enhance the aqueous
solubilityof the poorly water-soluble drugs (25, 27). In addition, it provides a high surface
area to volume ratio for the fibrous solid dispersion, which can offer a fast drug release (26,
27). Blending the hydrophobic polymer to the hydrophilic polymer can be a potential
approach to reduce the moisture uptake of the solid dispersion formulations and to increase
the physical stability of the amorphous FF. In this study, FF was formulated as electrospun
fibres with the polymer blend matrices of PVP, a hydrophilic carrier, and more hydrophobic
carriers, including HPMCAS, Soluplus or Eudragit E.
Another aspect of the control-release application, blending water soluble with water
insoluble or pH dependent soluble polymers can be a potential way to formulate a tuneable
release formualtion (21, 160, 162). Therefore the final stage of this project explored the
potential of using polymer blended fibres for tuneable drug release. The water soluble
polymer PVP and pH dependent soluble HPMCAS were used as the electrospun fibrous
matrices for the biphasic drug release purpose. In addition, the in situ phase separation of
the fibres during dissolution was studied in association with drug release.
56
The key objectives of this project are summarised below:
1. To fully understand the crystallisation behaviour of FF from its supercooled
amorphous state. The heterogeneous nucleation approaches, included the surface
disruption technique and impurity additives (talc), were used to crystallise amorphous
FF. In chapter 3, the effect of external triggers, including crystal growth temperatures
and open top surface of the amorphous FF during its crystallisation, were investigated.
Chapter 4 explores the use of talc to crystallise amorphous FF, which results in the
new polymorph of FF. Furthermore, the factors that influence a polymorphic
transformation between the metastable form and the stable form were also studied.
2. To develop polymer blend based electrospun fibrous formulations to stabilise the
amorphous FF, reduce moisture absorption, enhance physical stability and improve
dissolution of the drug. Moreover, the influences of moisture uptake on the drug-
polymer miscibility and structural deformation in the polymer blended electrospun
fibres were also investigated (Chapter 5).
3. To provide detailed understandings of the phase separation in the electrospun polymer
blend nanofibers. Using in situ phase separation of the polymer blend fibres to
potentially manipulated the drug release rate was explored (Chapter 6).

57
1.7 References
1. Mullin JW. Crystallization: Butterworth-Heinemann; 2001.
2. Bernstein J. Polymorphism in molecular crystals: Oxford University Press; 2007.
3. Hilfiker R. Polymorphism: in the pharmaceutical industry: John Wiley & Sons; 2006.
4. Singhal D, Curatolo W. Drug polymorphism and dosage form design: a practical perspective.
Advanced Drug Delivery Reviews. 2004;56(3):335-47.
5. Tao J, Jones KJ, Yu L. Cross-Nucleation between d-Mannitol Polymorphs in Seeded
Crystallization. Crystal Growth & Design. 2007;7(12):2410-4.
6. Reischl D, Röthel C, Christian P, Roblegg E, Ehmann HMA, Salzmann I, et al. Surface-Induced
Polymorphism as a Tool for Enhanced Dissolution: The Example of Phenytoin. Crystal Growth & Design.
2015;15(9):4687-93.
7. Chadwick K, Myerson A, Trout B. Polymorphic control by heterogeneous nucleation-A new
method for selecting crystalline substrates. CrystEngComm. 2011;13(22):6625-7.
8. Price CP, Grzesiak AL, Matzger AJ. Crystalline Polymorph Selection and Discovery with Polymer
Heteronuclei. Journal of the American Chemical Society. 2005;127(15):5512-7.
9. Zhou D, Zhang GGZ, Law D, Grant DJW, Schmitt EA. Physical stability of amorphous
pharmaceuticals: Importance of configurational thermodynamic quantities and molecular mobility. Journal of
Pharmaceutical sciences. 2002;91(8):1863-72.
10. Amstad E, Spaepen F, Weitz DA. Crystallization of undercooled liquid fenofibrate. Physical
Chemistry Chemical Physics. 2015;17(44):30158-61.
11. Heinz A, Gordon KC, McGoverin CM, Rades T, Strachan CJ. Understanding the solid-state forms
of fenofibrate–a spectroscopic and computational study. European Journal of Pharmaceutics and
Biopharmaceutics. 2009;71(1):100-8.
12. Chiou WL, Riegelman S. Pharmaceutical Applications of Solid Dispersion Systems Journal of
Pharmaceutical sciences. 1971; 60(9):1281-301.
13. Christian Leuner, Dressman J. Improving drug solubility for oral delivery using solid dispersions.
European Journal of Pharmaceutics and Biopharmaceutics 2000;50: 47-60.
14. Serajuddin ATM. Solid dispersion of poorly water-soluble drugs: Early promises, subsequent
problems, and recent breakthroughs. Journal of Pharmaceutical sciences. 1999;88(10):1058-66.
15. Urbanetz NA. Stabilization of solid dispersions of nimodipine and polyethylene glycol 2000.
European Journal of Pharmaceutical Sciences. 2006;28(1–2):67-76.
16. Rumondor ACF, Stanford LA, Taylor LS. Effects of Polymer Type and Storage Relative Humidity
on the Kinetics of Felodipine Crystallization from Amorphous Solid Dispersions. Pharmaceutical Research.
2009;26(12):2599-606.
17. Bley H, Fussnegger B, Bodmeier R. Characterization and stability of solid dispersions based on
PEG/polymer blends. International Journal of Pharmaceutics. 2010;390(2):165-73.
18. Yang Z, Nollenberger K, Albers J, Craig D, Qi S. Microstructure of an Immiscible Polymer Blend
and Its Stabilization Effect on Amorphous Solid Dispersions. Molecular Pharmaceutics. 2013;10(7):2767-80.
19. Karavas E, Georgarakis E, Bikiaris D. Felodipine nanodispersions as active core for predictable
pulsatile chronotherapeutics using PVP/HPMC blends as coating layer. International Journal of
Pharmaceutics. 2006;313(1–2):189-97.
20. Jiang H, Hu Y, Li Y, Zhao P, Zhu K, Chen W. A facile technique to prepare biodegradable coaxial
electrospun nanofibers for controlled release of bioactive agents. Journal of Controlled Release. 2005;108(2–
3):237-43.
21. Yu D-G, Wang X, Li X-Y, Chian W, Li Y, Liao Y-Z. Electrospun biphasic drug release
polyvinylpyrrolidone/ethyl cellulose core/sheath nanofibers. Acta biomaterialia. 2012.
22. Sill TJ, von Recum HA. Electrospinning: Applications in drug delivery and tissue engineering.
Biomaterials. 2008;29(13):1989-2006.
23. Yu D-G, Branford-White C, Shen X-X, Zhang X-F, Zhu L-M. Solid Dispersions of Ketoprofen in
Drug-Loaded Electrospun Nanofibers. Journal of Dispersion Science and Technology. 2010;31(7):902-8.
24. Yu D-G, Branford-White C, White K, Li X-L, Zhu L-M. Dissolution improvement of electrospun
nanofiber-based solid dispersions for acetaminophen. AAPS PharmSciTech. 2010;11(2):809-17.
25. Ignatious F, Sun L, Lee C-P, Baldoni J. Electrospun nanofibers in oral drug delivery.
Pharmaceutical research. 2010;27(4):576-88.
26. Yu D-G, Shen X-X, Branford-White C, White K, Zhu L-M, Bligh SA. Oral fast-dissolving drug
delivery membranes prepared from electrospun polyvinylpyrrolidone ultrafine fibers. Nanotechnology.
2009;20(5):055104.
27. Yu D-G, Zhu L-M, White K, Branford-White C. Electrospun nanofiber-based drug delivery
systems. Health. 2009;Vol.01No.02:9.
28. Bates S, Zografi G, Engers D, Morris K, Crowley K, Newman A. Analysis of amorphous and
nanocrystalline solids from their X-ray diffraction patterns. Pharmaceutical research. 2006;23(10):2333-49.
29. Yu L. Amorphous pharmaceutical solids: preparation, characterization and stabilization. Advanced
Drug Delivery Reviews. 2001;48(1):27-42.
30. Sheth AR, Bates S, Muller FX, Grant DJW. Local Structure in Amorphous Phases of Piroxicam
from Powder X-ray Diffractometry. Crystal Growth & Design. 2005;5(2):571-8.
31. Crowley KJ, Zografi G. Cryogenic grinding of indomethacin polymorphs and solvates: Assessment
of amorphous phase formation and amorphous phase physical stability. Journal of Pharmaceutical sciences.
2002;91(2):492-507.

58
32. Hancock BC, Zografi G. Characteristics and significance of the amorphous state in pharmaceutical
systems. Journal of Pharmaceutical sciences. 1997;86(1):1-12.
33. Hancock BC, Parks M. What is the True Solubility Advantage for Amorphous Pharmaceuticals?
Pharmaceutical research. 2000;17(4):397-404.
34. Kim J-S, Kim M-S, Park HJ, Jin S-J, Lee S, Hwang S-J. Physicochemical properties and oral
bioavailability of amorphous atorvastatin hemi-calcium using spray-drying and SAS process. International
Journal of Pharmaceutics. 2008;359(1–2):211-9.
35. Vasconcelos T, Sarmento B, Costa P. Solid dispersions as strategy to improve oral bioavailability
of poor water soluble drugs. Drug Discovery Today. 2007;12(23–24):1068-75.
36. Wu T, Yu L. Surface Crystallization of Indomethacin Below T g. Pharmaceutical Research.
2006;23(10):2350-5.
37. Zhu L, Wong L, Yu L. Surface-enhanced crystallization of amorphous nifedipine. Molecular
Pharmaceutics. 2008;5(6):921-6.
38. Sperling LH. Introduction to physical polymer science: John Wiley & Sons; 2005.
39. Chen S, Xi H, Yu L. Cross-Nucleation between ROY Polymorphs. Journal of the American
Chemical Society. 2005;127(49):17439-44.
40. Sun Y, Zhu L, Wu T, Cai T, Gunn EM, Yu L. Stability of Amorphous Pharmaceutical Solids:
Crystal Growth Mechanisms and Effect of Polymer Additives. The AAPS Journal. 2012;14(3):380-8.
41. De Yoreo JJ, Vekilov PG. Principles of crystal nucleation and growth. Reviews in mineralogy and
geochemistry. 2003;54(1):57-93.
42. Cubillas P, Anderson MW. Synthesis mechanism: crystal growth and nucleation. Zeolites and
Catalysis: Synthesis, Reactions and Applications. 2010:1-55.
43. Myerson AS. Concluding remarks. Faraday Discussions. 2015;179(0):543-7.
44. Trasi NS, Taylor LS. Effect of polymers on nucleation and crystal growth of amorphous
acetaminophen. CrystEngComm. 2012;14(16):5188-97.
45. Turnbull D, Fisher JC. Rate of Nucleation in Condensed Systems. The Journal of Chemical
Physics. 1949;17(1):71-3.
46. Yamada M, Mossa S, Stanley HE, Sciortino F. Interplay between Time-Temperature
Transformation and the Liquid-Liquid Phase Transition in Water. Physical Review Letters.
2002;88(19):195701.
47. Volmer M. Kinetik der phasenbildung. 1939.
48. Parambil JV, Poornachary SK, Tan RB, Heng JY. Template-induced polymorphic selectivity: the
effects of surface chemistry and solute concentration on carbamazepine crystallisation. CrystEngComm.
2014;16(23):4927-30.
49. Caridi A, Kulkarni SA, Di Profio G, Curcio E, Ter Horst JH. Template-induced nucleation of
isonicotinamide polymorphs. Crystal Growth & Design. 2014;14(3):1135-41.
50. Boukerche M, Mangin D, Klein J, Monnier O, Hoff C. Inducing the stable polymorph using
heterogeneous primary nucleation. Chemical Engineering Research and Design. 2010;88(11):1474-8.
51. Lang M, Grzesiak AL, Matzger AJ. The Use of Polymer Heteronuclei for Crystalline Polymorph
Selection. Journal of the American Chemical Society. 2002;124(50):14834-5.
52. Lu L, Dahle AK, StJohn DH. Heterogeneous nucleation of Mg–Al alloys. Scripta Materialia.
2006;54(12):2197-201.
53. Cantor B, Doherty RD. Heterogeneous nucleation in solidifying alloys. Acta Metallurgica.
1979;27(1):33-46.
54. Agrawal SG, Paterson AHJ. Secondary Nucleation: Mechanisms and Models. Chemical
Engineering Communications. 2015;202(5):698-706.
55. Verdurand E, Bebon C, Colson D, Klein JP, Blandin AF, Bossoutrot JM. Secondary nucleation and
growth of organic crystals in industrial crystallization. Journal of Crystal Growth. 2005;275(1–2):e1363-e7.
56. Kadam SS, Kramer HJM, ter Horst JH. Combination of a Single Primary Nucleation Event and
Secondary Nucleation in Crystallization Processes. Crystal Growth & Design. 2011;11(4):1271-7.
57. Beckmann W. Seeding the Desired Polymorph: Background, Possibilities, Limitations, and Case
Studies. Organic Process Research & Development. 2000;4(5):372-83.
58. Nancollas GH, Purdie N. The kinetics of crystal growth. Quarterly Reviews, Chemical Society.
1964;18(1):1-20.
59. Kossel W. Zur Energetik von Oberflächenvorgängen. Annalen der Physik. 1934;413(5):457-80.
60. Bahrig L, Hickey SG, Eychmuller A. Mesocrystalline materials and the involvement of oriented
attachment - a review. CrystEngComm. 2014;16(40):9408-24.
61. Zipp GL, Rodríguez-Hornedo N. The mechanism of phenytoin crystal growth. International Journal
of Pharmaceutics. 1993;98(1):189-201.
62. Kirkpatrick RJ. Crystal-growth from melt-review. American Mineralogist. 1975;60(9-10):798-814.
63. Bauer J, Spanton S, Henry R, Quick J, Dziki W, Porter W, et al. Ritonavir: an extraordinary
example of conformational polymorphism. Pharmaceutical research. 2001;18(6):859-66.
64. Haisa M, Kashino S, Kawai R, Maeda H. The monoclinic form of p-hydroxyacetanilide. Acta
Crystallographica Section B: Structural Crystallography and Crystal Chemistry. 1976;32(4):1283-5.
65. Haisa M, Kashino S, Maeda H. The orthorhombic form of p-hydroxyacetanilide. Acta
Crystallographica Section B: Structural Crystallography and Crystal Chemistry. 1974;30(10):2510-2.
66. Kato Y, Okamoto Y, Nagasawa K, Ishihara I. New polymorphic forms of phenobarbital. Chemical
& pharmaceutical bulletin. 1984;32(10):4170.
67. Kobayashi Y, Ito S, Itai S, Yamamoto K. Physicochemical properties and bioavailability of
carbamazepine polymorphs and dihydrate. International Journal of Pharmaceutics. 2000;193(2):137-46.

59
68. Salole EG, Al-Sarraj FA. Spironolactone Crystal Forms. Drug Development and Industrial
Pharmacy. 1985;11(4):855-64.
69. Phadnis NV, Suryanarayanan R. Polymorphism in anhydrous theophylline—implications on the
dissolution rate of theophylline tablets. Journal of Pharmaceutical sciences. 1997;86(11):1256-63.
70. Zhang GGZ, Law D, Schmitt EA, Qiu Y. Phase transformation considerations during process
development and manufacture of solid oral dosage forms. Advanced Drug Delivery Reviews.
2004;56(3):371-90.
71. Clas S-D. The importance of characterizing the crystal form of the drug substance during drug
development. Curr Opin Drug Discov Devel. 2003;6(4):550-60.
72. Myrick ML, Baranowski M, Profeta LTM. An Experiment in Physical Chemistry: Polymorphism
and Phase Stability in Acetaminophen (Paracetamol). Journal of Chemical Education. 2010;87(8):842-4.
73. Six K, Verreck G, Peeters J, Binnemans K, Berghmans H, Augustijns P, et al. Investigation of
thermal properties of glassy itraconazole: identification of a monotropic mesophase. Thermochimica Acta.
2001;376(2):175-81.
74. Sekiguchi K, Tsuda Y, Kanke M. Dissolution Behavior of Solid Drugs. VI. Determination of
Transition Temperatures of Various Physical Forms of Sulfanilamide by Initial Dissolution Rate
Measurements. Chemical & pharmaceutical bulletin. 1975;23(6):1353-62.
75. Barbas R, Martí F, Prohens R, Puigjaner C. Polymorphism of Norfloxacin: Evidence of the
Enantiotropic Relationship between Polymorphs A and B. Crystal Growth & Design. 2006;6(6):1463-7.
76. Kanke M, Sekiguchi K. Dissolution Behavior of Solid Drugs. II. Determination of the Transition
Temperature of Sulfathiazole Polymorphs by Measuring the Initial Dissolution Rates. Chemical &
pharmaceutical bulletin. 1973;21(4):878-84.
77. Ting VP, Schmidtmann M, Wilson CC, Weller MT. Cisplatin: Polymorphism and Structural
Insights into an Important Chemotherapeutic Drug. Angewandte Chemie International Edition.
2010;49(49):9408-11.
78. Barrio M, Maccaroni E, Rietveld IB, Malpezzi L, Masciocchi N, Céolin R, et al. Pressure–
temperature state diagram for the phase relationships between benfluorex hydrochloride forms I and II: A
case of enantiotropic behavior. Journal of Pharmaceutical sciences. 2012;101(3):1073-8.
79. Newman AW, Childs SL, Cowans BA. Salt and Cocrystal Form Selection. Pharmaceutical
Sciences Encyclopedia: John Wiley & Sons, Inc.; 2010.
80. Burger A, Ramberger R. On the polymorphism of pharmaceuticals and other molecular crystals. I.
Microchimica Acta. 1979;72(3-4):259-71.
81. Burger A, Ramberger R. On the polymorphism of pharmaceuticals and other molecular crystals. II.
Microchimica Acta. 1979;72(3-4):273-316.
82. Behme RJ, Brooke D. Heat of fusion measurement of a low melting polymorph of carbamazepine
that undergoes multiple-phase changes during differential scanning calorimetry analysis. Journal of
Pharmaceutical sciences. 1991;80(10):986-90.
83. Nelyubina YV, Glukhov IV, Antipin MY, Lyssenko KA. "Higher density does not mean higher
stability" mystery of paracetamol finally unraveled. Chemical Communications. 2010;46(20):3469-71.
84. Moynihan HA, O'Hare IP. Spectroscopic characterisation of the monoclinic and orthorhombic
forms of paracetamol. International Journal of Pharmaceutics. 2002;247(1–2):179-85.
85. Janssens S, Van den Mooter G. Review: physical chemistry of solid dispersions. Journal of
Pharmacy and Pharmacology. 2009;61(12):1571-86.
86. Jones AOF, Chattopadhyay B, Geerts YH, Resel R. Substrate-Induced and Thin-Film Phases:
Polymorphism of Organic Materials on Surfaces. Advanced Functional Materials. 2016;26(14):2233-55.
87. Yeager JD, Ramos KJ, Mack NH, Wang H-L, Hooks DE. Transformation and Growth of
Polymorphic Nuclei through Evaporative Deposition of Thin Films. Crystal Growth & Design.
2012;12(11):5513-20.
88. Ehmann HMA, Werzer O. Surface Mediated Structures: Stabilization of Metastable Polymorphs on
the Example of Paracetamol. Crystal Growth & Design. 2014;14(8):3680-4.
89. Konno H, Taylor LS. Influence of different polymers on the crystallization tendency of molecularly
dispersed amorphous felodipine. Journal of Pharmaceutical sciences. 2006;95(12):2692-705.
90. Miyazaki T, Yoshioka S, Aso Y, Kojima S. Ability of polyvinylpyrrolidone and polyacrylic acid to
inhibit the crystallization of amorphous acetaminophen. Journal of Pharmaceutical sciences.
2004;93(11):2710-7.
91. Cai T, Zhu L, Yu L. Crystallization of Organic Glasses: Effects of Polymer Additives on Bulk and
Surface Crystal Growth in Amorphous Nifedipine. Pharmaceutical research. 2011;28(10):2458-66.
92. Ishida H, Wu T, Yu L. Sudden rise of crystal growth rate of nifedipine near Tg without and with
polyvinylpyrrolidone. Journal of Pharmaceutical sciences. 2007;96(5):1131-8.
93. Baird JA, Van Eerdenbrugh B, Taylor LS. A classification system to assess the crystallization
tendency of organic molecules from undercooled melts. Journal of Pharmaceutical sciences.
2010;99(9):3787-806.
94. Desiraju GR. The C−H···O Hydrogen Bond: Structural Implications and Supramolecular Design.
Accounts of Chemical Research. 1996;29(9):441-9.
95. Tipduangta P, Takieddin K, Fábián L, Belton P, Qi S. A New Low Melting-Point Polymorph of
Fenofibrate Prepared via Talc Induced Heterogeneous Nucleation. Crystal Growth & Design.
2015;15(10):5011-20.
96. Sekiguchi K, Obi N. Studies on Absorption of Eutectic Mixture. I. A Comparison of the Behavior
of Eutectic Mixture of Sulfathiazole and that of Ordinary Sulfathiazole in Man. Chemical & pharmaceutical
bulletin. 1961;9(11):866-72.

60
97. Jung J-Y, Yoo SD, Lee S-H, Kim K-H, Yoon D-S, Lee K-H. Enhanced solubility and dissolution
rate of itraconazole by a solid dispersion technique. International Journal of Pharmaceutics. 1999;187(2):209-
18.
98. Kim E-J, Chun M-K, Jang J-S, Lee I-H, Lee K-R, Choi H-K. Preparation of a solid dispersion of
felodipine using a solvent wetting method. European Journal of Pharmaceutics and Biopharmaceutics.
2006;64(2):200-5.
99. Ali S, Kolter K. Challenges and opportunities in oral formulation development. Am Pharm Rev.
2012;15(7).
100. Vo CL-N, Park C, Lee B-J. Current trends and future perspectives of solid dispersions containing
poorly water-soluble drugs. European Journal of Pharmaceutics and Biopharmaceutics. 2013;85(3, Part
B):799-813.
101. Kawabata Y, Wada K, Nakatani M, Yamada S, Onoue S. Formulation design for poorly water-
soluble drugs based on biopharmaceutics classification system: Basic approaches and practical applications.
International Journal of Pharmaceutics. 2011;420(1):1-10.
102. Law D, Wang W, Schmitt EA, Qiu Y, Krill SL, Fort JJ. Properties of rapidly dissolving eutectic
mixtures of poly(ethylene glycol) and fenofibrate: The eutectic microstructure. Journal of Pharmaceutical
sciences. 2003;92(3):505-15.
103. Górniak A, Wojakowska A, Karolewicz B, Pluta J. Phase diagram and dissolution studies of the
fenofibrate–acetylsalicylic acid system. Journal of thermal analysis and calorimetry. 2011;104(3):1195-200.
104. Yong CS, Oh Y-K, Jung SH, Rhee J-D, Kim H-D, Kim C-K, et al. Preparation of ibuprofen-loaded
liquid suppository using eutectic mixture system with menthol. European Journal of Pharmaceutical Sciences.
2004;23(4–5):347-53.
105. Vippagunta SR, Wang Z, Hornung S, Krill SL. Factors affecting the formation of eutectic solid
dispersions and their dissolution behavior. Journal of Pharmaceutical sciences. 2007;96(2):294-304.
106. Brettmann BK, Cheng K, Myerson AS, Trout BL. Electrospun Formulations Containing Crystalline
Active Pharmaceutical Ingredients. Pharmaceutical research. 2013;30(1):238-46.
107. Kawabata Y, Yamamoto K, Debari K, Onoue S, Yamada S. Novel crystalline solid dispersion of
tranilast with high photostability and improved oral bioavailability. European Journal of Pharmaceutical
Sciences. 2010;39(4):256-62.
108. Rumondor ACF, Ivanisevic I, Bates S, Alonzo DE, Taylor LS. Evaluation of Drug-Polymer
Miscibility in Amorphous Solid Dispersion Systems. Pharmaceutical research. 2009;26(11):2523-34.
109. Craig DQM. The mechanisms of drug release from solid dispersions in water-soluble polymers.
International Journal of Pharmaceutics. 2002;231(2):131-44.
110. Goldberg AH, Gibaldi M, Kanig JL. Increasing dissolution rates and gastrointestinal absorption of
drugs via solid solutions and eutectic mixtures I. Theoretical considerations and discussion of the literature.
Journal of Pharmaceutical sciences. 1965;54(8):1145-8.
111. Craig DQM. Polyethyelene Glycols and Drug Release. Drug Development and Industrial
Pharmacy. 1990;16(17):2501-26.
112. Matsumoto T, Zografi G. Physical Properties of Solid Molecular Dispersions of Indomethacin with
Poly(vinylpyrrolidone) and Poly(vinylpyrrolidone-co-vinyl-acetate) in Relation to Indomethacin
Crystallization. Pharmaceutical research. 1999;16(11):1722-8.
113. Taylor LS, Zografi G. Spectroscopic Characterization of Interactions Between PVP and
Indomethacin in Amorphous Molecular Dispersions. Pharmaceutical research. 1997;14(12):1691-8.
114. Ouyang D. Investigating the molecular structures of solid dispersions by the simulated annealing
method. Chemical Physics Letters. 2012;554:177-84.
115. Qian F, Huang J, Hussain MA. Drug–polymer solubility and miscibility: Stability consideration and
practical challenges in amorphous solid dispersion development. Journal of Pharmaceutical sciences.
2010;99(7):2941-7.
116. Das SK, Roy S, Kalimuthu Y, Khanam J, Nanda A. Solid dispersions: an approach to enhance the
bioavailability of poorly water-soluble drugs. International journal of pharmacology and pharmaceutical
technology. 2012;1(1):37-46.
117. Wang X, Michoel A, Van den Mooter G. Solid state characteristics of ternary solid dispersions
composed of PVP VA64, Myrj 52 and itraconazole. International Journal of Pharmaceutics. 2005;303(1–
2):54-61.
118. Vasanthavada M, Tong W-QT, Joshi Y, Kislalioglu MS. Phase behavior of amorphous molecular
dispersions II: Role of hydrogen bonding in solid solubility and phase separation kinetics. Pharmaceutical
research. 2005;22(3):440-8.
119. Wegiel LA, Mauer LJ, Edgar KJ, Taylor LS. Crystallization of amorphous solid dispersions of
resveratrol during preparation and storage—Impact of different polymers. Journal of Pharmaceutical sciences.
2013;102(1):171-84.
120. Qi S, Belton P, McAuley W, Codoni D, Darji N. Moisture uptake of polyoxyethylene glycol
glycerides used as matrices for drug delivery: kinetic modelling and practical implications. Pharmaceutical
research. 2013;30(4):1123-36.
121. Marsac PJ, Rumondor AC, Nivens DE, Kestur US, Stanciu L, Taylor LS. Effect of temperature and
moisture on the miscibility of amorphous dispersions of felodipine and poly (vinyl pyrrolidone). Journal of
Pharmaceutical Sciences. 2010;99(1):169-85.
122. Rumondor AC, Marsac PJ, Stanford LA, Taylor LS. Phase behavior of poly (vinylpyrrolidone)
containing amorphous solid dispersions in the presence of moisture. Molecular Pharmaceutics.
2009;6(5):1492-505.

61
123. Lu Q, Zografi G. Phase behavior of binary and ternary amorphous mixtures containing
indomethacin, citric acid, and PVP. Pharmaceutical research. 1998;15(8):1202-6.
124. Taylor LS, Zografi G. Sugar–polymer hydrogen bond interactions in lyophilized amorphous
mixtures. Journal of Pharmaceutical sciences. 1998;87(12):1615-21.
125. Gordon M, Taylor JS. Ideal copolymers and the second-order transitions of synthetic rubbers. i.
non-crystalline copolymers. Journal of Applied Chemistry. 1952;2(9):493-500.
126. Boyer RF, Simha R. Relation between expansion coefficients and glass temperature: A reply.
Journal of Polymer Science: Polymer Letters Edition. 1973;11(1):33-44.
127. Couchman PR, Karasz FE. A Classical Thermodynamic Discussion of the Effect of Composition on
Glass-Transition Temperatures. Macromolecules. 1978;11(1):117-9.
128. Bhattacharya S, Suryanarayanan R. Local mobility in amorphous pharmaceuticals—
characterization and implications on stability. Journal of Pharmaceutical sciences. 2009;98(9):2935-53.
129. Andronis V, Zografi G. The Molecular Mobility of Supercooled Amorphous Indomethacin as a
Function of Temperature and Relative Humidity. Pharmaceutical research. 1998;15(6):835-42.
130. Badrinarayanan P, Zheng W, Li Q, Simon SL. The glass transition temperature versus the fictive
temperature. Journal of Non-Crystalline Solids. 2007;353(26):2603-12.
131. Shmeis RA, Wang Z, Krill SL. A Mechanistic Investigation of an Amorphous Pharmaceutical and
Its Solid Dispersions, Part I: A Comparative Analysis by Thermally Stimulated Depolarization Current and
Differential Scanning Calorimetry. Pharmaceutical research. 2004;21(11):2025-30.
132. Gunawan L, Johari GP, Shanker RM. Structural Relaxation of Acetaminophen Glass.
Pharmaceutical research. 2006;23(5):967-79.
133. Brettmann B, Bell E, Myerson A, Trout B. Solid-state NMR characterization of high-loading solid
solutions of API and excipients formed by electrospinning. Journal of Pharmaceutical Sciences.
2012;101(4):1538-45.
134. Bhugra C, Rambhatla S, Bakri A, Duddu SP, Miller DP, Pikal MJ, et al. Prediction of the onset of
crystallization of amorphous sucrose below the calorimetric glass transition temperature from correlations
with mobility. Journal of Pharmaceutical sciences. 2007;96(5):1258-69.
135. Van Krevelen DW, Te Nijenhuis K. Properties of polymers: their correlation with chemical
structure; their numerical estimation and prediction from additive group contributions: Elsevier; 2009.
136. Hancock BC, York P, Rowe RC. The use of solubility parameters in pharmaceutical dosage form
design. International Journal of Pharmaceutics. 1997;148(1):1-21.
137. Fedors RF. A method for estimating both the solubility parameters and molar volumes of liquids.
Polymer Engineering & Science. 1974;14(2):147-54.
138. Hoftyzer P, Van Krevelen D. Properties of polymers. Elsevier, Amsterdam. 1976:152-5.
139. Hoy K. New values of the solubility parameters from vapor pressure data. Journal of Paint
Technology. 1970;42(541):76-118.
140. Forster A, Hempenstall J, Tucker I, Rades T. Selection of excipients for melt extrusion with two
poorly water-soluble drugs by solubility parameter calculation and thermal analysis. International Journal of
Pharmaceutics. 2001;226(1–2):147-61.
141. Matsui T, Nagashima K, Fukamachi M, Shimoda M, Osajima Y. Application of the solubility
parameter in estimating the sorption behavior of flavor into packaging film. Journal of Agricultural and Food
Chemistry. 1992;40(10):1902-5.
142. Forster A, Hempenstall J, Rades T. Characterization of glass solutions of poorly water-soluble
drugs produced by melt extrusion with hydrophilic amorphous polymers. Journal of Pharmacy and
Pharmacology. 2001;53(3):303-15.
143. Djuris J, Nikolakakis I, Ibric S, Djuric Z, Kachrimanis K. Preparation of carbamazepine–Soluplus®
solid dispersions by hot-melt extrusion, and prediction of drug–polymer miscibility by thermodynamic model
fitting. European Journal of Pharmaceutics and Biopharmaceutics. 2013;84(1):228-37.
144. Marsac PJ, Shamblin SL, Taylor LS. Theoretical and Practical Approaches for Prediction of Drug–
Polymer Miscibility and Solubility. Pharmaceutical research. 2006;23(10):2417-26.
145. Forster A, Hempenstall J, Tucker I, Rades T. The potential of small-scale fusion experiments and
the Gordon-Taylor equation to predict the suitability of drug/polymer blends for melt extrusion. Drug
Development and Industrial Pharmacy. 2001;27(6):549-60.
146. Zhao Y, Inbar P, Chokshi HP, Malick AW, Choi DS. Prediction of the thermal phase diagram of
amorphous solid dispersions by flory–huggins theory. Journal of Pharmaceutical sciences. 2011;100(8):3196-
207.
147. Nishi T, Wang TT. Melting Point Depression and Kinetic Effects of Cooling on Crystallization in
Poly(vinylidene fluoride)-Poly(methyl methacrylate) Mixtures. Macromolecules. 1975;8(6):909-15.
148. Marsac PJ, Li T, Taylor LS. Estimation of Drug–Polymer Miscibility and Solubility in Amorphous
Solid Dispersions Using Experimentally Determined Interaction Parameters. Pharmaceutical research.
2008;26(1):139-51.
149. Dewick PM. Essentials of organic chemistry. for students of pharmacy, medicinal chemistry and
biological chemistry: Chichester, West Sussex, England ; Hoboken, N.J. : J. Wiley, c2006.; 2006. 150. McMurry J. Organic chemistry: Belmont, CA. : Thomson / Brooks/Cole, 2008.
7th ed. International student ed.; 2008.
151. Van den Mooter G, Wuyts M, Blaton N, Busson R, Grobet P, Augustijns P, et al. Physical
stabilisation of amorphous ketoconazole in solid dispersions with polyvinylpyrrolidone K25. European
Journal of Pharmaceutical Sciences. 2001;12(3):261-9.

62
152. Airaksinen S, Karjalainen M, Shevchenko A, Westermarck S, Leppänen E, Rantanen J, et al. Role
of water in the physical stability of solid dosage formulations. Journal of Pharmaceutical sciences.
2005;94(10):2147-65.
153. Rumondor ACF, Marsac PJ, Stanford LA, Taylor LS. Phase Behavior of Poly(vinylpyrrolidone)
Containing Amorphous Solid Dispersions in the Presence of Moisture. Molecular Pharmaceutics.
2009;6(5):1492-505.
154. Fitzpatrick S, McCabe JF, Petts CR, Booth SW. Effect of moisture on polyvinylpyrrolidone in
accelerated stability testing. International Journal of Pharmaceutics. 2002;246(1–2):143-51.
155. Amass W, Amass A, Tighe B. A review of biodegradable polymers: uses, current developments in
the synthesis and characterization of biodegradable polyesters, blends of biodegradable polymers and recent
advances in biodegradation studies. Polymer International. 1998;47(2):89-144.
156. Marin E, Briceño MI, Caballero-George C. Critical evaluation of biodegradable polymers used in
nanodrugs. International journal of nanomedicine. 2013;8:3071.
157. Siracusa V, Rocculi P, Romani S, Rosa MD. Biodegradable polymers for food packaging: a review.
Trends in Food Science & Technology. 2008;19(12):634-43.
158. Yu L, Dean K, Li L. Polymer blends and composites from renewable resources. Progress in
Polymer Science. 2006;31(6):576-602.
159. Cascone MG, Sim B, Sandra D. Blends of synthetic and natural polymers as drug delivery systems
for growth hormone. Biomaterials. 1995;16(7):569-74.
160. Jiang Y-N, Mo H-Y, Yu D-G. Electrospun drug-loaded core–sheath PVP/zein nanofibers for
biphasic drug release. International Journal of Pharmaceutics. 2012;438(1–2):232-9.
161. Alshahrani SM, Lu W, Park J-B, Morott JT, Alsulays BB, Majumdar S, et al. Stability-enhanced
Hot-melt Extruded Amorphous Solid Dispersions via Combinations of Soluplus® and HPMCAS-HF. AAPS
PharmSciTech. 2015;16(4):824-34.
162. Tipduangta P, Belton P, Fábián L, Wang LY, Tang H, Eddleston M, et al. Electrospun Polymer
Blend Nanofibers for Tunable Drug Delivery: The Role of Transformative Phase Separation on Controlling
the Release Rate. Molecular Pharmaceutics. 2016;13(1):25-39.
163. Quinten T, Beer TD, Vervaet C, Remon JP. Evaluation of injection moulding as a pharmaceutical
technology to produce matrix tablets. European Journal of Pharmaceutics and Biopharmaceutics.
2009;71(1):145-54.
164. van de Witte P, Dijkstra PJ, van den Berg JWA, Feijen J. Phase separation processes in polymer
solutions in relation to membrane formation. Journal of Membrane Science. 1996;117(1–2):1-31.
165. Lopez-Barron CR, Macosko CW. Characterizing Interface Shape Evolution in Immiscible Polymer
Blends via 3D Image Analysis. Langmuir. 2009;25(16):9392-404.
166. Flory PJ. Principles of polymer chemistry: Cornell University Press; 1953.
167. Six K, Verreck G, Peeters J, Brewster M, Mooter GVd. Increased physical stability and improved
dissolution properties of itraconazole, a class II drug, by solid dispersions that combine fast- and slow-
dissolving polymers. Journal of Pharmaceutical sciences. 2004;93(1):124-31.
168. Breitenbach J. Melt extrusion: from process to drug delivery technology. European Journal of
Pharmaceutics and Biopharmaceutics. 2002;54(2):107-17.
169. Crowley MM, Zhang F, Repka MA, Thumma S, Upadhye SB, Kumar Battu S, et al.
Pharmaceutical Applications of Hot-Melt Extrusion: Part I. Drug Development and Industrial Pharmacy.
2007;33(9):909-26.
170. Ouyang D, Smith SC. Introduction to Computational Pharmaceutics. Computational Pharmaceutics.
2015:1-5.
171. DiNunzio JC, Brough C, Hughey JR, Miller DA, Williams Iii RO, McGinity JW. Fusion production
of solid dispersions containing a heat-sensitive active ingredient by hot melt extrusion and Kinetisol®
dispersing. European Journal of Pharmaceutics and Biopharmaceutics. 2010;74(2):340-51.
172. Julien G, Thierry C, Patrice M. Microinjection molding of thermoplastic polymers: a review.
Journal of Micromechanics and Microengineering. 2007;17(6):R96.
173. Zema L, Loreti G, Melocchi A, Maroni A, Gazzaniga A. Injection Molding and its application to
drug delivery. Journal of Controlled Release. 2012;159(3):324-31.
174. Rathbone MJ, Bunt CR, Ogle CR, Burggraaf S, Macmillan KL, Pickering K. Development of an
injection molded poly(ϵ-caprolactone) intravaginal insert for the delivery of progesterone to cattle. Journal of
Controlled Release. 2002;85(1–3):61-71.
175. Soriano I, Martín AY, Évora C, Sánchez E. Biodegradable implantable fluconazole delivery rods
designed for the treatment of fungal osteomyelitis: Influence of gamma sterilization. Journal of Biomedical
Materials Research Part A. 2006;77A(3):632-8.
176. Melocchi A, Loreti G, Del Curto MD, Maroni A, Gazzaniga A, Zema L. Evaluation of Hot-Melt
Extrusion and Injection Molding for Continuous Manufacturing of Immediate-Release Tablets. Journal of
Pharmaceutical sciences. 2015;104(6):1971-80.
177. Gross BC, Erkal JL, Lockwood SY, Chen C, Spence DM. Evaluation of 3D Printing and Its
Potential Impact on Biotechnology and the Chemical Sciences. Analytical chemistry. 2014;86(7):3240-53.
178. Liu Tsang V, Bhatia SN. Three-dimensional tissue fabrication. Advanced Drug Delivery Reviews.
2004;56(11):1635-47.
179. Goyanes A, Buanz ABM, Basit AW, Gaisford S. Fused-filament 3D printing (3DP) for fabrication
of tablets. International Journal of Pharmaceutics. 2014;476(1–2):88-92.
180. Goyanes A, Buanz ABM, Hatton GB, Gaisford S, Basit AW. 3D printing of modified-release
aminosalicylate (4-ASA and 5-ASA) tablets. European Journal of Pharmaceutics and Biopharmaceutics.
2015;89:157-62.

63
181. Pietrzak K, Isreb A, Alhnan MA. A flexible-dose dispenser for immediate and extended release 3D
printed tablets. European Journal of Pharmaceutics and Biopharmaceutics. 2015;96:380-7.
182. Paudel A, Worku ZA, Meeus J, Guns S, Van den Mooter G. Manufacturing of solid dispersions of
poorly water soluble drugs by spray drying: Formulation and process considerations. International Journal of
Pharmaceutics. 2013;453(1):253-84.
183. Broadhead J, Edmond Rouan S, Rhodes C. The spray drying of pharmaceuticals. Drug
Development and Industrial Pharmacy. 1992;18(11-12):1169-206.
184. Cal K, Sollohub K. Spray drying technique. I: Hardware and process parameters. Journal of
Pharmaceutical sciences. 2010;99(2):575-86.
185. Sen D, Mazumder S, Melo JS, Khan A, Bhattyacharya S, D'Souza SF. Evaporation Driven Self-
Assembly of a Colloidal Dispersion during Spray Drying: Volume Fraction Dependent Morphological
Transition. Langmuir. 2009;25(12):6690-5.
186. Mahlin D, Ponnambalam S, Heidarian Höckerfelt M, Bergström CAS. Toward In Silico Prediction
of Glass-Forming Ability from Molecular Structure Alone: A Screening Tool in Early Drug Development.
Molecular Pharmaceutics. 2011;8(2):498-506.
187. Mitzi DB, Kosbar LL, Murray CE, Copel M, Afzali A. High-mobility ultrathin semiconducting
films prepared by spin coating. Nature. 2004;428(6980):299-303.
188. Norrman K, Ghanbari-Siahkali A, Larsen NB. 6 Studies of spin-coated polymer films. Annual
Reports Section "C" (Physical Chemistry). 2005;101(0):174-201.
189. Parejo PG, Zayat M, Levy D. Highly efficient UV-absorbing thin-film coatings for protection of
organic materials against photodegradation. Journal of Materials Chemistry. 2006;16(22):2165-9.
190. Qi S, Moffat JG, Yang Z. Early Stage Phase Separation in Pharmaceutical Solid Dispersion Thin
Films under High Humidity: Improved Spatial Understanding Using Probe-Based Thermal and Spectroscopic
Nanocharacterization Methods. Molecular Pharmaceutics. 2013;10(3):918-30.
191. Xie J, Tan JC, Wang C-H. Biodegradable films developed by electrospray deposition for sustained
drug delivery. Journal of Pharmaceutical sciences. 2008;97(8):3109-22.
192. Huang Z-M, Zhang YZ, Kotaki M, Ramakrishna S. A review on polymer nanofibers by
electrospinning and their applications in nanocomposites. Composites Science and Technology.
2003;63(15):2223-53.
193. Rutledge GC, Fridrikh SV. Formation of fibers by electrospinning. Advanced Drug Delivery
Reviews. 2007;59(14):1384-91.
194. Li M, Mondrinos MJ, Chen X, Gandhi MR, Ko FK, Lelkes PI. Co-electrospun poly(lactide-co-
glycolide), gelatin, and elastin blends for tissue engineering scaffolds. Journal of Biomedical Materials
Research Part A. 2006;79A(4):963-73.
195. Sahoo S, Toh SL, Goh JCH. A bFGF-releasing silk/PLGA-based biohybrid scaffold for
ligament/tendon tissue engineering using mesenchymal progenitor cells. Biomaterials. 2010;31(11):2990-8.
196. Richard-Lacroix M, Pellerin C. Molecular Orientation in Electrospun Fibers: From Mats to Single
Fibers. Macromolecules. 2013;46(24):9473-93.
197. Verreck G, Chun I, Rosenblatt J, Peeters J, Dijck AV, Mensch J, et al. Incorporation of drugs in an
amorphous state into electrospun nanofibers composed of a water-insoluble, nonbiodegradable polymer.
Journal of Controlled Release. 2003;92(3):349-60.
198. Alhusein N, Blagbrough IS, De Bank PA. Electrospun matrices for localised controlled drug
delivery: release of tetracycline hydrochloride from layers of polycaprolactone and poly(ethylene-co-vinyl
acetate). Drug Delivery and Translational Research. 2012;2(6):477-88.
199. Chen J-P, Chang G-Y, Chen J-K. Electrospun collagen/chitosan nanofibrous membrane as wound
dressing. Colloids and Surfaces A: Physicochemical and Engineering Aspects. 2008;313–314:183-8.
200. Subbiah T, Bhat GS, Tock RW, Parameswaran S, Ramkumar SS. Electrospinning of nanofibers.
Journal of Applied Polymer Science. 2005;96(2):557-69.
201. Yu D-G, Xu Y, Li Z, Du L-P, Zhao B-G, Wang X. Coaxial Electrospinning with Mixed Solvents:
From Flat to Round Eudragit L100 Nanofibers for Better Colon-Targeted Sustained Drug Release Profiles.
Journal of Nanomaterials. 2014;2014:8.
202. Ramakrishna S, Fujihara K, Teo W-E, Lim T-C, Ma Z. An introduction to electrospinning and
nanofibers: World Scientific; 2005.
203. Forward KM, Rutledge GC. Free surface electrospinning from a wire electrode. Chemical
Engineering Journal. 2012;183:492-503.
204. Tan SH, Inai R, Kotaki M, Ramakrishna S. Systematic parameter study for ultra-fine fiber
fabrication via electrospinning process. Polymer. 2005;46(16):6128-34.
205. Wannatong L, Sirivat A, Supaphol P. Effects of solvents on electrospun polymeric fibers:
preliminary study on polystyrene. Polymer International. 2004;53(11):1851-9.
206. Deitzel J, Kleinmeyer J, Harris Dea, Beck Tan N. The effect of processing variables on the
morphology of electrospun nanofibers and textiles. Polymer. 2001;42(1):261-72.
207. Yurteri CU, Hartman RPA, Marijnissen JCM. Producing Pharmaceutical Particles via
Electrospraying with an Emphasis on Nano and Nano Structured Particles - A Review. KONA Powder and
Particle Journal. 2010;28:91-115.
208. Fong H, Chun I, Reneker D. Beaded nanofibers formed during electrospinning. Polymer.
1999;40(16):4585-92.
209. Huan S, Liu G, Han G, Cheng W, Fu Z, Wu Q, et al. Effect of experimental parameters on
morphological, mechanical and hydrophobic properties of electrospun polystyrene fibers. Materials.
2015;8(5):2718-34.

64
210. De Vrieze S, Van Camp T, Nelvig A, Hagström B, Westbroek P, De Clerck K. The effect of
temperature and humidity on electrospinning. Journal of materials science. 2009;44(5):1357-62.
211. Reneker DH, Yarin AL. Electrospinning jets and polymer nanofibers. Polymer. 2008;49(10):2387-
425.
212. Megelski S, Stephens JS, Chase DB, Rabolt JF. Micro- and Nanostructured Surface Morphology on
Electrospun Polymer Fibers. Macromolecules. 2002;35(22):8456-66.
213. Luo CJ, Nangrejo M, Edirisinghe M. A novel method of selecting solvents for polymer
electrospinning. Polymer. 2010;51(7):1654-62.
214. Deitzel JM, Kleinmeyer J, Harris D, Beck Tan NC. The effect of processing variables on the
morphology of electrospun nanofibers and textiles. Polymer. 2001;42(1):261-72.
215. Zong X, Kim K, Fang D, Ran S, Hsiao BS, Chu B. Structure and process relationship of
electrospun bioabsorbable nanofiber membranes. Polymer. 2002;43(16):4403-12.
216. Luu YK, Kim K, Hsiao BS, Chu B, Hadjiargyrou M. Development of a nanostructured DNA
delivery scaffold via electrospinning of PLGA and PLA–PEG block copolymers. Journal of Controlled
Release. 2003;89(2):341-53.
217. Casper CL, Stephens JS, Tassi NG, Chase DB, Rabolt JF. Controlling Surface Morphology of
Electrospun Polystyrene Fibers: Effect of Humidity and Molecular Weight in the Electrospinning Process.
Macromolecules. 2004;37(2):573-8.
218. Subianto S, Donnadio A, Cavaliere S, Pica M, Casciola M, Jones DJ, et al. Reactive coaxial
electrospinning of ZrP/ZrO2 nanofibres. Journal of Materials Chemistry A. 2014;2(33):13359-65.
219. Chen R, Huang C, Ke Q, He C, Wang H, Mo X. Preparation and characterization of coaxial
electrospun thermoplastic polyurethane/collagen compound nanofibers for tissue engineering applications.
Colloids and Surfaces B: Biointerfaces. 2010;79(2):315-25.
220. Munj HR, Nelson MT, Karandikar PS, Lannutti JJ, Tomasko DL. Biocompatible electrospun
polymer blends for biomedical applications. Journal of Biomedical Materials Research Part B: Applied
Biomaterials. 2014;102(7):1517-27.
221. Shi Y, Wei Z, Zhao H, Liu T, Dong A, Zhang J. Electrospinning of Ibuprofen-Loaded Composite
Nanofibers for Improving the Performances of Transdermal Patches. Journal of Nanoscience and
Nanotechnology. 2013;13(6):3855-63.
222. Taepaiboon P, Rungsardthong U, Supaphol P. Vitamin-loaded electrospun cellulose acetate
nanofiber mats as transdermal and dermal therapeutic agents of vitamin A acid and vitamin E. European
Journal of Pharmaceutics and Biopharmaceutics. 2007;67(2):387-97.
223. Wu X-m, Branford-White CJ, Zhu L-m, Chatterton NP, Yu D-g. Ester prodrug-loaded electrospun
cellulose acetate fiber mats as transdermal drug delivery systems. Journal of Materials Science: Materials in
Medicine. 2010;21(8):2403-11.
224. Nagy ZK, Nyúl K, Wagner I, Molnár K, Marosi G. Electrospun water soluble polymer mat for
ultrafast release of Donepezil HCl. Express Polym Lett. 2010;4(12):763-72.
225. Yu D-G, Yang J-M, Branford-White C, Lu P, Zhang L, Zhu L-M. Third generation solid
dispersions of ferulic acid in electrospun composite nanofibers. International Journal of Pharmaceutics.
2010;400(1):158-64.
226. Khil M-S, Cha D-I, Kim H-Y, Kim I-S, Bhattarai N. Electrospun nanofibrous polyurethane
membrane as wound dressing. Journal of Biomedical Materials Research Part B: Applied Biomaterials.
2003;67B(2):675-9.
227. Thakur RA, Florek CA, Kohn J, Michniak BB. Electrospun nanofibrous polymeric scaffold with
targeted drug release profiles for potential application as wound dressing. International Journal of
Pharmaceutics. 2008;364(1):87-93.
228. Zhou Y, Yang D, Chen X, Xu Q, Lu F, Nie J. Electrospun Water-Soluble Carboxyethyl
Chitosan/Poly(vinyl alcohol) Nanofibrous Membrane as Potential Wound Dressing for Skin Regeneration.
Biomacromolecules. 2008;9(1):349-54.
229. Verreck G, Chun I, Peeters J, Rosenblatt J, Brewster ME. Preparation and characterization of
nanofibers containing amorphous drug dispersions generated by electrostatic spinning. Pharmaceutical
research. 2003;20(5):810-7.
230. Nagy ZK, Balogh A, Vajna B, Farkas A, Patyi G, Kramarics Á, et al. Comparison of electrospun
and extruded soluplus®‐based solid dosage forms of improved dissolution. Journal of Pharmaceutical
sciences. 2012;101(1):322-32.
231. Brettmann BK, Myerson AS, Trout BL. Solid-state nuclear magnetic resonance study of the
physical stability of electrospun drug and polymer solid solutions. Journal of Pharmaceutical sciences.
2012;101(6):2185-93.
232. Lopez FL, Shearman GC, Gaisford S, Williams GR. Amorphous formulations of indomethacin and
griseofulvin prepared by electrospinning. Molecular Pharmaceutics. 2014;11(12):4327-38.
233. Quan J, Yu Y, Branford-White C, Williams GR, Yu D-G, Nie W, et al. Preparation of ultrafine fast-
dissolving feruloyl-oleyl-glycerol-loaded polyvinylpyrrolidone fiber mats via electrospinning. Colloids and
Surfaces B: Biointerfaces. 2011;88(1):304-9.
234. Shen X, Yu D, Zhu L, Branford-White C, White K, Chatterton NP. Electrospun diclofenac sodium
loaded Eudragit® L 100-55 nanofibers for colon-targeted drug delivery. International Journal of
Pharmaceutics. 2011;408(1–2):200-7.
235. Yang Y, Xia T, Zhi W, Wei L, Weng J, Zhang C, et al. Promotion of skin regeneration in diabetic
rats by electrospun core-sheath fibers loaded with basic fibroblast growth factor. Biomaterials.
2011;32(18):4243-54.

65
236. Huang C, Soenen SJ, van Gulck E, Vanham G, Rejman J, Van Calenbergh S, et al. Electrospun
cellulose acetate phthalate fibers for semen induced anti-HIV vaginal drug delivery. Biomaterials.
2012;33(3):962-9.
237. Persano L, Camposeo A, Tekmen C, Pisignano D. Industrial Upscaling of Electrospinning and
Applications of Polymer Nanofibers: A Review. Macromolecular Materials and Engineering.
2013;298(5):504-20.
238. Sambaer W, Zatloukal M, Kimmer D. 3D modeling of filtration process via polyurethane nanofiber
based nonwoven filters prepared by electrospinning process. Chemical Engineering Science. 2011;66(4):613-
23.
239. Forward KM, Flores A, Rutledge GC. Production of core/shell fibers by electrospinning from a free surface. Chemical Engineering Science. 2013;104:250-9.

66
2.Chapter 2 Materials and methods
2.1 Introduction
This chapter discusses the basic information regarding the materials used in this study
including APIs and polymers. Characterisation techniques used in this study are described,
along with details of their experimental conditions.
2.2 Materials
2.2.1 Fenofibrate (FF)
FF (propan-2-yl 2-(4-[(4-chlorophenyl)carbonyl]phenoxy)-2-methylpropanoate) has been
prescribed to treat hypercholesterolemia since 1970 (1). It is a prodrug in which fenofibric
acid is its active form. The pharmacological effect of FF is to reduce low-density
lipoprotein (LDL) and increase high-density lipoprotein (HDL) by binding to peroxisome
proliferator-activated receptor alpha (PPARα ) (1, 2). FF is categorised as a BCS class II
drug because it is poorly aqueous soluble (0.8 µg/ml) but has a high permeability (>90%)
through a lipid membrane (3, 4). Therefore, administrating FF with foods can increase the
drug absorption (1). The nano crystallised (Tricor®) formulation and the solid dispersion
with PEG (Fenoglide®) have been used to increase the bioavailability of FF (5, 6).
Consequently, the FF content per the tablets can be reduced from 100 mg of the
conventional FF tablets to 67 mg or less in FF nano crystallised and solid dispersion
formulations (7, 8).
Figure 2.1 Molecular structure of FF
The amorphous fenofibrate does not spontaneously crystallise because it has high
configuration entropy and high molecular mobility is required for crystallisation (9).
Consequently, it has a low probability of molecular insertion to form nuclei for the
nucleation. However, the amorphous FF crystallises immediately after being triggered by
scratching its surface or seeding by using its crystal (10, 11).
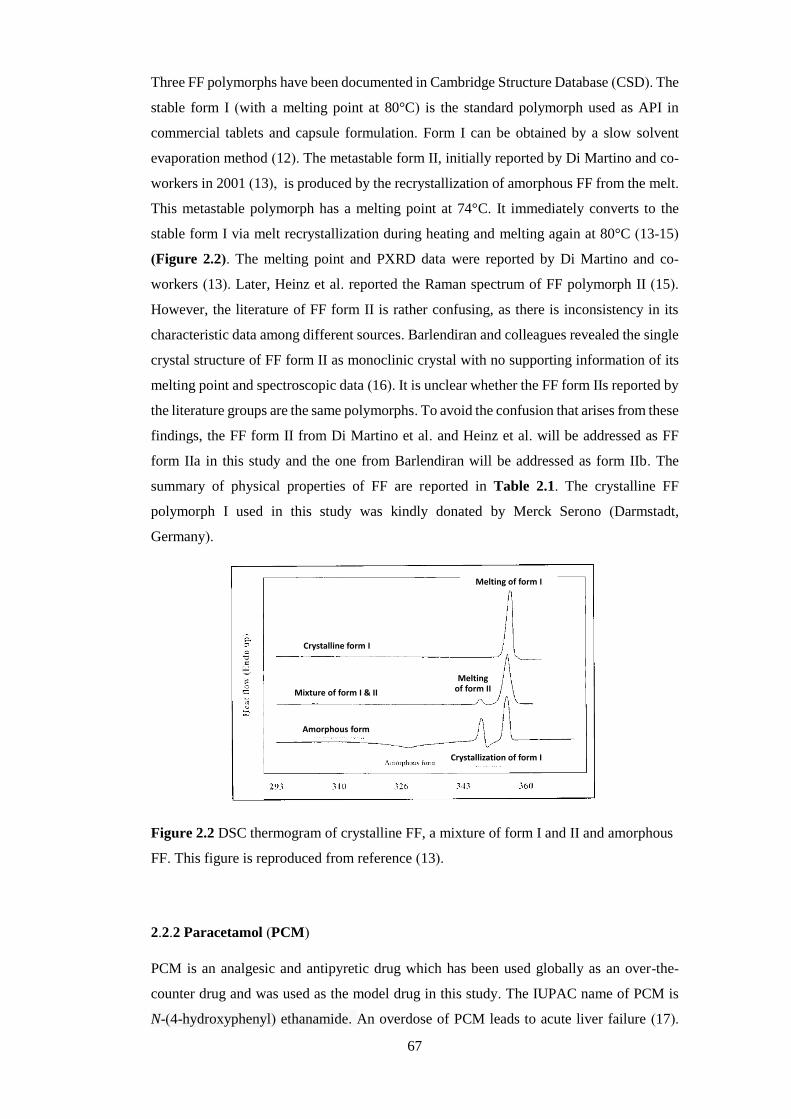
67
Three FF polymorphs have been documented in Cambridge Structure Database (CSD). The
stable form I (with a melting point at 80°C) is the standard polymorph used as API in
commercial tablets and capsule formulation. Form I can be obtained by a slow solvent
evaporation method (12). The metastable form II, initially reported by Di Martino and co-
workers in 2001 (13), is produced by the recrystallization of amorphous FF from the melt.
This metastable polymorph has a melting point at 74°C. It immediately converts to the
stable form I via melt recrystallization during heating and melting again at 80°C (13-15)
(Figure 2.2). The melting point and PXRD data were reported by Di Martino and co-
workers (13). Later, Heinz et al. reported the Raman spectrum of FF polymorph II (15).
However, the literature of FF form II is rather confusing, as there is inconsistency in its
characteristic data among different sources. Barlendiran and colleagues revealed the single
crystal structure of FF form II as monoclinic crystal with no supporting information of its
melting point and spectroscopic data (16). It is unclear whether the FF form IIs reported by
the literature groups are the same polymorphs. To avoid the confusion that arises from these
findings, the FF form II from Di Martino et al. and Heinz et al. will be addressed as FF
form IIa in this study and the one from Barlendiran will be addressed as form IIb. The
summary of physical properties of FF are reported in Table 2.1. The crystalline FF
polymorph I used in this study was kindly donated by Merck Serono (Darmstadt,
Germany).
Figure 2.2 DSC thermogram of crystalline FF, a mixture of form I and II and amorphous
FF. This figure is reproduced from reference (13).
2.2.2 Paracetamol (PCM)
PCM is an analgesic and antipyretic drug which has been used globally as an over-the-
counter drug and was used as the model drug in this study. The IUPAC name of PCM is
N-(4-hydroxyphenyl) ethanamide. An overdose of PCM leads to acute liver failure (17).
Melting of form I
Melting of form II
Crystalline form I
Mixture of form I & II
Amorphous form
Crystallization of form I

68
PCM is classified as a BSC class III according to the current guidelines, as highly water
solubility and low permeability (18). The permeability of PCM is 80%, which slightly
below the cut-off point between BCS class I and III, at 90% permeability. PCM has three
reported polymorphic forms which include monoclinic form I, orthorhombic form II and
the highly unstable form III (18-20). The PCM form II is prepared by melt recrystallization
of amorphous PCM. The orthorhombic polymorph exhibits a sliding plane resulting in a
good compressibility (19). However, the only monoclinic form I is used in commercial
products due to it being the most thermodynamic stable form. PCM has a low Tg at 25°C
(21). The amorphous of PCM is unstable at room temperature and immediately crystallises
to its form I (22). This is because PCM can form intermolecular hydrogen bonds resulting
in it having low configuration entropy and a low mobility required for crystallisation (9).
The physical properties of PCM are summarised in Table 2.1. The PCM (purity >99%)
used in this study was purchased from Sigma-Aldrich (Dorset, UK).
Figure 2.3 Molecular structure of PCM
Table 2.1 FF and PCM physical properties
Properties Fenofibrate Paracetamol
Molecular weight 360.83 g/mol 151.16 g/mol
Formula C8H9NO2 C8H9NO2
pKa -4.9 (3, 23) 9.5 (23)
Solubility 0.8 µg/ml (3) 14.3 mg/ml at 20°C
23.7 mg/ml at 37°C (18)
Log P 4.75 (3, 21) 0.28 (18)
Permeability >90% 80% (18)
Density 1.29 g/cm3 (24) 1.38 g/cm3 (21)
Glass Transition -20 °C (21) 25 °C (21)
Configuration entropy (ΔS) 76.6 J/mol.K (9) 43.0 J/mol.K (9)
Mobility required for
crystallization (1/τ)
72.3 s-1 (9) 1.0 s-1 (9)

69
2.2.3 Talc
Talc or hydrous magnesium silicate (H2Mg3(SiO3)4) is a soft mineral according to the
Moh’s scale of hardness (25). The crystalline structure of talc is identified as triclinic (26),
as illustrated in Figure 2.4. It exhibits a basal cleavage on the basal plane (001)(27). Talc
has been used in various industrial products such as cosmetic, plastic, foods, ceramic, paper
and pharmaceutical (28). It is chemically inert, hydrophobic, organophilic, with high
thermal and low electrical conductivity. The Food and Drug Administration (FDA) have
approved it as generally recognised as a safe (GRAS) excipient for the use as a glidant and
anti-tablet adherent in oral pharmaceutical products (28). In this study, talc was used as an
impurity additive to induce crystallisation of the amorphous FF in chapter 4. Talc used in
this study has an average particle size of below 70 µm (labelled on the package). It was
purchased from Sigma-Aldrich (Dorset, UK).
Figure 2.4 Packing arrangement of talc crystalline structure. The crystal parameters are
obtained from the reference (26).
2.2.4 Polyvinyl pyrrolidone (PVP)
PVP is white free-flowing powder. The molecular structure of PVP monomer is illustrated
in Figure 2.5. One mono unit of PVP, composed of a pyrrolidone ring connects with a
polyvinyl backbone. PVP is an amorphous polymer. There are four grades of PVP which
are commercially available, including PVP K12, PVP K17, PVP K30 and PVP K90, which
have a molecular weight 2500, 9000, 50000 and 1250000 g.mol-1, respectively. The high
number of K reflects the high molecular weight, high viscosity and Tg (29). It is soluble in
many solvents such as dichloromethane, ethanol, methanol, acetonitrile and water. It is an

70
official excipient in pharmacopoeia in which it has a range of applications including that
of a binder in granulation, solubilizer, and carrier of solid dispersion formulations (28, 29).
A vast body of literature uses PVP as hydrophilic solid dispersion matrices. PVP enhances
the aqueous solubility of poor water soluble APIs such as ibuprofen, griseofulvin and
felodipine (31-33). PVP can form a hydrogen bond via its carbonyl group with a hydrogen
donor of the drugs, i.e. hydroxyl and amide group resulting in an increase in the physical
stability of the solid dispersion (31, 33). PVP solid dispersion can be produced by both
melting based methods and solvent evaporation based methods including hot-melt
extrusion, spray drying, co-evaporation, spin-coating, and electrospinning (29, 32, 34, 35).
It is noted that the high molecular weight PVP-K 90 is not suitable for HME because the
high Tg of the PVP (180°C) requires high processing temperatures which lead to drug and
polymer degradation (36). In electrospinning, only PVP K30 and K90 are spinnable grades.
The concentration of PVP K30 and K90 required for electrospinning are 30-40 and 5-15
%w/v, respectively in ethanol (34, 37).
However, the drawback of PVP is its high hygroscopic nature. The moisture absorbed by
PVP plasticizes the solid dispersion matrices and increases mobility in which a reduction
in the Tg of the solid dispersion matrices has been observed (33, 38). Consequently, it
leads to phase separation and recrystallization of the amorphous drug in the solid dispersion
matrices. It is believed that the hydrogen bonding between drug and PVP was disturbed by
the moisture absorbed (38).
PVP-K90 was selected as a key polymer in this study to prepare solid dispersion
formulations for electrospinning technique because it is spinnable even at low
concentrations (5%w/v) and possibly enhances spinnability of another low molecular
polymer that blends with it. Polymer blended electrospinning was used as the primary
approach to developing electrospun formulations in this project. PVP was coupled with
hydrophobic polymers including Eudragit E, Soluplus and HPMCAS in order to minimise
the moisture uptake and increase the physical stability of the formulations. Another aspect
of using a PVP polymer blended electrospun fibrous formulation is to prepare biphasic
release formulations and PVP acts as the initial release phase. The PVP-K90 is the only
grade used in this study. It was kindly donated by BASF (Ludwigshafen, Germany).

71
Figure 2.5 Molecular structure of the PVP monomer unit
2.2.5 Eudragit E
Eudragit E is the trade name of a cationic copolymer based on dimethylamino ethyl
methacrylate, butyl methacrylate, and methyl methacrylate, as illustrated in Figure 2.6. It
has an average molecular weight of approximately 47,000 g.mol-1. Eudragit E has a
characteristic amine-like odour and pH dependent dissolution which dissolves at pH lower
than 5 but swells at pH greater than 5. It is non-hygroscopic, which absorbs less than 3%
moisture w/w at 75% RH 22°C (39). Eudragit E naturally exists as amorphous and
demonstrates a Tg at approximately 50°C (40). It has been used as stomach targeted
delivery, a coating material for moisture protection, odour and taste masking and solid
dispersion carriers for stabilising the amorphous APIs and enhancing physical stability (41,
42).
The solid dispersion of Eudragit E can be prepared with both melting based and solvent
evaporation based methods. The low Tg of Eudragit E allows it to process easily by HME.
The Eudragit E solid dispersion prepared by HME is well-documented for enhancing the
aqueous solubility of poorly water-soluble APIs and increasing their physical stability (40,
43-45). Liu et al. prepared solid dispersions of indomethacin and Eudragit E by HME. The
solid dispersion of Eudragit E significantly improved the solubility of indomethacin (45).
Jung and co-workers prepared a solid dispersion of Eudragit E and itraconazole by spray
drying. The solid dispersion spray drying particles were spherical and showed a diameter
of approximately 1-10 µm. This formulation demonstrated a faster drug release than the
marketed product (44). In electrospinning, few studies have reported the use of Eudragit E
as electrospun matrices. Nagy et al. and Soti et al. reported that the spinnable concentration
of Eudragit E is higher than 30% w/v in ethanol (46, 47). The carvedilol Eudragit E
electrospun fibres demonstrated a ten fold increase in aqueous solubility in comparison to
the crystalline drug and complete drug release within 3 minutes (46).
In this study, Eudragit E was blended with PVP in order to minimise moisture uptakes of
the solid dispersion formulations in which physical stability was expected to increase. The

72
Eudragit E used in this study was kindly donated by Evonik Industries (Darmstadt,
Germany).
Figure 2.6 Molecular structure of mono unit of Eudragit E
2.2.6 Soluplus
Soluplus is an amphiphilic polymer whose structure is composed of polyvinyl caprolactam
–polyvinyl acetate-polyethylene glycol graft copolymer, as illustrated in Figure 2.7. It has
a molecular weight of approximately 118,000 g.mol-1. Soluplusis considering as a new
generation solid dispersion carrier which demonstrates dual properties of solid dispersion
matrices and polymeric solubilizer (48). It forms micelles at a concentration of 7.6 mg.ml-
1and has a low Tg approximately 70°C. Soluplus was initially designed to be solid
dispersion matrices for HME for enhancing the aqueous solubility of poorly water soluble
drugs and maintaining supersaturated concentration during dissolution. Another advantage
of SP is low hygroscopic material (49, 50). In addition, Soluplus is soluble in various kinds
of organic solvents including, dichloromethane, ethanol, acetone, toluene and ethyl acetate
(29). This allows Soluplus to be prepared with both melting based and solvent evaporation
based solid dispersion preparation methods.
Nagy et al. successfully prepared Soluplus as electrospun fibres. At least 30% w/v of
Soluplus in acetone was required to form electrospun fibres (51). In this study, Soluplus
was coupled with PVP K-90. The blend fibrous matrices of PVP K90 and Soluplus were
expected to minimise the hygroscopic nature of PVP resulting in the increased physical
stability of the formulation and enhanced solubility of FF. Soluplus used in this study was
kindly donated by BASF (Ludwigshafen, Germany).

73
Figure 2.7 Molecular structure of Soluplus
2.2.7 Hypromellose acetate succinate (HPMCAS)
HPMCAS is a semi-synthesis polymer. The acetyl and succinoyl groups are added to the
hypromellose backbone. It has an average molecular weight of around 17,000-20,000
g.mol-1 (52). In comparison to the ordinary hypromellose (without succinoyl and acetyl
substitution), HPMCAS demonstrates significantly less hygroscopicity (53). There are
three grades of HPMCAS commercially available, L, M and H grade. Each grade has a
different ratio of succinoyl and acetyl substitution. The different percentages of succinoyl
and acetyl group substitutions lead to different solubility of the polymer at different pH
(54). The relationship of percent succinoyl and acetyl substitution and the pH they dissolve
is shown in Table 2.2. HPMCAS demonstrates Tg of approximately 120°C (55). HPMCAS
is an approved excipient in the United States, British and Japanese Pharmacopoeia (56, 57).
It is typically used as enteric coating materials. Moreover, HPMCAS has been used as solid
dispersion carriers to improve the aqueous solubility of poorly water-soluble APIs. It can
processed by both melt and solvent evaporation based methods including spray drying, co-
evaporation and hot melt extrusion (53-55, 58, 59).
Up to now, to the best of our knowledge, there is no reported use of HPMCAS alone in
electrospinning, but different grades of hypromellose have been reported as spinnable
polymers (60). Therefore, in this study, HPMCAS was blended with PVP to reduce the
hygroscopicity of the blend system. This was expected to improve the physical stability
against humidity in the environment. In addition, HPMCAS is insoluble in acidic pH. Thus,
this blends couple is expected to show a modified drug release in the acidic media in which
burst drug release is from PVP and sustained drug release is from HPMCAS. The

74
HPMCAS L grade was used in this study. It was kindly donated by Shin-Etsu Chemical Co
Ltd. (Niigata, Japan).
Table 2.2 The succinoyl and acetyl group substitution in HPMCAS grades and pH (54).
HPMCAS grade Succinoyl (%) Acetyl (%) Dissolved pH
L-grade 15 8 >5.0
M-grade 11 9 >5.5
H-grade 7 12 >6.0
Figure 2.8 Structural formula of HPMCAS
Table 2.3 Summarised properties used in this study including Tg, water uptake and
soluble pH
Polymers Tg (°C)a Water uptake at
75% RH 25°C
(%w/w)b
Soluble pHc
PVP K-90 176±2.0 30.0±0.4 Any
Eudragit E 56±0.5 1.8±0.1 < 5
Soluplus 77±0.8 10.7±0.05 Any
HPMCAS-L 122±2.2 6.4±0.07 >5.0
a measured by MTDSC from raw materials in this study
b measured DVS from raw materials in this study
c reference (41, 50, 54)

75
2.3 Electrospinning general set up
A custom-made single spinneret electrospinning device (SS-ES) was used to prepare the
electrospun fibrous formulations in this study. The electrospinning solution which
contained API and polymer was poured into a 5 ml plastic syringe which was equipped
with a syringe pump (Cole-Parmer, UK). The solution was fed through an 18 gauge blunt
metal spinneret (Terumo, Tokyo, Japan) with a rate of 1.5 ml.hr-1 and applying a voltage
of 15 kV from an ES40P-20W high voltage power supply (Gamma high voltage research
Inc, Ormond Beach, FL, USA). The custom- made drum collector was used to collect
electrospun fibres with 500 RPM. The distance between the spinneret to the collector was
fixed at 15 cm. For coaxial electrospinning (CS-ES), the solutions of the core and sheath
layers were fed from separated syringe pumps at a rate of 0.5 mL/h to the coaxial needle
(Linari engineering S.r.l., Pisa, Italy). The rest of the parameters, including distance from
the spinneret to the collector and collector type, were similar to the SS-ES. All
electrospinning experiments were performed under ambient conditions of 20 ± 2 °C/40 ±
5% relative humidity (RH). After the electrospinning process, the fibrous mats were peeled
off from the collector stored in a 0% RH desiccator filled with phosphorus pentaoxide
before analysis.
Figure 2.9 A custom-made single spinneret electrospinning with a rotating collector
2.4 General introduction to physicochemical characteristic techniques
The methods for characterisation of materials and formulations can be broadly divided into
two groups, which are bulk characterisation techniques and imaging characterisation
techniques. The bulk characterisation methods provide the average response of sample in
both qualitative and quantitative measurements, such as DSC, PXRD, and ss-NMR. As the
name implies, the imaging characterisation techniques emphasise on visualising a
Rotating collector
Syringe pump
Drug reservoir Electrode

76
particular region of the sample, for instance, SEM, TEM, FTIR microscopy, optical
microscopy and atomic force microscopy (AFM). The combination of these two kinds of
characterisation approaches provides essential information on understanding the physical
state of the raw materials and formulations.
2.4.1 Differential scanning calorimetry (DSC)
2.4.1.1 Basic principle
DSC is a thermal base analytical technique which offers information on physical and
energetic properties of materials. It is a frequently used method to analyse pharmaceutical
materials. DSC provides both qualitative and quantitative data from endothermic,
exothermic events (melting and recrystallization and a glass transition temperature) and
heat capacity changes by measuring the energy differences between sample and reference
(61, 62). Therefore, it is a benefit to characterise the polymorphic form of APIs, detecting
the instability of API recrystallization in solid dispersions and investigating the miscibility
of the drug and polymer (61, 63). DSC demonstrates numerous benefits such as the tiny
amount required for a measurement, coverage of a broad range of temperatures (-120 to
600°C), fast analysis and simple sample preparation (62).
There are two instrument types of DSC which are power-compensated and heat flux DSC
as shown in Figure 2.10. The power compensation DSC has two individual furnaces for
sample and reference, which has the advantage of achieving higher heating and cooling
rates because of its small furnace, while the heat flux DSC possesses a single furnace which
contains both sample and reference pans. The single surface of heat flux DSC has the
benefit of robust temperature control in comparison to the two separate furnaces of the
power compensation DSC design. As a consequence, it demonstrates a better baseline than
the power compensation DSC. Both power compensation and heat flux DSC have their
benefits and drawbacks but are similar in terms of sensitivity and accuracy. Therefore, both
DSC designs can be used to analyse the specimens with no supremacy (61, 62).

77
Figure 2.10 Schematic diagram of power-compensated DSC (a) and heat flux DSC (b).
This figure is reproduced from reference (61).
The DSC measurement is based on the heat flow measurement. The DSC monitors the heat
flow from the difference in temperature between the sample and reference (empty pan) by
a thermocouple as a function of thermal resistance (61, 62). The equation 2.1 shows how
DSC acquires the heat flow signal.
𝜕𝑄
𝜕𝑡=
(𝑇𝑅−𝑇𝑠)
𝑅…………………………………….(2.1)
where dQ/dt is the heat flow, TR is the temperature of reference; TS is the temperature of
the sample and R is thermal resistance of the sample. The data obtained from DSC is a
plot of heat flow as a function of temperature. In another words, the heat flow term is an
expression of heat capacity combined with the kinetics of the sample. Equation 2.2
demonstrates the relationship of heat flow.
𝜕𝑄
𝜕𝑡= 𝐶𝑝 ∙
𝜕𝑇
𝜕𝑡+ 𝑓(𝑇, 𝑡) …………………………(2.2)
where Cp is heat capacity, dT/dt is heating rate, and f(T,t) is the kinetic event. The kinetic
event represents the temperature corresponding thermal event such as polymer relaxation,
crystallisation, and melting. Figure 2.11 illustrates thermal events observed by DSC,
including glass transition, crystallisation exothermic and melting endothermic of PCM.
In the absence of the kinetic event, the heat flow corresponds to the baseline, and the Cp
can be obtained from the difference of baseline value as a function of heating rate. The
traditional Cp measurement from a standard DSC is described as
𝐶𝑝 =𝐾∆𝑌
𝑏…………………………………………(2.3)
where K is calorimetric sensitivity obtained from a calibration, ΔY is the baseline difference
in presence and absence of the sample and b is the heating rate. From this relationship,
therefore, Cp is defined as energy in a specific unit which rises temperature 1K of the
ab

78
substance. It also reflects the molecular motion available in the sample, including vibration,
translation, rotation. It needs to be borne in mind that the standard DSC reports the total
heat flow, which is the sum of the two terms in equation 2.2 (62).
Figure 2.11 Example of standard DSC thermogram of PCM
2.4.1.2 DSC experimental conditions
A Q-2000 (TA Instruments, Newcastle, DE, USA), was used to perform the DSC
experiments in this study. The Tzero calibration was used to calibrate the baseline. N-
Octadecane, indium, and tin were used for temperature calibration. The DSC experiments
were performed at heating rates of 2, 5, 10, and 20 °C.min−1 in the range between -40 to
120 °C. A constant nitrogen purge was applied at the 50 mL.min−1 rate. The standard DSC
was used to examine the polymorphic form of crystalline FF samples in chapters 3 and 4.
All of the FF crystalline samples were precisely weighed (1−3 mg), and TA standard
aluminium crimped pans were used. Each sample was tested in triplicate.
2.4.2 Modulated temperature differential scanning calorimetry (MTDSC)
2.4.2.1 Basic principle
MTDSC is an extension to the standard DSC. It was developed by Gill et al. (64). It applies
a perturbative heating or cooling program (mostly sine wave), unlike the standard DSC,
which has a linear heating. The MTDSC heating program consists of three parameters,
including underlying heating rate, modulated amplitude and modulated period. Figure 2.12
illustrates the sinewave heating (solid line) in comparison to the linear heating (broken
line). The combination of oscillating temperature program and fourier transform
mathematical process allows the separation of different types of sample behaviour signal
(62, 65). In comparison to the standard DSC, the whole term of heat flow is measured,
which is a combination of heating rate dependent and absolute temperature dependent
-12
-10
-8
-6
-4
-2
0
2
Heat F
low
(W
/g)
0 50 100 150 200
Temperature (°C)
Sample: ParacetamolSize: 2.5700 mgMethod: Heat/Cool/Heat
DSCFile: H:...\20140212 Paracetamol 1.001Operator: LucyRun Date: 12-Feb-2014 11:36Instrument: DSC Q2000 V24.10 Build 122
Exo Up Universal V4.5A TA Instruments
CrystallisationExothermic
Melting Endothermic
Glass transition

79
responses, as stated in equation 2.2. The MTDSC offers the advantage of separating these
two terms. The heating rate dependent term which is the first term on the right-hand side
in equation 2.2. is a function of heat capacity to the proportion of heating rate. Therefore,
the heating rate dependent transition effects by the heating program in which the fast
heating rate results in a larger value in this term, and the event shows in this term is
reversing. The Tg is an example of a thermal event that shows the reversing signal. On the
other hand, the absolute temperature dependent transition is the second term on the right-
hand side in equation 2.2. It is an irreversible response which, after the proceeding, cannot
be reversed by cyclic heating or cooling, i.e. enthalpies relaxation before the Tg, cold
crystallisation, curing, solvent evaporation and decomposition. Thus, this is known as a
non-reversing signal (62, 64, 65). The flow chart in Figure 2.13 describes the origin of
signal deconvolution. The advantage of separating the reversing and non-reversing
responses is to distinguish the overlapping thermal event, such as the relaxation enthalpy
coinciding with the Tg and separating the broad peak of water loss that interferes with the
glass transition in the hygroscopic materials (66).
Figure 2.12 Sine wave heating in MTDSC (solid line) and linear heating in conventional
DSC (broken line)
-30
-25
-20
-15
-10
Mo
du
late
d T
em
pe
ratu
re (
°C)
10 12 14 16 18 20 22
Time (min)
Sample: FF EPO casted filmSize: 4.0800 mg
Comment: prelim
DSCFile: E:...\20151118 FF EPO casted film 2.001Operator: MuqdadRun Date: 18-Nov-2015 20:11Instrument: DSC Q2000 V24.10 Build 122
Universal V4.5A TA Instruments
Tem
per
atu
re (
°C)

80
Figure 2.13 A flow chart illustrating an MTDSC signal deconvolution (adapted from
reference (62))
Cp acquired from MTDSC is twice as accurate and precise as the standard DSC because
MTDSC is less noisy and more precise (64, 65). In MTDSC, Cp is obtained by calculating
the proportion of modulated heat flow amplitude (AHF) to modulated heating rate amplitude
(AHR). Then, it is multiplied to the heat capacity calibration constant K, because of the non-
ideal behaviour in the real heating cell, as seen in equation 2.4.
𝐶𝑝 = 𝐾 ∙ (𝐴𝐻𝐹
𝐴𝐻𝑅)……………………………………..(2.4)
In the MTDSC experimental conditions, the longer period improves accuracy while the
larger amplitude improves the signal-to-noise ratio (65). In order to satisfy these
prerequisites, slow underlying heating is required (less than 5°C.min-1) and at least six
modulations on the thermal event are recommended to be applied during MTDSC
experiments to accurately deconvolute the MTDSC signal.
2.4.2.2 MTDSC experimental conditions
A Q-2000 (TA Instruments, Newcastle, DE, USA), was used to perform MTDSC
experiments in this study. The Tzero calibration was used to calibrate the baseline. N-
Octadecane, indium, and tin were used for temperature calibration. The heat capacity
calibration for the MTDSC experiment was calibrated in a temperature range of -60 to
200°C. A constant nitrogen purge was applied at the 50 mL.min−1 during the experiments.
For the MTDSC study, a heating rate of 2 °C/min with a modulated amplitude of ±1 °C
every 60 s was used for film casting and electrospun samples (Chapter 5 and Chapter 6).
The solid dispersion formulation specimens, which were prepared from both film casting
Modulated Temperature
Modulated Heat Flow
Heat capacity (Cp)Cp= (AHF/AMF)*K
Reversing Heat flowCp*dT/dt
Total Heat FlowdH/dt
Non-reversing Heat FlowdH/dt-Cp*dT/dt = f(T,t)
Multiply by the heating ratedT/dt
Subtract Total Heat Flow from reversing Heat Flow

81
and electrospinning, were cut and precisely weighed (1−3 mg). The isothermal MTDSC
experiments were performed with modulated amplitude ±1 °C every 60 s for 2 hours. The
reversing heat capacity of the isothermal MTDSC experiments was calibrated at 35, 40, 45,
60 and 70 °C. The FF crystalline samples were precisely weighted at 3-5 mg in each pan.
TA standard aluminium crimped pans were used. Each sample was tested in triplicate.
2.4.3 Thermogravimetric analysis (TGA)
2.4.3.1 Basic principle
Thermogravimetric analysis (TGA) is a technique which monitors the weight of the sample
as a function of temperature or time at a constant temperature in a controlled atmosphere
(purging with nitrogen or dry air). The changes in mass are due to chemical or physical
reaction, for example, solid-solid reaction, liquid-solid reaction and gas-liquid reaction,
sublimation, and degradation. In pharmaceutics, TGA has been used for estimating the
water content from the weight loss, desolvation of solvated APIs and decomposition of the
APIs (62). For advanced application, it can be used to study the kinetics of the dehydration
process, determining the drug content in mesoporous materials from the drug degradation
(67, 68).
2.4.3.2 Thermogravimetric analysis operating conditions
In this study, a TGA Q5000 SA (TA Instrument, New castle, DE, USA) was used to
examine the chemical stability of the different polymer of FF and to determine the water
content in the formulation. The heating rate of 10°C.min-1 from room temperature to 400°C
was used to investigate the degradation of FF and the isothermal at 120 °C for 60 min was
used for determining the water content in the formulations.
2.4.4 Dynamic vapour sorption (DVS)
2.4.4.1 Basic principle
DVS is another gravimetric technique that is applied to analyse the solvent absorption
behaviour (69-71) (most cases are water and in this study). DVS controls the vapour of
water surrounding the sample and monitoring mass change at a controlled temperature.
Figure 2.14 illustrate the internal instrument structure of DVS. The desired humidity is
obtained by passing a specific flow rate of dried nitrogen through a water reservoir. Then,
the humidified nitrogen air enters a sealed chamber, which contains two identical quart
pans hanging in the balance; one is an empty reference pan, and another loads the sample.
The sample absorbs moisture from the environment and causes a mass change which is
recorded against the time (72).

82
DVS demonstrates advantages for the study moisture sorption behaviour of foods and
pharmaceutical materials (69-71, 73). There are two common modes that are widely used
for DVS study which is isohume and sorption isotherm. The isohume experiments are
conducted at fixed relative humidity and a certain temperature. The mass change is
recorded as a function of time. The data from an isohume mode benefits the investigation
of moisture sorption mechanisms such as peleg model, double exponential, and Fick's
diffusion (69). The sorption isotherm is another DVS mode that monitors the mass change
as ramping a water vapour concentration. The data obtained from this mode reflect an effect
on relative humidity to the moisture sorption of the sample. Further information in depth
from the sorption isotherm data can be obtained from fitting the data to Guggenheim-
Anderson-de Boer and Peleg model in order to explain the kinetic moisture sorption of the
sample (74, 75). The details of the mathematic model used in this study will be discussed
in section 2.7.
Figure 2.14 Diagram illustrating inner structure of Q5000 SA DVS. This diagram
reproduces from TA Instrument brochure.
2.4.4.2 DVS operating conditions
A Q5000SA DVS (TA Instruments, Newcastle, DE, USA) was used to perform dynamic
vapour sorption experiments in Chapter 5. The samples of cast films and fibrous
formulations were freshly prepared and were cut into small pieces. Approximately 8-10 mg
of the samples was placed into a quartz pan. During the experiment, the sample chamber
was sealed shut, and the dry nitrogen purge through a water reservoir was used to control
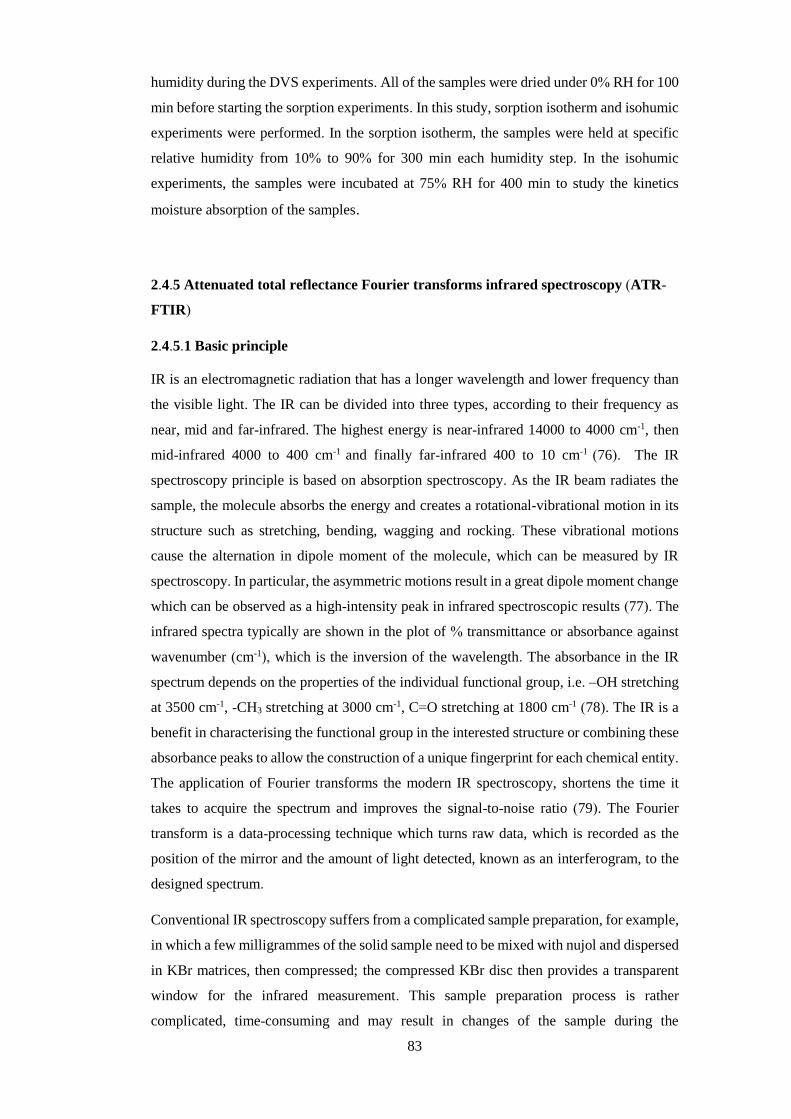
83
humidity during the DVS experiments. All of the samples were dried under 0% RH for 100
min before starting the sorption experiments. In this study, sorption isotherm and isohumic
experiments were performed. In the sorption isotherm, the samples were held at specific
relative humidity from 10% to 90% for 300 min each humidity step. In the isohumic
experiments, the samples were incubated at 75% RH for 400 min to study the kinetics
moisture absorption of the samples.
2.4.5 Attenuated total reflectance Fourier transforms infrared spectroscopy (ATR-
FTIR)
2.4.5.1 Basic principle
IR is an electromagnetic radiation that has a longer wavelength and lower frequency than
the visible light. The IR can be divided into three types, according to their frequency as
near, mid and far-infrared. The highest energy is near-infrared 14000 to 4000 cm-1, then
mid-infrared 4000 to 400 cm-1 and finally far-infrared 400 to 10 cm-1 (76). The IR
spectroscopy principle is based on absorption spectroscopy. As the IR beam radiates the
sample, the molecule absorbs the energy and creates a rotational-vibrational motion in its
structure such as stretching, bending, wagging and rocking. These vibrational motions
cause the alternation in dipole moment of the molecule, which can be measured by IR
spectroscopy. In particular, the asymmetric motions result in a great dipole moment change
which can be observed as a high-intensity peak in infrared spectroscopic results (77). The
infrared spectra typically are shown in the plot of % transmittance or absorbance against
wavenumber (cm-1), which is the inversion of the wavelength. The absorbance in the IR
spectrum depends on the properties of the individual functional group, i.e. –OH stretching
at 3500 cm-1, -CH3 stretching at 3000 cm-1, C=O stretching at 1800 cm-1 (78). The IR is a
benefit in characterising the functional group in the interested structure or combining these
absorbance peaks to allow the construction of a unique fingerprint for each chemical entity.
The application of Fourier transforms the modern IR spectroscopy, shortens the time it
takes to acquire the spectrum and improves the signal-to-noise ratio (79). The Fourier
transform is a data-processing technique which turns raw data, which is recorded as the
position of the mirror and the amount of light detected, known as an interferogram, to the
designed spectrum.
Conventional IR spectroscopy suffers from a complicated sample preparation, for example,
in which a few milligrammes of the solid sample need to be mixed with nujol and dispersed
in KBr matrices, then compressed; the compressed KBr disc then provides a transparent
window for the infrared measurement. This sample preparation process is rather
complicated, time-consuming and may result in changes of the sample during the

84
preparation steps. Attenuated total reflectance (ATR) sampling is a solution to this problem.
The ATR accessory employs the principle of internal reflection (80). The infrared beam
passes through the ATR crystal, which has a high refractive index (mostly diamond). The
beam reflects from the internal surface and creates an evanescent wave which penetrates
into the sample approximately 0.5-5 µm. The sample absorbs the evanescent wave and
returns the rest of the beam to the detector. Therefore, the sample must be in contact with
the ATR crystal. A diagram of ATR reflection is illustrated in Figure 2.15. Furthermore,
it is a non-invasive approach which minimises the damage to the sample during the
experiment.
Figure 2.15 A schematic diagram demonstrating the principle of attenuated total
reflectance
ATR-FTIR is a frequently used technique for the characterisation of pharmaceuticals (81,
82). It has many applications, including constructing a chemical fingerprint of each
material. The commonly used APIs IR fingerprints are available in British Pharmacopeia.
ATR-FTIR is sensitive to inter and intramolecular arrangement. Thus, it is a potential tool
to distinguish the state of materials, including amorphous, crystalline and even polymorphs.
ATR-FTIR has been used to detect the interaction of drug and excipients in solid
dispersions including a hydrogen bonding which promotes miscibility in solid dispersion
(33).
2.4.5.2 ATR-FTIR experimental conditions
In this study, ATR-FTIR was used to distinguish the polymorphic form of FF (Chapter
3and 4) and to study the interactions between drug and polymers in the formulations
(Chapter 5 and 6). An IFS 66/S spectrometer (Bruker Optics Ltd., Coventry, U.K.)
equipped with a Golden Gate heated top plate attenuated total reflectance accessory
(Specac Ltd., Orpington, U.K) was used to perform the IR spectroscopic studies. A few
milligrammes of raw materials, crystalline FF samples, film casting formulations and
electrospun fibrous formulations were placed on the diamond crystal of the ATR accessory.
Each spectrum was taken between 4000 and 550 cm−1 with 2.0 cm−1 resolution and 32
scans. All samples were examined in triplicate. OPUS software version 6.5 (Specac Ltd.,
Orpington, U.K) was used to analyse ATR-FTIR spectra.
Sample
ATR crystal
Evanescent wave

85
2.4.6 FTIR microscopy
2.4.6.1 Basic principle
FTIR microscopy is an imaging technique that couples optical microscopy with the FTIR
spectrometer. It has various types of applications in biology, biomedical, pharmaceutical
and polymers science as a potential mapping tool to distinguish material components (83-
85). Vogel and colleagues successfully acquired phase separation images with FTIR
microscopy of the blends of poly(3- hydroxybutyrate) (PHB) with poly(L-lactic acid)
(PLA) and poly(ε-caprolactone) (PCL), respectively (85). Moreover, the infrared spectrum
can differentiate between the amorphous and crystalline state of APIs. Therefore, it can be
potentially used for imaging the phase separation of an amorphous drug and polymer.
The operational modes of FTIR microscopy can be divided into two major modes, which
are transmission mode and reflection mode. The transition mode is suitable for thin
specimens which a laser can transmit through such as microparticles, thin films and a cross-
sectional film prepared from microtoming, while the reflection mode requires a thicker (at
least 15 μm) that can reflect a laser beam. This technique is particularly suitable for
studying the surface of the sample. Unlike an ordinary FTIR spectrometer, the instrument
of FTIR microscopy is equipped with a multi-channel focal plane array detector which
consists of a small pixel plate. Consequently, it enables fast data collection and can collect
the optical signal from the entire field (86). Currently, the available resolution of the plane
array detector is between 64x64 to 256x256 pixels in which the spatial resolution of this
technique is approximately 20 µm2 per pixel (87).
2.4.6.2 FTIR microscopy experimental conditions
FTIR mapping was investigated by using a Nicolet iN10 MX Infrared Imaging Microscope
(Thermo Fisher Scientific – Thermo Scientific Inc., Vienna, Austria). The small piece (1x1
cm) polymer cast films are placed on the stage, which is supported by a BaF2 window and
measured in the transmission mode. Each pixel size in the mapping was 25x25 µm2 and
was acquired from 16 scans with resolution 8 cm-1in which a 16 element MCT was an
imaging detector. The spectra were automatically corrected for atmospheric water vapour.
The data were processed with Omnic Spectra software (Thermo Scientific Inc., Vienna,
Austria). Different IR maps were generated for areas of selected peaks. The homogeneity
of areas was tested by plotting correlation maps related to known spectra, or by performing
PCA analysis in the region of 1800-800 cm-1.

86
2.4.7 Single crystal and powder X-ray diffraction
2.4.7.1 Basic principle
X-ray diffraction is an important technique to characterise crystalline materials. X-ray is
electromagnetic radiation with a small wavelength (approximately between 0.1 to 100Å),
which is similar to the interatomic distance. When the X-ray beam passes through the
crystalline matters, it is scattered by the electrons that surrounds an atom. The position of
the diffracted peak can be explained by using Bragg’s law, as seen in equation 2.5.
𝑛𝜆 = 2𝑑 𝑠𝑖𝑛𝜃………………………………….(2.5)
where n in an integer of diffracted beam that reflects from the different layer and perfectly
in phase with each other, λ is the wavelength of the X-ray beam, d is the spacing between
atom layer; θ is the incident angle of the beam and the crystal plane. The Bragg’s rule
applies to both single crystal and powder X-ray diffraction.
Single crystal X-ray diffraction (SCXD) and powder X-ray diffraction (PXRD) are
complementary techniques that have been used to study the crystalline structure of solid
substances. The single crystal X-ray diffraction provides an internal crystalline structure
such as bond length, atom position, cell dimensional and bond angle (77, 88). Thus, it is an
absolute method to determine the structure of crystalline matters. A single piece of crystal
is mounted to the needle shape sample holder and radiated by the X-ray beam at different
angles. The beam scatters are recorded and used as the primary data to solve the crystalline
structure. SCXD suffers from several disadvantages, for example, the time required for
analysis, difficulty in obtaining an individual piece of single crystal (50-250 µm). SCXD
is mainly used for identifying new crystalline structures including polymorph, solvate, and
co-crystals (77, 82). The Cambridge Structural Database (CSD) is the largest
crystallographic electronic database for crystalline materials; they have collected numerous
crystallographic data from X-ray single crystals for the purpose of pharmaceutical drug
discovery, materials development, research and education.
On the other hand, X-ray powder diffraction (PXRD) is a non-destructive method used to
characterise crystalline materials and is accepted as a gold-standard approach (77, 82). In
comparison to PXRD, SCXD has a single crystal orientation while powder in PXRD
contains numerous crystals. Thus, it demonstrates all possible orientations of the crystalline
materials. The sample was placed in a fixed position sample holder while the X-ray source
and the detector were raised upwards in θ°. The diffraction peaks with intensity recorded
at 2θ°.The PXRD is particularly sensitive to those long range orders of crystalline
materials, in which individual crystalline matter demonstrates its patterns. Therefore,
PXRD patterns can be used for identifying crystalline materials including their polymorphs

87
and solvates (82, 88). On the other hand, amorphous materials show a halo pattern (broad
peak). PXRD can characterise the mixture of amorphous materials and crystallines, and the
intensity of the PXRD peak reflects the degree of crystallisation of crystalline material.
Therefore, PXRD is an effective technique to study solid dispersion formulations and
evaluate their physical state (29).
The preferred orientation is a dramatic issue that influences the intensity of the PXRD
pattern. It is caused by the non-spherical crystallite, which has a tendency to orient at a
minimum volume (77). This phenomenon results in non-randomness, which leads to
intensity decrease of Bragg’s reflection for peaks that are not in reflecting position; increase
for peaks in reflecting position (such as face of a platelet). The example of this effect was
reported by the experimental sulfathiazole form III PXRD pattern, demonstrating the
preferred orientation in comparison to the simulated pattern obtained from its single crystal
data (89), illustrated in Figure 2.16.The preferred orientation can be eliminated by
sufficient grinding prior to loading to the sample holder, the customary load sample on the
side of the holder and by using spray drying as the preparation method (90). However, these
methods have to be applied with caution because they are considerably effected to
polymorphic transformations of the sample (77).
Figure 2.16 Preferred orientation of PXRD sulfathiazole form III is reduced by grinding.
This figure was reproduced from reference (89).
2.4.7.2 Single crystal X-ray diffraction experimental operating conditions
The diffraction experiments were performed using an Oxford Diffraction Xcalibur-
3/Sapphire3- CCD diffractometer (Oxford Diffraction Ltd., Oxford, UK) using graphite
monochromated Mo−Kα radiation (λ = 0.71073 Å). Crystals of FF from II and III were
colourless prisms. A single crystal was chiselled out from a solid array of crystals from a
10 3515 20 25 302θ( )

88
melt, mounted on a glass fibre and fixed in the cold nitrogen stream on the diffractometer.
Intensity data were measured using thin-slice ω and φ-scans at 140 K. The diffraction data
were processed using the CrysAlisPro-CCD and-RED programs (91).
2.4.7.3 Single crystal structure solving
The structure was solved in SHELXT using the dual-space approach and refined with
SHELXL, as implemented in the ShelXle GUI (92, 93). All non-hydrogen atoms were
located from electron density maps and were refined with anisotropic thermal parameters.
Hydrogen atoms were included in idealised positions and were refined with independent
isotropic displacement parameters. The coordinates of hydrogen atoms were refined in
riding mode while allowing rigid rotations of the methyl groups. The geometric
measurements in this article were obtained using the programs PLATON and OLEX2 (94,
95). The graphic illustrations were created using Mercury (96). The single crystal data were
analysed by Mr. Khaled Tekieddin.
2.4.7.4 Powder X-ray diffraction experimental operating conditions
A Thermo-ARL X’tra diffractometer (Ecublens, Switzerland) was used to perform PXRD
experiments at ambient temperature and humidity. The crystalline samples were gently
crushed with a mortar and a pestle to avoid the preferred orientation effect. The crushed
powders were transferred to a sample holder. The physical mixture of drug and polymer
were homogeneously blended in a mortar before transfer to the sample holders. The
electrospun fibres samples were cut into small pieces and then packed onto the sample
holders. A Cu Kα1 radiation source was used with 45 kV voltage and a current of 40 mA.
The angular range was from 5° to 50° (2°θ) with a step size 0.01° and one second per step.
2.4.8 Scanning electron microscopy (SEM)
2.4.8.1 Basic principles
SEM is one of the electron microscopic classes in which the surface topology of an object
is mapped with a focus electron beam. Typically, it has a high resolution and magnification
(down to nanometer) in comparison with traditional optical microscopic techniques. The
electron beam in generated from tungsten filament with 10-20 kV accelerating voltage is
radiated to the surface of the sample. The SEM images are constructed from the secondary
electron that is emitted from the excited atom from the electron beam. The specimens are
examined in a high vacuum chamber in which temperature can be cryogenic, room
temperature and elevated temperature (97).

89
The SEM demonstrates various applications in pharmaceutical formulation design and
development. It has been used to investigate the morphology of crystalline material at high
magnification, to examine the surface topography and to trace suspected APIs
recrystallization in solid dispersion formulations. Additionally, it is a powerful tool to study
the morphology of electrospun fibres including fibrous diameter, fibre orientation and
defects on the fibres (34, 35).
2.4.8.2 SEM experimental operating conditions
A JEOL 5900 LV (Tokyo, Japan) scanning electron microscopy scanning electron
microscope was used to examine the morphology of talcum, FF polymorphs I, III, spin-
coated film, cast films and electrospun fibres. A small piece of film, fibrous mat or some
drug crystals were attached to a sample stub and sputter coated with Au/Pd before
imaging. The accelerated voltage was fixed at 20 kV.
2.4.9 Transmission electron microscopy (TEM)
2.4.9.1 Basic principles
Transmission electron microscopy is another type of electron microscopy class. It employs
a similar principle to a light microscope, but TEM uses an electron beam instead of visible
light. Therefore, it offers extremely high magnification, which can explore down to the
nanoscale. A very thin specimen is mounted on a copper grid, which is later placed in a
vacuum chamber. The electron beam is generated by a tungsten filament electron gun. The
electron beam is finely focused on the specimen site by using an electromagnetic lens and
transmitted through a thin layer of a sample. Consequently, some electron scatter depends
on the density of the material. The transmitted electrons hit the fluorescent screen at the
bottom of the TEM and create shadow images, in which the intensity of the darkness in the
image relate to the density of the sample. Thus, this allows the internal structure of an
interested specimen to be examined. TEM is a frequently used approach to study the core-
shell structure of electrospun fibres (98, 99).
2.4.9.2 Transmission electron microscope operating conditions
Transmission electron microscopy characterization was performed at room temperature
using a Philips CM30 instrument operating at 300 kV. The very thin layer of electrospun
fibres including coaxial PVP-HPMCAS fibres and PCM PVP-HPMCAS fibres were
supported on holey-carbon films on 300 mesh copper grids held within a double tilt sample
holder. Images were collected on photographic films, which were scanned in order to
generate digital images.

90
2.4.10 Hot stage polarised light microscopy (HS-PLM)
2.4.10.1 Basic principle
Hot stage polarised microscopy is coupled between a controlled temperature chamber and
a polarised light microscopy. Polarised light is light with restricted oscillation frequency,
obtained from passing unpolarized light through a polarizer. The polarised light can be used
to determine the optical crystallographic properties of the crystalline APIs (62, 88). The
heating chamber controls the temperature of the sample and allows the thermal behaviour
of APIs to be studied at an elevated temperature such as melting, desolvation,
crystallisation, and their crystal growth. A colour camera records the images as a function
of temperature or against the time in case of the isothermal experiment. HS-PLM is an
observation technique that is typically applied for investigating the crystal growth kinetics
and also identifies the API crystals (62, 100).
2.4.10.2 HS-PLM operating conditions
A PLM model Leica DM LS2 (Wetzlar GmbH, Germany) equipped with a JVC camera
with 5, 10 and 20x magnification was used to study the morphology of the crystalline FF
and crystal growth of amorphous FF from the melts. The microscope coupled with a hot-
stage Mettler Toledo FP82HT in which regulated by an FP90 central processor (Greifensee,
Switzerland) was controlled from Software Studio Capture 1.6 from Mettler Toledo Ltd
(Greifensee, Switzerland). The growth rate of FF was analysed by using ImageJ software.
The average values of three measurements from different images were used.
2.4.11 Atomic force microscopy (AFM)
2.4.11.1 Basic principle
Atomic force microscopy is a surface probing technique, which has proven to have
tremendous advantages in surface science, medicinal and biological research (101, 102).
The AFM probe is composed of a sharp tip, facing the sample surface that is allocated at
the end of a cantilever. The back of the cantilever is coated with reflective material. A laser
beam is projected onto the back of a cantilever. The deflected laser beam is detected by a
photodetector, which is used to monitor the probe position. In the operation, the tip is
maintained close to the sample surface. Several forces such as van der Waals force or ionic
force interact between the apex of the tip and the surface of the specimen during sample
scanning. These forces contribute to a dislocation of the probe, which is monitored by the
photodetector and feedback signal is sent back to maintain the probe position. The feedback

91
data is then used to create a topography image of the sample surface. The diagram in Figure
2.17 illustrates the fundamental set up of an AFM system (103).
There are three common modes of AFM used for studying the topology of samples: contact
mode, non-contact mode, and tapping mode. This study emphasises the contact mode
because it was mainly used in this project and local thermal analysis, which is an extension
of this mode. The AFM tip is in contact with the sample and dragged along the surface
during an image scanning in contact mode. A probe is kept in a constant position using a
feedback loop, and a surface topography is generated from the feedback signal (102). This
mode is ideal for hard surface samples and force microscopy. It may cause damage to soft
samples such as cell and tissue (101, 103). Thus, the contact mode AFM is commonly used
for characterisation of the surface in materials science.
Figure 2.17 Schematic diagram of atomic force microscopic setup. This figure is
reproduced from reference (103)
2.4.11.2 Local thermal analysis (LTA)
Frequently used thermal analysis techniques such as DSC, MTDSC and TGA test show a
sample-average response, which is not site/local specific. In order to address this problem,
Hammiche and co-workers developed a thermal probe approach which allows heating to
occur locally at a particular site. This technique, namely local thermal analysis (LTA)
(104), is an extension of conventional AFM contact mode. The AFM is equipped with a
thermal probe that has the ability to heat up when electrical voltages are applied. There are
two types of thermal probe available: micro and nanoprobe, according to the resolution site
of each probe (105, 106). The thermal probe is landed on the interested location as in
contact with the surface of the sample. Electrical voltages are applied to the probe resulting
in its tip being heated. Then, the temperatures at the site reach a transition event such as
melting or glass transition of the material, leading to the site softening and the probe sinking

92
into the surface of the sample. This causes the probe to dislocate, which is detected from a
suddenly reducing of a laser deflection from the cantilever (106-108). The principle of LTA
is illustrated in Figure 2.18.
Figure 2.18 Schematic diagram of the principle of local thermal analysis, adapted from
reference (105).
There are two types of LTA probes, which are micro and nano thermal probe (105). The
microprobe is an AFM probe made from a Wollaston wire adapted cantilever probe, also
known as Wollaston probe (109). The wires consist of a silver shell (75 µm diameter) and
platinum core (5 µm diameter). The silver sheath is removed to expose the core platinum
wire. The wire is bent to form a V-shape, which is a suitable probe shape. The mirror is
attached to the top of the cantilever arms, which reflect a laser beam to the photodetector.
The images of the micro thermal probe are demonstrated in Figure 2.19a. This probe
provides spatial resolution of approximately 1 µm (109, 110). On the other hand, the nano
thermal probe is produced from a micromachine. The image of the nano thermal probe is
illustrated in Figure 2.19b. It consists of a silicon nitrile pyramidal tip, palladium resistor
and cantilever (105). The height of the apex is approximately 5 µm with the narrowest point
of 35 nm (105, 107). Thus, it can provide spatial resolution down to 50 nm (107). This is a
significant improvement of the spatial resolution in comparison to the Wollaston probe. In
this study, a nano thermal probe was used to examine the phase separation of the polymer
blended formulations.
Material surface
De
fle
ctio
n
Material surface Temperature
Applying voltage to the probe
1
21
2
Transition temperature

93
Figure 2.19 Schematic images of microprobe (a) and a nano thermal probe (b),
reproduced from reference (105,109)
2.4.11.3 AFM contact mode and LTA operating conditions
A Caliber AFM (Veeco Instruments, Santa Barbara, CA, USA) equipped with a nano
thermal analysis probe (Anasys Instruments, Santa Ba, CA, USA) with a spring constant
of 0.5−3 N·m−1 was used to study the submicron morphological details of the cast and spin-
coated blend films. The temperature calibration of LTA was performed using
polycaprolactone (Tm 60 °C), polyethylene (Tm 130 °C), and polyethylene terephthalate
(Tm 238 °C) prior to any sample analysis. Contact mode was used for acquiring the
topographical images of the PVP-HPMCAS films, which were prepared by film casting
and spin coating. The nano-TA probe was then moved to the point of interest for local
thermal analysis. LTA was performed at 5 points for each acquired topographic image. All
experiments were carried out at a heating rate of 10 °C·s−1.
2.4.12 Solid state nuclear magnetic resonance spectroscopy (ss-NMR)
2.4.12.1 Basic principle
Nuclear magnetic resonance (NMR) spectroscopy is a globally used and powerful
technique that can determine both physical and chemical properties of material. The NMR
principle is based on the resonance of nuclei under the influence of an external magnetic
field (111, 112). Nuclei that have a sum of proton and neutron as an odd number are NMR
active nuclei, including 1H, 13C, 15N and 19F (113). These isotopes demonstrate a half-
integer spin (1/2, 3/2 and 5/2). They are on an equal energy level in the absence of the
magnetic field. Under an external magnetic field, the spin splits into two different energy
levels, whether the spin is aligned with or against the magnetic field; each level is given a
magnetic quantum number (m), as shown in Figure 2.20. The low energy state always
a b

94
contains a higher number of nuclei than the high energy state. Thus, it is possible to excite
the lower energy nuclei to the higher energy level by applying radiofrequency pulses. After
these nuclei are excited to the high energy level, they undergo relaxation processes by
releasing energy and returning to the low energy level (112, 114). The time that it takes to
return to equilibrium is called relaxation time.
Figure 2.20 Energy levels of nuclei split into two different states after applying an
external magnetic field.
In real atoms, the proton is surrounded by an electron cloud. The external magnetic field
(B0) influences the circulation of electrons, which causes the production of local magnetic
fields (Bi) that oppose the external one. The proton with high electron density (electron
donating group) has the shielding effect, while the proton locates near electron withdrawing
group are less shielded (112, 114). The environment of atoms in the molecules plays an
important role, and it affects the resonant frequency. Consequently, atoms in molecules
demonstrate a different resonance frequency associated with their neighbour atoms. The
NMR spectrum is reported in a chemical shift scale obtained from comparing the sample
frequency to the standard frequency. Tetramethylsilane is commonly used as a standard in
NMR experiments.
In the solution state, molecules move freely in various directions, resulting in the anisotropy
being averaged to zero by the tumbling motions of the molecules. In contrast, solid
materials contain molecules which are tightly packed. Consequently, they have limited
mobility. Thus, the anisotropic effect in the solid sample is inevitable, resulting in peak
broadening and decreased resolution (88, 115). The development of magic spin angle
(MAS) results in an averaging out of the anisotropic effect by fast spinning the specimen
at 54.74° with respect to the applied magnetic field. Spectral resolution can also be
enhanced with cross polarisation (CP) experiments by improving the signal-to-noise ratio.
Ene
rgy
leve
l
m = 1/2
m = -1/2
No B0
Applied B0
0
B0
directio
n

95
The combination of MAS and CP allows ss-NMR to be a robust approach to characterise
solid state samples (88, 115-117).
Solid-state NMR spectroscopy is a powerful tool to characterise APIs and solid dispersions.
The CP-MAS spectrum can be used to identify polymorphism and to investigate the
interactions between drugs and polymers (82, 116, 118). Furthermore, solid-state NMR
relaxometry is frequently applied to the study of small-scale phase separation in polymer
blends (119). It is a high-resolution method in which its detection limit is beyond
microscopic and thermal techniques (MTDSC). The heterogeneity of the blends is
determined by measuring proton relaxation times, often referred to as longitudinal
relaxation time in the laboratory frame (T1) and longitudinal relaxation in the rotating time
frame (T1ρ). T1 processes occur via dipole-dipole interactions and are influenced by
molecular mobility, while T1ρ is sensitive to slower motions of the polymer chain such as
polymer backbone mobility (117, 120). By combining these two relaxation times, one can
estimate the upper and lower limit of phase separation down to the Å range (119, 121).
2.4.12.2 ss-NMR operating conditions
The proton spin−lattice relaxation time in the laboratory frame, T1, and in the rotating
frame, T1ρ were measured on a Bruker Mq- 20 spectrometer (Bruker BioSpin, Rheinstetten,
Germany) (19.95 MHz) with a proton 90° pulse-length of 2.85 μs. T1 was measured using
the saturation-recovery pulse sequence (recycle delay-90°-τ-90°-acquisition) for the slowly
relaxing pure drug and an inversion recovery sequence for the faster relaxing samples. The
relaxation T1ρ was measured using the standard sequence (recycle delay-90°-spin lock-
acquisition) with a spin-lock field of about 45 kHz. The ss-NMR experiments were
conducted by Dr. Li Ying Wang and Prof. Huiru Tang from the Wuhan Institute of Physics
and Mathematics, China.
2.6 In vitro dissolution study
Dissolution is a drug released test from solid or semisolid formulations to the medium
which performs according to the official pharmacopoeia (56). The dissolution data is a very
important piece of information for pharmaceutical products in term of both quality control
(QC) and research and development (R&D). In the QC, the dissolution tests are performed
to ensure batch consistency and that the products are manufactured according to their
specifications. The deviations of the dissolutions test may reflect problems in the
manufacturing process (122). This alerts the pharmaceutical industries to deal with the
issue before products are released to the markets. From an R&D perspective, the dissolution

96
test provides the estimation of the drug release behavior, which potentially correlate to the
in vivo drug release (122).
2.6.1 Preparation of dissolution media
In this study, the British Pharmacopoeia dissolution media pH 1.2 was used. To prepare
this media, 250 ml of 0.2 M NaCl solution was added to 425 ml of 0.2 M hydrochloric acid
and diluted to 1000 ml with distilled water. These acidic dissolution media were prepared
according to the official procedure stated in the British Pharmacopoeia (56).
2.6.2 In vitro dissolution operating conditions
Drug release experiments were performed using the British Pharmacopeia paddle method
by an apparatus II (Copley CIS 8000, Copley Scientific Ltd., Nottingham, U.K.). The
experiments were performed at 37°C±0.5°C with a paddle speed rotation of 50 rpm. The
pH 1.2 British Pharmacopoeia dissolution media were used. In the FF dissolution tests,
0.5% sodium lauryl sulphate reagent grade (purity >97%) (Fisher Scientific,
Loughborough, UK) was added to the dissolution media as a surfactant. The media was
sampled at times of 1, 3, 5, 7, 10, 20, 30, 60 and 120 mins and filtered through an 0.45 µm
membrane (Minisart Sartorius, Goettingen, Germany). As all dissolution testing was
performed under sink conditions, no recrystallization of the model drug as nanocrystals
was expected to be formed after release from the formulation; therefore, the filtration
method for treating the dissolution samples was appropriate. The drug concentration was
measured by ultraviolet-visible spectroscopy at different time intervals.
2.6.3 Ultraviolet-visible spectroscopy (UV-VIS) for measurement of drug release.
2.6.3.1 Basic principle
Molecules absorb electromagnetic energy from ultraviolet or visible light, resulting in the
electrons transitioning from a ground state to an excited state. The UV-VIS can be used to
analyse organic compounds that contain conjugated bonds in their molecular structure. It
is feasible for both qualitative and quantitative measurements (123). The UV-VIS
quantitative measure obeys the Beer-Lambert law which states that the concentration and
path length is proportion to the absorbance (56). The Beer-Lambert equation can be
described as;
𝐴 = 휀𝑙𝑐……………………………..(2.6)

97
where A is the absorbance, Ɛ is the absorptivity coefficient; l is the path length of the cuvette
and c is the concentration of drug in the media. This rule is only valid in the dilute medium
where drug concentrations have a linear relation with UV absorbance (56).
APIs are organic compounds that contain conjugated bonds in their structure. Hence, UV-
VIS can be used to quantify the concentration. FF and PCM demonstrate their maximum
UV absorption wavelength at 298 nm and 245 nm, respectively. The calibration curves in
this study were constructed by plotting different drug concentration against the UV
absorbance at the λmax of the model drugs, to obtain the absorptivity coefficient. The
linearity of the plots with R2 values greater than 0.999 has been achieved for both FF and
PCM calibration curves.
2.7 Kinetic models
2.7.1 Kinetics models of drug release
2.7.1.1 Power law
Korsmeyer-Peppas model, also known as power law model, is a semi-empirical model
(124). It offers the advantage of discriminating between the two general mechanisms of
drug release, which are Fick’s diffusion and case II transport (125). The equation is
expressed as
𝑀𝑡
𝑀∞= 𝑘𝑡𝑛 ……………………………….(2.7)
where Mt/M∞ is the fraction of drug released at time t in relation to complete drug release
at time infinity; k is a constant that reflects the geometric and structural characteristics of
the device, and n is the diffusion exponential that provides indications of the mechanism
of drug release. The electrospun fibres used in this study are cylindrical in shape. The
exponential value, n, which is obtained from fitting release data to equation 2.7, can
identify the mechanism of drug release as Fickian diffusion, anomalous transport, or Case-
II transport (zero order diffusion). In the case where the dominating mechanism of release
is Fickian diffusion for a cylindrical geometry, the n value is equal to 0.45; whereas for
zero order diffusion, the n value is equal to 0.89 (126). Any value between 0.45 and 0.89
is regarded as anomalous transport in which the mechanism of drug release is a combination
of both Fickian diffusion and Case-II transport. In the literature, it has been recognised that
the most valid prediction using power law should be performed only on the first 60% drug
release data due to the assumption of single dimensional release in cylinders (126).
The power law model has been used to fit with various kinds of formulations, including
electrospun fibres (98, 99, 127, 128). A mechanism of drug release from both conventional

98
and core-shell structure electrospun fibres has been successfully elucidated. Shen et. al
fitted the diclofenac release from Eudragit L 100-55 fibres in pH 6.8 media with the power
law equation. The authors found that their electrospun fibres with low drug content 10-20%
exhibited an anomalous transport while with high drug loading >30%, the release behaviour
was dominated by Fickian diffusion (128). Yu et al. and Jiang et al. prepared core-shell
electrospun fibres to form EC/PVP and zein/PVP respectively. The drug released profiles
of these formulations were fitted to the power law model. Both studies showed that Fickian
diffusion dominated the drug release in the core-shell fibrous formulations because the n
values of each formulation were less than 0.45 (98, 99). In this study, the PCM released
profiles from the PVP/HPMCAS blended electrospun formulations were fitted to the power
law model in order to investigate the mechanism of drug release (chapter 6).
2.7.1.2 Biphasic released model
The biphasic released model developed in this study was based on the assumption that the
polymer blend fibre mats contain two populations of immiscible polymer domains, which
have independent drug release rates. For each population, the fraction of drug release at
time t can be described by first-order mass transfer and expressed by equation 2.9 in which
Mt is the mass remaining at time t, k is the constant, and M∞ is the total drug release at
infinity.
𝑀𝑡 = 𝑀∞𝑒−𝑡𝑘 …………………………...... (2.8)
For the polymer blend electrospun fibres, two populations of domains, PVP-rich and
HPMCAS-rich, were assumed to independently release the drug at different rates. The mass
transfer, in this case, can be expressed using equation 2.8, in which ka and kb are exponents
of the PVP-rich and HPMCAS-rich phases, respectively. This model was used to
investigate the PCM released profiles in which the PVP-HPMCAS blended electrospun
formulations were fitted to the biphasic released model in order to investigate the
mechanism of drug release (Chapter 6). Note that this model assumes equal distribution of
the drug in the two phases.
𝑀𝑡
𝑀∞
= (𝑒−𝑡𝑘𝑎 + 𝑒−𝑡𝑘𝑏)…….…………………(2.9)
2.7.1.3 Statistical analysis for models selection
Akaike statistical analysis (AIC) is a statistical method for the model selecting approach. It
offers an estimation of model relative quality in comparison to other models (129).
Particularly, AIC was used to compare the effectiveness of the mathematical models. This

99
method combines goodness-of-fit with a penalty score for extra variables. Adding more
terms to model equations usually provides a better fit (lower R2), but not necessarily a better
description of the underlying processes. In this study, the power law (equation 2.7) and the
biphasic released model (equation 2.9) were used to investigate the mechanism of PCM
released from PVP/HPMCAS fibre mats by fitting to the drug released data. These models
have different numbers of variables and their ability to describe the dissolution process
cannot be judged objectively on the basis of R2 values alone. Therefore, AIC with corrected
finite sample size (AICc) was used to assess the quality of the power law and biphasic
released model. The lower AICc values indicate more accurate models. The AIC and AICc
can be expressed as;
AIC = u.ln(SSE/2)+(2L+1)……………………………(2.10)
AICc = AIC + (2(L+2)(L+3)/u-L-3)……………………(2.11)
where SSE is the sum of error residual from data fitting which is the difference between
experimental data and predictive values, u is the number of the data point, and L is the
number of the variables in the model.
2.7.2 Mathematic models for study kinetics of moisture sorption
In this study, three mathematical models, Guggenheim-Anderson-de Boer (GAB) model,
Peleg model, and double exponential (DE) model, were used to fit with moisture sorption
data obtained from DVS of electrospun fibres and cast films formulations. The purpose of
the mathematical models fitting is to investigate the moisture sorption mechanism of the
formulations.
The semi-empirical GAB model is a versatile model for fitting sorption isotherm data. It is
a developed version of Brunauer-Emmett-Teller’s equation respect to physical adsorption
background theory (74, 75). The GAB model can explain sorption behaviour in a wide
range of water activity from 0-0.9 and it is also recommended by the European Cooperation
in Science and Technology (COST) as an equation for describing sorption behaviour in
foods (75). The GAB model is expressed as
𝑀 =𝑀0𝐶𝐺𝐾𝑎𝑤
(1−𝐾𝑎𝑤)(1−𝐾𝑎𝑤+𝐶𝐾𝑎𝑤)……………………………(2.12)
where M is the moisture content, aw is the water activity which is equal to the relative
humidity at the equilibrium state, M0 is the monolayer moisture content, CG is Guggenheim

100
constant and K is the compensating constant for multilayer moisture adsorption. The M0,
CG, and K were obtained from the data fitting. In this study, the equilibrium moisture
contents from 10% RH to 90 RH% of the electrospun fibres were fitted with the GAB
model.
The moisture uptake of amorphous materials in foods and pharmaceutics can be described
by using Peleg and DE model (69) at a fixed relative humidity. The Peleg model is an
empirical model purely derived from/based on mathematics without the support of physics
theory. It is developed to fit with moisture sorption and frequently used to describe sorption
behaviour in agriculture and foods (130). The Peleg model has been used to explain the
hydration process of different materials, following the case II diffusion in which the waters
rapidly accumulate at the surface of the materials in the adsorption stage (40, 131). Then,
the boundary of the water outer layer is gradually absorbed into the interior of the materials.
The Peleg model can be expressed as
𝑀𝑡 = 𝑀0 +𝑡
𝐴1+𝐴2.𝑡...................................................(2.13)
where Mt is the moisture content at time t, M0 is the initial moisture content, A1 is the Peleg
rate constant, and A2 is the Peleg capacity constant.
The moisture uptake behaviour of porous materials such as porous silica and activated
carbons is complex. It combines adsorption and absorption in which the adsorption is the
dominant process in the porous materials (40). The dynamic of this process can be
described by using DE model.
𝑀𝑡
𝑀𝑒= 𝐴1(1 − 𝑒−(𝑘1𝑡)) + (1 − 𝐴1)(1 − 𝑒−(𝑘2𝑡)) …………….(2.14)
where Mt is the accumulated moisture uptake at time t, Me is the equilibrium moisture
content, k1 and k2 are adsorption rate constants, and A1 and (A1-1) are fractional
contributions to the difference in adsorption of rate constant k1 and k2.
The moisture sorption data of the film casting and electrospun fibrous formulations
obtained from DVS including sorption isotherm and isohume mode were averaged (n=3)
and fitted to the GAB, Peleg and DE models to describe their moisture uptake behaviour.
The data fitting experiments were performed using TableCurve 2D version 5.01 (systat
software Inc, San Jose, California, USA).

101
2.8 References
1. Ling H, Luoma JT, Hilleman D. A review of currently available fenofibrate and fenofibric acid
formulations. Cardiology Research. 2013;4(2):47-55.
2. Tziomalos K, Athyros VG. Fenofibrate: a novel formulation (Triglide™) in the treatment of lipid
disorders: a review. International Journal of Nanomedicine. 2006;1(2):129-47.
3. Jamzad S, Fassihi R. Role of surfactant and pH on dissolution properties of fenofibrate and
glipizide—a technical note. Aaps Pharmscitech. 2006;7(2):E17-E22.
4. Buch P, Holm P, Thomassen JQ, Scherer D, Branscheid R, Kolb U, et al. IVIVC for Fenofibrate
Immediate Release Tablets Using Solubility and Permeability as In Vitro Predictors for Pharmacokinetics.
Journal of Pharmaceutical sciences. 2010;99(10):4427-36.
5. Law D, Wang W, Schmitt EA, Qiu Y, Krill SL, Fort JJ. Properties of rapidly dissolving eutectic
mixtures of poly(ethylene glycol) and fenofibrate: The eutectic microstructure. Journal of Pharmaceutical
sciences. 2003;92(3):505-15.
6. Shegokar R, Müller RH. Nanocrystals: Industrially feasible multifunctional formulation technology
for poorly soluble actives. International Journal of Pharmaceutics. 2010;399(1–2):129-39.
7. Guichard JP, Levy-Prades Sauron R. A comparison of the bioavailability of standard or micronized
formulations of fenofibrate. Current Therapeutic Research. 1993;54(5):610-4.
8. Vogt M, Kunath K, Dressman JB. Dissolution enhancement of fenofibrate by micronization,
cogrinding and spray-drying: Comparison with commercial preparations. European Journal of Pharmaceutics
and Biopharmaceutics. 2008;68(2):283-8.
9. Zhou D, Zhang GGZ, Law D, Grant DJW, Schmitt EA. Physical stability of amorphous
pharmaceuticals: Importance of configurational thermodynamic quantities and molecular mobility. Journal of
Pharmaceutical sciences. 2002;91(8):1863-72.
10. Amstad E, Spaepen F, Weitz DA. Crystallization of undercooled liquid fenofibrate. Physical
Chemistry Chemical Physics. 2015;17(44):30158-61.
11. Yang Z. Development of methods to predict and enhance the physical stability of hot melt extruded
solid dispersion: University of East Anglia; 2013.
12. Watterson S, Hudson S, Svärd M, Rasmuson ÅC. Thermodynamics of fenofibrate and solubility in
pure organic solvents. Fluid Phase Equilibria. 2014;367(0):143-50.
13. Di Martino P, Palmieri G, Martelli S. Evidence of a metastable form of fenofibrate. Die Pharmazie.
2000;55(8):625-6.
14. Górniak A, Wojakowska A, Karolewicz B, Pluta J. Phase diagram and dissolution studies of the
fenofibrate–acetylsalicylic acid system. Journal of thermal analysis and calorimetry. 2011;104(3):1195-200.
15. Heinz A, Gordon KC, McGoverin CM, Rades T, Strachan CJ. Understanding the solid-state forms
of fenofibrate–a spectroscopic and computational study. European Journal of Pharmaceutics and
Biopharmaceutics. 2009;71(1):100-8.
16. Balendiran GK, Rath N, Kotheimer A, Miller C, Zeller M, Rath NP. Biomolecular Chemistry of
Isopropyl Fibrates. Journal of pharmaceutical sciences. 2012;101(4):1555-69.
17. Larson AM, Polson J, Fontana RJ, Davern TJ, Lalani E, Hynan LS, et al. Acetaminophen-induced
acute liver failure: Results of a United States multicenter, prospective study. Hepatology. 2005;42(6):1364-
72.
18. Kalantzi L, Reppas C, Dressman JB, Amidon GL, Junginger HE, Midha KK, et al. Biowaiver
monographs for immediate release solid oral dosage forms: Acetaminophen (paracetamol). Journal of
Pharmaceutical sciences. 2006;95(1):4-14.
19. Joiris E, Martino PD, Berneron C, Guyot-Hermann A-M, Guyot J-C. Compression Behavior of
Orthorhombic Paracetamol. Pharmaceutical Research. 1998;15(7):1122-30.
20. Di Martino P, Conflant P, Drache M, Huvenne J-P, Guyot-Hermann A-M. Preparation and physical
characterization of forms II and III of paracetamol. Journal of thermal analysis. 1997;48(3):447-58.
21. Baird JA, Van Eerdenbrugh B, Taylor LS. A classification system to assess the crystallization
tendency of organic molecules from undercooled melts. Journal of Pharmaceutical sciences.
2010;99(9):3787-806.
22. Martino PD, Palmieri GF, Martelli S. Molecular Mobility of the Paracetamol Amorphous Form.
CHEMICAL & PHARMACEUTICAL BULLETIN. 2000;48(8):1105-8.
23. JEF R. Martindale: the extra pharmacopoeia. Pharmaceutical Press, London; 1993.
24. Henry R, Zhang G, Gao Y, Buckner I. Fenofibrate. Acta Crystallographica Section E: Structure
Reports Online. 2003;59(5):o699-o700.
25. Yekeler M, Ulusoy U, Hiçyılmaz C. Effect of particle shape and roughness of talc mineral ground
by different mills on the wettability and floatability. Powder Technology. 2004;140(1–2):68-78.
26. Rayner J. The crystal structure of talc. Clays and Clay Minerals. 1973;21:103-14.
27. Haubruge HG, Daussin R, Jonas AM, Legras R, Wittmann JC, Lotz B. Epitaxial Nucleation of
Poly(ethylene terephthalate) by Talc: Structure at the Lattice and Lamellar Scales. Macromolecules.
2003;36(12):4452-6.
28. Rowe RC, Sheskey PJ, Quinn ME. Handbook of pharmaceutical excipients: Pharmaceutical press;
2009.
29. Kolter K, Karl M, Gryczke A, Ludwigshafen am Rhein B. Hot-melt extrusion with BASF pharma
polymers: extrusion compendium: BASF; 2012.
30. PVP and more ... LUVITEC®, LUVICROSS® and COLLACRAL® VAL Versatile specialty
polymers for technical applications.

102
31. Karavas E, Ktistis G, Xenakis A, Georgarakis E. Effect of hydrogen bonding interactions on the
release mechanism of felodipine from nanodispersions with polyvinylpyrrolidone. European Journal of
Pharmaceutics and Biopharmaceutics. 2006;63(2):103-14.
32. Shi Y, Wei Z, Zhao H, Liu T, Dong A, Zhang J. Electrospinning of Ibuprofen-Loaded Composite
Nanofibers for Improving the Performances of Transdermal Patches. Journal of Nanoscience and
Nanotechnology. 2013;13(6):3855-63.
33. Vasanthavada M, Tong W-QT, Joshi Y, Kislalioglu MS. Phase behavior of amorphous molecular
dispersions II: Role of hydrogen bonding in solid solubility and phase separation kinetics. Pharmaceutical
research. 2005;22(3):440-8.
34. Yu D-G, Branford-White C, Shen X-X, Zhang X-F, Zhu L-M. Solid Dispersions of Ketoprofen in
Drug-Loaded Electrospun Nanofibers. Journal of Dispersion Science and Technology. 2010;31(7):902-8.
35. Yu D-G, Shen X-X, Branford-White C, White K, Zhu L-M, Bligh SA. Oral fast-dissolving drug
delivery membranes prepared from electrospun polyvinylpyrrolidone ultrafine fibers. Nanotechnology.
2009;20(5):055104.
36. Chan SY. The Development of PVP-based Solid Dispersions using Hot Melt Extrusion for the
Preparation of Immediate Release Formulations. Norwich: University of East Anglia; 2013.
37. De Vrieze S, Van Camp T, Nelvig A, Hagström B, Westbroek P, De Clerck K. The effect of
temperature and humidity on electrospinning. Journal of materials science. 2009;44(5):1357-62.
38. Marsac PJ, Rumondor ACF, Nivens DE, Kestur US, Stanciu L, Taylor LS. Effect of temperature
and moisture on the miscibility of amorphous dispersions of felodipine and poly(vinyl pyrrolidone). Journal
of Pharmaceutical sciences. 2010;99(1):169-85.
39. Bley O, Siepmann J, Bodmeier R. Characterization of moisture-protective polymer coatings using
differential scanning calorimetry and dynamic vapor sorption. Journal of Pharmaceutical sciences.
2009;98(2):651-64.
40. Qi S, Gryczke A, Belton P, Craig DQM. Characterisation of solid dispersions of paracetamol and
EUDRAGIT® E prepared by hot-melt extrusion using thermal, microthermal and spectroscopic analysis.
International Journal of Pharmaceutics. 2008;354(1–2):158-67.
41. Joshi M. Role of Eudragit in targeted drug delivery. Int J Curr Pharm Res. 2013;5(2):58-62.
42. Nikam VK, Kotade KB, Gaware VM, Dhamak R, Somwanshi SB, Khadse AN. Eudragit a versatile
polymer: a review. Pharmacol online. 2011;1(1):152-64.
43. Verreck G, Decorte A, Li H, Tomasko D, Arien A, Peeters J, et al. The effect of pressurized carbon
dioxide as a plasticizer and foaming agent on the hot melt extrusion process and extrudate properties of
pharmaceutical polymers. The Journal of Supercritical Fluids. 2006;38(3):383-91.
44. Jung J-Y, Yoo SD, Lee S-H, Kim K-H, Yoon D-S, Lee K-H. Enhanced solubility and dissolution
rate of itraconazole by a solid dispersion technique. International Journal of Pharmaceutics. 1999;187(2):209-
18.
45. Liu H, Wang P, Zhang X, Shen F, Gogos CG. Effects of extrusion process parameters on the
dissolution behavior of indomethacin in Eudragit® E PO solid dispersions. International Journal of
Pharmaceutics. 2010;383(1–2):161-9.
46. Nagy ZK, Balogh A, Drávavölgyi G, Ferguson J, Pataki H, Vajna B, et al. Solvent-free melt
electrospinning for preparation of fast dissolving drug delivery system and comparison with solvent-based
electrospun and melt extruded systems. Journal of Pharmaceutical sciences. 2013;102(2):508-17.
47. Sóti PL, Bocz K, Pataki H, Eke Z, Farkas A, Verreck G, et al. Comparison of spray drying,
electroblowing and electrospinning for preparation of Eudragit E and itraconazole solid dispersions.
International Journal of Pharmaceutics. 2015;494(1):23-30.
48. Shamma RN, Basha M. Soluplus®: A novel polymeric solubilizer for optimization of Carvedilol
solid dispersions: Formulation design and effect of method of preparation. Powder Technology.
2013;237:406-14.
49. Alshahrani SM, Lu W, Park J-B, Morott JT, Alsulays BB, Majumdar S, et al. Stability-enhanced
Hot-melt Extruded Amorphous Solid Dispersions via Combinations of Soluplus® and HPMCAS-HF. AAPS
PharmSciTech. 2015;16(4):824-34.
50. Hardung H, Djuric D, Ali S. Combining HME & solubilization: Soluplus®—the solid solution.
Drug Deliv Technol. 2010;10(3):20-7.
51. Nagy ZK, Balogh A, Vajna B, Farkas A, Patyi G, Kramarics Á, et al. Comparison of electrospun
and extruded soluplus®-based solid dosage forms of improved dissolution. Journal of Pharmaceutical
sciences. 2012;101(1):322-32.
52. Fukasawa M, Obara S, eacute. Molecular Weight Determination of Hypromellose Acetate
Succinate (HPMCAS) Using Size Exclusion Chromatography with a Multi-Angle Laser Light Scattering
Detector. Chemical and Pharmaceutical Bulletin. 2004;52(11):1391-3.
53. Rumondor ACF, Stanford LA, Taylor LS. Effects of Polymer Type and Storage Relative Humidity
on the Kinetics of Felodipine Crystallization from Amorphous Solid Dispersions. Pharmaceutical Research.
2009;26(12):2599-606.
54. Tanno F, Nishiyama Y, Kokubo H, Obara S. Evaluation of Hypromellose Acetate Succinate
(HPMCAS) as a Carrier in Solid Dispersions. Drug Development and Industrial Pharmacy. 2004;30(1):9-17.
55. Al-Obaidi H, Buckton G. Evaluation of Griseofulvin Binary and Ternary Solid Dispersions with
HPMCAS. AAPS PharmSciTech. 2009;10(4):1172-7.
56. COMMISSION. BP. British Pharmacopoeia London: TSO; 2016.
57. The Japanese pharmacopoeia: Thirteenth edition. Tokyo : Society of Japanese Pharmacopoeia :
Distributed by Yakuji Nippo, 1996.; 1996.

103
58. Ghosh I, Snyder J, Vippagunta R, Alvine M, Vakil R, Tong W-Q, et al. Comparison of HPMC
based polymers performance as carriers for manufacture of solid dispersions using the melt extruder.
International Journal of Pharmaceutics. 2011;419(1–2):12-9.
59. Konno H, Handa T, Alonzo DE, Taylor LS. Effect of polymer type on the dissolution profile of
amorphous solid dispersions containing felodipine. European Journal of Pharmaceutics and
Biopharmaceutics. 2008;70(2):493-9.
60. Brewster ME, Verreck G, Chun I, Rosenblatt J, Mensch J, Van Dijck A, et al. The use of polymer-
based electrospun nanofibers containing amorphous drug dispersions for the delivery of poorly water-soluble
pharmaceuticals. Die Pharmazie - An International Journal of Pharmaceutical Sciences. 2004;59(5):387-91.
61. Clas S-D, Dalton CR, Hancock BC. Differential scanning calorimetry: applications in drug
development. Pharmaceutical Science & Technology Today. 1999;2(8):311-20.
62. Craig DQ, Reading M. Thermal analysis of pharmaceuticals: CRC press; 2006.
63. Taylor LS, Zografi G. Sugar–polymer hydrogen bond interactions in lyophilized amorphous
mixtures. Journal of Pharmaceutical sciences. 1998;87(12):1615-21.
64. Gill PS, Sauerbrunn SR, Reading M. Modulated differential scanning calorimetry. Journal of
Thermal Analysis. 1993;40(3):931-9.
65. Coleman NJ, Craig DQM. Modulated temperature differential scanning calorimetry: A novel
approach to pharmaceutical thermal analysis. International Journal of Pharmaceutics. 1996;135(1–2):13-29.
66. Royall PG, Craig DQM, Doherty C. Characterisation of moisture uptake effects on the glass
transitional behaviour of an amorphous drug using modulated temperature DSC. International Journal of
Pharmaceutics. 1999;192(1):39-46.
67. Salonen J, Laitinen L, Kaukonen AM, Tuura J, Björkqvist M, Heikkilä T, et al. Mesoporous silicon
microparticles for oral drug delivery: Loading and release of five model drugs. Journal of Controlled Release.
2005;108(2–3):362-74.
68. Sheth AR, Zhou D, Muller FX, Grant DJW. Dehydration kinetics of piroxicam monohydrate and
relationship to lattice energy and structure. Journal of Pharmaceutical sciences. 2004;93(12):3013-26.
69. Qi S, Belton P, McAuley W, Codoni D, Darji N. Moisture uptake of polyoxyethylene glycol
glycerides used as matrices for drug delivery: kinetic modelling and practical implications. Pharmaceutical
research. 2013;30(4):1123-36.
70. Roca E, Guillard V, Guilbert S, Gontard N. Moisture migration in a cereal composite food at high
water activity: Effects of initial porosity and fat content. Journal of Cereal Science. 2006;43(2):144-51.
71. Rumondor AC, Marsac PJ, Stanford LA, Taylor LS. Phase behavior of poly (vinylpyrrolidone)
containing amorphous solid dispersions in the presence of moisture. Molecular Pharmaceutics.
2009;6(5):1492-505.
72. Hunter NE. A spectroscopic and kinetic investigation into sugar glass. Norwich: University of East
Anglia; 2009.
73. Carter BP, Schmidt SJ. Developments in glass transition determination in foods using moisture
sorption isotherms. Food Chemistry. 2012;132(4):1693-8.
74. Al-Muhtaseb AH, McMinn WAM, Magee TRA. Moisture Sorption Isotherm Characteristics of
Food Products: A Review. Food and Bioproducts Processing. 2002;80(2):118-28.
75. ANDRADE P RD, LEMUS M R, PÉREZ C CE. MODELS OF SORPTION ISOTHERMS FOR
FOOD: USES AND LIMITATIONS. Vitae. 2011;18:325-34.
76. Stuart B. Infrared spectroscopy: Wiley Online Library; 2005.
77. Bernstein J. Polymorphism in molecular crystals: Oxford University Press; 2007.
78. Socrates G. Infrared and Raman characteristic group frequencies: tables and charts: John Wiley &
Sons; 2004.
79. Griffiths PR, De Haseth JA. Fourier transform infrared spectrometry: John Wiley & Sons; 2007. 80. FT-IR Spectroscopy—Attenuated Total Reflectance (ATR)
2005:[1-4 pp.].
81. Salari A, Young RE. Application of attenuated total reflectance FTIR spectroscopy to the analysis
of mixtures of pharmaceutical polymorphs. International Journal of Pharmaceutics. 1998;163(1–2):157-66.
82. Hilfiker R. Polymorphism: in the pharmaceutical industry: John Wiley & Sons; 2006.
83. Chan KLA, Kazarian SG. Fourier Transform Infrared Imaging for High-Throughput Analysis of
Pharmaceutical Formulations. Journal of Combinatorial Chemistry. 2005;7(2):185-9.
84. Erukhimovitch V, Pavlov V, Talyshinsky M, Souprun Y, Huleihel M. FTIR microscopy as a
method for identification of bacterial and fungal infections. Journal of Pharmaceutical and Biomedical
Analysis. 2005;37(5):1105-8.
85. Vogel C, Wessel E, Siesler HW. FT-IR Imaging Spectroscopy of Phase Separation in Blends of
Poly(3-hydroxybutyrate) with Poly(l-lactic acid) and Poly(ϵ-caprolactone). Biomacromolecules.
2008;9(2):523-7.
86. Prati S, Joseph E, Sciutto G, Mazzeo R. New Advances in the Application of FTIR Microscopy and
Spectroscopy for the Characterization of Artistic Materials. Accounts of Chemical Research. 2010;43(6):792-
801.
87. Bhargava R, Levin IW. Fourier transform mid-infrared spectroscopic imaging. Spectrochemical
Analysis Using Infrared Multichannel Detectors. 2005:1-24.
88. Byrn SR, Pfeiffer RR, Stowell JG. Solid-state chemistry of drugs: Ssci Inc; 1999.
89. Anwar J, Tarling SE, Barnes P. Polymorphism of sulfathiazole. Journal of Pharmaceutical sciences.
1989;78(4):337-42.
90. Langford JI, Daniel L. Powder diffraction. Reports on Progress in Physics. 1996;59(2):131.

104
91. Programs CrysAlisPro. Abingdon, UK: Oxford Diffraction Ltd; 2010.
92. Hübschle CB, Sheldrick GM, Dittrich B. ShelXle: a Qt graphical user interface for SHELXL.
Journal of applied crystallography. 2011;44(6):1281-4.
93. Sheldrick GM. SHELXT– Integrated space-group and crystal-structure determination. Acta
Crystallographica Section A. 2015;71(1):3-8.
94. Dolomanov OV, Bourhis LJ, Gildea RJ, Howard JA, Puschmann H. OLEX2: a complete structure
solution, refinement and analysis program. Journal of applied crystallography. 2009;42(2):339-41.
95. Spek AL. Structure validation in chemical crystallography. Acta Crystallographica Section D:
Biological Crystallography. 2009;65(2):148-55.
96. Macrae CF, Bruno IJ, Chisholm JA, Edgington PR, McCabe P, Pidcock E, et al. Mercury CSD 2.0–
new features for the visualization and investigation of crystal structures. Journal of applied crystallography.
2008;41(2):466-70.
97. Oatley CW, Nixon WC, Pease RFW. Scanning Electron Microscopy. In: Marton L, editor.
Advances in Electronics and Electron Physics: Academic Press; 1966. p. 181-247.
98. Jiang Y-N, Mo H-Y, Yu D-G. Electrospun drug-loaded core–sheath PVP/zein nanofibers for
biphasic drug release. International Journal of Pharmaceutics. 2012;438(1–2):232-9.
99. Yu D-G, Wang X, Li X-Y, Chian W, Li Y, Liao Y-Z. Electrospun biphasic drug release
polyvinylpyrrolidone/ethyl cellulose core/sheath nanofibers. Acta biomaterialia. 2012.
100. Trasi NS, Taylor LS. Effect of polymers on nucleation and crystal growth of amorphous
acetaminophen. CrystEngComm. 2012;14(16):5188-97.
101. Fotiadis D, Scheuring S, Müller SA, Engel A, Müller DJ. Imaging and manipulation of biological
structures with the AFM. Micron. 2002;33(4):385-97.
102. Jalili N, Laxminarayana K. A review of atomic force microscopy imaging systems: application to
molecular metrology and biological sciences. Mechatronics. 2004;14(8):907-45.
103. Bernardes-Filho R, Assis OBGd. Development of an algorithm for tip-related artifacts identification
in AFM biological film imaging. Brazilian Archives of Biology and Technology. 2005;48:667-74.
104. Hammiche A, Reading M, Pollock HM, Song M, Hourston DJ. Localized thermal analysis using a
miniaturized resistive probe. Review of Scientific Instruments. 1996;67(12):4268-74.
105. Pollock HM, Hammiche A. Micro-thermal analysis: techniques and applications. Journal of Physics
D: Applied Physics. 2001;34(9):R23.
106. Reading M, Price DM, Grandy DB, Smith RM, Bozec L, Conroy M, et al., editors. Micro-thermal
analysis of polymers: current capabilities and future prospects. Macromolecular Symposia; 2001: Wiley-
Blackwell, 111 River Street Hoboken NJ 07030-5774 USA.
107. Harding L, King WP, Dai X, Craig DQM, Reading M. Nanoscale Characterisation and Imaging of
Partially Amorphous Materials using Local Thermomechanical Analysis and Heated Tip AFM.
Pharmaceutical Research. 2007;24(11):2048-54.
108. Reading M, Price D, Pollock H, Hammiche A, Craig D, Royal P. Thermal analysis for the 21st
century. American laboratory. 1998;30:13-7.
109. Zhou L, Xu GQ, Ng HT, Li SFY. Scanning thermal microscope tip-induced chemical reaction on
solid organometallic compound thin films. Journal of Vacuum Science & Technology B. 1997;15(6):1871-5.
110. Séverine G, Nathalie T, Philippe G. DC thermal microscopy: study of the thermal exchange
between a probe and a sample. Measurement Science and Technology. 1999;10(9):805.
111. Duer MJ. Solid-state NMR spectroscopy : principles and applications: Oxford : Blackwell Science,
2002.; 2002.
112. Lambert JB, Mazzola EP. Nuclear magnetic resonance spectroscopy : an introduction to principles,
applications, and experimental methods: Upper Saddle River, N.J. ; London : Prentice Hall, 2004; 2004.
113. Koutcher JA, Burt CT. Principles of nuclear magnetic resonance. Journal of nuclear medicine.
1984;25(1):101-11.
114. Ernst RR, Bodenhausen G, Wokaun A. Principles of nuclear magnetic resonance in one and two
dimensions: Clarendon Press Oxford; 1987.
115. Brown SP, Spiess HW. Advanced Solid-State NMR Methods for the Elucidation of Structure and
Dynamics of Molecular, Macromolecular, and Supramolecular Systems. Chemical Reviews.
2001;101(12):4125-56.
116. Harris RK. Applications of solid-state NMR to pharmaceutical polymorphism and related matters*.
Journal of Pharmacy and Pharmacology. 2007;59(2):225-39.
117. Hawarden LE. Polymer drug dispersions: understanding structure and dynamics. Norwich:
university of East Anglia; 2015.
118. Rezende CA, San Gil RAS, Borré LB, Pires JR, Vaiss VS, Resende JALC, et al. Combining
Nuclear Magnetic Resonance Spectroscopy and Density Functional Theory Calculations to Characterize
Carvedilol Polymorphs. Journal of Pharmaceutical sciences. 2016.
119. Wu R-R, Kao H-M, Chiang JC, Woo EM. Solid-state NMR studies on phase behavior and motional
mobility in binary blends of polystyrene and poly(cyclohexyl methacrylate). Polymer. 2002;43(1):171-6.
120. Apperley DC, Forster AH, Fournier R, Harris RK, Hodgkinson P, Lancaster RW, et al.
Characterisation of indomethacin and nifedipine using variable-temperature solid-state NMR. Magnetic
Resonance in Chemistry. 2005;43(11):881-92.
121. Brettmann B, Bell E, Myerson A, Trout B. Solid-state NMR characterization of high-loading solid
solutions of API and excipients formed by electrospinning. Journal of Pharmaceutical Sciences.
2012;101(4):1538-45.
122. Azarmi S, Roa W, Löbenberg R. Current perspectives in dissolution testing of conventional and
novel dosage forms. International Journal of Pharmaceutics. 2007;328(1):12-21.

105
123. Banwell CN, McCash EM, McCash EM. Fundamentals of molecular spectroscopy: London ; New
York : McGraw-Hill Book, 1994
4th ed.; 1994.
124. Gao Z. Mathematical modeling of variables involved in dissolution testing. Journal of
Pharmaceutical sciences. 2011;100(11):4934-42.
125. Korsmeyer RW, Gurny R, Doelker E, Buri P, Peppas NA. Mechanisms of solute release from
porous hydrophilic polymers. International Journal of Pharmaceutics. 1983;15(1):25-35.
126. Ritger PL, Peppas NA. A simple equation for description of solute release I. Fickian and non-
Fickian release from non-swellable devices in the form of slabs, spheres, cylinders or discs. Journal of
controlled release. 1987;5(1):23-36.
127. Li X, Kanjwal MA, Lin L, Chronakis IS. Electrospun polyvinyl-alcohol nanofibers as oral fast-
dissolving delivery system of caffeine and riboflavin. Colloids and Surfaces B: Biointerfaces. 2013;103:182-
8.
128. Shen X, Yu D, Zhu L, Branford-White C, White K, Chatterton NP. Electrospun diclofenac sodium
loaded Eudragit® L 100-55 nanofibers for colon-targeted drug delivery. International Journal of
Pharmaceutics. 2011;408(1–2):200-7.
129. Akaike H. A new look at the statistical model identification. Automatic Control, IEEE Transactions
on. 1974;19(6):716-23.
130. Peleg M. An Empirical Model for the Description of Moisture Sorption Curves. Journal of Food
Science. 1988;53(4):1216-7.
131. Pinto G, Esin A. Kinetics of the Osmotic Hydration of Chickpeas. Journal of Chemical Education. 2004;81(4):532.

106
3. Chapter 3 Crystallisation behaviour of amorphous FF: Triggers of crystallisation
and polymorphic transformation
3.1 Introduction
Knowledge of the crystallisation behaviour of an amorphous drug is essential for
formulating a solid dispersion formulation. FF is in the BCS class II, which requires a
formulation approach to overcome its low aqueous solubility. Particle size reduction,
including micro and nanocrystals, in lipid dispersion has been used in commercial products
to solve this problem (1). Moreover, polymeric based amorphous solid dispersion
formulations that improve the oral bioavailability of FF have been reported (2-5). In this
study, FF was chosen as the primary model drug to develop the electrospun fibrous solid
dispersions (Chapter 5). Therefore, it is essential to understand the crystallisation behaviour
of amorphous FF, which will facilitate the investigation of the physical stability of the solid
dispersions.
The systematic analysis of the relationship between the physical stability and a range of
thermodynamic properties, including molecular mobility, configurational free energy and
the entropic barrier to crystallisation of FF, PCM, ritonavir, ABT-229 and sucrose, have
been reported by Zhou et. al (6). The study revealed that the molecules that have lower
configurational entropies required less molecular mobility to spontaneously crystallise (6).
The molecular mobility required for crystallisation is the inverse of the molecular
relaxation constant (τ) that calculated at the crystallisation temperature. As an example,
amorphous PCM has a low configurational entropy of 43.0 J.mol-1.K-1 and a molecular
mobility requirement for crystallisation of 1.0x10⁻⁵sec-1. While, amorphous FF has a higher
configurational entropy (76.6 J.mol-1.K-1) than PCM, which leads to a higher molecular
mobility requirement for crystallisation of 72.3x10⁻⁵sec-1 (6). Therefore, amorphous FF
demonstrates a lower tendency to crystallise spontaneously than amorphous PCM.
Amorphous FF has a higher entropic barrier and high mobility that is required for
crystallisation in comparison to PCM. This can possibly be attributed to weak
intermolecular bonding (7, 8), which results in the low probability of FF molecules forming
stable nuclei (9). However, the presence of external triggers, including scratching the
surface or placing an FF seed on the surface of amorphous FF, resulted in an immediate
crystallisation (9). In addition, FF has a fragility index (m) equal to 83.4 (6), which is
classified as a fragile glass material (m >75) (10, 11). Fragile glass materials tend to exhibit
greater changes in molecular mobility with temperature in comparison to strong glass
materials (12). The combination of these properties of amorphous FF may lead to a high
risk of physical instability in amorphous FF during storage.

107
This chapter aims to investigate the effect of the availability of an open top surface (OTS)
and variations in incubation temperature on the crystallisation behaviour of amorphous FF
prepared from the melt cooled method. The homogeneous nucleation of amorphous FF is
a slow process (9, 13). This chapter used heterogeneous nucleation by surface disruption
to initiate crystallisation of amorphous FF. The mechanism of scratching at the surface of
the melt induce nucleation occurs via the heterogeneous nucleation. The stainless spatula
that was used to scratch on the melt surface is considered as the impurity which was
introduced into the supercooled liquid phase. The nucleation occurs at the site where the
spatula was in contact with the supercooled liquid due to the contact angle of the spatula
and the supercooled liquid phase aid to reduce Gibb’s free energy of the nucleation process
as describe in equation 1.6. Consequently, the nucleation took place after the spatula
scratched the melt. The freshly prepared melt-cooled amorphous FF was scratched by a
stainless-steel spatula to initiate the crystallisation. After the crystallisation initiation, the
presence of an OTS and incubation temperatures during crystallisation and polymorphic
transformation of the material were investigated. The rationale behind selecting these two
variables as the primary factors in this chapter was because they can significantly impact
the molecular mobility and crystallisation behaviour of amorphous materials (14, 15). This
can be used to produce a desirable polymorph by intentionally manipulating the
crystallisation conditions during large scale crystallisation of the APIs.
The existence of FF form II was verified in the sample crystallised with OTS and bulk
crystallisation using a range of charaterisation techniques. In addition, the single crystal
structure of FF form IIa was studied in detail to clarify the confusion related to the FF form
IIs in the literature (as discussed in chapter 2). The physical stability of form IIa and the
factors that influence the polymorphic conversion to the most stable form I were studied.
The characteristic data of metastable FF form II available from the literature are shown in
Table 3.1.
Table 3.1 Summary of the available data related to FF form II that is reported in the
literature.
Available characteristic data of FF form II Assignment References
DSC (Tm at 74°C) IIa Di Martino et al. and
Heinz et al.(16, 17)
PXRD pattern IIa Di Martino et al.(16)
Raman spectrum (ester carbonyl stretching at
1718 cm-1)
IIa Heinz et al.(17)
Single crystal IIb Balendiran et al.(18)

108
3.2 Methodology
3.2.1 Materials
The details of the FF form I powder that was used in this chapter can be found in chapter
2 section 2.2.1.
3.2.2 Preparation of FF crystallisation samples
Approximately 3-5 mg of crystalline FF form I powder were placed on a glass slide and
heated on a hot plate at 100 °C until they were completely molten. The glass slide was
immediately removed from the hot plate to allow the sample to cool to room temperature.
The surface disruption technique, involving the use of a stainless steel spatula to scratch
the surface of the amorphous FF, was used to induce crystallisation. After surface
scratching, a cover slip was immediately placed on top of the FF to sandwich the drug
between the glass slide and the cover slip. These samples are referred to as “bulk crystalline
FF samples” or B-FF in this study. The scratched samples that were left to crystallise with
an OTS are referred to as “open top surface crystalline FF samples” or OTS-FF in the study.
Immediately after the initiation of crystallisation by surface scratching, both sets of the
sample were stored at ambient temperature or incubated in an oven at 40, 50, 60 or 70°C
for 30 mins, after which the crystallisation was complete. This allowed the investigation of
the effect of temperature on the crystallisation process. For B-FF samples, all
characterisations were performed after the top cover slip was carefully removed. The
stability of the OTS-FF and the B-FF was determined at room temperature by storing the
samples for six months in glass vials that were sealed with a plastic cap and examined at
one, three and six month intervals.
3.2.3 Characterisation methods
In this chapter, the OTS-FF and the B-FF were characterised by a range of characterisation
techniques. OTS-FF was characterized by DSC, MTDSC, ATR-FTIR, PXRD and SCXRD,
while B-FF was characterized by ATR-FTIR, PXRD and HS-PLM. The experimental
methods for DSC, MTDSC, TGA, ATR-FTIR, SCXRD, PXRD, SEM and HS-PLM are
presented in Chapter 2 in sections 2.4.1.2, 2.4.2.2, 2.4.3.2, 2.4.5.2, 2.4.7.2, 2.4.7.4, 2.4.8.2
and 2.4.10.2, respectively. The crystal structure of the FF form IIa was determined
according to the procedure stated in section 2.4.7.3.

109
3.3 Results
3.3.1 Verification of existence of FF IIa
In this chapter, we determined that the availability of an OTS and crystal growth
temperatures could influence the formation of FF IIa. The growth temperature of 40°C was
observed to be the optimal growth temperature for FF IIa crystals. This was confirmed by
the DSC and IR results. The DSC thermogram in Figure 3.1a shows that the amorphous
FF, which crystallised at 40°C with an OTS (OTS-FF 40°C), had two endothermic melting
peaks for FF at 74°C and 80°C. This DSC result indicates that the OTS-FF 40°C contained
the FF forms IIa and I, in which the melting point of the metastable form IIa (at 74°C)
matched with that in the literature (16, 17). The literature does not report the melting
enthalpy of the pure FF form IIa. However, the single crystal structures of forms I and IIa
are similar (as will be discussed in the next section). It was expected that FF forms I and
IIa would demonstrate similar melting enthalpies. This allows the quantification of the
amount of each form from the melting enthalpy values. FF IIa was the majority polymorph
in this sample, as seen in the melting enthalpy of 57.9±1.8 J/g in comparison to form I that
had a melting enthalpy of 27.9±5.6 J/g. Further evidence of FF IIa is the Raman spectrum
that was reported by Heinz et al. (17). The authors showed that FF IIa has a Raman
characteristic peak at 1718 cm-1, which was assigned to ester carbonyl stretching (O3-C17).
This functional group is both Raman and IR active (19); thus, it is expected to be observable
at similar wavenumbers in the IR spectrum. Figure 3.1b shows the IR spectrum of the
OTS-FF growth at 40°C. It demonstrates two peaks at 1727 and 1714 cm-1 that are the ester
carbonyl stretching peaks from the FF forms I and IIa, respectively. It can be noted that the
peak at 1714 cm-1 has a greater intensity than the other peak. This suggests that the OTS-
FF 40°C was a mixture of forms I and IIa, which was dominated by form IIa. This result
agrees with the DSC findings (Figure 3.1a).
It is possible to obtain the pure IR spectrum of FF form IIa by subtracting the OTS-FF 40°C
from the reference spectrum of the crystalline form I. The FF form I ATR-FTIR spectrum
intensity used in this calcualtion was only 40% of the maximum, as the OTS-FF 40°C
contained the equvalent of 40% FF form I. This assumption was made from the ratio of
forms I and IIa from the DSC melting enthalpy values. The subtracted spectrum is shown
in Figure 3.1b. There are a few regions in the subtracted spectrum that can be used to
distinguish the differences between forms I and IIa, which include the =CH-H stretching
of the benzene ring, methyl group stretching, ester carbonyl stretching, aryl ketone
stretching and benzene ring stretching. Details of the peak assignment are reported in Table
3.2. The methyl stretching region and ester carbonyl stretching (O3-C17) can be used as
indicator regions to distinguish the FF polymorphs in this chapter. It should be noted that

110
the small peak at 1727 cm-1 of the subtracted spectrum can be ignored due to the high molar
absorptivity of the form I ester carbonyl at this wavenumber.
Figure 3.1 Characteristic data of FF IIa including DSC, ATR-FTIR and PXRD. (a) Melting
points of OTS-FF 40°C in comparison to the reference form I. (b) ATR-FTIR spectra of
reference form I, OTS-FF 40°C, the subtracted spectrum of OTS-FF 40°C and 40%
intensity of the reference form I and B-FF RT in different regions, including 3400-1600
and 1800-1300 cm-1. (c) PXRD pattern of B-FF RT in comparison to form I.
The ATR-FTIR spectrum of the B-FF, which crystallised between coverslips at room
temperature (B-FF RT), resembles the subtracted spectrum in Figure 3.1b, which was
expected to be the pure form IIa spectrum. Therefore, we can conclude that the B-FF RT
crystallisation leads to a pure form of the FF IIa crystal. This sample was further examined
by DSC; however, the DSC preparation for the sample, which has to scratch the crystal
from the coverslip, can possibly cause a conversion of the IIa form to the I form (Figure
3.2). This demonstrated that mechanical triggers, such as scratching, have significant
impacts on the FF polymorphic conversion from polymorph IIa to I. The PXRD pattern of
the B-FF RT was different from the reference FF I PXRD (Figure 3.1c). Therefore, the
absence of an OTS during amorphous FF crystallisation at room temperature led to the
-17
-12
-7
-2
3
Heat F
low
(W
/g)
0 20 40 60 80 100 120
Temperature (°C)Exo Up Universal V4.5A TA Instruments
OTS-FF 40°C
Reference Form I
Form IIa
a
5 10 15 20 25 30
Inte
nsi
ty (
a.u
.)
2θ(°) c
B-FF RT
Form I
D:\Data\Champ\Reference spectra\20140804 edge after incubate 40C.0 20140804 edge after incubate 40C EX
D:\Data\Champ\Reference spectra\20160510 Fenofibrate form I.0 Fenofibrate form I DLaTGS, KBr-BMS, Globar, IFS 66
D:\Data\Champ\Reference spectra\Pure FF II from cover slip.0 20140723 FF crys between coverslips EX
D:\Data\Champ\20160629 spectrum subtraction FS-FEN 40C-0.5 FF I.0 20140804 edge after incubate 40C EX
04/08/2014
10/05/2016
23/07/2014
04/08/2014
14001500160017001800
Wavenumber cm-1
0.5
0.6
0.7
0.8
0.9
1.0
1.1
Absorb
ance U
nits
Page 1/1
D:\Data\Champ\Reference spectra\20140804 edge after incubate 40C.0 20140804 edge after incubate 40C EX
D:\Data\Champ\Reference spectra\20160510 Fenofibrate form I.0 Fenofibrate form I DLaTGS, KBr-BMS, Globar, IFS 66
D:\Data\Champ\Reference spectra\Pure FF II from cover slip.0 20140723 FF crys between coverslips EX
D:\Data\Champ\20160629 spectrum subtraction FS-FEN 40C-0.5 FF I.0 20140804 edge after incubate 40C EX
04/08/2014
10/05/2016
23/07/2014
04/08/2014
260027002800290030003100320033003400
Wavenumber cm-1
0.8
50.9
00.9
51.0
0
Absorb
ance U
nits
Page 1/1
Form I
OTS-FF 40°C
Subtracted spectrum
B-FF RT
Form I
OTS-FF 40°C
Subtracted spectrum
B-FF RT
b
1727 cm-1
1714 cm-1

111
formation of pure FF IIa. The clarification of the IIa form and II form, which was reported
by Balendiran et al. (assigned as form IIb), will be discussed in the next part.
Figure 3.2 DSC of B-FF that was scratched from the coverslip. The form IIa in the B-FF
immediately converted to the stable form I after the mechanical trigger of scratching.
ATR-FTIR was used to examine the upper open top surface and lower surface (in contact
with the glass substrate) of the OTS-FF RT and OTS-FF 40°C samples. As illustrated in
Figure 3.3a, the OTS-FF 40°C upper surface shows two ester carbonyl stretching peaks at
1727 and 1714 cm-1, for which the 1714 cm-1 peak has a greater intensity than the other
peak. This represents the co-existence of forms I and IIa at the OTS site, which was
dominated by form IIa. While the lower surface of the crystal shows a single ester carbonyl
stretching peak at 1714 cm-1, which is characteristic of the form IIa. This result implies that
the form IIa crystals were the only polymorph observed at the interface of the glass
substrate site.
On the other hand, the OTS-FF RT showed two ester carbonyl stretching peaks (1727 and
1714 cm-1) at both the upper and lower surface sites (Figure 3.3b). At the upper surface
site, the intensity of the peak at 1727 cm-1 was higher than the other peak at 1714 cm-1. This
is an indication that the amount of the crystalline FF form I is greater than the form IIa.
However, at the lower surface, it shows that the intensity of the ester carbonyl stretching
was inverse to the upper surface. The intensity of the ester carbonyl stretching of form IIa
(peak at 1714 cm-1) was much greater than the other carbonyl stretching peaks of form I (at
1727 cm-1). This result indicates that at the interface of the glass substrate site there is a
greater amount of form IIa in comparison to that at the OTS site. The presence of an OTS
during the crystallisation of amorphous FF can impact the polymorphic form of the drug.
FF form I preferably grows at an OTS site while the preferable site for form IIa is in the
bulk.
-60
-40
-20
0
20
Heat F
low
(W
/g)
30 40 50 60 70 80 90 100
Temperature (°C)
Sample: Pure FF IISize: 0.1000 mgMethod: 20CComment: FF crystallised between cover slip
DSCFile: E:...\20140723 Pure FF II.001Operator: MuqdadRun Date: 23-Jul-2014 13:02Instrument: DSC Q2000 V24.10 Build 122
Exo Up Universal V4.5A TA Instruments
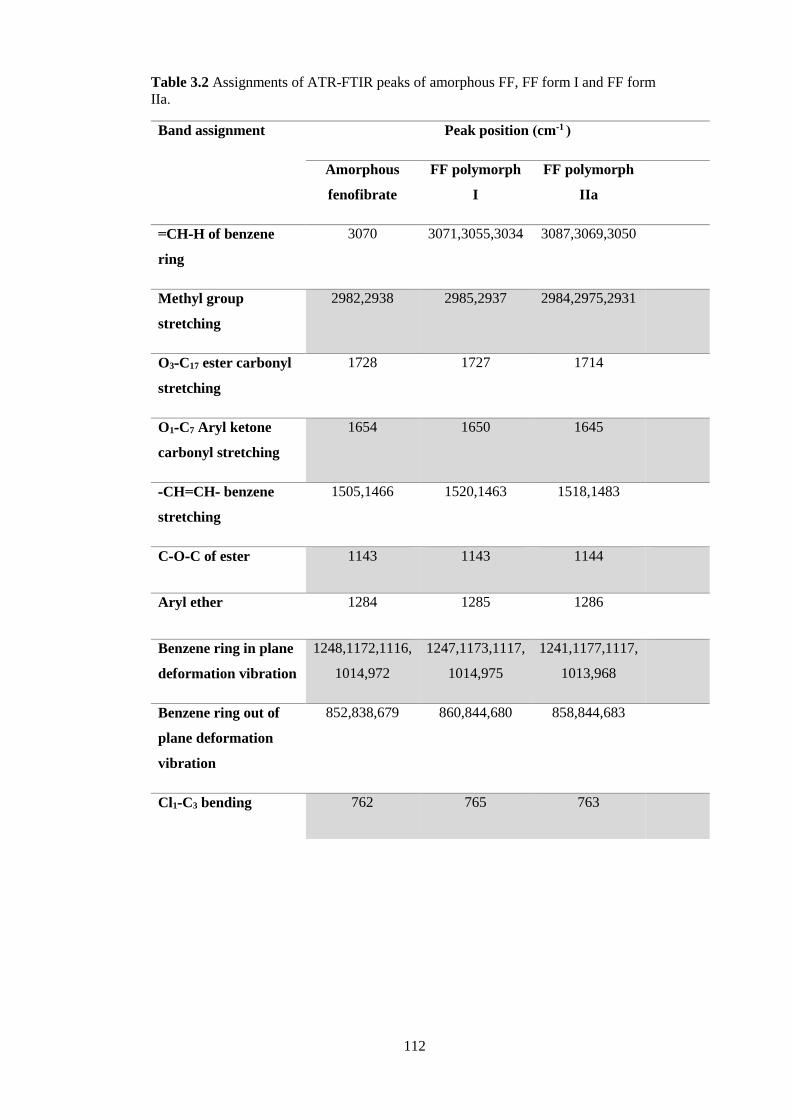
112
Table 3.2 Assignments of ATR-FTIR peaks of amorphous FF, FF form I and FF form
IIa.
Band assignment Peak position (cm-1 )
Amorphous
fenofibrate
FF polymorph
I
FF polymorph
IIa
=CH-H of benzene
ring
3070 3071,3055,3034 3087,3069,3050
Methyl group
stretching
2982,2938 2985,2937 2984,2975,2931
O3-C17 ester carbonyl
stretching
1728 1727 1714
O1-C7 Aryl ketone
carbonyl stretching
1654 1650 1645
-CH=CH- benzene
stretching
1505,1466 1520,1463 1518,1483
C-O-C of ester 1143 1143 1144
Aryl ether 1284 1285 1286
Benzene ring in plane
deformation vibration
1248,1172,1116,
1014,972
1247,1173,1117,
1014,975
1241,1177,1117,
1013,968
Benzene ring out of
plane deformation
vibration
852,838,679 860,844,680 858,844,683
Cl1-C3 bending 762 765 763

113
Figure 3.3 Partial ATR-FTIR spectra (1760-1500 cm-1) that were acquired on the upper
and lower surfaces of (a) OTS-FF 40°C and (b) OTS-FF RT. The two carbonyl stretching
position for the C17-O3 peaks at 1727 and 1714 cm-1 reflect a mixture between FF forms I
and IIa, whereas the carbonyl stretching of C17-O3 peak at 1714 cm-1 indicates FF form IIa.
3.3.2 Differentiation of form IIa by single crystal structure analysis
It was important to determine the crystal structure of form IIa to gain a better understanding
of the transformation between form IIa and the other FF polymorphs. The crystallographic
parameters of form IIa in comparison with the other known forms are shown in Table 3.3.
The FF molecule can be divided into two main parts: two aromatic rings linked by a keto
group and flexible aliphatic tail. An ORTEP drawing of the molecular structure of FF form
IIa is shown in Figure 3.4a. To compare form IIa to the other reported forms (I and IIb),
their molecular structures were overlain as illustrated in Figure 3.4b. The conformation of
FF in form IIa is largely similar to form I, while the orientation of the alkyl fragment
relative to the aromatic rings is markedly different in form IIb. The angles between the
planes of the two aromatic rings in forms I and IIa are 48.62(7)°and 48.25(10)°
respectively, while it is 53.73° in form IIb.
15501600165017001750
Wavenumber cm-1
0.00
0.05
0.10
0.15
0.20
0.25
0.30
0.35
Abs
orba
nce
Uni
ts
E:\FTIR back up\Second year Electrospinning project\Fenofibrate form II\Isothermal 65C from Lower surface\20140721 FF II rich iso 3 hr.016/06/2015 16:48:35
Page 1 of 1
OTS FF crystal at 40°C
Cover slip
a1727 and 1714 cm-1
1714 cm-1
Cover slip
OTS FFat room temperature
D:\Data\Champ\20160510 Fenofibrate form I.0 Fenofibrate form I DLaTGS, KBr-BMS, Globar, IFS 66
D:\Data\Champ\20160527 surface disruption RT surface.0 20160527 surface disruption RTsurface Disc
D:\Data\Champ\20160527 surface disruption RTbottom.1 20160527 surface disruption RTbottom Disc
10/05/2016
27/05/2016
27/05/2016
15501600165017001750
Wavenumber cm-1
0.1
0.2
0.3
0.4
0.5
0.6
0.7
0.8
Abs
orb
anc
e U
nits
Page 1/1
Upper surface
Lower surface
Form I
Upper surface
Lower surface
b1727 and 1714 cm-1
1727 cm-1
1727 and 1714 cm-1

114
Table 3.3 Crystallographic parameters of known polymorphic forms of FF
Parameter Form Ia Form IIa Form IIbb
Lattice system Triclinic Triclinic Monoclnic
Space group P-1 P-1 P21/n
a (Å) 8.1325 8.1328(5) 13.619
b (Å) 8.2391 8.7088(6) 7.554
c (Å) 14.399 13.6692(9) 17.88
α (°) 93.978 85.976(6) 90
β (°) 105.748 84.815(5) 92.35
γ (°) 95.854 74.344(6) 90
Cell volume 919.03 927.34(11) 1837.909
Density 1.285 1.292 1.304
Crystal size (mm) 0.55 x 0.50 x
0.44
0.12 x 0.13 x
0.46
0.55 × 0.30 × 0.25
Z 2 2 4
R 0.0418 0.1307 3.55
wR2 0.105 0.1265 0.0897
Temperature (K) 193 140(2) 100
Goodness of fit 1.035 1.023 1.026
a Obtained from reference (20) and b obtained from reference (18)
Figure 3.4 (a) ORTEP structure of form IIa; (b) overlay of molecular conformations in
FF form I (black), form IIa (blue) and form IIb (red).
Form I, the most stable form, shows two very short intermolecular CH…O interactions
between one hydrogen atom from both aromatic rings and the ester carbonyl group. The
corresponding CH…O distances, 2.49 Å and 2.61 Å, are more than 0.1 Å shorter than the
sum of the atomic van der Waals radii, while the C-H…O angles are 128° and 172°,
respectively. These interactions form a layer (Figure 3.5a) parallel to (001), which is
a b

115
supported by another, slightly longer CH…O (ketone) interaction (H…O: 2.62 Å, C-H..O:
156°). The layers are connected to each other through further CH…O interactions, which
are formed between isopropyl methyl groups and ketone carbonyl oxygen atoms (2.67 Å,
134°) (Figure 3.5b), and offset π-π interactions between parallel chlorobenzene rings at an
interplanar distance of 3.5116(6) Å. The interlayer CH…O interactions also facilitate the
efficient packing of the isopropyl groups.
Figure 3.5 Intermolecular interactions in form I: (a) layers formed by CH…O interactions
and (b) offset of π-π interactions and CH…O linked dimers that connect the layers.
Pairs of molecules in the unit cell of the polymorph IIa form dimers linked by C-H…O
hydrogen bonds between the ester carbonyl group (O3) and a hydrogen atom of the central
benzene ring (H7) [d(H…O) = 2.662(11) Å, (C-H…O) = 135.2(8)°]. Two of these
hydrogen bonds generate a ring motif between the two molecules of the dimer. The large
contact surface area between the two molecules suggests that van der Waals interactions
play a significant role in stabilising the dimers (Figure 3.6a).
a b

116
Figure 3.6 (a) Layers formed by CH…O interactions and π-π stacking in form IIa; (b)
interactions perpendicular to the layers of form IIa; (c) packing diagram of form IIa; and
(d) packing diagram of form I.
Two principal interactions connect adjacent dimers to form layers parallel to the (111)
plane: C-H…O hydrogen bonds and π-π interactions. The hydrogen bonds occur between
an aromatic hydrogen atom in the central ring (H5) and the ketone carbonyl group of an
adjacent molecule (O1) [d(H…O) = 2.570(17) Å, (C-H..O) = 135.2(8)°] (Figure 3.7a).
Here again, two of these hydrogen bonds form a ring motif. The offset of the π-π interaction
involves the chlorobenzene fragments of two molecules and takes place at an interplanar
distance of 3.3029(8) Å between the parallel rings (Figure 3.7b). The same stacking
interaction was observed in form I with an interplanar distance of 3.5116(6) Å.
Figure 3.7 (a) Form IIa short interactions and (b) form IIa pi-pi interactions.
The most notable interaction between the layers of form IIa involves an ‘embrace’ of the
alkyl groups from molecules in neighbouring layers (Figure 3.6b). Interestingly, the same
(a) (b)a b

117
embrace motif is also present in form I, but there it is accompanied by a methyl to ketone
C-H…O hydrogen bond. In form IIa the shortest H(methyl)…O(ketone) distance is 3.09
Å, which is much longer than the same contact in form I (2.56 Å). Nevertheless, the relative
arrangement of the molecules remains essentially the same in both forms, which suggests
that the favourable packing arrangement of the aliphatic groups is more important than the
weak CH…O bonds. Combined, the π-π interactions and the alkyl embrace form infinite
slabs of molecules (Figure 3.6b), which are shared between forms I and IIa, as seen in
Figure 3.5b. This results in similar overall packing structures for both forms, which can be
seen in Figure 3.6c and 3.6d. Therefore, the melting enthalpies of forms I and IIa are
expected to be similar. Additionally, the crystalline packing similarity of forms I and IIa
may also explain the sensitivity of the FF polymorphic conversion from form I to form IIa
by external stimuli, such as mechanical scratching.
The details of the FF IIb packing were discussed by Balendiran et al. (18). Briefly, there
are a few short interactions. The carbonyl of the ester group (O3) forms a bond with the
hydrogen from the chlorobenzene ring (H1) [H…O distance: 2.575 Å; C-H…O angle:
158.25 °]. The carbonyl from the ketone group (O1) forms a bond CH…O with another
hydrogen in the chlorobenzene ring (H3) [H…O distance: 2.66 Å; C-H…O angle: 167.26°],
as can be seen in Figure 3.8a. Additionally, form IIb shows the centrosymmetric dimer
between the ketone carbonyl (O1) and the methyl group (H20) [H…O distance: 2.704 Å; C-
H…O angle: 175.31°], which is similar to the interaction in forms I and IIa (Figure 3.8b).
The packing of FF form IIb is illustrated in Figure 3.8c. It is remarkably different from the
packing for forms I and IIa, as seen in Figure 3.6c and Figure 3.6d. These results prove
the differences between polymorphs IIa and IIb.

118
Figure 3.8 Intermolecular CH…O interactions in form IIb (a) forming a tape motif, (b)
cross-linking the tapes via dimeric rings similar to those in form I and (c) packing of form
IIb.
3.3.3 Effect of crystal growth temperatures on FF crystallisation with OTS
Different growth temperatures were applied during the crystallisation of OTS-FF, and
distinctively different visual appearances of the crystal growth were observed. As soon as
the crystallisation process was initiated, the OTS-FF samples were immediately stored at
room temperature (22°C), 40, 50, 60 and 70°C for 30 minutes, which was a sufficient length
of time to allow the complete crystallisation of the FF sample. At room temperature, the
continuous growth of fine opaque crystals can be seen underneath the white crystal cluster
in the centre where the crystallisation was initiated by mechanical scratching. However,
crystal growth at the temperatures of 40, 50 and 60 °C led to the growth of a layer of
transparent spherulite crystals beneath the opaque central crystal cluster that was formed
first (Figure 3.9).
a
c
b

119
Figure 3.9 (a) Images of OTS-FF growth at different temperatures and (b) PLM images
of B-FF growth at different temperatures and the change in crystal growth rate associated
with the temperature effect.
The DSC detected two melting transitions at 74 and 80°C in the OTS-FF samples that
crystallised at room temperature, 40, 50 and 60°C, which indicates the co-existence of FF
forms IIa and I (Figure 3.10a). From the melting enthalpy values, one can obtain a semi-
quantitative comparison of the amount of form I and form IIa obtained in the samples that
were growth at different temperatures (Figure 3.10b). At 40 and 50°C a greater amount of
form IIa was produced in comparison to form I. For the samples with growth at room
temperature and 60 °C, form I was the dominant polymorph with higher melting enthalpies
than that of form IIa.

120
Figure 3.10 (a) DSC thermogram demonstrating melting enthalpies of OTS-FF, which
were incubating at different temperatures during their crystallisation, and (b) changes in
the melting enthalpies of FF forms I and IIa with incubating temperature.
Two ester carbonyl stretching C17-O3 peaks at 1714 and 1727 cm-1 were observed in the
ATR-FTIR spectra of the samples grown at room temperature, 40, 50 and 60°C, which
confirmed the co-existence of form I and form IIa (Figure 3.11a). The relative peak
intensities of these two ester carbonyl peaks reflect the amount of FF form I and form IIa
in these samples. The OTS-FF 40 and 50°C demonstrate a higher intensity of the ester
carbonyl peak at 1714 cm-1 than at 1727 cm-1. This indicates that the OTS-FF 40 and 50°C
were dominated by FF form IIa. While the OTS-FF room temperature and 60°C show a
greater intensity of ester carbonyl at 1727 cm-1 than at 1714 cm-1. This indicates that the
OTS-FF RT and 60°C were dominated by FF form I. The ATR-FTIR findings agree with
the DSC results. This suggests that 40 and 50°C, with an OTS, are the optimal temperatures
for crystal growth of form IIa. The PXRD patterns of the OTS-FF RT and OTS-FF 60°C
(Figure 3.12a) contain peaks from form I and peaks that match the ones reported by Di
Martino and co-workers for their from IIa. This further confirms that the crystals were a
mixture of forms I and IIa (16). The PXRD patterns of the OTS-FF crystallised at 40 and
50 °C are clearly not FF form I, but some diffraction peaks are at similar diffraction angles
to the B-FF RT, including the diffraction peaks at 12.9, 17.6, 19.5, 26.0 and 27.6° (Figure
3.12).
20 30 40 50 60 70
10
20
30
40
50
60
70
80
90
100
Me
ltin
g E
nth
alp
ies (
J/g
)
Annealing Temperature(oC)
Fenofibrate I
Fenofibrate IIa
-24
-22
-20
-18
-16
-14
-12
-10
-8
-6
-4
-2
0
2
Heat F
low
(W
/g)
0 50 100
Temperature (°C)Exo Up Universal V4.5A TA Instruments
Form IIa
Form I a b
Room temperature
40°C
70°C
50°C
60°C

121
Figure 3.11 Partial ATR-FITR spectra (1800-1500 cm-1) of (a) OTS-FF and (b) B-FF that
were crystallised at various growth temperatures (70, 60, 50, 40 °C and room
temperature).
As the growth temperature was increased to 70°C, the crystal habits of both the top and
bottom layers of the growth gradually changed to blade-like shapes, as seen in Figure 3.9a.
At 70°C, only form I with a single melting point at 80°C was detected by DSC. The single
form I ester carbonyl stretching at 1727 cm-1 observed by ATR-FTIR confirms the
crystallisation was solely FF form I. The PXRD of the OTS-FF 70°C showed a similar
PXRD pattern to the reference FF form I (Figure 3.12a).
D:\Data\Champ\FEN II project\20160706 B-FEN 40C 1.1 20160706 B-FEN 40C 1.1
D:\Data\Champ\FEN II project\20160706 B-FEN 60C 1.2 20160706 B-FEN 60C 1.2
D:\Data\Champ\FEN II project\20160706 B-FEN 70C 1.1 20160706 B-FEN 70C 1.1
D:\Data\Champ\Reference spectra\Pure FF II from cover slip.0 20140723 FF crys between coverslips EX
D:\Data\Champ\FEN II project\20160706 B-FEN 50C 1.1 20160706 B-FEN 50C 1.1
06/07/2016
06/07/2016
06/07/2016
23/07/2014
06/07/2016
14501500155016001650170017501800
Wavenumber cm-1
0.00.2
0.40.6
0.8
Abso
rbanc
e Unit
s
Page 1/1
70°C
60°C
50°C
40°C
Room temperature
b F:\FT-IR\Temperature effect\50C\ FF surface growth 50C.0 20140828 FF surface growth 50C Powder
F:\FT-IR\Temperature effect\70C\ FF surface growth 70C.0 20140828 FF surface growth 70C Powder
F:\FT-IR\Second year Electrospinning project\Fenofibrate form II\Temperature effect\40C\20140804 edge after incubate 40C.0 20140804 edge after incubate 40C EX
D:\Data\Champ\20160520 FF free surface 60C surface s2 press.0 FF FS 60C
F:\FTIR back up\Second year Electrospinning project\Fenofibrate form II\Temperature effect\RT\FF Crystal placement at RT from surface disrup recrystalline\20140922 FF crystalline RT particle old sample.1 20140922 FF crystalline RT particle old sample Patch
28/08/2014
28/08/2014
04/08/2014
20/05/2016
22/09/2014
15501600165017001750
Wavenumber cm-1
0.0
0.1
0.2
0.3
0.4
0.5
0.6
0.7
0.8
Abso
rban
ce U
nits
Page 1/1
70°C
60°C
50°C
40°C
Room Temperature
a

122
Figure 3.12 PXRD patterns of (a) OTS-FF and (b) B-FF at different crystal growth
temperatures.
3.3.4 Effect of crystal growth temperatures on FF crystallisation in the bulk
For the B-FF samples, the crystal morphology changed significantly with changes in the
growth temperature. At room temperature, the crystals spread rapidly in a symmetrical
spherulite manner. When 50, 60 and 70 °C were used as the crystal growth temperatures,
the FF crystals became a blade-like shape and expanded asymmetrically (Figure 3.9b). The
crystal growth rate also showed high sensitivity to the changes in the incubation
temperature. As seen in Figure 3.9b, the crystal growth rates were 1.05, 5.37, 7.58, 5.83
and 2.4 µm.sec-1 at room temperature (22ºC), 40, 50, 60 and 70 ºC, respectively. The
maximum crystal growth rate of the FF was observed at 50 °C.
ATR-FTIR was used to examine the polymorph of the B-FF samples. At least three ATR-
FTIR spectra were acquired on the B-FF samples to ensure homogeneity throughout the B-
FF samples. The B-FF that crystallised at 40 and 50°C resulted in FF form IIa, as the
signature peaks of form IIa, including the methyl stretching region and ester carbonyl
stretching, match the pure form IIa spectrum (B-FF RT) (Figure 3.11b). The ATR-FTIR
spectra of B-FF 60 and 70°C closely resembled the FF form I. The few differences were
5 10 15 20 25 30
Inte
nsi
ty (
a.u
.)
2θ( )
5 10 15 20 25 30
Inte
nsi
ty (
a.u
.)
2θ( )
70°C
50°C
40°C
Room temperature
60°C
Form I
b
70°C
60°C
50°C
40°C
Room Temperature
aForm I

123
the ester carbonyl shifting to 1721 cm-1, which is between the ester carbonyl positions of
forms I and IIa, the different intensity of the benzene ring carbonyl stretching and the
absence of the benzene ring in-plane deformation vibration peak at 1098 cm-1(Figure
3.13a). The spectrum subtraction of the B-FF 60 and 70°C for FF form I was performed in
the methyl stretching region (3400-2600 cm-1). The rationale for choosing this region was
due to the flat base line in comparison to the range 1800-1300 cm-1, this would make it easy
to perform the spectrum subtraction. A straight line was obtained from the spectrum
subtraction (Figure 3.13b), which indicates that B FF 60 and 70 °C had an identical match
to the FF form I at the methyl stretching region. In addition, it should be noted that the FF
form I spectrum was observed in one of the three spectra acquired from the B-FF 70°C. It
is possible that the B-FF 70 and 60 °C could be a new polymorph of FF that has a similar
molecular packing to the FF form I or a polymorphic mixture of the new form with form I.
Another possibility is that it could be the preferred orientation of the crystal that influences
the optics of the ATR resulting in the peak position shift (21). PXRD was performed to
confirm the polymorph of FF in this sample.
Figure 3.13 ATR-FTIR spectra of (a) B-FF 60 and 70°C in comparison to the reference
form I spectrum (1800-600 cm-1) and (b) the subtracted spectra of B-FF 60 and 70°C
from the form I spectrum at 3400 to 2600 cm-1.
D:\Data\Champ\Reference spectra\20160510 Fenofibrate form I.0 Fenofibrate form I DLaTGS, KBr-BMS, Globar, IFS 66
D:\Data\Champ\20160707 B-FEN 70 C 2.4 20160707 B-FEN 70 2.1
D:\Data\Champ\FEN II project\20160706 B-FEN 60C 1.3 20160706 B-FEN 60C 1.3
10/05/2016
07/07/2016
06/07/2016
14001500160017001800
Wavenumber cm-1
0.0
0.2
0.4
0.6
0.8
1.0
1.2
Absorb
ance U
nits
Page 1/1
FF form I
B-FF 70°C
B-FF 60°C
D:\Data\Champ\Reference spectra\20160510 Fenofibrate form I.0 Fenofibrate form I DLaTGS, KBr-BMS, Globar, IFS 66
D:\Data\Champ\20160707 B-FEN 70 C 2.4 20160707 B-FEN 70 2.1
D:\Data\Champ\FEN II project\20160706 B-FEN 60C 1.3 20160706 B-FEN 60C 1.3
10/05/2016
07/07/2016
06/07/2016
7008009001000110012001300
Wavenumber cm-1
0.0
0.2
0.4
0.6
0.8
1.0
1.2
1.4
1.6
Absorb
ance U
nits
Page 1/1
FF form I
B-FF 70°C
B-FF 60°C
D:\Data\Champ\Reference spectra\20160707 spectrum subtraction B-FEN 70C-FF I 3400-2600.0 20160706 B-FEN 70C 1.2
D:\Data\Champ\Reference spectra\20160510 Fenofibrate form I.0 Fenofibrate form I DLaTGS, KBr-BMS, Globar, IFS 66
D:\Data\Champ\FEN II project\20160706 B-FEN 70C 1.1 20160706 B-FEN 70C 1.1
06/07/2016
10/05/2016
06/07/2016
260027002800290030003100320033003400
Wavenumber cm-1
0.5
0.6
0.7
0.8
0.9
Abs
orba
nce
Uni
ts
Page 1/1
B-FF 70°C
FF Form I
Subtracted spectrum
D:\Data\Champ\Reference spectra\20160707 spectrum subtraction B-FEN 60C-FF I 3400-2600.0 20160706 B-FEN 60C 1.2
D:\Data\Champ\Reference spectra\20160510 Fenofibrate form I.0 Fenofibrate form I DLaTGS, KBr-BMS, Globar, IFS 66
D:\Data\Champ\FEN II project\20160706 B-FEN 60C 1.3 20160706 B-FEN 60C 1.3
06/07/2016
10/05/2016
06/07/2016
260027002800290030003100320033003400
Wavenumber cm-1
0.45
0.50
0.55
0.60
0.65
0.70
Abs
orba
nce
Uni
ts
Page 1/1
B-FF 60°C
FF Form I
Subtracted spectrum
a
b

124
The PXRD results also show the changes in the diffraction patterns of B-FF with changes
in the growth temperatures (Figure 3.12b). Example diffraction peaks are highlighted in
Figure 3.12b and they show the clear differences between the known form I and the growth
of the B-FF at different temperatures. As the ATR-FTIR suggested, B-FF 60 and 70°C
might have similar PXRD patterns to the FF form I. However, the PXRD of the B-FF 60
and 70°C are significantly different to the reference form I PXRD. This could be the
preferred orientation effect in these B-FF samples. Therefore, PXRD may not be a suitable
technique to examine the B-FF samples. Thermal analysis by structural characterisation
(TASC) is an optical analogue micro-thermal analysis that employs a similar principle to a
hot-stage microscope. It takes account of the pixel changes while recording a series of
images during the heating or cooling program and changes them to quantitative data (22,
23). TACS has been used to measure the Tg of polymers and the melting points of
crystalline materials (22, 23). TASC could be a potential means to clarify the polymorph
of the B-FF by observing the melting points. Additionally, a B-FF sample with a glass
substrate can be inserted into the TACS to perform thermal analysis without damaging the
sample, as occurs with the DSC sample preparation.
3.3.5 Physical stability of FF IIa
OTS-FF
OTS-FF 40°C was chosen as the representative sample to study the physical stability of FF
IIa in an OTS sample because it contains the greatest amount of the FF IIa. Figure 3.14
shows the PXRD patterns of the OTS-FF 40°C. The stability study was conducted for six
months at room temperature using PXRD. The figure Figure 3.14 indicates that while
ageing at room temperature, there is no clear evidence of the continuous polymorphic
transformation of form IIa to I in the mixtures, since the PXRD of the OTS-FF 40°C at six
months was very similar to the fresh sample (only small peaks near 10° and 20° disappear).

125
Figure 3.14 PXRD analysis of six months physical stability under ambient conditions of
OTS-FF, which was crystallised at 40°C, fresh (A), one month (B), three months (C), six
months (D) and intact crystalline form I (E).
As seen in Figure 3.15, clear melting of form IIa followed by recrystallisation of form I
can be observed by DSC heating at 2°C.min-1 . However, with an increase in the heating
rate to 20°C.min-1, only the melting transitions of form IIa and form I could be observed.
This is due to there being less time available for the conversion and the completion of the
recrystallisation of form I. This was confirmed by the decreased melting enthalpy of form
I with an increase in the heating rate.
Figure 3.15 (a) DSC thermogram demonstrating different heating rates being applied to
OTS-FF at 40°C (which generated FF form IIa rich crystals) and (b) changes in melting
enthalpies of forms I and IIa with the heating rates used in the DSC experiments.
The heating effect on the conversion of form IIa to form I was studied at temperatures
below and above the melting point of the FF crystalline form IIa. The OTS-FF 40°C was
heated to 76°C, which is slightly higher than the melting point of form IIa, and incubated
until the crystallisation of form I was complete (which was approximately two minutes).
5 10 15 20 25 30
A
D
C
B
E
Inte
nsit
y (a
.u.)
2θ (°)
0 2 4 6 8 10 12 14 16 18 20 22
20
30
40
50
60
70
80
90
100
Me
ltin
g E
nth
alp
ies
(J/g
)
Heating Rate (oC/min)
Fenofibrate form I
Fenofibrate form IIa
-10
-5
0
5
Heat F
low
(W
/g)
60 70 80 90
Temperature (°C)Exo Up Universal V4.5A TA Instruments
2°C.min-1
20°C.min-1
5°C.min-1
10°C.min-1
a
b

126
As seen in Figure 3.16, during the incubating period there was the melting of form IIa at
74°C, which was immediately followed by an exothermic recrystallization of form I. The
complete crystallisation of form I after annealing was confirmed by the same single melting
point and enthalpy value as the pure crystalline form I.
Figure 3.16 (a) Isothermal DSC thermograms of a post polymorphic transformation of FF
form IIa rich crystals by melt-recrystallisation when annealing at 76 °C and (b) DSC
heating of form IIa after annealing at 76 °C.
Isothermal MTDSC was used to further probe the thermal impact on the form IIa to form I
conversion. It has been reported previously that a change in the Cp during an isothermal
DSC experiment is related to the polymorphic conversion (24). As seen in Figure 3.17, a
more significant surge of the reversing Cp signal was observed at the beginning of the
annealing period at 70 °C than at 60 °C. The peak observed in the reversing Cp signal is
associated with the polymorphic conversion of form IIa to form I, which was completed
within 11.3±1.2 minutes for annealing at 70 °C and 4.8±0.2 minutes at 60 °C. A standard
DSC was used to confirm the nature of the Cp change after the isothermal MTDSC
experiment. Only the melting of form I was detected in the OTS-FF 40°C samples that
annealed at 70°C. This indicates that the change in the Cp is associated with the complete
polymorphic transformation of form IIa to form I; whereas, the melting of form IIa can still
be observed in the sample that annealed at 60°C, but with a reduced enthalpy value and
-4
-3
-2
-1
0
1
Heat F
low
(W
/g)
6 8 10 12 14 16
Time (min)
Sample: FF II rich melting 76CSize: 1.8100 mgMethod: 20CComment: hold temperature at 76C
DSCFile: 20140722 FF II rich melting 76C.001Operator: MuqdadRun Date: 22-Jul-2014 14:16Instrument: DSC Q2000 V24.10 Build 122
Exo Up Universal V4.5A TA Instruments
-12
-10
-8
-6
-4
-2
0
2
Heat F
low
(W
/g)
-80 -60 -40 -20 0 20 40 60 80 100
Temperature (°C)
Sample: FF II rich melting 76C rerunSize: 1.8100 mgMethod: 20CComment: rerun after hold temperature at 76C
DSCFile: 20140722 FF II rich melting 76C rer...Operator: MuqdadRun Date: 22-Jul-2014 14:59Instrument: DSC Q2000 V24.10 Build 122
Exo Up Universal V4.5A TA Instruments
Form IIa melting
Form I recrystallise
Form Imelting
a
b
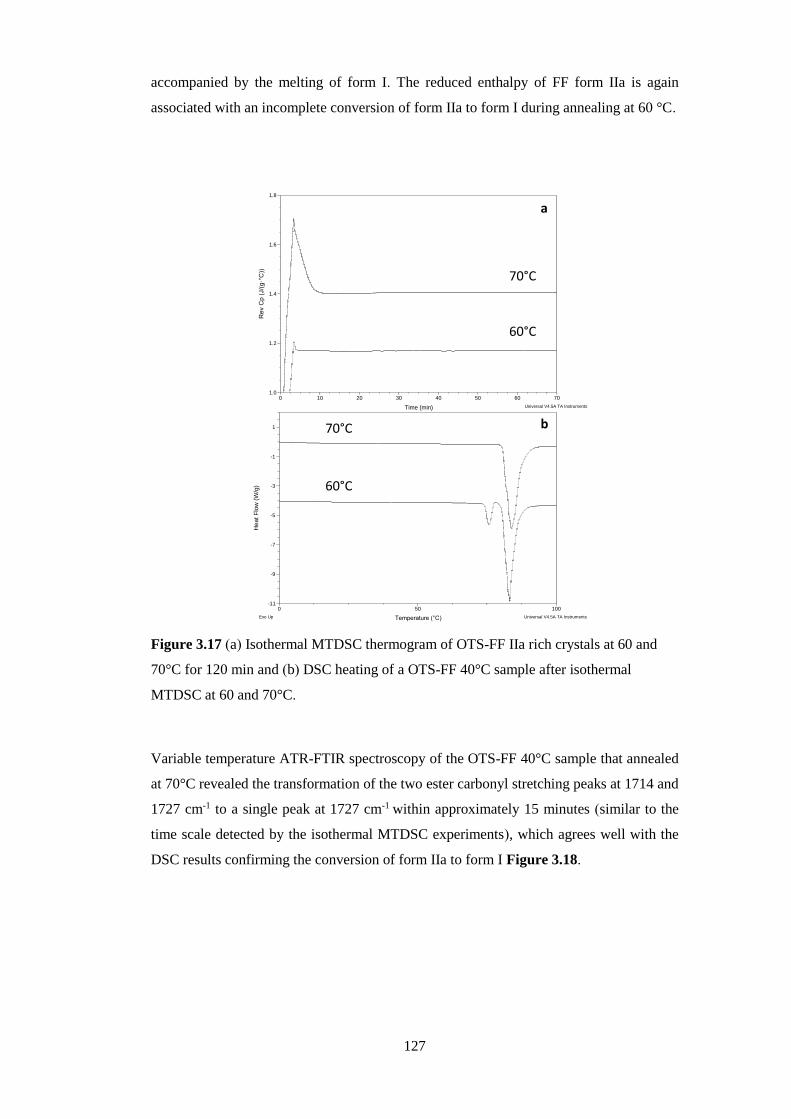
127
accompanied by the melting of form I. The reduced enthalpy of FF form IIa is again
associated with an incomplete conversion of form IIa to form I during annealing at 60 °C.
Figure 3.17 (a) Isothermal MTDSC thermogram of OTS-FF IIa rich crystals at 60 and
70°C for 120 min and (b) DSC heating of a OTS-FF 40°C sample after isothermal
MTDSC at 60 and 70°C.
Variable temperature ATR-FTIR spectroscopy of the OTS-FF 40°C sample that annealed
at 70°C revealed the transformation of the two ester carbonyl stretching peaks at 1714 and
1727 cm-1 to a single peak at 1727 cm-1 within approximately 15 minutes (similar to the
time scale detected by the isothermal MTDSC experiments), which agrees well with the
DSC results confirming the conversion of form IIa to form I Figure 3.18.
-11
-9
-7
-5
-3
-1
1
He
at
Flo
w (
W/g
)
0 50 100
Temperature (°C)Exo Up Universal V4.5A TA Instruments
1.0
1.2
1.4
1.6
1.8
Re
v C
p (
J/(
g·°
C))
0 10 20 30 40 50 60 70
Time (min) Universal V4.5A TA Instruments
70°C
b
a
60°C
60°C
70°C

128
Figure 3.18 Change in ester carbonyl stretching peak intensity during variable
temperature ATR-FTIR of OTS-FF40°C: the indicator peak at 1714 cm-1(form IIa) shifted
to 1727 cm-1 (form I). This is an indication of the transformation of form IIa to form I
after annealing at 70°C for 3 hrs.
B-FF
After the complete crystallisation of amorphous FF at room temperature, PXRD was used
to monitor the six month physical stability of form IIa stored at room temperature. The
PXRD results showed that B-FF samples remained as form IIa during the six month period
without conversion into form I (Figure 3.19).
Figure 3.19 PXRD pattern of B-FF physical stability for six months under ambient
conditions: fresh (A), one month (B), three months (C) and six months (D).
Form IIa converts into form I due to further mechanical stress, such as scratching with a
stainless steel spatula, or thermal treatment. The mechanical stress effect was described
previously in section 3.3.1. As demonstrated by the variable temperature ATR-FTIR
spectroscopy results (Figure 3.20), the completely crystallised form IIa converts to form I
during incubation at 70°C. Form IIa is identified by an intense peak at 1714 cm-1 that
0
0.02
0.04
0.06
0.08
0.1
0.12
0.14
0.16
0 50 100 150 200
Ab
sorb
ance
Time (min)
Time(hour)
Wave number (cm-1)
1
2
3
0
1727 cm-1
1727 cm-1
1714 cm-1
1714 cm-1
5 10 15 20 25 30
Inte
nsi
ty (
a.u
.)
2θ( )
A
B
C
D

129
indicates ester carbonyl stretching. The polymorphic conversion is indicated by a reduction
in this peak and an increase in the intensity of the ester carbonyl peak at 1721cm-1. As
discussed earlier, this is an indication of FF form I.
Figure 3.20 Changes in ATR-FTIR spectra of B-FF after removing coverslips and
placing on the variable temperature ATR-FTIR for 3 hr at 70°C. It should be noted that
the characteristic peak of FF form II at 1714 cm-1 gradually shifted to 1721 cm-1 that
indicated the polymorphic conversion of form II to I.
3.3.6 Effect of OTS on FF crystal growth mode switching
This section presents an investigation of the effect of using an OTS to switch the crystal
growth mode in the partially crystallised FF sample. The FF crystallisation was initiated
via surface disruption to activate heterogeneous nucleation (Figure 3.21a). A top coverslip
was immediately placed on the amorphous FF to limit the OTS. The spherulite form IIa
crystals, which were identified by the ester carbonyl at 1714 cm-1 using ATR-FTIR
spectroscopy, expand radially from the nucleation site throughout the amorphous FF, as
seen in Figure 3.21a-c. The removal of the top coverslip before the completion of the
crystallisation of the amorphous FF terminated the expansion of the form IIa. From this
point, needle-like clusters of crystals could be seen growing rapidly (Figure 3.21d-f).
These needle-like clusters were identified as form I by the measured shift of the ester
carbonyl stretching peak to 1727 cm-1 using ATR-FTIR spectroscopy (Figure 3.21g). This
phenomenon, in which the crystalline form IIa initiates form I, is likely to be due to cross-
nucleation (14, 25-28). Therefore, an OTS shows a significant impact on the crystal growth
mode of the amorphous FF.

130
Figure 3.21 Images of FF crystal growth mode being switched from form IIa to form I after
top coverslip removal. (a-c) FF form IIa crystals grown between sandwiched coverslips at
room temperature over 17 minutes (a = initial, b = 5 min, c = 15 min); (d-f) following top
cover slip removal, form IIa crystal growth was terminated and form I crystallisation
occurred throughout the remaining amorphous FF (d = initial, e = 5 min, f = 15 min ); and
(g) spherulite and needle-like crystalline regions were distinguished as two separate
domains using ATR-FTIR in which the ester carbonyl stretching peaks at 1714 and 1727
cm-1 indicates the presence of forms IIa and I, respectively.
3.4 Discussion
3.4.1 Origin of FF IIa crystallisation and FF cross-nucleation
In the bulk of the melt, molecules are being pulled by their neighbour’s molecules at all of
the directions. This is resulting in the small molecular mobility in the bulk. In contrast, at
the boundary between the melt and the air, the molecules at the interface are not surrounded
like in the bulk. They are being pulled inward by their neighbour molecules. This action
resulting in the melt to minimise its surface area. Therefore, this leads to the molecules at
the interface between the air, and the melt has a higher energy and mobility than the
molecules that stay in the bulk of the melt. Consequently, at the interface is a preferential
site for the nucleation and crystal growth because the molecules at this site have high
energy and mobility. The fast molecular mobility and high surface energy at the OTS
possibly lead to a crystallisation of the thermodynamically more stable polymorph (14, 15,

131
29, 30). The results of this chapter indicate that OTS crystallisation favours the formation
of the stable form I. This result is in good agreement with other studies, such as the surface
crystallisation of indomethacin that led to the generation of a stable gamma polymorph
(29). On the other hand, in the bulk where molecular mobility is slow, the molecules may
integrate to the crystal slower and cause the different polymorph in comparison to the OTS
crystallisation. In this study, the metastable FF form IIa shows a preference for the site
at the interface that was in contact with the glass substrate. This phenomenon is likely due
to the substrate induced phase (SIP) effect. The SIP effect has been reported to influence
the polymorphic form of APIs (31). Reischl et al. reported the use of SIP to induce a
metastable polymorph of phenytoin. The authors explained that the surface of the substrate
has a tremendous effect on the phenytoin crystal alignment that leads to a formation of the
metastable polymorph of phenytoin (32). Therefore, it is possible to speculate that the
origin of FF form IIa is from the SIP effect of the glass substrate that induces the FF
molecular alignment into the polymorph IIa.
Once completely crystallised in a closed environment, the crystal structure is stable for at
least six months at room temperature after the top substrate is removed. This indicates that
at room temperature, energetically, form IIa is relatively stable, which is confirmed by the
single crystal structural study. However, if there is still non-crystallised amorphous
material available, removing the top substrate led to the termination of the crystallisation
to form IIa, and the growth of form I. This is due to the top substrate removal introducing
an OTS to the amorphous FF. As a consequence, the amorphous FF switched crystal growth
mode from FF IIa to I because FF form I is more favourable than form IIa in the presence
of an OTS. This phenomenon corresponds to the cross-nucleation in which the crystals of
form IIa nucleated the crystal growth of form I after the top coverslip was removed (14,
25-28).
Cross-nucleation is a phenomenon in which one crystalline polymorph is nucleated to the
other polymorph that has higher or lower thermodynamic stability. It has been reported in
the literature (14, 25-28). Cross-nucleation has been observed in some APIs and
pharmaceutical excipients. Tao et al. observed that the seed crystals of mannitol forms β
and δ induced the crystallisation of mannitol form α at a temperature below 150°C. While
mannitol form β was the only form that crystallised at a temperature greater than 150°C
(14). Gunn et al. reported that the nifedipine form α crystal resulted in the crystal growth
of nifedipine form β at 110°C or below. A temperature greater than 120°C lead to the
crystallisation of the nifedipine α form (28). Hence, the cross-nucleation of mannitol and
nifedipine is temperature dependent (14, 28). To the best of our knowledge, the cross-
nucleation that results from the availability of an OTS has not been reported previously.

132
This chapter carries a significant finding of the OTS effect on the polymorphic form of FF,
which can be a potential means to select the polymorph for the other APIs.
3.4.2 Optimal crystal growth condition of form IIa
The second significant finding of this study was the optimal crystal growth of form IIa at
40 to 50°C for OTS-FF while the maximum crystal growth rate of FF IIa in the bulk was
at 50°C. This agrees with Amstad’s study that the maximum crystal growth rate of FF is at
50°C (9). However, in contrast to other studies, the results of this study highlighted the
importance of the combination of both growth temperature and OTS on the optimal growth
of metastable form IIa. The OTS-FF RT yielded a mixture of forms IIa and I, in which form
I was the dominant polymorph. This suggests that form IIa nucleation and growth occurs
beneath the surface of the amorphous FF. The higher form I yield at higher crystallisation
temperatures can be attributed to the combination of a lower form IIa crystallisation driving
force and the conversion of crystallised form IIa into form I.
3.5 Conclusion
The results presented in this chapter demonstrate that polymorphic form selection of FF
could be achieved by the availability of an OTS during its crystallisation. The use of a
thermal treatment in addition to an OTS can fine tune the selection of the crystallisation of
FF form I and form IIa. The crystal growth mode switching form IIa to form I occurs when
an OTS is introduced to the incomplete crystallisation of form IIa. This indicates that the
crystallisation of form I is highly dependent on the OTS. This chapter reports for the first
time the crystallographic data of metastable FF form IIa, which confirmed the similarity of
it to the molecular packing of the stable form I and clarified the confusion between the FF
form IIs in the literature. This chapter has produced new insights into how to use an OTS
to manipulate and control the crystallisation of FF, which could be useful for industrial
applications.
3.6 References
1. Tran TH, Ramasamy T, Truong DH, Choi H-G, Yong CS, Kim JO. Preparation and
Characterization of Fenofibrate-Loaded Nanostructured Lipid Carriers for Oral Bioavailability Enhancement.
Aaps Pharmscitech. 2014;15(6):1509-15.
2. He H, Yang R, Tang X. In vitro and in vivo evaluation of fenofibrate solid dispersion prepared by
hot-melt extrusion. Drug development and industrial pharmacy. 2010;36(6):681-7.
3. Hossen SM, Sarkar R, Towhid MHA, Sultan MT, Aziz NA. Study on the effect of different
polymers on in-vitro dissolution profile of Fenofibrate by solid dispersion technique. Journal of Applied
Pharmaceutical Science Vol. 2014;4(06):056-60.
4. Patel T, Patel L, Patel T, Makwana S, Patel T. Enhancement of dissolution of Fenofibrate by Solid
dispersion Technique. Int J Res Pharm Sci. 2010;1(2):127-32.

133
5. Srinarong P, Faber JH, Visser MR, Hinrichs WLJ, Frijlink HW. Strongly enhanced dissolution rate
of fenofibrate solid dispersion tablets by incorporation of superdisintegrants. European Journal of
Pharmaceutics and Biopharmaceutics. 2009;73(1):154-61.
6. Zhou D, Zhang GGZ, Law D, Grant DJW, Schmitt EA. Physical stability of amorphous
pharmaceuticals: Importance of configurational thermodynamic quantities and molecular mobility. Journal of
pharmaceutical sciences. 2002;91(8):1863-72.
7. Sailaja U, Thayyil MS, Kumar NSK, Govindaraj G. Molecular dynamics of amorphous
pharmaceutical fenofibrate studied by broadband dielectric spectroscopy. Journal of Pharmaceutical Analysis.
2015.
8. Tipduangta P, Takieddin K, Fábián L, Belton P, Qi S. A New Low Melting-Point Polymorph of
Fenofibrate Prepared via Talc Induced Heterogeneous Nucleation. Crystal Growth & Design.
2015;15(10):5011-20.
9. Amstad E, Spaepen F, Weitz DA. Crystallization of undercooled liquid fenofibrate. Physical
Chemistry Chemical Physics. 2015;17(44):30158-61.
10. Kawakami K, Usui T, Hattori M. Understanding the glass-forming ability of active pharmaceutical
ingredients for designing supersaturating dosage forms. Journal of pharmaceutical sciences.
2012;101(9):3239-48.
11. Crowley KJ, Zografi G. The use of thermal methods for predicting glass-former fragility.
Thermochimica Acta. 2001;380(2):79-93.
12. Angell CA. Why C1 = 16–17 in the WLF equation is physical—and the fragility of polymers.
Polymer. 1997;38(26):6261-6.
13. Baird JA, Van Eerdenbrugh B, Taylor LS. A classification system to assess the crystallization
tendency of organic molecules from undercooled melts. Journal of Pharmaceutical sciences.
2010;99(9):3787-806.
14. Tao J, Jones KJ, Yu L. Cross-nucleation between D-mannitol polymorphs in seeded crystallization.
Crystal Growth and Design. 2007;7(12):2410-4.
15. Zhu L, Wong L, Yu L. Surface-enhanced crystallization of amorphous nifedipine. Molecular
Pharmaceutics. 2008;5(6):921-6.
16. Di Martino P, Palmieri G, Martelli S. Evidence of a metastable form of fenofibrate. Die Pharmazie.
2000;55(8):625-6.
17. Heinz A, Gordon KC, McGoverin CM, Rades T, Strachan CJ. Understanding the solid-state forms
of fenofibrate–a spectroscopic and computational study. European Journal of Pharmaceutics and
Biopharmaceutics. 2009;71(1):100-8.
18. Balendiran GK, Rath N, Kotheimer A, Miller C, Zeller M, Rath NP. Biomolecular Chemistry of
Isopropyl Fibrates. J pharm sci. 2012;101(4):1555-69.
19. Socrates G. Infrared and Raman characteristic group frequencies: tables and charts: John Wiley &
Sons; 2004.
20. Henry R, Zhang G, Gao Y, Buckner I. Fenofibrate. Acta Crystallographica Section E: Structure
Reports Online. 2003;59(5):o699-o700.
21. Stuart BH. Spectral Analysis. Infrared Spectroscopy: Fundamentals and Applications: John Wiley
& Sons, Ltd; 2005. p. 45-70.
22. Reading M, Morton M, Antonijevic M, Grandy D, Hourston D, Lacey A. New methods of thermal
analysis and chemical mapping on a micro and nano scale by combining microscopy with image analysis.
Microscopy: advances in scientific research and education Formatex Research Center. 2014:1083-9.
23. Alhijjaj M, Reading M, Belton P, Qi S. Thermal Analysis by Structural Characterization as a
Method for Assessing Heterogeneity in Complex Solid Pharmaceutical Dosage Forms. Analytical chemistry.
2015;87(21):10848-55.
24. Qi S, Craig DQM. The Development of Modulated, Quasi-Isothermal and Ultraslow Thermal
Methods as a Means of Characterizing the α to γ Indomethacin Polymorphic Transformation. Molecular
Pharmaceutics. 2012;9(5):1087-99.
25. Chen S, Xi H, Yu L. Cross-Nucleation between ROY Polymorphs. Journal of the American
Chemical Society. 2005;127(49):17439-44.
26. Yu L. Nucleation of One Polymorph by Another. Journal of the American Chemical Society.
2003;125(21):6380-1.
27. Tao J, Yu L. Kinetics of Cross-Nucleation between Polymorphs. The Journal of Physical Chemistry
B. 2006;110(14):7098-101.
28. Gunn E, Guzei IA, Cai T, Yu L. Polymorphism of Nifedipine: Crystal Structure and Reversible
Transition of the Metastable β Polymorph. Crystal Growth & Design. 2012;12(4):2037-43.
29. Wu T, Yu L. Surface Crystallization of Indomethacin Below T g. Pharm Res. 2006;23(10):2350-5.
30. Sun Y, Zhu L, Kearns KL, Ediger MD, Yu L. Glasses crystallize rapidly at free surfaces by
growing crystals upward. Proceedings of the National Academy of Sciences. 2011;108(15):5990-5.
31. Jones AOF, Chattopadhyay B, Geerts YH, Resel R. Substrate-Induced and Thin-Film Phases:
Polymorphism of Organic Materials on Surfaces. Advanced Functional Materials. 2016;26(14):2233-55.
32. Reischl D, Röthel C, Christian P, Roblegg E, Ehmann HMA, Salzmann I, et al. Surface-Induced
Polymorphism as a Tool for Enhanced Dissolution: The Example of Phenytoin. Crystal Growth & Design. 2015;15(9):4687-93.

134
4. Chapter 4: New Low Melting-point Polymorph of FF Prepared via Talc Induced
Heterogeneous Nucleation
4.1 Introduction
In the previous chapter, the melt-cooled amorphous FF had its crystallisation behaviour
explored with respect to the availability of an OTS (open top surface) and the crystal growth
temperature. The FF form IIa crystallisation was found to be sensitive to an OTS and crystal
growth temperature (previously reported in Chapter 3). The heterogeneous nucleation
approach by scratching the amorphous FF with a stainless steel spatula was used to initiate
the FF crystallisation. However, in practice, heterogeneous nucleation and crystallisation
induced by mechanical triggers are often extremely difficult to control; whereas, the
addition of an impurity is a much more controllable approach for initiating heterogeneous
nucleation and crystallisation (1-3). The interaction between the impurity and the drug
molecules can often be used to control the crystallisation of a certain polymorph (4, 5).
Poornachary et al demonstrated the use of LD-aspartic acid and glutamic acid to
specifically inhibit the nucleation of α-glycine. This resulted in the control of the
crystallisation of the supersaturated glycine to crystallise into γ-glycine (5). It is believed
that the polymorphic control from additives occurs through one of two main mechanisms,
which are 1) the lattice match between the impurity surface and the aggregate molecules
and 2) the molecular ordering according to the morphological features of the additive’s
surface (2). Therefore, there has been an increasing number of reports on using
heterogeneous nucleation as a novel means to selectively produce desirable polymorphic
forms in the pharmaceutical industry (2, 3, 6-8). For example, Chadwick and co-workers
reported the use of a 4-aminophenylacetic acid to induce the crystallisation of amorphous
PCM into its polymorph II (2). Lang et al. successfully used hydroxypropyl cellulose,
poly(4-methylpentene), poly(R-methylstyrene) and poly(p-phenylene ether-sulfone) to
crystallise amorphous carbamazepine into its polymorph IV (8).
Talc (Mg3Si4O10(OH)2) is a generally recognized as safe (GRAS) excipient widely used in
pharmaceutical oral solid dosages as a tableting excipient (9). In this chapter, the use of a
low quantity of talc to induce the heterogeneous nucleation of FF from the melt was
explored. It was expected that the talc additives would induce crystallisation of amorphous
FF by enhancing the nucleation process of amorphous FF via heterogeneous nucleation.
In this part of the study, talc was used to crystallise a new polymorphic form (form III) of
FF, which has not been reported previously. The physicochemical properties of FF form
III were characterized along with the crystal growth condition optimization. The single
crystal structure of FF III was elucidated in comparison to the previously reported FF
polymorphs. Additionally, the mechanism of FF form III crystallization with the presence

135
of talc was investigated. Furthermore, the transformations of this form to other known
polymorphs are also described in this Chapter.
4.2 Methodology
4.2.1. Sample preparation
The FF form I and talc powders were precisely weighed at proportions of 80:20, 90:10,
95:5, and 99:1. The powders with a total weight of approximately 300 mg were transferred
to glass vials and physically mixed with a metal spatula. The samples were heated to 100
°C until all FF crystals had completely melted. After complete melting, the vials were
carefully removed from the heat source and immediately transferred to 0% RH desiccators
(using P2O5 as the desiccating agent). The amorphous FF obtained by cooling the melt that
contained talcum powder completely recrystallized within 24 h. When preparing form III,
caution should be taken because if the amorphous FF containing 1% talc experiences any
mechanical shock, such as scratching with metal implements or knocking on the outside of
the glass vial containing the molten FF, the recrystallization of FF forms I and II could
occur instead of form III (this will be explained in page 137-8, Figure 4.2).
4.2.2 Characterisation methods
In this chapter, the FF crystals with talc additives (1-20%) were characterised by a range
of characterisation technique, as follows: DSC, MTDSC, TGA, ATR-FTIR, SEM, PXRD
and SCXRD. The details of the DSC, MTDSC, TGA, ATR-FTIR, SCXRD, PXRD and
SEM techniques are included in Chapter 2, sections 2.4.1.2, 2.4.2.2, 2.4.3.2, 2.4.5.2,
2.4.7.2, 2.4.7.4 and 2.4.8.2, respectively. The crystal structure of FF form III was
determined according to the procedure stated in section 2.4.7.3.
4.3 Results
4.3.1 Identification and optimization of new form III crystallisation
The nucleation and crystallisation of form III are strongly affected by the talc concentration
suspended in the molten FF. Figure 4.1 shows the crystallisation of form III, which has a
distinct low melting point of approximately 50°C. This form only occurred when the talc
concentration was 1% (w/w). The absence of a glass transition in the DSC result confirmed
that the material was fully crystallised. Following the melting of form III, exothermic
crystallisation occurred immediately at 57.6°C. The product of the crystallisation is

136
confirmed to be form I as form I melting can be observed at 80°C with a melting enthalpy
of 89.8±0.6 J/g.
Figure 4.1 DSC thermograms of FF crystallised from melt containing (A) 1% w/w, (B)
5% w/w, (C) 10% w/w and (D) 20% w/w talc.
The use of talc concentrations greater than 1% resulted in the crystallisation of mixtures of
the metastable form IIa (melting point of approximately 74°C) and the stable form I
(melting point of approximately 80°C). Judging by the enthalpy values of the peaks
associated with forms I and IIa, more form I was crystallised than form IIa in the samples
containing 5-20% talc (10). It is important to emphasize that careful control of the
crystallisation conditions is imperative for obtaining form III with a high purity. In our
experiments, the absence of humidity and complete avoidance of any mechanical shocks
were necessary to increase the chance of crystallising the new form III with a high purity.
As shown in Figure 4.2, despite the addition of 1% talc and cooling and storing the sample
at 0% RH, a low level of mechanical shock (i.e., the container being bumped against the
wall of the desiccator) can potentially cause the failure of the form III crystallisation and
result in a mixture of forms I and IIa crystallising.
-20
-15
-10
-5
0
5
He
at
Flo
w (
W/g
)
-20 0 20 40 60 80 100 120
Temperature (°C)Exo Up Universal V4.5A TA Instruments
Melting of form III
Melting of form IIa
Melting of form I
A
B
C
D

137
Figure 4.2 Optical images of crystalline FF-containing 1% talc that was obtained from
the melt-cooling process: (A) crystallisation initiated by mechanical shock resulting in a
mixture of forms I and IIa with form I being the dominatant form and (B) non-disruptive
spontaneous crystallisation of form III in the presence of talc.
4.3.2 Physicochemical characterisation of FF form III
The morphology and spectroscopic features of the new FF form III were further
characterised using SEM, PXRD and ATR-FTIR. Figure 4.2 demonstrates the
macroscopic differences between the appearance of the form I/form IIa mixture and form
III. The form I and IIa mixture shows the presence of fine crystals. Form III, on the contrary,
shows a flat and spreading habit of a mass of slender crystals. Macroscopically, form III is
semi-translucent. Figure 4.3 further confirms the significant crystal habit difference
between form III and the stable form I. The SEM image of form I reveals large triclinic
shaped form I crystals, which agrees well with the literature (11, 12). The radiating habit is
further confirmed by the SEM image of form III.
Figure 4.3 SEM images of (A and B) talc powders, (C and D) FF powder polymorph I as
received and (E and F) form III crystallized in presence of 1% talc.

138
The ATR-FTIR results for form III show a clear fingerprint of form III, which is
distinctively different from the known forms I and IIa at the methyl group stretching region,
benzene ring stretching, benzene ring in plane deformation and benzene ring out of plane
deformation, as highlight in Figure 4.4. The peak shifts in these regions indicate the
differences in the molecular interactions of the FF functional groups, which cause the
different crystal packing of form III in comparison to forms I and IIa. The functional groups
associated with the vibrational bands shown in the IR spectra are summarised in Table 4.1.
Figure 4.4 Comparison of ATR-FTIR spectra of FF polymorphic froms I, IIa and III: (a)
spectra of 3300 to 2700 cm-1 region, (b) spectra of 1850 to 1350 cm-1 region and (c) spectra
of 1350 to 550 cm-1 region. The differences between form I and form III spectra are
highlighted in the dashed-line boxes.
PXRD is a technique that is highly sensitive to molecular packing arrangements. A clear
and sharp PXRD diffraction pattern for form III with the absence of a background halo was
obtained, as seen in Figure 4.5; this indicates that form III was crystallised by the method
described in this Chapter and has a reasonably high purity. Additionally, the FF form III
PXRD pattern is distinctively different from the known stable forms I and IIa, which were
reported by Di Martino and co-workers (13). This refers to the difference in the crystalline
packing of FF form III in comparison to FF forms I and IIa. Therefore, the results of the
ATR-FTIR and PXRD both confirm the successful crystallisation of the new FF polymorph
form III.
C:\Program Files\OPUS\Users\Champ\Second year Electrospinning project\Fenofibrate form II\Fenofibrate form I 20130130 Fenofibrate heat 10C-min 20130130
C:\Program Files\OPUS\Users\Champ\Average spectra\Raw data\20150130 FF III 2C min.0 20150130 FF III 2C min
C:\Program Files\OPUS\Users\Champ\Second year Electrospinning project\Fenofibrate form II\Pure FF II from cover slip.0 20140723 FF crys between coverslips EX
30/01/2013
30/01/2015
23/07/2014
26002700280029003000310032003300
Wavenumber cm-1
0.2
80
.30
0.3
20
.34
0.3
60
.38
0.4
00
.42
Ab
so
rba
nce
Un
its
Page 1 of 1
C:\Program Files\OPUS\Users\Champ\Second year Electrospinning project\Fenofibrate form II\Fenofibrate form I 20130130 Fenofibrate heat 10C-min 20130130
C:\Program Files\OPUS\Users\Champ\Average spectra\Raw data\20150130 FF III 2C min.0 20150130 FF III 2C min
C:\Program Files\OPUS\Users\Champ\Second year Electrospinning project\Fenofibrate form II\Pure FF II from cover slip.0 20140723 FF crys between coverslips EX
30/01/2013
30/01/2015
23/07/2014
135014001450150015501600165017001750
Wavenumber cm-1
0.3
00
.35
0.4
00
.45
0.5
00
.55
0.6
00
.65
Ab
so
rba
nce
Un
its
Page 1 of 1
C:\Program Files\OPUS\Users\Champ\Second year Electrospinning project\Fenofibrate form II\Fenofibrate form I 20130130 Fenofibrate heat 10C-min 20130130
C:\Program Files\OPUS\Users\Champ\Average spectra\Raw data\20150130 FF III 2C min.0 20150130 FF III 2C min
C:\Program Files\OPUS\Users\Champ\Second year Electrospinning project\Fenofibrate form II\Pure FF II from cover slip.0 20140723 FF crys between coverslips EX
30/01/2013
30/01/2015
23/07/2014
6007008009001000110012001300
Wavenumber cm-1
0.0
0.2
0.4
0.6
0.8
Abs
orba
nce
Uni
ts
Page 1 of 1
Form I
Form IIa
Form III
Form I
Form IIa
Form III
Form I
Form IIa
Form III
a
c
b

139
Table 4.1 Assignment of ATR-FTIR peaks of amorphous FF, FF form I, form IIa and
form III.
Band assignment Peak position (cm-1 )
Amorphous
fenofibrate
FF
polymorph I
FF
polymorph
IIa
FF
polymorph
III
=CH-H of benzene
ring
3070 3071, 3055,
3034
3087, 3069,
3050
3068, 3015
Methyl group
stretching
2982, 2938 2985, 2937 2984, 2975,
2931
2978, 2939,
2876
O3-C17 ester
carbonyl
stretching
1728 1727 1714 1727
O1-C7 Aryl ketone
carbonyl
stretching
1654 1650 1645 1650
-CH=CH- benzene
stretching
1505, 1466 1520, 1463 1518, 1483 1506, 1484
C-O-C of ester 1143 1143 1144 1148
Aryl ether 1284 1285 1286 1284
Benzene ring in
plane deformation
vibration
1248, 1172,
1116,
1014, 972
1247, 1173,
1117,
1014, 975
1241, 1177,
1117,
1013, 968
1247, 1179,
1104, 1014,
983
Benzene ring out
of plane
deformation
vibration
852, 838,
679
860, 844, 680 858, 844,
683
849, 829,
680
Cl1-C3 bending 762 765 763 765, 758

140
Figure 4.5 PXRD diffraction patterns of (a) pure talc, (b) FF form III and (c) form I.
4.3.3 Crystal structure of FF form III
In this section, the crystal structure of form III will be presented and compared to the crystal
structures of forms I, IIa and IIb. The basic crystallographic parameters of these forms are
given in Table 4.2.
Table 4.2 Crystallographic parameters of available polymorphic forms of FF.
Parameter Form Ia Form IIa Form IIbb Form IIIc
Lattice system Triclinic Triclinic Monoclnic Triclinic
Space group P-1 P-1 P21/n P-1
a (Å) 8.1325 8.1328 (5) 13.619 9.4803 (6)
b (Å) 8.2391 8.7088 (6) 7.554 9.7605 (6)
c (Å) 14.399 13.6692 (9) 17.88 10.9327 (8)
α (°) 93.978 85.976 (6) 90 110.840 (6)
β (°) 105.748 84.815 (5) 92.35 90.352 (5)
γ (°) 95.854 74.344 (6) 90 99.701 (5)
Cell volume 919.03 927.34 (11) 1837.909 929.53 (11)
Density 1.285 1.292 1.304 1.289 (2)
Crystal size (mm) 0.55 x 0.50
x 0.44
0.12 x 0.13 x
0.46
0.55 × 0.30 ×
0.25
0.12 × 0.15 ×
0.34
Z 2 2 4 2
R 0.0418 0.1307 3.55 0.0653
wR2 0.105 0.1265 0.0897 0.149
Temperature (K) 193 140(2) 100 140
Goodness of fit 1.035 1.023 1.026 1.016
a obtain from reference (14), b is from reference (12) and c measured in this study

141
As the parameters suggest, the conformation of the FF molecules in forms I, IIa and III
show a close similarity. The orientation of the tail group relative to the aromatic rings is
markedly different in form IIb compared to forms I, IIa and III, and the angle between the
plane of the two aromatic rings in form III is 45.73 (9)° (Figure 4.6). The crystalline
structures of the stable from I and metastable IIa with their interactions on the crystal
packing were discussed in Chapter 3.
Figure 4.6 Overlay of molecular conformations in FF form I (black), form IIa (blue),
form IIb (red) and form III (green).
Similar to form I, the molecules of form III are linked into layers by CH…O bonds
parallel to the crystallographic (100) plane (Figure 4.7a and 4.7b). The interaction
between a hydrogen of the isopropyl group and the ketone carbonyl group of an
adjacent molecule [H…O distance: 2.56 Å; C-H…O angle: 160°] generates a chain
that is shared between forms I and III (diagonal in Figures 3.5a and 4.7a). The
aromatic hydrogen to ester carbonyl contacts of form I are replaced by another
isopropyl to ketone CH…O bond in form III. These interactions lead to remarkably
similar layers in forms I and III, however, these are not superimposable. The relative
positions of the molecules perpendicular to the plane in Figures 3.5a and 4.7a are
different in the two forms. A further shared interaction between forms I and III is
the offset π-π interaction of the chlorobenzene rings, which links pairs of layers. In
form III, this interaction is formed with an interplanar distance of 3.5719 (8) Å. The
layers are further connected through an interaction that involves a short repulsive
hydrogen–hydrogen contact (2.25 Å) between the central aromatic rings of the
inversion related molecules (Figure 4.7b). Presumably, this contact can form
because its unfavourable effect is compensated by a pair of long CH…O
interactions (2.92 Å, 162°). This set of contacts replaces the dimeric rings formed
through the CH…O (ketone) bonds in form I (Figure 3.5b), thus a clearly favourable
interaction is replaced by a strained one, which explains the low stability of form

142
III. The crystal packing of form IIb has been discussed in Chapter 3. As expected from the
different conformations, it is distinct from forms I, IIa and III (Figures 3.5, 3.8 and 4.7).
Figure 4.7 Intermolecular interactions in form III: (a) layer formed by CH…O
interactions, (b) offset π-π interactions and CH…O linked dimers that connect the layers
and (c) packing of form III.
4.3.4 Verifying epitaxial relationship of talc and FF form III
The mechanism by which talc induces the crystallisation of form III is not clear. Thus, it
was hypothesized that the FF form III crystallisation may be related to heterogeneous
nucleation on the surface of talc particles. Talc is a mineral crystal that exhibits basal
cleavage, which exposes the (001) face (15). Increasing the talc concentration in the
mixtures may have increased the chance of aggregation of talc particles, thereby reducing
the relative amount of accessible (001) talc surfaces.
Two-dimensional epitaxy has been successfully applied to control polymorphism in the
past (16). Therefore, the existence of an epitaxial relationship between talc and form III
was verified. This could explain the preferential nucleation and growth of form III in the
presence of talc. The method of Ward and co-workers was used to identify possible matches
(c)

143
with the dominant (001) face of talc (17, 18). For both forms, the best overlay on talc was
possible with their respective (100) faces (Figure 4.8). The two-dimensional lattice
parameters used for talc were a1 = 5.29 Å, a2 = 9.18 Å and α = 90.03°, while for form I they
were b1 = 8.27 Å, b2 = 14.51 Å and β = 93.95°. The optimal azimuthal angle was θ = 129.4°.
While there are overlapping lattice points, no common matching for the two-dimensional
superlattice can be identified (Figure 4.8a). In Figure 4.8b, the two-dimensional lattice
parameters used for talc were a1 = 5.29 Å, a2 = 9.18 Å and α = 90.03°, while for form III
they were b1 = 9.76 Å, b2 = 10.93 Å and β = 110.8°. The optimal azimuthal angle was found
to be θ = 69.3°. The points of the 1 x 3 form III superlattice approximately coincide with
the talc lattice, which suggests a possible epitaxial relationship between the two. The
geometrical match between the two lattices is much better in the case of form III, which
suggests that this form could preferentially nucleate on the surface of talc crystallites.
Figure 4.8 Optimal lattice overlay between (001) plane of talc (black) and (100) plane
(red) of forms I (a) and III (b). The reference unit cells are drawn with thick lines.
4.3.5 Investigation into physicochemical stability of FF form III
No change was observed in the thermal decomposition behaviour of form III in comparison
to form I, as seen in Figure 4.9. This indicates the good chemical stability of form III. It
was observed that FF form III converts to its more stable polymorphic forms I and IIa. This
polymorphic transformation can be triggered by increased temperature, crystal damage and
aging. The metastable nature of form III is obvious, as the melting of form III is followed
by immediate crystallisation of form I, as seen in Figure 4.1. MTDSC experiments on form
III revealed a hidden exothermic event on the non-reverse heat flow signal at approximately
48°C (indicated by black arrows) prior to the melting of form III, as seen in Figure 4.10.
This suggests that there is a high possibility of a polymorphic transformation occurring
before the melting point.
a b

144
Figure 4.9 TGA results of (a) FF polymorphic form I and (b) new form III.
Figure 4.10 MTDSC result of FF from III with underlying heating at 2° C/min with±
0.318°C amplitude every 60 s; (blue) total heat flow, (green) reversing heat flow and
(red) non-reversing heat flow.
To investigate the transformation prior to the melting point of FF form III, isothermal
MTDSC experiments were conducted at 35, 40 and 45°C. Small surges of reversing Cp
signals were observed at the beginning of every experiment, followed by a gradual decrease
in the reversing Cp until reaching the equilibrium state (Figure 4.11a). The reversing Cp of
the isothermal samples at 45 and 40 °C returned to their equilibrium values within 17±9
and 53±16 min, respectively. Meanwhile, the 35°C isothermal sample demonstrated a
consistently flat reversing Cp signal. These observations suggest that a polymorphic
transformation occurred during the isothermal experiments above 35°C, in which the
kinetics of the transformation were temperature dependent. To confirm the polymorphic
conversion phenomenon, the samples were examined by standard DSC after the isothermal
experiment finished (Figure 4.11b). The melting peaks of form I at 80°C and small melting
peaks of from IIa at 74°C were observed after annealing the samples at 40 and 45°C. This
confirmed that the observation of the reverse Cp changes during the isothermal MTDSC
experiments was evidence of a polymorphic transformation. A melting peak with a reduced
a b

145
enthalpy value in form III was still present for the sample annealed at 35°C, and it was
accompanied by an immediate exothermic recrystallisation and melting of from I.
Figure 4.11 (a) Isothermal MTDSC thermograms of FF form III at 45, 40 and 35°C and
(b) DSC heating of form III after the isothermal MTDSC experiments at 45, 40 and 35°C
for 2 h.
To investigate whether the DSC sample preparation (scratching crystalline samples from
the glass vial and loading into the DSC pan) had an effect on the transition, crystalline form
III was milled in a mortar and then examined using standard DSC after different time
intervals (2 and 5 h) after being milled. The melting enthalpies of form III significantly
decreased after the sample was milled and gradually declined until a complete conversion
to form I after 5 h (Figure 4.12).
Figure 4.12 DSC thermogram demonstrating stability after milling FF form III:
immediately after milling (A), 2 h after milling (B) and 5 h after milling (C).
Finally, the physical stability of the intact crystalline form III on aging was investigated.
Some small opaque spots were observed on the crystals on day one, which later completely
consumed the translucent crystals (Figure 4.13). The DSC thermogram in Figure 4.13
0.80
0.85
0.90
0.95
1.00
Rev
Cp (
J/(g
·°C
))
0 20 40 60 80 100 120
Time (min) Universal V4.5A TA Instruments
a
-12
-10
-8
-6
-4
-2
0
2
He
at
Flo
w (
W/g
)
-50 -30 -10 10 30 50 70 90 110
Temperature (°C)Exo Up Universal V4.5A TA Instruments
b
45°C
45°C40°C
35°C
35°C
40°C
-15
-10
-5
0
5
He
at
Flo
w (
W/g
)
-60 -40 -20 0 20 40 60 80 100 120
Temperature (°C)Exo Up Universal V4.5A TA Instruments
A
B
C

146
shows that the opaque crystal obtained after two days of ageing was dominated by form I
with a minor component of form IIa and a tiny amount of form III. This result further
confirmed the instability of FF form III, which thermodynamically converts to its more
stable form on ageing.
Figure 4.13 Appearance of aged FF form III under 0% RH at room temperature for
different periods of time and the corresponding DSC thermogram of the sample aged for
two days.
4.4 Discussion
With 1% talc dispersed in the amorphous FF, the new FF form III was successfully
crystallised. It has a distinct melting point at 50°C. However, the higher talc ratios resulted
in a crystalline mixture of forms I and IIa (I>>IIa). This suggests that the talc concentration
is not relevant to the polymorphic selection between forms I and IIa, but it has a unique
effect on the nucleation and growth of form III. It is possible to speculate that at talc
concentrations above 1%, the talc particles were acting as non-specific foreign solids to
induce heterogeneous nucleation of form I with a low level of nucleation of metastable
form IIa. While at the 1% concentration talc provides a monolayer surface of talc crystals,
which is favourable for nucleating the FF III polymorph. This hypothesis was confirmed
by the two-dimensional epitaxy calculations that crystalline FF form III perfectly fitted
with the unit cell dimensions on specific planes of the talc crystals. It is possible that other

147
materials apart from Talc can be used to induce the nucleation of FF. The property that
requires is a matching between the epitaxial calculation of the material surface and
crystalline surface. If this condition is satisfied, then it potentially leads to the
crystallisation of the specific polymorph, such as FF form III. The principle of epitaxial
crystalline matching induces nucleation can be potentially applied to other API to induce
their nucleation. The FF form III demonstrated characteristic fingerprints from ATR-FTIR
and PXRD. The fingerprint data are implied that the intermolecular interactions and
crystalline packing of FF III are clearly different from the other known FF polymorphs.
The depth details about FF form III molecular interactions and crystalline packing was
further investigated by SCXRD. The crystalline structure of FF form III is very similar to
the stable form I. However, the interaction of the isopropyl methyl groups and ketone
carbonyl oxygen atoms that support the proposed link between these structural motifs in
form I was replaced by a short repulsive hydrogen-hydrogen contact in form III. Hence,
the strain interaction of form III results in the instability of this polymorph which
transforms to I with ease. The polymorphic conversion of FF form III can proceed through
melt-recrystallisation can be induced by increased temperature or mechanical triggers and
occurs spontaneously on ageing. Melt-recrystallisation results in a complete conversion of
form III to form I. Annealing FF form III samples below their melting point and milling
both led to a crystalline mixture of FF forms dominated by form I with form IIa as a minor
product. The ageing of intact form III crystals leads to a mixture of forms I and IIa, in which
the amount of form IIa was greater than in samples that were subjected to annealing or
milling. On the basis of the data presented in Chapters 3 and 4, the polymorphic conversion
pathways of FF form III can be summarised as shown in Figure 4.14.
Figure 4.14 Schematic diagram depicting FF form III preparation and polymorphic
transformation pathways of metastable polymorphs to forms I and IIa.

148
4.5 Conclusion
This Chapter described a heterogeneous crystallisation method to obtain a new FF
polymorph, form III, with high purity. A low quantity (1%) of pharmaceutical grade talc
was used to induce the crystallisation of form III, which can tentatively be explained by an
epitaxial relationship between the talc and form III. The new form III was fully
characterised by microscopic, thermal, spectroscopic and structural methods. This new
form has a very low melting point of 50°C. It exhibits high thermal instability and converts
to the stable polymorphs of forms I and IIa via melt-recrystallization on heating, milling
and aging. This study also demonstrates the prospect of using safe pharmaceutical
excipients to selectively crystallise metastable polymorphs of APIs, and this can be
potentially expanded for largely scale industrial production.
4.5 References
1. Lu L, Dahle AK, StJohn DH. Heterogeneous nucleation of Mg–Al alloys. Scripta Materialia.
2006;54(12):2197-201.
2. Chadwick K, Myerson A, Trout B. Polymorphic control by heterogeneous nucleation-A new
method for selecting crystalline substrates. CrystEngComm. 2011;13(22):6625-7.
3. Boukerche M, Mangin D, Klein JP, Monnier O, Hoff C. Inducing the stable polymorph using
heterogeneous primary nucleation. Chemical Engineering Research and Design. 2010;88(11):1474-8.
4. Takenaka H, Kawashima Y, Lin SY. Polymorphism of spray-dried microencapsulated
sulfamethoxazole with cellulose acetate phthalate and colloidal silica, montmorillonite, or talc. Journal of
pharmaceutical sciences. 1981;70(11):1256-60.
5. Poornachary SK, Chow PS, Tan RBH. Influence of Solution Speciation of Impurities on
Polymorphic Nucleation in Glycine. Crystal Growth & Design. 2007;8(1):179-85.
6. Parambil JV, Poornachary SK, Tan RB, Heng JY. Template-induced polymorphic selectivity: the
effects of surface chemistry and solute concentration on carbamazepine crystallisation. CrystEngComm.
2014;16(23):4927-30.
7. Price CP, Grzesiak AL, Matzger AJ. Crystalline Polymorph Selection and Discovery with Polymer
Heteronuclei. Journal of the American Chemical Society. 2005;127(15):5512-7.
8. Lang M, Grzesiak AL, Matzger AJ. The Use of Polymer Heteronuclei for Crystalline Polymorph
Selection. Journal of the American Chemical Society. 2002;124(50):14834-5.
9. Rowe RC, Sheskey PJ, Quinn ME. Handbook of pharmaceutical excipients: Pharmaceutical press;
2009.
10. Górniak A, Wojakowska A, Karolewicz B, Pluta J. Phase diagram and dissolution studies of the
fenofibrate–acetylsalicylic acid system. Journal of thermal analysis and calorimetry. 2011;104(3):1195-200.
11. Heinz A, Gordon KC, McGoverin CM, Rades T, Strachan CJ. Understanding the solid-state forms
of fenofibrate–a spectroscopic and computational study. European Journal of Pharmaceutics and
Biopharmaceutics. 2009;71(1):100-8.
12. Balendiran GK, Rath N, Kotheimer A, Miller C, Zeller M, Rath NP. Biomolecular Chemistry of
Isopropyl Fibrates. Journal of pharmaceutical sciences. 2012;101(4):1555-69.
13. Di Martino P, Palmieri G, Martelli S. Evidence of a metastable form of fenofibrate. Die Pharmazie.
2000;55(8):625-6.
14. Henry R, Zhang G, Gao Y, Buckner I. Fenofibrate. Acta Crystallographica Section E: Structure
Reports Online. 2003;59(5):o699-o700.
15. Haubruge HG, Daussin R, Jonas AM, Legras R, Wittmann JC, Lotz B. Epitaxial Nucleation of
Poly(ethylene terephthalate) by Talc: Structure at the Lattice and Lamellar Scales. Macromolecules.
2003;36(12):4452-6.
16. Mitchell CA, Yu L, Ward MD. Selective Nucleation and Discovery of Organic Polymorphs through
Epitaxy with Single Crystal Substrates. Journal of the American Chemical Society. 2001;123(44):10830-9.
17. Rayner J. The crystal structure of talc. Clays and Clay Minerals. 1973;21:103-14.
18. Last JA, Hooks DE, Hillier AC, Ward MD. The Physicochemical Origins of Coincident Epitaxy in
Molecular Overlayers: Lattice Modeling vs Potential Energy Calculations. The Journal of Physical Chemistry B. 1999;103(32):6723-33.

149
5. Chapter 5: Fenofibrate loaded solid dispersions prepared by electrospinning and
their moisture sorption behaviour
5.1 Introduction
Electrospining can be used for producing solid dispersion formulations in which micro to
nano sized polymer fibres can be fabricated by employing electrostatic forces (1-4). Thus,
these fibres form three-dimensional porous matrices that have the great advantage of their
large surface area to volume ratio (3, 4). This high surface area to volume ratio shows an
improved dissolution of poorly water soluble drugs (5-7). The high surface area to volume
is a remarkable advantage, however, it can promote moisture uptake in electrospun fibre
formulations.
The application of polymer blends in solid dispersions demonstrates many promising
advantages, including increased physical stability of amorphous solid dispersions and
reduced moisture uptake of the formulations (8). Additionally, blending a suitable
electrospinning filament-forming agent with a poorly spinnable polymer can improve the
total spinnability of the system. Electrospinning was used as the primary means for
producing solid dispersion formulations in this chapter. The electrospun fibres were
prepared from blends of hydrophilic polymers and hydrophobic polymers. The rationale
for using a combination of the hydrophilic and hydrophobic polymers is to minimise the
moisture uptake of the electrospun formulations that would impede the amorphous drug
crystallisation. PVP-90 is a good filament forming polymer for blending with low
molecular weight polymers as it can enhance the spinnability of the blends (9). Thus, it was
selected as the hydrophilic electrospun matrix for blending with low hygroscopic polymers,
including dimethyl- aminoethyl methacrylate (Eudragit E), polyvinyl caprolactam -
polyvinyl acetate - polyethene glycol graft copolymer (Soluplus) and hypromellose acetate
succinate (HPMCAS). Two drugs were used in this Chapter: FF and PCM, with FF being
a poorly water-soluble drug. In Chapters 3 and 4 the crystallisation behaviour of FF was
discussed. It is a challenging drug that demonstrates a high possibility of recrystallisation
in a solid dispersion matrix (10). PCM is another drug that has demonstrated hydrogen
bonding with PVP (11, 12). Hydrogen bonding between the drug and polymer is an
essential parameter that enhances the miscibility of the drug and polymer and also prevents
the drug from recrystallisation under a stressed environment (13). PCM-PVP-HPMCAS
fibres were used for a comparison to the FF solid dispersions to study the effect of hydrogen
bonding on the physical stability of the electrospun fibres under a high humidity
environment.
The moisture uptake in a solid dispersion leads to phase separation and amorphous drug
crystallisation (14, 15). This irreversible change in solid dispersion formulations

150
significantly reduces the dissolution of the solid dispersion formulation (16). The influence
of moisture uptake on the stability of the solid dispersion formulations prepared from hot-
melt extrusion and co-evaporation has been studied (17, 18). However, little is known about
the moisture sorption of electrospun fibre solid dispersions. The presence of moisture may
lead to fibrous structure deformation, drug-polymer phase separation and provoke
amorphous drug crystallisation. These events are expected to occur faster than with other
solid dispersion formulations that are prepared by hot melt extrusion and co-evaporation
because of the larger surface area to volume ratio of electrospun fibres.
This chapter aims to develop polymer blended electrospun fibrous formulations that
potentially stabilise the drugs in their amorphous state and enhance the dissolution of FF.
Secondly, we also studied the influence of moisture sorption on the miscibility of the
polymer-polymer and drug-polymer in the electrospun fibrous films. The chapter renders a
fundamental understanding of the moisture uptake kinetics in electrospun fibres along with
an in-depth investigation of the phase separation and drug recrystallization on the
electrospun fibres.
5.2 Methodology
5.2.1 Stock solution preparation
There are two types of stock solution used in this chapter: placebo and drug loaded stock
solutions. The placebo solutions were prepared by dissolving 10 % w/v of the polymer
blends at a ratio of 1:1 of PVP with Eudragit, HPMCAS or Soluplus in 7:3 ethanol:DCM.
Then, the solutions were stirred until all of the components were dissolved. The solid-state
drug content was fixed at 25%. The drug was added into single (PVP, HPMCAS, Eudragit
Eand Soluplus) solutions or polymer blended solutions (ratio of 1:1 of PVP:HPMCAS,
PVP:Eudragit E and PVP:Soluplus) in 7:3 ethanol:DCM solvent. These were stirred until
clear solutions were obtained.
5.2.2 Sample preparation
In this chapter, two types of polymer films were prepared, which were cast films and
electrospun fibrous films. In the cast films, 1 ml of the stock solution was applied to a
Teflon plate and a casting knife with a 50 µm gap was used to obtain a smooth flat cast
film. Then, the films were left in a fume hood for 24 h to allow the organic solvent to
evaporate. On the other hand, a custom-made electrospinning apparatus was used to prepare
the electrospun fibres. The stock solution was filled into a plastic syringe that was equipped
with a syringe pump (Cole-Parmer, UK). The feed rate was set at 1.5 ml.hr-1 by applying a
voltage of 15 kV from an ES40P-20W high voltage power supply (Gamma High Voltage

151
Research Inc., Ormond Beach, FL, USA). The drum collector was used to collect the
electrospun fibres at 500 RPM. The distance between the spinnerette and the collector was
fixed at 15 cm. The electrospinning was conducted under ambient humidity at room
temperature (temperature 24°C and 45-55% RH). All electrospun samples were stored in a
0% RH desiccator filled with phosphorus pentaoxide.
5.2.3 Characterisation methods
In this chapter, a range of characterisation techniques was employed to characterise the
ternary blended formulation, including MTDSC, ATR-FTIR, FT-IR microscopy, PXRD
and SEM. The experimental methods of MTDSC, ATR-FTIR, PXRD and SEM are referred
to in Chapter 2 in sections 2.4.2.2, 2.4.5.2, 2.4.7.4 and 2.4.8.2, respectively.
5.2.4 Moisture sorption and kinetic model study
DVS was used to perform the sorption isotherm and isohume experiments of the
electrospun fibres and cast films. For the experimental method of DVS refer to section
2.4.4.2. Then, the kinetic sorption data were fitted to the mathematical models described in
Chapter 2 section 2.7.2, including GAB, Peleg and DE models. The data fitting were
performed by TableCurve 2D version 5.01 (Systat Software Inc., Chicago, USA)
5.2.5 In vitro drug release study
All in vitro drug release experiments were performed according to the method described in
section 2.6.1.2. A 50 rpm paddle rotation speed and 500 ml of British Pharmacopoeia HCl
dissolution medium (pH 1.2) with 0.5% sodium lauryl sulphate were used for each vessel
and the temperature of the vessel was controlled at 37±0.5 °C. Pieces of the electrospun
fibre mats that contain the equivalent of 10 mg FF (calculated by weight) were used for the
release tests to ensure sink conditions. The media (5 ml) from each vessel were sampled at
predetermined time intervals, filtered through 0.45 µm filters (Minisart Sartorius,
Goettingen, Germany) and then diluted with 5 ml of ethanol. As all dissolution tests were
performed under sink conditions, no recrystallization of the model drug as nanocrystals
was expected after release from the formulation; therefore, the filtration method for treating
the dissolution samples was appropriate. The FF content in each sample was measured by
a UV spectrometer (Perkin-Elmer Lamda XLS, USA) at 290 nm. All measurements were
performed in triplicate.
5.2.6 Solubility parameter estimation
The Fedor’s group contribution method was used to estimate the solubility parameter of
the drug and polymers in this study (19). This approach relies on additive atomic and group
contributions of vapourisation energy at a given temperature. Further details of the theory
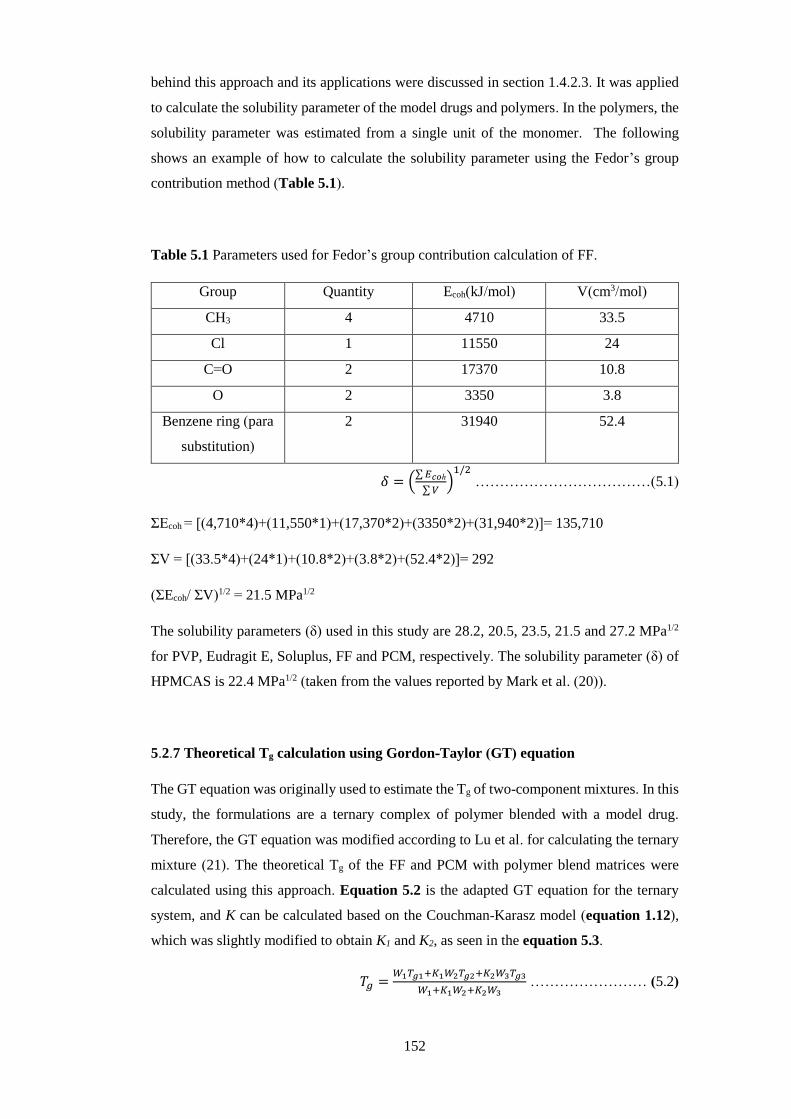
152
behind this approach and its applications were discussed in section 1.4.2.3. It was applied
to calculate the solubility parameter of the model drugs and polymers. In the polymers, the
solubility parameter was estimated from a single unit of the monomer. The following
shows an example of how to calculate the solubility parameter using the Fedor’s group
contribution method (Table 5.1).
Table 5.1 Parameters used for Fedor’s group contribution calculation of FF.
Group Quantity Ecoh(kJ/mol) V(cm3/mol)
CH3 4 4710 33.5
Cl 1 11550 24
C=O 2 17370 10.8
O 2 3350 3.8
Benzene ring (para
substitution)
2 31940
52.4
𝛿 = (∑ 𝐸𝑐𝑜ℎ
∑ 𝑉)
1/2 ………………………………(5.1)
ΣEcoh = [(4,710*4)+(11,550*1)+(17,370*2)+(3350*2)+(31,940*2)]= 135,710
ΣV = [(33.5*4)+(24*1)+(10.8*2)+(3.8*2)+(52.4*2)]= 292
(ΣEcoh/ ΣV)1/2 = 21.5 MPa1/2
The solubility parameters (δ) used in this study are 28.2, 20.5, 23.5, 21.5 and 27.2 MPa1/2
for PVP, Eudragit E, Soluplus, FF and PCM, respectively. The solubility parameter (δ) of
HPMCAS is 22.4 MPa1/2 (taken from the values reported by Mark et al. (20)).
5.2.7 Theoretical Tg calculation using Gordon-Taylor (GT) equation
The GT equation was originally used to estimate the Tg of two-component mixtures. In this
study, the formulations are a ternary complex of polymer blended with a model drug.
Therefore, the GT equation was modified according to Lu et al. for calculating the ternary
mixture (21). The theoretical Tg of the FF and PCM with polymer blend matrices were
calculated using this approach. Equation 5.2 is the adapted GT equation for the ternary
system, and K can be calculated based on the Couchman-Karasz model (equation 1.12),
which was slightly modified to obtain K1 and K2, as seen in the equation 5.3.
𝑇𝑔 =𝑊1𝑇𝑔1+𝐾1𝑊2𝑇𝑔2+𝐾2𝑊3𝑇𝑔3
𝑊1+𝐾1𝑊2+𝐾2𝑊3 …………………… (5.2)

153
𝐾1 ≈∆𝐶𝑝2
∆𝐶𝑝1 𝑎𝑛𝑑 𝐾2 ≈
∆𝐶𝑝3
∆𝐶𝑝1 …………..…………….. (5.3)
Where W1, W2 and W3 are the weight fractions of FF or PCM, PVP and HPMCAS, Soluplus
or Eudragit; Tg1, Tg2 and Tg3 are the glass transition temperatures of FF or PCM, PVP and
HPMCAS, Soluplus or Eudragit; and ΔCp1, ΔCp2 and ΔCp3 are the heat capacity changes of
FF or PCM, PVP and HPMCAS, Soluplus or Eudragit. The theoretical glass transition
temperatures of the ternary blends are reported in Table 5.3.
5.2.8 Physical stability study
The stabilities of the FF loaded electrospun fibres were monitored for six months. The
fibres were stored at 0%RH in a desiccator filled with phosphorus pentaoxide. Their
stabilities were monitored using MTDSC to detect the FF recrystallization. The MTDSC
experimental parameters are described in detail in section 2.4.2.2.
5.3 Results
5.3.1 Physical characterisation of placebo and FF loaded electrospun fibres and cast
films
Fresh placebo
The electrospun fibres of HPMCAS, Eudragit E and Solulpus could not be prepared
because the concentration of these polymers used in this study (10% w/v) was not suitable
to fabricate electrospun fibres (Figure 5.1). Eudragit E and Solulpus form microparticles,
which have a size less than approximately 5 µm (Figure 5.1 a and c). HPMCAS forms
beaded fibres that are very fragile and cannot be used as fibrous films (Figure 5.1b). PVP
is the most suitable polymer for electrospinning as it fabricates a smooth fibrous structure
at concentrations of 5% w/v (Figure 5.1d). The average diameter of PVP prepared from
solution concentrations of 5 and 10% w/v were 0.50±0.17 and 0.75±0.24 µm, respectively.
Blending HPMCAS, Eudragit E or Solulpus with PVP at the ratio of 1:1 enhances the
spinnability of HPMCAS, Eudragit E and Soluplus. The electrospun fibres illustrate a
random direction arrangement of smooth cylindrical fibres. The placebo electrospun fibres
showed average diameters of 1.29±0.41, 0.82±0.22 and 1.07±0.25 µm for PVP-HPMCAS,
PVP-Eudragit E and PVP-Soluplus fibres, respectively (Figure 5.1f-h).
The SEM images shown in Figure 5.2 reveal the surfaces of the placebo cast films, which
are largely flat and smooth. The polymer blended cast films of PVP-HPMCAS and PVP-

154
Soluplus also demonstrate smooth PVP films. Only PVP-Eudragit E cast films show rough
surfaces with hemispherical island features.
Figure 5.1 SEM images of single polymer and polymer blend (ratio 1:1) electrospun
(a)10% w/v Eudragit, (b) 10% w/v HPMCAS, (c)10% w/v Soluplus, (d) 5% w/v PVP,
(e)10% w/v PVP, (f) 10% w/v PVP-HPMCAS, (g) 10% w/v PVP-Eudragit E and (h)10%
w/v PVP-Soluplus.
a
c
b
c d
e f
g h
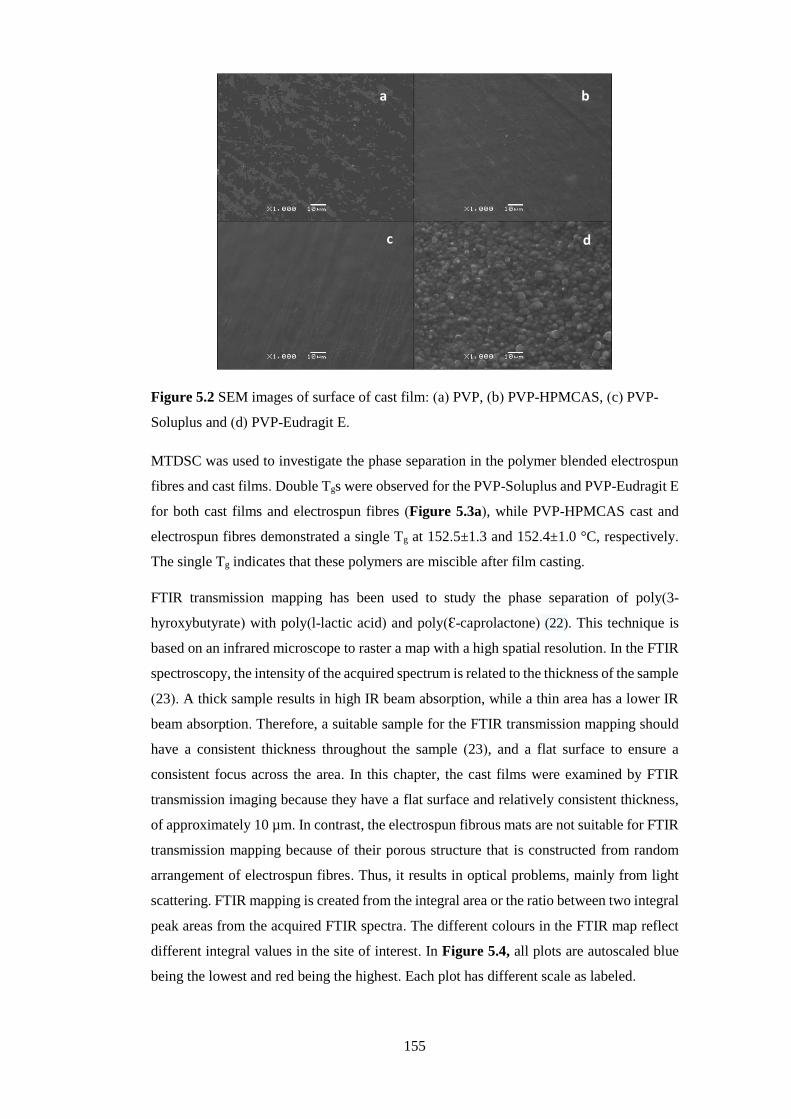
155
Figure 5.2 SEM images of surface of cast film: (a) PVP, (b) PVP-HPMCAS, (c) PVP-
Soluplus and (d) PVP-Eudragit E.
MTDSC was used to investigate the phase separation in the polymer blended electrospun
fibres and cast films. Double Tgs were observed for the PVP-Soluplus and PVP-Eudragit E
for both cast films and electrospun fibres (Figure 5.3a), while PVP-HPMCAS cast and
electrospun fibres demonstrated a single Tg at 152.5±1.3 and 152.4±1.0 °C, respectively.
The single Tg indicates that these polymers are miscible after film casting.
FTIR transmission mapping has been used to study the phase separation of poly(3-
hyroxybutyrate) with poly(l-lactic acid) and poly(Ɛ-caprolactone) (22). This technique is
based on an infrared microscope to raster a map with a high spatial resolution. In the FTIR
spectroscopy, the intensity of the acquired spectrum is related to the thickness of the sample
(23). A thick sample results in high IR beam absorption, while a thin area has a lower IR
beam absorption. Therefore, a suitable sample for the FTIR transmission mapping should
have a consistent thickness throughout the sample (23), and a flat surface to ensure a
consistent focus across the area. In this chapter, the cast films were examined by FTIR
transmission imaging because they have a flat surface and relatively consistent thickness,
of approximately 10 µm. In contrast, the electrospun fibrous mats are not suitable for FTIR
transmission mapping because of their porous structure that is constructed from random
arrangement of electrospun fibres. Thus, it results in optical problems, mainly from light
scattering. FTIR mapping is created from the integral area or the ratio between two integral
peak areas from the acquired FTIR spectra. The different colours in the FTIR map reflect
different integral values in the site of interest. In Figure 5.4, all plots are autoscaled blue
being the lowest and red being the highest. Each plot has different scale as labeled.
a
dc
b

156
Figure 5.3 MTDSC results of placebo and FF loaded cast films and electrospun fibres:
(a) placebo blends, (b) single polymer with FF loading and (c) polymer blends with FF
loading.
c
b
0.0
0.5
1.0
1.5
2.0
2.5
3.0
Rev
Cp
(J/(
g·°C
))
10 60 110 160
Temperature (°C) Universal V4.5A TA Instruments
152.5±1.3°C
174.5±1.8°C47.1±0.6°C
177.7±2.1°C
76.8.5±3.1°C
152.4±1.0°C
175.7±0.9°C48.6±1.8°C
81.5±0.9°C
175.3±2.4°C
PVP-HPMCAS cast films
PVP-Soluplus cast films
PVP-Eudragir fibres
PVP-Eudragit cast films
PVP-HPMCAS fibres
PVP-Soluplus fibres
a
-0.08
-0.06
-0.04
-0.02
0.00
0.02
0.04
0.06
Rev
Hea
t Flo
w (W
/g)
-30 20 70 120 170
Temperature (°C)Exo Up Universal V4.5A TA Instruments
FF-PVP cast films
FF-Soluplus cast films
FF-Eudragit cast films
FF-HPMCAS cast films
FF-PVP fibres
4.2±0.9°C
21.2±0.7°C
-0.12
-0.10
-0.08
-0.06
-0.04
-0.02
0.00
0.02
Rev
Hea
t Flo
w (W
/g)
-50 0 50 100 150 200
Temperature (°C)Exo Up Universal V4.5A TA Instruments
FF-PVP-HPMCAS cast films
FF-PVP-Eudragitcast films
FF-PVP-Soluplus cast films
FF-PVP-HPMCAS fibres
FF-PVP-Eudragit fibres
FF-PVP-Soluplus fibres
FF-PVP-HPMCAS cast filmsTransparent
-2.6±1.8°C
-2.6±1.8°C
14.5±0.8°C
119.7±2.6°C
118.2±6.0°C
-5.8±1.5°C

157
The phase separations of the PVP-HPMCAS, PVP-Eudragit E and PVP-Soluplus were
studied using FTIR transmission mapping. Theoretically, a characteristic peak of each
polymer is need to construct the FTIR image. A wavenumber in the range between 2000 to
1500 cm-1 cannot used to construct the map because of the inconsistent integral values from
the signal overshoot (intensity is much greater than one absorption unit). At an absorbance
greater than one, the relationship between the substance concentration and absorbance is
not linear. The signal overshoot in strong bands is due to the errors of the instrument data
processing when the observed light transmission approaches zero. At 1500 to 600 cm-1,
there are too many overlapping peaks for these polymers, which are difficult to assign
clearly to one component and not suitable to construct a chemical map. Although this is not
ideal, the ratio of the absorption of the methyl stretching of the polymers at 2910 cm-1
(integral range 3000 to 2800 cm-1) and OH stretching at 3450 cm-1 (integral range 3700 to
3100 cm-1) is used to construct an FTIR image. The area that shows a low ratio of methyl
stretching/OH stretching integral peaks represents a PVP rich region. This is due to PVP
attracting water molecules more than the HPMCAS, Eudragit E and Soluplus. The PVP-
Eudragit E and PVP-HPMCAS FTIR mapping demonstrate similar spectra through the
mapping area . The variation across the area is actually very small scale. Thus, the observed
colour changes show essentially the experimental error during the mapping. This indicates
a homogeneous dispersion of the polymer blends or a phase separation domain that is
smaller than the spatial resolution of the FTIR mapping (25µm) (Figure 5.4 a and b). In
Figure 5.4 c, two distinguished domains are clearly observed in the PVP-Soluplus cast
films. The blue and green colours reflect the higher PVP content in comparison to the red
area, and the phase separation of the PVP-Soluplus cast films can be seen as circular
domains with sizes of approximately 50 to 100 µm.

158
Figure 5.4 Phase separation detected by FTIR transmission microscopy in the placebo
blended cast ilms; (a) PVP-Eudragit E cast films, (b) PVP-HPMCAS cast films, (c) PVP-
Soluplus cast films. The left panel shows a FTIR transmission map calculated from (a-c)
in which the ratio of the integral peak area of the methyl stretching/OH stretching. The righ
a
b
c

159
panel demonstrates a visible image of the area of the map and the bottom panel is the
representative FTIR spectra that was used to construct the FTIR mapping
Fresh FF loaded solid dispersions
The FF-HPMCAS, FF-Eudragit E and FF-Soluplus were prepared only as cast films
because these polymers are not spinnable, as discussed earlier. FF-PVP was produced as
both cast films and electrospun fibres. Electrospinning and film casting were used to
prepare the ternary drug-polymer blends. The paracetamol loaded PVP-HPMCAS (PCM-
PVP-HPMCAS) was prepared only by electrospinning for comparing the moisture sorption
and physical stability at 75% RH to the FF loaded polymer blended solid dispersions. ATR-
FTIR was used to study the interaction between the FF and the polymers. As seen in Figure
5.5, neither the polymer peaks nor drug peaks demonstrated any shift from their original
positions. This implies that FF does not show any strong interaction with PVP, HPMCAS,
Eudragit E and Soluplus. It should be noted that the O1-C7 carbonyl stretching (1655 cm-1)
of FF was absent in the FF-Soluplus cast films. However, other peaks showed no shift. It
is possible that the FF carbonyl peak merged with a broad carbonyl peak in the caprolactam
group of Soluplus at 1625 cm-1.
Figure 5.5 ATR-FTIR of raw materials and cast films of FF-polymer: (a) PVP, (b) FF-
PVP, (c) HPMCAS, (d) FF-HPMCAS, (e) Eudragit, (f) FF-Eudragit, (g) Soluplus, (h) FF-
Soluplus and (i) amorphous FF.
F:\FTIR back up\Second year Electrospinning project\Raw materials\Dry PVP K 90.1 Dry PVP K 90 F:\FTIR back up\Second year Electrospinning project\Raw materials\HPMCAS LG.0 20130430 HPMCAS LG powder F:\FTIR back up\Second year Electrospinning project\Raw materials\20131011 Eudragit EPO.0 20131011 Eudragit EPO SOILD F:\FTIR back up\Soluplus raw materail.0 Soluplus raw materail Patch D:\Data\Champ\20151219 FF EPO cast side 1.0 FF EPO cast side 1 DLaTGS, KBr-BMS, Globar, IFS 66 D:\Data\Champ\20151219 FF SP cast side 2.0 FF SP cast side 2 DLaTGS, KBr-BMS, Globar, IFS 66 D:\Data\Champ\20160510 FF PVP cast films side 1.1 Fenofibrate form I D:\Data\Champ\20151219 FF HPMCAS cast side 2.0 FF HPMCAS cast side 2 DLaTGS, KBr-BMS, Globar, IFS 66 F:\FTIR back up\Second year Electrospinning project\Raw materials\Fenofibrate amor quencing.0 20131205 FF amor quencing DLaTGS, KBr-BMS, Globar, IFS 66
17/01/201430/04/201311/10/201330/01/201619/12/201519/12/201510/05/201619/12/2015
800100012001400160018002000
Wavenumber cm-1
0.0
0.1
0.2
0.3
0.4
0.5
0.6
0.7
Abs
orba
nce
Uni
ts
Page 1/1
a
b
c
d
e
f
g
h
i

160
In Figure 5.3b, the melting enndotherms of FF at 80°C indicate that form I were seen in
the electrospun fibres and cast films of FF-PVP, but no Tg was observed. It should be noted
that FF-PVP cast films demonstrate higher melting enthalpies than the electrospun fibres.
The melting enthalpy values of these samples are summarised in Table 5.2. This result
implies that the electrospinning can minimise FF crystallisation in the FF-PVP dispersions
in the fresh samples. The FF-HPMCAS also showed a small melting enthalpy of FF at
80°C, and its Tg can be observed at 54.3 ±1.3°C. The melting enthalpies reflect a partial
miscibility between the drug and the polymers. The majority of the FF molecules are in the
amorphous state while some of the drug recrystallized in the dispersions. The FF-Eudragit
E and FF-Soluplus cast films demonstrate a single Tg without melting at 4.2±0.9°C and
21.2±0.7°C, respectively (Figure 5.3b). The physical appearance of the FF-Eudragit E and
FF-Soluplus cast films were transparent and viscid due to their Tgs being slightly lower
than room temperature. As seen in Figure 5.6, the experimental Tgs of the FF-HPMCAS,
FF-Eudragit E and FF-Soluplus cast films are lower than the Tgs that are calculated from
the GT equation (equation 5.2). In the literature, such a negative deviation from the GT
theoretical calculation has been interpreted as the interaction between the drug-drug and
the polymer-polymer being stronger than the drug-polymer interaction in these binary
systems (24).
Figure 5.6 Differences between Tgs as predicted by GT equation and experimental
observation.
For the drug loaded polymer blend cast films, double Tgs were detected in the FF-PVP-
Eudragit E and FF-PVP-Soluplus cast films. The Tgs of the FF-PVP-Eudragit E cast films
were at -5.8±1.5 and 119.0±6.0°C, and the Tgs of the FF-PVP-Soluplus cast films were at
13.5±0.8 and 119.7±2.62 °C, respectively. A double Tg is an indication of a phase
separation in the polymer blends and also indicates an uneven FF distribution among the
two phases. A poor reproducibility was observed in the MTDSC results of the FF-PVP-
Soluplus cast film. One of the three replicates of the FF-PVP-Soluplus cast film showed a
0
20
40
60
80
100
120
FF PVP FF HPMCAS FF Eudragit E FF Soluplus
Ob
serv
ed T
g
drug-polymer binary dispersions
GT prediction Experiments
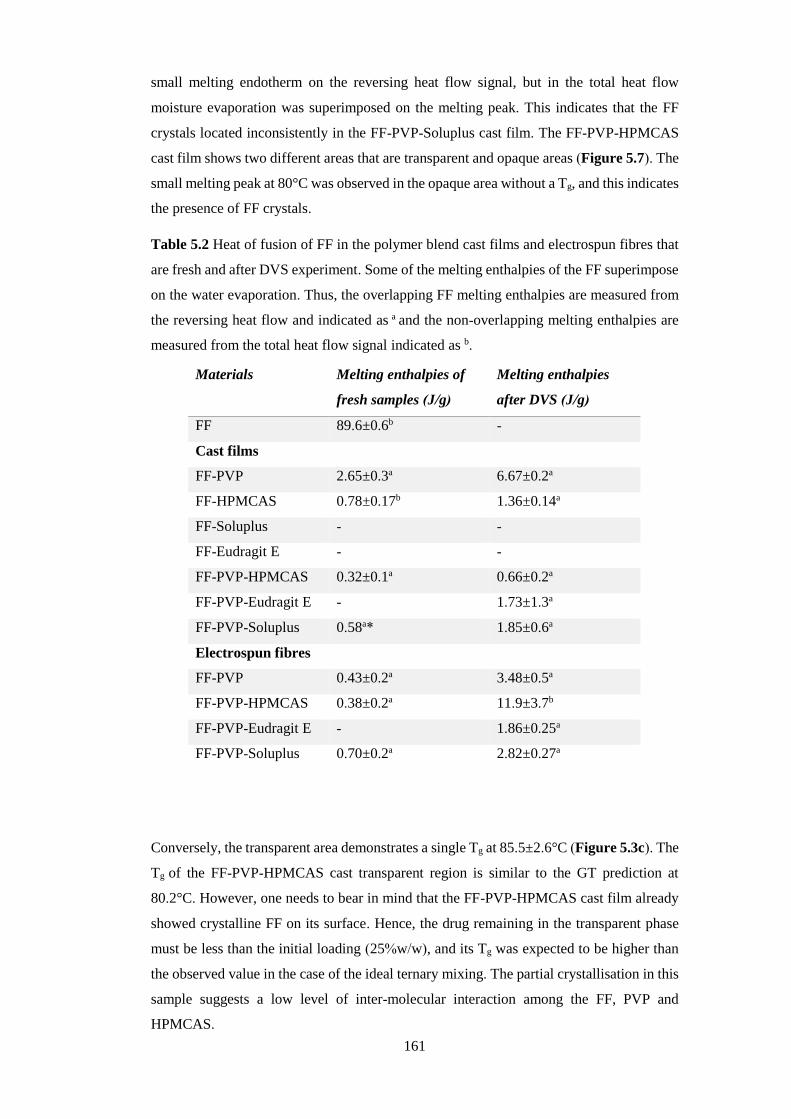
161
small melting endotherm on the reversing heat flow signal, but in the total heat flow
moisture evaporation was superimposed on the melting peak. This indicates that the FF
crystals located inconsistently in the FF-PVP-Soluplus cast film. The FF-PVP-HPMCAS
cast film shows two different areas that are transparent and opaque areas (Figure 5.7). The
small melting peak at 80°C was observed in the opaque area without a Tg, and this indicates
the presence of FF crystals.
Table 5.2 Heat of fusion of FF in the polymer blend cast films and electrospun fibres that
are fresh and after DVS experiment. Some of the melting enthalpies of the FF superimpose
on the water evaporation. Thus, the overlapping FF melting enthalpies are measured from
the reversing heat flow and indicated as a and the non-overlapping melting enthalpies are
measured from the total heat flow signal indicated as b.
Conversely, the transparent area demonstrates a single Tg at 85.5±2.6°C (Figure 5.3c). The
Tg of the FF-PVP-HPMCAS cast transparent region is similar to the GT prediction at
80.2°C. However, one needs to bear in mind that the FF-PVP-HPMCAS cast film already
showed crystalline FF on its surface. Hence, the drug remaining in the transparent phase
must be less than the initial loading (25%w/w), and its Tg was expected to be higher than
the observed value in the case of the ideal ternary mixing. The partial crystallisation in this
sample suggests a low level of inter-molecular interaction among the FF, PVP and
HPMCAS.
Materials Melting enthalpies of
fresh samples (J/g)
Melting enthalpies
after DVS (J/g)
FF 89.6±0.6b -
Cast films
FF-PVP 2.65±0.3a 6.67±0.2a
FF-HPMCAS 0.78±0.17b 1.36±0.14a
FF-Soluplus - -
FF-Eudragit E - -
FF-PVP-HPMCAS 0.32±0.1a 0.66±0.2a
FF-PVP-Eudragit E - 1.73±1.3a
FF-PVP-Soluplus 0.58a* 1.85±0.6a
Electrospun fibres
FF-PVP 0.43±0.2a 3.48±0.5a
FF-PVP-HPMCAS 0.38±0.2a 11.9±3.7b
FF-PVP-Eudragit E - 1.86±0.25a
FF-PVP-Soluplus 0.70±0.2a 2.82±0.27a

162
Figure 5.7 Polymer blended cast films with FF loading: (a) FF-PVP-HPMCAS, (b) FF-
PVP-Eudragit E and (c) FF-PVP-Soluplus cast films. The FF PVP-HPMCAS films show
different transparent and opaque areas. The opaque area has crystallised FF on the surface
of the cast films, whereas the FF-PVP-Eudragit E and FF-PVP-Soluplus cast films
demonstrate transparent areas.
No Tg was observed in the FF-PVP-HPMCAS and FF-PVP-Soluplus electrospun fibres,
but small melting enthalpies of the FF crystals were detected (Figure 5.3c). The difficulty
in finding the Tg of the FF-PVP-HPMCAS and FF-PVP-Soluplus electrospun fibres may
be due to the combination of weak Tg and the fibrous samples not being flat and not being
able to establish good contacts with the bottom of the DSC pan. The FF-PVP-Eudragit E
fibres show a single Tg at -2.6±1.8°C. This Tg is similar to the lower Tg of the double Tg of
the FF-PVP-Eudragit E cast films.
SEM images revealed that the FF-Eudragit E and FF-Soluplus cast films have smooth
surfaces; whereas, some drug crystals can be observed at the surface of the FF-PVP and
FF-HPMCAS cast films. These results were confirmed by the drug melting observed in the
MTDSC results of these samples (Figure 5.3b). In the drug-loaded blended cast films,
some densely packed crystals were present on the surfaces of the FF-PVP-HPMCAS films
and isolated large crystals were observed on the surface of the FF-PVP-Soluplus films;
whereas, no FF crystal was observed on the surface of the FF-PVP-Eudragit E films
(Figure 5.8). These findings also agree with the previous MTDSC results indicating that
FF is partially miscible with PVP and HPMCAS. The FF-PVP fibres show an average fibre
diameter of 0.51±0.02 µm. The diameters of the FF loaded polymer blend electrospun
fibres are 0.77±0.17 µm, 1.03±0.39 µm and 0.77±0.16 µm for the FF-PVP-Eudragit, FF-
PVP-HPMCAS and FF-PVP-Soluplus, respectively. The PCM-PVP-HPMCAS
electrospun fibres show an average fibre diameter of 0.75±0.2 µm (Figure 5.8). There is
no significant difference between the average diameter of the placebo and drug loaded
fibres.
(a) (c)(b)

163
Table 5. 3 Comparison of experimental and theoretical Tgs of all formulations predicted
using GT equation. *Tg of FF-PVP-HPMCAS cast film was measured from its
transparent area.
Material Tg 1 (°C) Tg 2 (°C) GT predicted
Tg (°C)
FF -20±0.5 - -
PVP 176.4±2.0 - -
HPMCAS 122.0±2.2 - -
Soluplus 77.0±0.8 - -
Eudragit E 55.8±0.5 - -
Cast films
FF-PVP - - 95.7
FF-HPMCAS 54.3±1.5 - 65.4
FF-Soluplus 21.2±0.7 - 36.5
FF-Eudragit E 4.2±0.9 - 21.2
FF-PVP-
HPMCAS*
85.5±2.6 - 80.2
FF-PVP-
Eudragi Et
-5.8±1.5 119.0±6.0 60.0
FF-PVP-
Soluplus
13.50±0.8 119.7±2.62 66.0
Electrospun
fibres
FF-PVP - - 95.7
FF-PVP-
HPMCAS
- - 80.2
FF-PVP-
Eudragit E
-2.6±1.8 - 60.0
FF-PVP-
Soluplus
- - 66.0

164
Figure 5.8 SEM images of freshly prepared placebo and drug-loaded electrospun fibres
as well as freshly prepared placebo and FF loaded cast films
FTIR transmission mapping was used to study the drug loaded cast films. This was based
on the distribution of the integral peak area of the =CH-H stretching at 3070 and 3054 cm-
1 with a selected baseline from 3100 to 3020 cm-1; these are characteristic peaks of the
crystalline FF form I. The rationale of selecting this region was because it is neither
overlapping with the polymer peaks nor the overshooting signal. In Figure 5.9c, the FTIR
transmission mapping shows the FF crystals on the FF-PVP-HPMCAS cast film. This
result agrees with its optical microscopic image in which the FF crystals were observed on
the surface. However, from the low peak intensity of the FF form I, it is possible to deduce
that the FF crystals were only located on the surface of the films. The big circular spots
observed in both the FTIR mapping and optical image were FF crystals that recrystallized
on the surface of the FF-PVP-HPMCAS cast films. This result indicates the co-existence
of amorphous and crystalline FF in the FF-PVP-HPMCAS cast films. Additionally, the
FTIR microscopic mapping of the FF-PVP-Soluplus cast film shows a suspect area
indicated by the red spot that may be FF crystals and green lines may be surface defects
that FF could also accumulate, as seen in Figure 5.9d. From the microscopic images, it is
FF-PVP Fibres
FF-PVP-Eudragit E Fibres
FF-PVP-HPMCAS FibresFF-PVP Soluplus Fibres
PCM-PVP-HPMCAS Fibres
FF-PVP
FF-PVP-Eudragit E FF-PVP-Soluplus
FF-Eudragit E FF-HPMCAS
FF-Soluplus
FF-PVP-HPMCAS

165
likely to be a single crystal of FF that is located on the surface of the FF-PVP-Soluplus cast
films. The FF-PVP-Eudragit E and FF-PVP showed that the drug was in an amorphous
phase throughout the bulk of these cast films, because the scale of the variation across the
map was consistently small, which showed only experimental variability. The smooth
image could also mean that the crystalline FF size was smaller than the resolution of the IR
mapping (25µm per pixel), as seen in Figure 5.9 a and b.
To investigate the drug crystallisation of the surfaces of the cast films, ATR-FTIR was used
to examine both sides of the FF loaded cast films. In this study, we used a single reflection
and the ATR crystal was made from a diamond with the angle of incidence of 45°. The
estimated penetration depth of the evanescent IR waves were approximately 0.5-2 µm (25).
Figure 5.10 shows that the crystalline FF form I characteristic peaks (3070 and 3054 cm-
1) are observed on at least one side of the FF-PVP and FF PVP-HPMCAS, whereas they
are absent in the FF-PVP-Eudragit E and FF-PVP-Soluplus films. This is an indication of
FF crystal growth occurring on the surface of the FF-PVP and FF-PVP-HPMCAS cast
films.
In the FF loaded electrospun fibres, no peaks indicative of crystalline FF were present in
the ATR-FTIR spectra as seen in Figure 5.11. However, small melting endotherms were
observed in the FF-PVP and FF-PVP-HPMCAS fibres, as seen in Figure 5.3c. The lack of
IR indicative peak is likely caused by a combination of the sample containing a low amount
of FF crystals and the porous structure of the fibrous mats that may reduce the penetration
depth of the beam (25,26), thus it cannot detect the crystal located in the interior of the
fibrous mats.

166
Figure 5.9 Phase separation detected by FTIR transmission microscopy in FF loaded cast films (a) FF-PVP cast films, (b) FF-PVP-Eudragit E cast films, (c) FF-PVP-
HPMCAS cast films and (d) FF-PVP-Soluplus cast films. The left panel shows a FTIR transmission map calculated from the integral of the =CH-H stretching at 3070
and 3054 cm-1 are the characteristic peaks of FF form I. The righ panel demonstrates a visible image of the area of the map and the bottom panel is the representative
FTIR spectra that was used to construct the FTIR mapping.
a b
dc

167
Figure 5.10 ATR-FTIR spectra of FF-PVP, FF-PVP HPMCAS, FF-PVP-Eudragit E and
FF-PVP Soluplus cast films for both top and bottom sides of the films.
Figure 5.11 ATR-FTIR spectra of FF loaded polymer blend fibrous film: (a) FF-PVP, (b)
FF-PVP-Soluplus, (c) FF-PVP-Eudragit E, (d) FF-PVP-HPMCAS and (e) amorphous FF.
These spectra demonstrate that the FF in the polymer blended fibrous mats is in the
amorphous state because of the absence of the FF crystalline marker peaks at 3070 and
3054 cm-1.
C:\Documents and Settings\HPLC-2\My Documents\Champ\FTIR back up\Raw data\20140312 25% FF PVP 1 month.0 20140312 25% FF PVP 1 month C:\Documents and Settings\HPLC-2\My Documents\Champ\FTIR back up\Raw data\20141014 25% FF PVP solupus fresh.0 20141014 25% FF PVP solupus fresh Patch C:\Documents and Settings\HPLC-2\My Documents\Champ\FTIR back up\Raw data\20140915 25% FF PVP HPMCAS 11 ES 1 m 0%RH.0 20140915 25% FF PVP/HPMCAS ES 1 m 0%RH Powder C:\Documents and Settings\HPLC-2\My Documents\Champ\FTIR back up\Second year Electrospinning project\Raw materials\Fenofibrate amor quencing.0 20131205 FF amor quencing DLaTGS, KBr-BMS, Globar, IFS 66 C:\Documents and Settings\HPLC-2\My Documents\Champ\FTIR back up\Raw data\20141113 25% FF PVP EPO fresh.0 20141113 25% FF PVP/EPO fresh Patch C:\Documents and Settings\HPLC-2\My Documents\Champ\FTIR back up\Second year Electrospinning project\Fenofibrate form II\Fenofibrate form I 20130130 Fenofibrate heat 10C-min 20130130
12/03/201414/10/201415/09/2014
13/11/201430/01/2013
285029002950300030503100
Wavenumber cm-1
0.8
50.9
00.9
51.0
0
Absorb
ance U
nits
Page 1/1
a
e
d
c
b
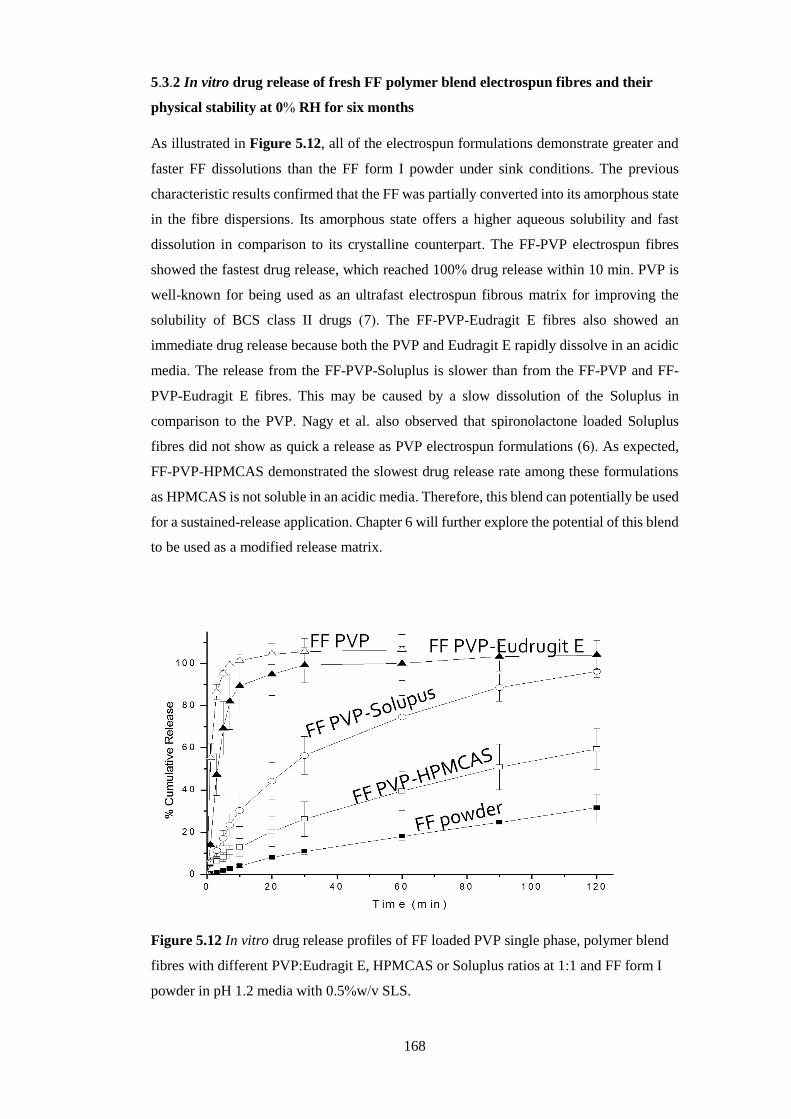
168
5.3.2 In vitro drug release of fresh FF polymer blend electrospun fibres and their
physical stability at 0% RH for six months
As illustrated in Figure 5.12, all of the electrospun formulations demonstrate greater and
faster FF dissolutions than the FF form I powder under sink conditions. The previous
characteristic results confirmed that the FF was partially converted into its amorphous state
in the fibre dispersions. Its amorphous state offers a higher aqueous solubility and fast
dissolution in comparison to its crystalline counterpart. The FF-PVP electrospun fibres
showed the fastest drug release, which reached 100% drug release within 10 min. PVP is
well-known for being used as an ultrafast electrospun fibrous matrix for improving the
solubility of BCS class II drugs (7). The FF-PVP-Eudragit E fibres also showed an
immediate drug release because both the PVP and Eudragit E rapidly dissolve in an acidic
media. The release from the FF-PVP-Soluplus is slower than from the FF-PVP and FF-
PVP-Eudragit E fibres. This may be caused by a slow dissolution of the Soluplus in
comparison to the PVP. Nagy et al. also observed that spironolactone loaded Soluplus
fibres did not show as quick a release as PVP electrospun formulations (6). As expected,
FF-PVP-HPMCAS demonstrated the slowest drug release rate among these formulations
as HPMCAS is not soluble in an acidic media. Therefore, this blend can potentially be used
for a sustained-release application. Chapter 6 will further explore the potential of this blend
to be used as a modified release matrix.
Figure 5.12 In vitro drug release profiles of FF loaded PVP single phase, polymer blend
fibres with different PVP:Eudragit E, HPMCAS or Soluplus ratios at 1:1 and FF form I
powder in pH 1.2 media with 0.5%w/v SLS.

169
5.3.3 Physical stability of FF polymer fibrous formulation under 0%RH
The physical stability of the FF loaded polymer blended fibres was studied at 0%RH for
six months. MTDSC was used to examine the crystallinity of the FF polymer blended fibres
at different time intervals to monitor their physical stability. As seen in Figure 5.13, all FF
loaded electrospun fibrous formulations developed a low level of crystallisation through
the six month period of the stability study at 0% RH. The FF-PVP electrospun fibres
demonstrated higher FF melting enthalpies than the polymer blend fibres. Therefore, these
results indicate that the polymer blend matrices have better stabilisation effects for the
amorphous FF than pure PVP. Among the polymer blend electrospun matrices, the FF-
PVP-HPMCAS showed the lowest level of FF crystallisation in comparison to the FF-PVP-
Eudragit E and FF-PVP-Soluplus fibres under 0%RH.
Figure 5.13 Physical stability monitoring by MTDSC of FF loaded electrospun fibres
stored at 0%RH for six months: (a) FF-PVP, (b) FF-PVP-Eudragit E, (c) FF-PVP-
HPMCAS and (d) FF-PVP-Soluplus.
5.3.4 Kinetics of moisture sorption of placebo and drug loaded dispersions
Sorption isotherm and GAB model fitting
The sorption isotherm experiments were performed at 25°C for the placebo and drug loaded
electrospun fibres. The moisture uptakes of these formulations are reported in the ratios of
water sorption in grams to polymers in grams (Gwater/Gpolymer), as seen in Figure 5.14. The
moisture sorption of the electrospun fibres is RH dependent. The amount of water absorbed
-0.055
-0.050
-0.045
-0.040
-0.035
-0.030
-0.025
Re
v H
ea
t F
low
(W
/g)
0 50 100 150
Temperature (°C)Exo Up Universal V4.5A TA Instruments
-0.08
-0.06
-0.04
-0.02
0.00
Re
v H
ea
t F
low
(W
/g)
0 50 100 150
Temperature (°C)Exo Up Universal V4.5A TA Instruments
-0.05
-0.04
-0.03
-0.02
Rev H
eat F
low
(W
/g)
0 50 100 150
Temperature (°C)Exo Up Universal V4.5A TA Instruments
-0.07
-0.06
-0.05
-0.04
-0.03
-0.02
Re
v H
ea
t F
low
(W
/g)
0 50 100 150
Temperature (°C)Exo Up Universal V4.5A TA Instruments
FreshFresh
FreshFresh
3 months3 months
3 months3 months
6 months6 months
6 months
6 months
a b
c d

170
in all the electrospun fibre formulations increased in a linear fashion until 70% RH, and
then above this RH, the moisture sorption showed an exponential increase (Figure 5.14).
The Gwater/Gpolymer of the FF-PVP-HPMCAS, FF-PVP-Soluplus and FF-PVP fibres slightly
decreased in comparison to the PVP-HPMCAS and PVP placebo fibres. The small
difference in moisture absorption may imply that the FF increases the hydrophobicity of
these systems. The PVP-Eudragit E blends demonstrated a resemblance of the Gwater/Gpolymer
of the placebo and FF loaded electrospun fibres. Therefore, FF does not significantly alter
the water sorption property of the polymer blend electrospun fibres. Interestingly, the PCM-
PVP-HPMCAS fibres demonstrated a lower moisture uptake than their placebo and FF
loaded PVP-HPMCAS blends. Forster et al. previously reported that the API that forms a
hydrogen bond with PVP could reduce the moisture uptake as PVP has less free carbonyl
groups to attract water molecules (26).
Figure 5.14 Sorption isotherms of FF and PCM loaded and placebo electrospun fibres of
blends and single polymers: (a) PVP, (b) PVP-HPMCAS, (c) PVP-Eudragit E and (d)
PVP-Soluplus.
The Guggenheim-Anderson-de Boer (GAB) model is a versatile mathematical model to
describe non-linear moisture sorption behaviour in foods and pharmaceutical materials that
is isothermal type II (sigmoidal shape) (27-29). In this Chapter, it was used to fit the
sorption data from 0% to 90% RH to describe and understand the water sorption behaviour
0 20 40 60 80 100
0.00
0.05
0.10
0.15
0.20
0.25
0.30
0.35
PVP-Eudragit fibres
FF-PVP-Eudragit fibres
Gra
ms w
ate
r/ G
ram
s p
oly
me
r
Relative humidity (%)
0 20 40 60 80 100
0.0
0.1
0.2
0.3
0.4
PVP-SP fibres
FF-PVP-SP fibres
Gra
ms w
ate
r/G
ram
s p
oly
me
r
Relative humidity (%)
0 20 40 60 80 100
0.0
0.1
0.2
0.3
0.4
0.5
0.6
0.7 PVP fibres
FF-PVP fibres
Gra
ms w
ate
r/ G
ram
s p
oly
me
r
Relative humidity (%)0 20 40 60 80 100
0.00
0.05
0.10
0.15
0.20
0.25
0.30
0.35
0.40
0.45
0.50
PVP-HPMCAS fibres
FF-PVP-HPMCAS fibres
PCM-PVP-HPMCAS fibresP
VP
-HP
MC
AS
fib
res (
G w
ate
r/G
po
lym
er)
Relative humidity (%)
a
dc
b
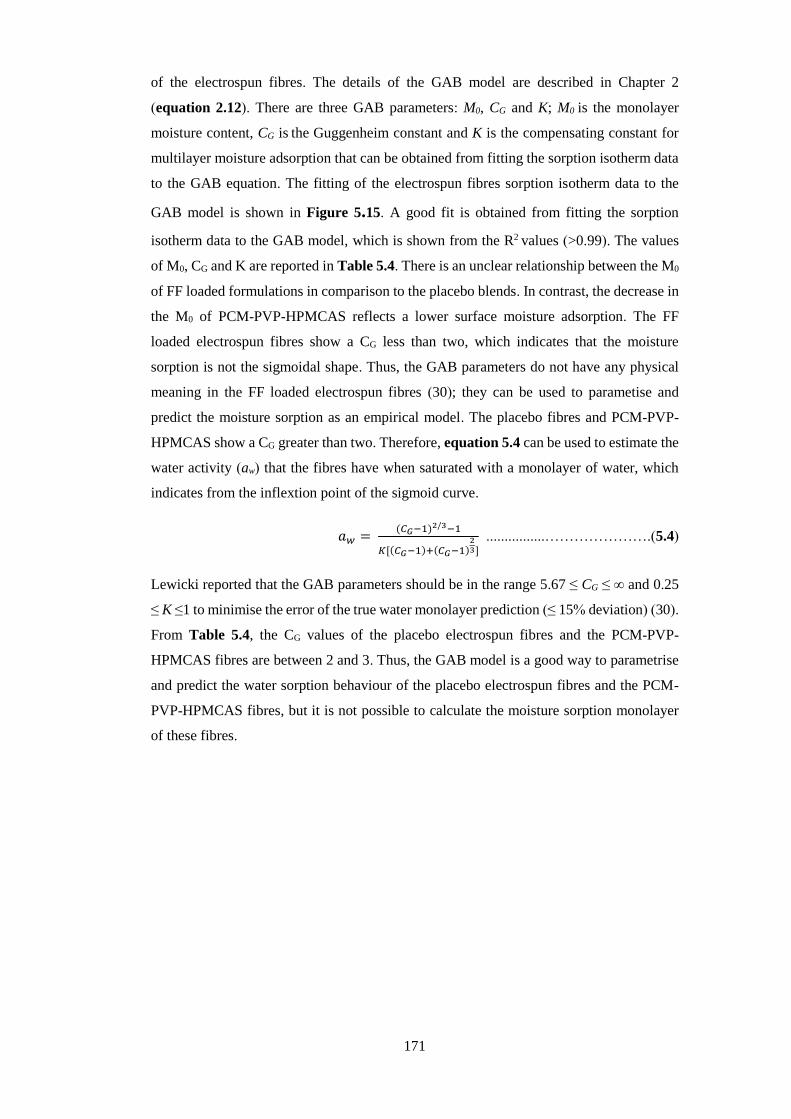
171
of the electrospun fibres. The details of the GAB model are described in Chapter 2
(equation 2.12). There are three GAB parameters: M0, CG and K; M0 is the monolayer
moisture content, CG is the Guggenheim constant and K is the compensating constant for
multilayer moisture adsorption that can be obtained from fitting the sorption isotherm data
to the GAB equation. The fitting of the electrospun fibres sorption isotherm data to the
GAB model is shown in Figure 5.15. A good fit is obtained from fitting the sorption
isotherm data to the GAB model, which is shown from the R2 values (>0.99). The values
of M0, CG and K are reported in Table 5.4. There is an unclear relationship between the M0
of FF loaded formulations in comparison to the placebo blends. In contrast, the decrease in
the M0 of PCM-PVP-HPMCAS reflects a lower surface moisture adsorption. The FF
loaded electrospun fibres show a CG less than two, which indicates that the moisture
sorption is not the sigmoidal shape. Thus, the GAB parameters do not have any physical
meaning in the FF loaded electrospun fibres (30); they can be used to parametise and
predict the moisture sorption as an empirical model. The placebo fibres and PCM-PVP-
HPMCAS show a CG greater than two. Therefore, equation 5.4 can be used to estimate the
water activity (aw) that the fibres have when saturated with a monolayer of water, which
indicates from the inflextion point of the sigmoid curve.
𝑎𝑤 = (𝐶𝐺−1)2/3−1
𝐾[(𝐶𝐺−1)+(𝐶𝐺−1)23]
................………………….(5.4)
Lewicki reported that the GAB parameters should be in the range 5.67 ≤ CG ≤ ∞ and 0.25
≤ K ≤1 to minimise the error of the true water monolayer prediction (≤ 15% deviation) (30).
From Table 5.4, the CG values of the placebo electrospun fibres and the PCM-PVP-
HPMCAS fibres are between 2 and 3. Thus, the GAB model is a good way to parametrise
and predict the water sorption behaviour of the placebo electrospun fibres and the PCM-
PVP-HPMCAS fibres, but it is not possible to calculate the moisture sorption monolayer
of these fibres.

172
Table 5.4 GAB model parameter values of placebo and drug loaded electrospun fibres.
Fibres M0 CG K R2
PVP-Eudragit E 0.075 2.72 0.87 0.999
PVP-HPMCAS 0.084 2.89 0.88 0.999
PVP-Soluplus 0.095 2.54 0.87 0.999
PVP 0.158 3.01 0.85 0.999
FF-PVP 0.167 1.84 0.83 0.999
FF-PVP-Eudragit E 0.096 1.66 0.84 0.999
FF-PVP-HPMCAS 0.100 1.08 0.85 0.999
FF-PVP-Soluplus 0.094 1.81 0.88 0.999
PCM-PVP-HPMCAS 0.059 2.40 0.87 0.999
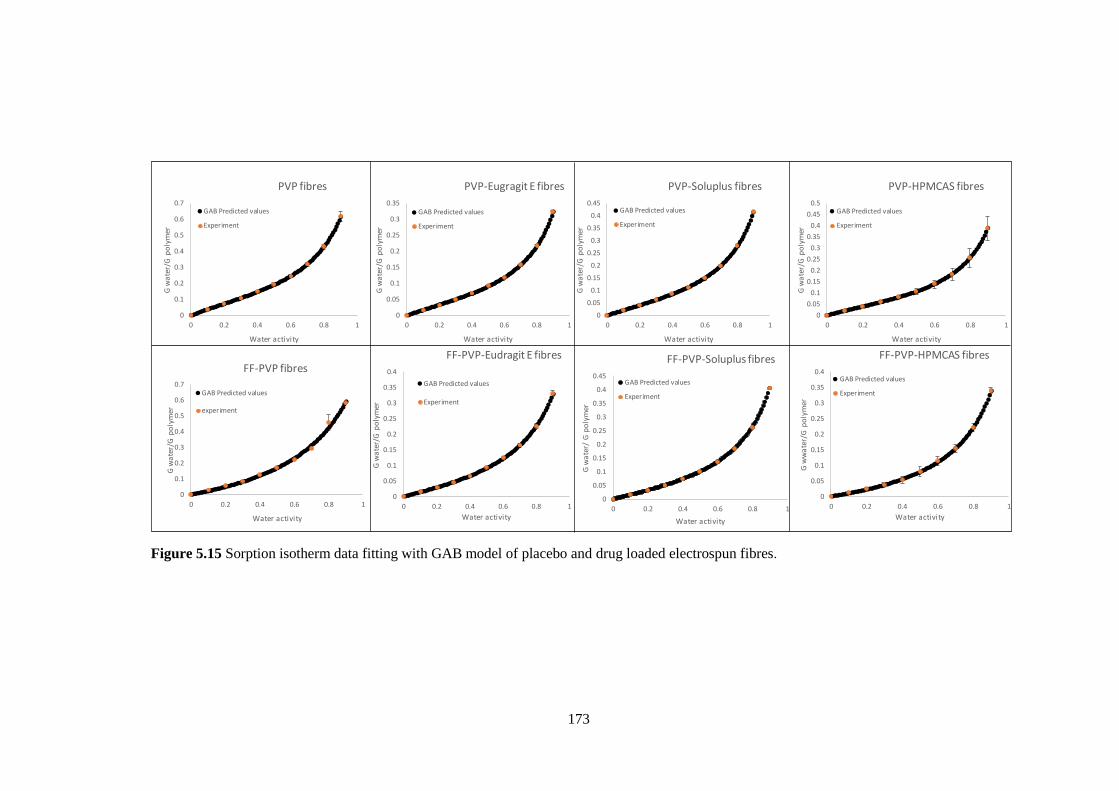
173
Figure 5.15 Sorption isotherm data fitting with GAB model of placebo and drug loaded electrospun fibres.
0
0.1
0.2
0.3
0.4
0.5
0.6
0.7
0 0.2 0.4 0.6 0.8 1
G w
ate
r/G
po
lym
er
Water activity
PVP fibres
GAB Predicted values
Experiment
0
0.05
0.1
0.15
0.2
0.25
0.3
0.35
0 0.2 0.4 0.6 0.8 1
G w
ate
r/G
po
lym
er
Water activity
PVP-Eugragit E fibres
GAB Predicted values
Experiment
0
0.05
0.1
0.15
0.2
0.25
0.3
0.35
0.4
0.45
0 0.2 0.4 0.6 0.8 1
G w
ate
r/G
po
lym
er
Water activity
PVP-Soluplus fibres
GAB Predicted values
Experiment
0
0.05
0.1
0.15
0.2
0.25
0.3
0.35
0.4
0.45
0.5
0 0.2 0.4 0.6 0.8 1
G w
ate
r/G
po
lym
er
Water activity
PVP-HPMCAS fibres
GAB Predicted values
Experiment
0
0.1
0.2
0.3
0.4
0.5
0.6
0.7
0 0.2 0.4 0.6 0.8 1
G w
ate
r/G
po
lym
er
Water activity
FF-PVP fibres
GAB Predicted values
experiment
0
0.05
0.1
0.15
0.2
0.25
0.3
0.35
0.4
0 0.2 0.4 0.6 0.8 1
G w
ate
r/G
po
lym
er
Water activity
FF-PVP-Eudragit E fibres
GAB Predicted values
Experiment
0
0.05
0.1
0.15
0.2
0.25
0.3
0.35
0.4
0.45
0 0.2 0.4 0.6 0.8 1
G w
ate
r/ G
po
lym
er
Water activity
FF-PVP-Soluplus fibres
GAB Predicted values
Experiment
0
0.05
0.1
0.15
0.2
0.25
0.3
0.35
0.4
0 0.2 0.4 0.6 0.8 1
G w
wa
ter/
G p
oly
mer
Water activity
FF-PVP-HPMCAS fibres
GAB Predicted values
Experiment

174
Moisture sorption of solid dispersions at 75% RH
The isohumic sorption at a fixed 75% RH is the standard condition for determining the
accelerated stability for pharmaceutical products (31). Therefore, this test was applied to
the raw materials, placebo and drug loaded electrospun fibre and cast film formulations.
The Gwater/Gpolymer of the raw materials are 0.34±0.0001, 0.108±0.0003, 0.0640±0.0001 and
0.018±0.001 for PVP, Soluplus, HPMCAS and Eudragit E, respectively. These data clearly
demonstrate the order of the hygroscopicity of these polymers as
PVP>Soluplus>HPMCAS>Eudragit E (Figure 5.16a). The electrospinning and film
casting were used to prepare the blends of PVP and hydrophobic polymer (HPMCAS,
Eudragit E and Soluplus). The rationale of these experiments was to compare the moisture
sorption between simple solid films produced by the film casting method and the networked
fibrous structure prepared by the electrospinning technique. The moisture uptakes of the
formulations are reported in Gwater/Gpolymer. Figure 5.16 presents the moisture uptakes of
the placebo and drug-loaded electrospun fibres and cast films.
The placebo PVP cast films and electrospun fibres demonstrate similar moisture uptakes.
After blended with HPMCAS, Eudragit E and Soluplus, the systems illustrate a significant
reduction in the overall moisture absorption in both the placebo cast films and fibres in
comparison to PVP alone (Figure 5.16b). The PVP-HPMCAS and PVP-Eudragit E
electrospun fibres absorbed moisture significantly more than their cast film counterparts by
about 5.7 and 2.5 times, respectively. On the other hand, PVP-Soluplus showed only a
slight difference between the cast film and electrospun fibres. PVP and PVP-Soluplus
demonstrated a higher hygroscopicity than HPMCAS and Eudragit.
In the PVP-HPMCAS and PVP-Eudragit, it can be speculated that the fibres absorb a
greater amount of moisture than the cast films because of the capillary condensation of the
moisture in the fibrous structure. In the case of PVP and PVP-Soluplus, both cast films and
electrospun fibres show similar moisture uptakes because the fibrous structure collapsed
upon the moisture sorption. The fibre collapse is possibly due to the relaxation of PVP and
Soluplus when they absorb water during the sorption experiment. Hence, this phenomenon
minimises the surface area of the fibres. The details of the fibrous structure deformation
after the moisture sorption will be discussed in the next section.
The FF-PVP cast films and electrospun fibres demonstrate similar moisture uptake
capacities as their placebo counterparts. The moisture absorption of FF-HPMCAS and FF-
Soluplus cast films decreased to half in comparison to their raw materials, while the FF-
Eudragit E cast films showed a similar moisture sorption to the raw materials. Incorporating
FF into the polymers, including HPMCAS, Eudragit E and Soluplus cast films, resulted in
enhancing the hydrophobicity of the blends. This leads to a decrease in the moisture uptake

175
in comparison to their raw materials. In contrast, no significant moisture sorption was
observed in both the fibres and cast films of FF-PVP in comparison to their placebo fibres
and cast films. This is because the FF molecules did not affect the free carbonyl group of
PVP, thus, they could attract water in a similar manner to their placebo.
Drug incorporation of polymer blended formulations showed an impact on their moisture
uptake capacities in comparison to their placebos for both cast films and electrospun fibres.
The moisture uptakes of the FF-PVP-HPMCAS and FF-PVP-Soluplus electrospun fibres
slightly decreased in comparison to their placebo fibres. Although the moisture uptake of
FF-PVP-Eudragit E fibres slightly increased in comparison to their placebo fibres, the
difference in these trends was not significant. Thus, FF did not significantly affect moisture
sorption in the electrospun mats. In contrast, PCM-PVP-HPMCAS electrospun fibres
demonstrated a notable decrease (1.4 times) in their moisture uptake in comparison to their
placebo fibres. In the cast films, the Gwater/Gpolymer of the FF-PVP-Soluplus slightly
decreased in comparison to its placebo. Although, FF-PVP-Eudragit E and FF-PVP-
HPMCAS cast films demonstrated higher moisture uptakes than their placebos
(approximately 2.3 and 3.3 times, respectively), the mechanism behind the increases in the
moisture uptakes of FF-PVP-HPMCAS and FF-PVP-Eudragit E cast films is unclear. It is
speculated that the PVP rich phase contributed to the moisture absorption in the FF-
polymer blended cast films.
Figure 5.16 Moisture uptake in Gwater/Gpolymer of the polymer of raw materials, cast films
and fibrous films at 75%RH and 25°C.
PVP alo
ne
PVP-HPM
CAS
PVP-Eudra
git E
PVP-Solu
plus
0.0
0.1
0.2
0.3
0.4ES
Cast
FF ES
FF Cast
PCM ES
Mo
istu
re s
orp
tio
n (
Gra
mm
e o
f w
ate
r/G
ram
me o
f p
oly
mer
FF C
ast
Place
bo cas
t
0.0
0.1
0.2
0.3
0.4PVP
HPMCAS
Eudragit E
Soluplus
Mo
istu
re s
orp
tio
n (
Gram
me o
f w
ater/G
ram
me o
f p
oly
mer
a b

176
Moisture sorption kinetics under 75%RH
The isohumic water absorption data of electrospun fibres and cast films were fitted to Peleg
and double exponential (DE) models to obtain kinetics information of the water absorption
in these formulations. The water sorption data from the initial state until the equilibrium
state of the electrospun fibres and cast films were fitted to the Peleg model. Overall, fibrous
water sorption data showed better fits to the Peleg model than the water sorption data from
the cast films. In the initial state (0-25 min), the experimental values agree well with Peleg’s
prediction in both cast films and electrospun fibres (Figure 5.17a and b). However, the
Peleg predictive values significantly deviated from the experimental values in the
intermediate state (25-75 mins) and before reaching an equilibrium state (75-200 min), as
seen from Figure 5.17c and d for both cast and fibrous films. Therefore, the Peleg model
was used to fit only the initial state (0-25 min) of the moisture sorption where it showed a
good predictive capacity.
Figure 5.17 Examples of Peleg model fitting and fitting residual to the moisture sorption
behavior of FF loaded cast films and electrospun fibres: (a) 25 min FF-PVP cast films, (b)
0
0.02
0.04
0.06
0.08
0.1
0.12
0 5 10 15 20 25 30
Mt/
M0
Time (min)
Observed
Predicted
0
0.02
0.04
0.06
0.08
0.1
0.12
0.14
0.16
0 20 40 60 80 100 120 140 160 180 200
Mt/
M0
Time (min)
Experiment
Predicted
c
-0.01
-0.005
0
0.005
0.01
0 0.02 0.04 0.06 0.08 0.1 0.12
Res
idu
al
Mt/M0
-0.01
-0.005
0
0.005
0.01
0 0.02 0.04 0.06 0.08 0.1 0.12 0.14 0.16Res
idu
al
Mt/M0
d
0
0.05
0.1
0.15
0.2
0.25
0 5 10 15 20 25
Mt/
M0
Time (min)
experiment
Prediction
0
0.05
0.1
0.15
0.2
0.25
0.3
0 50 100 150 200
Mt/
M0
Time(min)
Experiment
Prediction
-0.02
-0.01
0
0.01
0.02
0.03
0 0.05 0.1 0.15 0.2 0.25 0.3
Res
idu
al
Mt/M0
ba
-0.015
-0.01
-0.005
0
0.005
0.01
0.015
0.02
0.025
0.03
0 0.05 0.1 0.15 0.2 0.25
Res
idu
al
Mt/M0

177
25 min FF-PVP-HPMCAS electrospun fibres, (c) 200 min FF-PVP cast films and (d) 200
min FF-PVP-HPMCAS fibrous films.
The details of the Peleg equation are described in Chapter 2 (equation 2.13). The
parameters involved in the Peleg equation are Peleg rate (A1), Peleg capacity (A2) and
initial mass (M0) that can be obtained from fitting the isohumic data to the Peleg model.
The fitting parameters of the placebo and FF loaded electrospun fibres and cast films are
reported in Table 5.5 with their R2 values. The smaller values of A1 and A2 indicate a fast
moisture absorption rate and higher moisture absorption capacity, respectively. The
comparison of the Peleg rate and the Peleg capacity of electrospun fibres and cast films are
shown in Figure 5.18. Overall, the electrospun fibres show a faster moisture sorption rate
than the cast films, except for the FF-PVP blend fibres, in which the FF-PVP cast films
absorbed moisture quicker than the fibre. The Peleg capacity parameter corresponds to the
moisture uptake, which agrees with the previous moisture uptake study at 75%RH, as
discussed in the moisture sorption results. The Peleg capacity of the electrospun fibres and
cast films are similar in the PVP, PVP-Soluplus, FF-PVP, FF-PVP-Eudragit E and FF-
PVP-Soluplus. While the PVP-HPMCAS, PVP-Eudragit E and FF-PVP-HPMCAS
demonstrated that electrospun fibres have greater moisture uptake than their cast films.
Figure 5.18 Comparison of (a) Peleg rate and (b) Peleg capacity parameters of
electrospun fibres and cast films. The smaller values of Peleg rate and Peleg capacity
indicate a faster moisture absorption rate and higher moisture absorption capacity,
respectively.
a
b
29.0
46.3 44.538.4
54.4
70.0
48.255.8
35.6
80.5
69.8
38.3 35.5
75.571.4
63.5
0.0
10.0
20.0
30.0
40.0
50.0
60.0
70.0
80.0
90.0
Pele
g ra
te (A
1)
fibre cast
2.64.4 4.7 3.8 4.2
6.6 5.9 5.32.2
24.7
11.0
3.8 3.2
9.7
5.8 5.4
0.0
5.0
10.0
15.0
20.0
25.0
30.0
Pele
g ca
paci
ty (A
2)
fibre cast

178
Table 5.5 Peleg model fitting parameters of electrospun fibres and cast films at isohumic 75% RH.
Fibres
(200 min)
M0 A1 A2 R2 Cast films (200
min)
M0 A1 A2 R2
PVP -0.025 21.59 2.61 0.997 PVP -
0.034
22.63 2.41 0.991
PVP-HPMCAS -0.008 36.81 4.42 0.994 PVP-HPMCAS -
0.004
55.10 24.38 0.989
PVP-Eudragit E -0.008 35.36 4.68 0.995 PVP-Eudragit E -
0.009
45.96 11.11 0.989
PVP-Soluplus -0.012 34.35 3.74 0.997 PVP-Soluplus -
0.018
25.60 3.91 0.990
FF-PVP -0.008 42.36 3.29 0.997 FF-PVP -0.03 20.78 3.38 0.987
FF-PVP-
HPMCAS
-0.004 59.14 6.57 0.995 FF-PVP-
HPMCAS
-
0.008
50.00 10.22 0.986
FF-PVP-
Eudragit E
-0.004 40.00 6.39 0.997 FF-PVP-
Eudragit E
-
0.021
37.91 6.14 0.984
FF-PVP-
Soluplus
-0.005 47.98 5.46 0.999 FF-PVP-
Soluplus
-
0.013
44.92 5.61 0.994

179
Fibres
(25min)
M0 A1 A2 R2 Cast films (25
min)
M0 A1 A2 R2
PVP -0.005 28.97 2.55 0.999 PVP -
0.006
35.57 2.24 0.999
PVP-HPMCAS -0.003 46.31 4.44 0.999 PVP-HPMCAS -
0.002
80.47 24.69 0.999
PVP-Eudragit E -0.001 44.54 4.70 0.999 PVP-Eudragit E -
0.002
69.78 11.03 0.999
PVP-Soluplus -0.002 38.40 3.81 0.999 PVP-Soluplus -
0.001
38.26 3.83 0.999
FF-PVP 0.0001 54.35 4.21 0.999 FF-PVP -
0.005
35.51 3.19 0.999
FF-PVP-
HPMCAS
0.0002 69.99 6.62 0.998 FF-PVP-
HPMCAS
-
0.002
75.48 9.65 0.999
FF-PVP-
Eudragit E
-0.003 48.17 5.93 0.999 FF-PVP-
Eudragit E
-
0.003
71.41 5.80 0.999
FF-PVP-
Soluplus
-0.001 55.80 5.33 0.999 FF-PVP-
Soluplus
-
0.003
63.45 5.44 0.999

180
The fibre network collapse upon moisture sorption is key to explaining the moisture
sorption behaviour of the electrospun fibres. The FF-PVP cast films show a faster moisture
sorption rate than the electrospun fibres because the FF-PVP fibres demonstrate a dramatic
fibrous structure deformation. Hence, this structure deformation could potentially impede
moisture uptake in the FF-PVP fibres. On the other hand, PVP-HPMCAS, PVP-Eudragit
E and FF-PVP-HPMCAS show minor or no structural collapses. Therefore, the capillary
condensation that occurs in the fibrous structure resulted in the greater amounts of moisture
sorption than the cast films. The similar Peleg capacity between the electrospun fibres and
cast films of PVP, PVP-Soluplus, FF-PVP-Eudragit E and FF-PVP-Soluplus is speculated
to be due to the major fibre structure deformation that occurs in these samples. Hence, it
results in a smaller effect of capillary condensation. Consequently, the electrospun fibres
show similar moisture absorption to their cast films. The details of the fibre structure
deformation will be discussed in the next section.
The Peleg parameters are only capable of explaining the initial stage of the moisture
sorption, during which the systems had not reached the equilibrium yet. These result
suggest that a single kinetic term is insufficient to explain the process of water absorption
on both the cast films and electrospun fibres. The water absorption process of these samples
may involve more than one kinetic process. Therefore, the DE model that has two terms
for the kinetic process was used to fit the isohumic water sorption of both cast films and
electrospun fibres. The details of the DE model are described in Chapter 2 using equation
2.14. k1 and k2 are the sorption rate constants and A1 is the fraction contribution to the
different sorption constants.
The DE model demonstrated a better predictive capacity than the Peleg model. It precisely
predicted the water sorption data at all states of the absorption in both cast films and fibrous
films (Figure 5.19a) The DE model fitting parameters are reported in Table 5.6. However,
slight deviations in the data fitness that indicate the lower quality fits were observed in the
FF-PVP-HPMCAS fibres and FF-PVP-Soluplus cast films. These deviations from the DE
model potentially referred to another complicated water absorption process that occurs in
these samples. This confirmed that at least two kinetic processes happen during the water
sorption process. The two processes could potentially be moisture absorption in
combination with structural change. The water absorption in the cast films and electrospun
fibres is a complicated process in which both the Peleg and DE models could partially
explain the absorption process and parametrised the absorption data.

181
Figure 5.19 Example of DE model fitting and fitting residual to the moisture sorption
behaviour of FF loaded electrospun fibres: (a) good fitting of FF-PVP-Eudragit E fibres
and (b) slight deviation for FF-PVP-HPMCAS fibres.
Table 5.6 DE model fitting parameters of fibrous and cast films at isohumic 75% RH.
Fibres A1 K1 K2 R2 Cast films A1 K1 K2 R2
FF-PVP 0.328 0.017 0.077 0.999 FF PVP 0.369 0.041 0.123 0.999
FF-PVP-
Eudragit E
0.247 0.02 0.120 0.999 FF PVP-
Eudragit E
0.271 0.036 0.102 0.999
FF-PVP-
HPMCAS
0.352 0.024 0.116 0.997 FF PVP-
HPMCAS
0.335 0.041 0.157 0.999
FF-PVP-
Soluplus
0.263 0.014 0.106 0.998 FF PVP-
Soluplus
0.163 0.011 0.085 0.997
PVP-
Eudragit E
0.467 0.035 0.157 0.999 PVP-
Eudragit E
0.360 0.049 0.192 0.999
PVP-
HPMCAS
0.552 0.038 0.162 0.999 PVP-
HPMCAS
0.268 0.061 0.299 0.998
PVP-
Soluplus
0.508 0.032 0.156 0.999 PVP-
Soluplus
0.509 0.044 0.165 0.999
PVP 0.291 0.021 0.106 0.999 PVP 0.616 0.091 0.029 0.999
0
0.2
0.4
0.6
0.8
1
1.2
0 20 40 60 80 100 120 140 160 180 200
Mt/
Me
Time (min)
Experiment
Prediction
0
0.2
0.4
0.6
0.8
1
1.2
0 20 40 60 80 100 120 140 160 180 200
Mt/
Me
Time (min)
Experiment
Prediction
-0.02
-0.01
0
0.01
0.02
0.03
0.04
0.05
0 0.1 0.2 0.3 0.4 0.5 0.6 0.7 0.8 0.9 1
Re
sid
ua
l
Mt/Me -0.02
-0.01
0
0.01
0.02
0.03
0.04
0.05
0 0.1 0.2 0.3 0.4 0.5 0.6 0.7 0.8 0.9 1
Re
sid
ua
l
Mt/Me
a b

182
5.3.5 Structure deformation caused by moisture sorption
The increase in moisture sorption leads to the plasticisation of the polymer fibres by water
that enhances the molecular mobilities in the system. Therefore, phase separation of the
drug and polymer occurs, followed by recrystallization of the amorphous drug. The
scenario is of moisture provoking drug crystallisation to occur during the moisture uptake
process (14, 15). The visual appearance of the formulations before and after being
incubated in a humid environment is the simplest way to indicate the physical and structural
changes. Therefore, 4x4 cm pieces of the placebo and drug loaded fibrous films were
incubated in a 75% RH desiccator at room temperature for 24 h to demonstrate fibre
structure deformations due to moisture absorption. The placebo fibres were dense and
flexible before incubation in the desiccator, as seen in Figure 5.20a and b. However, the
texture of the PVP placebo electrospun fibres significantly deformed; they became
shrunken, fragile and rigid after being in the humid environment. While the PVP-Eudragit
E and PVP-Soluplus became more rigid and shrunk slightly. This shrinkage is an indication
of the fibre structures undergoing structural changes. PVP-HPMCAS fibres did not change
their texture after being incubated in the humidity desiccator. In the FF loaded polymer
blended electrospun fibres, the FF-PVP, FF-PVP-Soluplus and FF-PVP-Eudragit E fibrous
textures dramatically distort, including significant shrinkage and increased rigidity. The
FF-PVP-HPMCAS electrospun fibres texture did not change after being incubated in the
75% RH desiccator, as seen in Figure 5.20c and d.
183
Figure 5.20 Optical images of placebo and FF loaded electrospun fibres before and after
incubation in 75% RH desiccator for 24 h. (a) Placebo electrospun fibres before and (b)
placebo electrospun fibres after incubation. (c) FF loaded electrospun fibres before and
(d) FF loaded electrospun fibres after incubation.
SEM and MTDSC were performed on the placebo and drug loaded cast and electrospun
fibres after the isohumic test at 75%RH by DVS at 25°C for 4 h. SEM results revealed
evidence of fibre structure deformation after the DVS experiments. The PVP fibres were
tremendously swollen and their fibrous structures completely collapsed. It is clearly
observed that the gap spaces between the fibres disappeared as the fibres merged. Other
fibre structure deformations, including swelling and distorting, are observed in PVP-
Eudragit E and PVP-Soluplus fibres, as seen in Figure 5.22. These microscopic fibrous
structure deformations are highly likely to result in macroscopic fibre shrinkages. On the
contrary, the fibrous network of the PVP-HPMCAS placebo fibres remained unchanged.
Consequently, the PVP-HPMCAS fibres can maintain the original texture after exposure
to 75% RH. The diameters of the placebo PVP, PVP-Eudragit, PVP-Soluplus and PVP-

184
HPMCAS are 3.2±0.8, 1.3±0.3, 1.7±0.2 and 0.94±0.2 µm, respectively. It can be seen that
the diameters of the electrospun fibres increase after moisture sorption in comparison to
the dry fibres, indicating swelling (Figure 5.21).
Figure 5.21 Comparison of fibre diameter in fresh fibres and after moisture sorption at
75% RH. It is noted that the diameter of FF-PVP and FF-PVP-Eudragit E fibres cannot be
measured due to dramatic fibrous structure collapse and fibres merging.
Significant structural deformations of the FF loaded polymer blend electrospun fibres were
observed by SEM (Figure 5.22). Fibrous structural collapses occurred in FF-PVP, FF-
PVP-Eudragit E and FF-PVP-Soluplus fibres. The fibrous diameter of the FF-PVP-and FF-
PVP-Eudragit E could not be measured because of the dramatic structure collapse and
fibres merging. This results in an unclear boundary of the fibres, which hinders the diameter
measurement. The dramatic fibre collapse in the FF-PVP fibres, in which fibres are fused
together as a sheet, can potentially hinder moisture sorption resulting in a slower moisture
sorption rate than its cast film. FF-PVP-HPMCAS and FF-PVP-Soluplus showed diameters
of 0.99±0.3 and 2.3±0.8 µm, respectively. The fibre diameters of FF-PVP-HPMCAS after
the moisture sorption resembled their dry fibre diameter, while the FF-PVP-Soluplus fibre
diameters increased approximately two fold in comparison to their dry fibres (Figure 5.21).
The dramatic deformation of the FF loaded fibres is due to a synergistic effect of FF and
water plasticising the samples. Unlike the other electrospun fibres, the fibrous structure of
the FF-PVP-HPMCAS fibres remained after exposure to 75% RH. However, some
microcrystals were observed on the surface of the FF-PVP-HPMCAS fibres instead (as
seen with higher magnification image in Figure 5.22). These microcrystals were suspected
to be FF crystals. The PCM-PVP-HPMCAS electrospun fibres showed fibre swelling
without a structural collapse after the DVS moisture sorption test. Its average diameter was
1.6±0.4 µm, which was approximately twice its dry state.
PV
P
FF
-PV
P
PV
P-E
ud
rag
it
FF
-PV
P-E
ud
rag
it
PV
P-H
PM
CA
S
FF
-PV
P-H
PM
CA
S
PV
P-S
olu
plu
s
FF
-PV
P-S
olu
plu
s
0
1
2
3
4
5
Fib
re d
iam
ete
r (u
m)
F re s h
7 5 % R H

185
Figure 5.22 SEM images of placebo and drug-loaded electrospun fibres after isohume
75% RH in DVS. Red cycles highlight micro crystals of FF on the fibres.
FF-PVP Fibres FF-PVP-Eudragit E Fibres
FF-PVP-HPMCAS FibresFF-PVP-Soluplus Fibres
FF-PVP-HPMCAS Fibres
PCM-PVP-HPMCAS Fibres
PVP HPMCAS
PVP Eudragit EPVP Soluplus
PVP

186
The SEM images of the FF loaded cast films are shown in Figure 5.23. FF crystals were
observed on the surface of the FF-PVP, FF-HPMCAS, FF-PVP-HPMCAS, FF-PVP-
Soluplus and FF-PVP-Eudragit E after the DVS experiments. This may be an indication of
the moisture induced drug crystallisation on the surface of these cast films. On the contrary,
FF-Soluplus and FF-Eudragit E cast films presented smooth surfaces. This suggests that
Soluplus and Eudragit E prevented FF crystallisation at 75% RH for 400 min.
Figure 5.23 SEM images of FF loaded cast films after isohume 75%RH in DVS.
FF-PVP
FF-PVP-Eudragit E
FF-PVP-HPMCAS FF-PVP-Soluplus
FF-Soluplus
FF-Eudragit E FF-HPMCAS

187
The presence of FF crystals in both electrospun fibres and cast films seen in the SEM results
was confirmed by MTDSC. As seen in Figure 5.24a and b, melting endotherms were
observed for FF-PVP and FF-HPMCAS cast films; whereas, no FF melting can be detected
in the FF-Soluplus and FF-Eudragit E cast films. These findings agree well with the
previous SEM results. In the FF loaded polymer blend dispersions, small melting peaks
were observed in the total heat flow signal in the FF-PVP-Eudragit E and FF-PVP-Soluplus
fibres and cast films that had absorbed moisture in the DVS, as shown in Figure 5.24b.
However, the melting enthalpies cannot be measured from the total heat flow signal. This
is because of the non-flat baseline that is caused by the water evaporation being
superimposed on the melting signals. As the melting was shown in both the total heat flow
and reversing heat flow, the melting enthalpies were measured from the reversing heat flow
signal, which showed a flat baseline (Figure 5.24c), and the values are reported in Table
5.1. The measurement of FF melting enthalpies from the reversing heat flow is only for
comparative purposes between the formulations. The reversing heat flow cannot be used to
quantify the amount of FF crystals, because it is part of the total heat flow, which is
responsible for the reversible event (Tg), and the integral area of the pure crystals melting
peak in the reversing heat flow is not equal to the melting enthalpy measured from the total
heat flow. The majority of the FF loaded polymer blended dispersions show a melting peak
for the FF at 80°C, which refers to FF form I recrystallization. However, the FF-PVP-
Soluplus cast films and the FF-PVP-Eudragit E and FF-PVP-Soluplus fibres had a drug
melting point at 73°C. This could be attributed to either a melting point depression due to
the presence of polymers or that the FF crystallised as its metastable polymorph IIa (32).
The highest melting enthalpy value (11.9±0.11 g/J) was observed in the FF-PVP-HPMCAS
fibres with the equivalent of 53.3% FF form I recrystallization. This melting peak
confirmed that the microcrystals in the FF-PVP-HPMCAS fibres were FF crystals. On the
reversing heat flow signal, FF-PVP-Eudragit E cast films demonstrated double Tg values
similar to those obtained for the fresh sample. However, no Tg was observed in the other
cast films and electrospun fibres (Figure 5.24c).

188
Figure 5.24 MTDSC of FF loaded cast films and electrospun fibres after being incubated
in DVS at 75%RH: (a) single polymer cast film, (b) total heat flow of polymer blended
dispersion, (c) reversing heat flow of polymer blended dispersion and (d) PCM-PVP-
HPMCAS fresh and sample after DVS experiment.
Again, for comparative purposes, the PCM loaded system was also studied. The PCM-
PVP-HPMCAS fibres showed a double Tg at 47.9 ± 2.8 and 86.6± 0.9 °C, but no melting
of PCM was observed (Figure 5.24d). From the ΔCp, approximately one-third of the PCM-
PVP-HPMCAS phase demonstrated a separation at the lower Tg phase. A single Tg was
obtained from the cooling cycle (86.0± 0.5°C). The fresh PCM-PVP-HPMCAS fibres
demonstrated a Tg at 87.1±0.7°C, which is similar to the second Tg of the DVS sample and
the Tg from the cooling cycle. Therefore, the first Tg of the PCM-PVP-HPMCAS fibre
could be the moisture that was bound to the PVP during the moisture sorption experiment.
It is speculated that the hydrogen bond in the PVP-PCM enhances the physical stability of
the PCM-PVP-HPMCAS fibres under 75% RH. However, the FF did not establish the
hydrogen bond with neither the PVP nor the HPMCAS. Thus, this results in the amorphous
FF recrystallization in the FF-PVP-HPMCAS fibres under 75% RH.
-0.10
-0.05
0.00
0.05
0.10
Re
v H
ea
t F
low
(W
/g)
0 50 100 150
Temperature (°C)Exo Up Universal V4.5A TA Instruments
DVS sample Cooling cycle
DVS sampleheating cycle
Fresh sample heating cycle
86.6± 0.9 °C 47.9± 2.8 °C
87.1± 0.7 °C
86.0± 0.5 °C
b
-0.12
-0.10
-0.08
-0.06
-0.04
-0.02
0.00
Re
v H
ea
t F
low
(W
/g)
-30 20 70 120
Temperature (°C)Exo Up Universal V4.5A TA Instruments
4.5±1.4°C
18.4±1.9°C
FF-Eudragit cast film
FF-Soluplus cast film
FF-PVP cast film
FF-HPMCAS cast film
-3.9±2.0°C 117.2±4.0°C
a
c d
-0.5
-0.3
-0.1
0.1
0.3
0.5
0.7
He
at
Flo
w (
W/g
)
-20 30 80 130 180
Temperature (°C)Exo Up Universal V4.5A TA Instruments
FF-PVP cast films
FF-PVP-HPMCAS cast films
FF-PVP-Eudragit cast films
FF-PVP-Soluplus cast films
FF-PVP-HPMCAS fibres
FF-PVP fibres
FF-PVP-Eudragit fibres
FF-PVP-Soluplus fibres
-0.40
-0.35
-0.30
-0.25
-0.20
-0.15
-0.10
-0.05
0.00
Re
v H
ea
t F
low
(W
/g)
-40 10 60 110 160
Temperature (°C)Exo Up Universal V4.5A TA Instruments
FF-PVP cast films
FF-PVP-HPMCAS cast films
FF-PVP-Eudragit cast films
FF-PVP-Soluplus cast films
FF-PVP-HPMCAS fibres
FF-PVP fibres
FF-PVP-Eudragit fibres
FF-PVP-Soluplus fibres

189
PXRD was used to further confirm the crystallinity and the polymorphic form of the FF
present in the electrospun fibres. The amount of sample obtained from the DVS
experiments was inadequate for the PXRD experiments. Hence, the fibrous samples were
incubated in the 75% RH desiccator instead. As seen in Figure 5.25, initially no FF crystals
were detected by PXRD in the electrospun fibres. Later, after exposure to 75% RH, there
were some FF crystallised in the FF loaded polymer blended fibres. In comparison to the
physical mixture of FF form I and polymers, the peak intensity of the FF polymer blends
is relatively low and the peaks are broad. This indicates that there was a small amount of
FF crystals or poor crystallinity in these samples. Considering the diffracted peak positions
observed in Figure 5.25a, it is unclear which FF polymorph crystallised in these samples,
but it is likely to be FF form I because it is the polymorph which usually observe in the
recrystallization of amorphous FF under 75% RH (10).
Figure 5.25 PXRD of FF loaded electrospun fibres: (a) before and after expose to
75%RH and (b) physical mixtures of FF and polymer in comparison to FF form I powder.
5 10 15 20 25 30 35 40
2θ( )
5 10 15 20 25 30 35 40
2θ( )
FF form I
FF-PVP physical mix
FF-PVP-HPMCAS physical mix
FF-PVP-Eudragit physical mix
FF-PVP-Soluplus physical mix
FF-PVP-HPMCAS fibres
FF-PVP fibres
FF-PVP-Soluplus fibres
FF-PVP-Eudragit fibres
FF-PVP-Soluplus fibres 75% RH
FF-PVP-Eudragit fibres 75% RH
FF-PVP-HPMCAS fibres 75% RH
FF-PVP fibres 75% RH
a
b
Enlarging 2.5 times

190
5.4 Discussion
5.4.1 Effect of moisture sorption on drug-polymer binary dispersions
The clarification of the drug-polymer and the polymer-polymer miscibility is an important
piece of information before dealing with a complex system composed of a drug in a
polymer blend matrix. The PVP-HPMCAS pair is miscible because it showed a single Tg.
However, PVP-Eudragit E and PVP-Soluplus blends are immiscible and phase separation
was observed in these systems (double Tg). The results of polymer miscibility are consistent
in both cast films and electrospun fibres. FF showed different miscibilities among the
polymers that had been used in this study. In the literature, theoretical miscibility could be
divided into three different classes according to the differences in the solubility parameter
(δ) between the two components: they are likely miscible (Δδ < 2 MPa1/2), partially miscible
(Δδ between 2 and 10 MPa1/2) and immiscible (Δδ > 10 MPa1/2) (33). Considering the δ
values of FF with PVP, HPMCAS, Eudragit E and Soluplus in Table 5.7, it suggests that
FF is miscible with HPMCAS, Eudragit E and Soluplus but only partially miscible with
PVP. On the contrary, PCM is theoretically highly miscible with PVP but partially miscible
with HPMCAS.
The experimental results indicated that FF is highly miscible with Eudragit E and Soluplus,
in which no FF crystal was observed. However, it is partially miscible with PVP and
HPMCAS, as seen from the recrystallization of the FF on the surface of the FF-PVP and
FF-HPMCAS cast films. PVP and FF have only carbonyl groups that are a hydrogen
acceptor in their structure. Thus, a weak hydrogen bond between the carbonyl group and
acidic C-H or dipole-dipole interaction can be established (34). This results in partial
miscibility between PVP and FF. From the HPMCAS structure in Figure 2.7, it has a
carboxylic group that can potentially form a hydrogen bond with a carbonyl group of FF.
However, the amount of carboxylic groups in HPMCAS is considered low (1 mmol.g-1),
and the steric hindrance of the HPMCAS structure impedes the hydrogen donor group from
bonding with FF (34). Therefore, FF and HPMCAS have weak molecular interactions that
contribute to a partial miscibility. From this information, it is possible to speculate that the
FF crystals observed in the FF-PVP-HPMCAS, FF-PVP-Eudragit E and FF-PVP-Soluplus
ternary solid dispersions are likely due to a partial miscibility of FF-PVP or FF-HPMCAS.
The PCM and PVP demonstrate a hydrogen donor (hydroxyl) and a hydrogen acceptor
(carbonyl) in their structure. Thus, they form a hydrogen bond in which they promote their
miscibility (11). On the contrary, the PCM and HPMCAS show a partial miscibility
because a hydrogen bond between PCM and HPMCAS is difficult to form. The structural
hindrance of a polymer chain and low number of carboxylic groups impedes the interaction

191
between PCM and HPMCAS (34). The details of the PCM interaction with PVP and
HPMCAS is discussed in Chapter 6.
Table 5.7 Calculated solubility parameter from Fedor’s method and Δδ between the
model drugs and polymers.
Materials δ(MPa1/2) Δδ of
polymer
and FF
Δδ of
polymer
and PCM
FF 21.5 - -
PCM 27.1 - -
PVP 28.2 7.7 1.1
HPMCASa 22.4 0.9 4.7
Eudragit E 20.5 1.0 -
Soluplus 23.5 2.3 -
a Taken from reference (20).
Humidity demonstrates a significant impact on the miscibility of the drugs and polymers.
The molecular mobility of the polymers and drug increases due to the plasticization effect
of the moisture. This results in an enhanced phase separation between the polymer-polymer
and drug-polymer (14, 15). The FF-PVP pair is partially miscible and the system is not in
equilibrium. Hence, the addition of moisture accelrelates the FF-PVP system toward to the
equilibrium which FF and PVP are phase separated. Futhermore, moisture also increases
the hydrophilicity of PVP. Consequently, the environment is less favourable for FF. Thus,
the miscibility of FF-PVP is reduced. In the PVP electrospun fibres, it is likely that the
structure collapse is due to the PVP domain absorbing moisture and weakening the
entanglement of the polymer chains in the fibres.
FF-HPMCAS is another example that shows a partial miscibility between the drug and
polymer. However, the amount of the crystalline FF observed remained the same after the
DVS isohumic 75%RH experiment. It is likely that FF increased the hydrophobicity of the
blends, which is supported by the reduction in the moisture absorption in comparison to the
HPMCAS raw material. In this particular case, the moisture does not affect the drug
recrystallization in the FF-HPMCAS system. The polymer-drug miscibility plays a greater
role than the moisture in the drug recrystallization.
No FF crystals were observed in the FF-Eudragit E cast films. The hydrophobicity of the
blend resulted in reduced moisture absorption in the FF-Eudragit E blends because the

192
moisture absorption decreased in comparison to the Eudragit E raw material. It should be
noted that the Tg of the FF-Eudragit E is lower than room temperature, hence the system is
in the rubbery state. The FF-Eudragit E system has high mobility but does not interact with
water. This is because of the hydrophobic propensity of FF and Eudragit. Despite the fact
that the FF-Soluplus cast film absorbed moisture more than the FF-HPMCAS and FF-
Eudragit E cast films and that it has a Tg close to room temperature, no FF crystals were
observed after the 75%RH isohumic experiment. From these results, the recrystallization
of FF in the FF-HPMCAS, FF-Eudragit E and FF-Soluplus pairs were not affected by
moisture. Thus, these polymers can prevent drug recrystallization in a high humidity
environment.
5.4.2 Effects of moisture sorption on ternary drug-polymer blend system
Incorporating FF into the system at 25% solid content did not significantly affect the
physical appearance of the electrospun fibres, since the overall appearance and average
diameter of the placebo and API loaded fibres were almost the same. Overall, both the FF
loaded and placebo electrospun fibres demonstrated a greater moisture sorption rate than
the cast films. This could be attributed to the higher surface area to volume ratio of the
fibres. The large surface area to volume ratio is one of the advantages of the electrospun
fibre formulations to increase the aqueous solubility of poorly water-soluble drugs (5, 35).
However, it is a double-edged sword, which potentially increases the moisture absorption
rate and results in fibrous structure deformation and recrystallization of the amorphous
drug.
FF-PVP-Eudragit E and FF-PVP-Soluplus
The deformation of the electrospun fibres was macroscopically observed as fibre shrinkage,
which was a consequence of the fibre network collapsing. The minor fibrous structure
collapse was observed in the placebo PVP-Eudragitand PVP-Soluplus blends. In contrast,
the FF loaded polymer blended fibres demonstrated a more dramatic morphological
deformation (fibres bent and twisted) than the placebo fibres. The mechanism of the fibre
structure deformation has not yet been reported in the literature. However, Rasekh et al.
and Yu et al previously described the mechanism of PVP electrospun dissolution (11, 36).
The authors explained that the dissolution process of a PVP electrospun fibre roots from
the polymer-solvent interaction being stronger than the polymer-polymer attractive force,
for example, PVP interacts with water better than with PVP. Therefore, PVP absorbed
water molecules rapidly leading to an increase in the volume of the polymer matrices.
Consequently, the polymer chains loosen from their coiled shape as fibres. The drug
entrapped in the PVP is released to the media (11). It is possible to speculate that at a high

193
RH (75%), PVP polymer chains of electrospun fibres loosen because water molecules were
absorbed and plasticised the fibres. However, this process is incomplete, unlike in the
dissolution process. The loose polymer chains cause an increase in their volume as seen
from the swelling of the fibres. Therefore, this leads to the shrinkage of the electrospun
fibre structure due to the uncoiled polymer chains, and the fibre structure collapses as
observed in the placebo and FF loaded PVP-Eudragit E and PVP-Soluplus electrospun
fibres.
Only a small amount of FF crystals were observed in the FF-PVP-Eudragit E and FF-PVP-
Soluplus fibres and cast films after the moisture sorption. It is speculated that the drug
probably distributes unevenly in the phase-separated polymers, in which FF likely
partitions to the Eudragit E or Soluplus domains rather than the PVP domain. This is
because of the dipole-dipole interaction of the drug and polymers (37) or because of their
similar hydrophobicity. Therefore, the majority of the amorphous drug is stabilised in the
Eudragit E or Soluplus phase, while the minority of the amorphous drug is crystallised in
the PVP phase. To strengthen the hypothesis of the uneven FF distribution among the phase
separation, the GT equation was used to estimate the amount of FF distributed throughout
each phase. However, we have to bear in mind that the experimental Tg of the FF loaded in
the Eudragit E and Soluplus demonstrated a negative deviation from the GT prediction
(approximately 15-17°C). This is a consequence of the stronger interaction among the like-
molecules (drug-drug and polymer-polymer) than the unlike molecules (drug-polymer)
(38). In addition, the Tg of the FF-PVP is not detectable in either the cast films or the
electrospun formulations.
Assuming that the FF is completly distributed to the Eudragit E or Soluplus phases in the
FF-PVP-Eudragit E and FF-PVP-Soluplus solid dispersions, the FF content in the Eudragit
E or Soluplus would be 40% because the polymer blend matrices contain PVP: Eudragit E
or Soluplus 1:1. The Tgs that were calculated from the GT equation at 40% FF in the
Eudragit E and Soluplus phases are 8.5 and 20 °C, respectively. We need to take into
account the negative deviation from the predicted values of approximately 15°C that was
observed in FF-Eudragit E and FF-Soluplus cast films. The expected Tg of the completely
distribution of FF into Eudragit E and Soluplus phases are -6.5 and 5°C, respectively. The
first Tgs that were detected by MTDSC in the FF-PVP-Eudragit E cast film, FF-PVP-
Soluplus cast film and FF-PVP-Eudragit E electrospun fibres are -5.8±1.5, 13.5±0.8 and -
2.6±1.8°C, respectively. This result indicates the uneven FF distribution in the FF-PVP-
Eudagit and FF-PVP-Soluplus that the majority of FF partitions to the Eudragit E and
Soluplus rich phases. The second Tg at 120°C is likely to be the PVP phase. However, the
Tg of the FF-PVP could not be measured from the cast films nor electrospun fibres. Hence,

194
it is difficult to estimate the amount of FF in the PVP phase because of the unknown
deviation of the experimental and predicted values.
Being on the safe side, it is certain that FF is less miscible in PVP than Eudragit E and
Soluplus. This was shown previously from the melting enthalpies observed in the FF-PVP
formulations and the Δδ of the FF and PVP. It is possible to conclude that the majority of
FF would distribute to the Eudragit E or Soluplus domains rather than the PVP. This
approach may not be a straightforward method that directly and precisely quantifies the
absolute amount of FF in each polymer phase, but it can be a rough guideline that indicates
the drug distribution to each phase due to their miscibility.
The small amount FF crystals observed in the FF-PVP-Eudragit E and FF-PVP-Soluplus
electrospun fibres after the moisture sorption at 75% RH was due to the majority of FF
molecules being in either the Eudragit E or Soluplus phases so that the FF was protected
from moisture. Therefore, the uneven distribution of the drug in the immiscible polymer
blends enhances the physical stability of the formulations. Figure 5.26a illustrates the FF
uneven distribution between the PVP and Eudragit E or Soluplus domains.
FF-PVP-HPMCAS
The PVP-HPMCAS polymer blend fibres exhibit an inverse property to the previous
systems (PVP-Eudragit E and PVP-Soluplus). The fibres withstand 75% RH without a fibre
structure rupture, even though they took up some moisture. The fibrous structure of the FF-
PVP-HPMCAS electrospun fibres also did not collapse, but numerous FF crystals were
observed on the fibre surface, with evidence from both MTDSC and SEM. Approximately
53% drug loaded recrystallized as FF form I after the fibres were incubated at 75% RH.
The mechanism behind this phenomenon is unclear but it is possible to speculate that it
may correlate to both moisture and the miscibility in this ternary solid dispersion, since the
FF-PVP-HPMCAS fibre structure could withstand 75% RH without the fibre structure
collapsing. Moisture could infiltrate into the whole fibrous architecture and induce
crystallisation of the amorphous FF in the interior fibrous structure. Additionally, the
recrystallization of the FF-PVP-HPMCAS fibres could contribute to the polymer-polymer
pair that has a better miscibility than the drug-polymer pair, in which the FF previously
showed a partial miscibility in both PVP and HPMCAS. Hence, it is speculated that the
amorphous drug domains initially blended homogeneously with the polymer matrices in
the dry state, as illustrated in (Figure 5.26b). After exposing the FF-PVP-HPMCAS fibres
to moisture, the PVP domains attract the moisture and lead to the increased mobility of the
FF molecules. This results in amorphous FF that does not interact with neither PVP nor
HPMCAS and was forced to mobilise to the surface of the fibres and crystallise. In contrast,
the FF-PVP-HPMCAS cast film showed a tiny amount of FF crystallinity after exposure to

195
75% RH because the moisture only triggers the FF crystallisation on the surface of the cast
films. This made the surface even more hydrophobic resulting in the prevention of moisture
from penetrating into the bulk of the cast film.
PCM-PVP-HPMCAS
Unlike the FF-PVP-HPMCAS dispersion, the PVP forms a hydrogen bond with PCM in
the PCM-PVP-HPMCAS electrospun fibres. These hydrogen bonds result in the moisture
protective effects of this formulation. They reduced the water uptake of the formulation
and prevented the drug from recrystallizing during exposing to 75% RH. The scenario for
the PCM-PVP-HPMCAS fibre moisture sorption is illustrated in Figure 5.26c. Most of
PCM molecules are allocated in the PVP phase rather than the HPMCAS due to the
hydrogen bond formation with PVP. After exposing the PCM-PVP-HPMCAS fibres to
moisture, a phase separation occurred as shown by the double Tg. The lower Tg phase,
which belonged to the free carbonyl PVP bond with water molecules, and the other phase
was at 85°C, which was similar to the Tg of the fresh PCM-PVP-HPMCAS fibres. The
single Tg at 85 °C was again obtained after complete water removal on the cooling cycle.
In this case, a double Tg did not contributed to a phase separation of PCM-PVP and PCM-
HPMCAS. If this scenario occurs, the Tg of each phase will show a larger difference due
to the Tg of the PCM-PVP shifting to a higher temperature than 85°C (the Tg of the PCM-
PVP estimated by the GT equation is at 119°C).
Furthermore, no crystallisation of PCM has been observed in the PCM-PVP-HPMCAS
fibres after the moisture sorption. Forster et al. reported that the solid dispersion of
indomethacin and PVP prepared by hot melt extrusion remained amorphous after storage
at 75% RH/25°C for eight weeks. While the extrudates of nifedipine and lacidipine with
PVP had their hydrogen bonds degraded due to 75% RH immediately crystallised (26). The
authors explained that the presence of hydrogen bonding in the solid dispersion resulted in
less free PVP carbonyl groups. Hence, they attracted less moisture. On the contrary, an
absence or degradation of the hydrogen bonding of the drug and PVP caused a greater
amount of free carbonyl groups, which potentially attracts moisture from the environment.
The high moisture absorbed by the PVP plasticised the solid dispersion, which leads to a
phase separation of the drug rich amorphous phase and eventually crystallisation (13). This
explanation agrees with the findings of FF-PVP-HPMCAS and PCM-PVP-HPMCAS as
ternary solid disprsions. The FF-PVP-HPMCAS fibres and cast films showed a greater
level of moisture sorption than the PCM-PVP-HPMCAS fibres. This potentially caused a
greater number of free carbonyl groups in FF-PVP-HPMCAS than PCM-PVP-HPMCAS.
Approximately half of FF loaded in the FF-PVP-HPMCAS fibre films crystallised into FF
form I, whereas no crystallisation of the PCM was observed in the PCM-PVP-HPMCAS

196
fibres after moisture sorption. This is a consequence of the hydrogen bonding of PVP and
PCM stabilising the drug in its amorphous state.
Figure 5.26 Schematic diagrams illustrating three different scenarios for the ternary
blend phase transformation under the influence of humidity: (a) drug miscible in one
polymer more than the other, (b) polymer-polymer more miscible than drug and (c) drug
binds to one polymer by hydrogen bonding (highly miscible).
Crystalline Fenofibrate
Amorphous Fenofibrate
PVP
Eudragit E or Soluplus
HPMCASAmorphous Paracetamol
water
waterwater
water
water
water
water
Dry stage 75% RH
water
waterwater
water
water
water
water
Dry stage 75% RHa
b
c
Dry stage 75% RH
water
water
water
water
water
water
water
water
water
water water
Water bound with PVP phase
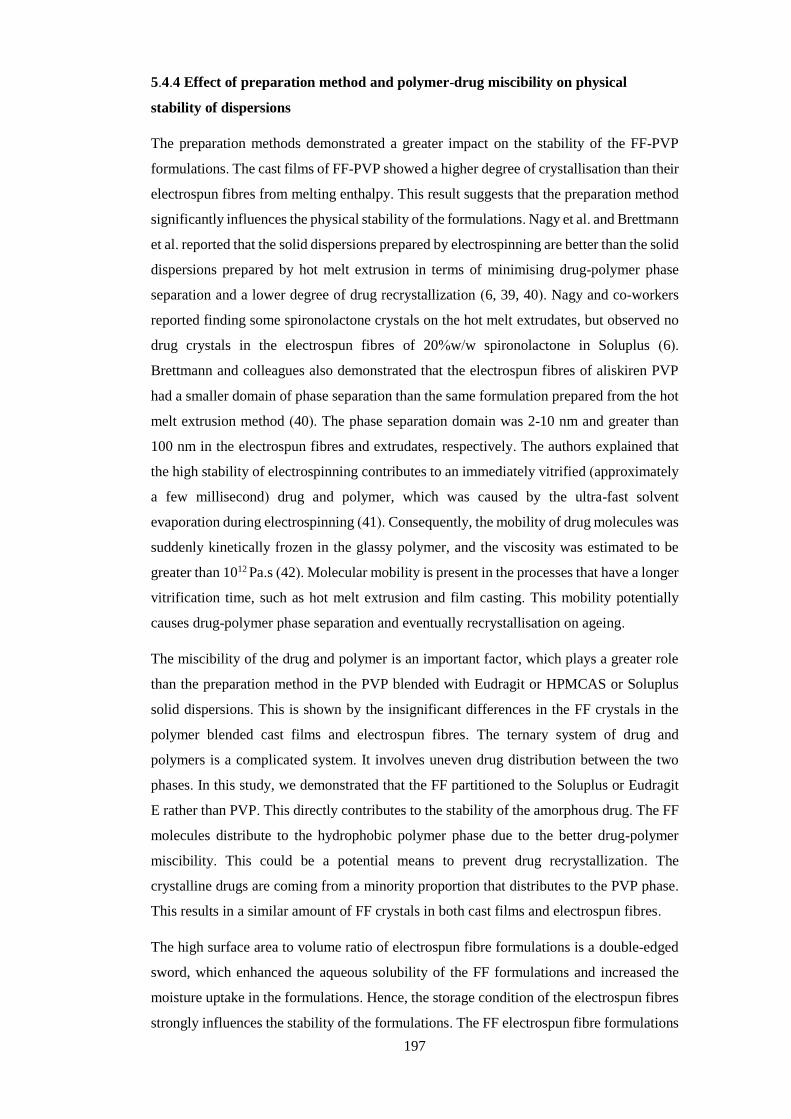
197
5.4.4 Effect of preparation method and polymer-drug miscibility on physical
stability of dispersions
The preparation methods demonstrated a greater impact on the stability of the FF-PVP
formulations. The cast films of FF-PVP showed a higher degree of crystallisation than their
electrospun fibres from melting enthalpy. This result suggests that the preparation method
significantly influences the physical stability of the formulations. Nagy et al. and Brettmann
et al. reported that the solid dispersions prepared by electrospinning are better than the solid
dispersions prepared by hot melt extrusion in terms of minimising drug-polymer phase
separation and a lower degree of drug recrystallization (6, 39, 40). Nagy and co-workers
reported finding some spironolactone crystals on the hot melt extrudates, but observed no
drug crystals in the electrospun fibres of 20%w/w spironolactone in Soluplus (6).
Brettmann and colleagues also demonstrated that the electrospun fibres of aliskiren PVP
had a smaller domain of phase separation than the same formulation prepared from the hot
melt extrusion method (40). The phase separation domain was 2-10 nm and greater than
100 nm in the electrospun fibres and extrudates, respectively. The authors explained that
the high stability of electrospinning contributes to an immediately vitrified (approximately
a few millisecond) drug and polymer, which was caused by the ultra-fast solvent
evaporation during electrospinning (41). Consequently, the mobility of drug molecules was
suddenly kinetically frozen in the glassy polymer, and the viscosity was estimated to be
greater than 1012 Pa.s (42). Molecular mobility is present in the processes that have a longer
vitrification time, such as hot melt extrusion and film casting. This mobility potentially
causes drug-polymer phase separation and eventually recrystallisation on ageing.
The miscibility of the drug and polymer is an important factor, which plays a greater role
than the preparation method in the PVP blended with Eudragit or HPMCAS or Soluplus
solid dispersions. This is shown by the insignificant differences in the FF crystals in the
polymer blended cast films and electrospun fibres. The ternary system of drug and
polymers is a complicated system. It involves uneven drug distribution between the two
phases. In this study, we demonstrated that the FF partitioned to the Soluplus or Eudragit
E rather than PVP. This directly contributes to the stability of the amorphous drug. The FF
molecules distribute to the hydrophobic polymer phase due to the better drug-polymer
miscibility. This could be a potential means to prevent drug recrystallization. The
crystalline drugs are coming from a minority proportion that distributes to the PVP phase.
This results in a similar amount of FF crystals in both cast films and electrospun fibres.
The high surface area to volume ratio of electrospun fibre formulations is a double-edged
sword, which enhanced the aqueous solubility of the FF formulations and increased the
moisture uptake in the formulations. Hence, the storage condition of the electrospun fibres
strongly influences the stability of the formulations. The FF electrospun fibre formulations

198
demonstrated a small degree of crystallisation under a 0% RH condition. All FF loaded
electrospun fibres developed fibre structure deformations in the presence of moisture.
Therefore, if the electrospun fibre formulations in this study were developed as an oral
dosage form, their containers would be an important factor that dictates the physical
stability of the dosage form. Thus, the recommended package of electrospun fibres should
be a single use unit that is made from polyvinylchloride laminated on aluminium foil
because moisture cannot penetrate this material (43). Therefore, it completely protects the
dosage forms from environmental humidity.
5.5 Conclusion
This study demonstrated the prospect of developing electrospun ternary solid dispersions
for oral drug delivery. The polymer blended electrospun fibres showed a remarkable
improvement for the FF dissolution in comparison to the crystalline FF. Additionally, the
use of PVP-HPMCAS blends demonstrated a potential for sustained release applications
as FF demonstrated the slowest release rate among the polymer blend formulations. We
speculated that the drug in PVP phase released first then follow by the sustained drug from
HPMCAS phase which was insoluble in the acidic media. In the moisture sorption study,
electrospun fibres showed a notably greater rate of moisture absorption than the cast film
formulations. This was attributed to the high surface area to volume ratio of the electrospun
fibres. Upon moisture sorption, the fibres underwent fibre structure deformation and
recrystallization of the amorphous FF. The drug-polymer miscibility played a major role in
stabilising the amorphous drug under the high humidity environment. Amorphous FF was
protected from moisture as the drug distributed to the Eudragit E or Soluplus rather than
the PVP because the drug has a higher miscibility to Eudragit E and Soluplus. In the FF-
PVP-HPMCAS blends, the PVP-HPMCAS pair has a better miscibility than the drug-
polymer pair, which resulted in the FF crystallising on the fibres. On the other hand, the
PCM molecules demonstrated a strong interaction with the PVP via hydrogen bonding.
This can stabilise the PCM in an amorphous form under the high humidity stress and
reduced the moisture uptake of the formulations. Therefore, polymer-polymer and drug-
polymer miscibility are important parameters that influence the physical stability of the
ternary blends of solid dispersions.

199
5.6 References
1. Huang Z-M, Zhang YZ, Kotaki M, Ramakrishna S. A review on polymer nanofibers by
electrospinning and their applications in nanocomposites. Composites Science and Technology.
2003;63(15):2223-53.
2. Munj HR, Nelson MT, Karandikar PS, Lannutti JJ, Tomasko DL. Biocompatible electrospun
polymer blends for biomedical applications. Journal of Biomedical Materials Research Part B: Applied
Biomaterials. 2014;102(7):1517-27.
3. Richard-Lacroix M, Pellerin C. Molecular Orientation in Electrospun Fibers: From Mats to Single
Fibers. Macromolecules. 2013;46(24):9473-93.
4. Rutledge GC, Fridrikh SV. Formation of fibers by electrospinning. Advanced Drug Delivery
Reviews. 2007;59(14):1384-91.
5. Lopez FL, Shearman GC, Gaisford S, Williams GR. Amorphous formulations of indomethacin and
griseofulvin prepared by electrospinning. Molecular Pharmaceutics. 2014;11(12):4327-38.
6. Nagy ZK, Balogh A, Vajna B, Farkas A, Patyi G, Kramarics Á, et al. Comparison of electrospun
and extruded soluplus®‐based solid dosage forms of improved dissolution. Journal of Pharmaceutical
sciences. 2012;101(1):322-32.
7. Yu D-G, Shen X-X, Branford-White C, White K, Zhu L-M, Bligh SA. Oral fast-dissolving drug
delivery membranes prepared from electrospun polyvinylpyrrolidone ultrafine fibers. Nanotechnology.
2009;20(5):055104.
8. Yang Z, Nollenberger K, Albers J, Craig D, Qi S. Microstructure of an Immiscible Polymer Blend
and Its Stabilization Effect on Amorphous Solid Dispersions. Molecular Pharmaceutics. 2013;10(7):2767-80.
9. Tipduangta P, Belton P, Fábián L, Wang LY, Tang H, Eddleston M, et al. Electrospun Polymer
Blend Nanofibers for Tunable Drug Delivery: The Role of Transformative Phase Separation on Controlling
the Release Rate. Molecular Pharmaceutics. 2016;13(1):25-39.
10. Alsulays BB, Park J-B, Alshehri SM, Morott JT, Alshahrani SM, Tiwari RV, et al. Influence of
molecular weight of carriers and processing parameters on the extrudability, drug release, and stability of
fenofibrate formulations processed by hot-melt extrusion. Journal of Drug Delivery Science and Technology.
2015;29:189-98.
11. Yu D-G, Branford-White C, White K, Li X-L, Zhu L-M. Dissolution improvement of electrospun
nanofiber-based solid dispersions for acetaminophen. AAPS PharmSciTech. 2010;11(2):809-17.
12. Nair R, Nyamweya N, Gönen S, Martınez-Miranda LJ, Hoag SW. Influence of various drugs on the
glass transition temperature of poly(vinylpyrrolidone): a thermodynamic and spectroscopic investigation.
International Journal of Pharmaceutics. 2001;225(1–2):83-96.
13. Vasanthavada M, Tong W-QT, Joshi Y, Kislalioglu MS. Phase behavior of amorphous molecular
dispersions II: Role of hydrogen bonding in solid solubility and phase separation kinetics. Pharmaceutical
research. 2005;22(3):440-8.
14. Marsac PJ, Rumondor AC, Nivens DE, Kestur US, Stanciu L, Taylor LS. Effect of temperature and
moisture on the miscibility of amorphous dispersions of felodipine and poly (vinyl pyrrolidone). Journal of
Pharmaceutical Sciences. 2010;99(1):169-85.
15. Rumondor AC, Marsac PJ, Stanford LA, Taylor LS. Phase behavior of poly (vinylpyrrolidone)
containing amorphous solid dispersions in the presence of moisture. Molecular Pharmaceutics.
2009;6(5):1492-505.
16. Djuris J, Nikolakakis I, Ibric S, Djuric Z, Kachrimanis K. Preparation of carbamazepine–Soluplus®
solid dispersions by hot-melt extrusion, and prediction of drug–polymer miscibility by thermodynamic model
fitting. European Journal of Pharmaceutics and Biopharmaceutics. 2013;84(1):228-37.
17. Rumondor ACF, Stanford LA, Taylor LS. Effects of Polymer Type and Storage Relative Humidity
on the Kinetics of Felodipine Crystallization from Amorphous Solid Dispersions. Pharmaceutical Research.
2009;26(12):2599-606.
18. Alshahrani SM, Lu W, Park J-B, Morott JT, Alsulays BB, Majumdar S, et al. Stability-enhanced
Hot-melt Extruded Amorphous Solid Dispersions via Combinations of Soluplus® and HPMCAS-HF. AAPS
PharmSciTech. 2015;16(4):824-34.
19. Fedors RF. A method for estimating both the solubility parameters and molar volumes of liquids.
Polymer Engineering & Science. 1974;14(2):147-54.
20. Marks JA, Wegiel LA, Taylor LS, Edgar KJ. Pairwise Polymer Blends for Oral Drug Delivery.
Journal of Pharmaceutical Sciences. 2014;103(9):2871-83.
21. Lu Q, Zografi G. Phase Behavior of Binary and Ternary Amorphous Mixtures Containing
Indomethacin, Citric Acid, and PVP. Pharmaceutical research. 1998;15(8):1202-6.
22. Vogel C, Wessel E, Siesler HW. FT-IR Imaging Spectroscopy of Phase Separation in Blends of
Poly(3-hydroxybutyrate) with Poly(l-lactic acid) and Poly(ϵ-caprolactone). Biomacromolecules.
2008;9(2):523-7.
23. Kazarian SG, Chan KLA. Sampling Approaches in Fourier Transform Infrared Imaging Applied to
Polymers. In: Grundke K, Stamm M, Adler H-J, editors. Characterization of Polymer Surfaces and Thin
Films. Berlin, Heidelberg: Springer Berlin Heidelberg; 2006. p. 1-6.
24. Konno H, Taylor LS. Influence of different polymers on the crystallization tendency of molecularly
dispersed amorphous felodipine. Journal of Pharmaceutical Sciences. 2006;95(12):2692-705.
25. Application note: ATR – Theory and Applications2011.

200
26. Forster A, Hempenstall J, Rades T. Characterization of glass solutions of poorly water-soluble
drugs produced by melt extrusion with hydrophilic amorphous polymers. Journal of Pharmacy and
Pharmacology. 2001;53(3):303-15.
27. Qi S, Belton P, McAuley W, Codoni D, Darji N. Moisture uptake of polyoxyethylene glycol
glycerides used as matrices for drug delivery: kinetic modelling and practical implications. Pharmaceutical
research. 2013;30(4):1123-36.
28. Al-Muhtaseb AH, McMinn WAM, Magee TRA. Moisture Sorption Isotherm Characteristics of
Food Products: A Review. Food and Bioproducts Processing. 2002;80(2):118-28.
29. Andrade P RD, Lemus M R, Perez C CE. Model of Sorption Isoterms for Food: Uses and
Limitations. Vitae. 2011;18:325-34.
30. Lewicki PP. The applicability of the GAB model to food water sorption isotherms. International
Journal of Food Science & Technology. 1997;32(6):553-7.
31. Waterman KC, Adami RC. Accelerated aging: Prediction of chemical stability of pharmaceuticals.
International Journal of Pharmaceutics. 2005;293(1–2):101-25.
32. Di Martino P, Palmieri G, Martelli S. Evidence of a metastable form of fenofibrate. Die Pharmazie.
2000;55(8):625-6.
33. Forster A, Hempenstall J, Tucker I, Rades T. The potential of small-scale fusion experiments and
the Gordon-Taylor equation to predict the suitability of drug/polymer blends for melt extrusion. Drug
Development and Industrial Pharmacy. 2001;27(6):549-60.
34. Kestur US, Van Eerdenbrugh B, Taylor LS. Influence of polymer chemistry on crystal growth
inhibition of two chemically diverse organic molecules. CrystEngComm. 2011;13(22):6712-8.
35. Ignatious F, Sun L, Lee C-P, Baldoni J. Electrospun nanofibers in oral drug delivery.
Pharmaceutical research. 2010;27(4):576-88.
36. Rasekh M, Karavasili C, Soong YL, Bouropoulos N, Morris M, Armitage D, et al. Electrospun
PVP–indomethacin constituents for transdermal dressings and drug delivery devices. International Journal of
Pharmaceutics. 2014;473(1–2):95-104.
37. Marsac PJ, Li T, Taylor LS. Estimation of Drug–Polymer Miscibility and Solubility in Amorphous
Solid Dispersions Using Experimentally Determined Interaction Parameters. Pharmaceutical research.
2008;26(1):139-51.
38. Taylor LS, Zografi G. Sugar–polymer hydrogen bond interactions in lyophilized amorphous
mixtures. Journal of Pharmaceutical sciences. 1998;87(12):1615-21.
39. Nagy ZK, Balogh A, Drávavölgyi G, Ferguson J, Pataki H, Vajna B, et al. Solvent-free melt
electrospinning for preparation of fast dissolving drug delivery system and comparison with solvent-based
electrospun and melt extruded systems. Journal of pharmaceutical sciences. 2013;102(2):508-17.
40. Brettmann B, Bell E, Myerson A, Trout B. Solid-state NMR characterization of high-loading solid
solutions of API and excipients formed by electrospinning. Journal of Pharmaceutical Sciences.
2012;101(4):1538-45.
41. Reneker DH, Yarin AL. Electrospinning jets and polymer nanofibers. Polymer. 2008;49(10):2387-
425.
42. Hancock BC, Zografi G. Characteristics and significance of the amorphous state in pharmaceutical
systems. Journal of Pharmaceutical Sciences. 1997;86(1):1-12.
43. Guilbert S, Cuq B, Gontard N. Recent innovations in edible and/or biodegradable packaging
materials. Food Additives & Contaminants. 1997;14(6-7):741-51.

201
6. Chapter 6: Electrospun Polymer Blend Nanofibers for Tunable Drug Delivery:
The Role of Transformative Phase Separation on Controlling the Release Rate
6.1 Introduction
In the previous chapter we explored the use of electrospun fibrous formulations of polymer
blends of hydrophilic, PVP and hydrophobic polymers, including Eudragit E, Soluplus and
HPMCAS, to enhance the aqueous solubility and the physical stability of the FF. However,
the results showed the apparent miscibility of the polymer-polymer and the drug-polymer
as being the key parameter that determined the physical stability of the formulations. The
apparent miscibility of the polymer-polymer and drug-polymer can be alternated using
different solvents (1). Al-obidi et al. showed that using acetone/water and acetone/methanol
as the vehicle for a griseofulvin-PVP-poly[N-(2-hydroxypropyl) methacrylate] (PHPMA)
ternary solid dispersion resulted in different Tg values and physical stabilities of the drug
(1). The preparation methods can influence the phase separation scale of the drug-polymer
binary system. Brettman and Nagy reported that the use of electrospinning can minimise
the phase separation of the drug and polymer to the nanoscale in comparison to HME (2,
3). Preparation methods can be a potential means to intentionally manipulate different
scales of phase separation. In addition, the PVP-HPMCAS blend showed the potential of
providing a modified release formulation. Modified release is often a desirable feature for
certain types of controlled drug release. Yu et al. prepared a polymer blend of PVP and
ethyl cellulose using coaxial electrospinning, which manipulated the core-shell structure
phase separation in the electrospun fibre structures (4). This resulted in modified drug
loading, in which the outer layer of PVP released the API as a burst release and then there
was a sustained release from the ethyl cellulose phase. Therefore, this chapter will focus
on exploring the tuneability of the modified release feature of PVP-HPMCAS blends.
One of the aims of this chapter was to provide an improved understanding to fill this
knowledge gap. The use of dichloromethane (DCM) and ethanol (3:7) as a solvent for PVP-
HPMCAS resulted in the blend being miscible (Chapter 5). In this chapter, 9:1 ethanol:
water was used for the blending of PVP-HPMCAS. It was expected to alter the apparent
miscibility of the PVP-HPMCAS blend. The use of different solvent systems can affect the
polymer conformation after the solvent removal process (1). Consequently, the apparent
miscibility of the polymer can be modified using different solvents. Another aspect of this
is to evaluate different preparation methods, including film casting, spin-coating and
electrospinning, which have different rates of solvent evaporation. This is expected to
influence the scale of the phase separation in the PVP-HPMCAS blends.

202
To produce controlled drug delivery systems using electrospun fibres, it has been
empirically accepted in the literature that the blending of hydrophilic and hydrophobic
polymers can improve the drug loading efficiency and reduce the burst release of drugs (5-
9). However, there is little known on how the phase behaviour of the polymer blends
contributes to the in vitro drug release behaviour of the electrospun fibres. Therefore, the
transformation of the phase separation of the electrospun blend fibres upon wetting was
investigated. For the PVP-HPMCAS blends, PVP is a hydrophilic polymer that can provide
a fast drug release (10, 11), while HPMCAS is a pH dependent dissolved polymer that can
only dissolve at a pH greater than five (12). Therefore, this blend can potentially provide a
modified drug release. The mechanism of the modified release was evaluated. The PVP-
HPMCAS fibres were loaded with a model drug, PCM. In contrast to other electrospinning
techniques, such as co-axial electrospinning in which different polymer phases are
artificially separated to create a core and outer coating shell (5, 7, 8), the behaviour of the
nanofibers containing two polymers and a model drug produced via solvent evaporation
during single spinneret electrospinning is expected to be more complex. In this chapter, co-
axial electrospinning (CS-ES) fibres that should have a designed core-shell structure were
used in comparison with the behaviour of the single spinneret electrospinning (SS-ES)
polymer blend fibres.
6.2 Methodology
6.2.1 Preparation of cast film, spin-coated films and electrospun fibers of PVP-
HPMCAS blends
A 10% w/v PVP-HPMCAS solution was prepared for film casting, spin-coating and SS-
ES. PVP and HPMCAS at a weight proportion of 1:1 were precisely weighted and
dissolved in ethanol:water (9:1 v/ v). The solution was stirred and sonicated until all solid
material was completely dissolved. For film casting, 500 μL of the solution was applied to
a Teflon coated plate (20 × 20 cm) and dried under ambient conditions in a fume cupboard
for 24 h. For spin-coated samples, a few drops of the PVP-HPMCAS solution were applied
on a glass substrate, which was spun at 2000 rpm for 3 min using a SCS G3P-8 lab scale
spin coater (Indianapolis, USA). A custom-made single spinneret electrospinning device
was used to prepare the polymer blend fibres at a constant flow rate of 1.5 mL.h-1 and a
voltage of 15 kV. The distance from the spinneret to the grounded rotating drum collector
(coated with aluminium foil) with a spinning rate of 500 rpm was fixed at 15 cm. For CS-
ES, ethanol:DCM (7:3 v/v) was used as the solvent to ensure rapid solvent evaporation and
to minimize the mixing at the core-shell interface. The solutions of the core (HPMCAS)
and sheath (PVP) layers were prepared separately. The solutions of the core and sheath

203
layers were fed from separate syringe pumps at rate 0.5 mL.h-1 to the coaxial needle. All
electrospinning experiments were performed under the conditions of 20 ± 2 °C and 40 ±
5% RH. After the electrospinning process, the fibre mats were peeled from the collector
and stored in a 0% RH desiccator filled with phosphorus pentaoxide prior to analysis.
6.2.2 Preparation of drug loaded electrospun fibres
The solid state drug contents for all formulations studied were fixed at 25% (w/w). SS-ES
solutions with a 10% w/v solid content were prepared by dissolving precisely weighed PVP
and HPMCAS at weight ratios of 3:1, 1:1 and 1:2 into an ethanol-water mixture. PCM was
then dissolved into the polymer solutions. The solutions were stirred and sonicated until all
solid content was dissolved. The solid-state drug loading for the core and shell layers of
the CS-electrospun fibres was 12.5% (w/w). The same SS- ES and CS-ES operation
parameters as described above were used for the preparation of the drug loaded fibre mats.
6.2.3 Tg estimation using GT equation
The GT equation, as modified by Lu et al. (13), was used to estimate the Tg of the placebo
PVP-HPMCAS blend and the ternary PCM-PVP-HPMCAS blends at PVP:HPMCAS
ratios of 3:1, 1:1 and 1:2. The GT equation was described in section 5.2.7. The ΔCp values
of PVP, HPMCAS and PCM were experimentally measured using MTDSC as 0.290, 0.270
and 0.508 J.g-1·C-1. The estimated Tgs of the polymer blends and ternary blends are reported
in Table 6.2.
6.2.4 Characterisation methods
In this chapter, a range of characterisation techniques were employed to characterise the
ternary blended formulations of PCM-PVP-HPMCAS, which were MTDSC, ATR-FTIR,
PXRD, LTA and ss-NMR. For the experimental details of these characterisation techniques
refer to sections 2.4.2.2, 2.4.5.2, 2.4.7.4, 2.4.11.3 and 2.4.12.2, respectively.
6.2.5 Fibrous morphology study
SEM and TEM were used to investigate the external and internal morphologies of the
placebo PVP-HPMCAS fibres and ternary PCM-PVP-HPMCAS fibres. SEM and TEM
analyses were performed according to the procedures described in sections 2.4.8.2 and
2.4.9.2, respectively.

204
6.2.6 Disintegration and wettability studies of electrospun fibre mats
Pieces of drug-loaded SS-ES and CS-ES fibre mats were cut into areas of approximately
4x4 cm and transferred to plastic Petri dishes filled with 10 ml of British Pharmacopoeial
HCl dissolution medium (pH 1.2). The disintegration processes of different electrospun
fibre mats were recorded using a COOLPIX P510 digital camera (Nikon, Japan).
6.2.7 In vitro drug release studies of drug loaded electrospun fibre mats
All in vitro drug release experiments were performed according to the procedure described
in section 2.6.2. British Pharmacopoeia HCl dissolution medium (900 mL) (pH 1.2) was
used for each dissolution vessel. Electrospun fibre mats containing the equivalent of 5 mg
PCM were used for the release tests to ensure sink conditions. The PCM released from the
electrospun fibres was evaluated by UV-VIS spectroscopy, which was described in section
2.6.3. All UV-VIS measurements were performed in triplicate.
6.2.8 Release data analysis and statistical evaluation
The PCM release kinetics of the polymer blended electrospun fibres were assessed by
fitting to the power law (equation 2.7) and biphasic released model (equation 2.9) to
investigate the drug release mechanism. The principles of these mathematic models were
described in sections 2.7.1.1 and 2.7.1.2, respectively. Then, the AICc statistical analysis
was performed to assess the quality of these models. The procedure for the AICc analysis
is referred to in section 2.7.1.3.
6.3 Results
6.3.1 Processing effect on phase separation of PVP-HPMCAS blends
The theoretical miscibility of PVP and HPMCAS was estimated to provide an indication
of the intrinsic mixing behaviour of the two polymers in the absence of any effects induced
by processing. The most widely used method for miscibility estimation is comparing the
solubility parameters (δ) of the two polymers. Similar solubility parameter values indicate
good miscibility between the two components (14). In the literature, miscibility predictions
are categorised based on the ∆δ values being likely miscible (∆δ <2 MPa1/2), partially
miscible (∆δ between 2 and 10 MPa1/2) and immiscible (∆δ >10 MPa1/2) (14). From the
solubility parameter calculated by Fedor’s group contribution method, the δ are 28.2, 27.2
and 22.4 MPa1/2 for PVP, PCM and HPMCAS, respectively (15, 16). The ∆δ between
HPMCAS and PVP is 5.8, suggesting partial miscibility between the two polymers. For

205
such partially miscible blends, the non-equilibrium apparent miscibility is expected to be
affected by additional processing. To gain a comparative understanding of the effect of
processing on the phase separation behaviour of polymer blends, four different solvent
evaporation based methods were used to prepare PVP-HPMCAS 1:1 (w/w) blends. These
include conventional film casting, spin-coating and SS- and CS-electrospinning. The
thicknesses of the cast and spin-coated PVP-HPMCAS blend films were 90±5μm and
5±1.5µm, respectively. These films were opaque and brittle after complete solvent removal,
whereas the electrospun fibre mats were flexible and easily peeled off from the collector
surface.
The SEM images reveal a rougher surface morphology of the cast films, containing cracks
and holes in comparison to the spin-coated films (Figure 6.1A and B). The spin-coated
film surface is densely packed with sub-micron semi-spherical morphologies. These
surface features were further characterised using AFM and LTA. As seen in Figure 6.1C
and D, the diameters of the semi-spherical islands are circa 6±1.8µm and below 1μm for
the cast and spin-coated films, respectively.

206
Figure 6.1 Morphologies of PVP-HPMCAS 1:1 blend films using SEM: (A) cast film
and (B) spin-coated film, and AFM: (C) cast film and (D) spin-coated film, with 2D (left)
and 3D (right) topography images.
The LTA results of the cast and spin-coated films are shown in Figure 6.2. The temperature
at the onset of the deflection of the nano-TA signal indicates the softening temperature of
the tested material surface. The spin-coated pure HPMCAS films show a transition
temperature at approximately 158±2.5 °C, which is about 20°C higher than the Tg of the
polymer when tested using MTDSC. This phenomenon has been observed and reported in
the literature previously when comparing LTA measurements with DSC responses (34). It
is believed that the measurable transition using LTA is a softening response relative to the
pressure exerted by the probe, which is different from the Tg of the bulk material measured
0.389 µm
0.389 µm
-0.569 µm
50 µm
50 µm
25 µm
25 µm
0µm
0µm

207
using DSC. The rapid heating rates used for LTA experiments could also contribute to the
overshoot of the transition measured by LTA. The LTA results of the spin coated PVP K90
films show continuous softening from the ambient temperature (Figure 6.2B), which
indicates the high fluidity of the surfaces of the PVP films. Similar results have been
reported previously for PVPVA films (35). This may be associated with the highly
hygroscopic nature of the polymer, which leads to significantly plasticized surfaces of the
films with a high moisture content. The LTA results for the PVP-HPMCAS cast films
(Figure 6.2C) are similar to the results of the pure PVP films, with continuous softening
from the ambient temperature. This may indicate the likelihood of PVP covering the outer
surfaces of the blend films prepared by the conventional casting method. The relatively
slow solvent evaporation may allow the phase separation of the two polymers into layers.
The LTA results of the spin coated films (Figure 6.2D) show a higher softening
temperature at approximately 55°C, which is still much lower than the Tg of the individual
polymers and the predicted Tg of the PVP:HPMCAS 1:1 blend. The fact that the softening
temperature has shifted to a higher temperature in comparison to cast films indicates less
phase separation of the PVP from the blend and the presence of a certain proportion of
HPMCAS at the top surface of the spin-coated films.
Figure 6.2 LTA results of (A) spin-coated HPMCAS film, (B) spin-coated PVP film, (C)
PVP-HPMCAS 1:1 cast film and (D) PVP-HPMCAS spin-coated film.
Pure PVP and HPMCAS had distinct Tg, which were 176.4±2.0°C and 122.0±2.2°C,
respectively. The phase separations in the cast and spin-coated films are clearly evident in

208
the MTDSC results for the films. As seen in Figure 6.3, there is a double Tg in the MTDSC
result for the physical mixture of PVP-HPMCAS with a 1:1 ratio. These two Tgs are highly
similar to the Tg of each polymer alone, which indicates the low miscibility between the
two polymers (3). As illustrated in Figure 6.3, double Tgs at similar temperatures to those
observed in the physical mixtures are also seen in the cast and spin-coating blend films,
which indicates a significant phase separation of the PVP and HPMCAS phases in these
films.
Figure 6.3 Reversing signals of MTDSC results of (A) physical mixture of PVP and
HPMCAS (1:1 w/w), (B) conventional cast polymer blend films, (C) spin-coated polymer
blend films, (D) co-axial CS-electrospun fibres with PVP as the shell and HPMCAS as
the core and (E) SS-electrospun polymer blend fibres.
The electrospun fibre mats are flexible films on a macroscopic scale. The SEM images of
the electrospun fibres show smooth surfaces with no beading (Figure 6.4). The average
diameters of the SS- and CS-electrospun fibres are 0.41± 0.22 µm and 1.37±0.47 µm,
respectively. A bimodal diameter distribution is observed for both types of fibres, which
contributes to the high standard deviation values seen in both cases. This relatively large
variation in diameter, in particular for the SS-electrospun fibres, may be caused by clogging
at the tip of the spinnerets, which leads to multi-Taylor cone formation during the
electrospinning (12).
-0.5
0.0
0.5
1.0
1.5
2.0
Rev
Cp (
J/(g
·°C
))
90 140 190
Temperature (°C) Universal V4.5A TA Instruments
122.0 ± 0.9 °C
175.9 ± 0.9 °C
176.0 ± 0.8 °C
121.0 ± 1.1 °C
122.2 ± 0.7 °C
176.2 ± 0.9 °C
173.6 ± 1.3 °C
122.2 ± 0.4 °C
A
B
C
D
E

209
Figure 6.4 SEM images and histograms of fibre diameter distributions of (A) SS-
electrospun PVP-HPMCAS 1:1 blend fibres and (B) CS-electrospun PVP-HPMCAS 1:1
blend fibres.
The phase separation in the PVP: HPMCAS (1:1) electrospun fibres was first examined
using thermal methods. Due to the submicron dimensions of each single fibre, a localised
single-point characterisation by the LTA on the fibres was extremely challenging, thus
making it difficult to obtain reliable results. Therefore, LTA was not used to study the
fibres, but MTDSC was used to determine the phase separation of the fibres as a bulk mat.
Clearly separated double Tgs are shown in the MTDSC results for the CS-ES core-shell
fibre mats. This was expected as the polymers were not blended, but separately formed as
the core and shell of the fibres. The formation of well-separated core and shell layers was
confirmed by the TEM results for the CS-electrospun fibres (Figure 6.5). However, for
the SS-ES fibres, no clear double Tg could be detected using the reversing Cp signal.
A
B
0.5 1.0 1.5 2.0 2.5
0
2
4
6
8
10
12
14
16
18
Fre
qu
en
cy
Diameter (um)
0.1 0.2 0.3 0.4 0.5 0.6 0.7 0.8
0
5
10
15
20
Fre
qu
en
cy
Diameter size (um)

210
Figure 6.5 TEM images of (A) the placebo CS-electrospun fibres with PVP as the shell
layer and HPMCAS as the core and (B) the CS-electrospun PVP and HPMCAS fibres
after PCM incorporation into both core and shell with equal loading.
To further characterise the phase separation behaviour of the blends (PVP: HPMCAS 3:1,
1:1 and 1:2 w/w) proton-NMR relaxometry was used (2, 17-19). The 1H spin lattice
relaxation time in the laboratory frame (T1) and the spin lattice relaxation time in a rotating
frame (T1ρ) of the placebo SS-electrospun fibres are summarised in Table 6.1. It can be
seen that for all fibre samples a single T1 relaxation time was obtained, whereas a double
exponential T1ρ relaxation was detected for all blended fibres. The presence of a two-
component T1ρ behaviour indicates that on this time scale two separately relaxing domains
exist; whereas, for the T1 time scale, the polarisation exchange rates are such that complete
mixing of the polarisation occurs. Assuming that mixing is by the process of spin diffusion,
it is possible to use these results to estimate the order of magnitude of the domains involved
(17). For laminar geometry the criterion for diffusive exchange between two regions that
is slow enough to allow the observation of two or more relaxation processes is given by:
……………………………..( 6.1)
where A is the laminar dimension, D is the relevant diffusion coefficient and Δγ is given
by:
∆𝛾 = (1
𝑇𝑎−
1
𝑇𝑏)…………….……………………( 6.2)
where Ta and Tb are the relaxation time of the phase a and b, respectively. Note that it is
important to use the differences in relaxation rate rather than a single relaxation rate. In the
case of the T1 data, it is apparent (Table 6.1) that blending the polymers using
electrospinning resulted in a single T1 that is shorter than the T1 of either of the polymers
2 µm2 µm
1.39 µm
0.36 µm
A B
1)/(22 22 DA

211
on their own. If the values of relaxation times converge on mixing, then is around zero
and no discrimination between sites is possible. If, however, the differences between
components remain the same order as in the separate components, then has a value of
about 1. The value of D may be as high as 8x10-16 m2s-1 in immobile polymers (18) but as
low as 0.5x 10⁻¹⁶ m2s-1 in mobile polymers (19), thus the possible range of A is between 8
and 30 nm. However, the observation of a single relaxation time of the polymer blends
could imply a complete mixing of the polymers. Alternatively, if some immiscibility exists,
since is unknown and may be greater or less than 1 a definitive estimate of the domain
size is not possible. The observation of a single exponential relaxation, therefore, cannot
be used as a reliable guide for domain size. However, the change in T1 is such that it cannot
be the weighted average of the individual T1’s of the polymers and is indicative of some
physical or chemical change in the system on electrospinning.
Table 6.1 ss-NMR results (T1 (1H) and T1ρ (1H)) of the raw materials and blend formulations
with (25% w/w) and without PCM.
Material T1(
1H)(ms) T1ρ(
1H)(ms)
PVP 269 6.9
HPMCAS (LF) 214.0 3.0
Crystalline PCM 93000 N/A
PVP:HPMCAS 3:1 165.0 1.4 ± 0.3 10 ± 2.0
PVP:HPMCAS 1:1 150.0 1.0 ± 0.3 5.9 ± 0.6
PVP:HPMCAS 1:2 175.0 1.0 ± 0.2 5.5 ± 0.4
PCM PVP:HPMCAS 3:1 277.0 0.32 ± 0.09 3.1 ± 0.3
PCM PVP:HPMCAS 1:1 293.0 0.2 ± 0.04 2.5 ± 0.1
PCM PVP:HPMCAS 1:2 299.0 1.51
PCM:PVP 199.0 1.7
PCM:HPMCAS 222.0 0.7
212
Better estimates of domain size are afforded by the observation of multiple exponential T1ρ
relaxations. The observation of a double exponential decay implies that there must be at
least two populations of protons in the system. However, it cannot be concluded that the
two systems are not in exchange since the ratios of the populations of the two relaxation
components do not scale with the relative proton populations of the polymers in the
materials. This may be due to mixed but separate phases being formed or because of the
mixing of the spin populations by spin diffusion. Assuming that the differences in
relaxation rates of the two populations are the same as that for the pure components and
recognising that under spin locking conditions the value of D is halved (i.e., D=4x10-16)
(20), the upper limit for A is 3 nm. If D is at the lower limit the value of A is of the order of
0.5 nm. If the difference in relaxation rates is taken as that between the two components
measured in the mixtures, the values are in the order of 1.5 and 4 nm. Given the
approximations involved, the conclusion is that the dimensions of the separated phases
must be greater than a few nanometers.
6.3.2 Effect of drug incorporation on phase separation of electrospun blend fibres
Drug incorporation led to a slight morphological change in the SS-ES blend fibres. As seen
in Figure 6.6, smooth cylindrical fibres can be seen without beading or obvious drug
crystals for all PVP: HPMCAS blend ratios. The average diameters of the drug loaded SS-
ES blend fibres are 1.15±0.48 µm, 0.52±0.24 µm and 1.69±0.30 µm for PVP-HPMCAS
with ratios of 3:1, 1:1 and 1:2, respectively. Bimodal distributions of the diameters of the
fibres are still observed in the PVP-HPMCAS blends with ratios of 3:1 and 1:1, but with a
1:2 ratio a more uniform fibre diameter is achieved. Interestingly, for the CS-ES fibres after
drug incorporation, despite no obvious morphological changes, the separation of the core
and shell layers is no longer evident by TEM (Figure 6.5). The average diameters of the
drug loaded core-shell fibres were 1.1± 0.2 μm. This is likely to be a result of the change
in the miscibility between the phase-separated domains after the drug partitioning into the
phases. Therefore, the miscibility of the PCM in the two polymers was first estimated using
the solubility parameter method (14, 21). The ∆δ of the PCM-PVP and PCM-HPMCAS
were 1 and 4.8, respectively, which indicates that the PCM has a better miscibility with
PVP than HPMCAS and the PCM-PVP and PCM-HPMCAS phases are partially miscible.
This suggests that there is likely to be a higher partition of PCM into the PVP-rich phase
than the HPMCAS-rich phase. This prediction was further tested using ATR-FTIR
spectroscopy, MTDSC and ss-NMR.

213
Figure 6.6 SEM images and histograms of the diameter distributions of SS-electrospun
25% PCM loaded PVP-HPMCAS blends fibres with PVP: HPMCAS ratios of (A) 3:1,
(B) 1:1 and (C) 1:2.
In the first instance, the contribution of the drug-polymer molecular interaction to the
miscibility was assessed using ATR-FTIR spectroscopy. After incorporation into the
polymer fibres, the PCM related peaks in the ATR-FTIR spectra of the drug-loaded fibres
all show clear amorphous features (Figure 6.7). The carbonyl stretching of HPMCAS (at
1732 cm-1) in the spectra of HPMCAS-PCM fibres shows no significant shift in position in
comparison to that of pure HPMCAS (at 1735 cm-1). The single PVP carbonyl peak (which
is at 1663 cm-1 for pure PVP) developed into a doublet peak at 1657 and 1650 cm-1 in the
spectra of the PVP-PCM fibres. This indicates a hydrogen bonding interaction between the
PVP and the PCM (22). This PVP-PCM interaction is likely to contribute to the higher
miscibility between the two in comparison to the PCM-HPMCAS system.
0.2 0.4 0.6 0.8 1.0 1.2 1.4 1.6 1.8 2.0 2.2
0
2
4
6
8
10
12
14
16
18
Fre
qu
en
cy
Diameter size (um)
0.2 0.4 0.6 0.8 1.0 1.2
0
5
10
15
20
Fre
qu
en
cy
Fibre diameter (um)
0.8 1.0 1.2 1.4 1.6 1.8 2.0 2.2 2.4 2.6 2.8
0
5
10
15
20
Fre
qu
en
cy
Fibre diameter (um)
A
B
C

214
Figure 6.7 Partial ATR-FTIR spectra of raw materials and 25% PCM loaded SS-
electrospun fibres (A) PCM PVP-HPMCAS 3:1, (B) PCM PVP-HPMCAS 1:1, (C) PCM
PVP-HPMCAS 1:2, (D) PCM-PVP, (E) PCM-HPMCAS, (F) PVP as received, (G)
HPMCAS as received, (I) PCM form I and (J) amorphous PCM prepared by melt-cool
method. (The dashed line box highlights the PVP carbonyl peak that shifted to a lower
wavenumber after the incorporation of PCM.)
The spectra of the PVP-HPMCAS-PCM fibres show similar trends to the carbonyl peak of
PVP shifting to lower wavenumbers and no significant shift for HPMCAS. For these blend
samples, the doublet carbonyl peaks at 1656 and 1651 cm-1 can be clearly seen. These peaks
are associated with hydrogen bonded PVP and PCM. The shift of the PVP carbonyl peak
to lower wavenumbers is more significant than that of the HPMCAS carbonyl peak in the
spectra of the blend formulations. This suggests that in the blend formulations PCM has a
more favourable and stronger interaction with PVP via hydrogen bonding than with
HPMCAS. This leads to the prediction of more PCM partitions into the PVP-rich phases
than the HPMCAS-rich phases in the drug-loaded fibres. This could potentially have
significant implications in modulating the drug release of such fibres.
The phase separation was further studied using MTDSC. As seen in Figure 6.8, the DSC
results of the single polymer-PCM fibres show single Tgs at 115.1±1.1 and 57.6±1.4°C for
PVP-PCM and HPMCAS-PCM, respectively. According to the GT prediction (under ideal
mixing), the experimental PCM-PVP Tg was relatively close to the predicted value,
whereas a significant negative deviation was observed between the prediction and
experimental Tg values of the PCM-HPMCAS blend (Table 6.2). In the literature, a

215
negative deviation from the GT prediction is usually attributed to stronger drug-drug and
polymer-polymer intermolecular interactions than drug-polymer interactions (23). This
again indicates the low level of PCM-HPMCAS interaction in comparison to that of the
PVP-PCM. A small melting enthalpy was detected in the PCM-HPMCAS fibres at
153.3±0.2°C, which is likely to be the depressed melting of the crystalline PCM. The
presence of the crystalline PCM in the HPMCAS fibres further indicates the lower
miscibility between the HPMCAS with PCM in comparison to the PVP.
Figure 6.8 MTDSC results of SS-ES fibres of (A) PCM-PVP and (B) PCM-HPMCAS as
well as (C) raw material PVP and (D) HPMCAS.
In comparison to the inconclusive MTDSC results of the placebo SS-electrospun fibres, the
MTDSC results of all drug loaded SS-electrospun blend fibre samples exhibit a single Tg
with no melting of PCM (Figure 6.9), which suggests the fibres are molecular dispersions
of PCM in polymers. This is a significant observation and a clear indication of the improved
miscibility between the components of the ternary system (PCM-PVP-HPMCAS), which
is a result of the drug incorporation. This was further confirmed by the PXRD results
(Figure 6.10). As seen in Table 6.2, the experimental Tg of the PCM loaded polymer blend
fibres demonstrated greater negative deviations from the GT predictions with increasing
HPMCAS content in the formulation (24). This can be attributed to the weaker PCM-
HPMCAS interaction suggested previously by the ATR-FTIR spectroscopy data. The PCM
loaded CS-ES core-shell fibres (PVP:HPMCAS 1:1) also show a single Tg at 86.2±1.5°C,
which indicates mixing of the core and shell layers of the fibres with drug incorporation.

216
Figure 6.9 MTDSC results of 25% PCM loaded single polymer fibre mats and PVP-
HPMCAS blend fibre mats. (A) PCM-PVP, (B) PCM-HPMCAS, (C) PCM-PVP-
HPMCAS 1:2, (D) PCM-PVP-HPMCAS 1:1, (E) PCM-PVP-HPMCAS 3:1 and (F)
PCM-PVP-HPMCAS 1:1 core-shell electrospun fibres.
Table 6.2 Comparison of experimental and theoretical glass transition temperatures (Tg)
of all formulations predicted using GT equation.
Materials Tg (°C) GT predicted Tg(°C)
PCM 25.3±1.3a -
PVP 176.4±2.0a -
HPMCAS 122.0±2.2a -
PCM-PVP 115.1±1.1b 119
PCM-HPMCAS 57.6±1.4b 86
PVP-HPMCAS
3:1
1:1
1:2
163.4±1.2b
149.2±1.3b
139.3±2.1b
160
151
140
PCM-PVP-HPMCAS
3:1
1:1
1:2
105.5±2.0b
93.4±1.4b
83.4±1.3b
110
101
96
a Measured by MTDSC from raw materials.
b Measured by MTDSC using electrospun materials.
-2
0
2
4
Rev C
p (
J/(
g·°
C))
5 55 105 155
Temperature (°C) Universal V4.5A TA Instruments
115.1 ± 1.1 °C
57.6 ± 1.4 °C
105.5 ± 2.0 °C
93.4 ± 1.4 °C
83.4 ± 1.3 °C
86.2 ± 1.5 °C
A
D
B
F
E
C

217
Figure 6.10 Comparison of PXRD patterns of physical mixtures (PVP, HPMCAS and
PCM powder) and PVP-HPMCAS blend electrospun fibres loaded with PCM. PVP-
HPMCAS physical mixture ratios (w/w) of 3:1 (A), 1:1 (B) and 1:2 (C). The PVP-
HPMCAS blend electrospun fibres with polymer ratios of 3:1 (D), 1:1 (E), 1:2 (F) and
PCM crystalline form I (H).
The phase separation of the PCM loaded polymer blend fibres was further investigated
using NMR relaxometry. Relaxation times were measured in all PCM-loaded fibres (Table
6.1). Single exponential T1’s were observed for all samples, but were lengthened in
comparison to the unloaded samples. In contrast, the T1ρ values, whether single or double
exponential, were shortened. This is consistent with the lengthening of the correlation times
on incorporation of the drug. Due to the long correlation time side of the T1 minimum, an
increase in the correlation time will result in a lengthening of T1. If, however, the
correlation time is on the short side of the T1ρ minimum, which occurs at a longer
correlation time than the T1 minimum, the T1ρ will shorten.
The single exponential T1ρs observed in the mixtures with single polymer components
indicate that the length scale of any phase separation must be sub-nanometre and is
consistent with a completely homogeneous material with the drug molecularly dispersed.
Similarly, although two component behaviour is seen in the 3:1 and 1:1 samples with the
drug incorporated, the likeliest explanation is that this is due to polymer phase separation
as drug phase separation would result in the observation of a long T1ρ component
corresponding to the drug phase. The conclusions from these data are therefore consistent
with the formation of a molecularly dispersed drug in both polymer phases.
0 10 20 30 40 50 60
2°θ
A
B
C
ED
H
F

218
6.3.3 Transformation of phase separation of electrospun blend fibres upon wetting
Prior to the drug release study, the disintegration and wetting behaviour of the fibre mats
were assessed. The ultra-fast disintegration and dissolution of the placebo and drug loaded
PVP electrospun fibres were complete within a few seconds following immersion in the
medium (Figure 6.11). With the blending of HPMCAS, which is insoluble at pH 1.2, the
PVP-HPMCAS blend fibres showed a change in appearance of the mat when it was wetted.
Clearly separated translucent and opaque domains were observed for the wetted mat. It was
also noted that the overall dimensions of the SS-ES polymer blend fibre mats shrunk
significantly to one-third of their original size after they were immersed in the media
(Figure 6.12). Interestingly, this was not observed in the CS-ES core-shell PVP-HPMCAS
fibres. This indicates that this macroscopic contraction behaviour is unique to the SS-ES
polymer blends and may be associated with the changes in the phase separation behaviour
of the fibres after being wetted.
The changes in the phase separation behaviour during in vitro drug release were further
investigated by recovering the fibre mats during the course of the drug release followed by
an analysis of the dried material using ATR-FTIR spectroscopy. Due to the high PVP
content, it was impossible to recover the material after dissolution for the PCM-loaded 3:1
PVP: HPMCAS blend. Macroscopically, the PCM loaded SS-ES fibres transformed into a
gel-like mass with a translucent surface layer and opaque centre after 5 min of being
immersed in the dissolution media. After drying, the surface layer and the opaque centre
could be separated easily, and the ATR-FTIR spectra of the surface coating and the centre
were acquired. The ATR-FTIR spectra of both 1:2 and 1:1 PVP: HPMCAS formulations
are shown in Figure 6.13. High relative peak intensities of PVP and PCM related peaks
indicate that the translucent areas predominately have high concentrations of PVP and
PCM, whereas the opaque areas mainly contain HPMCAS, in comparison to the PVP-rich
areas. It is reasonable to suggest that this rapid macro-scale layered phase separation is a
result of a sequence of events including wetting, migration of PVP to the surface due to the
hydrophobicity difference between the HPMCAS and PVP and the formation of the PVP-
rich surface coating layer. The results indicated that this re-configuration of the PVP-rich
and the HPMCAS-rich phases from nanoscale separation in a dry state to macroscopically
layered separation after wetting is a transformation with fast kinetics.

219
Figure 6.11 Visual observation of the effect of PVP to HPMCAS ratio on the
disintegration and dissolution rate of the electrospun fibres.
25% PCM PVP
1 sec 3 sec
1 sec 3 sec
25% PCM PVP/HPMCAS 3:1
25% PCM PVP/HPMCAS 1:1
3 sec 6 sec
25% PCM PVP/HPMCAS 1:2
3 sec 6 sec
3 sec
60 sec
25% PCM PVP-HPMCAS 1:1 CS
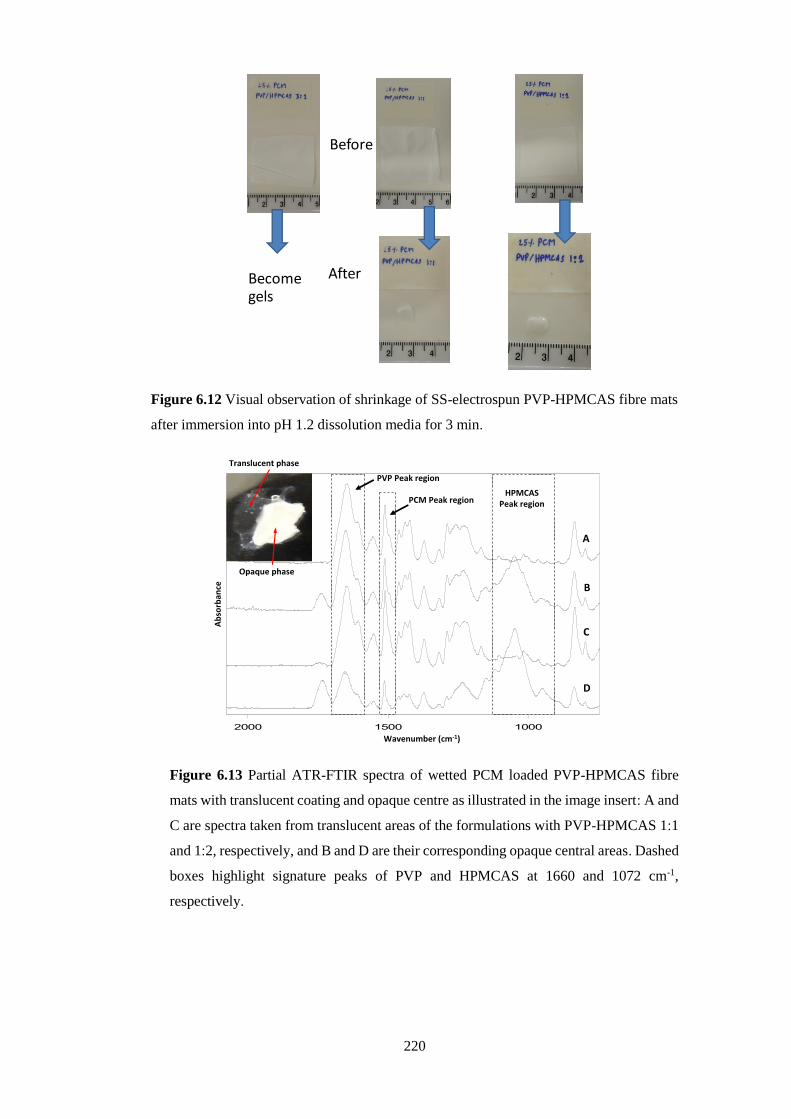
220
Figure 6.12 Visual observation of shrinkage of SS-electrospun PVP-HPMCAS fibre mats
after immersion into pH 1.2 dissolution media for 3 min.
Figure 6.13 Partial ATR-FTIR spectra of wetted PCM loaded PVP-HPMCAS fibre
mats with translucent coating and opaque centre as illustrated in the image insert: A and
C are spectra taken from translucent areas of the formulations with PVP-HPMCAS 1:1
and 1:2, respectively, and B and D are their corresponding opaque central areas. Dashed
boxes highlight signature peaks of PVP and HPMCAS at 1660 and 1072 cm-1,
respectively.
Before
AfterBecome gels

221
Further testing was conducted to follow the course of the phase separation changes during
the dissolution. In these tests, spectra were acquired from samples that had been removed
from the dissolution media at different stages of the in vitro dissolution testing and dried.
As seen in Figure 6.14, after 5 min of dissolution testing, signature peaks of PVP, PCM
and HPMCAS at 1655, 1554 and 1072 cm-1, respectively, could be clearly identified, which
indicated the presence of all components in the wetted mat. With increases in the
dissolution time, the relative peak intensity of the 1072 cm-1 HPMCAS peak increased,
while the relative intensities of the PVP and PCM related peaks decreased in both
formulations. Using the relative intensity as a coarse measure, the relative concentration
changes of the components could be estimated. The ratios of PCM, PVP and HPMCAS
were 34:51:15, 23:37:40, 0:19:81 and 0:21:79 for 5, 15, 30 and 60 min of dissolution,
respectively. This reflects the dissolution and release of PVP and PCM to the media,
whereas insoluble HPMCAS remained largely intact. The low quantity of the remaining
PVP in the HPMCAS phase can be attributed to the partial miscibility of PVP and
HPMCAS. This may impact the drug release behaviour of the formulations as the PVP-
rich phase tends to have a faster drug release rate, while the HPMCAS-rich phase reserves
the drug as HPMCAS is insoluble at the acidic pH 1.2.
Figure 6.14 Partial ATR-FTIR spectra of PCM loaded PVP-HPMCAS blended fibre
mats with polymer ratios of (A) 1:1 and (B) 1:2 when sampled at different time intervals
during dissolution experiments. Dashed boxes represent signature peaks of PVP, PCM
and HPMCAS at 1660, 1512 and 1072cm-1, respectively.

222
6.3.4 In vitro drug release kinetics of electrospun blend fibres
The PCM release profiles were obtained from all blend formulations, as seen in Figure
6.15. The PVP-PCM fibres exhibited an immediate release with complete drug release
being obtained within 5 min. The PCM-HPMCAS drug release study was not conducted
because the HPMCAS alone is an extremely poor fibre forming material and no proper
fibre mat could be generated. The PCM-PVP-HPMCAS blend fibres demonstrated an
initial burst release with up to 50% of the PCM released within 10 min and 100% released
in 1 h for PVP:HPMCAS mats with weight ratios of 3:1 and 1:1, but only approximately
an 80% release for the PVP:HPMCAS 1:2 blend. Despite the polymer ratio difference, the
core-shell HPMCAS(core)-PVP(shell) 1:1 fibres showed a similar trend of drug release to
the PVP: HPMCAS 1:2 blends with 50% PCM release in the first 10 min and 85% release
in 1 h.
Figure 6.15 In vitro drug release profiles of PCM loaded PVP single phase, polymer
blend fibres with different PVP: HPMCAS ratios and coaxial electrospun fibre.
Data fitting to the power law and biphasic models was performed to obtain insights into the
mechanism of the drug release from the formulations. As seen in Table 6.3, the coefficients
of determination (R2) of the power law fitting for only 60% drug release data (25) were
greater than 0.98 for all blend formulations. The exponents (n) of the SS PVP-HPMCAS
3:1 blend and CS-ES core-shell fibre formulations were in the range of 0.45-0.89, which
indicates the drug release was dominated by anomalous transportation, which refers to a
combination of Fickian diffusion and case II transport (25). For SS-ES PVP-HPMCAS
blends with ratios of 1:1 and 1:2, the n values of 0.42 and 0.43 were obtained, respectively.
This indicates that Fickian diffusion was the dominant release mechanism for these
formulations (25, 26). However, it should be highlighted that ignoring the remaining 40%

223
release, which is much slower than first 60% for all blend formulations, may give
misleading results with regard to the release mechanisms of these phase-separated
nanofiber blend mats.
When the power law and biphasic release models were fitted to the entire 60-minute release
data, the R2 values of the power law fit decreased significantly, whereas the biphasic model
fit gave R2 values greater than 0.99 (Table 6.3). The biphasic model allowed the estimation
of the amount of drug release (Ma and Mb) and kinetic exponential (ka and kb) of both phases
(assumed to be completely phase-separated PVP-PCM and HPMCAS-PCM phases). The
fact that Ma and Mb did not together come to 100% can be explained by some miscibility
between the PVP and HPMCAS, as discussed earlier. The ka and kb values of all polymer
blends and core-shell formulations were found to differ significantly, with ka being
approximately six times greater than kb. This refers to PCM being released faster from one
phase (likely the PVP-rich phase) than the other phase (likely the HPMCAS-rich phase).
It should be kept in mind that the biphasic model contains more variables for fitting in
comparison to the power law model. This may lead to better data fitting and higher R2
values for the biphasic model, without necessarily being a truly more accurate description
of the dissolution process. To test the relative likelihood of these two possibilities, AICc
was employed. The AICc scores of the biphasic model fitting of all SS-ES PVP-HPMCAS
blend fibres are significantly lower (which means distinctively better suitability) than the
ones of the power law model. Therefore, the biphasic model is universally superior to a
descriptive drug release model for SS PVP-HPMCAS blend fibres. The AICc scores of the
biphasic fitting for the CS PVP-HPMCAS 1:1 fibres are also lower than those of the power
law fittings, which indicates the biphasic model as being a better descriptive model of the
drug release behaviour.

224
Table 6.3 Kinetic parameters obtained from fitting 60 min dissolution experimental data of PCM loaded nanofibers to power law and first order
biphasic model.
PVP-HPMCAS
ratio
Power law Alkaike test
(AICc) First order bi-phasic
Alkaike test
(AICc)
R2 k n R2 Ma Mb ka kb Ma+Mb
SS 3:1 0.81 43.99 0.189 71 0.997 45.01 48.28 0.399 0.098 93.29 45
SS 1:1 0.87 42.56 0.192 65 0.998 49.00 35.99 0.287 0.048 84.99 39
SS 1:2 0.94 26.80 0.271 57 0.999 30.48 57.19 0.112 0.015 87.67 33
CS 1:1 0.70 29.70 0.267 67 0.994 54.98 43.97 0.15 0.043 98.95 65
PVP-HPMCAS
ratio
Power law
(data fitting for 60% of drug release)
R2 k n
SS 3:1 0.984 28.45 0.56
SS 1:1 0.991 31.27 0.42
SS 1:2 0.996 24.2 0.43
CS 1:1 0.98 12.25 0.69
PVP alone 0.81 67.12 0.41
225
6.4 Discussion
6.4.1 Improved apparent miscibility of polymer blends by processing and drug
incorporation
Effect of solvent
The seemingly contradictory results of this study and other recent literature on the apparent
miscibility of PVP and HPMCAS should first be clarified. In the literature, PVP and HPMC
blends were established as miscible by Karavas and co-workers by a cast film method, but
with weak interactions between the carbonyl group of the PVP and the hydroxyl group of
the HPMC (27). More recently, Marks and co-workers prepared HPMCAS and PVP
K29/32 blends by spray drying using 1:1 ethanol:DCM as a solvent and observed that they
were miscible based on MTDSC data (15). In the previous chapter, when PVP K 90 was
used with HPMCAS, which was dissolved in 3:7 DCM:ethanol, and prepared by film
casting and SS-ES, they showed a single Tg that indicated a miscibility between the PVP
and the HPMCAS. However, in this chapter, a double Tg was observed from the cast film
formulation of PVP-HPMCAS, which was dissolved in 9:1 ethanol:water. This is an
indication of the phase separation of PVP and HPMCAS. While SS-ES PVP-HPMCAS
fibres show the nanophase separation that was observed by ss-NMR relaxometry.
A solvent system can be a potential factor that affects the conformational properties of the
polymer in solution (1). There are two types of solvent, related to the capability of the
solvent to solvate the polymer: a good solvent and a bad solvent. In the good solvent, the
polymer is fully solvated, which results in it displaying swelling and extending
conformation. In contract, the bad solvent partially solvates the polymer. Consequently,
this leads to a compact conformation because the repeated units of the polymer interact
amongst themselves more than the solvent molecules. Therefore, the compact form
potentially leads to phase separation (1). Al-obaidi et al. reported the use of different
solvent mixtures (acetone-methanol and acetone-water) in spray drying affected the
stability and dissolution of the ternary solid dispersion of griseofulvin, PVP and poly[N-
(2-hydroxypropyl)methacrylate] (PHPMA) (1). The ternary solid dispersions dissolved in
acetone-water demonstrated a better physical stability and dissolution rate than the one
dissolved in acetone-methanol. Even though the ternary prepared from an acetone-water
solvent had a lower Tg than the ternary prepared from acetone-methanol, their Tgs were 84
and 104°C, respectively. The authors explained that these two solvent systems caused a
different polymer conformation in the ternary systems after a complete solvent evaporation
resulting in the different physical stabilities and dissolutions. Acetone-methanol enhances
the miscibility between the PVP and the PHPMA, which resulted in a phase separation of
griseofulvin that later lead to the drug’s recrystallization. While acetone-water encouraged

226
PHPMA to form an interaction with griseofulvin (1). As a consequence, it resulted in a
better physical stability in comparison to the other solvent system. In our case, PVP is freely
soluble in ethanol, DCM and water (28). While, HPMCAS is soluble in DCM, ethanol and
alcoholic aqueous, but insoluble in water (29). DCM and ethanol are good solvents for PVP
and HPMCAS in which the polymers demonstrate a conformational extent. In contrast, the
polymer chain of HPMCAS may form a compacted conformation because water is a bad
solvent for HPMCAS. The use of 9:1 ethanol:water as the solvent could potentially cause
a different polymeric conformation of PVP-HPMCAS in comparison to the PVP-HPMCAS
that was prepared from 7:3 ethanol:DCM. As a consequence, it led to the immiscibility and
phase separation of the PVP-HPMCAS.
Effect of preparation methods
The results of this study suggest that the different rates of solvent evaporation used in the
preparation methodology may have a significant impact on the size of the phase separated
domains in the blend material. Techniques with slow solvent evaporation rates lead to
micron, or even larger, scale phase separations, which were determined by MTDSC and
AFM. The rapid solvent evaporation technique, electrospinning, in combination with rapid
2D deformation by elongating the blend into nanosized fibres with highly confined
dimensions improved the apparent miscibility. The outcome of the drying process used in
the different preparation methods may be determined by the thermodynamics of the system
or the kinetics of drying.
The relative rates of ethanol and water evaporation may be important in the determination
of the phase behaviour: at 90% ethanol, water shows a positive deviation from Raoult’s
law and ethanol follows Raoult’s law line; therefore, at 90% ethanol and above there is
more water in the vapour phase than would be predicted by its pure vapour pressure and
concentration. Therefore, the evaporation rates of ethanol may be slower than expected.
However, it is not clear if the system is at equilibrium and, as it also contains a polymer
and drug, the vapour pressures of the five-component system may not reflect the simple
binary system. In addition, as the solvent evaporates, the high polymer concentrations will
impede the diffusion of the solvent molecules, and it is possible that water as the smaller
molecule may escape faster.
The process of electrospinning is very rapid and the observation of the phase separation
will depend on the relative rates of evaporation and polymer phase separation. If the latter
process is slow compared to the solvent loss, then a molecularly dispersed polymer mixture
will be “frozen in place” despite the differences in the intrinsic solubilities. If the polymer
phase separation is fast compared to the evaporation rate, then phase separation may take

227
place. PCM incorporation significantly affected the phase behaviour of the system and
improved the miscibility of the PVP and HPMCAS. It is possible that this is a result of a
combination of PCM acting as a molecular solvent and the reduced viscosity of the solution
(as PCM replaced the same amount of polymer in the solution), which aids the mixing
during the drying stage of the electrospinning process for both SS- and CS-ES.
6.4.2 Effect of wetting and dissolution on phase separation and their impact on drug
release
PCM demonstrated a higher degree of partition into the PVP-rich rather than the HPMCAS-
rich phase. The length scale of the phase separation was rapidly amplified into the macro-
scale layers after the electrospun fibres were wetted by the dissolution media. This rapid
dynamic transformation from nanoscale phase separation to layered separation was
speculated to be a result of the rapid local phase separation and the migration of the PVP
to the surfaces of the wetted mats. As a consequence of such phase separation
transformations, in which the majority of the initial drug is released from the PVP-rich
phase, and being followed by the slower release from HPMCAS-rich phase, a clear biphasic
drug release behaviour was observed in all the blend fibre formulations. This biphasic drug
release mechanism was confirmed by the fact that when alternating the ratio of PVP and
HPMCAS in the blend, the drug release profile of the fibres could be tuned to the desired
rate. It is worth mentioning that HPMCAS is a pH sensitive polymeric excipient, which is
known to dissolve at a pH above 5.0 and is often used for enteric coating (30). Therefore,
the slower drug release from the HPMCAS than PVP phases, as was observed in the
dissolution tests of this study, would be expected. It is likely that the drug contained in the
HPMCAS phases of the formulations with high HPMCAS content will be released rapidly
once the formulation reaches the small intestine due to the increased solubility of HPMCAS
at the intestinal pH. Although a single model drug was used for the proof-of-concept in this
project, the use of the dynamic phase behaviour of the polymer blend to control drug release
for improved delivery of one or multiple drugs in one formulation should be explored in
future.
6.5 Conclusion
Nanofabrication methods, such as electrospinning, have been increasingly used in the
preparation of drug delivery systems. This chapter investigated the phase behaviour of
blends of a pair of partially miscible polymers, PVP K-90 and HPMCAS, after processing
by electrospinning. The results confirmed nanoscale phase separation of the electrospun
fibres in contrast to the micron-scale phase separation in the blends prepared by
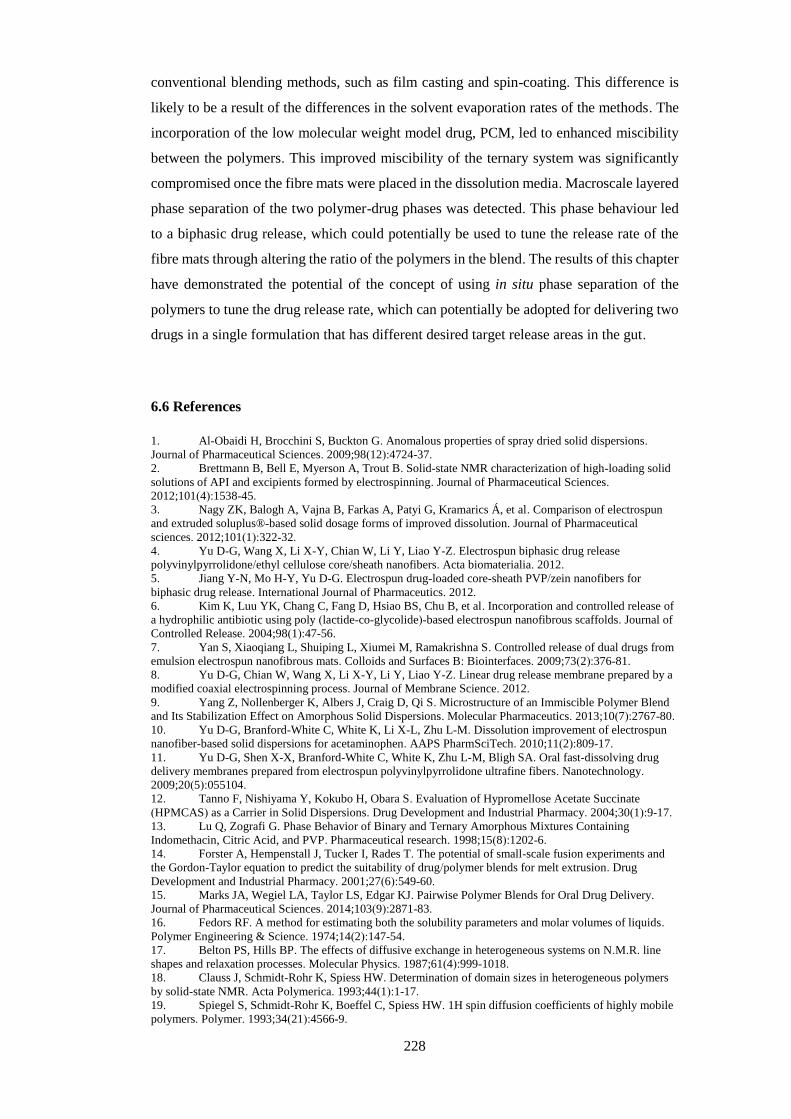
228
conventional blending methods, such as film casting and spin-coating. This difference is
likely to be a result of the differences in the solvent evaporation rates of the methods. The
incorporation of the low molecular weight model drug, PCM, led to enhanced miscibility
between the polymers. This improved miscibility of the ternary system was significantly
compromised once the fibre mats were placed in the dissolution media. Macroscale layered
phase separation of the two polymer-drug phases was detected. This phase behaviour led
to a biphasic drug release, which could potentially be used to tune the release rate of the
fibre mats through altering the ratio of the polymers in the blend. The results of this chapter
have demonstrated the potential of the concept of using in situ phase separation of the
polymers to tune the drug release rate, which can potentially be adopted for delivering two
drugs in a single formulation that has different desired target release areas in the gut.
6.6 References
1. Al-Obaidi H, Brocchini S, Buckton G. Anomalous properties of spray dried solid dispersions.
Journal of Pharmaceutical Sciences. 2009;98(12):4724-37.
2. Brettmann B, Bell E, Myerson A, Trout B. Solid-state NMR characterization of high-loading solid
solutions of API and excipients formed by electrospinning. Journal of Pharmaceutical Sciences.
2012;101(4):1538-45.
3. Nagy ZK, Balogh A, Vajna B, Farkas A, Patyi G, Kramarics Á, et al. Comparison of electrospun
and extruded soluplus®‐based solid dosage forms of improved dissolution. Journal of Pharmaceutical
sciences. 2012;101(1):322-32.
4. Yu D-G, Wang X, Li X-Y, Chian W, Li Y, Liao Y-Z. Electrospun biphasic drug release
polyvinylpyrrolidone/ethyl cellulose core/sheath nanofibers. Acta biomaterialia. 2012.
5. Jiang Y-N, Mo H-Y, Yu D-G. Electrospun drug-loaded core-sheath PVP/zein nanofibers for
biphasic drug release. International Journal of Pharmaceutics. 2012.
6. Kim K, Luu YK, Chang C, Fang D, Hsiao BS, Chu B, et al. Incorporation and controlled release of
a hydrophilic antibiotic using poly (lactide-co-glycolide)-based electrospun nanofibrous scaffolds. Journal of
Controlled Release. 2004;98(1):47-56.
7. Yan S, Xiaoqiang L, Shuiping L, Xiumei M, Ramakrishna S. Controlled release of dual drugs from
emulsion electrospun nanofibrous mats. Colloids and Surfaces B: Biointerfaces. 2009;73(2):376-81.
8. Yu D-G, Chian W, Wang X, Li X-Y, Li Y, Liao Y-Z. Linear drug release membrane prepared by a
modified coaxial electrospinning process. Journal of Membrane Science. 2012.
9. Yang Z, Nollenberger K, Albers J, Craig D, Qi S. Microstructure of an Immiscible Polymer Blend
and Its Stabilization Effect on Amorphous Solid Dispersions. Molecular Pharmaceutics. 2013;10(7):2767-80.
10. Yu D-G, Branford-White C, White K, Li X-L, Zhu L-M. Dissolution improvement of electrospun
nanofiber-based solid dispersions for acetaminophen. AAPS PharmSciTech. 2010;11(2):809-17.
11. Yu D-G, Shen X-X, Branford-White C, White K, Zhu L-M, Bligh SA. Oral fast-dissolving drug
delivery membranes prepared from electrospun polyvinylpyrrolidone ultrafine fibers. Nanotechnology.
2009;20(5):055104.
12. Tanno F, Nishiyama Y, Kokubo H, Obara S. Evaluation of Hypromellose Acetate Succinate
(HPMCAS) as a Carrier in Solid Dispersions. Drug Development and Industrial Pharmacy. 2004;30(1):9-17.
13. Lu Q, Zografi G. Phase Behavior of Binary and Ternary Amorphous Mixtures Containing
Indomethacin, Citric Acid, and PVP. Pharmaceutical research. 1998;15(8):1202-6.
14. Forster A, Hempenstall J, Tucker I, Rades T. The potential of small-scale fusion experiments and
the Gordon-Taylor equation to predict the suitability of drug/polymer blends for melt extrusion. Drug
Development and Industrial Pharmacy. 2001;27(6):549-60.
15. Marks JA, Wegiel LA, Taylor LS, Edgar KJ. Pairwise Polymer Blends for Oral Drug Delivery.
Journal of Pharmaceutical Sciences. 2014;103(9):2871-83.
16. Fedors RF. A method for estimating both the solubility parameters and molar volumes of liquids.
Polymer Engineering & Science. 1974;14(2):147-54.
17. Belton PS, Hills BP. The effects of diffusive exchange in heterogeneous systems on N.M.R. line
shapes and relaxation processes. Molecular Physics. 1987;61(4):999-1018.
18. Clauss J, Schmidt-Rohr K, Spiess HW. Determination of domain sizes in heterogeneous polymers
by solid-state NMR. Acta Polymerica. 1993;44(1):1-17.
19. Spiegel S, Schmidt-Rohr K, Boeffel C, Spiess HW. 1H spin diffusion coefficients of highly mobile
polymers. Polymer. 1993;34(21):4566-9.

229
20. McBrierty VJ, Packer KJ. Nuclear magnetic resonance in solid polymers: Cambridge University
Press; 2006.
21. Thakral S, Thakral NK. Prediction of drug–polymer miscibility through the use of solubility
parameter based flory–huggins interaction parameter and the experimental validation: PEG as model
polymer. Journal of Pharmaceutical Sciences. 2013;102(7):2254-63.
22. Anastasiadis SH, Gancarz I, Koberstein JT. Interfacial tension of immiscible polymer blends:
temperature and molecular weight dependence. Macromolecules. 1988;21(10):2980-7.
23. Konno H, Taylor LS. Influence of different polymers on the crystallization tendency of molecularly
dispersed amorphous felodipine. Journal of Pharmaceutical Sciences. 2006;95(12):2692-705.
24. Taylor LS, Zografi G. Sugar–polymer hydrogen bond interactions in lyophilized amorphous
mixtures. Journal of Pharmaceutical sciences. 1998;87(12):1615-21.
25. Ritger PL, Peppas NA. A simple equation for description of solute release I. Fickian and non-
Fickian release from non-swellable devices in the form of slabs, spheres, cylinders or discs. Journal of
controlled release. 1987;5(1):23-36.
26. Siepmann J, Peppas N. Modeling of drug release from delivery systems based on hydroxypropyl
methylcellulose (HPMC). Advanced drug delivery reviews. 2012.
27. Karavas E, Georgarakis E, Bikiaris D. Application of PVP/HPMC miscible blends with enhanced
mucoadhesive properties for adjusting drug release in predictable pulsatile chronotherapeutics. European
Journal of Pharmaceutics and Biopharmaceutics. 2006;64(1):115-26.
28. Kolter K, Karl M, Gryczke A, Ludwigshafen am Rhein B. Hot-melt extrusion with BASF pharma
polymers: extrusion compendium: BASF; 2012.
29. NF Hypromellose acetate succinate Shin-Etsu AQQAT entric coating agent 2005.
30. Friesen DT, Shanker R, Crew M, Smithey DT, Curatolo WJ, Nightingale JAS. Hydroxypropyl
Methylcellulose Acetate Succinate-Based Spray-Dried Dispersions: An Overview. Molecular Pharmaceutics. 2008;5(6):1003-19.

230
7. Chapter 7: Concluding remarks and future outlook
7.1 Crystallisation of amorphous FF
The spontaneous crystallisation of amorphous FF is unpredictable and difficult to control.
Hence, heterogeneous nucleation, which is a common means to initiate the crystallisation
of APIs (1-3), was used to crystallise the amorphous FF. This method includes the surface
disruption technique and use of impurity additives (talc). Additionally, controlling the
crystal growth temperature and the presence of an OTS have indicated the prospect of
controlling the crystallisation into specific polymorphs (4-8). These approaches were
applied to study the crystallisation of amorphous FF in this project. The results of this
project lead to a better understanding of the crystallisation of amorphous FF. One of the
significant findings in Chapter 3 was a clarification of the confusion in the literature about
FF form IIs. Di Martino et al. and Balendiran et al. reported the discovery of FF form IIs
(9, 10). The DSC, ATR-FTIR, PXRD and SCXRD results presented in Chapter 3 confirmed
that the FF form IIs that were obtained by Di Martino et al. and Balendiran et al. were not
the same.
The FF form II that Di Martino reported (referred to as form IIa) was further investigated
to determine the factors that influence its crystallisation. We observed that the use of an
OTS and crystal growth temperature can control the crystallisation of specific polymorph
of FF. The FF form I prefers to grow at the OTS site; in contrast, the form IIa was found to
crystallise beneath the surface. The crystallisation of amorphous FF between the
sandwiched coverslips (B-FF) resulted in pure FF form IIa. The switching of the crystal
growth mode of polymorph IIa to I was observed when the cover was removed during the
partial crystallisation of form IIa. Consequently, the rest of the amorphous FF crystallised
as form I. This finding corresponds to the cross-nucleation phenomenon in which one
polymorph nucleate on the surface of another polymorph (8, 11). Additionally, the
environmental temperature during the crystal growth influenced the polymorphs of the FF.
The optimal crystal growth temperature of form IIa was determined at 40°C with an OTS
while both OTS-FF and B-FF crystallise at 70°C in the pure form I.
In Chapter 4, the addition of talc was used to induce the heterogeneous nucleation of
amorphous FF. The crystallisation of the new FF form III was a consequence of using talc
as the heterogeneous nuclei. The characteristic data of FF form III were collected, including
melting point, ATR-FTIR spectrum, PXRD pattern and single crystal structure. The
mechanism of the FF form III crystallisation is due to the talc crystals inducing the form
III nuclei. The physical stability data of FF form III showed that it is highly
thermodynamically instable, and likely to convert to its more stable polymorphs (forms I

231
and IIa) upon ageing, on incubated or elevated temperatures or undergoing mechanical
stress such as milling.
Figure 7. 1 Summary of polymorphic conversions between different polymorphs of FF.
7.2 Solid dispersions for stabilising amorphous FF
Electrospinning was found to be an efficient means to prepare the FF solid dispersions (12,
13). In the literature, it has been used to prepare ultrafast release and sustained-release
electrospun fibres for the oral route (14-17). The fresh 25% w/w FF loaded PVP
electrospun fibres showed a lower amount of recrystallised FF crystals than the PVP cast
films. Blending PVP with poorly spinnable polymers, including HPMCAS, Soluplus and
Eudragit, enhanced the spinnability of the blends, which was shown by the reduction in the
beading on the fibres and the fibres becoming a more cylindrical shape. The FF-PVP, FF-
PVP-Eudragit E, FF-PVP-Soluplus and FF-PVP-HPMCAS fibres significantly improved
the dissolution of the FF in comparison with its crystalline form I. FF-PVP and FF-PVP-
Eudragit E can be used as an immediate release formulation; whereas FF-PVP-HPMCAS
demonstrated its potential in the sustained-release application. The electrospun fibres
showed a faster rate of moisture sorption than their cast films. The fibrous structure
deformation, including increasing its rigidness and fibre shrinkage, was a consequence of
the moisture sorption. In terms of the physical stability, we observed that the polymer
blended matrices showed better stabilisation of the amorphous FF than pure PVP.
The polymer-polymer and drug-polymer apparent miscibility are essential pieces of
information that need to be taken into account for formulating the ternary solid dispersions
as they play an important role in affecting the physical stability of the solid dispersions. FF
showed a good apparent miscibility with Eudragit E and Soluplus, which could be
potentially attributed to the dipole-dipole interactions between drug and polymer. It was
observed that these polymers could stabilise 25% w/w FF under 75% RH and also caused
uneven FF distribution in the phase separated FF-PVP-Eudragit E and FF-PVP-Soluplus
Melt-cooled Amorphous FF
FF form III
FF form IIa
FF form I Ageing at room
temperature

232
solid dispersions. In contrast, FF and PVP blends lack the hydrogen bonding that the drug
and polymer have, and so have a low level of molecular interaction. Thus, the polymer
matrices could only partially stabilise the amorphous drug. The FF-PVP-HPMCAS blends
showed a stronger polymer-polymer dipole-dipole interaction than the drug-polymer
interaction. Consequently, half of the 25% w/w FF loaded in the formulation rapidly
crystallised when it was exposed to 75% RH. On the contrary, the PCM-PVP-HPMCAS
blends showed a high physical stability because PCM forms a hydrogen bond with PVP.
Therefore, it can minimise the moisture uptake and inhibit the amorphous PCM
recrystallization in the presence of a high moisture environment (75% RH).
The results of this project suggest that the polymer pair needs to be carefully selected by
considering their polymer-polymer and drug-polymer miscibility in the ternary solid
dispersion. The apparent polymer-drug miscibility is an important factor that maintains the
drugs in their amorphous state even in a high humidity environment. The drug that is used
in the ternary solid dispersion electrospun fibres should form hydrogen bonds with at least
one of the polymers, which is most likely to be the hydrophilic polymers due to the carbonyl
group in their structure. Consequently, this will enhance the physical stability of API in the
ternary solid dispersions.
7.3 Phase separation behaviour: A key to stabilise amorphous drugs in complex
blends and achieving modified drug release performance
Phase separation has been observed in FF-PVP-Eudragit E and FF-PVP-Soluplus solid
dispersions in which FF was unevenly distributed among the polymers. The uneven FF
resulted in the physical stability enhancement of these formulations, since it can protect the
majority of the amorphous drug from recrystallization under 75% RH Figure 7. 2A. Apart
from stabilising the amorphous drug, the in situ phase separation of PCM-PVP-HPMCAS
electrospun polymer fibres was observed. The nanophase separation of PCM-PVP-
HPMCAS was magnified to the macro scale upon dissolution. The electrospun fibre
shrinkage corresponded to the microstructure deformation when the fibres were wetted,
and this consequently resulted in the phase separation of the PVP rich phase and HPMCAS
rich phase. This phase separation resulted in the modified release of the drug in which the
PVP rich phase demonstrated burst drug release while the HPMCAS rich phase provided
sustained drug release Figure 7. 2B. The rate of the drug release can be tuned by altering
the proportions of PVP and HPMCAS.
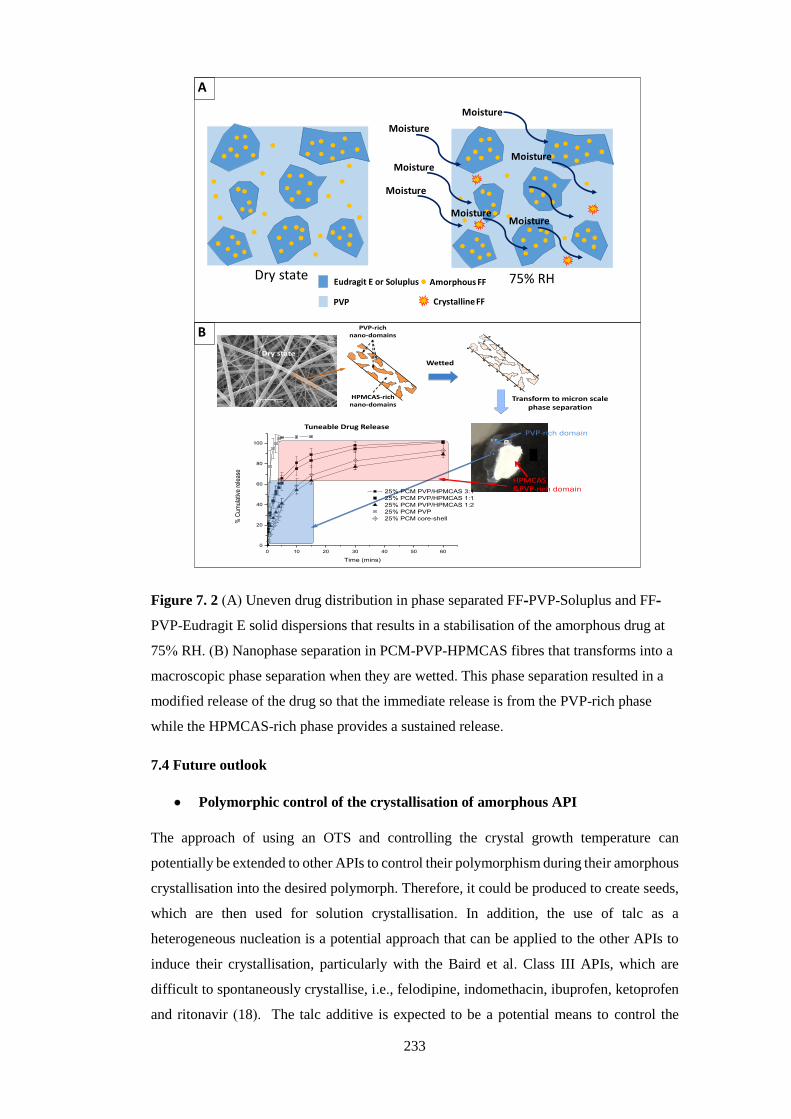
233
Figure 7. 2 (A) Uneven drug distribution in phase separated FF-PVP-Soluplus and FF-
PVP-Eudragit E solid dispersions that results in a stabilisation of the amorphous drug at
75% RH. (B) Nanophase separation in PCM-PVP-HPMCAS fibres that transforms into a
macroscopic phase separation when they are wetted. This phase separation resulted in a
modified release of the drug so that the immediate release is from the PVP-rich phase
while the HPMCAS-rich phase provides a sustained release.
7.4 Future outlook
Polymorphic control of the crystallisation of amorphous API
The approach of using an OTS and controlling the crystal growth temperature can
potentially be extended to other APIs to control their polymorphism during their amorphous
crystallisation into the desired polymorph. Therefore, it could be produced to create seeds,
which are then used for solution crystallisation. In addition, the use of talc as a
heterogeneous nucleation is a potential approach that can be applied to the other APIs to
induce their crystallisation, particularly with the Baird et al. Class III APIs, which are
difficult to spontaneously crystallise, i.e., felodipine, indomethacin, ibuprofen, ketoprofen
and ritonavir (18). The talc additive is expected to be a potential means to control the
Moisture
Moisture
Moisture
Moisture
Moisture
Moisture
Moisture
Dry state 75% RH
PVP
HPMCAS&PVP
PVP rich Phase
HPMCAS rich Phase
PVP rich Phase
HPMCAS rich Phase
A
B
C
-rich domain
-rich domain
0 10 20 30 40 50 60
0
20
40
60
80
100
25% PCM PVP/HPMCAS 3:1
25% PCM PVP/HPMCAS 1:1
25% PCM PVP/HPMCAS 1:2
25% PCM PVP
25% PCM core-shell% C
umul
ativ
e re
leas
e
Time (mins)
Wetted
PVP-rich nano-domains
HPMCAS-rich nano-domains
Dry state
Transform to micron scale phase separation
Tuneable Drug Release
B
A
Eudragit E or Soluplus
PVP
Amorphous FF
Crystalline FF

234
crystallisation of these APIs (19). Additionally, it is feasible to scale this up to industrial
crystallisation.
Electrospun fibrous solid dispersions
The results from this project raise some concerns related to the development of electrospun
fibrous formulations. The selection of drug and polymer matrices need to take into account
the polymer-polymer and drug-polymer miscibility. Moisture uptake causes serious
damage to the fibrous structure and triggers the drug recrystallization. These pieces of
information are expected to benefit the development of commercial electrospun fibrous
formulations.
In addition, the proof-of-concept blending of hydrophilic and hydrophobic polymers
created a biphasic release in the electrospun material from the phase separation of these
polymers. Examples of blended polymer pairs that could potentially prepare a biphasic
release include PVP-Ethyl cellulose, PVP-Zein, PVP-Eudragit L or S and PVP-Eudragit
RL or RS. These polymer pairs are expected to demonstrate similar results to those found
in this work. Furthermore, the concept of using hydrophilic and hydrophobic matrices can
potentially be applied to dual drug release systems. One drug that has high miscibility to
the hydrophilic polymer is expected to provide an immediate drug release while the other
drug may bind to the hydrophobic phase with a slow release of the API.
7.5 References
1. Prasad KVR, Ristic RI, Sheen DB, Sherwood JN. Crystallization of paracetamol from solution in
the presence and absence of impurity. International Journal of Pharmaceutics. 2001;215(1–2):29-
44.
2. Rauls M, Bartosch K, Kind M, Kuch S, Lacmann R, Mersmann A. The influence of impurities on
crystallization kinetics – a case study on ammonium sulfate. Journal of Crystal Growth.
2000;213(1–2):116-128.
3. Myerson A. Handbook of industrial crystallization: Butterworth-Heinemann; 2002.
4. Cai T, Zhu L, Yu L. Crystallization of Organic Glasses: Effects of Polymer Additives on Bulk and
Surface Crystal Growth in Amorphous Nifedipine. Pharmaceutical research. 2011;28(10):2458-
2466.
5. Chen S, Xi H, Yu L. Cross-Nucleation between ROY Polymorphs. Journal of the American
Chemical Society. 2005;127(49):17439-17444.
6. Tao J, Jones KJ, Yu L. Cross-nucleation between D-mannitol polymorphs in seeded crystallization.
Crystal Growth and Design. 2007;7(12):2410-2414.
7. Tao J, Yu L. Kinetics of Cross-Nucleation between Polymorphs. The Journal of Physical Chemistry
B. 2006;110(14):7098-7101.
8. Yu L. Nucleation of One Polymorph by Another. Journal of the American Chemical Society.
2003;125(21):6380-6381.
9. Balendiran GK, Rath N, Kotheimer A, Miller C, Zeller M, Rath NP. Biomolecular Chemistry of
Isopropyl Fibrates. J pharm sci. 2012;101(4):1555-1569.
10. Di Martino P, Palmieri G, Martelli S. Evidence of a metastable form of fenofibrate. Die Pharmazie.
2000;55(8):625-626.
11. Sun Y, Zhu L, Wu T, Cai T, Gunn EM, Yu L. Stability of Amorphous Pharmaceutical Solids:
Crystal Growth Mechanisms and Effect of Polymer Additives. The AAPS Journal. 2012;14(3):380-
388.
12. Ignatious F, Sun L, Lee C-P, Baldoni J. Electrospun nanofibers in oral drug delivery.
Pharmaceutical research. 2010;27(4):576-588.

235
13. Lopez FL, Shearman GC, Gaisford S, Williams GR. Amorphous formulations of indomethacin and
griseofulvin prepared by electrospinning. Molecular Pharmaceutics. 2014;11(12):4327-4338.
14. Jiang Y-N, Mo H-Y, Yu D-G. Electrospun drug-loaded core–sheath PVP/zein nanofibers for
biphasic drug release. International Journal of Pharmaceutics. 2012;438(1–2):232-239.
15. Kenawy E-R, Abdel-Hay FI, El-Newehy MH, Wnek GE. Controlled release of ketoprofen from
electrospun poly(vinyl alcohol) nanofibers. Materials Science and Engineering: A. 2007;459(1–
2):390-396.
16. Pattama T, Uracha R, Pitt S. Drug-loaded electrospun mats of poly(vinyl alcohol) fibres and their
release characteristics of four model drugs. Nanotechnology. 2006;17(9):2317.
17. Taepaiboon P, Rungsardthong U, Supaphol P. Vitamin-loaded electrospun cellulose acetate
nanofiber mats as transdermal and dermal therapeutic agents of vitamin A acid and vitamin E.
European Journal of Pharmaceutics and Biopharmaceutics. 2007;67(2):387-397.
18. Baird JA, Van Eerdenbrugh B, Taylor LS. A classification system to assess the crystallization
tendency of organic molecules from undercooled melts. Journal of Pharmaceutical sciences.
2010;99(9):3787-3806.
19. Bruce CD, Fegely KA, Rajabi-Siahboomi AR, McGinity JW. The influence of heterogeneous
nucleation on the surface crystallization of guaifenesin from melt extrudates containing Eudragit®
L10055 or Acryl-EZE®. European Journal of Pharmaceutics and Biopharmaceutics. 2010;75(1):71-78.

236
Copyright © 2022 FDOKUMEN