triggers of crystallisation and polymorphic transformatio
13
Towards controlling the crystallisation behaviour of fenofibrate melt: triggers of crystallisation and polymorphic transformation† Pratchaya Tipduangta, ac Khaled Takieddin, a L ´ aszl ´ oF ´ abi ´ an, a Peter Belton b and Sheng Qi * a Fenofibrate (FEN) is a dyslipidemia treatment agent which is poorly soluble in water. FEN has tendency to form polymorphs and its crystallisation behaviour is difficult to predict. The nucleation process can be initiated by mechanical disruption such as ball milling or surface scratching which may result in different crystallisation behaviour to that observed in the unperturbed system. This study has obtained insights into the controllability of FEN crystallisation by means of regulating the exposed surface and growth temperatures during its crystallisation. The availability of an open top surface (OTS) during the crystallisation of the FEN melt resulted in a mixture containing FEN form I and IIa (I [ IIa) at room temperature, and in the range 40 to 70 C. Covering the surface led to significant increases in the yield of form IIa at room temperature and at 40 and 50 C. These temperatures also yielded the highest amount of form IIa in the OTS samples whilst crystallisation at 70 C led to only FEN form I crystals regardless of the availability of the free surface. The metastable FEN form IIa transforms to the stable form I under the influence of a mechanical stress. Additionally, the introduction of OTS before the completion of crystallisation of form IIa led to a ‘switch’ of from IIa growth to form I. This study demonstrates that the polymorph selection of FEN can be obtained by the manipulation of the crystallisation conditions. Introduction Fenobrate (propan-2-yl 2-(4-[(4-chlorophenyl)carbonyl] phenoxy)-2-methylpropanoate) has been prescribed to treat hypercholesterolemia since 1970. 1 It is a prodrug in which fenobric acid is the active form. The pharmacological effect of fenobrate (FEN) is to reduce low-density lipoprotein (LDL) and increase high-density lipoprotein (HDL) by binding to peroxi- some proliferator-activated receptor alpha (PPARa). 1,2 FEN is categorised as a BCS class II drug because of its poor aqueous solubility (0.8 mg ml 1 ), but it has a high permeability (>90%) through lipid membranes. 3,4 To overcome the solubility issue, particle size reduction (micronized and nanocrystals) and lipid dispersions have been used in the commercialised formulations containing FEN. 1 With the increased use of the amorphous state of the drug in dispersion based formulations, 5–8 it is extremely important to fully understand the stability and crystallisation behaviour of amorphous FEN. Zhou and co-workers have con- ducted a systematic study of a range of low-molecular weight drugs including FEN 9 probing the relationship between physical stability and a range of thermodynamic properties. They identi- ed two important properties: molecular mobility, which is a measure of the rate of cooperatively rearrangement in subsys- tems in the amorphous state, and congurational entropy, which is the entropy difference between the disordered state and the crystalline state. The study revealed that the molecules that have high congurational entropies and low molecular mobilities were the least likely to spontaneously crystallise. 9 In amorphous FEN the congurational entropy had a relatively high value of 76.6 J mol 1 K 1 (relative to form I), but it also exhibited a rela- tively high molecular mobility value of 72.3 10 5 s 1 . 9 The high molecular mobility can possibly be attributed to weak intermo- lecular interactions, 10,11 which results in the low probability of FEN molecules forming stable nuclei and heterogeneous nucle- ation is the main route to initiate the crystallisation. 12 Hetero- geneous nucleation triggers, including scratching the surface or placing an FEN seed on the surface of amorphous FEN, resulted in an immediate initiation of crystallisation. 12 Three FEN polymorphs have been documented in the Cam- bridge Structural Database (CSD). The stable form I (with a melting point at 80 C) is the standard polymorph used as API in a School of Pharmacy, University of East Anglia, Norwich, Norfolk, NR4 7TJ, UK. E-mail: [email protected] b School of Chemistry, University of East Anglia, Norwich, Norfolk, NR4 7TJ, UK c Department of Pharmaceutical Sciences, Faculty of Pharmacy, Chiang Mai University, Chiang Mai, Thailand 50200 † Electronic supplementary information (ESI) available. CCDC 1822341. For ESI and crystallographic data in CIF or other electronic format see DOI: 10.1039/c8ra01182f Cite this: RSC Adv. , 2018, 8, 13513 Received 6th February 2018 Accepted 5th April 2018 DOI: 10.1039/c8ra01182f rsc.li/rsc-advances This journal is © The Royal Society of Chemistry 2018 RSC Adv. , 2018, 8, 13513–13525 | 13513 RSC Advances PAPER Open Access Article. Published on 10 April 2018. Downloaded on 6/29/2022 8:13:15 AM. This article is licensed under a Creative Commons Attribution 3.0 Unported Licence. View Article Online View Journal | View Issue
-
Upload
khangminh22 -
Category
Documents
-
view
4 -
download
0
Transcript of triggers of crystallisation and polymorphic transformatio

RSC Advances
PAPER
Ope
n A
cces
s A
rtic
le. P
ublis
hed
on 1
0 A
pril
2018
. Dow
nloa
ded
on 6
/29/
2022
8:1
3:15
AM
. T
his
artic
le is
lice
nsed
und
er a
Cre
ativ
e C
omm
ons
Attr
ibut
ion
3.0
Unp
orte
d L
icen
ce.
View Article OnlineView Journal | View Issue
Towards control
aSchool of Pharmacy, University of East Angli
[email protected] of Chemistry, University of East AngcDepartment of Pharmaceutical Sciences, Fac
Chiang Mai, Thailand 50200
† Electronic supplementary information (and crystallographic data in CIF or10.1039/c8ra01182f
Cite this: RSC Adv., 2018, 8, 13513
Received 6th February 2018Accepted 5th April 2018
DOI: 10.1039/c8ra01182f
rsc.li/rsc-advances
This journal is © The Royal Society of C
ling the crystallisation behaviourof fenofibrate melt: triggers of crystallisation andpolymorphic transformation†
Pratchaya Tipduangta, ac Khaled Takieddin,a Laszlo Fabian, a Peter Beltonb
and Sheng Qi *a
Fenofibrate (FEN) is a dyslipidemia treatment agent which is poorly soluble in water. FEN has tendency to
form polymorphs and its crystallisation behaviour is difficult to predict. The nucleation process can be
initiated by mechanical disruption such as ball milling or surface scratching which may result in different
crystallisation behaviour to that observed in the unperturbed system. This study has obtained insights
into the controllability of FEN crystallisation by means of regulating the exposed surface and growth
temperatures during its crystallisation. The availability of an open top surface (OTS) during the
crystallisation of the FEN melt resulted in a mixture containing FEN form I and IIa (I [ IIa) at room
temperature, and in the range 40 to 70 �C. Covering the surface led to significant increases in the yield
of form IIa at room temperature and at 40 and 50 �C. These temperatures also yielded the highest
amount of form IIa in the OTS samples whilst crystallisation at 70 �C led to only FEN form I crystals
regardless of the availability of the free surface. The metastable FEN form IIa transforms to the stable
form I under the influence of a mechanical stress. Additionally, the introduction of OTS before the
completion of crystallisation of form IIa led to a ‘switch’ of from IIa growth to form I. This study
demonstrates that the polymorph selection of FEN can be obtained by the manipulation of the
crystallisation conditions.
Introduction
Fenobrate (propan-2-yl 2-(4-[(4-chlorophenyl)carbonyl]phenoxy)-2-methylpropanoate) has been prescribed to treathypercholesterolemia since 1970.1 It is a prodrug in whichfenobric acid is the active form. The pharmacological effect offenobrate (FEN) is to reduce low-density lipoprotein (LDL) andincrease high-density lipoprotein (HDL) by binding to peroxi-some proliferator-activated receptor alpha (PPARa).1,2 FEN iscategorised as a BCS class II drug because of its poor aqueoussolubility (0.8 mg ml�1), but it has a high permeability (>90%)through lipid membranes.3,4 To overcome the solubility issue,particle size reduction (micronized and nanocrystals) and lipiddispersions have been used in the commercialised formulationscontaining FEN.1 With the increased use of the amorphous stateof the drug in dispersion based formulations,5–8 it is extremely
a, Norwich, Norfolk, NR4 7TJ, UK. E-mail:
lia, Norwich, Norfolk, NR4 7TJ, UK
ulty of Pharmacy, Chiang Mai University,
ESI) available. CCDC 1822341. For ESIother electronic format see DOI:
hemistry 2018
important to fully understand the stability and crystallisationbehaviour of amorphous FEN. Zhou and co-workers have con-ducted a systematic study of a range of low-molecular weightdrugs including FEN9 probing the relationship between physicalstability and a range of thermodynamic properties. They identi-ed two important properties: molecular mobility, which isa measure of the rate of cooperatively rearrangement in subsys-tems in the amorphous state, and congurational entropy, whichis the entropy difference between the disordered state and thecrystalline state. The study revealed that the molecules that havehigh congurational entropies and low molecular mobilitieswere the least likely to spontaneously crystallise.9 In amorphousFEN the congurational entropy had a relatively high value of76.6 J mol�1 K�1 (relative to form I), but it also exhibited a rela-tively high molecular mobility value of 72.3� 10�5 s�1.9 The highmolecular mobility can possibly be attributed to weak intermo-lecular interactions,10,11 which results in the low probability ofFEN molecules forming stable nuclei and heterogeneous nucle-ation is the main route to initiate the crystallisation.12 Hetero-geneous nucleation triggers, including scratching the surface orplacing an FEN seed on the surface of amorphous FEN, resultedin an immediate initiation of crystallisation.12
Three FEN polymorphs have been documented in the Cam-bridge Structural Database (CSD). The stable form I (with ameltingpoint at 80 �C) is the standard polymorph used as API in
RSC Adv., 2018, 8, 13513–13525 | 13513

RSC Advances Paper
Ope
n A
cces
s A
rtic
le. P
ublis
hed
on 1
0 A
pril
2018
. Dow
nloa
ded
on 6
/29/
2022
8:1
3:15
AM
. T
his
artic
le is
lice
nsed
und
er a
Cre
ativ
e C
omm
ons
Attr
ibut
ion
3.0
Unp
orte
d L
icen
ce.
View Article Online
commercial tablets and capsules. Form I can be obtained by a slowsolvent evaporation method.13 The metastable form called form IIwas reported by Di Martino et al. and Heinz et al.14–16 It wasproduced by the recrystallization of amorphous FEN from themelt. Themelting point of the product was 74 �C. It converts to thestable form I during heating via melt recrystallization and meltsagain at 80 �C.14–16 Balendiran and co-workers reported the singlecrystal structure of a FEN form they called form II. It was recrys-tallised by a solvent (ethanol) evaporation method, but no meltingpoint and spectroscopic data were reported.17 However, it is notclear that the two types of form II are the same. In order to avoidconfusion, the FEN form II from Di Martino et al. and Heinz et al.will be addressed as FEN form IIa in this study and the one fromBalendiran will be addressed as form IIb. Form III was rst re-ported by additive induced crystallisation using talc and it is notpossible to crystallise it in isolation as pure form.11 The charac-teristic data of all the metastable FEN forms available from theliterature: IIa, IIb and III are summarised in Table 1.
This study aims to investigate the effect of the availability ofan open top surface (OTS) and variations in incubation temper-ature on the crystallisation behaviour of FEN melt. There is goodevidence that allowing crystallisation to proceed from the melt inan unconstrained manner (the so called free surface) canincrease the rates of crystal growth in drugs such as nifedipine,indomethacin, and griseofulvin.18–21 This increased growth rate isthought to be due to higher molecular mobility at freesurfaces.18–21 Increasing numbers of pharmaceutically relatedmolecules have been reported to exhibit surface-induced poly-morph selection behaviour when crystallised from solvents andsubjected to different solid substrate surfaces.22–25 However, littlehas been reported in terms of whether the free surface has animpact on polymorph selection of the crystals obtained frommelt-cooled amorphousmaterials. Furthermore, the temperatureduring crystallisation is another important factor that inuencesthe formation of crystal polymorphs.26 Therefore this studyfurther investigated the combined effect of growth temperatureand availability of free surface on the crystallisation behaviour ofamorphous FEN. As the homogeneous nucleation of amorphousFEN is a slow process,12,27 the heterogeneous nucleation andcrystallisation of FEN was initiated by scratching the surface ofamorphous FEN using a metal spatula.
Materials and methodsMaterials
Crystalline FEN form I was kindly donated by Merck Serono,Germany. Glass slides and coverslips 24 � 24 mm, thickness
Table 1 Summary of the available literature data related to metastable F
Characteristic data of FEN form IIAssignment bythe authors Referen
DSC (Tm at 74 �C) IIa 14,16PXRD pattern IIa 14Raman spectrum IIa 16Single crystal IIb 17
13514 | RSC Adv., 2018, 8, 13513–13525
0.16–0.18 mm were purchased from Academy Science Limited(Kent, UK).
Preparation of FEN crystallisation samples
Approximately 3–5 mg of crystalline FEN form I powder wasplaced on a glass slide and heated on a hot plate at 100 �C untilit was completely molten. The glass slide was immediatelyremoved from the hot plate to allow the sample to cool to roomtemperature. The surface disruption technique, involving theuse of a stainless-steel spatula to scratch the surface of theamorphous FEN, was used to induce crystallisation. Aersurface scratching either of two procedures was followed. In therst, a cover slip was immediately placed on top of the sample tosandwich the drug between the glass slide and the cover slip(these samples are referred to as “bulk crystalline FEN samples”or B-FEN in this study). The second set of scratched sampleswere le to crystallise with an OTS (these samples are referred toas “free surface crystalline FEN samples” or FS-FEN). In thesesamples, where it was possible, examination was made of thetop and bottom layers of the material separately. Immediatelyaer the initiation of crystallisation by surface scratching, bothB-FEN and FS-FEN samples were incubated in an oven at 40, 50,60 or 70 �C for 30 min to obtain complete crystallisation. Thestorage stability studies of B-FEN and FS-FEN were conductedby storing the samples at ambient temperature in sealed glassvials for up to 6 months. For the storage stability of B-FENsamples, once the crystallisation was completed, the top coverslip was carefully removed prior to the storage.
Differential scanning calorimetry (DSC)
A DSC Q2000 TA (New Castle, USA) which was equipped with anRSC 90 cooling unit was used. Full temperature and heatcapacity calibrations were performed prior to the samplemeasurement. The scanning rate used was 10 �C min�1 overa temperature range of �60 �C to 120 �C. For isothermalmodulated temperature DSC (MTDSC) at 60 and 70 �C for 120minutes, the amplitude of �2 �C with a period of 60 secondswas used for all measurements. The dry nitrogen was purged at50 ml min�1. Between 1 and 3 mg of samples was weighed outaccurately and encapsulated in TA standard crimped pans. Allmeasurements were performed in triplicate.
Polarised light microscopy (PLM) and hot-stage polarisedlight microscopy (HS-PLM)
PLM model Leica DM LS2 (Wetzlar GmbH, Germany) equippedwith a JVC camera with 5, 10 and 20�magnication was used to
EN form II and III
cesCharacteristic dataof FEN form III
Assignment bythe authors Reference
DSC (Tm at 50 �C) III 11PXRD pattern III 11FTIR spectrum III 11Single crystal III 11
This journal is © The Royal Society of Chemistry 2018

Table 2 Crystallographic parameters of known polymorphic forms of FEN
Parameter Form Ia Form IIa Form IIbb Form IIIc
Sum formula C20H21ClO4 C20H21ClO4 C20H21ClO4 C20H21ClO4
Formula weight 360.82 360.82 360.82 360.82Crystal system Triclinic Triclinic Monoclinic TriclinicSpace group P�1 P�1 P21/n P�1a (A) 8.1605 (16) 8.1328 (5) 13.619 (7) 9.4803 (6)b (A) 8.2664 (16) 8.7088 (6) 7.554 (4) 9.7605 (6)c (A) 14.511 (3) 13.6692 (9) 17.880 (9) 10.9327 (8)a (�) 93.951 (3) 85.976 (6) 90 110.840 (6)b (�) 105.664 (3) 84.815 (5) 92.351 (7) 90.352 (5)g (�) 96.002 (3) 74.343 (6) 90 99.701 (5)Z 2 2 4 2Cell volume 932.5 (3) 927.35 (11) 1837.91 929.53 (11)Density 1.285 1.292 1.304 1.289 (2)Independent reections 4225 6241 5647 6258Rint 0.065 0.064 0.027 0.059R[I > 2s(I)] 0.052 0.0694 0.036 0.0653wR2 (all) 0.147 0.1507 0.095 0.1834Temperature (K) 193 140 100 140Goodness of t 1.06 1.023 1.026 1.016
a Obtained from ref. 38. b Obtained from ref. 17. c Obtained from ref. 11.
Paper RSC Advances
Ope
n A
cces
s A
rtic
le. P
ublis
hed
on 1
0 A
pril
2018
. Dow
nloa
ded
on 6
/29/
2022
8:1
3:15
AM
. T
his
artic
le is
lice
nsed
und
er a
Cre
ativ
e C
omm
ons
Attr
ibut
ion
3.0
Unp
orte
d L
icen
ce.
View Article Online
study the morphology of the crystalline FEN. The microscopewas controlled from Soware Studio Capture 1.6 from MettlerToledo Ltd (Greifensee, Switzerland). The growth rate of FENwas analysed by using ImageJ soware. The average values ofthree measurements from different images were used. A Hot-stage HS82 with a controller by Mettler Toledo Ltd (Grei-fensee, Switzerland) was used to identify the polymorphic formof the B-FEN (70 �C) by a visual observation of the melting pointusing a heating rate of 20 �C min�1.
Attenuated total reection Fourier transform infraredspectrometry (ATR-FTIR)
Infrared spectra in this study were acquired by a Bruker IF-66spectrometer (Bruker Optics, Coventry, UK) equipped witha golden gate MKII accessory from Specac Ltd (Orpington, UK).A fewmg of the sample was placed on the crystal of the ATR cell;each spectrum was acquired at a resolution of 2 cm�1 with 32scans over a range of 4000 to 550 cm�1 at ambient temperature.For the hot-stage ATR-FTIR, the spectra were acquired every 5minutes for 3 hours when the sample was placed on the heatedATR stage at 70 �C. The spectra were baseline corrected by usingthe Bruker OPUS soware (Bruker Optics, Coventry, UK). Atleast three ATR-FTIR spectra were acquired from different sitesof each sample to ensure homogeneity throughout the sampletested.
Powder X-ray diffraction (PXRD)
A Thermo ARL Xtra model (Ecublens, Switzerland) X-raydiffractometer was used in this study. The glass cover slips onwhich the FEN crystals were grown were placed into the sampleholder. The crystals were not milled into powder form in orderto avoid any polymorphic transformation induced by milling.However, it is worth highlighting that as the samples were not
This journal is © The Royal Society of Chemistry 2018
in powder form, orientation effects may affect the diffractionpatterns obtained in this study. The X-ray source generatedfrom a copper X-ray tube (1.540562 A) set at 45 kV and 40 mA.Data were collected over a 2q range of 5 to 50�, with a step size of0.01� with 1 second per step. The instrument was operatedunder ambient conditions.
Single crystal X-ray diffraction
The fully crystallised OTS-FEN sample, grown at 40 �C, was usedfor conducting single crystal X-ray diffraction experiments ofFEN form IIa. The diffraction experiments were performedusing an Oxford Diffraction Xcalibur-3/Sapphire3-CCD diffrac-tometer (Oxford Diffraction Ltd., Oxford, UK) equipped witha graphite monochromator using Mo-Ka radiation (l ¼ 0.71073A). A single crystal was selected from crystals of FEN form IIawhich were colourless prisms. This single crystal sample wasmounted on a glass bre under oil and xed in the cold nitrogenstream on the diffractometer. Intensity data were measured bythin-slice u- and 4-scans at 140 K. The diffraction data wereprocessed using the CrysAlisPro-CCD and -RED programmes.28
The structure was solved in SHELXT29 using the dual-spaceapproach and rened with SHELXL30 as implemented inShelXle GUI.31 The non-hydrogen atoms were rened withanisotropic thermal parameters. Hydrogen atoms wereincluded in idealised positions and allowed to reneisotropically.
Results and discussionVerication of form IIs by single crystal structure analysis
As the polymorphic form is the focus of this study, we rstneeded to verify the structural difference of the two types ofform II. As mentioned earlier, in the literature, form IIa wasreported to be obtained by melt-crystallisation.14–16 Therefore
RSC Adv., 2018, 8, 13513–13525 | 13515

Fig. 3 Partial ATR-FTIR spectra (1760–1500 cm�1) that were acquiredon the upper and lower surfaces of (a) FS-FEN 40 �C and (b) FS-FENRT. The two carbonyl stretching positions for the C17–O3 peaks at 1727and 1714 cm�1 reflect a mixture between FEN forms I and IIa, whereasthe carbonyl stretching of C17–O3 peak at 1714 cm�1 indicates FENform IIa.
Fig. 1 (a) ORTEP structure of form IIa; (b) an overlay of the molecularconformations in FEN form I (black), form IIa (blue), form IIb (red), formIII (green).
RSC Advances Paper
Ope
n A
cces
s A
rtic
le. P
ublis
hed
on 1
0 A
pril
2018
. Dow
nloa
ded
on 6
/29/
2022
8:1
3:15
AM
. T
his
artic
le is
lice
nsed
und
er a
Cre
ativ
e C
omm
ons
Attr
ibut
ion
3.0
Unp
orte
d L
icen
ce.
View Article Online
form IIa was prepared by melt-crystallisation and the meltingpoint and FTIR spectra were used to verify the polymorph beingthe same as the one reported in the literature. The single crystal
Fig. 2 (a) Layers formed by CH/O interactions and p–p stacking inform IIa; (b) interactions perpendicular to the layers of form IIa; (c)packing diagram of form IIa and (d) packing diagram of form I.
13516 | RSC Adv., 2018, 8, 13513–13525
structure of form IIa was also determined. The crystallographicparameters of form IIa in comparison with the other knownforms are shown in Table 2. The FEN molecule can be dividedinto two main parts: two aromatic rings linked by a keto groupand exible aliphatic tail. An ORTEP drawing of the molecularstructure of FEN form IIa is shown in Fig. 1a. To compare formIIa to the other reported forms (I, III and IIb), their molecularstructures were overlaid as illustrated in Fig. 1b. The confor-mation of FEN in form IIa is largely similar to forms I and III,while the orientation of the alkyl fragment relative to thearomatic rings is markedly different in form IIb. The anglesbetween the planes of the two aromatic rings in forms I, III andIIa are 48.62(7)�, 45.73(9)� and 48.25(10)�, respectively; whereasit is 53.73� in form IIb. This further conrms that the two formIIs reported in literature are structurally different.
Pairs of molecules in the unit cell of polymorph IIa formdimers linked by C–H/O hydrogen bonds between the estercarbonyl group (O3) and a hydrogen atom of the centralbenzene ring (H7) [d(H/O) ¼ 2.662(11) A, :(C–H/O) ¼135.2(8)�]. Two of these hydrogen bonds generate a ring motifbetween the two molecules of the dimer. The large contactsurface area between the two molecules suggests that van derWaals interactions play a signicant role in stabilising thedimers (Fig. 2a).
Two principal interactions connect adjacent dimers to formlayers parallel to the (111) plane: C–H/O hydrogen bonds andp–p interactions. The hydrogen bonds occur between anaromatic hydrogen atom in the central ring (H5) and the ketonecarbonyl group of an adjacent molecule (O1) [d(H/O) ¼2.570(17) A, :(C–H/O) ¼ 135.2(8)�] (Fig. 2a). Here again, two
This journal is © The Royal Society of Chemistry 2018

Fig. 4 (a) Melting points of FS-FEN 40 �C in comparison to the reference form I; (b) partial ATR-FTIR spectra of: reference form I; FS-FEN 40 �C;FS-FEN 40 �C after subtracting 40% of the intensity of the form I spectrum; B-FEN crystallised at room temperature.
Paper RSC Advances
Ope
n A
cces
s A
rtic
le. P
ublis
hed
on 1
0 A
pril
2018
. Dow
nloa
ded
on 6
/29/
2022
8:1
3:15
AM
. T
his
artic
le is
lice
nsed
und
er a
Cre
ativ
e C
omm
ons
Attr
ibut
ion
3.0
Unp
orte
d L
icen
ce.
View Article Online
of these hydrogen bonds form a ring motif. The offset p–p
interaction involves the chlorobenzene fragments of two mole-cules and takes place at an interplanar distance of 3.3029(8) Abetween the parallel rings (Fig. 2a). The same stacking inter-action was observed in form I with an interplanar distance of3.5116(6) A.
The most notable interaction between the layers of form IIainvolves an ‘embrace’ of the alkyl groups from molecules inneighbouring layers (Fig. 2b). Interestingly, the same embracemotif is also present in form I, but there it is accompanied bya methyl to ketone C–H/O hydrogen bond.11 In form IIa theshortest H(methyl)/O(ketone) distance is 3.09 A, much longerthan the same contact in form I (2.56 A). Nevertheless, therelative arrangement of the molecules remains essentially the
This journal is © The Royal Society of Chemistry 2018
same in both forms, suggesting that the favourable packingarrangement of the aliphatic groups is more important than theweak CH/O bonds. Combined, the p–p interactions and thealkyl embrace form innite slabs of molecules (Fig. 2b), whichare shared between forms I and IIa (also see Fig. 8b in (ref. 11)).The resulting similarity in the overall packing structures of bothforms can be seen in Fig. 2c and d. This similarity may alsoexplain the sensitivity of the crystallisation process to externalstimuli described in the following sections.
Crystallisation and polymorphic transformation of FEN
The crystallisation of FEN was rst studied using the samplemelted and cooled on a glass coverslip. As illustrated in Fig. 3a,the FS-FEN crystals grown at 40 �C at the open top surface (OTS)
RSC Adv., 2018, 8, 13513–13525 | 13517
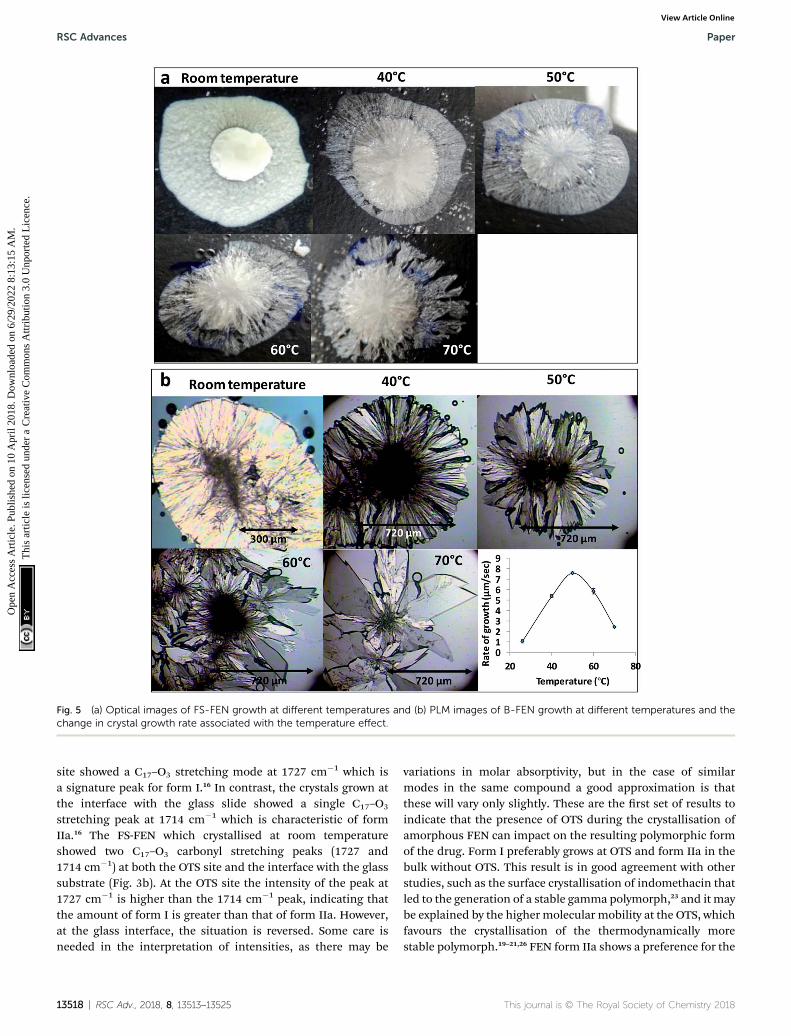
Fig. 5 (a) Optical images of FS-FEN growth at different temperatures and (b) PLM images of B-FEN growth at different temperatures and thechange in crystal growth rate associated with the temperature effect.
RSC Advances Paper
Ope
n A
cces
s A
rtic
le. P
ublis
hed
on 1
0 A
pril
2018
. Dow
nloa
ded
on 6
/29/
2022
8:1
3:15
AM
. T
his
artic
le is
lice
nsed
und
er a
Cre
ativ
e C
omm
ons
Attr
ibut
ion
3.0
Unp
orte
d L
icen
ce.
View Article Online
site showed a C17–O3 stretching mode at 1727 cm�1 which isa signature peak for form I.16 In contrast, the crystals grown atthe interface with the glass slide showed a single C17–O3
stretching peak at 1714 cm�1 which is characteristic of formIIa.16 The FS-FEN which crystallised at room temperatureshowed two C17–O3 carbonyl stretching peaks (1727 and1714 cm�1) at both the OTS site and the interface with the glasssubstrate (Fig. 3b). At the OTS site the intensity of the peak at1727 cm�1 is higher than the 1714 cm�1 peak, indicating thatthe amount of form I is greater than that of form IIa. However,at the glass interface, the situation is reversed. Some care isneeded in the interpretation of intensities, as there may be
13518 | RSC Adv., 2018, 8, 13513–13525
variations in molar absorptivity, but in the case of similarmodes in the same compound a good approximation is thatthese will vary only slightly. These are the rst set of results toindicate that the presence of OTS during the crystallisation ofamorphous FEN can impact on the resulting polymorphic formof the drug. Form I preferably grows at OTS and form IIa in thebulk without OTS. This result is in good agreement with otherstudies, such as the surface crystallisation of indomethacin thatled to the generation of a stable gamma polymorph,23 and it maybe explained by the higher molecular mobility at the OTS, whichfavours the crystallisation of the thermodynamically morestable polymorph.19–21,26 FEN form IIa shows a preference for the
This journal is © The Royal Society of Chemistry 2018

Fig. 6 PXRD patterns of (a) FS-FEN and (b) B-FEN at different crystalgrowth temperatures and partial ATR-FITR spectra (1800–1500 cm�1)of (c) FS-FEN and (d) B-FEN that were crystallised at various growthtemperatures (70, 60, 50, 40 �C and room temperature).
Paper RSC Advances
Ope
n A
cces
s A
rtic
le. P
ublis
hed
on 1
0 A
pril
2018
. Dow
nloa
ded
on 6
/29/
2022
8:1
3:15
AM
. T
his
artic
le is
lice
nsed
und
er a
Cre
ativ
e C
omm
ons
Attr
ibut
ion
3.0
Unp
orte
d L
icen
ce.
View Article Online
site at the interface that was in contact with the glass substrate.This phenomenon is likely due to the substrate induced phase(SIP) effect. The SIP effect has been reported to inuence thepolymorphic form of APIs.23 Reischl et al. reported the use of SIPto induce a metastable polymorph of phenytoin. The authorsexplained that the surface of the substrate has a large effect on
This journal is © The Royal Society of Chemistry 2018
the phenytoin crystal alignment that leads to a formation of themetastable polymorph of phenytoin.25 Therefore, it is possibleto speculate that the origin of FEN form IIa is from the SIP effectof the glass substrate that induces the FENmolecular alignmentinto the polymorph IIa.
As shown in Fig. 4a, the amorphous FEN, which crystallisedat 40 �C with an OTS (FS-FEN 40 �C), had three endothermicmelting peaks for FEN at 70, 74 and 80 �C. The peak at 70 �C hasan extremely low enthalpy value indicating a trace quantity ofthis form, which could be a trace of form IIb. However, as themelting point of form IIb was not reported in the literature, thiscould not be conrmed. The two main melting peaks are theFEN forms IIa and I.14,16 The literature does not report themelting enthalpy of the pure FEN form IIa. However, as dis-cussed in the previous section, the single crystal structures offorms I and IIa are similar. It was thus expected that FEN formsI and IIa would demonstrate similar melting enthalpies. Thisallows the rough estimation of the amount of each form fromthe melting enthalpy values. The melting enthalpy of form IIapeak is 57.9� 1.8 J g�1 whereas form I had amelting enthalpy of27.9 � 5.6 J g�1, indicating that form IIa is the dominantpolymorphic form under these conditions.
In the B-FEN samples, a different crystallisation behaviourwas observed. The ATR-FTIR spectrum of the B-FEN whichcrystallised between coverslips at room temperature (B-FEN RT)was examined immediately aer removing the cover slips withcareful avoidance of any other physical contact with thesamples. The spectrum is identical with the spectrum of formIIa (Fig. 4b). Therefore, it can be concluded that covering thesample (B-FEN RT) resulted in a signicantly increased amountof form IIa crystallisation in comparison to FS-FEN. DSC wasnot performed on these samples, as the preparation of thesample for DSC requires removal by scratching the crystals offthe coverslip and this process is known to induce the conver-sion of form IIa to form I (Fig. S3†).
Effect of crystal growth temperatures on FS-FENcrystallisation
The effect of temperature on the crystal growth of FEN was rstindicated by the difference between the FS-FEN 40 �C and FS-FEN RT, as discussed in the previous section. Therefore, theeffect of temperature on the crystal growth at OTS was studiedby storage at room temperature (22 �C), 40, 50, 60 and 70 �C for30 minutes immediately aer the crystallisation was initiated byscratching. The crystallisation progressed rapidly as reported byAmstad12 and within 30 minutes all amorphous samplesappeared to be fully crystallised. At room temperature, thecontinuous growth of ne opaque crystals can be seen under-neath the white crystal cluster in the centre where the crystal-lisation was initiated by mechanical scratching. However,crystal growth at the temperatures of 40, 50 and 60 �C led to thegrowth of a layer of transparent spherulite crystals beneath theopaque central crystal cluster that was formed rst (Fig. 5a). ThePXRD patterns of the FS-FEN RT and FS-FEN 60 �C (Fig. 6a)contain peaks from form I and form IIa peaks that match theones reported by Di Martino and co-workers. This further
RSC Adv., 2018, 8, 13513–13525 | 13519

Fig. 7 (a) DSC thermogram demonstrating melting enthalpies of FS-FEN, which were incubated at different temperatures during their crys-tallisation; (b) changes in the melting enthalpies of FEN forms I and IIa with incubating temperature.
Fig. 8 ATR-FTIR spectra of (a) B-FEN 60 and 70 �C in comparison to the reference form I spectrum (1800–600 cm�1); (b) the subtracted spectraof B-FEN 60 and 70 �C from the form I spectrum at 3400 to 2600 cm�1; (c) HS-PLM images of B-FEN 70 �C heated to 40, 74 and 80 �C.
13520 | RSC Adv., 2018, 8, 13513–13525 This journal is © The Royal Society of Chemistry 2018
RSC Advances Paper
Ope
n A
cces
s A
rtic
le. P
ublis
hed
on 1
0 A
pril
2018
. Dow
nloa
ded
on 6
/29/
2022
8:1
3:15
AM
. T
his
artic
le is
lice
nsed
und
er a
Cre
ativ
e C
omm
ons
Attr
ibut
ion
3.0
Unp
orte
d L
icen
ce.
View Article Online
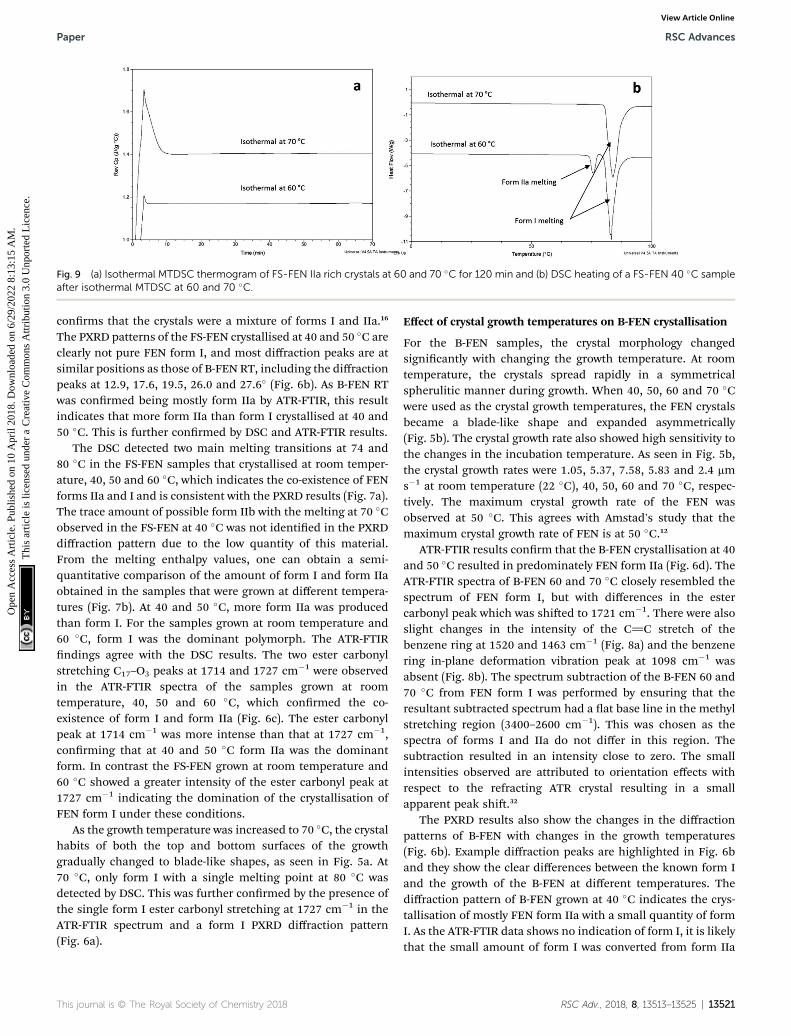
Fig. 9 (a) Isothermal MTDSC thermogram of FS-FEN IIa rich crystals at 60 and 70 �C for 120 min and (b) DSC heating of a FS-FEN 40 �C sampleafter isothermal MTDSC at 60 and 70 �C.
Paper RSC Advances
Ope
n A
cces
s A
rtic
le. P
ublis
hed
on 1
0 A
pril
2018
. Dow
nloa
ded
on 6
/29/
2022
8:1
3:15
AM
. T
his
artic
le is
lice
nsed
und
er a
Cre
ativ
e C
omm
ons
Attr
ibut
ion
3.0
Unp
orte
d L
icen
ce.
View Article Online
conrms that the crystals were a mixture of forms I and IIa.16
The PXRD patterns of the FS-FEN crystallised at 40 and 50 �C areclearly not pure FEN form I, and most diffraction peaks are atsimilar positions as those of B-FEN RT, including the diffractionpeaks at 12.9, 17.6, 19.5, 26.0 and 27.6� (Fig. 6b). As B-FEN RTwas conrmed being mostly form IIa by ATR-FTIR, this resultindicates that more form IIa than form I crystallised at 40 and50 �C. This is further conrmed by DSC and ATR-FTIR results.
The DSC detected two main melting transitions at 74 and80 �C in the FS-FEN samples that crystallised at room temper-ature, 40, 50 and 60 �C, which indicates the co-existence of FENforms IIa and I and is consistent with the PXRD results (Fig. 7a).The trace amount of possible form IIb with the melting at 70 �Cobserved in the FS-FEN at 40 �C was not identied in the PXRDdiffraction pattern due to the low quantity of this material.From the melting enthalpy values, one can obtain a semi-quantitative comparison of the amount of form I and form IIaobtained in the samples that were grown at different tempera-tures (Fig. 7b). At 40 and 50 �C, more form IIa was producedthan form I. For the samples grown at room temperature and60 �C, form I was the dominant polymorph. The ATR-FTIRndings agree with the DSC results. The two ester carbonylstretching C17–O3 peaks at 1714 and 1727 cm�1 were observedin the ATR-FTIR spectra of the samples grown at roomtemperature, 40, 50 and 60 �C, which conrmed the co-existence of form I and form IIa (Fig. 6c). The ester carbonylpeak at 1714 cm�1 was more intense than that at 1727 cm�1,conrming that at 40 and 50 �C form IIa was the dominantform. In contrast the FS-FEN grown at room temperature and60 �C showed a greater intensity of the ester carbonyl peak at1727 cm�1 indicating the domination of the crystallisation ofFEN form I under these conditions.
As the growth temperature was increased to 70 �C, the crystalhabits of both the top and bottom surfaces of the growthgradually changed to blade-like shapes, as seen in Fig. 5a. At70 �C, only form I with a single melting point at 80 �C wasdetected by DSC. This was further conrmed by the presence ofthe single form I ester carbonyl stretching at 1727 cm�1 in theATR-FTIR spectrum and a form I PXRD diffraction pattern(Fig. 6a).
This journal is © The Royal Society of Chemistry 2018
Effect of crystal growth temperatures on B-FEN crystallisation
For the B-FEN samples, the crystal morphology changedsignicantly with changing the growth temperature. At roomtemperature, the crystals spread rapidly in a symmetricalspherulitic manner during growth. When 40, 50, 60 and 70 �Cwere used as the crystal growth temperatures, the FEN crystalsbecame a blade-like shape and expanded asymmetrically(Fig. 5b). The crystal growth rate also showed high sensitivity tothe changes in the incubation temperature. As seen in Fig. 5b,the crystal growth rates were 1.05, 5.37, 7.58, 5.83 and 2.4 mms�1 at room temperature (22 �C), 40, 50, 60 and 70 �C, respec-tively. The maximum crystal growth rate of the FEN wasobserved at 50 �C. This agrees with Amstad's study that themaximum crystal growth rate of FEN is at 50 �C.12
ATR-FTIR results conrm that the B-FEN crystallisation at 40and 50 �C resulted in predominately FEN form IIa (Fig. 6d). TheATR-FTIR spectra of B-FEN 60 and 70 �C closely resembled thespectrum of FEN form I, but with differences in the estercarbonyl peak which was shied to 1721 cm�1. There were alsoslight changes in the intensity of the C]C stretch of thebenzene ring at 1520 and 1463 cm�1 (Fig. 8a) and the benzenering in-plane deformation vibration peak at 1098 cm�1 wasabsent (Fig. 8b). The spectrum subtraction of the B-FEN 60 and70 �C from FEN form I was performed by ensuring that theresultant subtracted spectrum had a at base line in the methylstretching region (3400–2600 cm�1). This was chosen as thespectra of forms I and IIa do not differ in this region. Thesubtraction resulted in an intensity close to zero. The smallintensities observed are attributed to orientation effects withrespect to the refracting ATR crystal resulting in a smallapparent peak shi.32
The PXRD results also show the changes in the diffractionpatterns of B-FEN with changes in the growth temperatures(Fig. 6b). Example diffraction peaks are highlighted in Fig. 6band they show the clear differences between the known form Iand the growth of the B-FEN at different temperatures. Thediffraction pattern of B-FEN grown at 40 �C indicates the crys-tallisation of mostly FEN form IIa with a small quantity of formI. As the ATR-FTIR data shows no indication of form I, it is likelythat the small amount of form I was converted from form IIa
RSC Adv., 2018, 8, 13513–13525 | 13521

RSC Advances Paper
Ope
n A
cces
s A
rtic
le. P
ublis
hed
on 1
0 A
pril
2018
. Dow
nloa
ded
on 6
/29/
2022
8:1
3:15
AM
. T
his
artic
le is
lice
nsed
und
er a
Cre
ativ
e C
omm
ons
Attr
ibut
ion
3.0
Unp
orte
d L
icen
ce.
View Article Online
during the PXRD sample preparation, during which an OTS hadto be introduced. The PXRD data of B-FEN grown at 70 �C PXRDis consistent with FEN form I. In both cases, there are few peaksmissing in comparison to the literature data. This is attributedto the orientation effect, which can be seen in both cases with(001) plane as preferred orientation for both forms. PXRD maytherefore, not be the most suitable technique to examine the B-FEN samples. Hot-stage microscopy was performed to clarifythe polymorph of the B-FEN 70 �C by determining its meltingpoint. The result demonstrated that the B-FEN 70 �C melts at80 �C, which is the same as the form I melting point andconrms it being FEN form I (Fig. 8c).
Physical stability of FEN form IIa formed with and withoutOTS
FS-FEN 40 �C was chosen as the representative sample to studythe physical stability of FEN form IIa because it contains thegreatest amount of the form IIa. The stability was monitored
Fig. 10 (a) Peak intensity changes of ester carbonyl stretching peak at 171at 70 �C of FS-FEN 40 �C indicating the transformation of form IIa toremoving coverslips and placing on the variable temperature ATR-FTIR fopeak of FEN form II at 1714 cm�1 gradually shifted to 1721 cm�1 indicati
13522 | RSC Adv., 2018, 8, 13513–13525
during six months at room temperature using PXRD. There is noclear evidence of the continuous polymorphic transformation ofform IIa to I in the mixtures at room temperature (Fig. S1†).However, the conversion to form I can be accelerated by applyingthermal annealing. Isothermal MTDSC was used to further probethe effect of annealing temperature on the conversion of form IIato form I. It has been reported previously that a change in the Cp
during an isothermal DSC experiment is related to polymorphicconversion.33 As seen in Fig. 9a, a more signicant surge of thereversing Cp signal was observed at the beginning of theannealing period at 70 �C than at 60 �C (completed within 11.3�1.2 minutes for annealing at 70 �C and 4.8 � 0.2 minutes at 60�C). The peak observed in the reversing Cp signal is associatedwith the polymorphic conversion of form IIa to form I. A standardDSC was used to conrm the nature of the Cp change aer theisothermal MTDSC experiment. Only the melting of form I wasdetected in the FS-FEN 40 �C samples that had been annealed at70 �C (Fig. 9b). This indicates that the change in the Cp is
4 cm�1 (form IIa) shifted to 1727 cm�1 (form I) during 3 hours annealingform I (b) peak intensity changes in ATR-FTIR spectra of B-FEN afterr 3 hours annealing at 70 �C. It should be noted that the characteristic
ng the polymorphic conversion of form IIa to I.
This journal is © The Royal Society of Chemistry 2018

Paper RSC Advances
Ope
n A
cces
s A
rtic
le. P
ublis
hed
on 1
0 A
pril
2018
. Dow
nloa
ded
on 6
/29/
2022
8:1
3:15
AM
. T
his
artic
le is
lice
nsed
und
er a
Cre
ativ
e C
omm
ons
Attr
ibut
ion
3.0
Unp
orte
d L
icen
ce.
View Article Online
associated with the complete polymorphic transformation ofform IIa to form I; whereas, the melting of form IIa can still beobserved in the sample that annealed at 60 �C, but with a reducedenthalpy value and accompanied by the melting of form I. Thereduced enthalpy of FEN form IIa is again associated with anincomplete conversion of form IIa to form I during annealing at60 �C (Fig. 9b). Variable temperature ATR-FTIR spectroscopy ofthe FS-FEN 40 �C sample that annealed at 70 �C revealed thetransformation of the two ester carbonyl stretching peaks at 1714and 1727 cm�1 to a single peak at 1727 cm�1 which agrees wellwith the DSC results conrming the conversion of form IIa toform I (Fig. 10a). A similar transformation occurs when B-FEN isannealed at 70 �C (Fig. 10b).
For B-FEN samples, aer the complete crystallisation atroom temperature, PXRD was used to monitor the six-monthphysical stability of form IIa stored at room temperature. Theform IIa is stable for at least six months at room temperatureaer the top substrate is removed without conversion into formI (Fig. S2†). This indicates that at room temperature, form IIa isrelatively stable, which is conrmed by the single crystalstructural study.
Fig. 11 Images of FEN crystal growth mode being switched from form IIabetween sandwiched coverslips at room temperature over 17 minutes (aform IIa crystal growth was terminated and form I crystallisation occurredmin); and (g) spherulite and needle-like crystalline regions were distingcarbonyl stretching peaks at 1714 and 1727 cm�1 indicates the presence
This journal is © The Royal Society of Chemistry 2018
‘Switching’ of polymorphic form growth
The conversion of form IIa to form I can be induced by externalmechanical stress, such as scratching with a stainless-steelspatula, or thermal treatment (Fig. S3†). In addition to this,the signicance of OTS on the crystallisation of FEN poly-morphic forms from the melt is further demonstrated bya ‘switching’ effect of the polymorphic growth. It was observedthat if there was still non-crystallised amorphous materialavailable in B-FEN samples, removing the cover slip led to thetermination of the crystallisation to form IIa, and the growth ofform I. As seen in Fig. 11a–c, the continuous growth of FENform IIa from the melt was observed between coverslips. Thespherulite form IIa crystals, which were identied by the estercarbonyl vibration at 1714 cm�1 using ATR-FTIR spectroscopy,expand radially from the nucleation site (initiated by surfacescratching) throughout the melt. The removal of the topcoverslip before the completion of the crystallisation termi-nated the expansion of the form IIa (Fig. 11d). Instead, needle-like clusters of crystals could be seen growing rapidly on theedge of the form IIa crystals (Fig. 11e and f). These needle-likecrystals were identied as form I by the shi of the ester
to form I after top coverslip removal. (a–c) FEN form IIa crystals grown¼ initial, b ¼ 5 min, c ¼ 15 min); (d–f) following top cover slip removal,throughout the remaining amorphous FEN (d¼ initial, e¼ 5min, f¼ 15uished as two separate domains using ATR-FTIR in which the esterof forms IIa and I, respectively.
RSC Adv., 2018, 8, 13513–13525 | 13523

RSC Advances Paper
Ope
n A
cces
s A
rtic
le. P
ublis
hed
on 1
0 A
pril
2018
. Dow
nloa
ded
on 6
/29/
2022
8:1
3:15
AM
. T
his
artic
le is
lice
nsed
und
er a
Cre
ativ
e C
omm
ons
Attr
ibut
ion
3.0
Unp
orte
d L
icen
ce.
View Article Online
carbonyl stretching peak to 1727 cm�1 using ATR-FTIR spec-troscopy (Fig. 11g). This phenomenon, in which the crystallineform IIa initiates form I, is likely to be due to cross-nucle-ation.26,34–37 This is a phenomenon in which one crystallinepolymorph is nucleated by another polymorph. Tao et al.observed that the seed crystals of mannitol forms b andd induced the crystallisation of mannitol form a at a tempera-ture below 150 �C. While mannitol form b was the only formthat crystallised at a temperature greater than 150 �C.26 Gunnet al. reported the crystallisation and growth of nifedipinemetastable b and X forms at growth temperatures below 110 �C,whereas pure stable a form of nifedipine was obtained atgrowth temperatures above 120 �C.35 Hence, the cross-nucleation of mannitol and nifedipine is temperature depen-dent.35,36 To the best of our knowledge, this ‘switching’ effect ofthe crystal forms provided by the presence of OTS has not beenreported previously.
Conclusion
This study demonstrated that the availability of an OTS duringcrystallisation is a factor that strongly impacts the polymorphicform selection of the super cooled liquid of FEN. Moreover, theuse of a thermal treatment in addition to an OTS can ne tunethe selection of the crystallisation of FEN into form I and formIIa. The crystal growth mode switching form IIa to form I occurswhen an OTS is introduced to the incomplete crystallisation ofform IIa. This indicates that the crystallisation of form I ishighly dependent on the OTS. This study reports for the rsttime the crystallographic data of metastable FEN form IIa,which conrmed the similarity of it to the molecular packing ofthe stable form I and claried the confusion between the FENform IIs in the literature. This study has produced new insightsinto how to use an OTS to manipulate and control the crystal-lisation of FEN which will allow improved polymorphic controlduring crystallisation of FEN.
Conflicts of interest
There are no conicts to declare.
Acknowledgements
The authors would like to acknowledge the IMODE Interreg 2Seas Cross-border Cooperation Programme for funding. More-over, we would like to thanks to Dr David Hughes for his kindhelp with the single crystal X-ray experiments.
References
1 H. Ling, J. T. Luoma and D. Hilleman, Cardiol. Res., 2013, 4,47–55.
2 K. Tziomalos and V. G. Athyros, Int. J. Nanomed., 2006, 1,129–147.
3 P. Buch, P. Holm, J. Q. Thomassen, D. Scherer,R. Branscheid, U. Kolb and P. Langguth, J. Pharm. Sci.,2010, 99, 4427–4436.
13524 | RSC Adv., 2018, 8, 13513–13525
4 S. Jamzad and R. Fassihi, AAPS PharmSciTech, 2006, 7, E17–E22.
5 H. He, R. Yang and X. Tang, Drug Dev. Ind. Pharm., 2010, 36,681–687.
6 S. M. Hossen, R. Sarkar, M. H. A. Towhid, M. T. Sultan andN. A. Aziz, J. Appl. Pharm. Sci., 2014, 4, 056–060.
7 T. Patel, L. Patel, T. Patel, S. Makwana and T. Patel, Int. J. Res.Pharm. Sci., 2010, 1, 127–132.
8 P. Srinarong, J. H. Faber, M. R. Visser, W. L. J. Hinrichs andH. W. Frijlink, Eur. J. Pharm. Biopharm., 2009, 73, 154–161.
9 D. Zhou, G. G. Z. Zhang, D. Law, D. J. W. Grant andE. A. Schmitt, J. Pharm. Sci., 2002, 91, 1863–1872.
10 U. Sailaja, M. S. Thayyil, N. S. K. Kumar and G. Govindaraj, J.Pharm. Anal., 2016, 6, 165–170.
11 P. Tipduangta, K. Takieddin, L. Fabian, P. Belton and S. Qi,Cryst. Growth Des., 2015, 15, 5011–5020.
12 E. Amstad, F. Spaepen and D. A. Weitz, Phys. Chem. Chem.Phys., 2015, 17, 30158–30161.
13 S. Watterson, S. Hudson, M. Svard and A. C. Rasmuson, FluidPhase Equilib., 2014, 367, 143–150.
14 P. Di Martino, G. Palmieri and S. Martelli, Die Pharmazie,2000, 55, 625–626.
15 A. Gorniak, A. Wojakowska, B. Karolewicz and J. Pluta, J.Therm. Anal. Calorim., 2011, 104, 1195–1200.
16 A. Heinz, K. C. Gordon, C. M. McGoverin, T. Rades andC. J. Strachan, Eur. J. Pharm. Biopharm., 2009, 71, 100–108.
17 G. K. Balendiran, N. Rath, A. Kotheimer, C. Miller, M. Zellerand N. P. Rath, J. Pharm. Sci., 2012, 101, 1555–1569.
18 T. Cai, L. Zhu and L. Yu, J. Pharma Res., 2011, 28, 2458–2466.19 Y. Sun, L. Zhu, K. L. Kearns, M. D. Ediger and L. Yu, Proc.
Natl. Acad. Sci. U. S. A., 2011, 108, 5990–5995.20 T. Wu and L. Yu, Pharm. Res., 2006, 23, 2350–2355.21 L. Zhu, L. Wong and L. Yu, Mol. Pharm., 2008, 5, 921–926.22 Y. Diao, A. S. Myerson, T. A. Hatton and B. L. Trout,
Langmuir, 2011, 27, 5324–5334.23 A. O. F. Jones, B. Chattopadhyay, Y. H. Geerts and R. Resel,
Adv. Funct. Mater., 2016, 26, 2233–2255.24 B. M. Ocko, X. Z. Wu, E. B. Sirota, S. K. Sinha, O. Gang and
M. Deutsch, Phys. Rev. E: Stat. Phys., Plasmas, Fluids, Relat.Interdiscip. Top., 1997, 55, 3164–3182.
25 D. Reischl, C. Rothel, P. Christian, E. Roblegg,H. M. A. Ehmann, I. Salzmann and O. Werzer, Cryst.Growth Des., 2015, 15, 4687–4693.
26 J. Tao, K. J. Jones and L. Yu, Cryst. Growth Des., 2007, 7, 2410–2414.
27 J. A. Baird, B. Van Eerdenbrugh and L. S. Taylor, J. Pharm.Sci., 2010, 99, 3787–3806.
28 Programs CrysAlisPro, Oxford Diffraction Ltd, Abingdon, UK,2010.
29 G. M. Sheldrick, Acta Crystallogr., Sect. A: Found. Adv., 2015,71, 3–8.
30 G. M. Sheldrick, Acta Crystallogr., Sect. C: Struct. Chem., 2015,71, 3–8.
31 C. B. Hubschle, G. M. Sheldrick and B. Dittrich, J. Appl.Crystallogr., 2011, 44, 1281–1284.
This journal is © The Royal Society of Chemistry 2018

Paper RSC Advances
Ope
n A
cces
s A
rtic
le. P
ublis
hed
on 1
0 A
pril
2018
. Dow
nloa
ded
on 6
/29/
2022
8:1
3:15
AM
. T
his
artic
le is
lice
nsed
und
er a
Cre
ativ
e C
omm
ons
Attr
ibut
ion
3.0
Unp
orte
d L
icen
ce.
View Article Online
32 B. H. Stuart, in Infrared Spectroscopy: Fundamentals andApplications, John Wiley & Sons, Ltd, 2005, pp. 45–70, DOI:10.1002/0470011149.ch3.
33 S. Qi and D. Q. M. Craig, Mol. Pharm., 2012, 9, 1087–1099.34 S. Chen, H. Xi and L. Yu, J. Am. Chem. Soc., 2005, 127, 17439–
17444.
This journal is © The Royal Society of Chemistry 2018
35 E. Gunn, I. A. Guzei, T. Cai and L. Yu, Cryst. Growth Des.,2012, 12, 2037–2043.
36 J. Tao and L. Yu, J. Phys. Chem. B, 2006, 110, 7098–7101.37 L. Yu, J. Am. Chem. Soc., 2003, 125, 6380–6381.38 R. Henry, G. Zhang, Y. Gao and I. Buckner, Acta Crystallogr.,
Sect. E: Struct. Rep. Online, 2003, 59, o699–o700.
RSC Adv., 2018, 8, 13513–13525 | 13525