Reconstruction of human evolutionary tree using polymorphic autosomal microsatellites
Upload
independentCategory
view
0download
0
Molecular Ecology (2000)
9
, 2155–2234
© 2000 Blackwell Science Ltd
Blackwell Science, Ltd
PRIMER NOTES
0000Graphicraft Limited, Hong Kong
Microsatellite loci for the social wasp
Polistes dominulus
and their application in other polistine wasps
MICHAEL T. HENSHAW*
Department of Ecology and Evolutionary Biology, Rice University, PO Box 1892, Houston, TX 77251–1892, USA
Keywords
: Polistinae, social wasps, Vespidae
Received 21 March 2000; revision accepted 29 May 2000
Correspondence: Michael T. Henshaw.
*
Present address: Department of Entomology, 102 Fernald Hall, University of Massachusetts, Amherst, MA 01003–2410 USA. Fax: (413) 545–0231; E-mail: [email protected]
The social wasps of the genus
Polistes
are an important modelsystem for understanding the evolution of cooperation. Theirrelatively simple societies lack the distinct morphologicalcastes which characterize many of the social insects, and newlyemerged females possess a variety of reproductive options(Reeve 1991). A female may remain on her natal nest as a helpergaining indirect fitness; usurp a foreign nest and becomereproductively dominant; initiate a new nest independently;reproduce on a satellite nest; or initiate a new nest in coopera-tion with other wasps (Strassmann 1981; Reeve 1991; Mead
et al
. 1995; Cervo & Lorenzi 1996; Queller
et al.
2000). Bycharacterizing the reproductive payoffs associated withdifferent reproductive strategies, we are better able to under-stand how cooperative societies are maintained.
Recently, microsatellite genetic loci have greatly extendedour ability to characterize the reproductive strategies used bysocial wasps (Hughes 1998; Queller
et al
. 1993a). Using micro-satellite loci we can reconstruct pedigrees, and estimaterelatedness. Using this information, unobserved events suchas queen death, nest usurpation or past reproductive domin-ance can be inferred (Queller
et al
. 1993a,b; Field
et al
. 1998;Hughes 1998). In this paper, I describe microsatellite lociisolated from the social wasp
Polistes dominulus
, one of thebest studied
Polistes
species.We followed published protocols for the isolation of micro-
satellite loci (Strassmann
et al
. 1996) with clarifications andmodifications to those protocols as noted below. DNA wasextracted from 1 to 1.5 g of pupal thoraces ground in a mortarand pestle which had been chilled in liquid nitrogen. Theground tissue was suspended in grinding buffer (0.1
m
NaCl;0.1
m
Tris-HCl, pH 9.1; 0.05
m
EDTA; 0.05% SDS), and purifiedthree times with phenol:chloroform:isoamyl alcohol (25:24:1),and then three times with chloroform:isoamyl alcohol (24:1).The purified genomic DNA was then ethanol precipitated,and resuspended in distilled water.
Genomic DNA was digested with
Sau
3aI, and 300–1000 bpinserts were ligated into the pZErO –2 plasmid (Zero Back-ground cloning kit, Invitrogen) digested with
Bam
HI. Wetransformed TOP10 cells (Invitrogen) to obtain approximately
5000–6000 clones. Nylon replicates of the genomic library wereprobed with five oligonucleotides (AAT
10
, AAG
10
, AAC
10
, TAG
10
,and CAT
10
) which were end-labelled with [
γ
-
33
P]-dATP. Probesof the nylon replicates yielded 151 positives and subsequentprobing of plasmid DNA on the southern blot confirmed 34unique positives. Clones which were positive on the south-ern blot were sequenced on an ABI 377 automated sequencer(Perkin-Elmer), and 19 sets of polymerase chain reaction (PCR)primers were designed from the 28 resulting sequences usingMac Ventor 5.0 (Kodak Scientific Imaging Systems).
We optimized the PCR primers on an MJ Research PTC-100 thermocycler using 10
µ
L reactions (Peters
et al
. 1998),and assessed within-species polymorphisms for eight speciesof polistine wasps, using from one to eight unrelated femalesfor each species (Table 1). PCR products were visualized on6% polyacrylamide/8
m
Urea sequencing gels.Twelve of the 19 loci tested were polymorphic within our
P. dominulus
population and had a mean observed hetero-zygosity (
H
O
) of 0.76. Loci with a minimum of five uninterruptedrepeats were polymorphic, and heterozygosity increasedlogarithmically with the number of uninterrupted repeats(Fig. 1; logarithmic regression,
R
2
= 0.454,
P
= 0.0016). Theloci retained much of their polymorphism in other speciesof
Polistes
with six polymorphic loci for
P. fuscatus
and
P. apachus
which had a mean
H
O
of 0.48. No polymorph-isms were detected outside of the
Polistes
genus, however, itis likely that some polymorphisms went undetected due tothe small number of individuals screened in the other species(Table 1).
Acknowledgements
This work was supported by a National Science Foundation(NSF) grant DEB-9510126 to Joan Strassmann and David Queller,
Fig. 1 The relationship between the observed heterozygosityand the number of uninterrupted repeats for 19 microsatelliteloci isolated from Polistes dominulus.
MEC1053.fm Page 2155 Wednesday, November 15, 2000 8:58 AM

2156
PR
IME
R N
OT
ES
© 2000 B
lackwell Science L
td,
Molecular Ecology
, 9, 2155–2234
Table 1
A description of polymorphic microsatellite loci isolated from
Polistes dominulus
, including their utility in related polistine taxa. The sample size (
n
) for each species is given inthe column heading with exceptions for certain primers noted in the table. Where
n
≥
3, we report the observed heterozygosity for all species, as well as the expected heterozygosity for
P. dominulus
. In all cases we report the observed number of alleles in parentheses. The product size and repeat region data are based on the sequenced allele. NP = no scorable product.GenBank accession nos are AF155596 to AF155623 and include 16 additional loci not summarized in the table
LocusSize (bp)
T
a
(
°
C) Repeat
Polistes
dominulus (
n = 8)
Polistes
fuscatus
(
n
= 4)
Polistes
apachus
(
n
= 4)
Protopolybia
exigua
(
n
= 2)
Brachgastera
mellifica
(
n
= 2)
Polybia
occidentallis
(
n
= 1)
Ropalidiaexcavata
(
n
= 1)
Miscocyterus alfkenii
(
n
= 1) Primers (5
′
–3
′
)
Pdom 1 209 55 (
CAG
)
9
TAG
(
CAG
)
5
H
O
= 0.38 (3) 0.00 (1) –(2) –(1) –(1) –(1) –(1) –(1) F:
GGACGCTCGGCTGATTTGTC
(
CAT
)
5
GGCAC
(
CAG
)
3
H
E
= 0.41
n
= 1 R:
AAGGGATTTTTCCTGAGACTATTCG
Pdom 2 184 51, 48 (
AAG
)
8
CG
(
AAG
)
2
H
O
= 0.75 (4) 0.50 (4) 0.33 (3) NP NP NP NP NP F:
CGTCTCTCGAAATATGCTAAAC
H
E
= 0.63 R:
AGAACGGTAAACATTCTTCTATC
Pdom 7 160 54 (
AAG
)
CAG
(
AAG
)
9
H
O
= 0.75 (5) –(1) 0.00 (1) –(1) –(1) –(1) NP –(1) F:
CACTGTATTGTCCTACGGTGGTCC
H
E
= 0.73
n
= 2
n
= 1
n
= 1 R:
GCGAGAACCTGTACTCAAAACAAAC
Pdom 20 236 55, 52 (
CAT
)
18
H
O
= 0.88 (4) 0.75 (6) 1.00 (5) NP NP NP NP NP F:
TTCTCTGGCGAGCTGCACTC
H
E
= 0.63 R:
AGATGGCATCGTTTGAAAGAGC
Pdom 25 157 50, 45 (
AAG
)
11
H
O
= 0.50 (3) NP NP NP NP NP NP NP F:
CATTATAAACGCCGCG
H
E
= 0.53 R:
ACGATGGAAACGTAAGTCC
Pdom 93 131 55 (
AAG
)
2
ACG
(
AAG
)
2
H
O
= 0.63 (2) 0.25 (4) 0.50 (5) –(1) –(1) NP –(1) NP F:
CCATCAGCTGTCCCATTCGCACG
(
AAG
)
5
H
E
= 0.43 R:
AATCGGTTTCGCTCGTCCACCTCC
Pdom 117 260 51, 48 (
AAG
)
4
AGG
(
AAG
)
2
H
O
= 1.00 (9) 0.25 (2) –(2) –(1) –(1) NP NP NP F:
AAGAAAACCTACTACGTTGTGTGAGAGG
(
AAG
)
14
H
E
= 0.83
n
= 2 R:
TTTCAACATTCCATAGGGACAG
Pdom 121 218 54, 50 (
AAG
)
8
AGGAAC
H
O
= 0.63 (6) 0.00 (1) 0.00 (1) NP NP NP NP –(1) F:
GAGTGGGTATGACGAAGATGATGG
(
AAG
)
2
AAC(AAG)2 HE = 0.78 R:TGATTATAGCCTGCCGAAACTCTGPdom 122 172 46, 48 (AAT)10GAAAAT HO = 1.00 (9) 0.50 (2) –(2) NP NP NP NP –(1) F:CCGAAGAATGATAGTAGGTCC
(AAT)2GAAAAT (AAT)8 HE = 0.85 n = 1 R:AGACCATCTCTCGCACGCPdom 127b 119 48 (AAT)13... (AAT)6 AA HO = 0.88 (9) 0.00 (1) 0.00 (1) –(1) –(1) –(1) –(1) –(1) F:TCCCCCGTTTTTGGTCCTTG
(AAT)4AAC(AAT) HE = 0.80 R:GGGAGAGAATCGTGCCTTTTCPdom 139 186 48, 45 (AAC)7(AAT)2(AAC) HO = 0.88 (6) 0.00 (1) 0.00 (1) NP NP NP NP – (1) F:TGACAAAAGACAACAAAATATG
(AAT)2(AAC)2 HE = 0.72 R:AGCTTCGGTAGGGCTTCGPdom 140 192 55 (TAG)9 HO = 0.88 (9) 0.00 (1) 0.00 (1) –(1) –(1) –(1) NP NP F:GCTTTTCCCTTATTTTCCCG
HE = 0.85 R:CGTGTTCGTATATTCCTGTAACGPdom 151 115 52, 50 (CAT)2AA(CAT)CAAT HO = 0.00 (1) 0.25 (2) –(1) –(1) –(1) NP –(2) –(1) F:TGATGTTACCACTGCTTTGAGCG
(CAT)3 HE = 0.00 R:TTCAGCACCGTCGTCGTTGTTG
Ta, annealing temperature.
ME
C1053.fm
Page 2156 W
ednesday, Novem
ber 15, 2000 8:58 AM

P R I M E R N O T E S 2157
© 2000 Blackwell Science Ltd, Molecular Ecology, 9, 2155–2234
and by a NSF predoctoral fellowship to MT Henshaw. I thank JEStrassmann and DC Queller for comments on the manuscript,Steffano Turillazzi and Rita Cervo for their help collecting waspsin Italy, and Aviva Liebert for help screening the loci in otherspecies.
References
Cervo R, Lorenzi MC (1996) Behavior in usurpers and late joinersof Polistes biglumis bimaculatus (Hymenoptera: Vespidae). InsectesSociaux, 43 (3), 255–266.
Field J, Solis CR, Queller DC, Strassmann JE (1998) Social andgenetic structure of Papers Wasp Cofoundress Associations:tests of reproductive skew models. The American Naturalist, 151(6), 545–563.
Hughes CR (1998) Integrating molecular techniques with fieldmethods in studies of social behavior: a revolution results.Ecology, 79, 383–399.
Mead F, Gabouriaut D, Habersetzer C (1995) Nest-foundingbehavior induced in the first descendants of Polistes dominulusChrist (Hymenoptera: Vespidae) colonies. Insectes Sociaux, 42(4), 385–396.
Peters JM, Queller DC, Imperatriz Fonseca VL, Strassmann JE(1998) Microsatellite loci for stingless bees. Molecular Ecology, 7,783–792.
Queller DC, Strassmann JE, Hughes CR (1993a) Microsatellitesand kinship. Trends in Ecology and Evolution, 8 (8), 285–288.
Queller DC, Strassmann JE, Solís CR, Hughes CR, DeLoach DM(1993b) A selfish strategy of social insect workers that promotessocial cohesion. Nature, 365, 639–641.
Queller DC, Zacchi F, Cervo R, et al. (2000) Unrelated helpers in asocial insect. Nature, 405, 784–787.
Reeve HK (1991) Polistes. In: The Social Biology of Wasps (edsRoss KG, Matthews RW), pp. 99–148. Cornell University Press,Ithaca.
Strassmann JE (1981) Evolutionary implications of early maleand satellite nest production in Polistes exclamans colony cycles.Behavioral Ecology and Sociobiology, 8, 55–64.
Strassmann JE, Solís CR, Peters JM, Queller DC (1996) Strategiesfor finding and using highly polymorphic DNA microsatelliteloci for studies of genetic relatedness and pedigrees. In:Molecular Zoology: Advances, Strategies and Protocols (edsFerraris JD, Palumbi SR), pp. 163–180, 528–549. Wiley-Liss,Inc., New York.
91220001112 PRIMER NOTEs PRIMER NOTEsPRIMER NOTEs100Graphicraft Limited, Hong Kong
Characterization of nuclear microsatellites in Pinus halepensis Mill. and their inheritance in P. halepensis and Pinus brutia Ten.
R. N. KEYS, * A. AUTINO,† K . J . EDWARDS,‡ B . FADY,* C . P ICHOT* and G. G . VENDRAMIN†
*Institut National de la Recherche Agronomique, Unité des Recherches Forestières Méditerranéennes, Avenue Vivaldi, 84000 Avignon, France, †Istituto Miglioramento Genetico Piante Forestali, Consiglio Nazionale delle Ricerche, via Atto Vanucci 13, 50134 Firenze, Italy, ‡IACR-Long Ashton Research Station, University of Bristol, Bristol BS41 9AF, UK
Keywords: microsatellite primers, Pinus brutia, Pinus halepensis
Received 25 May 2000; revision received 29 June 2000; accepted 24 July 2000
Correspondence: B. Fady. Fax: +33 4 90 13 59 59; E-mail: [email protected]
Nuclear microsatellites, or single sequence repeats (nSSRs),have been characterized in many tree species and are powerfulmarkers for genetic diversity studies in natural populations(e.g. Echt et al. 1996; Pfeiffer et al. 1997). Although nSSR enrich-ment protocols have successfully been applied to conifers(Edwards et al. 1996), identification of single-locus, reproduciblemarkers is difficult, probably because of their large genomesize and complexity (Pfeiffer et al. 1997; Soranzo et al. 1998).In this study, we report the successful isolation of nSSRs inPinus halepensis Mill. and their Mendelian segregation in bothP. halepensis and P. brutia, two closely related Mediterraneanpines.
A microsatellite library enriched for di- (GC, CT, CA),tri- (CAA, GCC) and tetra-nucleotide (GATA, CATA) repeatswas constructed for Pinus halepensis, following the methoddescribed by Edwards et al. (1996). A total of 43 clonescontaining a microsatellite were detected from 47 clonesrandomly chosen from the library: 16% were repetitions of asingle nucleotide (A/T), 77% were repetitions of dinucleotides(CA, CT or compounds CA–TA, CA–GA) and 7% were repeti-tions of trinucleotides (TAA, GCC). Sequencing reactionswere performed using the Pharmacia AutoRead SequencingKit, and run on a 6% polyacrylamide gel containing 7 murea using an ALF Pharmacia automatic sequencer. Primerswere designed for the amplification of 25 dinucleotidenSSRs using the computer program Primer (http://www-genome.wi.mit.edu/genome_software/other/primer3.html).
Total genomic DNA extracted from leaf and mega-gametophyte tissue was used for testing the primer pairs. Theprocedure described by Doyle and Doyle (1990) and theNucleon Phytopur DNA extraction kit were used for leaftissue and mega-gametophytes, respectively. Polymerase chainreaction (PCR) was carried out using a Gradient 96 StratageneRobocycler: the reaction solution (25 µL) contained four dNTPs(each 0.2 mm), 0.25 µm of each primer, 2.5 µL reaction buffer(100 mm Tris–HCl pH 9.0, 15 mm MgCl2, 500 mm KCl), 25 ngof template DNA and 1 unit of Taq polymerase (Pharmacia).After a preliminary denaturing step at 95 °C for 1.5 min, PCRamplification was performed for 35 cycles: 1.5 min denaturingat 94 °C, 1.5 min at annealing temperature (Table 1) and 1.5 minextension at 72 °C, with a final 5 min step at 72 °C. Afteramplification, PCR products were mixed with a loading buffer(98% formamide, 10 mm EDTA pH 8.0, 0.1% bromophenolblue, 0.1% xylene cyanol and 10 mm NaOH), heated for 5 minat 95 °C, and then set on ice. Fragments were electrophoreticallyseparated on a 6% polyacrylamide gel and stained usingsilver nitrate (Rajora et al. 2000).
Out of 25 primer pairs, nine (36%) either gave no amplifica-tion (n = 4) or produced multi-band patterns (n = 5). Sixteenproduced fragment amplification in the expected size range,of which eight were polymorphic within one or the otherspecies (Table 1). This proportion of functional markers is com-parable to what is generally observed in conifers (e.g. Echt
MEC1053.fm Page 2157 Wednesday, November 15, 2000 8:58 AM
2158P
RIM
ER
NO
TE
S
© 2000 B
lackwell Science L
td, M
olecular Ecology, 9, 2155–2234
Table 1 Primers and characteristics of seven microsatellite loci that were polymorphic either within Pinus halepensis or within Pinus brutia*
Locus†Repeat sequence Primer sequence (5′ → 3′)
Annealing temp. (°C)
MgCl2 (mm)
Expected size (bp)
Number of alleles‡
Heterozygosity (HO/HE)§
Number of mega-gametophytes per bi-allelic combination
χ2 test (P value)
Accession no.
PHAF01 (CA)18 F: TTCAGATATGGTCCATGGATG 54 2.5 194 3/3 0.611/0.538 15 0.795 AF195535R: GATCACAATGTCATTATCGGG
PHAF02 (CA)15 F: TGGCAATGGAAACCTGATAC 54 2.5 149 3/3 0.550/0.609 15 0.795 AF195536R: GCCCCACCATCATATCTCTTTAG
PHAF05 (CA)17 F: TCATAAGCCCTTTGTTTCTTTTC 56 3.5 125 4/4 0.611/0.624 20, 15, 8 0.655, 0.197, 1 AF195540R: TTTTTCGCCCTGTATTTTCTG
PHAF07 (CT)16 F: ATCAGCTTAGTAGGTCTCGCC 54 2.5 123 3/3 0.700/0.676 13, 9 0.782, 0.739 AF195541R: AGACACTAAAGGGGAGTCCG
PHAF08 (CT)25 F: TTCCACATTGTATTTTGATGCT 53 4.5 150 2/1 0.500/0.479 19 0.251 AF195542R: AACTTTGGAAGTGACCAAATGT
PHAF09 (CT)18 F: ACTAAGAAACGGTGTGATGCTG 59 2.5 198 2/1 0.600/0.505 19 0.819 AF195538R: CTTCGCATAGGCATGCATAC
PHAF10 (CA)17(TA)3 F: TCCTTTCTTGTTCTTGGTAACTG 53 2.5 129 4/4 0.529/0.665 19, 16 0.108, 1 AF195543R: ACCGCGGATTATAACCTGTG
*An eighth locus, ITPF4516 (accession AJ012087) tested in P. pinaster (Mariette et al. 2000), is polymorphic in P. halepensis and P. brutia (four common alleles in both species). †PHAF, Pinus halepensis Avignon Firenze. ‡Values are for P. halapensis/P. brutia. In loci PHAF08 and PHAF09, P. halepensis and P. brutia do not share common alleles (sizes 205 and 155 bp respectively). §HO is the frequency of heterozygotes in the sample and HE is the unbiased expected heterozygosity (Nei 1978), where HE = (2n/2n – 1) (1 – Σpi
2).
ME
C1053.fm
Page 2158 W
ednesday, Novem
ber 15, 2000 8:58 AM

P R I M E R N O T E S 2159
© 2000 Blackwell Science Ltd, Molecular Ecology, 9, 2155–2234
et al. 1996; Pfeiffer et al. 1997). A single marker was found tobe polymorphic in Pinus pinaster when the same 25 primerpairs were tested (Mariette et al. 2000). Transfer of nSSRmarkers across species of the same genus is generally difficultin conifers (e.g. Echt & May-Marquardt 1997), and theresults thus confirm the close taxonomic relatedness betweenP. halepensis and P. brutia.
nSSR polymorphism was screened at population level using50 P. brutia individuals (two populations) and 47 P. halepensisindividuals (three populations). The maximum number ofalleles per locus was four, and the expected heterozygosity perlocus was between 0.479 and 0.676 (Table 1), which is lowerthan observed for other conifers, e.g. Pinus sylvestris (Soranzoet al. 1998) or Picea abies (Pfeiffer et al. 1997), but higher thanfound using isozymes (Schiller et al. 1986; Teisseire et al. 1995).Mendelian segregation was tested on 1–3 bi-allelic com-binations in all polymorphic loci (Table 1). No significantdeviation from the expected 1:1 ratio was observed. nSSRsare thus potentially helpful markers for studying populationdiversity in P. halepensis and P. brutia.
Acknowledgements
This study was supported by the European Union, contract FAIRCT95-0097 ‘Mediterranean Pinus and Cedrus’. Many thanks toB. Jouaud for technical assistance.
References
Doyle JJ, Doyle JL (1990) Isolation of plant DNA from freshtissue. Focus, 12, 13–15.
Echt CS, May-Marquardt P (1997) Survey of microsatellite DNAin pine. Genome, 40, 9–17.
Echt CS, May-Marquardt P, Hseih M, Zahorchak R (1996)Characterization of microsatellite markers in eastern whitepine. Genome, 39, 1102–1108.
Edwards KJ, Barker JHA, Daly A, Jones C, Karp A (1996) Micro-satellite libraries enriched for several microsatellite sequencesin plants. Biotechniques, 20, 758–760.
Mariette S, Chagne D, Decroocq S, Vendramin GG, Lalanne C,Madur D, Plomion C (2000) Microsatellite markers for Pinuspinaster Ait. Annals of Forest Science, in press.
Nei M (1978) Estimation of average heterozygosity and geneticdistance from a small number of individuals. Genetics, 89,583–590.
Pfeiffer A, Olivieri AM, Morgante M (1997) Identification andcharacterization of microsatellites in Norway spruce (Piceaabies K.). Genome, 40, 411–419.
Rajora OP, Rahman MH, Buchert GP, Dancik BP (2000) Micro-satellite DNA analysis of genetic effects of harvesting inold-growth eastern white pine (Pinus strobus) in Ontario,Canada. Molecular Ecology, 9, 339–348.
Schiller G, Conkle MT, Grunwald C (1986) Local differentiationamong Mediterranean populations of Aleppo pine in theirisoenzymes. Silvae Genetica, 35, 11–18.
Soranzo N, Provan J, Powell W (1998) Characterisation of micro-satellite loci in Pinus sylvestris L. Molecular Ecology, 7, 1247–1248.
Teisseire H, Fady B, Pichot C (1995) Allozyme variation in fiveFrench populations of Aleppo pine (Pinus halepensis Mill.).Forest Genetics, 2, 225–236.
91220001113 PRIMER NOTEs PRIMER NOTEsPRIMER NOTEs113Graphicraft Limited, Hong Kong
Microsatellite markers for behavioural studies in a semi-fossorial shrew (Soricidae: Anourosorex squamipes)
HON-TSEN YU and YU-YING LIAO
Department of Zoology, National Taiwan University, Taipei, Taiwan, ROC 106, Republic of China
Keywords: Anourosorex squamipes, behavioural genetics, fossorial, microsatellite, Soricidae
Received 23 June 2000; revision accepted 24 July 2000
Correspondence: Alex Hon-Tsen Yu. Fax: +886 2 23638179; E-mail: [email protected]
Genetic information revealed by microsatellite markers isuseful for inferring social behaviours in animals (Garza et al.1997), particularly for species that lead a secretive life style.The mole shrews (Anourosorex squamipes) are semi-fossorial,living underground and digging burrows but also coming tothe forest floor to search for food (Hutterer 1985). Yu (1994)suggested that several mole shrews might share the sameburrow system, as three or four mole shrews were oftencaught successively by one trap placed on the same spot.Thus, the mole shrew may have the peculiar social structureand behaviour common to some other subterranean mammals(Nevo 1979). As a preparatory step for studying behaviouralgenetics, we have characterized 11 microsatellite loci that arepolymorphic and suitable for use to address questions regard-ing social structure in Anourosorex squamipes.
Genomic DNA for constructing the partial libraries wasprepared according to procedures described by Sambrook et al.(1989). Genomic DNA was digested with Sau3A and fractionedin a 2.5% NuSieve™ GTG gel (FMC, Rockland, ME, USA). DNAof size range of 300–700 bp was isolated, purified with a Gene-Clean III kit (Bio101 Inc.) and ligated into plasmid PUC18/BamHI/BAP (Pharmacia, Vista, CA, USA) according manu-facturer’s protocols. Ligated plasmids were transformed into com-petent SURE cells or XL-2 Blue ultracompetent cells (Stratagene).
Recombinant clones containing inserts were transferredto Hybond N+ nylon membranes (Amersham), which werehybridized to a set of six oligonucleotide probes: (AC)10, (TC)10,(CAC)5CA, CT(ATCT)6, (TGTA)6TG and CT(CCT)5. Probeswere labelled with a DIG Oligonucleotide 3′-End LabellingKit (Boehringer Mannheim). Hybridization was performedat 45 °C for 16 h in a standard hybridization buffer consistingof 5 × SSC, 0.1% N-lauroylsarcosine, 0.2% SDS and 1% blockingreagent (Boehringer Mannheim). The membranes were washedtwice for 5 min at 45 °C, with a solution of 2 × SSC, 0.1% SDS,and then twice for 15 min at 65 °C with a solution of 0.1 × SSC,0.1% SDS. Chemi-luminescent detection was performed witha DIG Luminescent Detection Kit (Boehringer Mannheim).The exposure time ranged from 15 to 30 min.
Positive clones were chosen for sequencing to confirmsuitable length and base composition. The sequencingreactions were performed with a Big Dye dye-terminator kit,following the manufacturer’s protocols, and analysed onpolyacrylamide gels with an ABI 377 automated sequencer(Perkin-Elmer Applied Biosystems). The online program
MEC1053.fm Page 2159 Wednesday, November 15, 2000 8:58 AM
2160 P R I M E R N O T E S
© 2000 Blackwell Science Ltd, Molecular Ecology, 9, 2155–2234
Primer 3.0 (http://www.genome.wi.mit.edu) was used todesign primers from flanking regions of microsatellite DNAloci that contain more than 10 repeat units.
Individual genotypes were determined by polymerasechain reaction (PCR). PCR reactions were performed eitherwith non-radioactive primers or radioactive primers. For non-radioactive PCR, 25 µL reactions were performed, containing200 ng template DNA, 10 mm Tris–HCl, 50 mm KCl, 0.1%Triton X-100, 0.75 mm Mg2+, 0.15 mm dNTP, 0.5 µm of eachprimer and 2 units Taq DNA polymerase (Promega). Ampli-fication was carried out according to the thermal profile:95 °C for 4 min, followed by 25 cycles of 94 °C for 30 s,optimal annealing temperature (Table 1) for 30 s and 72 °Cfor 30 s, with a final extension step at 72 °C for 7 min. PCRproducts were run on 6% native polyacrylamide gel, stainedby ethidium bromide and visualized on a UV light box. Thenon-radioactive PCR was used to screen for polymorphicloci and the initial round of genotyping.
For radioactive PCR, one primer from each pair was 5′end-labelled with [γ32P]-ATP (NEN) and T4 polynucleotidekinase (Promega, Boston, MA, USA), following the manufac-turer’s protocols. Each PCR reaction totalled 10 µL, containing200 ng template DNA, 10 mm Tris–HCl, 50 mm KCl, 0.1% Tri-ton X-100, 0.25 mm dNTP, 0.2 µm of each unlabelled primer,0.6 mm Mg2+, 0.25 units Taq DNA polymerase (Promega)and 0.5 pmol [γ32P]-ATP labelled primer. Amplification wascarried out according to the thermal profile: 95 °C for 3 min,followed by 25 cycles of 95 °C for 15 s, optimal annealing
temperature (Table 1) for 2 min and 72 °C for 2 min, with afinal extension step at 72 °C for 7 min. PCR products wererun on a regular denaturing 6% polyacrylamide sequencinggel. The sizes of alleles were estimated by using control DNA(PUC18) from a Thermo Sequenase Cycle Sequencing Kit(Amersham) as markers. The radioactive PCR was used for asecond round of screening: all the alleles of different sizesdetected in the first round of screening were run on com-parison gels to accurately determine their sizes. Runningradioactive PCR products on denaturing gels also helpsreduce the confusion caused by the heteroduplex bands thatsometimes appeared in the first round of screening.
Eleven clones were confirmed to be polymorphic (Table 1)by typing 36 mole shrews collected from Taiwan. The numberof alleles per locus ranged from 10 to 20, and the observedand expected heterozygosities ranged from 0.33 to 0.92and from 0.82 to 0.96, respectively. The observed genotypesdeviated from Hardy–Weinberg expectation at the 11 loci(all P < 0.05), resulting from heterozygote deficiency, whichmay be caused by combining samples from various disparatelocalities (Wahlund’s effect).
Acknowledgements
Chu-Fong Lo and members of her laboratory offered technicalsupport for molecular cloning. Financial aid was granted to HTYby the National Science Council (89-2311-B-002-029, 88-2311-B-002-051).
Table 1 Characteristics of 11 polymorphic microsatellite loci in Anourosorex squamipes, including repeat motif, primer sequences,annealing temperature, allele size range, number of alleles, observed heterozygosity (HO) and expected heterozygosity (HE)
Locus* Repeat motif Primer sequences (5′ → 3′)Annealing temp. (°C)
Allele size range (bp)
Number of alleles HO HE
AS1 (AC)15 GGATTCTATTTCATTCTTGAGTCAC 53 129–155 10 0.75 0.88GTAAAACTCTGGCTGGTGCC
AS2 (TC)9(TG)6 CCTGGTTTGACCTCATGTTTGG 58 136–166 15 0.56 0.89GACAGAGAGAGATGGGTGGGG
AS3 (TG)3TA(TG)18 TTCCGCCTTGTACTTTGCTG 56 118–138 20 0.67 0.93CCCCGGGGATCCAGTGTCTTAC
AS4 (TGTC)5(TC)11(AC)6 GGATCCTTCCAGCGTTCTCTCTC 53 140–164 11 0.78 0.89GCAGCATGTTTCCCCAGTGTC
AS5 (CA)17 AGGCAAACGCTTTACCCTTG 56 94–112 17 0.58 0.89TGTAGAAGGCTGGAGAGACAGTG
AS6 (AC)13 GGTATGGAGGCACACAACGG 56 96–126 13 0.56 0.86TGCTTGCCAGTCTTCTCTGCG
AS7 (TG)14 CGCATGCGTGTGTGTGAATC 53 120–150 13 0.36 0.82CCAGGTGTGCCCTTGAAACC
AS8 (TG)12 TGCTCAAAAGCAATGCTAGCTG 52 112–138 13 0.53 0.88GTTCCAAGGACAATGCACGG
AS9 (TG)12 CGCACTTTTGTTGTTGTATGCG 50 126–148 19 0.58 0.93TTCCTGGCGCCCCATAATAG
AS10 (CA)26 GGGGCCTATTCCCCTGTTTC 56 79–111 20 0.92 0.96GGATGAGGGAATCCAGAAGACG
AS11 (CCA)6CCG(CCA)8 AGCCACAGGTTTCCACCCAC 56 80–119 19 0.33 0.88TTCCGCCTGTCTGCTTCTCC
*GenBank accession nos (order listed in table): AF261959–AF261969.
MEC1053.fm Page 2160 Wednesday, November 15, 2000 8:58 AM

P R I M E R N O T E S 2161
© 2000 Blackwell Science Ltd, Molecular Ecology, 9, 2155–2234
References
Garza JC, Dallas J, Duryadi D, Gerasimov S, Croset H, Boursot P(1997) Social structure of the mound-building mouse Musspicilegus revealed by genetic analysis with microsatellite.Molecular Ecology, 6, 1009–1017.
Hutterer R (1985) Anatomical adaptations of shrews. MammalReview, 15, 43–55.
Nevo E (1979) Adaptive convergence and divergence of sub-terranean mammals. Annual Review of Ecology and Systematics,10, 269–308.
Sambrook J, Fritsch EF, Maniatis T (1989) Molecular Cloning. ALaboratory Manual, 2nd edn. Cold Spring Harbor LaboratoryPress, Cold Spring Harbor, New York.
Yu HT (1994) Distribution and abundance of small mammalsalong a subtropical elevational gradient in central Taiwan.Journal of Zoology, London, 234, 577–600.
91220001115Primer notesPrimer notesPrimer notes113Graphicraft Limited, Hong Kong
Isolation and characterization of microsatellite DNA markers in the Florida manatee (Trichechus manatus latirostris) and their application in selected Sirenian species
A. I . GARCIA-RODRIGUEZ,* D. MORAGA-AMADOR,† W. FARMERIE,‡ P. MCGUIRE§ and T. L . KING¶
*United States Geological Survey, Biological Resources Division, Sirenia Project, Gainesville, FL 32601, USA, †Education and Training Core, Interdisciplinary Center for Biotechnology Research, University of Florida, Gainesville, FL 32610, USA, ‡ Molecular Services Core, Interdisciplinary Center for Biotechnology Research, University of Florida, Gainesville, FL 32610, USA, §Department of Biochemistry and Molecular Biology, University of Florida, Gainesville, FL 32610, USA, ¶United States Geological Survey, Biological Resources Division, Aquatic Ecology Laboratory, Leetown Science Center, 1700 Leetown Road, Kearneysville, WV 25430, USA
Keywords: Dugong dugong, microsatellite DNA, Trichechus inunguis, Trichechus manatus
Received 3 February 2000; revision received 2 July 2000; accepted 27 July 2000
Correspondence: T.L. King. Fax: 304 724 4498; E-mail: [email protected]
The West Indian manatee (Trichechus manatus) inhabits sub-tropical and tropical waters of the Caribbean Sea from thesouthern USA to Brazil’s north-east coast. Two sub-speciesare recognized, the Florida manatee (T. m. latirostris) and theAntillean manatee (T. m. manatus) (Domning & Hayek 1986).Abundant biological and ecological data for the Floridamanatee have been collected, and the information has formedthe basis for management and conservation programmes.However, to plan and implement biologically sound manage-ment programmes for this marine mammal, knowledge of theamount of genetic diversity present and a thorough under-standing of the evolutionary relationships among geographicalpopulations are essential. Genetic studies employing allozymes(McClenaghan & O’Shea 1988) and mitochondrial DNA(Bradley et al. 1993; Garcia-Rodriguez et al. 1998) have identified
low levels of genetic diversity, and failed to resolve populationstructure for the Florida manatee. A technique with a higherresolution of genetic population structure and pedigree ana-lysis is needed. We report the development and characteriza-tion of microsatellite DNA markers in the Florida manateeand test the utility of these markers in three closely relatedSirenian species.
Two methodologies were used to generate microsatellite-enriched libraries for T. m. latirostris. Four enriched librarieswere produced by Genetic Identification Services (Chatworth,California, USA) using proprietary magnetic bead capturetechnology. An additional library was constructed and screenedfor polymorphic loci following a protocol modified fromArmour et al. (1994). For this protocol, approximately 50 µgof manatee genomic DNA were digested with Sau3AI (LifeTechnologies, Rockville, Maryland, USA), gel-fractionated toisolate 0.4–1.0 kbp fragments, and ligated to Sau3AI linkers.Polymerase chain reaction (PCR) amplifications were per-formed in a 100 µL volume containing 15 ng of purified DNA,50 mm KCl, 10 mm Tris–HCl (pH 9.0), 0.1% Triton X-100,0.25 mm MgCl2, 0.2 mm dNTPs (Applied Biosystems, FosterCity, California, USA), 1 µm Sau-L-A primer and 2.5 units ofTaq DNA polymerase (Promega, Madison, Wisconsin, USA).The following amplification programme was used: 94 °C for3 min, 30 cycles of 94 °C for 45 s, 68 °C for 45 s and 72 °C for1.5 min, followed by 72 °C for 10 min. Purified PCR prod-ucts were denatured by alkali treatment and hybridizedto nylon filters containing (CA)n oligonucleotide repeats.Hybridization was performed overnight at 65 °C, and 5 µL ofthe recovered hybridized molecules were used for a 100 µLPCR amplification of microsatellite-enriched genomic DNAfragments following the amplification and PCR conditionsdescribed above. PCR products were directly ligated topCR®2.1 (Invitrogen, Carlsbad, California, USA) followedby transformation into INVαF′ One Shot™ competent cells(Invitrogen). A total of 186 colonies were screened for (CA)n-containing inserts using alkaline phosphatase-conjugated(TG)n oligomer and a chemi-luminescent detection system(FMC BioProducts Corp., Rockland, Maine, USA). Followinga secondary screening, 60 positive colonies were sequencedusing the ABI Prism BigDye Terminator Cycle SequencingReady Reaction Kit (Applied Biosystems) employing M13forward and reverse primers. Sequencing reactions wereelectrophoresed on an ABI 377 automated sequencer (AppliedBiosystems).
From the two sets of libraries, primers were designed inthe flanking regions of 61 microsatellite-bearing clones usingoligo 5.1 (National Biosciences, Molecular Biology InsightsInc., Cascade, Colorado, USA). Microsatellite DNA amplificationreactions consisted of 200 ng DNA, 10 mm Tris–HCl (pH 8.3),50 mm KCl, 1.5 mm MgCl2, 0.20 mm dNTP, 5 pmol of forwardand reverse primer and 1.0 U Taq DNA polymerase (Promega)in a total volume of 20 µL. The forward primer was 5′ modifiedwith either TET, FAM or HEX fluorescent labels (AppliedBiosystems). Amplification was performed in a Biometra®UNO II thermal cycler using the following conditions: 94 °Cfor 2 min, 34 cycles of 94 °C for 30 s, 54 °C for 30 s and 72 °Cfor 30 s, and a final extension at 72 °C for 10 min. Ampli-fied fragments were subjected to fragment analysis on an
MEC1053.fm Page 2161 Wednesday, November 15, 2000 8:58 AM

2162P
RIM
ER
NO
TE
S
© 2000 B
lackwell Science L
td, M
olecular Ecology, 9, 2155–2234
Table 1 Expected size of fragment (bp), repeat type, number of alleles detected, observed and expected levels of heterozygosity, primer sequence, and GenBank accession nos for 14Trichechus manatus latirostris microsatellite DNA markers surveyed in 50 animals collected throughout Florida, and the results of cross-species amplification of these markers in threeother Sirenian taxa
Manatee species
FloridaAntillean N
Amazonian N
Dugong N
GenBank accession no.Locus Size Repeat type (and length) N HO HE Primer sequences (5′ → 3′)
TmaA01 107 (TA)3(CA)3CG(CA)7 1 0.00 0.00 F-CAGAAGGGATACATATACA 2 2 2 AF223649R-CAGCCCCTGGCTGTCTCTTGTC
TmaA02 247–251 (CACT)2(CA)16 3 0.51 0.54 F-CTCAGTCCAAACAGCTAATG 3 5 2 AF223650R-TAGTCATTTGTGCAGAGTGC
TmaA03 163–183 (GACA)4 2 0.30 0.40 F-ACATGTGTTCCCTGCTGTAT 4 3 1 AF223651R-GATTTTTGGAGCAGTTGTCA
TmaA04 204 (CT)2(GT)12AT(GT)7AT(GT)2 1 0.00 0.00 F-GAACACAAGACCGCAATAAC 3 1 3 AF223652R-TGGTGTATCACTCAGGGTTC
TmaA09 150 (GT)15 1 0.00 0.00 F-GATGGGATACTGGGTTATGC 1 4 3 AF223653R-ATGCAGACACTGGACATAGG
TmaE02 172–174 (GT)13 2 0.44 0.46 F-GTCTCTACGGCCTAGAATTGTG 2 1 3 AF223656R-TTTCTCTACCTCTCCTCACACG
TmaE08 149–165 (CA)13TA(CA)5 3 0.47 0.55 F-GAATAGAGACTGGGCTAGAATCC 4 2 3 AF223657R-GCCTTTTGGAGGGATAGAAGTAG
TmaE11 177–197 (CA)13 6 0.58 0.63 F-ACACACAACATCACTCATCCAC 8 1 3 AF223658R-AAGCTGCGTTCTACTTCATATAATC
TmaE26 199–201 (CA)8C(CA)17 2 0.24 0.26 F-CATTCCTGATCCACAAAATC 5 3 2 AF223659R-CCTGTCTTCTCTCTGTTTCTCC
TmaF14 204–206 (TC)6(TG)2TA(TC)5TG(TC)3 2 0.24 0.32 F-CTAAGACATTGCTCCAAAAGC 2 2 1 AF223660R-GGGCAGTGGGATTTGAGATG
TmaF34 271 (TCTCTCTCTTTCTG)2(TC)4 1 0.00 0.00 F-CATGAGAGACTATGCTCCCTTC 1 2 — AF223661TT(TC)3 (AC)8AT(AC)9 R-CAGGTAGGAAGATGATGAGGAC
TmaH1I 298 (TCTG)4(TCTA)5CCTGTCTATCCA 1 0.00 0.00 F-AGCAGATAGACACACTGGGAAG 1 3 1 AF223662(TCTA)3CCTG(TCTA)8CCTG(TCTA)5 R-GAGTCTGAATGAATGAATTACTGC
TmaM61 176 (TG)3(GT)17 1 0.00 0.00 F-TTGAGGTGTAATCTGTGTG 2 2 1 AF223655R-GGTAATCGGAGTTGGTGTA
TmaM79 154–156 (GT)15 2 0.56 0.54 F-CCAATCATGTCCCAAACT 3 3 2 AF223654R-CAATAGAAGAAGCAGCAG
Tests for goodness of fit to Hardy–Weinberg expectations suggested that there were no significant differences between observed and expected values (Raymond & Rousset 1995). The results of cross-species amplification of these markers in three other Sirenian taxa are also provided: Antillean manatee (Trichechus manatus manatus), n = 21 animals surveyed; Amazonian manatee (Trichechus inunguis), n = 7; and the dugong (Dugong dugong), n = 3. ‘—’ indicates no or sub-optimal amplification products in cross-species tests. N, number of alleles observed.
ME
C1053.fm
Page 2162 W
ednesday, Novem
ber 15, 2000 8:58 AM

P R I M E R N O T E S 2163
© 2000 Blackwell Science Ltd, Molecular Ecology, 9, 2155–2234
ABI PRISM™ 310 Genetic Analyser (Applied Biosystems).Genescan™ 2.1 and Genotyper™ 2.1 Fragment Analysissoftware (Applied Biosystems) were used to score, bin andoutput allelic (and genotypic) data.
Fourteen sets of primers amplified fragments of expectedsize from Florida manatee genomic DNA (Table 1). Thesemarkers were screened in 50 manatees collected throughoutthe Florida peninsula. Eight of the 14 loci were polymor-phic in this initial survey, and overall levels of heterozygos-ity averaged 41%. Low levels of allelic diversity wereobserved in the Florida manatee. The maximum number ofalleles identified was six (TmaE11), and the average numberof alleles observed at polymorphic loci was 2.9. This paucityof genetic diversity suggests a founder effect or major popu-lation bottleneck of evolutionary significance (see Garcia-Rodriguez et al. 1998). In addition, this study reports one of thelowest levels of genetic diversity observed in species-specificmicrosatellite DNA markers [see Nyakaana & Arctander 1999(African elephant); Waldick et al. 1999 (right whale)].
Cross-species amplification was tested in three Sireniantaxa: the Antillean manatee (T. m. manatus), the Amazonianmanatee (T. inunguis) and the dugong (Dugong dugong).Eleven of 14 markers were polymorphic for the Antilleanand the Amazonian manatee (Table 1). At least nine markerswere polymorphic in the dugong; the polymorphism islikely to be under-estimated due to the small samplesize (n = 3). This suite of markers appears to be ideal forthe identification of population structure and possiblypedigree analysis in all four Sirenian species, and providesa nuclear DNA-based approach to complement existingmitochondrial DNA genetic information for these vulnerablespecies.
References
Armour JAL, Neumann R, Gobert S, Jeffreys AJ (1994) Isolationof human simple repeat loci by hybridization selection. HumanMolecular Genetics, 3, 599–605.
Bradley JL, Wright SD, McGuire PM (1993) The Florida manatee:cytochrome b DNA sequence. Marine Mammal Science, 9, 197–202.
Domning DP, Hayek LC (1986) Interspecific and intraspecificmorphological variation in manatees (Sirenia: Trichechus).Marine Mammal Science, 2, 87–144.
Garcia-Rodriguez AI, Bowen BW, Domning D, et al. (1998)Phylogeography of the West Indian manatee (Trichechus manatus):how many populations and how many taxa? Molecular Ecology,7, 1137–1149.
McClenaghan LR Jr, O’Shea TJ (1988) Genetic variability in theFlorida manatee (Trichechus manatus). Journal of Mammalogy, 69,481–488.
Nyakaana S, Arctander P (1999) Population genetic structureof the African elephant in Uganda based on variation atmitochondrial and nuclear loci: evidence for male-biased geneflow. Molecular Ecology, 8, 1105–1115.
Raymond M, Rousset F (1995) genepop (version 1.2): populationgenetics software for exact tests and ecumenicism. Journal ofHeredity, 86, 248–249.
Waldick RC, Brown MW, White BN (1999) Characterization andisolation of microsatellite loci from the endangered NorthAtlantic right whale. Molecular Ecology, 8, 1753–1768.
91220001116Primer notesPrimer notesPrimer notes113Graphicraft Limited, Hong KongMicrosatellite loci for two European sciurid species (Marmota marmota, Spermophilus citellus)
S . HANSLIK* and L . KRUCKENHAUSER†
*Department of Animal Breeding and Genetics, University of Veterinary Medicine Vienna, A-1210 Vienna, Austria, †Museum of Natural History Vienna, 1st Zoology Department, Burgring 7, A-1014 Vienna, Austria
Keywords: Marmota marmota, microsatellite, primer, population genetics, Spermophilus citellus
Received 10 May 2000; revision received 19 June 2000; accepted 29 July 2000
Correspondence: L. Kruckenhauser. Fax: +43 15235254; E-mail: [email protected]
Two species of European sciurid rodents are of particularinterest for behavioural ecology and population genetics:Marmota marmota and Spermophilus citellus. The Alpine marmot(M. marmota) inhabits higher elevations of the European Alpsand some isolated mountain massifs. Autochthonous popu-lations occur only in the Alpine core area and in a small areanear Berchtesgaden. The distribution of the European ground-squirrel (S. citellus) comprises the grassland of the Pannonianplain ranging from eastern Europe to the foothills of the Alps.It is presently listed as endangered (Berner Convention 1999).We isolated six new microsatellite markers for each of the twospecies (M. marmota: L. Kruckenhauser; S. citellus: S. Hanslik).
Genomic DNA was extracted from frozen liver (M. marmota)or ethanol-stored tissue samples from the tail (S. citellus) usinga standard phenol–chloroform extraction method (Sambrooket al. 1989). Following the protocol of Rassmann et al. (1991),partial genomic libraries were established for M. marmotaand S. citellus and around 1400 clones from each species werescreened for the presence of microsatellite sequences using adinucleotide simple sequence polymer probe AC/GT.
Fifty-eight marmot clones showed a positive signal. Twenty-two were sequenced using the SequiTherm EXCEL™ IIDNA Sequencing Kit (Epicentre Technologies) with bio-tinylated primers and the SAAP/CSPD detection system (USBiochemicals, Inc.). Primer pairs were synthesized for 11 loci;six of these microsatellite loci showed unambiguous allelicpatterns in M. marmota (Table 1). Polymerase chain reaction(PCR) amplifications were performed on a HYBAID Omnigenethermocycler in a volume of 12.5 µL containing 10 mmTris–HCl (pH 8.8), 1.5 mm MgCl2, 150 mm KCl, 0.1% TritonX-100, 0.25 U DynaZyme DNA polymerase (Finnzymes OY),2 pmol of each primer (forward primer labelled with IRD-800),200 µmol of each dNTP, 0.25 µL DMSO and 50 ng templateDNA. The amplification protocols were as follows: 94 °C for5 min, then two cycles of 94 °C for 20 s, annealing temperatureplus 6 °C for 20 s, 70 °C for 20 s, then 30 cycles of 94 °Cfor 30 s, annealing temperature for 20 s, 70 °C for 20 s, andfinally 72 °C for 2 min. PCR products were separated on6% denaturating polyacrylamide gels in a Li-Cor automaticsequencer. Analysis of PCR fragments was carried out usingRFLPscan (Scanalytics). The six loci were tested in 19 indi-viduals of M. marmota from the Austrian allochthonouspopulation Turracher Nockberge. In addition, 10 individualsof S. citellus were cross-tested with the same primer sets.
MEC1053.fm Page 2163 Wednesday, November 15, 2000 8:58 AM

2164 P R I M E R N O T E S
© 2000 Blackwell Science Ltd, Molecular Ecology, 9, 2155–2234
Thirty-six positive ground-squirrel clones were sequencedwith the M13-40 forward primer using Sequenase version 2.0(Amersham Life Sciences). Sequencing products were separ-ated on a 4% denaturing polyacrylamide gel and visualizedautoradiographically. Primers were designed with the oligosoftware package (National Biosciences Inc., version 5.0). PCRamplification was carried out on a HYBAID Omnigene ther-mocycler in 10 µL reaction volume with 10 mm Tris–HCl (pH 9.0),50 mm KCl, 1.5 mm MgCl, 0.1% Triton X-100, 0.2 mg/mL BSA,200 µm dNTPs, 1 µmol of each primer (0.02 pmol forward primerend-labelled with γ32P), 50–100 ng template DNA, and 0.5 unitsTaq DNA polymerase. A 4 min initial denaturation at 94 °C wasfollowed by 30 cycles of 1 min at 94 °C, 1 min at 47–61 °C(depending on the primer combination), 1 min at 72 °C, anda final extension at 72 °C for 45 min. PCR products wereseparated on a 7% denaturing polyacrylamide gel. Alleleswere sized by running a sequencing reaction of M13 next tothe amplified microsatellites. Six primer pairs yielded clearamplification products in S. citellus (Table 1). The six loci wereanalysed in 54 ground-squirrel and 10 marmot individuals.
Observed and expected heterozygosities were calculatedusing genepop (version 1.2; Raymond & Rousset 1995).Altogether 12 microsatellite loci were tested in both species,the results for these are shown in Table 2. Ten loci amplifiedin both species, two amplified in M. marmota only. All lociwere polymorphic in at least one of the two species, and up toseven different alleles were observed in one species. Significantdeviations from the Hardy–Weinberg expectations as calcu-lated with the program genepop (version 1.2; Raymond &
Rousset 1995) were found for the loci SB10 (P = 0.0038) andSX (P = 0.0098) in the ground-squirrel population and MS56(P = 0.0001) in the marmot population. These deviationsmight be due to null alleles in the respective populations.
So far, only a small number of microsatellite loci have beenidentified for M. marmota (Klinkicht 1993), and no markershave been isolated for S. citellus. The primer sets for 12 locicompiled here should provide sufficient information forgenetic investigations not only in M. marmota and S. citellusbut also over a larger species range within the two genera.
Acknowledgements
We are very much indebted to C. Schlötterer and W. Pinsker foruseful comments on the manuscript. We thank I. Hoffman andS. Huber for field work assistance and P. Taberlet and M. Preleuthnerfor providing marmot samples. The work was supported by aJubiläumsfonds der Österreichischen National bank grant (project6590) to Eva Millesi and Fords zur Förderung der wissenschaft-lichen Forschung grants to WP (project P-11840-GEN) and C.S.(P-11628, S-8207, S-8213).
References
Berner Convention (1999) EU Habitats & Species Directive Annex II& Annex IV.
Klinkicht M (1993) Untersuchungen zum Paarungssystem desAlpenmurmeltieres, Marmota m. marmota (Linné, 1758), mittels DNA-Fingerprinting. PhD Thesis, Ludwig-Maximilians-Universität,München, Germany.
Table 1 Primer sequences (5′ → 3′) of microsatellites from Marmota marmota (MS6, MS41, MS45, MS57, MS53, MS56) and Spermophiluscitellus (ST7, ST10, SB10, SC2, SC4, SX), GenBank accession nos, repeat motifs and annealing temperatures
Locus Repeat motif Primer Accession no. Annealing temp. (°C)
MS6 (GT)20 F: CTGATGGGGTTAAGATTGCC AF259372 53R: CCCCACTGACCCACCTCC
MS41 (GT)11 F: GGTGTATATGGGAATAGGGGG AF259373 53R: GCCTTCAAATCAAAGCAGGTTG
MS45 (GT)13 F: CTGTCTCTTTGTCCCTGCC AF259374 53R: CTCCTTACCATCATCTTTCCG
MS47 (GT)4TC(GT)3AT(GT)7GAGG F: CCTGATGTAGTCAGTCAG AF259375 50(GA)4TT(GA)3AA(GA)11 R: TGTGGGAAATGGCACATC
MS53 (GT)18 F: ATTGAGGAGCAGCATCTAGG AF259376 53R: TCAGGGAAAGGCAGACCTG
MS56 (CA)14 F: CAGACTCCCACCAGTGACC AF259377 53R: CCTGATCTATGTAGGTTCCAT
SB10 (GA)12(TG)18 F: TCTGTTTAGTTCATTTGCCATTT AF254435 50R: TCAAGAGAGGTCCTACAGAATGA
SC2 (GA)31 F: CATCATGGCAGAAGATGTGG AF254438 56R: TTGACTGGAAGTGGGACTCTC
SC4 (GT)20 F: AAAAGCGTGCATTGCCTTAC AF254437 56R: CCTCTCAAGACGGGCAGA
ST7 (TGG)7T(GT)2 F: GAATCTTGACTCCTGAGATA AF254439 50AT(GT)7AT(TG)8 R: CCATCTCCTGACATTTAATA
ST10 (CA)12 F: TTGTGATCCTCCAGGGAGTT AF254436 52R: GTGATTTCCAAACCCCATTC
SX (GA)25 F: TTTTCCTCTCCTGAATGCTTTT AF254440 56R: CAAAGATGTTGTGTCCGACG
MEC1053.fm Page 2164 Wednesday, November 15, 2000 8:58 AM

P R I M E R N O T E S 2165
© 2000 Blackwell Science Ltd, Molecular Ecology, 9, 2155–2234
Rassmann K, Schlötterer C, Tautz D (1991) Isolation of simple-sequence loci for use in polymerase chain reaction-based DNAfingerprinting. Electrophoresis, 12, 113–118.
Raymond M, Rousset F (1995) genepop (version 1.2): a populationgenetics software for exact tests and ecumenicism. Journal ofHeredity, 86, 248–249.
Sambrook J, Fritsch EF, Maniatis T (1989) Molecular Cloning: ALaboratory Manual. 2nd edn. Cold Spring Harbor LaboratoryPress, Cold Spring Harbor, New York.
91220001117PRIMER NOTEsPRIMER NOTEsPRIMER NOTEs100Graphicraft Limited, Hong Kong
Microsatellite loci in the Eurasian red squirrel, Sciurus vulgaris L.
REBECCA TODD
Division of Genetics, University of Nottingham, Queen’s Medical Centre, Nottingham, NG7 2UH, UK
Keywords: microsatellites, primers, red squirrels, Sciurus vulgaris
Received 18 May 2000; revision received 12 July 2000; accepted 29 July 2000
Correspondence: Rebecca Todd. E-mail: [email protected]
Ever since microsatellites were first amplified using the poly-merase chain reaction (PCR) and shown to be variable, theyhave been enthusiastically adopted by population geneticists.Microsatellites quickly became the molecular marker of choiceduring the 1990s because of the speed and ease with whichthey can be applied to large samples, and the possibility oftheir amplification from poor-quality samples collected bynon-invasive methods. The level of variability found atmicrosatellite loci has meant that they can be used to answerphylogenetic questions on many levels (McDonald & Potts1997). However, the main disadvantage in the use of micro-satellites is the frequent need to develop a set of markers foreach species under investigation; this limitation will diminishas more markers are isolated for different species. This paperreports the development of five polymorphic microsatellite locifrom the genome of Sciurus vulgaris L., the Eurasian red squirrel.
The loci were isolated using the enrichment method ofArmour et al. (1994). Three partial genomic libraries wereconstructed using DNA extracted from Sciurus vulgaristissue and digested with the enzyme Mbo1 (Gibco BRL). SAUlinkers were ligated to a size-selected fragment (400–1300 bp),as described in Armour et al. (1994), and used to prime awhole-genome PCR reaction. The product of this reactionwas further size-selected before hybridization selection wascarried out. Each library was constructed using genomicfractions selected by hybridization to a different set oftetra-, tri-and dinucleotide target repeat sequences taken from(GATA)n, (GACA)n, (CCAT)n, (ACCT)n, (TTGG)n, (GGAA)n,(TTTG)n, (TTTC)n, (GTA)n, (GAT)n, (GCT)n, (CGT)n, (TCC)n,(CAC)n, (GTT)n, (AAG)n and (GT)n.
The hybridization selection reactions were carried out asdescribed by Armour et al. (1994). The selected fraction wasre-amplified in a whole-genome PCR and ligated directlyinto the pGEM-T vector (Promega) or the pNoTA/T7 shuttlevector of the Prime PCR Cloner Cloning System (5 Prime →3 Prime, Inc.). These ligations were used to transform Epicu-rian coli XL2-Blue MRF ultracompetent cells (Stratagene).Positive colonies were cultured and stored as glycerol stocksin microtitre plates; the contents of each plate were replicatedonto nylon filters and probed with labelled target oligonucle-otide repeat sequences. Positive colonies were identified andsequenced manually using either isolated plasmid DNA oramplified PCR products as template (the PCR products weregenerated using the primers M13for (Gibco BRL) and M13rev(Promega) which flank the insertion site). Sequencing wascarried out using the T7 sequencing mixes and the T7 poly-merase enzyme (Pharmacia Biotech) following a protocolbased on protocol 11 described in Hoelzel & Green (1998).Primers for all useful repeat sequences were designed (withthe aid of the computer program oligo™; National Bioscience)and tested for variability on a panel of 10 DNA samples.
PCR amplification of variable loci was optimized using themethod described by Cobb & Clarkson (1994). The forwardreaction primer in each case was end-labelled with 32P γ-dATP
Table 2 Microsatellite loci tested in Marmota marmota and Spermophilus citellus: number of detected alleles, size range of alleles, expectedand observed heterozygosities (HE, HO) and number of individuals analysed (n)
Marmota marmota Spermophilus citellus
Locus n Number of alleles Size range HE HO n Number of alleles Size range HE HO
MS6 19 5 142–164 0.67 0.67 10 — — — —MS41 19 3 186–190 0.42 0.41 10 3 195–201 0.43 0.55MS45 19 3 109–113 0.68 0.69 10 2 127–129 0.16 0.17MS47 19 7 163–191 0.87 0.81 10 — — — —MS53 19 5 141–149 0.71 0.78 10 4 147–153 0.58 0.46MS56 19 3 111–115 0.58 0.16 10 3 113–121 0.49 0.62
SC2 10 2 128–130 0.50 0.50 54 1 146 0.00 0.00SC4 10 2 134–145 0.53 0.00 54 1 102 0.00 0.00ST7 10 5 135–154 0.60 0.87 54 3 151–156 0.55 0.44SB10 10 1 154 0.00 0.00 54 4 150–162 0.73 0.65ST10 10 4 124–130 0.63 0.83 54 3 127–134 0.51 0.62SX 10 2 142–146 0.50 0.50 54 3 142–146 0.60 0.61
MEC1053.fm Page 2165 Wednesday, November 15, 2000 8:58 AM

2166 P R I M E R N O T E S
© 2000 Blackwell Science Ltd, Molecular Ecology, 9, 2155–2234
using T4 polynucleotide kinase (Gibco BRL). Amplificationreactions were carried out on a PTC-200 thermocycler (MJResearch, Inc.) with 25 µL reactions containing dNTPs (0.15 mmfor RSµ1, 0.1 mm for RSµ3, 0.2 mm for RSµ4 and 0.05 mm forRSµ5 and 6), 1 mm MgCl2 (1.5 mm for RSµ1), 10 pmol of eachprimer (5 pmol for RSµ1 and 3) including 1 pmol of labelledprimer (2 pmol for RSµ1), 1 unit of ‘red hot’ Taq DNA poly-merase (Advanced Biotechnologies) with Taq buffer (finalconcentration 0.75 m Tris–HCl, pH 9.0, 20 mm (NH4)2SO4, 0.01%w/v Tween; Advanced Biotechnologies) and approximately0.8 ng of template DNA. The reactions were denatured at94 °C for 3 min, and then subjected to 30 cycles of 94 °C for1 min, 54 °C for 1 min and 72 °C for 90 s. A final extensionstep was carried out for 5 min at 72 °C. The PCR productswere visualized by electrophoresis through 6% polyacrylamidegels using Sequi-GenII GT gel rigs (BioRad) and exposure toX-ray film. Allele sizes were determined by comparison to aknown sequence ladder.
Five loci, named RSµ1, RSµ3, RSµ4, RSµ5 and RSµ6, werefound to be polymorphic in the Eurasian red squirrel (Table 1).These loci were amplified from 163 samples of red squirrelDNA in individuals taken from 11 populations in Belgiumand Germany (Todd 2000); the proportion of individuals foundto be heterozygous at each locus is also given in Table 1. Thestudy included samples of more than 20 individuals fromthree large populations, and these were used to test for nullalleles. Fisher’s exact test was carried out using Biomstat(version 3.2) (Applied Biostatistics Inc.) on the observed andexpected number of heterozygotes at each locus in the threepopulations, and no evidence to indicate the presence of nullalleles was found (P > 0.2).
Acknowledgements
This work was carried out under the supervision of ProfessorDavid Parkin with financial support from the University ofNottingham. Red squirrel tissue samples were collected by GoedeleVerbeyen, University of Antwerp, Belgium. The assistance ofDr Jon Wetton is gratefully acknowledged.
References
Armour JAL, Neumann R, Gobert S, Jeffreys AJ (1994) Isolationof human simple repeat loci by hybridization selection. HumanMolecular Genetics, 3, 599–605.
Cobb BD, Clarkson JM (1994) A simple procedure for optimisingthe polymerase chain reaction (PCR) using modified Taguchimethods. Nucleic Acids Research, 22, 3801–3805.
Hoelzel AR, Green A (1998) PCR protocols and population ana-lysis by direct DNA sequencing and PCR-based DNA finger-printing. In: Molecular Genetic Analysis of Populations: A PracticalApproach (ed. Hoelzel AR), pp. 201–235. Oxford UniversityPress, Oxford.
McDonald DB, Potts WK (1997) DNA microsatellites as geneticmarkers at several scales. In: Avian Molecular Evolution andSystematics (ed. Mindell DP), pp. 29–48. Academic Press, SanDiego.
Todd RT (2000) The population genetics of red squirrels in a fragmentedhabitat. PhD Thesis, University of Nottingham, Nottingham, UK.
91220001118 PRIMER NOTEs PRIMER NOTEs PRIMER NOTEs100Graphicraft Limited, Hong Kong
Isolation and characterization of microsatellite loci from the ocellated wrasse Symphodus ocellatus (Perciformes: Labridae) and their applicability to related taxa
S . ARIGONI*†‡ and C. R . LARGIADÈR*
*Division of Population Biology, Institute of Zoology, University of Berne, Baltzerstrasse 3, CH-3012 Berne, Switzerland, †Department of Zoology and Animal Biology, University of Geneva, 13, rue des Maraîchers, CH-1211 Geneva, Switzerland, ‡Station Marine d’Endoume, University of the Mediterranean, rue de la Batterie des Lions, F-13007 Marseille, France
Keywords: Labridae, microsatellites, ocellated wrasse, Symphodus ocellatus
Received 30 June 2000; revision accepted 27 July 2000
Correspondence: S. Arigoni. Fax: +41 31 6314888; E-mail: [email protected]
Table 1 The characteristics of five Eurasian red squirrel microsatellites
Locus name
GenBank accession no. Repeat structure Primer sequences (5′ → 3′)
Allele size range (bp)
Number of alleles HO (%) HE (%)
RSµ1 AF285149 [GGAT]13 F 5′-CTGGGTTCACTGACTTCTCC-3′ 172–196 7 71.9 73R 5′-CACTCTCAGAGGCCAAAGTC-3′
RSµ3 AF285150 [GA]9[GACA]9 F 5′-GCCAAAATCTAGCCCAAGAAG-3′ 161–173 7 52.2 57.4R 5′-CTCAGGTGTGGGAAAGAAGC-3′
RSµ4 AF285151 [ATCC]12 F 5′-CAATCCTCCCATCCTGCTGC-3′ 256–284 8 78.1 72.3R 5′-TAGGCAGTCAGATAGGTGGG-3′
RSµ5 AF285152 [GT]10 F 5′-CCCAGTCTACATTAAAGGGC-3′ 123–143 7 39.3 45.5R 5′-GCCTATACACTATAATTGACTG-3′
RSµ6 AF285153 [GTT]10 F 5′-GGCATAGGGCACGTGAAG-3′ 122–131 4 27.3 36.5R 5′-GGGCCAATCTCATACCAAG-3′
HO, observed average heterozygosity; HE, expected average heterozygosity. F, forward primer; R, reverse primer.
MEC1053.fm Page 2166 Wednesday, November 15, 2000 8:58 AM

P R I M E R N O T E S 2167
© 2000 Blackwell Science Ltd, Molecular Ecology, 9, 2155–2234
The ocellated wrasse, Symphodus ocellatus, is a commonMediterranean labrid fish of shallow coastal waters. Its geo-graphical distribution also includes the Black Sea, the AzovSea and the North-Eastern Atlantic (Whitehead et al. 1984).This species is abundant in the Mediterranean and inhabitsvarious biotopes such as shallow rocky areas and seagrassbeds (Michel et al. 1987; Francour 1997). The ocellated wrasseis a partially sedentary fish, with territorial males, exclusivemale parental care and conspicuous male nuptial colorationand courtship (Warner & Lejeune 1985), and thus constitutesan interesting species for investigating various aspects ofpopulation genetics and behavioural ecology of marine fishes.Here we report seven microsatellite loci of the labrid fishS. ocellatus and their amplification in five related taxa.
Ocellated wrasse microsatellite loci were cloned as describedby Estoup et al. (1993) and in detailed protocols by A. Estoupand J. Turgeon available at http://www.inapg.inra.fr/dsa/microsat/microsat.htm. The genomic library was constructedwith about 10 µg of DNA isolated from muscle tissue of asingle ocellated wrasse from a population near Marseille(France). Approximately 1500 colonies were screened formicrosatellites using a mixture of six probes (TC)10, (TG)10,(CAC)5CA, CT(CCT)5, CT(ATCT)6 and (TGTA)6TG, yielding176 positively hybridizing clones. Plasmid DNA of positiveclones was purified using a QIAprep Spin Miniprep Kit™(Qiagen). Both strands of the wrasse DNA inserts weresequenced using a Thermo sequenase cycle sequencing kit™(Amersham) and M13 forward and reverse primers end-labelledwith fluorescent dye (IRD800™; Li-Cor). Miniprep prepara-tion and sequencing reactions were carried out according tothe recommendations of the manufacturers, and sequencereaction products were resolved on an automated DNAsequencer (model 4200™; Li-Cor).
Here we report the seven microsatellite loci (Table 1) forwhich we so far have successfully designed primer pairs.The genomic DNA for genotyping was prepared either using
a phenol–ethanol extraction method or a rapid BIO RAD(Celex 100 resin) extraction protocol as described by Estoupet al. (1996). Polymerase chain reaction (PCR) amplificationswere carried out in 10 µL volumes using a PTC100™ machine(MJ Research, USA). Each reaction contained 20 ng genomicDNA, 2 pmol of each primer, one of which was end-labelledwith an infra-red fluorescent dye (IRD800™), MgCl2 (concen-tration in Table 1), 0.06 mm of each dNTP, 1 × PCR buffer(Qiagen) and 0.25 U Taq DNA polymerase (Qiagen). Reactionconditions were as follows: an initial denaturation step of5 min at 95 °C, five cycles consisting of 30 s at 95 °C, 30 s atannealing temperature (see Table 1) and 75 s at 72 °C, 25cycles consisting of 30 s at 94 °C, 30 s at annealing tempera-ture and 75 s at 72 °C, followed by a final 5 min extension at72 °C. PCR products were analysed on an automated DNAsequencer (model 4200™), and amplified fragments of clonedalleles were used for size determination at the respectiveloci. Variability of the loci was tested in five populations ofS. ocellatus from the French Mediterranean coast (CapMartin, St Jean Cap Ferrat, Antibes, Cannes and Marseille).Ten individuals from each population were analysed. Thenumber of alleles per locus and the observed and expectedheterozygosities are listed in Table 1. All loci were polymor-phic, with the number of alleles per locus ranging between11 and 30 and the observed heterozygosity between 0.76 and0.96. Additionally, we tested the amplification of these prim-ers in the labrid Coris julis and four other species of thegenus Symphodus: S. tinca, S. roissali, S. rostratus and S. cin-ereus (Table 2). All specimens were sampled along the FrenchMediterranean coast between Cap Martin and Cannes.
Acknowledgements
We thank Alex Kohler and Susanne Wüthrich for their labor-atory assistance and the Swiss Federal Office of Educationand Science for financial support. S.A. thanks L. Zaninetti,
Table 1 Characterization of seven Symphodus ocellatus microsatellite loci based on five samples (10 individuals each)
Locus Repeat array Primer sequences (5′ → 3′)Annealing temp. (°C)
MgCl2 (mm)
Number of alleles
Size range(bp)** HO HE
Soc1017PBBE (AC)20GC(AC)2 *TCC TGT CAG TCT CCC TTC A
GTG ATT GAT TAG GCG ATG AG 63 0.8 20 (9–15) 77–123 (101) 0.86 (0.6–1.0) 0.92 (0.87–0.96)Soc1063PBBE (GA)2(GT)8
AT(GT)4
*CCC TTC TTG TGT CAT TCC
AAG CCT CAC TTG ATA TGT CC 56 0.8 14 (6–9) 92–134 (98) 0.76 (0.4–1.0) 0.86 (0.83–0.91)Soc1093PBBE (AC)26 *CCT CCA ATT CCC AAA ACA AC
CTG ACC ACT GGC ACA CTC AT 63 0.8 30 (12–15) 96–294 (132) 0.96 (0.9–1.0) 0.95 (0.91–0.97)Soc1109PBBE (GT)10 *AGG ATT TAG CCT GCC CAG GA
TGC GGT GAA TGG CTG TAG GT 57 1.0 13 (7–9) 133–167 (137) 0.84 (0.7–1.0) 0.87 (0.80–0.89)Soc1198PBBE (TG)5TA (TG)13 *CTC TTT CTG CCT GCA CTC
GAC TTC ATT GGA CAG CAC AC 57 1.2 11 (5–9) 89–113 (109) 0.76 (0.6–0.9) 0.80 (0.67–0.89)Soc3121PBBE (GT)18 *ACG ACA AGC TGC ACG AAC
CCA GTA ATT CTG ACT CCA CCC 56 0.9 28 (12–14) 82–205 (102) 0.90 (0.8–1.0) 0.95 (0.94–0.96)Soc3200PBBE (GT)15 *AGT GCC AGA TGT ATA TGG G
CAT GGA CGC ATT TGT AGC 51 1.0 27 (12–14) 120–188 (134) 0.88 (0.8–1.0) 0.94 (0.91–0.96)
The sequences of cloned fragments have GenBank accession nos AJ278566–AJ278572; HO, observed heterozygosity; HE, expected heterozygosity; given are the mean values across the five populations with range in parentheses. *Primer used for end-labelling. **Cloned insert size in parentheses.
MEC1053.fm Page 2167 Wednesday, November 15, 2000 8:58 AM

2168 P R I M E R N O T E S
© 2000 Blackwell Science Ltd, Molecular Ecology, 9, 2155–2234
M. Harmelin-Vivien and P. Francour for scientific support, andF. Palluy and C. Marschal for assistance in obtaining samples.
References
Estoup A, Largiadèr CR, Perrot E, Chourrout D (1996) Rapid onetube DNA extraction for reliable PCR detection of fish poly-morphic markers and transgenes. Molecular Marine Biology andBiotechnology, 5, 295–298.
Estoup A, Solingnac M, Harry M, Cornuet JM (1993) Character-isation of (GT)n and (CT)n microsatellites in two insect species:Apis mellifera and Bombus terrestris. Nucleic Acids Research, 21,1427–1431.
Francour P (1997) Fish assemblages of Posidonia oceanica bedsat Port-Cros (France, NW Mediterranean): assessment ofcomposition and long-term fluctuations by visual census. Pub-licazioni della Stazione Zoologica di Napoli Halia: Marine Ecology,18, 157–173.
SpeciesAnnealingtemp. (°C)
Mg concentration(mm) n
Numberof alleles
Size range(bp)
Soc1017PBBES. tinca 63 0.8 5 5 75–85S. roissali 63 0.8 7 9 83–109S. rostratus 61 0.8 6 5 93–101S. cinereus 61 0.8 2 4 81–97Coris julis 61 0.8 1 2 93–97
Soc1093PBBES. tinca 63 0.8 3 5 114–206S. roissali 63 0.8 5 1 112S. rostratus 63 0.8 6 5 86–96S. cinereus 63 0.8 2 4 106–120Coris julis 63 0.8 1 1 104
Soc1198PBBES. tinca 57 1.2 5 7 89–105S. roissali 57 1.2 8 9 95–133S. rostratus 57 1.2 6 2 85–103S. cinereus 57 1.2 2 4 93–109Coris julis 57 1.2 1 1 85
Soc3200PBBES. tinca 61 0.9 5 3 142–148S. roissali 61 0.9 8 11 117–154S. rostratus 61 0.9 6 5 122–134S. cinereus 61 0.9 2 3 132–150Coris julis 61 0.9 1 — —
Soc1063PBBES. tinca 56 0.8 5 4 96–102S. roissali 56 0.8 6 12 98–164S. rostratus 56 0.8 6 7 94–112S. cinereus 56 0.8 2 4 92–120Coris julis 54 0.8 1 2 103–113
Soc1109PBBES. tinca 57 1.0 5 6 141–155S. roissali 57 1.0 8 12 133–167S. rostratus 57 1.0 6 4 127–147S. cinereus 57 1.0 2 3 143–159Coris julis 57 1.0 1 1 125
Soc3121PBBES. tinca 56 0.9 5 5 91–125S. roissali 56 0.9 8 13 86–147S. rostratus 56 0.9 6 2 87–95S. cinereus 56 0.9 2 4 87–97Coris julis 56 0.9 1 1 87
n, number of analysed specimens; —, no alleles obtained.
Table 2 Amplification results of sevenSymphodus ocellatus microsatellite loci inrelated taxa
MEC1053.fm Page 2168 Wednesday, November 15, 2000 8:58 AM

P R I M E R N O T E S 2169
© 2000 Blackwell Science Ltd, Molecular Ecology, 9, 2155–2234
Michel Ch, Lejeune P, Voss J (1987) Biologie et comportement desLabres européens. Revue Française d’Aquariologie Herpétologie,14, 1–80.
Warner RR, Lejeune P (1985) Sex change limited by paternal care:a test using four Mediterranean labrid fishes, genus Symphodus.Marine Biology, 87, 89–99.
Whitehead PJP, Bauchot ML, Hureau JC, Nielsen J, Tortonese E(1984) Fishes of the North-Eastern Atlantic and Mediterranean.UNESCO Publications, Paris.
91220001126PRIMER NOTEsPRIMER NOTEsPRIMER NOTEs113Graphicraft Limited, Hong Kong
Characterization of microsatellite loci in the primitive ant Nothomyrmecia macrops Clark
MATTHIAS SANETRA* and ROSS H. CROZIER*
School of Biochemistry and Genetics, La Trobe University, Bundoora, Victoria 3083, Australia
Keywords: microsatellites, Myrmecia, Nothomyrmecia macrops, primitive ants
Received 14 June 2000; revision accepted 7 August 2000
Correspondence: M. Sanetra. Fax: + 61 7 4725 1570; E-mail: [email protected]*Present address: School of Tropical Biology, James Cook University, Townsville 4811, Queensland, Australia.
Although a number of microsatellite loci have been isolatedfor some species of ‘primitive ants’ in the subfamily Ponerinae[e.g. Diacamma (Doums 1999), Gnamptogenys (Giraut et al. 1999)],the availability of genetic markers for the unique Australianant Nothomyrmecia macrops has been poor. Of 16 allozyme locistudied by Ward & Taylor (1981) only one locus was poly-morphic. Colonies appear to have low nestmate relatedness(Ward & Taylor 1981) but these estimates must be interpretedwith caution because of limited sample size. N. macrops has greatsignificance in evolutionary sociobiology because it possessesa relatively large proportion of ancestral characters (e.g. Taylor1978). Thus, a more detailed knowledge of the genetics ofthis ant is desirable and will perhaps shed new light on anumber of issues related to the evolution of eusociality inthe Hymenoptera. In this paper we describe the isolation ofvariable microsatellite loci that can be used for precisecolony- and population-level genetic analyses in Nothomyrmecia,and in the most closely related subfamily, the Myrmeciinae.
Genomic DNA was extracted from five worker pupae asdescribed by Baur et al. (1993). The DNA was digested withthe restriction enzymes Sau3AI and RsaI, and size-selectedfragments (300–600 bp) were ligated into the BamHI/HincIIsite of the vector pUC19. Electrocompetent Escherichia coliJM109 strains were transformed by electroporation using aBioRad genepulser and colonies were hybridized onto HybondN + (Amersham) nylon membranes. Approximately 9000recombinant colonies were screened with a radiolabelled (GA)10oligonucleotide probe and 117 positive clones identified. Thirtyclones were sequenced either manually using the fmol® cyclesequencing kit (Promega) or using the Big Dye Terminatorcycle sequencing ready reaction kit (Perkin Elmer) with an
ABI Prism 377 DNA auto-sequencer. Primers were designedfor 18 loci using the computer program oligoTM (Macintoshversion 4.0, National Biosciences Inc.).
DNA for microsatellite analysis was prepared from gastersof single Nothomyrmecia workers using a modification of theChelex® 100 Resin extraction protocol (Walsh et al. 1991).Polymerase chain reactions contained 10 mm Tris-HCl (pH 9.0),50 mm KCl, 1.5 mm MgCl2, 0.1% Triton® X-100, 165 µm dNTPs,0.1 µm of forward primer, 0.03–0.06 µm of forward primerend-labelled with [γ33P]-ATP, 0.4 µm of reverse primer, 0.5 µg/µLbovine serum albumin, 0.4 U of Taq DNA polymerase (Promega)and 2 µL of template DNA in a total volume of 10 µL. Ampli-fications were conducted in a Corbett thermal cycler usingthe following temperature profile: 2 min at 94 °C followedby 35 cycles of 30 s at 93 °C, 30 s at 50 or 55 °C for annealing(see Table 1) and 30 s at 72 °C, and a final elongation step of10 min at 72 °C. The amplified products were electrophoresedon 5% polyacrylamide sequencing gels and visualized byautoradiography.
Of the 18 sets of primers, two failed to amplify and onegave a banding pattern that was difficult to interpret. Theother 15 loci yielded repeatable and scorable results. Asample of 36 workers from Poochera, South Australia (takenfrom trees in an area of approximately 200 × 20 m) was usedto assess the variability of these markers. We found that allbut one of the 15 loci showed considerable polymorphism(Table 1), which is surprising given the small and geograph-ically restricted sample analysed. Each polymorphic locushad between three and 12 alleles. The expected heterozygo-sity based on allele frequencies ranged from 0.53–0.90 witha mean of 0.70 across all loci. We tested for heterozygotedeficiency using the computer program genepop (web version3.1c) in order to detect the presence of null alleles. Except forthe significant excess of homozygotes at locus Nmac 115, nodeviations from expected heterozygosities were discovered.
We investigated cross-species amplification in two speciesof Myrmecia and found that a large proportion of the locicould be amplified in M. forficata (see Table 1). Despite beinghighly polymorphic in Nothomyrmecia, the loci Nmac 11, 28and 45 turned out to be monomorphic in M. pyriformis (threeindividuals from each of five colonies examined). The relat-ively high success rate of cross-species amplification maysupport the general contention that the two subfamiliesNothomyrmeciinae and Myrmeciinae are closely related(Baroni Urbani et al. 1992). In other groups of ants, successfulcross-species amplifications have been reported most fre-quently among genera within the same subfamily (e.g. Doums1999) suggesting a relatively low level of conservation ofmicrosatellites across ant taxa.
Acknowledgements
We thank Seigo Higashi and Hiroki Miyata for field assistance,and Ching Crozier, Melissa Carew, Maria Chiotis and VanessaFraser for their help during the laboratory work. Lynn Atkinsonand Michael Goodisman made comments on the manuscript. Thiswork was supported by the Deutsche Akademie der Naturfor-scher Leopoldina (grant no. LPD 9701–6 to M.S.) and by theAustralian Research Council (grant no. A19925028 to R.H.C.).
MEC1053.fm Page 2169 Wednesday, November 15, 2000 8:58 AM

2170 P R I M E R N O T E S
© 2000 Blackwell Science Ltd, Molecular Ecology, 9, 2155–2234
References
Baroni Urbani C, Bolton B, Ward PS (1992) The internal phylogenyof ants (Hymenoptera: Formicidae). Systematic Entomology, 17,301–329.
Baur A, Buschinger A, Zimmermann FK (1993) Molecular cloningand sequencing of 18S rDNA gene fragments from six differentant species. Insectes Sociaux, 40, 325–335.
Doums C (1999) Characterization of microsatellite loci in the queenlessPonerine ant Diacamma cyaneiventre. Molecular Ecology, 8, 1957–1959.
Giraud T, Blatrix R, Solignac M, Jaisson P (1999) Polymorphicmicrosatellite DNA markers in the ant Gnamptogenys striatula.Molecular Ecology, 8, 2143–2145.
Taylor RW (1978) Nothomyrmecia macrops: a living-fossil ant redis-covered. Science, 201, 979–985.
Walsh PS, Metzger DA, Higuchi R (1991) Chelex® 100 as amedium for simple extraction of DNA for PCR-based typingfrom forensic material. Biotechniques, 10, 506–513.
Ward PS, Taylor RW (1981) Allozyme variation, colony structureand genetic relatedness in the primitive ant Nothomyrmeciamacrops Clark (Hymenoptera: Formicidae). Journal of the Aus-tralian Entomological Society, 20, 177–183.
91220001127PRIMER NOTEsPRIMER NOTEsPRIMER NOTEs000000Graphicraft Limited, Hong Kong
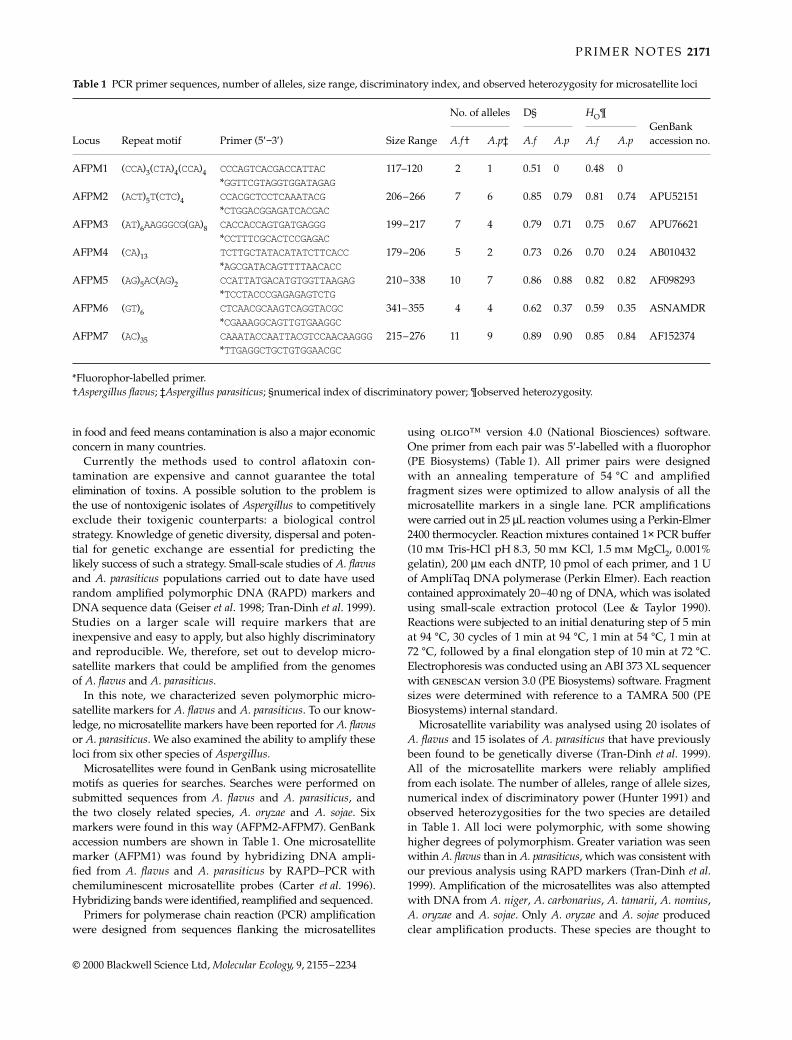
Characterization of microsatellite loci in the aflatoxigenic fungi Aspergillus flavus and Aspergillus parasiticus
NAI TRAN-DINH and DEE CARTER
Department of Microbiology, Building G08, University of Sydney, NSW 2006, Australia
Keywords: Aspergillus flavus, Aspergillus parasiticus, microsatellite, PCR
Received 30 June 2000; revision accepted 7 August 2000
Correspondence: D. Carter. Fax: + 612 93514571; E-mail: [email protected]
Aspergillus flavus and Aspergillus parasiticus are closely related,morphologically similar species belonging to Aspergillussection Flavi. Both A. flavus and A. parasiticus have a worldwideimpact on agriculture due to their ability to produce aflatoxin.Contamination of crops poses a serious health risk, asaflatoxins are extremely potent hepatocarcinogens (Dieneret al. 1987). The need to monitor and control aflatoxin levels
Table 1 Microsatellite loci and their characteristics developed in the ant Nothomyrrmecia macrops. The number of alleles (Na), frequency ofthe most common allele ( f ) and the estimates of observed (HO) and expected heterozygosity (HE) are based on a worker sample of 36individuals collected near Poochera. Amplification success in Myrmecia forficata (Mf — three individuals examined) is indicated by ± butwith the annealing temperature (Ta) set to 50 °C for all runs
Locus Core repeat Size (bp) Na f HO HE Ta (°C) Primers (5′−3′) Mf
Nmac 1 (AG)13 186–209 8 0.32 0.94 0.82 50 F: CGT TTC CGA TAT TCG AGC AG +R: CAG GAT GAC AGC CGG TGA G
Nmac 11 (GA)3G(GA)2CG(GA)18(G)5(GA)2AA (GA)3 187–210 12 0.21 0.97 0.90 55 F: ATT ACA ACA TAG ACG GCA AGA T +(GGA)2(GA)3TA(GA)2 R: AAT CCC TGC TGC GGC TTA G
Nmac 13 (AG)15 108–126 5 0.65 0.50 0.53 55 F: TGC TCG CCG CTT ATC CTT C –R: TAG AAC ACC AGA TGC GTC GT
Nmac 14 (T)3(CT)10(CCCT)2(CT)4TTCA(TC)2 151–165 5 0.47 0.49 0.62 50 F: TAT AAG ATT GAG AAT GTA TCG CT +R: TGT AAT TCT TAG CTC TCG CAA C
Nmac 18 (TC)4TTTG (TC)2(N)9(TC)11(AC)4TCTT(TC)2
282–302 7 0.54 0.78 0.66 50 F: CCA ATT CGT GCG TCC CCA T +R: GGC GAG GGT TAT TTC TTA CG
Nmac 20 CC(CCCT)2(CT)3A(C)6TC(CT)8CA(CT)2 198–204 3 0.85 0.31 0.27 55 F: TGG TAA AGC AAA TGT AAA GCC G –R: AGA CTG GAA GGT GTG CTC G
Nmac 23 (AG)15 286–292 4 0.32 0.78 0.74 55 F: TCG GCA AAG TGC GGT TGA GC +R: CTC CCA CTG CTG AGT TGG TA
Nmac 28 (C)9(TC)11TT (TC)5 156–186 10 0.60 0.64 0.63 55 F: AGA CCG TAT AAA ATT CGT TGA G +R: ATA AAT CCT CGA AGG TGG CGA
Nmac 39 (GA)14 206–222 12 0.21 0.94 0.89 55 F: GGC TCT CCA TTC TGA CGG TG –R: GTC CCG AGA CAT GCA CAT AC
Nmac 43 (CT)23 105–139 11 0.49 0.67 0.73 50 F: GTT CGT GGC AGC AGT CGG +R: CTC CGT GCT TTC CAG AAC G
Nmac 45 (GA)15GG(GA)10 133–173 10 0.33 0.83 0.83 50 F: CGC TTT CAA ACC TGC TTC TG +R: GCC ATA CCC TTT TAG AGA TAA C
Nmac 47 (GA)24 291–321 11 0.22 0.82 0.88 50 F: GAT GTC GTT GGG TTC GTA TC +R: GAA ACT TCG GCA GGG ACT C
Nmac 53 (GA)18 308–328 6 0.42 0.67 0.76 55 F: ACA CAA GGC GAG CCA AAC G +R: CCC CCT TTC CTC AAC TAC C
Nmac 115 (CT)3(AT)2(CA)10(CT)10TTCT (CTTT)4 309–313 3 0.56 0.22 0.53 55 F: GCC ATT TAG TAT CGC CGT GTG +R: CGG GGG TGA GTG ATT AAG CG
GenBank Accession numbers AF264862–264874, 264876.
MEC1053.fm Page 2170 Wednesday, November 15, 2000 8:58 AM
P R I M E R N O T E S 2171
© 2000 Blackwell Science Ltd, Molecular Ecology, 9, 2155–2234
in food and feed means contamination is also a major economicconcern in many countries.
Currently the methods used to control aflatoxin con-tamination are expensive and cannot guarantee the totalelimination of toxins. A possible solution to the problem isthe use of nontoxigenic isolates of Aspergillus to competitivelyexclude their toxigenic counterparts: a biological controlstrategy. Knowledge of genetic diversity, dispersal and poten-tial for genetic exchange are essential for predicting thelikely success of such a strategy. Small-scale studies of A. flavusand A. parasiticus populations carried out to date have usedrandom amplified polymorphic DNA (RAPD) markers andDNA sequence data (Geiser et al. 1998; Tran-Dinh et al. 1999).Studies on a larger scale will require markers that areinexpensive and easy to apply, but also highly discriminatoryand reproducible. We, therefore, set out to develop micro-satellite markers that could be amplified from the genomesof A. flavus and A. parasiticus.
In this note, we characterized seven polymorphic micro-satellite markers for A. flavus and A. parasiticus. To our know-ledge, no microsatellite markers have been reported for A. flavusor A. parasiticus. We also examined the ability to amplify theseloci from six other species of Aspergillus.
Microsatellites were found in GenBank using microsatellitemotifs as queries for searches. Searches were performed onsubmitted sequences from A. flavus and A. parasiticus, andthe two closely related species, A. oryzae and A. sojae. Sixmarkers were found in this way (AFPM2-AFPM7). GenBankaccession numbers are shown in Table 1. One microsatellitemarker (AFPM1) was found by hybridizing DNA ampli-fied from A. flavus and A. parasiticus by RAPD–PCR withchemiluminescent microsatellite probes (Carter et al. 1996).Hybridizing bands were identified, reamplified and sequenced.
Primers for polymerase chain reaction (PCR) amplificationwere designed from sequences flanking the microsatellites
using oligo™ version 4.0 (National Biosciences) software.One primer from each pair was 5′-labelled with a fluorophor(PE Biosystems) (Table 1). All primer pairs were designedwith an annealing temperature of 54 °C and amplifiedfragment sizes were optimized to allow analysis of all themicrosatellite markers in a single lane. PCR amplificationswere carried out in 25 µL reaction volumes using a Perkin-Elmer2400 thermocycler. Reaction mixtures contained 1× PCR buffer(10 mm Tris-HCl pH 8.3, 50 mm KCl, 1.5 mm MgCl2, 0.001%gelatin), 200 µm each dNTP, 10 pmol of each primer, and 1 Uof AmpliTaq DNA polymerase (Perkin Elmer). Each reactioncontained approximately 20–40 ng of DNA, which was isolatedusing small-scale extraction protocol (Lee & Taylor 1990).Reactions were subjected to an initial denaturing step of 5 minat 94 °C, 30 cycles of 1 min at 94 °C, 1 min at 54 °C, 1 min at72 °C, followed by a final elongation step of 10 min at 72 °C.Electrophoresis was conducted using an ABI 373 XL sequencerwith genescan version 3.0 (PE Biosystems) software. Fragmentsizes were determined with reference to a TAMRA 500 (PEBiosystems) internal standard.
Microsatellite variability was analysed using 20 isolates ofA. flavus and 15 isolates of A. parasiticus that have previouslybeen found to be genetically diverse (Tran-Dinh et al. 1999).All of the microsatellite markers were reliably amplifiedfrom each isolate. The number of alleles, range of allele sizes,numerical index of discriminatory power (Hunter 1991) andobserved heterozygosities for the two species are detailedin Table 1. All loci were polymorphic, with some showinghigher degrees of polymorphism. Greater variation was seenwithin A. flavus than in A. parasiticus, which was consistent withour previous analysis using RAPD markers (Tran-Dinh et al.1999). Amplification of the microsatellites was also attemptedwith DNA from A. niger, A. carbonarius, A. tamarii, A. nomius,A. oryzae and A. sojae. Only A. oryzae and A. sojae producedclear amplification products. These species are thought to
Table 1 PCR primer sequences, number of alleles, size range, discriminatory index, and observed heterozygosity for microsatellite loci
No. of alleles D§ HO¶GenBank accession no.Locus Repeat motif Primer (5′−3′) Size Range A.f† A.p‡ A.f A.p A.f A.p
AFPM1 (CCA)3(CTA)4(CCA)4 CCCAGTCACGACCATTAC 117–120 2 1 0.51 0 0.48 0*GGTTCGTAGGTGGATAGAG
AFPM2 (ACT)5T(CTC)4 CCACGCTCCTCAAATACG 206–266 7 6 0.85 0.79 0.81 0.74 APU52151*CTGGACGGAGATCACGAC
AFPM3 (AT)6AAGGGCG(GA)8 CACCACCAGTGATGAGGG 199–217 7 4 0.79 0.71 0.75 0.67 APU76621*CCTTTCGCACTCCGAGAC
AFPM4 (CA)13 TCTTGCTATACATATCTTCACC 179–206 5 2 0.73 0.26 0.70 0.24 AB010432*AGCGATACAGTTTTAACACC
AFPM5 (AG)5AC(AG)2 CCATTATGACATGTGGTTAAGAG 210–338 10 7 0.86 0.88 0.82 0.82 AF098293*TCCTACCCGAGAGAGTCTG
AFPM6 (GT)6 CTCAACGCAAGTCAGGTACGC 341–355 4 4 0.62 0.37 0.59 0.35 ASNAMDR*CGAAAGGCAGTTGTGAAGGC
AFPM7 (AC)35 CAAATACCAATTACGTCCAACAAGGG*TTGAGGCTGCTGTGGAACGC
215–276 11 9 0.89 0.90 0.85 0.84 AF152374
*Fluorophor-labelled primer.†Aspergillus flavus; ‡Aspergillus parasiticus; §numerical index of discriminatory power; ¶observed heterozygosity.
MEC1053.fm Page 2171 Wednesday, November 15, 2000 8:58 AM
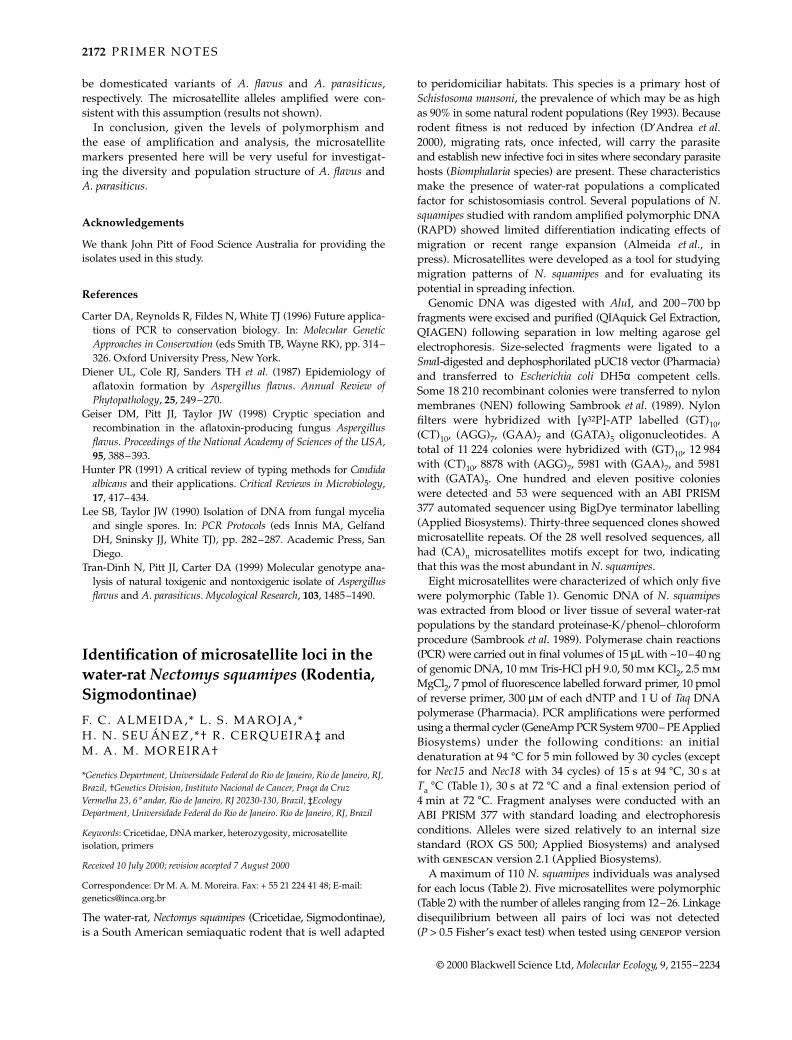
2172 P R I M E R N O T E S
© 2000 Blackwell Science Ltd, Molecular Ecology, 9, 2155–2234
be domesticated variants of A. flavus and A. parasiticus,respectively. The microsatellite alleles amplified were con-sistent with this assumption (results not shown).
In conclusion, given the levels of polymorphism andthe ease of amplification and analysis, the microsatellitemarkers presented here will be very useful for investigat-ing the diversity and population structure of A. flavus andA. parasiticus.
Acknowledgements
We thank John Pitt of Food Science Australia for providing theisolates used in this study.
References
Carter DA, Reynolds R, Fildes N, White TJ (1996) Future applica-tions of PCR to conservation biology. In: Molecular GeneticApproaches in Conservation (eds Smith TB, Wayne RK), pp. 314–326. Oxford University Press, New York.
Diener UL, Cole RJ, Sanders TH et al. (1987) Epidemiology ofaflatoxin formation by Aspergillus flavus. Annual Review ofPhytopathology, 25, 249–270.
Geiser DM, Pitt JI, Taylor JW (1998) Cryptic speciation andrecombination in the aflatoxin-producing fungus Aspergillusflavus. Proceedings of the National Academy of Sciences of the USA,95, 388–393.
Hunter PR (1991) A critical review of typing methods for Candidaalbicans and their applications. Critical Reviews in Microbiology,17, 417–434.
Lee SB, Taylor JW (1990) Isolation of DNA from fungal myceliaand single spores. In: PCR Protocols (eds Innis MA, GelfandDH, Sninsky JJ, White TJ), pp. 282–287. Academic Press, SanDiego.
Tran-Dinh N, Pitt JI, Carter DA (1999) Molecular genotype ana-lysis of natural toxigenic and nontoxigenic isolate of Aspergillusflavus and A. parasiticus. Mycological Research, 103, 1485–1490.
91220001128PRIMER NOTEsPRIMER NOTEsPRIMER NOTEs113Graphicraft Limited, Hong Kong
Identification of microsatellite loci in the water-rat Nectomys squamipes (Rodentia, Sigmodontinae)
F. C . ALMEIDA,* L . S . MAROJA,* H. N. SEUÁNEZ,*† R . CERQUEIRA‡ and M. A. M. MOREIRA†
*Genetics Department, Universidade Federal do Rio de Janeiro, Rio de Janeiro, RJ, Brazil, †Genetics Division, Instituto Nacional de Cancer, Praça da Cruz Vermelha 23, 6° andar, Rio de Janeiro, RJ 20230-130, Brazil, ‡Ecology Department, Universidade Federal do Rio de Janeiro. Rio de Janeiro, RJ, Brazil
Keywords: Cricetidae, DNA marker, heterozygosity, microsatellite isolation, primers
Received 10 July 2000; revision accepted 7 August 2000
Correspondence: Dr M. A. M. Moreira. Fax: + 55 21 224 41 48; E-mail: [email protected]
The water-rat, Nectomys squamipes (Cricetidae, Sigmodontinae),is a South American semiaquatic rodent that is well adapted
to peridomiciliar habitats. This species is a primary host ofSchistosoma mansoni, the prevalence of which may be as highas 90% in some natural rodent populations (Rey 1993). Becauserodent fitness is not reduced by infection (D’Andrea et al.2000), migrating rats, once infected, will carry the parasiteand establish new infective foci in sites where secondary parasitehosts (Biomphalaria species) are present. These characteristicsmake the presence of water-rat populations a complicatedfactor for schistosomiasis control. Several populations of N.squamipes studied with random amplified polymorphic DNA(RAPD) showed limited differentiation indicating effects ofmigration or recent range expansion (Almeida et al., inpress). Microsatellites were developed as a tool for studyingmigration patterns of N. squamipes and for evaluating itspotential in spreading infection.
Genomic DNA was digested with AluI, and 200–700 bpfragments were excised and purified (QIAquick Gel Extraction,QIAGEN) following separation in low melting agarose gelelectrophoresis. Size-selected fragments were ligated to aSmaI-digested and dephosphorilated pUC18 vector (Pharmacia)and transferred to Escherichia coli DH5α competent cells.Some 18 210 recombinant colonies were transferred to nylonmembranes (NEN) following Sambrook et al. (1989). Nylonfilters were hybridized with [γ32P]-ATP labelled (GT)10,(CT)10, (AGG)7, (GAA)7 and (GATA)5 oligonucleotides. Atotal of 11 224 colonies were hybridized with (GT)10, 12 984with (CT)10, 8878 with (AGG)7, 5981 with (GAA)7, and 5981with (GATA)5. One hundred and eleven positive colonieswere detected and 53 were sequenced with an ABI PRISM377 automated sequencer using BigDye terminator labelling(Applied Biosystems). Thirty-three sequenced clones showedmicrosatellite repeats. Of the 28 well resolved sequences, allhad (CA)n microsatellites motifs except for two, indicatingthat this was the most abundant in N. squamipes.
Eight microsatellites were characterized of which only fivewere polymorphic (Table 1). Genomic DNA of N. squamipeswas extracted from blood or liver tissue of several water-ratpopulations by the standard proteinase-K/phenol–chloroformprocedure (Sambrook et al. 1989). Polymerase chain reactions(PCR) were carried out in final volumes of 15 µL with ~10–40 ngof genomic DNA, 10 mm Tris-HCl pH 9.0, 50 mm KCl2, 2.5 mmMgCl2, 7 pmol of fluorescence labelled forward primer, 10 pmolof reverse primer, 300 µm of each dNTP and 1 U of Taq DNApolymerase (Pharmacia). PCR amplifications were performedusing a thermal cycler (GeneAmp PCR System 9700– PE AppliedBiosystems) under the following conditions: an initialdenaturation at 94 °C for 5 min followed by 30 cycles (exceptfor Nec15 and Nec18 with 34 cycles) of 15 s at 94 °C, 30 s atTa °C (Table 1), 30 s at 72 °C and a final extension period of4 min at 72 °C. Fragment analyses were conducted with anABI PRISM 377 with standard loading and electrophoresisconditions. Alleles were sized relatively to an internal sizestandard (ROX GS 500; Applied Biosystems) and analysedwith genescan version 2.1 (Applied Biosystems).
A maximum of 110 N. squamipes individuals was analysedfor each locus (Table 2). Five microsatellites were polymorphic(Table 2) with the number of alleles ranging from 12–26. Linkagedisequilibrium between all pairs of loci was not detected(P > 0.5 Fisher’s exact test) when tested using genepop version
MEC1053.fm Page 2172 Wednesday, November 15, 2000 8:58 AM

P R I M E R N O T E S 2173
© 2000 Blackwell Science Ltd, Molecular Ecology, 9, 2155–2234
3.2 (Raymond & Rousset 1995). Expected heterozygozity wassignificantly higher than observed heterozygosity for all butone locus (Table 2). Although this was probably a result ofthe Wahlund effect (Hartl & Clark 1997), and since sampleswere collected in eight different localities, the existence of nullalleles cannot be ruled out until a more detailed populationstudy can be performed.
The five polymorphic microsatellites loci, the first knownfor Nectomys, will be useful for assessing genetic variabilitywithin and among water-rat populations as well as fordetecting differentiation and migration.
Acknowledgements
This work was funded by CNPq-PRONEX 100/98, PROBIO/MMA, FIOCRUZ (to L. Rey and P. S. D’Andrea), FUJB, INCa/FAF and CAPES (graduate grants). We are grateful to P. S.D’Andrea and C. R. Bonvicino for providing part of the ana-lysed samples.
References
Almeida FC, Moreira MAM, Bonvicino CR, Cerqueira R (in press)RAPD analysis of Nectomys squamipes (Rodentia, Sigmodontinae)populations. Genetics and Molecular Biology, in press.
D’Andrea PS, Maroja LS, Gentile R, Cerqueira R, Maldonado A,Jr, Rey L (2000) The influence of Schistosoma mansoni on anaturally infected population of water-rats in Brazil. Parasitology,120, 573–582.
Hartl DL, Clark AG (1997) Principles of Population Genetics. 3rdedn. Sinauer Associates Inc., Sunderland, MA.
Raymond M, Rousset F (1995) genepop (Version 1.2): a popula-tion genetics software for exact tests and ecumenicism. Journalof Heredity, 86, 248–249.
Rey L (1993) Non-human vertebrate hosts of Schistosoma mansoniand Schistosomiasis transmission in Brazil. Research andReviews in Parasitology, 53, 13–25.
Sambrook J, Fritcsh E, Maniatis T (1989) Molecular Cloning aLaboratory Manual. 2nd edn. Cold Spring Harbour LaboratoryPress, New York.
91220001129PRIMER NOTEsPRIMER NOTEsPRIMER NOTEs100Graphicraft Limited, Hong Kong
A set of CA repeat microsatellite markers derived from the pool frog, Rana lessonae
T. W. J . GARNER,* B . GAUTSCHI ,† S . RÖTHLISBERGER,* and H. -U. REYER*
*Zoologisches Institut, Universität Zürich-Irchel, Winterthurerstrasse 190, CH-8057 Zürich, Switzerland, †Institut für Umweltwissenschaften, Universität Zürich-Irchel, Winterthurerstrasse 190, CH-8057 Zürich, Switzerland
Keywords: hybridogenesis, microsatellites, primers, Rana esculenta, Rana lessonae, water frogs
Received 21 July 2000; revision accepted 7 August 2000
Correspondence: T. W. J. Garner. Fax: + 41 635 68 21; E-mail: [email protected]
The pool frog, Rana lessonae, is broadly distributed in centralEurope and often forms hybridogenetic, hemiclonal hybridswith the lake frog, Rana ridibunda (Blankenhorn 1977). Thesehybrids, known as Rana klepton esculenta, sexually para-sitize either one or the other of the parental species, the mostcommon form of which is the L-E system (R. lessonae LL × R.esculenta LR) (Graf & Polls-Pelaz 1989). In this system,hybrids transmit a clonal R. ridibunda haplotype by matingwith a syntopic R. lessonae, while hybrid by hybrid crossesresult in inviable offspring (Graf & Müller 1979; Uzzell et al.
Table 1 Motifs and primer sequences of eight microsatellite loci of Nectomys squamipes. F, Forward primer; R, Reverse primer. Ta °C,annealing temperature
Locus Repeat motif Primer sequences (5′ → 3′) Ta °C GenBank accession no.
Nec12 (CA)4T(CA)19 F: CTCCCTTCCCTCAATTTGCTGAGT 61 AF283417R: ACATGTGCAAAGCATGAAAATGGA
Nec14 (CA)24 F: CAGGCGATTTACACAAAAGAAT 57 AF283420R: CACTGAGCCATCTATCCAGTTC AF283419
Nec15 (AC)24T(CA)6 F: AGGAAATGCTTATCTGGAGGAG 58 AF283422R: GACTCCTGATGTTGAACTGACC AF283421
Nec18 (CA)34 F: CTCTTTGAGGCCACTTCATTAA 58 AF283426R: GAACTAACATTTGCATCCTCCAG AF283424
Nec28 (CA)19 F: AGGAGAAAACCTGTATGCCATG 59 AF283428R: GTTTCTTCTTGCTGACCATGAGG
Table 2 Genetic variation of eight microsatellite loci in Nectomyssquamipes. N, number of examined animals; A, number ofalleles per loci; Freq., frequency of the most common allele;HO, observed heterozygosity; HE, expected heterozygosity
Locus N A Freq. HE HO Allele range (bp)
Nec12 110 26 0.15 0.93 0.72* 206–242Nec14 110 16 0.16 0.90 0.73*** 204–236Nec15 100 19 0.17 0.90 0.68*** 171–213Nec18 109 21 0.11 0.93 0.80** 128–170Nec28 110 12 0.24 0.85 0.82 133–155
*P < 0.01, **P < 0.001, ***P < 0.0001. P-values obtained with Fisher’s exact test for difference between HE and HO considering the null hypothesis of heterozygote deficiency.
MEC1053.fm Page 2173 Wednesday, November 15, 2000 8:58 AM
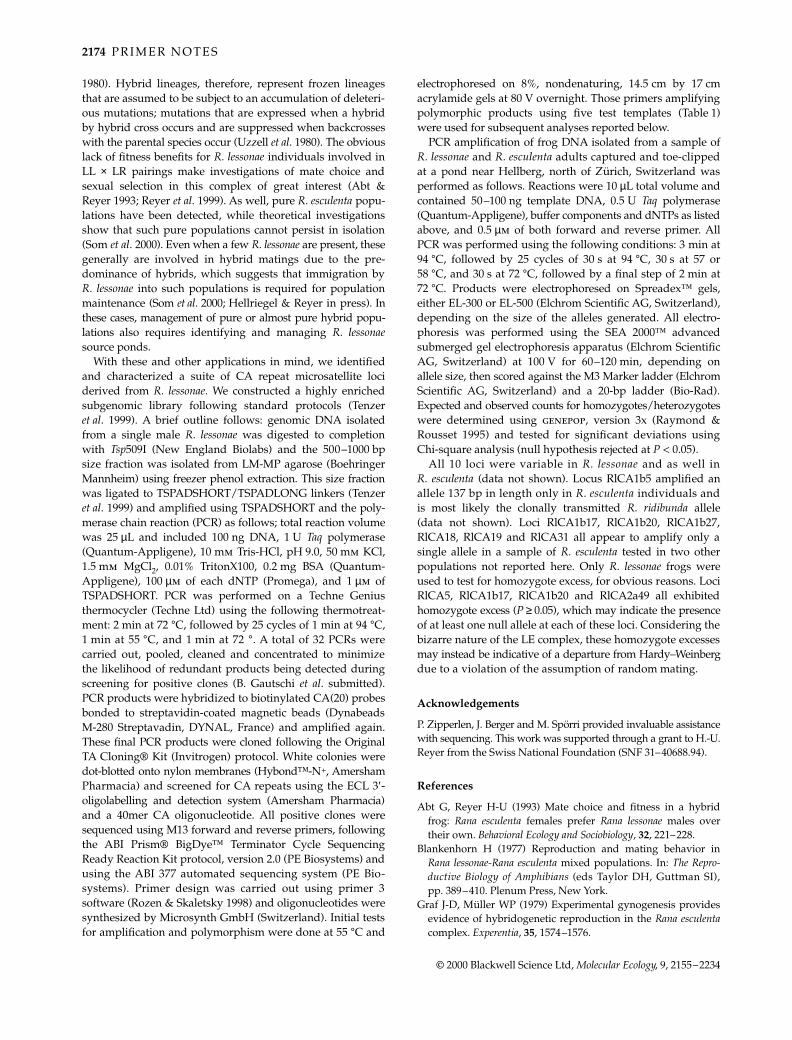
2174 P R I M E R N O T E S
© 2000 Blackwell Science Ltd, Molecular Ecology, 9, 2155–2234
1980). Hybrid lineages, therefore, represent frozen lineagesthat are assumed to be subject to an accumulation of deleteri-ous mutations; mutations that are expressed when a hybridby hybrid cross occurs and are suppressed when backcrosseswith the parental species occur (Uzzell et al. 1980). The obviouslack of fitness benefits for R. lessonae individuals involved inLL × LR pairings make investigations of mate choice andsexual selection in this complex of great interest (Abt &Reyer 1993; Reyer et al. 1999). As well, pure R. esculenta popu-lations have been detected, while theoretical investigationsshow that such pure populations cannot persist in isolation(Som et al. 2000). Even when a few R. lessonae are present, thesegenerally are involved in hybrid matings due to the pre-dominance of hybrids, which suggests that immigration byR. lessonae into such populations is required for populationmaintenance (Som et al. 2000; Hellriegel & Reyer in press). Inthese cases, management of pure or almost pure hybrid popu-lations also requires identifying and managing R. lessonaesource ponds.
With these and other applications in mind, we identifiedand characterized a suite of CA repeat microsatellite lociderived from R. lessonae. We constructed a highly enrichedsubgenomic library following standard protocols (Tenzeret al. 1999). A brief outline follows: genomic DNA isolatedfrom a single male R. lessonae was digested to completionwith Tsp509I (New England Biolabs) and the 500–1000 bpsize fraction was isolated from LM-MP agarose (BoehringerMannheim) using freezer phenol extraction. This size fractionwas ligated to TSPADSHORT/TSPADLONG linkers (Tenzeret al. 1999) and amplified using TSPADSHORT and the poly-merase chain reaction (PCR) as follows; total reaction volumewas 25 µL and included 100 ng DNA, 1 U Taq polymerase(Quantum-Appligene), 10 mm Tris-HCl, pH 9.0, 50 mm KCl,1.5 mm MgCl2, 0.01% TritonX100, 0.2 mg BSA (Quantum-Appligene), 100 µm of each dNTP (Promega), and 1 µm ofTSPADSHORT. PCR was performed on a Techne Geniusthermocycler (Techne Ltd) using the following thermotreat-ment: 2 min at 72 °C, followed by 25 cycles of 1 min at 94 °C,1 min at 55 °C, and 1 min at 72 °. A total of 32 PCRs werecarried out, pooled, cleaned and concentrated to minimizethe likelihood of redundant products being detected duringscreening for positive clones (B. Gautschi et al. submitted).PCR products were hybridized to biotinylated CA(20) probesbonded to streptavidin-coated magnetic beads (DynabeadsM-280 Streptavadin, DYNAL, France) and amplified again.These final PCR products were cloned following the OriginalTA Cloning® Kit (Invitrogen) protocol. White colonies weredot-blotted onto nylon membranes (Hybond™-N+, AmershamPharmacia) and screened for CA repeats using the ECL 3′-oligolabelling and detection system (Amersham Pharmacia)and a 40mer CA oligonucleotide. All positive clones weresequenced using M13 forward and reverse primers, followingthe ABI Prism® BigDye™ Terminator Cycle SequencingReady Reaction Kit protocol, version 2.0 (PE Biosystems) andusing the ABI 377 automated sequencing system (PE Bio-systems). Primer design was carried out using primer 3software (Rozen & Skaletsky 1998) and oligonucleotides weresynthesized by Microsynth GmbH (Switzerland). Initial testsfor amplification and polymorphism were done at 55 °C and
electrophoresed on 8%, nondenaturing, 14.5 cm by 17 cmacrylamide gels at 80 V overnight. Those primers amplifyingpolymorphic products using five test templates (Table 1)were used for subsequent analyses reported below.
PCR amplification of frog DNA isolated from a sample ofR. lessonae and R. esculenta adults captured and toe-clippedat a pond near Hellberg, north of Zürich, Switzerland wasperformed as follows. Reactions were 10 µL total volume andcontained 50–100 ng template DNA, 0.5 U Taq polymerase(Quantum-Appligene), buffer components and dNTPs as listedabove, and 0.5 µm of both forward and reverse primer. AllPCR was performed using the following conditions: 3 min at94 °C, followed by 25 cycles of 30 s at 94 °C, 30 s at 57 or58 °C, and 30 s at 72 °C, followed by a final step of 2 min at72 °C. Products were electrophoresed on Spreadex™ gels,either EL-300 or EL-500 (Elchrom Scientific AG, Switzerland),depending on the size of the alleles generated. All electro-phoresis was performed using the SEA 2000™ advancedsubmerged gel electrophoresis apparatus (Elchrom ScientificAG, Switzerland) at 100 V for 60–120 min, depending onallele size, then scored against the M3 Marker ladder (ElchromScientific AG, Switzerland) and a 20-bp ladder (Bio-Rad).Expected and observed counts for homozygotes/heterozygoteswere determined using genepop, version 3x (Raymond &Rousset 1995) and tested for significant deviations usingChi-square analysis (null hypothesis rejected at P < 0.05).
All 10 loci were variable in R. lessonae and as well inR. esculenta (data not shown). Locus RlCA1b5 amplified anallele 137 bp in length only in R. esculenta individuals andis most likely the clonally transmitted R. ridibunda allele(data not shown). Loci RlCA1b17, RlCA1b20, RlCA1b27,RlCA18, RlCA19 and RlCA31 all appear to amplify only asingle allele in a sample of R. esculenta tested in two otherpopulations not reported here. Only R. lessonae frogs wereused to test for homozygote excess, for obvious reasons. LociRlCA5, RlCA1b17, RlCA1b20 and RlCA2a49 all exhibitedhomozygote excess (P ≥ 0.05), which may indicate the presenceof at least one null allele at each of these loci. Considering thebizarre nature of the LE complex, these homozygote excessesmay instead be indicative of a departure from Hardy–Weinbergdue to a violation of the assumption of random mating.
Acknowledgements
P. Zipperlen, J. Berger and M. Spörri provided invaluable assistancewith sequencing. This work was supported through a grant to H.-U.Reyer from the Swiss National Foundation (SNF 31–40688.94).
References
Abt G, Reyer H-U (1993) Mate choice and fitness in a hybridfrog: Rana esculenta females prefer Rana lessonae males overtheir own. Behavioral Ecology and Sociobiology, 32, 221–228.
Blankenhorn H (1977) Reproduction and mating behavior inRana lessonae-Rana esculenta mixed populations. In: The Repro-ductive Biology of Amphibians (eds Taylor DH, Guttman SI),pp. 389–410. Plenum Press, New York.
Graf J-D, Müller WP (1979) Experimental gynogenesis providesevidence of hybridogenetic reproduction in the Rana esculentacomplex. Experentia, 35, 1574–1576.
MEC1053.fm Page 2174 Wednesday, November 15, 2000 8:58 AM

P R I M E R N O T E S 2175
© 2000 Blackwell Science Ltd, Molecular Ecology, 9, 2155–2234
Graf J-D, Polls-Pelaz M (1989) Evolutionary genetics of theRana esculenta complex. In: Evolution and Ecology of UnisexualVertebrates (eds Dawley RM, Bogert JP), pp. 289–302. Bulletin466, New York State Museum, Albany, New York.
Hellriegel B, Reyer H-U (in press) Factors influencing the com-position of mixed populations of a hemiclonal hybrid and itssexual host. Journal of Evolutionary Biology, in press.
Nei M (1978) Estimation of average heterozygosity and geneticdistance from a small number of individuals. Genetics, 89, 583–590.
Raymond M, Rousset F (1995) genepop (Version 1.2): Populationgenetics software for exact tests and ecumenism. Journal ofHeredity, 86, 248–249.
Reyer H-U, Frei G, Som C (1999) Cryptic female choice: frogsreduce clutch size when amplexed by undesired males. Proceed-ings of the Royal Society, London, Series B, 266, 2101–2107.
Rozen S, Skaletsky HJ (1998) Primer 3. Code available athttp://www-genome.wi.mit.edu/genome_software/other/primer3.html.
Som C, Anholt BR, Reyer H-U (2000) The effect of assortativemating on the coexistence of a hybridogenetic waterfrog andits sexual host. American Naturalist, 156, 34–46.
Tenzer I, degli Ivanissevich S, Morgante M, Gessler C (1999)Identification of microsatellite markers and their application topopulation genetics of Venturia inaequalis. Phytopathology, 89,748–753.
Uzzell T, Hotz H, Berger L (1980) Genome exclusion ingametogenesis by an interspecific Rana hybrid: evidence fromelectrophoresis of individual oocytes. Journal of ExperimentalZoology, 214, 251–259.
91220001130PRIMER NOTEsPRIMER NOTEsPRIMER NOTEs100Graphicraft Limited, Hong Kong
Characterization of microsatellite and minisatellite loci in Atlantic salmon (Salmo salar L.) and cross-species amplification in other salmonids
M. CAIRNEY,* J . B . TAGGART* and B . HØYHEIM†
*Institute of Aquaculture, University of Stirling, Stirling, FK9 4LA, UK, †Norwegian School of Veterinary Science, MGA-Genetics, PO Box 8146 DEP, N-0033 Oslo, Norway
Keywords: linkage, microsatellite enrichment, minisatellite, Salmo salar
Received 21 July 2000; revision accepted 7 August 2000
Correspondence: Margaret Cairney. Fax: 01786 472133; E-mail: [email protected]
The Atlantic salmon (Salmo salar) is a salmonid fish specieswhich naturally inhabits cool rivers and oceans of the Northernhemisphere. It is of considerable economic importance, bothfor recreational fishing and as a major aquaculture species.Novel polymorphic genetic markers are in continual demandto extend familial and population genetic studies in thisspecies. We report here on the identification of ‘higher order’(tri- and tetranucleotide) Atlantic salmon microsatellites.
A number of different size-selected Atlantic salmon genomicDNA libraries were constructed, employing a microsatelliteenrichment methodology (comprehensively described by Kijaset al. 1994). This protocol uses biotinylated microsatellite motif
Table 1 10 CA repeat microsatellite loci developed for Rana lessonae. All data based on PCR analysis of 25 R. lessonae individuals. Ta,annealing temperature; HO, observed number of homozygotes; HE, unbiased average heterozygosity estimate (Nei 1978). Both size andrepeat motif are based on that detected in the original sequenced clone (GenBank Accession nos: AF286384–93)
Locus Primer Sequences (5′–3′) Repeat motif Ta (°C) No. alleles Size (bp) HO HE
RlCA1 AAATGCAAGCGTCCCAATAC (CA)16 58 10 110 0.20 0.832GGACGCAGTTTCTGGATTTG
RlCA5 CTTCCACTTTGCCCATCAAG (CA)17 58 6 250 0.52 0.678ATGTGTCGGCAGCTATGTTC
RlCA18 CTCTGCTCCCTCAGCTATGC (CA)22 57 5 177 0.48 0.573AAAAAGTGGTCCTTTCATTTTGAG
RlCA19 GTCTGTCCGTGTGCAGAGAG (CA)15 57 2 129 0.52 0.490CAAGTGATTGAGAGCCTCAGC
RlCA1b5 CCCAGTGACAGTGAGTACCG (CA)17 58 3* 145 0.56 0.476CCCAACTGGAGGACCAAAAG
RlCA1b17 TAAACCTTAAAAGTGGTTATAAAAACC (A)8(CAAA)2(CA)16 57 8 134 0.44 0.742GTAAGTGTTAGGGATGCTGAGG
RlCA1b20 GGGCAGGTATTGTACTCAATATCAC (CA)8(C)13 57 4 87 0.72 0.506CAACACAAGGACTCCACTGC
RlCA2a49 TGTCCACATTAAGGAACTTTTGC (C)8(A)2(CA)15CG(CA)4 57 5 200 0.48 0.710TTCAGAGATCAGGGGTCTCC
RlCA1b27 GTAAGTGTTAGGGATGCTGAGG (CA)15(CAAA)3(A)5 58 6 134 0.48 0.644TAAACCTTAAAAGTGGTTATAAAAAGG
RlCA31 GAAGCTTAAACCACTTGACCAAC (C)4A(C)5GACAAA 58 3 98 0.44 0.640TCCCTTTTTCAGGTCTTTGG CATA(CA)6TA(CA)5
*Third allele detected at this locus only amplifies in R. esculenta and is not included in enumerations of HO, and calculations of HE and homozygote excess (see text for last).
MEC1053.fm Page 2175 Wednesday, November 15, 2000 8:58 AM
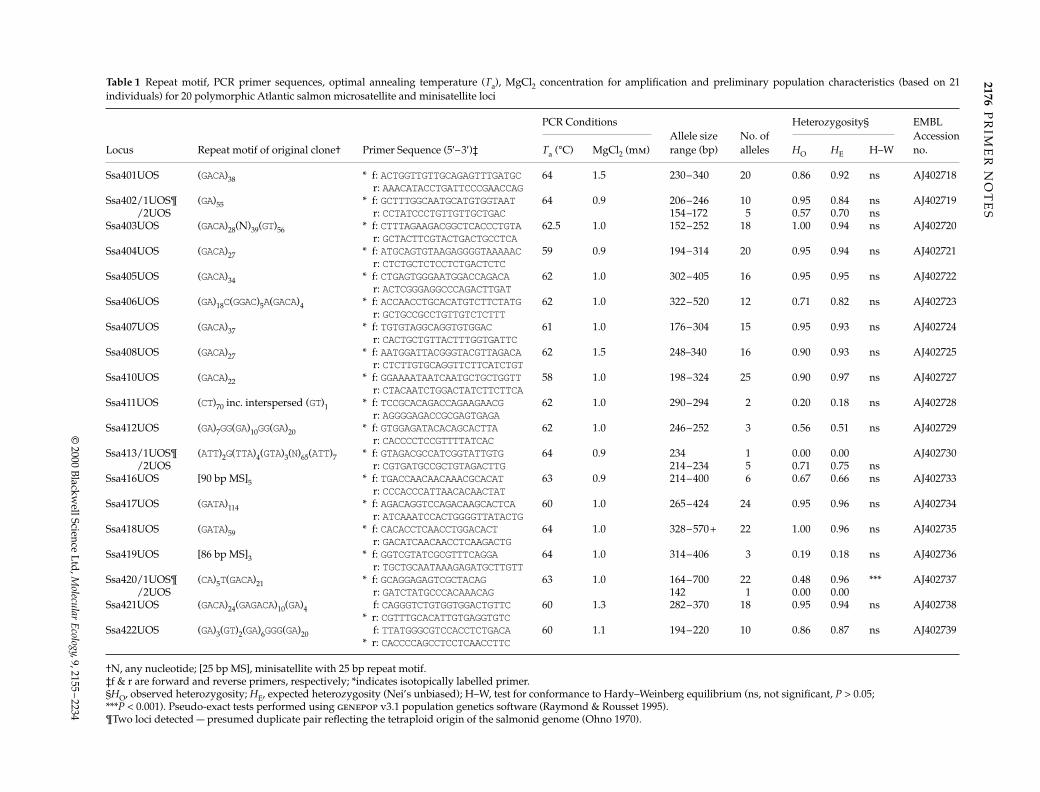
2176P
RIM
ER
NO
TE
S
© 2000 B
lackwell Science L
td, M
olecular Ecology, 9, 2155–2234
Table 1 Repeat motif, PCR primer sequences, optimal annealing temperature (Ta), MgCl2 concentration for amplification and preliminary population characteristics (based on 21individuals) for 20 polymorphic Atlantic salmon microsatellite and minisatellite loci
Locus Repeat motif of original clone† Primer Sequence (5′–3′)‡
PCR ConditionsAllele size range (bp)
No. of alleles
Heterozygosity§ EMBL Accession no.Ta (°C) MgCl2 (mm) HO HE H–W
Ssa401UOS (GACA)38 * f: ACTGGTTGTTGCAGAGTTTGATGC64 1.5 230–340 20 0.86 0.92 ns AJ402718r: AAACATACCTGATTCCCGAACCAG
Ssa402/1UOS¶ (GA)55 * f: GCTTTGGCAATGCATGTGGTAAT 64 0.9 206–246 10 0.95 0.84 ns AJ402719 /2UOS r: CCTATCCCTGTTGTTGCTGAC 154–172 5 0.57 0.70 ns
Ssa403UOS (GACA)28(N)39(GT)56 * f: CTTTAGAAGACGGCTCACCCTGTA62.5 1.0 152–252 18 1.00 0.94 ns AJ402720r: GCTACTTCGTACTGACTGCCTCA
Ssa404UOS (GACA)27 * f: ATGCAGTGTAAGAGGGGTAAAAAC59 0.9 194–314 20 0.95 0.94 ns AJ402721r: CTCTGCTCTCCTCTGACTCTC
Ssa405UOS (GACA)34 * f: CTGAGTGGGAATGGACCAGACA 62 1.0 302–405 16 0.95 0.95 ns AJ402722r: ACTCGGGAGGCCCAGACTTGAT
Ssa406UOS (GA)18C(GGAC)5A(GACA)4 * f: ACCAACCTGCACATGTCTTCTATG62 1.0 322–520 12 0.71 0.82 ns AJ402723r: GCTGCCGCCTGTTGTCTCTTT
Ssa407UOS (GACA)37 * f: TGTGTAGGCAGGTGTGGAC 61 1.0 176–304 15 0.95 0.93 ns AJ402724r: CACTGCTGTTACTTTGGTGATTC
Ssa408UOS (GACA)27 * f: AATGGATTACGGGTACGTTAGACA62 1.5 248–340 16 0.90 0.93 ns AJ402725r: CTCTTGTGCAGGTTCTTCATCTGT
Ssa410UOS (GACA)22 * f: GGAAAATAATCAATGCTGCTGGTT58 1.0 198–324 25 0.90 0.97 ns AJ402727r: CTACAATCTGGACTATCTTCTTCA
Ssa411UOS (CT)70 inc. interspersed (GT)1 * f: TCCGCACAGACCAGAAGAACG 62 1.0 290–294 2 0.20 0.18 ns AJ402728r: AGGGGAGACCGCGAGTGAGA
Ssa412UOS (GA)7GG(GA)10GG(GA)20 * f: GTGGAGATACACAGCACTTA 62 1.0 246–252 3 0.56 0.51 ns AJ402729r: CACCCCTCCGTTTTATCAC
Ssa413/1UOS¶ (ATT)2G(TTA)4(GTA)3(N)65(ATT)7 * f: GTAGACGCCATCGGTATTGTG 64 0.9 234 1 0.00 0.00 AJ402730 /2UOS r: CGTGATGCCGCTGTAGACTTG 214–234 5 0.71 0.75 ns
Ssa416UOS [90 bp MS]5 * f: TGACCAACAACAAACGCACAT 63 0.9 214–400 6 0.67 0.66 ns AJ402733r: CCCACCCATTAACACAACTAT
Ssa417UOS (GATA)114 * f: AGACAGGTCCAGACAAGCACTCA60 1.0 265–424 24 0.95 0.96 ns AJ402734r: ATCAAATCCACTGGGGTTATACTG
Ssa418UOS (GATA)59 * f: CACACCTCAACCTGGACACT 64 1.0 328–570+ 22 1.00 0.96 ns AJ402735r: GACATCAACAACCTCAAGACTG
Ssa419UOS [86 bp MS]3 * f: GGTCGTATCGCGTTTCAGGA 64 1.0 314–406 3 0.19 0.18 ns AJ402736r: TGCTGCAATAAAGAGATGCTTGTT
Ssa420/1UOS¶ (CA)5T(GACA)21 * f: GCAGGAGAGTCGCTACAG 63 1.0 164–700 22 0.48 0.96 *** AJ402737 /2UOS r: GATCTATGCCCACAAACAG 142 1 0.00 0.00
Ssa421UOS (GACA)24(GAGACA)10(GA)4 f: CAGGGTCTGTGGTGGACTGTTC 60 1.3 282–370 18 0.95 0.94 ns AJ402738* r: CGTTTGCACATTGTGAGGTGTC
Ssa422UOS (GA)3(GT)2(GA)6GGG(GA)20 f: TTATGGGCGTCCACCTCTGACA 60 1.1 194–220 10 0.86 0.87 ns AJ402739* r: CACCCCAGCCTCCTCAACCTTC
†N, any nucleotide; [25 bp MS], minisatellite with 25 bp repeat motif. ‡f & r are forward and reverse primers, respectively; *indicates isotopically labelled primer.§HO, observed heterozygosity; HE, expected heterozygosity (Nei’s unbiased); H–W, test for conformance to Hardy–Weinberg equilibrium (ns, not significant, P > 0.05; ***P < 0.001). Pseudo-exact tests performed using genepop v3.1 population genetics software (Raymond & Rousset 1995).¶Two loci detected — presumed duplicate pair reflecting the tetraploid origin of the salmonid genome (Ohno 1970).
ME
C1053.fm
Page 2176 W
ednesday, Novem
ber 15, 2000 8:58 AM

P R I M E R N O T E S 2177
© 2000 Blackwell Science Ltd, Molecular Ecology, 9, 2155–2234
sequences bound to streptavidin-coated magnetic particlesas the basis for enrichment. The libraries were constructedusing dephosphorylated pBluescript II KS(–) phagemidvector (BamHI or EcoRV digested), Epicurian Coli XL2-Blueultracompetent host cells (Stratagene) and size selected(≈200–500 bp) restriction-digested Atlantic salmon genomicDNA. One library was constructed using MboI digestedDNA fragments which was enriched for (GACA)n sequences.Additional libraries were made using blunt-ended restrictiondigested DNA (pooled from separate AluI, HaeIII and RsaIdigests). These libraries were potentially enriched for (GACA)n,(GATA)n, (TAA)n, and (AAGG)n motifs. Microsatellite con-taining recombinant clones were identified by ordered arrayscreening of the libraries (Armour et al. 1994). RecombinantDNA was fixed onto Hybond-N membrane (Amersham) andhybridized with isotopically [γ32P]-ATP end-labelled targetoligonucleotide [(TAA)6, (GACA)4, (GATA)4 or (AAGG)4]. Hybrid-ization was performed overnight in 6× SSC (20× SSC is 3 mNaCl, 0.3 m Na3 citrate, pH 7.0), 0.1% SDS (sodium dodecylsulphate), 42 °C with subsequent washes to a stringency of5× SSC, 0.1% SDS, 42 °C for 30 min. Following autoradio-graphy, clones exhibiting strong signal were sequenced (ABIPRISM Dye Primer Cycle Sequencing Ready Reaction Kit andABI 377 mediated automated detection) and, where possible,appropriate polymerase chain reaction (PCR) primers weredesigned (assisted by Primer Select software, DNASTAR Inc.).
Characterization of primer sets involved both nonisotopicand isotopic screening. Atlantic salmon DNA was extractedfrom liver tissue by a rapid phenol-based method (Taggartet al. 1992). Common components in both assays (10 µL final
volume) were: 50 ng template DNA, 50 mm KCl, 10 mm Tris-HCl pH 9.0, 0.1% Triton X-100, 0.9–1.5 mm MgCl2, 130 µm eachnucleotide and 0.5 U Taq DNA polymerase (Promega). Fornonisotopic PCRs 1 µm of each primer was included. For isotopicassays 0.1 µm of each primer was added with 10% of oneprimer being end-labelled with [γ32P]-ATP (4500 Ci/mMol).Cycling parameters, using a Hybaid TouchDown thermocycler,were: 96 °C for 3 min, four cycles of 95 °C for 50 s, xx °C anneal-ing for 50 s, 72 °C for 50 s and n cycles of 94 °C for 50 s, xx °Cannealing for 50 s, 72 °C for 50 s, where xx is locus specificannealing temperature (Table 1) and n = 28 for nonisotopicor 25 for isotopic reactions. Non-isotopic products were resolvedon ethidium bromide stained 1.4% agarose gels while isotopicproducts were separated on 50 cm long denaturing polyacry-lamide gels (SequaGel XR; National Diagnostics) followed byautoradiography. Allele sizes were determined relative topBluescript II KS(–) sequence reactions run on each gel.
Level of variability at each identified locus was assessed in21 wild adult salmon. Polymorphic loci were also screened intwo Atlantic salmon families (each consisting of two parents+46 progeny). Cross-species amplification was assessed inseven other salmonid species (Table 2). Two individuals of eachspecies were screened (nonisotopically) using two differentannealing temperatures (1 °C and 4 °C below optimum forAtlantic salmon) and 1.5 mm MgCl2. Additionally four browntrout (Salmo trutta) and two rainbow trout (Oncorhynchus mykiss)were screened for polymorphism using identical isotopicconditions to those employed for Atlantic salmon.
Of 164 clones sequenced, 144 had identifiable repeat motifs.While most (87%) were the expected target repeats both
Table 2 Cross amplification of 19 Atlantic salmon derived primer sets in seven other salmonid species, as determined by agarose gelelectrophoresis. + or (+) indicates detection of a discrete fragment of appropriate size at 1 °C or 5 °C below Atlantic salmon optimumannealing temperature, respectively; – indicates absence or smeared product. Additionally, P indicates polymorphism confirmed byisotopic screening (Salmo trutta and Oncorhynchus mykiss individuals only); see text for details
Primer setSalmo trutta
Oncorhynchus mykiss
Oncorhynchus clarki
Oncorhynchus nerka
Salvelinus alpinus
Coregonus lavaretus
Thymallus thymallus
Ssa401UOS (+) – – – – – –Ssa402UOS + P + P + + + + +Ssa403UOS + P + P + – + + –Ssa404UOS + – – – + – –Ssa405UOS + + + – + – –Ssa406UOS + P + + + + + +Ssa407UOS + P + P + + + – +Ssa408UOS + P + P + + + + (+)Ssa410UOS + P + P + + + + –Ssa411UOS – – – – – – –Ssa412UOS + + + + + + –Ssa413UOS + P + P + (+) + + (+)Ssa416UOS + P + + – + – –Ssa417UOS + P + P + + + + +Ssa418UOS + P* + P* + + + + +Ssa419UOS + P – + (+) + – –Ssa420UOS + P – + (+) + + –Ssa421UOS – – – – – – –Ssa422UOS + P (+) + – + + +
*Two loci detected.
MEC1053.fm Page 2177 Wednesday, November 15, 2000 8:58 AM
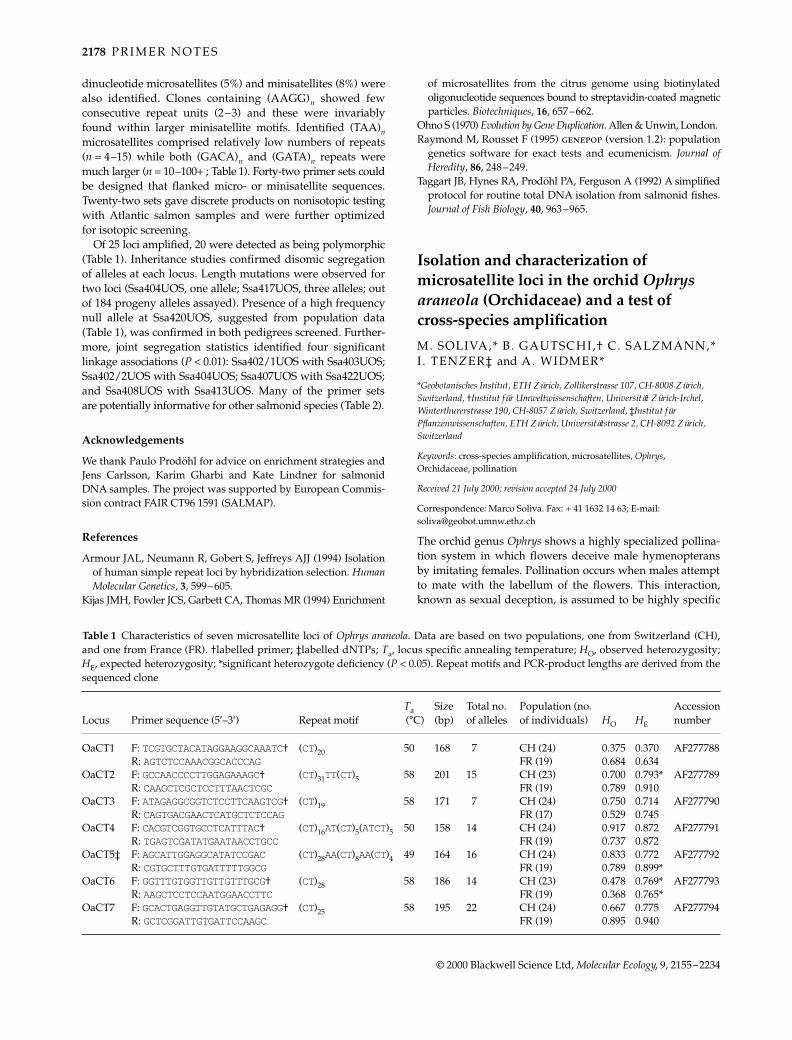
2178 P R I M E R N O T E S
© 2000 Blackwell Science Ltd, Molecular Ecology, 9, 2155–2234
dinucleotide microsatellites (5%) and minisatellites (8%) werealso identified. Clones containing (AAGG)n showed fewconsecutive repeat units (2–3) and these were invariablyfound within larger minisatellite motifs. Identified (TAA)nmicrosatellites comprised relatively low numbers of repeats(n = 4–15) while both (GACA)n and (GATA)n repeats weremuch larger (n = 10–100+ ; Table 1). Forty-two primer sets couldbe designed that flanked micro- or minisatellite sequences.Twenty-two sets gave discrete products on nonisotopic testingwith Atlantic salmon samples and were further optimizedfor isotopic screening.
Of 25 loci amplified, 20 were detected as being polymorphic(Table 1). Inheritance studies confirmed disomic segregationof alleles at each locus. Length mutations were observed fortwo loci (Ssa404UOS, one allele; Ssa417UOS, three alleles; outof 184 progeny alleles assayed). Presence of a high frequencynull allele at Ssa420UOS, suggested from population data(Table 1), was confirmed in both pedigrees screened. Further-more, joint segregation statistics identified four significantlinkage associations (P < 0.01): Ssa402/1UOS with Ssa403UOS;Ssa402/2UOS with Ssa404UOS; Ssa407UOS with Ssa422UOS;and Ssa408UOS with Ssa413UOS. Many of the primer setsare potentially informative for other salmonid species (Table 2).
Acknowledgements
We thank Paulo Prodöhl for advice on enrichment strategies andJens Carlsson, Karim Gharbi and Kate Lindner for salmonidDNA samples. The project was supported by European Commis-sion contract FAIR CT96 1591 (SALMAP).
References
Armour JAL, Neumann R, Gobert S, Jeffreys AJJ (1994) Isolationof human simple repeat loci by hybridization selection. HumanMolecular Genetics, 3, 599–605.
Kijas JMH, Fowler JCS, Garbett CA, Thomas MR (1994) Enrichment
of microsatellites from the citrus genome using biotinylatedoligonucleotide sequences bound to streptavidin-coated magneticparticles. Biotechniques, 16, 657–662.
Ohno S (1970) Evolution by Gene Duplication. Allen & Unwin, London.Raymond M, Rousset F (1995) genepop (version 1.2): population
genetics software for exact tests and ecumenicism. Journal ofHeredity, 86, 248–249.
Taggart JB, Hynes RA, Prodöhl PA, Ferguson A (1992) A simplifiedprotocol for routine total DNA isolation from salmonid fishes.Journal of Fish Biology, 40, 963–965.
91220001131PRIMER NOTEsPRIMER NOTEsPRIMER NOTEs100Graphicraft Limited, Hong Kong
Isolation and characterization of microsatellite loci in the orchid Ophrys araneola (Orchidaceae) and a test of cross-species amplification
M. SOLIVA,* B. GAUTSCHI,† C. SALZMANN,* I . TENZER‡ and A. WIDMER*
*Geobotanisches Institut, ETH Zürich, Zollikerstrasse 107, CH-8008 Zürich, Switzerland, †Institut für Umweltwissenschaften, Universität Zürich-Irchel, Winterthurerstrasse 190, CH-8057 Zürich, Switzerland, ‡Institut für Pflanzenwissenschaften, ETH Zürich, Universitätstrasse 2, CH-8092 Zürich, Switzerland
Keywords: cross-species amplification, microsatellites, Ophrys, Orchidaceae, pollination
Received 21 July 2000; revision accepted 24 July 2000
Correspondence: Marco Soliva. Fax: + 41 1632 14 63; E-mail: [email protected]
The orchid genus Ophrys shows a highly specialized pollina-tion system in which flowers deceive male hymenopteransby imitating females. Pollination occurs when males attemptto mate with the labellum of the flowers. This interaction,known as sexual deception, is assumed to be highly specific
Table 1 Characteristics of seven microsatellite loci of Ophrys araneola. Data are based on two populations, one from Switzerland (CH),and one from France (FR). †labelled primer; ‡labelled dNTPs; Ta, locus specific annealing temperature; HO, observed heterozygosity;HE, expected heterozygosity; *significant heterozygote deficiency (P < 0.05). Repeat motifs and PCR-product lengths are derived from thesequenced clone
Locus Primer sequence (5′–3′) Repeat motifTa
(°C)Size (bp)
Total no. of alleles
Population (no.of individuals) HO HE
Accession number
OaCT1 F: TCGTGCTACATAGGAAGGCAAATC† (CT)20 50 168 7 CH (24) 0.375 0.370 AF277788R: AGTCTCCAAACGGCACCCAG FR (19) 0.684 0.634
OaCT2 F: GCCAACCCCTTGGAGAAAGC† (CT)31TT(CT)5 58 201 15 CH (23) 0.700 0.793* AF277789R: CAAGCTCGCTCCTTTAACTCGC FR (19) 0.789 0.910
OaCT3 F: ATAGAGGCGGTCTCCTTCAAGTCG† (CT)19 58 171 7 CH (24) 0.750 0.714 AF277790R: CAGTGACGAACTCATGCTCTCCAG FR (17) 0.529 0.745
OaCT4 F: CACGTCGGTGCCTCATTTAC† (CT)16AT(CT)5(ATCT)5 50 158 14 CH (24) 0.917 0.872 AF277791R: TGAGTCGATATGAATAACCTGCC FR (19) 0.737 0.872
OaCT5‡ F: AGCATTGGAGGCATATCCGAC (CT)28AA(CT)8AA(CT)4 49 164 16 CH (24) 0.833 0.772 AF277792R: CGTGCTTTGTGATTTTTGGCG FR (19) 0.789 0.899*
OaCT6 F: GGTTTGTGGTTGTTGTTTGCG† (CT)28 58 186 14 CH (23) 0.478 0.769* AF277793R: AAGCTCCTCCAATGGAACCTTC FR (19) 0.368 0.765*
OaCT7 F: GCACTGAGGTTGTATGCTGAGAGG† (CT)25 58 195 22 CH (24) 0.667 0.775 AF277794R: GCTCGGATTGTGATTCCAAGC FR (19) 0.895 0.940
MEC1053.fm Page 2178 Wednesday, November 15, 2000 8:58 AM

P R I M E R N O T E S 2179
© 2000 Blackwell Science Ltd, Molecular Ecology, 9, 2155–2234
due to the imitation of sexual pheromones (Schiestl et al. 1999).To study the influence of this specialized pollination systemon genetic population structure and to estimate gene flowamong morphologically similar, coflowering Ophrys specieswith presumably different pollinators, variable and codominantgenetic markers are needed. We, therefore, isolated and char-acterized microsatellite loci from Ophrys araneola and testedtheir variability in two O. araneola populations. Furthermore,we assessed whether these loci can be amplified in otherOphrys species.
Genomic DNA was extracted from leaf material storedin silica gel using the CTAB protocol (Doyle & Doyle 1990).Microsatellite loci were isolated and identified from a partialgenomic library enriched for GA/CT repeats, followingTenzer et al. (1999). Enriched DNA was ligated into pGEM®-Tvector and cloned using JM109 high efficiency competent cells(Promega). The 672 colonies with inserts were blotted ontonylon filters (Hybond-N+, Amersham Pharmacia Biotech) andscreened for GA/CT repeats using the ECL 3′-oligolabellingand detection systems (Amersham Pharmacia Biotech).Plasmid DNA of 74 positive clones was purified with theGFXTM Micro Plasmid Prep Kit (Amersham Pharmacia Biotech).Cycle-sequencing reactions were performed with BigDyeterminator chemistry (PE Biosystems) using the universalprimers pUC/M13 forward and pUC/M13 reverse, and runon an ABI Prism 310 Genetic Analyser. Microsatellite motifswere found in 51 clones. Primers annealing to flanking regionswere designed for 21 loci using MacVector™ 6.0 (OxfordMolecular LTD). Polymerase chain reactions (PCRs) wereperformed in 10 µL reaction volumes containing 4.5 µL ddH2O,10 mm Tris-HCl, 50 mm KCl, 0.4 µm of each forward andreverse primer, 200 µm of each dNTP, 0.5 U AmpliTaq Gold®DNA Polymerase (PE Biosystems), 1.5 mm MgCl2 and 10–50 ngof DNA. PCRs were run on a Perkin-Elmer GeneAmp PCRSystem 9700 thermocycler. An initial denaturation step (95 °C,10 min) was followed by 35 cycles of 30 s at 95 °C, 30 s at thelocus specific annealing temperature (see Table 1), 30 s at72 °C; a final extension step for 5 min at 72 °C was performedat the end. Products were visualized on an ABI PRISM310 Genetic Analyser (PE Biosystems) using either labelledprimers or labelled nucleotides (Table 1). Allele sizes werescored against the internal GeneScan-500 (ROX) sizestandard (PE Biosystems) and individuals were genotypedusing GeneScan Analysis® 3.1 and Genotyper® 2.1 software(PE Biosystems). Seven out of 21 primer pairs amplifiedfragments of the expected size.
Levels of variability detected at these seven loci are high,with numbers of alleles ranging from 7–22 and observed hetero-zygosities ranging from 37–92% (Table 1). Using genepop 3.1c(Rousset & Raymond 1995) we found a significant heterozygotedeficiency (P < 0.01) for loci OaCT2 and OaCT6 in the SwissO. araneola population, and for OaCT5 and OaCT6 in theFrench population. Loci OaCT1 and OaCT7 exhibit significantlinkage disequilibrium across both populations (P < 0.01).
We tested for cross-species amplification of O. araneola primerswith six other Ophrys species of increasing phylogeneticdistance to O. araneola (M. Soliva et al., unpublished results),using two individuals per species. PCR conditions were thesame as described above. Qualities of PCR products wereclassified according to Smulders et al. (1997). Amplificationproducts of qualities 1–3 were regarded as successful cross-species amplifications, whereas products of qualities 4 and 5were treated as failure. Microsatellite loci were successfullycross-amplified with Ophrys aveyronensis, partially withO. sphegodes, O. fuciflora, O. insectifera, and O. tenthrediniferaand failed to cross-amplify with the more distantly relatedO. lutea (Table 2).
Acknowledgements
The authors thank Susanne Graf and Elke Karaus for technicalassistance. This study was supported by Swiss Federal Instituteof Technology (ETH) internal grants (no. 0–20–477–98 and no.0–20–600–99).
References
Doyle JJ, Doyle JL (1990) Isolation of plant DNA from freshtissue. Focus, 12, 13–15.
Rousset F, Raymond M (1995) genepop (version 1.2): populationgenetics software for exact tests and ecumenicism. Journal ofHeredity, 86, 248–249.
Schiestl FP, Ayasse M, Paulus HFL, Löfstedt C, Hansson BS,Ibarra F, Francke W (1999) Orchid pollination by sexual swindle.Nature, 399, 421–422.
Smulders MJM, Bredemeijer G, Rus-Kortekaas W, Arens P,Vosman B (1997) Use of short microsatellites from databasesequences to generate polymorphisms among Lycopersiconesculentum cultivars and accessions of other Lycopersiconspecies. Theoretical and Applied Genetics, 97, 264–272.
Tenzer I, degli Ivanissevich S, Morgante M, Gessler C (1999) Identi-fication of microsatellite markers and their application to popu-lation genetics of Venturia inaequalis. Phytopathology, 89, 748–753.
91220001133primer notesprimer notesPRIMER NOTEs0000Graphicraft Limited, Hong Kong
Species
Locus
OaCT1 OaCT2 OaCT3 OaCT4 OaCT5 OaCT6 OaCT7
Ophrys aveyronensis + + + + + + +Ophrys fuciflora + + – + + + +Ophrys insectifera + + – + + – +Ophrys lutea – – – – – – –Ophrys sphegodes – + + + + + +Ophrys tenthredinifera – + – – – + +
Table 2 Cross-species amplification withOphrys araneola microsatellite primers. +,successful amplification (qualities 1–3 ofSmulders et al. 1997); –, no amplification(qualities 4 and 5 of Smulders et al. (1997)
MEC1053.fm Page 2179 Wednesday, November 15, 2000 8:58 AM
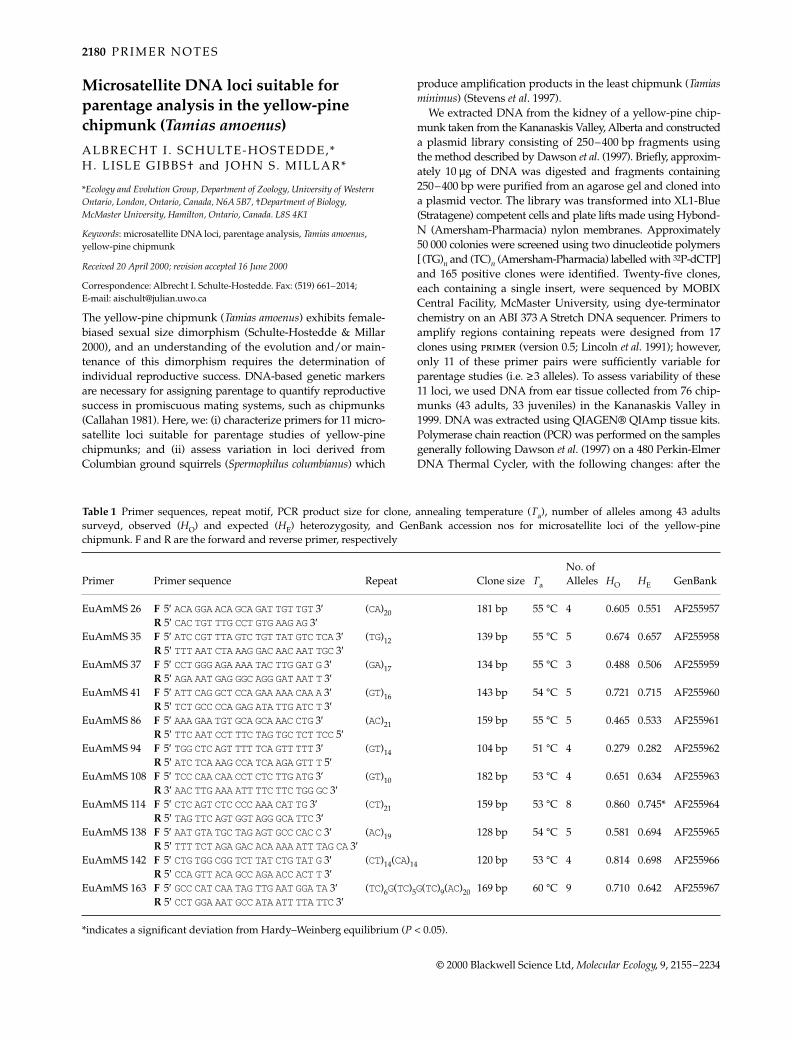
2180 P R I M E R N O T E S
© 2000 Blackwell Science Ltd, Molecular Ecology, 9, 2155–2234
Microsatellite DNA loci suitable for parentage analysis in the yellow-pine chipmunk (Tamias amoenus)ALBRECHT I . SCHULTE-HOSTEDDE,* H. LISLE GIBBS† and JOHN S . MILLAR*
*Ecology and Evolution Group, Department of Zoology, University of Western Ontario, London, Ontario, Canada, N6A 5B7, †Department of Biology, McMaster University, Hamilton, Ontario, Canada. L8S 4K1
Keywords: microsatellite DNA loci, parentage analysis, Tamias amoenus, yellow-pine chipmunk
Received 20 April 2000; revision accepted 16 June 2000
Correspondence: Albrecht I. Schulte-Hostedde. Fax: (519) 661–2014; E-mail: [email protected]
The yellow-pine chipmunk (Tamias amoenus) exhibits female-biased sexual size dimorphism (Schulte-Hostedde & Millar2000), and an understanding of the evolution and/or main-tenance of this dimorphism requires the determination ofindividual reproductive success. DNA-based genetic markersare necessary for assigning parentage to quantify reproductivesuccess in promiscuous mating systems, such as chipmunks(Callahan 1981). Here, we: (i) characterize primers for 11 micro-satellite loci suitable for parentage studies of yellow-pinechipmunks; and (ii) assess variation in loci derived fromColumbian ground squirrels (Spermophilus columbianus) which
produce amplification products in the least chipmunk (Tamiasminimus) (Stevens et al. 1997).
We extracted DNA from the kidney of a yellow-pine chip-munk taken from the Kananaskis Valley, Alberta and constructeda plasmid library consisting of 250–400 bp fragments usingthe method described by Dawson et al. (1997). Briefly, approxim-ately 10 µg of DNA was digested and fragments containing250–400 bp were purified from an agarose gel and cloned intoa plasmid vector. The library was transformed into XL1-Blue(Stratagene) competent cells and plate lifts made using Hybond-N (Amersham-Pharmacia) nylon membranes. Approximately50 000 colonies were screened using two dinucleotide polymers[(TG)n and (TC)n (Amersham-Pharmacia) labelled with 32P-dCTP]and 165 positive clones were identified. Twenty-five clones,each containing a single insert, were sequenced by MOBIXCentral Facility, McMaster University, using dye-terminatorchemistry on an ABI 373 A Stretch DNA sequencer. Primers toamplify regions containing repeats were designed from 17clones using primer (version 0.5; Lincoln et al. 1991); however,only 11 of these primer pairs were sufficiently variable forparentage studies (i.e. ≥3 alleles). To assess variability of these11 loci, we used DNA from ear tissue collected from 76 chip-munks (43 adults, 33 juveniles) in the Kananaskis Valley in1999. DNA was extracted using QIAGEN® QIAmp tissue kits.Polymerase chain reaction (PCR) was performed on the samplesgenerally following Dawson et al. (1997) on a 480 Perkin-ElmerDNA Thermal Cycler, with the following changes: after the
Table 1 Primer sequences, repeat motif, PCR product size for clone, annealing temperature (Ta), number of alleles among 43 adultssurveyd, observed (HO) and expected (HE) heterozygosity, and GenBank accession nos for microsatellite loci of the yellow-pinechipmunk. F and R are the forward and reverse primer, respectively
Primer Primer sequence Repeat Clone size Ta
No. of Alleles HO HE GenBank
EuAmMS 26 F 5′ ACA GGA ACA GCA GAT TGT TGT 3′ (CA)20 181 bp 55 °C 4 0.605 0.551 AF255957R 5′ CAC TGT TTG CCT GTG AAG AG 3′
EuAmMS 35 F 5′ ATC CGT TTA GTC TGT TAT GTC TCA 3′ (TG)12 139 bp 55 °C 5 0.674 0.657 AF255958R 5′ TTT AAT CTA AAG GAC AAC AAT TGC 3′
EuAmMS 37 F 5′ CCT GGG AGA AAA TAC TTG GAT G 3′ (GA)17 134 bp 55 °C 3 0.488 0.506 AF255959R 5′ AGA AAT GAG GGC AGG GAT AAT T 3′
EuAmMS 41 F 5′ ATT CAG GCT CCA GAA AAA CAA A 3′ (GT)16 143 bp 54 °C 5 0.721 0.715 AF255960R 5′ TCT GCC CCA GAG ATA TTG ATC T 3′
EuAmMS 86 F 5′ AAA GAA TGT GCA GCA AAC CTG 3′ (AC)21 159 bp 55 °C 5 0.465 0.533 AF255961R 5′ TTC AAT CCT TTC TAG TGC TCT TCC 5′
EuAmMS 94 F 5′ TGG CTC AGT TTT TCA GTT TTT 3′ (GT)14 104 bp 51 °C 4 0.279 0.282 AF255962R 5′ ATC TCA AAG CCA TCA AGA GTT T 5′
EuAmMS 108 F 5′ TCC CAA CAA CCT CTC TTG ATG 3′ (GT)10 182 bp 53 °C 4 0.651 0.634 AF255963R 3′ AAC TTG AAA ATT TTC TTC TGG GC 3′
EuAmMS 114 F 5′ CTC AGT CTC CCC AAA CAT TG 3′ (CT)21 159 bp 53 °C 8 0.860 0.745* AF255964R 5′ TAG TTC AGT GGT AGG GCA TTC 3′
EuAmMS 138 F 5′ AAT GTA TGC TAG AGT GCC CAC C 3′ (AC)19 128 bp 54 °C 5 0.581 0.694 AF255965R 5′ TTT TCT AGA GAC ACA AAA ATT TAG CA 3′
EuAmMS 142 F 5′ CTG TGG CGG TCT TAT CTG TAT G 3′ (CT)14(CA)14 120 bp 53 °C 4 0.814 0.698 AF255966R 5′ CCA GTT ACA GCC AGA ACC ACT T 3′
EuAmMS 163 F 5′ GCC CAT CAA TAG TTG AAT GGA TA 3′ (TC)6G(TC)5G(TC)9(AC)20 169 bp 60 °C 9 0.710 0.642 AF255967R 5′ CCT GGA AAT GCC ATA ATT TTA TTC 3′
*indicates a significant deviation from Hardy–Weinberg equilibrium (P < 0.05).
MEC1053.fm Page 2180 Wednesday, November 15, 2000 8:58 AM

P R I M E R N O T E S 2181
© 2000 Blackwell Science Ltd, Molecular Ecology, 9, 2155–2234
initial denaturing step at 94 °C for 3 min, 32 PCR cycles wereperformed consisting of 45 s at 94 °C, 45 s at the appropriateannealing temperature, and 45 s at 72 °C. Amplification productswere resolved on polyacrylamide gels, as described in Dawsonet al. (1997) except gels were run at 70 W. PCR reactions (1 µLvolume) consisted of the following reagents; 2.5 mm of MgCl2(MBI Fermentas), PCR buffer [75 mm Tris-HCl (pH 8.8), 20 mm(NH4)2SO4, 0.01% Tween (MBI Fermentas)] 1 µg/µL BSA(Amersham-Pharmacia), 200 µm dNTP’s, 0.25 U Taq DNApolymerase (MBI Fermentas), 0.2 pmol of the forward primerlabelled with [γ-33P]-ATP (Amersham-Pharmacia), 0.3 pmol ofthe unlabelled forward primer, and 0.5 pmol unlabelled reverseprimer. Table 1 describes the primer sequence, size of cloneproduct, annealing temperature, and number of observed allelesfor each locus. We determined whether there were deviationsfrom Hardy–Weinberg equilibrium for each locus from adultchipmunks using genepop (Raymond & Rousset 1995). OnlyEuAmMS 114 was found to deviate from Hardy–Weinbergexpectation due to heterozygote excess (Table 1).
To assess the utility of these microsatellite loci for parentageanalysis, we used the likelihood-based approach and simula-tion procedures of cervus 1.0 (Marshall et al. 1998). Using thisprogram, we were able to assign maternity to all 33 juveniles(100%) with 80% confidence, 18 (54.5%) of these with 95%confidence. Using known maternity data, we were able toassign paternity to 30 juveniles (90.9%) with 80% confidence,20 (60.6%) of these with 95% confidence. The microsatelliteloci presented here provide adequate information to assessparentage in yellow-pine chipmunks.
We also attempted to amplify samples of yellow-pine chip-munk DNA using four primers which amplify DNA fromColumbian ground squirrels and least chipmunks (Loci: GS3,GS17, GS20, and GS34) (Stevens et al. 1997). Only two alleles wereobserved among samples from 22 chipmunks for GS22. At alow-stringency annealing temperature (50 °C) we found onlyGS20 to amplify, producing one allele. These primers were notconsidered to be appropriate for further parentage analysis.
Acknowledgements
We thank Liliana De Sousa for superb technical assistance. Thisstudy was supported by a grant-in-aid of research from the AmericanSociety of Mammalogists, and postgraduate scholarship from theNatural Sciences and Engineering Research Council of Canada(NSERC) to AISH, and NSERC operating grants to HLG and JSM.
References
Callahan JR (1981) Vocal solicitation and parental investment infemale Eutamias. American Naturalist, 118, 872–875.
Dawson RJG, Gibbs HL, Hobson KA, Yezerinac SM (1997)Isolation of microsatellite DNA markers from a passerinebird, Dendroica petechia (the yellow warbler), and their use inpopulation studies. Heredity, 79, 506–514.
Lincoln SE, Daly MJ, Lander ES (1991) Primer: A computer programfor automatically selecting PCR primers, Version 0.5. WhiteheadInstitute for Biomedical Research, Cambridge, MA.
Marshall TC, Slate J, Kruuk LEB, Pemberton JM (1998) Statisticalconfidence for likelihood-based paternity inference in naturalpopulations. Molecular Ecology, 7, 639–655.
Raymond M, Rousset F (1995) genepop (Version 1.2): a populationgenetics software for exact tests and ecumenicism. Journal ofHeredity, 86, 248–249.
Schulte-Hostedde AI, Millar JS (2000) Measuring sexual sizedimorphism in the yellow-pine chipmunk (Tamias amoenus).Canadian Journal of Zoology, 78, 728–733.
Stevens S, Coffin J, Strobeck C (1997) Microsatellite loci in Columbianground squirrels Spermophilus columbianus. Molecular Ecology,6, 493–495.
91220001132PRIMER NOTEsPRIMER NOTEsPRIMER NOTEs100Graphicraft Limited, Hong Kong
Polymorphic di-nucleotide microsatellite loci isolated from the humpback whale, Megaptera novaeangliaeMARTINE BÉRUBÉ,*† HANNE JØRGENSEN,† ROSS MCEWING* and PER J . PALSBØLL*†
*School of Biological Sciences, University of Wales, Deiniol Road, Bangor, Gwynedd LL57 2UW, UK, †Department of Evolutionary Biology, University of Copenhagen, Universitetsparken 15, DK-2100 Copenhagen Ø, Denmark
Keywords: baleen whale, kinship, Mysticeti, STR loci
Received 10 August 2000; revision accepted 11 August 2000
Correspondence: Martine Bérubé. School of Biological Sciences, University of Wales, Deiniol Road, Bangor, Gwynedd LL57 2UW, UK. Fax: +44 1248 38 28 25; E-mail: [email protected]
The study of cetaceans by genetic methods is moving increas-ingly towards the estimation of kinship among individualsusing genetic data. Microsatellite loci are ideal for this kindof study given their high mutation rates and co-dominantinheritance. However, a large number of loci need to begenotyped in order to ensure reliable estimation of kinship.Even for relatively small sample sizes, reliable identificationof parent–offspring pairs is likely to require more than 17 locigenotyped in each individual (Palsbøll 1999). Towards thisend, we isolated an additional nine polymorphic microsatelliteloci from genomic DNA of the humpback whale, Megapteranovaeangliae, which are presented here.
The loci originate from the same partial genomic libraryfrom which we previously presented tri- and tetra-nucleotidemicrosatellite loci (Palsbøll et al. 1997). In this paper, wepresent additional di-nucleotide loci identified among thepositive clones in the above-mentioned genomic library. Theisolation and sequencing of clones containing inserts hasbeen described previously (Palsbøll et al. 1997). The datapresented here are based upon genotypes obtained fromup to 353 individual humpback whales, 65 individual finwhales (Balaenoptera physalus), 169 individual minke whales(B. acutorostrata) and 92 individual blue whales (B. musculus).
Total-cell DNA was extracted from skin biopsies by stand-ard phenol and chloroform extractions (Sambrook et al. 1989)and the DNA re-suspended in 1 × TE (Sambrook et al. 1989).The nucleotide sequence at each locus was amplified bypolymerase chain reaction (PCR) (Mullis & Faloona 1987)using 10 µL reaction volumes, each containing 10 ng of genomicDNA, 67 mm Tris–HCl, pH 8.8, 2 mm MgCl2, 16.6 mm (NH4)2SO4,10 mm β-mercaptoethanol, 0.2 mm dNTPs, 1 mm unlabelledoligo-nucleotide primer, 40 µm end-labelled oligo-nucleotide
MEC1053.fm Page 2181 Wednesday, November 15, 2000 8:58 AM
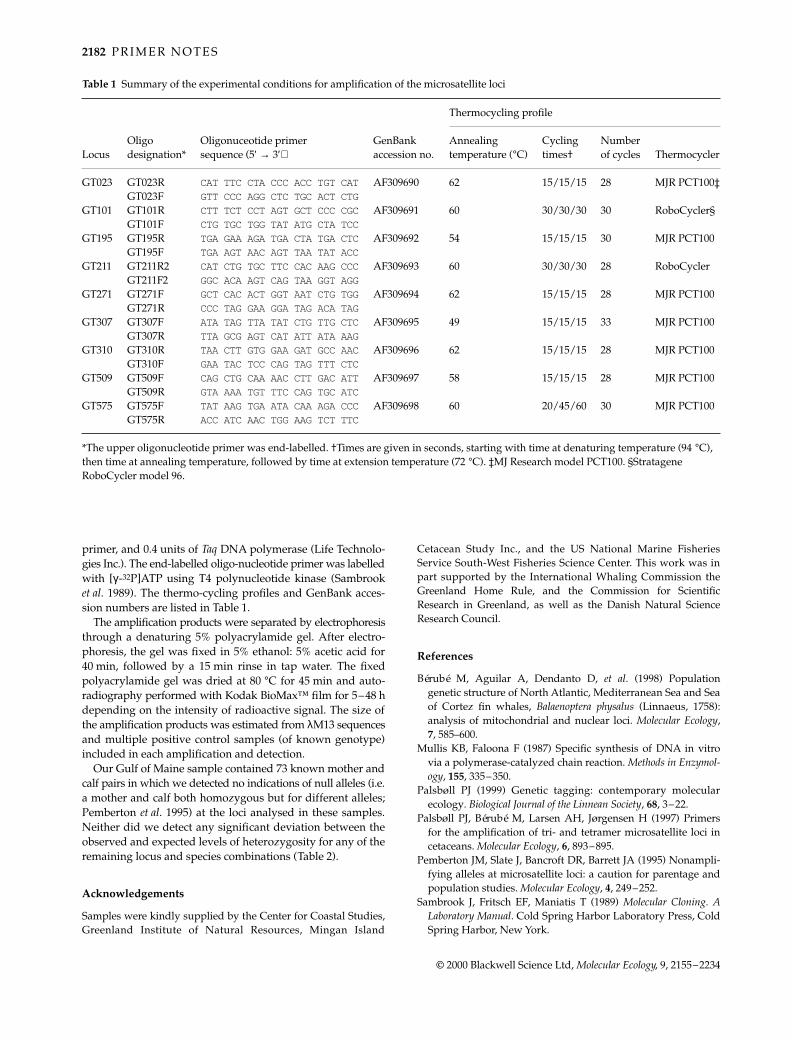
2182 P R I M E R N O T E S
© 2000 Blackwell Science Ltd, Molecular Ecology, 9, 2155–2234
primer, and 0.4 units of Taq DNA polymerase (Life Technolo-gies Inc.). The end-labelled oligo-nucleotide primer was labelledwith [γ-32P]ATP using T4 polynucleotide kinase (Sambrooket al. 1989). The thermo-cycling profiles and GenBank acces-sion numbers are listed in Table 1.
The amplification products were separated by electrophoresisthrough a denaturing 5% polyacrylamide gel. After electro-phoresis, the gel was fixed in 5% ethanol: 5% acetic acid for40 min, followed by a 15 min rinse in tap water. The fixedpolyacrylamide gel was dried at 80 °C for 45 min and auto-radiography performed with Kodak BioMax™ film for 5–48 hdepending on the intensity of radioactive signal. The size ofthe amplification products was estimated from λM13 sequencesand multiple positive control samples (of known genotype)included in each amplification and detection.
Our Gulf of Maine sample contained 73 known mother andcalf pairs in which we detected no indications of null alleles (i.e.a mother and calf both homozygous but for different alleles;Pemberton et al. 1995) at the loci analysed in these samples.Neither did we detect any significant deviation between theobserved and expected levels of heterozygosity for any of theremaining locus and species combinations (Table 2).
Acknowledgements
Samples were kindly supplied by the Center for Coastal Studies,Greenland Institute of Natural Resources, Mingan Island
Cetacean Study Inc., and the US National Marine FisheriesService South-West Fisheries Science Center. This work was inpart supported by the International Whaling Commission theGreenland Home Rule, and the Commission for ScientificResearch in Greenland, as well as the Danish Natural ScienceResearch Council.
References
Bérubé M, Aguilar A, Dendanto D, et al. (1998) Populationgenetic structure of North Atlantic, Mediterranean Sea and Seaof Cortez fin whales, Balaenoptera physalus (Linnaeus, 1758):analysis of mitochondrial and nuclear loci. Molecular Ecology,7, 585–600.
Mullis KB, Faloona F (1987) Specific synthesis of DNA in vitrovia a polymerase-catalyzed chain reaction. Methods in Enzymol-ogy, 155, 335–350.
Palsbøll PJ (1999) Genetic tagging: contemporary molecularecology. Biological Journal of the Linnean Society, 68, 3–22.
Palsbøll PJ, Bérubé M, Larsen AH, Jørgensen H (1997) Primersfor the amplification of tri- and tetramer microsatellite loci incetaceans. Molecular Ecology, 6, 893–895.
Pemberton JM, Slate J, Bancroft DR, Barrett JA (1995) Nonampli-fying alleles at microsatellite loci: a caution for parentage andpopulation studies. Molecular Ecology, 4, 249–252.
Sambrook J, Fritsch EF, Maniatis T (1989) Molecular Cloning. ALaboratory Manual. Cold Spring Harbor Laboratory Press, ColdSpring Harbor, New York.
91220001137PRIMER NOTEsPRIMER NOTEsPRIMER NOTEs1000Graphicraft Limited, Hong Kong
Table 1 Summary of the experimental conditions for amplification of the microsatellite loci
LocusOligo designation*
Oligonuceotide primer sequence (5′ → 3′)
GenBank accession no.
Thermocycling profile
Annealing temperature (°C)
Cycling times†
Number of cycles Thermocycler
GT023 GT023R CAT TTC CTA CCC ACC TGT CAT AF309690 62 15/15/15 28 MJR PCT100‡GT023F GTT CCC AGG CTC TGC ACT CTG
GT101 GT101R CTT TCT CCT AGT GCT CCC CGC AF309691 60 30/30/30 30 RoboCycler§GT101F CTG TGC TGG TAT ATG CTA TCC
GT195 GT195R TGA GAA AGA TGA CTA TGA CTC AF309692 54 15/15/15 30 MJR PCT100GT195F TGA AGT AAC AGT TAA TAT ACC
GT211 GT211R2 CAT CTG TGC TTC CAC AAG CCC AF309693 60 30/30/30 28 RoboCyclerGT211F2 GGC ACA AGT CAG TAA GGT AGG
GT271 GT271F GCT CAC ACT GGT AAT CTG TGG AF309694 62 15/15/15 28 MJR PCT100GT271R CCC TAG GAA GGA TAG ACA TAG
GT307 GT307F ATA TAG TTA TAT CTG TTG CTC AF309695 49 15/15/15 33 MJR PCT100GT307R TTA GCG AGT CAT ATT ATA AAG
GT310 GT310R TAA CTT GTG GAA GAT GCC AAC AF309696 62 15/15/15 28 MJR PCT100GT310F GAA TAC TCC CAG TAG TTT CTC
GT509 GT509F CAG CTG CAA AAC CTT GAC ATT AF309697 58 15/15/15 28 MJR PCT100GT509R GTA AAA TGT TTC CAG TGC ATC
GT575 GT575F TAT AAG TGA ATA CAA AGA CCC AF309698 60 20/45/60 30 MJR PCT100GT575R ACC ATC AAC TGG AAG TCT TTC
*The upper oligonucleotide primer was end-labelled. †Times are given in seconds, starting with time at denaturing temperature (94 °C), then time at annealing temperature, followed by time at extension temperature (72 °C). ‡MJ Research model PCT100. §Stratagene RoboCycler model 96.
MEC1053.fm Page 2182 Wednesday, November 15, 2000 8:58 AM

P R I M E R N O T E S 2183
© 2000 Blackwell Science Ltd, Molecular Ecology, 9, 2155–2234
Novel chloroplast microsatellites reveal cytoplasmic variation in Arabidopsis thaliana
J . PROVAN
School of Biology and Biochemistry, The Queen’s University of Belfast, Medical Biology Centre, 97 Lisburn Road, Belfast BT9 7BL, Northern Ireland
Keywords: Arabidopsis thaliana, Brassicaceae, cytoplasm, chloroplast, microsatellites, simple sequence repeats
Received 29 July 2000; revision accepted 15 August 2000
Correspondence: Dr Jim Provan. Fax: + 44 028 90 236505; E-mail: [email protected]
The analysis of levels and patterns of cytoplasmic variationin plants is now widely recognized as providing importantand complementary information to that obtained using nuclearmarkers. In particular, the uniparentally inherited, non-recombining chloroplast genome has been utilized in manystudies in plant population and evolutionary genetics (Soltiset al. 1992; Ennos et al. 1999). Until recently, however, the typ-ically low substitution rates associated with the chloroplastgenome meant that detecting sufficient levels of polymorphism
Locus Species n*Numberof alleles
Size range(bp) HO† HE‡
GT023 M. novaeangliae 353 8 114–128 0.82 0.80B. acutorostrata 91 9 100–116 0.86 0.81B. musculus 92 8 122–136 0.85 0.83B. physalus 65 7 112–138 0.66 0.64
GT101 M. novaeangliae 4 2 92–94 — —B. acutorostrata —B. musculus 92 9 85–101 0.65 0.67B. physalus 4 5 94–112 — —
GT195 M. novaeangliae 353 5 151–163 0.65 0.65B. acutorostrata 3 2 162–166 — —B. musculus 4 2 146–148 — —B. physalus 65 8 158–176 0.74 0.70
GT211 M. novaeangliae 353 7 196–208 0.80 0.82B. acutorostrata 21 7 185–203 0.85 0.75B. musculus —B. physalus 73 6 193–213 0.60 0.55
GT271 M. novaeangliae 353 10 97–123 0.57 0.59B. acutorostrata 2 3 101–104 — —B. musculus 4 3 101–105 — —B. physalus 65 6 112–128 0.45 0.43
GT307 M. novaeangliae 353 7 127–139 0.67 0.68B. acutorostrata 2 3 135–141 — —B. musculus 4 3 127–133 — —B. physalus 65 7 121–139 0.70 0.64
GT310 M. novaeangliae 4 2 102–106 — —B. acutorostrata 21 6 112–122 0.60 0.70B. musculus 4 3 110–116 — —B. physalus 65 2 104–130 0.54 0.50
GT509 M. novaeangliae 6 1 195 — —B. acutorostrata 169 11 195–217 0.81 0.81B. musculus —B. physalus —
GT575 M. novaeangliae 5 6 140–154 — —B. acutorostrata 21 5 195–211 0.80 0.85B. musculus —B. physalus 5 5 140–154 — —
*Number of individual whales genotyped. Estimated †observed and ‡expected heterozygosity. Megaptera novaeangliae was sampled in the Gulf of Maine, Balaenoptera acutorostrata across the North Atlantic, B. musculus in the Gulf of S. Lawrence as well as off West Greenland, and B. physalus in the Sea of Cortez (a small population with low levels of genetic variation, Bérubé et al. 1998).
Table 2 Levels of genetic variation esti-mated in selected baleen whale species
MEC1053.fm Page 2183 Wednesday, November 15, 2000 8:58 AM

2184 P R I M E R N O T E S
© 2000 Blackwell Science Ltd, Molecular Ecology, 9, 2155–2234
was the main drawback to the analysis of cytoplasmic vari-ation, particularly below the species level. The discovery ofpolymorphic mononucleotide repeats in the chloroplast genomesof plants analogous to nuclear microsatellites, or simple sequencerepeats, has provided a new approach to detecting cytoplasmicvariation that had previously gone undetected using tradi-tional restriction fragment length polymorphism (RFLP) studies.These chloroplast microsatellites have been used for the high-resolution analysis of cytoplasmic diversity in both crop speciesand natural plant populations (Provan et al. 1999b, 2000).
This report describes the development of chloroplastmicrosatellite markers in the weedy crucifer Arabidopsisthaliana (Brassicaceae). Despite Arabidopsis being the modelorganism for studies into the physiology, genetics and develop-ment of higher plants, very little work has been carried outon the analysis of natural populations of the species. Indeed,to date there have been no published studies investigatinglevels of cytoplasmic variation in Arabidopsis and only a limitednumber assessing levels of nuclear diversity in natural popu-lations (Vander Zwan et al. 2000 and references therein).
The complete chloroplast sequence of A. thaliana (EMBLaccession number AP000423) was searched for mononucleotiderepeats of n = 8 or greater using the findpatterns program
(Genetics Computer Group). A total of 231 repeats were foundand primers were designed to amplify seven mononucleotiderepeat loci in noncoding regions using the primer program(Genetics Computer Group; Table 1). Primers were tested on22 A. thaliana accessions from 11 populations in Europe andthe USA, as well as on six Brassica species (see Table 2). Poly-merase chain reaction (PCR) was carried out in a total volumeof 10 µL containing 50 ng genomic DNA, 10 pmol 32P end-labelled forward primer, 10 pmol reverse primer, 1× PCR reac-tion buffer [20 mm Tris-HCl (pH 8.4), 50 mm KCl], 15 mmMgCl2, 0.05 U Taq polymerase (Gibco BRL). Reactions werecarried out on a Techne GENIUS thermal cycler using thefollowing parameters: initial denaturation at 94 °C for 3 min;30 cycles of denaturation at 94 °C for 30 s, annealing at 55 °Cfor 30 s, extension at 72 °C for 30 s; final extension at 72 °Cfor 5 min. After addition of 10 µL loading buffer (95%formamide), products were resolved on 6% denaturingpolyacrylamide gels containing 1× TBE buffer and 8 m ureaat 80 W constant power for 2 h. Gels were transferred onto3 mm blotting paper (Whatman) and exposed to X-ray filmovernight at –70 °C.
All seven loci were polymorphic in the sample studied,with between two and six alleles detected per locus (Table 1).
Table 1 Arabidopsis chloroplast microsatellite primers
Locus Repeat Location Primers (5 –3′) Alleles Range (bp)
ATCP112 (A)15 trnH(GUG)/psbA intergenic ATCCGCCCCTACGCTACTAT 5 96–100AGGTGGAATTTGCTACCTTTTT
ATCP7905 (A)13 trnS(GCU)/trnG(UCC) intergenic CGAACCCTCGGTACGATTAA 2 140–141TGGAGAAGGTTCTTTTTCAAGC
ATCP28673 (T)13 ycf6/psbM intergenic GCGTTCCTTTCATTTAAGACG 4 140–145TGCACTCTTCATTCTCGTTCC
ATCP30287 (A)13 trnD(GUC)/trnY(GUA) intergenic CCCTATACCCTGAAATTTGACC 3 100–102CAGCTCGGCCCAATAATTAG
ATCP46615 (A)14 trnT(UGU)/trnL(UAA) intergenic AATTTTTTTCCATTGCACATTG 3 111–113TCAGAAATAGTCGAACGGTCG
ATCP66701 (T)16 trnP(UGG)/psaJ intergenic TCCACATCCTCCTTCTTTTTT 5 145–150CATTTGAAAACGTAAAGGCC
ATCP70189 (A)13 rpS12/clpP intergenic CGGGTTGATGGATCATTACC 6 124–132GCAATGCACAAAAAAAGCCT
Locus
Brassica species
B. oleracea B. rapa B. napus B. nigra B. carinata B. juncea
ATCP112 ✘ ✘ ✘ ✘ ✘ ✘
ATCP7905 ✔✔ ✔✔ ✔✔ ✔✔ ✔✔ ✔✔
ATCP28673 ✔✔ ✔✔ ✔✔ ✔✔ ✔✔ ✔✔
ATCP30287 ✔ ✔ ✔ † † ✔
ATCP46615 ✔✔ ✔✔ ✔✔ ✔✔ ✔✔ ✔✔
ATCP66701 ✔ ✔ ✔ ✔ ✔ ✔
ATCP70189 ✔✔ ✔✔ ✔✔ ✔✔ ✔✔ ✔✔
✔✔ — Strong amplification; ✔ — Weak amplification; ✘ — Poor or no amplification.†Primer ATCP30287 amplified two bands in both B. nigra and B. carinata.
Table 2 Cross-species amplification inBrassica species using Arabidopsis chloroplastmicrosatellite primers
MEC1053.fm Page 2184 Wednesday, November 15, 2000 8:58 AM

P R I M E R N O T E S 2185
© 2000 Blackwell Science Ltd, Molecular Ecology, 9, 2155–2234
Combining the alleles from the seven linked loci gave 11haplotypes in the 22 individuals. Intrapopulation variationwas detected in several populations, highlighting the resolv-ing power of the chloroplast microsatellite technique even inhighly inbreeding species such as Arabidopsis, which is believedto have a selfing rate of ≈99%. Although no previous cyto-plasmic studies have been carried out in Arabidopsis, it isunlikely that such levels of variation would be detected withRFLPs. This has been observed in chloroplast microsatellitestudies of other inbreeding species, e.g. barley (Provan et al.1999a), where diversity levels were far in excess of thoserevealed by chloroplast RFLPs.
Due to high levels of conservation of both sequence and geneorganization in plant chloroplast genomes, primers designedto amplify chloroplast microsatellites in one species havebeen shown to amplify polymorphic products in related species,even at the intergeneric level (Provan et al. 2000). Consequently,the primers developed for Arabidopsis were tested on severalBrassica species (Table 2). Although primer pair ATCP112 didnot amplify in the Brassica species and primers ATCP30287and ATCP66701 gave poor and/or nonspecific amplification,the other four primer pairs amplified a single, strong productin all six species tested. This suggests that these primers mayhave considerable value in studying cytoplasmic variationwithin the Brassicaceae.
In summary, these chloroplast microsatellite primers offernew opportunities to study levels and patterns of cytoplasmicvariation within and between Arabidopsis natural populationsand ecotypes. A comparison of chloroplast and nuclear micro-satellite markers will provide new insights into the relativeroles of seed and pollen movement in shaping the geneticstructure of natural populations. Furthermore, their utilityacross the Brassicaceae means that this ability to discriminateseed and pollen movement will be of value in assessing modesof potential transgene escape in genetically modified oilseedrape (Brassica napus) and in possible hybrids between B. napusand its wild relatives.
Acknowledgements
The author would like to thank Joy Bergelson for providing theArabidopsis DNA and Steve Millam for providing seeds of theBrassica species.
References
Ennos RA, Sinclair WT, Hu X-S, Langdon A (1999) Usingorganelle markers to elucidate the history, ecology and evolu-tion of plant populations. In: Molecular Systematics and PlantEvolution (eds Hollingsworth PM, Bateman RM, Gornall RJ),pp. 1–19, Taylor & Francis, London.
Provan J, Powell W, Hollingsworth PM (2000) Chloroplast micro-satellites: new tools for studies in plant ecology and evolution.Trends in Ecology and Evolution, in press.
Provan J, Russell JR, Booth A, Powell W (1999a) Polymorphicsimple sequence repeat primers for systematic and populationstudies in the genus Hordeum. Molecular Ecology, 8, 505–511.
Provan J, Soranzo N, Wilson NJ et al. (1999b) The use of uni-parent-ally inherited simple sequence repeat markers in plantpopulation studies and systematics. In: Molecular Systematics
and Plant Evolution (eds Hollingsworth PM, Bateman RM,Gornall RJ), pp. 35–50, Taylor & Francis, London.
Soltis DE, Soltis PS, Milligan BG (1992) Intraspecific chloroplastDNA variation: systematic and phylogenetic implications. In:Molecular Systematics of Plants (eds Soltis DE, Soltis PS, Doyle JJ),pp. 117–150, Chapman & Hall, New York.
Vander Zwan C, Brodie S, Campanella JJ (2000) The intraspecificphylogenetics of Arabidopsis thaliana in worldwide populations.Systematic Botany, 25, 47–59.
91220001139PRIMER NOTEsPRIMER NOTEsPRIMER NOTEs100Graphicraft Limited, Hong Kong
Characterization of 14 tetranucleotide microsatellite loci derived from sockeye salmon
JEFFREY B. OLSEN,* SHERI L. WILSON,* ERIC J . KRETSCHMER,* KENNETH C. JONES† and JAMES E. SEEB*
*Alaska Department of Fish and Game, Gene Conservation Laboratory, 333 Raspberry Road, Anchorage, Alaska 99518–1599, USA, †Genetic Identification Services, 9552 Topanga Canyon Blvd., Chatsworth, California 91311, USA
Keywords: conservation genetics, microsatellites, salmon, sockeye salmon
Received 21 July 2000; revision accepted 15 August 2000
Correspondence: Jeffrey B. Olsen. Fax: +907–267–2442; E-mail: [email protected]
The use of microsatellites for research and conservation ofPacific salmon (Oncorhynchus spp.) is increasing. Examples ofapplications include gene mapping (e.g. Lindner et al. 2000),pedigree analysis (e.g. Estoup et al. 1998), and populationassignment (e.g. Olsen et al. 2000). Through these studiesresearchers have become more discriminating in their choiceof microsatellites to meet specific project objectives and toimprove genotyping efficiency. Examples of selection criteriainclude locus polymorphism, presence of null alleles, allelesize range, polymerase chain reaction (PCR) annealing tem-perature, and PCR amplification quality. New microsatellitesare needed to improve the selection of loci for each species ofPacific salmon. In particular, there is need for tetranucleotidemicrosatellites. This class of microsatellites does not generallyexhibit the complicated shadow banding (‘stutter ’) observedin many dinucleotide microsatellites, and they providesufficient range in polymorphism for various applications(Jarne & Lagoda 1996). Here we report the developmentof primers for 14 novel tetranucleotide microsatellites insockeye salmon (O. nerka).
Sequences for 27 novel DNA fragments (~350–550 bp)containing TAGA tetranucleotide microsatellites were identifiedby Genetic Identification Services (GIS, Chatsworth CA) usingan enrichment protocol similar to Edwards et al. (1996). GenomicDNA from a single sockeye salmon was partially restrictedwith a cocktail of seven blunt-end cutting enzymes (RsaI, HaeIII,BsrB 1, PvuII, StuI, ScaI, EcoR V). Fragments in the size rangeof 300–750 bp were adapted and subjected to magneticbead capture (CPG Inc., Lincoln Park, NJ), using (TAGA)8biotinylated capture molecules (Integrated DNA Technology,Coralville, IA). Captured molecules were amplified and
MEC1053.fm Page 2185 Wednesday, November 15, 2000 8:58 AM
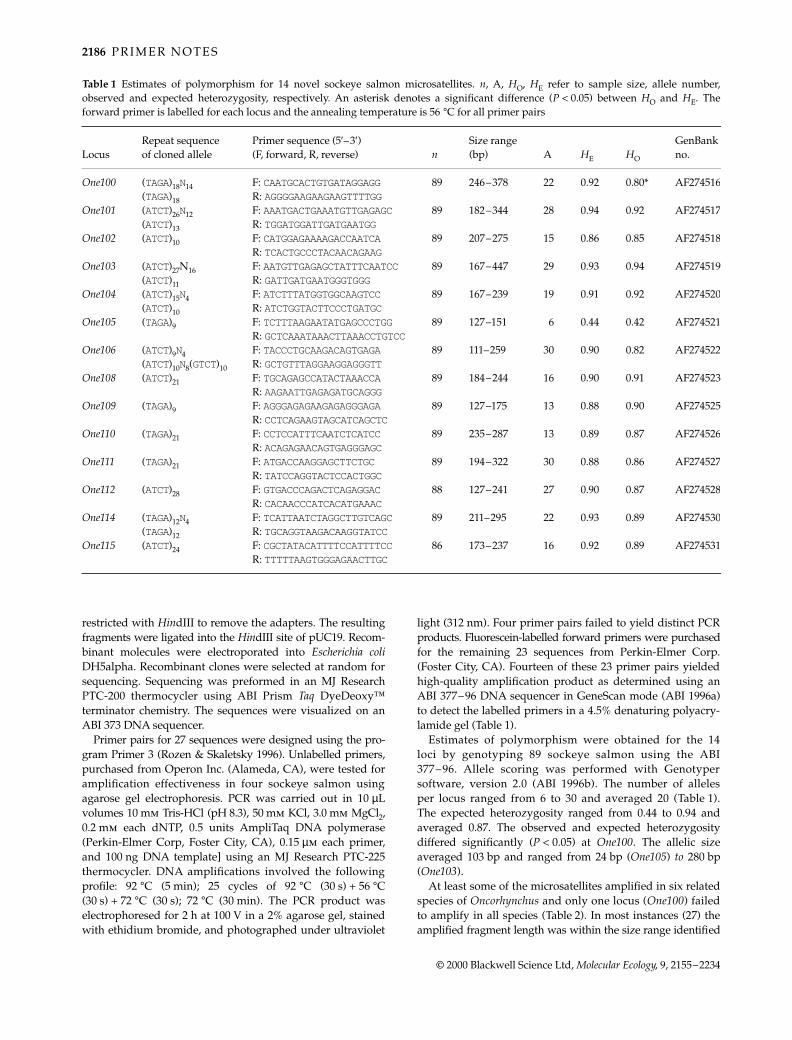
2186 P R I M E R N O T E S
© 2000 Blackwell Science Ltd, Molecular Ecology, 9, 2155–2234
restricted with HindIII to remove the adapters. The resultingfragments were ligated into the HindIII site of pUC19. Recom-binant molecules were electroporated into Escherichia coliDH5alpha. Recombinant clones were selected at random forsequencing. Sequencing was preformed in an MJ ResearchPTC-200 thermocycler using ABI Prism Taq DyeDeoxy™terminator chemistry. The sequences were visualized on anABI 373 DNA sequencer.
Primer pairs for 27 sequences were designed using the pro-gram Primer 3 (Rozen & Skaletsky 1996). Unlabelled primers,purchased from Operon Inc. (Alameda, CA), were tested foramplification effectiveness in four sockeye salmon usingagarose gel electrophoresis. PCR was carried out in 10 µLvolumes 10 mm Tris-HCl (pH 8.3), 50 mm KCl, 3.0 mm MgCl2,0.2 mm each dNTP, 0.5 units AmpliTaq DNA polymerase(Perkin-Elmer Corp, Foster City, CA), 0.15 µm each primer,and 100 ng DNA template] using an MJ Research PTC-225thermocycler. DNA amplifications involved the followingprofile: 92 °C (5 min); 25 cycles of 92 °C (30 s) + 56 °C(30 s) + 72 °C (30 s); 72 °C (30 min). The PCR product waselectrophoresed for 2 h at 100 V in a 2% agarose gel, stainedwith ethidium bromide, and photographed under ultraviolet
light (312 nm). Four primer pairs failed to yield distinct PCRproducts. Fluorescein-labelled forward primers were purchasedfor the remaining 23 sequences from Perkin-Elmer Corp.(Foster City, CA). Fourteen of these 23 primer pairs yieldedhigh-quality amplification product as determined using anABI 377–96 DNA sequencer in GeneScan mode (ABI 1996a)to detect the labelled primers in a 4.5% denaturing polyacry-lamide gel (Table 1).
Estimates of polymorphism were obtained for the 14loci by genotyping 89 sockeye salmon using the ABI377–96. Allele scoring was performed with Genotypersoftware, version 2.0 (ABI 1996b). The number of allelesper locus ranged from 6 to 30 and averaged 20 (Table 1).The expected heterozygosity ranged from 0.44 to 0.94 andaveraged 0.87. The observed and expected heterozygositydiffered significantly (P < 0.05) at One100. The allelic sizeaveraged 103 bp and ranged from 24 bp (One105) to 280 bp(One103).
At least some of the microsatellites amplified in six relatedspecies of Oncorhynchus and only one locus (One100) failedto amplify in all species (Table 2). In most instances (27) theamplified fragment length was within the size range identified
Table 1 Estimates of polymorphism for 14 novel sockeye salmon microsatellites. n, A, HO, HE refer to sample size, allele number,observed and expected heterozygosity, respectively. An asterisk denotes a significant difference (P < 0.05) between HO and HE. Theforward primer is labelled for each locus and the annealing temperature is 56 °C for all primer pairs
LocusRepeat sequence of cloned allele
Primer sequence (5′–3′) (F, forward, R, reverse) n
Size range (bp) A HE HO
GenBank no.
One100 (TAGA)18N14 F: CAATGCACTGTGATAGGAGG 89 246–378 22 0.92 0.80* AF274516(TAGA)18 R: AGGGGAAGAAGAAGTTTTGG
One101 (ATCT)26N12 F: AAATGACTGAAATGTTGAGAGC 89 182–344 28 0.94 0.92 AF274517(ATCT)13 R: TGGATGGATTGATGAATGG
One102 (ATCT)10 F: CATGGAGAAAAGACCAATCA 89 207–275 15 0.86 0.85 AF274518R: TCACTGCCCTACAACAGAAG
One103 (ATCT)27N16 F: AATGTTGAGAGCTATTTCAATCC 89 167–447 29 0.93 0.94 AF274519(ATCT)11 R: GATTGATGAATGGGTGGG
One104 (ATCT)15N4 F: ATCTTTATGGTGGCAAGTCC 89 167–239 19 0.91 0.92 AF274520(ATCT)10 R: ATCTGGTACTTCCCTGATGC
One105 (TAGA)9 F: TCTTTAAGAATATGAGCCCTGG 89 127–151 6 0.44 0.42 AF274521R: GCTCAAATAAACTTAAACCTGTCC
One106 (ATCT)9N4 F: TACCCTGCAAGACAGTGAGA 89 111–259 30 0.90 0.82 AF274522(ATCT)10N8(GTCT)10 R: GCTGTTTAGGAAGGAGGGTT
One108 (ATCT)21 F: TGCAGAGCCATACTAAACCA 89 184–244 16 0.90 0.91 AF274523R: AAGAATTGAGAGATGCAGGG
One109 (TAGA)9 F: AGGGAGAGAAGAGAGGGAGA 89 127–175 13 0.88 0.90 AF274525R: CCTCAGAAGTAGCATCAGCTC
One110 (TAGA)21 F: CCTCCATTTCAATCTCATCC 89 235–287 13 0.89 0.87 AF274526R: ACAGAGAACAGTGAGGGAGC
One111 (TAGA)21 F: ATGACCAAGGAGCTTCTGC 89 194–322 30 0.88 0.86 AF274527R: TATCCAGGTACTCCACTGGC
One112 (ATCT)28 F: GTGACCCAGACTCAGAGGAC 88 127–241 27 0.90 0.87 AF274528R: CACAACCCATCACATGAAAC
One114 (TAGA)12N4 F: TCATTAATCTAGGCTTGTCAGC 89 211–295 22 0.93 0.89 AF274530(TAGA)12 R: TGCAGGTAAGACAAGGTATCC
One115 (ATCT)24 F: CGCTATACATTTTCCATTTTCC 86 173–237 16 0.92 0.89 AF274531R: TTTTTAAGTGGGAGAACTTGC
MEC1053.fm Page 2186 Wednesday, November 15, 2000 8:58 AM

P R I M E R N O T E S 2187
© 2000 Blackwell Science Ltd, Molecular Ecology, 9, 2155–2234
in sockeye salmon. In 23 instances the amplified fragmentwas smaller than the smallest allele in sockeye salmon andin one instance the amplified fragment was larger than thelargest allele in sockeye salmon (One112). These microsatellitesshould prove useful for a number of conservation geneticapplications in sockeye salmon and, to a lesser degree, theother species examined here.
Acknowledgements
Funding was provided by the State of Alaska and National MarineFisheries Service through the Western Alaska research project. Thisis Alaska Department of Fish and Game professional paper 198.
References
ABI (Applied Biosystems Inc.) (1996a) GeneScan 672 Users ManualRev. A. Perkin-Elmer Corp., Foster City, CA.
ABI (Applied Biosystems Inc.) (1996b) Genotyper 2.0 Users Manual.Perkin-Elmer Corp., Foster City, CA.
Edwards KJ, Barker JHA, Daly A, Jones C, Karp A (1996) Micro-satellite libraries enriched for several microsatellite sequencesin plants. Biotechniques, 20, 758–760.
Estoup A, Gharbi K, SanCristobal M, Chavelet C, Haffray P,Guyomard R (1998) Parentage assignment using microsatellites inturbot (Scopthalamus maximus) and rainbow trout (Oncorhynchusmykiss) hatchery populations. Canadian Journal of Fisheries andAquatic Sciences, 55, 715–723.
Jarne P, Lagoda JL (1996) Microsatellites, from molecules topopulations and back. Trends in Ecology and Evolution, 11 (10),424–429.
Lindner KR, Seeb JE, Habicht C et al. (2000) Gene-centromeremapping of 312 loci in pink salmon by half-tetrad analysis.Genome, 43, 538–549.
Olsen JB, Bentzen P, Banks MA, Shaklee JB, Young S (2000)Microsatellites reveal population identity of individual pinksalmon to allow supportive breeding of a population at riskof extinction. Transactions of the American Fisheries Society, 129,232–242.
Rozen S, Skaletsky H (1996) Primer 3 design program. Code avail-able at http://www-genome.wi.mit.edu/genome_software/other/primer3.html.
91220001140PRIMER NOTEsPRIMER NOTEsPRIMER NOTEs100Graphicraft Limited, Hong Kong
Microsatellite characterization in central stoneroller Campostoma anomalum (Pisces: Cyprinidae)
PERO DIMSOSKI , GREGORY P. TOTH and MARK J . BAGLEY
National Exposure Research Laboratory, United States Environmental Protection Agency, 26 West Martin Luther King Drive, Cincinnati, OH 45268, USA
Keywords: Campostoma anomalum, central stoneroller, Cyprinidae, microsatellites
Received 10 July 2000; revision accepted 15 August 2000
Correspondence: Pero Dimsoski. Fax: (650) 638-6333; E-mail: [email protected]
The central stoneroller (Campostoma anomalum) is a smallcyprinid fish that is native to streams and rivers of centraland eastern North America. It can be found in a range ofanthropogenically modified habitats, ranging from nearlypristine to highly polluted waters (Zimmerman et al. 1980),and has intermediate sensitivity to habitat degradationrelative to other fishes in the region (Zimmerman et al. 1980;Gillespie & Guttman 1989). The species is the focus of intens-ive study by the United States Environmental ProtectionAgency due to its biological and distributional character-istics. An important aspect of this research is to understand thefine-scale genetic structure of the species across its nativerange, and to determine how this ‘genetic landscape’ relatesto underlying environmental processes. To date, genetic ana-lyses have focused on multi-locus fingerprints generated bythe random amplified polymorphic DNA (RAPD) method todelineate levels of similarity among and within populations(Silbiger et al. 1998). Because allelic counts are highly sensitiveto recent changes in population size, highly polymorphicmicrosatellite DNA markers should provide genetic informa-tion that is highly complementary to the RAPD data and mayreveal finer levels of population structuring. Here, we reporta suite of highly polymorphic microsatellite markers developedfor the central stoneroller.
Table 2 Results of cross-species testing of sockeye salmon microsatellite primers. Two individuals were tested for each species
Species
Locus (One)
100 101 102 103 104 105 106 108 109 110 111 112 114 115
Oncorhynchus gorbuscha – + + + – – – – – + + + – + ↓O. keta – + ↓ + + ↓ – + + + – + + + + –O. tshawytscha – + ↓ + + ↓ – – + – + ↓ + ↓ + – + –O. kisutch – + – + ↓ + ↓ – + – + ↓ + ↓ + ↓ + ↑ – –O. mykiss – + ↓ + + ↓ + ↓ – – + + ↓ + ↓ + + + ↓ –O. clarki – + ↓ + + ↓ – – – + ↓ + ↓ + ↓ + + – –
+, amplified at designed annealing temperature; –, did not amplify; ↓ , amplified fragment smaller than smallest allele in sockeye; ↑ , amplified fragment larger than largest allele in sockeye.
MEC1053.fm Page 2187 Wednesday, November 15, 2000 8:58 AM
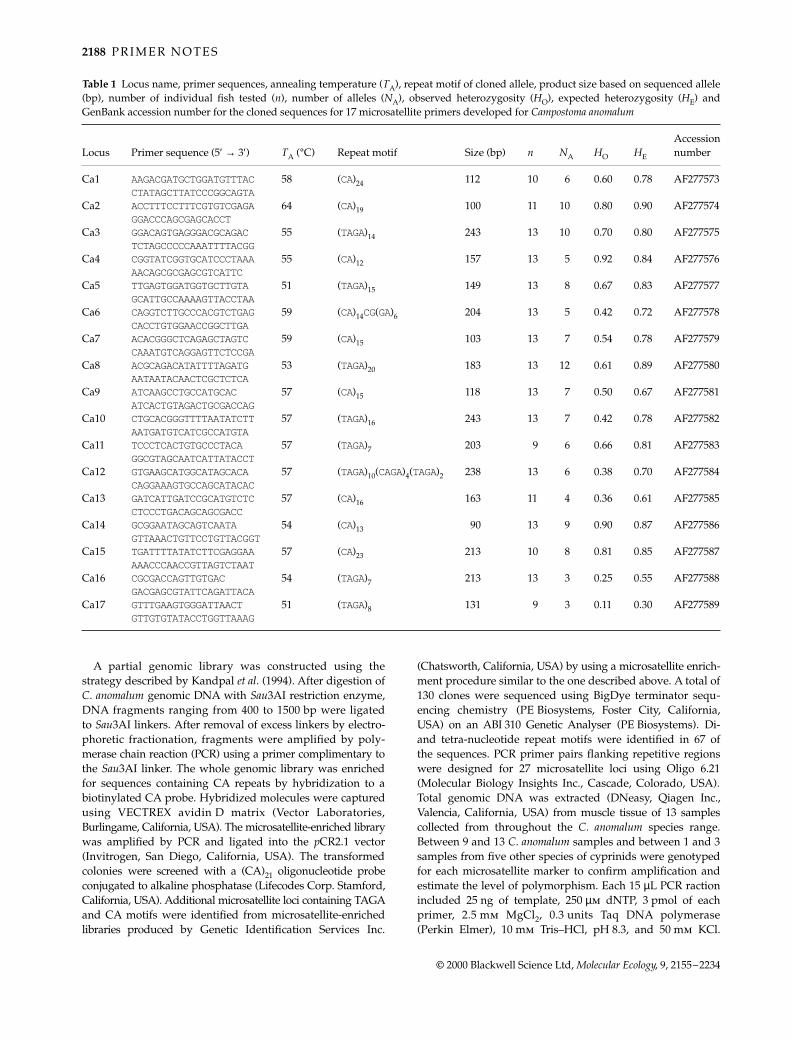
2188 P R I M E R N O T E S
© 2000 Blackwell Science Ltd, Molecular Ecology, 9, 2155–2234
A partial genomic library was constructed using thestrategy described by Kandpal et al. (1994). After digestion ofC. anomalum genomic DNA with Sau3AI restriction enzyme,DNA fragments ranging from 400 to 1500 bp were ligatedto Sau3AI linkers. After removal of excess linkers by electro-phoretic fractionation, fragments were amplified by poly-merase chain reaction (PCR) using a primer complimentary tothe Sau3AI linker. The whole genomic library was enrichedfor sequences containing CA repeats by hybridization to abiotinylated CA probe. Hybridized molecules were capturedusing VECTREX avidin D matrix (Vector Laboratories,Burlingame, California, USA). The microsatellite-enriched librarywas amplified by PCR and ligated into the pCR2.1 vector(Invitrogen, San Diego, California, USA). The transformedcolonies were screened with a (CA)21 oligonucleotide probeconjugated to alkaline phosphatase (Lifecodes Corp. Stamford,California, USA). Additional microsatellite loci containing TAGAand CA motifs were identified from microsatellite-enrichedlibraries produced by Genetic Identification Services Inc.
(Chatsworth, California, USA) by using a microsatellite enrich-ment procedure similar to the one described above. A total of130 clones were sequenced using BigDye terminator sequ-encing chemistry (PE Biosystems, Foster City, California,USA) on an ABI 310 Genetic Analyser (PE Biosystems). Di-and tetra-nucleotide repeat motifs were identified in 67 ofthe sequences. PCR primer pairs flanking repetitive regionswere designed for 27 microsatellite loci using Oligo 6.21(Molecular Biology Insights Inc., Cascade, Colorado, USA).Total genomic DNA was extracted (DNeasy, Qiagen Inc.,Valencia, California, USA) from muscle tissue of 13 samplescollected from throughout the C. anomalum species range.Between 9 and 13 C. anomalum samples and between 1 and 3samples from five other species of cyprinids were genotypedfor each microsatellite marker to confirm amplification andestimate the level of polymorphism. Each 15 µL PCR ractionincluded 25 ng of template, 250 µm dNTP, 3 pmol of eachprimer, 2.5 mm MgCl2, 0.3 units Taq DNA polymerase(Perkin Elmer), 10 mm Tris–HCl, pH 8.3, and 50 mm KCl.
Table 1 Locus name, primer sequences, annealing temperature (TA), repeat motif of cloned allele, product size based on sequenced allele(bp), number of individual fish tested (n), number of alleles (NA), observed heterozygosity (HO), expected heterozygosity (HE) andGenBank accession number for the cloned sequences for 17 microsatellite primers developed for Campostoma anomalum
Locus Primer sequence (5′ → 3′) TA (°C) Repeat motif Size (bp) n NA HO HE
Accession number
Ca1 AAGACGATGCTGGATGTTTAC 58 (CA)24 112 10 6 0.60 0.78 AF277573CTATAGCTTATCCCGGCAGTA
Ca2 ACCTTTCCTTTCGTGTCGAGA 64 (CA)19 100 11 10 0.80 0.90 AF277574GGACCCAGCGAGCACCT
Ca3 GGACAGTGAGGGACGCAGAC 55 (TAGA)14 243 13 10 0.70 0.80 AF277575TCTAGCCCCCAAATTTTACGG
Ca4 CGGTATCGGTGCATCCCTAAA 55 (CA)12 157 13 5 0.92 0.84 AF277576AACAGCGCGAGCGTCATTC
Ca5 TTGAGTGGATGGTGCTTGTA 51 (TAGA)15 149 13 8 0.67 0.83 AF277577GCATTGCCAAAAGTTACCTAA
Ca6 CAGGTCTTGCCCACGTCTGAG 59 (CA)14CG(GA)6 204 13 5 0.42 0.72 AF277578CACCTGTGGAACCGGCTTGA
Ca7 ACACGGGCTCAGAGCTAGTC 59 (CA)15 103 13 7 0.54 0.78 AF277579CAAATGTCAGGAGTTCTCCGA
Ca8 ACGCAGACATATTTTAGATG 53 (TAGA)20 183 13 12 0.61 0.89 AF277580AATAATACAACTCGCTCTCA
Ca9 ATCAAGCCTGCCATGCAC 57 (CA)15 118 13 7 0.50 0.67 AF277581ATCACTGTAGACTGCGACCAG
Ca10 CTGCACGGGTTTTAATATCTT 57 (TAGA)16 243 13 7 0.42 0.78 AF277582AATGATGTCATCGCCATGTA
Ca11 TCCCTCACTGTGCCCTACA 57 (TAGA)7 203 9 6 0.66 0.81 AF277583GGCGTAGCAATCATTATACCT
Ca12 GTGAAGCATGGCATAGCACA 57 (TAGA)10(CAGA)4(TAGA)2 238 13 6 0.38 0.70 AF277584CAGGAAAGTGCCAGCATACAC
Ca13 GATCATTGATCCGCATGTCTC 57 (CA)16 163 11 4 0.36 0.61 AF277585CTCCCTGACAGCAGCGACC
Ca14 GCGGAATAGCAGTCAATA 54 (CA)13 90 13 9 0.90 0.87 AF277586GTTAAACTGTTCCTGTTACGGT
Ca15 TGATTTTATATCTTCGAGGAA 57 (CA)23 213 10 8 0.81 0.85 AF277587AAACCCAACCGTTAGTCTAAT
Ca16 CGCGACCAGTTGTGAC 54 (TAGA)7 213 13 3 0.25 0.55 AF277588GACGAGCGTATTCAGATTACA
Ca17 GTTTGAAGTGGGATTAACT 51 (TAGA)8 131 9 3 0.11 0.30 AF277589GTTGTGTATACCTGGTTAAAG
MEC1053.fm Page 2188 Wednesday, November 15, 2000 8:58 AM

P R I M E R N O T E S 2189
© 2000 Blackwell Science Ltd, Molecular Ecology, 9, 2155–2234
Cycling was performed with a PE Biosystems Geneamp 9600thermal cycler under the following conditions: 30 s at 94 °C;27 cycles of 1 min at 92 °C, 1 min at 51–64 °C, dependingon the specific primer set (Table 1), and 1.5 min at 72 °C;followed by 7 min at 72 °C. PCR products were separated ondenaturing 5% polyacrylamide gels and visualized with VistraGreen (Amersham Life Science, Amersham, Buckingamshire,UK) fluorescent dye using a FluorImager 595 fluorescentscanner (Molecular Dynamics, Sunnyvale, California, USA).
A total of 17 microsatellite markers were identified as highlypolymorphic for C. anomalum (Table 1). The other 10 primersets either failed to produce a reliable PCR product or werenot polymorphic for the samples assayed. Two of the 17primer sets that were informative for C. anomalum produceda PCR product of similar size for all of the other five cyprinidspecies tested (Table 2). In addition, nine primer sets pro-duced a PCR product of similar size in at least one of theother cyprinid species. The extensive polymorphismsidentified for these markers within C. anomalum, and theirapparent applicability to other species, indicate that they willhave utility for future population studies.
Acknowledgements
This research was supported in part by the appointment of PD tothe Postgraduate Research Program at the National ExposureResearch Laboratory administered by the Oak Ridge Institute forScience and Education through an inter-agency agreement betweenthe US Department of Energy and the US Environmental Protec-tion Agency.
References
Gillespie RB, Guttman SI (1989) Effects of contaminants on thefrequencies of allozymes in populations of the central stone-roller. Environmental Toxicology, 8, 309–317.
Kandpal RP, Kandpal G, Weissman SM (1994) Construction oflibraries enriched for sequence repeats and jumping clones, and
hybridization selection for region-specific markers. Proceed-ings of the National Academy of Sciences USA, 91, 88–92.
Silbiger RN, Christ SA, Leonard AC, et al. (1998) Preliminarystudies on the population genetics of the central stoneroller(Campostoma anomalum) from the Great Miami River basin,Ohio. Environmental Monitoring and Assessment, 51, 481–495.
Zimmerman EG, Merrit RL, Woten MC (1980) Genetic variationand ecology of stoneroller minnows. Biochemical Systematicsand Ecology, 8, 447–453.
91220001143PRIMER NOTEsPRIMER NOTEsPRIMER NOTEs1000Graphicraft Limited, Hong Kong
Dinucleotide microsatellite loci for Andrena vaga and other andrenid bees from non-enriched and CT-enriched libraries
C. MOHRA, M. FELLENDORF, G. SEGELBACHER and R . J . PAXTON
Zoological Institute, University of Tübingen, Auf der Morgenstelle 28, D-72076 Tübingen, Germany
Keywords: Andrenidae, Apoidea, Hymenoptera, SSR
Received 14 June 2000; revision accepted 15 August 2000
Correspondence: Dr R.J. Paxton. Fax: +49 7071 295634; E-mail: [email protected]
Andrena is a large genus (>1000 species) of bees with aprimarily Holarctic distribution (Michener 1979). Analysis ofAndrena population genetics has been hampered by theirlimited allozyme variability (Ayasse et al. 1990). Micro-satellites potentially make up this shortfall, although there arefew loci described for this group of bees (Paxton et al. 1996).
We developed microsatellites for the andrenid bee Andrenavaga Panzer 1799 using both non-enriched and enriched partialgenomic libraries. DNA for cloning was isolated from thethorax of one male bee using phenol/chloroform, digestedto completion with Sau3AI, resolved on an agarose gel, andfragments between 200 and 800 bp were isolated from the gel
Table 2 Cross-specific amplification of microsatellite loci isolated from Campostoma anomalum
Locus
Bluntnose minnows Pimephales notatus (n = 3)
Fathead minnows Pimephales promelas (n = 3)
Blacknose dace Rhinichthys atratulus (n = 3)
Creek chubs Semotilus atromaculatus (n = 3)
Zebra fishDanio rerio (n = 1)
Ca1 4 4 4 3 1Ca3 1 — 3 — 1Ca6 4 3 — — —Ca7 — — 3 2 —Ca9 4 — — — —Ca11 — — 2 4 —Ca12 3 3 6 5 1Ca13 — — — — 1Ca14 — — 2 — —Ca16 4 5 — — —Ca17 3 — — — —
Fragments were resolved on 5% polyacrylamide gels. The data indicate the number of alleles counted from n genotyped individuals. ‘—’, no or unreadable amplification.
MEC1053.fm Page 2189 Wednesday, November 15, 2000 8:58 AM

2190 P R I M E R N O T E S
© 2000 Blackwell Science Ltd, Molecular Ecology, 9, 2155–2234
using the QIAquick Gel Extraction Kit (Qiagen) following themanufacturer’s protocol.
For the non-enriched library, the 200–800 bp fragments wereligated into plasmid vector pUC18/BamHI (Amersham/Pharmacia). Highly competent E. coli (INVαF′ One Shot,Invitrogen) were transformed with plasmids, and resultantcolonies were simultaneously screened for microsatellites usingdigoxigenin (DIG)-end labelled (GA)10 and (CA)10 exactly asdescribed by Estoup & Turgeon (1996).
We used filter hybridization (Armour et al. 1994) to gen-erate a CT-enriched library, following methods described bySegelbacher et al. (2000) (see also Piertney et al. 1998). A 1 µgaliquot of the A. vaga 200–800 bp fragments was ligated to aSauL linker molecule, denatured and hybridized to a 1 cm2
piece of Hybond N+ membrane (Amersham/Pharmacia) towhich synthetic (GA)n polymers had previously been bound(Schlötterer 1998, pp. 241–244). After overnight hybridiza-tion at 65 °C in 2 × SSC and 0.1% SDS, nylon membranes
were given three washes of 2 × SSC and 0.1% SDS, and thenthe enriched fragments were stripped from the membrane byheating to 95 °C for 5 min in water. The enriched fractionwas precipitated and complementary strands were reformedin a polymerase chain reaction (PCR) (30 cycles consisting of1 min at 94 °C, 1 min at 55 °C and 1 min at 72 °C) using theSauL-A oligonucleotide as a primer (Schlötterer 1998). Linkerswere removed from the fragments by digestion with Sau3AI,and the fragments, now enriched for CT/GA sequences, weresubsequently ligated into a plasmid, cloned and screenedexactly as described above for the non-enriched library.
From the non-enriched library, four of 732 screened colonieswere positive (0.5%), and, from the enriched library, 154 of435 screened colonies were positive (35.4%), demonstrating theutility of the enrichment protocol. Plasmid DNA was extractedfrom positive colonies, inserts were cycle-sequenced usingBig Dye Terminator chemistry (Perkin Elmer), and fragmentswere resolved on an ABI Prism 377 automated sequencer.
Table 1 Description of 19 microsatellite loci for Andrena vaga and heterozygosities for eight females
Locus Sequence (5′ → 3′) Repeat sequenceFragment size (and range) (bp)
Annealing temp. (°C) HE HO
Number of alleles
GenBank accession no.
vaga01 F: GTGCCAAGTCAGTTAGTGTGC (CT)20 186 (184–194) 65 0.76 0.63 4 G64722R: GAAACACGTAGCGAACACG
vaga02 F: CTTCTCCAAGCCGAATCTTCC (CT)27 232 (210–240) 65 0.91 0.88 8 G64906R: GATCGGCCTGGGAAATTCC
vaga03 F: GATTCGGGAACGACACTCG (CT)17 107 (105–123) 65 0.82 0.63 7 G64907R: CGTTTATAGCGATGATGTCCG
vaga04 F: TTCTACGTTAGTCCGCAGG (CT)17 228 (226–238) 60 0.88 0.75 7 G64908R: CTTAGTCCGTTAAGGAGCAAC
vaga05 F: GGAAGGTTGAGTGGAAATTG (CT)16 318 (316–326) 56 0.88 0.75 6 G64909R: TGTCCGAAGTGAAGAGAACG
vaga06 F: GCTTTGGTTCCTCGTGTCG (CT)15 194 (192–218) 60 0.24 0 2 G64910R: CCACTGAAACTCATCTAGGTACACG
vaga08 F: GATCCGAAAAGTTGAAGGTG (CT)29 171 (165–187) 56 0.88 0.75 7 G64911R: CTACGTGACTTTCCTGTCCTC
vaga09 F: CCGTTGTAATCGAATGAACC (CT)21 117 (105–131) 56 0.91 0.63 8 G64912R: GATGGAGGAAAGGGGAGA
vaga12 F: GGAATTCGTCGACGAAAGG (CT)21 178 (164–194) 63 0.86 0.88 7 G64913R: CGATGGGTGTAGGTGGGAT
vaga13 F: CTTAGTCCGTTAAGGAGCAAC (CT)18 153 (145–163) 56 0.89 1.00 8 G64914R: GGAACGAAAGTCTTCTCTTCTC
vaga14 F: CTGCCACCTCTGTACATGG (CT)16 218 (216–224) 65 0.65 0.50 4 G64915R: CGTGTGAGCTAGAGTTCCATC
vaga18 F: CGACTTTGCTACAGCGATTC (CT)20 135 (123–155) 60 0.68 0.25 6 G64916R: CGACTTGGATAGGCAGGG
vaga19 F: GGGTAACGAGAGAAGGGG (CT)23 160 (146–162) 56 0.82 0.38 6 G64923R: GAGGAGTCGTGTTACGTGC
vaga20 F: GATCTTCTTACCTCCCCCC (CT)17 183 (179–191) 60 0.79 0.63 7 G64917R: CTTCCTTTTGCTCCCTCTTG
vaga21 F: CCTTGTTACGCGTGCATAG (CT)19 149 (149–161) 60 0.80 0.38 5 G64918R: TCGGAAACTGTACGTCGTC
vaga23 F: CTGTGTGGAAAGGTGATAACG (CT)33 219 (203–233) 56 0.87 0.38 7 G64919R: GAAGGGAACAGTAATGGACAAG
vaga25 F: GTCGCTACACACTCGTTATCTTG (CT)18 126 (126–128) 56 0.23 0 2 G64920R: CATGGATTCCAACGAATTCTC
vaga26 F: CGAGGGCAATCGACAGTG (CT)20 166 (156–170) 60 0.77 0.50 5 G64921R: GCCGTTGAATTCACGTAGG
vaga27 F: GACGGACTCGGATACACCC (CT)14 100 (98–106) 65 0.69 0.63 4 G64922R: CGAGTTGCCGCTAACTTTC
MEC1053.fm Page 2190 Wednesday, November 15, 2000 8:58 AM
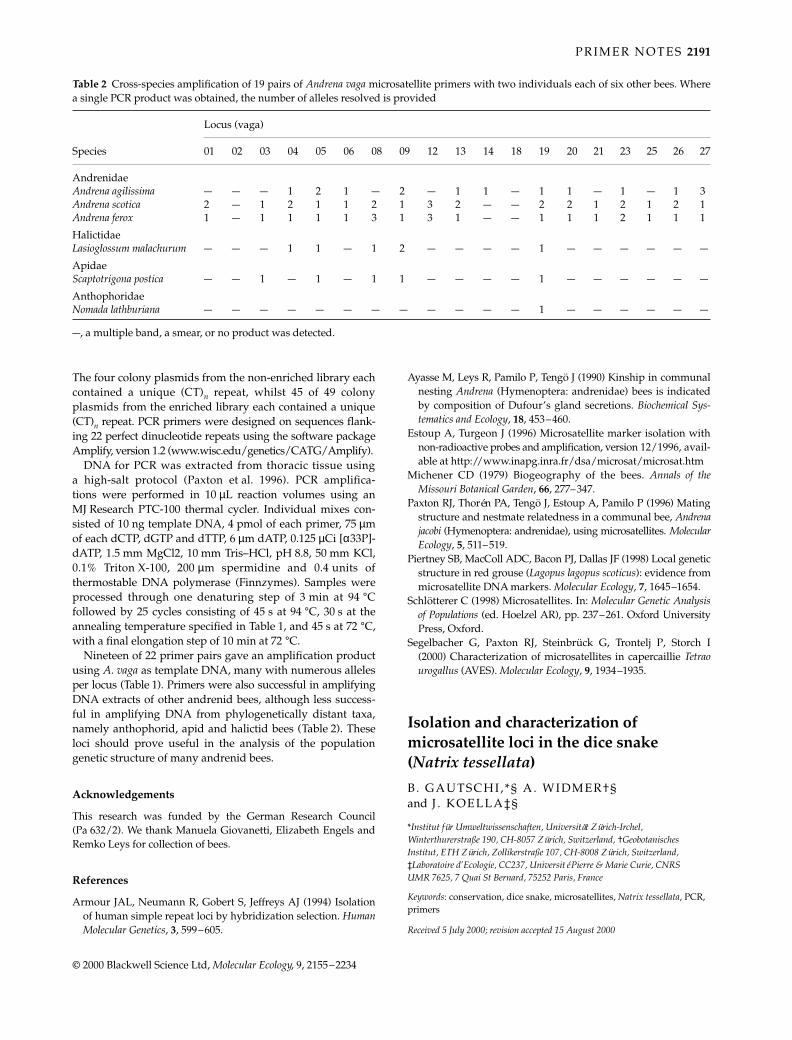
P R I M E R N O T E S 2191
© 2000 Blackwell Science Ltd, Molecular Ecology, 9, 2155–2234
The four colony plasmids from the non-enriched library eachcontained a unique (CT)n repeat, whilst 45 of 49 colonyplasmids from the enriched library each contained a unique(CT)n repeat. PCR primers were designed on sequences flank-ing 22 perfect dinucleotide repeats using the software packageAmplify, version 1.2 (www.wisc.edu/genetics/CATG/Amplify).
DNA for PCR was extracted from thoracic tissue usinga high-salt protocol (Paxton et al. 1996). PCR amplifica-tions were performed in 10 µL reaction volumes using anMJ Research PTC-100 thermal cycler. Individual mixes con-sisted of 10 ng template DNA, 4 pmol of each primer, 75 µmof each dCTP, dGTP and dTTP, 6 µm dATP, 0.125 µCi [α33P]-dATP, 1.5 mm MgCl2, 10 mm Tris–HCl, pH 8.8, 50 mm KCl,0.1% Triton X-100, 200 µm spermidine and 0.4 units ofthermostable DNA polymerase (Finnzymes). Samples wereprocessed through one denaturing step of 3 min at 94 °Cfollowed by 25 cycles consisting of 45 s at 94 °C, 30 s at theannealing temperature specified in Table 1, and 45 s at 72 °C,with a final elongation step of 10 min at 72 °C.
Nineteen of 22 primer pairs gave an amplification productusing A. vaga as template DNA, many with numerous allelesper locus (Table 1). Primers were also successful in amplifyingDNA extracts of other andrenid bees, although less success-ful in amplifying DNA from phylogenetically distant taxa,namely anthophorid, apid and halictid bees (Table 2). Theseloci should prove useful in the analysis of the populationgenetic structure of many andrenid bees.
Acknowledgements
This research was funded by the German Research Council(Pa 632/2). We thank Manuela Giovanetti, Elizabeth Engels andRemko Leys for collection of bees.
References
Armour JAL, Neumann R, Gobert S, Jeffreys AJ (1994) Isolationof human simple repeat loci by hybridization selection. HumanMolecular Genetics, 3, 599–605.
Ayasse M, Leys R, Pamilo P, Tengö J (1990) Kinship in communalnesting Andrena (Hymenoptera: andrenidae) bees is indicatedby composition of Dufour’s gland secretions. Biochemical Sys-tematics and Ecology, 18, 453–460.
Estoup A, Turgeon J (1996) Microsatellite marker isolation withnon-radioactive probes and amplification, version 12/1996, avail-able at http://www.inapg.inra.fr/dsa/microsat/microsat.htm
Michener CD (1979) Biogeography of the bees. Annals of theMissouri Botanical Garden, 66, 277–347.
Paxton RJ, Thorén PA, Tengö J, Estoup A, Pamilo P (1996) Matingstructure and nestmate relatedness in a communal bee, Andrenajacobi (Hymenoptera: andrenidae), using microsatellites. MolecularEcology, 5, 511–519.
Piertney SB, MacColl ADC, Bacon PJ, Dallas JF (1998) Local geneticstructure in red grouse (Lagopus lagopus scoticus): evidence frommicrosatellite DNA markers. Molecular Ecology, 7, 1645–1654.
Schlötterer C (1998) Microsatellites. In: Molecular Genetic Analysisof Populations (ed. Hoelzel AR), pp. 237–261. Oxford UniversityPress, Oxford.
Segelbacher G, Paxton RJ, Steinbrück G, Trontelj P, Storch I(2000) Characterization of microsatellites in capercaillie Tetraourogallus (AVES). Molecular Ecology, 9, 1934–1935.
91220001142PRIMER NOTEsPRIMER NOTEsPRIMER NOTEs1000Graphicraft Limited, Hong Kong
Isolation and characterization of microsatellite loci in the dice snake (Natrix tessellata)
B. GAUTSCHI , *§ A. WIDMER†§ and J . KOELLA‡§
*Institut für Umweltwissenschaften, Universität Zürich-Irchel, Winterthurerstraße 190, CH-8057 Zürich, Switzerland, †Geobotanisches Institut, ETH Zürich, Zollikerstraße 107, CH-8008 Zürich, Switzerland, ‡Laboratoire d’Ecologie, CC237, Université Pierre & Marie Curie, CNRS UMR 7625, 7 Quai St Bernard, 75252 Paris, France
Keywords: conservation, dice snake, microsatellites, Natrix tessellata, PCR, primers
Received 5 July 2000; revision accepted 15 August 2000
Table 2 Cross-species amplification of 19 pairs of Andrena vaga microsatellite primers with two individuals each of six other bees. Wherea single PCR product was obtained, the number of alleles resolved is provided
Locus (vaga)
Species 01 02 03 04 05 06 08 09 12 13 14 18 19 20 21 23 25 26 27
AndrenidaeAndrena agilissima — — — 1 2 1 — 2 — 1 1 — 1 1 — 1 — 1 3Andrena scotica 2 — 1 2 1 1 2 1 3 2 — — 2 2 1 2 1 2 1Andrena ferox 1 — 1 1 1 1 3 1 3 1 — — 1 1 1 2 1 1 1
HalictidaeLasioglossum malachurum — — — 1 1 — 1 2 — — — — 1 — — — — — —
ApidaeScaptotrigona postica — — 1 — 1 — 1 1 — — — — 1 — — — — — —
AnthophoridaeNomada lathburiana — — — — — — — — — — — — 1 — — — — — —
—, a multiple band, a smear, or no product was detected.
MEC1053.fm Page 2191 Wednesday, November 15, 2000 8:58 AM

2192 P R I M E R N O T E S
© 2000 Blackwell Science Ltd, Molecular Ecology, 9, 2155–2234
Correspondence: B. Gautschi. Fax: +41 1635 57 11; E-mail: [email protected] §Former address: Experimentelle Ökologie, ETH Zürich, ETH Zentrum-NW, CH-8092 Zürich, Switzerland
The dice snake, Natrix tessellata (Laurenti) 1768, has a largegeographical distribution, ranging from Italy in the west toChina in the east (Hecht 1930). While population sizes areoften large in suitable habitats, they are small in many range-marginal populations, such as along the rivers Mosel, Lahnand Nahe in Germany (Gruschwitz 1985), where populationsare in danger of becoming extinct as a consequence of eitherstochastic catastrophic events or genetic erosion. On the otherhand, allochthonous populations in Switzerland that resultfrom introductions of a small number of founding individualsmay be very large (Mebert 1993). To assess the levels of gen-etic variation within large natural populations, decliningrange-marginal populations and allochthonous populations,suitable molecular markers are necessary. Allozymes or mito-chondrial DNA are not suitable for this purpose because levelsof genetic variation in small populations are typically verylow, or because relatively large amounts of fresh blood or tissueare necessary. Microsatellites, on the other hand, are oftenvariable even in small and endangered populations and canbe easily amplified from minute amounts of DNA recoveredfrom blood samples, shed skin or faeces.
We constructed a partial genomic library enriched for CAand GA repeats using a slight modification of the proceduresdescribed by Tenzer et al. (1999) and Gautschi et al. (2000). Briefly,total genomic DNA was isolated from blood samples using astandard phenol–chloroform extraction protocol (Sambrook
et al. 1989). DNA was digested with Tsp509I (New EnglandBiolabs), 200–700 bp fragments were isolated and ligated toTSPADSHORT/TSPADLONG linker sequences (Tenzer et al.1999). DNA linker molecules were amplified according toGautschi et al. (2000) using TSPADSHORT as the polymerasechain reaction (PCR) primer, and PCR products were hybridizedto biotinylated (CA)13 and (GA)13 probes attached to streptavidin-coated magnetic beads (Dynabeads M-280 streptavidin, Dynal,France) (see Tenzer et al. 1999 for details). Enriched fragmentswere again amplified and products were cloned using theOriginal TA Cloning® Kit (Invitrogen BV) following the manu-facturer’s instructions. After dot-blotting of recombinantcolonies onto Nylon membranes (Hybond N+, AmershamPharmacia), oligonucleotide probes labelled using the ECL3′-oligolabelling and detection system (Amersham Pharmacia)were used to screen for inserts containing CA and GA repeats.The hybridization was carried out in accordance with themanufacturer’s instructions. Plasmids from positive cloneswere sequenced as described in Gautschi et al. (2000) and thesequences submitted to GenBank (Table 1). Primer design wascarried out using primer 3 software (Rozen & Skaletsky 1998),oligonucleotides were synthesized by Microsynth GmbH(Switzerland), and one primer for each pair was labelled withfluorescent dye (see Table 1).
PCR amplification for polymorphism assessment wasperformed in a 10 µL reaction volume containing 10 ng ofgenomic DNA, 50 mm KCl, 1.5 mm MgCl2, 10 mm Tris–HCl(pH 9.0), 150 µm of each dNTP (Amersham Pharmacia), 0.5 µmeach of forward and reverse primer and 0.5 units of Taq DNApolymerase (Amersham Pharmacia). We used the following
Table 1 Natrix tessellata microsatellite primer sequences, annealing temperatures (TA), population-specific allelic diversity (A), totalnumber of alleles detected (Atotal) and observed (HO) and expected (HE) heterozygosities in samples from populations from Lake Lugano(Switzerland) (n = 10) and Lake Garda (Italy) (n = 19). Repeat motifs are derived from the sequenced clones (GenBank accession numbersAF269184–AF269191)
Locus Primer sequence (5′ → 3′) TA (°C) Size range (bp) Repeat motif Population A Atotal HO HE
µNt1 GGAGTAGCCATTATTGCCAAAG 60 129–137 (CA)15 Lugano 2 4 0.000 0.340GCTCCGACCACACTTTAAGC* Garda 3 0.158 0.301
µNt2 TGGCACCATTTCAGTTTCTG 60 172–226 (CA)21 Lugano 7 10 0.600 0.735GGGACCTCATCGAAACATTG* Garda 8 0.369 0.712
µNt3 GGCAGGCTATTGGAGAAATG 63 142–156 (AC)16 Lugano 5 6 0.000 0.680GGCAAAACTCCAGGTGCTAC* Garda 4 0.053 0.652
µNt5 TGCTTTTCGGATTTGACATTC 58 116–126 (CA)2GA(CA)3GA(CA)4GA(CA)15 Lugano 5 6 0.700 0.595CTGCATTTGAAGCGTGGTAG* Garda 5 0.632 0.474
µNt6 TGCTGGCATGTGAAATCAAG 62 187–209 (CT)6CA(CT)14(GT)13TT(GT)4 Lugano 6 11 0.600 0.780GGGGCTGTTTTCTGTCAATC* Garda 10 0.474 0.819
µNt7 TTTGAAAGGAGAATGAATCGTG 58 171–185 (AC)17 Lugano 6 6 0.900 0.800CGCGAGGAATCAGAATGAAC* Garda 5 0.632 0.632
µNt8 GGGGTATCGTCCTTCCAGAC* 58 152–166 (AC)15 Lugano 5 5 0.700 0.545GCCAAGTGTTTCTTCAAGTGG Garda 3 0.632 0.571
µNt10 AATTACAGTAGGTAGGTAGTTAGGGAGG64† 291–301 (GA)27 Lugano 3 6 0.400 0.515CTGTGCCAGCAGAAACACC* Garda 5 0.368 0.501
*Fluorescent-labelled primer.†For locus µNt10, a hot-start protocol was used. The PCR conditions are as described before but with HotStarTaq™ DNA polymerase and buffer (Tris–Cl (NH4)2SO4, 1.5 mm MgCl2; pH 8.7 (20 °C), Qiagen) and an initial denaturing step of 95 °C for 15 min.
MEC1053.fm Page 2192 Wednesday, November 15, 2000 8:58 AM

P R I M E R N O T E S 2193
© 2000 Blackwell Science Ltd, Molecular Ecology, 9, 2155–2234
thermotreatment on a PTC-100™ Programmable ThermalController (MJ Research Inc.): 25–30 cycles at 95 °C for 30 s, thelocus-specific annealing temperature (Table 1) for 30 s, and72 °C for 30 s. Before the first cycle, a prolonged denatura-tion step (95 °C for 5 min) was included, and the last cyclewas followed by an extra 8 min extension. The amplified prod-ucts were diluted with double-distilled water containingGENESCAN-350 (TAMRA) Size Standard (PE Biosystems)and genotyped on an ABI Prism 310 Genetic Analyser usingGeneScanAnalysis® Software version 2.1 and Genotyper®version 2.1 software (PE Biosystems). Observed and expectedheterozygosities for each locus were calculated using Popgeneversion 1.32 (Yeh & Boyle 1997).
All eight microsatellite loci reported here were variable inNatrix tessellata and detected between four and 11 alleles inthe two populations studied. Likelihood ratio tests indicatedsignificant deviations from Hardy–Weinberg equilibrium(HWE) at loci µNt1 and µNt3, suggesting that null alleles maybe present at these loci. Genotype frequencies at all other lociconformed to HWE. These microsatellites will therefore pro-vide a valuable tool for the analysis of genetic variation innatural and allochthonous populations of the dice snake andhelp to devise appropriate conservation management strategiesfor small and endangered populations.
Acknowledgements
The work was supported by the DGHT (Deutsche Gesellschaftfür Herpetologie und Terrarienkunde), by the Barth-Fonds fromthe ETH Zürich (011/1994-28) and by a Swiss National ScienceFoundation Grant 31-49477.96 to Dr J.-P. Müller, B.G. and ProfessorB. Schmid.
References
Gautschi B, Tenzer I, Müller JP, Schmid B (2000) Isolation andcharacterization of microsatellite loci in the bearded vulture(Gypaetus barbatus) and cross-amplification in three Old Worldvulture species. Molecular Ecology, 9, 2193–2195.
Gruschwitz M (1985) Status und Schutzproblematik der Würfel-natter (Natrix tessellata LAURENTI, 1768) in der BundesrepublikDeutschland. Natur und Landschaft, 60, 353–356.
Hecht G (1930) Systematik, Ausbreitungsgeschichte und Ökologieder europäischen Arten der Gattung Tropidonotus (Kuhl) H. Boie.Mitteilungen aus dem Zoologischen Museum in Berlin, 16, 244–393.
Mebert K (1993) Untersuchung zur Morphologie und Taxonomie derWürfelnatter Natrix tessellata (LAURENTI) 1768 in der Schweizund im südlichen Alpenraum. Diploma Thesis, University of Zurich.
Rozen S, Skaletsky HJ (1998) Primer 3. Code available at http://www-genome.wi.mit.edu/genome_software/other/primer3.html
Sambrook J, Fritsch EF, Maniatis T (1989) Molecular Cloning: ALaboratory Manual, 2nd edn. Cold Spring Harbor Laboratory Press,Cold Spring Harbor, New York.
Tenzer I, degli Ivanissevich S, Morgante M, Gessler C (1999)Identification of microsatellite markers and their application topopulation genetics of Venturia inaequalis. Phytopathology, 89,748–753.
Yeh FC, Boyle TJB (1997) Population genetic analysis of co-dominantand dominant markers and quantitative traits. Belgian Journalof Botany, 129, 157.
91220001141PRIMER NOTEsPRIMER NOTEsPRIMER NOTEs100Graphicraft Limited, Hong Kong
Isolation and characterization of microsatellite loci in the bearded vulture (Gypaetus barbatus) and cross-amplification in three Old World vulture species
B. GAUTSCHI , * I . TENZER,† J . P. MÜLLER,‡ and B . SCHMID*
*Institut für Umweltwissenschaften, Universität Zürich-Irchel, Winterthurerstrasse 190, CH-8057 Zürich, Switzerland, †Institute of Plant Sciences, Pathology Group, Universitätstrasse 2, ETH-Zentrum, CH-8092 Zürich, Switzerland, ‡Bündner Natur-Museum, Masanserstrasse 31, CH-7000 Chur, Switzerland
Keywords: Aegypius monachus, conservation genetics, cross-species amplification, Gypaetus barbatus, Gyps fulvus, Neophron percnopterus
Received 25 June 2000; revision accepted 16 August 2000
Correspondence: B. Gautschi. Fax: + 41 1635 57 11; E-mail: [email protected]
During the last one hundred years the bearded vulture,Gypaetus barbatus, has suffered extreme population declinesin Europe primarily because of hunting, but changes also inagriculture, and especially in grazing practices, have resultedin poor food conditions for carrion feeders. Small populationshave survived in the Pyrenees, on Corsica and Crete. Thepopulation in the Alps was completely extinct by the beginningof the 20th century. To re-establish a self-sustaining popula-tion in the Alps, over 90 juvenile bearded vultures have beenreleased since 1986, all originating from a captive population.The amount of genetic variability in the captive and releasedpopulations, genealogical relationships between individuals,and the degree of gene flow among wild populations in thepast (represented by over 200 Museum specimens) and atpresent are important criteria in the development of a geneticmanagement strategy. We describe the development of 14microsatellite primers for conservation genetic analyses ofthe bearded vulture. We designed the primers with specialemphasis on their later use for ancient DNA (aDNA) and testedtheir suitability for use in other Old World vulture species.
We constructed a genomic library enriched for CA and GArepeats using a modification of the method described inTenzer et al. (1999). Digestion of total genomic DNA with Tsp509I(New England Biolabs), isolation of 200–700 bp fragmentsand ligation to TSPADSHORT/TSPADLONG linker sequenceswere carried out according to Tenzer et al. (1999). The ligationproduces blunt-ended molecules that were amplified in 4025 µL reactions containing 10 mm Tris-HCl, pH 9.0; 50 mmKCl, 1.5 mm MgCl2; 0.1% TritonX 100; 0.2 mg/mL BSA, 150 µmof each dNTP, 1 µm of TSPADSHORT (primer), and 1.25 U ofTaq DNA polymerase (Appligene oncor). The thermal profile ona PTC100™ Programmable Thermal Controller (MJ Research)was 30 cycles of 93 °C for 1 min, 55 °C for 1 min and 72 °Cfor 1 min. An initial 5 min extension step at 72 °C allowed theDNA polymerase to synthesize the nick between genomicDNA and linker sequences. Polymerase chain reaction(PCR) products were hybridized to biotinylated (CA)13 and(GA)13 probes that were immobilized onto Dynabeads M-280Streptavidin (DYNAL, France). Hybridization was carried out
MEC1053.fm Page 2193 Wednesday, November 15, 2000 8:58 AM

2194 P R I M E R N O T E S
© 2000 Blackwell Science Ltd, Molecular Ecology, 9, 2155–2234
as described in Tenzer et al. (1999). Retained fragments wereamplified in a second PCR as above without the initial exten-sion step. PCR products were digested with EcoRI (AmershamPharmacia) in preparation for ligation with dephosphorylatedpUC18 (precut EcoRI/BAP, Amersham Pharmacia). Followingtransformation of JM109 High Efficiency competent cells(Promega), plating onto selective agar media and dot-blottingcolonies onto Nylon-Membrane (Hybond™-N+, AmershamPharmacia), the library was screened for inserts containingCA and GA repeats using oligonucleotide probes labelledwith ECL3′-oligolabelling and detection system (AmershamPharmacia). Hybridization was carried out in accordancewith the manufacturer’s instructions.
Plasmids from positive clones were sequenced using M13forward and reverse primers and the ABI PRISM® BigDye™Terminator Cycle Sequencing Ready Reaction Kit (PE Biosys-tems). Sequences were analysed on an ABI Prism 310 GeneticAnalyser and edited with Sequence Navigator Software (PEBiosystems). Primers were designed using Primer 3 software(Rozen & Skaletsky 1998). Where possible, we consideredonly primers that did not bind to a template thymine or
cytosine residue at the 3′ end because these nucleotides aremost likely to be degraded in aDNA (Pääbo 1989). One primerfor each pair was labelled with fluorescent dye (Table 1).
To assay variation among individuals, amplifications wereperformed in 10 µL volumes containing 10 ng of genomicDNA, 50 mm KCl, 1.5 mm MgCl2, 10 mm Tris-HCl (pH 9.0),150 µm per dNTP, 0.5 µm of each primer, 0.5 U of Taq DNAPolymerase (Amersham Pharmacia), and the followingthermotreatment: 25–30 cycles of 30 s at 95 °C, 30 s at locusspecific annealing temperature (Table 1) and 30 s at 72 °C. Aninitial denaturation step (95 °C for 5 min) was included andthe last cycle was followed by an 8-min extension. Amplifiedproducts were diluted and mixed with formamide containingGENESCAN-350(ROX) Size Standard (PE Biosystems) andthe genotype was determined on an ABI Prism 310 GeneticAnalyser using GeneScan Analysis® software version 2.1 andGenotyper® software version 2.1 (PE Biosystems). We screened30 bearded vulture individuals from the captive population(Table 1), 15 Egyptian vultures, Neophron percnopterus, 15 blackvultures, Aegypius monachus, from Spain, and 10 griffonvultures, Gyps fulvus, from France (Table 2).
Table 1 Genetic characteristics of 14 bearded vulture microsatellite loci. Data on numbers of alleles and heterozygosities are based ongenotypes of 30 bearded vulture individuals. Ta, locus-specific annealing temperature; HO, observed heterozygosity (direct count); HE, unbiasedexpected heterozygosity (Nei 1978). No significant departures from Hardy–Weinberg equilibrium were detected using likelihood ratiotests. The characteristics of repeat motifs and sizes are based on the sequenced clones (GenBank Accession nos: AF270729–AF270742)
Locus Primer Sequences (5′–3′) Repeat motif Ta (°C) No. of alleles Size (bp) HO HE
BV 1 ATACTTTGGCTGCATGAAGTGC† (CA)14 58 3 101 0.400 0.371GGTCTCACTCCTTGTGTCCC
BV 2 CAGCATGTTATTTTGGCTGC† (CA)11 58 4 136 0.633 0.705TTGCTAAACCGGTTAGAAGTTG
BV 5 GTTCTGAGGGTAGAGGGACTG† (CA)17 62 6 197 0.733 0.708GCTGAGCAGCTTCAGAAAGTC
BV 6 AATCTGCATCCCAGTTCTGC† (CA)11 60 7 115 0.633 0.586CCGGAGACTCTCAGAACTTAAC
BV 7 TGAACTCCTGGAGACTTCCC† (CA)15 55* 5 247 0.467 0.502CTCCTTGTAGCGTTGCCTTC
BV 8 TGGCATGCTGCTATGAGAAC† (CA)11 60 2 113 0.067 0.066GTGCTTTGCATGCTTTTACTC
BV 9 ATCTAGGGACATCGAGGAGC† (TA)6 (CA)11 60 2 219 0.567 0.463ACAGGGATGCAGGTAAGCC
BV 11 TGTTTGCAAGCTGGAGACC† (CA)22 62 11 181 0.867 0.884AAAAGCCTTGGGGTAAGCAC
BV 12 TCAGGTTTTGACGACCTTCC† (CA)15 62 11 245 0.867 0.857GTGGTAACGGAGGAACAAGC
BV 13 AAAACAGAGTTTTCACATTTTCATAAG (CA)16 50 10 184 0.900 0.900TTCAGGAAACAGAAGCATGAAC†
BV 14 GGCAGTGTGGAGCCTACATC† (CA)16 60 6 179 0.733 0.730CTCCAGGGTCCTTGTTTGC
BV 16 CCCCTCACCTCACAGTCAC† (GA)3(CA)3A13(GA)13 62 13 221 0.867 0.825GGAGTGATTTTCATTGTCTTGC AACC(GA)8
BV 17 TGATGTGCAGATGCGTGAC† (CA)11 58 2 199 0.267 0.325GGACTCTGATGAAGCCAAGC
BV 20 GAACAGCACTGAACGTGAGC† (CA)13 58 3 141 0.267 0.320GTTTCTCCTGACAGTGAAATAACTC
*For this PCR, a hotstart protocol is needed. PCR conditions are as described before but with HotStarTaq™ DNA Polymerase and buffer (Tris-Cl (NH4)2SO4, 1.5 mm MgCl2; pH 8.7, Qiagen) and an initial denaturing step of 95 °C for 15 min.†Fluorescent labelled primer.
MEC1053.fm Page 2194 Wednesday, November 15, 2000 8:58 AM

P R I M E R N O T E S 2195
© 2000 Blackwell Science Ltd, Molecular Ecology, 9, 2155–2234
We received an individual genetic fingerprint for all analysedcaptive birds [probability of identity for sibs (PIsibs) = 7.8 × 10⁻⁵;see Taberlet & Luikart 1999)], showing that apart from theconservation genetic analysis mentioned above, these micro-satellites will provide an important tool in the long termmonitoring of the released population in the Alps.
Acknowledgements
We would like to thank Hans Frey (VeterinärmedizinischesInstitut, Universität Wien, Austria), Juan Negro (Estación BiológicaDoñana, Seville, Spain) and François Sarrazin (Université Pierreet Marie Curie, Paris, France) for providing blood samples. Thiswork was supported by the Swiss National Science FoundationGrant 31–49477.96 to JPM, BG and BS.
References
Nei M (1978) Estimation of average heterozygosity and genetic dis-tance from a small number of individuals. Genetics, 89, 583–590.
Pääbo S (1989) Ancient DNA: Extraction, characterization, molecu-lar cloning, and enzymatic amplification. Proceedings of theNational Academy of Sciences of the USA, 86, 1939–1943.
Rozen S, Skaletsky HJ (1998) Primer 3. Code available athttp://www-genome.wi.mit.edu/genome_software/other/primer3.html.
Taberlet P, Luikart G (1999) Non-invasive genetic sampling andindividual identification. Biological Journal of the Linnean Society,68, 41–55.
Tenzer I, degli Ivanissevich S, Morgante M, Gessler C (1999)Identification of microsatellite markers and their applicationto population genetics of Venturia inaequalis. Phytopathology, 89,748–753.
91220001138PRIMER NOTEsPRIMER NOTEsPRIMER NOTEs1000Graphicraft Limited, Hong Kong
Microsatellites for Barren Brome (Anisantha sterilis)
J . M. GREEN, K . J . EDWARDS, S . L . USHER, J . H. A. BARKER, E . J . P. MARSHALL, R . J . FROUD-WILLIAMS* and A. KARP
IACR-Long Ashton Research Station, Department of Agricultural Sciences, University of Bristol, Long Ashton, Bristol, BS41 9AF, UK, *Department of Agricultural Botany, School of Plant Sciences, The University of Reading, 2 Earley Gate, Reading, Berkshire RG6 6AU, UK
Keywords: Anisantha sterilis, Bromus, microsatellites, weed
Received 24 July 2000; revision accepted 16 August 2000
Correspondence: Dr Angela Karp. Fax: 01275 394007; E-mail: [email protected]
Barren Brome (Anisantha sterilis: synonym Bromus sterilis) is adiploid grass weed of cereals which naturally occurs in fieldmargins and waste ground. It is an inbreeding annual whichcan invade and compete with cereal crops especially whencereals are grown repeatedly with minimum cultivation(Cussans et al. 1994). Investigations into the genetic diversitywithin A. sterilis may provide indications of its ability torespond to future control measures. Here, we describe theidentification of polymorphic microsatellites in A. sterilis forpopulation genetic studies.
A small-insert genomic library, enriched for microsatellites,was developed using a modified procedure of Edwards et al.(1996). Genomic DNA (2 µg) was digested with RsaI and SspI.An MluI adapter [21-mer: (5′-CTCTTGCTTACGCGTGGAC-TA-3′ ) and phosphorylated 25-mer: (5′-pTAGTCCACGCGTA-AGCAAGAGCACA-3′ ) ] was ligated to the ends of the DNA
Table 2 Results of the cross-species amplification. Summarized are locus specific annealing temperature (Ta), PCR product size range and numberof alleles for each of the species tested. When amplification did not result in a clear allelic pattern, received fragment sizes are listed below
Locus
Egyptian Vulture (n = 15) Griffon Vulture (n = 10) Black Vulture (n = 15)
Ta (°C)Product size (bp)
Number of alleles Ta (°C)
Product size (bp)
Number of alleles Ta (°C)
Product size (bp)
Number of alleles
BV 1 50 100 1 50 91 1 58 91 1BV 2 55 123 1 55* 119 1 55 118 1BV 5 58* 190 1 58* 177–183 4 58 189–201 4BV 6 58 95–117 5† 58 118–120 2 55* 127–161 4‡BV 7 No amplification No amplification No amplificationBV 8 58 106 1 58 106 1 58 103 1BV 9 58* 224–228 3 58 207 1 58 205 1BV 11 58 148–150 2 58 152–162 4 58 164–180 7BV 12 58 235–239 3 58* 243–279 7§ 58 227 1BV 13 50 170–176 4 50 172–178 3 50 174–176 2BV 14 55 161–163 2 55 162–164 2 55 158 1BV 16 58 179–185 4 58 184–188 3 55 160–170 4BV 17 55* 185 1 55* 185–187 2 55 185–187 2BV 20 55 133–135 2 55 132–138 4 55 136–140 3
*For this PCR, a hotstart protocol is needed. PCR conditions are as described before but with HotStarTaq™ DNA Polymerase and buffer (Tris-Cl (NH4)2SO4, 1.5 mm MgCl2; pH 8.7, Qiagen) and an initial denaturing step of 95 °C for 15 min.†Amplification products are (in bp): 95, 97, 105, 115, 117.‡Amplification products are (in bp): 127, 133, 139, 161.§Amplification products are (in bp): 243, 245, 259, 263, 265, 267, 279.
MEC1053.fm Page 2195 Wednesday, November 15, 2000 8:58 AM

2196 P R I M E R N O T E S
© 2000 Blackwell Science Ltd, Molecular Ecology, 9, 2155–2234
fragments. Five identical reactions (25 µL each) were pre-pared: 2 µL ligated DNA, 1× polymerase chain reaction (PCR)buffer (10 mm Tris-HCl, pH 8.5, 1.5 mm MgCl2, 50 mm KCl,0.001% gelatine), 200 µm each dNTP, 300 ng 21-mer and 1 UTaq polymerase (GibcoBRL). Amplification proceeded for20 cycles (94 °C for 20 s, 60 °C for 1 min and 72 °C for 3 min)using a Perkin Elmer 9600 Thermal Cycler. Reactions werepooled, purified by phenol–chloroform extraction, concen-trated by ethanol precipitation and resuspended in 25 µLsterile distilled water (SDW).
Oligonucleotides [(CA)15, (CT)15] were cross-linked by UVirradiation to separate 0.7 cm2 nylon membranes (HybondN+, Amersham), then used to hybridize the amplified DNAin one tube, at 45 °C overnight. Filters were washed fourtimes in 2× SSC (20× SSC: 3 m NaCl, 0.3 m Na Citrate, pH 7)at 65 °C for 5 min and three times in 1× SSC at 65 °C for 5 min.Eluted DNA was ethanol precipitated and resuspended in25 µL SDW. Five identical reactions (25 µL) were prepared:2 µL DNA, 1× PCR buffer, 400 µm each dNTP, 200 ng21-mer and 2 U Taq polymerase. Amplification proceededfor 25 cycles (94 °C for 30 s, 60 °C for 1 min and 72 °C for3 min). Reactions were pooled, purified, concentrated andresuspended as before. DNA was digested with MluI andfragments were selected using a Size Sep™ 400 Spun Column(Pharmacia). Fragments were cloned into pJV1 vector andtransformed into Epicurian coli® Competent Cells (XL1-BlueMRF′ Kan Supercompetent Cells, Stratagene). Plasmid DNAwas extracted using Wizard™ Plus Minipreps DNA Purifica-tion System (Promega) and sequenced using the ABI Prism™Dye Terminator Cycle Sequencing Ready Reaction Kit.Sequences were separated on the ABI Prism 377 DNASequencer. Primers were designed using primer version 0.5(Whitehead Institute for Biomedical Research, Massachusetts)and synthesized by Genosys Inc.
Leaf samples were collected from 20 A. sterilis plants atan Oxfordshire farm and six A. diandra plants from farmsacross England. Genomic DNA was extracted using theNucleon® Phytopure Extraction Kit (Amersham). DNAwas also extracted from one seed of A. rigida (Australia).For genotyping, the forward primer was end-labelled with[γ33P]-ATP (Amersham). Microsatellite amplification wasperformed in 12.5 µL reactions: 5 ng DNA, 1× PCR buffer,200 µm each dNTP, 25 ng forward primer, 25 ng reverseprimer, 0.5 U Taq polymerase. Amplification proceeded for35 cycles (94 °C for 1 min, 54 °C for 1 min and 72 °C for1 min) and one cycle of 72 °C for 10 min. PCR productswere separated on 6% polyacrylamide denaturing gelsusing M13 control sequence as a size marker and exposedto Kodak Biomax MR-1 film overnight.
Table 2 Primer sequences and characteristics of Anisantha sterilis microsatellites
Locus Primer sequences (5′–3′) Repeat motif Size range (bp) No. of alleles Gene diversity
AS115 F: GTTGCTGCTGCCAGGCTGA (GT)19 117–131 3 0.585*† R: TTAACAAAACAGGCAACACAAS124 F: GAATGTAGATAAAAACTGGTGT (CA)5AG(CA)6AGCG(CA)20 182–184 2 0.320* R: GCACTCACTTCATAAATTCAAAS133 F: ATGGACAACCATGGCGTGAGA (TG)15C(GT)2(TG)3A(GT)4 204–210 3 0.580† R: TGATAGAAGTAATACGAGGCGAS139 F: AAACACCAAAAATAATTAAGG (TG)23 174–188 3 0.485
R: GCCCATCCAACATGTGCCAGAS147 F: ATTTTAGCTGATGTGCTTTTG (CA)28AA(CA)10GT(CA)11 194–210 5 0.780* R: ACTGTGGTGATCGTACCCGTGAS152 F: AAGGTTCAAAGTGTAAGGACG (GT)3(TG)2C(TG)2C(TG)8C(GT)14 178–187 4 0.685* R: AGGAGAAGAAGAACGAGAGAAAS184 F: CGGAATGTTGTCAGAATAGTT (AC)3(AT)7AA(GT)16(A)5 144–170 4 0.700* R: ACGAACCGTGGAACTTGTTACAS211 F: TTCTATGTAATCATGGCTTGC (CA)12 126–140 3 0.545*† R: TCCAAGGACCGACCGATCTCAS219 F: CAGGAATTTGTCAGGTTAAG (TG)15 146–150 3 0.535*† R: AGCTATAAAAGTAACCACATCA
*Polymorphic in A. diandra; †cross-amplification in A. rigida.GenBank accession nos: AF285620–AF285628.
Table 1 Microsatellite library characterization
Clones sequenced 97
Microsatellites >18 base pairs 56Of these: CA/GT repeats 41
CT/GA repeats 6CT/GA & CA/GT repeats 6Duplicated sequences 3
Primers designed 17
Monomorphic 2Unscorable 3Multilocus 2No product 1Informative 9
MEC1053.fm Page 2196 Wednesday, November 15, 2000 8:58 AM

P R I M E R N O T E S 2197
© 2000 Blackwell Science Ltd, Molecular Ecology, 9, 2155–2234
The results of sequencing and characterizing 97 libraryclones are shown in Table 1. Nine primer pairs amplifiedpolymorphic markers producing 2–5 alleles per locus andgene diversity (D = 1−Σpi
2) (Nei 1973) values from 0.32 to0.78 (Table 2). No heterozygotes were observed. Cross-amplification was investigated by testing the primers on therelated species A. diandra and A. rigida. All nine loci wereamplified from A. diandra and seven were polymorphic withbetween two and seven alleles per locus. For A. rigida, fourloci were amplified (Table 2).
Acknowledgements
We acknowledge a Lawes Trust-University of Reading studentshipaward to Miss J. Green. We thank Chloe Aldam for technicalhelp. IACR receives grant-aided support from the Biotechnologyand Biological Sciences Research Council of England.
References
Cussans GW, Cooper FB, Davis DHK, Thomas MR (1994) Asurvey of the incidence of the Bromus species as weeds ofwinter cereals in England, Wales and parts of Scotland. WeedResearch, 34, 361–368.
Edwards KJ, Barker JHA, Daly A, Jones C, Karp A (1996) Micro-satellite libraries enriched for several microsatellite sequencesin plants. Biotechniques, 20, 758–760.
Nei M (1973) Analysis of gene diversity in subdivided popula-tions. Proceedings of the National Academy of Sciences of the USA,70, 3321–3323.
91220001159PRIMER NOTEsPRIMER NOTEsPRIMER NOTEs113Graphicraft Limited, Hong Kong
Development and characterization of microsatellite loci from lynx (Lynx canadensis), and their use in other felids
L. E . CARMICHAEL, W. CLARK and C. STROBECK
Department of Biological Sciences, University of Alberta, Edmonton, AB, Canada, T6G 2E9
Keywords: cross-species amplification, felids, lynx, microsatellites, primers
Received 29 July 2000; revision accepted 18 August 2000
Correspondence: LE Carmichael. c/o Curtis Strobeck, Department of Biological, Sciences University of Alberta, Edmonton, Alberta, Canada, T6G 2E9. Fax: +780 492 9234; E-mail: [email protected]
On 24 March 2000, the United States Fish and Wildlife Servicedeclared the Canadian lynx (Lynx canadensis) to be threatenedthroughout the contiguous United States (United States Fishand Wildlife Service Website: http://www.fws.gov/). Lynxconservation programmes have been attempted in Colorado(Kloor 1999) and are currently in development throughout thecontiguous United States. Because an understanding of thegenetics of wildlife populations may assist in their conserva-tion, we set out to identify microsatellite markers that mightfacilitate population genetic studies of Canadian lynx.
Muscle tissue chips from a single lynx were frozen in liquidnitrogen and ground to powder. High molecular weight genomic
DNA was then isolated by phenol extraction (Sambrook et al.1989) and digested to completion with Sau3A. Fragmentsof 200–800 bp (size-selected as in Davis & Strobeck 1998)were cloned into BamHI-linearized M13 mp18 RF, and trans-formed into Escherichia coli strain DH5ãF′IQ (Gibco BRL) madecompetent using the SEM (18 °C) method of Inoue et al. (1990).The library was plated in 0.7% top agarose (containing X-galand IPTG) at a density of 1000–2000 plaques per 150 mmPetri plate.
Approximately 2600 recombinant clones were screenedwith a biotinylated (GT)12 oligonucleotide probe, and clonescontaining putative microsatellites identified using a non-radioactive detection kit (BluGene®, Gibco BRL). Forty-oneinsert-containing clones screened positive in the primaryplatings. These plaques were picked, regrown and replatedat low density in a secondary hybridization/detection screen.Inserts from 24 confirmed positive clones were polymerasechain reaction (PCR) amplified using universal M13 forwardand reverse primers. PCR products were then electrophoresedin 1.0% agarose (TAE) and gel-purified using the glass powderbinding method of Vogelstein & Gillespie (1979). These puri-fied products were cycle-sequenced using a dRhodamineTerminator sequencing kit (with Amplitaq DNA polymeraseFS, ABI Prism, PE Applied Biosystems) and an ABI Prism 377DNA sequencer.
Primer pairs were designed for 10 microsatellite loci usingoligo 4.0 (National Biosciences Inc.) and tested on lynxgenomic DNA extracted from muscle samples (Alberta Fishand Wildlife). Six of these loci (Table 1) gave strong, cleanPCR products. Furthermore, multiplexing allows the ampli-fication of these six loci in three 15 µL reactions: Lc 106, Lc 110and Lc 118 = 0.16 µm each primer, 160 µm dNTPs, 2 mm MgCl2,0.36 U Taq DNA Polymerase (prepared as in Engelke et al.1990) and approximately 50 ng genomic DNA [extractedusing QIAamp™ spin columns (QIAGEN)] in PCR buffer(50 mm KC1, 10 mm Tris-HC1, pH8.8, 0.1% Triton-X 100, 0.16mg/mL BSA); Lc 111 and Lc 120 = 0.16 µm each primer,160 µm dNTPs, 2mm MgC12, 1.44 U Taq DNA Polymeraseand 50 ng template DNA in PCR buffer; Lc 109 = 0.16 µm eachprimer, 120 µm dNTPs, 2 mm MgC12, 0.3 U Taq DNA Poly-merase and 50 ng template DNA in PCR buffer. All cyclingreactions were performed as in Davis & Strobeck (1998) andtheir products analysed on an ABI 377 Sequencer withGenescan and Genotyper software (Applied Biosystems).
Twenty-nine lynx tissue samples were genotyped toestimate the variability of each locus (these samples do notrepresent a population as they were collected from a varietyof sites in Alberta over approximately 15 years). Completegenotypes were obtained with a single exception: for oneindividual, locus Lc 109 could not be amplified. Size rangesand variability are given in Table 1. Mean number of alleleswas 6.17, and there was no significant difference betweenobserved and expected heterozygosity.
Six additional felid species were also tested: cougar (Felisconcolour); bobcat (Felis rufus); African lion (Panthera leo);Siberian tiger (Panthera tigris); Asian leopard cat (Felisbengalensis); and domestic cat (Felis catus, breed unknown).Table 2 summarizes the size range and number of allelesobserved in each species. Variability in cougars does not exceed
MEC1053.fm Page 2197 Wednesday, November 15, 2000 8:58 AM

2198 P R I M E R N O T E S
© 2000 Blackwell Science Ltd, Molecular Ecology, 9, 2155–2234
that observed using domestic cat loci (data not shown), andpatchy results for this species strongly suggest the existenceof null alleles. However, the level of variation observed inlynx, and the ability of these primers to amplify microsatel-lites across a range of felid species, suggests they may beuseful in a variety of population genetic studies.
Acknowledgements
We would like to thank Lisa Ostafichuk for her significant contri-bution to this work. The laboratory of Curtis Strobeck receivesoperating grants from Parks Canada and the Natural Sciencesand Engineering Research Council of Canada.
References
Davis CS, Strobeck S (1998) Isolation, variability and cross-species amplification of polymorphic microsatellite loci in thefamily Mustelidae. Molecular Ecology, 7, 1776–1777.
Engelke DR, Krikos A, Bruck ME, Ginsburg D (1990) Purificationof Thermus aquaticus DNA polymerase expressed in Escherichiacoli. Analytical Biochemistry, 191, 396–400.
Inoue H, Nojima H, Okayama H (1990) High efficiency transfor-mation of Escherichia coli with plasmids. Gene, 96, 23–28.
Kloor K (1999) Lynx and biologists try to recover after disastrousstart. Science, 285, 320–321.
Sambrook J, Fritch EF, Maniatus T (1989) Molecular Cloning: aLaboratory Manual. 2nd edn. Cold Spring Harbor LaboratoryPress, New York.
Vogelstein B, Gillespie D (1979) Preparative and analytical puri-fication of DNA from agarose. Proceedings of the NationalAcademy of Science of the USA, 76, 615–619.
91220001147PRIMER NOTEsPRIMER NOTEsPRIMER NOTEs1000Graphicraft Limited, Hong Kong
Variation at tri- and tetranucleotide repeat microsatellite loci in the fruit bat genus Cynopterus (Chiroptera: Pteropodidae)
J . F. STORZ*
Department of Biology, Boston University, 5 Cummington Street, Boston, MA, 02215, USA
Keywords: Chiroptera, Cynopterus, microsatellite DNA, Pteropodidae
Received 15 August 2000; revision accepted 22 August 2000
Correspondence: Jay F. Storz. *Present address: Department of Biology, Duke University, Box 90338, Durham, NC, 27708, USA. Fax: + 1 919 660 7293; E-mail: [email protected]
Table 1 Size range of PCR products, variability, repeat motif and primer sequences for each locus. Expected heterozygosity (HE) wascalculated using the formula (1−ΣPi
2)
LocusSize range (bp)
No. of alleles HO HE Repeat motif Primer sequences (5′−3′)
Accession no.
Lc 106 96–108 7 0.793 0.786 (T)3(GT)17 F: TCTCCACAATAAGGTTAGC AF288054R: FAM–GGGATCTTAAATGTTCTCA
Lc 109 172–182 6 0.893 0.801 (GT)18 F: AAGTGGCAAGATTACATTC AF288055R: TET–AACATCCTTTTATTCATTG
Lc 110 91–103 7 0.828 0.815 (T)3(GT)14 F: CCTTTGTCACTCACCA AF288056R: TET–CGGGGATCTTCTGCTC
Lc 111 140–154 6 0.586 0.619 (GT)17 F: GAGGATCATTGTGCAT AF288057R: FAM–ATCCACTCACCCTCTA
Lc 118 133–145 7 0.759 0.766 (T)4(GT)22(T)2 F: TGGGGTGGGAACTCTC AF288058R: TET–AGTGCCCCAGATTTTT
Lc 120 196–204 4 0.577 0.551 (T)3(GT)11(GA)13 F: TGAGCCTGAGCATACATT AF288059R: HEX–GTTTGTGAGTTGGAGCC
FAM, TET and HEX are fluorescent dye labels (Gibco BRL).
Table 2 Survey of amplification potential in six felid species. Size ranges are given in base pairs. Number of unique alleles observed/number of alleles scored is provided in brackets. ‘–’ indicates no PCR product, while ‘ + ’ represents a multiple banding pattern
LocusCougar Felis concolour
Bobcat Felis rufus
African Lion Panthera leo
Siberian Tiger Panthera tigris
Asian Leopard Cat Felis bengalensis
Domestic Cat Felis catus
Lc 106 87–97 (2/16) 87–89 (2/6) 89 (1/2) 88–98 (2/2) 93–99 (2/2) +Lc 109 191–199 (2/18) 163–169 (3/6) 171 (1/2) 163 (1/2) 169 (1/2) 167–177 (2/2)Lc 110 102–104 (2/12) 80 (1/6) 122–134 (2/2) 124 (1/2) 88–90 (2/2) 96 (1/2)Lc 111 − 136–142* (3/6) − − 146 (1/2) 140 (1/2)Lc 118 112–113 (2/16) 129–137 (3/6) − − 111 (1/2) 114–116 (2/2)Lc 120 209 (1/20) 212–220 (3/6) 205–207 (2/2) 202–208 (2/2) 201–203 (2/2) +
*Lc 111 may include an additional Bobcat allele at 194 bp.
MEC1053.fm Page 2198 Wednesday, November 15, 2000 8:58 AM

P R I M E R N O T E S 2199
© 2000 Blackwell Science Ltd, Molecular Ecology, 9, 2155–2234
Species in the fruit bat genus Cynopterus (Chiroptera: Ptero-podidae) are widely distributed across the Indomalayanregion (Corbet & Hill 1992). The two most geographicallywidespread members of the genus are the short-nosed fruitbat (Cynopterus sphinx) and the lesser dog-faced fruit bat(C. brachyotis). There is considerable uncertainty surroundingthe taxonomic relationship between C. sphinx and C. brachyotis,and the status of the many named forms within C. sphinx(Storz & Kunz 1999). The availability of polymorphic micro-satellite markers for cynopterine fruit bats would greatly aidefforts to elucidate species boundaries and genetic correl-ates of morphological variation within species. The primarymotivation for developing microsatellite markers for C. sphinxwas to investigate the influence of polygynous mating andharem social organization on population genetic structure(Storz et al. 2000a,b). Efforts are also underway to investigatecomparative levels of geographical differentiation in bodysize and microsatellites in Indian populations of C. sphinx(see Storz et al. 2000c).
Genomic DNA was isolated from wing-membrane biopsysamples of C. sphinx using QIAamp extraction columns(Qiagen). Microsatellite loci were isolated from three genomiclibraries enriched for tri- and tetranucleotide repeat motifsfollowing the methods of Jones et al. (2000). Following partialdigestion with a combination of seven blunt-end restrictionendonucleases, size-selected genomic fragments (350–650 bp)were ligated to 20 bp oligonucleotide adapters that containeda HindIII restriction site. Genomic fragments were subjectedto magnetic bead capture using the following 5′-biotinylatedoligonucleotides: ATG8, CATC8, and TAGA8 (Integrated DNATechnologies). Captured fragments were Polymerase chain
reaction (PCR)-amplified using primers complementary to theadapter sequences. The resultant products were ligated into theHindIII restriction site of the plasmid pUC19. Recombinantplasmids were transfected into Escherichia coli strain DH5αby electroporation. Colonies were screened according tothe protocol of Jones et al. (2000). Following PCR amplifica-tion, a total of 27 clones in the size range 350–650 bp weresequenced using Prism Cycle Sequencing kits and labelleddNTP’s (Applied Biosystems). Sequences were resolved onan ABI 373 automated sequencer (Applied Biosystems).
All clone sequences contained at least one microsatellitelocus. Primers were designed for a total of 21 microsatelliteloci using the program Designer PCR version 1.03 (ResearchGenetics). Primer pairs were tested by amplifying DNA fromeight individual C. sphinx sampled from various localities inpeninsular India. Sixteen primer pairs amplified variablePCR products, as revealed by electrophoresis in 3.5% agarosegels followed by ethidium-bromide staining. Nine primerpairs that yielded the most consistent results were selectedfor further testing, and the forward primer of each pair wasfluorescently labelled with 6-FAM, TET, or HEX (AppliedBiosystems). PCR was performed using 20 µm of eachprimer, 5 mm dNTP’s, 25 mm MgCL2, 0.012 U of AmpliTaqDNA polymerase (Applied Biosystems), 10× PCR buffer(100 mm Tris-HCl buffer, pH 8.3, 500 mm KCl), ddH2O,and 10 ng of template DNA in a total reaction volume of15 µL. Thermal cycling was performed in a GeneAmp PCRSystem 9700 (Applied Biosystems) under the followingconditions: initial denaturation at 94 °C for 2 min followedby 35 cycles of denaturation at 94 °C for 30 s, annealingat 55–57 °C (Table 1) for 45 s, and extension at 72 °C for
Table 1 Primer sequences and characteristics of nine tri- and tetranucleotide repeat microsatellite loci used in the genetic analysis ofCynopterus sphinx from Pune, India (18°32′ N, 73°51′ E). Repeat numbers refer to cloned alleles and plus signs denote sequence interrup-tions between tracts of ≥2 repeat units. Ta, annealing temperature; n, number of bats genotyped per locus; NA, number of alleles per locus;HO, observed heterozygosity; HE, expected heterozygosity. Loci CSP-4, CSP-6, and CSP-7 segregated subsets of alleles that differed by2 bp rather than 4 bp. It is not known whether this was due to interruptions within the array of tetranucleotide repeats or insertions/deletions in flanking sequences
Locus Primer sequences (5′–3′) Repeat motif Ta (°C) Allele size range n NA HO HE GenBank accession no.
CSP-1 F: GGGGAAACAAAGGAAAAGT (ATC)2+4+5+3 55 191–218 431 9 0.73 0.71 AF289705R: AGAAAAGTGAGACCTGACAGAG
CSP-2 F: CCCGATGATGGATTTCTAC (ATC)3+13+2 57 113–134 431 7 0.78 0.74 AF289706R: CTGGGCTGTAATAAGTGCTC
CSP-3 F: AACACCACCACCACCACTA (ATC)8 57 95–107 431 5 0.37 0.38 AF289707R: TGTGGCAACAACTCAGACA
CSP-4 F: GAGAGGACTCCGTTCTTTTAGA(CATC)12 57 139–163 431 10 0.79 0.78 AF289708R: ATGGATGGGTGACAGATGA
CSP-5 F: CATTTGTGGTAACTTGTGATG (ATGG)8(ACGG)4 55 110–170 431 12 0.76 0.73 AF289709R: ACAGCAGTGAAACTTCCTCT
CSP-6 F: TGAGGAGTGTTCCCGAGTA (CATC)10 55 127–219 431 14 0.81 0.85 AF289710R: AAAAATCCCAACGCACAG
CSP-7 F: CCACAAGAAACCCAATACTAAC(TATC)3+8 57 231–265 431 17 0.82 0.82 AF289711R: CTTCCTAGCCCCACAATC
CSP-8 F: CCAGGTGTTATGGGTTGA (TAGA)3+3+5+11 57 150–202 420 14 0.75 0.74 AF289712R: TGAGGTGTTGGGAGTTTG
CSP-9 F: GGTCCCTCTGCTCTTCAG (TAGA)3+7 57 278–298 431 5 0.49 0.47 AF289713R: AGCATGGGGAATATAGTCAAG
MEC1053.fm Page 2199 Wednesday, November 15, 2000 8:58 AM

2200 P R I M E R N O T E S
© 2000 Blackwell Science Ltd, Molecular Ecology, 9, 2155–2234
50 s (with a final extension at 72° for 2 min 30 s). Allelesizes were quantified using an ABI Prism 377 automatedsequencer and analysed using genescan software (PEApplied Biosystems).
To assess levels of variation in C. sphinx and C. brachyotis,microsatellite genotypes were obtained for a total of 731 bats(620 C. sphinx and 111 C. brachyotis). A total of 431 adults andjuveniles of C. sphinx from a single population in Pune, India(Storz et al. 2000b) were genotyped at all nine loci (Table 1). Atotal of 185 known mother–offspring pairs were examined,and no genotypic mismatches were observed at any locus.
Using a subset of five microsatellite loci, an additional 189C. sphinx that were sampled from localities in south-westernIndia (see Storz et al. 2000c), and 111 C. brachyotis that weresampled from high-elevation wet forest sites in the WesternGhats were genotyped. In the total sample of C. sphinx (n = 620),mean number of alleles per locus was 12.4 (range = 6–21;Table 2). Although preliminary screening of 20 individualsindicated that CSP-2 was monomorphic in C. brachyotis, theremaining four loci segregated 4–17 alleles. Relative to C. sphinx,homologous loci in C. brachyotis segregated alleles thatwere generally shorter in length (Table 2). These markersshould open up many new opportunities for studying thepopulation biology and phylogeography of Old World fruitbats.
Acknowledgements
Funding was provided by the National Geographic Society,the Lubee Foundation, and the National Science Foundation(DEB 97–01057). I thank H. R. Bhat, J. Balasingh, G. Marimuthu,P. T. Nathan, A. A. Prakash, and D. P. Swami Doss for assistancewith field collections.
References
Corbet GB, Hill JE (1992) The mammals of the Indomalayan Region: asystematic review. British Museum Publications, Oxford Univer-sity Press, Oxford.
Jones KC, Levine KF, Banks JD (2000) DNA-based genetic markersin black-tailed and mule deer for forensic applications. CaliforniaFish and Game, 86, in press.
Storz JF, Balasingh J, Bhat HR et al. (2000c) Clinal variation in body-size and sexual dimorphism in an Indian fruit bat, Cynopterussphinx (Chiroptera: Pteropodidae). Biological Journal of the LinneanSociety, 71, in press.
Storz JF, Balasingh J, Nathan PT, Emmanuel K, Kunz TH (2000a)Dispersion and site-fidelity in a tent-roosting population ofthe short-nosed fruit bat (Cynopterus sphinx) in southern India.Journal of Tropical Ecology, 16, 117–131.
Storz JF, Bhat HR, Kunz TH (2000b) Social structure of a poly-gynous tent-making bat, Cynopterus sphinx (Megachiroptera).Journal of Zoology (London), 251, 151–165.
Storz JF, Kunz TH (1999) Cynopterus sphinx. Mammalian Species,613, 1–8.
91220001149PRIMER NOTEsPRIMER NOTEsPRIMER NOTEs0000Graphicraft Limited, Hong Kong
Isolation and characterization of microsatellite DNA loci in Japanese flounder Paralichthys olivaceus (Pleuronectiformes, Pleuronectoidei, Paralichthyidae)
M. SEKINO* and M. HARA†
*Tohoku National Fisheries Research Institute, Shinhama, Shiogama, Miyagi, 985–0001, Japan, †National Research Institute of Aquaculture, Nansei, Watarai, Mie, 516–0193, Japan
Keywords: DNA, Japanese flounder, microsatellites, Paralichthyidae, Paralichthys olivaceus
Received 15 August 2000; revision accepted 22 August 2000
Correspondence: M. Sekino. Fax: + 81 22-367-1250; E-mail: [email protected]
Table 2 Summary statistics for five tri- and tetranucleotide repeat microsatellite markers used in the genetic analysis of Cynopterus sphinx(from localities <18° N latitude) and C. brachyotis in peninsular India. n, number of bats genotyped per locus; NA, number of alleles perlocus; HO, observed heterozygosity; HE, expected heterozygosity. In both species, locus CSP-7 segregated multiple alleles with lengthsthat differed by 2 bp, even though the cloned allele was a (TATC)n repeat
Locus
Cynopterus sphinx (southern localities) Cynopterus brachyotis
Allele size range n NA* HO HE Allele size range n NA HO HE
CSP-1 191–224 189 12 0.79 0.86 176–227 111 12 0.61 0.69CSP-2 119–134 189 6(7) 0.74 0.71 101 20 1 0 0CSP-5 130–190 189 11(16) 0.82 0.81 110–166 111 11 0.29 0.34CSP-7 227–285 189 21 0.78 0.84 229–263 111 17 0.72 0.86CSP-9 286–302 189 5(6) 0.55 0.60 270–282 111 4 0.45 0.49
*Numbers in parentheses refer to numbers of alleles observed in the complete sample of C. sphinx, from Pune and the southern localities (n = 620 bats).
MEC1053.fm Page 2200 Wednesday, November 15, 2000 8:58 AM

P R I M E R N O T E S 2201
© 2000 Blackwell Science Ltd, Molecular Ecology, 9, 2155–2234
Japanese flounder Paralichthys olivaceus is an importantspecies consisting coastal fisheries resources in Japan, and isof high commercial value. Interest has been directed towardresource enhancement, and accordingly, millions of P. olivaceusare released into Japanese coastal fisheries grounds everyyear (Furusawa 1997), yet little is known about reproductivesuccess of the stocked fish. To promote effective stockingmanagement, it is necessary to monitor the fate of stockedfish and their relatedness apart from naturally reproducedfish. Microsatellite DNA loci are expected to provide aninvaluable tool for this purpose because of the power andability of microsatellite markers in regard to resolutionfor genetic relatedness among individuals (Blouin et al.1996) and parentage determination (O’Reilly et al. 1998).Here, we describe the characterization of microsatellitesisolated from P. olivaceus that will be useful to address thestocking effects.
The method described by Sekino et al. (2000) was usedfor cloning P. olivaceus microsatellites. In brief, genomicDNA was fragmented by sonication. Sonicated fragmentswere blunted by mung bean nuclease (Takara, Shiga, Japan),and the fragments ranging from 300–500 bp were recovered.The fragments were ligated into SrfI site of pCR-ScriptAmp SK(+) vector (Stratagene, La Jolla, CA, USA), and recom-binant plasmid vector was transformed into XL2-BlueMRF′ ultracompetent cells (Stratagene). Single-strandedDNA was prepared, and selective second-strand DNAsynthesis was employed using (CA)12 oligonucleotide andcloned pfu DNA polymerase (Stratagene). The resultantdouble-strand DNA was transformed into XL2-Blue MRF′cells again and these transformants were referred to a (CA)n-enriched library. From the library, 80 clones were randomlychosen, and plasmid DNAs were purified using GFXMicro Plasmid prep kit (Amersham Pharmacia Biotech,Uppsala, Sweden). The DNA sequences were determinedin both directions using Thermo Sequenase™ cycle sequen-cing kit (Amersham Pharmacia Biotech) in combinationwith KS and T3 primers and subjected to an ALFexpressautomated DNA sequencer (Amersham Pharmacia Biotech).Of the 80 clones, 59 contained one or more repeatsequences. We designed 27 polymerase chain reaction(PCR) primer pairs using a Premier software package(Premier Biosoft International, Palo Alto, CA, USA). Toexamine microsatellite polymorphisms, PCR was employed.PCR amplification was carried out in a 20 µL reactionvolume, which included 20 pmols of each primer set (oneprimer in each pair was 5′ end-labelled with Cy5), 100 µm ofeach dNTP, 10 mm Tris-HCl (pH 8.3), 50 mm KCl, 1.5 mmMgCl2, 0.001% gelatin, 0.5 U of Ampli Taq GoldTM (PerkinElmer, Foster City, CA, USA), and approximately 50 ngof template DNA using PC-960G gradient thermal cycler(Corbett Research, Mortlake, NSW, Australia). PCR ampli-fication cycles were as follows: 12 min at 95 °C, 35–40 cyclesof 30 s at 94 °C, 1 min at a primer-specific temperature, 1 minat 72 °C, and final elongation for 5 min at 72 °C. Analyses ofPCR products were performed using ALFexpress sequencerin combination with an Allelelinks software package (Amer-sham Pharmacia Biotech).
All 27 microsatellite loci were successfully amplified,
out of which we finally chose 16 primer sets (the remain-ing 11 having been rejected because their polymorphismswere low, and/or they produced unexpected PCRproducts in an initial sample of P. olivaceus) and assessedfurther microsatellite polymorphisms in a natural P. olivaceuspopulation collected from the Japanese coast of the JapanSea.
As shown in Table 1, the number of alleles ranged from4–40, and the observed and expected heterozygosity rangedfrom 0.43–0.99 and 0.43–0.97, respectively. All but one of the16 loci conformed to Hardy–Weinberg’s (HW) equilib-rium in the Markov-chain method (parameters used; 100 000Markov-chain steps; 10 000 dememorization steps), usingan Arlequin verion 1.1 software package (Schneider et al.1997). At the Po31 locus, the observed genotype frequen-cies showed significant departure from HW expectations(P < 0.05) with a large discrepancy between the observedand expected heterozygosity (0.34 and 0.91, respect-ively). This may be explained by sampling errors due tolimited sample size or substructuring of the samples, how-ever, this seems unlikely because the observed genotypefrequencies in all other 15 loci were consistent with theexpectations. We believe that the presence of null alleles(Pemberton et al. 1995) may be a valid explanation causingthese results. Further investigation of this topic isnecessary. Microsatellite DNA loci described in thepresent study possess hypervariability, suggesting thatthese loci will be useful for genetic monitoring of stockedP. olivaceus in furthering our understanding of stockingeffects.
Acknowledgements
We express gratitude to Dr H. Takahashi, National ResearchInstitute of Agro-biological Resources, for the technical advisesand contributions.
References
Blouin MS, Parsons M, Lacaille V, Lotz S (1996) Use of micro-satellite loci to classfy individuals by relatedness. MolecularEcology, 3, 393–401.
Furusawa T (1997) Key problems of sea-farming associated withits perspective. In: Biology and Stock Enhancement of JapaneseFlounder (eds Minami T, Tanaka M), pp. 117–126. Koseisha-koseikaku, Tokyo. (in Japanese).
O’Reilly PT, Herbinger C, Wright JM (1998) Analysis of parentagedetermination in Atlantic salmon (Salmo salar) using micro-satellites. Animal Genetics, 29, 363–370.
Pemberton JM, Slate J, Bancroft DR, Barrett A (1995) Nonamplify-ing alleles at microsatellite loci: a caution for parentage andpopulation studies. Molecular Ecology, 4, 249–252.
Schneider S, Kueffer JM, Roessli D, Excoffier L (1997) Arlequinversion 1.1: A software for population genetic data analysis.Genetics and Biometry Laboratory, University of Geneva,Switzerland.
Sekino M, Takagi N, Hara M, Takahashi H (2000) Microsatellitesin rockfish Sebastes thompsoni (Scorpaenidae). Molecular Ecology,9, 634–636.
MEC1053.fm Page 2201 Wednesday, November 15, 2000 8:58 AM

2202P
RIM
ER
NO
TE
S
© 2000 B
lackwell Science L
td, M
olecular Ecology, 9, 2155–2234
Table 1 Core repeat and primer sequences, PCR amplification conditions, and results of variability of the 16 microsatellite loci in a Paralichthys olivaceus population. HO is observed andHE is expected heterozygosity
Locus Core repeat sequence (5′−3′) Primer sequence (5′−3′) Anneal. (°C) Sample size No. of alleles Size range† (bp) HO HE P‡GenBank accession no.§
Po1 (TG)3T2(TG)8 F-GCCTTTTGTCAGCCATTAACAGAGC55 67 20 160–216 0.68 0.71 0.84 AB046745R-CTGAGGCCAGACATGACATTACCTT
Po13 (TG)3GA(CA)13 F-CGGCCTAAACCTGGACATCCTCTCTA58 69 23 206–276 0.78 0.92 0.18 AB046746R-CGGGACAACGGAGGTTTGACTGAC
Po20 (CACG)4(CA)4CG(CA)18 F-TGCTCCTTCACCTGCACGGCCTCAAA58 69 40 239–379 0.99 0.97 1.00 AB046748C(GT)3 R-TGCACCCTGACCTGTCACTGGGGATT
Po25A (GATG)2A2CA(GATG)10 F-TGAGGAGTCAGGTTTCAGGCCACT 55 68 12 201–253 0.76 0.76 0.26 AB046749R-TCGCAGGAACACCCAGAGTACAGA
Po26 (CA)6CGCACGGA(CA)7 F-ACACTGGGCCCTCTGTTAAACAC 55 67 5 141–159 0.73 0.65 0.72 AB046750R-AGAGGAGAAAGGGCACCGAGATA
Po31 (CA)4(GA)2(CA)11 F-AGGGTTAATTATAGAGGACGCAG 57 69 25 129–193 0.43 0.91 0.00* AB046751R-CTGAAACAACAACTCAGAAGACG
Po33 (TG)5T2(TG)10 F-GTTGGTTTAACTGATTCATCTGCAG 55 69 10 257–290 0.74 0.68 0.82 AB046752R-TTACATATCCCACAATGCTTCACTC
Po35 (CA)7 F-TGGTTCTAGTGTTTGTCTGGTGA 54 69 15 283–333 0.81 0.78 1.00 AB046753R-CCTACAGCACAGATATGACCTTT
Po42 (CA)5(TA)13(CA)3 F-CGAGCGCTGTTTCAACTACGGTCATT55 69 23 164–224 0.88 0.91 0.67 AB046754R-ATGATGATCTAACCGTCCGGCTCCAT
Po48 (CACG)4(CA)5 F-GCCTCCAGAAACATTTATGGGG 55 64 6 126–142 0.44 0.43 0.69 AB046755R-TGTCTTGCCTCTGGTCCTTCTT
Po52 (CA)2CG(CA)6 GA(CA)5 F-TCAGACAGAGGAGCGGGGTTGTTGC58 64 4 155–163 0.46 0.50 0.62 AB046756R-GCTGTACCCAGGGTTCCGCTGAAGA
Po56 (AC)20 F-TCGAGCGTAAACAAACCAGCTAACA55 69 26 139–205 0.94 0.94 0.62 AB046757R-GCTGAAAATCGCTTTAGCTTCCCAT
Po58 (CA)11(GA)2GC(GA)9 F-GCCCCTCACTGAGACTGTGACA 52 69 27 101–159 0.84 0.90 0.52 AB046758R-CAAGGTATGTGCATGAGCAGGC
Po83 (CA)5AG(CG)2(TG)3 F-TGCGGTCATCATGTCTTTAAAATA 57 68 32 227–313 0.91 0.93 0.18 AB046759(CG)2(CA)15 R-AGCAAATGTTTGCTTTTGGATACA
Po89 TA3(CA)7 F-ATCAGAAGTCATCCATGCACTGGCAC60 69 20 252–327 0.86 0.90 0.44 AB046760R-AGCTACTTATCCACAGGTGTCGACGG
Po91 (CA)18 F-AGGTTTCAAGGTGTTCATTGCGAGTC55 69 34 146–246 0.96 0.94 0.97 AB046761R-TAAAGGAAGTGCCTCACTGTGGAGAA
mean 20.1 — 0.76 0.80 —
†Size is indicated as number of the base pairs of PCR products.‡P is the exact P-value estimated by a test anologous to Fisher’s exact test described by Schneider et al. (1997). Significant departure of the observed genotype frequencies from H-W expectations was determined by adding *P < 0.05.§The nucleotide sequence data will appear in the DDJB/EMBL/GenBank nucleotide databases with the accession numbers.
ME
C1053.fm
Page 2202 W
ednesday, Novem
ber 15, 2000 8:58 AM

P R I M E R N O T E S 2203
© 2000 Blackwell Science Ltd, Molecular Ecology, 9, 2155–2234
91220001156PRIMER NOTEsPRIMER NOTEsPRIMER NOTEs0000Graphicraft Limited, Hong KongPolymorphic microsatellite loci for primitively eusocial Stenogastrine wasps
YONG ZHU,* MONICA LANDI , * DAVID C. QUELLER,* STEFANO TURILLAZZI† and JOAN E. STRASSMANN*
*Department of Ecology and Evolutionary Biology, Rice University, PO Box 1892, Houston, TX 77251–1892, USA, †Department of Biologia Animale e Genetica, University of Firenze, Italy
Keywords: cooperation, Eustenogaster, kin selection, microsatellite, sociality, wasp
Received 6 July 2000; revision accepted 22 August 2000
Correspondence: Joan E. Strassmann. Fax: (713) 285 5232; E-mail: [email protected]
Social wasps of the subfamily Stenogastrinae live inSouth-east Asia and comprise about 50 described speciesin six genera (Turillazzi 1996). Most species in this tropicalsubfamily of Vespidae have a colony with a small numberof individuals and a simple temporal division of labour whichmakes them a suitable group for studying the origin ofsociality in wasps (Turillazzi 1991; Strassmann et al. 1994).
Microsatellite loci are useful tools for studying Stenogastrinepopulation structure, relatedness within colonies and brood,and for determining males (Queller & Strassmann 1993). Allof these are crucial factors for understanding Stenogastrinesocieties. In this paper, we describe 33 microsatellite loci isolatedfrom Eustenogaster fraterna that are likely to be useful in thisand many other species of the subfamily Stenogastrinae.
We made a partical genomic library of E. fraterna follow-ing published protocols (Strassmann et al. 1996), but used apositive-selection plasmid (pZErO-2.1, Invitrogen) whicheliminated the need for plasmid dephosphorylation. We cutgenomic DNA with Sau3AI then ligated the fragments rang-ing from 300–900 bp into pZErO-2.1 plasmids. We transformedTOP10F′ cells to obtain a 15 000 clone library which was platedinto nylon. Probing library replicates with oligoncleotides ofall 10 trinucleotide motifs yielded 361 positives. Southern blotsof plasmid DNA confirmed 121, 70 of which were sequenced.We designed polymerase chain reaction (PCR) primers for 31clones containing five or more trinucleotide repeats, and twoclones consisting of long dinucleotide repeats (Table 1).
We evaluated these primers for heterozygosity on 24individuals from six species following standard protocols(Strassmann et al. 1996). We extracted genomic DNA first andthen performed PCR in a 10-µL volume with final concentra-tions of 50–200 ng genomic DNA, 250 nm of each primer,100 µm of each dNTP, 50 mm KCl, 10 mm Tris-HCl pH 9.0,0.1% Triton X-100, 1.55 mm MgCl2, 1.875 µCi 35S-dATP and0.25 U Taq DNA polymerase under an oil overlay. We ran 40cycles of 30 s at 92 °C denaturing, 30 s primer annealing(temperature varied depending on each primer and species)and 45 s extension at 72 °C, followed by 5 extra minutes at72 °C to allow for the complete extension of all PCR frag-ments using a PTC-100 thermocycler (MJ Research). PCRproducts were run on 6% denaturing acrylamide gels, and anM13 sequence was used as a size standard.
Of the 33 primer pairs we designed, 29 yielded scorablemicrosatellite alleles. The number of alleles and expectedheterozygosity of each variable locus in different speciesare detailed in Table 2. Out of 33 microsatellite loci, 27 werepolymorphic in E. fraterna though heterozygosity variedfrom 0.20–0.81. Eighteen and 15 loci were polymorphic inE. calytodoma and Eustenogaster sp., respectively. Six lociwere polymorphic in both Parischnogaster jacobsoni andP. alternata. Ten loci were polymorphic in Liostenogasterflavolineata. These results were congruent with the findingthat polymorphisms of microsatellite loci decrease withincreasing phylogenetic distance cross species (Ezenwaet al. 1998; Zhu et al. 2000).
We analysed the relationship between repeat length andheterozygosity. Repeat length was represented by two meas-ures: (i) the number of longest perfect, uninterrupted repeats;and (ii) total number of repeats including ones with base pairimperfections. We found significantly positive correlationsbetween heterozygosity and repeat length (both perfectP = 0.038 and total P = 0.011, Spearman correlation). We hadmore than two microsatellite loci in E. fraterna for three repeatmotifs, AAG, AAT and GAC. If we split the analysis fordifferent motif types, we found no significant relationshipsbetween repeat length (either perfect or total) and hetero-zygosity for these three repeat motifs. Both correlations forthe GAC motif were insignificant. Small sample size leads toa lack of power and might obscure any relationship betweennumbers of repeats and heterozygosity for these motifs.
Acknowledgements
We thank Rosli Hashim for permission to collect samples inMalaysia. We also thank Michael Henshaw for laboratory advice.This research was supported by NSF grants, IBN9975351 andIBN9808809.
References
Ezenwa VO, Peters JM, Zhu Y et al. (1998) Ancient conservationof trinucleotide microsatellite loci in Polistine wasps. MolecularPhylogenetics and Evolution, 10, 168–177.
Queller DC, Strassmann JE (1993) Microsatellites and kinship.Trends in Ecology and Evolution, 8, 285–288.
Strassmann JE, Hughes CR, Turillazzi S, Solis CR, Queller DC(1994) Genetic relatedness and incipient eusociality in steno-gastrine wasps. Animal Behavior, 48, 813–821.
Strassmann JE, Solis CR, Peters JM, Queller DC (1996) Strategiesfor finding and using highly polymorphic DNA microsatelliteloci for studies of genetic relatedness and pedigrees. In: MolecularMethods in Zoology and Evolution (eds Ferraris J, Palumbi S),pp. 163–178, 528–549. Wiley, New York.
Turillazzi S (1991) The Stenogastrinae. In: Social Biology of Wasps(eds Ross KG, Matthews RW), pp. 74–98. Cornell UniversityPress, Ithaca.
Turillazzi S (1996) Polistes in perspective: comparativesocial biology and evolution in Belonogastrinae. In: NaturalHistory and Evolution of Paper-wasps (eds By Turillazzi S,West-Eberhard), pp. 235–247, Oxford University Press, Oxford.
Zhu Y, Queller DC, Strassmann JE (2000) A phylogeneticperspective on sequence evolution in microsatellite loci. Journalof Molecular Evolution, 50, 324–338.
MEC1053.fm Page 2203 Wednesday, November 15, 2000 8:58 AM

2204 P R I M E R N O T E S
© 2000 Blackwell Science Ltd, Molecular Ecology, 9, 2155–2234
Table 1 Characteristics of 28 microsatellite loci in social wasp Eustenogaster fraterna
Locus Size (bp) Ta (°C) Repeat motif PO Primers sequences (5′−3′) Accession no.
EF79TCT 176 51 (AAG)13 F TCGCTGTTCGACCATCG AF225508R AATTCTTACCGCCGAATGG
EF80CTT 173 50 (AAG)15 F TGTCTTTCGCCTAACCG AF225495R CCTCCTGCCTGTTTCTTG
EF91CTT 161 53 (AAG)7 F GACCGTTCCAACTGGCA AF225510R CGACGTGTGAAATAAAGCAGGAG
EF92CTT 173 54 (AAG)9 F TCTACCGCCAACAGTCCCA AF225511R CGAACGAGAAAAGTCCAAGCA
EF97AAG 183 49 (AAG)8AAT(AAG)2 F GGGTTCCTTTATTAGTCCAAC AF225487AAT(AAG)2 R TTCCTGGAGCATCCGTAAGC
EF98AAG 246 57 (AAG)9 F ATTGAGATGCAGAGAGCGTCGG AF225488R AACAGGAGCACGGAGAAGAGGAAG
EF99AAG 153 51 (AAG)6 F CTGTCGTTCGTTTCGTTCTTCC AF225489R AGTAGCGAGCAGATGATGATGATG
EF103AAG 258 53 (AAG)7 F TCCCTTCTCCTTCTCTTCGC AF225479R CCTCCTTACTCCTTCTGGAC
EF104AAG 125 52 (AAG)14 F CGACCAGTGGCGTTTCA AF225502R CCCTTACCGTTGAGACCCTG
EF107AGA 217 55 (AAG)9 F AAGCAAGGACGCACAGG AF225497R ATCGACCGATGCACCGA
EF109AAG 178 53 (AAG)7AGA(AAG)5 F CGCCTACAGAGTTCCTTG AF225490R CGTCCTCGTTCATGGATTG
EF131CAT 121 51 (CAT)4CGT(CAT)2 F TCATCTTCGTTGTCCTCG AF225480R AAGCGGTTCTCTCGATG
EF183AAG 124 49 (AAG)8GAG(AAG)4 F GCTCTTTGGGAATTTCTCG AF225498R CGTTTCTCTTCGTCTTCG
EF184AAC 117 51 (AAC)12AAA(AAC)2 F GCTCACATTTTTTCCCAGTCCC AF225481R AATCTGCGTGCGTTGTTCTTG
EF189TAA 206 48 (AAT)14 F CGGATCTCGTAACGACTGATA AF225503R GGAGCAAGTTGAAGGTACAA
EF197TTC 141 50 (AAG)8 F ACTCGGAAGCAACCTCG AF225504R TGGAAAAGGCGGTAGAG
EF201TCT 175 50 (AAG)8 F GCGTGCCTCGAACATTA AF225499R TGGAAAAGGCGGTAGAG
EF204TTC 187 54 (AAG)6ACG(AAG)2 F GCGTTGTCCAGTCGTTTAACA AF225505R TCGGCACGAAGACGATG
EF211CTT 214 53 (AAG)7 F AGGCTCTTCAGACGCTG AF225492R TGGTGTAATCCGTGAGTGAG
EF213AAT 238 50 (AAT)10 F GCGATTTGAAGAAGCATTTAGTCG AF225483R CAGGAAGTATATTAAGTGAAGCGTG
EF217GA 237 52 (AG)4AA(AG)19 F GAAACTTTGCTCGCACACTG AF225484R TCTATTCAGGGGAGGAAAAGC
EF229AAG 175 52 (AAG)14TAG(AAG)3 F TGTAGGAAGAACGAAGGGTG AF225506R GAGTGATTGATGGTCCGAGA
EF238AAT 212 48 (AAT)12 F GGATCACCGTGTAAAGACG AF225500R CGATTTTTCTCGTTCGACGAAG
EF280GCA 252 55 (CAG)3CAA(CAG)5 F CGCAGTCATCGCTTTTCA AF225493R CCTAACCTACCCCAATCG
EF290CCT 121 54 (GAG)8AG(GAG)2 F TCTTGCGTTCGTTCGGA AF225501R GCAGAGCGGAAAAAAGGG
EF293CAG 197 55 (GAC)2AAC(GAC)6 F CGCAGTCATCGCTTTTCA AF225494R GCATCGGCAACAGGAAA
EF299TGC 184 55 (GAC)9 F AGCTATCTCGGCTGTCG AF225507R CTCCATCCATCCATCCA
EF318CAG 144 58 (GAC)15 F GTTTATCGCTCGTTGCTATCGG AF225486R CTCCTATCCATCGCCCTTTCTC
Ta (°C), Annealing temperature; PO, primer orientation; F, forward primer; R, reverse primer.
MEC1053.fm Page 2204 Wednesday, November 15, 2000 8:58 AM
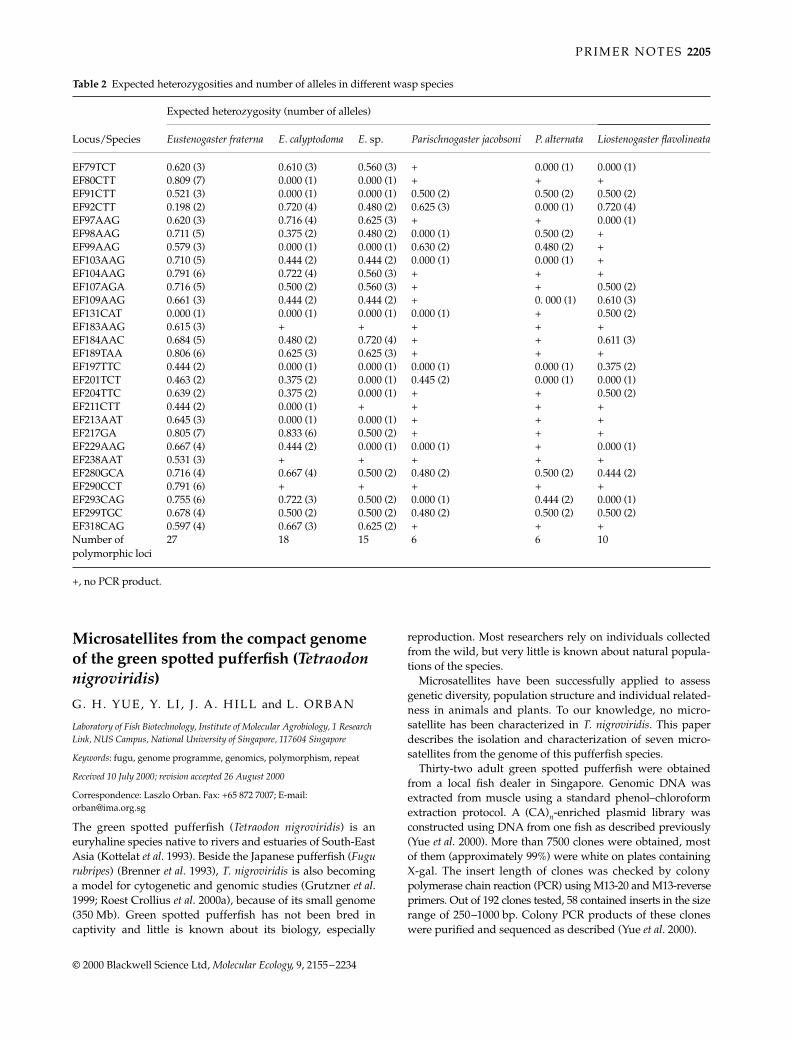
P R I M E R N O T E S 2205
© 2000 Blackwell Science Ltd, Molecular Ecology, 9, 2155–2234
91220001158PRIMER NOTEsPRIMER NOTEsPRIMER NOTEs0000Graphicraft Limited, Hong KongMicrosatellites from the compact genome of the green spotted pufferfish (Tetraodon nigroviridis)
G. H. YUE, Y. L I , J . A . HILL and L . ORBAN
Laboratory of Fish Biotechnology, Institute of Molecular Agrobiology, 1 Research Link, NUS Campus, National University of Singapore, 117604 Singapore
Keywords: fugu, genome programme, genomics, polymorphism, repeat
Received 10 July 2000; revision accepted 26 August 2000
Correspondence: Laszlo Orban. Fax: +65 872 7007; E-mail: [email protected]
The green spotted pufferfish (Tetraodon nigroviridis) is aneuryhaline species native to rivers and estuaries of South-EastAsia (Kottelat et al. 1993). Beside the Japanese pufferfish (Fugurubripes) (Brenner et al. 1993), T. nigroviridis is also becominga model for cytogenetic and genomic studies (Grutzner et al.1999; Roest Crollius et al. 2000a), because of its small genome(350 Mb). Green spotted pufferfish has not been bred incaptivity and little is known about its biology, especially
reproduction. Most researchers rely on individuals collectedfrom the wild, but very little is known about natural popula-tions of the species.
Microsatellites have been successfully applied to assessgenetic diversity, population structure and individual related-ness in animals and plants. To our knowledge, no micro-satellite has been characterized in T. nigroviridis. This paperdescribes the isolation and characterization of seven micro-satellites from the genome of this pufferfish species.
Thirty-two adult green spotted pufferfish were obtainedfrom a local fish dealer in Singapore. Genomic DNA wasextracted from muscle using a standard phenol–chloroformextraction protocol. A (CA)n-enriched plasmid library wasconstructed using DNA from one fish as described previously(Yue et al. 2000). More than 7500 clones were obtained, mostof them (approximately 99%) were white on plates containingX-gal. The insert length of clones was checked by colonypolymerase chain reaction (PCR) using M13-20 and M13-reverseprimers. Out of 192 clones tested, 58 contained inserts in the sizerange of 250–1000 bp. Colony PCR products of these cloneswere purified and sequenced as described (Yue et al. 2000).
Table 2 Expected heterozygosities and number of alleles in different wasp species
Expected heterozygosity (number of alleles)
Locus/Species Eustenogaster fraterna E. calyptodoma E. sp. Parischnogaster jacobsoni P. alternata Liostenogaster flavolineata
EF79TCT 0.620 (3) 0.610 (3) 0.560 (3) + 0.000 (1) 0.000 (1)EF80CTT 0.809 (7) 0.000 (1) 0.000 (1) + + +EF91CTT 0.521 (3) 0.000 (1) 0.000 (1) 0.500 (2) 0.500 (2) 0.500 (2)EF92CTT 0.198 (2) 0.720 (4) 0.480 (2) 0.625 (3) 0.000 (1) 0.720 (4)EF97AAG 0.620 (3) 0.716 (4) 0.625 (3) + + 0.000 (1)EF98AAG 0.711 (5) 0.375 (2) 0.480 (2) 0.000 (1) 0.500 (2) +EF99AAG 0.579 (3) 0.000 (1) 0.000 (1) 0.630 (2) 0.480 (2) +EF103AAG 0.710 (5) 0.444 (2) 0.444 (2) 0.000 (1) 0.000 (1) +EF104AAG 0.791 (6) 0.722 (4) 0.560 (3) + + +EF107AGA 0.716 (5) 0.500 (2) 0.560 (3) + + 0.500 (2)EF109AAG 0.661 (3) 0.444 (2) 0.444 (2) + 0. 000 (1) 0.610 (3)EF131CAT 0.000 (1) 0.000 (1) 0.000 (1) 0.000 (1) + 0.500 (2)EF183AAG 0.615 (3) + + + + +EF184AAC 0.684 (5) 0.480 (2) 0.720 (4) + + 0.611 (3)EF189TAA 0.806 (6) 0.625 (3) 0.625 (3) + + +EF197TTC 0.444 (2) 0.000 (1) 0.000 (1) 0.000 (1) 0.000 (1) 0.375 (2)EF201TCT 0.463 (2) 0.375 (2) 0.000 (1) 0.445 (2) 0.000 (1) 0.000 (1)EF204TTC 0.639 (2) 0.375 (2) 0.000 (1) + + 0.500 (2)EF211CTT 0.444 (2) 0.000 (1) + + + +EF213AAT 0.645 (3) 0.000 (1) 0.000 (1) + + +EF217GA 0.805 (7) 0.833 (6) 0.500 (2) + + +EF229AAG 0.667 (4) 0.444 (2) 0.000 (1) 0.000 (1) + 0.000 (1)EF238AAT 0.531 (3) + + + + +EF280GCA 0.716 (4) 0.667 (4) 0.500 (2) 0.480 (2) 0.500 (2) 0.444 (2)EF290CCT 0.791 (6) + + + + +EF293CAG 0.755 (6) 0.722 (3) 0.500 (2) 0.000 (1) 0.444 (2) 0.000 (1)EF299TGC 0.678 (4) 0.500 (2) 0.500 (2) 0.480 (2) 0.500 (2) 0.500 (2)EF318CAG 0.597 (4) 0.667 (3) 0.625 (2) + + +Number of polymorphic loci
27 18 15 6 6 10
+, no PCR product.
MEC1053.fm Page 2205 Wednesday, November 15, 2000 8:58 AM

2206 P R I M E R N O T E S
© 2000 Blackwell Science Ltd, Molecular Ecology, 9, 2155–2234
Out of the 58 clones sequenced, only 7 (~12%) containedmicrosatellite repeats, which is about 6 times lower than thepercentage obtained from Asian arowana (Yue et al. 2000) byusing the same enrichment procedure. This result mightindicate low abundance of CA-repeats in the genome ofT. nigroviridis. However, data from large scale sequencingperformed on the T. nigroviridis genome do not support thishypothesis (Roest Crollius et al. 2000b). Alternative inter-pretation of the result might be that the CA-repeats in this com-pact genome are relatively short and are difficult to enrich bythe method used. Among the seven microsatellites isolated,only five contained CA/GT repeats, the other two comprisedGCA-repeats and GACA-repeats, respectively (Table 1).
Primer pairs were designed to the flanking sequences ofrepeats using software PrimerSelect (DNASTAR). Thirty-twoT. nigroviridis individuals were genotyped for the sevenmicrosatellites as described previously (Yue et al. 2000), exceptusing different annealing temperatures (in the range of 45–60 °C) and MgCl2 concentrations (1.5 or 3.0 mm; see Table 1).Six out of seven microsatellites showed specific prod-ucts and polymorphism (Table 1), while locus PF33 was notpolymorphic. The average number of alleles at the polymorphicloci was 12.7 (range: 5–22), whereas the average observedheterozygosity ranged from 0.22–0.95 with an average of0.63 (Table 1). Three loci (PF12, PF29, PF204) conformed toHardy–Weinberg expectations when tested using chi-squareanalysis, while the other three did not. A significant hetero-zygosity deficit was displayed at locus PF203, suggesting theappearance of null alleles.
One duplex-PCR was established for the PF12 and PF29 lociaccording to Yue et al. (1999). The 25 µL reaction contained10 mm Tris-HCl (pH 8.8), 150 mm KCl, 1.5 mm MgCl2, 100 µmof each dNTP, 0.2 µm each of PF12 primers, 0.4 µm each ofPF29 primers, 30 ng genomic DNA and 1.0 U DyNAzyme IIDNA-polymerase (Finnzymes). PCR cycling conditions were:an initial denaturation at 94 °C for 2 min, followed by 30cycles of 94 °C for 30 s, 55 °C for 30 s, 72 °C for 30 s, witha final extension at 72 °C for 5 min. The detection of PCR
products and the sizing of alleles were performed on theABI 377 sequencer as described previously (Yue et al. 2000).
In order to become a good model not only for genomics, butalso for genetics and developmental biology, T. nigroviridismust be bred routinely in captivity. The polymorphic micro-satellite markers described here will assist the analysis ofnatural populations and breeding experiments.
Acknowledgements
We thank H. Roest Croellius for providing materials prior topublication. Funding was provided by the National Science andTechnology Board of Singapore.
References
Brenner S, Elgar G, Sandford R, Macrae A, Venkatesh B, Aparicio S(1993) Characterization of the pufferfish (Fugu) genome as acompact model vertebrate genome. Nature, 366, 265–268.
Grutzner F, Lutjens G, Rovira C, Barnes DW, Ropers HH, Haaf T(1999) Classical and molecular cytogenetics of the pufferfishTetraodon nigroviridis. Chromosome Research, 7, 655–662.
Kottelat M, Whitten AJ, Kartikasari SN, Wirjoatmodjo S (1993)Freshwater Fishes of Western Indonesia and Sulawesi. PeriplusEditions (HK) Ltd, Indonesia, p. 242.
Roest Crollius H, Jaillon O, Bernot A et al. (2000a) Estimate ofhuman gene number provided by genome-wide analysis usingTetraodon nigroviridis DNA sequence. Nature Genetics, 25, 235–238.
Roest Crollius H, Jaillon O, Dasilva C et al. (2000b) Character-isation and repeat analysis of the compact genome of thefreshwater pufferfish Tetraodon nigroviridis. Genome Research,10, 950–958.
Yue GH, Beeckmann P, Bartenschlager H, Moser G, Geldermann H(1999) Rapid and precise genotyping of porcine microsatellites.Electrophoresis, 20, 3358–3363.
Yue GH, Chen F, Orban L (2000) Rapid isolation and character-isation of microsatellites from the genome of Asian arowana(Scleropages formosus, Osteoglossidae, Pisces). Molecular Ecology,9, 1007–1009.
91220001150PRIMER NOTEsPRIMER NOTEsPRIMER NOTEs113Graphicraft Limited, Hong Kong
Table 1 Characterization of six microsatellites on 32 individuals of the green spotted pufferfish ( Tetraodon nigroviridis)
Locus Repeat motif Primer (5′−3′)Ta(°C)
MgCl2 (mm)
No. of alleles
Size range (bp) HO HE
GenBank Accession no.
PF12 (CA)11 F HEX-CAGGCCTGGACAAACAAAAC55 1.5 22 176–240 0.95 0.91 AF283467R ATCTTCAAAGTGGCGCTATCATT
PF29 (GCA)13 F HEX-TGAGCCGATCAAGTAGTGAG55 1.5 11 120–159 0.84 0.84 AF283468R GAATGATAGTGCTGCTGGGG
PF39 (GT)8 F CTTGGATGTGACAGCGAAACAAAC60 1.5 5 158–180 0.59** 0.75 AF283470R GCGCGTACGCACAGGCGGG
PF41 (GA)2(CA)6GACTGAAG(CA)3 F ACAAACACGGTCAACAAGCACTAC55 1.5 17 162–198 0.59** 0.90 AF283471R ACAGGTGTTCTTTGGCGTGACA
PF203 (GT)6(GA)7(GT)6(GA)8(GT)10 F TGGTGACCATTAGGGTAAGG 45 3.0 12 220–258 0.22** 0.87 AF283472R GGGGGTGAAACGACCTC
PF204 (GACA)10 F CTCGCCATGCAAAGAAAA 50 1.5 9 130–154 0.72 0.78 AF283473R AAACGTTAAAGGTAGTGATGTGG
Ta, annealing temperature; HO, observed heterozygosity; HE, expected heterozygosity; **, Loci showing significant (P < 0.01) deviations from Hardy–Weinberg equilibrium by using chi-square analysis. HEX: Primer labelled with the fluorescent dye HEX.
MEC1053.fm Page 2206 Wednesday, November 15, 2000 8:58 AM

P R I M E R N O T E S 2207
© 2000 Blackwell Science Ltd, Molecular Ecology, 9, 2155–2234
Polymorphic DNA microsatellites identified in the yellow dung fly (Scathophaga stercoraria)
T. W. J . GARNER,* H. BRINKMANN,† G. GERLACH,† A. MEYER,† P. I . WARD,‡ M. SPÖRRI* and D. J . HOSKEN†‡
*Zoologisches Institut and ‡Zoological Museum, Universität Zürich-Irchel, Winterthurerstrasse 190, Zürich, Switzerland, †Faculty of Biology, Box 5560, University of Konstanz, D-78434 Konstanz, Germany
Keywords: microsatellites, Scathophaga stercoraria, sperm competition, yellow dung fly
Received 15 August 2000; revision accepted 2 September 2000
Correspondence: T. W. J. Garner. Fax: + 41 635 68 21; E-mail: [email protected]
Sperm competition in yellow dung flies (Scathophagastercoraria) has been extensively investigated since Parker’s(1970a) seminal work (e.g. Parker & Simmons 1991; Ward1993; Hosken & Ward 2000; reviewed in Hosken 1999). Theseflies serve as a model system for understanding the mechan-isms and outcomes of sperm competition in internal fertilizers.Invariably however, these investigations have been labor-atory based, and typically involved competition betweenonly two males. How the results of such studies relates to free-living flies is unknown, but it is unlikely that the experimentalconditions employed exist in nature, and therefore outcomesmay not reflect true female sperm utilization patterns (Eady& Tubman 1996). This is exemplified by a study of spermcompetition in pseudoscorpions, which showed that second-male mating advantage breaks down when females matewith more than two males (Zeh & Zeh 1994). In addition,Ward (2000) has shown that females are able to subtly alterpaternity patterns under conditions that are likely to becommon in the field. With this in mind, our aim was todevelop appropriate genetic markers to allow paternity to beaccurately assigned in clutches laid by free-living femaleyellow dung flies.
A subgenomic library enriched for CA repeat microsatelliteswas constructed following standard protocols outlined inTenzer et al. (1999), with slight modifications. Genomic DNAisolated from a single S. stercoraria male using standard phenol–chloroform extraction and ethanol precipitation (Sambrooket al. 1989) was digested using Tsp509I (New England Biolabs).A 500–1000 bp size fraction was isolated from a LM-MPagarose (Boehringer Mannheim) gel by first excising theappropriate size range from the gel. The gel fragment wasmelted in a 65 °C water bath and volume was increased to500 µL using double distilled water. An equal volume ofequilibrated phenol (pH 8.0) was added, the solution vortexedbriefly and then put at – 80 °C for 30 min. The sample wasthen thawed and extraction was completed following standardphenol–chloroform extraction methods (Sambrook et al. 1989).This isolate was used for ligation with TSPADSHORT/TSPADLONG linkers (Tenzer et al. 1999) and then amplifiedvia the polymerase chain reaction (PCR), using TSPADSHORTas a primer. PCR was performed using the following condi-tions: Total reaction volume was 25 µL included 100 ng DNA,
1 U Taq DNA polymerase (Quantum-Appligene), 10 mm Tris-HCl,pH 9.0, 50 mm KCl, 1.5 mm MgCl2, 0.01% TritonX100, 0.2 mgBSA (Quantum-Appligene), 100 µm of each dNTP (Promega),and 1 µm of TSPADSHORT. PCR was performed on a TechneGenius thermocycler (Techne Ltd) using the following thermo-treatment: 2 min at 72 °C, followed by 25 cycles of 1 minat 94 °C, 1 min at 55 °C, and 1 min at 72 °C. A total of 32PCRs were carried out, pooled, cleaned and concentratedto minimize the likelihood of redundant products beingdetected during screening for positive clones. PCR prod-ucts were hybridized to biotinylated (CA)20 probes bondedto streptavidin-coated magnetic beads (Dynabeads M-280Streptavadin, DYNAL, France) and amplified again. Thesefinal PCR products were cloned following the OriginalTA Cloning® Kit (Invitrogen) protocol. White colonies weredot-blotted onto nylon membranes (Hybond™-N+, Amer-sham Pharmacia) and screened for CA repeats using the ECL3′-oligolabelling and detection system (Amersham Pharmacia)and a 40mer CA oligonucleotide. All positive clones weresequenced following the ABI Prism® BigDye™ TerminatorCycle Sequencing Ready Reaction Kit protocol, version 2.0(PE Biosystems) using M13 forward and reverse primers,and using the ABI 377 automated sequencing system (PEBiosystems). Primers were designed using Primer3 software(Rozen & Skaletsky 1998) and all oligonucleotides weresynthesized by Microsynth GmbH (Switzerland). Initial testsfor amplification and polymorphism were carried out at55 °C and electrophoresed on 8%, nondenaturing, 14.5 cm× 17 cm acrylamide gels at 80 V overnight. Those primersthat amplified polymorphic products using five test templateswere used for all following analyses.
Only field-caught male S. stercoraria were used for PCRanalysis, as almost every field-caught female is alreadymated (Parker 1970b), and extraction from fertilized femalescould therefore result in contamination by sperm DNA. Eachsample male was extracted using the QIAamp® DNA minikit (Qiagen). Twenty males were used to characterize suit-able primers, and PCR was carried out using approximately100 ng of template DNA and the following cycle treatment;initial step of 3 min at 94 °C, followed by 27 cycles of 30 s at94 °C, 30 s at 58–61 °C (see Table 1), and 30 s at 72 °C, with afinal extension step of 2 min at 72 °C. Total reaction volumewas 25 µL and contained 10 mm Tris-HCl, pH 9.0, 50 mmKCl, 1.5 mm MgCl2, 0.01% Triton × 100, 0.2 mg BSA (Quantum-Appligene), 100 µm of each dNTP (Promega), 0.5 µm of bothforward and reverse primer, and 0.5 U Taq DNA polymerase(Quantum-Appligene). All products were electrophoresedon Spreadex™ EL-300 S-100 gels (Elchrom Scientific AG,Switzerland), using the SEA 2000™ advanced submergedgel electrophoresis apparatus (Elchrom Scientific AG,Switzerland). Gels were run at 100 V for 80–90 min, depend-ing on allele sizes, then scored against the M3 Markerladder (Elchrom Scientific AG, Switzerland). Expected andobserved counts for homozygotes/heterozygotes weredetermined using genepop version 3x (Raymond & Rousset1995) and homozygote excess was tested for using Chi-squareanalysis (null hypothesis rejected at P < 0.05).
A minimum of five alleles were detected at each of theloci listed in Table 1. Tests for homozygote excess were only
MEC1053.fm Page 2207 Wednesday, November 15, 2000 8:58 AM
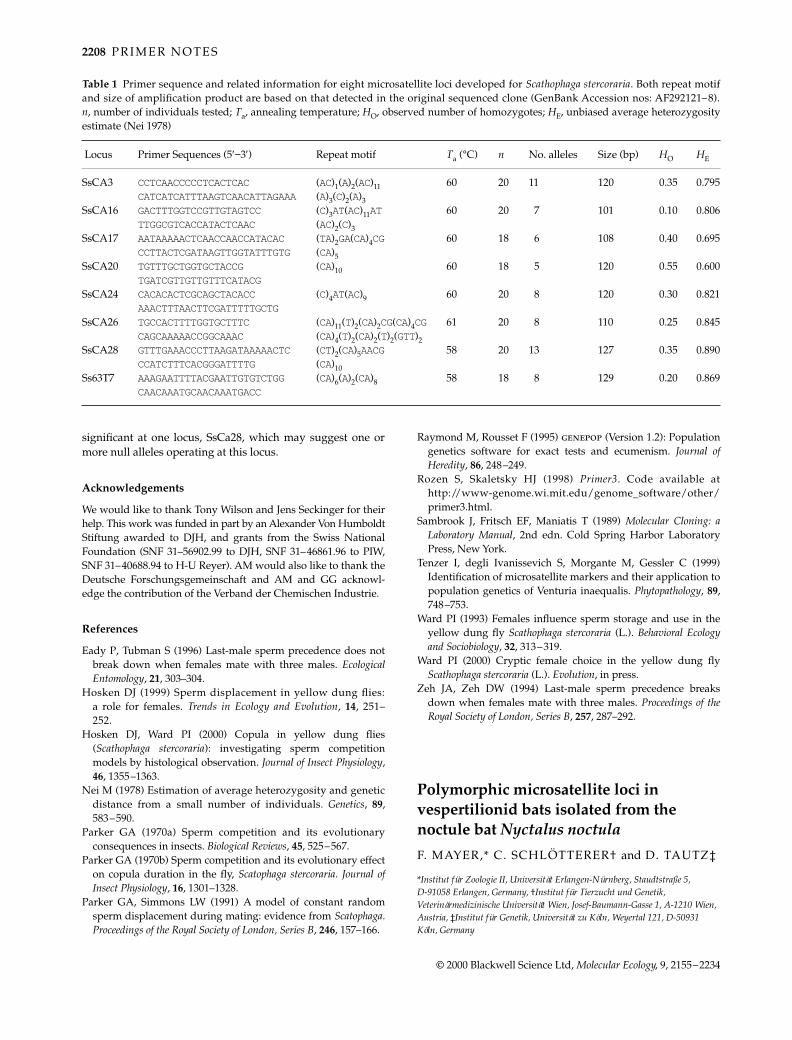
2208 P R I M E R N O T E S
© 2000 Blackwell Science Ltd, Molecular Ecology, 9, 2155–2234
significant at one locus, SsCa28, which may suggest one ormore null alleles operating at this locus.
Acknowledgements
We would like to thank Tony Wilson and Jens Seckinger for theirhelp. This work was funded in part by an Alexander Von HumboldtStiftung awarded to DJH, and grants from the Swiss NationalFoundation (SNF 31–56902.99 to DJH, SNF 31–46861.96 to PIW,SNF 31–40688.94 to H-U Reyer). AM would also like to thank theDeutsche Forschungsgemeinschaft and AM and GG acknowl-edge the contribution of the Verband der Chemischen Industrie.
References
Eady P, Tubman S (1996) Last-male sperm precedence does notbreak down when females mate with three males. EcologicalEntomology, 21, 303–304.
Hosken DJ (1999) Sperm displacement in yellow dung flies:a role for females. Trends in Ecology and Evolution, 14, 251–252.
Hosken DJ, Ward PI (2000) Copula in yellow dung flies(Scathophaga stercoraria): investigating sperm competitionmodels by histological observation. Journal of Insect Physiology,46, 1355–1363.
Nei M (1978) Estimation of average heterozygosity and geneticdistance from a small number of individuals. Genetics, 89,583–590.
Parker GA (1970a) Sperm competition and its evolutionaryconsequences in insects. Biological Reviews, 45, 525–567.
Parker GA (1970b) Sperm competition and its evolutionary effecton copula duration in the fly, Scatophaga stercoraria. Journal ofInsect Physiology, 16, 1301–1328.
Parker GA, Simmons LW (1991) A model of constant randomsperm displacement during mating: evidence from Scatophaga.Proceedings of the Royal Society of London, Series B, 246, 157–166.
Raymond M, Rousset F (1995) genepop (Version 1.2): Populationgenetics software for exact tests and ecumenism. Journal ofHeredity, 86, 248–249.
Rozen S, Skaletsky HJ (1998) Primer3. Code available athttp://www-genome.wi.mit.edu/genome_software/other/primer3.html.
Sambrook J, Fritsch EF, Maniatis T (1989) Molecular Cloning: aLaboratory Manual, 2nd edn. Cold Spring Harbor LaboratoryPress, New York.
Tenzer I, degli Ivanissevich S, Morgante M, Gessler C (1999)Identification of microsatellite markers and their application topopulation genetics of Venturia inaequalis. Phytopathology, 89,748–753.
Ward PI (1993) Females influence sperm storage and use in theyellow dung fly Scathophaga stercoraria (L.). Behavioral Ecologyand Sociobiology, 32, 313–319.
Ward PI (2000) Cryptic female choice in the yellow dung flyScathophaga stercoraria (L.). Evolution, in press.
Zeh JA, Zeh DW (1994) Last-male sperm precedence breaksdown when females mate with three males. Proceedings of theRoyal Society of London, Series B, 257, 287–292.
91220001151PRIMER NOTEsPRIMER NOTEsPRIMER NOTEs0000Graphicraft Limited, Hong Kong
Polymorphic microsatellite loci in vespertilionid bats isolated from the noctule bat Nyctalus noctula
F. MAYER,* C. SCHLÖTTERER† and D. TAUTZ‡
*Institut für Zoologie II, Universität Erlangen-Nürnberg, Staudtstraße 5, D-91058 Erlangen, Germany, †Institut für Tierzucht und Genetik, Veterinärmedizinische Universität Wien, Josef-Baumann-Gasse 1, A-1210 Wien, Austria, ‡Institut für Genetik, Universität zu Köln, Weyertal 121, D-50931 Köln, Germany
Table 1 Primer sequence and related information for eight microsatellite loci developed for Scathophaga stercoraria. Both repeat motifand size of amplification product are based on that detected in the original sequenced clone (GenBank Accession nos: AF292121–8).n, number of individuals tested; Ta, annealing temperature; HO, observed number of homozygotes; HE, unbiased average heterozygosityestimate (Nei 1978)
Locus Primer Sequences (5′−3′) Repeat motif Ta (°C) n No. alleles Size (bp) HO HE
SsCA3 CCTCAACCCCCTCACTCAC (AC)1(A)2(AC)11 60 20 11 120 0.35 0.795CATCATCATTTAAGTCAACATTAGAAA(A)3(C)2(A)3
SsCA16 GACTTTGGTCCGTTGTAGTCC (C)3AT(AC)11AT 60 20 7 101 0.10 0.806TTGGCGTCACCATACTCAAC (AC)2(C)3
SsCA17 AATAAAAACTCAACCAACCATACAC (TA)2GA(CA)4CG 60 18 6 108 0.40 0.695CCTTACTCGATAAGTTGGTATTTGTG (CA)5
SsCA20 TGTTTGCTGGTGCTACCG (CA)10 60 18 5 120 0.55 0.600TGATCGTTGTTGTTTCATACG
SsCA24 CACACACTCGCAGCTACACC (C)4AT(AC)9 60 20 8 120 0.30 0.821AAACTTTAACTTCGATTTTTGCTG
SsCA26 TGCCACTTTTGGTGCTTTC (CA)11(T)2(CA)2CG(CA)4CG 61 20 8 110 0.25 0.845CAGCAAAAACCGGCAAAC (CA)4(T)2(CA)2(T)2(GTT)2
SsCA28 GTTTGAAACCCTTAAGATAAAAACTC (CT)2(CA)5AACG 58 20 13 127 0.35 0.890CCATCTTTCACGGGATTTTG (CA)10
Ss63T7 AAAGAATTTTACGAATTGTGTCTGG (CA)6(A)2(CA)8 58 18 8 129 0.20 0.869CAACAAATGCAACAAATGACC
MEC1053.fm Page 2208 Wednesday, November 15, 2000 8:58 AM
P R I M E R N O T E S 2209
© 2000 Blackwell Science Ltd, Molecular Ecology, 9, 2155–2234
Keywords: bat, Chiroptera, cross-species amplification, microsatellite, Nyctalus noctula
Received 15 August 2000; revision accepted 2 September 2000
Correspondence: F. Mayer. Fax: + 49 91318528060; E-mail: [email protected]
Prolonged sperm storage increases the possibility of spermcompetition because several males could contribute spermduring the sperm-storing period prior to fertilization. The long-est sperm storing capacity among mammals is documented inthe noctule bat. Females can store sperm in the uterus after cop-ulation in autumn for up to six months until fertilization inspring (Racey 1973). Therefore, noctule bats are likely can-didates to show high levels of multiple paternity that couldbe analysed most efficiently with highly polymorphic nuclearmarkers, such as microsatellite loci.
Microsatellite loci of the noctule bat were isolated from asize-selected partial genomic library (Rassmann et al. 1991).Total genomic DNA was isolated from muscle tissue of afemale bat and was digested with three restriction enzymes(AluI, HaeIII and RsaI). Fragments ranging from 300–600 bpin length were ligated in SmaI digested M13mp18 and M13mp19cloning vectors (Yanisch-Perron et al. 1985). Ligation productswere transformed into competent XL-1 Blue cells (Stratagene)which were plated onto LB pates containing X-gal andIPTG. A total of 5400 clones were screened with differentprobes specific for microsatellites. Radioactive 32P-labelledprobes for di- and trinucleotide micosatellite loci weregenerated by slippage synthesis (Schlötterer & Tautz 1992)using the following pairs of oligonucleotides: (AG)7/(TC)4,(GT)7/(CA)4, (TCC)5T/(GGA)3, (CCA)5/(GGT)3, (TGC)5/(GCA)3 and (TCG)5T/(ACG)3. One hundred and forty-five‘positive’ clones were detected with dinucleotide polymers,54 with trinucleotide polymers, 11 with the 32P-end-labelledoligonucleotide (ATCC)3 and 14 with the 32P-end-labelledoligonucleotide (CTAT)5 representing 2.7, 1.0, 0.2 and 0.3%,respectively, of the total number of clones which werescreened. Thirty-one of the 224 ‘positive’ clones were sequencedand polymerase chain reaction (PCR) primers were designedfor 14 loci.
A circular wing clip of 4 mm diameter was obtained fromindividual bats. Approximately 0.5 µg DNA was isolated after a3-h incubation with 0.1 mg proteinase K in 500 µL digestionbuffer (100 mm Tris-HCl, 100 mm NaCl, 2 mm EDTA, 42 mmdithiotreitol, 2% sodium dodecyl sulphate) following theprotocol of Müllenbach et al. (1989). PCR amplifications werecarried out in a 10-µL volume containing approximately 10 ngDNA, 1.5 mm MgCl2, 0.5 µm each primer, 0.025 mm each dNTP,0.25 unit Goldstar Polymerase (Eurogentec) together with thereaction buffer provided by the supplier [final concentration:75 mm Tris-HCl, pH 9.0, 20 mm (NH4)2SO4, 0.01% (w/v) Tween20]. PCRs were performed in a Perkin Elmer DNA ThermalCycler TC1 and consisted of 30 cycles of 94 °C for 30 s, theannealing temperature (Table 1) for 20 s and 72 °C for 30 s.For each microsatellite locus one primer was labelled with afluorescent dye. The PCR products were separated on 6%Sequagel®XR gels (National Diagnostics) in a LI-COR DNAsequencer (model 4000 L), and genotypes were determinedusing RFLPscan™ (Scanalytics).
Highly specific amplification products were obtained at 13of the 14 loci. For each animal only one or two major ampli-fication products were detected which were close to the lengthof the cloned allele. Allele sizes varied in multiples of therepeat size only and characteristic slippage bands could bedetected at all loci. At two loci the proportion of homozygoteswas much higher than expected under Hardy–Weinbergequilibrium. At locus P22a only one allele could be amplified inall males. In females no deviation from Hardy–Weinbergexpectation was detected. This strongly suggests that locusP22a is located on the X chromosome. The deficit of hetero-zygotes at the other locus was not limited to males. Therefore,the presence of null alleles is a likely explanation. This locuswas not evaluated further.
Cross-species amplification was tested in 11 European batspecies of the family Vespertilionidae. Nine loci could beamplified in other species and eight in other genera than thesource species. Allelic variation was usually high and only infive cases the loci seemed to be monomorphic in a particularspecies (Table 2). The applicability of primer pairs is highamong species within the family Vespertilionidae but seemsto be low in other families (Burland et al. 1998). Length ofamplification products can vary substantially among species.For example the amplification product of locus P217 was about400 bp longer in the three species of Eptesicus and Plecotusthan in all other species.
Acknowledgements
This work was supported by the Deutsche Forschungsgemein-schaft (DFG).
References
Burland TM, Barratt EM, Racey PA (1998) Isolation and charac-terization of microsatellite loci in the brown long-eared bat,Plecotus auritus, and cross-species amplification within thefamily Vespertilionidae. Molecular Ecology, 7, 136–138.
Helversen Ov, Mayer F, Kock D (2000) Comments on the pro-posed designation of single neotypes for Vespertilio pipistrellusSchreber, 1774 (Mammalia, Chiroptera) and for Vespertilio pygmaeusLeach, 1825. Bulletin of Zoological Nomenclature, 57, 113–115.
Müllenbach R, Lagoda PJL, Welter C (1989) An efficient salt-chlorophorm extraction of DNA from blood and tissues. Trendsin Genetics, 5, 391.
Petri B, Pääbo S, Haeseler Av et al. (1997) Paternity assessmentand population subdivision in a natural population of thelarger mouse-eared bat Myotis myotis. Molecular Ecology, 6,235–242.
Racey PA (1973) The viability of spermatozoa after prolongedstorage by male and female European bats. Periodicum Biologorum,75, 201–205.
Rassmann K, Schlötterer C, Tautz D (1991) Isolation of simple-sequence loci for use in polymerase chain reaction-based DNAfingerprinting. Electrophoresis, 12, 113–118.
Schlötterer C, Tautz D (1992) Slippage synthesis of simplesequence DNA. Nucleic Acids Research, 20, 211–215.
Yanisch-Perron C, Viera J, Messing J (1985) Improved M13 phagecloning vectors and host strains: nucleotide sequence of M13mp18 and pUC19 vectors. Gene, 33, 103–119.
91220001153PRIMER NOTEsPRIMER NOTEsPRIMER NOTEs0000Graphicraft Limited, Hong Kong
MEC1053.fm Page 2209 Wednesday, November 15, 2000 8:58 AM

2210P
RIM
ER
NO
TE
S
© 2000 B
lackwell Science L
td, M
olecular Ecology, 9, 2155–2234
Table 1 Primer, annealing temperature and sequence of 12 microsatellite loci isolated from the noctule bat (Nyctalus noctula). Primers labelled at the 5′-end with the fluorescent dyeIRD-41 or IRD-800 are marked with an asterisk
Annealing temperature (°C) Amplification of the cloned alleleGenBankaccession no.Locus Primer Sequence N. noctula other species length (bp) microsatellite sequence
P2 Mü418 5′-ATATACTTAAGGATCAGAGC-3 48 48 98 (AT)2(GT)2(AT)(GT)2 AF141645Mü419* 5′-TATTGTTCTGTTCATTCAGT-3′ (AT)(GT)3(AT)2(GT)12
P11 ER22* 5′-AAAACCAAAGTTATTTATTC-3′ 52 — 132 (GT)15 AF273675ER23 5′-CTTTCCTCAGAAATTATATC-3′
P13 Mü360* 5′-CCTGATAAAACCTGT-3′ 52 52 140 (TG)4C(GT)19 AF141646Mü361 5′-CTGAATCGGTGTTTC-3′
P14 Mü397* 5′-TGGTGATTTGTTATG-3′ 40 — 112 (TG)17 AF273676Mü398 5′-CACTTATCATTTTCA-3′
P19 ER28* 5′-TCTAATCTCTTTCTGCACCC-3′ 53 — 114 (AC)19 AF273677ER29 5′-GGGGCATGGAAATTGAACAG-3′
P20 ER47* 5′-CTTATCTAATCAATATACTTAAAA-3′ 45 40 176 (TA)21(TG)17TAT(TA)6 AF141647Mü435 5′-AAAATGCATCAATATATGAG-3′
P22a ER37* 5′-CTTCTCCCTTCCCATAAATC-3′ 48 40 113 (AT)5(AC)4AT(AC)10AT(AC)13 AF273678ER25 5′-TCTTATTTTGGGGGAAACTG-3′
P217 ER49* 5′-TCCTAAGATTCTGTTCCTCC-3′ 48 48 251 (CTAT)2CAT(CTAT)11 AF141648ER6 5′-GGGCTGTATCATATGATTTT-3′ (CATCTAT)4(CTAT)2
(CATCTAT)2TAT(CTAT)3(CAT)2CTAT
P219 ER36* 5′-CAATTTAACTTTTCAACAAC-3′ 48 48 157 (CTAT)7(CCAT)6 AF141649ER5 5′-TCTTCATTTCCTCTCCTCTC-3′
P223 ER1* 5′-TCCATTTTTTCCCCTTCCCT-3′ 48 48 110 (CT)7CCCTC(CTAT)9 AF141650ER2 5′-GGTCTCCTTTTCTTCACTTTG-3′
ME
C1053.fm
Page 2210 W
ednesday, Novem
ber 15, 2000 8:58 AM

PR
IME
R N
OT
ES
2211
© 2000 B
lackwell Science L
td, M
olecular Ecology, 9, 2155–2234
Table 2 Polymorphism of microsatellite loci in different vespertilionid bat species. The source species was Nyctalus noctula. The loci NN8 and NN18 were previously published by Petriet al. (1997). No amplification is marked by a dash. Locus P22a is located on the X-chromosome. Therefore, the observed heterozygosity corresponds only to females at this locus. Cross-species amplification of the locus P14 was not tested, due to weak signals in N. noctula. Heterozygosities are given if more than 10 individuals were scored within a species. Pipistrellusmediterraneus corresponds to the 55 kHz phonic type of the pipistrelle bat (Helversen et al. 2000)
Myotis Parameter
Species
Nyctalus noctula
Nyctalus leisleri
Pipistrellus pipistrellus
Pip. mediter.
Pip. kuhli
Pip.nathusii
Eptesicusnilssoni
Vespertiliomurinus
Plecotusaustriacus
Plecotusauritus
Myotismyotis
Myotisbechsteini
P2 number of individuals 43 10 37 16 5 4 6 5 3 5 — —alleles detected 10 9 11 13 7 4 3 6 4 6 — —observed heterozygosity 0.74 1.00 0.84 0.75expected heterozygosity 0.83 0.83 0.89 0.86 — —
NN8 number of individuals 43 10 55 3 1 5 5 5 9 16 57 5alleles detected 12 12 30 4 2 4 6 9 7 14 10 5observed heterozygosity 0.72 0.70 0.76 0.88 0.89expected heterozygosity 0.79 0.87 0.93 0.88 0.85
P11 number of individuals 41 — — — — — — — — — — —alleles detected 11 — — — — — — — — — — —observed heterozygosity 0.90expected heterozygosity 0.84
P13 number of individuals 42 5 25 20 3 2 5 5 10 16 — —alleles detected 15 10 14 11 4 3 1 4 11 13 — —observed heterozygosity 0.95 0.92 0.95 0.80 0.69expected heterozygosity 0.91 0.83 0.85 0.87 0.89 — —
P14 number of individuals 40 ? ? ? ? ? ? ? ? ? ? ?alleles detected 9 ? ? ? ? ? ? ? ? ? ? ?observed heterozygosity 0.92 ? ? ? ? ? ? ? ? ? ? ?expected heterozygosity 0.86 ? ? ? ? ? ? ? ? ? ? ?
NN18 number of individuals 30 10 53 21 5 6 8 6 4 14 5 —alleles detected 8 9 12 9 1 6 7 8 6 10 1 —observed heterozygosity 0.83 0.90 0.83 0.67 0.93expected heterozygosity 0.78 0.82 0.85 0.79 0.81
P19 number of individuals 37 — — — — — — — — — — —alleles detected 16 — — — — — — — — — — —observed heterozygosity 0.86expected heterozygosity 0.90
ME
C1053.fm
Page 2211 W
ednesday, Novem
ber 15, 2000 8:58 AM

2212P
RIM
ER
NO
TE
S
© 2000 B
lackwell Science L
td, M
olecular Ecology, 9, 2155–2234
Table 2 Continued
Myotis Parameter
Species
Nyctalus noctula
Nyctalus leisleri
Pipistrellus pipistrellus
Pip. mediter.
Pip. kuhli
Pip.nathusii
Eptesicusnilssoni
Vespertiliomurinus
Plecotusaustriacus
Plecotusauritus
Myotismyotis
Myotisbechsteini
P20 number of individuals 36 5 32 23 2 3 5 5 3 15 32 9alleles detected 14 8 3 3 2 6 1 5 4 4 18 7observed heterozygosity 0.83 0.53 0.04 0.67 0.94expected heterozygosity 0.92 0.50 0.04 0.56 0.92
P22a number females + males 22 + 17 1 + 4 — — — — — — — — — —alleles detected 14 3 — — — — — — — — — —observed heterozygosity 0.67expected heterozygosity 0.86
P217 number of individuals 34 5 45 15 5 5 2 5 5 13 — —alleles detected 18 8 12 10 8 10 4 6 8 11 — —observed heterozygosity 0.88 0.89 0.93 0.85expected heterozygosity 0.90 0.81 0.77 0.84
P219 number of individuals 36 — 42 14 4 — 6 4 5 — — —alleles detected 7 — 14 8 3 — 4 6 1 — — —observed heterozygosity 0.72 0.76 0.79expected heterozygosity 0.75 0.81 0.80
P223 number of individuals 38 5 — — — — — — — — — —alleles detected 13 5 — — — — — — — — — —observed heterozygosity 0.76expected heterozygosity 0.77
ME
C1053.fm
Page 2212 W
ednesday, Novem
ber 15, 2000 8:58 AM

P R I M E R N O T E S 2213
© 2000 Blackwell Science Ltd, Molecular Ecology, 9, 2155–2234
Isolation and characterization of microsatellites in the seabird ectoparasite Ixodes uriae
KAREN D. MCCOY and CLAIRE TIRARD
Laboratoire d’Ecologie, Université Paris VI — CNRS UMR 7625, 7 quai St. Bernard, 75005 Paris France
Keywords: ectoparasite, Ixodidae, microsatellite, tick
Received 10 August 2000; revision accepted 2 September 2000
Correspondence: Karen D. McCoy, Fax: + 33 1 44 27 35 16; E-mail: [email protected]
Ixodes uriae is a common parasite of many seabird speciesin the polar regions. Interest in this tick has risen in the pastdecade as more information is gathered on its potentialimpacts on host ecology and evolution. In particular, I. uriaeis thought to affect the reproductive success and habitatchoice of its seabird hosts (Boulinier et al. 2001), and to vectorseveral avian arbo-viruses and disease agents (Chastel1988), including the Lyme disease agent, Borrelia burgdorferi(Olsen et al. 1993). Thus, knowledge of dispersal ability ofthis ectoparasite within and among host populations is ofvital importance if we are to understand its role in this host-parasite–disease interaction.
The independent migratory abilities of hard ticks are con-sidered to be weak, and direct examination of dispersal ofthese parasites at large spatial scales is not possible (McCoyet al. 1999). Thus, to examine patterns of dispersion, indirectapproaches, such as using genetic markers, are more plausible.To address the question of population structure and gene flowof I. uriae within and among its seabird hosts, we first attempted
to amplify DNA using primers developed for I. ricinus, acommon tick species of vertebrates in Europe (Delaye et al.1998); no successful amplifications were achieved. In this note,we characterize nine microsatellite markers developed for I. uriae.
DNA was extracted from 42 unfed larval ticks originatingfrom Atlantic puffin (Fratercula arctica) hosts on Hornøya,Norway (70°22′N, 31°10′ W). A genomic library was con-structed following Estoup et al. (1993). Eleven µg of larvalDNA was restricted with the enzyme Sau3A. Resulting frag-ments were separated on a 1.5% low-melting-point agarosegel and fragments between 400–800 bp were isolated, puri-fied using a Q1Aquick Gel Extraction Kit (Qiagen) andligated into a pBluescript vector II Sk + plasmid (Stratagene).Ligation products were then transformed into XL1-Blue MRF′Supercompetent cells (Stratagene) and the resulting colonieswere blotted on Hybond-N + membranes which were hybrid-ized with a mixture of two probes (CT)10 and (GT)10. Twothousand clones from the library gave 65 positively hybrid-ized clones from which 48 were sequenced. Primers weredesigned for 10 loci using Primer 0.5 (Lincoln & Daly 1991).Nine loci were polymorphic and gave clear polymerase chainreaction (PCR) results of expected size (Table 1).
Genomic DNA was prepared using a high-salt extractionmethod. PCR amplifications were performed in a 10-µL mixturecontaining 1 µL of genomic DNA (approximately 50 ng), 75 µmof each of dCTP, dTTP, dGTP, 7.5 µm of dATP, 0.4 µm of eachprimer, 1 µL of 10× Taq buffer (Tris-Cl, KCl (NH4)2SO4, 15 mmMgCl2, pH 8.7), 0.25 U Taq DNA polymerase (Qiagen) and 0.025µCi [α33P]-dATP (Amersham). Amplifications were performedin a PTC100 thermocycler (MJ Research) as follows: initialdenaturation of 3 min at 94 °C followed by 30 cycles (30 s at94 °C, 30 s at annealing temperature specified in Table 1 and
Table 1 Characteristics of nine polymorphic loci developed for Ixodes uriae. The number of observed alleles (NA), observed (HO) andexpected (HE) heterozygosities were calculated using ticks (n refers to number of ticks) sampled from two Atlantic puffin (Fraterculaarctica) colonies. Hardy–Weinberg equilibrium was tested separately for each colony (Raymond & Rousset 1995); no significantdeviations were found after correcting for multiple tests (Rice 1989)
Locus Repeat array n Size (bp) NA HO HE Ta * (°C) Accession no.† Primer sequence (5′−3′)
T1 (GA)3TA(GA)2-(GA)2- 63 158–164 7 0.63 0.70 57 AF293324 F: CTTCAATCACGTGGGATGC(GA)4-(GA)2CA(GA)3 R: GACTTGTGCCTCTCCCAAAG
T3 (CA)4AA(CA)3-(CA)7 64 112–114 2 0.05 0.08 57 AF293325 F: GCATTAGCGTCATAACATGAACR: CTCTGTTTACCCTCTTCTTTGC
T5 (GA)15 63 180–244 12 0.73 0.86 55 AF293326 F: AATTGGAAAGTAGCCATTCGR: ACTCTAATGCAACGGCGTATG
T22 (GA)7-(GA)13 64 157–187 11 0.83 0.83 57 AF293327 F: CAGACGCCGACAAATTATCCR: GACGTTTGTTTGGTGCTGTG
T35 (CT)12 60 142–162 10 0.80 0.79 57 AF293328 F: CTCCTTTCACTCGCTTGTCCR: TCCTTCAAGCGTGTATCCAG
T38 (TC)13 64 155–167 6 0.44 0.55 57 AF293329 F: GCATAACCAGATTCCTCCTTTCR: CAAGTGAAAGAAAACGGTGAC
T39 (CA)31 63 188–255 26 0.89 0.94 55 AF293330 F: AACCGCAATATTAGGTCAGCR: GTTTTGGTTTCGCTTGTTTAG
T44 (GT)4AG(GT)7AG(GT)7 63 153–185 6 0.32 0.33 57 AF293331 F: CATAACCCGACTGTCTCACTGR: GAACCACACCCAGACAACG
T47 (GT)5CT(GT)7 62 152–158 3 0.37 0.48 57 AF293332 F: GAAACGCAATGACGTACAGGR: TAATAACGCCGCACAAGGAG
*Ta, annealing temperature.†Accession no. of the sequences available from GenBank.
MEC1053.fm Page 2213 Wednesday, November 15, 2000 8:58 AM

2214 P R I M E R N O T E S
© 2000 Blackwell Science Ltd, Molecular Ecology, 9, 2155–2234
1 min at 72 °C) and a final elongation step of 10 min at 72 °C.PCR products were denatured and separated on 6% poly-acrylamide and 8 m urea sequencing gels using a M13sequence as a size marker.
To characterize each locus, we genotyped ticks originatingfrom two Atlantic Puffin colonies: Baccalieu Island, Newfound-land, Canada (48°08′ N, 52°48′ W) and Hornøya, Norway (Table 1).Expected heterozygosities were variable, ranging from 0.08–0.94 with an average of 0.61 (± 0.09). Neither tick populationshowed any significant deviation from Hardy–Weinbergequilibrium after correcting for multiple tests (Rice 1989).
Cross-species amplification of primers was tested on I. ricinus.PCR amplifications were attempted for all nine loci using 10ticks originating from Bern, Switzerland; PCR protocols wereidentical except that the annealing temperature used forall primers was 52 °C. No successful amplifications wereachieved for any locus.
In conclusion, based on their high polymorphism, the micro-satellite markers developed for I. uriae should enable theexamination of a diverse range of questions related to parasitedispersal among hosts over a range of spatial scales, fromwithin colonies to between hemispheres. Likewise, patternsof parasite gene flow may provide insight into the large-scalemovement of their seabird hosts. Such data will provevaluable for examining questions related to the evolution oflocal adaptation in this host-parasite system and for examin-ing the epidemiology of tick-borne disease.
Acknowledgements
Many thanks to T. Boulinier, Y. Michalakis, E. Danchin, T. De Meeûsand F. Renaud for advice and support, and to T. De Meeûs forproviding samples of Ixodes ricinus. This work was supported bythe CNRS, Programme Environnement, Vie et Sociétés and theInstitute Français Pour la Recherche et la Technologie Polaires(France), and by a Natural Sciences and Engineering ResearchCouncil of Canada Postgraduate Scholarship (Canada) to KM.
References
Boulinier T, McCoy KD, Sorci G (2001) Parasites and dispersal.In: Dispersal: Individual, Population and Community (eds Clobert J,Danchin E, Dhondt A, Nichols J), Oxford University Press,Oxford (in press).
Chastel C (1988) Tick-borne virus infections of marine birds. In:Advances in Disease Vector Research (ed. Harris HK), pp. 25–60.Springer-Verlag, New York.
Delaye C, Aeschlimann A, Renaud F, Rosenthal B, De Meeûs T(1998) Isolation and characterization of microsatellite markersin the Ixodes ricinus complex (Acari: ixodidae). Molecular Ecology,7, 360–361.
Estoup A, Solignac M, Harry M, Cornuet JM (1993) Characterisationof (GT)n and (CT)n microsatellites in two insect species: Apismellifera and Bombus terrestris. Nucleic Acids Research, 21, 1427–1431.
Lincoln S, Daly M (1991) Primer, Version 0.5. Whitehead Institutefor Biomedical Research, Cambridge, MA.
McCoy KD, Boulinier T, Chardine JW, Danchin E, Michalakis Y(1999) Dispersal and distribution of the tick Ixodes uriae withinand among seabird host populations: the need for a populationgenetic approach. Journal of Parasitology, 85, 196–202.
Olsen B, Jaenson TGT, Noppa N, Bunikis J, Bergstrom S (1993) ALyme borreliosis cycle in seabirds and Ixodes uriae ticks. Nature,362, 340–342.
Raymond M, Rousset F (1995) genepop (v.1.2): populationgenetics software for exact tests and ecumenicism. Journal ofHeredity, 86, 248–249.
Rice WR (1989) Analyzing tables of statistical tests. Evolution, 43,223–225.
91220001154PRIMER NOTEsPRIMER NOTEsPRIMER NOTEs0000Graphicraft Limited, Hong Kong
Characterization of microsatellite loci in King George Whiting Sillaginodes punctata Cuvier and Valenciennes (Percoidei: Sillaginidae)
L. HAIGH* and S . C . DONNELLAN†
*South Australian Research and Development Institute, 2 Hamra Avenue, West Beach 5024, Australia †Evolutionary Biology Unit, South Australian Museum, Adelaide, 5000, Australia
Keywords: fish, microsatellites, Sillaginidae, Sillaginodes, teleost
Received 10 August 2000; revision accepted 2 September 2000
Correspondence: S. C. Donnellan. Fax: +61-8-82077222; E-mail: [email protected]
Commonly known as ‘whiting’, the 25 species of the fishfamily Sillaginidae inhabit the western Pacific and IndianOceans. The King George whiting, Sillaginodes punctata, isthe most widespread whiting species in southern Australiawhere it forms significant fisheries, which have becomesubject to management controls due to catch declines (Kailolaet al. 1993). If multiple stocks are present, then their identifica-tion can allow management to be more efficiently focused.In an allozyme study of stocks of Australian whiting, Dixonet al. (1987) identified too few usefully polymorphic lociin King George whiting. Microsatellite DNA markers canprovide sufficient numbers of polymorphic markers inspecies that have low proportions of polymorphic allozymeloci. We describe the isolation and characterization of micro-satellite loci from the King George whiting. We also evaluatethe cross-species amplification of some of these loci on twoother species of whiting of the genus Sillago, from southernAustralian waters that also form significant fisheries.
Microsatellites were isolated, using (AAAG)6 probes, withtwo methods, a polymerase chain reaction (PCR)-based pro-cedure (Cooper et al. 1997) and magnetic bead enrichment(Gardner et al. 1999). A total of 32 clones were isolated bythe first method and sequenced with the Sp6 vector primerusing PE Applied Biosystems PRISM™ Dye Terminator CycleSequencing Kit with the products run on an ABI 373 instru-ment. Sequencing showed that inserts of 24 clones containedAAAG repeats. Of the 18 clones isolated with the secondprocedure, nine showed tandem repeats following sequencing.Of the 33 primer pairs designed, 19 produced amplifiablemicrosatellite loci. GenBank accession numbers for the sequencedclones are AF291469–80.
Each of the 19 loci tested for variability were amplified byPCR using 50–100 ng DNA, 10 pmol each primer, 0.2 mm each
MEC1053.fm Page 2214 Wednesday, November 15, 2000 8:58 AM

P R I M E R N O T E S 2215
© 2000 Blackwell Science Ltd, Molecular Ecology, 9, 2155–2234
of dNTP, 4 mm MgCl2, 1× Promega Taq Gold dilution buffer(10 mm Tris-HCl pH 8.3, 50 mm KCl) and 0.5 U Promega TaqGold DNA polymerase in a 25-µL reaction volume. PCR cyclingconditions for reactions involving King George whiting were:94 °C for 3 min, 58 °C for 45 s, 72 °C for 1 min for one cycle;94 °C for 45 s, 58 °C for 45 s, 72 °C for 1 min for 34 cycles; and72 °C for 6 min, 26 °C for 10 s for one cycle. Genotyping of 10individuals from across the species geographical range,showed that nine loci were variable (Table 1). A single primerfrom each variable pair was re-synthesized and labelled withABI fluorescent dyes (Table 1) for genotyping on an ABI 377instrument using the Genescan application (PE AppliedBiosystems). Co-amplification was achieved for the fol-lowing four groups of loci: Sp2–22, Sp7–19, Sp35–39 andSp32–36–38. Loci were combined for electrophoresis asfollows: Sp2–22, Sp7–19 and Sp32–35–36–38–39.
The nine microsatellite loci were genotyped for 288 indi-viduals in 10 populations from across the species’ geographicalrange. Inspection of the genotype arrays showed, for locus Sp38,a small number of individuals typed as homozygous for rareputative alleles in four populations that otherwise containedonly the common allele. In view of these potentially anomaloustypings and the high frequency of the common allele, eitherfixed or P > 0.99, the locus was omitted from further con-sideration. Tests for conformity to Hardy–Weinberg proportionsin the remaining loci, after sequential Bonferroni adjustment(Hochberg 1988), produced significant results for locus Sp39 inall populations. Locus Sp39 was omitted from further analysisbecause of the possible presence of null alleles. Table 1 showsthe values of FST, for the remaining individual loci estimatedwith genepop (Raymond & Rousset 1995). Individual locusFST values are low, the typical picture for subpopulationdifferentiation seen in many marine fishes (Ward et al. 1994).
Cross-species amplifications, without extra optimizationand at an annealing temperature of 50 °C, were successful
for Sillago bassensis for Sp2, Sp11, Sp19, but were unsuccessfulfor Sp7, Sp22 and Sp32. For S. schomburgkii, Sp2, Sp7, Sp19, andSp32 were successfully amplified. In all cases clean productswere detected in the single individual of each species tested.
Acknowledgements
This work was supported by a Fisheries Research and Develop-ment Corporation grant number 95/008.
References
Cooper S, Bull CM, Gardner MG (1997) Characterisation of micro-satellite loci from the socially monogamous lizard Tiliqua rugosausing a PCR-based isolation technique. Molecular Ecology, 6,793–795.
Dixon PI, Crozier RH, Black M, Church A (1987) Stock identifica-tion and discrimination of commercially important whitings inAustralian waters using genetic criteria. FIRTA Project 83/16,final report 69pp. Centre for Marine Science, University ofNew South Wales, NSW, Australia.
Gardner MG, Cooper S, Bull CM, Grant WN (1999) Isolation ofmicrosatellite loci from a social lizard, Egernia stokesii, using amodified enrichment procedure. Journal of Heredity, 90, 301–304.
Hochberg Y (1988) A sharper Bonferroni procedure for multipletests. Biometrika, 75, 800–802.
Kailola PJ, Williams MJ, Stewart PC, Reichelt RE, McNee A,Grieve C (1993) Australian Fisheries Resources. Bureau ofResource Sciences and the Fisheries Research and DevelopmentCorporation, Canberra, Australia.
Raymond M, Rousset F (1995) genepop (Version 3.1b): popula-tion genetics software for exact tests and ecumenicism. Journalof Heredity, 86, 248–249.
Ward RD, Woodwark M, Skibinski DOF (1994) A comparison ofgenetic diversity levels in marine, freshwater, and anadromousfishes. Journal of Fish Biology, 44, 213–232.
91220001161PRIMER NOTEsPRIMER NOTEsPRIMER NOTEs113Graphicraft Limited, Hong Kong
Table 1 Primer sequences and variability measures for nine microsatellite loci genotyped in King George whiting. HO and HE are theobserved and expected heterozygosity, respectively
Locus Repeat sequence of clone allele Primer sequences (5′−3′)
Fluoro-label type
No. of alleles
Size range (bp)
Mean HO
Mean HE FST
Sp2 (ATAG)8(AAAG)5 F: ATGCGTGAAGATGGTGTCA HEX 29 215–391 0.671 0.768 0.0027R: CTGTTCTCAGCAGTGCTTCA
Sp7 (AAAG)7 F: AAGCTCATTTTCATCAGCGT HEX 9 119–147 0.466 0.530 0.0093R: CGGATCGGAATTTGAAGACA
Sp19 (AAAG)4 F: CGTGTAACCCAGAAACCTACT FAM 3 197–205 0.361 0.331 0.0304R: CATCGAAGCATTGCCTGTAA
Sp22 (AAAG)7 F: CTACTTCACTGCTGCACTCACA HEX 23 119–223 0.774 0.853 0.0016R: GGACCAACACAAGACACACAA
Sp32 (AAAG)4(ACAG)(AAG)3 F: ACACAGATCGCGCACTTGTA TET 3 142–158 0.363 0.411 –0.0024R: CACTGTCCTCGCTGTGGTGA
Sp35 (AAAG)4 F: TCCTAGCTACGATGATGGATG FAM 6 124–144 0.438 0.404 0.0096R: TCTGGTCAGATTCGTCGATGG
Sp36 (AAAG)6 F: CCTCAGTAAGCGCCAGTAATAGACTET 4 106–118 0.239 0.263 –0.0025R: CCTACAGCGATTGGTACAGCAC
Sp38 (CCT)8 F: CCGTGACCGGTTCCATTGAG FAM 4 274–283 0.019 0.538 *R: TCCTCAACTGCGTCTGTGTTCA
Sp39 (GTATC)11 F: TTGCTGACCATGTCAAGTTGA HEX 17 206–286 0.434 0.850 †R: CACCAGGACAAGGCTGATATG
*†See text for explanation of locus departures from Hardy–Weinberg equilibrium.
MEC1053.fm Page 2215 Wednesday, November 15, 2000 8:58 AM

2216 P R I M E R N O T E S
© 2000 Blackwell Science Ltd, Molecular Ecology, 9, 2155–2234
Microsatellite primers from the Eurasian badger, Meles meles
R. BI JLSMA,* M. VAN DE VLIET,* C . PERTOLDI ,† R . C . VAN APELDOORN‡ and L . VAN DE ZANDE*
*Department of Genetics, University of Groningen, Kerklaan 30, NL-9751 NN Haren, The Netherlands, †Department of Ecology and Genetics, University of Aarhus, Building 540, Ny Munkegade, DK-8000 Aarhus C, Denmark, ‡Alterra, PO Box 23, 6700 AA Wageningen, The Netherlands
Keywords: badger, microsatellites, mustilidae, pine marten, primers
Received 29 July 2000; revision accepted 2 September 2000
Correspondence: R. Bijlsma. Fax: + 31 50 3632348; E-mail: [email protected]
In man-dominated landscapes populations of once commonspecies have become decreased both in range and densityand been restricted to small habitat patches with reduceddispersal possibilities. Such fragmented populations becomeincreasingly affected by stochastic population dynamics dueto demographic, environmental and genetic risks, eventuallyleading to increased extinction probabilities (Bijlsma et al.2000). The Eurasian badger (Meles meles L.) is a species that isthreatened in many parts of Western Europe because offragmentation and suffers greatly from agricultural activities(Moore et al. 1999). Moreover, increasing density of roads andtraffic does not only considerably limit dispersal, but alsohighly increases mortality due to road-kills (Aaris Sørensen1995). From a conservation perspective insights into the(meta)population structure of the badger is clearly needed.As allozyme variation was found to be low in badgers(Pertoldi et al. 2000), we have developed highly variablemicrosatellite markers that make noninvasive sampling anduse of dead animals possible.
To isolate microsatellite markers, muscle tissue was obtainedfrom 23 badgers, killed by traffic accidents, by samplinga piece of the ear or the tail. DNA extraction and smallinsert libraries were constructed using standard procedures(Ausubel et al. 1987). Overnight incubation in lysis buffer(100 mm NaCl, 10 mm Tris-HCl pH 8.0, 25 mm EDTA, 0.5%SDS, 0.1 mg/mL proteinase K) at 55 °C was followed by twophenol extractions and one phenol:chloroform (24:1 v/v)extraction. Ethanol precipitated DNA was dried and dis-solved in TE (10 mm Tris-HCL pH. 7.6, 1 mm EDTA). Totalgenomic DNA was digested to completion with MboI, sizefractionated on a 1% agarose gel and the 200–1000 bp frac-tion was recovered by electroelution. These fragments wereligated into BamHI digested pBluescript and used to trans-form competent XL1-Blue Escherichia coli cells to establish asmall-insert library. This library was screened with synthetic(CA)7 and (GA)7 probes, end-labelled with [γ32P]-ATP. Positiveclones were sequenced using the T7-sequencing kit and[α35S]-dATP. Out of an initial 2400 clones, 43 positive recom-binants were identified, eventually yielding seven usablemicrosatellite loci.
Polymerase chain reactions (PCRs) were carried out in 10 µLvolumes, containing 100 ng template DNA, 0.5 µm each primer,0.2 mm dATP, dGTP and dTTP, 0.02 mm dCTP, 0.4 U Taq
DNA polymerase (Pharmacia) and 0.14 µCi [α32P]-dCTP(3000 Ci/mmol) in buffer (50 mm KCl, 1.5 mm MgCl2 and10 mm Tris-HCl, pH 9.0). After an initial 3 min at 94 °C,30 cycles were performed with the following profile: 1 minat 94 °C, 2 min at Ta (optimal annealing temperature) and1.5 min at 72 °C, followed by 10 min at 72 °C. Labelled PCRproducts were separated on a 5% denaturing polyacryla-mide gel (Biozym, Sequagel XR) and exposed to medical X-rayfilm (Fuji) for 5–16 h at –70 °C, using intensifying screens.A sequence ladder of pBluescript was used as size reference.
The level of polymorphism was determined for a totalof 105 badger samples collected from different localities inThe Netherlands and Denmark. The characteristics of theseven microsatellite loci are shown in Table 1. All loci werefound to be polymorphic and the mean number of alleleswas 4.3 (range: 2–6) and mean expected heterozygosity(HE) was 0.45 (range: 0.15–0.65). Although this is within therange observed for other mustelid species (O’Connell et al.1996; Dallas & Piertney 1998; Fleming et al. 1999), meanexpected heterozygosity in the badger was lower than inthese other species (means ranging from 0.55 to 0.84). Exceptfor two subsamples of locus Mel 2, mainly due to verylow expected numbers for some genotypes, no significantdifferences in expected and observed levels of hetero-zygosity were observed for all loci, indicating the absenceof null-alleles. The badger primer sets were also evaluatedfor use in two other mustelid species. In the pine marten(Martes martes, n = 88), two primer sets failed to produce anamplification product, two were found to be polymorphic andthe other three monomorphic (Table 1). In the otter (Lutralutra, n = 5), all primer sets yielded an amplification product(data not shown). However, the sample size was too small toreliably estimate number of alleles and expected heterozygosity.
Presently, the primer sets are used to assess the currentgenetic population structure of badger populations and ofthe pine marten.
Acknowledgements
We thank the ‘Vereniging Das en Boom’ (Beek-Ubbergen, NL)and the National Environmental Research Institute (Rønde, DK)for supplying the badger road-kills, and Alterra (Wageningen,NL) for the pine marten samples.
References
Aaris Sørensen J (1995) Road-kills of badgers (Meles meles) inDenmark. Annales Zoologici Fennici, 32, 31–36.
Ausubel FM, Brent R, Kingston RE et al. (1987) Current Protocolsin Molecular Biology. Wiley, New York.
Bijlsma R, Bundgaard J, Boerema AC (2000) Does inbreedingaffect the extinction risk of amall populations?: predictionsfrom Drosophila. Journal of Evolutionary Biology, 13, 502–514.
Dallas JF, Piertney SB (1998) Microsatellite primers for theEurasian otter. Molecular Ecology, 7, 1248–1251.
Fleming MA, Ostrander EA, Cook JA (1999) Microsatellitemarkers for American mink (Mustela vison) and ermine(Mustela erminea). Molecular Ecology, 8, 1352–1354.
Moore N, Witherow A, Kelly P, Garthwaite D, Bishop J, Langton S,Cheeseman C (1999) Survey of badger Meles meles damage to
MEC1053.fm Page 2216 Wednesday, November 15, 2000 8:58 AM

P R I M E R N O T E S 2217
© 2000 Blackwell Science Ltd, Molecular Ecology, 9, 2155–2234
agriculture in England and Wales. Journal of Applied Ecology,36, 974–988.
O’Connell M, Wright JM, Farid A (1996) Development of PCRprimers for nine polymorphic American mink Mustela visonmicrosatellite loci. Molecular Ecology, 5, 311–312.
Pertoldi C, Loeschcke V, Madsen AB, Randi E (2000) Allozymevariation in the Eurasian badger Meles meles in Denmark. Journalof Zoology, 252, in press.
91220001162PRIMER NOTEsPRIMER NOTEsprimer Notes0000Graphicraft Limited, Hong Kong
Characterization of microsatellite loci in the eastern oyster, Crassostrea virginica
BONNIE L . BROWN,* DEAN E. FRANKLIN,* PATRICK M. GAFFNEY,† MIN HONG,‡ DAN DENDANTO§ and IRV KORNFIELD¶
*Ecological Genetics Laboratory, Virginia Commonwealth University, Richmond, Virginia, USA, †College of Marine Studies, University of Delaware, Lewes, Delaware, USA, ‡Basic College of Medicine, Norman Bethune University of Medical Sciences, Chang Chun, Jilin Province, PR China, §Department of Biological Sciences, University of Maine, Orono, Maine, USA, ¶School of Marine Sciences, University of Maine, Orono, Maine, USA
Keywords: Crassostrea virginica, genetics, microsatellite, oyster
Received 10 August 2000; accepted 2 September 2000
Correspondence: B. L. Brown. Fax: + 804 8280503; [email protected]
Oysters of the genus Crassostrea are of great ecological andeconomic value worldwide. Eastern oysters, C. virginica, wereonce a keystone species of western Atlantic estuaries but noware depleted in many areas due to the combined effectsof overharvesting, habitat alteration, and diseases causedby introduced parasites (Brown & Paynter 1991). Hopes ofrestoring oysters to these regions are tied to development of
disease tolerant strains of the native C. virginica, and efforts tocultivate this and related species involve the use of marker-assisted selection. The preferred character for such studiescurrently is the microsatellite (Hare & Avise 1997; Magoulaset al. 1998; Huvet et al. 2000). In each published instanceto date, dinucleotide repeats were investigated, exhibitingextremely high heterozygosities and therefore reduced powerfor multilocus heterozygosity surveys.
We surveyed a C. virginica library for the presence of tri- andtetranucleotide repeats. Genomic DNA was purified fromC. virginica somatic tissue with an STE (10 mm Tris-HCl,pH 8.0, 1 mm EDTA, 100 mm NaCl, 2% SDS, 0.5 mg/mLproteinase K) extraction (Hillis et al. 1996), which includedtreating the first aqueous phase following organic extractionwith RNase A (final concentration 0.03 µg/µL) for 30 min.Detection of microsatellite sequences in a size-selected (400and 900 bp) partial genomic library (pBluescript II SK+) wasperformed as described by Rassmann et al. (1991). Transformantcolonies were screened using a cocktail of two digoxygenin-labelled oligonucleotide probes [(ATG)7 and (AAAC)5] andDNA inserts of 13 positive colonies were sequenced. Primerswere designed with target annealing temperatures of 50–55 °C and expected amplicon lengths between 80 and 220 bp.Polymerase chain reactions (PCRs) were performed in reactionscontaining 100 ng genomic DNA, 0.5 µm unlabelled forwardprimer, 0.25 µm unlabelled reverse primer, 0.25 µm labelledreverse primer, 0.2 mm each dNTP, 0.5 U of Taq polymerase(Display Systems Biotech), 10 mm Tris-HCl, pH 8.3, 2.5 mmMgCl2, 50 mm KCl, 0.01% Triton X-100, 0.0005% gelatin, andsufficient diH2O for a total volume of 15 µL. Amplificationwas conducted in PTC-100 thermal cyclers (MJ Research)using an initial denaturation at 94 °C for 2 min, followed by30 cycles of 94° for 30 s, 50–55° for 30 s, and 72° for 15 s.Amplification products were resolved by ultrathin gel electro-phoresis of fluorescent-labelled PCR products (using filter set
Table 1 Attributes of seven microsatellite loci derived from the badger (Meles meles) in 105 badgers and 88 pine martens (Martes martes)samples. Ta, annealing temperature; SR, size range observed in bp; A, number of alleles; HE, expected heterozygosity; HO, observedheterozygosity; NA, no amplification product. GenBank accession nos of these loci are AF300707–AF300714
Meles meles Martes martes
Locus Repeat structure Primer sequences (5′−3′) Ta (°C) SR A HE HO SR A HE HO
Mel 1 (GT)20 CTGGGGAAAATGGCTAAACC 60 262–274 5 0.54 0.45 261–267 4 0.69 0.68AATGCAGGCTTTGCAATTCC
Mel 2 (GT)12 TTGTGCGTATGCATGTGTGC 55 126–128 2 0.15 0.08 NA — — —TGCCCACGTTATAAACACTCC
Mel 3 (GT)13 CTAAAACCACCACCACAATGC 60 128–134 4 0.69 0.67 NA — — —GTGTATAGCCTGCGAACAAGG
Mel 4 (GT)16 TGAGTTTCCATCCTTGGTCC 60 141–147 4 0.21 0.21 144 1 0 0ATCTTTTTCCTGCTGAGACCC
Mel 5 (GT)23 AATGTAAGGTACCCAGCATAGTCC60 105–119 6 0.65 0.53 188 1 0 0GACACCATGTTAACCATATAAAGGG
Mel 6 (GT)13AC(GA)4 AAGTCCTCCTTGCAGTTTGG 60 149–155 4 0.33 0.29 137–139 2 0.29 0.31AGCAAGCTCTTGGTTCTTGG
Mel 7 (GT)21 ATTCTTCCTTTTAGCTTTGGCC 60 134–144 5 0.58 0.50 124 1 0 0TCTCACAGTGTCAGCAGAAAGG
MEC1053.fm Page 2217 Wednesday, November 15, 2000 8:58 AM

2218P
RIM
ER
NO
TE
S
© 2000 B
lackwell Science L
td, M
olecular Ecology, 9, 2155–2234
Table 1 Repeat structure, primer sequences, amplification characteristics, and polymorphism data for microsatellite loci examined in Crassostrea virginica. Observed numbers of alleles,heterozygosity values (observed and expected), and the P-values for exact tests of fit to Hardy–Weinberg equilibrium (HWE; for each P-value compared to Bonferroni-corrected alphavalue, significant departure is shown by an asterisk ‘*’) were determined for native populations in Virginia (n = 40) and Connecticut (n = 44; for Cvi6, 8, and 11 only), USA, the lattershown in parentheses
Locus RepeatGenBank Accession no.
Primer Sequences (5′−3′) (F = forward, R = reverse)
Anneal (°C)
Expected size (bp)
Observed no. alleles HO HE HWE
Cvi6 AF276247 F: AATATTACCACGTGACCTGTGATGAATCCTTGTAGC 50 198 13 0.54 0.87 <0.0001*(GAT)17 R: GTAAATATTGTATGTTCACTGTCCGGTCGTTGTGTTA (15) (0.55) (0.90) (<0.0001*)Cvi7 AF276248 F: TCGAAACCGAACCCTTCACCAG 50 196 9 0.58 0.77 <0.0001*(CAAA)6 R: TAGTGTATATCAGTTCAGACAGGTCTTTTAATGGCvi8 AF276249 F: CTGAGCTTAGACTACAGCCCTACACCAG 55 205 14 0.48 0.68 0.0001*[(CAAA)2(CAA)]2 R: GATATCCTAAACCTACTCCTCTTTTGCATTTTTG (6) (0.18) (0.47) (<0.0001*)Cvi9 AF276250 F: TCCAGAATTTATAAGATACTAACGATAATATACTTTATAATCCGT55 124 14 0.83 0.90 0.1207(CAT)14 R: ACGAAACCGACCACAACGACGACTCvi11 AF276252 F: CATCGGCCAGTGACTACCTTGTAAAAG 55 153 4 0.51 0.64 0.0465(CAAA)5 R: GCGATAACACTAAATACTTTGTTTCGGCCC (4) (0.48) (0.53) (0.2882)Cvi12 AF276253 F: GAGTGAGAATTTCTCGGGTGGGGC 55 117 10 0.70 0.81 0.0399(CAAA)6CAGAAAAA(CAAA)4 R: ACTTTTTGTCACATTGACCATCCCATTTCACvi13 AF276254 F: ACCGGAGATGGTGGTATTTCC 50 156 26 0.71 0.94 0.0027*(CAAA)10 R: GTGTTGCAAGACTTACAGAAGAAAC
ME
C1053.fm
Page 2218 W
ednesday, Novem
ber 15, 2000 8:58 AM

P R I M E R N O T E S 2219
© 2000 Blackwell Science Ltd, Molecular Ecology, 9, 2155–2234
C and tamara size standard). Mendelian inheritance of alleleswas determined by examining the amplified products intwo or more full sib families per locus (both parents and 15–20 offspring in each family). To determine allele range andpopulation-level variability, two wild groups of C. virginica wereexamined: one from Virginia Beach, Virginia (latitude36°54′N, longitude 076°05′W; n = 40) and one derived from wildspat fall in Long Island Sound, Connecticut (latitude41°06′N, longitude 73°25′W; n = 44). Primers also were testedwith C. gigas (n = 5 each from two populations), C. angulata(n = 5), Saccostrea glomerata (formerly S. commercialis; n = 5) andTiostrea chilensis (n = 5). Statistical analyses were performedusing genepop version 3.1 (Raymond & Rousset 1995).
Of the 10 primer sets, all amplified from C. virginica productsof the size expected from insert sequences. Three yielded homo-logous products and seven loci (Cvi-6, Cvi-7, Cvi-8, Cvi-9,Cvi-11, Cvi-12, and Cvi-13) were polymorphic (Table 1). Allseven polymorphic loci exhibited Mendelian segregation. TheVirginia C. virginica population was surveyed for variation atall seven loci and the Connecticut population was surveyedfor Cvi-6, Cvi-8, and Cvi-11. Only three of the seven lociconformed approximately to Hardy–Weinberg equilibrium(Cvi-9, Cvi-11, and Cvi-12). For all loci, observed heterozygositywas lower than expected, suggesting the common occurrence ofsegregating null alleles. No evidence for linkage was observedamong these seven loci. Allelic distribution was significantlydifferent between the two wild C. virginica populations (Fisherexact test P < 0.0001). When tested with C. gigas, C. angulata,and S. glomerata, four of the 10 primer sets (Cvi6, Cvi9, Cvi12,Cvi13) yielded various homologous products differingsubstantially in size from the allele sizes observed forC. virginica. No amplification was observed for T. chilensis.
Acknowledgements
We thank the following for providing tissue or DNA samples ofoysters: Trafford Hill, Tallmadge Bros. Inc., Geoff Allan, MikeHeasman, Diarmaid Ó Foighil, John Scarpa, and Jon Waters. Weacknowledge the assistance and advice of Tracy Hamm, BillEggleston and Jon Waters. This research was supported in partby funding from Chesapeake Scientific Investigations Founda-tion, Inc. and by a grant from the Maine Aquaculture InnovationCenter (98–23).
References
Brown BL, Paynter KT (1991) Mitochondrial DNA analysisof native and selectively inbred Chesapeake Bay oysters,Crassostrea virginica. Marine Biology, 110, 343–352.
Hare MP, Avise JC (1997) Population structure in the Americanoyster as inferred by nuclear gene genealogies. Molecular Biologyand Evolution, 15, 119–128.
Hillis DM, Mable BK, Larson A, Davis SK, Zimmer EA (1996) NucleicAcids IV: sequencing and cloning, In: Molecular Systematics2nd edn. (eds Hillis DM, Moritz C, Mable B), pp. 342–343.Sinauer Associates, Inc., Sunderland, Massachusetts, USA.
Huvet A, Boudry P, Ohresser M, Delsert C, Bonhomme F (2000)Variable microsatellites in the Pacific oyster Crassostrea gigasand other cupped oyster species. Animal Genetics, 31, 71–72.
Magoulas AN, Gjetvaj B, Terzoglou V, Zouros E (1998) Three
polymorphic microsatellites in Japanese oyster Crassostreagigas (Thunberg). Animal Genetics, 29, 69–70.
Rassmann KC, Schlötterer C, Tautz D (1991) Isolation of simple-sequence loci for use in polymerase chain reaction-based DNAfingerprinting. Electrophoresis, 12, 113–118.
Raymond M, Rousset F (1995) genepop (vers 1.2): populationgenetics software for exact tests and ecumenicism. Journal ofHeredity, 86, 248–249.
91220001148PRIMER NOTEsPRIMER NOTEsPRIMER NOTEs1000Graphicraft Limited, Hong Kong
Microsatellite markers for Rhytidoponera metallica and other ponerine ants
M. CHAPUISAT,* and J . N. PAINTER,† and R . H. CROZIER,‡
Department of Genetics, La Trobe University, Bundoora, Victoria 3083, Australia
Keywords: microsatellite, ponerine ants, Rhytidoponera metallica, social insects
Received 17 August 2000; revision accepted 4 September 2000
Correspondence: Michel Chapuisat. *Present address: Institute of Ecology, University of Lausanne, 1015 Lausanne, Switzerland. Fax: + 41 21 692 41 65; E-mail: [email protected] addresses: †Department of Ecology and Systematics, University of Helsinki, PL 17, FIN-00014 Helsinki, Finland. ‡School of Tropical Biology, James Cook University, Townsville, Queensland 4811, Australia.
The ant genus Rhytidoponera (subfamily Ponerinae) contains104 described species (Bolton 1995) which are remarkablydiverse in their social organization and mating system(Crozier & Pamilo 1996). The greenhead ant Rhytidoponerametallica is among the most common ants in Australia, and itpossesses an unusual social structure, as the reproductive roleis almost invariably taken by multiple mated workers in lieuof queens (Haskins & Whelden 1965). This secondary loss ofqueens and partitioning of reproduction between morpho-logically undifferentiated workers offers a good opportunityto study how altruism is maintained in societies with lowrelatedness (Hamilton 1972). Such studies require detailedgenetic data on the social organization and mating system.Recently, microsatellite markers have been described in threespecies of ponerine ants (Doums 1999; Giraud et al. 1999; Tay& Crozier 2000), but only two microsatellites from the mostrelated species proved useful in R. metallica. Therefore, wecharacterized eight new microsatellite markers for R. metallica,and tested for cross-species amplification in 10 other speciesof ponerine ants.
A partial genomic library was constructed from 100 R.metallica workers, with gasters removed. DNA was extractedwith a CTAB protocol (Hillis et al. 1990), digested to completionwith Sau3A I and RsaI, size-selected for fragments between300 and 900 bp (Crozier et al. 1999), and ligated into a pUC19vector. The library was screened with an (AG)10 oligonucle-otide probe end-labelled with 33P, and 62 positive recombinantclones were isolated. Thirty positive clones were sequenced,and primers were designed for 14 of them.
These primers were assayed on a sample of workerscollected from the You Yangs Regional Park in Victoria. DNA
MEC1053.fm Page 2219 Wednesday, November 15, 2000 8:58 AM

2220 P R I M E R N O T E S
© 2000 Blackwell Science Ltd, Molecular Ecology, 9, 2155–2234
from individual workers was extracted by incubating threecrushed legs in 250 µL of 5% Chelex at 95 °C for 20 min(Crozier et al. 1999). Amplification was carried out in 10 µLfinal volume with 10 mm Tris-HCl, 50 mm KCl, 0.1% TritonX-100, 1.5 mm MgCl2, 1.7 µm each dNTP, 0.03–0.05 µm for-ward primer end-labelled with 33P, 0.4 µm reverse primer,5 µg of BSA, 0.4 U of Taq DNA polymerase (Promega) and2 µL of template DNA. The polymerase chain reaction (PCR)profile consisted of a 3-min initial denaturation step at 94 °C,followed by 30 cycles of 30 s at 92 °C, 30 s at 50 °C and 30 s at72 °C. PCR products were separated by electrophoresis through6% denaturing polyacrylamide gels.
Eight primer pairs yielded suitable amplification products.All eight markers were highly polymorphic, with betweennine and 23 alleles detected in the study population (Table 1).Alleles were somewhat difficult to score for Rmet8 andRmet16, because of stutter bands. Additionally, the previouslyunpublished marker Rh12–13525, which was developed byW. Tek Tay for Rhytidoponera sp. 12, (Tay & Crozier 2000)had seven alleles in R. metallica (Table 1).
The success of cross-species amplification in other generawas low (Table 2). Scorable amplification products wereobtained in only 12 out of the 45 tests (27% of the five speciesassayed for nine markers). Polymorphism among three indi-viduals was detected at a single marker in four species, i.e. in9% of the 45 tests.
In contrast, the success of cross-species amplification withinthe genus Rhytidoponera was very high (Table 2). Primingsites were well conserved among the Rhytidoponera speciestested, resulting in strong amplification products in 40 outof the 45 tests (89%). Overall, scorable polymorphism amongthree individuals was detected in 23 out of the 45 tests(51%). In each species of Rhytidoponera, between three and
eight markers were polymorphic, and this figure shouldincrease when more individuals are analysed. Hence, thispanel of microsatellites will permit detailed studies of kinstructure, breeding system, gene flow and population struc-ture across species of Rhytidoponera with variable social struc-tures. Additionally, these markers might help to distinguishbetween the species yet to be described that are currentlylumped into the metallica species-complex.
Acknowledgements
We thank Bruno Gobin, Juergen Liebig, Christian Peeters andHanna Reichel for specimens of various ponerine species, WeeTek Tay for the primers of the locus Rh12–13525, and ParksVictoria for permitting research in the You Yangs Regional Park.This work was supported by grants from the Swiss NationalScience Foundation and the Société Académique Vaudoise.
References
Bolton B (1995) A New General Catalogue of the Ants of the World.Harvard University Press, Cambridge, MA.
Crozier RH, Kaufmann B, Carew ME, Crozier YC (1999) Mutabilityof microsatellites developed for the ant Camponotus consobrinus.Molecular Ecology, 8, 271–276.
Crozier RH, Pamilo P (1996) Evolution of Social Insect Colonies: SexAllocation and Kin Selection. Oxford University Press, Oxford.
Doums C (1999) Characterization of microsatellite loci in thequeenless Ponerine ant Diacamma cyaneiventre. Molecular Ecology,8, 1957–1959.
Giraud T, Blatrix R, Solignac M, Jaisson P (1999) Polymorphicmicrosatellite DNA markers in the ant Gnamptogenys striatula.Molecular Ecology, 8, 2143–2145.
Hamilton WD (1972) Altruism and related phenomena, mainly
Table 1 Characteristics of nine microsatellite loci for Rhytidoponera metallica. n, number of individuals analysed; N, number of nestsanalysed; HO, observed heterozygosity; HE, expected heterozygosity. Deviations from Hardy–Weinberg equilibrium are not significant(exact tests). GenBank accession nos: AF282988–AF282998, AF292086
Locus Primer sequence (5′−3′)Core repeat in cloned allele n/N No. alleles Size range HO HE
Rmet3 F: TCTCGGAAAAGAAATAGAGACAG (GA)40 23/13 10 226–248 0.74 0.84R: CATGTCTACCTGACCGAGAAC
Rmet4 F: CATACTATCGCTTATCTCAGC (CT)26 14/14 11 152–178 1.00 0.87R: GAACTAACCTCATCGTCCACT
Rmet7 F: AGACTTCAATCACGAGAAGCG (AG)30 216/27 21 223–269 0.86 0.86R: ATTGGCACTTGGTCGATAGG
Rmet8 F: AAAACACGAGATACCGTCCTC (CT)50 27/13 15 108–144 0.96 0.88R: CTGTTGACCCGCCTCCTG
Rmet10 F: GTCATGGACGGAAATCGC (CT)37 216/27 23 246–296 0.91 0.89R: TACCCCCATTCTATCTCGCA
Rmet12 F: GGAGTTTCTACTCGCCTCTCG (GA)20 216/27 15 275–315 0.85 0.87R: CTCATTCGTATCACGCAAGC
Rmet15 F: CATTCGACCGCATTTTCC (AG)28 216/27 9 154–202 0.44 0.42R: CGAGAGAGGGTGCGACAT
Rmet16 F: TTTAGGGACAAGAGACATGGC (CT)40 18/14 17 117–203 1.00 0.92R: ATTGATAGGTCGCGGTCTTG
Rh12–13525 F: GACATACCGGGAGCGACC (CT)11 216/27 7 178–192 0.72 0.70R: CGCCTTCTGACACCTTTGG
MEC1053.fm Page 2220 Wednesday, November 15, 2000 8:58 AM

P R I M E R N O T E S 2221
© 2000 Blackwell Science Ltd, Molecular Ecology, 9, 2155–2234
in social insects. Annual Review of Ecology and Systematics, 3,193–232.
Haskins CP, Whelden RM (1965) ‘Queenlessness’, worker sibship,and colony versus population structure in the Formicid genusRhytidoponera. Psyche, 72, 87–112.
Hillis DM, Larson A, Davis SK, Kimmer EA (1990) Nucleic acidsIII: Sequencing. In: Molecular Systematics (eds Hillis DM, Moritz C),pp. 318–370. Sinauer, Sunderland, MA.
Tay WT, Crozier RH (2000) Microsatellite analysis of gamergaterelatedness of the queenless ponerine ant Rhytidoponera sp. 12.Insectes Sociaux, 47, 188–192.
91220001152PRIMER NOTEsPRIMER NOTEsPRIMER NOTEs0000Graphicraft Limited, Hong Kong
Rapid and efficient identification of microsatellite loci from the sea urchin, Evechinus chloroticus
C. PERRIN and M. S . ROY
Department of Zoology, University of Otago, PO Box 56, Dunedin, New Zealand
Keywords: biotin, Evechinus chloroticus, microsatellites, nonradioactive
Received 10 August 2000; revision accepted 4 September 2000
Correspondence: M. S. Roy. Fax: + 64 3479 7584; E-mail: [email protected]
The New Zealand Fiords are characterized by a seawardlyflowing surface low salinity layer (LSL), produced by prodi-gious rainfall. Maintenance of salt balance occurs by a weakoceanic inflow below this LSL. Because the flow of sea wateris inwards, planktonic larvae of the fiords are thought tobe retained within natal fiords, which could have importantconsequences on gene flow. This hypothesis was supportedby allozyme analyses of Evechinus chloroticus, a sea urchinendemic to New Zealand (Mladenov et al. 1997). Despite highlevels of gene flow found amongst all coastal populationsof New Zealand, a population sampled within one fiord
was found to be genetically differentiated. Our intention isto address the effects of oceanographic and hydrographicfeatures of all 14 fiords on recruitment and population struc-turing of E. chloroticus. In order to do this we are usinghighly polymorphic microsatellite markers.
Traditional colony hybridization methods used for micro-satellite cloning are time-consuming and relatively inefficient.Several enrichment techniques have previously been pub-lished (Gardner et al. 1999; Inoue et al. 1999). However, theseeither use radioactivity or include a number of lengthy steps.We report here on an alternative easy, fast, efficient and non-radioactive method of cloning microsatellite markers fromthe sea urchin E. chloroticus.
Size selected fragments (250–800 bp) of NdeII-digest genomicDNA from five individuals of E. chloroticus were ligated intopUC18 vector (Pharmacia). Inserts were amplified usinguniversal primers (M13) and purified with High Pure PCRproduct purification Kit (Roche).
In order to hybridize DNA to probes, 100–500 ng of sizeselected amplified DNA (250–800 bp) was mixed, in separatetubes, with 2 pmol of GA12 and GT12 5′-biotinylated repeatprobes in 20 µL of extension solution containing: 0.2 mm ofeach dNTP, 2 mm MgCl2, 10 mm Tris-HCl (pH 8.3), 50 mm KCl,and 0.5 U Taq DNA polymerase (Roche). This mixture wassubjected to one round of polymerase chain reaction (PCR)(5 min at 94 °C, 1 min at 55 °C, 10 min at 72 °C) using a PTC-100thermal cycler (MJ Research). Purified products were added toStreptavidin MagneSphere Paramagnetic Particles (Promega)and incubated for 15 min at room temperature with 120 µL of6× SSC/0.1% SDS, mixed continuously. After a series of washesin 150 µL of 6× SSC/0.1% SDS for 15 min: once at 60 °C, 65 °C,70 °C, 75 °C and twice in 150 µL of 6× SSC at 80 °C, DNA waseluted with 100 µL of 0.1 m NaOH at 80 °C for 10 min. Thesolution was neutralized with 100 µL TE pH 7.5, purified andamplified as above. A further round of enrichment (hybridiza-tion, elution, PCR) was then undertaken.
Size selected fragments (250–800 bp) of NdeII-digest fromenriched inserts were ligated into pUC18 vector. Ligation
Table 2 Results of cross-species amplification in 10 other ant species from the subfamily Ponerinae
Rmet3 Rmet4 Rmet7 Rmet8 Rmet10 Rmet12 Rmet15 Rmet16 Rh12–13525
Tribe ECTATOMMINIRhytidoponera tasmaniensis +5 +3 — +5 +2 +3 +2 +2 +4R. victoriae +2 +1 +1 +1 +2 +2 +1 — +2R. purpurea +1 +1 +2 — +1 +3 +2 +1 +4R. impressa +1 +1 +5 — +1 +2 s +1 +4R. confusa +1 +1 +3 — +2 +1 s +2 +3Gnamptogenys menadensis +1 — — — — +1 +2 — —
Tribe PONERINIDiacamma cyaneiventre +3 — — — — — +1 — —D. ceylonense +2 — — — — — +1 — —Harpegnathos saltator +3 — — — +1 — +1 — —Streblognathus aethiopicus — — — — — +1 +1 — —
+ n, scorable amplification product with n alleles detected in three individuals.—, no scorable amplification product.s, present of supernumerary amplification products.
MEC1053.fm Page 2221 Wednesday, November 15, 2000 8:58 AM

2222P
RIM
ER
NO
TE
S
© 2000 B
lackwell Science L
td, M
olecular Ecology, 9, 2155–2234
Table 1 Characteristics of height Evechinus chloroticus microsatellite loci. HO and HE are observed and expected heterozygosities, respectively, calculated with genetix 4.1 (Belkhir et al.1996). PCR programmes are: (1) 31 cycles of 15 s at 94 °C, 10 s at annealing temperature, 10 s at 72 °C; and (2) 4 min at 94 °C, 31 cycles of 1 min at 94 °C, 1 min at annealing temperature,1 min at 72 °C and finished by 10 min at 72 °C
Locus Primer sequences (5′−3′) Repeat arrayPCRprogramme
Annealingtemp. (°C)
No. ofalleles
Size range (bp) HO HE
Accession no.
C1 F: CTGCCCGGAAGTATTGTTATTG (AG)23 1 53 24 110–166 0.92 0.92 AF299134R: CATTTCGGCCACGGTCACT
C29 F: GAATAAACATTTACAAATCTGTC (AG)11 2 55 6 77–89 0.77 0.77 AF299135R: ATAAAAAGGGAAACGAAACAAGAA
G29 F: GATCGGTATGATAAACTT (CT)3CC(CT)3AT(CT)10 1 45 8 92–102 0.74 0.73 AF299136R: ATGCATGGGTAGGTGTG
A34 F: ACGGTTCGATTGAGAGAG (AG)19 1 51 13 109–133 0.63 0.86 AF299137R: TGACGGGGCAGGAAATGTG
B14 F: GATCATTGAGATGGCGATG (GT)6 1 51 4 58–64 0.31 0.36 AF299138R: GCACCCACACGTACGCGC
A12 F: CTGTGTTCTATTAAAATTGTCCTC (GA)4TAT(GA)7 2 58 7 85–97 0.14 0.51 AF299132R: TTGAAATTTGCTCTACCCCTATT
D1 F: CGACAAGTCCACCGTTCAACTCCA (CA)2CT(CA)2CT(CA)4TG(AC)2 1 51 6 91–109 0.07 0.28 AF299139R: ATCTACTGTTGTTGCCTGTGTCAC
A13 F: ATCCCCTTCAAATGTTGCCTGATT (AG)2(GA)5AA(AG)4 1 51 3 99–111 0.07 0.07 AF299133R: GGCGTAACGGTAATGACCCTGTC
ME
C1053.fm
Page 2222 W
ednesday, Novem
ber 15, 2000 8:58 AM
P R I M E R N O T E S 2223
© 2000 Blackwell Science Ltd, Molecular Ecology, 9, 2155–2234
reactions were transformed into Escherichia coli XL1-Bluecompetent cells. Recombinant clones were screened usingtwo separate 10 µL PCR reactions, incorporating the repeatprobe and either one of the M13 universal primers. Productswere visualized on 2% agarose gel using ethidium bromide.Approximately 70% (19) and 45% (7) of the clones were posit-ive for GA12 and GT12 probes, respectively. Screening of thesame clones was attempted by using both M13 primers andthe complementary probe in the same PCR reaction (as inGardner et al. 1999). However, only 10% of clones for eachprobe were positive, indicating that this screening methodis unreliable. Eighteen and six positive clones were ampli-fied with M13 primers and sequenced using Big-Dye cyclesequencing kit (Applied Biosystems), separated on ABI377 automated sequencer. Eighteen and five sequencescontained microsatellites, respectively, and 11 and four wereunique resulting in a final enrichment efficiency of approxim-ately 45% for GA12 and 30% for GT12.
Primer pairs were designed from sequences flanking repeats.PCR were performed in 10 µL reaction mixture: 20–200 ngDNA, 0.2 mm of each dNTP, 1.5 mm MgCl2, 10 mm Tris-HCl(pH 8.3), 50 mm KCl, 0.5 µm of [γ33]-ATP-labelled forwardprimer, 0.5 µm of reverse primer and 0.25 U Taq DNA poly-merase. Different PCR regimes were used (Table 1). Alleleswere separated on a 5% denaturing polyacrylamide gel (LongRanger, FMC) and visualized by autoradiography.
Eight polymorphic loci were identified and scored for 100individuals from 14 sites along the fiords (Table 1). No link-age disequilibrium was detected between each pair of locususing genetix 4.1 (1000 permutations, P < 0.05) (Belkhir et al.1996). To assess Wahlund effects, 26 individuals of the samesite were analysed for deficit of heterozygotes. Loci A12and D1 showed significant deviation from Hardy–Weinbergequilibrium (1000 permutations, P < 0.05) suggesting thepossibility of null alleles.
We also tested the utility of these primers for two individualsfrom each of Coscinasterias muricata (Asteroidea), Ophiactissavignyi and Amphipholis squamata (Ophiuroidea). Only theless polymorphic locus (A13) seems to amplify clearly in sucha large range of echinoderms.
Acknowledgements
We thank Philip Mladenov and Steve Wing for help with samplecollections, and Renate Sponer for technical advice. This workwas funded by the Royal Society of New Zealand’s MARSDENFUND, and approved by the Environmental Risk ManagementAuthority of New Zealand (No. GMO00/UO021).
References
Belkhir K, Borsa P, Goudet J, Chikhi L, Bonhomme F (1996)GENETIX (Version 4.01), logiciel sous WINDOWS TM pour la génétiquedes populations. Laboratoire Génome, Populations, Interactions,Université de Montpellier II, Montpellier.
Gardner MG, Cooper SJB, Bule CM, Grant WN (1999) Isolationof microsatellite loci from social lizard, Egernia stoksii, using amodified enrichment procedure. Journal of Heredity, 90 (2), 301–304.
Inoue S, Takahashi K, Ohta M (1999) Sequence analysis of genomic
regions containing trinucleotide repeats isolated by a novelcloning method. Genomics, 57, 169–172.
Mladenov PV, Allibone RM, Wallis GP (1997) Genetic differenti-ation in the New Zealand sea urchin Evechinus chloroticus(Echinodermata: Echinoidea). New Zealand Journal of Marineand Freshwater Research, 31, 261–269.
91220001155PRIMER NOTEsPRIMER NOTEsPRIMER NOTEs113Graphicraft Limited, Hong Kong
Polymorphic microsatellite DNA markers in the African elephant (Loxondonta africana) and their use in the Asian elephant (Elephas maximus)
L. S . EGGERT,* U. RAMAKRISHNAN,* N. I . MUNDY† and D. S . WOODRUFF*
*Ecology, Behavior and Evolution, University of California San Diego, 9500 Gilman Dr., La Jolla, CA 92093–0116, USA, †Institute of Biological Anthropology, Oxford, OX2 6QS UK
Keywords: elephants, genetic censusing, microsatellites
Received 14 June 2000; revision received 10 August 2000; accepted 4 September 2000
Correspondence: Lori Eggert. Fax: (858) 534–7108; E-mail: [email protected]
Poaching and rapid human population growth have putintense pressure on elephant populations, especially in theforests of west and central Africa. Conversion of rainforest toagriculture has resulted in the fragmentation and isolationof forest elephant populations in small reserves. Effectivemanagement of these populations will require informationabout census size, sex ratio, and the amount and distributionof genetic diversity. Although we can count savannah ele-phants from the ground or air, forest elephants are difficult tosee in the dense vegetation and censusing them requires usingindirect methods (Barnes & Jensen 1987).
For our genetic characterization of African forest elephantpopulations, we developed a panel of microsatellite loci.Genomic DNA was extracted from tissue samples of fourunrelated African zoo elephants using the QIAamp Bloodand Tissue Kit (Qiagen), then pooled in equal concentrations.We digested 10 µg with MboI and ligated fragments of 200–500 bp into M13mp18 (Rassmann et al. 1991). Transformationof competent DH5αF′ Escherichia coli (GibcoBRL) was per-formed by electroporation. Cells were plated on YT mediaand plaques were replicated on nylon filters (MSI). Theprobes (CA)15 and (GA)15 were labelled with [γ32P]-dATP andhybridized with the plaque lifts. We selected 40 (1.6%) col-onies that were strongly positive and isolated the DNA usingthe QiaPrep Spin Miniprep Kit (Qiagen). We sequenced theseusing the Sequenase 2.0 kit (Amersham Life Science), anddetermined that 32 contained microsatellites, 12 of whichwere uninterrupted and had sufficient flanking regions forprimer design. Primer pairs were designed using primer 0.5(Whitehead Institute, Cambridge, USA).
We tested our primers on 10 African savannah elephantsfrom the Frozen Zoo® of the Zoological Society of San Diego.Three primer sets revealed monomorphic loci and three were
MEC1053.fm Page 2223 Wednesday, November 15, 2000 8:58 AM
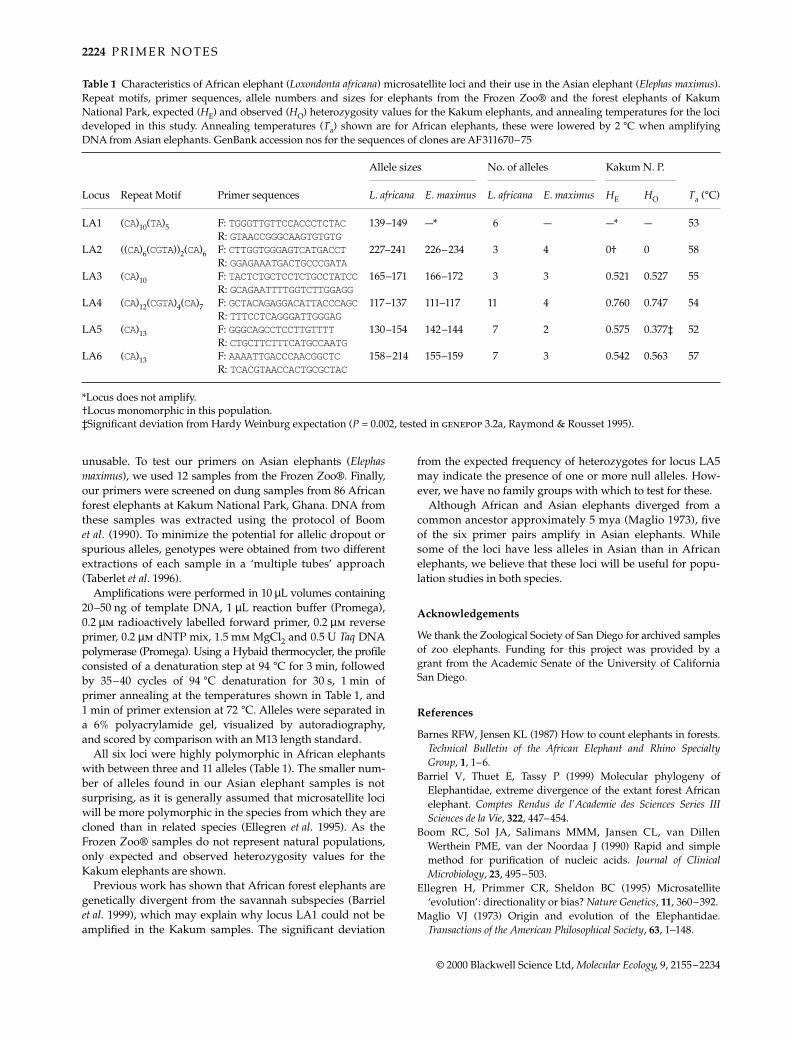
2224 P R I M E R N O T E S
© 2000 Blackwell Science Ltd, Molecular Ecology, 9, 2155–2234
unusable. To test our primers on Asian elephants (Elephasmaximus), we used 12 samples from the Frozen Zoo®. Finally,our primers were screened on dung samples from 86 Africanforest elephants at Kakum National Park, Ghana. DNA fromthese samples was extracted using the protocol of Boomet al. (1990). To minimize the potential for allelic dropout orspurious alleles, genotypes were obtained from two differentextractions of each sample in a ‘multiple tubes’ approach(Taberlet et al. 1996).
Amplifications were performed in 10 µL volumes containing20–50 ng of template DNA, 1 µL reaction buffer (Promega),0.2 µm radioactively labelled forward primer, 0.2 µm reverseprimer, 0.2 µm dNTP mix, 1.5 mm MgCl2 and 0.5 U Taq DNApolymerase (Promega). Using a Hybaid thermocycler, the profileconsisted of a denaturation step at 94 °C for 3 min, followedby 35–40 cycles of 94 °C denaturation for 30 s, 1 min ofprimer annealing at the temperatures shown in Table 1, and1 min of primer extension at 72 °C. Alleles were separated ina 6% polyacrylamide gel, visualized by autoradiography,and scored by comparison with an M13 length standard.
All six loci were highly polymorphic in African elephantswith between three and 11 alleles (Table 1). The smaller num-ber of alleles found in our Asian elephant samples is notsurprising, as it is generally assumed that microsatellite lociwill be more polymorphic in the species from which they arecloned than in related species (Ellegren et al. 1995). As theFrozen Zoo® samples do not represent natural populations,only expected and observed heterozygosity values for theKakum elephants are shown.
Previous work has shown that African forest elephants aregenetically divergent from the savannah subspecies (Barrielet al. 1999), which may explain why locus LA1 could not beamplified in the Kakum samples. The significant deviation
from the expected frequency of heterozygotes for locus LA5may indicate the presence of one or more null alleles. How-ever, we have no family groups with which to test for these.
Although African and Asian elephants diverged from acommon ancestor approximately 5 mya (Maglio 1973), fiveof the six primer pairs amplify in Asian elephants. Whilesome of the loci have less alleles in Asian than in Africanelephants, we believe that these loci will be useful for popu-lation studies in both species.
Acknowledgements
We thank the Zoological Society of San Diego for archived samplesof zoo elephants. Funding for this project was provided by agrant from the Academic Senate of the University of CaliforniaSan Diego.
References
Barnes RFW, Jensen KL (1987) How to count elephants in forests.Technical Bulletin of the African Elephant and Rhino SpecialtyGroup, 1, 1–6.
Barriel V, Thuet E, Tassy P (1999) Molecular phylogeny ofElephantidae, extreme divergence of the extant forest Africanelephant. Comptes Rendus de l’Academie des Sciences Series IIISciences de la Vie, 322, 447–454.
Boom RC, Sol JA, Salimans MMM, Jansen CL, van DillenWerthein PME, van der Noordaa J (1990) Rapid and simplemethod for purification of nucleic acids. Journal of ClinicalMicrobiology, 23, 495–503.
Ellegren H, Primmer CR, Sheldon BC (1995) Microsatellite‘evolution’: directionality or bias? Nature Genetics, 11, 360–392.
Maglio VJ (1973) Origin and evolution of the Elephantidae.Transactions of the American Philosophical Society, 63, 1–148.
Table 1 Characteristics of African elephant (Loxondonta africana) microsatellite loci and their use in the Asian elephant (Elephas maximus).Repeat motifs, primer sequences, allele numbers and sizes for elephants from the Frozen Zoo® and the forest elephants of KakumNational Park, expected (HE) and observed (HO) heterozygosity values for the Kakum elephants, and annealing temperatures for the locideveloped in this study. Annealing temperatures (Ta) shown are for African elephants, these were lowered by 2 °C when amplifyingDNA from Asian elephants. GenBank accession nos for the sequences of clones are AF311670–75
Allele sizes No. of alleles Kakum N. P.
Ta (°C)Locus Repeat Motif Primer sequences L. africana E. maximus L. africana E. maximus HE HO
LA1 (CA)10(TA)5 F: TGGGTTGTTCCACCCTCTAC 139–149 —* 6 — —* — 53R: GTAACCGGGCAAGTGTGTG
LA2 ((CA)6(CGTA))2(CA)6 F: CTTGGTGGGAGTCATGACCT 227–241 226–234 3 4 0† 0 58R: GGAGAAATGACTGCCCGATA
LA3 (CA)10 F: TACTCTGCTCCTCTGCCTATCC165–171 166–172 3 3 0.521 0.527 55R: GCAGAATTTTGGTCTTGGAGG
LA4 (CA)12(CGTA)4(CA)7 F: GCTACAGAGGACATTACCCAGC117–137 111–117 11 4 0.760 0.747 54R: TTTCCTCAGGGATTGGGAG
LA5 (CA)13 F: GGGCAGCCTCCTTGTTTT 130–154 142–144 7 2 0.575 0.377‡ 52R: CTGCTTCTTTCATGCCAATG
LA6 (CA)13 F: AAAATTGACCCAACGGCTC 158–214 155–159 7 3 0.542 0.563 57R: TCACGTAACCACTGCGCTAC
*Locus does not amplify.†Locus monomorphic in this population.‡Significant deviation from Hardy Weinburg expectation (P = 0.002, tested in genepop 3.2a, Raymond & Rousset 1995).
MEC1053.fm Page 2224 Wednesday, November 15, 2000 8:58 AM

P R I M E R N O T E S 2225
© 2000 Blackwell Science Ltd, Molecular Ecology, 9, 2155–2234
Rassmann K, Schlötterer C, Tautz D (1991) Isolation of simple-sequence loci for use in polymerase chain reaction-based DNAfingerprinting. Electrophoresis, 12, 113–118.
Raymond M, Rousset F (1995) genepop (Version 3.2a): a populationgenetics software for exact tests and ecumenicism. Journal ofHeredity, 86, 248–249.
Taberlet P, Griffin S, Goossens B et al. (1996) Reliable genotypingof samples with very low DNA quantities using PCR. NucleicAcids Research, 24, 3189–3194.
91220001157PRIMER NOTEsPRIMER NOTEsPRIMER NOTEs113Graphicraft Limited, Hong Kong
The estuarine teleost, Acanthopagrus butcheri (Sparidae), shows low levels of polymorphism at five microsatellite loci
E. S . YAP,* P. B . S . SPENCER,† J . A . CHAPLIN* and I . C . POTTER*
*School of Biological Sciences and Biotechnology, Murdoch University, Perth, 6150, Western Australia †Perth Zoo, South Perth, 6951, Western Australia
Keywords: Acanthopagrus butcheri, estuaries, microsatellite polymorphism, Sparidae
Received 6 July 2000; revision received 2 September 2000; accepted 4 September 2000
Correspondence: E. S. Yap. Fax: + 61–8-9360–6303; E-mail: [email protected]
The black bream, Acanthopagrus butcheri, is a member of thefamily Sparidae that is found throughout southern Australia(Kailola et al. 1993). Information on the population geneticstructure of this species is of value for two reasons. First,black bream is one of a relatively small number of teleoststhat typically spends its entire life-cycle within estuaries.Thus, studies of this species can be used to test hypothesesabout the role that estuaries play in promoting geneticdifferentiation in those teleosts that breed within thesesystems (e.g. Chaplin et al. 1998). Second, such informationhas important implications for the management of this spe-cies, which supports significant commercial and recreationalfisheries in three Australian states (Kailola et al. 1993) andis a target of a developing inland aquaculture industry insouth-western Australia.
Microsatellite markers are particularly useful for elucidatingthe details of the population genetic structure of species thatshow low levels of polymorphism in other types of markers,such as allozymes and mitochondrial DNA (e.g. Shaw et al. 1999).The black bream is one such species (Chaplin et al. 1998;E. Yap et al. unpublished data). Here, we describe the isola-tion and characterization of microsatellite loci from blackbream and then assess the levels of polymorphism at five loci.
Genomic DNA was extracted from the muscle tissue ofblack bream using CTAB buffer and a phenol–chloroformextraction protocol. The DNA was digested to completion withSau3A and size fractionated in an agarose gel. Fragments of200–600 bp were excised from the gel, purified and ligatedinto the BamHI site of the vector pGEM 3Zf(+) (Promega). Theligation products were transformed into ElectroMAX-DH10Bcells (Life Technologies), which were then plated onto agar
containing ampicillin (100 mg/mL), IPTG and x-gal. Therecombinant colonies (n = 446) were picked into 96-wellmicrotitre plates, grown at 37 °C, vacuum blotted ontoHybond-N nylon membranes (Amersham), and screenedwith (CA)12, (AG)12, (TCC)5, (GACA)4, (GATA)4 and (GAA)5oligo probes end-labelled with [α32P]-dATP. Plasmid DNAwas isolated from 12 positive clones and then subjected todye-terminator cycle sequencing. The sequencing productswere electrophoresed and the sequences of the plasmids andinserts were determined using an ABI 373 Sequencer (PerkinElmer). All inserts contained microsatellite loci. Primers, foruse in polymerase chain reaction (PCR), were designed forsix of these loci on the basis that they contained 15 or morerepeat units and that the sequencing of their flanking regionswas sufficient to permit primers to be generated.
Five of the primer pairs amplified scorable alleles at themicrosatellite loci (Table 1). The ‘optimised’ conditions forPCR amplification of these loci were: (i) 15 µL reactionmixture containing 50–100 ng DNA template, 1.5 mm MgCl2,0.20 mm of each dNTPs, 20–40 nm of each primer, with 25%of the forward primer end-labelled with [γ33P]-ATP, 0.05 UTaq DNA polymerase, and 10 mm Tris-HCl with 50 mm KCl;and (ii) PCR profiles with an initial 5 min denaturation at94 °C, followed by 26 cycles of 30 s denaturation at 94 °C,30 s at annealing temperature (Table 1) and 90 s extension at72 °C, and a final 7 min extension at 72 °C. Amplified alleleswere resolved on a 6% denaturing polyacrylamide gel andtheir sizes estimated using pUC18 DNA sequencing standards.
The levels of polymorphism at the five microsatelliteloci were assessed using at least 40 black bream fromnine water bodies in Western Australia and 10 individualsfrom Gippsland Lake in south-eastern Australia. One locus(pAb4D5) was monomorphic in all samples, while anotherlocus (pAb2D11) was polymorphic only within the samplesfrom south-eastern Australia (Table 1). Only one (pAb2B7) ofthe remaining three loci, which were polymorphic in all 10populations, was represented by a total of more than sevenalleles and had an expected heterozygosity of greater than 0.56(Table 1). Thus, the black bream appears to contain relativelylow amounts of microsatellite polymorphism, especially inWestern Australia, and particularly in comparison with, forexample, two species of marine sparid (see Takagi et al. 1997;Batargias et al. 1999). Nevertheless, the four polymorphic locihave revealed greater amounts of variation in black breamthan allozyme genes (see Chaplin et al. 1998). In addition, thegenotype frequencies at each of the pAb1H1, pAb2B7 andpAb2A5 loci, in each of samples of 38 or more black breamfrom nine water bodies in Western Australia, did not showany statistically significant departures from those expectedunder Hardy–Weinberg equilibrium conditions. The fourpolymorphic microsatellite loci should, therefore, be useful foraddressing population-level questions about the black bream.
Acknowledgements
This work was made possible by the provision of a postgraduatescholarship to ESY from the Australian Agency for InternationalDevelopment (AusAID), and a Special Research Grant to JACfrom Murdoch University.
MEC1053.fm Page 2225 Wednesday, November 15, 2000 8:58 AM

2226 P R I M E R N O T E S
© 2000 Blackwell Science Ltd, Molecular Ecology, 9, 2155–2234
References
Batargias C, Dermitzakis E, Magoulas A, Zouros E (1999) Char-acterization of six polymorphic microsatellite markers in thegilthead seabream, Sparus aurata (Linneaus 1758). MolecularEcology, 8, 897–898.
Chaplin JC, Baundais GA, Hill HS, McCulloch R, Potter IC (1998)Are assemblages of black bream (Acanthopagrus butcheri) indifferent estuaries distinct? International Journal of Salt LakeResearch, 6, 303–321.
Kailola PJ, Williams MJ, Steward PC et al. (1993) AustralianFisheries Resources. Bureau of Resource Sciences and FisheriesResearch and Development Corporation, Canberra.
Shaw PW, Pierce GJ, Boyle PR (1999) Subtle population structur-ing within a highly vagile marine invertebrate, the veinedsquid Loligo forbesi, demonstrated with microsatellite markers.Molecular Ecology, 8, 407–417.
Takagi M, Taniguchi N, Cook D, Doyle RW (1997) Isolation andcharacterisation of microsatellite loci from red sea breamPagrus major and detection in closely related species. FisheriesScience, 63, 199–204.
91220001160PRIMER NOTEsPRIMER NOTEsPRIMER NOTEs0000Graphicraft Limited, Hong Kong
Fifty Seychelles warbler (Acrocephalus sechellensis) microsatellite loci polymorphic in Sylviidae species and their cross-species amplification in other passerine birds
D. S . RICHARDSON, F. L . JURY, D. A. DAWSON, P. SALGUEIRO, J . KOMDEUR* and T. BURKE
Department of Animal and Plant Sciences, University of Sheffield, Sheffield, S10 2TN, UK, *Zoological Laboratory, University of Groningen, PO Box 14, 9750 AA Haren, The Netherlands
Keywords: Acrocephalus, microsatellite, PCR, Seychelles warbler, Sylviidae
Received 21 July 2000; revision received 2 September 2000; accepted 4 September 2000
Correspondence: T. Burke. Fax: + 44 (0) 114 222 0002; E-mail: [email protected]
The cooperatively breeding Seychelles warbler, Acrocephalussechellensis, is a rare endemic of the Seychelles islands. By 1959,anthropogenic disturbance had pushed this species to the vergeof extinction and only 26 individuals remained, confined tothe island of Cousin. The population has since recovered andhas been the focus of intense study since 1985 (e.g. Komdeur1992; Komdeur et al. 1997).
We required a set of microsatellite markers to enable studiesof mate choice, reproductive success and fitness. Geneticvariability is relatively low within this species, possibly dueto the recent population bottleneck. Consequently, manymicrosatellites had to be isolated and screened to providesufficient polymorphic loci to enable parentage assignmentand pedigree construction. We isolated 63 microsatelliteloci from the Seychelles warbler and tested for their poly-morphism in this and five other species of Sylviidae. We alsoexamined the utility of a subset of these loci in 16 otherpasserine birds.
DNA was extracted following Bruford et al. (1998). A genomiclibrary enriched for (CA)n, (GA)n and (TTTC)n was prepared asdescribed by Armour et al. (1994) using modifications sug-gested by Gibbs et al. (1997). DNA reactions were performedin a 10-µL volume containing 10–50 ng DNA, 1.0 µm of eachprimer, 0.2 mm of each dNTP, 0.05 units Taq DNA polymerase(Thermoprime Plus, Advanced Biotechnologies) and 1.0–2.0 mm MgCl2 (Table 1) in 20 mm (NH4)2SO4, 75 mm Tris-HClpH 9.0, 0.01% (w/v) Tween. Polymerase chain reaction(PCR) amplification was performed in a Hybaid Touchdownthermal cycler. Initially, a touchdown cycle was performedwith a reaction profile of 95 °C for 3 min, then 94 °C for 30 s,
Table 1 Characteristics of five microsatellite loci in samples of black bream (Acanthopagrus butcheri) from nine water bodies in WesternAustralia and from the Gippsland Lakes in Victoria, south-eastern Australia. The Western Australian samples are the same as those usedby Chaplin et al. (1998)
LocusGenBankaccession no. Primer sequence (5′−3′)
Repeatunit*
Ta(°C)
Size range(bp)
No. ofalleles n HE HO
pAb1H1 AF284351 F: GGCTTTCATTTCCCCATTTGTG (TG)15 63 132–148 5 268 0.37 0.44R: CACCTTTCTCCACGCCATAAA
pAb2B7 AF284352 F: GGTGCGTGCATTGTTAATGTGT (TG)24 65 98–128 14 274 0.70 0.72R: GATCTGCTTTCCTTTGACTCAGC
pAb4D5 AF284353 F: ACCTCTTCATCTGCGTGACATCT (TG)60 54 199 1 50 0 0R: GACAACACCCTCACTCAGCTGA
pAb2A5 AF284354 F: AGTTACTTTCTCCAGAGTGGCGC (TG)19 63 105–119 7 273 0.56 0.62R: GGCAACAGATAAGCACTGAGCATA
pAb2D11 AF284355 F: CGGTCCAGTTTCACTCTGATGTT (TG)15 65 106–110 4† 50 0.11 0.08R: AACTGCTGTCATCGCCCTGTT
*determined from the sequenced insert; †polymorphic only within samples from the Gippsland Lakes. n, is the total number of individuals assayed per locus; Ta, is the optimal annealing temperature of each primer pair; HE, is the expected heterozygosity, calculated as 1 − Σ(fi
2), where fi is the frequency of the ith allele; and HO, is the observed heterozygosity.
MEC1053.fm Page 2226 Wednesday, November 15, 2000 8:58 AM

PR
IME
R N
OT
ES
2227
© 2000 B
lackwell Science L
td, M
olecular Ecology, 9, 2155–2234
Table 1 Characterization of 50* polymorphic microsatellite loci from the Seychelles warbler (Acrocephalus sechellensis), and their polymorphism in five other members of the Sylviidaefamily
Locus
EMBLaccession number Repeat motif Primer sequence (5′−3′)
Ta (°C)
MgCl2 conc. (mm)
Productsize† (bp)
Number of alleles/number of individuals
Number of alleles/number of individuals tested in
SW HO HE CRW AW GRW EMW WW
Ase2 AJ287385 [(GAAA)2GCAA]3 F: TTGACAGAGTGTTATTCAATGTG 60 1.5 97 2/7 0.71 0.50 1/6 0 1/3 3/2 1/2R: GAGCAGATAATAGACCTTGCT
Ase3 AJ287386 (CA)14CCA F: ACAGGTATGGCGCTCAAGTC 60 1.5 101 3/7 0.86 0.60 1/6 4/4 1/3 1/2 1/2R: CTGAATCTTACACAGGAGACCGT
Ase4 AJ287387 (CA)11 F: TCTCCATCATCACCACAAAGC 60 1.0 103 2/25 0.40 0.37 0 3/4 1/3 0 0R: TTCCCATTGCCCTAGTTATTCCA
Ase5 AJ287388 AAA(CA)12AAA F: TGAAACAAAATGGGATGGTCC 61 1.0 110 1/7 0.00 0.00 1/6 1/4 1/3 1/2 2/2R: CCTTTCTCGGAACTGATTGCTT
Ase6 AJ287389 (CA)3G(CA)17 F: TAAAAGCCAGCAGTGGAGCC 60 1.5 119 4/25 0.76 0.70 1/6 2/4 1/3 0 0R: CGAGCTTGCAGGGTTTCCT
Ase7 AJ287390 (CT)13 F: AATCAACTTCAAATGCTCACAG 60 1.5 123 2/7 0.83 0.53 2/6 1/4 2/3 1/2 0R: ACTACATGACTCCAGGCTCAG
Ase8 AJ287391 (GT)4TTT(GT)7 F: TACCTCTCCTTGGCTGAGCA TD 1.5 125 1/7 0.00 0.00 3/6 2/4 1/3 2/2 1/2R: CCAGCCCTAGCTGTTTCACC
Ase9 AJ287392 (CA)15 F: GACTGAAGTCCTTTCTGGCTTC 60 1.5 125 3/25 0.40 0.44 3/6 5/4 5/3 2/2 1/2R: CACCAGGAATACAAGTCCATTG
Ase10 AJ287393 (CCTTCCCT)7 F: CATTGGGGTACTATGGAAAGACCTD 1.5 127 3/25 0.64 0.56 9/5 0 1/3 1/2 0R: TCCTGAGTGGAAGGAACATAGG
Ase11 AJ287394 (AC)14 F: TCCCCAAATCTCTCAATTCC 60 1.5 128 2/5 0.40 0.53 7/6 4/4 5/3 3/2 0R: AGTTCTAAGCCTGCCTGTGC
Ase12 AJ287395 (CA)11 F: TCAAGGAAACACAACTACAGCC 60 1.5 128 1/7 0.00 0.00 4/6 4/4 1/3 3/2 2/2R: TTTCCTCACAGCCTTGACTG
Ase13 AJ287396 (GT)11 F: TGTGCTCCTCTGCTTTCC 62 1.5 132 3/25 0.52 0.54 5/5 7/4 1/3 2/2 1/2R: CAGATGGCCAGTGTTAGTCC
Ase16 AJ276374 (TCTCC)13 F: TCAGTTCCTGAGTAAATGTCTC 58 1.5 155 4/7 100.0 0.70 5/6 0 6/3 1/2 0R: TGAATTACCCCTAAATACCTG
Ase18 AJ276375 (GT)12 F: ATCCAGTCTTCGCAAAAGCC 60 1.5 176 3/25 0.56 0.50 1/6 5/4 3/3 1/2 3/2R: TGCCCCAGAGGGAAGAAG
Ase19 AJ276376 (CA)4GA(CA)5 F: TAGGGTCCCAGGGAGGAAG 60 2.0 177 4/8 0.88 0.64 3/6 3/4 1/3 4/2 3/2R: TCTGCCCATTAGGGAAAAGTC
Ase20 AJ276377 (CTTC/CTTT)10 F: TCTAAAGCTGCCTGCCAGAA TD 1.5 178 1/7 0.00 0.00 1/6 7/4 1/3 1/2 0R: GCGGTTGCAGTGGACTTG
Ase21 AJ276378 (CTTTT)2CTC(TTTC)8 F: TTAGAACCATTTGATAGTTGCCAC58 2.0 180 1/7 0.00 0.00 9/6 5/4 1/3 1/2 2/2R: ATGGGTTTCTTGGGGAAGAG
Ase22 AJ276379 (GT)13 F: TGAACCATTGTCACCAACAC 58 1.5 181 2/6 0.50 0.53 1/6 0 0 1/2 0R: GCTTTAGTTCAGATGCCCAG
Ase25 AJ276382 (GAAA)31 F: GATGGCTATATGCTTCAAATGC 58 1.5 187 5/25 0.76 0.74 1/6 6/4 0 2/2 0R: TTGAAAGCCTTAAAGTGGGA
ME
C1053.fm
Page 2227 W
ednesday, Novem
ber 15, 2000 8:58 AM

2228P
RIM
ER
NO
TE
S
© 2000 B
lackwell Science L
td, M
olecular Ecology, 9, 2155–2234
Locus
EMBLaccession number Repeat motif Primer sequence (5′−3′)
Ta (°C)
MgCl2 conc. (mm)
Productsize† (bp)
Number of alleles/number of individuals
Number of alleles/number of individuals tested in
SW HO HE CRW AW GRW EMW WW
Ase26 AJ276383 (CTC)3(TC)12 F: GCTGGCCTTGCAAAAACTTC 60 1.5 203 1/7 0.00 0.00 1/6 5/4 1/3 2/2 2/2R: AACACCTCCCTGTCCCTGC
Ase27 AJ276384 (TTTC)16 F: TTAACATTGCATGCTCCTGC 60 1.0 204 4/25 0.64 0.60 1/6 1/4 3/3 2/2 1/2R: AGTCAAGGTACAGGCTAGATAGCC
Ase29 AJ276386 (AC)7TTTG(AC)6 F: GATCAGTTTGGAGACGTTTTCT 62 1.5 207 2/7 0.14 0.14 1/6 1/4 1/3 1/2 2/2R: ACAGAGCCATAAGGAATGTGC
Ase32 AJ276635 (GT)13(TCAC)2(GT)9 F: AATGAGCAATACCATGACAGC 58 1.5 218 1/7 0.00 0.00 1/6 5/4 0 0 0R: GATCTTTCAGTCAGGAACAAGC
Ase33 AJ289865 (AT)10 F: CTTTGGAATGCCAGGCTGCT TD 1.5 220 1/7 0.00 0.00 1/6 4/4 2/3 1/2 1/2R: TGCTGGAACCACAGGACTT
Ase34 AJ276636 (CT)11 F: GTTAATTCTTTTGGCCCTCAGC 60 1.5 220 1/7 0.00 0.00 3/5 1/4 3/3 4/2 3/2R: GGAGACACCACACCAATGC
Ase35 AJ276637 (GT)10 F: GTCCTTGGTCCTTAGCATCTGT 58 1.5 224 3/25 0.44 0.62 1/6 1/4 0 2/2 0R: GCTCCTGTTGTTCTGGGAATAG
Ase36 AJ276638 (TGTGG)7 F: AAGTTCCATGGGGTGAATGC 60 1.5 225 2/5 0.20 0.20 1/6 1/4 1/3 1/2 0R: GAGCGTGTTCCTCCAATTCC
Ase37 AJ276639 (AC)9 F: TAATTCATGGAGAAGCCCAG 58 1.5 226 3/25 0.32 0.37 2/6 1/4 0 4/2 0R: TCAAAACAACAGTTTTCACAGC
Ase38 AJ276640 (CA)15 F: ATCCGAGAACCCAATCACTT 58 2.0 226 2/4 0.50 0.43 0 3/4 1/3 3/2 1/2R: GCAGCATTACAGTCTCAAAGAAC
Ase40 AJ276642 (GT)10 F: CACTGCTCCAGGCACTCTG 58 1.5 230 1/7 0.00 0.00 3/6 3/4 1/3 1/2 1/2R: TCCAAGGCACACAAAGGTG
Ase42 AJ276644 (GT)4(AT)6(GT)8(AT)2 F: CATGGGTAGGTTGGGATGTC 62 1.5 243 2/25 0.32 0.27 1/6 1/4 4/3 1/2 2/2R: AGGTGAGGGTATGCAAACATG
Ase43 AJ276645 (TA)3(CA)8(TA)5 F: ATTGTGTGGGATTTGCAT TD 1.5 250 1/7 0.00 0.00 2/6 3/4 1/3 1/2 2/2R: TTGCTGTGCAGTTTGCTTTT
Ase44 AJ276646 (GT)18 F: TTCCCGTAATTATGACCTCTCTTGTD 1.5 250 1/7 0.00 0.00 1/6 4/4 3/3 1/2 2/2R: ACCAGAACTTGTTGTCTGGGAG
Ase46 AJ276775 (TG)13 F: CTGGCTGTATCTTGGTGTGC 62 1.5 265 3/25 0.24 0.48 1/6 2/4 1/3 1/2 1/2R: CAGTGTTTTAGGTCTCCTGCTG
Ase47 AJ276776 (CA)10 … (CA)4 F: GATCACATTTGGCATTTACTGAT TD 1.5 267 1/7 0.00 0.00 4/6 0 1/3 1/2 2/2R: ACTCTTTAGGGCAAGGCACT
Ase48 AJ276777 (CCTTCT)6 F: TTTATTTCCTGGACTGGAACAATC58 1.0 270 4/25 0.56 0.53 7/5 7/4 5/3 3/2 0R: GAACATTGGGCTACTGGGC
Ase49 AJ276778 (AC)10 F: CCCCTGAAGTGTCCAACG 58 1.5 272 2/7 0.00 0.26 1/6 2/4 1/3 1/2 2/2R: ACTTTCCCAGCACATCTTGC
Ase50 AJ276779 (CA)12 F: CTGTGGAATGCTGTCTGGC 60 1.5 272 1/7 0.00 0.00 1/6 6/3 2/3 2/2 2/2R: ATGGACTCCCGTCTAACTTGC
Table 1 Continued
ME
C1053.fm
Page 2228 W
ednesday, Novem
ber 15, 2000 8:58 AM

PR
IME
R N
OT
ES
2229
© 2000 B
lackwell Science L
td, M
olecular Ecology, 9, 2155–2234
Table 1 Continued
Locus
EMBLaccession number Repeat motif Primer sequence (5′−3′)
Ta (°C)
MgCl2 conc. (mm)
Product size† (bp)
Number of alleles/ number of individuals
Number of alleles/number of individuals tested in
SW HO HE CRW AW GRW EMW WW
Ase51 AJ276780 (CA)12 F: AATTCCCCTAGACAGGCAGC 60 1.5 277 1/7 0.00 0.00 1/6 7/4 2/3 2/2 1/2R: TCACTGGAGAGCCAAATTCC
Ase52 AJ276781 (CA)9(CA)5 F: TCTTAGCCTGCACTCATTTCA 60 1.5 278 1/7 0.00 0.00 1/6 2/4 1/3 1/2 1/2R: CAGTCACCGTAAGTTCATAGGC
Ase53 AJ276782 (CTT)22 (CTCCTT)10 F: ATGGAGAATTCTGGGTGCTG 60 1.5 285 2/7 0.43 0.54 1/6 8/4 0 0 0R: CCCAATAATGAGGTAACACCAA
Ase55 AJ276784 (GT)9 F: GTGTGGACTCTGGTGGCTC 62 1.5 292 1/7 0.00 0.00 1/6 6/4 2/3 2/2 2/2R: TCCCAAAGCACTCAAACTAGG
Ase56 AJ276785 (GT)18 F: TTCACTGAGAAGTGAGAATGTG 60 1.5 298 3/25 0.44 0.40 5/6 5/4 2/3 3/2 0R: GTCCTTGATTGATTACAGGCT
Ase57 AJ276786 (AC)14 F: GCAAGTGCAGATGTTTCCCT TD 1.5 299 1/7 0.00 0.00 6/6 3/4 4/3 1/2 0R: CCAAAGCAGGACAATGCTG
Ase58 AJ276787 (CTTTTT)27 F: ATTCCAGGGATTGGGCAG 60 1.0 311 5/25 0.76 0.76 1/6 7/4 5/3 4/2 1/2R: CTCAAAGCGAAATTGAGCAGT
Ase60 AJ276789 (GT)9GG(GT)8 F: CATGAAAAGGAACTCTCCAGC 62 1.5 353 1/7 0.00 0.00 0 5/4 4/3 1/2 3/2R: TTCCATCTCTGTTCTACTGCG
Ase61 AJ276790 (GAAAAA)13 F: AGGATTTTTAATGGGATATACACATCTG54 2.0 369 2/5 0.40 0.36 0 0 3/3 0 0R: AGCCACATTTTAGCCCACAG
Ase62 AJ276791 (CT)2(GT)8 F: TCGCCAGGTCGTGTGTAGTC 58 1.5 372 1/7 0.00 0.00 1/6 1/4 1/3 2/2 0R: CAAAACCGTGTCGGGGAG
Ase63 AJ276792 (GAGAAA)8(GA)7 F: TTTGGGGTTTAGGAATAGCAGA 60 1.0 400 2/7 0.29 0.26 2/6 8/4 2/3 4/2 1/2R: GGCTTCAGCCTGAGAAAGTC
Ase64 AJ276793 (AGGG)9 (ATGG)12 F: CCACCTTTCATACTGGGGAG TD 1.5 412 2/8 0.50 0.40 7/6 1/4 3/3 1/2 1/2R: TTCAGCCAGTCAGTGTAGCC
*An additional 13 loci were monomorphic in all species tested (EMBL accession numbers: AJ287384, AJ287397, AJ287398 AJ276380, AJ276381, AJ276385, AJ276387, AJ276634, AJ276641, AJ276643, AJ276647, AJ276783, AJ276788).†Size in cloned allele.SW, Seychelles warbler, Acrocephalus sechellensis; CRW, clamorous reed warbler, Acrocephalus stentoreus australis (M. Berg, personal communication); AW, aquatic warbler, Acrocephalus paludicola (P. Hedrich, personal communication); GRW, great reed warbler, Acrocephalus arundinaceus (B. Hansson, personal communication); EMW, European marsh warbler, Acrocephalus palustris (B. Hansson, personal communication); WW, willow warbler, Phylloscopus trochilus (B. Hansson, personal communication).Ta, annealing temperature; TD, Touchdown cycle; HO, observed heterozygosity; HE, expected heterozygosity; 0, no product detected.
ME
C1053.fm
Page 2229 W
ednesday, Novem
ber 15, 2000 8:58 AM

2230P
RIM
ER
NO
TE
S
© 2000 B
lackwell Science L
td, M
olecular Ecology, 9, 2155–2234
Table 2 Cross-species utility of 15 Seychelles warbler (Acrocephalus sechellensis) microsatellite loci in 21 other passerine birds
Number of alleles/Number of individuals tested (n = 4 unless stated)
Family* Species Ase8 Ase9 Ase13 Ase18 Ase19 Ase29 Ase34 Ase37 Ase40 Ase42 Ase43 Ase46 Ase48 Ase55 Ase56
Maluridae Superb fairy-wren, Malurus cyaneus 0 1 1 0 0 1 1 0 1 0 1 1 0 0 0Pomatostomidae White-browed babbler, Pomatostomus superciliosus 1 1 1 1 1 1 1 1 1 1 1 1 1 1 0Laniidae Loggerhead shrike, Lanius ludovicianus 0 0 1 1 0 0 1 0 0 1 1 0 0 0 0Corvidae Azure-winged magpie, Cyanopica cyana 0 1 1 1 0 0 1 0 0 1 1 1 0 1 1Cinclidae White-throated dipper, Cinclus cinclus 0 1 1 1 0 1 1 0 1 1 1 1 0 1 0Sturnidae European starling, Sturnus vulgaris 1 1 1 1 1 1 1 0 1 1 1 1 1 1 1Certhiidae Winter wren, Troglodytes troglodytes 7/6 2/6 2/6 5/6 3/6 5/6 2/6 3/6 2/5 — 3/6 3/6 — 5/6 6/6Paridae Blue tit, Parus caeruleus 0 1 1 1 0 1 1 0 0 1 1 0 0 1 0Paridae Long-tailed tit, Aegithalos caudatus — — — 1 — 1 1 16/680 1 1 0 1 0 — —Hirundinidae Sand martin, Riparia riparia 0 1 1 0 1 1 1 0 1 1 1 1 1 1 0Pycnonotidae White-spectacled bulbul, Pycnonotus xanthopygos 0 1 1 1 1 1 1 0 1 0 1 1 0 1 0Zosteropidae Seychelles grey white-eye, Zosterops modestus 1 1 1 1 0 1 1 1 1 1 1 1 1 1 0Sylviidae Aquatic warbler, Acrocephalus paludicola 2/4 5/4 7/4 5/4 3/4 1/4 1/4 1/4 3/4 1/4 3/4 2/4 7/4 6/4 5/4Sylviidae Sedge warbler, Acrocephalus schoenobaenus — 1/8 — 16/40 — — — — — 5/8 1/8 — — — —Sylviidae European marsh warbler, Acrocephalus palustris 2/2 2/2 2/2 1/2 4/2 1/2 4/2 4/2 1/2 1/2 1/2 1/2 3/2 2/2 3/2Sylviidae Great reed warbler, Acrocephalus arundinaceus 1/4 5/4 1/4 3/4 1/4 1/4 3/4 0 1/4 4/4 1/4 1/4 5/4 2/4 2/4Sylviidae Clamourous reed warbler, Acrocephalus stentoreus australis 3/6 3/6 5/5 1/6 3/6 1/6 3/5 2/6 3/6 1/6 2/6 1/6 7/5 1/6 5/6Sylviidae Seychelles warbler, Acrocephalus sechellensis 1/7 3/25 3/25 4/25 4/8 2/7 1/7 3/25 1/7 2/25 1/7 3/25 4/25 1/7 3/25Sylviidae Willow warbler, Phylloscopus trochilus 1/2 1/2 1/2 3/2 3/2 2/2 3/2 0 1/2 2/2 2/2 1/2 0 2/2 0Nectariniidae Seychelles sunbird, Nectarinia dussumieri 0 1 1 1 0 1 1 0 1 1 1 0 0 1 1Passeridae Seychelles fody, Fodia sechallarum 0 1 1 1 0 1 1 0 1 1 1 0 1 1 0Fringillidae European greenfinch, Carduelis chloris 0 1 1 1 1 1 1 0 1 1 1 1 1 1 1
Number of species tested for amplification 20 21 20 21 20 21 21 21 21 21 22 21 20 20 20% of species in which a product was amplified 50 95 100 90 55 86 100 38 86 90 95 80 52 90 50Number of species tested for variability 7 8 7 8 7 7 7 6 7 7 8 7 5 7 6% of species (tested for variability) with ≥3 alleles 29 50 43 75 86 14 57 67 29 29 25 14 100 29 83
*Following Sibley & Monroe (1990), except Seychelles warbler which follows Komdeur (1992).—, sample not tested; 0, no reliable product; 1, product visualized on agarose gel (not tested for variability).
ME
C1053.fm
Page 2230 W
ednesday, Novem
ber 15, 2000 8:58 AM

P R I M E R N O T E S 2231
© 2000 Blackwell Science Ltd, Molecular Ecology, 9, 2155–2234
annealing temperature X for 45 s, 72 °C for 45 s for twocycles each at X = 60 °C, 57 °C, 54 °C, 51 °C then 25 cycles atX = 48 °C, followed by 72 °C for 5 min. To optimize the PCRamplification of the loci found to be polymorphic, furtherPCRs consisted of one cycle at 95 °C for 3 min then 35 cyclesat 94 °C for 1 min, annealing temperature (Table 1) for 30 s, 72 °Cfor 45 s, followed by 72 °C for 5 min. For the cross-speciesamplifications, a touchdown cycle was performed as above.
PCR products were visualized on a 0.8% agarose gel stainedwith ethidium bromide. When testing for polymorphism, PCRproducts were run on 6% polyacrylamide gels and visual-ized by staining with silver (Promega) or by autoradiography(after PCR with one of the primers end-labelled with [γ33P]-dATP; Sambrook et al. 1989).
We developed primers for 63 microsatellites, of which50 were polymorphic in at least one of the tested species ofSylviidae (Table 1). Thirty loci were polymorphic, displayingup to five alleles, in a test panel of up to 25 unrelatedSeychelles warblers. There was no significant difference at anylocus between the observed and expected heterozygosity,though these comparisons were of limited power.
All 50 loci found to be polymorphic in the Sylviidae weretested for polymorphism in six unrelated individuals of thewinter wren, Troglodytes troglodytes (M. Berg, personal com-munication). Fifteen of the loci that were also found to bepolymorphic in the winter wren were selected and tested forutility in 16 other species, representing 15 passerine families(Table 2; following Sibley & Monroe 1990).
The high proportion of loci found to be polymorphic in theother Sylviidae will reduce or eliminate the need to developnew primers for future studies of these species. The cross-species amplification suggests that, after further testing, manyof the primers presented here may also be useful for detectingpolymorphic loci in other passerine families (Table 2).
Acknowledgements
We thank M. Berg, N. Chaline, B. Hansson, P. Heidrich,R.C. Marshall and D.J. Ross for contributing data on the cross-utility of primers. D. Bryant, M.C. Double, B.J. Hatchwell,J.G. Martinez, N. Mundy, J. Wetton, J. Wright, S. Yezerinac andR. Zilberman kindly supplied blood or DNA samples. This workwas supported by the Natural Environment Research Council.
References
Armour JAL, Neumann R, Gobert S, Jeffreys AJ (1994) Isolationof human simple repeat loci by hybridization selection. HumanMolecular Genetics, 3, 599–605.
Bruford MW, Hanotte O, Brookfield JFY, Burke T (1998) Multi-locus and single-locus DNA fingerprinting. In: MolecularGenetic Analysis of Populations: a Practical Approach, 2nd edn(ed. Hoelzel AR), pp. 287–336. IRL Press, Oxford.
Gibbs M, Dawson DA, McCamley C, Wardle AF, Armour JAL,Burke T (1997) Chicken microsatellite markers isolated fromlibraries enriched for simple tandem repeats. Animal Genetics,28, 401–417.
Komdeur J (1992) Importance of habitat saturation and territoryquality for evolution of cooperative breeding in the Seychelleswarbler. Nature, 358, 493–495.
Komdeur J, Daan S, Tinbergen J, Mateman C (1997) Extremeadaptive modification in the sex ratio of Seychelles warbler’seggs. Nature, 385, 522–525.
Sambrook J, Fritsch EF, Maniatis T (1989) Molecular Cloning: aLaboratory Manual. 2nd edn. Cold Spring Harbor LaboratoryPress, New York.
Sibley CG, Monroe BL (1990) Distribution and Taxonomy of Birds ofthe World. Yale University Press, New Haven.
91220001164PRIMER NOTEsPRIMER NOTEsprimer Notes0000Graphicraft Limited, Hong Kong
Variable microsatellite loci in red swamp crayfish, Procambarus clarkii, and their characterization in other crayfish taxa
NATALIA M. BELFIORE and BERNIE MAY
Department of Animal Science, University of California, Davis, 95616, USA
Keywords: crayfish, heterologous, microsatellites, primers, Procambarus clarkii
Received 10 August 2000; revision accepted 7 September 2000
Correspondence: Natalia M. Belfiore. Fax: + 530 752 0175; E-mail: [email protected]
The red swamp crayfish, Procambarus clarkii, is a temperatefreshwater crayfish native to the south-eastern United States.It is heavily exploited as a fishery product and is used widelyin aquaculture. Its economic importance led to widespreadintroductions on four continents. The species has been usedextensively in laboratory studies, but studies of its populationbiology in the wild have been rare (Huner 1988). Previouspopulation work using allozymes found low levels of geneticvariation in two Procambarus species, including P. clarkii(Busack 1988). We developed two microsatellite libraries forP. clarkii (f. Cambaridae) from which 23 variable microsatelliteloci were optimized. The 18 clearest markers were testedin representative taxa of the other two crayfish families(Parastacidae and Astacidae), as well as two cambarid speciesin Orconectes and one congeneric species; characterizationis reported here.
Genomic DNA was extracted from frozen (–80 °C) tail muscleof a red swamp crayfish (Putah Creek, Yolo County California)using the Tris sodium chloride EDTA sodium dodecyl sulphate(SDS) (TNES)-urea buffer extraction protocol (Asahida et al.1996) with the following modifications. Approximately 200 mgtissue were added to 700 µL extraction buffer, containing 4 murea and 0.5% SDS, and 0.035 mg Proteinase K. After over-night incubation (37 °C), samples were extracted twice withphenol:chloroform:isoamyl alcohol (25:24:1) and once withchloroform:isoamyl alcohol (24:1). DNA was precipitatedwith 0.3 m sodium acetate pH 5.3 in a final ethanol concen-tration of 67%. The pellet was washed in 70% ethanol, air orvacuum dried, and resuspended in Tris low EDTA (TLE)buffer (10 mm tris + 0.1 mm EDTA, pH 8.0). Two subgenomiclibraries were created by Genetic Identification Services(Chatsworth, CA) by partially digesting whole genomic DNAwith a mixture of the following restriction enzymes: BsrBR1,
MEC1053.fm Page 2231 Wednesday, November 15, 2000 8:58 AM

2232P
RIM
ER
NO
TE
S
© 2000 B
lackwell Science L
td, M
olecular Ecology, 9, 2155–2234
Table 1 Summary of locus data for 23 microsatellite loci developed for Procambarus clarkii. GenBank Accession nos are AF290219-AF290941. n is the number of individuals screened;individuals were drawn from two or three (where n ≤ 10) to four (where n > 10) populations. HO and HE are the observed and expected heterozygosities, respectively, calculated acrossall populations due to small sample sizes (Genes in Populations version 2, May et al. 1995); sample sizes precluded reasonable inference of the presence of null alleles
Locus ID Primer sequences (5′−3′) Repeat (cloned allele) Product size range (bp) n No. of alleles HO HE MgCl2 (mM) Primer (µM)
PclG-02 F: CTC CCC ATG CAC TCT GGC TCT GT (GATA)3GAGAA(GATA)5 216–224 25 3 0.56 0.61 1.5 0.5R: TGG CGA ATT TTG CCT GTT TCT GTC
PclG-03 F: CTC TCC ACC AGT CAT TTC TT (TCTA)20 216–420 26 12 0.73 0.89 2.0 0.5R: AAG CTT ACA ATA AAT ATA GAT AGA C
PclG-04 F: TAT ATC AGT CAA TCT GTC CAG (TCTA)3 … (TCTA)2 … (TCTA)29 … (TCTA)2 170–290 26 15 0.77 0.89 2.0 0.5R: TCA GTA AGT AGA TTG ATA GAA GG
PclG-07 F: CCT CCC ACC AGG GTT ATC TAT TCA (TCTA)8 100–160 19 11 0.84 0.85 1.5 0.5R: GTG GGT GTG GCG CTC TTG TT
PclG-08 F: ACG ATA AAT GGA TAG ATG GAT GAA (GATA)16 148–220 18 11 0.56 0.82 1.0 0.3R: CCG GGT CTG TCT GTC TGT CA
PclG-09 F: TAT GCA CCT TTA CCT GAA T (TCTA)14 80–160 20 8 0.35 0.85 1.5 0.5R: TGT TGG TGT GGT CAT CA
PclG-10 F: TGC TCA CGC AAA CTT GTA TTC AGT (TAGA)2TA(TAGA)16 90–176 10 6 0.40 0.65 1.5 0.5R: CAA TGG TCC TTG ATT TGG TGT TCT
PclG-13 F: CTC TCC TGG CGC TGT TAT TTA GC (TCTA)12 130–150 17 3 0.53 0.54 1.5 0.5R: TGA AGA GGC AGA GTG AGG ATT CTC
PclG-15 F: GGC GTG ACG CCA ACG TGT CTT (TATC)2TGTC(TATC)17TATT(TATC)3 150–185 18 12 0.78 0.85 1.5 0.5R: GGC TGG CCA CTT TGT TAG CCT GAG
PclG-16 F: CTC GGA ATG TCC ACC TGA GA (TCTA)18TCTC(TATC)3 80–160 19 11 0.95 0.86 1.5 0.5R: TCA TTA TGG ATT TTG TCA ATC TAT
PclG-17 F: GTC GGG AAC CTA TTT ACA GTG TAT (TCTA)14 156–190 19 8 0.84 0.78 1.5 0.5R: AAG AGC GAA GAA AGA GAT AAA GAT
PclG-24 F: CAA GGC ATT GAG GGG GTG AGA T (GATA)3AATA(GATA)24 … (AC)8T(CA)31 280–290 3 3 1.00 0.61 1.5 0.5R: CCG CGC CAC AGA ATT ACG AGT
PclG-26 F: ATA TAG CCT CGC CCT TTT ACC C (CT)5(CA)41 210–300 16 9 0.75 0.85 1.5 0.5R: TCG TGT TCA CAT CAG CAG GAG A
PclG-27 F: AAT CTT AAG ATC ATG AAA AAG GTA (TATC)4CATC(TATC)8 80–150 8 11 0.63 0.84 1.5 0.5R: TTT AAG GAA CGT ATA AGA AAA GAC
PclG-28 F: CTC GGC GAG TTT ACT GAA AT (GATA)22(GA)5 210–270 20 8 0.65 0.82 1.5 0.5R: AGA AGA AAG GGA TAT AAG GTA AAG
PclG-29 F: GAA AGT CAT GGG TGT AGG TGT AAC (TATC)9 95–165 19 7 0.58 0.82 1.5 0.5R: TTT TTG GGC TAT GTG ACG AG
PclG-32 F: CCC CCA CTC GTC TCT GTG TAT G (CT)7 … (TC)37 … (CA)15 … (CA)5 150–250 19 14 0.74 0.91 1.5 0.5R: TGT GCT TGC GGG AGT GAG C
PclG-33 F: TTC GAG GCG TTG CTG ATT GTA AGT (GT)21 120–180 19 11 0.63 0.85 1.5 0.5R: CAA GGA AGC GTA TAG CCG GAG TCT
PclG-34 F: CAG TCC ATG TGA TCA ATA CTG ACC (CA)4CG(CA)22TA(CA)15 80–160 4 6 0.75 0.75 1.5 0.5R: CTC AGG TGG AAC ACT CAT AAA CAA
PclG-35 F: TCC TCA CGT TTC TTT CCC ATC ATT (GT)6AA(GT)8AA(GT)11AA(GT)5 152–190 18 6 0.56 0.68 1.5 0.5R: TGC CTT TTC GAT CTC CAC CTT C
PclG-37 F: TAA ATA AGT GGC GTG TAA GAC GAG (CA)4CG(CA)15CG(CA)13 80–180 20 12 0.85 0.90 1.5 0.5R: TAA CTA AGC CAG GGT GGT CTC CAG
PclG-45 F: ATA TAA ACC GGT GTC GGT GTA G (CA)3 … (GA)6 96–98 16 2 0.25 0.43 1.5 0.5R: CTT TGA CTT CAC CTT TTC TCT TAT
PclG-48 F: CTG TTG GTG ATT TCC GTC AAT TTT (CA)12 146–190 17 8 0.59 0.84 1.5 0.5R: AGA TTC AAC GCT GTG TTC CTG ATC
ME
C1053.fm
Page 2232 W
ednesday, Novem
ber 15, 2000 8:58 AM

P R I M E R N O T E S 2233
© 2000 Blackwell Science Ltd, Molecular Ecology, 9, 2155–2234
EcoRV, HaeIII, PvuII, ScaI, and StuI. An oligonucleotide linkercontaining a HindIII site was ligated to fragments in therange of 300–700 bp. Magnetic beads were used to capturefragments containing (CA)n or (TAGA)n. These were ligatedinto the HindIII site of pUC19; the products were used totransform competent Escherichia coli DH5α. Of the positiveclones initially screened, 82% (n = 11) (CA)n, and 58% (n = 12)(TAGA)n contained microsatellites. We plated additionalclones and amplified approximately 300 recombinant clonesby colony polymerase chain reaction (PCR) using the follow-ing protocol. We added a toothpick stab of each colony to10 µL of 24 mm Tris-HCl (pH 8.4), 60 mm KCl, 0.075 mm eachdNTP, 7.5 mm MgCl2, and 0.6 mm pUC19 forward andreverse sequencing primers. We incubated the mixture at100 °C for 10 min then placed the tubes on ice. Five µL Taqsolution (12 mm Tris-HCl, pH 8.4, 30 mm KCl, 0.5 U Taq DNApolymerase, recombinant, GIBCO) were added to eachtube. Fifteen µL reactions (final conditions: 20 mm Tris-HCl,pH 8.4, 50 mm KCl, 0.05 mm each dNTP, 5 mm MgCl2,0.4 mm each primer, 0.5 U Taq DNA polymerase) were placedin a preheated thermal cycler (MJ Research PTC 100) set tocycle as follows: 94 °C for 4.5 min, 25 cycles of 94 °C for 30 s,57 °C for 30 s, 72 °C for 30 s, then 72 °C for 2 min. Approxi-mately 1 µL product was run on a 3% TAE agarose gel madewith 0.03× GelStar nucleic acid stain (BioWhittaker Molecu-lar Products) to identify inserts of 300–800 bp. Colonies con-taining these inserts were grown overnight in Luria broth fromwhich plasmids were purified using the QIAprep Spin Mini-prep Kit (Qiagen). More than 150 clones were sequenced usingthe Big DyeTM Terminator cycle sequencing protocol and visu-alized on an ABI 377 DNA sequencer (Applied Biosystems) byDavis Sequencing (Davis, CA). Fifty-four primer pairs weredesigned from approximately 100 unique sequences using‘PrimerSelect’ (DNAStar, Inc.). Ten to 20 ng DNA from up tofour crayfish populations sampled within the Sacramento Val-ley, California, were combined with 20 mm Tris-HCl (pH 8.4),50 mm KCl, 0.2 mm each dNTP and 0.5 U Taq DNA Polymer-ase in a 10 µL reaction volume; MgCl2 and primer concentra-tions are indicated in Table 1. Cycling conditions were 95 °Cfor 2 min, 30 cycles of 95 °C for 30 s, 56 °C for 30 s, 72 °C for1 min, then 72 °C for 5 min. Amplification products weremixed 1:1 with 98% formamide loading dye, denatured for3 min at 95 °C, placed on ice, then run on 5% denaturing acr-ylamide gels and stained by agarose overlay containing0.5 µL SYBR GreenI nucleic acid stain (BioWhittaker Molecu-lar Application). Staining otherwise followed Rodzen et al.(1998). Products were visualized on a Molecular DymamicsFluorImager 595. Locus details are reported in Table 1. Eight-een primer pairs were also tested on P. zonangulus, Orconectesvirilis, O. rusticus, Pacifasticus leniusculus, and Cherax quadricari-natus. Amplification success is reported in Table 2. Theseresults indicate the utility of these microsatellite loci forgenetic studies involving P. clarkii, and their potential utilityin related species.
Acknowledgements
This work was supported by a University of California ToxicSubstances Research and Teaching fellowship and an National Ta
ble
2C
ross
-spe
cies
am
plifi
cati
on w
ith
18 o
f the
pri
mer
s lis
ted
in T
able
1. n
ind
icat
es n
umbe
r of
ind
ivid
uals
test
ed u
nles
s ot
herw
ise
ind
icat
ed in
par
enth
eses
in e
ach
cell.
Num
bers
ince
lls in
dic
ate
the
num
ber
of o
bser
ved
(pre
sum
ed) a
llele
s; ‘–
’ ind
icat
es a
mpl
ifica
tion
but
unc
lear
; ‘0’
ind
icat
es n
o am
plifi
cati
on o
r sm
ear
only
Spec
ies
PclG
-02
PclG
-03
PclG
-04
PclG
-07
PclG
-08
PclG
-09
PclG
-13
PclG
-15
PclG
-16
PclG
-17
PclG
-27
PclG
-28
PclG
-29
PclG
-32
PclG
-37
PclG
-45
PclG
-47
PclG
-48
Proc
amba
rus
71
53
—1
01
00
2(2)
11
3—
2—
2(3)
zona
ngul
us (n
= 4
)O
rcon
ecte
s 3
01
12
10
10
00
00
11
10
—vi
rilis
(n =
2)
Orc
onec
tes
20
31
21
01
00
00
01
11
1—
rust
icus
(n =
2)
Pasi
fast
icus
1(
2)0
11(
3)1(
1)1(
3)1(
2)1
1(3)
00
00
11(
1)1
2(3)
1(3)
leni
uscu
lus
(n =
4)
Che
rax
—0
01
11
01
01(
2)0
00
1–(
2)0
01
quad
rica
rina
tus
(n =
4)
MEC1053.fm Page 2233 Wednesday, November 15, 2000 8:58 AM
2234 P R I M E R N O T E S
© 2000 Blackwell Science Ltd, Molecular Ecology, 9, 2155–2234
Institute of Environmental Health Sciences Superfund ResearchFellowship to NM Belfiore. Many thanks to Drs W Perry andJ Huner for samples.
References
Asahida T, Kobayashi T, Saitoh K, Nakayama I (1996) Tissuepreservation and total DNA extraction from fish stored atambient temperature using buffers containing high concentra-tion of urea. Fisheries Science, 62 (5), 727–730.
Busack CA (1988) Electrophoretic variation in the red swamp
(Procambarus clarkii) and the White River crayfish (P. acutus)(Decapoda: Cambaridae). Aquaculture, 69, 211–226.
Huner JV (1988) Procambarus in North America and elsewhere.In: Freshwater Crayfish: Biology, Management and Exploitation(eds Holdich DM, Lowery RS), pp. 239–261. Timber Press,Portland.
May B, Krueger CC, Eng W, Paul E (1995) Genes in Populations Ver-sion 2. http://animalscience.ucdavis.edu/extension/gene.htm.
Rodzen JA, Agresti JJ, Tranah G, May B (1998) Agarose overlaysallow simplified staining of polyacrylamide gels. BioTechniques,25 (4), 584.
MEC1053.fm Page 2234 Wednesday, November 15, 2000 8:58 AM
Copyright © 2022 FDOKUMEN