Johnson et al 2013 Curr Biol: Report Phylogenomics Resolves Evolutionary Relationships among Ants,...
14
Current Biology 23, 2058–2062, October 21, 2013 ª2013 Elsevier Ltd All rights reserved http://dx.doi.org/10.1016/j.cub.2013.08.050 Report Phylogenomics Resolves Evolutionary Relationships among Ants, Bees, and Wasps Brian R. Johnson, 1 Marek L. Borowiec, 1 Joanna C. Chiu, 1 Ernest K. Lee, 2 Joel Atallah, 1 and Philip S. Ward 1, * 1 Department of Entomology and Nematology, University of California, Davis, One Shields Avenue, Davis, CA 95616, USA 2 Sackler Institute for Comparative Genomics, American Museum of Natural History, Central Park West at 79 th Street, New York, NY 10024, USA Summary Eusocial behavior has arisen in few animal groups, most notably in the aculeate Hymenoptera, a clade comprising ants, bees, and stinging wasps [1–4]. Phylogeny is crucial to understanding the evolution of the salient features of these insects, including eusociality [5]. Yet the phylogenetic relationships among the major lineages of aculeate Hyme- noptera remain contentious [6–12]. We address this problem here by generating and analyzing genomic data for a repre- sentative series of taxa. We obtain a single well-resolved and strongly supported tree, robust to multiple methods of phylogenetic inference. Apoidea (spheciform wasps and bees) and ants are sister groups, a novel finding that contra- dicts earlier views that ants are closer to ectoparasitoid wasps. Vespid wasps (paper wasps, yellow jackets, and rel- atives) are sister to all other aculeates except chrysidoids. Thus, all eusocial species of Hymenoptera are contained within two major groups, characterized by transport of larval provisions and nest construction, likely prerequisites for the evolution of eusociality. These two lineages are interpolated among three other clades of wasps whose species are pre- dominantly ectoparasitoids on concealed hosts, the inferred ancestral condition for aculeates [2]. This phylogeny pro- vides a new framework for exploring the evolution of nest- ing, feeding, and social behavior within the stinging Hymenoptera. Results and Discussion Aculeate (stinging) Hymenoptera are behaviorally diverse, en- compassing both solitary and eusocial species and exhibiting a variety of life history strategies including parasitoidism, predation, omnivory, and pollenivory [2, 13]. Multiple lines of evidence provide strong support for the monophyly of the Aculeata [9, 10], but relationships among the major lineages within this group have been a matter of continued uncertainty [7–9, 11, 12]. The position of ants, the most species-rich and ecologically dominant of all eusocial insects, has been partic- ularly problematic [7–9, 11, 12](Figure 1). Advances in next-generation sequencing have unleashed the potential of genomic data to clarify many previously intrac- table parts of the Tree of Life [14–16]. Here we addressed the problem of aculeate Hymenoptera phylogeny by generating transcriptome data for ten representative species in nine fam- ilies and genomic data for one key taxon (Apterogyna) for which RNA was unavailable (Table 1; see also Table S1 available online). We then combined these data with the pub- lished genome sequences of three bee species and three ant species, a transcriptome from one additional bee species, and genomic data from Nasonia vitripennis, a nonaculeate hymenopteran used as an outgroup. Orthology identification and matrix assembly was accomplished with the OrthologID pipeline [17]. This yielded multiple partitioned amino acid matrices, with different levels of gene representation across the 18 ingroup taxa, ranging from a 5,214-gene matrix (3,001,657 amino acid sites) to a stringently filtered matrix of 308 genes (175,404 sites) and only 14.98% missing data (see Experimental Procedures and Supplemental Experimental Procedures). Table 1 shows the summary statistics for all the transcrip- tomes and for the genomic assembly. For the transcriptomes, we identified a range of protein sequence numbers, with the scoliid wasp Crioscolia alcione having the largest transcrip- tome size and the sweat bee Lasioglossum albipes the small- est. Whether variation in the transcriptome sizes represents actual variation in the number of genes present in these spe- cies or whether it represents variation in the quality of the assemblies is uncertain. The genomic library of Apterogyna AZ01 (family Bradynobaenidae) had only 1,717 genes, with a median amino acid length of 450. This reflects the relatively low coverage of sequencing (183) and the apparent degrada- tion of this older sample. Nevertheless, the Apterogyna sequence data were sufficient to reliably place this taxon within the hymenopteran tree. Phylogenetic analyses produced a fully resolved tree of the aculeate Hymenoptera with robust support at all nodes (Fig- ure 2). The same tree topology and relative branch lengths were obtained under a variety of analytical procedures, including partitioned maximum likelihood (ML) analyses and Bayesian analyses of concatenated data sets, as well as species tree estimates (Figures 2 and S1). All nodes in the topology have ML bootstrap support of 100% and Bayesian posterior probabilities of 1.0. Under species tree analyses, most nodes are also strongly supported, although support values drop for some of the deeper nodes in the tree (Figures 2 and S1). Most procedures employed the 308-gene matrix, but we also ran ML analyses of three other matrices of varying size and completeness (525, 3,018, and 5,214 genes, respec- tively), with the same results (Figures S1A–S1C). As expected [6] we found that the cuckoo wasp (Argochry- sis) is sister to all other aculeates, and that ants, bees, apoids, and vespid wasps are all monophyletic. We recovered the vespid wasps (represented by a nonsocial pollen wasp, Pseu- domasaris, and a eusocial paper wasp, Mischocyttarus) as sister to all aculeates except the cuckoo wasp, a result that is in agreement with some other recent molecular studies [8, 11] although in strong conflict with morphology-based trees [7] in which vespids are nested well within the aculeate phylog- eny, as sister to scoliid wasps (Figure 1A). Of particular interest is the finding that ants are sister to Apoidea, a novel result that emphasizes a greater affinity of ants to the predatory wasps that characterize the earliest branching lineages of Apoidea than to scoliids, bradynobae- nids, tiphiids, and other ectoparasitoid wasps with which they have been associated previously [1, 7, 9, 12]. This result *Correspondence: [email protected]
-
Upload
universityofcalifornia -
Category
Documents
-
view
0 -
download
0
Transcript of Johnson et al 2013 Curr Biol: Report Phylogenomics Resolves Evolutionary Relationships among Ants,...
Phylogenomics Resolves Ev
Current Biology 23, 2058–2062, October 21, 2013 ª2013 Elsevier Ltd All rights reserved http://dx.doi.org/10.1016/j.cub.2013.08.050
Reportolutionary
Relationships among Ants, Bees, and Wasps
Brian R. Johnson,1 Marek L. Borowiec,1 Joanna C. Chiu,1
Ernest K. Lee,2 Joel Atallah,1 and Philip S. Ward1,*1Department of Entomology and Nematology, University ofCalifornia, Davis, One Shields Avenue, Davis, CA 95616, USA2Sackler Institute for Comparative Genomics, AmericanMuseum of Natural History, Central Park West at 79th Street,New York, NY 10024, USA
Summary
Eusocial behavior has arisen in few animal groups, most
notably in the aculeate Hymenoptera, a clade comprisingants, bees, and stinging wasps [1–4]. Phylogeny is crucial
to understanding the evolution of the salient features ofthese insects, including eusociality [5]. Yet the phylogenetic
relationships among the major lineages of aculeate Hyme-noptera remain contentious [6–12].We address this problem
here by generating and analyzing genomic data for a repre-sentative series of taxa. We obtain a single well-resolved
and strongly supported tree, robust to multiple methods ofphylogenetic inference. Apoidea (spheciform wasps and
bees) and ants are sister groups, a novel finding that contra-dicts earlier views that ants are closer to ectoparasitoid
wasps. Vespid wasps (paper wasps, yellow jackets, and rel-atives) are sister to all other aculeates except chrysidoids.
Thus, all eusocial species of Hymenoptera are containedwithin twomajor groups, characterized by transport of larval
provisions and nest construction, likely prerequisites for the
evolution of eusociality. These two lineages are interpolatedamong three other clades of wasps whose species are pre-
dominantly ectoparasitoids on concealed hosts, the inferredancestral condition for aculeates [2]. This phylogeny pro-
vides a new framework for exploring the evolution of nest-ing, feeding, and social behavior within the stinging
Hymenoptera.
Results and Discussion
Aculeate (stinging) Hymenoptera are behaviorally diverse, en-compassing both solitary and eusocial species and exhibitinga variety of life history strategies including parasitoidism,predation, omnivory, and pollenivory [2, 13]. Multiple lines ofevidence provide strong support for the monophyly of theAculeata [9, 10], but relationships among the major lineageswithin this group have been a matter of continued uncertainty[7–9, 11, 12]. The position of ants, the most species-rich andecologically dominant of all eusocial insects, has been partic-ularly problematic [7–9, 11, 12] (Figure 1).
Advances in next-generation sequencing have unleashedthe potential of genomic data to clarify many previously intrac-table parts of the Tree of Life [14–16]. Here we addressed theproblem of aculeate Hymenoptera phylogeny by generatingtranscriptome data for ten representative species in nine fam-ilies and genomic data for one key taxon (Apterogyna) forwhich RNA was unavailable (Table 1; see also Table S1
*Correspondence: [email protected]
available online). We then combined these data with the pub-lished genome sequences of three bee species and three antspecies, a transcriptome from one additional bee species,and genomic data from Nasonia vitripennis, a nonaculeatehymenopteran used as an outgroup. Orthology identificationand matrix assembly was accomplished with the OrthologIDpipeline [17]. This yielded multiple partitioned amino acidmatrices, with different levels of gene representation acrossthe 18 ingroup taxa, ranging from a 5,214-gene matrix(3,001,657 amino acid sites) to a stringently filtered matrix of308 genes (175,404 sites) and only 14.98% missing data (seeExperimental Procedures and Supplemental ExperimentalProcedures).Table 1 shows the summary statistics for all the transcrip-
tomes and for the genomic assembly. For the transcriptomes,we identified a range of protein sequence numbers, with thescoliid wasp Crioscolia alcione having the largest transcrip-tome size and the sweat bee Lasioglossum albipes the small-est. Whether variation in the transcriptome sizes representsactual variation in the number of genes present in these spe-cies or whether it represents variation in the quality of theassemblies is uncertain. The genomic library of ApterogynaAZ01 (family Bradynobaenidae) had only 1,717 genes, with amedian amino acid length of 450. This reflects the relativelylow coverage of sequencing (183) and the apparent degrada-tion of this older sample. Nevertheless, the Apterogynasequence data were sufficient to reliably place this taxonwithin the hymenopteran tree.Phylogenetic analyses produced a fully resolved tree of the
aculeate Hymenoptera with robust support at all nodes (Fig-ure 2). The same tree topology and relative branch lengthswere obtained under a variety of analytical procedures,including partitioned maximum likelihood (ML) analyses andBayesian analyses of concatenated data sets, as well asspecies tree estimates (Figures 2 and S1). All nodes in thetopology have ML bootstrap support of 100% and Bayesianposterior probabilities of 1.0. Under species tree analyses,most nodes are also strongly supported, although supportvalues drop for some of the deeper nodes in the tree (Figures2 and S1). Most procedures employed the 308-gene matrix,but we also ran ML analyses of three other matrices of varyingsize and completeness (525, 3,018, and 5,214 genes, respec-tively), with the same results (Figures S1A–S1C).As expected [6] we found that the cuckoo wasp (Argochry-
sis) is sister to all other aculeates, and that ants, bees, apoids,and vespid wasps are all monophyletic. We recovered thevespid wasps (represented by a nonsocial pollen wasp, Pseu-domasaris, and a eusocial paper wasp, Mischocyttarus) assister to all aculeates except the cuckoo wasp, a result thatis in agreement with some other recent molecular studies[8, 11] although in strong conflict withmorphology-based trees[7] in which vespids are nestedwell within the aculeate phylog-eny, as sister to scoliid wasps (Figure 1A).Of particular interest is the finding that ants are sister to
Apoidea, a novel result that emphasizes a greater affinity ofants to the predatory wasps that characterize the earliestbranching lineages of Apoidea than to scoliids, bradynobae-nids, tiphiids, and other ectoparasitoid wasps with whichthey have been associated previously [1, 7, 9, 12]. This result

Figure 1. Previous Hypotheses of Phylogenetic Relationships among Ants,
Bees, and Stinging Wasps
Morphological analysis of Brothers [7] (A) and molecular phylogenetic
studies of Pilgrim et al. [8] (B) and Heraty et al. [9] (C). Major groups have
differently colored branches. Vespid wasps * = Vespidae + Rhopalosomati-
dae; scoliid wasps * = Scoliidae + Bradynobaenidae.
Genomic-Based Phylogeny of Ants, Bees, and Wasps2059
receives significant statistical support (p < 0.01) under the Shi-modaira-Hasegawa test [23] against five alternate phyloge-netic placements, including ants as sister to scolioid wasps,and ants as sister to scolioid wasps plus apoids (Table S3).Thus, morphologically generalized apoid wasps such as Am-pulicidae (cockroach wasps) and Sphecidae (digger wasps,mud dauber wasps, and relatives) may provide more insightinto the early evolution of stem-group ants than the ectopara-sitoid wasps that have previously served as models for theorigin of ants.
Our results also provide newperspective on the lower Creta-ceous fossil Cariridris bipetiolata, originally claimed to be theoldest fossil ant [24] but later reinterpreted to be a spheciformwasp, probably belonging to Ampulicidae [25]. Although thisappeared to represent a major reassignment of the fossil,our discovery that ants and apoids are sister taxa helps toexplain difficulty in the placement of Cariridris [26] and sug-gests that it is best treated as a lineage close to the root ofthe ant-apoid tree, perhaps not assignable with certainty toeither branch.
The sister group of [ants + Apoidea] is [Scoliidae + Bradyno-baenidae sensu stricto]. This more inclusive clade was alsorecovered in some other molecular studies [8, 11], but with a
different branching order, such that the scolioid lineage wasidentified as sister to Apoidea. Our new results motivate asearch for features in common between ants and apoids—not shared with scolioid wasps—that might predispose thisgroup toward the evolution of sociality. The most obviousbehavioral commonality is the collection and transport ofresources (arthropod prey or pollen) to a constructed nest, atrait also sharedwith vespidwasps, the other group containingeusocial species. Scoliid wasps, in contrast, are ectoparasi-toids on concealed hosts [2, 27]. (The life history of Bradyno-baenidae remains to be elucidated.) It has long been arguedthat nest construction and provisioning are key prerequisitesfor the evolution of eusociality [1, 2]. The finding that antsand apoids are sister taxa suggests that this favorable combi-nation of traits arose only once in their common ancestor,rather than separately from ectoparasitoid predecessors inthe ant and apoid lineages, emphasizing that the precondi-tions for eusociality are rare and contingent.Our phylogeny reveals a well-supported clade of tiphioid
and pompiloid wasps, to the exclusion of the scolioids. Thiscomports with an earlier molecular study [8], except that wefind that the tiphiid wasp (Brachycistis) and the chyphotinewasp (Chyphotes) are sister taxa, to the exclusion of pompi-loids (spider wasps and velvet ants), a result inconsistentwith previous findings. Further taxon sampling is neededwithin this clade to test the monophyly and placement oftiphiid wasps (Tiphiidae) and velvet ants (Mutillidae), but ourresults confirm an earlier inference [8, 11] that the family Bra-dynobaenidae is not monophyletic, with true bradynobaenids(represented in our data set by Apterogyna) being sister toScoliidae, whereas the subfamily Chyphotinae (representedhere by Chyphotes) is part of the tiphioid complex. Bradyno-baenid-like wasps share a number of morphological features[7], some unique, and these must be interpreted as examplesof convergence between two distantly related clades, perhapsgenerated in part by the independent loss of wings in femalesof both groups. It should be noted that scoliid females arewinged, as are some members of the tiphioid-pompiloidclade, so winged females are the ancestral condition for bothclades.The phylogenetic results presented here support the
following scenario of behavioral evolution in aculeateHymenoptera (Figure 3). The ancestral aculeate wasp wasan ectoparasitoid, attacking and paralyzing concealed hostsand leaving its offspring in or near the host cavity [2]. Intwo major lineages (ants + Apoidea, and Vespidae), thisbehavior became modified as wasps adopted a more activepredatory lifestyle, with increased importance of prey trans-port, nest construction, and parental care. More specializedfeeding habits (pollenivory) were acquired later. Eusocialbehavior evolved multiple times within both of these lineages[4, 28, 29]. The three remaining clades of aculeates (chrysi-doids, scolioids, and the tiphioid-pompiloid clade) havelargely retained ectoparasitoid habits, except for pompilids[30], and no examples of eusociality are known in thesegroups.This is the first comprehensive phylogenomic analysis of
aculeate Hymenoptera. It demonstrates the utility and feasi-bility of employing transcriptome data to resolve outstandingproblems in insect phylogeny. The new tree provides a robustframework for investigating the evolution of nesting, feeding,and social behavior within the stinging Hymenoptera, andfor exploring genomic signatures of changes in thesecharacteristics.
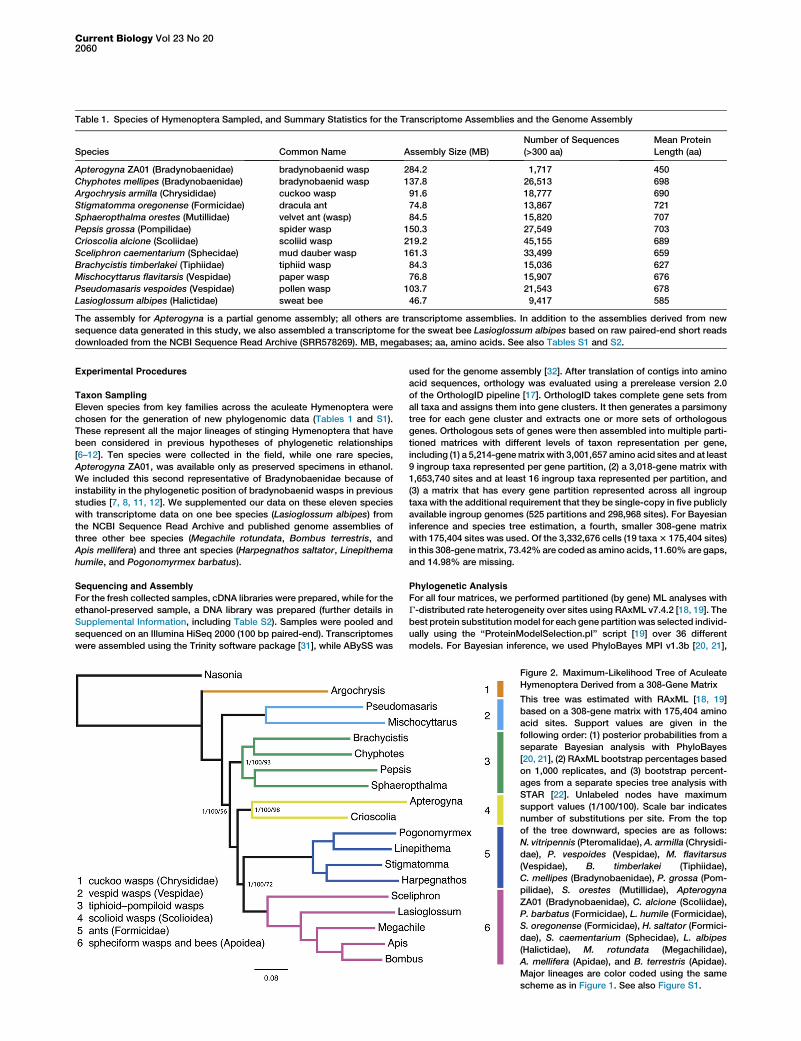
Table 1. Species of Hymenoptera Sampled, and Summary Statistics for the Transcriptome Assemblies and the Genome Assembly
Species Common Name Assembly Size (MB)
Number of Sequences
(>300 aa)
Mean Protein
Length (aa)
Apterogyna ZA01 (Bradynobaenidae) bradynobaenid wasp 284.2 1,717 450
Chyphotes mellipes (Bradynobaenidae) bradynobaenid wasp 137.8 26,513 698
Argochrysis armilla (Chrysididae) cuckoo wasp 91.6 18,777 690
Stigmatomma oregonense (Formicidae) dracula ant 74.8 13,867 721
Sphaeropthalma orestes (Mutillidae) velvet ant (wasp) 84.5 15,820 707
Pepsis grossa (Pompilidae) spider wasp 150.3 27,549 703
Crioscolia alcione (Scoliidae) scoliid wasp 219.2 45,155 689
Sceliphron caementarium (Sphecidae) mud dauber wasp 161.3 33,499 659
Brachycistis timberlakei (Tiphiidae) tiphiid wasp 84.3 15,036 627
Mischocyttarus flavitarsis (Vespidae) paper wasp 76.8 15,907 676
Pseudomasaris vespoides (Vespidae) pollen wasp 103.7 21,543 678
Lasioglossum albipes (Halictidae) sweat bee 46.7 9,417 585
The assembly for Apterogyna is a partial genome assembly; all others are transcriptome assemblies. In addition to the assemblies derived from new
sequence data generated in this study, we also assembled a transcriptome for the sweat bee Lasioglossum albipes based on raw paired-end short reads
downloaded from the NCBI Sequence Read Archive (SRR578269). MB, megabases; aa, amino acids. See also Tables S1 and S2.
Current Biology Vol 23 No 202060
Experimental Procedures
Taxon Sampling
Eleven species from key families across the aculeate Hymenoptera were
chosen for the generation of new phylogenomic data (Tables 1 and S1).
These represent all the major lineages of stinging Hymenoptera that have
been considered in previous hypotheses of phylogenetic relationships
[6–12]. Ten species were collected in the field, while one rare species,
Apterogyna ZA01, was available only as preserved specimens in ethanol.
We included this second representative of Bradynobaenidae because of
instability in the phylogenetic position of bradynobaenid wasps in previous
studies [7, 8, 11, 12]. We supplemented our data on these eleven species
with transcriptome data on one bee species (Lasioglossum albipes) from
the NCBI Sequence Read Archive and published genome assemblies of
three other bee species (Megachile rotundata, Bombus terrestris, and
Apis mellifera) and three ant species (Harpegnathos saltator, Linepithema
humile, and Pogonomyrmex barbatus).
Sequencing and Assembly
For the fresh collected samples, cDNA libraries were prepared, while for the
ethanol-preserved sample, a DNA library was prepared (further details in
Supplemental Information, including Table S2). Samples were pooled and
sequenced on an Illumina HiSeq 2000 (100 bp paired-end). Transcriptomes
were assembled using the Trinity software package [31], while ABySS was
used for the genome assembly [32]. After translation of contigs into amino
acid sequences, orthology was evaluated using a prerelease version 2.0
of the OrthologID pipeline [17]. OrthologID takes complete gene sets from
all taxa and assigns them into gene clusters. It then generates a parsimony
tree for each gene cluster and extracts one or more sets of orthologous
genes. Orthologous sets of genes were then assembled into multiple parti-
tioned matrices with different levels of taxon representation per gene,
including (1) a 5,214-genematrix with 3,001,657 amino acid sites and at least
9 ingroup taxa represented per gene partition, (2) a 3,018-gene matrix with
1,653,740 sites and at least 16 ingroup taxa represented per partition, and
(3) a matrix that has every gene partition represented across all ingroup
taxa with the additional requirement that they be single-copy in five publicly
available ingroup genomes (525 partitions and 298,968 sites). For Bayesian
inference and species tree estimation, a fourth, smaller 308-gene matrix
with 175,404 sites was used. Of the 3,332,676 cells (19 taxa3 175,404 sites)
in this 308-genematrix, 73.42%are coded as amino acids, 11.60%are gaps,
and 14.98% are missing.
Phylogenetic Analysis
For all four matrices, we performed partitioned (by gene) ML analyses with
G-distributed rate heterogeneity over sites using RAxML v7.4.2 [18, 19]. The
best protein substitutionmodel for each gene partition was selected individ-
ually using the ‘‘ProteinModelSelection.pl’’ script [19] over 36 different
models. For Bayesian inference, we used PhyloBayes MPI v1.3b [20, 21],
Figure 2. Maximum-Likelihood Tree of Aculeate
Hymenoptera Derived from a 308-Gene Matrix
This tree was estimated with RAxML [18, 19]
based on a 308-gene matrix with 175,404 amino
acid sites. Support values are given in the
following order: (1) posterior probabilities from a
separate Bayesian analysis with PhyloBayes
[20, 21], (2) RAxML bootstrap percentages based
on 1,000 replicates, and (3) bootstrap percent-
ages from a separate species tree analysis with
STAR [22]. Unlabeled nodes have maximum
support values (1/100/100). Scale bar indicates
number of substitutions per site. From the top
of the tree downward, species are as follows:
N. vitripennis (Pteromalidae), A. armilla (Chrysidi-
dae), P. vespoides (Vespidae), M. flavitarsus
(Vespidae), B. timberlakei (Tiphiidae),
C. mellipes (Bradynobaenidae), P. grossa (Pom-
pilidae), S. orestes (Mutillidae), Apterogyna
ZA01 (Bradynobaenidae), C. alcione (Scoliidae),
P. barbatus (Formicidae), L. humile (Formicidae),
S. oregonense (Formicidae), H. saltator (Formici-
dae), S. caementarium (Sphecidae), L. albipes
(Halictidae), M. rotundata (Megachilidae),
A. mellifera (Apidae), and B. terrestris (Apidae).
Major lineages are color coded using the same
scheme as in Figure 1. See also Figure S1.
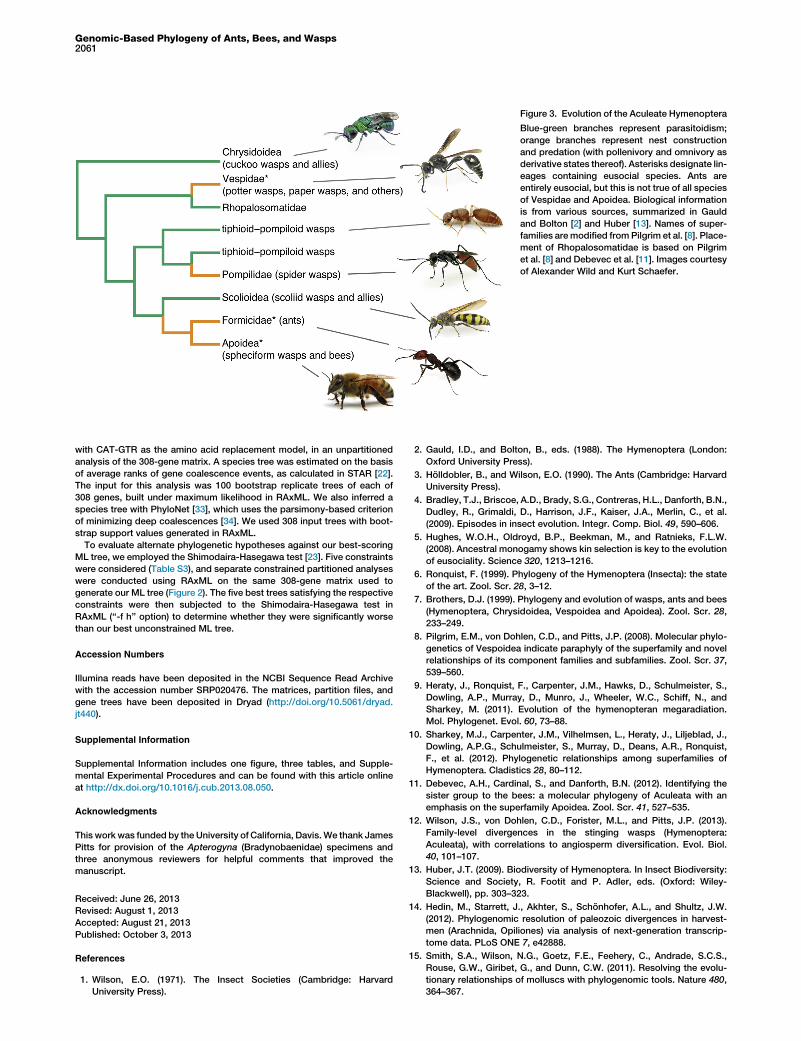
Figure 3. Evolution of the Aculeate Hymenoptera
Blue-green branches represent parasitoidism;
orange branches represent nest construction
and predation (with pollenivory and omnivory as
derivative states thereof). Asterisks designate lin-
eages containing eusocial species. Ants are
entirely eusocial, but this is not true of all species
of Vespidae and Apoidea. Biological information
is from various sources, summarized in Gauld
and Bolton [2] and Huber [13]. Names of super-
families aremodified fromPilgrim et al. [8]. Place-
ment of Rhopalosomatidae is based on Pilgrim
et al. [8] and Debevec et al. [11]. Images courtesy
of Alexander Wild and Kurt Schaefer.
Genomic-Based Phylogeny of Ants, Bees, and Wasps2061
with CAT-GTR as the amino acid replacement model, in an unpartitioned
analysis of the 308-gene matrix. A species tree was estimated on the basis
of average ranks of gene coalescence events, as calculated in STAR [22].
The input for this analysis was 100 bootstrap replicate trees of each of
308 genes, built under maximum likelihood in RAxML. We also inferred a
species tree with PhyloNet [33], which uses the parsimony-based criterion
of minimizing deep coalescences [34]. We used 308 input trees with boot-
strap support values generated in RAxML.
To evaluate alternate phylogenetic hypotheses against our best-scoring
ML tree, we employed the Shimodaira-Hasegawa test [23]. Five constraints
were considered (Table S3), and separate constrained partitioned analyses
were conducted using RAxML on the same 308-gene matrix used to
generate our ML tree (Figure 2). The five best trees satisfying the respective
constraints were then subjected to the Shimodaira-Hasegawa test in
RAxML (‘‘-f h’’ option) to determine whether they were significantly worse
than our best unconstrained ML tree.
Accession Numbers
Illumina reads have been deposited in the NCBI Sequence Read Archive
with the accession number SRP020476. The matrices, partition files, and
gene trees have been deposited in Dryad (http://doi.org/10.5061/dryad.
jt440).
Supplemental Information
Supplemental Information includes one figure, three tables, and Supple-
mental Experimental Procedures and can be found with this article online
at http://dx.doi.org/10.1016/j.cub.2013.08.050.
Acknowledgments
This work was funded by the University of California, Davis.We thank James
Pitts for provision of the Apterogyna (Bradynobaenidae) specimens and
three anonymous reviewers for helpful comments that improved the
manuscript.
Received: June 26, 2013
Revised: August 1, 2013
Accepted: August 21, 2013
Published: October 3, 2013
References
1. Wilson, E.O. (1971). The Insect Societies (Cambridge: Harvard
University Press).
2. Gauld, I.D., and Bolton, B., eds. (1988). The Hymenoptera (London:
Oxford University Press).
3. Holldobler, B., and Wilson, E.O. (1990). The Ants (Cambridge: Harvard
University Press).
4. Bradley, T.J., Briscoe, A.D., Brady, S.G., Contreras, H.L., Danforth, B.N.,
Dudley, R., Grimaldi, D., Harrison, J.F., Kaiser, J.A., Merlin, C., et al.
(2009). Episodes in insect evolution. Integr. Comp. Biol. 49, 590–606.
5. Hughes, W.O.H., Oldroyd, B.P., Beekman, M., and Ratnieks, F.L.W.
(2008). Ancestral monogamy shows kin selection is key to the evolution
of eusociality. Science 320, 1213–1216.
6. Ronquist, F. (1999). Phylogeny of the Hymenoptera (Insecta): the state
of the art. Zool. Scr. 28, 3–12.
7. Brothers, D.J. (1999). Phylogeny and evolution of wasps, ants and bees
(Hymenoptera, Chrysidoidea, Vespoidea and Apoidea). Zool. Scr. 28,
233–249.
8. Pilgrim, E.M., von Dohlen, C.D., and Pitts, J.P. (2008). Molecular phylo-
genetics of Vespoidea indicate paraphyly of the superfamily and novel
relationships of its component families and subfamilies. Zool. Scr. 37,
539–560.
9. Heraty, J., Ronquist, F., Carpenter, J.M., Hawks, D., Schulmeister, S.,
Dowling, A.P., Murray, D., Munro, J., Wheeler, W.C., Schiff, N., and
Sharkey, M. (2011). Evolution of the hymenopteran megaradiation.
Mol. Phylogenet. Evol. 60, 73–88.
10. Sharkey, M.J., Carpenter, J.M., Vilhelmsen, L., Heraty, J., Liljeblad, J.,
Dowling, A.P.G., Schulmeister, S., Murray, D., Deans, A.R., Ronquist,
F., et al. (2012). Phylogenetic relationships among superfamilies of
Hymenoptera. Cladistics 28, 80–112.
11. Debevec, A.H., Cardinal, S., and Danforth, B.N. (2012). Identifying the
sister group to the bees: a molecular phylogeny of Aculeata with an
emphasis on the superfamily Apoidea. Zool. Scr. 41, 527–535.
12. Wilson, J.S., von Dohlen, C.D., Forister, M.L., and Pitts, J.P. (2013).
Family-level divergences in the stinging wasps (Hymenoptera:
Aculeata), with correlations to angiosperm diversification. Evol. Biol.
40, 101–107.
13. Huber, J.T. (2009). Biodiversity of Hymenoptera. In Insect Biodiversity:
Science and Society, R. Footit and P. Adler, eds. (Oxford: Wiley-
Blackwell), pp. 303–323.
14. Hedin, M., Starrett, J., Akhter, S., Schonhofer, A.L., and Shultz, J.W.
(2012). Phylogenomic resolution of paleozoic divergences in harvest-
men (Arachnida, Opiliones) via analysis of next-generation transcrip-
tome data. PLoS ONE 7, e42888.
15. Smith, S.A., Wilson, N.G., Goetz, F.E., Feehery, C., Andrade, S.C.S.,
Rouse, G.W., Giribet, G., and Dunn, C.W. (2011). Resolving the evolu-
tionary relationships of molluscs with phylogenomic tools. Nature 480,
364–367.
Current Biology Vol 23 No 202062
16. Oakley, T.H., Wolfe, J.M., Lindgren, A.R., and Zaharoff, A.K. (2013).
Phylotranscriptomics to bring the understudied into the fold: monophy-
letic ostracoda, fossil placement, and pancrustacean phylogeny. Mol.
Biol. Evol. 30, 215–233.
17. Chiu, J.C., Lee, E.K., Egan, M.G., Sarkar, I.N., Coruzzi, G.M., and
DeSalle, R. (2006). OrthologID: automation of genome-scale
ortholog identification within a parsimony framework. Bioinformatics
22, 699–707.
18. Stamatakis, A. (2006). RAxML-VI-HPC: maximum likelihood-based
phylogenetic analyses with thousands of taxa and mixed models.
Bioinformatics 22, 2688–2690.
19. Stamatakis, A. (2012). RAxML GitHub repository. https://github.com/
stamatak/standard-RAxML/.
20. Lartillot, N., Lepage, T., and Blanquart, S. (2009). PhyloBayes 3: a
Bayesian software package for phylogenetic reconstruction andmolec-
ular dating. Bioinformatics 25, 2286–2288.
21. Lartillot, N., Rodrigue, N., Stubbs, D., and Richer, J. (2013). PhyloBayes
MPI: phylogenetic reconstruction with infinite mixtures of profiles in a
parallel environment. Syst. Biol. 62, 611–615.
22. Liu, L., Yu, L.L., Pearl, D.K., and Edwards, S.V. (2009). Estimating
species phylogenies using coalescence times among sequences.
Syst. Biol. 58, 468–477.
23. Shimodaira, H., and Hasegawa, M. (1999). Multiple comparisons of log-
likelihoods with applications to phylogenetic inference. Mol. Biol. Evol.
16, 1114–1116.
24. Brandao, C.R.F., Martins-Neto, R.G., and Vulcano, M.A. (1990). The
earliest known fossil ant (first southern hemisphere Mesozoic record)
(Hymenoptera: Formicidae: Myrmeciinae). Psyche (Camb. Mass.) 96,
195–208.
25. Dlussky, G.M., and Rasnitsyn, A.P. (2003). Ants (Hymenoptera:
Formicidae) of Formation Green River and some other Middle Eocene
deposits of North America. Russ. Entomol. J. 11, 411–436.
26. Ohl, M. (2004). The first fossil representative of the wasp genus
Dolichurus, with a review of fossil Ampulicidae (Hymenoptera:
Apoidea). J. Kans. Entomol. Soc. 77, 332–342.
27. Clausen, C.P. (1940). Entomophagous Insects (New York: McGraw-Hill).
28. Hines, H.M., Hunt, J.H., O’Connor, T.K., Gillespie, J.J., and Cameron,
S.A. (2007). Multigene phylogeny reveals eusociality evolved twice in
vespid wasps. Proc. Natl. Acad. Sci. USA 104, 3295–3299.
29. Cardinal, S., and Danforth, B.N. (2011). The antiquity and evolutionary
history of social behavior in bees. PLoS ONE 6, e21086.
30. Evans, H.E., and Shimizu, A. (1996). The evolution of nest building and
communal nesting in Ageniellini (Insecta: Hymenoptera: Pompilidae).
J. Nat. Hist. 30, 1633–1648.
31. Grabherr, M.G., Haas, B.J., Yassour, M., Levin, J.Z., Thompson, D.A.,
Amit, I., Adiconis, X., Fan, L., Raychowdhury, R., Zeng, Q., et al.
(2011). Full-length transcriptome assembly from RNA-Seq data without
a reference genome. Nat. Biotechnol. 29, 644–652.
32. Simpson, J.T., Wong, K., Jackman, S.D., Schein, J.E., Jones, S.J., and
Birol, I. (2009). ABySS: a parallel assembler for short read sequence
data. Genome Res. 19, 1117–1123.
33. Than, C., Ruths, D., and Nakhleh, L. (2008). PhyloNet: a software pack-
age for analyzing and reconstructing reticulate evolutionary relation-
ships. BMC Bioinformatics 9, 322.
34. Maddison, W.P. (1997). Gene trees in species trees. Syst. Biol. 46,
523–536.

Current Biology, Volume 23
Supplemental Information
Phylogenomics Resolves Evolutionary
Relationships among Ants, Bees, and Wasps
Brian R. Johnson, Marek L. Borowiec, Joanna C. Chiu, Ernest K. Lee, Joel Atallah,
and Philip S. Ward
Supplemental Inventory
Figure S1. Aculeate Hymenoptera phylogeny inferred under different phylogenetic methods,
related to Figure 2
Table S1. Species of aculeate Hymenoptera sampled: collection data and composition of pooled
material from which RNA or DNA was extracted
Table S2. Number of raw and quality-controlled reads for each library
Table S3. Evaluation of alternative tree topologies using the SH-test as implemented in RAxML
Supplemental Experimental Procedures
Supplemental References
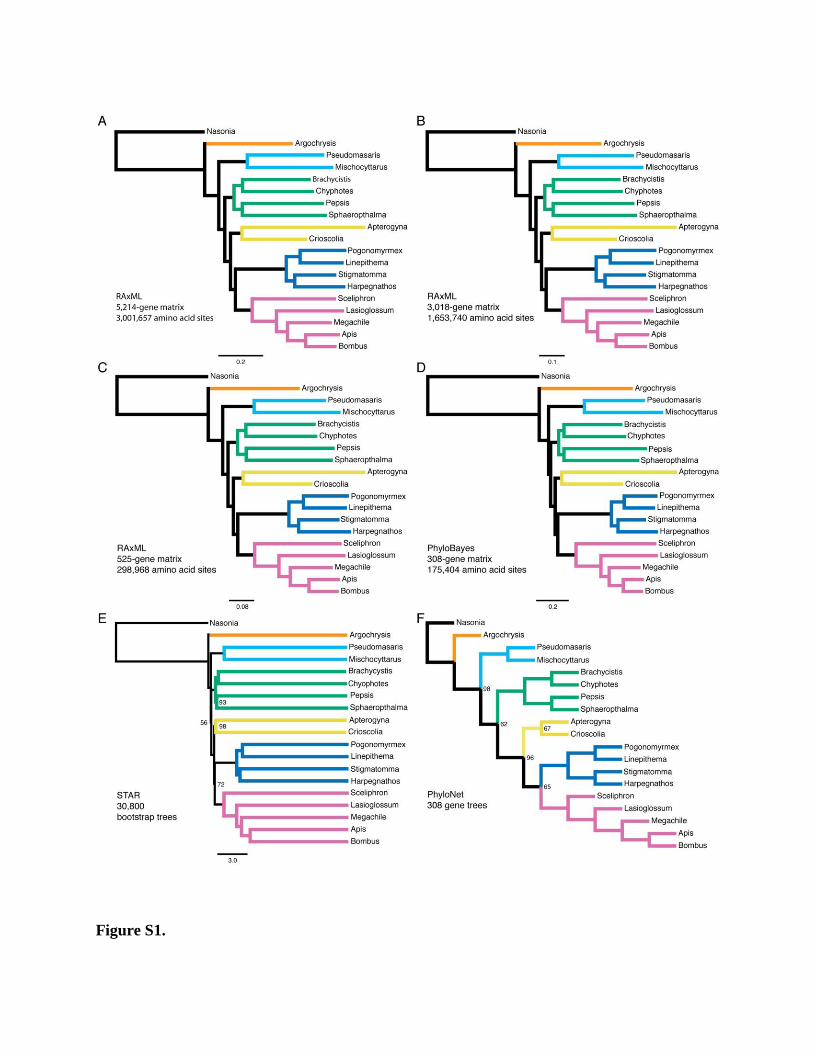
Figure S1.

Figure S1. Aculeate Hymenoptera Phylogeny Inferred under Different Phylogenetic
Methods, Related to Figure 2
(A-C) Maximum likelihood (ML) trees derived from 5,214-gene matrix, 3,018-gene matrix, and
525-gene matrix, respectively, estimated with RAxML. All nodes have maximum (100%)
bootstrap support. Scale bar indicates substitutions per site.
(D) Majority rule consensus tree from Bayesian analysis of 308-gene matrix, estimated with
PhyloBayes. All nodes have 1.00 posterior probability. Scale bar indicates substitutions per site.
(E) Species tree resulting from STAR analysis. Only bootstrap percentages less than 100% are
indicated. “Branch lengths” are average ranks of coalescences, not estimated substitutions per
site.
(F) Species tree (cladogram) resulting from PhyloNet analysis. Only bootstrap percentages less
than 100% are indicated.
Table S1. Species of Aculeate Hymenoptera Sampled: Collection Data and Composition of
Pooled Material from which RNA Was Extracted (DNA for Apterogyna)
Species
Voucher
Specimen Code
Date of
Collection GPS Coordinates Composition
Apterogyna ZA01 CASENT0106304 Oct 2004 -33.43 22.25 2 males
Chyphotes mellipes CASENT0106316 3-Jul-2012 39.29020 -118.41550 2 males
Argochrysis armilla CASENT0106319 14-Jul-2012 39.42435 -120.23679 3 females
Stigmatomma oregonense CASENT0106313 21-Jun-2012 39.99652 -120.99261 2 workers, 6 larvae
Sphaeropthalma orestes CASENT0106318 10-Jul-2012 39.77403 -120.07391 2 males
Pepsis grossa CASENT0106314 2-Jul-2012 39.28784 -119.27530 1 female, 1 male
Crioscolia alcione CASENT0106317 8-Jul-2012 39.84368 -119.43436 1 male
Sceliphron caementarium CASENT0106321 26-Jul-2012 38.54030 -121.75628 1 female, 1 male
Brachycistis timberlakei CASENT0106315 2-Jul-2012 39.28899 -119.27316 3 males
Mischocyttarus flavitarsis CASENT0106320 26-Jul-2012 38.54030 -121.75628 1 female, 1 male
Pseudomasaris vespoides CASENT0106312 19-Jun-2012 39.31914 -120.65916 1 female, 1 male
Each voucher specimen code is linked to more detailed collection data on AntWeb
(www.antweb.org). Voucher specimens have been deposited in the Bohart Museum of
Entomology (UCDC).

Table S2. Number of Raw and Quality-Controlled Reads for Each Library
Species Raw Reads Filtered Reads 1 Filtered Reads 2
Apterogyna ZA01 27,243,036 25,293,951 25,293,951
Chyphotes mellipes 14,529,464 14,362,151 13,744,283
Argochrysis armilla 17,264,088 17,074,979 16,346,892
Stigmatomma oregonense 13,648,445 13,457,982 12,773,283
Sphaeropthalma orestes 14,493,142 14,307,149 13,714,095
Pepsis grossa 18,098,742 17,860,027 17,023,108
Crioscolia alcione 14,585,832 14,388,055 13,707,012
Sceliphron caementarium 18,861,014 18,594,250 17,615,417
Brachycistis timberlakei 13,463,088 13,295,450 12,714,614
Mischocyttarus flavitarsis 16,910,898 16,742,131 16,148,909
Pseudomasaris vespoides 16,675,940 16,502,109 15,858,504
Lasioglossum albipes 19,412,393 19,388,645 19,388,645
“Filtered reads” refers to the number of reads remaining after quality control using fast-toolkit
and cutadapt. Reads 1 and 2 refer to forward and reverse reads, respectively.
Table S3. Evaluation of Alternative Tree Topologies Using the SH Test as Implemented
in RAxML
Constraint Tree Likelihood1 D(LH) Significantly Worse (p < 0.01)
(ants, all aculeates except Argochrysis) -2515334.7 -753.3 ± 97.1 Yes
(ants, scolioids + apoids) -2514722.3 -140.9 ± 47.3 Yes
(ants, scolioids) -2514758.4 -176.9 ± 46.9 Yes
(ants, tiphioid-pompiloid wasps) -2515486.6 -905.2 ± 83.1 Yes
(ants, vespids) -2515424.9 -843.4 ± 97.2 Yes
D(LH) is the difference in log likelihood units between the best constrained tree and the best
unconstrained tree. 1 Likelihood Score of best ML tree (Figure 2) = -2514581.4.
Supplemental Experimental Procedures
Sampling of Taxa
Samples of ten species of aculeate Hymenoptera were collected at field sites in California and
Nevada, United States, in June and July 2012 (Table S1). Taxa were targeted to cover all major
families of Aculeata. After collection, live insects were immobilized by freezing, cut into several
pieces, briefly dipped in 95% ethanol to reduce the hydrophobic quality of the cuticle, and then
immersed in RNAlater. Specimens were kept at 4°C for 24 hours to encourage perfusion of
RNAlater, and then stored at -20°C until extraction. The sample of Apterogyna ZA01
(Bradynobaenidae) represents a special case, since fresh collection of this rare African insect was
not possible. We therefore extracted DNA from two male specimens collected in 2004 and
preserved in 95% ethanol.
Library Construction, Sequencing, and Quality Control
For all samples, one to several pooled specimens were used for RNA or DNA extraction. Table
S1 shows the number and sex of each individual from each species used in the study. For
samples for which transcriptomes were to be generated, total RNA was extracted using Trizol
according to the manufacturer’s instructions. RNA quality and integrity were checked with the
Nanodrop 1000 and Bioanalyzer 2100. Total RNA was used for library prep using the Illumina
TruSeq v2 kit according to the manufacturer’s instructions. For the Apterogyna ZA01
(Bradynobaenidae) DNA library, DNA was extracted using the ChargeSwitch® gDNA Mini
Tissue Kit according to the manufacturer’s instructions. The additional RNAase step was
conducted to remove RNA. DNA concentration was determined using Qubit, and an Illumina
genomic library was then made using the Illumina TruSeq v2 kit according the manufacturer’s
instructions. Both cDNA and DNA libraries were checked for integrity with the Bioanalyzer
2100 before being pooled into one lane on the Illumina HiSeq 2000. Each library had a unique
Illumina barcode. Because genome assembly requires more reads than transcriptome assembly,
we biased the pooling such that we obtained more reads from the genomic library. 100 bp paired-
end sequencing was conducted. Low quality bases and adapter contamination were removed
from reads using the fastx toolkit and the cutadapt software package [S1].
Table S2 shows the number of raw and processed reads for each library. In addition to the
new genomic and transcriptomic data sets generated, raw Illumina paired-end short reads from
whole body extractions were downloaded from the NCBI SRA archive (SRR578269) for the
sweat bee, Lasioglossum albipes (family Halictidae). This raw data was quality controlled using
the same procedure as the newly generated short reads and was treated identically with respect to
transcriptome assembly. Protein sequences of the leafcutter bee Megachile rotundata (primarily
from the Megachile genome study) were downloaded from NCBI.
Transcriptome Assembly
De novo transcriptomes were generated with the Trinity short read assembler [S2]. For each
assembly, the “transcripts_to_best_scoring_ORFs.pl” script, included with the Trinity software,
was used to identify the longest open reading frame in each contig and translate it into a protein
sequence. Further identification of unigenes was not necessary as the OrthologID pipeline (see
below) automatically estimates the single best ortholog for each gene and discards other
sequences.

Genome Assembly: Apterogyna
The rationale for this portion of the study was that a complete genome of Apterogyna AZ01 was
unnecessary for the phylogenetic problem at hand. Rather we required a sufficiently
comprehensive and phylogenetically informative assembly of protein coding genes. Hence, while
short reads alone are typically insufficient for a complete genome assembly, we hypothesized
that they would be sufficient to assemble enough protein coding sequence to allow for a rigorous
phylogenomic placement of this key taxon.
The genome assembly was performed with the ABYSS software package v1.3.5 [S3].
The resulting assembly was 284.2 MB with an N50 of 1,065 bp and a maximum contig length of
9,143. The assembly is highly fragmented due to low coverage (for a short read dataset) and the
likely degradation of the sample, which was collected in ethyl alcohol eight years ago. The result
is essentially a “gene assembly” more than a complete genome. For this reason, we used the
“transcripts_to_best_scoring_ORFs.pl” script (from the Trinity assembly package) to identify the
longest ORF in each contig and translate it into a protein sequence. A more formal genome
bioinformatics process was not pursued, as our downstream bioinformatics analyses are designed
to identify orthologs from each species and discard chimeric genes.
Orthology Estimation and Data Matrix Assembly
Gene orthology was evaluated using a pre-release version 2.0 of the OrthologID pipeline. Similar
to the original version [S4], the latest version of OrthologID takes complete gene sets from all
ingroup and outgroup taxa as input and assigns them into gene clusters. OrthologID then
generates a parsimony tree for each gene cluster and extracts one or more sets of orthologous
genes according to the gene tree topology. In addition to improved execution pipeline on Sun
Grid Engine clusters, this version of OrthologID uses the MCL algorithm [S5, S6] for improved
clustering, and includes automated extraction of orthologs from gene trees into a partitioned
matrix in a single package. Using gene sets from our 19 species as input, OrthologID recovered
19,746 sets of orthologs from 11,119 gene clusters with at least one gene from 5 publicly
available genomes (Apis mellifera, Bombus terrestris, Harpegnathos saltator, Linepithema
humile, and Pogonomyrmex barbatus) in each cluster. For phylogenetic analysis, these
orthologous sets of genes or gene fragments were then assembled by OrthologID into multiple
partitioned matrices with different levels of taxon representation per gene, including (i) a 5,214-
gene matrix with 3,001,657 amino acid sites and at least 9 ingroup taxa represented per gene
partition, (ii) a 3,018-gene matrix with 1,653,740 sites and at least 16 ingroup taxa represented
per partition, and (iii) a matrix that has every gene partition represented across all ingroup taxa
with the additional requirement that they are single-copy in the 5 publicly available ingroup
genomes. This matrix has a total of 525 partitions and 298,968 sites. To further reduce this
matrix to allow for the most computationally intensive analysis, i.e. Bayesian inference, we
extracted a submatrix by examining the maximum likelihood tree estimate of each of the 525
partitions, calculating the total tree length and branch length variance for each partition and
choosing only the gene partitions that lay within the 68th percentile in both categories. We used
the 68th percentile because this reduced the matrix to a manageable size (~300 genes) for
Bayesian analysis. The resultant 308-gene matrix has 175,404 sites. Of the 3,332,676 cells (19
taxa × 175,404 sites) in this 308-gene matrix, 73.42% are coded as amino acids, 11.60% are
gaps, and 14.98% are missing. Equivalent percentages of missing data in the 5,214-gene, 3,018-
gene and 525-gene matrices are 36.77%, 21.53% and 15.16%, respectively.
Maximum Likelihood Analysis
We performed maximum likelihood (ML) analysis on the different matrices described above.
Partitioned analyses with -distributed rate heterogeneity over sites were performed using
RAxML v7.4.2 [S7, S8]. For each matrix, the best protein substitution model for each gene
partition was selected individually using the “ProteinModelSelection.pl” script [S8] over 36
different models. We used the MPI-AVX version of RAxML to perform rapid bootstrap on each
of the matrices, and the PTHREADS-AVX version to search for the best scoring trees. At least
250 bootstrap replicates were computed for each matrix. For the 308-gene matrix, 1,000
bootstrap replicates were performed. Identical topologies with bootstrap value of 100 at every
node were recovered for all 4 matrices with very small differences in relative branch lengths
(Figures 2, S1A-C), except for Apterogyna ZA01, which has a shorter relative branch length for
the smaller but more completely represented matrices.
Bayesian Inference
Bayesian inference was performed on the 308-gene matrix using PhyloBayes-MPI v1.3b [S9,
S10]. CAT-GTR is recommended in Lartillot et al. [S9] as the best overall model implemented
in PhyloBayes for large data sets and it was therefore chosen as the amino acid replacement
model for our analysis. We executed two independent chains of at least 7,000 cycles on 128 CPU
cores each. Convergence was determined by visually examining the trace plots of the
PhyloBayes summary statistics using the mcmcplots R library [S11]. Using the bpcomp program
of PhyloBayes on the two chains with a burn-in of 1,500 returned maxdiff and meandiff of 0,
indicating that no discrepancies were observed across all bipartitions after convergence. The
consensus of all trees pooled across both chains after burn-in was identical to the ML tree in
topology, with posterior probabilities of 1.0 across all nodes (Figure S1D).
Species Tree Inference
Although model-based methods of species tree estimation have been shown to outperform other
approaches, their computational costs are prohibitive for genomic-scale data sets [S12, S13]. For
that reason, we estimated the species tree with average ranks of gene coalescence events in
STAR [S14]. As input we used 100 bootstrap replicate trees of each of 308 genes from the small
matrix, built under maximum likelihood in RAxML. The analyses were carried out on the
STRAW web server [S15].
In addition we inferred a species tree in PhyloNet [S16], which uses the parsimony-based
criterion of minimizing deep coalescences [S17]. We used 308 input trees with bootstrap support
values generated in RAxML. PhyloNet allows for accounting of uncertainty in gene trees and
performs better when collapsing poorly supported splits [S16]. We thus set an arbitrary cutoff
value of 70, contracting all branches with lower bootstrap support and ran the analysis over
10,000 replicates. The resulting cladogram is presented in Figure S1F.
Supplemental References
S1. Martin, M. (2011) Cutadapt removes adapter sequences from high-throughput sequencing
reads. EMBnet journal 17, 10–12.
S2. Grabherr, M.G., Haas, B.J., Yassour, M., Levin, J.Z., Thompson, D.A., Amit, I.,
Adiconis, X., Fan, L., Raychowdhury, R., Zeng, Q., et al. (2011) Full-length
transcriptome assembly from RNA-Seq data without a reference genome. Nat. Biotech.
29, 644–652.
S3. Simpson, J.T., Wong, K., Jackman, S.D., Schein, J.E., Jones, S.J., and Birol, I. (2009)
ABySS: A parallel assembler for short read sequence data. Genome Res. 19, 1117–1123.
S4. Chiu, J.C., Lee, E.K., Egan, M.G., Sarkar, I.N., Coruzzi, G.M., and DeSalle, R. (2006)
OrthologID: automation of genome-scale ortholog identification within a parsimony
framework Bioinformatics 22, 699–707.
S5. Enright, A.J., Van Dongen, S., and Ouzounis, C.A. (2002) An efficient algorithm for
large-scale detection of protein families. Nucleic Acids Res. 30, 1575–1584.
S6. Van Dongen, S. (2008) Graph clustering via a discrete uncoupling process. SIAM J.
Matrix Anal. Appl. 30, 121–141.
S7. Stamatakis, A. (2006) RAxML-VI-HPC: Maximum likelihood-based phylogenetic
analyses with thousands of taxa and mixed models. Bioinformatics 22, 2688–2690.
S8. Stamatakis, A. (2012) RAxML GitHub repository, https://github.com/stamatak/standard-
RAxML/.
S9. Lartillot, N., Lepage, T., and Blanquart, S. (2009) PhyloBayes 3: a Bayesian software
package for phylogenetic reconstruction and molecular dating. Bioinformatics 25, 2286–
2288.
S10. Lartillot, N., Rodrigue, N., Stubbs, D., and Richer, J. (2013) PhyloBayes MPI:
Phylogenetic reconstruction with infinite mixtures of profiles in a parallel environment.
Syst. Biol. 62, 611-615.
S11. Curtis, S. M. (2012) R package - mcmcplots v0.4.1
S12. Yang, J., and Warnow, T. (2011) Fast and accurate methods for phylogenomic analyses.
BMC Bioinformatics 12, S4. doi:10.1186/1471-2105-12-S9-S4.
S13. Whelan, N.V. (2011) Species tree inference in the age of genomics. Trends Evol. Biol. 3,
e5. doi:10.4081/eb.2011.e5.
S14. Liu, L., Yu, L.L., Pearl, D.K., and Edwards, S.V. (2009) Estimating species phylogenies
using coalescence times among sequences. Syst. Biol. 58, 468–477.
S15. Shaw, T. I., Ruan, Z., Glenn, T. C., and Liu, L. (2013). STRAW: Species TRee Analysis
Web server. Nucleic Acids Res. Advance Access, doi:10.1093/nar/gkt377
S16. Than, C., Ruths, D., and Nakhleh, L. (2008) PhyloNet: a software package for analyzing
and reconstructing reticulate evolutionary relationships. BMC Bioinformatics 9, 322.
doi:10.1186/1471-2105-9-322.
S17. Maddison, W.P. (1997) Gene trees in species trees. Syst. Biol. 46, 523–536.

Current Biology 23, 2565, December 16, 2013 ª2013 Elsevier Ltd All rights reserved
Phylogenomics Resolves Evolutionary
Erratum
Relationships among Ants, Bees, and Wasps
Brian R. Johnson, Marek L. Borowiec, Joanna C. Chiu, Ernest K. Lee, Joel Atallah, and Philip S. Ward*
(Current Biology 23, 2058–2062; October 21, 2013)In our recent paper on the phylogeny of aculeate Hymenoptera, we supplemented our primary data set with publicly availablegenome sequence data from four bee species, three ant species, and one wasp species. However, we did not give detailedcitations for these data, nor did we make a clear distinction between those species whose genomes had been formally pub-lished and those for which data had been made publicly available prior to publication. The published genomes were those ofthe wasp Nasonia vitripennis [1], the honeybee Apis mellifera [2], and the ants Harpegnathos saltator [3], Pogonomyrmexbarbatus [4], and Linepithema humile [5]. The prepublication genome data came from the bees Lasioglossum albipes (NCBISequence Read Archive SRR578269, as part of the Lasioglossum albipes WGS project, http://www.ncbi.nlm.nih.gov/bioproject/174755),Megachile rotundata (NCBI Protein database search, with data coming mostly from theMegachile genomesequencing project, http://www.ncbi.nlm.nih.gov/bioproject/66515), and Bombus terrestris (protein set from NCBI RefSeq andGenome Annotation projects, derived from genomic sequence generated by the Bumble Bee Genome Project, https://www.hgsc.bcm.edu/arthropods/bumble-bee-genome-project).
We apologize for any confusion created by the lack of explicit citations of these data sources.
References
1. Werren, J.H., Richards, S., Desjardins, C.A., Niehuis, O., Gadau, J., Colbourne, J.K., Werren, J.H., Richards, S., Desjardins, C.A., Niehuis, O., et al.;
Nasonia Genome Working Group (2010). Functional and evolutionary insights from the genomes of three parasitoid Nasonia species. Science 327,
343–348.
2. Honeybee Genome Sequencing Consortium (2006). Insights into social insects from the genome of the honeybee Apis mellifera. Nature 443, 931–949.
3. Bonasio, R., Zhang, G., Ye, C., Mutti, N.S., Fang, X., Qin, N., Donahue, G., Yang, P., Li, Q., Li, C., et al. (2010). Genomic comparison of the ants
Camponotus floridanus and Harpegnathos saltator. Science 329, 1068–1071.
4. Smith, C.R., Smith, C.D., Robertson, H.M., Helmkampf, M., Zimin, A., Yandell, M., Holt, C., Hu, H., Abouheif, E., Benton, R., et al. (2011). Draft genome of
the red harvester ant Pogonomyrmex barbatus. Proc. Natl. Acad. Sci. USA 108, 5667–5672.
5. Smith, C.D., Zimin, A., Holt, C., Abouheif, E., Benton, R., Cash, E., Croset, V., Currie, C.R., Elhaik, E., Elsik, C.G., et al. (2011). Draft genome of the
globally widespread and invasive Argentine ant (Linepithema humile). Proc. Natl. Acad. Sci. USA 108, 5673–5678.
*Correspondence: [email protected]
http://dx.doi.org/10.1016/j.cub.2013.11.056


![Reprint of “Conservation biological control and enemy diversity on a landscape scale” [Biol. Control 43 (2007) 294–309]](https://static.fdokumen.com/doc/165x107/63244fb95f71497ea904bf23/reprint-of-conservation-biological-control-and-enemy-diversity-on-a-landscape.jpg)