Role of social wasps in Saccharomyces cerevisiae ecology and evolution
Upload
independentCategory
view
0download
0
Plant diversity in a nutshell: testing for small-scale effectson trap nesting wild bees and wasps
YVONNE FABIAN,1 NADINE SANDAU,1 ODILE T. BRUGGISSER,1 ALEXANDRE AEBI,1,2 PATRIK KEHRLI,1,3
RUDOLF P. ROHR,1,4 RUSSELL E. NAISBIT,1 AND LOUIS-FELIX BERSIER1,�
1University of Fribourg, Unit of Ecology & Evolution, Chemin du Musee 10, 1700 Fribourg, Switzerland2University of Neuchatel, Laboratory of Soil Biology, Emile-Argand 11, 2000 Neuchatel, Switzerland
3Station de recherche Agroscope Changins-Wadenswil ACW, 1260 Nyon, Switzerland4Integrative Ecology Group, Estacion Biologica de Donana, EBD-CSIC, 41092 Sevilla, Spain
Citation: Fabian, Y., N. Sandau, O. T. Bruggisser, A. Aebi, P. Kehrli, R. P. Rohr, R. E. Naisbit, and L.-F. Bersier. 2014. Plant
diversity in a nutshell: testing for small-scale effects on trap nesting wild bees and wasps. Ecosphere 5(2):18. http://dx.
doi.org/10.1890/ES13-00375.1
Abstract. Declining plant species richness in agro-ecosystems and thus reduced habitat quality can have
cascading effects on ecosystem functioning, leading to reduced pollination and biological control. Here we
test if plant diversity can affect arthropod diversity and abundance on a very small scale, manipulating
plant species richness (2, 6, 12 and 20 sown species) in small adjacent subplots (6 3 9 m) in 10 wildflower
strips in an agricultural landscape. We simultaneously analyzed the effect of plant species richness,
vegetation structure, and plant composition on the species richness and abundance of cavity-nesting wild
bees, wasps, their prey and natural enemies, and on the structure of their food webs. By separating the
trap-nesting species into functional groups according to their prey, we aimed to understand the underlying
patterns for the effects of plant diversity. Increasing plant species richness had a significant effect only on
spider-predating wasps, the group of wasps trophically most distant from plants. In contrast, bees and
food-web structure were unaffected by plant diversity. Spider-predating wasp abundance negatively
correlated with the abundance of spiders, suggesting top-down control. Interestingly, the abundance of
spiders was the only variable that was strongly affected by plant composition. The hypothesis that the
effect of plant diversity decreases with increasing trophic level is not supported by our study, and the
mobility of species appears to play a greater role at this small spatial scale.
Key words: biological control; parasitism; plant composition; pollinators; quantitative food webs; resource
heterogeneity hypothesis; Trypoxylon figulus.
Received 25 November 2013; accepted 26 November 2013; final version received 7 January 2014; published 13 February
2014. Corresponding Editor: D. P. C. Peters.
Copyright: � 2014 Fabian et al. This is an open-access article distributed under the terms of the Creative Commons
Attribution License, which permits unrestricted use, distribution, and reproduction in any medium, provided the
original author and source are credited. http://creativecommons.org/licenses/by/3.0/
� E-mail: [email protected]
INTRODUCTION
Biodiversity loss due to intensification in
agriculture is an important driver of reduced
ecosystem functioning (Cardinale et al. 2006).
Plant species richness has often been central to
this discussion (Hooper et al. 2005) and has been
identified as an important determinant of the
diversity and abundance of consumers (Haddad
et al. 2009, Scherber et al. 2010a). Two non-
exclusive hypotheses have been formulated to
explain the relationship between plant diversity
and herbivore abundance and diversity. First, the
resource heterogeneity hypothesis (Hutchinson
1959) argues that higher plant diversity offers
greater resource heterogeneity, resulting in a
v www.esajournals.org 1 February 2014 v Volume 5(2) v Article 18
higher diversity of consumers. Second the moreindividuals hypothesis (Srivastava and Lawton1998) suggests that diverse plant communitiesare often more productive than simple plantcommunities (Tilman et al. 2001), and thus thegreater quantity of resources available for con-sumers increases their abundance and diversity.Both hypotheses have found support in previousstudies (Knops et al. 1999, Haddad et al. 2009).
At higher trophic levels, predator species maysimply respond to increased diversity or produc-tivity of resources provided by their prey indiverse plant communities (resource heterogeneityand more individuals hypotheses acting at thepredator level), although this indirect responsewith plant diversity may dampen with increas-ing trophic level (Scherber et al. 2010a). However,predators may also respond directly to structuralhabitat diversity in diverse and productive plantcommunities. Consequently, plant diversitycould influence positively the structure of pred-ator communities, possibly resulting in top-downeffects limiting herbivore abundances morestrongly in more diverse plant communities, aspredicted by the enemy hypothesis (Root 1973).Thus declining plant species richness can havecascading effects, releasing herbivores from thiscontrol and leading to reduced ecosystem func-tioning (Knops et al. 1999, Balvanera et al. 2006).The relationships between abundance and diver-sity of different trophic levels is therefore difficultto predict, and it is not surprising that recentstudies showed varying effects of plant diversityon the abundance or diversity of higher trophiclevels, yielding positive (Albrecht et al. 2007,Dinnage 2013), neutral (Ebeling et al. 2012) ornegative (Schuldt et al. 2011) relationships.However, positive effects dominate, with areported decrease in the strength of the relation-ship for higher trophic levels (Scherber et al.2010a).
In addition to plant species richness, thecomposition of the plant community can affectthe species richness, abundance and food-webstructure of consumers and higher trophic levels(Hooper and Vitousek 1997, Haddad et al. 2001,Viketoft et al. 2009, Scherber et al. 2010b).Usually, plant composition is analyzed separatelyfrom plant diversity and structure, either byusing multivariate approaches (Fabian et al.2012), by considering different functional groups
(e.g., grasses, herbs, legumes; Hector et al. 1999,Haddad et al. 2009, Scherber et al. 2010b), or byusing dissimilarity matrices in Mantel tests(Ebeling et al. 2012). To our knowledge, studiesthat simultaneously analyzed the effect of plantdiversity, plant composition and structure oninsect diversity and abundance and ultimatelyfood-web structure are rare.
The spatial scale at which the studies areconducted can affect the shape and strength ofthe relationship between plant species richnessand the higher trophic levels. For example, theeffect of productivity on the species richness ofproducers and of animals changed from uni-modal to linear when increasing the spatial scaleof the study (Chase and Leibold 2002). In thatcase, increased scale was obtained by poolingplots (ponds) of similar productivity, and thechange in shape was explained by higher speciesdissimilarity in more productive plots. Moregenerally, rather than a change in shape, onecan expect that the relationships become weakerwhen considering smaller plots. For example,using hymenopteran-dominated communities intrap-nests, Albrecht et al. (2007) found a signif-icant relationship between plant and bee diver-sity in 1-ha plots, while no significantrelationship could be detected in the 20 m 3 20m plots of the Jena experiment (Ebeling et al.2012). However, the same experiment yieldedmany positive results for other groups (Scherberet al. 2010a), and it is likely that this scale-effect isdependent on the mobility of the species consid-ered. Because various species groups may re-spond differently to plant diversity according totheir trophic level (Scherber et al. 2010a) and theirmobility, it is interesting to consider the effects ofplant diversity at a small spatial scale, since it ishere that differences between the groups may bemore apparent. Additionally, considering moresubtle differences in the ecology of the species,rather than simply their trophic level, couldreveal otherwise hidden effects.
Here, we look at the hymenopteran-dominatedcommunities breeding in trap-nests in a plantdiversity experiment installed within wildflowerstrips. These structures are ecological compensa-tion areas consisting of mixtures of typically tallherbs and often established along field margins(Haaland et al. 2011). Among those species likelyto colonize wildflower strips, solitary cavity-
v www.esajournals.org 2 February 2014 v Volume 5(2) v Article 18
FABIAN ET AL.
nesting bees and wasps (Hymenoptera, Aculea-ta) provide valuable ecosystem services (Gath-mann and Tscharntke 1997) and have been usedto monitor the effects of ecological change(Tscharntke et al. 1998, Albrecht et al. 2007,Holzschuh et al. 2010). Cavity-nesting bees act aspollinators and collect pollen or nectar as foodfor their larvae (Westrich 1989). Cavity-nestingwasps can act as biological control agents(Tscharntke et al. 1998) by collecting phloem-sucking aphids (Aphididae) or other herbivorousarthropods, including larvae of smaller moths(microlepidoptera), leaf beetles (Chrysomelidae)and weevils (Curculionidae). Other species be-have as intraguild predators by feeding onspiders (Araneae), which themselves are benefi-cial as predators in agricultural ecosystems(Schmidt-Entling and Dobeli 2009). Thus, thetrap-nest bees and wasps fall in different trophiclevels and may respond differently to vegetationcomposition, diversity and structure, either di-rectly, through the availability of pollen andnectar sources, or indirectly, through the avail-ability of their different prey taxa. Although it isknown that prey abundance has importanteffects on the abundance of predators (Cohen etal. 2003), earlier studies on trap nests includedplant species richness, but not specific preyabundances (e.g., Albrecht et al. 2007, Ebelinget al. 2012).
We used mixed effect models to simultaneous-ly analyze the effect of plant composition, plantdiversity and vegetation structure on the diver-sity and abundance of the trap-nest functionalgroups in a plant diversity experiment. We alsoreconstructed quantitative food webs describingthe feeding links and interaction strength be-tween bee and wasp hosts (the nest-makers) andtheir enemies, mostly cleptoparasitic flies andparasitoid wasps (Bersier et al. 2002, Tylianakis etal. 2007). We tested the following hypotheses:
(1) Plant diversity affects the diversity andabundance of bees, wasps and their ene-mies in trap nests according to the resourceheterogeneity and more individuals hypothe-ses. These effects can be measured for somegroups even on a very small scale.
(2) The strength of the plant diversity effectdiffers among insect functional groups,decreasing with increasing trophic level in
the following order: (1) bees, (2) aphid- andother herbivore-predating wasps, (3) spi-der-predating wasps, and (4) enemies oftrap-nesting bees and wasps.
(3) The complexity of biotic interactions, asmeasured by quantitative food web met-rics, decreases more rapidly than simplespecies diversity and abundance as plantdiversity declines (Tylianakis et al. 2007).
MATERIAL AND METHODS
Wildflower strip manipulationsWildflower strips are one of several elements
in agri-environmental schemes introduced inEurope to counter species declines and provideecosystem services (Kleijn et al. 2009, Haaland etal. 2011). In Switzerland, they consist of fieldmargins or patches sown with a recommendedplant mixture containing 24 herb species andmaintained for six years (Nentwig 2000). Inspring (April–June) 2007 12 wildflower stripswere sown manually in agricultural fieldsaround the village of Grandcour, 10 km southof Lake Neuchatel in north-west Switzerland (479m altitude; coordinates: 468 520 N, 068 560 E).Annual average air temperatures are 10.18C andannual precipitation is approximately 941 mm inthe region (Confederation suisse, Agroscope2011). The region is characterized by intensiveagriculture embedded in a small-scale mosaic ofarable fields, meadows and forests (Fabian et al.2013).
The wildflower strips (hereafter strips) wereeach divided into three blocks of 216 m2, whichwere randomly assigned to one of three trophiccompositions: (1) control unfenced; (2) fencedwith the aim of excluding slugs, micromammalsand their main vertebrate predators; and (3)fenced to exclude only the vertebrate predators(as explained in detail in Fabian et al. 2012).These treatments did not affect the trap-nestcommunity analyzed here (see statistical analysisbelow). Within each trophic treatment, foursubplots (6 3 9 m) differing in plant diversity(2, 6, 12, 20 sown species) were randomlyassigned (Fig. 1) and established from seeds ofthe conventional wildflower seed mixture(Gunter 2000). The order and species composi-tion of the plant diversity subplots was the samein the three fence treatments within a strip (Fig.
v www.esajournals.org 3 February 2014 v Volume 5(2) v Article 18
FABIAN ET AL.

1), but differed between strips. Thus, in total eachof the 12 strips consisted of 12 subplots (3 fencing3 4 diversity treatments). In contrast to otherbiodiversity experiments (e.g., Cedar Creek; Til-man et al. (2001) and Jena Experiment, Roscher etal. (2004)), the plots were not weeded, so that theplant communities are the result of self-assem-blage following initial sowing. All plant diversitymeasures were thus based on actual diversityestimates rather than sown values, although thetwo were correlated (r¼ 0.13, df¼ 280, P¼ 0.014).
VegetationIn autumn 2008, the percentage cover for each
species was visually estimated using the stan-dard method of Braun-Blanquet (Perner et al.2005) for each subplot. Plant diversity wascharacterized by the total plant species richness.Vegetation structure was characterized by theaverage vegetation height and plant biomass.Vegetation height was estimated as the averageheight of all plants of a subplot. Plant biomasswas assessed by measuring the leaf area index(LAI) with a LAI-2000 (LI-COR Biosciences) at 24random points in each subplot in autumn 2008.The method was calibrated by cutting, dryingand weighing 5 biomass samples in 8 subplots,and the resulting linear relationship (Pearsonproduct-moment correlation r¼0.89) was used totransform the average LAI values to plantbiomass per subplot in dry weight g/m2.
Trap nestsCommunity composition.—Trap nests enabled us
to study species richness, abundance, and inter-actions of above ground nesting hymenopteransand their natural enemies under standardizednest site conditions (Tscharntke et al. 1998). Trap-
nests consisted of 170–180 20-cm long internodesof common reed Phragmites australis, placed in20-cm long plastic pipes of 10 cm diameter. Thediameters of reed internodes ranged from 2 to 10mm. One trap was placed within each subplot,fixed at a height of 1.3 m on a wooden pole andprotected by a 30 3 30 cm wooden roof. In total,12 trap nests were positioned in each strip (Fig. 1)from mid-April until October 2008. After collec-tion they were stored at 48C for at least sevenweeks to simulate winter. Twenty-seven nestswere destroyed while in place, including nearlyall of those in two strips, thus in total 117 trapnests from 10 strips were analyzed.
In spring 2009, all reed internodes containingbrood cells were opened and counts made of thenumber of cells and the occurrence of (clepto-)parasites, parasitoids and predators (hereaftercalled ‘‘enemies’’) attacking the nest-makers(hereafter called ‘‘hosts’’). Reeds were storedseparately in glass tubes to collect emergingadults for identification. Individuals were iden-tified using the following resources: Megachili-dae, Amiet et al. (2007); Sphaecidae, DeBeaumont (1964); Pompilidae, Wolf (1972); Eu-menidae, Schmid-Egger (2004); Sapygidae,Amiet (2008); and Chrysididae, Bellmann (1995)and Linsenmaier (1997). Several specimens ofeach species were verified by taxonomists (seeAcknowledgments). If no adult emerged, fea-tures of the nest and larval food were used toidentify the genus or (sub-) family based onGathmann and Tscharntke (1999). Empty broodcells of eumenid wasps were assumed to belongto the bivoltine Ancistrocerus nigricornis, since itwas the only species for which offspring of thefirst generation emerged before trap collection(Krewenka et al. 2011).
Fig. 1. Experimental set up of 12 trap-nests (red circles) within subplots in wildflower strips. Numbers indicate
sown plant species richness. Strips were divided into three blocks of equal size, with 3 fence treatments: (1) fence
with 8 mm mesh (dotted-line), (2) fence with 25 mm mesh (dashed-line) and (3) no fence.
v www.esajournals.org 4 February 2014 v Volume 5(2) v Article 18
FABIAN ET AL.
Species richness and abundance (number of
brood cells) in each subplot were recorded for the
entire trap-nest community and separately for
the following groups: hosts, enemies, pollen- and
nectar-collecting bees (Apidae), all wasps, and
the individual wasp functional groups predating
on herbivores (Eumenidae and Sphecidae, feed-
ing on Chrysomelidae, Curculionidae, Caelifera,
and microlepidoptera larvae), on aphids (Sphe-
cidae of the genera Passaloecus, Pemphredon, and
Psenulus), and on spiders (Pompilidae and
Sphecidae of the genus Trypoxylon) (see Table 1).
Food-web metrics.—Quantitative host-enemy
interaction food webs were constructed based
on the pooled data from the three equal diversity
subplots of each strip, and three quantitative
food-web metrics were calculated following
Bersier et al. (2002), using the bipartite package
(Dormann et al. 2009) in R (R Development Core
Team 2012). Vulnerability is the weighted mean
effective number of enemies per host species and
generality is the weighted mean effective number
of hosts per enemy species. Interaction diversity is
a measure of the Shannon diversity of interac-
tions that takes both the number and the
evenness of interactions into account (Tylianakis
et al. 2007). For comparison, qualitative food-
web metrics were calculated based on binary
presence/absence interaction data. We analyzed
three additional qualitative food-web metrics.
Connectance is the proportion of potential links
that are realized. Nestedness is a measure of
departure from a systematic arrangement of
species by niche width whereby the niches of
more specialized species fall within those of more
generalized species, ranging from 0 to 100, high
to low nestedness (Atmar and Patterson 1993).
The number of compartments is the number of
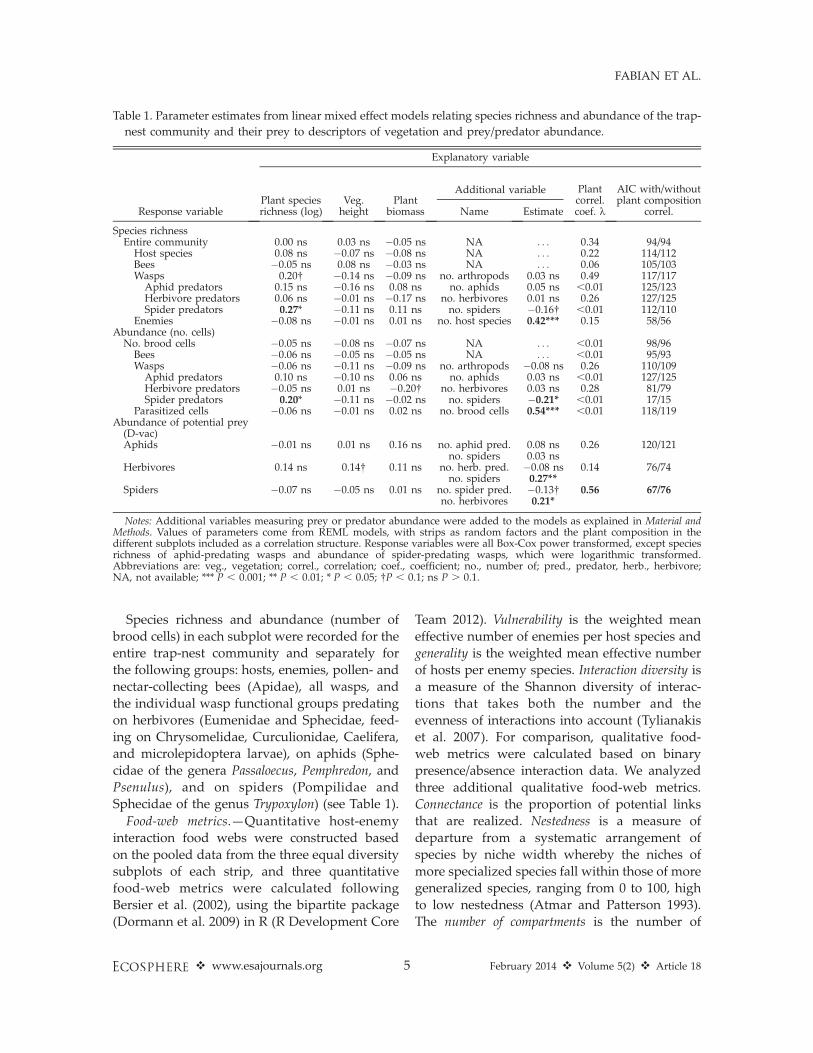
Table 1. Parameter estimates from linear mixed effect models relating species richness and abundance of the trap-
nest community and their prey to descriptors of vegetation and prey/predator abundance.
Response variable
Explanatory variable
Additional variablePlant speciesrichness (log)
Veg.height
Plantbiomass Name Estimate
Plantcorrel.coef. k
AIC with/withoutplant composition
correl.
Species richnessEntire community 0.00 ns 0.03 ns �0.05 ns NA . . . 0.34 94/94Host species 0.08 ns �0.07 ns �0.08 ns NA . . . 0.22 114/112Bees �0.05 ns 0.08 ns �0.03 ns NA . . . 0.06 105/103Wasps 0.20� �0.14 ns �0.09 ns no. arthropods 0.03 ns 0.49 117/117Aphid predators 0.15 ns �0.16 ns 0.08 ns no. aphids 0.05 ns ,0.01 125/123Herbivore predators 0.06 ns �0.01 ns �0.17 ns no. herbivores 0.01 ns 0.26 127/125Spider predators 0.27* �0.11 ns 0.11 ns no. spiders �0.16� ,0.01 112/110
Enemies �0.08 ns �0.01 ns 0.01 ns no. host species 0.42*** 0.15 58/56Abundance (no. cells)
No. brood cells �0.05 ns �0.08 ns �0.07 ns NA . . . ,0.01 98/96Bees �0.06 ns �0.05 ns �0.05 ns NA . . . ,0.01 95/93Wasps �0.06 ns �0.11 ns �0.09 ns no. arthropods �0.08 ns 0.26 110/109Aphid predators 0.10 ns �0.10 ns 0.06 ns no. aphids 0.03 ns ,0.01 127/125Herbivore predators �0.05 ns 0.01 ns �0.20� no. herbivores 0.03 ns 0.28 81/79Spider predators 0.20* �0.11 ns �0.02 ns no. spiders �0.21* ,0.01 17/15
Parasitized cells �0.06 ns �0.01 ns 0.02 ns no. brood cells 0.54*** ,0.01 118/119Abundance of potential prey
(D-vac)Aphids �0.01 ns 0.01 ns 0.16 ns no. aphid pred. 0.08 ns 0.26 120/121
no. spiders 0.03 nsHerbivores 0.14 ns 0.14� 0.11 ns no. herb. pred. �0.08 ns 0.14 76/74
no. spiders 0.27**Spiders �0.07 ns �0.05 ns 0.01 ns no. spider pred. �0.13� 0.56 67/76
no. herbivores 0.21*
Notes: Additional variables measuring prey or predator abundance were added to the models as explained in Material andMethods. Values of parameters come from REML models, with strips as random factors and the plant composition in thedifferent subplots included as a correlation structure. Response variables were all Box-Cox power transformed, except speciesrichness of aphid-predating wasps and abundance of spider-predating wasps, which were logarithmic transformed.Abbreviations are: veg., vegetation; correl., correlation; coef., coefficient; no., number of; pred., predator, herb., herbivore;NA, not available; *** P , 0.001; ** P , 0.01; * P , 0.05; �P , 0.1; ns P . 0.1.
v www.esajournals.org 5 February 2014 v Volume 5(2) v Article 18
FABIAN ET AL.
subwebs within a web, where a subweb is a set ofinterconnected species with no links to membersof other subwebs (Tylianakis et al. 2007).
Availability of arthropod preyTo estimate arthropod abundance in each
subplot of the 10 strips, vacuum (hereafter D-vac) samples were taken in May 2008, between10:00 and 16:00 on dry and sunny days. Thisperiod covers both the peak in flight activity ofearly and abundant species (Trypoxylon and thebivoltine Ancistrocerus nigricornis), and the startof the peak of late species (Ancistrocerus gazellaand Passaloecus borealis; Bellmann 1995). A foliagehoover type SH 85C (Stihl, Dieburg, Germany)was used to sample for two minutes from an areaof 1 m2 in the center of each subplot, workingsystematically along each strip to minimizedisturbance (Fig. 1). Collected arthropods werestored in ethanol and grouped into orders. Aphid(Aphidina) and spider (Araneae) abundancesserved as estimates of food availability for aphid-and spider-predating wasps, respectively. Totalabundances of butterfly larvae (Lepidoptera),Psocoptera, beetle larvae (Coleoptera) and grass-hoppers (Caelifera) per subplot (Appendix: TableA3) served as estimates of food availability forherbivore-predating wasps. For the analysis oftotal wasp species richness and abundance, thesummed abundance of all these groups wascounted as ‘‘arthropods’’.
Statistical analysesAll analyses were carried out using R version
2.12.0 (R Development Core Team 2012). Todetermine the best structure of the randomfactors, we first analyzed linear models with theresponse variables bee, wasp and enemy speciesrichness and abundance and tested for differenc-es between strips and between trophic (fence)treatment blocks. Models with only strips asrandom factor always performed best based onAkaike Information Criterion (AIC), compared tomodels with either trophic treatment, or strip andtrophic treatment as random factors, thus weused the ten strips as random factors in allfollowing analyses.
We analyzed the data using a linear mixedeffect model with a correlation structure inducedby the similarity in plant species compositionbetween subplots. Our model is given by
yi; j ¼ b0 þ b1logðSÞi; j þ b2ðHeightÞi; jþ b3ðBiomassÞi; j þ b4ðAdditionalÞi; j þ zj þ ei; j
where the indices i and j denote the subplot andthe wildflower strip, respectively. As responsevariables (yi,j), we tested: the species richness andnumber of brood cells of all trap nest species,hosts, enemies, bees, wasps, and the three waspfunctional groups, and the abundance of aphids,other herbivores, and spiders from the D-vacsamples. The following covariates were used: thenatural logarithm of number of plant species(log(S )), the average vegetation height (Height)and the average plant biomass (Biomass). Asadditional explanatory variables (Additional), weused: (1) the abundance of D-vac collectedarthropods, aphids, other herbivores, and spidersin the analysis of the abundance and speciesrichness of all wasps, aphid-, other herbivore-and spider- predating wasps, respectively; (2) thehost species richness and number of brood cellsin the analysis of enemy richness and number ofparasitized cells, respectively; (3) the abundanceof the respective predatory wasp group in theanalysis of the abundance of D-vac collectedaphids, other herbivores and spiders and (4) theabundance of D-vac collected spiders for aphidsand herbivores, and of herbivores for spiders.The parameter b0 denotes the intercept and b1–4
denote the parameter estimates for the slopes oneach variable. The 10 wildflower strips wereconsidered as random factors with zj ; Nð0;r2
z Þ,where r2
z denotes the random effect variance.The similarities in plant species compositionbetween subplots were included as correlationstructure in the residuals. Specifically, we do notconsider the residuals as independent (which isthe usual assumption in linear models). In ourmodel the correlation between the residuals fromsubplot (i1, j1) and (i2, j2) is proportional to theirvegetation similarity measured as the Bray-Curtis index (Bray and Curtis 1957), i.e., ei,j ;
N(0, R), where the elements of the variance-covariance matrix are given by
Rði1 ; j1Þ;ði2; j2Þ
¼r2 if ði1; j1Þ ¼ ði2; j2Þ
r2 3ðBray-CurtisÞði1 ; j1Þ;ði2; j2Þ3 k if ði1; j1Þ 6¼ ði2; j2Þ:
8<:
The parameter k determines the strength of the
v www.esajournals.org 6 February 2014 v Volume 5(2) v Article 18
FABIAN ET AL.
correlation structure induced by the similarity inplant species composition, and is estimated at thesame time as the other parameters. Note that fork ¼ 0, our model is simply equivalent to astandard linear mixed effect model. In order todetermine if the correlation structure between thesubplots induced by the plant composition wassignificant, we fitted models with and withoutinclusion of the correlation structure by maxi-mum likelihood (see Chapter 9.4.2 in Davison2003) and then computed the AIC (Zuur et al.2009). Finally, the parameters were estimatedusing restricted maximum likelihood (REML, seeChapter 12.2 in Davison 2003). We examined Q-Q plots and Shapiro-Wilk tests of the normalizedresiduals of the models and Box-Cox trans-formed the response variables when necessary,to meet the assumptions of normality (Fox andWeisberg 2011). All continuous explanatoryvariables were scaled to zero mean and unitvariance to facilitate comparison of their relativeimportance (Oksanen et al. 2011). The REML andML codes can be provided upon request.
The food-web metrics (vulnerability, generali-ty, interaction diversity, connectance, nestednessand number of compartments) were analyzedusing the same procedure, with the explanatoryvariables: plant species richness (log), vegetationheight, plant biomass and trap-nest speciesrichness (to account for the possible dependenceof the food-web metrics on the latter; Banasek-Richter et al. 2009).
The species composition of the entire commu-nity and of the four trophic guilds was analyzedwith respect to (1) plant species richness andeffective number of plant species (based on theShannon diversity, see Jost 2006), vegetationheight and biomass, and (2) vegetation compo-sition of the 40 most abundant plant species overall strips, using constrained correspondenceanalyses (CCA) in vegan (Oksanen et al. 2011).Trap nest species with less than ten individualswere down-weighted; the effect of the stripidentity was removed (‘‘partialled out’’) asconditioning variable. The importance of thepredictors was tested using the function anovawith 9999 permutations. Plant species thatsignificantly affected the composition of the trapnest community were identified using the func-tion ordistep with backward stepwise modelselection using 9999 permutations.
RESULTS
In total we recorded 13,795 brood cells of 38host taxa identified at the species level, and 16 atcoarser level in the 117 trap nests. Bees wererepresented by 13 species in 9442 brood cells andwasps by 25 species in 3926 brood cells (Appen-dix: Table A1). The most abundant bee specieswas the Red Mason bee, Osmia bicornis (FamilyMegachilidae), with 6666 brood cells. The mostabundant wasp species were the spider-predat-ing digger wasp, Trypoxylon figulus (familySphecidae), and the caterpillar-predating masonwasp, Ancistrocerus nigricornis (family Eumeni-dae), building 1659 and 931 brood cells, respec-tively. We found 36 taxa of higher trophicenemies of the orders Hymenoptera (clepto-parasites and parasitoids), Diptera (parasites),Coleoptera (predators) and Acari (parasites). Tenattacked bees, ten attacked wasps, eight attackedboth bees and wasps, and eight attacked unde-termined hosts. The most common enemyspecies were the gregarious chalcid wasp Melit-tobia acasta, which attacked 23 host species in 523cells (Appendix: Table A2) and the cleptopar-asitic drosophilid Cacoxenus indagator, attackingthree bee species in 1281 cells. Mortality due tonatural enemies was 20.3% for bees and 17.3% forwasps. Full species lists can be found inAppendix: Tables A1 and A2; and means forvariables are given in Table A3.
Trap nest species richness and abundanceBee richness and abundance and total wasp
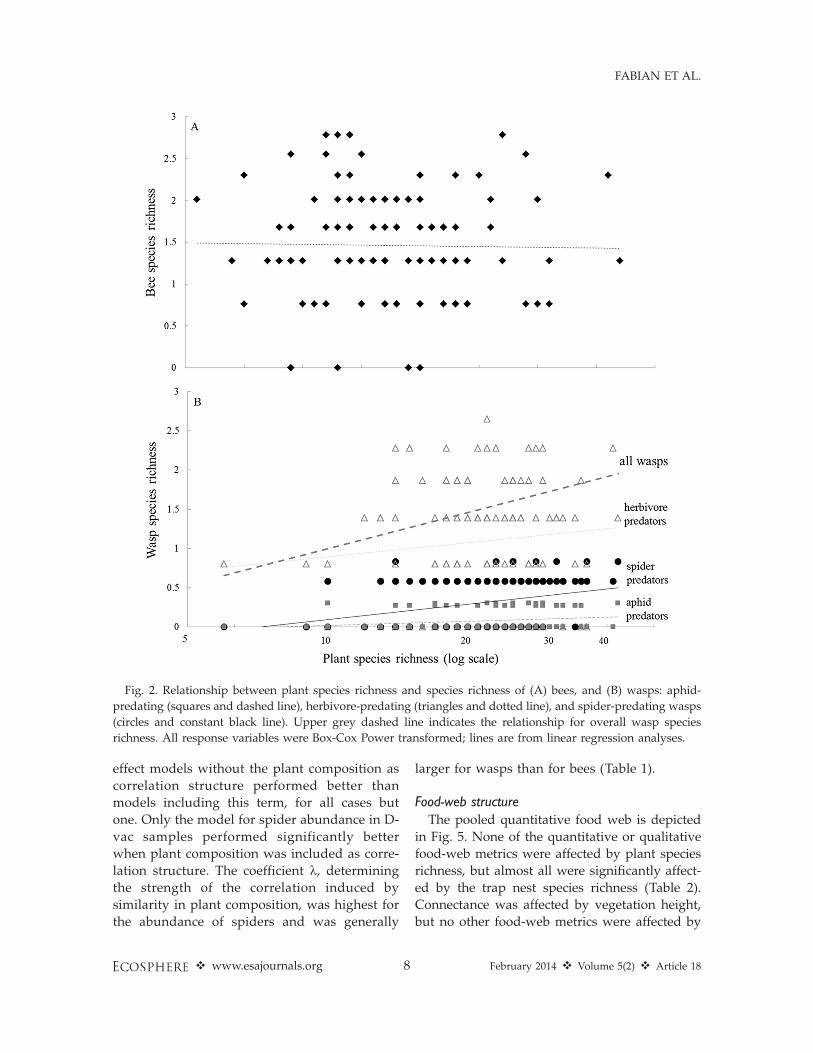
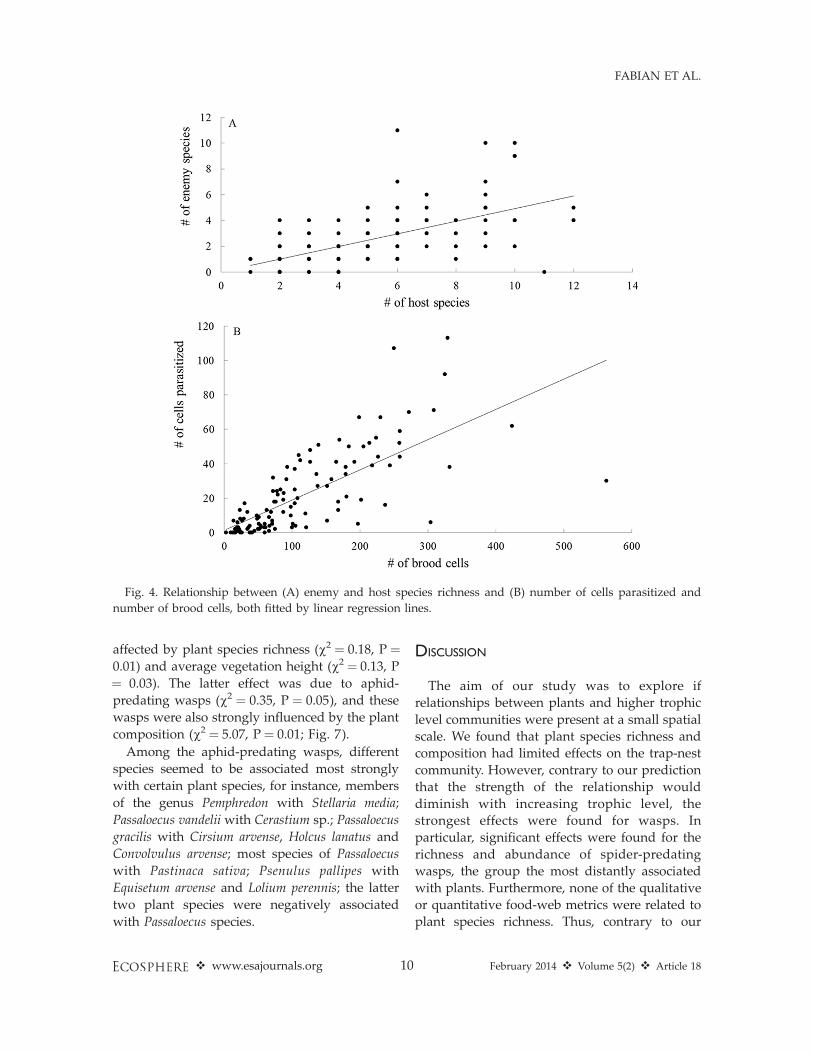
abundance were not related to plant speciesrichness (P . 0.1), but the relationship betweenthe species richness of wasps and of plantsapproached significance (parameter value ¼0.20, P ¼ 0.053, Figs. 2A, B and 3A, B). Amongthe individual trophic groups, only spider-predating wasps showed a significant effect ofplant species richness, with positive relation-ships for both species richness and abundance(Table 1, Figs. 2B and 3B). The abundances ofspiders and spider-predating wasps were nega-tively correlated, while the abundances ofspiders and herbivores were positively correlat-ed. The abundance and species richness of theenemies were strongly positively related to theabundance and species richness of their hosts,respectively (Fig. 4). Based on the AIC, mixed
v www.esajournals.org 7 February 2014 v Volume 5(2) v Article 18
FABIAN ET AL.
effect models without the plant composition as
correlation structure performed better than
models including this term, for all cases but
one. Only the model for spider abundance in D-
vac samples performed significantly better
when plant composition was included as corre-
lation structure. The coefficient k, determining
the strength of the correlation induced by
similarity in plant composition, was highest for
the abundance of spiders and was generally
larger for wasps than for bees (Table 1).
Food-web structure
The pooled quantitative food web is depicted
in Fig. 5. None of the quantitative or qualitative
food-web metrics were affected by plant species
richness, but almost all were significantly affect-
ed by the trap nest species richness (Table 2).
Connectance was affected by vegetation height,
but no other food-web metrics were affected by
Fig. 2. Relationship between plant species richness and species richness of (A) bees, and (B) wasps: aphid-
predating (squares and dashed line), herbivore-predating (triangles and dotted line), and spider-predating wasps
(circles and constant black line). Upper grey dashed line indicates the relationship for overall wasp species
richness. All response variables were Box-Cox Power transformed; lines are from linear regression analyses.
v www.esajournals.org 8 February 2014 v Volume 5(2) v Article 18
FABIAN ET AL.

vegetation height or biomass. For all food-web
metrics, the AIC favors the model without plant
composition included.
Vegetation effects on trap nestcommunity composition
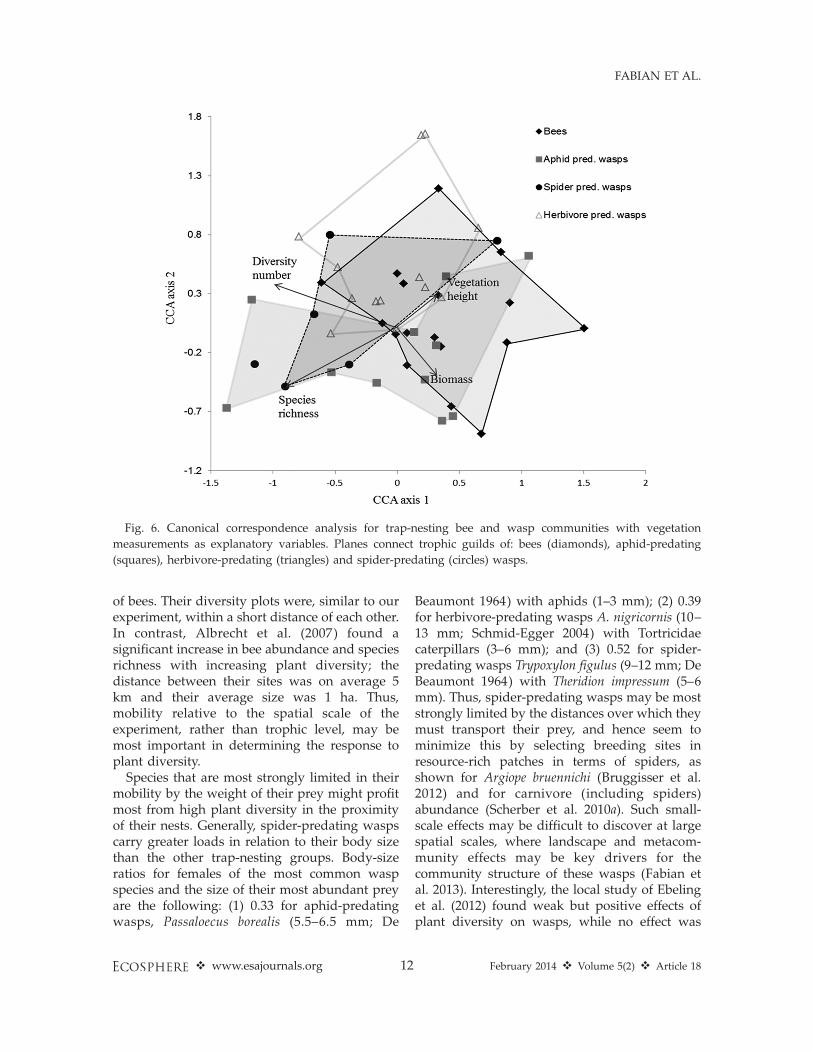
The multivariate analysis of the effect of the
vegetation on the species composition of the
entire trap nest community revealed effects
approaching significance for plant species rich-
ness (v2 ¼ 0.06, P ¼ 0.07; see Fig. 6) and
composition (v2 ¼ 2.43, P ¼ 0.09). Splitting the
data into trophic guilds, we found that the
community of bees was not affected by the
vegetation measures or by the plant composition
(all P . 0.1). In contrast, wasps were significantly
Fig. 3. Relationship between plant species richness and number of brood cells of A) bees, and B) wasps, aphid-
predating (squares and dashed line), herbivore-predating (triangles and dotted line), and spider-predating wasps
(circles and constant black line). Upper grey dashed line indicates the relationship for overall wasp species
richness. All response variables were Box-Cox Power transformed; lines are from linear regression analyses.
v www.esajournals.org 9 February 2014 v Volume 5(2) v Article 18
FABIAN ET AL.
affected by plant species richness (v2 ¼ 0.18, P ¼0.01) and average vegetation height (v2¼ 0.13, P
¼ 0.03). The latter effect was due to aphid-
predating wasps (v2 ¼ 0.35, P ¼ 0.05), and these
wasps were also strongly influenced by the plant
composition (v2 ¼ 5.07, P ¼ 0.01; Fig. 7).
Among the aphid-predating wasps, different
species seemed to be associated most strongly
with certain plant species, for instance, members
of the genus Pemphredon with Stellaria media;
Passaloecus vandelii with Cerastium sp.; Passaloecus
gracilis with Cirsium arvense, Holcus lanatus and
Convolvulus arvense; most species of Passaloecus
with Pastinaca sativa; Psenulus pallipes with
Equisetum arvense and Lolium perennis; the latter
two plant species were negatively associated
with Passaloecus species.
DISCUSSION
The aim of our study was to explore if
relationships between plants and higher trophic
level communities were present at a small spatial
scale. We found that plant species richness and
composition had limited effects on the trap-nest
community. However, contrary to our prediction
that the strength of the relationship would
diminish with increasing trophic level, the
strongest effects were found for wasps. In
particular, significant effects were found for the
richness and abundance of spider-predating
wasps, the group the most distantly associated
with plants. Furthermore, none of the qualitative
or quantitative food-web metrics were related to
plant species richness. Thus, contrary to our
Fig. 4. Relationship between (A) enemy and host species richness and (B) number of cells parasitized and
number of brood cells, both fitted by linear regression lines.
v www.esajournals.org 10 February 2014 v Volume 5(2) v Article 18
FABIAN ET AL.

expectation, the effect of plant diversity on food-
web structure was not stronger than on simple
community richness.
Our results are intriguing since groups most
closely linked to plants—i.e., bees—showed no
effect, while higher trophic levels did. Species
richness of wasps approached significance and,
intriguingly, the richness and abundance of
spider-predating wasps were positively affected
by plant species richness. Thus our results
support the resource heterogeneity and more indi-
viduals hypotheses for wasps, but not for bees.
Ebeling et al. (2012) also found no relationship
between plant diversity and brood cell densities
Fig. 5. Quantitative host–enemy food web from all diversity plots. Width of bars represents host and enemy
abundance and width of links total number of interactions. Species richness: 34 hosts (lower bars) and 36 enemies
(upper bars). Host functional groups: bees (yellow), aphid-predating wasps (green), herbivore-predating wasps
(blue), spider-predating wasps (red) and undetermined groups (grey). Species codes are given in Appendix:
Tables A1 and A2. Hosts and enemies are ordered to minimize the overlap of interactions.
Table 2. Parameter estimates from linear mixed effect models relating food-web metrics to descriptors of
vegetation and trap nest species richness.
Food-web metrics
Explanatory variable
Plant speciesrichness (log)
Veg.height
Plantbiomass
Trap nestspeciesrichness
Plant correl.coeff. k
AIC with/withoutplant composition
correl.
QuantitativeVulnerability �0.12 ns 0.03 ns 0.17 ns 0.37* 0.15 28/26Generality 0.06 ns 0.13 ns �0.20 ns 0.21 ns 0.08 48/46Interaction diversity �0.11 ns 0.14 ns �0.11 ns 0.59** 0.07 37/34
QualitativeVulnerability �0.19 ns �0.02 ns 0.27 � 0.50** ,0.01 29/27Generality 0.11 ns 0.06 ns �0.18 ns 0.42* ,0.01 41/39Interaction diversity 0.01 ns 0.16� 0.03 ns 0.28*** ,0.01 7/5Connectance 0.02 ns �0.31* 0.14 ns �0.68*** ,0.01 29/27Nestedness 0.02 ns 0.01 ns 0.21 ns �0.57*** ,0.01 33/31No. compartments 0.11 ns 0.06 ns �0.18 ns 0.42* ,0.01 41/39
Notes: Values of parameters from REML models, with strips as random factors and the plant composition in the differentsubplots included as a correlation structure. Abbreviations as in Table 1.
v www.esajournals.org 11 February 2014 v Volume 5(2) v Article 18
FABIAN ET AL.
of bees. Their diversity plots were, similar to ourexperiment, within a short distance of each other.In contrast, Albrecht et al. (2007) found asignificant increase in bee abundance and speciesrichness with increasing plant diversity; thedistance between their sites was on average 5km and their average size was 1 ha. Thus,mobility relative to the spatial scale of theexperiment, rather than trophic level, may bemost important in determining the response toplant diversity.
Species that are most strongly limited in theirmobility by the weight of their prey might profitmost from high plant diversity in the proximityof their nests. Generally, spider-predating waspscarry greater loads in relation to their body sizethan the other trap-nesting groups. Body-sizeratios for females of the most common waspspecies and the size of their most abundant preyare the following: (1) 0.33 for aphid-predatingwasps, Passaloecus borealis (5.5–6.5 mm; De
Beaumont 1964) with aphids (1–3 mm); (2) 0.39for herbivore-predating wasps A. nigricornis (10–13 mm; Schmid-Egger 2004) with Tortricidaecaterpillars (3–6 mm); and (3) 0.52 for spider-predating wasps Trypoxylon figulus (9–12 mm; DeBeaumont 1964) with Theridion impressum (5–6mm). Thus, spider-predating wasps may be moststrongly limited by the distances over which theymust transport their prey, and hence seem tominimize this by selecting breeding sites inresource-rich patches in terms of spiders, asshown for Argiope bruennichi (Bruggisser et al.2012) and for carnivore (including spiders)abundance (Scherber et al. 2010a). Such small-scale effects may be difficult to discover at largespatial scales, where landscape and metacom-munity effects may be key drivers for thecommunity structure of these wasps (Fabian etal. 2013). Interestingly, the local study of Ebelinget al. (2012) found weak but positive effects ofplant diversity on wasps, while no effect was
Fig. 6. Canonical correspondence analysis for trap-nesting bee and wasp communities with vegetation
measurements as explanatory variables. Planes connect trophic guilds of: bees (diamonds), aphid-predating
(squares), herbivore-predating (triangles) and spider-predating (circles) wasps.
v www.esajournals.org 12 February 2014 v Volume 5(2) v Article 18
FABIAN ET AL.

discovered at a regional scale by Albrecht et al.(2007).
When analyzing the prey community in D-vacsamples, we found no effect of plant speciesrichness on the abundance of spiders, herbivores,or aphids. It is possible that, for spiders at least,we could not detect an effect because it wasmasked by top-down control, in the form ofstronger predation pressure by spider-predatingwasps in plots with higher plant diversity. Themost common of the wasps, Trypoxylon figulus,can have a substantial negative effect on spiderpopulations (Blackledge et al. 2003), because onefemale can catch 100–300 spiders in the course ofa summer (Bristowe 1941). In our study every
brood cell was filled with 5–15 spiders. Thus,with an average of ten spiders per larva, the 1732brood cells would contain 17320 spiders caughtby Trypoxylon wasps. Furthermore, the wasppopulations were concentrated in only some ofthe strips: although five strips contained only 0 to28 brood cells per strip, five others had muchgreater numbers, with between 102 and 583 cells.Within the same system, strong regulation ofspider abundance by hymenoptera is seen inArgiope bruennichi by hornets (Bruggisser et al.2012).
The complexity of biotic interactions is expect-ed to be more strongly affected by a decrease inplant diversity than simple species diversity and
Fig. 7. Canonical correspondence analysis for the aphid-predating wasp community (in grey) with the most
influential plant species as explanatory variables (in black). CCA axis 1 explains 25.5% (v2¼ 0.66, P¼ 0.005) and
CCA axis 2 explains 19.9% (v2 ¼ 0.57, P ¼ 0.005) of the variation.
v www.esajournals.org 13 February 2014 v Volume 5(2) v Article 18
FABIAN ET AL.

abundance (Albrecht et al. 2007, Tylianakis et al.2007). Although the diversity and abundance ofhigher and lower trophic levels in the trap nestswere strongly positively correlated, contrary toour expectation, we detected no effect of plantdiversity on the quantitative or qualitative food-web metrics. This absence of relationship may besimply due to the fact that only a small subset ofthe whole community, namely spider-predatingwasps, responds to plant diversity. Interestingly,connectance was negatively correlated withvegetation height, which might be due to adecreased accessibility of the trap nests for highertrophic levels when Dipsacus fullonum, the tallestspecies of our system, was abundant. Indeed,adding the logarithmically transformed cover ofDipsacus fullonum to the model shows a negativerelationship between connectance and D. full-onum cover (parameter estimate ¼ �0.29, P ¼0.023). Thus, the architecture of the vegetationcan override the effects of plant diversity onfood-web complexity.
In contrast to other analyses that simplytreated species diversity (e.g., Albrecht et al.2007, Tylianakis et al. 2007, Haddad et al. 2009,Scherber et al. 2010a, Ebeling et al. 2012), weaccounted for plant composition by including acorrelation structure in the residuals of themixed-effect models. This is important becausea change in plant diversity cannot be achievedwithout altering plant composition. In our casehowever, for all groups except spiders, modelswith plant composition performed worse thanmodels without. Earlier studies similarly foundthat the abundances of spiders were stronglyaffected by the plant community, acting throughspecies composition (Schaffers et al. 2008),diversity (Bruggisser et al. 2012), or vegetationstructure (Pearson 2009, Bruggisser et al. 2012).Moreover, the abundances of spiders and ofherbivores were strongly positively correlated inour study, reflecting a bottom-up effect. For web-building spiders, habitat use is strongly depen-dent on high prey abundance and on vegetationstructure, which is closely linked to plantcomposition. Thus, habitat selection might ex-plain this effect for spiders. The absence of aneffect of plant composition for the other speciesgroups may reflect the small-scale of the studyrelative to their mobility. In general, however,plant composition should be included in biodi-
versity models and may reveal unexpectedresults.
ACKNOWLEDGMENTS
We would like to thank Felix Amiet (Eumenidae,Sapygidae, Sphecidae), Hannes Baur (Parasitica) andSeraina Klopfstein (Ichneumonidae) for identificationof uncertain specimens. Silvie Rotzetter and ValentineRenevey sorted the D-vac samples. We are grateful toMatthias Albrecht and Martin Schmidt-Entling fordiscussions and comments on trap-nest ecology. Weare very grateful to two anonymous reviewers and theeditor in Chief for their constructive suggestions,which greatly improved the manuscript. The experi-ment complies with current Swiss laws. This studywas supported by the Swiss National Science Foun-dation (Grant 31003A_138489 to L.-F. Bersier) and bythe Fonds de recherche de l’Universite de Fribourg,Switzerland. RPR was funded by the 214 FP7-REGPOT-2010-1 program (project 264125 EcoGenes).P. Kehrli, L.-F. Bersier, Y. Fabian and O. T. Bruggisserdesigned and A. Aebi, O. T. Bruggisser, N. Sandau andY. Fabian established the experiment; Y. Fabian and R.P. Rohr performed the analysis and Y. Fabian wrote thefirst draft; R. E. Naisbit, Y. Fabian, P. Kehrli and L.-F.Bersier revised the manuscript.
LITERATURE CITED
Albrecht, M., P. Duelli, B. Schmid, and C. B. Muller.2007. Interaction diversity within quantified insectfood webs in restored and adjacent intensivelymanaged meadows. Journal of Animal Ecology76:1015–1025.
Amiet, F. 2008. Vespoidea 1. Mutillidae, Sapygidae,Scoliidae, Tiphiidae. Fauna Helvetica. 23. Centresuisse de cartographie de la faune, Neuchatel,Switzerland.
Amiet, F., M. Herrmann, A. Muller, and R. Neumeyer.2007. Apidae 5: Ammobates, Ammobatoides,Anthophora, Biastes, Ceratina, Dasypoda, Epeo-loides, Epeolus, Eucera, Macropis, Melecta, Melitta,Nomada, Pasites, Tetralonia, Thyreus, Xylocopa.Fauna Helvetica 20. Centre suisse de cartographiede la faune, Neuchatel, Switzerland.
Atmar, W., and B. D. Patterson. 1993. The measure oforder and disorder in the distribution of species infragmented habitat. Oecologia 96:373–382.
Balvanera, P., A. B. Pfisterer, N. Buchmann, J. S. He, T.Nakashizuka, D. Raffaelli, and B. Schmid. 2006.Quantifying the evidence for biodiversity effects onecosystem functioning and services. Ecology Let-ters 9:1146–1156.
Banasek-Richter, C. et al. 2009. Complexity in quanti-tative food webs. Ecology 90:1470–1477.
v www.esajournals.org 14 February 2014 v Volume 5(2) v Article 18
FABIAN ET AL.

Bellmann, H. 1995. Bienen, Wespen, Ameisen: dieHautflugler Mitteleuropas. Franck-Kosmos Ver-lags, Stuttgart, Germany.
Bersier, L. F., C. Banasek-Richter, and M. F. Cattin.2002. Quantitative descriptors of food-web matri-ces. Ecology 83:2394–2407.
Blackledge, T. A., J. A. Coddington, and R. G. Gillespie.2003. Are three-dimensional spider webs defensiveadaptations? Ecology Letters 6:13–18.
Bray, J. R., and J. T. Curtis. 1957. An ordination ofupland forest communities of southern Wisconsin.Ecological Monographs 27:325–349.
Bristowe, W. S. 1941. The community of spiders.Volumes 1 and 2. Ray Society, London, UK.
Bruggisser, O. T., N. Sandau, G. Blandenier, Y. Fabian,K. Patrik, A. Aebi, R. E. Naisbit, and L.-F. Bersier.2012. Direct and indirect bottom-up and top-downforces shape the abundance of the orb-web spiderArgiope bruennichi. Basic and Applied Ecology13:706–714.
Cardinale, B. J., D. S. Srivastava, J. E. Duffy, J. P.Wright, A. L. Downing, M. Sankaran, and C.Jouseau. 2006. Effects of biodiversity on thefunctioning of trophic groups and ecosystems.Nature 443:989–992.
Chase, J. M., and M. A. Leibold. 2002. Spatial scaledictates the productivity–biodiversity relationship.Nature 416:427–430.
Cohen, J. E., T. Jonsson, and S. R. Carpenter. 2003.Ecological community description using the foodweb, species abundance, and body size. Proceed-ings of the National Academy of Sciences USA100:1781–1786.
Confederation suisse, Agroscope. 2011. Agrometeo:donnees meteorologiques. http://www.agrometeo.ch/fr/meteorology/datas
Davison, A. C. 2003. Statistical methods. CambridgeUniversity Press, Cambridge, UK.
De Beaumont, J. 1964. Hymenoptera: Sphecidae.Insecta Helvetica, Fauna 3. Societe EntomologiqueSuisse, Lausanne, Switzerland.
Dinnage, R. 2013. Phylogenetic diversity of plantsalters the effect of species richness on invertebrateherbivory. PeerJ 1:e93.
Dormann, C. F., J. Frund, N. Bluthgen, and B. Gruber.2009. Indices, graphs and null models: analyzingbipartite ecological networks. Open Ecology Jour-nal 2:7–24.
Ebeling, A., A. M. Klein, W. W. Weisser, and T.Tscharntke. 2012. Multitrophic effects of experi-mental changes in plant diversity on cavity-nestingbees, wasps, and their parasitoids. Oecologia169:453–465.
Fabian, Y., N. Sandau, O. Bruggisser, P. Kehrli, A. Aebi,R. P. Rohr, R. E. Naisbit, and L.-F. Bersier. 2013. Theimportance of landscape and spatial structure forhymenopteran-based food webs in an agro-ecosys-
tem. Journal of Animal Ecology 82:1203–1214.Fabian, Y., N. Sandau, O. Bruggisser, P. Kehrli, A. Aebi,
R. P. Rohr, R. E. Naisbit, and L.-F. Bersier. 2012.Diversity protects plant communities against gen-eralist molluscan herbivores. Ecology and Evolu-tion 2:2460–2473.
Fox, J., and S. Weisberg. 2011. An R companion toapplied regression. Second edition. SAGE, Thou-sand Oaks, California, USA.
Gathmann, A., and T. Tscharntke. 1997. Bees andwasps in the agricultural landscape: colonizationand augmentation in trap nests. Mitteilungen derDeutschen Gesellschaft fur Allgemeine und Ange-wandte Entomologie 11:91–94.
Gathmann, A., and T. Tscharntke. 1999. Landschafts-Bewertung mit Bienen und Wespen in Nisthilfen:Artenspektrum, Interaktionen und Bestimmungs-schlussel. Naturschutz und Landschaftspflege Ba-den-Wurttemberg 73:277–305.
Gunter, M. 2000. Establishment and care of perennialwildflower strips under specific conditions forarable farming in the Swiss midlands. Agrarokolo-gie 37:1–154.
Haaland, C., R. E. Naisbit, and L. F. Bersier. 2011. Sownwildflower strips for insect conservation: a review.Insect Conservation and Diversity 4:60–80.
Haddad, N. M., G. M. Crutsinger, K. Gross, J.Haarstad, J. M. H. Knops, and D. Tilman. 2009.Plant species loss decreases arthropod diversityand shifts trophic structure. Ecology Letters12:1029–1039.
Haddad, N. M., D. Tilman, J. Haarstad, M. Ritchie, andJ. M. H. Knops. 2001. Contrasting effects of plantrichness and composition on insect communities: Afield experiment. American Naturalist 158:17–35.
Hector, A. et al. 1999. Plant diversity and productivityexperiments in European grasslands. Science286:1123–1127.
Holzschuh, A., I. Steffan-Dewenter, and T. Tscharntke.2010. How do landscape composition and config-uration, organic farming and fallow strips affect thediversity of bees, wasps and their parasitoids?Journal of Animal Ecology 79:491–500.
Hooper, D. U. et al. 2005. Effects of biodiversity onecosystem functioning: A consensus of currentknowledge. Ecological Monographs 75:3–35.
Hooper, D. U., and P. M. Vitousek. 1997. The effects ofplant composition and diversity on ecosystemprocesses. Science 277:1302–1305.
Hutchinson, G. E. 1959. Homage to Santa Rosalia, orwhy are here so many kinds of animals? AmericanNaturalist 93:145–159.
Jost, L. 2006. Entropy and diversity. Oikos 113:363–375.Kleijn, D., et al. 2009. On the relationship between
farmland biodiversity and land-use intensity inEurope. Proceedings of the Royal Society B276:903–909.
v www.esajournals.org 15 February 2014 v Volume 5(2) v Article 18
FABIAN ET AL.

Knops, J. M. H., D. Tilman, N. M. Haddad, S. Naeem,C. E. Mitchell, J. Haarstad, M. E. Ritchie, K. M.Howe, P. B. Reich, E. Siemann, and J. Groth. 1999.Effects of plant species richness on invasiondynamics, disease outbreaks, insect abundancesand diversity. Ecology Letters 2:286–293.
Krewenka, K. M., A. Holzschuh, T. Tscharntke, andC. F. Dormann. 2011. Landscape elements aspotential barriers and corridors for bees, waspsand parasitoids. Biological Conservation 144:1816–1825.
Linsenmaier, W. 1997. Die Goldwespen der Schweiz.Veroffentlichungen des Naturmuseums, Luzern,Switzerland.
Nentwig, W. E. 2000. Streifenformige okologischeAusgleichsflachen in der Kulturlandschaft: Ackerk-rautstreifen, Buntbrachen, Feldrander. VerlagAgrarokologie, Bern, Switzerland.
Oksanen, J., F. G. Blanchet, R. Kindt, P. Legendre, P. R.Minchin, R. B. O’Hara, G. L. Simpson, P. Solymos,M. H. H. Stevens, and H. Wagner. 2011. vegan:community ecology package. R package version2.0-0.
Pearson, D. E. 2009. Invasive plant architecture alterstrophic interactions by changing predator abun-dance and behavior. Oecologia 159:549–558.
Perner, J., C. Wytrykush, A. Kahmen, N. Buchmann, I.Egerer, S. Creutzburg, N. Odat, V. Audorff, andW. W. Weisser. 2005. Effects of plant diversity, plantproductivity and habitat parameters on arthropodabundance in montane European grasslands. Ecog-raphy 28:429–442.
R Development Core Team. 2012. R: a language andenvironment for statistical computing. R Founda-tion for Statistical Computing, Vienna, Austria.
Root, R. B. 1973. The organisation of a plant-arthropodassociation in simple and diverse habitats: thefauna of collards, Brassica olacea. Ecological Mono-graphs 43:95–124.
Roscher, C., J. Schumacher, J. Baade, W. Wilcke, G.Gleixner, W. W. Weisser, B. Schmid, and E. D.Schulze. 2004. The role of biodiversity for elementcycling and trophic interactions: an experimentalapproach in a grassland community. Basic andApplied Ecology 5:107–121.
Schaffers, A. P., I. P. Raemakers, K. V. Sykora, andC. J. F. Ter Braak. 2008. Arthropod assemblages arebest predicted by plant species composition.Ecology 89:782–794.
Scherber, C. et al. 2010a. Bottom-up effects of plant
diversity on multitrophic interactions in a biodi-versity experiment. Nature 468:553–556.
Scherber, C., J. Heimann, G. Kohler, N. Mitschunas,and W. W. Weisser. 2010b. Functional identityversus species richness: herbivory resistance inplant communities. Oecologia 163:707–717.
Schmid-Egger, C. 2004. Bestimmungsschlussel fur diedeutschen Arten der solitaren Faltenwespen (Hy-menoptera: Eumeninae). Deutscher Jungendbundfur Naturbeobachtung, Hamburg, Germany.
Schmidt-Entling, M. H., and J. Dobeli. 2009. Sownwildflower areas to enhance spiders in arablefields. Agriculture Ecosystems and Environment133:19–22.
Schuldt, A., S. Both, H. Bruelheide, W. Hardtle, B.Schmid, H. Zhou, and T. Assmann. 2011. Predatordiversity and abundance provide little support forthe enemies hypothesis in forests of high treediversity. PLoS ONE 6(7):e22905.
Srivastava, D. and J. Lawton. 1998. Why moreproductive sites have more species: an experimen-tal test of theory using tree-hole communities.American Naturalist 152:210–229.
Tilman, D., P. B. Reich, J. Knops, D. Wedin, T. Mielke,and C. Lehman. 2001. Diversity and productivity ina long-term grassland experiment. Science 294:843–845.
Tscharntke, T., A. Gathmann, and I. Steffan-Dewenter.1998. Bioindication using trap-nesting bees andwasps and their natural enemies: communitystructure and interactions. Journal of AppliedEcology 35:708–719.
Tylianakis, J. M., T. Tscharntke, and O. T. Lewis. 2007.Habitat modification alters the structure of tropicalhost-parasitoid food webs. Nature 445:202–205.
Viketoft, M., J. Bengtsson, B. Sohlenius, M. P. Berg, O.Petchey, C. Palmborg, and K. Huss-Danell. 2009.Long-term effects of plant diversity and composi-tion on soil nematode communities in modelgrasslands. Ecology 90:90–99.
Westrich, P. 1989. Die Wildbienen Baden Wurttem-bergs. Eugen Ulmer Verlag, Stuttgart, Germany.
Wolf, H. 1972. Hymenoptera Pompilidae. InsectaHelvetica, Fauna 5. Schweizerischen Entomologi-schen Gesellschaft, Zurich, Switzerland.
Zuur, A. F., E. N. Ieno, N. Walker, A. A. Saveliev, andG. M. Smith. 2009. Mixed effects models andextensions in ecology with R. Springer, New York,New York, USA.
v www.esajournals.org 16 February 2014 v Volume 5(2) v Article 18
FABIAN ET AL.

SUPPLEMENTAL MATERIAL
APPENDIX
Table A1. Bee and wasp species in 117 trap nests, their
number of occupied brood cells, and the number of
cells attacked by their natural enemy species.
Abbreviations are: Code, species code used in Fig.
5; p/n, pollen and/or nectar; a, aphids; h, herbivores;
s, spiders; na, not available; No. cb, number of cells
built; No. ca, number of cells attacked.
Code SpeciesLarvalfood
No.cb
No.ca
Apidae1 Hylaeus communis p/n 28 02 Hylaeus difformis p/n 7 03 Hylaeus sp. p/n 212 134 Chelostoma florisomne p/n 76 85 Heriades truncorum p/n 1094 1396 Megachile centuncularis p/n 78 67 Megachile ericetorum p/n 44 108 Megachile versicolor p/n 202 279 Megachile sp. p/n 200 7910 Osmia adunca p/n 100 211 Osmia bicornis p/n 6666 142712 Osmia brevicornis p/n 21 413 Osmia caerulescens p/n 332 11814 Osmia gallarum p/n 4 415 Osmia caerulescens/gallarum p/n 43 3016 Osmia cornuta p/n 2 017 Osmia sp. p/n 11 518 Apiformes sp. p/n 322 42
Eumenidae19 Alastor atrops h 1 020 Allodynerus rossii h 55 521 Ancistrocerus antilope h 54 022 Ancistrocerus gazella h 331 2623 Ancistrocerus nigricornis h 931 2124 Ancistrocerus parietinus h 11 025 Ancistrocerus sp. h 11 026 Euodynerus notatus h 5 227 Gymnomerus laevipes h 18 028 Microdynerus timidus h 60 029 Symmorphus gracilis h 18 030 Eumenidae sp. h 298 160
Sphecidae31 Ectemius continuus h 1 032 Isodontia mexicana h 31 633 Nitela sp. h 5 034 Sphecidae sp. a 13 035 Passaloecus borealis a 70 036 Passaloecus gracilis a 61 037 Passaloecus insignis a 43 538 Passaloecus corniger a 11 039 Passaloecus vandeli a 3 040 Passaloecus sp. a 70 641 Pemphredon lugubris a 20 142 Pemphredon sp. a 16 543 Psenulus pallipes a 22 244 Psenulus sp. a 2 045 Trypoxylon figulus s 1659 42146 Trypoxylon sp. s 73 18
Pompilidae47 Agenioides cinctellus s 19 548 Auplopus carbonarius s 3 050 Dipogon subintermedius s 5 0
Table A1. Continued.
Code SpeciesLarvalfood
No.cb
No.ca
49 Dipogon sp. s 6 2Others
52 Symphyta sp. na 6 455 undetermined host na 392 6256 Host Braconidae 1 na 12 1257 Host Braconidae 2 na 17 17Total no.
brood cells13795 2695
v www.esajournals.org 17 February 2014 v Volume 5(2) v Article 18
FABIAN ET AL.
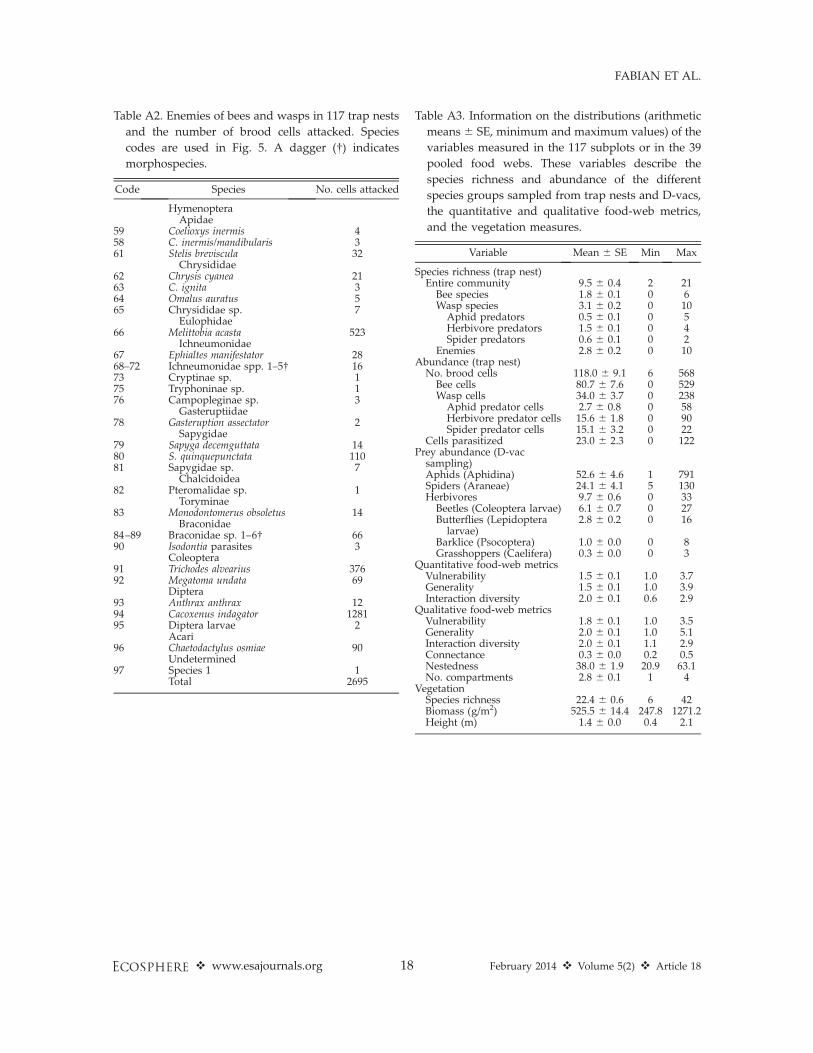
Table A3. Information on the distributions (arithmetic
means 6 SE, minimum and maximum values) of the
variables measured in the 117 subplots or in the 39
pooled food webs. These variables describe the
species richness and abundance of the different
species groups sampled from trap nests and D-vacs,
the quantitative and qualitative food-web metrics,
and the vegetation measures.
Variable Mean 6 SE Min Max
Species richness (trap nest)Entire community 9.5 6 0.4 2 21Bee species 1.8 6 0.1 0 6Wasp species 3.1 6 0.2 0 10
Aphid predators 0.5 6 0.1 0 5Herbivore predators 1.5 6 0.1 0 4Spider predators 0.6 6 0.1 0 2
Enemies 2.8 6 0.2 0 10Abundance (trap nest)No. brood cells 118.0 6 9.1 6 568Bee cells 80.7 6 7.6 0 529Wasp cells 34.0 6 3.7 0 238
Aphid predator cells 2.7 6 0.8 0 58Herbivore predator cells 15.6 6 1.8 0 90Spider predator cells 15.1 6 3.2 0 22
Cells parasitized 23.0 6 2.3 0 122Prey abundance (D-vac
sampling)Aphids (Aphidina) 52.6 6 4.6 1 791Spiders (Araneae) 24.1 6 4.1 5 130Herbivores 9.7 6 0.6 0 33Beetles (Coleoptera larvae) 6.1 6 0.7 0 27Butterflies (Lepidoptera
larvae)2.8 6 0.2 0 16
Barklice (Psocoptera) 1.0 6 0.0 0 8Grasshoppers (Caelifera) 0.3 6 0.0 0 3
Quantitative food-web metricsVulnerability 1.5 6 0.1 1.0 3.7Generality 1.5 6 0.1 1.0 3.9Interaction diversity 2.0 6 0.1 0.6 2.9
Qualitative food-web metricsVulnerability 1.8 6 0.1 1.0 3.5Generality 2.0 6 0.1 1.0 5.1Interaction diversity 2.0 6 0.1 1.1 2.9Connectance 0.3 6 0.0 0.2 0.5Nestedness 38.0 6 1.9 20.9 63.1No. compartments 2.8 6 0.1 1 4
VegetationSpecies richness 22.4 6 0.6 6 42Biomass (g/m2) 525.5 6 14.4 247.8 1271.2Height (m) 1.4 6 0.0 0.4 2.1
Table A2. Enemies of bees and wasps in 117 trap nests
and the number of brood cells attacked. Species
codes are used in Fig. 5. A dagger (�) indicates
morphospecies.
Code Species No. cells attacked
HymenopteraApidae
59 Coelioxys inermis 458 C. inermis/mandibularis 361 Stelis breviscula 32
Chrysididae62 Chrysis cyanea 2163 C. ignita 364 Omalus auratus 565 Chrysididae sp. 7
Eulophidae66 Melittobia acasta 523
Ichneumonidae67 Ephialtes manifestator 2868–72 Ichneumonidae spp. 1–5� 1673 Cryptinae sp. 175 Tryphoninae sp. 176 Campopleginae sp. 3
Gasteruptiidae78 Gasteruption assectator 2
Sapygidae79 Sapyga decemguttata 1480 S. quinquepunctata 11081 Sapygidae sp. 7
Chalcidoidea82 Pteromalidae sp. 1
Toryminae83 Monodontomerus obsoletus 14
Braconidae84–89 Braconidae sp. 1–6� 6690 Isodontia parasites 3
Coleoptera91 Trichodes alvearius 37692 Megatoma undata 69
Diptera93 Anthrax anthrax 1294 Cacoxenus indagator 128195 Diptera larvae 2
Acari96 Chaetodactylus osmiae 90
Undetermined97 Species 1 1
Total 2695
v www.esajournals.org 18 February 2014 v Volume 5(2) v Article 18
FABIAN ET AL.
Copyright © 2022 FDOKUMEN