Uncertainty Measures and Limiting Distributions for Filament Estimation
Upload
independentCategory
view
1download
0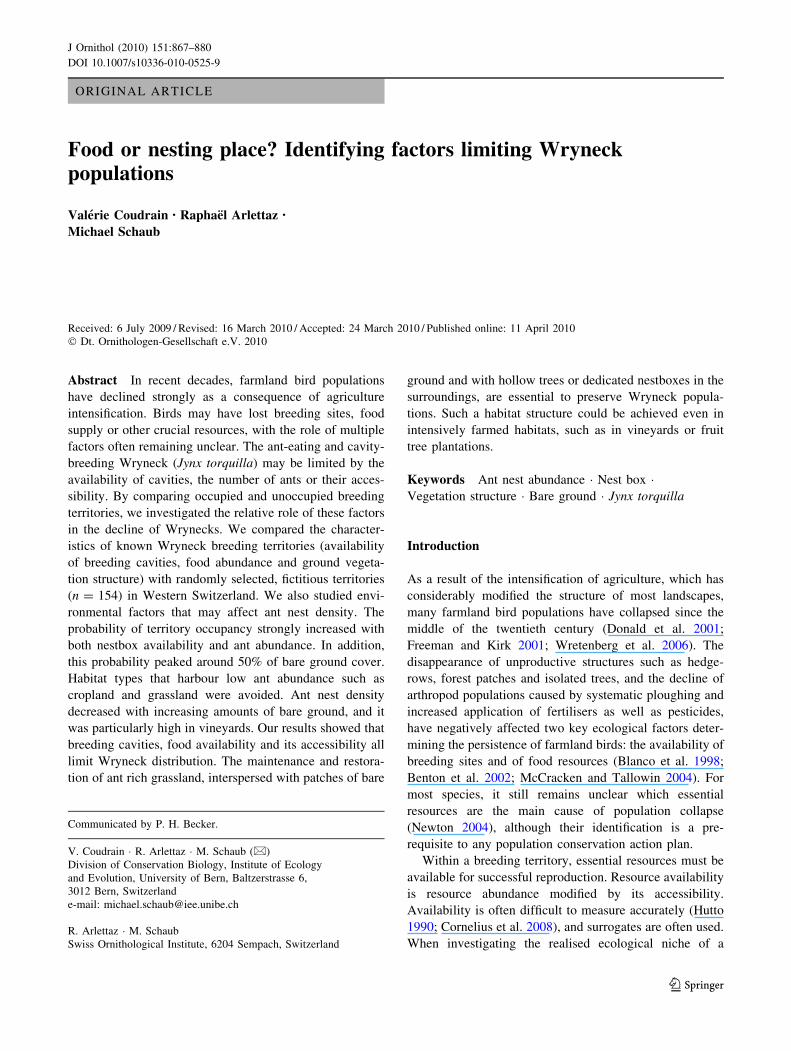
ORIGINAL ARTICLE
Food or nesting place? Identifying factors limiting Wryneckpopulations
Valerie Coudrain • Raphael Arlettaz •
Michael Schaub
Received: 6 July 2009 / Revised: 16 March 2010 / Accepted: 24 March 2010 / Published online: 11 April 2010
� Dt. Ornithologen-Gesellschaft e.V. 2010
Abstract In recent decades, farmland bird populations
have declined strongly as a consequence of agriculture
intensification. Birds may have lost breeding sites, food
supply or other crucial resources, with the role of multiple
factors often remaining unclear. The ant-eating and cavity-
breeding Wryneck (Jynx torquilla) may be limited by the
availability of cavities, the number of ants or their acces-
sibility. By comparing occupied and unoccupied breeding
territories, we investigated the relative role of these factors
in the decline of Wrynecks. We compared the character-
istics of known Wryneck breeding territories (availability
of breeding cavities, food abundance and ground vegeta-
tion structure) with randomly selected, fictitious territories
(n = 154) in Western Switzerland. We also studied envi-
ronmental factors that may affect ant nest density. The
probability of territory occupancy strongly increased with
both nestbox availability and ant abundance. In addition,
this probability peaked around 50% of bare ground cover.
Habitat types that harbour low ant abundance such as
cropland and grassland were avoided. Ant nest density
decreased with increasing amounts of bare ground, and it
was particularly high in vineyards. Our results showed that
breeding cavities, food availability and its accessibility all
limit Wryneck distribution. The maintenance and restora-
tion of ant rich grassland, interspersed with patches of bare
ground and with hollow trees or dedicated nestboxes in the
surroundings, are essential to preserve Wryneck popula-
tions. Such a habitat structure could be achieved even in
intensively farmed habitats, such as in vineyards or fruit
tree plantations.
Keywords Ant nest abundance � Nest box �Vegetation structure � Bare ground � Jynx torquilla
Introduction
As a result of the intensification of agriculture, which has
considerably modified the structure of most landscapes,
many farmland bird populations have collapsed since the
middle of the twentieth century (Donald et al. 2001;
Freeman and Kirk 2001; Wretenberg et al. 2006). The
disappearance of unproductive structures such as hedge-
rows, forest patches and isolated trees, and the decline of
arthropod populations caused by systematic ploughing and
increased application of fertilisers as well as pesticides,
have negatively affected two key ecological factors deter-
mining the persistence of farmland birds: the availability of
breeding sites and of food resources (Blanco et al. 1998;
Benton et al. 2002; McCracken and Tallowin 2004). For
most species, it still remains unclear which essential
resources are the main cause of population collapse
(Newton 2004), although their identification is a pre-
requisite to any population conservation action plan.
Within a breeding territory, essential resources must be
available for successful reproduction. Resource availability
is resource abundance modified by its accessibility.
Availability is often difficult to measure accurately (Hutto
1990; Cornelius et al. 2008), and surrogates are often used.
When investigating the realised ecological niche of a
Communicated by P. H. Becker.
V. Coudrain � R. Arlettaz � M. Schaub (&)
Division of Conservation Biology, Institute of Ecology
and Evolution, University of Bern, Baltzerstrasse 6,
3012 Bern, Switzerland
e-mail: [email protected]
R. Arlettaz � M. Schaub
Swiss Ornithological Institute, 6204 Sempach, Switzerland
123
J Ornithol (2010) 151:867–880
DOI 10.1007/s10336-010-0525-9
species in a given context, it is essential to understand the
subtle interplay between food abundance and habitat
structure because the latter may largely determine food
accessibility, i.e. its actual availability. Recognising these
forces directing resource exploitation patterns is crucial for
developing corrective measures to conserve and restore
populations of endangered species.
Here, we study the habitat requirements of Wrynecks
(Jynx torquilla), a small migratory woodpecker. The
Wryneck is a secondary cavity breeder that forages
essentially on ground-dwelling ants taken directly from
their nests (Cramp 1985; Freitag 1996, 1998). It inhabits
different kinds of semi-open habitats such as orchards,
parks, alluvial woods, open pine forests or vineyards,
provided that the two main resources, breeding cavities and
ground-dwelling ants, are available (Mermod et al. 2009).
Wrynecks have undergone a strong decline in Europe
(Tomialojc 1994), with habitat loss or degradation men-
tioned as the main causes (Holzinger 1987).
Trees are an important component of Wryneck territo-
ries. Firstly, they can contain natural cavities, offering
breeding opportunities; secondly, they are used for perch
hunting, a typical foraging technique of Wrynecks (Cramp
1985; Bitz and Rohe 1993; Freitag 1998). With the inten-
sification of agriculture, large trees have been systemati-
cally removed, and high-stem orchards, a traditional habitat
of Wrynecks in many areas (Holzinger 1987; Cramp 1985),
have been widely eradicated. The decline of large trees in
farmland can therefore be seen as a major factor of decline.
Ground-dwelling ants are the main prey of Wrynecks.
Their availability to Wrynecks is determined by their
abundance modified by their accessibility. Ant brood (lar-
vae and pupae) is especially important because it consti-
tutes the main resource for the nestlings (Freitag 1998). As
thermophilic organisms that build long-lived sedentary
nests, ground-dwelling ants rely generally on warm and
stable soil surfaces. They are thus sensitive to changes and
disturbances in the uppermost layer of the soil (Folgarait
1998; Kaspari 2000). Intensive agricultural practices can
therefore affect ant colonies directly by mechanical soil
disturbance and indirectly by fertilisation that increases
vegetation density, thus reducing soil surface temperature.
Both can result in a considerable decline of ant nest
abundance (Folgarait 1998), potentially negatively affect-
ing Wryneck populations. However, although the effect of
land management on ant species diversity has raised much
interest (Peck et al. 1998; Bromham et al. 1999; Bestel-
meyer and Wiens 2001; Underwood and Fischer 2006), its
effects on ant abundance have been poorly investigated.
Detection of, and access to, food resources is an
important issue for many ground-foraging birds in inten-
sive farmland (Wilson et al. 2005). Whilst Wrynecks are
tolerant to the presence of tall sward, the density of
vegetation cover is a major determinant of foraging site
selection: Wrynecks prefer to feed at places with a vege-
tation cover lesser than 50% (Kervyn and Xhardez 2006;
Weisshaupt 2007). The systematic fertilisation of grassland
by modern farming practices inexorably leads to a denser
sward. Even though a dense ground vegetation cover does
not necessarily induce a decrease in ant abundance, ant
detectability and accessibility may be seriously affected.
It is largely unknown which factors have caused the
large-scale population decline observed in the European
Wryneck. We investigated in parallel the three main factors
mentioned above: decline in the offer of breeding cavities;
decline of ant abundance; and impeded access and
detectability of ant nests. We compared habitat features
and ant occurrence in known breeding territories, and
randomly selected sites currently not occupied by Wry-
necks, with the aim of identifying the relative contribution
of the above factors. Additionally, we studied abundance of
ants in various habitat types and determined environmental
factors affecting their nest density and size. This infor-
mation will be useful for developing sound conservation
action plans for this regionally endangered bird species.
Methods
The study was conducted from May to August 2008 in
three viticultural regions of Switzerland where Wrynecks
still occur in reasonable numbers. The first two regions
(Neuchatel, 47.0�N, 6.8�E, 450 m asl and La Cote, 46.5�N,
6.5�E, 510 m asl) are situated along the northern banks of
the Lakes Neuchatel and Geneva, respectively. The third
region (Geneva, 46.2�N, 6.0�E, 370 m asl) is located in the
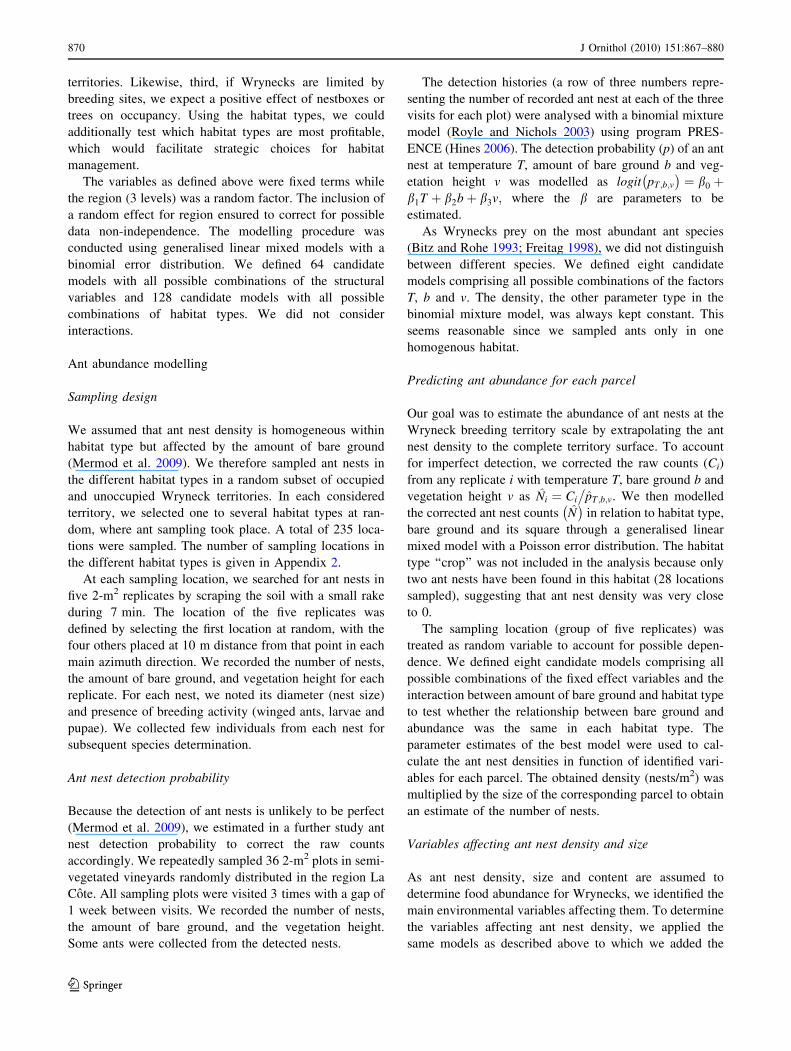
countryside west of the city of Geneva (Fig. 1). All
regions, characterised by the proximate presence of a lake,
Fig. 1 Location of the three study regions within Switzerland. NENeuchatel, VD La Cote, GE Geneve
868 J Ornithol (2010) 151:867–880
123
harbour a favourable climate allowing wine production
and, especially in La Cote, fruit tree plantations. The study
area is therefore intensively managed farmland. Measure-
ments of temperatures (5 cm above ground) were obtained
from the three nearest meteorological stations (Neuchatel,
Pully, Geneve-Cointrin; MeteoSchweiz).
Habitat requirements of Wrynecks
Sampling design
By comparing currently occupied Wryneck territories with
randomly selected, non-occupied sites, we aimed to char-
acterise habitat preferences of Wrynecks. Based on average
home-range sizes as revealed by radio tracking (Weiss-
haupt 2007), territories were defined as a circle with 111 m
radius around a point location (nesting site in case of
occupied territories). Actually occupied territories were
obtained from nestbox surveys (n = 4 in Neuchatel,
n = 19 in La Cote) and casual observations during the
breeding period (n = 4 in Neuchatel, n = 10 in La Cote,
n = 8 in Geneva) from the years 2006 and 2007, as well as
from observations collected during territory mapping in
2008 (see below). To determine non-occupied sites, we
generated for each region points at random (n = 31 in
Neuchatel, n = 52 in La Cote, n = 36 in Geneva) within
the minimal convex polygon defined by all occupied sites
in a given region. We excluded forests, lakes and urbanised
areas as random locations, because these are unsuitable
habitats.
In each site initially classified as unoccupied, we
checked for the presence of Wrynecks in May and June
2008 by playing back their song twice during 1 min.
Wrynecks react very strongly to songs of conspecifics,
rendering the playback of their songs a reliable method to
assess territory occupancy. The random sites in which the
presence of the Wryneck was actually assessed were
reclassified as ‘‘occupied territories’’ (n = 7 in Neuchatel,
n = 11 in La Cote). Thus, we compared territories that
have been occupied at least once from 2006 to 2008 with
randomly selected sites that were not occupied in 2008.
Hereafter, we name territories and sites as occupied and
unoccupied territories, respectively. In total, the study is
based on 154 territories (53 occupied, 101 unoccupied; 39
in Neuchatel, 71 in La Cote, 44 in Geneva).
Habitat mapping
We mapped habitats within all territories at the scale of
parcels (fields with a given culture type that are separated
from any other culture types) with the aid of geo-refer-
enced aerial photographs. This ensured accurate mapping.
We allocated all parcels to one of seven habitat types (fruit
tree plantation, semi-vegetated vineyard, non-vegetated
vineyard, crop, meadow, pasture, and lawn; see Appendix 1
for their definition) and recorded the amount of bare
ground and vegetation height in each parcel. A territory
was thus composed of a number of parcels, each parcel
being defined by a habitat type, an estimated vegetation
height and an estimated amount of bare ground. In several
freshly cut meadows, identification of intensity of man-
agement was not possible. As a consequence, categories for
meadow management intensity were only considered for
the modelling of ant nest abundance. We also noted the
number of nestboxes and trees (diameter at breast height
[20 cm) outside forests. Habitat heterogeneity has gen-
erally a positive effect on farmland biodiversity (Benton
et al. 2003); it also plays a major role in Wryneck habitat
selection (Mermod et al. 2009). We defined heterogeneity
as the number of parcels within a territory. Although
Wrynecks do not occur in dense forests, they may use trees
along forest edges or in hedges to breed. As hedges and
forest edges are often more extensively managed than
nearby farmland, they may provide good foraging oppor-
tunities (Poeplau 2005). We accounted for this possibility
by including the variable ‘‘edge length’’, which combines
the total length of both forest border and hedges within a
territory. Field maps were digitised and the size of the
parcels was measured in ArcMap (ArcGIS Version 9.2).
Food resources
Our goal was to get an estimate of the density of ant nests
for each territory in order to test whether food supply was a
limiting factor. We estimated habitat-specific ant densities
and extrapolated this information across habitat types for
the whole territory.
Statistical analyses
To compare occupied with unoccupied territories, we
separately analysed two sets of explanatory variables. The
first set included structural variables (amount of bare
ground and its square, number of ant nests, edge length,
heterogeneity, number of nestboxes and trees). The second
set of variables contained the proportion of the seven dif-
ferent habitat types within the territories. We performed
two separate analyses due to the different nature of the
variables and because of some overlap in the information
embedded by the two variable sets (habitat type already
contains information about habitat structure).
Using the structural variables, we could test our main
hypotheses. First, if food resources limit Wryneck distri-
bution we expect an effect of ant nest numbers on occu-
pancy. Second, if access to food limits Wryneck distribution
we expect a higher amount of bare ground in occupied
J Ornithol (2010) 151:867–880 869
123
territories. Likewise, third, if Wrynecks are limited by
breeding sites, we expect a positive effect of nestboxes or
trees on occupancy. Using the habitat types, we could
additionally test which habitat types are most profitable,
which would facilitate strategic choices for habitat
management.
The variables as defined above were fixed terms while
the region (3 levels) was a random factor. The inclusion of
a random effect for region ensured to correct for possible
data non-independence. The modelling procedure was
conducted using generalised linear mixed models with a
binomial error distribution. We defined 64 candidate
models with all possible combinations of the structural
variables and 128 candidate models with all possible
combinations of habitat types. We did not consider
interactions.
Ant abundance modelling
Sampling design
We assumed that ant nest density is homogeneous within
habitat type but affected by the amount of bare ground
(Mermod et al. 2009). We therefore sampled ant nests in
the different habitat types in a random subset of occupied
and unoccupied Wryneck territories. In each considered
territory, we selected one to several habitat types at ran-
dom, where ant sampling took place. A total of 235 loca-
tions were sampled. The number of sampling locations in
the different habitat types is given in Appendix 2.
At each sampling location, we searched for ant nests in
five 2-m2 replicates by scraping the soil with a small rake
during 7 min. The location of the five replicates was
defined by selecting the first location at random, with the
four others placed at 10 m distance from that point in each
main azimuth direction. We recorded the number of nests,
the amount of bare ground, and vegetation height for each
replicate. For each nest, we noted its diameter (nest size)
and presence of breeding activity (winged ants, larvae and
pupae). We collected few individuals from each nest for
subsequent species determination.
Ant nest detection probability
Because the detection of ant nests is unlikely to be perfect
(Mermod et al. 2009), we estimated in a further study ant
nest detection probability to correct the raw counts
accordingly. We repeatedly sampled 36 2-m2 plots in semi-
vegetated vineyards randomly distributed in the region La
Cote. All sampling plots were visited 3 times with a gap of
1 week between visits. We recorded the number of nests,
the amount of bare ground, and the vegetation height.
Some ants were collected from the detected nests.
The detection histories (a row of three numbers repre-
senting the number of recorded ant nest at each of the three
visits for each plot) were analysed with a binomial mixture
model (Royle and Nichols 2003) using program PRES-
ENCE (Hines 2006). The detection probability (p) of an ant
nest at temperature T, amount of bare ground b and veg-
etation height v was modelled as logit pT ;b;v
� �¼ b0 þ
b1T þ b2bþ b3v; where the b are parameters to be
estimated.
As Wrynecks prey on the most abundant ant species
(Bitz and Rohe 1993; Freitag 1998), we did not distinguish
between different species. We defined eight candidate
models comprising all possible combinations of the factors
T, b and v. The density, the other parameter type in the
binomial mixture model, was always kept constant. This
seems reasonable since we sampled ants only in one
homogenous habitat.
Predicting ant abundance for each parcel
Our goal was to estimate the abundance of ant nests at the
Wryneck breeding territory scale by extrapolating the ant
nest density to the complete territory surface. To account
for imperfect detection, we corrected the raw counts (Ci)
from any replicate i with temperature T, bare ground b and
vegetation height v as Ni ¼ Ci
�pT ;b;v. We then modelled
the corrected ant nest counts N� �
in relation to habitat type,
bare ground and its square through a generalised linear
mixed model with a Poisson error distribution. The habitat
type ‘‘crop’’ was not included in the analysis because only
two ant nests have been found in this habitat (28 locations
sampled), suggesting that ant nest density was very close
to 0.
The sampling location (group of five replicates) was
treated as random variable to account for possible depen-
dence. We defined eight candidate models comprising all
possible combinations of the fixed effect variables and the
interaction between amount of bare ground and habitat type
to test whether the relationship between bare ground and
abundance was the same in each habitat type. The
parameter estimates of the best model were used to cal-
culate the ant nest densities in function of identified vari-
ables for each parcel. The obtained density (nests/m2) was
multiplied by the size of the corresponding parcel to obtain
an estimate of the number of nests.
Variables affecting ant nest density and size
As ant nest density, size and content are assumed to
determine food abundance for Wrynecks, we identified the
main environmental variables affecting them. To determine
the variables affecting ant nest density, we applied the
same models as described above to which we added the
870 J Ornithol (2010) 151:867–880
123
fixed variable ‘‘Wryneck presence’’ that indicates whether
the sampling location was within an occupied or unoccu-
pied territory. This allowed testing in addition whether ant
nest densities were consistently higher where Wrynecks
occurred. In total, we formulated 19 candidate models
comprising all possible combinations of the fixed effect
variables and the interaction between bare ground and
habitat type, and between Wryneck presence and habitat
type.
To assess the potential impact of grassland management
on ant nest density, we modelled ant nest density in relation
to meadow type, where the latter could be accurately
determined. As fixed effect variables, we included meadow
type, amount of bare ground and its square, and we treated
sampling plots as random factor. We defined six candidate
models comprising all possible combinations of the fixed
effect variables.
To analyse the relationship between ant nest size and
environmental variables, we used generalised linear mixed
models with a normal error distribution. As fixed variables
we included amount of bare ground, habitat type, temper-
ature and its square. Temperature was included because
ants are expected to move deeper into the soil at low or
very high temperatures (Freitag 1998), resulting in appar-
ent smaller nests. We considered the same habitat types as
for ant nest density modelling but could also include non-
vegetated vineyards, because the sample size for this
habitat type was large enough. To account for possible data
interdependence of nests close to each other, we considered
replicates nested in sampling locations as random vari-
ables. We defined 14 candidate models comprising all
possible combinations of the fixed effect variables.
As ant brood is an energy-rich resource for nestlings, we
performed a regression analysis between the presence of
ant brood (presence of new queens, larvae or pupae in the
nest) and the size of the nests using generalised linear
mixed models with a binomial error distribution. The ant
species was included as a random factor.
Ant species determination
The collected ants were inspected with a binocular
microscope. The determination was carried out to the
species level or to the family level if uncertainty was too
high, using the identification keys of Della Santa (1994)
and Seifert (1996).
Model selection and predictions
For all modelling procedures described above, the candi-
date models were ranked according to their AIC (Aikaike’s
Information Criterion). The AIC is composed of the model
deviance and the number of estimated parameters and thus
allows ranking different models according to the best
compromise between precision and bias (Burnham and
Anderson 2002). Since there was uncertainty in model
selection, we considered models within DAIC \ 2, and
averaged their predictions using standardised AIC weights.
Predictions and confidence intervals from single models
were obtained with non-parametric bootstrapping (1,000
replicates). All modelling procedures were conducted in R
2.7.1 with function (lmer) (R Development Core Team).
Results
Ant abundance modelling
Ant diversity
We detected 2,101 ant nests belonging to eight species.
Lasius niger was in all regions the most abundant species
(38.9%, n = 818). Solenopsis fugax (21%, n = 442),
Tetramorium caespitum (18.6%, n = 391) and Lasius
flavus (11.1%, n = 234) were also common and widely
distributed. Myrmica spp. (6.1%, n = 128), Tapinoma
erraticum (2.2%, n = 47), Formica spp. (1.7%, n = 36),
Aphaenogaster subterraneae (0.1%, n = 2), Lasius alienus
(0.1%, n = 2) and Ponera coerctata (\0.1%, n = 1) were
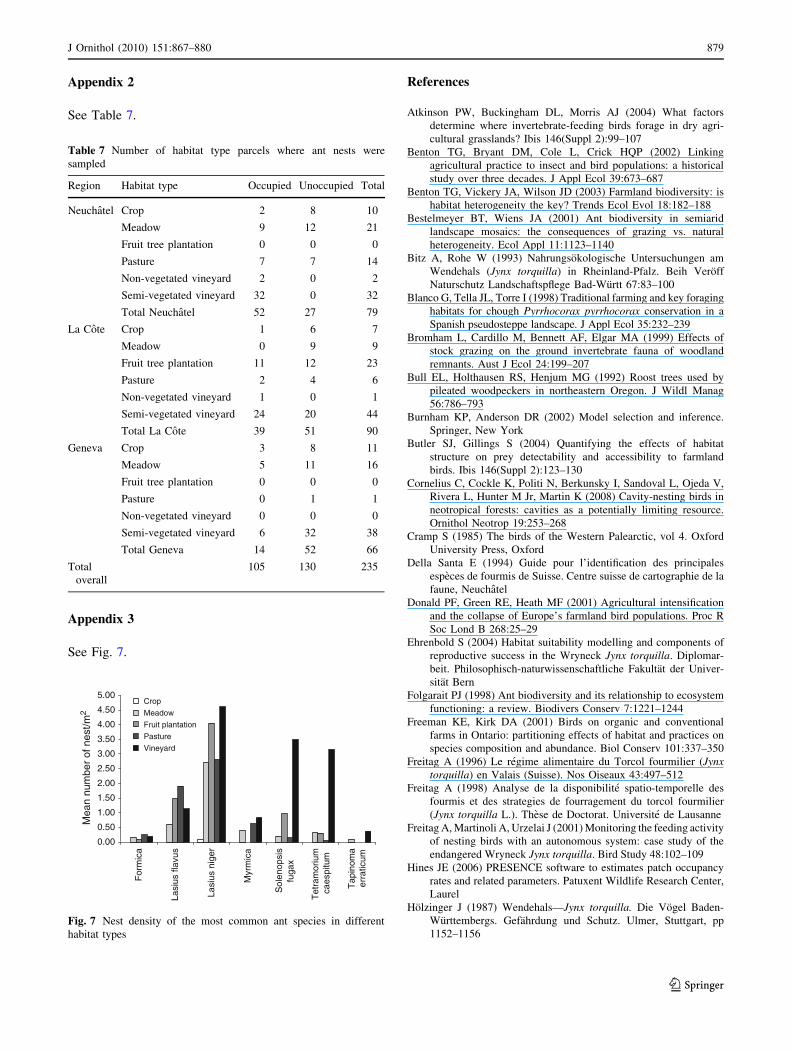
all relatively rare. The nest density of the more common
ant species in the different habitat types is given in
Appendix 3.
The 442 nests belonging to Solenopsis fugax were
excluded from further modelling procedures because this
tiny ant is not part of the Wryneck’s diet (Freitag 1998).
Modelling detection probability
Temperature was the main factor influencing ant nest
detection probability, followed by the amount of bare
ground. Vegetation height had hardly an effect (Table 1).
Detection probability increased with increasing tempera-
ture and amount of bare ground. Since vegetation height
was not important, we estimated detection probability
pT ;b
� �using only the parameter estimates of temperature
and bare ground logit pT ;b
� �¼ 0:3749þ 0:1605 � Tþ
�
0:0771 � bÞ:
Relationship between ant abundance and environmental
variables
According to the AIC ranking, ant nest density was best
explained by the model including amount of bare ground,
habitat type and presence/absence of Wrynecks in the ter-
ritory (Table 2). Uncertainty existed whether or not the
interaction of habitat and bare ground should be included.
J Ornithol (2010) 151:867–880 871
123
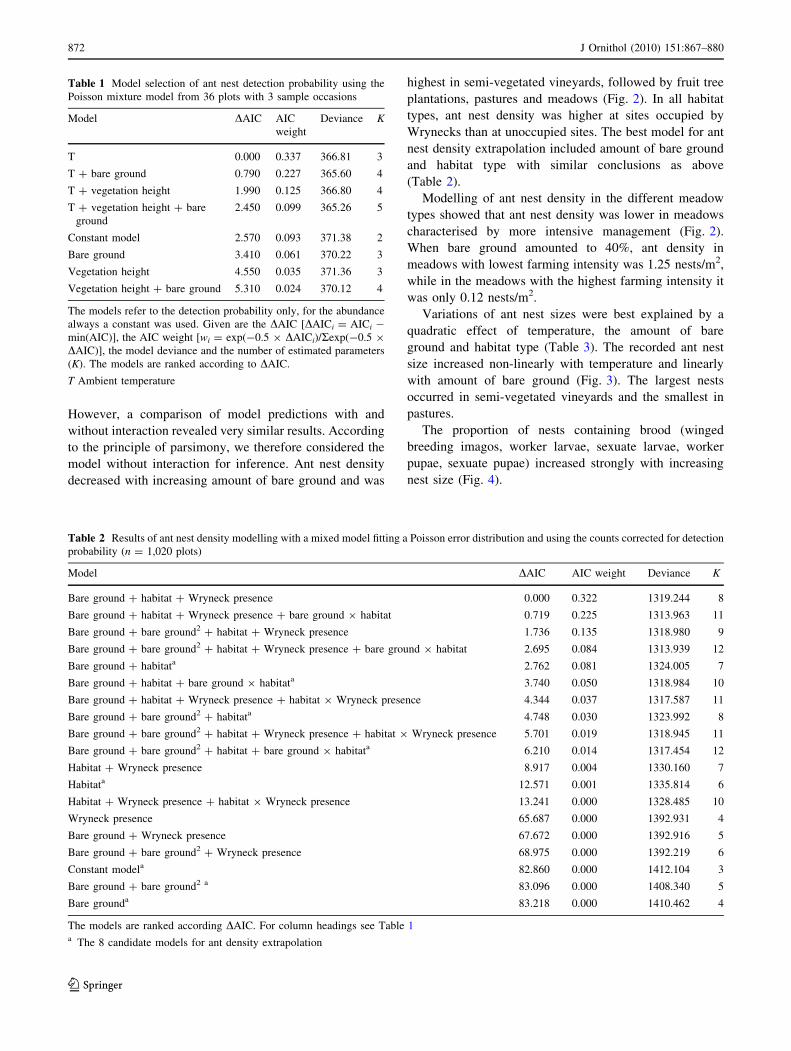
However, a comparison of model predictions with and
without interaction revealed very similar results. According
to the principle of parsimony, we therefore considered the
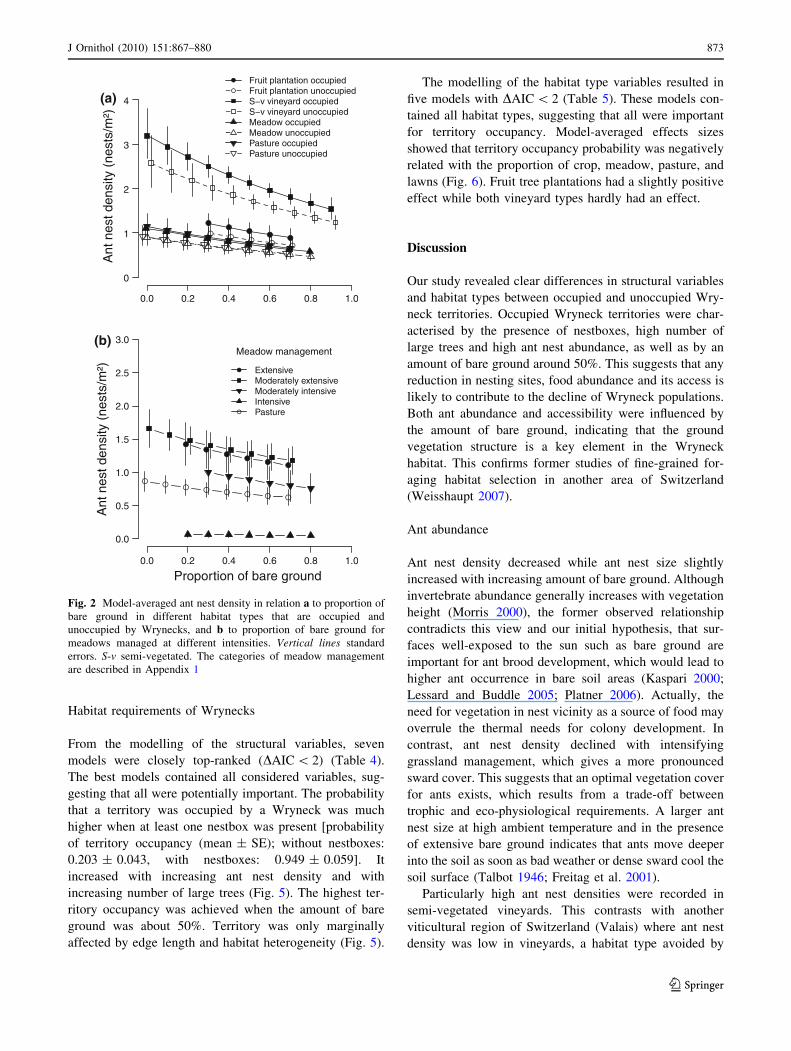
model without interaction for inference. Ant nest density
decreased with increasing amount of bare ground and was
highest in semi-vegetated vineyards, followed by fruit tree
plantations, pastures and meadows (Fig. 2). In all habitat
types, ant nest density was higher at sites occupied by
Wrynecks than at unoccupied sites. The best model for ant
nest density extrapolation included amount of bare ground
and habitat type with similar conclusions as above
(Table 2).
Modelling of ant nest density in the different meadow
types showed that ant nest density was lower in meadows
characterised by more intensive management (Fig. 2).
When bare ground amounted to 40%, ant density in
meadows with lowest farming intensity was 1.25 nests/m2,
while in the meadows with the highest farming intensity it
was only 0.12 nests/m2.
Variations of ant nest sizes were best explained by a
quadratic effect of temperature, the amount of bare
ground and habitat type (Table 3). The recorded ant nest
size increased non-linearly with temperature and linearly
with amount of bare ground (Fig. 3). The largest nests
occurred in semi-vegetated vineyards and the smallest in
pastures.
The proportion of nests containing brood (winged
breeding imagos, worker larvae, sexuate larvae, worker
pupae, sexuate pupae) increased strongly with increasing
nest size (Fig. 4).
Table 1 Model selection of ant nest detection probability using the
Poisson mixture model from 36 plots with 3 sample occasions
Model DAIC AIC
weight
Deviance K
T 0.000 0.337 366.81 3
T ? bare ground 0.790 0.227 365.60 4
T ? vegetation height 1.990 0.125 366.80 4
T ? vegetation height ? bare
ground
2.450 0.099 365.26 5
Constant model 2.570 0.093 371.38 2
Bare ground 3.410 0.061 370.22 3
Vegetation height 4.550 0.035 371.36 3
Vegetation height ? bare ground 5.310 0.024 370.12 4
The models refer to the detection probability only, for the abundance
always a constant was used. Given are the DAIC [DAICi = AICi -
min(AIC)], the AIC weight [wi = exp(-0.5 9 DAICi)/Rexp(-0.5 9
DAIC)], the model deviance and the number of estimated parameters
(K). The models are ranked according to DAIC.
T Ambient temperature
Table 2 Results of ant nest density modelling with a mixed model fitting a Poisson error distribution and using the counts corrected for detection
probability (n = 1,020 plots)
Model DAIC AIC weight Deviance K
Bare ground ? habitat ? Wryneck presence 0.000 0.322 1319.244 8
Bare ground ? habitat ? Wryneck presence ? bare ground 9 habitat 0.719 0.225 1313.963 11
Bare ground ? bare ground2 ? habitat ? Wryneck presence 1.736 0.135 1318.980 9
Bare ground ? bare ground2 ? habitat ? Wryneck presence ? bare ground 9 habitat 2.695 0.084 1313.939 12
Bare ground ? habitata 2.762 0.081 1324.005 7
Bare ground ? habitat ? bare ground 9 habitata 3.740 0.050 1318.984 10
Bare ground ? habitat ? Wryneck presence ? habitat 9 Wryneck presence 4.344 0.037 1317.587 11
Bare ground ? bare ground2 ? habitata 4.748 0.030 1323.992 8
Bare ground ? bare ground2 ? habitat ? Wryneck presence ? habitat 9 Wryneck presence 5.701 0.019 1318.945 11
Bare ground ? bare ground2 ? habitat ? bare ground 9 habitata 6.210 0.014 1317.454 12
Habitat ? Wryneck presence 8.917 0.004 1330.160 7
Habitata 12.571 0.001 1335.814 6
Habitat ? Wryneck presence ? habitat 9 Wryneck presence 13.241 0.000 1328.485 10
Wryneck presence 65.687 0.000 1392.931 4
Bare ground ? Wryneck presence 67.672 0.000 1392.916 5
Bare ground ? bare ground2 ? Wryneck presence 68.975 0.000 1392.219 6
Constant modela 82.860 0.000 1412.104 3
Bare ground ? bare ground2 a 83.096 0.000 1408.340 5
Bare grounda 83.218 0.000 1410.462 4
The models are ranked according DAIC. For column headings see Table 1a The 8 candidate models for ant density extrapolation
872 J Ornithol (2010) 151:867–880
123
Habitat requirements of Wrynecks
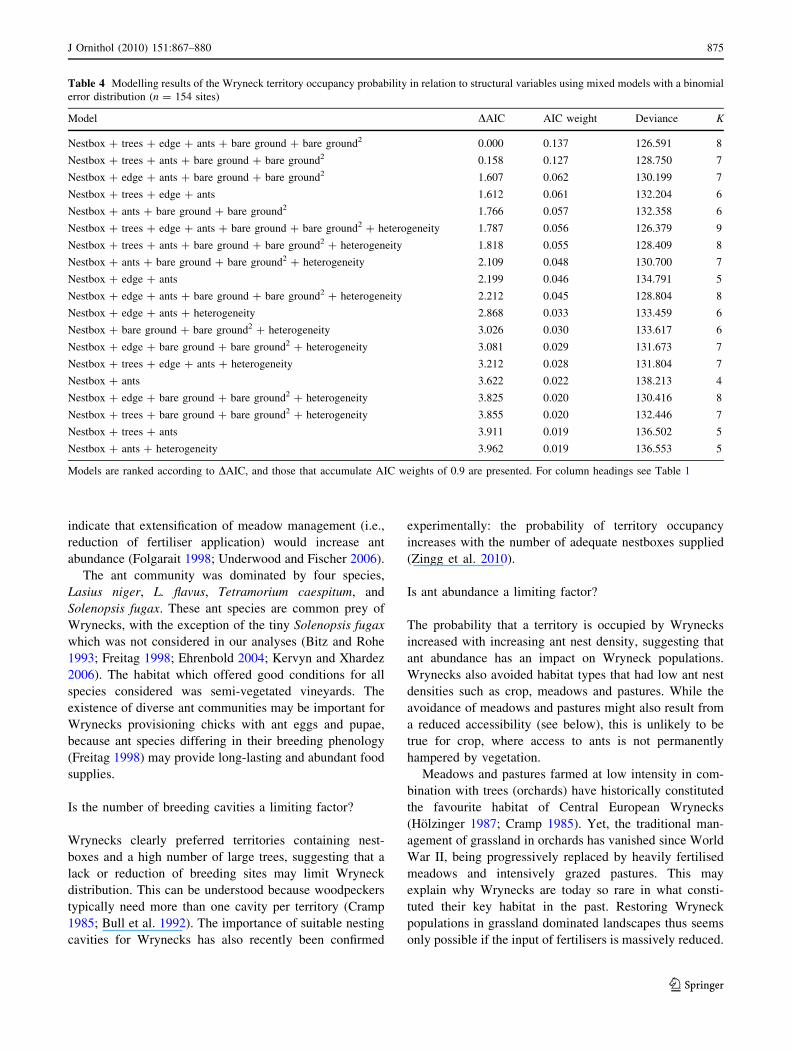
From the modelling of the structural variables, seven
models were closely top-ranked (DAIC \ 2) (Table 4).
The best models contained all considered variables, sug-
gesting that all were potentially important. The probability
that a territory was occupied by a Wryneck was much
higher when at least one nestbox was present [probability
of territory occupancy (mean ± SE); without nestboxes:
0.203 ± 0.043, with nestboxes: 0.949 ± 0.059]. It
increased with increasing ant nest density and with
increasing number of large trees (Fig. 5). The highest ter-
ritory occupancy was achieved when the amount of bare
ground was about 50%. Territory was only marginally
affected by edge length and habitat heterogeneity (Fig. 5).
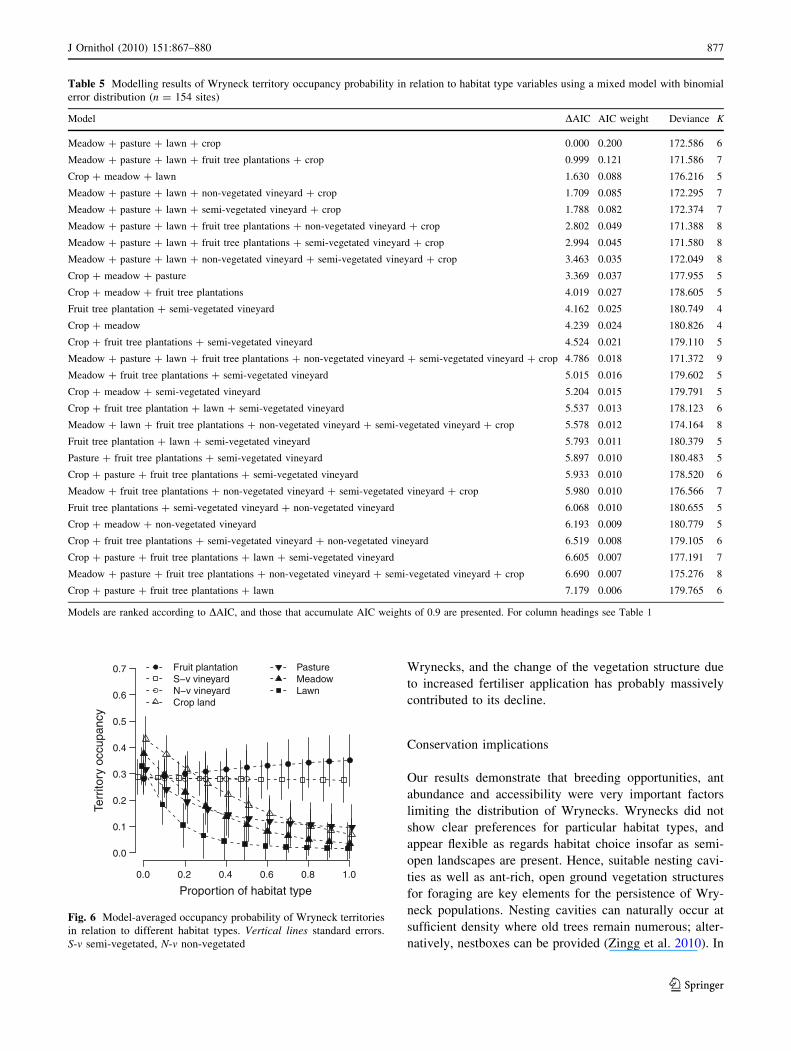
The modelling of the habitat type variables resulted in
five models with DAIC \ 2 (Table 5). These models con-
tained all habitat types, suggesting that all were important
for territory occupancy. Model-averaged effects sizes
showed that territory occupancy probability was negatively
related with the proportion of crop, meadow, pasture, and
lawns (Fig. 6). Fruit tree plantations had a slightly positive
effect while both vineyard types hardly had an effect.
Discussion
Our study revealed clear differences in structural variables
and habitat types between occupied and unoccupied Wry-
neck territories. Occupied Wryneck territories were char-
acterised by the presence of nestboxes, high number of
large trees and high ant nest abundance, as well as by an
amount of bare ground around 50%. This suggests that any
reduction in nesting sites, food abundance and its access is
likely to contribute to the decline of Wryneck populations.
Both ant abundance and accessibility were influenced by
the amount of bare ground, indicating that the ground
vegetation structure is a key element in the Wryneck
habitat. This confirms former studies of fine-grained for-
aging habitat selection in another area of Switzerland
(Weisshaupt 2007).
Ant abundance
Ant nest density decreased while ant nest size slightly
increased with increasing amount of bare ground. Although
invertebrate abundance generally increases with vegetation
height (Morris 2000), the former observed relationship
contradicts this view and our initial hypothesis, that sur-
faces well-exposed to the sun such as bare ground are
important for ant brood development, which would lead to
higher ant occurrence in bare soil areas (Kaspari 2000;
Lessard and Buddle 2005; Platner 2006). Actually, the
need for vegetation in nest vicinity as a source of food may
overrule the thermal needs for colony development. In
contrast, ant nest density declined with intensifying
grassland management, which gives a more pronounced
sward cover. This suggests that an optimal vegetation cover
for ants exists, which results from a trade-off between
trophic and eco-physiological requirements. A larger ant
nest size at high ambient temperature and in the presence
of extensive bare ground indicates that ants move deeper
into the soil as soon as bad weather or dense sward cool the
soil surface (Talbot 1946; Freitag et al. 2001).
Particularly high ant nest densities were recorded in
semi-vegetated vineyards. This contrasts with another
viticultural region of Switzerland (Valais) where ant nest
density was low in vineyards, a habitat type avoided by
(a)
(b)
Fig. 2 Model-averaged ant nest density in relation a to proportion of
bare ground in different habitat types that are occupied and
unoccupied by Wrynecks, and b to proportion of bare ground for
meadows managed at different intensities. Vertical lines standard
errors. S-v semi-vegetated. The categories of meadow management
are described in Appendix 1
J Ornithol (2010) 151:867–880 873
123

local Wrynecks (Freitag 1998; Mermod et al. 2009). We
see two reasons for this apparent geographic discrepancy.
First, soils are much more mineral (stony) in Valais. Sec-
ond, vineyards in Valais are still scarcely vegetated (\5%
of the total area), offering very little room for thriving ant
populations. Vineyards and fruit tree plantations thus rep-
resent suitable Wryneck habitat only if they are planted in
soft substrates and harbour a mix of vegetated and bare
strips under the vine and tree rows.
Ant abundance was low in meadows and pastures
compared to vineyards. However, ant nest densities dif-
fered according to the intensity of meadow management,
with highly fertilised meadows containing much lower ant
nest densities. Factors affecting ants in intensively man-
aged meadow have been little studied, yet our results
Table 3 Results of ant nest size
modelling using a mixed model
with normal error distribution
(n = 1,647 nests)
The models are ranked accordingto DAIC. For column headings seeTable 1
T Ambient temperature
Model DAIC AIC weight Deviance K
Habitat ? T ? T2 0.000 0.409 14,209.067 9
Habitat ? T2 0.809 0.273 14,204.079 8
Bare ground ? habitat ? T 1.773 0.168 14,207.164 9
Bare ground ? habitat ? T ? T2 2.024 0.149 14,214.244 10
Bare ground ? bare ground2 ? habitat ? T ? T2 11.935 0.001 14,199.674 11
Bare ground ? bare ground2 ? habitat ? T 13.933 0.000 14,204.117 10
Bare ground ? habitat 21.413 0.000 14,225.051 8
Habitat 26.589 0.000 14,237.647 7
Bare ground ? T 31.890 0.000 14,222.243 5
Bare ground ? T ? T2 33.117 0.000 14,228.136 6
Bare ground ? bare ground2 ? habitat 33.222 0.000 14,228.983 9
Bare ground ? bare ground2 ? T 41.568 0.000 14,245.231 4
T ? T2 42.625 0.000 14,247.414 5
Bare ground ? bare ground2 ? T ? T2 44.770 0.000 14,243.009 6
Bare ground 47.704 0.000 14,228.995 4
T2 47.795 0.000 14,228.157 7
Bare ground ? bare ground2 61.286 0.000 14,243.010 5
Constant model 64.221 0.000 14,266.910 3
(a)
(b)
Fig. 3 Model-averaged ant nest diameter in relation to a temperature
and b amount of bare ground for different habitat types. Vertical linesstandard errors. S-v semi-vegetated, N-v non-vegetated
Fig. 4 Proportion of ant nests containing a brood in relation to nest
size. Vertical lines standard errors
874 J Ornithol (2010) 151:867–880
123
indicate that extensification of meadow management (i.e.,
reduction of fertiliser application) would increase ant
abundance (Folgarait 1998; Underwood and Fischer 2006).
The ant community was dominated by four species,
Lasius niger, L. flavus, Tetramorium caespitum, and
Solenopsis fugax. These ant species are common prey of
Wrynecks, with the exception of the tiny Solenopsis fugax
which was not considered in our analyses (Bitz and Rohe
1993; Freitag 1998; Ehrenbold 2004; Kervyn and Xhardez
2006). The habitat which offered good conditions for all
species considered was semi-vegetated vineyards. The
existence of diverse ant communities may be important for
Wrynecks provisioning chicks with ant eggs and pupae,
because ant species differing in their breeding phenology
(Freitag 1998) may provide long-lasting and abundant food
supplies.
Is the number of breeding cavities a limiting factor?
Wrynecks clearly preferred territories containing nest-
boxes and a high number of large trees, suggesting that a
lack or reduction of breeding sites may limit Wryneck
distribution. This can be understood because woodpeckers
typically need more than one cavity per territory (Cramp
1985; Bull et al. 1992). The importance of suitable nesting
cavities for Wrynecks has also recently been confirmed
experimentally: the probability of territory occupancy
increases with the number of adequate nestboxes supplied
(Zingg et al. 2010).
Is ant abundance a limiting factor?
The probability that a territory is occupied by Wrynecks
increased with increasing ant nest density, suggesting that
ant abundance has an impact on Wryneck populations.
Wrynecks also avoided habitat types that had low ant nest
densities such as crop, meadows and pastures. While the
avoidance of meadows and pastures might also result from
a reduced accessibility (see below), this is unlikely to be
true for crop, where access to ants is not permanently
hampered by vegetation.
Meadows and pastures farmed at low intensity in com-
bination with trees (orchards) have historically constituted
the favourite habitat of Central European Wrynecks
(Holzinger 1987; Cramp 1985). Yet, the traditional man-
agement of grassland in orchards has vanished since World
War II, being progressively replaced by heavily fertilised
meadows and intensively grazed pastures. This may
explain why Wrynecks are today so rare in what consti-
tuted their key habitat in the past. Restoring Wryneck
populations in grassland dominated landscapes thus seems
only possible if the input of fertilisers is massively reduced.
Table 4 Modelling results of the Wryneck territory occupancy probability in relation to structural variables using mixed models with a binomial
error distribution (n = 154 sites)
Model DAIC AIC weight Deviance K
Nestbox ? trees ? edge ? ants ? bare ground ? bare ground2 0.000 0.137 126.591 8
Nestbox ? trees ? ants ? bare ground ? bare ground2 0.158 0.127 128.750 7
Nestbox ? edge ? ants ? bare ground ? bare ground2 1.607 0.062 130.199 7
Nestbox ? trees ? edge ? ants 1.612 0.061 132.204 6
Nestbox ? ants ? bare ground ? bare ground2 1.766 0.057 132.358 6
Nestbox ? trees ? edge ? ants ? bare ground ? bare ground2 ? heterogeneity 1.787 0.056 126.379 9
Nestbox ? trees ? ants ? bare ground ? bare ground2 ? heterogeneity 1.818 0.055 128.409 8
Nestbox ? ants ? bare ground ? bare ground2 ? heterogeneity 2.109 0.048 130.700 7
Nestbox ? edge ? ants 2.199 0.046 134.791 5
Nestbox ? edge ? ants ? bare ground ? bare ground2 ? heterogeneity 2.212 0.045 128.804 8
Nestbox ? edge ? ants ? heterogeneity 2.868 0.033 133.459 6
Nestbox ? bare ground ? bare ground2 ? heterogeneity 3.026 0.030 133.617 6
Nestbox ? edge ? bare ground ? bare ground2 ? heterogeneity 3.081 0.029 131.673 7
Nestbox ? trees ? edge ? ants ? heterogeneity 3.212 0.028 131.804 7
Nestbox ? ants 3.622 0.022 138.213 4
Nestbox ? edge ? bare ground ? bare ground2 ? heterogeneity 3.825 0.020 130.416 8
Nestbox ? trees ? bare ground ? bare ground2 ? heterogeneity 3.855 0.020 132.446 7
Nestbox ? trees ? ants 3.911 0.019 136.502 5
Nestbox ? ants ? heterogeneity 3.962 0.019 136.553 5
Models are ranked according to DAIC, and those that accumulate AIC weights of 0.9 are presented. For column headings see Table 1
J Ornithol (2010) 151:867–880 875
123
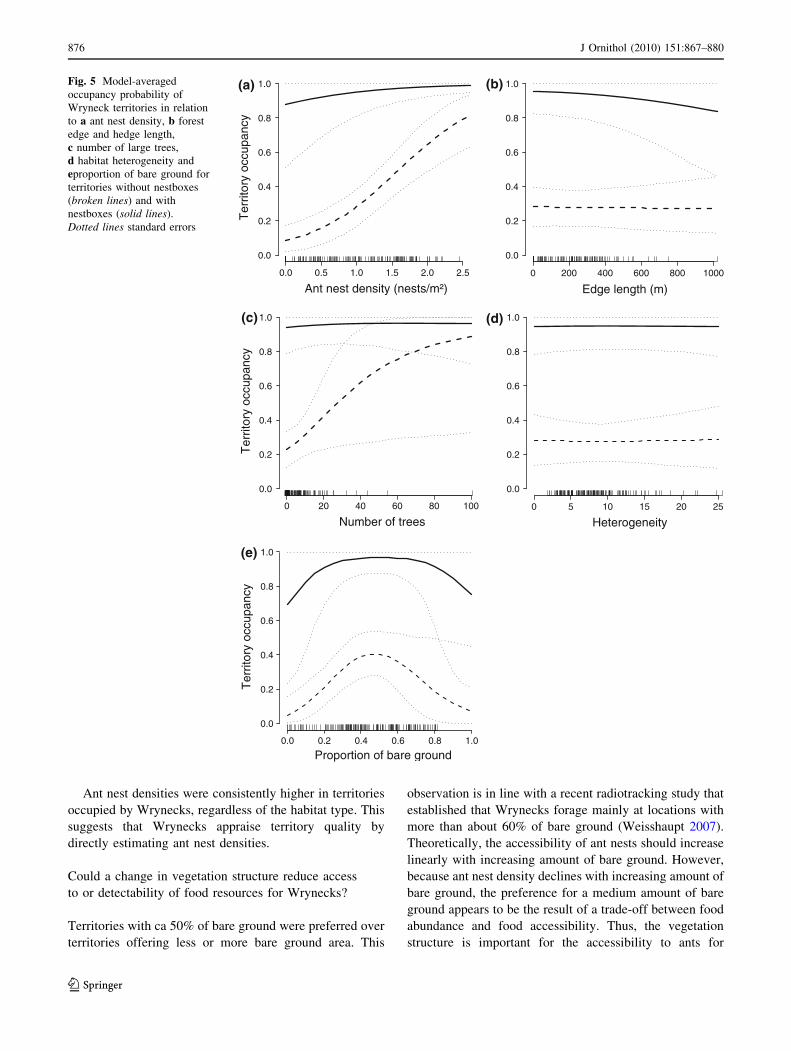
Ant nest densities were consistently higher in territories
occupied by Wrynecks, regardless of the habitat type. This
suggests that Wrynecks appraise territory quality by
directly estimating ant nest densities.
Could a change in vegetation structure reduce access
to or detectability of food resources for Wrynecks?
Territories with ca 50% of bare ground were preferred over
territories offering less or more bare ground area. This
observation is in line with a recent radiotracking study that
established that Wrynecks forage mainly at locations with
more than about 60% of bare ground (Weisshaupt 2007).
Theoretically, the accessibility of ant nests should increase
linearly with increasing amount of bare ground. However,
because ant nest density declines with increasing amount of
bare ground, the preference for a medium amount of bare
ground appears to be the result of a trade-off between food
abundance and food accessibility. Thus, the vegetation
structure is important for the accessibility to ants for
0.0 0.5 1.0 1.5 2.0 2.5
0.0
0.2
0.4
0.6
0.8
1.0
Ter
ritor
y oc
cupa
ncy
Ant nest density (nests/m²)
(a)
0 200 400 600 800 1000
0.0
0.2
0.4
0.6
0.8
1.0
Edge length (m)
(b)
0 20 40 60 80 100
0.0
0.2
0.4
0.6
0.8
1.0
Ter
ritor
y oc
cupa
ncy
Number of trees
(c)
0 5 10 15 20 25
0.0
0.2
0.4
0.6
0.8
1.0
Heterogeneity
(d)
0.0 0.2 0.4 0.6 0.8 1.0
0.0
0.2
0.4
0.6
0.8
1.0
Ter
ritor
y oc
cupa
ncy
Proportion of bare ground
(e)
Fig. 5 Model-averaged
occupancy probability of
Wryneck territories in relation
to a ant nest density, b forest
edge and hedge length,
c number of large trees,
d habitat heterogeneity and
eproportion of bare ground for
territories without nestboxes
(broken lines) and with
nestboxes (solid lines).
Dotted lines standard errors
876 J Ornithol (2010) 151:867–880
123
Wrynecks, and the change of the vegetation structure due
to increased fertiliser application has probably massively
contributed to its decline.
Conservation implications
Our results demonstrate that breeding opportunities, ant
abundance and accessibility were very important factors
limiting the distribution of Wrynecks. Wrynecks did not
show clear preferences for particular habitat types, and
appear flexible as regards habitat choice insofar as semi-
open landscapes are present. Hence, suitable nesting cavi-
ties as well as ant-rich, open ground vegetation structures
for foraging are key elements for the persistence of Wry-
neck populations. Nesting cavities can naturally occur at
sufficient density where old trees remain numerous; alter-
natively, nestboxes can be provided (Zingg et al. 2010). In
Table 5 Modelling results of Wryneck territory occupancy probability in relation to habitat type variables using a mixed model with binomial
error distribution (n = 154 sites)
Model DAIC AIC weight Deviance K
Meadow ? pasture ? lawn ? crop 0.000 0.200 172.586 6
Meadow ? pasture ? lawn ? fruit tree plantations ? crop 0.999 0.121 171.586 7
Crop ? meadow ? lawn 1.630 0.088 176.216 5
Meadow ? pasture ? lawn ? non-vegetated vineyard ? crop 1.709 0.085 172.295 7
Meadow ? pasture ? lawn ? semi-vegetated vineyard ? crop 1.788 0.082 172.374 7
Meadow ? pasture ? lawn ? fruit tree plantations ? non-vegetated vineyard ? crop 2.802 0.049 171.388 8
Meadow ? pasture ? lawn ? fruit tree plantations ? semi-vegetated vineyard ? crop 2.994 0.045 171.580 8
Meadow ? pasture ? lawn ? non-vegetated vineyard ? semi-vegetated vineyard ? crop 3.463 0.035 172.049 8
Crop ? meadow ? pasture 3.369 0.037 177.955 5
Crop ? meadow ? fruit tree plantations 4.019 0.027 178.605 5
Fruit tree plantation ? semi-vegetated vineyard 4.162 0.025 180.749 4
Crop ? meadow 4.239 0.024 180.826 4
Crop ? fruit tree plantations ? semi-vegetated vineyard 4.524 0.021 179.110 5
Meadow ? pasture ? lawn ? fruit tree plantations ? non-vegetated vineyard ? semi-vegetated vineyard ? crop 4.786 0.018 171.372 9
Meadow ? fruit tree plantations ? semi-vegetated vineyard 5.015 0.016 179.602 5
Crop ? meadow ? semi-vegetated vineyard 5.204 0.015 179.791 5
Crop ? fruit tree plantation ? lawn ? semi-vegetated vineyard 5.537 0.013 178.123 6
Meadow ? lawn ? fruit tree plantations ? non-vegetated vineyard ? semi-vegetated vineyard ? crop 5.578 0.012 174.164 8
Fruit tree plantation ? lawn ? semi-vegetated vineyard 5.793 0.011 180.379 5
Pasture ? fruit tree plantations ? semi-vegetated vineyard 5.897 0.010 180.483 5
Crop ? pasture ? fruit tree plantations ? semi-vegetated vineyard 5.933 0.010 178.520 6
Meadow ? fruit tree plantations ? non-vegetated vineyard ? semi-vegetated vineyard ? crop 5.980 0.010 176.566 7
Fruit tree plantations ? semi-vegetated vineyard ? non-vegetated vineyard 6.068 0.010 180.655 5
Crop ? meadow ? non-vegetated vineyard 6.193 0.009 180.779 5
Crop ? fruit tree plantations ? semi-vegetated vineyard ? non-vegetated vineyard 6.519 0.008 179.105 6
Crop ? pasture ? fruit tree plantations ? lawn ? semi-vegetated vineyard 6.605 0.007 177.191 7
Meadow ? pasture ? fruit tree plantations ? non-vegetated vineyard ? semi-vegetated vineyard ? crop 6.690 0.007 175.276 8
Crop ? pasture ? fruit tree plantations ? lawn 7.179 0.006 179.765 6
Models are ranked according to DAIC, and those that accumulate AIC weights of 0.9 are presented. For column headings see Table 1
Fig. 6 Model-averaged occupancy probability of Wryneck territories
in relation to different habitat types. Vertical lines standard errors.
S-v semi-vegetated, N-v non-vegetated
J Ornithol (2010) 151:867–880 877
123
semi-open grassland-dominated matrices, meadows must
be managed at low intensity such that the vegetation
structure becomes more open, with the intention both to
boost ant abundance and to facilitate accessibility to prey
for Wrynecks. In vineyards and fruit tree plantations,
management practices must promote a mix of bare and
vegetated surfaces. Semi-open landscapes with a mix of
bare and vegetated ground surfaces have been proven
essential for many other ground-foraging species (Benton
et al. 2003; Atkinson et al. 2004; Butler and Gillings 2004;
Martinez et al. 2010) and will benefit many other elements
of flora and fauna.
Zusammenfassung
Nahrung oder Nistplatze? Bestimmung von
limitierenden Faktoren in Wendehalspopulationen
In den letzten Jahrzehnten haben viele Vogelpopulationen
als Folge der Intensivierung der Landwirtschaft markant
abgenommen. Die genauen Mechanismen, die zum Ruck-
gang gefuhrt haben, sind aber nicht immer klar. So konnte
der in Hohlen brutende und auf Ameisennahrung spezia-
lisierte Wendehals Jynx torquilla sowohl durch eine Ver-
minderung der Nistplatze, der Nahrungsmenge oder deren
Verfugbarkeit limitiert werden. Um die relative Wich-
tigkeit dieser Faktoren zu bestimmen, verglichen wir in der
Westschweiz besetzte Wendehalsreviere mit zufallig aus-
gewahlten Orten, an denen keine Wendehalse vorkamen
(Zufallsreviere; total 154 Reviere). Wir untersuchten auch
Umweltfaktoren, die einen Einfluss auf die Dichte der
Wiesenameisen hatten. Die Wahrscheinlichkeit, dass ein
Revier von einem Wendehals besetzt war, stieg mit der
Anzahl vorhandener Nistkasten und der Dichte an Amei-
sennester an. Ausserdem wurden Reviere bevorzugt, die
etwa 50% offener Boden aufwiesen. Habitattypen, die eine
geringe Dichte an Ameisennestern hatten, wie Ackerland
und intensives Grunland, wurden gemieden. Die Dichte der
Ameisennester nahm mit zunehmender Vegetationsdichte
zu, und sie war am hochsten in Reben. Unsere Resultate
zeigen, dass sowohl Brutplatze, Nahrung, wie auch der
Zugang zur Nahrung (offener Boden) limitierende Faktoren
fur die Verbreitung der Wendehalse sind. Grunland mit
einer hohen Dichte an Wiesenameisennestern, das mosa-
ikartig verteilt vegetationslose Stellen und in unmittelbarer
Umgebung Baumen mit Hohlen oder Nistkasten aufweist,
scheinen die wichtigsten Faktoren zu sein, um Wende-
halspopulationen erhalten und fordern zu konnen. Diese
Eigenschaften konnen in unterschiedlichen Habitattypen
vorhanden sein, sogar in intensiv genutzten Habitaten wie
Obstanlagen oder Reben.
Acknowledgments Data on Wryneck breeding sites were kindly
provided by Hans Schmid, Niklaus Zbinden, Blaise Mulhauser,
Sebastien Chabot, Bernard Genton, Bernard Lugrin and Michel Rogg.
We thank Fitsum Abadi Gebreselassie for statistical advise, Jerome
Guelat for his help with GIS, and Niklaus Zbinden for valuable
comments. Diane Patry offered accommodation during the field work.
Appendix 1
See Table 6.
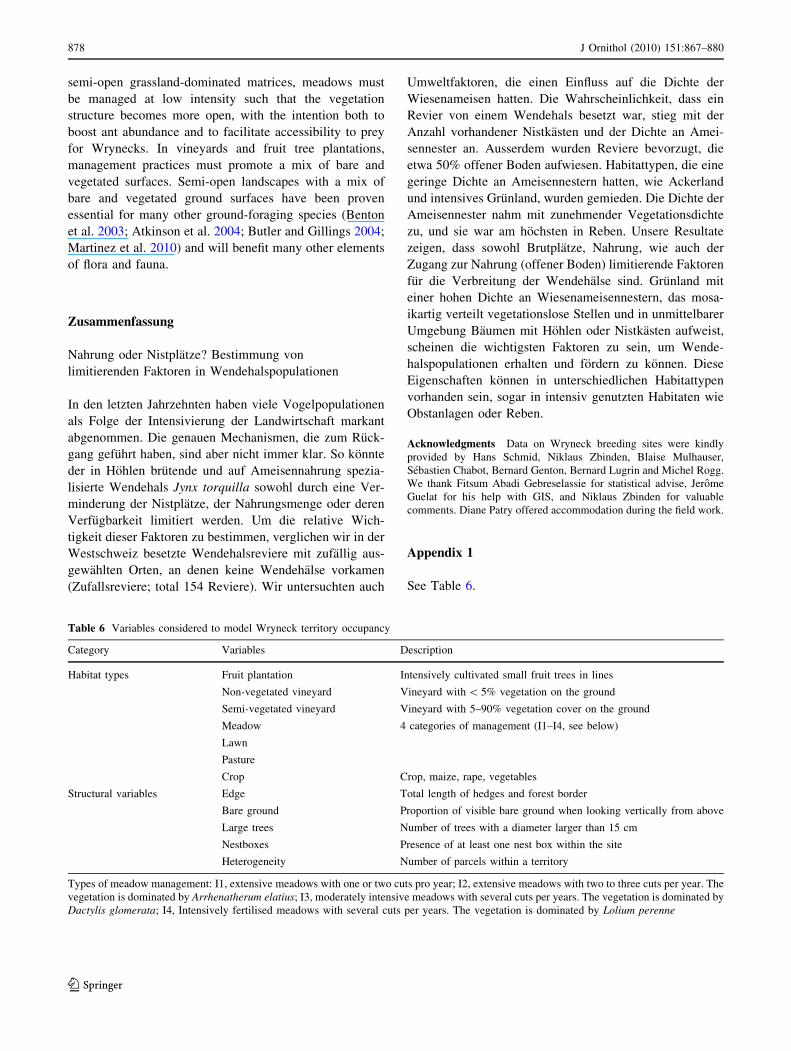
Table 6 Variables considered to model Wryneck territory occupancy
Category Variables Description
Habitat types Fruit plantation Intensively cultivated small fruit trees in lines
Non-vegetated vineyard Vineyard with \ 5% vegetation on the ground
Semi-vegetated vineyard Vineyard with 5–90% vegetation cover on the ground
Meadow 4 categories of management (I1–I4, see below)
Lawn
Pasture
Crop Crop, maize, rape, vegetables
Structural variables Edge Total length of hedges and forest border
Bare ground Proportion of visible bare ground when looking vertically from above
Large trees Number of trees with a diameter larger than 15 cm
Nestboxes Presence of at least one nest box within the site
Heterogeneity Number of parcels within a territory
Types of meadow management: I1, extensive meadows with one or two cuts pro year; I2, extensive meadows with two to three cuts per year. The
vegetation is dominated by Arrhenatherum elatius; I3, moderately intensive meadows with several cuts per years. The vegetation is dominated by
Dactylis glomerata; I4, Intensively fertilised meadows with several cuts per years. The vegetation is dominated by Lolium perenne
878 J Ornithol (2010) 151:867–880
123
Appendix 2
See Table 7.
Appendix 3
See Fig. 7.
References
Atkinson PW, Buckingham DL, Morris AJ (2004) What factors
determine where invertebrate-feeding birds forage in dry agri-
cultural grasslands? Ibis 146(Suppl 2):99–107
Benton TG, Bryant DM, Cole L, Crick HQP (2002) Linking
agricultural practice to insect and bird populations: a historical
study over three decades. J Appl Ecol 39:673–687
Benton TG, Vickery JA, Wilson JD (2003) Farmland biodiversity: is
habitat heterogeneity the key? Trends Ecol Evol 18:182–188
Bestelmeyer BT, Wiens JA (2001) Ant biodiversity in semiarid
landscape mosaics: the consequences of grazing vs. natural
heterogeneity. Ecol Appl 11:1123–1140
Bitz A, Rohe W (1993) Nahrungsokologische Untersuchungen am
Wendehals (Jynx torquilla) in Rheinland-Pfalz. Beih Veroff
Naturschutz Landschaftspflege Bad-Wurtt 67:83–100
Blanco G, Tella JL, Torre I (1998) Traditional farming and key foraging
habitats for chough Pyrrhocorax pyrrhocorax conservation in a
Spanish pseudosteppe landscape. J Appl Ecol 35:232–239
Bromham L, Cardillo M, Bennett AF, Elgar MA (1999) Effects of
stock grazing on the ground invertebrate fauna of woodland
remnants. Aust J Ecol 24:199–207
Bull EL, Holthausen RS, Henjum MG (1992) Roost trees used by
pileated woodpeckers in northeastern Oregon. J Wildl Manag
56:786–793
Burnham KP, Anderson DR (2002) Model selection and inference.
Springer, New York
Butler SJ, Gillings S (2004) Quantifying the effects of habitat
structure on prey detectability and accessibility to farmland
birds. Ibis 146(Suppl 2):123–130
Cornelius C, Cockle K, Politi N, Berkunsky I, Sandoval L, Ojeda V,
Rivera L, Hunter M Jr, Martin K (2008) Cavity-nesting birds in
neotropical forests: cavities as a potentially limiting resource.
Ornithol Neotrop 19:253–268
Cramp S (1985) The birds of the Western Palearctic, vol 4. Oxford
University Press, Oxford
Della Santa E (1994) Guide pour l’identification des principales
especes de fourmis de Suisse. Centre suisse de cartographie de la
faune, Neuchatel
Donald PF, Green RE, Heath MF (2001) Agricultural intensification
and the collapse of Europe’s farmland bird populations. Proc R
Soc Lond B 268:25–29
Ehrenbold S (2004) Habitat suitability modelling and components of
reproductive success in the Wryneck Jynx torquilla. Diplomar-
beit. Philosophisch-naturwissenschaftliche Fakultat der Univer-
sitat Bern
Folgarait PJ (1998) Ant biodiversity and its relationship to ecosystem
functioning: a review. Biodivers Conserv 7:1221–1244
Freeman KE, Kirk DA (2001) Birds on organic and conventional
farms in Ontario: partitioning effects of habitat and practices on
species composition and abundance. Biol Conserv 101:337–350
Freitag A (1996) Le regime alimentaire du Torcol fourmilier (Jynxtorquilla) en Valais (Suisse). Nos Oiseaux 43:497–512
Freitag A (1998) Analyse de la disponibilite spatio-temporelle des
fourmis et des strategies de fourragement du torcol fourmilier
(Jynx torquilla L.). These de Doctorat. Universite de Lausanne
Freitag A, Martinoli A, Urzelai J (2001) Monitoring the feeding activity
of nesting birds with an autonomous system: case study of the
endangered Wryneck Jynx torquilla. Bird Study 48:102–109
Hines JE (2006) PRESENCE software to estimates patch occupancy
rates and related parameters. Patuxent Wildlife Research Center,
Laurel
Holzinger J (1987) Wendehals—Jynx torquilla. Die Vogel Baden-
Wurttembergs. Gefahrdung und Schutz. Ulmer, Stuttgart, pp
1152–1156
Table 7 Number of habitat type parcels where ant nests were
sampled
Region Habitat type Occupied Unoccupied Total
Neuchatel Crop 2 8 10
Meadow 9 12 21
Fruit tree plantation 0 0 0
Pasture 7 7 14
Non-vegetated vineyard 2 0 2
Semi-vegetated vineyard 32 0 32
Total Neuchatel 52 27 79
La Cote Crop 1 6 7
Meadow 0 9 9
Fruit tree plantation 11 12 23
Pasture 2 4 6
Non-vegetated vineyard 1 0 1
Semi-vegetated vineyard 24 20 44
Total La Cote 39 51 90
Geneva Crop 3 8 11
Meadow 5 11 16
Fruit tree plantation 0 0 0
Pasture 0 1 1
Non-vegetated vineyard 0 0 0
Semi-vegetated vineyard 6 32 38
Total Geneva 14 52 66
Total
overall
105 130 235
0.00
0.50
1.00
1.50
2.00
2.50
3.00
3.50
4.00
4.50
5.00
For
mic
a
Lasi
us fl
avus
Lasi
us n
iger
Myr
mic
a
Sol
enop
sis
fuga
x
Tet
ram
oriu
mca
espi
tum
Tap
inom
aer
ratic
um
Mea
n nu
mbe
r of
nes
t/m2
Crop
Meadow
Fruit plantation
Pasture
Vineyard
Fig. 7 Nest density of the most common ant species in different
habitat types
J Ornithol (2010) 151:867–880 879
123
Hutto RL (1990) Measuring the availability of food resources. Stud
Avian Biol 13:20–28
Kaspari M (2000) A primer on ant ecology. In: Agosti D, Majer J,
Alonso L, Schultz TR (eds) Ants: Standard methods for
measuring and monitoring biodiversity. Smithsonian Institution
Press, Washington, DC
Kervyn T, Xhardez C (2006) Utilisation de l’espace par le Torcol
fourmilier (Jynx torquilla) lors d’une nidification uniparentale en
Ardenne. Aves 43:65–72
Lessard J-P, Buddle CM (2005) The effects of urbanization on ant
assemblage (Hymenoptera: Formicidae) associated with the
Molson Nature Reserve, Quebec. Can Entomol 137:215–225
Martinez N, Jenni L, Wyss E, Zbinden N (2010) Habitat structure
versus food abundance: the importance of sparse vegetation for
the common redstart Phoenicurus phoenicurus. J Ornithol
151:297–307
McCracken DI, Tallowin JR (2004) Swards and structure: the
interactions between farming practices and bird food resources
in lowland grasslands. Ibis 146(Suppl 2):108–114
Mermod M, Arlettaz R, Reichlin TS, Schaub M (2009) The
importance of ant-rich habitats for the persistence of the
Wryneck Jynx torquilla on farmland. Ibis 151:731–742
Morris MG (2000) The effects of structure and its dynamics on the
ecology and conservation of arthropods in British grasslands.
Biol Conserv 95:129–142
Newton I (2004) The recent declines of farmland bird populations in
Britain: an appraisal of causal factors and conservation actions.
Ibis 146:579–600
Peck SL, McQuaid K, Campbell CL (1998) Using ant species
(Hymenoptera: Formicidae) as a biological indicator of agro-
ecosystem condition. Environ Entomol 27:1102–1110
Platner C (2006) Ameisen als Schlusseltiere in einem Grasland.
Studien zu ihrer Bedeutung fur die Tiergemeinschaft, das
Nahrungsnetz und das Okosystem. Universitatsverlag Gottingen
Poeplau N (2005) Untersuchungen zur Siedlungsdichte und Habita-
tqualitat des Wendehalses (Jynx torquilla) in Sudhessen.
Zeitschrift fur Vogelkunde und Naturschutz in Hessen. Vogel
Umwelt 16:115–127
Royle JA, Nichols JD (2003) Estimating abundance from repeated
presence–absence data or point counts. Ecology 84:777–790
Seifert B (1996) Ameisen. Naturbuch, Augsburg
Talbot M (1946) Daily fluctuations in aboveground activity of three
species of ants. Ecology 27:65–70
Tomialojc L (1994) Wryneck. In: Tucker GM, Heath MF (eds) Birds
in Europe: their conservation status. BirdLife International,
Cambridge, pp 342–343
Underwood E, Fischer B (2006) The role of ants in conservation
monitoring: if, when, and how. Biol Conserv 132:166–182
Weisshaupt N (2007) Habitat selection by foraging wrynecks Jynxtorquilla during the breeding season: identifying optimal species
habitat. Masterarbeit. Philosophisch-naturwissenschaftliche Fak-
ultat der Universitat Bern
Wilson JD, Whittingham MJ, Bradbury RB (2005) The management
of crop structure: a general approach to reversing the impacts of
agricultural intensification on birds? Ibis 147:453–463
Wretenberg J, Lindstrom A, Svensson S, Thierfelder T, Part T (2006)
Population trends of farmland birds in Sweden and England:
similar trends but different patterns of agricultural intensifica-
tion. J Appl Ecol 43:1110–1120
Zingg S, Arlettaz R, Schaub M (2010) Nestbox design influences
territory occupancy and reproduction in a declining, secondary
cavity-breeding bird. Ardea 98:67–75
880 J Ornithol (2010) 151:867–880
123
Copyright © 2022 FDOKUMEN