limiting phosphorus in Indian bread wheat germplasm - PLOS
22
RESEARCH ARTICLE Deciphering the change in root system architectural traits under limiting and non- limiting phosphorus in Indian bread wheat germplasm Palaparthi Dharmateja 1 , Manjeet Kumar 1 , Rakesh Pandey 2 , Pranab Kumar Mandal ID 3 , Prashanth Babu 1 , Naresh Kumar Bainsla ID 1 , Kiran B. Gaikwad 1 , Vipin Tomar 4 , Kamre Kranthi kumar 1 , Narain Dhar 5 , Rihan Ansari 1 , Nasreen Saifi 1 , Rajbir Yadav ID 1 * 1 Division of Genetics, ICAR-Indian Agricultural Research Institute, New Delhi, India, 2 Division of Plant Physiology, ICAR-Indian Agricultural Research Institute, New Delhi, India, 3 ICAR- National Institute for Plant Biotechnology, New Delhi, India, 4 Department of Research and Crop Improvement, Borlaug Institute for South Asia, Ludhiana, Punjab, India, 5 Department of Research and Crop Improvement, Borlaug Institute for South Asia, Jabalpur, Madhya Pradesh, India * [email protected] Abstract The root system architectures (RSAs) largely decide the phosphorus use efficiency (PUE) of plants by influencing the phosphorus uptake. Very limited information is available on wheat’s RSAs and their deciding factors affecting phosphorus uptake efficiency (PupE) due to difficulties in adopting scoring values used for evaluating root traits. Based on our earlier research experience on nitrogen uptake efficiency screening under, hydroponics and soil- filled pot conditions, a comprehensive study on 182 Indian bread wheat genotypes was car- ried out under hydroponics with limited P (LP) and non-limiting P (NLP) conditions. The find- ings revealed a significant genetic variation, root traits correlation, and moderate to high heritability for RSAs traits namely primary root length (PRL), total root length (TRL), total root surface area (TSA), root average diameter (RAD), total root volume (TRV), total root tips (TRT) and total root forks (TRF). In LP, the expressions of TRL, TRV, TSA, TRT and TRF were enhanced while PRL and RAD were diminished. An almost similar pattern of cor- relations among the RSAs was also observed in both conditions except for RAD. RAD exhibited significant negative correlations with PRL, TRL, TSA, TRT and TRF under LP (r = -0.45, r = -0.35, r = -0.16, r = -0.30, and r = -0.28 respectively). The subclass of TRL, TSA, TRV and TRT representing the 0–0.5 mm diameter had a higher root distribution percentage in LP than NLP. Comparatively wide range of H’ value i.e. 0.43 to 0.97 in LP than NLP indi- cates that expression pattern of these traits are highly influenced by the level of P. In which, RAD (0.43) expression was reduced in LP, and expressions of TRF (0.91) and TSA (0.97) were significantly enhanced. The principal component analysis for grouping of traits and genotypes over LP and NLP revealed a high PC1 score indicating the presence of non- crossover interactions. Based on the comprehensive P response index value (CPRI value), the top five highly P efficient wheat genotypes namely BW 181, BW 103, BW 104, BW 143 and BW 66, were identified. Considering the future need for developing resource-efficient PLOS ONE PLOS ONE | https://doi.org/10.1371/journal.pone.0255840 October 1, 2021 1 / 22 a1111111111 a1111111111 a1111111111 a1111111111 a1111111111 OPEN ACCESS Citation: Dharmateja P, Kumar M, Pandey R, Mandal PK, Babu P, Bainsla NK, et al. (2021) Deciphering the change in root system architectural traits under limiting and non-limiting phosphorus in Indian bread wheat germplasm. PLoS ONE 16(10): e0255840. https://doi.org/ 10.1371/journal.pone.0255840 Editor: Reyazul Rouf Mir, Faculty of Agriculture (FoA), Sher-e-Kashmir University of Agricultural Sciences and Technology of Kashmir (SKUAST-K), Wadura Campus, INDIA Received: March 24, 2021 Accepted: July 25, 2021 Published: October 1, 2021 Peer Review History: PLOS recognizes the benefits of transparency in the peer review process; therefore, we enable the publication of all of the content of peer review and author responses alongside final, published articles. The editorial history of this article is available here: https://doi.org/10.1371/journal.pone.0255840 Copyright: © 2021 Dharmateja et al. This is an open access article distributed under the terms of the Creative Commons Attribution License, which permits unrestricted use, distribution, and reproduction in any medium, provided the original author and source are credited.
-
Upload
khangminh22 -
Category
Documents
-
view
1 -
download
0
Transcript of limiting phosphorus in Indian bread wheat germplasm - PLOS

RESEARCH ARTICLE
Deciphering the change in root system
architectural traits under limiting and non-
limiting phosphorus in Indian bread wheat
germplasm
Palaparthi Dharmateja1, Manjeet Kumar1, Rakesh Pandey2, Pranab Kumar MandalID3,
Prashanth Babu1, Naresh Kumar BainslaID1, Kiran B. Gaikwad1, Vipin Tomar4,
Kamre Kranthi kumar1, Narain Dhar5, Rihan Ansari1, Nasreen Saifi1, Rajbir YadavID1*
1 Division of Genetics, ICAR-Indian Agricultural Research Institute, New Delhi, India, 2 Division of Plant
Physiology, ICAR-Indian Agricultural Research Institute, New Delhi, India, 3 ICAR- National Institute for Plant
Biotechnology, New Delhi, India, 4 Department of Research and Crop Improvement, Borlaug Institute for
South Asia, Ludhiana, Punjab, India, 5 Department of Research and Crop Improvement, Borlaug Institute for
South Asia, Jabalpur, Madhya Pradesh, India
Abstract
The root system architectures (RSAs) largely decide the phosphorus use efficiency (PUE)
of plants by influencing the phosphorus uptake. Very limited information is available on
wheat’s RSAs and their deciding factors affecting phosphorus uptake efficiency (PupE) due
to difficulties in adopting scoring values used for evaluating root traits. Based on our earlier
research experience on nitrogen uptake efficiency screening under, hydroponics and soil-
filled pot conditions, a comprehensive study on 182 Indian bread wheat genotypes was car-
ried out under hydroponics with limited P (LP) and non-limiting P (NLP) conditions. The find-
ings revealed a significant genetic variation, root traits correlation, and moderate to high
heritability for RSAs traits namely primary root length (PRL), total root length (TRL), total
root surface area (TSA), root average diameter (RAD), total root volume (TRV), total root
tips (TRT) and total root forks (TRF). In LP, the expressions of TRL, TRV, TSA, TRT and
TRF were enhanced while PRL and RAD were diminished. An almost similar pattern of cor-
relations among the RSAs was also observed in both conditions except for RAD. RAD
exhibited significant negative correlations with PRL, TRL, TSA, TRT and TRF under LP (r =
-0.45, r = -0.35, r = -0.16, r = -0.30, and r = -0.28 respectively). The subclass of TRL, TSA,
TRV and TRT representing the 0–0.5 mm diameter had a higher root distribution percentage
in LP than NLP. Comparatively wide range of H’ value i.e. 0.43 to 0.97 in LP than NLP indi-
cates that expression pattern of these traits are highly influenced by the level of P. In which,
RAD (0.43) expression was reduced in LP, and expressions of TRF (0.91) and TSA (0.97)
were significantly enhanced. The principal component analysis for grouping of traits and
genotypes over LP and NLP revealed a high PC1 score indicating the presence of non-
crossover interactions. Based on the comprehensive P response index value (CPRI value),
the top five highly P efficient wheat genotypes namely BW 181, BW 103, BW 104, BW 143
and BW 66, were identified. Considering the future need for developing resource-efficient
PLOS ONE
PLOS ONE | https://doi.org/10.1371/journal.pone.0255840 October 1, 2021 1 / 22
a1111111111
a1111111111
a1111111111
a1111111111
a1111111111
OPEN ACCESS
Citation: Dharmateja P, Kumar M, Pandey R,
Mandal PK, Babu P, Bainsla NK, et al. (2021)
Deciphering the change in root system
architectural traits under limiting and non-limiting
phosphorus in Indian bread wheat germplasm.
PLoS ONE 16(10): e0255840. https://doi.org/
10.1371/journal.pone.0255840
Editor: Reyazul Rouf Mir, Faculty of Agriculture
(FoA), Sher-e-Kashmir University of Agricultural
Sciences and Technology of Kashmir (SKUAST-K),
Wadura Campus, INDIA
Received: March 24, 2021
Accepted: July 25, 2021
Published: October 1, 2021
Peer Review History: PLOS recognizes the
benefits of transparency in the peer review
process; therefore, we enable the publication of
all of the content of peer review and author
responses alongside final, published articles. The
editorial history of this article is available here:
https://doi.org/10.1371/journal.pone.0255840
Copyright: © 2021 Dharmateja et al. This is an
open access article distributed under the terms of
the Creative Commons Attribution License, which
permits unrestricted use, distribution, and
reproduction in any medium, provided the original
author and source are credited.
wheat varieties, these genotypes would serve as valuable genetic sources for improving P
efficiency in wheat cultivars. This set of genotypes would also help in understanding the
genetic architecture of a complex trait like P use efficiency.
Introduction
Wheat (Triticum aestivum L.) is a major staple food crop across the globe that contributes to
one-fourth of total dietary protein and one-fifth of calorie intake. In India, recently (2019–20),
wheat has recorded the all-time highest production, estimated at 107.59 million tonnes [1].
Since the inception of the green revolution era (the 1960s), productivity has continuously
increased with the combined effects of responsive genotypes and agronomic interventions
including fertilizer management. However, currently, considering environmental, health con-
cerns and factor productivity (production per unit input), the focus is shifted to resource/fertil-
izer use efficient genotypes in accordance to the policy and market demand.
Among the three major organic minerals crucial for plant’s survival and growth, Phospho-
rus (P) is a crucial element, which plays a vital role in energy, sugar metabolism, enzymatic
reaction, and photosynthesis. P is also a component of nucleic acid, plant hormones, and
largely defines crop quality and yield [2, 3]. P is mainly absorbed by the plants in the form of
phosphate; however, because of its high reactivity with some metal ions in the soil like Ca2+ in
alkaline soil; and Fe3+, Mn2+ and Al2+ in acidic soil, it naturally gets precipitated, resulting in
low availability of P to the plants [4]. Besides, organic material present in the soil can also bind
to P usually in phytate form (inositol compounds) [5], which again hampers its uptake through
plant roots. Although excess P application generally results in P toxicity in plants leading to
the delayed formation of reproductive organs [6], it also leads to micronutrient deficiencies
resulting in reduced yield.
The amount of unabsorbed and unutilized P would flow with the rain or irrigation water
into the river resulting in eutrophication [7], a process of making water bodies rich in nutri-
ents and hence leading to the profuse growth of plants. Globally P reserves are declining and
will be depleted by the end of this century [8]. In contrast to nitrogen which can be fixed from
the atmosphere, weathering minerals are the lone non-renewable natural source of P [9]. P fer-
tiliser’s primary source is rock phosphate, which is minable in only a few places in the world
[5]. Therefore, concerns have been expressed regarding the potential global scarcity of P in the
coming years. With this absolute shortage of P fertilisers, agricultural soils will be depleted by
between 4–19 kg ha−1 yr−1 worldwide, with an average loss to the tune of 50% of total P losses
due to soil erosion [10]. Morocco, a single country, possesses 85% of known remaining depos-
its. Expected future scarcity is already reflected in the move that the US and China have
stopped export for strategic reasons. India depends entirely on imported P fertilizer [5]. With
around 24–25 million tonnes of annual P2O5 requirement for agriculture crop production in
India, depleting reserve and high mining cost and analysis of 10–20% use efficiency of applied
P is likely to cause massive burden to the Indian economy. The monetary loss of P2O5 was cal-
culated to the tune of INR 7.81 billion [11].
P is considered one of the important yield-limiting factors in the context of sustainable agri-
cultural production systems in subtropical and tropical conditions [12]. P utilization rate is
low (10.7%) in wheat compared to rice (13.1%) and maize (11%) [13], which has demanded
the immediate attention of wheat researchers [14] across the globe. In India, 49.3% of soil has
a low P, 48.8% is of average P and only about 1.9% are in the high P category [15]. In this
PLOS ONE Deciphering the change in root system architectural traits under limiting and non-limiting phosphorus in wheat
PLOS ONE | https://doi.org/10.1371/journal.pone.0255840 October 1, 2021 2 / 22
Data Availability Statement: All relevant data are
within the manuscript and its Supporting
Information files.
Funding: The financial or material support was
provided by ICAR-Indian Agricultural Research
Institute, New Delhi.
Competing interests: No conflict of interest.

context, genetic interventions are compulsory and need of the hour for breeding P use efficient
crops [16]. This is very much essential to make sure of increased productivity and to meet the
current food demand, but in ways that are environmentally safe, economically viable, and
socially sustainable.
The root system is a vital organ for water and nutrients uptake and it helps in the anchoring
of plants to the ground. The physiological characteristics of the root system largely determine
the rates of absorption of nutrients and water [17] in crop plants. Plants may exhibit a wide
range of adaptations in response to P deficiency, and one of those is root system architectural
traits modification [18, 19]. In wheat P requirement during early stages of growth is vital for
determining the final yield. Even though sufficient P supplied thereafter, P deprivation during
the early developing stages produces significant reductions in tiller production and head devel-
opment [20, 21]. Plants can modify their roots in response to P stress by stimulating the root
hairs [22] and enhancement of lateral root growth [23]. In arabidopsis, P deprivation stimu-
lates the production of a highly branched root system at the expense of the primary root, as evi-
denced by the increased creation and appearance of lateral roots and root hairs [24, 25]. In
other crops like maize and rice, the low P availability affects growth of primary root length,
root angle, branching of roots, quantity and length of lateral roots, augmentation of root hair
and cluster root formation [26, 27]. In rice PSTOL gene (OsPSTOL) identified their role in
phosphorus stress tolerance, change in root system architecture along with improvement of
agronomically important traits [28]. Overexpression of wheat homologue of the rice PSTOL
gene (OsPSTOL) revealed a substantial influence on root biomass, effective tiller number,
flowering time and seed yield, all of which were correlated with TaPSTOL expression [29].
Under low P condition, RSA traits such as root length, root surface area and root volume were
moderately heritable in maize [30]. More precisely in wheat developing varieties with the
improved inherent ability to absorb more P and understanding the key traits deciding its effi-
cient utilization can be one way to address the problem sustainably. However, before harping
on such an adventure, it is essential to have information about the plant traits involved in
higher uptake and utilization, the level of variability in the available germplasm, their inheri-
tance, and the way to select for and against these traits to achieve a better genetic gain with low
P application. Unfortunately, most of the root system traits influencing P uptake are very diffi-
cult to score with different values and hence, tough to characterise different genotypes con-
trasting for P use response in crop breeding programs. Therefore, not much work has been
done globally.
In India except for some isolated effort, none of the Indian wheat breeding programs has
any generated information on RSAs which can be integrated into developing P use efficient
wheat genotypes. More P efficient cultivars can either reduce P applications or reduce the envi-
ronmental risk associated with the high P use in agriculture. Hence, the current study was
designed to characterize 182 diverse wheat genotypes from the Indian wheat breeding pro-
gramme for P uptake and understand prominent root system traits largely influencing P use
efficiency. The core objective of this work was to identify the P- responsive and P- efficient
genotypes and to upgrade the knowledge of the key traits involved in higher uptake and utiliza-
tion of P.
Material and methods
Plant material
Root system architectures (RSAs) study was conducted using 182 improved breeding lines (S1
Table) representing different pedigree groups with diverse parents in their lineage under lim-
ited and non-limited phosphorus conditions. Based on our earlier field evaluations, the tested
PLOS ONE Deciphering the change in root system architectural traits under limiting and non-limiting phosphorus in wheat
PLOS ONE | https://doi.org/10.1371/journal.pone.0255840 October 1, 2021 3 / 22

genotypes are high-yielding and possess resistance to major wheat diseases. The selected geno-
types are also in the final stage of evaluation under our Institute trials and few of them better
performing may be pipelined to National Initial Varietal Trials (NIVT) in the coming years. In
addition, we have also used three popular, high yielding commercial varieties viz., HD2967,
HD3226 and HDCSW18 for the estimation of comprehensive phosphorous response.
Growth conditions
This experiment was conducted in controlled hydroponics conditions of the National Phyto-
tron Facility situated at the Indian Agricultural Research Institute, New Delhi, India during
2019–20. The standard growing conditions with 12˚C—22˚C temperature, 10 h of photope-
riod and 70% relative humidity were maintained throughout the growing period. Initially, uni-
form plump seeds of each genotype were sterilized with 1% sodium hypochlorite for 2 minutes
and thoroughly washed with distilled water and wrapped in seed germination paper. Then 5
days old seedlings of uniform size were transferred to the modified Hoagland solution [31]. A
hydroponic system was developed from plastic boxes of 18-litre capacity covering with a
ceramic lid. Holes of around 8 mm diameter were drilled on the lids. The containers and tops
for hydroponic culture were opaque to produce healthy roots and discourage algal growth.
The seedlings wrapped in cotton plug were placed in each hole of the lid so that their roots
remained immersed in the hydroponic solutions tank.
The basal nutrient solution for hydroponics experiment was comprised of (NH4)2SO4�H2O
(1 mmol/L), Ca(NO3)2�4H2O (1 mmol/L), KCl (1.8 mmol/L), MgSO4�7H2O (0.5 mmol/L),
CaCl2 (1.5 mmol/L), H3BO3 (1 μmol/L), CuSO4�5H2O (0.5 μmol/L), ZnSO4�7H2O (1 μmol/L),
MnSO4�H2O (1 μmol/L), FeEDTA (100 μmol/L), (NH4)6Mo7O24�4H2O (0.1 μmol/L), and two
levels of P were maintained using KH2PO4 as Non limiting P (0.2 mmol/L) and limiting P
(0.02 mmol/L) [31, 32]. The pH of the solution was maintained to 6–6.5 by using 1M HCl
and1M KOH and was continuously aerated with the aquarium air pump. Each genotype was
replicated three times, and the nutrient solution was replaced with the fresh solution every
four days [33] to maintain the continuous supply of nutrients.
Root analysis
The complete root system of thirty days old seedlings of each genotype across the three replica-
tions raised in NLP and LP, were separated from shoot and individual plants were spread out
in a tray for scanning. The root system was scanned with Epson professional scanner, and
obtained images were analysed with WinRhizo [34] (Pro version 2016a; Regent Instrument
Inc., Quebec, Canada). Roots were placed in an acrylic tray with double distilled water root
parameters namely TRL, TSA, TRV, TRT, and TRF were recorded by scanning the complete
root system. The metric scale was used to measure primary root length manually. The addi-
tional pieces of information were generated with the WinRhizo software in which each root
parameter namely TRL, TSA, TRV and TRT was divided into five subclasses based on root
diameter intervals of 0–0.5 mm, 0.5–1.0 mm, 1.0–1.5 mm, 1.5–2.0 mm and>2.0 mm [35].
The notations of each subclass were given like RL1-5 for TRL; SA1-5 for TSA; RV1-5 for TRV,
and RT1-5 for TRT.
Statistical analysis
The information on descriptive statistics viz., mean, standard deviation, coefficient of varia-
tion, heritability and analysis of variance were generated for traits under study using R-soft-
ware based STAR (Statistical Tool for Agricultural Research) 2.1.0 software [36]. The
estimated values of each genotype’s phenotype for further analysis were calculated based on
PLOS ONE Deciphering the change in root system architectural traits under limiting and non-limiting phosphorus in wheat
PLOS ONE | https://doi.org/10.1371/journal.pone.0255840 October 1, 2021 4 / 22

the best linear unbiased prediction (BLUP) [37]. Based on their performance genotypes are
classified into three different groups namely: (i) low performing genotypes (� �x - SD), (ii)
medium performing genotypes (� �x - SD) to (� �x + SD), and (iii) high performing genotypes
(� �x + SD), where �x and SD represents mean and standard deviation of particular root traits
[38]. The Shannon-Weaver diversity index (H’) was calculated for all RSA traits [39, 40].
Root trait associations and genotypes differential response. Pearson’s correlation coef-
ficient and principal component analysis were performed to understand the associations
among the root traits and responsive behaviour of genotypes under contrasting P regimes by
using R package version 4.0.1. GGE biplot analysis was also carried out to select the best geno-
types for RSAs under both NLP and LP regimes. The P response coefficient (PRC) was calcu-
lated as the ratio of the data derived from the LP and NLP treatment of the same genotype for
each trait using the following equation, PRCij = XijLP/XijNLP. Where, PRCij is the P response
coefficient of the trait (j) for the cultivar (i); XijLP and XijNLP are the value of the root trait (j)for the cultivar (i) evaluated under LP and NLP, respectively.
Comprehensive P response. A comprehensive P response index value (CPRI value) was
used to estimate the P stress response capability of all tested wheat genotypes. Fuzzy subordi-
nation method could be used to analyse the response of genotypes entirely and avoid the short-
age of the single index. The membership function of a fuzzy set is a generalization of the
indicator function in classical sets; it represents the degree of truth as an extension of valua-
tion. Uij stands for the membership function value of P efficiency (MFVP) that indicates a pos-
itive correlation between the trait and P response. The CPRI value was calculated across traits
to evaluate wheat P stress response by using the formula [41, 42] described below.
Uij ¼PRCij � PRCjmin
PRCjmax � PRCjminJ ¼ 1; 2; 3 . . . nð Þ
Where Uij is the membership function value of the trait (j) for the cultivar (i) for P response;
PRCjmax is the maximum value of the P response coefficient for the trait (j); PRCjmin is the
minimum value of PRCj. Comprehensive P response index value was calculated using the for-
mula:
CPRI ¼Xn
j¼1
Uij� jPRCijj=Xn
j¼1jPRCijj
h iðj ¼ 1; 2; 3 . . . :nÞ
Where CPRI is the comprehensive P response index of each wheat genotype under LP.
Results
Measure of variability and heritability of root traits
For seven traits (PRL, TRL, TSA, RAD, TRV, TRT, and TRF) tested under NLP and LP condi-
tions; analysis of variance indicated highly significant variation among the genotypes, phos-
phorus regimes and Genotype (G) vs Phosphorous (P) interactions for RSAs (Table 1). The
highly significant interaction between G × P showed that the genotypes responded differently
under contrasting P regimes for the RSAs indicating most of these traits were influenced
mainly by genotypic effect of wheat lines followed by NLP or LP phosphorous and their inter-
action. The coefficient of variation (CV) for the RSAs varied from RAD (5.93%) to TRT
(23.68%). As a strong determinant to response to selection, a relatively high broad-sense heri-
tability was observed in TSA (0.83%) followed by TRV (0.82%) and the lowest was obtained in
TRT (0.47%). The subclasses of TRL, TSA, TRV and TRF were also having significant G, P and
G × P interactions.
PLOS ONE Deciphering the change in root system architectural traits under limiting and non-limiting phosphorus in wheat
PLOS ONE | https://doi.org/10.1371/journal.pone.0255840 October 1, 2021 5 / 22
Genotypes response with phosphorus availability (phosphorus response
coefficient)
The study of 182 diverse wheat genotypes showed a wide variation in the mean values under
NLP and LP for traits under study (Table 2). The independent t-test showed that the mean val-
ues of TRL, TSA, TRV, TRT and TRF in LP were significantly high relative to the NLP.
Whereas PRL and RAD are substantially higher in the case of NLP compare to LP. The box-
plots of these traits over the P regimes have been demonstrated in (Fig 1) with mean values as
black “�”. The spread of variations between the Ist and IIIrd quartile were recorded higher for
TRL and TRF in LP, which means the level of P influence the expression of these traits in a
higher magnitude. Almost all subclasses of TRL, TSA, TRV, and TRT representing various
diameters had higher mean values in LP except RT3 was having a high mean value in NLP.
TRL and TRF showed high mean values for the phosphorus response coefficient (PRC), fol-
lowed by TSA, TRV and TRT. PRL and RAD showed a value of PRC < 1.0, suggesting that it
was reduced under limited P. The subclasses of TRL, TSA, TRV, TRT also had the >1 PRC in
LP which resembles their respective major class except for the RT3.
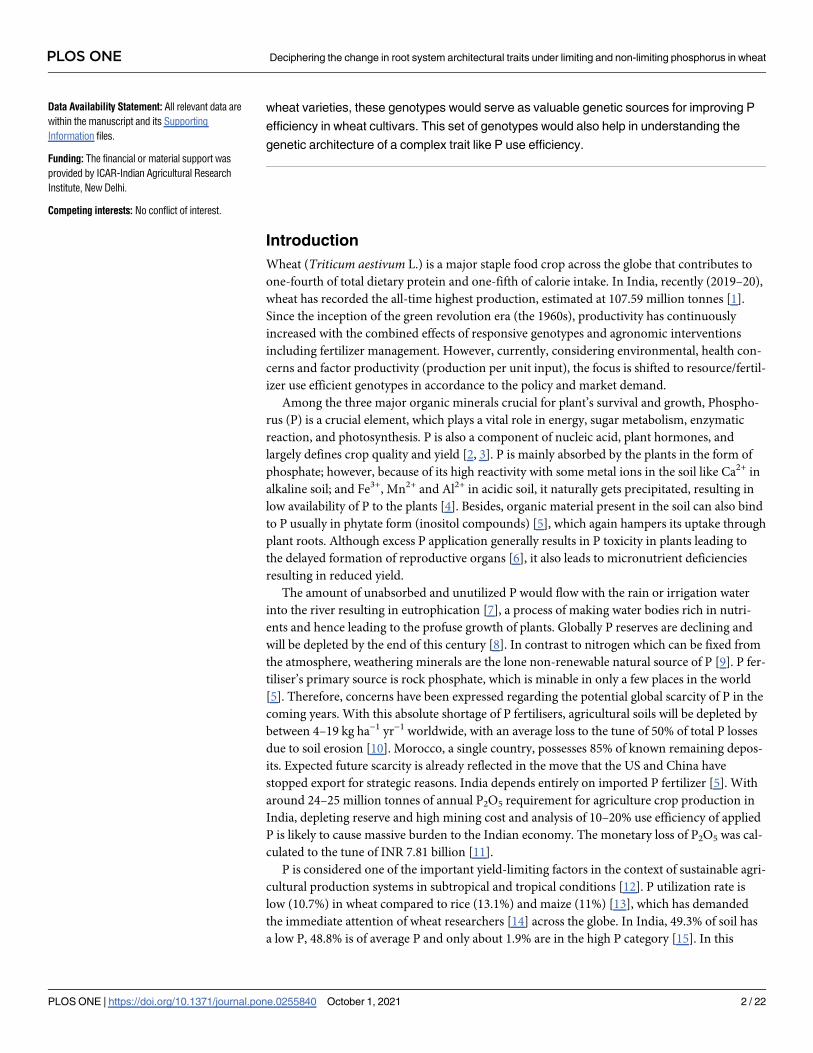
Table 1. Variance components, expected mean squares and heritability for root traits among 182 genotypes evaluated under non-limiting and limiting phosphorus
conditions.
Variables Mean squares CV (%) Heritability
Genotypes(G) Phosphorus(P) G x P
Df 181 1 181
PRL 205.79(<0.001) 3450.85(<0.001) 72.44(<0.001) 10.12 0.64
TRL 624689.91(<0.001) 32037168.18(<0.001) 112217.76(<0.001) 16.33 0.80
TSA 5510.73(<0.001) 166542.98(<0.001) 903.00(<0.001) 15.42 0.83
RAD 0.0064(<0.001) 0.1439(<0.001) 0.0015(<0.001) 5.93 0.76
TRV 0.3383(<0.001) 4.54(<0.001) 0.058 (<0.001) 16.34 0.82
TRT 8912636.24(<0.001) 43854974.88(<0.001) 4716964.59(<0.001) 23.68 0.47
TRF 12642180.35(<0.001) 731563841.05(<0.001) 2471231.18(<0.001) 21.20 0.81
TRL RL1 451361.79(<0.001) 31206255.42(<0.001) 93568.30(<0.001) 19.67 0.79
RL2 13762.44(<0.001) 1601.04(0.124) 3501.27(<0.001) 22.46 0.74
RL3 143.03 (<0.001) 580.082(<0.001) 52.04(<0.001) 38.20 0.63
RL4 20.19(<0.001) 84.36(<0.001) 10.65(<0.001) 58.04 0.47
RL5 1.36(<0.001) 2.85(0.0017) 0.83(<0.001) 71.44 0.37
TSA SA1 1315.46(<0.001) 101181.97(<0.001) 273.49(<0.001) 18.60 0.78
SA2 576.10(<0.001) 80.18(0.0936) 153.91(<0.001) 22.78 0.73
SA3 20.35(<0.001) 79.10(<0.001) 7.35(<0.001) 38.57 0.63
SA4 5.68(<0.001) 25.71(<0.001) 2.90(<0.001) 58.23 0.48
SA5 0.65(<0.001) 1.43(0.0015) 0.397(<0.001) 71.86 0.37
TRV RV1 0.04(<0.001) 2.99(<0.001) 0.009(<0.001) 18.13 0.77
RV2 0.16(<0.001) 0.032(0.0484) 0.046(<0.001) 23.30 0.71
RV3 0.0189(<0.001) 0.0697(<0.001) 0.0068(<0.001) 39.08 0.63
RV4 0.0103(<0.001) 0.0502(<0.001) 0.0051(<0.001) 58.48 0.49
RV5 0.002(<0.001) 0.0046(0.0013) 0.0012(<0.001) 72.45 0.38
TRT RT1 8626618.07(<0.001) 46922438.02(<0.001) 4738661.23(<0.001) 25.17 0.45
RT2 154.89(<0.001) 20.3306(0.2932) 85.74(<0.001) 39.69 0.44
RT3 6.0091(<0.001) 15.96(0.0008) 5.33(<0.001) 74.45 0.11
RT4 1.9639(<0.001) 3.187(0.012) 1.6389(<0.001) 81.34 0.16
RT5 0.4998(<0.001) 1.9377(0.0005) 0.3613(<0.001) 88.89 0.26
https://doi.org/10.1371/journal.pone.0255840.t001
PLOS ONE Deciphering the change in root system architectural traits under limiting and non-limiting phosphorus in wheat
PLOS ONE | https://doi.org/10.1371/journal.pone.0255840 October 1, 2021 6 / 22

Association studies for RSA traits
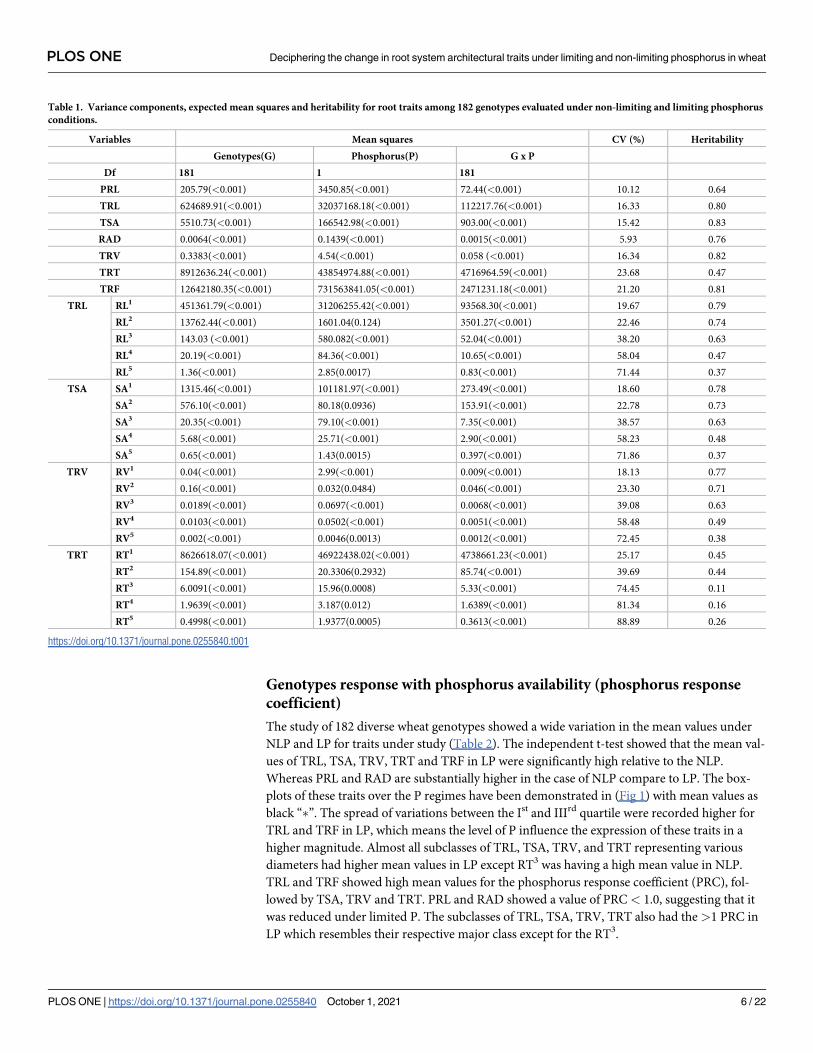
Pearson’s correlation coefficients revealed a substantial and positive correlations (p<0.01 and
p<0.001) among the measures of root traits (Fig 2). In NLP, a very high positive correlations
(r =>0.80) were observed for total root length with TSA, TRV and TRF (r = 0.98, r = 0.91and
r = 0.90 respectively); and for total root surface area with TRV and TRF (r = 0.98 and r = 0.86).
Similarly, moderate correlations (r = 0.61–0.80) were observed for primary root length with
TRL, TSA and TRV (r = 0.63, r = 0.64 and r = 0.62); for total root tips with TSA and TRL
(r = 0.65 and r = 0.71); and for total root fork with TRT and TRV (r = 0.64 and r = 0.78). RAD
had only positive significant correlation with TRV (r = 0.43) and TSA (r = 0.24), and non-sig-
nificant correlation with all the remaining root traits. The other correlations among the RSAs
were found to be weak or non-significant. An almost similar pattern of correlations among the
RSAs was also observed under LP conditions (Fig 2). However, it is interesting to see a signifi-
cant negative correlations of root average diameter with PRL (r = -0.45), TRL (r = -0.35), TSA
(r = -0.16), TRT (r = -0.30), TRF (r = -0.28) and non-significant positive association with TRV
(r = 0.09).
Table 2. Measures of variability and Phosphorus Response-Coefficient (PRC) for roots system architectural and their subclass traits under non-limiting and limit-
ing phosphorus conditions.
Variable Min Max Mean PRC(MEAN)
NLP LP NLP LP NLP LP
PRL 23 14.5 63 67.3 42.46 38.9 0.92
TRL 276.16 238.75 1623.03 2195.67 722.78 1065.35 1.47
TSA 25.95 26.01 159.35 226.97 72.93 97.63 1.34
RAD 0.24 0.22 0.45 0.52 0.32 0.30 0.94
TRV 0.17 0.17 1.30 1.87 0.59 0.72 1.22
TRT 587 498 10509 10942 2739.39 3140.19 1.15
TRF 754 631 8837 10223 2634.84 4271.83 1.62
TRL RL1 199.84 132.81 1602.09 1883.86 586.41 924.50 1.58
RL2 12.91 13.50 309.26 267.64 114.62 117.05 1.02
RL3 0.24 0.10 35.41 31.50 7.96 9.41 1.18
RL4 0 0 14.77 23.54 2.29 2.85 1.24
RL5 0 0 4.79 6.27 0.70 0.80 1.14
TSA SA1 12.13 10.50 88.73 110.59 34.38 53.63 1.56
SA2 2.46 2.64 63.49 55.6 23.15 23.69 1.02
SA3 0.08 0.04 13.11 11.8 2.97 3.51 1.18
SA4 0 0 8.11 12.41 1.22 1.52 1.25
SA5 0 0 3.38 4.39 0.49 0.56 1.14
TRV RV1 0.08 0.08 0.52 0.66 0.22 0.32 1.45
RV2 0.04 0.04 1.06 0.96 0.38 0.39 1.03
RV3 0 0 0.39 0.36 0.09 0.11 1.22
RV4 0 0 0.36 0.52 0.05 0.07 1.40
RV5 0 0 0.19 0.25 0.03 0.03 1.00
TRT RT1 584 304 10477 10863 2694.31 3108.89 1.15
RT2 0 0 48 67 10.66 10.94 1.03
RT3 0 0 10 9 1.52 1.28 0.84
RT4 0 0 7 10 0.57 0.68 1.19
RT5 0 0 3 3 0.2 0.28 1.40
https://doi.org/10.1371/journal.pone.0255840.t002
PLOS ONE Deciphering the change in root system architectural traits under limiting and non-limiting phosphorus in wheat
PLOS ONE | https://doi.org/10.1371/journal.pone.0255840 October 1, 2021 7 / 22

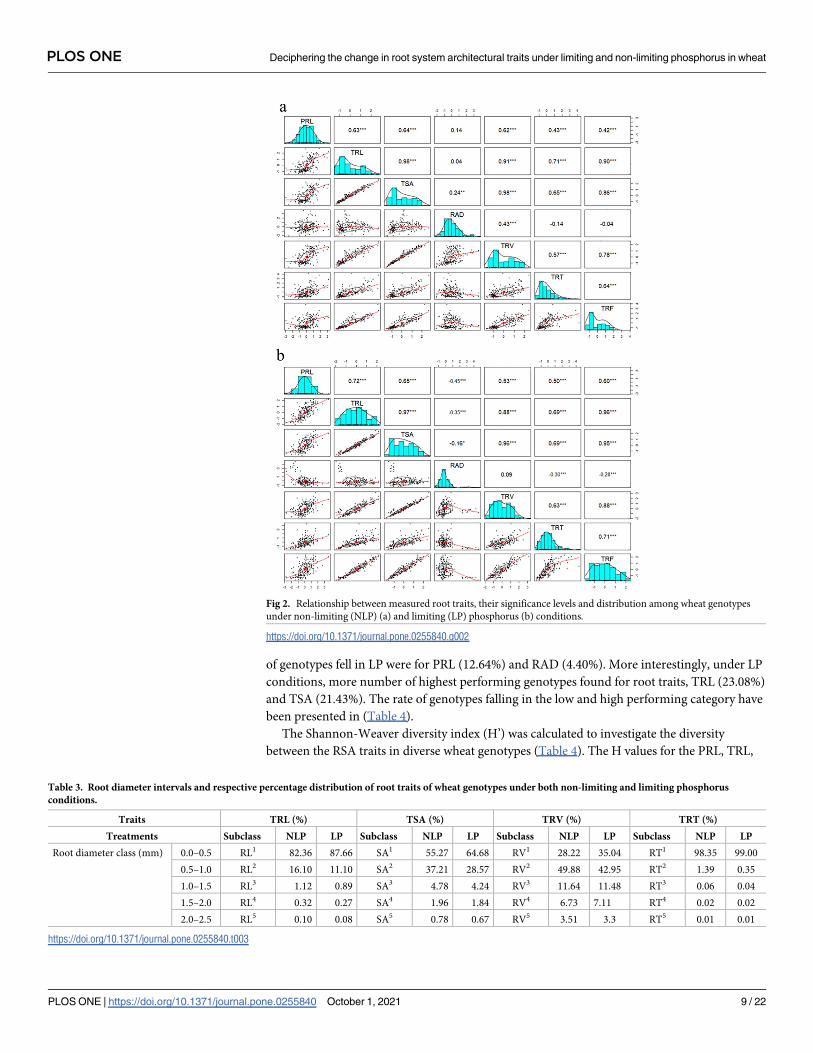
Fine root distribution patterns under differential P regimes
The distribution of fine roots over various root diameter intervals in both P was analysed to
understand the differential relationship that exists between root diameter and other root char-
acteristics (Table 3). The subclasses of TRL, TSA, and TRT representing the diameter of 0–0.5
mm viz., RL1, SA1, and RT1 had higher root distribution percentages than other diameter clas-
ses across the genotypes under both P regimes. However, RV2 (a subclass of TRV representing
0.5–1.0 mm diameter) had a higher root percentage than other subclasses of TRV. The subclass
of TRL, TSA, TRV and TRT representing the 0–0.5 mm diameter had a higher root distribu-
tion percentage in LP than NLP. While the subclasses of TRL, TSA, TRV and TRT represent-
ing 0.5–1.0 mm, 1.0–1.5 mm and 1.5–2.0 mm and 2.0–2.5 mm diameter, higher root
percentage in NLP than LP.
Diversity pattern with Shannon-Weaver diversity index (H)
The comparative analysis of root morphology of the various groups showed clear differences
for RSAs (Table 4). The genotypes were grouped into low, medium and high-performance cat-
egories based on the mean and standard deviation of each trait under both NLP and LP and
then the percentile of genotypes in each category is derived over total number of genotypes
(182). The majority of genotypes were grouped in to the medium performance category for all
RSAs irrespective of P regimes. In the high-performance category, a more significant number
of genotypes for all RSAs except PRL fell in the NLP regime, though the difference was very
minimal. However, in the low-performance category, more number of genotypes fell in the LP
regime for all the root traits except for PRL and RAD. In this category, the lowest percentage
Fig 1. Box plot showing the median and range of phenotypic variation in wheat genotypes in non-limiting and
limiting phosphorus conditions.
https://doi.org/10.1371/journal.pone.0255840.g001
PLOS ONE Deciphering the change in root system architectural traits under limiting and non-limiting phosphorus in wheat
PLOS ONE | https://doi.org/10.1371/journal.pone.0255840 October 1, 2021 8 / 22
of genotypes fell in LP were for PRL (12.64%) and RAD (4.40%). More interestingly, under LP
conditions, more number of highest performing genotypes found for root traits, TRL (23.08%)
and TSA (21.43%). The rate of genotypes falling in the low and high performing category have
been presented in (Table 4).
The Shannon-Weaver diversity index (H’) was calculated to investigate the diversity
between the RSA traits in diverse wheat genotypes (Table 4). The H values for the PRL, TRL,
Fig 2. Relationship between measured root traits, their significance levels and distribution among wheat genotypes
under non-limiting (NLP) (a) and limiting (LP) phosphorus (b) conditions.
https://doi.org/10.1371/journal.pone.0255840.g002
Table 3. Root diameter intervals and respective percentage distribution of root traits of wheat genotypes under both non-limiting and limiting phosphorus
conditions.
Traits TRL (%) TSA (%) TRV (%) TRT (%)
Treatments Subclass NLP LP Subclass NLP LP Subclass NLP LP Subclass NLP LP
Root diameter class (mm) 0.0–0.5 RL1 82.36 87.66 SA1 55.27 64.68 RV1 28.22 35.04 RT1 98.35 99.00
0.5–1.0 RL2 16.10 11.10 SA2 37.21 28.57 RV2 49.88 42.95 RT2 1.39 0.35
1.0–1.5 RL3 1.12 0.89 SA3 4.78 4.24 RV3 11.64 11.48 RT3 0.06 0.04
1.5–2.0 RL4 0.32 0.27 SA4 1.96 1.84 RV4 6.73 7.11 RT4 0.02 0.02
2.0–2.5 RL5 0.10 0.08 SA5 0.78 0.67 RV5 3.51 3.3 RT5 0.01 0.01
https://doi.org/10.1371/journal.pone.0255840.t003
PLOS ONE Deciphering the change in root system architectural traits under limiting and non-limiting phosphorus in wheat
PLOS ONE | https://doi.org/10.1371/journal.pone.0255840 October 1, 2021 9 / 22
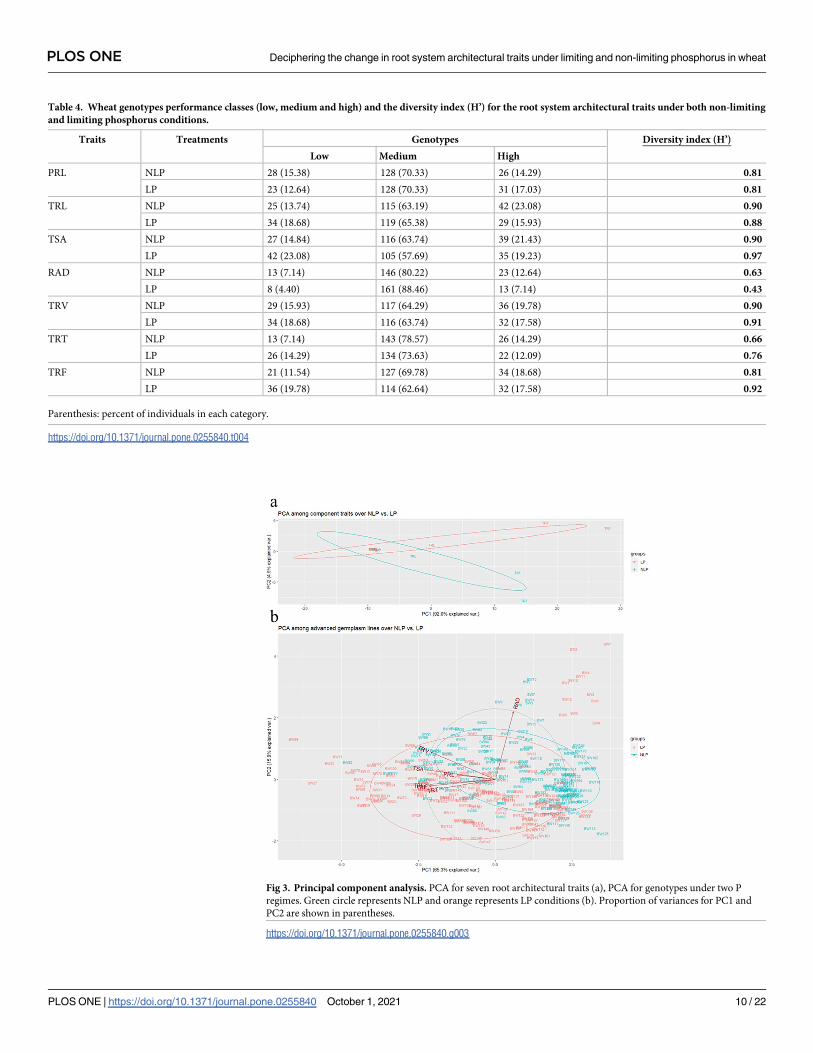
Table 4. Wheat genotypes performance classes (low, medium and high) and the diversity index (H’) for the root system architectural traits under both non-limiting
and limiting phosphorus conditions.
Traits Treatments Genotypes Diversity index (H’)
Low Medium High
PRL NLP 28 (15.38) 128 (70.33) 26 (14.29) 0.81
LP 23 (12.64) 128 (70.33) 31 (17.03) 0.81
TRL NLP 25 (13.74) 115 (63.19) 42 (23.08) 0.90
LP 34 (18.68) 119 (65.38) 29 (15.93) 0.88
TSA NLP 27 (14.84) 116 (63.74) 39 (21.43) 0.90
LP 42 (23.08) 105 (57.69) 35 (19.23) 0.97
RAD NLP 13 (7.14) 146 (80.22) 23 (12.64) 0.63
LP 8 (4.40) 161 (88.46) 13 (7.14) 0.43
TRV NLP 29 (15.93) 117 (64.29) 36 (19.78) 0.90
LP 34 (18.68) 116 (63.74) 32 (17.58) 0.91
TRT NLP 13 (7.14) 143 (78.57) 26 (14.29) 0.66
LP 26 (14.29) 134 (73.63) 22 (12.09) 0.76
TRF NLP 21 (11.54) 127 (69.78) 34 (18.68) 0.81
LP 36 (19.78) 114 (62.64) 32 (17.58) 0.92
Parenthesis: percent of individuals in each category.
https://doi.org/10.1371/journal.pone.0255840.t004
Fig 3. Principal component analysis. PCA for seven root architectural traits (a), PCA for genotypes under two P
regimes. Green circle represents NLP and orange represents LP conditions (b). Proportion of variances for PC1 and
PC2 are shown in parentheses.
https://doi.org/10.1371/journal.pone.0255840.g003
PLOS ONE Deciphering the change in root system architectural traits under limiting and non-limiting phosphorus in wheat
PLOS ONE | https://doi.org/10.1371/journal.pone.0255840 October 1, 2021 10 / 22

TSA, TRV, RAD, TRT and TRF varied largely and overall it ranged from 0.43–0.97 across the
roots traits. RAD, TRT and TRF showed relatively higher variation (0.63 vs 0.43; 0.66 vs 0.76
and 0.81 vs 0.92 for NLP vs LP conditions respectively). While, PRL did not vary at all under
both the NLP and LP conditions. In comparison to NLP, a wide range of H’ value i.e. 0.43 to
0.97 in LP, indicates that the expression pattern of these traits is highly influenced by availabil-
ity of P. These traits were having the differential pattern of H’ values over NLP and LP. In LP,
higher H’ values for all the traits except RAD (0.43) and TRT (0.79) were observed. In LP, the
reduction in the H’ value of RAD (0.43) indicates that this trait’s full expression is hampered
under limited P. In contrast, LP had given the ambience for higher expression of TRV, TRF
and TSA with higher H’ values i.e. 0.91, 0.92 and 0.97 respectively.
Large amount of non-crossover interaction predicted by the principal
component analysis
PCA based grouping of traits over LP and NLP conditions (Fig 3), indicated that the first prin-
ciple component (PC1) had explained 92% variation defining the presence of a large amount
of non-crossover interaction. The traits RAD, TSA, PRL and TRV were grouped together and
having a low PC2 score. TRT, TRF and TRL were separated with different P regimes, in-
between TRF and TRT had the high PC2 score followed by TRL in both P regimes. The distri-
bution of genotypes with PCA over LP and NLP indicates that TRV, TRL, PRL, TRT, TRF and
TSA are positively correlated, while RAD is not associated with these root traits. Among the
tested wheat genotypes BW99, BW71, BW92, BW95, BW88, BW75, BW66, BW13, BW79, and
BW89, were positively correlated with TRV, TRL, PRL, TRT, TRF and TSA with high trait
expression value under LP. Meanwhile, genotypes BW92 and BW75 were having a high trait
expression of these traits irrespective of P availability. The genotypes, BW2, BW10, BW7,
BW8, BW11, BW3 in NLP; and BW2, BW7, BW4, BW11 in LP were having a positive associa-
tion with RAD. While genotypes BW2, BW7, BW11 were common in both P regimes. ‘Which
Won Where’ had given precise insights to select the best genotypes for respective P regimes. In
LP, BW7 &, BW2 for RAD; BW99 for TRV, TSA, TRF, TRL; and BW27 for PRL, TRT were
the best genotypes. While, BW10; BW92 for TRT, TRF, TRL; and BW52 for TSA, PRL, TRV
were the best genotypes in NLP (Fig 4).
Grouping wheat genotypes in to different classes based on comprehensive P
response index (0–1)
The comprehensive response of all wheat genotypes for P use was estimated through a com-
prehensive synthetic index, using subordination function value analysis to enquire the
response of root system architecture under limiting and non-limiting phosphorus conditions
(S2 Table). Based on the comprehensive synthetic index, 182 wheat genotypes were grouped
into five different classes which varied from 0.03 in 0.90 across the genotypes. First class com-
prised high P stress responsive genotypes with comprehensive P response index higher than
0.70. The variation in the RSAs of contrasting genotypes based on CPRI values is presented in
Table 5 and Fig 5. Genotype BW181 with the highest CPRI value observed higher values for
PRL, TRL, TSA, TRV, TRT, TRF and except for RAD under LP than NLP.
The second class comprised of 17 genotypes with CPRI values ranges between 0.50 and
0.70. A total of 44 genotypes fell in to class three which exhibited moderate responsive with
CPRI values between 0.30 and 0.50 consists. Low P responsive genotypes (100) with CPRI val-
ues between 0.10 and 0.30 were grouped in to fourth class, while fifth class comprising 16
genotypes, including BW 9 and BW 139, poor performing genotypes for all LP traits, showed
non-responsiveness with CPRI values below 0.10. Mean P response coefficient values for all
PLOS ONE Deciphering the change in root system architectural traits under limiting and non-limiting phosphorus in wheat
PLOS ONE | https://doi.org/10.1371/journal.pone.0255840 October 1, 2021 11 / 22
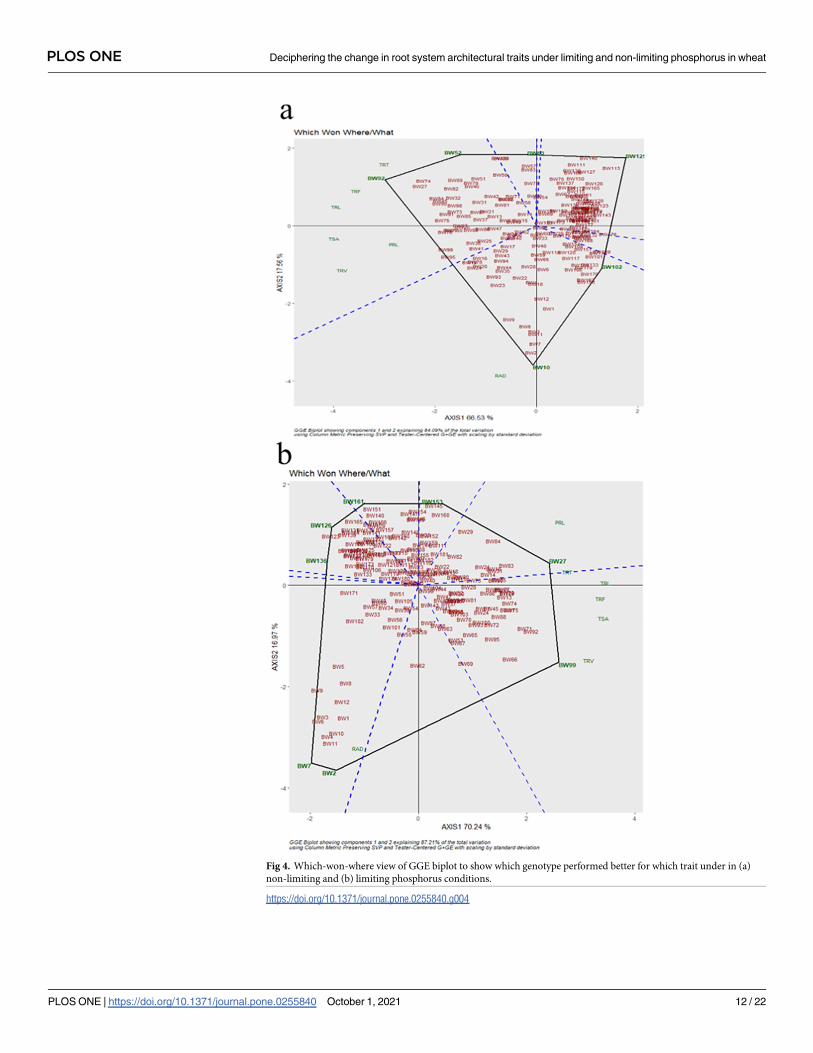
Fig 4. Which-won-where view of GGE biplot to show which genotype performed better for which trait under in (a)
non-limiting and (b) limiting phosphorus conditions.
https://doi.org/10.1371/journal.pone.0255840.g004
PLOS ONE Deciphering the change in root system architectural traits under limiting and non-limiting phosphorus in wheat
PLOS ONE | https://doi.org/10.1371/journal.pone.0255840 October 1, 2021 12 / 22

root characteristics were highest for class 1, moderate for class 2, 3 and 4, and lowest for class
5, except for RAD. This result indicates that P efficient wheat genotypes with higher CPRI val-
ues also had higher P response coefficients.
The per cent change in the RSA traits from NLP to LP of the top five genotypes was positive
for TRL (19.12), TSA (18.25), TRV (16.98), TRT (20.97), TRF (25.49) but PRL (-0.34) and
RAD (-0.40) showed a negative trend. The highly responsive genotype class has shown that the
reduction in PRL and RAD traits with increasing in RSA remaining traits under limiting phos-
phorous conditions. In case of bottom five genotypes with low P response, the per cent changes
are PRL (-19.81), TRL (-12.35), TSA (-14.76), RAD (-1.31), TRV (-16.43), TRT (-30.71) and
TRF (-4.62) which clearly evident that a decrease in the RSA traits in the LP conditions in com-
parison to the NLP condition for non-responsive genotypes. In order to have a comparative
understanding, three high yielding commercial varieties viz., HD2967, HD3226 and
HDCSW18 which were bred under optimum P environment were tested for the P response
and they exhibited CPRI index value of 0.16, 0.15 and 0.08 respectively. These genotypes
showed low P response, even though having a better root trait compared to most of the
advanced breeding lines.
Discussion
Phosphorus is a main component of nucleic acid, plant hormones, and largely defines crop
growth, quality and consolidated yield [2, 3]. Insufficiency of P affects the photosynthetic abil-
ity and electron transport by repressing orthophosphate concentration in stroma, thus inhibit-
ing ATP synthase activity [43]. Generally, greater root:shoot ratio was observed under P stress
due to the tendency of plants to increase the root biomass to uptake more nutrients [44, 45]
from the soil. The root system is a vital organ for the absorption of nutrients and water in
plants and their rate of uptake is largely determined by physiological characteristics of plant
Table 5. Comprehensive phosphorus response index values and top ten contrasting wheat genotypes for seven root system architectural traits under non-limiting
and limiting phosphorus conditions.
GENOTYPES CPRI ROOT TRAITS
PRL TRL TSA RAD TRV TRT TRF
NLP LP NLP LP NLP LP NLP LP NLP LP NLP LP NLP LP
Top 5 genotypes
BW181 0.904 45.25 46.88 421.95 1095.46 38.89 98.91 0.31 0.29 0.30 0.71 1314.97 4399.64 1192.72 4537.69
BW103 0.806 36.48 33.72 529.37 1416.75 49.83 128.96 0.30 0.29 0.38 0.93 1721.18 3996.07 1707.32 6391.79
BW104 0.751 41.85 42.06 437.84 1141.38 40.38 107.31 0.29 0.30 0.30 0.80 1556.65 3888.83 1380.11 3807.77
BW143 0.733 29.94 33.70 440.98 1140.43 43.02 105.90 0.31 0.30 0.34 0.78 1389.65 3260.42 1757.44 5883.29
BW66 0.708 41.09 31.50 647.68 1654.60 66.41 159.78 0.33 0.31 0.54 1.23 2245.13 7375.77 3647.26 7438.71
% Change -0.34 19.12 18.25 -0.40 16.98 20.97 25.49
Bottom 5 genotypes
BW9 0.033 47.19 21.33 699.40 434.54 87.32 51.20 0.39 0.39 0.87 0.49 3137.18 862.21 2267.88 1935.96
BW139 0.039 43.81 34.31 767.76 559.12 73.82 48.90 0.31 0.28 0.57 0.34 8557.33 1895.12 2657.02 1977.49
BW136 0.057 33.55 26.18 526.26 487.52 52.89 43.77 0.32 0.29 0.43 0.32 3857.57 1388.07 1920.56 1732.26
BW3 0.060 46.75 25.22 585.75 430.61 73.40 54.34 0.39 0.42 0.73 0.56 1628.54 847.16 2170.52 1872.13
BW8 0.074 49.68 29.86 635.72 533.48 78.77 63.73 0.39 0.39 0.78 0.62 2115.31 1617.29 1774.04 2141.80
% Change -19.81 -12.35 -14.76 -1.31 -16.43 -30.71 -4.62
HD 3226 0.15 54.53 48.17 1228.60 1499.68 139.09 159.65 0.36 0.34 1.25 1.35 2540.00 3429.33 4420.67 5730.00
HDCSW18 0.16 56.50 50.60 1181.50 1608.41 121.04 146.99 0.33 0.29 0.99 1.07 3062.67 4406.00 4142.00 5002.00
HD 2967 0.08 36.00 27.83 496.67 254.22 59.77 38.01 0.41 0.48 0.56 0.46 1519.33 451.33 1841.33 1012.67
https://doi.org/10.1371/journal.pone.0255840.t005
PLOS ONE Deciphering the change in root system architectural traits under limiting and non-limiting phosphorus in wheat
PLOS ONE | https://doi.org/10.1371/journal.pone.0255840 October 1, 2021 13 / 22

roots [17]. Therefore, the study of variation in root architectural traits and their associations
with each other would help us to maximize the efficiency of nutrient and water use and iden-
tify key traits showing maximum positive response would help to improve wheat genotypes
suitable for LP conditions. These traits would also be readily, transferred to high yielding, but
P non responsive genotypes to develop higher yielding P responsive cultivars for the future
world.
Though understanding the plants root system is very important to estimate nutrient
absorption efficiency and to characterise, and select better genotypes responsive to P uptake,
there are no systematic studies undertaken so far in wheat crop on Indian breeding material.
Hence, the current investigation was carried out to systematically characterize Indian wheat
germplasm for root architectural traits and to understand their differential ability to phospho-
rus use efficiency and response.
Fig 5. Root system architecture of better performing (BW 181 and BW 103) and poor performing (BW 9 and BE
139) genotypes grown under non-limiting (NLP) and limiting (LP) phosphorus conditions.
https://doi.org/10.1371/journal.pone.0255840.g005
PLOS ONE Deciphering the change in root system architectural traits under limiting and non-limiting phosphorus in wheat
PLOS ONE | https://doi.org/10.1371/journal.pone.0255840 October 1, 2021 14 / 22
Analysis of variance revealed the presence of significant variations for genotypes, P regimes,
and G×P interactions for all the root traits under present study. The significance of G×P indi-
cates that wheat genotypes root traits have been substantially modified by conditions LP and
NLP under the hydroponics. This indicates that the tested genotypes possess differential
responsive ability and they adopt different root traits for available P conditions. The maximum
mean sum of squares among the RSA traits was observed for TRT, not only across genotypes
and the P regimes, but also for their interaction (G×P). This suggests that there is an ample
scope for exploring this trait to improve wheat genotypes for better P use efficiency. The low
CV, for RAD established the fact that, the tested genotypes performed stably across the replica-
tions, leading error free estimations. But, TRT has showed little high variation, as these root
traits may vary considerably within the common treatment. This makes interpretation through
root studies, more complicated and unrealistic in developing a standard scale value. The, var-
ied response indicated for these root traits creates a definitive platform for the adoption of
unique selection and breeding strategies for developing the P responsive genotypes in wheat.
High broad-sense heritability of the RSAs gives indications of the presence of underlying geno-
mic regions with significant genotypic effect on these root traits. So, there is always a scope for
improving wheat breeding lines, through selection and introgression of underlying gene(s)
responsive to P use without much influence of environment. The genetic stability of a particu-
lar genotype for any trait under consideration is determined by low coefficient of variation
and high heritability of respective traits [42].
The, reduction of mean PRL and enhancement in TRL of genotypes under LP our findings
is also supported by the change in primary root elongation reported as a typical phenomenon
in response to P deprivation in other major cereal rice (O. Sativa) [46, 47]. The enhanced pri-
mary root length growth was reported in rice [48] and green gram [42], but was found to be
inhibited in Arabidopsis in response to P deficiency [49]. The reduction of cell differentiation
within the primary root meristem and the inhibition of cell proliferation in the root elongation
zone reduce the PRL in P deficient [50, 51]. The inhibition of primary root growth and prolif-
eration of lateral root formation is enhanced by relocating mitotic activity at the sites of lateral
root formation by P deficiency, resulting in increased total root length [52, 53]. Likewise, the
reduction of RAD in LP in our finding is in line with previous findings, as a 30% reduction in
root diameter from high P to low P [54]. A reduction in root diameter, root mass density, and
an increase in specific root length was observed in temperate pasture species [55]. In compari-
son to adequate P condition, root diameter reduction was recorded under low P in Zea mays
[56] and Aegilops tauschii [57] under P limitation. Earlier researchers have observed an higher
per cent increment in root length by 113% and 80%, respectively, in two wheat cultivars, Crac
and Tukan with a reduction in root diameter [58]. Also P stress, showed greater root surface
area and root volume in the P efficient genotypes of mungbean [11].
Association studies helps to identify highly interactive traits, in response to a given treatment
and hence, helps in picking positive traits for selection and improvement. In both P regimes, all
RSA traits viz., TRV, TRL, PRL, TRT, TRF and TSA were having the moderate to high associa-
tions with each other except for RAD. However, the correlations of RAD with other traits were
changed with P regimes, indicating influence of availability of P has substantially affected the
way these traits interact. Under non-limiting conditions also TRL was positively correlated with
TSA and TRV in wheat [59] showing their noninfluential interactive modifications under dif-
ferent P regimes. In LP, RAD had significant negative correlations with PRL, TRL, TSA, TRT
and TRF and no correlation with TRV. In contrary, under NLP the significant positive correla-
tion of RAD with TRV and TSA and a non-significant association with other traits were
observed. This proves the fact that, under stressed environment of P unavailability RAD reduces
drastically independent of other root traits where they show increased mean values. Therefore,
PLOS ONE Deciphering the change in root system architectural traits under limiting and non-limiting phosphorus in wheat
PLOS ONE | https://doi.org/10.1371/journal.pone.0255840 October 1, 2021 15 / 22

RAD is a key characteristic feature for differentiating tested root traits and to study of the
impact of available P on plant growth. The vigorous root system of the plant thus not only
encourages the establishment of good crops but also ensures the survival of the plants under
these stressful conditions. Moreover, at the plant’s early growth stage, the absorption of nutri-
ents is facilitated by vigorous root growth along with higher root length and surface area [60].
Even though the genetic variation of the root system differs from plant to plant, the exis-
tence of very fine to fine roots determines the most percentage of root traits, which is essential
for water and nutrient uptake [61, 62]. In this study, we observed the high percentage of fine
roots in diameter class from 0.0 to 0.5 mm in LP compared to NLP condition, while the per-
centage of roots with>0.5 mm diameter was more in NLP condition. It was very interesting to
note that, two root traits viz., TRL and TRT had a maximum percent of very fine roots (0.0–
0.50mm) under both the conditions, with a higher mean trending towards LP. This showed
the deciding factor of P availability on the percent of fine root distribution pattern at different
diameter classes in the wheat genotypes. Due to fine roots tend to turn over more rapidly than
coarse roots, the carbon cost of producing finer roots may be higher as these will have to be
replaced more frequently [63]. Under P deficient condition, plant species produce more fine
roots that increase total root area in contact with larger soil volume per unit of root surface
area, thereby increasing P uptake rates [22, 63]. Enhanced fine root production results in
improving the total adsorption area, as an adaptive strategy of crop plants stress-tolerance
mechanism [64]. In addition, the presence of fine root hairs [65] and roots with less diameter
allows better absorption of nutrients due to increased available absorptive surface area. This
must prove an obviousness that, the genotypes with the better root systems outperform in
terms of yield as compared to genotypes with poor root traits.
Based on mean performance and standard deviation of root characteristics as a criterion of
selection [41] wheat genotypes were classified into high, medium and low- efficiency classes.
In the high-performance group, a high percentage of genotypes for RSAs, especially TRL and
RAD in the NLP regime than LP, indicate that only a few selective genotypes remain respon-
sive in limited P and the genotypes itself vary in their response to P. As expected, the high per-
centage of genotypes for RSAs except PRL and RAD fell in LP under the low-performance
group. The Shannon-Weaver diversity index (H’) revealed high diversity among the genotypes
for RSAs over NLP and LP. The presence of a wide range of H’ value i.e. 0.43 to 0.97 in LP indi-
cates that the expression pattern of RSAs is highly influenced by the level of P. The higher H’
value indicates balanced frequency distribution and greater phenotypic diversity, while lower
H’ value indicates an extremely unstable frequency distribution with a lack of diversity for that
trait [41]. Regardless of root length, larger diversity in root diameter is due to the changes in
the fine root distribution pattern for each root diameter in response to the nutritional environ-
ment [61]. In contrast, LP had given the ambiance for higher expression of TRV, TRF and
TSA with higher H’ values. The Shannon-Weaver Diversity Index (H’) were previously used to
describe the diversity of root traits in rice [66], maize [67], and mungbean [42].
The PCA analysis to study the expression pattern of root traits over LP and NLP revealed
that a high PC score (92%) defines the presence of a large amount of non-crossover interac-
tion. The traits, namely RAD, TSA, PRL and TRV had a PC2 score close to zero, which shows
the parallel response of these traits for a large number of genotypes in either direction over LP
and NLP (Fig 2). The traits namely TRV, TRL, PRL, TRT, TRF and TSA were positively corre-
lated with each other, and RAD was independent of other traits. Genotypes pertaining to LP,
with high trait expression value were positively correlated with TRV, TRL, PRL, TRT, TRF and
TSA. The same correlation pattern among the traits was observed in mungbean [42]. The
genotypes BW92 and BW74 had a high trait expression, and BW123 and BW126 were having
a low trait expression for these traits irrespective of P regimes. Therefore, genotypes having
PLOS ONE Deciphering the change in root system architectural traits under limiting and non-limiting phosphorus in wheat
PLOS ONE | https://doi.org/10.1371/journal.pone.0255840 October 1, 2021 16 / 22

high and low performance can be utilized for making bi-parental populations that would have
a very low influence on P regimes. With the help of the ‘Which Won Where’ biplot best geno-
types for individual traits in both P regimes were selected (Fig 3). Our results suggested that
TRL, TSA, TRV and TRF were sufficient to explain the most of variation and these were
proved to be ideal traits for phosphorus uptake efficiency screening at seedling stage. As most
of these traits showed very close relatedness in terms of explaining the variation we, can choose
TRL as the main trait as it is a combination of many component RSA traits determining the
efficiency of genotypes.
CPRI is based on relative trait values i.e. PRC of traits and degree of membership between
trait value and P response i.e. MFVP [68], considering all traits together regardless of the
nature of the trait. It represents the response of the genotypes based on the magnitude of
change of all traits from NLP to LP. The genotypes BW181, BW103, BW104, BW143, and
BW66 were found to be most P responsive based on CPRI value. The most contributing in top
five P stress-responsive genotypes was TRF followed by TRT, TRL, TSA and TRV. Total root
length and root dry weight were able to provide the most contribution to total variation and
sufficient to improve other root traits in maize [25, 49]. The PRL and RAD have classified the
least contributing traits in gaining the P responsive due to their average negligible share in
CPRI index of the top five P responsive genotypes. In contrast, BW9, BW139, BW136, BW3
and BW8 were classified as non-responsive genotypes. The drastic reduction was seen in TRT
followed by PRL, TRV, TSA and TRL. The least affected trait in the bottom five genotypes was
RAD followed by TRF. This result indicates that RAD is the least important trait in developing
the P efficiency of genotypes, while TRF is of very high importance in increasing P limitation
efficiency. However, TRF and RAD were not reduced drastically in limited P, which means
both the traits are essential in the survival of the plants in limited P. This classification is
important for selection of genotypes for desirable RSA traits under limiting p conditions. Fur-
thermore, these genotypes with contrasting root traits can be used in recombination breeding
programme to develop P efficient cultivars [69, 70]. The three commercial varieties, used for a
comparative understanding of P response, showed very low comprehensive phosphorus
response index values, as they were initially bred under non-limiting P conditions. In our find-
ings, HDCSW18 was identified as low P responsive because it is having high TRL, PRL, TSA,
TRF and TRT values in both P regimes. That means this variety might be having an inherent
capacity to show constant response to changing P regimes for RSA traits. Under CA environ-
ments the nutrient use efficiency is low as compared to normal tillage conditions. Because the
applied fertiliser is retained for longer time on the soil surface and the plants should have the
inherent capacity to absorb the nutrients from the soil rather than totally dependent on the
external supply of fertiliser. HDCSW18 has been bred under Conservation Agriculture (CA)
environments and therefore believed to be having better absorption capacity for the nutrients
due to its strong RSA traits. Based on the pedigree information, few genotypes which shared
common parentage varied for their P response index. For example, genotypes BW143, BW69,
BW1, BW162, BW 6 and BW 171 developed through a cross CSW2/ HD2932+Yr15, showed
high to very low/non-responsiveness. This may be due to the reason that, both the parents are
contrasting for P use efficiency. It also shows that the P use efficiency is polygenic in nature
and these lines may be suggestive to be used as parents in developing mapping populations for
dissecting P use efficiency.
Conclusion
To reduce the P footprint on the environment and to lessen the economic burden due to over
P fertilisation, increasing the PUE of the important cereal crop like wheat is the present-day
PLOS ONE Deciphering the change in root system architectural traits under limiting and non-limiting phosphorus in wheat
PLOS ONE | https://doi.org/10.1371/journal.pone.0255840 October 1, 2021 17 / 22

need. Knowing the complexity of root traits exploration under field conditions, its labour
intensiveness and the large influence by the environment these traits, these traits are least
explored by the breeders in improving crop plants. Our earlier findings on nitrogen use effi-
ciency, another important mineral, revealed a significant association between hydroponic and
soil-filled pot conditions for nitrogen use efficiency. Therefore, screening of RSAs under
hydroponics was used to measure the P use response of wheat genotypes. Hydroponics helps
in the preliminary screening of a large number of genotypes with minimum efforts under con-
trolled conditions. Our results indicated that the P-efficient genotypes showed increased fine
root anatomy and their adaptation strategy to P limitation conditions. Under LP-condition,
important RSA traits like TRL, TSA, TRV, TRT and TRF of P-efficient genotypes were signifi-
cantly higher than P-inefficient and these traits can be used as direct measures of P use
response and can be used readily in selecting genotypes with higher P efficiency. We could
identify five genotypes BW 181, BW 103, BW 104, BW 143 and BW 66, with higher P response
and further these genotypes can be used for developing P efficient wheat cultivars. The identi-
fied highly efficient genotypes can also be used in developing mapping populations with inef-
fective genotypes for dissecting the genomic regions responsible for PUE. It is further needed
to investigate the relationship of RSA in the adult plant stage and their correlation with the
seedling root traits for a better understanding of the differential expression of these traits in
response to natural P availability conditions.
Supporting information
S1 Table. List of 182 wheat genotypes used in the study.
(PDF)
S2 Table. Comprehensive phosphorus response index value of 182 wheat advanced breed-
ing lines used in the study.
(PDF)
Acknowledgments
Authors are thankful to Dr. A. K. Singh, Director, IARI, New Delhi, Dr. Rajbir Yadav, Head,
Division of Genetics, Dr. Vinod, Professor Division of Genetics, IARI, New Delhi and Dr.
Akshay Talukdar, Principal Scientist, Division of Genetics, IARI, New Delhi (Incharge,
National Phytotron Facility) for providing the necessary facilities for smooth conductance of
research.
Author Contributions
Conceptualization: Rajbir Yadav.
Formal analysis: Palaparthi Dharmateja, Manjeet Kumar, Pranab Kumar Mandal.
Funding acquisition: Rajbir Yadav.
Investigation: Palaparthi Dharmateja, Kamre Kranthi kumar, Narain Dhar, Rihan Ansari,
Nasreen Saifi.
Methodology: Palaparthi Dharmateja, Rakesh Pandey, Rajbir Yadav.
Project administration: Rajbir Yadav.
Resources: Rakesh Pandey, Rajbir Yadav.
Software: Palaparthi Dharmateja, Manjeet Kumar, Prashanth Babu, Vipin Tomar.
PLOS ONE Deciphering the change in root system architectural traits under limiting and non-limiting phosphorus in wheat
PLOS ONE | https://doi.org/10.1371/journal.pone.0255840 October 1, 2021 18 / 22

Supervision: Palaparthi Dharmateja, Manjeet Kumar, Pranab Kumar Mandal.
Validation: Palaparthi Dharmateja.
Visualization: Rakesh Pandey, Naresh Kumar Bainsla, Kiran B. Gaikwad, Rajbir Yadav.
Writing – original draft: Palaparthi Dharmateja, Manjeet Kumar.
Writing – review & editing: Manjeet Kumar, Prashanth Babu, Rajbir Yadav.
References1. Ministry of Agriculture and Farmers Welfare, Government of India. 2020 (https://eands.dacnet.nic.in/
Advance_Estimate/4th_Adv_Estimates2019-20_Eng.pdf)
2. Qiu H, Mei X, Liu C, Wang J, Wang G, Wang X, et al. Fine mapping of quantitative trait loci for acid phos-
phatase activity in maize leaf under low phosphorus stress. Mol Breed. 2013 Oct; 32(3):629–39.
3. Yun SJ, Kaeppler SM. Induction of maize acid phosphatase activities under phosphorus starvation.
Plant Soil. 2001; 237(1):109–15.
4. Su JY, Zheng Q, Li HW, Li B, Jing RL, Tong YP, et al. Detection of QTLs for phosphorus use efficiency
in relation to agronomic performance of wheat grown under phosphorus sufficient and limited condi-
tions. Plant Sci. 2009 Jun; 176(6):824–36.
5. Van de Wiel CCM, van der Linden CG, Scholten OE. Improving phosphorus use efficiency in agricul-
ture: opportunities for breeding. Vol. 207, Euphytica. Springer Netherlands; 2016;1–22.
6. Maharajan T, Ceasar SA, Ajeesh krishna TP, Ramakrishnan M, Duraipandiyan V, Naif Abdulla AD,
et al. Utilization of molecular markers for improving the phosphorus efficiency in crop plants. Plant
Breeding. Blackwell Publishing Ltd; 2018; 137:10–26.
7. Yang XE, Wu X, Hao HL, He ZL. Mechanisms and assessment of water eutrophication. J Zhejiang Univ
Sci B. 2008; 9(3):197–209. https://doi.org/10.1631/jzus.B0710626 PMID: 18357622
8. Manschadi AM, Kaul H-P, Vollmann J, Eitzinger J, Wenzel W. Reprint of “Developing phosphorus-effi-
cient crop varieties—An interdisciplinary research framework.” F Crop Res. 2014; 165:49–60.
9. Schlesinger WH, Bernhardt ES. Biogeochemistry: an analysis of global change. Academic press. 2013.
10. Alewell, C., Ringeval, B., Ballabio, C., Robinson, D., Panagos, P. and Borrelli, P., Global phosphorus
shortage will be aggravated by soil erosion, Nat Comm., ISSN 2041-1723,2020 Nov:4546, JRC119626.
11. Pandey R, Meena SK, Krishnapriya V, Ahmad A, Kishora N. Root carboxylate exudation capacity under
phosphorus stress does not improve grain yield in green gram. Plant Cell Rep. 2014; 33(6):919–28.
https://doi.org/10.1007/s00299-014-1570-2 PMID: 24493254
12. Ramaekers L, Remans R, Rao IM, Blair MW, Vanderleyden J. Strategies for improving phosphorus
acquisition efficiency of crop plants. F Crop Res. 2010; 117(2–3):169–76.
13. Ma W, Ma L, Li J, Wang F, Sisak I, Zhang F. Phosphorus flows and use efficiencies in production and
consumption of wheat, rice, and maize in China. Chemosphere [Internet]. 2011; 84(6):814–21. https://
doi.org/10.1016/j.chemosphere.2011.04.055 PMID: 21570104
14. Shabnam R, Iqbal MT. Phosphorus use efficiency by wheat plants that grown in an acidic soil. Brazilian
J Sci Technol. 2016; 3(1).
15. Hasan BR. Phosphorus Status of Soils in India. Crops. 1996; 10(2):4–5.
16. Gamuyao R, Chin JH, Pariasca-Tanaka J, Pesaresi P, Catausan S, Dalid C, et al. The protein kinase
Pstol1 from traditional rice confers tolerance of phosphorus deficiency. Nature. 2012; 488(7412):535–9.
https://doi.org/10.1038/nature11346 PMID: 22914168
17. Hodge A, Berta G, Doussan C, Merchan F, Crespi M. Plant root growth, architecture and function. Plant
Soil. 2009; 321(1):153–87.
18. Zhu J, Mickelson SM, Kaeppler SM, Lynch JP. Detection of quantitative trait loci for seminal root traits in
maize (Zea mays L.) seedlings grown under differential phosphorus levels. Theor Appl Genet. 2006;
113(1):1–10. https://doi.org/10.1007/s00122-006-0260-z PMID: 16783587
19. Niu YF, Chai RS, Jin GL, Wang H, Tang CX, Zhang YS. Responses of root architecture development to
low phosphorus availability: a review. Ann Bot. 2013; 112(2):391–408. https://doi.org/10.1093/aob/
mcs285 PMID: 23267006
20. Gericke WF. The beneficial effect to wheat growth due to depletion of available phosphorus in the cul-
ture media. Science (80-). 1924; 60(1552):297–8. https://doi.org/10.1126/science.60.1552.297-a
PMID: 17798090
21. Gericke WF. Salt requirements of wheat at different growth phases. Bot Gaz. 1925; 80(4):410–25.
PLOS ONE Deciphering the change in root system architectural traits under limiting and non-limiting phosphorus in wheat
PLOS ONE | https://doi.org/10.1371/journal.pone.0255840 October 1, 2021 19 / 22

22. Fohse D, Claassen N, Jungk A. Phosphorus efficiency of plants. Plant Soil. 1991; 132(2):261–72.
23. Zhu J, Kaeppler SM, Lynch JP. Mapping of QTLs for lateral root branching and length in maize (Zea
mays L.) under differential phosphorus supply. Theor Appl Genet. 2005; 111(4):688–95. https://doi.org/
10.1007/s00122-005-2051-3 PMID: 16021413
24. Bates TR, Lynch JP. Stimulation of root hair elongation in Arabidopsis thaliana by low phosphorus avail-
ability. Plant Cell Environ. 1996; 19(5):529–38.
25. Peret B, Clement M, Nussaume L, Desnos T. Root developmental adaptation to phosphate starvation:
better safe than sorry. Trends Plant Sci. 2011; 16(8):442–50. https://doi.org/10.1016/j.tplants.2011.05.
006 PMID: 21684794
26. Lambers H, Finnegan PM, Laliberte E, Pearse SJ, Ryan MH, Shane MW, et al. Phosphorus nutrition of
Proteaceae in severely phosphorus-impoverished soils: are there lessons to be learned for future
crops? Plant Physiol. 2011; 156(3):1058–66. https://doi.org/10.1104/pp.111.174318 PMID: 21498583
27. Jin J, Tang C, Armstrong R, Sale P. Phosphorus supply enhances the response of legumes to elevated
CO 2 (FACE) in a phosphorus-deficient vertisol. Plant Soil. 2012; 358(1):91–104.
28. Wissuwa M, Yano M, Ae N. Mapping of QTLs for phosphorus-deficiency tolerance in rice (Oryza sativa
L.). Theor Appl Genet. 1998; 97(5–6):777–83.
29. Milner MJ, Howells RM, Craze M, Bowden S, Graham N, Wallington EJ. A PSTOL-like gene, TaPSTOL,
controls a number of agronomically important traits in wheat. BMC Plant Biol. 2018; 18(1):1–14. https://
doi.org/10.1186/s12870-017-1213-1 PMID: 29291729
30. Zhang L, Li J, Rong T, Gao S, Wu F, Xu J, et al. Large-scale screening maize germplasm for low-phos-
phorus tolerance using multiple selection criteria. Euphytica. 2014; 197(3):435–46.
31. Yuan Y, Gao M, Zhang M, Zheng H, Zhou X, Guo Y, et al. QTL mapping for phosphorus efficiency and
morphological traits at seedling and maturity stages in wheat. Front Plant Sci. 2017; 8(April):1–13.
https://doi.org/10.3389/fpls.2017.00614 PMID: 28484481
32. Bilal HM, Aziz T, Maqsood MA, Farooq M, Yan G. Categorization of wheat genotypes for phosphorus
efficiency. PLoS One. 2018; 13(10):1–20. https://doi.org/10.1371/journal.pone.0205471 PMID:
30332479
33. Kong F-M, Guo Y, Liang X, Wu C-H, Wang Y-Y, Zhao Y, et al. Potassium (K) effects and QTL mapping
for K efficiency traits at seedling and adult stages in wheat. Plant Soil. 2013; 373(1):877–92.
34. Magalhães PC, De Souza TC, Cantão FRO. Early evaluation of root morphology of maize genotypes
under phosphorus deficiency. Plant, Soil Environ. 2011; 57(3):135–8.
35. Liu Y, Wang G, Yu K, Li P, Xiao L, Liu G. A new method to optimize root order classification based on
the diameter interval of fine root. Sci Rep. 2018; 8(1):1–11. https://doi.org/10.1038/s41598-017-17765-
5 PMID: 29311619
36. Gulles AA, Bartolome VI, Morantte R, Nora LA, Relente CEN, Talay DT, et al. Randomization and anal-
ysis of data using STAR [Statistical Tool for Agricultural Research]. Philipp J Crop Sci. 2014; 39(1):137.
37. Piepho HP, Mohring J, Melchinger AE, Buchse A. BLUP for phenotypic selection in plant breeding and
variety testing. Euphytica. 2008; 161(1):209–28.
38. Abdel-Ghani AH, Kumar B, Reyes-Matamoros J, Gonzalez-Portilla PJ, Jansen C, San Martin JP, et al.
Genotypic variation and relationships between seedling and adult plant traits in maize (Zea mays L.)
inbred lines grown under contrasting nitrogen levels. Euphytica. 2013; 189(1):123–33.
39. Hutcheson K. A test for comparing diversities based on the Shannon formula. J Theor Biol. 1970; 29
(1):151–4. https://doi.org/10.1016/0022-5193(70)90124-4 PMID: 5493290
40. Shannon CE, Weaver W. The mathematical theory of communication.,( University of Illinois Press:
Champaign, IL). 1963;
41. Li R, Zeng Y, Xu J, Wang Q, Wu F, Cao M, et al. Genetic variation for maize root architecture in
response to drought stress at the seedling stage. Breed Sci. 2015; 65(4):298–307. https://doi.org/10.
1270/jsbbs.65.298 PMID: 26366112
42. Reddy VRP, Aski MS, Mishra GP, Dikshit HK, Singh A, Pandey R, et al. Genetic variation for root archi-
tectural traits in response to phosphorus deficiency in mungbean at the seedling stage. PLoS One
[Internet]. 2020; 15(6):1–21. Available from: http://dx.doi.org/10.1371/journal.pone.0221008
43. Carstensen A, Herdean A, Schmidt SB, Sharma A, Spetea C, Pribil M, et al. The impacts of phosphorus
deficiency on the photosynthetic electron transport chain. Plant Physiol. 2018; 177(1):271–84. https://
doi.org/10.1104/pp.17.01624 PMID: 29540590
44. Swinnen J. Rhizodeposition and turnover of root-derived organic material in barley and wheat under
conventional and integrated management. Agric Ecosyst Environ. 1994; 51(1–2):115–28.
PLOS ONE Deciphering the change in root system architectural traits under limiting and non-limiting phosphorus in wheat
PLOS ONE | https://doi.org/10.1371/journal.pone.0255840 October 1, 2021 20 / 22

45. Nielsen KL, Eshel A, Lynch JP. The effect of phosphorus availability on the carbon economy of contrast-
ing common bean (Phaseolus vulgaris L.) genotypes. J Exp Bot. 2001; 52(355):329–39. PMID:
11283178
46. Wissuwa M. How do plants achieve tolerance to phosphorus deficiency? Small causes with big effects.
Plant Physiol. 2003; 133(4):1947–58. https://doi.org/10.1104/pp.103.029306 PMID: 14605228
47. Shimizu A, Yanagihara S, Kawasaki S, Ikehashi H. Phosphorus deficiency-induced root elongation and
its QTL in rice (Oryza sativa L.). Theor Appl Genet. 2004; 109(7):1361–8. https://doi.org/10.1007/
s00122-004-1751-4 PMID: 15375618
48. Dai X, Wang Y, Yang A, Zhang W-H. OsMYB2P-1, an R2R3 MYB transcription factor, is involved in the
regulation of phosphate-starvation responses and root architecture in rice. Plant Physiol. 2012; 159
(1):169–83. https://doi.org/10.1104/pp.112.194217 PMID: 22395576
49. Zheng H, Pan X, Deng Y, Wu H, Liu P, Li X. AtOPR3 specifically inhibits primary root growth in Arabi-
dopsis under phosphate deficiency. Sci Rep. 2016; 6(1):1–11. https://doi.org/10.1038/s41598-016-
0001-8 PMID: 28442746
50. Ticconi CA, Abel S. Short on phosphate: plant surveillance and countermeasures. Trends Plant Sci.
2004; 9(11):548–55. https://doi.org/10.1016/j.tplants.2004.09.003 PMID: 15501180
51. Svistoonoff S, Creff A, Reymond M, Sigoillot-Claude C, Ricaud L, Blanchet A, et al. Root tip contact with
low-phosphate media reprograms plant root architecture. Nat Genet. 2007; 39(6):792–6. https://doi.org/
10.1038/ng2041 PMID: 17496893
52. Niu YF, Chai RS, Jin GL, Wang H, Tang CX, Zhang YS. Responses of root architecture development to
low phosphorus availability: A review. Ann Bot. 2013; 112(2):391–408. https://doi.org/10.1093/aob/
mcs285 PMID: 23267006
53. Tyburski J, Dunajska-Ordak K, Skorupa M, Tretyn A. Role of ascorbate in the regulation of the Arabi-
dopsis thaliana root growth by phosphate availability. J Bot. 2012Oct; 2012:1–12.
54. Powell CL. Effect of P fertilizer on root morphology and P uptake of Carex coriacea. Plant Soil. 1974; 41
(3):661–7.
55. Hill JO, Simpson RJ, Moore AD, Chapman DF. Morphology and response of roots of pasture species to
phosphorus and nitrogen nutrition. Plant Soil. 2006; 286(1):7–19.
56. Wang Q, Yuan Y, Liao Z, Jiang Y, Wang Q, Zhang L, et al. Genome-Wide Association Study of 13 Traits
in Maize Seedlings under Low Phosphorus Stress. Plant Genome. 2019; 12(3):190039. https://doi.org/
10.3835/plantgenome2019.06.0039 PMID: 33016582
57. Liu Y, Wang L, Deng M, Li Z, Lu Y, Wang J, et al. Genome-wide association study of phosphorus-defi-
ciency-tolerance traits in Aegilops tauschii. Theor Appl Genet. 2015; 128(11):2203–12. https://doi.org/
10.1007/s00122-015-2578-x PMID: 26187748
58. de Souza Campos PM, Cornejo P, Rial C, Borie F, Varela RM, Seguel A, et al. Phosphate acquisition
efficiency in wheat is related to root: shoot ratio, strigolactone levels, and PHO2 regulation. J Exp Bot.
2019; 70(20):5631–42. https://doi.org/10.1093/jxb/erz349 PMID: 31359044
59. Narayanan S, Mohan A, Gill KS, Vara Prasad P V. Variability of root traits in spring wheat germplasm.
PLoS One. 2014; 9(6):e100317. https://doi.org/10.1371/journal.pone.0100317 PMID: 24945438
60. Wang Y, Thorup-Kristensen K, Jensen LS, Magid J. Vigorous root growth is a better indicator of early
nutrient uptake than root hair traits in spring wheat grown under low fertility. Front Plant Sci. 2016;
7:865. https://doi.org/10.3389/fpls.2016.00865 PMID: 27379145
61. Zobel RW, Waisel Y. A plant root system architectural taxonomy: a framework for root nomenclature.
Plant Biosyst. 2010; 144(2):507–12.
62. Liu L, Gan Y, Bueckert R, Van Rees K, Warkentin T. Fine root distributions in oilseed and pulse crops.
Crop Sci. 2010; 50(1):222–6.
63. Gahoonia TS, Nielsen NE. Barley genotypes with long root hairs sustain high grain yields in low-P field.
Plant Soil. 2004; 262(1):55–62.
64. Arif MR, Islam MT, Robin AHK. Salinity stress alters root morphology and root hair traits in Brassica
napus. Plants. 2019; 8(7):192. https://doi.org/10.3390/plants8070192 PMID: 31252515
65. Jungk A. Root hairs and the acquisition of plant nutrients from soil. J Plant Nutr Soil Sci. 2001; 164
(2):121–9.
66. Raju BR, Narayanaswamy BR, Mohankumar M V, Sumanth KK, Rajanna MP, Mohanraju B, et al. Root
traits and cellular level tolerance hold the key in maintaining higher spikelet fertility of rice under water
limited conditions. Funct Plant Biol. 2014; 41(9):930–9. https://doi.org/10.1071/FP13291 PMID:
32481046
PLOS ONE Deciphering the change in root system architectural traits under limiting and non-limiting phosphorus in wheat
PLOS ONE | https://doi.org/10.1371/journal.pone.0255840 October 1, 2021 21 / 22
67. Kumar B, Abdel-Ghani AH, Reyes-Matamoros J, Hochholdinger F, Lubberstedt T. Genotypic variation
for root architecture traits in seedlings of maize (Zea mays L.) inbred lines. Plant Breed. 2012; 131
(4):465–78.
68. Liu Y, Bowman BC, Hu Y-G, Liang X, Zhao W, Wheeler J, et al. Evaluation of agronomic traits and
drought tolerance of winter wheat accessions from the USDA-ARS national small grains collection.
Agronomy. 2017; 7(3):51.
69. Gill HS, Singh A, Sethi SK, Behl RK. Phosphorus uptake and use efficiency in different varieties of
bread wheat (Triticum aestivum L). Arch Agron Soil Sci. 2004; 50(6):563–72.
70. Rahmatullah Aziz T.; Maqsood MA; Sabir M.; Kanwal S. Categorization of Brassica cultivars for phos-
phorus acquisition from phosphate rock on basis of growth and ionic parameters. J Plant Nutr. 2011;
34:522–33.
PLOS ONE Deciphering the change in root system architectural traits under limiting and non-limiting phosphorus in wheat
PLOS ONE | https://doi.org/10.1371/journal.pone.0255840 October 1, 2021 22 / 22