Investigation on Functional, Thermo-Mechanical, and Bread ...
Upload
khangminh22Category
view
5download
0
PaPer
476 Ital. J. Food Sci., vol. 27 - 2015
- Keywords: shrimp oil, encapsulation, bread quality, lipid oxidation -
CHARACTERISTICS AND OXIDATIVE STABILITY OF BREAD FORTIFIED
WITH ENCAPSULATED SHRIMP OIL
SIRIMA TAkEUNgWONgTRAkULa, SOOTTAWAT BENjAkULa* and ARAN H-kITTIkUNb
aDepartment of Food Technology, Faculty of Agro-Industry, Prince of Songkla University, Hat Yai, Songkhla, 90112 Thailand
bDepartment of Industrial Biotechnology, Faculty of Agro-Industry, Prince of Songkla University, Hat Yai, Songkhla, 90112 Thailand*Corresponding author: Tel. +66 74 286334, Fax +66 74 558866,
email: [email protected]
AbstrAct
characteristics and oxidative stability of bread fortified with micro-encapsulated shrimp oil (MsO) were determined. the addition of MsO could improve the loaf volume of bread. chewiness, gumminess and resilience of resulting bread were decreased. bread crust and crumb showed high-er redness and yellowness when MsO was incorporated (P<0.05). Microstructure study revealed that MsO remained intact with bread crumbs. the addition of MsO up to 3% had no adverse ef-fect on bread quality and sensory acceptability. Oxidation took place in bread fortified with 5% MsO to a higher extent, compared with those with 1 or 3% MsO. therefore, the bread could be fortified with MsO up to 3%.

Ital. J. Food Sci., vol. 27 - 2015 477
INtrODUctION
Hepatopancreas, a byproduct generated from the manufacturing of hepatopancreas-free whole shrimp, is the excellent source of lipids with high polyunsaturated fatty acids (PUFA) (37.42 g/100g oil) and carotenoids (2.02 mg/g oil). shrimp oil from hepatopancreas contained linoleic acid as the most abundant fatty acid, followed by oleic acid. Additionally, shrimp oil also contained PUFA including eicosapentaeno-ic acid (2.15 g/100 g oil) and docosahexaeno-ic acid (6.20 g/100 g oil) (tAKEUNGWONGtrA-KUL et al., 2012), (tAKEUNGWONGtrAKUL et al., 2014a). the recommended daily intakes for li-noleic acid, linolenic acid and long-chain n-3 PUFA are 4.4-20 g/d; 1.35-2.2 g/d and 0.16-1.6 g/d, respectively (MEYEr et al., 2003). Neverthe-less, oil from hepatopancreas is very suscepti-ble to oxidation, leading to undesirable off-odor (tAKEUNGWONGtrAKUL et al., 2012). rancidity is the major drawback for application of shrimp oil. Encapsulation of oil under the appropriate condition can be a promising means to extend its shelf-life. Encapsulation has appeared as a key technology in delaying or inhibiting oxida-tion and masking undesirable odor and flavor in the final product. the process involves the conversion of the oil into a free flowing powder, which can be easily handled and used for food fortification. Encapsulation can be defined as a process, in which tiny droplets, namely core, are surrounded by wall materials (GALLArDO et al., 2013). Proteins and carbohydrates are frequently used as matrices for micro-encap-sulation of lipophilic compounds by spray dry-ing (GHArsALLAOUI et al., 2007). tAKEUNG-WONGtrAKUL et al. (2014b) reported that the use of whey protein and Na-caseinate in com-bination with glucose syrup as the wall mate-rials could improve encapsulation efficiency of micro-encapsulated shrimp oil more effective-ly than protein alone and protein in combina-tion with gum arabic or maltodextrin. Amongst several encapsulation techniques, spray-dry-ing is the most common micro-encapsulation technology used in food industry due to its low cost, continuous production, ease of industri-alization and available equipment (GHArsAL-LAOUI et al., 2007).
the world’s food market is currently focused on foods that provide nutritive values and health benefits to consumers. Functional foods are rapidly expanding and draw the great at-tention (EZHILArAsI et al., 2014). Fortification of highly nutritive ingredients such as polyun-saturated fatty acid rich oil, etc. is gaining the interest for food industry. the incorporation of micro-encapsulated oil into foods enables the development of new functional foods with minimal impact on the organoleptic properties of the food products (EZHILArAsI et al., 2014). Wall materials surrounding oil droplets can act
as the shield, preventing the oil from oxidation. bOrNEO et al. (2007) fortified micro-encapsu-lated n-3 fatty acids in cream-filled sandwich cookies without any adverse effect on senso-ry properties.
bread has become popular, especially for the new generation (cLEArY et al., 2007). the for-tification of shrimp oil rich in PUFA and astax-anthin in the encapsulated form could increase the nutritive value of bread. As a consequence, the consumers can obtain the active nutrients with the health benefit from the bread. Never-theless, no information regarding the fortifica-tion of micro-encapsulated shrimp oil in bread has been reported. the objective of this study was to investigate the effects of micro-encapsu-lated shrimp oil fortification on the characteris-tics and sensory property of bread.
MAtErIALs AND MEtHODs
Chemicals
Ethylenediamine tetraacetic acid (EDtA) was obtained from Merck (Darmstadt, Germa-ny). tannic acid (99.5% purity) was purchased from sigma (st. Louis. MO, UsA). Essential oil (100% purity) from lemon was obtained from botanicessence (bangkok, thailand). sodium caseinate was procured from Vicchi enterprise co., Ltd. (bangkok, thailand). Whey protein concentrate was obtained from I.P.s. Interna-tional co., Ltd. (bangkok, thailand). Glucose syrup (Dextrose equivalent; 40-43) was pur-chased from charoenworrakit co., Ltd. (sam-ut Prakan, thailand). Wheat flour, sugar, salt, shortening, milk powder and yeast were pro-cured from a local market in Hat Yai, song-khla, thailand.
Collection and preparation of hepatopancreas from Pacific white shrimp
Hepatopancreas of Pacific white shrimp (Litopenaeus vannamei) with the size of 50-60 shrimp/kg was obtained from the sea wealth frozen food co., Ltd., songkhla province, thai-land during February and March, 2014. Pooled hepatopancreas (3-5 kg) was placed in a poly-ethylene bag. to maintain the quality of hepato-pancreas during transportation, the bag was im-bedded in a polystyrene box containing ice with a sample/ice ratio of 1:2 (w/w) and transported to the Department of Food technology, Prince of songkla University, Hat Yai, songkhla with-in approximately 2 h. the sample was stored at -18°c until use, but the storage time was no longer than 1 month. Prior to oil extraction, hepatopancreas was thawed using running wa-ter (25°c) and ground in the presence of liquid nitrogen using a blender (Phillips, Guangzhou, china) for 30 sec.
478 Ital. J. Food Sci., vol. 27 - 2015
Extraction of oils from hepatopancreas
Oil was extracted from hepatopancreas fol-lowing the method of tAKEUNGWONGtrAKUL et al. (2014). the prepared hepatopancreas (20 g) was homogenized with 90 mL of cold solvent mixtures (isopropanol: hexane, 50: 50, v/v) (4°c) at the speed of 9500 rpm using an IKA Labortechnik homogenizer (selangor, Malay-sia) for 2 min at 4ºc. the extract was filtered using a Whatman filter paper No.4 (Whatman International Ltd., Maidstone, England). the residue was extracted with cold solvent mix-tures for another two times. the hexane frac-tion was pooled and repeatedly washed with an equal quantity of 1% Nacl in order to sep-arate the phases and remove traces of polar solvents. Hexane fraction (approximately 135 mL) was then added with 2-5 g anhydrous so-dium sulphate, shaken very well, and decant-ed into a round-bottom flask through a What-man No. 4 filter paper. the solvent was evap-orated at 40ºc using an EYELA rotary evap-orator N-1000 (tokyo rikakikai, co. Ltd, to-kyo, Japan) and the residual solvent was re-moved by nitrogen flushing. the obtained oil with the yield of 19.04% (w/w) was used for micro-encapsulation.
Preparation of shrimp oil-in-water emulsion
Aqueous stock mixed solution of whey pro-tein concentrate, sodium caseinate and glucose syrup at a ratio of 1: 1: 2 (w/w/w) in deionized water was prepared. the mixture was stirred overnight using a magnetic stirrer at room temperature (28°-30°c) to obtain the homog-enous wall material solution as per the meth-od of tAKEUNGWONGtrAKUL and bENJAKUL (2014b). shrimp oil was added into the solu-tion at a core/wall material ratio of 1:4 (v/v). the mixtures were homogenized at a speed of 10,000 rpm for 3 min using a homogenizer (Model t25 basic, IKA Labortechnik, selangor, Malaysia). the obtained coarse emulsions were then passed through a Microfluidics homoge-niser (Model Hc-5000, Microfluidizer, Newton, MA, UsA) at a pressure level of 4,000 psi for four passes. Emulsions were added with lem-on essential oil + tannic acid + EDtA. Prior to the incorporation, lemon essential oil (200 ppm) was dissolved in shrimp oil, whereas EDtA (50 ppm) and tannic acid (100 ppm) were dissolved in aqueous stock solution.
Preparation of micro-encapsulated shrimp oil (MSO)
the prepared emulsion was subjected to dry-ing using a laboratory scale spray-dryer (Lab-Plant Ltd., LabPlant sD-06A, Huddersfield, UK) equipped with a 0.5 mm diameter nozzle. the emulsion was fed into the main chamber (215
mm diameter × 500 mm long) through a peri-staltic pump. Feed flow rate was 8.08 mL/min; drying air flow rate was 4.3 m/s and compres-sor air pressure was 40.61 psi. Air inlet tem-perature was 180°±2°c. the outlet temperature was controlled at 90°±2°c. the obtained pow-der referred to as micro-encapsulated shrimp oil (MsO) was collected in the amber bottle and capped tightly. MsO was determined for the total oil content using the mixture of chloro-form and methanol as per the method of sHA-HIDI and WANAsUNDArA (1995). MsO contained 18±1.34% shrimp oil and had 1.06±0.05% moisture content.
Fortification of MSO in bread
bread was prepared with the following for-mulation: wheat flour (500 g), sugar (20 g), salt (8 g), shortening (20 g), milk powder (25 g) and yeast (7 g). Flour and other ingredients were mixed and kneaded uniformly, in which water (300 mL) was added during kneading. thereaf-ter, MsO was directly added to dough at differ-ent levels (0, 1, 3 and 5%, w/w). the dough was kneaded for another 10 min. Dough (150 g) was then subjected to bulk fermentation for approx-imately 1 h at 30ºc and 75% relative humid-ity, followed by scaling, intermediate proving, moulding and second proving (for about 1-1.25 h). Finally, baking was carried out at 220ºc for 20 min in baking oven (YXD-20, Guandzhou Xinnanfang electro-thermal equipment co., Ltd., Guandzhou, china). After baking, bread samples were removed from mold and allowed to cool at room temperature. bread incorporat-ed with 5% (w/w) spray dried empty capsules (without the addition of shrimp oil) was used as the control bread. the bread samples were subjected to analyses.
Characterization of bread fortified with MSO
Loaf volume
the volume of bread was determined by ses-ame seed displacement method after the loaves were cooled to room temperature for approxi-mately 2 h (JIAMYANGYUEN et al., 2005).
Texture profile analysis
texture profile analysis (tPA) was performed using a tA-Xt2 texture analyzer (stable Micro systems, Godalming, surrey, UK) with a cy-lindrical aluminum probe (35 mm diameter). the samples were sliced (each 2.0 cm thick-ness) and placed on the instrument’s base. the tests were performed with two compres-sion cycles. texture measurements were per-formed ten times for each sample and mean values were reported. Hardness, springiness,

Ital. J. Food Sci., vol. 27 - 2015 479
cohesiveness, gumminess, chewiness and re-silience were calculated from the force-time-curves generated for each sample (GÖKMEN et al., 2011). Hardness is expressed as the max-imum force for the first compression, which relates to the strength of the samples under penetration. Gumminess is defined as the force required to disintegrate a semi - solid food be-fore it is ready for swallowing. springiness is a measure of how much the samples structure is broken down by the initial penetration and is calculated as the ratio of the time from the start of the second area up to the second probe reversal over the time between the start of the first area and the first probe reversal. cohe-siveness is a measure of the degree of difficul-ty in breaking down the internal structure of sample. resilience reflects the redeformation capacity of sample tissues after penetration (cHANG et al., 2012). chewiness is related to the time required for masticating a bread piece prior to swallow, and the low chewing value means easy break of the bread in the mouth (KrUPA-KOZAK et al., 2012).
Color measurement
the color of crust and crumb samples were de-termined using a colorimeter (colorFlex, Hunter Lab reston, VA, UsA) and reported in the cIE system, including L*, a*, b* and ΔE*, represent-ing lightness, redness/greenness, yellowness/blueness and total difference of color respec-tively. ΔE* was also calculated using the follow-ing equation:
ΔE* = [(ΔL*)2+(Δa*)2+(Δb*)2]1/2
where ΔL*, Δa* and Δb* are the differences be-tween the color parameter of the samples and the color parameters of the white standard (L* = 92.85, a* = - 1.20, b* = 0.46).
Scanning electron microscopy (SEM)
bread morphology was evaluated by scan-ning electron microscopy (sEM). Fresh bread was sliced by a razor blade and mounted on a bronze stub and sputter-coated with gold (sput-ter coater sPI-Module, West chester, PA, UsA). the specimens were observed using a scanning electron microscope (Quanta 400, FEI, Eind-hoven, Netherlands) at an acceleration voltage of 15 kV with magnification of 2000×.
Sensory evaluation
sensory evaluation was performed by 30 untrained panelists with ages ranging from 20 to 35 years, who were familiar with the consumption of bread. Panelists were asked to evaluate for crust color, crumb color, odor, texture, appearance and overall likeness of
bread samples using a nine-point hedon-ic scale, in which a score of 1 = not like very much, 5 = neither like nor dislike and 9 = like extremely, respectively. Panelists were asked to hand-feel the sample for texture. Freshly prepared bread was taken randomly for senso-ry evaluation at day 0 and 3. Each bread loaf was cut in half and slices were subsequently cut to a thickness of 2 cm. bread was served in a closed odorless plastic container at room temperature. the samples were labeled with random three-digit codes. the order of pres-entation of the samples was randomized ac-cording to “balance order and carry-over ef-fects design” (cArr et al., 1999).
Changes in volatile compounds in bread during storage
bread was placed in polyethylene bag and sealed. Packaged bread samples with different treatments were stored at room temperature (28°-30°c). the samples were taken at day 0, 1, 2 and 3 for analyses. Volatile compounds in bread was analysed by headspace Gc-Ms using a solid-phase microextraction gas chromatogra-phy mass spectrometry (sPME Gc-Ms) follow-ing the method of GÖKMEN et al. (2011) with a slight modification.
Extraction of volatile compounds by SPME fiber
to extract volatile compounds, 1 gram of bread slice was placed in a headspace 20 mL -vial (Agilent technologies, Palo Alto, cA, UsA). the vial was tightly closed by means of a capper. A carboxen–polydimethylsiloxane solid phase micro-extraction fiber (50/30 µm DVb/car-boxen™/ PDMs stableFlex™) (supelco, belle-fonte, PA, UsA) was used to adsorb the vola-tile lipid oxidation compounds released from the sample. the fiber was inserted into the vial and equilibrated at 40 °c for 30 min prior to Gc-Ms analysis.
GC-MS analysis
Gc-Ms analysis was performed in a HP 5890 series II gas chromatography (Gc) coupled with HP 5972 mass-selective detector equipped with a splitless injector and coupled with a quad-rupole mass detector (Hewlett Packard, Atlan-ta, GA, UsA). compounds were separated on a HP-Innowax capillary column (Hewlett Pack-ard, Atlanta, GA, UsA) (30 m±0.25 mm ID, with film thickness of 0.25 µm). the Gc oven temperature program was: 35ºc for 3 min, fol-lowed by an increase of 3ºc/min to 70ºc, then an increase of 10ºc/min to 200ºc, and final-ly an increase of 15ºc/min to a final tempera-ture of 250ºc and holding for 10 min. Helium was employed as a carrier gas with a constant

480 Ital. J. Food Sci., vol. 27 - 2015
flow of 1 mL/min. the injector was operated in the splitless mode and its temperature was set at 270ºc. transfer line temperature was main-tained at 260ºc. the quadrupole mass spec-trometer was operated in the electron ioniza-tion (EI) mode and source temperature was set at 250ºc. Initially, full-scan-mode data was ac-quired to determine appropriate masses for the later acquisition in scan mode under the follow-ing conditions: mass range: 25-500 amu and scan rate: 0.220 s/scan. All analyses were per-formed with ionization energy of 70 eV, filament emission current at 150 µA, and the electron multiplier voltage at 500 V.
Analyses of volatile compounds
Identification of the compounds was done by consulting chemstation Library search (Wiley 275.L). Identification of compounds was per-formed, based on the retention time and mass spectra in comparison with those of stand-ards from chemstation Library search (Wiley 275.L). Quantification limits were calculated to a signal-to-noise (s/N) ratio of 10. repeat-ability was evaluated by analysing 3 replicates of each sample. the identified volatile com-pounds, related to lipid oxidation, including aldehydes, alcohols, ketones, etc., were pre-sented in the term of abundance of each iden-tified compound.
Statistical analysis
All experiments were run in triplicate. All anal-yses were conducted in five replications. statisti-cal analysis was performed using one-way anal-ysis of variance (ANOVA). Mean comparison was carried out using Duncan’s multiple range test (stEEL and tOrrIE, 1960).
rEsULts AND DIscUssION
Characteristics of bread fortified with MSO
Loaf volume
Loaf volume of bread fortified with MsO at dif-ferent levels is shown in table 1. Incorporation of MsO (1-5%) resulted in the increase in loaf volume (P< 0.05). However, similar loaf volume was obtained, regardless of amount of MsO add-ed (P > 0.05). Loaf volume of bread incorporated with spray dried empty capsule (control bread) was not different from that of bread containing MsO at a level of 1% (w/w) (P> 0.05). Neverthe-less, bread fortified with MsO at the levels of 3 and 5% (w/w) had higher loaf volume than the control bread (P< 0.05). spray dried empty cap-sule, including whey protein concentrate, sodi-um caseinate and glucose syrup, could increase loaf volume of bread to some degree. those pro-teins as well as glucose syrup might strength-en the loaf structure via interaction with wheat gluten, in which the bread matrix could hold gas more efficiently. Whey proteins demonstrat-ed the ability to increase the loaf volume of the bread (NUNEs et al., 2009). Gluten proteins of wheat flour create unique visco-elastic proper-ties of dough, which allow dough to expand due to the formation of carbon dioxide during fer-mentation and retain most of this gas inside the dough texture (WEHrLE et al., 1997). GÖKMEN et al. (2011) and EZHILArAsI et al. (2014) report-ed that increasing amount of micro-encapsulat-ed oil or active compounds decreased loaf vol-ume of bread. Encapsulated substances could decrease the concentration of gluten in the for-mulation and lower the retention of gases dur-ing the baking process. therefore, bread forti-fied with MsO with the range of 3-5% (w/w) had
table 1 - Loaf volume and textural at properties of breads incorporated with MsO at different levels at day 0 and 3 of storage.
Storage time MSO Loaf volume Hardness Springiness Cohesiveness Gumminess Chewiness Resilience(day) (% w/w) (mL) (g) (mm) (g.mm)
0 Control 296.06±9.36bA 1362.22±80.23aB 0.90±0.02aA 0.59±0.02aA 759.25±50.08aB 739.70±38.73aB 0.22±0.01bA 0 % 269.25±10.84cA 1020.99±54.21bB 0.91±0.03aA 0.61±0.02aA 670.14±57.86abB 712.87±51.31aB 0.24±0.01aA 1 % 315.22±10.47abA 1022.73±46.70bB 0.91±0.01aA 0.59±0.02aA 622.09±46.49bB 554.13±38.71bB 0.22±0.01bA 3 % 317.67±9.13aA 938.58±65.57bB 0.90±0.02aA 0.60±0.03aA 610.30±42.41bB 480.51±37.57bcB 0.22±0.01bA 5 % 317.47±8.86aA 927.85±69.48bB 0.90±0.03aA 0.60±0.01aA 503.91±42.57cA 466.17±47.67cB 0.22±0.02bA
3 Control 290.83±8.96bA 2454.22±84.41aA 0.89±0.02aA 0.50±0.02aB 1146.05±54.24aA 1034.57±56.96aA 0.19±0.01aB 0 % 267.22±11.34cA 2158.52±49.27bA 0.90±0.01aA 0.52±0.02aB 1097.85±39.01aA 979.92±70.76aA 0.19±0.02aB 1 % 312.17±8.86aA 1532.61±58.13cA 0.90±0.02aA 0.52±0.03aB 838.77±44.37bA 759.42±64.20bA 0.19±0.01aB 3 % 313.89±10.37aA 1257.53±77.38dA 0.90±0.01aA 0.53±0.01aB 720.33±40.92cA 622.02±59.62cA 0.19±0.01aB 5 % 313.33±5.77aA 1225.42±34.58dA 0.90±0.01aA 0.52±0.02aB 672.64±54.40cA 617.68±60.45cA 0.17±0.01aB
Control = Added with 5% (w/w) spray dried empty capsule without the addition of shrimp oil.Data are expressed as mean±SD (n=3).Lowercase letters in the same column within the same storage time indicate significant difference (p < 0.05).Uppercase letters in the same column within the same sample indicate significant difference (p < 0.05).

Ital. J. Food Sci., vol. 27 - 2015 481
the higher loaf volume, in comparison with the control bread.
After storage of 3 days at room temperature, in which mold was not detected, no difference in loaf volume was noticeable in comparison with that found at day 0 (P> 0.05). thus, bread struc-ture was not collapsed within 3 days of storage. It was noted that the addition of MsO had no influence on the shelf-life of bread.
Textural properties
textural properties of bread samples contain-ing MsO at various levels are presented in table 1. the addition of MsO generally had the effects on the texture profile of bread. However, MsO had no effect on hardness (P> 0.05), irrespec-tive of amount used. It was noted that, the con-trol bread had higher hardness value than oth-ers (P< 0.05). the proteins in spray dried empty capsules with smaller size might be distributed more uniformly and strengthened bread struc-ture more efficiently. For gumminess, the addi-tion of MsO decreased the value. the decrease was more pronounced as the level of MsO in-creased (P< 0.05). It was found that bread incor-porated with 5% MsO showed the lowest gum-miness, compared with others (P< 0.05). the addition of MsO or spray dried empty capsule had no impact on springiness and cohesive-ness (P> 0.05). chewiness of bread decreased as the amount of MsO in bread increased (P< 0.05). control bread showed similar chewiness to that without MsO (P> 0.05). For resilience, bread without MsO (0%) showed the higher val-ue than others (P< 0.05).
After the storage at room temperature for 3 days, hardness, gumminess and chewiness in-creased, whilst the cohesiveness and resilience decreased (P< 0.05). Nevertheless, no changes
in springiness were observed after the storage (P> 0.05). these results indicated that bread staling took place upon storage, probably due to retrogradation (HENNA-LU and NOrZIAH, 2011). therefore, MsO addition had the di-rect impact on textural property to different degrees, depending on the amount of MsO in-corporated.
Color
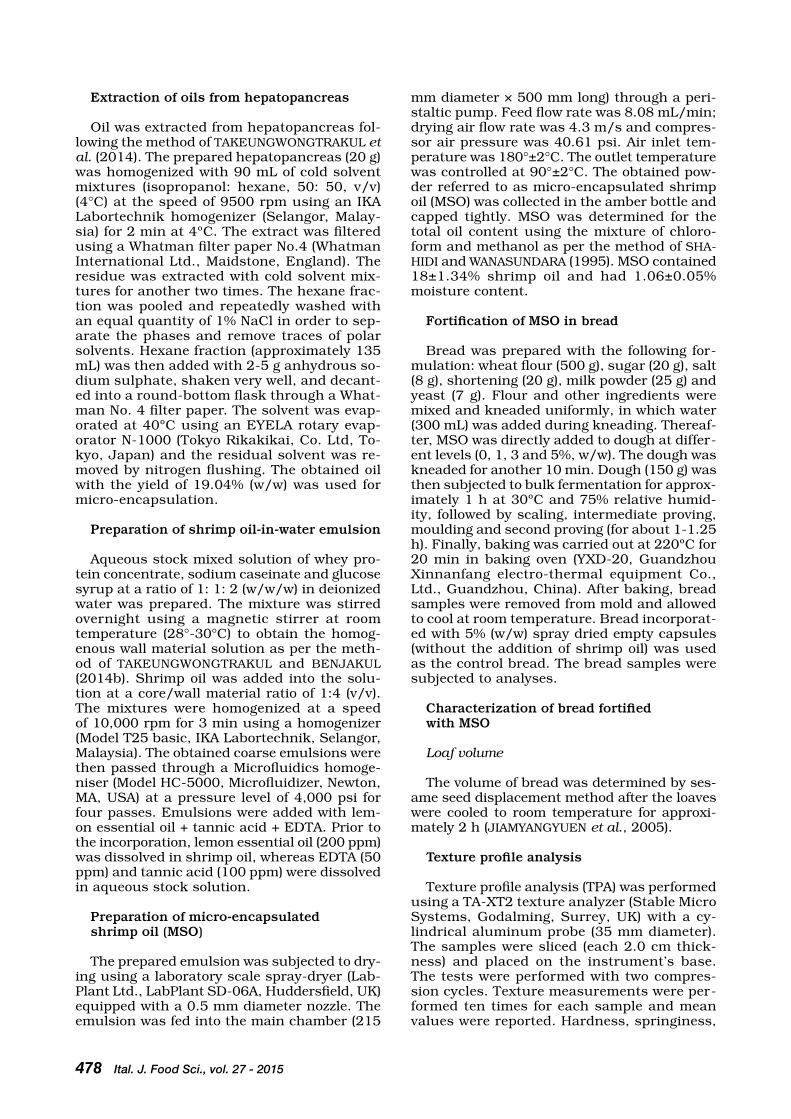
color of bread crust was affected by the amount of MsO added as shown in table 2. the photographs of bread crust are shown in Fig. 1 A. bread crust had the decrease in L*-value, but the increases in a*-, b*- and ΔE*- values as the lev-el of MsO increased (P< 0.05). Amongst all sam-ples, that added with 5% MsO showed the lowest L*-value but highest a*-, b*- and ΔE*- values (P< 0.05). It was found that bread incorporated with spray dried empty capsule (control) had the low-er L*- value than others, except for that added with 5% MsO. the color of bread crust is most-ly attributed to non-enzymatic chemical reac-tions such as Maillard and caramelization reac-tion that produce colored compounds (formation of the golden yellow color) during bread baking (GÖKMEN et al., 2011). Proteins in spray dried empty capsule could serve as the reactant, espe-cially for browning reaction, especially at crust region. GÖKMEN et al. (2011) reported that the particles in the crust region were partially de-stroyed due to more severe thermal conditions during baking. Furthermore, the wall materials also contained some sugars, which more like-ly underwent caramelization at high tempera-ture. this could contribute to the brown color of bread crust. PUrLIs and sALVADOrI (2009) reported that bread had high browning reac-tion rates, particularly when caramelization oc-
table 2 - color of breads incorporated with MsO at different levels at day 0 and 3 of storage.
Storage time MSO Crust color Crumb color (day) (% w/w) L* a* b* ΔE* L* a* b* ΔE*
0 Control 56.16±3.89bA 15.20±2.37bA 36.30±1.36abA 54.28±4.32bA 71.08±1.12aA 0.13±0.02dA 11.67±0.89dA 25.17±1.47eA 0 % 69.13±2.98aA 9.76±1.12cA 32.12±1.07cA 41.91±1.56cdA 67.66±1.22bB 0.12±0.02dA 11.89±0.60dA 28.35±1.19dA 1 % 67.88±3.46aA 12.28±1.08bA 35.38±1.06bA 45.42±2.65cA 64.53±1.56cB 2.15±0.41cA 13.72±1.42cA 32.08±1.91cA 3 % 64.95±2.55aA 13.75±1.17bA 35.73±0.43bA 47.77±1.77cA 63.90±2.07cdB 7.19±0.68bA 18.92±0.91bA 35.89±0.76bA 5 % 47.27±1.99cA 20.08±0.52aA 38.67±1.28aA 63.47±1.56aA 60.77±1.48dB 11.45±0.51aB 22.59±0.61aB 41.46±0.83aA
3 Control 56.68±3.95bA 14.38±2.26bA 36.31±1.42aA 53.69±0.91bA 72.98±1.09aA 0.12±0.01dA 12.63±1.76dA 23.97±1.36dA 0 % 67.58±2.16aA 9.67±0.99cA 32.69±0.92cA 42.77±1.88dA 71.99±1.33aA 0.11±0.04dA 12.20±0.76dA 24.61±1.12cdB 1 % 66.72±2.20aA 11.59±2.17bcA 35.72±1.27bA 46.09±1.09cA 70.94±1.69aA 2.27±0.33cA 13.90±1.28cA 26.55±1.19cB 3 % 64.10±3.29aA 13.19±2.04bA 35.96±1.10bA 48.28±1.37cA 66.17±2.02bA 7.58±0.36bA 20.13±0.86bA 34.80±1.39bA 5 % 46.36±0.57cA 20.44±0.69aA 38.54±0.97aA 64.32±.041aA 65.11±1.54bA 13.34±0.50aA 26.12±0.99aA 40.90±0.69aA
Control = Added with 5% (w/w) spray dried empty capsule without the addition of shrimp oil.Data are expressed as mean±SD (n=3).Lowercase letters in the same column within the same storage time indicate significant difference (p < 0.05).Uppercase letters in the same column within the same sample indicate significant difference (p < 0.05).
482 Ital. J. Food Sci., vol. 27 - 2015
curred. therefore, browning reaction had a pro-nounced influence on bread color, particularly during bread baking.
For bread fortified with MsO, the increases in redness (a*- value) were more likely due to the orange/red color of MsO. shrimp oil contained a high amount of astaxanthin (tAKEUNGWONGtr-AKUL et al., 2014). As a result, the bread crust turned to be more orange in color, when MsO was added, especially at higher levels. thus, the color of bread crust might depend on both non-enzymatic browning reactions and astaxan-thin partially released from MsO. However, the changes in color of crust were more likely caused by the releases of astaxanthin from MsO as ev-idenced by the more a*-value (redness) in color of resulting bread. When comparing L*-, a*-, b*- and ΔE*- values of all bread crust, all bread samples had no change in color after 3 days of storage (P> 0.05). the result suggested that the pigments in MsO were stable after 3 days of storage as evidenced by the unchanged color of bread crust. It was presumed that wall materi-al might protect the oxidation of astaxanthin to some degree during the storage.
the color of bread crumb was determined (ta-ble 2). the levels of MsO incorporated in bread were coincidental with the color. the decrease in L*- value and increases in a*-, b*- and ΔE*- values of bread crumb were found as the level of MsO increased (P< 0.05). For color of bread crumb, crumb does not undergo Maillard re-action, but is affected by the ingredients in the formula (cONFOrtI and DAVIs, 2006). Oils from shrimp hepatopancreas were reddish orange in color due to the presence of astaxanthin (tAKE-UNGWONGtrAKUL et al., 2014). Additionally, surface oil and oil released to the surface of MsO during bread making could also contribute to color of bread crumb. When MsO at a level of 5%
Fig. 1 - the photographs of breads incorporated with MsO at different levels. A) bread crust, b) bread crumb.
was incorporated, bread crumb had the lowest L*- value but highest a*-, b*- and ΔE*- values than others (P< 0.05). For control bread (with only spray dried empty capsule), a*- and b*- val-ues of crumb were not different from those of bread without MsO (P> 0.05). spray dried empty capsule was visually white in color without red or yellow color. After 3 days of storage, the con-trol bread had no change in L*- value (P> 0.05), whilst other bread had the increase in L*- val-ue (P< 0.05). For a*- and b*- values, all bread crumb had no change in a*-, b*- and ΔE*- val-ues (P> 0.05). Nevertheless, crumb of bread in-corporated with 5% MsO had the increases in a*- and b*- values. It was noted that those with 0 and 1% MsO had the decrease in ΔE*- value after 3 days of storage (P< 0.05).
the photographs of bread crumb are shown in Fig. 1b. During storage, the oil might be re-leased from the wall to some degree. As a re-sult, oil with high content of astaxanthin could contribute to the increase in a*- and b*- values to some extent. this was obvious for bread for-tified with 5% MsO. therefore, the addition of MsO directly affected the color of both crust and crumb of bread.
Microstructure
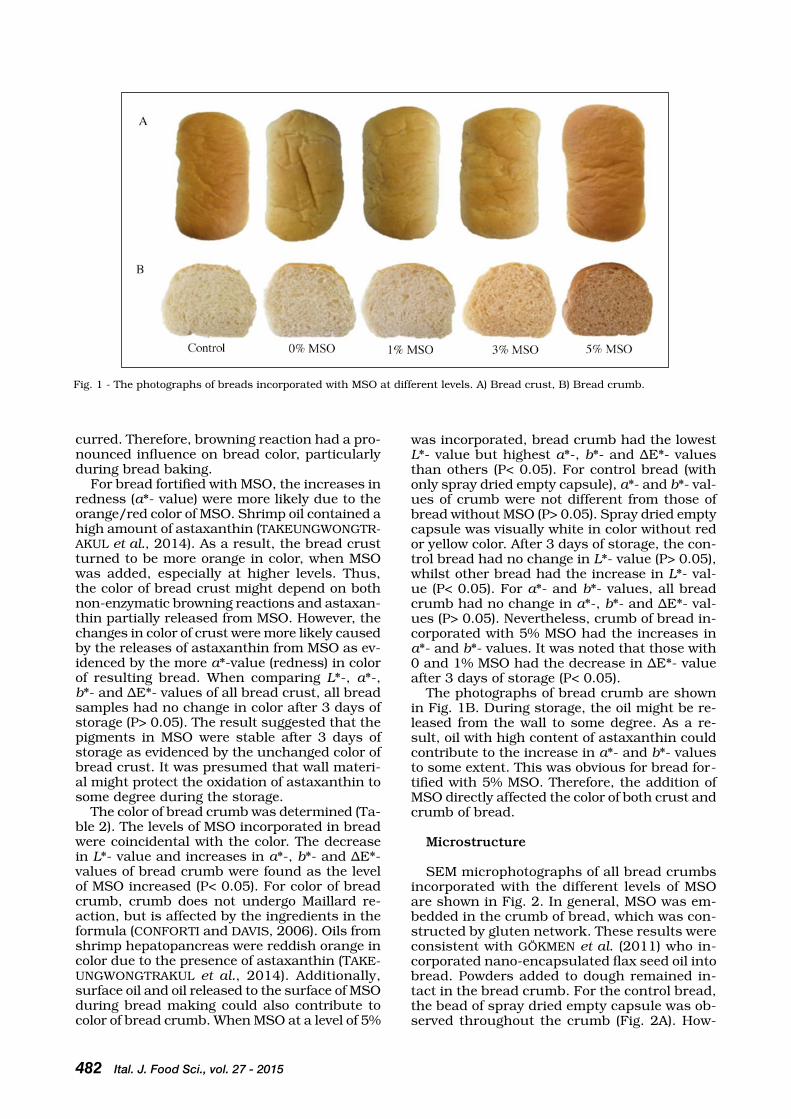
sEM microphotographs of all bread crumbs incorporated with the different levels of MsO are shown in Fig. 2. In general, MsO was em-bedded in the crumb of bread, which was con-structed by gluten network. these results were consistent with GÖKMEN et al. (2011) who in-corporated nano-encapsulated flax seed oil into bread. Powders added to dough remained in-tact in the bread crumb. For the control bread, the bead of spray dried empty capsule was ob-served throughout the crumb (Fig. 2A). How-

Ital. J. Food Sci., vol. 27 - 2015 483
Fig. 2 - surface morphology of breads incorporated with MsO at different levels. (Magnification: ×2000).

484 Ital. J. Food Sci., vol. 27 - 2015
ever, there was no bead in the bread without MsO and spray dried empty capsule (Fig. 2b). It was clearly illustrated that the number of bead, representing MsO, increased as the level of MsO increased. In general, MsO were locat-ed uniformly in the crumb matrix. those MsO could serve as the source of PUFA and astax-anthin rich shrimp oil.
Sensory property
crust color, crumb color, texture, appear-ance, odor and overall likeness scores of all bread samples added with different amounts of MsO at day 0 and 3 of storage are shown in ta-ble 3. there were no differences in all attributes amongst all bread samples (P> 0.05) at day 0 of storage, except for crumb color and overall like-ness scores of bread incorporated with 5% MsO, which had the lower score (P< 0.05). the addi-tion of 5% MsO to bread had negative effect on crumb color and overall likeness of bread. this was due to the marked increases in a* and b* values of bread crumb (table 2). GÖKMEN et al. (2011) reported that the addition of micro-encap-sulated n-3 fatty acids could increase function-ality of bread. shrimp oil is one of the important sources of n-3 fatty acids (tAKEUNGWONGtrA-KUL et al., 2012). thus, MsO at 3% (w/w) could be added into bread to improve the nutritive val-ues of bread without the negative effect on sen-sory property of bread.
After 3 days of storage, no differences in all at-tributes were observed amongst all bread sam-ples (P> 0.05). Nevertheless, crumb color, odor and overall likeness of bread added with 5% MsO were lower than others (P< 0.05). Wall ma-terials could protect the entrapped core by pro-viding a physical barrier against environmental conditions (GALLArDO et al., 2013). Food forti-fication is good way to induce the general pop-
ulation to consume components, such as n-3 fatty acids, and will add value to food product manufactured by the food industry (bOrNEO et al., 2007). However, the addition of 5% MsO might result in the increased free oil, especially at the surface of MsO. this led to more free oil, which was susceptible to oxidation. As a con-sequence, the lower score of odor likeness was found. therefore, MsO must be incorporated at the appropriate level to avoid the undesirable attributes of bread.
Volatile compounds
Volatile compounds in bread samples added with MsO at different levels after 3 days of stor-age are displayed in table 4. Volatile compounds in bread without MsO (days 0) were also deter-mined. Lipid oxidation generates a number of products, including volatile compounds, which are the major contributors to the rancid off-fla-vors and off-odors in the food product (rOss and sMItH, 2006).
In general, all compounds present in bread without MsO at day 0 were lower in abundance than those found after 3 days of storage. Nev-ertheless, 3-methyl-1-butanol, 2-pentyl-furan, heptenal and 2-octen-1-al were also lower in abundance after storage, plausibly due to the volatilization or decomposition. several deriv-atives of aldehyde, ketone and alcohol can be formed by the oxidation of lipids (VArLEt et al., 2006). Aldehydes are the most prominent vola-tiles produced during lipid oxidation and have been used to successfully follow lipid oxidation in a number of foods (sHAHIDI and PEGG 1994). After the storage, the bread without MsO con-tained new volatile compounds including deca-nal. the highest amount of lipid oxidation prod-ucts such as 3-methyl-1-butanol, benzeneeth-anol, benzaldehyde and 2-methyl-1-propanol
table 3 - Likeness score of breads incorporated with MsO at different levels at day 0 and 3 of storage.
Storage time MSO Crust color Crumb color Texture Appearance Odor Overall likeness(day) (% w/w)
0 Control 7.04±0.78aA 6.90±1.08aA 6.47±1.17aA 7.00±1.04aA 7.13±0.94aA 7.03±1.00aA 0 % 6.92 ±0.65aA 6.75±1.16aA 6.70±0.76aA 6.79±0.92aA 7.00±0.94aA 6.90±0.82aA 1 % 7.04±0.81aA 6.90±0.90aA 7.03±1.27aA 7.07±1.16aA 6.93±0.82aA 6.83±0.95aA 3 % 7.31±0.89aA 7.10±0.90aA 7.00±0.98aA 6.93±1.00aA 6.97±0.88aA 6.80±0.77aA 5 % 6.67±0.88aA 5.54±1.12bA 6.97±1.37aA 6.63±1.36aA 6.47±0.95aA 5.63±1.12bA
3 Control 6.94±0.89aA 6.90±1.24aA 6.04±0.91aA 7.00±0.89aA 6.52±1.23aA 6.44±0.93aA 0 % 6.72±0.96aA 6.74±0.96aA 6.38±1.10aA 7.00±1.21aA 6.58±1.31aA 6.36±0.91aA 1 % 6.83±1.33aA 6.87±1.41aA 6.74±0.90aA 7.06±1.21aA 6.56±1.01aA 6.28±0.96aA 3 % 7.00±0.80aA 7.00±0.91aA 6.70±0.95aA 6.74±1.21aA 5.96±0.75aA 6.14±1.09aA 5 % 6.66±1.14aA 5.43±1.07bA 6.60±1.22aA 6.39±1.36aA 5.16±0.94bA 5.36±0.99bA
Control = Added with 5% (w/w) spray dried empty capsule without the addition of shrimp oil.Data are expressed as mean±SD (n=3).Lowercase letters in the same column within the same storage time indicate significant difference (p < 0.05).Uppercase letters in the same column within the same sample indicate significant difference (p < 0.05).

Ital. J. Food Sci., vol. 27 - 2015 485
was found in bread without MsO after 3 days. Among all the aldehydic compounds, benzal-dehyde was found to be the major aldehyde in bread without MsO (0% MsO), followed by no-nanal and decanal, respectively. Additionally, volatile ketones (dihydro-5-pentyl-2(3H)-fura-none) and volatile alcohols (3-methyl-1-butanol, benzeneethanol, 2-methyl-1-propanol, 1-hex-anol, 1-octen-3-ol and 1-octanol) were also found in bread without MsO. MAIrE et al. (2013) reported that flour appeared relatively rich in al-cohols (3-methyl-1-butanol, 1-pentanol, 1-hex-anol and 1-octen-3-ol). these compounds were also reported by HANsEN and HANsEN (1994) in flour with different millings, formed by ei-ther lipid oxidation or microorganism metabo-lism. 1-Octen-3-ol is a volatile generated from linoleic acid oxidation in the presence of sin-glet oxygen (LEE and MIN, 2010). this indicated that lipid oxidation took place in bread without MsO. MAIrE et al. (2013) reported that dough preparation seemed to be the crucial step to-ward lipid oxidation due to enzymes (lipoxyge-nase and lipase) as well as air inside the dough texture. Additionally, auto-oxidation could oc-cur during baking by high temperatures, which promote an accelerated oxidation of ingredients in bread without MsO.
After storage, the formation of most volatile compounds in bread increased as the amount of MsO increased from none to 5%. those com-pounds included 1-hexanol, nonanal, 1-octen-3-ol, 1-octanol, (Z)-3-decen-1-ol and benze-
table 4 - Volatile compounds in breads incorporated with MsO at different levels after storage of 3 days at 30ºc.
Compounds Peak area (Abundance) × 106
Control 0% MSO 1% MSO 3% MSO 5% MSO
2-methyl-1-propanol ND 424 (309) 414 388 2643-methyl- 1-butanol 1350 1383 (1406) 1293 1264 12552-pentyl-furan ND ND (128) ND ND ND3-hydroxy-2-butanone 180 ND ND ND 168Heptenal ND ND (74) ND ND 1181-hexanol 414 302 (253) 402 426 441Nonanal 296 207 (122) 303 366 4142-octen-1-al ND ND (33) ND ND ND1-octen-3-ol 102 89 (63) 133 176 226Decanal 41 40 (ND) 26 78 83Benzaldehyde 347 450 (354) 285 274 4771-octanol 29 35 (33) 48 52 532-octen-1-ol ND ND 21 17 202-furanmethanol ND ND ND 152 220(E)-6-nonen-1-ol 89 ND 102 119 ND(Z)- 3-decen-1-ol 58 ND 59 67 135Benzenemethanol 22 ND ND ND 44Benzeneethanol 795 716 (683) 728 856 14373-hydroxy-2-methyl-4H-pyran-4-one ND ND ND ND 50Dihydro-5-pentyl-2(3H)-furanone ND 19 (15) 23 30 20
ND: non-detectable * Value in the parenthesis represents the abundance of compound in sample at 0 day.Control: Added with 5% (w/w) spray dried empty capsule without the addition of shrimp oil.
neethanol. However, 3-methyl-1-butanol de-creased with increasing MsO. this could be due to volatilization. benzaldehyde of sample added with 1 and 3% MsO showed the lower abundance than that without MsO. benzalde-hyde formed might bind with protein matrix of bread. Heptenal was also found in the sample added with 5% MsO. Higher abundance in no-nanal and benzaldehyde was observed in the sample incorporated with 5% MsO, compared with others after 3 days of storage. Volatile com-pounds in bread added with 5% MsO were gen-erally highest in abundance, compared with those added with others. tAKEUNGWONGtrA-KUL et al. (2014) reported that surface oil con-tent of MsO prepared using whey protein con-centrate: sodium caseinate: glucose syrup (1: 1: 2, w/w/w) as wall materials was 2.48 % (w/w). bread with higher level of MsO incorporated showed the higher amount of surface oil, which was more susceptible to oxidation. As a result, oxidation took place to a higher extent. Abun-dance of volatile compounds in all bread corre-lated well with the sensory property as shown in table 3, in which bread added with 5% MsO had the lowest score of odor likeness. For bread added with 1% or 3% MsO and control bread, similar amount of volatile compounds was no-ticeable and no difference in sensory property of bread was observed (p > 0.05) (table 3). there-fore, 3% MsO was the appropriate level to for-tify in bread without negative effect on quality and acceptability.

486 Ital. J. Food Sci., vol. 27 - 2015
cONcLUsION
MsO prepared using whey protein concen-trate, sodium caseinate and glucose syrup (1: 1: 2, w/w/w) as wall materials could be fortified in bread product. Fortification of MsO had im-pact on the bread loaf volume, color and senso-ry properties. MsO up to 3% could be incorpo-rated into bread to improve the nutritive value without affecting its sensorial properties. the fortified bread was quite stable up to 3 days of storage, in which no marked changes in color occurred and only slight increases in volatiles were obtained.
AcKNOWLEDGEMENt
“this work was supported by the Higher Education research Promotion and National research University Project of thai-land, Office of the Higher Education commission”. the trF Distinguished research Professor Grant and Prince of song-kla University were also acknowledged.
rEFErENcEs
borneo r., Kocer D., Ghai G., tepper b. and Karwe M. 2007. stability and consumer acceptance of long-chain ome-ga-3 fatty acids (eicosapentaenoic acid, 20: 5, n-3 and docosahexaenoic acid, 22: 6, n-3) in cream-filled sand-wich cookies. J. Food sci. 72: s049-s054.
carr b.t., Meilgaard M. and civille G. 1999. sensory evalu-ation techniques. crc Press, Washington, Dc.
chang H.J., Xu X.L., Zhou G.H., Li c.b. and Huang M. 2012. Effects of characteristics changes of collagen on meat physicochemical properties of beef semitendino-sus muscle during ultrasonic processing. Food bioproc. technol. 5:285-297.
cleary L.J., Andersson r. and brennan c.s. 2007. the be-haviour and susceptibility to degradation of high and low molecular weight barley β-glucan in wheat bread during baking and in vitro digestion. Food chem. 102:889-897.
conforti F.D. and Davis s.F. 2006. the effect of soya flour and flaxseed as a partial replacement for bread flour in yeast bread. Int. J. Food sci. technol. 41:95-101.
Ezhilarasi P.N., Indrani D., Jena b.s. and Anandharam-akrishnan c. 2014. Microencapsulation of Garcinia fruit extract by spray drying and its effect on bread quality. J. sci. Food Agric. 94:1116-1123.
Gallardo G., Guida L., Martinez V., López M.c., bernhardt D., blasco r., Pedroza-Islas r. and Hermida L.G. 2013. Microencapsulation of linseed oil by spray drying for func-tional food application. Food res Int. 52:473-482.
Gharsallaoui A., roudaut G., chambin O., Voilley A. and saurel r. 2007. Applications of spray-drying in microen-capsulation of food ingredients: An overview. Food res Int. 40:1107-1121.
Gökmen V., Mogol b.A., Lumaga r.b., Fogliano V., Kaplun Z. and shimoni E. 2011. Development of functional bread containing nanoencapsulated omega-3 fatty acids. J Food Eng. 105:585-591.
Hansen Å. and Hansen b. 1994. Influence of wheat flour type on the production of flavour compounds in wheat sourdoughs. J. cereal sci. 19:185-190.
Henna Lu F.s. and Norziah M.H. 2011. contribution of mi-croencapsulated n-3 PUFA powder toward sensory and oxidative stability of bread. J. Food Proc. Pres. 35:596-604.
Jiamyangyuen s., srijesdaruk V. and Harper W.J. 2005. Ex-traction of rice bran protein concentrate and its applica-tion in bread. songklanakarin J. sci. technol. 27:55-64.
Krupa-Kozak U., Altamirano-Fortoul r., Wronkowska M. and rosell c.M. 2012. breadmaking performance and tech-nological characteristic of gluten-free bread with inulin supplemented with calcium salts. Eur. Food res. tech-nol. 235:545-554.
Lee J. and Min D.b. 2010. Analysis of volatile compounds from chlorophyll photosensitized linoleic acid by head-space solid-phase microextraction (Hs-sPME). Food sci. biotechnol. 19:611-616.
Maire M., rega b., cuvelier M.E., soto P. and Giampaoli P. 2013. Lipid oxidation in baked products: Impact of formu-la and process on the generation of volatile compounds. Food chem. 141:3510-3518.
Meyer b.J., Mann N.J., Lewis J.L., Milligan G.c., sinclair A.J. and Howe P.r. 2003. Dietary intakes and food sourc-es of omega-6 and omega-3 polyunsaturated fatty acids. Lipid. 38: 391-398.
Nunes M., ryan L.A.M. and Arendt E. 2009. Effect of low lactose dairy powder addition on the properties of glu-ten-free batters and bread quality. Eur. Food res. tech-nol. 229:31-41.
Purlis E. and salvadori V.O. 2009. Modelling the brown-ing of bread during baking. Food res. Inter. 42:865-870.
ross c.F. and smith D.M. 2006. Use of volatiles as indica-tors of lipid oxidation in muscle foods. compr. rev. Food sci. Food saf. 5:18-25.
shahidi F. and Pegg r.b. 1994. Hexanal as an indicator of the flavor deterioration of meat and meat products. In “Li-pid oxidation in food”. A.J. Angelo (Ed.), p 105–19. Amer-ican chemical society., Washington, D.c.
shahidi F. and Wanasundara U.N. 1995. Oxidative stabili-ty of encapsulated seal blubber oil. In “Flavor technolo-gy-Physical chemistry, Modification, and Process”. c.t. Ho, c.t. tan and c.H. tong (Eds.), pp. 139–151. Ameri-can chemical society., Washington, Dc.
steel, r. G. D. and torrie, J. H. 1980. “Principles and Pro-cedures of statistics” 2nd ed. A biometrical Approach, McGraw-Hill, NY.
takeungwongtrakul s. and benjakul s. 2013. Oxidative sta-bility of shrimp oil-in-water emulsions as affected by an-tioxidant incorporation. Int. Aquat res. 5:1-12.
takeungwongtrakul s., benjakul s. and H-kittikun A. 2012. Lipids from cephalothorax and hepatopancreas of Pacif-ic white shrimp (Litopenaeus vannamei): compositions and deterioration as affected by iced storage. Food chem. 134:2066-2074.
takeungwongtrakul s., benjakul s., santoso J., trilaksani W. and Nurilmala M. 2014a. Extraction and stability of carotenoid-containing lipids from hepatopancreas of Pa-cific white shrimp (Litopenaeus vannamei). J. Food Proc. Pres. 39:10-18.
takeungwongtrakul s., benjakul s. and H-kittikun A. 2015. Wall materials and the presence of antioxidants influ-ence encapsulation efficiency and oxidative stability of micro-encapsulated shrimp oil. Eur. J. Lipid sci. tech-nol. 117: 450-459.
Varlet V., Knockaert c., Prost c. and serot t. 2006. com-parison of odor-active volatile compounds of fresh and smoked salmon. J. Agric. Food chem. 54:3391-3401.
Wehrle K., Grau H. and Arendt E.K. 1997. Effects of lactic acid, acetic acid, and table salt on fundamental rheolog-ical properties of wheat dough. cereal chem. J. 74:739-744.
Paper Received October 30, 2014 Accepted February 2, 2015
Copyright © 2022 FDOKUMEN


![Hamilton Beach Artisan Bread Maker [29888] - Use & Care](https://static.fdokumen.com/doc/165x107/6324aafb051fac18490ce4cf/hamilton-beach-artisan-bread-maker-29888-use-care.jpg)