Performance evaluation of crumb rubber modified stone mastic asphalt pavement in Malaysia

Baravalle et al. EURASIP Journal on Image and Video Processing (2015) 2015:9 DOI 10.1186/s13640-015-0063-8
RESEARCH Open Access
Multifractal characterisation and classificationof bread crumb digital imagesRodrigo G Baravalle1*, Claudio A Delrieux2 and Juan C Gómez1
Abstract
Adequate models of the bread crumb structure can be critical for understanding flow and transport processes inbread manufacturing, creating synthetic bread crumb images for photo-realistic rendering, evaluating similarities, andestablishing quality features of different bread crumb types. In this article, multifractal analysis, employing themultifractal spectrum (MFS), has been applied to study the structure of the bread crumb in four varieties of bread(baguette, sliced, bran, and sandwich). The computed spectrum can be used to discriminate among bread crumbs fromdifferent types. Also, high correlations were found between some of these parameters and the porosity, coarseness,and heterogeneity of the samples. These results demonstrate that the MFS is an appropriate tool for characterising theinternal structure of the bread crumb, and thus, it may be used to establish important quality properties it should have.The MFS has shown to provide local and global image features that are both robust and low-dimensional, leading tofeature vectors that capture essential information for classification tasks. Results show that the MFS-based classificationis able to distinguish different bread crumbs with very high accuracy. Multifractal modelling of the underlyingstructure can be an appropriate method for parameterising and simulating the appearance of different bread crumbs.
Keywords: Fractal; Multifractal; Image analysis; Image classification; Feature extraction
1 IntroductionThe goals of this research are (1) to evaluate if the MFS[1] can be applied to characterise and discriminate thebread crumb structure for different bread types from dig-ital images and (2) to investigate the effectiveness of themethod in the classification of these structures.One of the most important factors to evaluate the qual-
ity of a bread loaf is related to its crumb structure. Closeexamination of different slices reveals considerable varia-tion in the cell (air bubble) size even within a single sampleof the same bread type.Fractal and multifractal analysis of images has proved
to be able to capture useful properties of the underlyingmaterial being represented. These features have been suc-cessfully applied in different areas, such as medicine [2,3]and texture classification [4]. In food research, fractal andmultifractal analysis has been applied in the study of appletissues [5], pork sirloins [6], and also in chocolate, potato,
*Correspondence: [email protected] for System Dynamics and Signal Processing, FCEIA, UniversidadNacional de Rosario, CIFASIS-CONICET, Ocampo y Esmeralda, S2000EZP,Rosario, ArgentinaFull list of author information is available at the end of the article
and pumpkin surfaces [7]. Through several procedures[8,9], it is possible to obtain different fractal dimensions(FD), each of them capturing a different property of thematerial (e.g. porosity, rugosity).Data analysis of the results of the feature extraction
process is useful for obtaining key properties of mate-rials. This information could then be used in qualitymeasurements of real samples and in the validation ofsynthetic representations of them. In other words, theseprocesses are useful to determine if a given image presentsthe observed features in that material, allowing to asso-ciate quality measure parameters to it. In [10], a breadcrumb quality test based on Gabor filters was performed,obtaining good quality assessment. Nevertheless, a smalldatabase was used (30 images). In [9], several fractal fea-tures were obtained for one type of bread, demonstratingthat a vector of FDs would be capable of obtaining key fea-tures of the crumb texture more accurately than using asingle FD.In this work, we propose the application of the mul-
tifractal spectrum (MFS) to describe and classify differ-ent bread crumb types. One of the main features of theMFS is its bi-Lipschitz invariance, that is, invariance to
© 2015 Baravalle et al.; licensee Springer. This is an Open Access article distributed under the terms of the Creative CommonsAttribution License (http://creativecommons.org/licenses/by/4.0), which permits unrestricted use, distribution, and reproductionin any medium, provided the original work is properly credited.

Baravalle et al. EURASIP Journal on Image and Video Processing (2015) 2015:9 Page 2 of 10
perspective transforms (viewpoint changes) and smoothtexture surface deformations. It is shown that the MFSis also locally invariant to affine changes in illumination.In other words, MFS analysis is in theory a robust fea-ture extractor, what makes it specially adequate for thepurposes of our study.Food classification has already been applied using frac-
tal and other techniques in [11,12], but these works donot address the intra-class problem, i.e. the classificationismade among different foods and not bymaking differentclasses out of the same food.In a previous work [13], we showed that the MFS in
combination with other fractal features was able to clas-sify different bread crumb types with high accuracy. Thepresent work aims to simplify the model and strengthenthese results by comparing only the MFS with other state-of-the-art features and using different classifiers and alsoto study the correlations of the features obtained with theprocedure and different texture features obtained fromthe images.The proposed method is compared to other state-of-
the-art features for texture classification. The results ofthis feature extraction procedure show that the classifieris robust and presents good discrimination properties todistinguish between different bread types and also breadfrom non-bread images.This paper is organised as follows. In Section 2, the
theory underlying fractal sets is introduced, and the mate-rials and methods employed in this work are presented.In Section 3, the results obtained in the characterisationand classification procedures are shown and discussed.In Section 4, the conclusions are summarised, as well aspossible future works.
2 Materials andmethods2.1 Fractals andmultifractalsThe term fractal was first employed by the mathematicianB. Mandelbrot in [14]. Fractal objects have the prop-erty of self-similarity (i.e. the geometrical or topologicalproperties are invariant at different scales), and they arecharacterised by a non-integer dimension. Fractal objectscan have one or more FDs. Most of the famous fractal sets(i.e. the Cantor set, the Von Koch curve, and the Sierpinskigasket) can be characterised by a single exponent thatrelates how their geometrical properties vary under scalechanges. On the other hand, there are cases where thefractal object exhibits different exponents under differentscales. Those are called multifractals [15] and are char-acterised by a sequence of FDs or even a function thatestablishes the local variance of the geometrical propertiesunder scale changes. It is assumed that these structuresare composed by different fractals coexisting simultane-ously. The self-similarity, then, can be characterised by amultifractal spectrum that establishes the specific fractal
behaviour of the set at a given scale. The multifractalapproach characterises better the objects than the frac-tal one, since variations in local regions are captured in amore accurate manner. A particular definition of dimen-sion, the so-called box dimension, is employed in fractaland multifractal analysis.
2.1.1 Box dimensionOn the one hand, mathematical objects such as theKoch curve and the Sierpinski triangle have exact self-similarity. Natural phenomena, on the other hand, arebetter described by statistical self-similarity. In such cases,the box FD is used. Box FD is a simplification of theHausdorff (originally Minkowski-Bouligand) dimensionfor non-strictly self-similar objects [8]. Given an image I,it is subdivided in a regular grid of boxes of side ε. If Nε
represents the amount of boxes that contain at least onepoint of I for that ε, then the box dimension Db is definedas:
Db � limε→0
log (Nε)
log (1/ε). (1)
A practical algorithm for computing Db in digital bina-rised images establishes different partitions of the originalimage in regular grids of side ε (in pixels) and counts foreach partition the amount Nε of boxes that contains atleast one pixel of the object of interest. It uses a bina-rised image and selects different values of ε in it, makinga count of the boxes that contains pixels in each case.Since this procedure is not invariant under translations,an average of grid counting is performed under severaltranslations at a given grid size ε. With the previous steps,a set of {1/ε,Nε} pairs is obtained, with which a lin-ear fit is performed in log-space. Finally, the slope of theresulting straight line is by definition the box dimensionof the image. In Figure 1, an image of the bread typebran is shown (left), with an example of binarisation (cen-tre) and its corresponding box dimension computation(right).
2.2 The theory behindmultifractal analysisIn [9], several procedures were applied to analyse thebread crumb structure showing that a vector of FDscould better characterise those structures. Based on thatassumption, in this work, a multifractal analysis of thebread crumb is carried out. The idea behind multifractalanalysis is to examine, in the limit, the local behaviour ofa measure μ at each point of the set under study.Let E be a structure divided in disjoint substructures Ei
of size ε in such a way that:
⋃iEi = E. (2)
Baravalle et al. EURASIP Journal on Image and Video Processing (2015) 2015:9 Page 3 of 10
Figure 1 Box dimension computation. A bread image (left) with its binarisation (centre) and its computed box dimension (right).
Each substructure Ei is characterised by a measureμ(Ei). From the point of view of multifractal analysis,it is useful to define the Hölder exponent, αi, for eachsubstructure Ei, as a function of ε, i.e.,
αi �ln (μ(Ei))ln (ε)
, (3)
and to take the limit when ε tends to 0. The limit α rep-resents the value of the Hölder exponent at a point in thestructure, that is:
α = limε→0
αi. (4)
This exponent characterises the local regularity of thestructure at a point. To obtain a global characterisationof the regularity of the structure, it is necessary to obtainthe distribution of α in E. Then, the multifractal spectrumrelated to the value of ε, fε(αi), is obtained by counting theNε boxes characterised by αi, in the form:
fε(αi) = − ln(Nε(αi))
ln(ε). (5)
When ε tends to 0, the limiting value is the FD of thestructure E characterised by α (the Hausdorff dimensionof the α distribution). It is also known as the multifractalspectrum f (α) (MFS) [16], i.e.,
f (α) = limε→0
fε(α). (6)
2.2.1 Practical procedure for theMFSThere are several techniques described in the literature toobtain the MFS, which lead to different representations ofthe multifractal information present in the structure. Usu-ally, the method of moments is used [5,6], but it producesa feature vector which is not always suitable for classifica-tion tasks. In this work, the procedure presented in [1] isemployed, due to its better classification performance.
The technique first computes α(x) for each pixel x ofthe image. Denote with B(x, ε) the closed disk of radiusε > 0 centred at x, then, α(x) is defined as a straight linefit of the values log(μ(B(x, ε))) and log(ε). Then, a discretesample set {αi, i = 1, . . . ,M} is taken from the interval[0, 1], and the point set corresponding to that value of αi isformed by grouping the pixels with values that are close tothat αi under some threshold. The FD for each point set iscomputed as the straight line fit of the values log((Nε(αi))and log(ε). The valueM determines the vector length, i.e.the number of FDs of the MFS.As previously stated, the f (α) spectrum (MFS) and the
method of moments produce vectors which contains thesame information, but in this work, the first is employed,since it also outperforms the method of moments inclassification tasks. This process produces a finite vectorwhich is used as the feature vector later in this paper. Inthe next sections, the vector length (the number of FDs)is chosen based on the classification performance of thecomputed feature vector.
2.2.2 Multifractal measuresDefining different μ functions accounts for differentimage features. The first approach is to define μ in theintensity domain (I), i.e.,
μ (B(x, ε)) =∫B(x,ε)
(Gε ∗ I)dx, (7)
where ∗ is the 2D convolution operator and Gε is aGaussian smoothing kernel with variance ε, i.e. μ is theweighted average intensity value in the disk of radius ε
centred at x (B(x, ε)). This is the density of the intensityfunction, and it describes how the intensity at a pointchanges over scale.The definition of μ could serve to specific purposes. For
instance, if robustness to illumination changes is needed,one choice is to define μ(B(x, ε)) on the domain of the
Baravalle et al. EURASIP Journal on Image and Video Processing (2015) 2015:9 Page 4 of 10
energy of the gradients. Let fk , k = 1, 2, 3, 4 be four direc-tional differential operators along (respectively) the ver-tical, horizontal, diagonal, and anti-diagonal directions.Then, we define a measure function μ(B(x, ε)) for theimage I as follows:
μ(B(x, ε)) =(∫
B(x,ε)
∑k
(fk ∗ (Gε ∗ I)
)2 dx)1/2
. (8)
Another choice is to define μ(B(x, ε)) as the sum of theLaplacians of the image inside B(x, ε), that is:
μ(B(x, ε)) =∫B(x,ε)
|∇2(Gε ∗ I)|dx. (9)
All these alternative measures modify the computedFD and MFS (except for trivial or monofractal images)and therefore are valuable choices in finding adequatefeatures, as will be shown below.
2.3 Image acquisitionFor testing our characterisation and classification proce-dures, 20 images of 4 different commercial bread types(baguette, sliced, bran, and sandwich), counting 80 images,were obtained in the same day of purchase using an HPPSC 1210 scanner with the following settings: highlight190, shadows 40, and midtones 1, and they were savedin TIFF format. Images were acquired at a resolution of380 × 380 pixels (the maximum possible area for the fourbread types) and 350 dpi (1 pixel= 0.00527
[mm2]). Then,
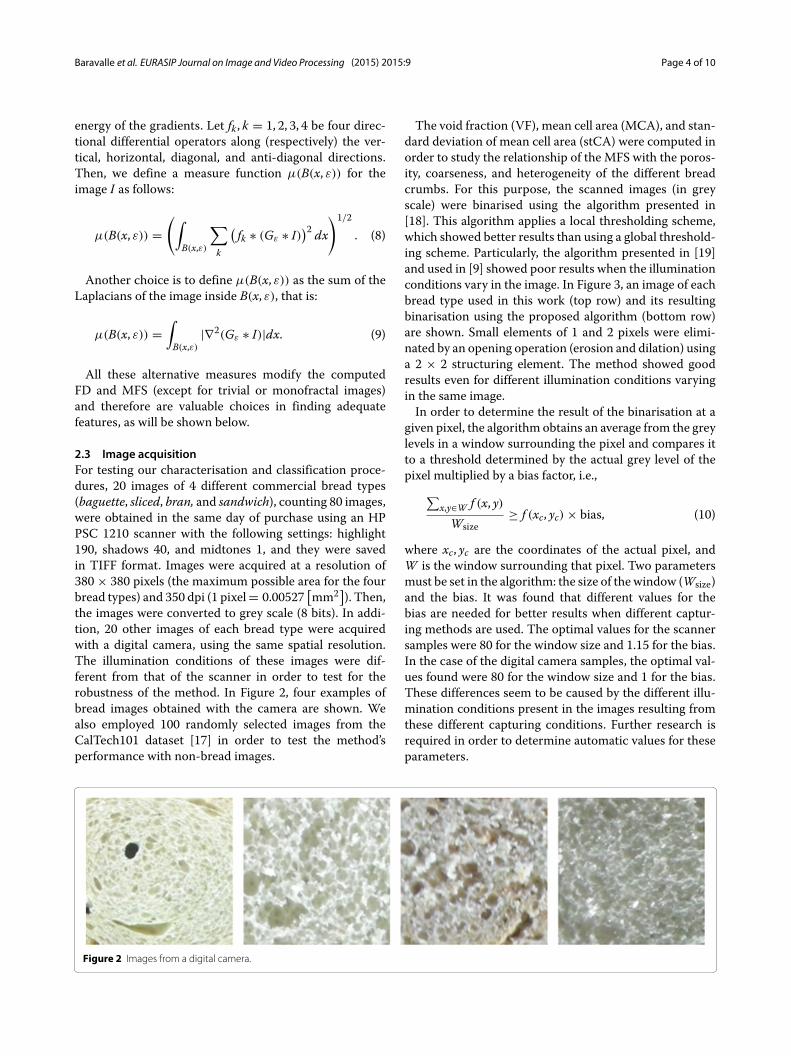
the images were converted to grey scale (8 bits). In addi-tion, 20 other images of each bread type were acquiredwith a digital camera, using the same spatial resolution.The illumination conditions of these images were dif-ferent from that of the scanner in order to test for therobustness of the method. In Figure 2, four examples ofbread images obtained with the camera are shown. Wealso employed 100 randomly selected images from theCalTech101 dataset [17] in order to test the method’sperformance with non-bread images.
The void fraction (VF), mean cell area (MCA), and stan-dard deviation of mean cell area (stCA) were computed inorder to study the relationship of the MFS with the poros-ity, coarseness, and heterogeneity of the different breadcrumbs. For this purpose, the scanned images (in greyscale) were binarised using the algorithm presented in[18]. This algorithm applies a local thresholding scheme,which showed better results than using a global threshold-ing scheme. Particularly, the algorithm presented in [19]and used in [9] showed poor results when the illuminationconditions vary in the image. In Figure 3, an image of eachbread type used in this work (top row) and its resultingbinarisation using the proposed algorithm (bottom row)are shown. Small elements of 1 and 2 pixels were elimi-nated by an opening operation (erosion and dilation) usinga 2 × 2 structuring element. The method showed goodresults even for different illumination conditions varyingin the same image.In order to determine the result of the binarisation at a
given pixel, the algorithm obtains an average from the greylevels in a window surrounding the pixel and compares itto a threshold determined by the actual grey level of thepixel multiplied by a bias factor, i.e.,∑
x,y∈W f (x, y)Wsize
≥ f (xc, yc) × bias, (10)
where xc, yc are the coordinates of the actual pixel, andW is the window surrounding that pixel. Two parametersmust be set in the algorithm: the size of the window (Wsize)and the bias. It was found that different values for thebias are needed for better results when different captur-ing methods are used. The optimal values for the scannersamples were 80 for the window size and 1.15 for the bias.In the case of the digital camera samples, the optimal val-ues found were 80 for the window size and 1 for the bias.These differences seem to be caused by the different illu-mination conditions present in the images resulting fromthese different capturing conditions. Further research isrequired in order to determine automatic values for theseparameters.
Figure 2 Images from a digital camera.

Baravalle et al. EURASIP Journal on Image and Video Processing (2015) 2015:9 Page 5 of 10
Figure 3 Images from a scanner. Baguette, sliced, bran, and sandwich bread types (top row) with their corresponding binarisations (bottom row).
3 Results and discussionIn this section, we will attempt to show how the MFSbehave adequately as a feature descriptor able to distin-guish bread from non-bread images. For this purpose, theMFS, using 20 FDs, was computed for each of the 200images (i.e., 40 images of each bread type and 40 randomlyselected non-bread images, getting 5 balanced classes). Inthe next subsections, we show how the computed data isanalysed and used for classification purposes.
3.1 Data analysisSelf-organising maps (SOM) [20] of the feature vectorsassociated with each bread image were useful to rep-resent them in a lower dimensional view, in order tobetter understand the meaning of their respective MFS. ASOM maps high-dimensional data into a (typically) two-dimensional representation, using neighbourhood infor-mation. Topological information of the original data ispreserved.Unsupervised SOM of the multifractal representation
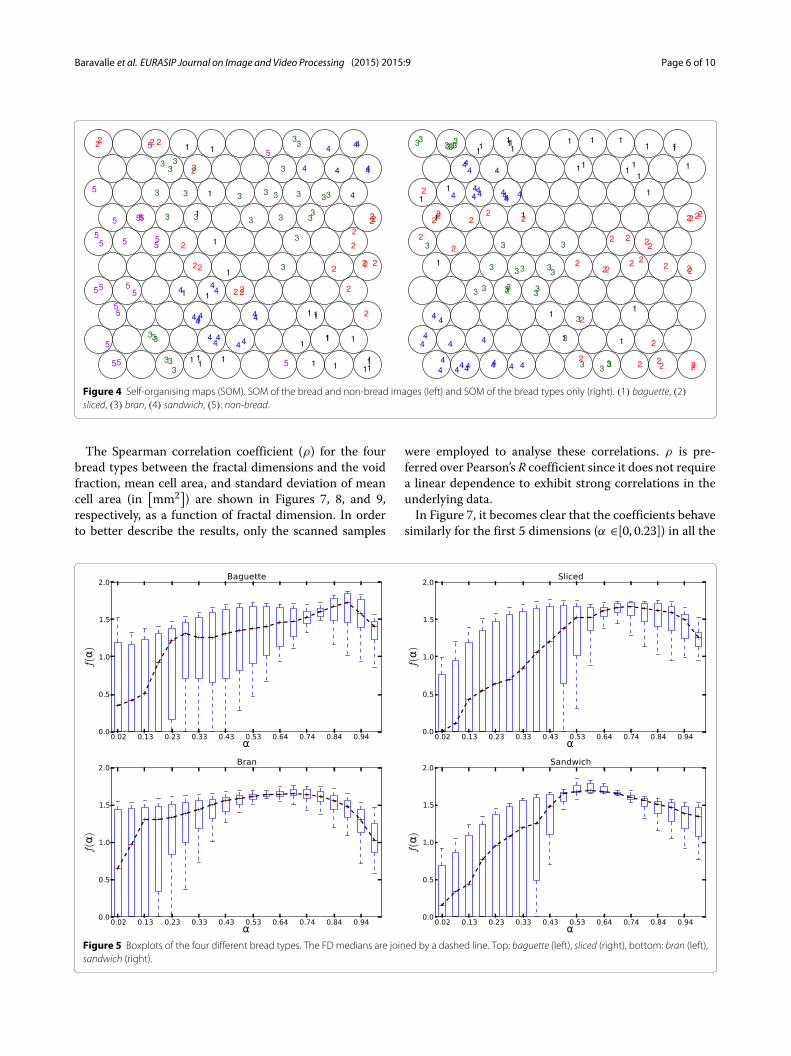
of bread and non-bread images are shown in Figure 4 ina grid of 10 × 10 cells (the behaviour observed is simi-lar for different grid sizes). In the left image, the 5 classes(e.g. baguette, sliced, bran, sandwich, and non-bread) areshown, while in the right image, the non-bread class hasbeen removed, and then, the SOMwas recomputed for theremaining 4 classes, in order to highlight details amongthe MFS of the different bread types. The multifractalfeature SOM appears to show easily separable classes.It seems that a classifier could potentially obtain low
classification errors using the multifractal features, sincethe numbers representing different classes are clearly sep-arated to each other, i.e. there are almost no cells with twoor more different numbers in it. A classifier can defineregions of space (group of cells) for each class.In Figure 5, boxplots of the four different bread types
are shown with the medians of each FD (in red) joined bya dashed line. Each FD corresponds to a value of αi. Inour experiments, the MFS vector has 20 FDs (for reasonsthat will be explained in the classification section). Fromthis plot, it could be pointed out that in the first half ofthe MFS (first 10 FDs, α ∈[0, 0.53)), the dispersion of theFDs is higher than in the second half of the spectrum (last10 FDs, α ∈[0.53, 1]). The spectrum in the last FDs tendsto have a shape that identifies better a particular type ofimage. Usually, the spectra of the same class and the samecapturing method have, in this part of the spectrum, ashape that is useful to characterise the class. Nevertheless,the capturing method and the illumination conditions ofthe image influence this shape, i.e. these two factors alterthe MFS of the image. In other words, there is no uniqueshape for each class of bread type.For the sake of completeness, in Figure 6, the mean val-
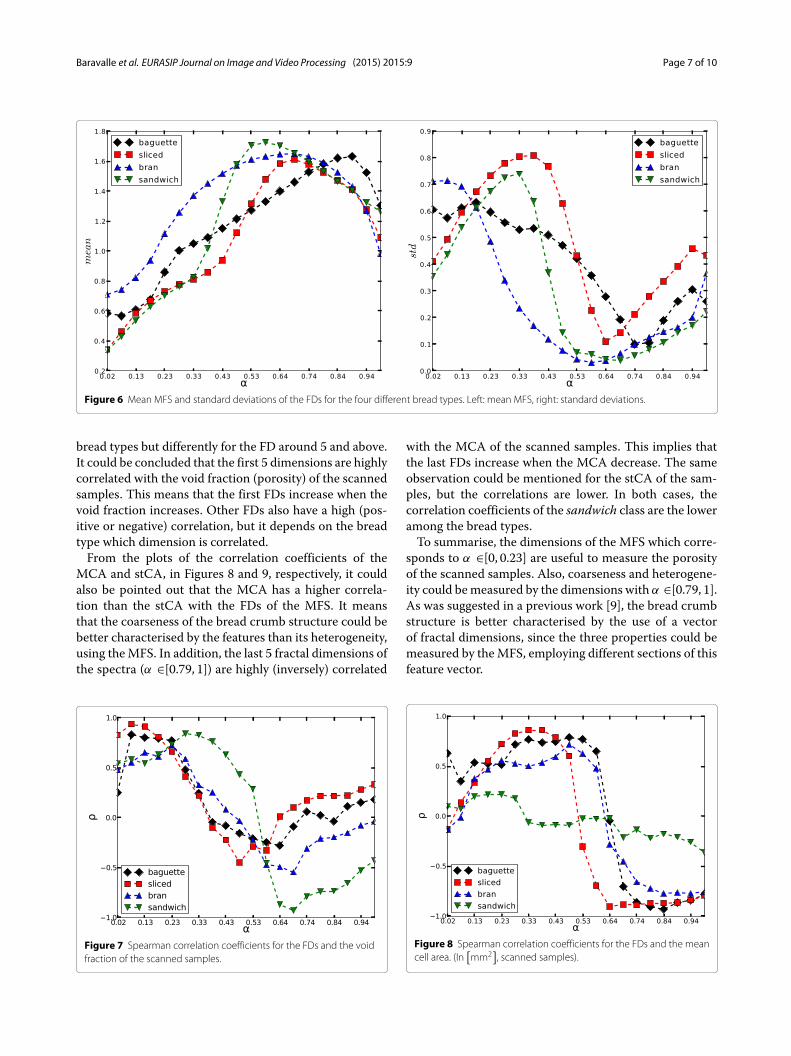
ues and the standard deviations of the MFS for the fourdifferent bread types are shown. This image shows, sim-ilarly to the SOM maps, that the MFS could potentiallycharacterise and classify the different bread crumb types,since the mean values are different for each class. Thestandard deviations are also consistent with the resultsfound in the boxplots.
Baravalle et al. EURASIP Journal on Image and Video Processing (2015) 2015:9 Page 6 of 10
Figure 4 Self-organising maps (SOM). SOM of the bread and non-bread images (left) and SOM of the bread types only (right). (1) baguette, (2)sliced, (3) bran, (4) sandwich, (5): non-bread.
The Spearman correlation coefficient (ρ) for the fourbread types between the fractal dimensions and the voidfraction, mean cell area, and standard deviation of meancell area (in
[mm2]) are shown in Figures 7, 8, and 9,
respectively, as a function of fractal dimension. In orderto better describe the results, only the scanned samples
were employed to analyse these correlations. ρ is pre-ferred over Pearson’s R coefficient since it does not requirea linear dependence to exhibit strong correlations in theunderlying data.In Figure 7, it becomes clear that the coefficients behave
similarly for the first 5 dimensions (α ∈[0, 0.23]) in all the
Figure 5 Boxplots of the four different bread types. The FD medians are joined by a dashed line. Top: baguette (left), sliced (right), bottom: bran (left),sandwich (right).
Baravalle et al. EURASIP Journal on Image and Video Processing (2015) 2015:9 Page 7 of 10
Figure 6 Mean MFS and standard deviations of the FDs for the four different bread types. Left: mean MFS, right: standard deviations.
bread types but differently for the FD around 5 and above.It could be concluded that the first 5 dimensions are highlycorrelated with the void fraction (porosity) of the scannedsamples. This means that the first FDs increase when thevoid fraction increases. Other FDs also have a high (pos-itive or negative) correlation, but it depends on the breadtype which dimension is correlated.From the plots of the correlation coefficients of the
MCA and stCA, in Figures 8 and 9, respectively, it couldalso be pointed out that the MCA has a higher correla-tion than the stCA with the FDs of the MFS. It meansthat the coarseness of the bread crumb structure could bebetter characterised by the features than its heterogeneity,using theMFS. In addition, the last 5 fractal dimensions ofthe spectra (α ∈[0.79, 1]) are highly (inversely) correlated
Figure 7 Spearman correlation coefficients for the FDs and the voidfraction of the scanned samples.
with the MCA of the scanned samples. This implies thatthe last FDs increase when the MCA decrease. The sameobservation could be mentioned for the stCA of the sam-ples, but the correlations are lower. In both cases, thecorrelation coefficients of the sandwich class are the loweramong the bread types.To summarise, the dimensions of the MFS which corre-
sponds to α ∈[0, 0.23] are useful to measure the porosityof the scanned samples. Also, coarseness and heterogene-ity could bemeasured by the dimensions with α ∈[0.79, 1].As was suggested in a previous work [9], the bread crumbstructure is better characterised by the use of a vectorof fractal dimensions, since the three properties could bemeasured by theMFS, employing different sections of thisfeature vector.
Figure 8 Spearman correlation coefficients for the FDs and the meancell area. (In
[mm2
], scanned samples).

Baravalle et al. EURASIP Journal on Image and Video Processing (2015) 2015:9 Page 8 of 10
Figure 9 Spearman correlation coefficients for the FDs and thestandard deviation of the mean cell area. (In
[mm2
], scanned
samples).
3.2 Bread classificationIn order to test for the discriminative capability of themethod, a classification experiment is made. Five classesare defined, viz., baguette, sliced, bran, sandwich, and non-bread, assigning 40 images to each class. A comparisonis made between the MFS and state-of-the-art features inthe computer vision literature. This classification schemecorresponds to an intra-class problem, which is harder tosolve than an ordinary inter-class one.K-fold cross validation is applied to the entire set (with
K = 4), employing three different classifiers: support vec-tor machines (SVM), random forests (RF) [21], and near-est neighbours (NN). Results show that the MFS presentsgood classification performance regardless of the classi-fier employed. The libsvm implementation [22] was usedfor the SVM classifier (with RBF kernel). In the case of theRF (100 trees) and the NN (1 neighbour) classifiers, thescikit-learn python library was employed.In Table 1, the classification performance of the method
is tested using different numbers of FDs. When 20 FDsare used, a useful combination of performance and low di-mensionality is achieved (it shows the best classificationresults for the RF and NN classifiers), so this number ofFDs is used in the following computations.
Table 1 Bread crumb classification results with differentnumbers of FDs for theMFS and different classifiers
#FDs 10 20 30
SVM 96% 94.5% 95.5%
RF 91.5% 93.5% 93%
NN 88.5% 90.5% 90%
Best results for each classifier appear in italics.
Table 2 Bread crumb classification results using differentcombinations of theMFS and different classifiers
Method MFS MFS+L MFS+G CIELab
SVM 94.5% 95.5% 97.5% 97.5%
RF 93.5% 96% 95% 96%
NN 90.5% 90% 87% 92%
#FDs 20 40 40 60
Best results for each classifier appear in italics.
In Table 2, several combinations of different MFSobtained from the images and their classificationperformance are shown. The MFS used in the study werecomputed based on the density of the intensity (MFS inthe table), the Laplacian of the intensity (L), and the gra-dient of the intensity (G) (see section ‘Multifractal mea-sures’). In addition, another test is made, using the CIELab[23] colour space. The key advantage of this colour spaceis that it tends to reduce the dependency of the resultingimage colour on the device used in the capture. The inten-sity of the images is transformed to the CIELab space,and the MFS of the three separated channels (L, a, and b)are combined together, obtaining a vector of 60 FDs. Thiscombination showed the best classification performance.It means that adding colour information in the a andb channels is useful for better classification of differenttypes of bread crumbs, when different capturing devicesare used (in this case, a scanner and a digital camera).In Table 3, state-of-the-art features (Haralick [24], local
binary pattern (Lbp) [25], and SIFT [26] features) are com-puted for the images. The best classification performanceis obtained using the SIFT features, but a feature vectorof length 128 is required for every image, and, in addition,computational space and time is needed to build internalstructures (e.g. a codebook).For better understanding of the classification results,
confusion matrices of the classification procedures couldbe plotted. As an example, the confusion matrix (fromthe cross validation) of the best results, i.e. the CIELabmethod, employing the SVM classifier, can be seen inTable 4. In each column of the matrix, the output of theclassifier for the 40 images of each class is tested for cor-rectness. The table shows that only in a few cases, the
Table 3 Bread crumb classification results for differentstate-of-the-art features and different classifiers
Method Haralick Lbp SIFT
SVM 94% 78.5% 96.5%
RF 91% 71.5% 92%
NN 79% 70% 86%
#FDs 13 36 128
Best results for each classifier appear in italics.
Baravalle et al. EURASIP Journal on Image and Video Processing (2015) 2015:9 Page 9 of 10
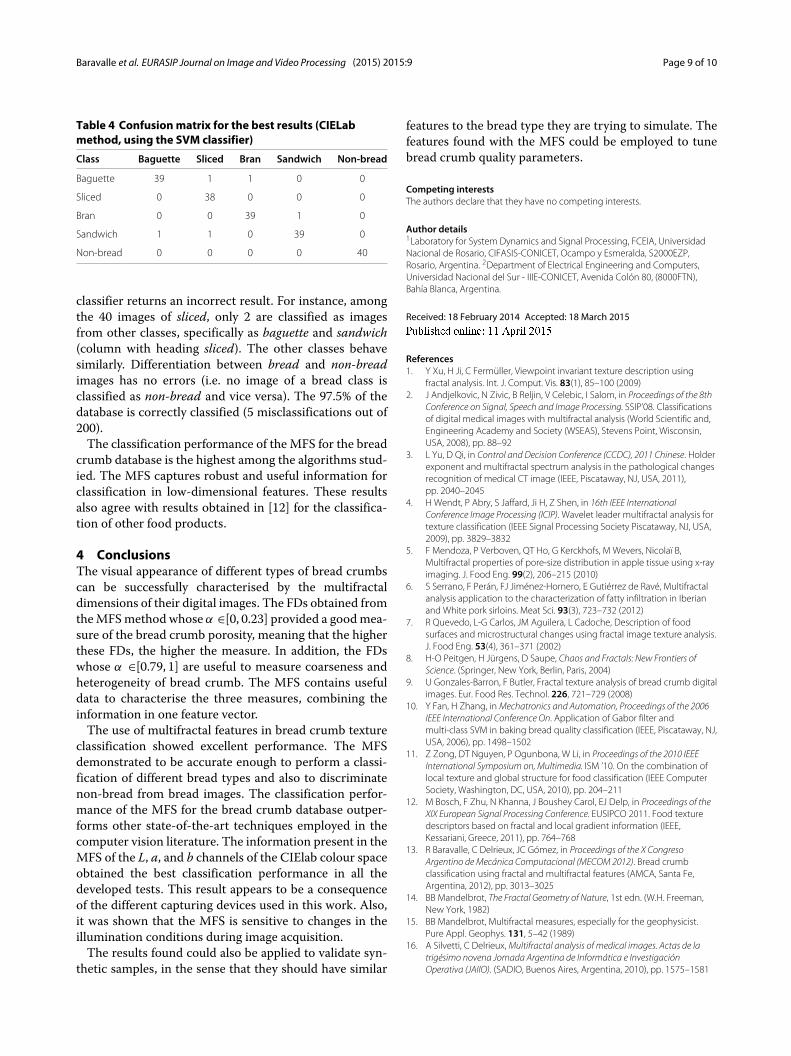
Table 4 Confusionmatrix for the best results (CIELabmethod, using the SVM classifier)
Class Baguette Sliced Bran Sandwich Non-bread
Baguette 39 1 1 0 0
Sliced 0 38 0 0 0
Bran 0 0 39 1 0
Sandwich 1 1 0 39 0
Non-bread 0 0 0 0 40
classifier returns an incorrect result. For instance, amongthe 40 images of sliced, only 2 are classified as imagesfrom other classes, specifically as baguette and sandwich(column with heading sliced). The other classes behavesimilarly. Differentiation between bread and non-breadimages has no errors (i.e. no image of a bread class isclassified as non-bread and vice versa). The 97.5% of thedatabase is correctly classified (5 misclassifications out of200).The classification performance of the MFS for the bread
crumb database is the highest among the algorithms stud-ied. The MFS captures robust and useful information forclassification in low-dimensional features. These resultsalso agree with results obtained in [12] for the classifica-tion of other food products.
4 ConclusionsThe visual appearance of different types of bread crumbscan be successfully characterised by the multifractaldimensions of their digital images. The FDs obtained fromtheMFSmethod whose α ∈[0, 0.23] provided a goodmea-sure of the bread crumb porosity, meaning that the higherthese FDs, the higher the measure. In addition, the FDswhose α ∈[0.79, 1] are useful to measure coarseness andheterogeneity of bread crumb. The MFS contains usefuldata to characterise the three measures, combining theinformation in one feature vector.The use of multifractal features in bread crumb texture
classification showed excellent performance. The MFSdemonstrated to be accurate enough to perform a classi-fication of different bread types and also to discriminatenon-bread from bread images. The classification perfor-mance of the MFS for the bread crumb database outper-forms other state-of-the-art techniques employed in thecomputer vision literature. The information present in theMFS of the L, a, and b channels of the CIElab colour spaceobtained the best classification performance in all thedeveloped tests. This result appears to be a consequenceof the different capturing devices used in this work. Also,it was shown that the MFS is sensitive to changes in theillumination conditions during image acquisition.The results found could also be applied to validate syn-
thetic samples, in the sense that they should have similar
features to the bread type they are trying to simulate. Thefeatures found with the MFS could be employed to tunebread crumb quality parameters.
Competing interestsThe authors declare that they have no competing interests.
Author details1Laboratory for System Dynamics and Signal Processing, FCEIA, UniversidadNacional de Rosario, CIFASIS-CONICET, Ocampo y Esmeralda, S2000EZP,Rosario, Argentina. 2Department of Electrical Engineering and Computers,Universidad Nacional del Sur - IIIE-CONICET, Avenida Colón 80, (8000FTN),Bahía Blanca, Argentina.
Received: 18 February 2014 Accepted: 18 March 2015
References1. Y Xu, H Ji, C Fermüller, Viewpoint invariant texture description using
fractal analysis. Int. J. Comput. Vis. 83(1), 85–100 (2009)2. J Andjelkovic, N Zivic, B Reljin, V Celebic, I Salom, in Proceedings of the 8th
Conference on Signal, Speech and Image Processing. SSIP’08. Classificationsof digital medical images with multifractal analysis (World Scientific and,Engineering Academy and Society (WSEAS), Stevens Point, Wisconsin,USA, 2008), pp. 88–92
3. L Yu, D Qi, in Control and Decision Conference (CCDC), 2011 Chinese. Holderexponent and multifractal spectrum analysis in the pathological changesrecognition of medical CT image (IEEE, Piscataway, NJ, USA, 2011),pp. 2040–2045
4. H Wendt, P Abry, S Jaffard, Ji H, Z Shen, in 16th IEEE InternationalConference Image Processing (ICIP). Wavelet leader multifractal analysis fortexture classification (IEEE Signal Processing Society Piscataway, NJ, USA,2009), pp. 3829–3832
5. F Mendoza, P Verboven, QT Ho, G Kerckhofs, M Wevers, Nicolaï B,Multifractal properties of pore-size distribution in apple tissue using x-rayimaging. J. Food Eng. 99(2), 206–215 (2010)
6. S Serrano, F Perán, FJ Jiménez-Hornero, E Gutiérrez de Ravé, Multifractalanalysis application to the characterization of fatty infiltration in Iberianand White pork sirloins. Meat Sci. 93(3), 723–732 (2012)
7. R Quevedo, L-G Carlos, JM Aguilera, L Cadoche, Description of foodsurfaces and microstructural changes using fractal image texture analysis.J. Food Eng. 53(4), 361–371 (2002)
8. H-O Peitgen, H Jürgens, D Saupe, Chaos and Fractals: New Frontiers ofScience. (Springer, New York, Berlin, Paris, 2004)
9. U Gonzales-Barron, F Butler, Fractal texture analysis of bread crumb digitalimages. Eur. Food Res. Technol. 226, 721–729 (2008)
10. Y Fan, H Zhang, inMechatronics and Automation, Proceedings of the 2006IEEE International Conference On. Application of Gabor filter andmulti-class SVM in baking bread quality classification (IEEE, Piscataway, NJ,USA, 2006), pp. 1498–1502
11. Z Zong, DT Nguyen, P Ogunbona, W Li, in Proceedings of the 2010 IEEEInternational Symposium on, Multimedia. ISM ’10. On the combination oflocal texture and global structure for food classification (IEEE ComputerSociety, Washington, DC, USA, 2010), pp. 204–211
12. M Bosch, F Zhu, N Khanna, J Boushey Carol, EJ Delp, in Proceedings of theXIX European Signal Processing Conference. EUSIPCO 2011. Food texturedescriptors based on fractal and local gradient information (IEEE,Kessariani, Greece, 2011), pp. 764–768
13. R Baravalle, C Delrieux, JC Gómez, in Proceedings of the X CongresoArgentino deMecánica Computacional (MECOM 2012). Bread crumbclassification using fractal and multifractal features (AMCA, Santa Fe,Argentina, 2012), pp. 3013–3025
14. BB Mandelbrot, The Fractal Geometry of Nature, 1st edn. (W.H. Freeman,New York, 1982)
15. BB Mandelbrot, Multifractal measures, especially for the geophysicist.Pure Appl. Geophys. 131, 5–42 (1989)
16. A Silvetti, C Delrieux,Multifractal analysis of medical images. Actas de latrigésimo novena Jornada Argentina de Informática e InvestigaciónOperativa (JAIIO). (SADIO, Buenos Aires, Argentina, 2010), pp. 1575–1581

Baravalle et al. EURASIP Journal on Image and Video Processing (2015) 2015:9 Page 10 of 10
17. L Fei-Fei, R Fergus, P Perona, in Proceedings of theWorkshop onGenerative-Model Based Vision. Learning generative visual models fromfew training examples an incremental Bayesian approach tested on 101object categories (Washington, DC, 2004)
18. JM White, GD Rohrer, Image thresholding for optical characterrecognition and other applications requiring character image extraction.IBM J. Res. Dev. 27(4), 400–411 (1983)
19. L-K Huang, M-JJ Wang, Image thresholding by minimizing the measuresof fuzziness. Pattern Recognit. 28(1), 41–51 (1995)
20. T Kohonen, MR Schroeder, TS Huang, Self-Organizing Maps, 3rd edn.(Springer, Secaucus, NJ, USA, 2001)
21. L Breiman, Random forests. Mach. Learn. 45(1), 5–32 (2001)22. C-C Chang, C-J Lin, LIBSVM: A library for support vector machines.
Available at http://www.csie.ntu.edu.tw/~cjlin/libsvm (2001)23. RS Hunter, Photoelectric color difference meter. J. Opt. Soc. Am. 48(12),
985–993 (1958)24. RM Haralick, K Shanmugam, I Dinstein, Textural features for image
classification. Syst. Man Cybernet. IEEE Trans. SMC-3(6), 610–621 (1973)25. T Ojala, M Pietikainen, D Harwood, in Pattern Recognition, 1994. Vol. 1 -
Conference A: Computer, Vision & Image Processing., Proceedings of the 12thIAPR International Conference On. Performance evaluation of texturemeasures with classification based on Kullback discrimination ofdistributions, vol. 1 (IEEE Computer Society Press, Los Alamitos, Calif., USA,1994), pp. 582–585
26. DG Lowe, Distinctive image features from scale-invariant keypoints. Int. J.Comput. Vis. 60(2), 91–110 (2004)
Submit your manuscript to a journal and benefi t from:
7 Convenient online submission
7 Rigorous peer review
7 Immediate publication on acceptance
7 Open access: articles freely available online
7 High visibility within the fi eld
7 Retaining the copyright to your article
Submit your next manuscript at 7 springeropen.com
Copyright © 2022 FDOKUMEN