Association Analysis of Historical Bread Wheat Germplasm Using Additive Genetic Covariance of...
25
Copyright Ó 2007 by the Genetics Society of America DOI: 10.1534/genetics.107.078659 Association Analysis of Historical Bread Wheat Germplasm Using Additive Genetic Covariance of Relatives and Population Structure Jose ´ Crossa,* ,1 Juan Burguen ˜o,* Susanne Dreisigacker,* Mateo Vargas,* Sybil A. Herrera-Foessel,* Morten Lillemo, † Ravi P. Singh,* Richard Trethowan, ‡ Marilyn Warburton,* Jorge Franco, § Matthew Reynolds,* Jonathan H. Crouch* and Rodomiro Ortiz* *International Maize and Wheat Improvement Center (CIMMYT), 06600 Me ´xico, D.F., Mexico, † Department of Plant and Environmental Sciences, Norwegian University of Life Sciences, N-1432 A ˚ s, Norway, ‡ University of Sydney, Camden NSW 2570, Australia and § Facultad de Agronomı ´a, Universidad de la Repu ´ blica del Uruguay, CP 12900, Montevideo, Uruguay Manuscript received July 18, 2007 Accepted for publication September 9, 2007 ABSTRACT Linkage disequilibrium can be used for identifying associations between traits of interest and genetic markers. This study used mapped diversity array technology (DArT) markers to find associations with resistance to stem rust, leaf rust, yellow rust, and powdery mildew, plus grain yield in five historical wheat international multienvironment trials from the International Maize and Wheat Improvement Center (CIMMYT). Two linear mixed models were used to assess marker–trait associations incorporating information on population structure and covariance between relatives. An integrated map containing 813 DArT markers and 831 other markers was constructed. Several linkage disequilibrium clusters bearing multiple host plant resistance genes were found. Most of the associated markers were found in genomic regions where previous reports had found genes or quantitative trait loci (QTL) influencing the same traits, providing an independent validation of this approach. In addition, many new chromosome regions for disease resistance and grain yield were identified in the wheat genome. Phenotyping across up to 60 environments and years allowed modeling of genotype 3 environment interaction, thereby making possible the identification of markers contributing to both additive and additive 3 additive interaction effects of traits. A useful new tool for crop genetic improvement is the identification of polymorphic markers associ- ated with phenotypic variation for important traits by means of linkage disequilibrium (LD) between loci (Thornsberry et al. 2001; Flint-Garcia et al. 2003). A major advantage of this approach over conventional linkage mapping is that it does not require the time- consuming and expensive generation of specific genetic populations. LD is determined by the physical distance of the loci across chromosomes and has proven useful for dissecting complex traits because it offers fine-scale mapping due to the inclusion of historical recombina- tion (Lynch and Walsh 1998). However, false positive correlation between markers and traits can arise in the absence of physical proximity due to population struc- ture caused by admixture, mating system, and genetic drift or by artificial or natural selection during evolu- tion, domestication, or plant improvement ( Jannink and Walsh 2002). False associations can also be caused by alleles occurring at very low frequencies in the initial pop- ulation (Breseghello and Sorrells 2006a,b). These fac- tors create LD between loci that are not physically linked and cause a high rate of false positives when relating polymorphic markers to phenotypic trait variation. Thus, separating LD due to physical linkage from LD due to population structure is a critical prerequisite in associa- tion analyses. Population structure can be quantified using Bayesian analysis, which has been effective for assigning individ- uals to subpopulations (Q matrix) using unlinked markers (Pritchard et al. 2000). Other multivariate statistical analyses such as classification (clustering) and ordination (scaling) can also be used to account for population structure (Kraakman et al. 2004). Popula- tion structure in modern breeding populations can be caused by complex pedigrees derived from crosses of parents with different levels of relatedness. Relation- ships between individuals can be detected by means of (1) marker-based estimation of the probability of iden- tity by descent between individuals, (2) coefficient of parentage (COP) that measures the covariance between related individuals in a population (Parisseaux and Bernardo 2004), and (3) both types of analysis simul- taneously (Arbelbide and Bernardo 2006; Malosetti 1 Corresponding author: Biometrics and Statistics Unit, Crop Research Informatics Laboratory, CIMMYT, Apdo. Postal 6-641, 06600 Me ´xico, D.F., Mexico. E-mail: [email protected] Genetics 177: 1889–1913 (November 2007)
Transcript of Association Analysis of Historical Bread Wheat Germplasm Using Additive Genetic Covariance of...

Copyright � 2007 by the Genetics Society of AmericaDOI: 10.1534/genetics.107.078659
Association Analysis of Historical Bread Wheat Germplasm UsingAdditive Genetic Covariance of Relatives and Population Structure
Jose Crossa,*,1 Juan Burgueno,* Susanne Dreisigacker,* Mateo Vargas,*Sybil A. Herrera-Foessel,* Morten Lillemo,† Ravi P. Singh,* Richard Trethowan,‡
Marilyn Warburton,* Jorge Franco,§ Matthew Reynolds,*Jonathan H. Crouch* and Rodomiro Ortiz*
*International Maize and Wheat Improvement Center (CIMMYT), 06600 Mexico, D.F., Mexico, †Department of Plant andEnvironmental Sciences, Norwegian University of Life Sciences, N-1432 As, Norway, ‡University of Sydney,
Camden NSW 2570, Australia and §Facultad de Agronomıa, Universidad de la Republicadel Uruguay, CP 12900, Montevideo, Uruguay
Manuscript received July 18, 2007Accepted for publication September 9, 2007
ABSTRACT
Linkage disequilibrium can be used for identifying associations between traits of interest and geneticmarkers. This study used mapped diversity array technology (DArT) markers to find associations withresistance to stem rust, leaf rust, yellow rust, and powdery mildew, plus grain yield in five historical wheatinternational multienvironment trials from the International Maize and Wheat Improvement Center(CIMMYT). Two linear mixed models were used to assess marker–trait associations incorporatinginformation on population structure and covariance between relatives. An integrated map containing 813DArT markers and 831 other markers was constructed. Several linkage disequilibrium clusters bearingmultiple host plant resistance genes were found. Most of the associated markers were found in genomicregions where previous reports had found genes or quantitative trait loci (QTL) influencing the sametraits, providing an independent validation of this approach. In addition, many new chromosome regionsfor disease resistance and grain yield were identified in the wheat genome. Phenotyping across up to 60environments and years allowed modeling of genotype 3 environment interaction, thereby makingpossible the identification of markers contributing to both additive and additive 3 additive interactioneffects of traits.
A useful new tool for crop genetic improvement isthe identification of polymorphic markers associ-
ated with phenotypic variation for important traits bymeans of linkage disequilibrium (LD) between loci(Thornsberry et al. 2001; Flint-Garcia et al. 2003). Amajor advantage of this approach over conventionallinkage mapping is that it does not require the time-consuming and expensive generation of specific geneticpopulations. LD is determined by the physical distanceof the loci across chromosomes and has proven usefulfor dissecting complex traits because it offers fine-scalemapping due to the inclusion of historical recombina-tion (Lynch and Walsh 1998). However, false positivecorrelation between markers and traits can arise in theabsence of physical proximity due to population struc-ture caused by admixture, mating system, and geneticdrift or by artificial or natural selection during evolu-tion, domestication, or plant improvement ( Jannink andWalsh 2002). False associations can also be caused byalleles occurring at very low frequencies in the initial pop-
ulation(BreseghelloandSorrells2006a,b).Thesefac-tors create LD between loci that are not physically linkedand cause a high rate of false positives when relatingpolymorphic markers to phenotypic trait variation. Thus,separating LD due to physical linkage from LD due topopulation structure is a critical prerequisite in associa-tion analyses.
Population structure can be quantified using Bayesiananalysis, which has been effective for assigning individ-uals to subpopulations (Q matrix) using unlinkedmarkers (Pritchard et al. 2000). Other multivariatestatistical analyses such as classification (clustering) andordination (scaling) can also be used to account forpopulation structure (Kraakman et al. 2004). Popula-tion structure in modern breeding populations can becaused by complex pedigrees derived from crosses ofparents with different levels of relatedness. Relation-ships between individuals can be detected by means of(1) marker-based estimation of the probability of iden-tity by descent between individuals, (2) coefficient ofparentage (COP) that measures the covariance betweenrelated individuals in a population (Parisseaux andBernardo 2004), and (3) both types of analysis simul-taneously (Arbelbide and Bernardo 2006; Malosetti
1Corresponding author: Biometrics and Statistics Unit, Crop ResearchInformatics Laboratory, CIMMYT, Apdo. Postal 6-641, 06600 Mexico,D.F., Mexico. E-mail: [email protected]
Genetics 177: 1889–1913 (November 2007)
et al. 2007). Yu et al. (2006) incorporated the outcome ofpopulation structure (Q matrix), with the estimation ofrelatedness between individuals obtained through themarker-based kinship matrix (K), into a unified linearmixed-model approach. Yu et al. (2006) showed that thisapproach effectively decreases type I error rates (falsepositives) and increases the power of the marker–traitassociation tests.
Successful application of association analysis requirescomprehensive phenotypic data for modeling genotype3 environment interaction (GE). However, an advan-tage of association analysis is that it can be based onhistorical phenotypic data from breeding trials, which inthe case of the International Maize and Wheat Improve-ment Center (CIMMYT)’s wheat breeding programs isin plentiful supply. Linear mixed-model methodologyapplied to plant phenotypic data allows accurate pre-diction of genotypic performance using covariancestructures that consider genetic associations between rel-atives included in the experiment. Using linear mixed-model methodology, a genetic covariance matrix can beestimated, and best linear unbiased predictors (BLUPs)can be obtained. BLUPs for simultaneously modelingGE and incorporating information on additive geneticvariation have been previously suggested by Crossa et al.(2006) and Burgueno et al. (2007).
The CIMMYT wheat breeding program concentrateson producing stable high-yielding and widely adaptedadvanced breeding lines (Braun et al. 1996; Rajaram
et al. 1996). CIMMYT bread wheat (Triticum aestivum L.)germplasm is known to contain various photoperiodinsensitivity genes, dwarfing genes, and rust resistancegenes (Trethowan et al. 2007). Grain yield and re-sistance to diseases, particularly to the rusts, are primaryselection criteria, and the generation of closely linkedmolecular markers would speed up the breeding pro-gress. CIMMYT’s wheat breeding program annuallydistributes improved germplasm to a network of wheatresearch and breeding cooperators across the world whoevaluate this material in many different environmentsand agronomic conditions. Phenotypic data from thesetrials have been cataloged, analyzed, and made availableto the network. The data are used at CIMMYT to identifyparents for future crosses and to drive the strategicincorporation of new genetic variability into advancedlines that are consequently able to cope with the dynamicsof abiotic and biotic stresses.
In this study, we investigate the association of 242diversity array technology (DArT) markers with resis-tance to stem (black) rust (caused by Puccinia graminis f.sp.tritici), leaf (brown) rust (caused by P. triticina), yellow(stripe) rust (caused by P. striiformis), powdery mildew(caused by Blumeria graminis f.sp. tritici), and grain yieldin five historical CIMMYT elite spring wheat yield trials(ESWYT) conducted from 1979 to 2004 with data col-lected from up to 60 international environments. Twolinear mixed models were used to assess marker–trait
associations incorporating information on populationstructure and additive genetic covariance betweenrelatives.
MATERIALS AND METHODS
Association populations and phenotypic data: A total of 170wheat lines derived from five CIMMYT elite spring wheat yieldtrials (ESWYT 1, ESWYT 6, ESWYT 10, ESWYT 20, and ESWYT24) from 1979, 1984, 1988, 1999, and 2004, respectively, wereincluded in this study. The data in each ESWYT were usuallybalanced, although for some traits data were recorded onlyfrom one replicate in some locations. There were no lines incommon among the ESWYTs selected for this study, except forGenaro T81, which was included in ESWYTs 1 and 6. Depend-ing on the trait and the specific ESWYT, the number of sitesused for the various statistical analyses ranged from 6 to 60.Five traits were considered in this study: response to stem rust(SR) (percentage of infection), leaf rust (LR) (percentage ofinfection), yellow rust (YR) (percentage of infection), andpowdery mildew (PM) (scored on a scale of 1–9) and grainyield (GY in tons per hectare). Association analyses were firstperformed for each of the five ESWYTs individually, and thenthe five ESWYTs were grouped into two sets related by year.ESWYTs 1, 6, and 10, which included 76 lines, formed ESWYTset 1, and ESWYTs 20 and 24, with 94 lines, formed ESWYT set2. Unadjusted means of the five traits for each of the 170 wheatlines, their selection identifiers (SID), cross identifier (CID),line names, and ESWYT number are given in the additionalinformation in supplemental Table S1 at http://www.genetics.org/supplemental/.
Depending on the trait and set, different sites, countries,and site–country combinations were used for the analyses. Allfive traits were recorded in all five ESWYTs in at least six sites,except SR, which was recorded only in sites of ESWYTs 1, 6,and 24.
DArT assay and map construction: DArT markers weregenerated by Triticarte Pty. Ltd. (Canberra, Australia; http://www.triticarte.com.au), a whole-genome profiling service lab-oratory, as described by Akbari et al. (2006). The locusdesignations used by Triticarte Pty. Ltd. were adopted in thisarticle, and DArT markers were named using the prefix ‘‘wPt,’’followed by a unique numerical identifier. An integrated mapof the DArT markers was developed using previous reportedmaps from diverse segregating populations, including: (1)Cranbrook 3 Halberd, 339 DArT (Akbari et al. 2006); (2)Arina 3 NK93604, 189 DArT (Semagn et al. 2006); (3) Avocet3 Saar, 112 DArT (M. Lillemo, unpublished data); and (4)selected linkage groups of markers from nine different popu-lations published by Triticarte Pty. Ltd. (http://www.triticarte.com.au). The integrated map was constructed with the soft-ware package CMTV (Sawkins et al. 2004); it included a totalof 1644 markers, 813 of which were DArT markers and 831 ofwhich were markers based on simple sequence repeats (SSRs),amplified fragment length polymorphisms (AFLPs), or restric-tion fragment length polymorphisms (RFLPs). Of a total of813 DArT markers, 318 were polymorphic in the lines in-cluded in this study, and 242 of these were located on the finalintegrated map. A total of 76 polymorphic DArT markerscould not be integrated into the final map (these are hereafterreferred to as unmapped markers).
Population structure: Possible population substructuringwas investigated using the program STRUCTURE (Pritchard
et al. 2000), on the basis of a set of 45 unlinked mapped DArTmarkers distributed evenly across the genome. Models with aputative number of subpopulations (K) from 1 to 20 withoutadmixture and with noncorrelated allele frequencies were
1890 J. Crossa et al.
considered for each ESWYT. For the two ESWYT sets, K was setbetween 1 and 30. Lines within a subpopulation were assumedto be in Hardy–Weinberg equilibrium, as well as in linkageequilibrium (LE). In addition, the neighbor-joining clusteringalgorithm was run on the 170 lines (within ESWYTs and withincombined ESWYTsets), using the Jaccard similarity coefficientas a proximity matrix with all 318 polymorphic DArT markersand the software DARWIN (Perrier et al. 2003). This step wasundertaken to confirm the results of the population structureobtained from STRUCTURE.
Linkage disequilibrium: Estimating LD between markersmeasures whether markers segregate independently or not.The program TASSEL (http://www.maizegenetics.net) wasused to estimate the LD parameter r2 among loci, and thecomparisonwise significance was computed with 1000 permu-tations. The r2 parameter was estimated for unlinked loci andfor loci on the same chromosome. The latter was plotted foreach ESWYT against genetic distance measured in centimor-gans. A critical value for r2, as evidence of linkage, was derivedusing the 95% percentile of unlinked loci according toBreseghello and Sorrells (2006a). If, within a chromosomeregion, all pairs of adjacent loci were in LD, this region wasreferred to as an LD block (LDb).
The COP matrix: The COP between individuals i and i9 isthe probability that an allele from a randomly selected locus inindividual i is identical by descent with an allele randomlyselected from the same locus in individual i9 (Cockerham
1971). The genetic covariance between relatives due to theiradditive genetic effects is equal to two times the coefficient ofparentage (Kempthorne 1969) (COP¼ fii9) times the additivegenetic variance; i.e., 2fii9s
2a ¼ As2
a ; where A is the additiverelationship matrix and s2
a is the additive genetic variance. Inthe case of self-pollinating species with successive generationsof inbreeding, COP between sister lines decreases with in-creasing numbers of generations following the split from thecommon ancestor. The Browse application of the InternationalCrop Information System (ICIS), as described in http://cropwiki.irri.org/icis/index.php/TDM_GMS_Browse (McLaren et al.2005), was used for deriving the relationship matrix; this appli-cation accounts for selection as well as inbreeding and improvesthe accuracy of breeding value estimation. The different ESWYTshad different numbers of sister line groups (ranging from 2 to 5).Matrix fii9 was computed for the 76 lines included in ESWYTset 1and for the 96 lines of ESWYT set 2.
Linear mixed models used for association analyses: Thelinear mixed model (LMM) was used to control the broad levelof population structure inferred from Pritchard’s STRUC-TURE using the Q matrix and the level of relatedness betweenwheat lines using the relationship A matrix. Two kinds of linearmixed models (LMM1 and LMM2) were used to fit data from glines, s sites, and r replicates (at each site) for modelingassociation of phenotypic traits with m markers. LMM1 issimilar to some of the models proposed by Smith et al. (2002)for modeling GE and by Crossa et al. (2006) and Burgueno
et al. (2007) for modeling GE with matrix A. In LMM2, markersare included as covariates for modeling the fixed effects ofmarker 3 environment interaction in a manner similar to thepartition proposed in the factorial regression model (van
Eeuwijk et al. 1996).Linear mixed model 1 with covariance between relatives for
modeling line and line 3 environment interaction: Linear mixedmodel 1 (LMM1), which uses the relationship of the linesmeasured by the g 3 g A matrix for modeling GE, is
Y ¼ XSb 1 ZRr 1 ZGg 1 e; ð1Þ
where XS is the design matrix relating Y to the fixed effects ofsites (b), and ZR and ZG are the design matrices relating Y to
the random effects of replicates within sites (r) and lineswithin sites (g), respectively. Vectors r, g, and e are assumed tobe normally distributed, with zero mean vectors and variance–covariance (VCV) matrices R, G, and E, respectively. The VCVmatrix G, which combines the main effect of lines and GE, canbe represented as G ¼ Sg5A, where 5 is the Kroneckerproduct operator, and the jth diagonal element of the s 3 smatrix Sg is the additive genetic variance s2
ajwithin the jth site,
and the jjth element is the additive genetic covariancerjj9saj
saj9between sites j and j9; thus, rij9 is the correlation of
additive genetic effects between sites j and j9. The VCV matrixG was modeled using the factor analytical model (Smith et al.2002; Crossa et al. 2006; Burgueno et al. 2007).
For each DArT marker, BLUPs of the lines obtained wereused for contrasts of the predictable function of no differencebetween BLUPs with the mth DArT marker ¼ 1 and BLUPs oflines with the mth DArT marker ¼ 0. This was done using theVCV matrix of the BLUPs of lines obtained from LMM1. Thecontrasts between BLUPs were calculated by weighting eachline with its probability of membership of each subpopulationobtained from matrix Q. The contrasts were performed foreach marker at each subpopulation, as well as for each markerover all subpopulations.
A variant of LMM1 was proposed by Burgueno et al. (2007)for partitioning the total genetic effect (g) of a line intoadditive (a) and additive 3 additive (i) effects, as in Oakey
et al. (2006). The covariance between individuals due toadditive 3 additive effects in matrix notation is (A # A) ¼ A(where # is the elementwise multiplication operator). Thismodel (with the partition of g into a and i) was used only for GYin each individual ESWYT and in ESWYT set 2. Thus, resultsfrom these trials were presented in terms of GY, GYA, andGYAA, which refer to the total genetic effect, the additiveeffects, and the additive 3 additive effects, respectively. Highlyunbalanced data for other traits in ESWYT set 1 preventedfitting LMM1 with g ¼ a 1 i.
Linear mixed model 2 with covariance between relatives formodeling the polygenic effects of lines and including marker 3environment interaction as fixed effects: The best linear unbiasedestimates (BLUEs) obtained from the individual-site analysisand their weights were used in the second-stage across-siteanalysis to calculate the BLUPs of the lines. The weights for theith genotype in the jth location, wij, were computed assuggested by Cullis et al. (1996), wij ¼ rij�s
2::=s 2
:j ; where rij isthe number of replicates for the ith genotype in the jthenvironment, s 2
:j is the estimated error variance for the jthenvironment, and �s2
:: is the pool error variance. The second-stage across-site analysis uses linear mixed model 2 (LMM2)with random sites (s), random polygenic effects of lines (g),and fixed covariables from matrix Q of population structureand partitions the GE into marker 3 environment interactionsas fixed covariable effects
Y ¼ XQq 1 ZSb 1 ZGg 1X
m
XMEm mem 1 e; ð2Þ
where XQ is the design matrix of the fixed effects ofpopulation structure (covariate) (q); ZS and ZG are the designmatrices of the random effect of sites (s) and lines (g), andXME is the design matrix for the fixed effect of the marker 3site interaction (me) for each of the m markers. The designmatrix XME contains the allelic values of the markers, which forDArT markers are 0 and 1 (or�1 and 1). Vector g is assumed tobe normally distributed with zero mean and VCV matrix As2
a;vectors of random effects of sites (b) and residual error (e) areassumed to have a simple VCV.
Predictable functions of the contrast of the BLUPs oflines: For the case of association analysis, for a given marker m,
Association Analysis of Historical Wheat 1891
the null hypothesis of no difference between BLUPs of thelines with the mth DArT marker ¼ 1 and BLUPs of the lineswith the mth DArT marker ¼ 0 was tested using a generalizedt-statistic. The Wald z-statistics were also used for a simplecontrast or Wald F-statistics for multiple contrasts. Asymptot-ically, the Wald statistics follow a chi-squared distribution.
Controlling the rate of false positives and the falsediscovery rate: Critical P-values for assessing the significanceof the null hypothesis were calculated using the Bonferronigenomewise error rate protection against rejecting a true nullhypothesis (lower type I error rate). The testwise significancelevel was divided by the number of tests (markers). The controlof the false discovery rate (FDR) for the test of each marker(Benjamini and Hochberg 1995) was used as an independentalternative method.
RESULTS
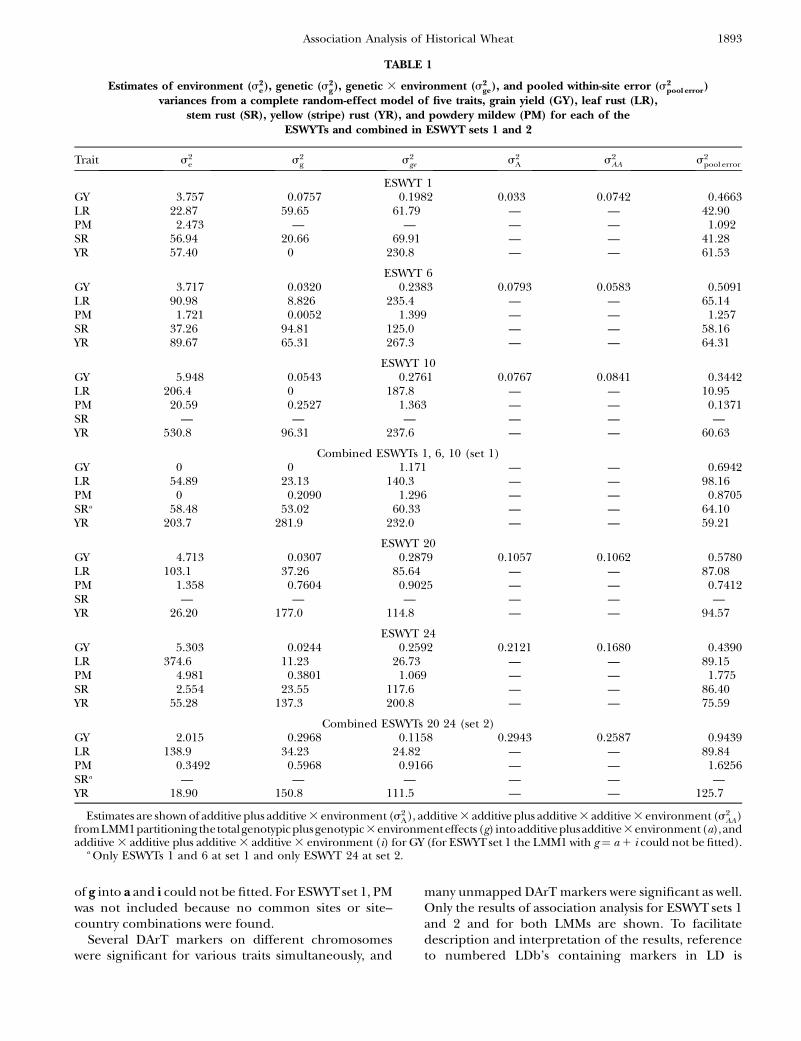
Variance component estimates are given in Table 1for five traits in each individual ESWYT and in ESWYTsets 1 and 2. Site variability was important, but genetic aswell as GE components were also of considerable size.The additive and additive 3 additive components andtheir interaction with sites for GY in ESWYTs 20 and 24,as well as in ESWYT set 2, were greater than those inESWYTs 1, 6, and 10, probably due to the larger numberof sites included in ESWYT set 2.
Linkage disequilibrium: LD analyses were performedfor each ESWYT individually, for ESWYT sets 1 and 2,and for both sets combined. The LD patterns weredistinct for each individual ESWYT; however, for ESWYTset 1, ESWYT set 2, and the combined sets, the LDpatterns were very similar. As LD breakdown depends onthe number and relatedness of the lines under study,this result was not unexpected. The percentage ofphysically linked loci pairs located in significant LDblocks was 26.2% in ESWYT set 1 (r2 . 0.124, P , 0.01),25.3% in ESWYT set 2 (r2 . 0.182, P , 0.01), and 27.6%in both sets combined (r2 . 0.115, P , 0.01). Pairwise r2
estimates were on average 0.169, 0.196, and 0.169 forESWYT set 1, ESWYT set 2, and both sets combined,respectively. The percentages of unlinked pairs of locithat were in significant LD were 4.9% in ESWYT set 1,5.0% in ESWYT set 2, and 5.0% in both sets combined.The estimated averages of r2 for unlinked loci were 0.03in ESWYT set 1, 0.05 in ESWYT set 2, and 0.03 in bothsets combined.
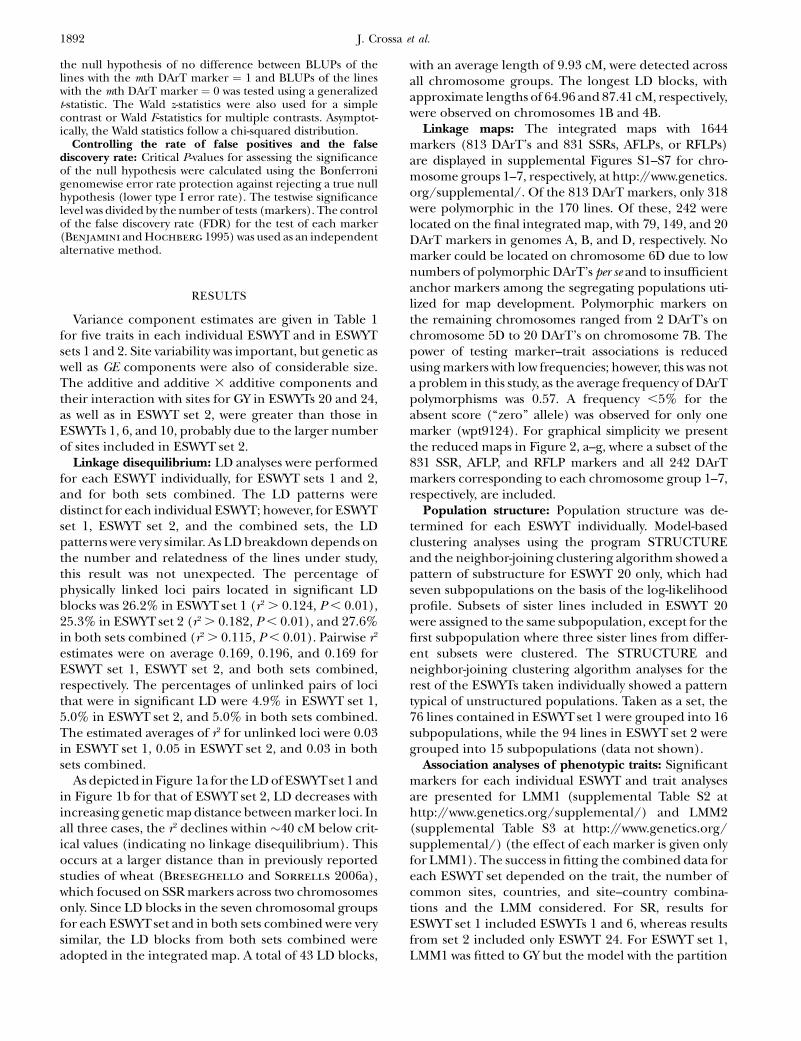
As depicted in Figure 1a for the LD of ESWYTset 1 andin Figure 1b for that of ESWYT set 2, LD decreases withincreasing genetic map distance between marker loci. Inall three cases, the r2 declines within �40 cM below crit-ical values (indicating no linkage disequilibrium). Thisoccurs at a larger distance than in previously reportedstudies of wheat (Breseghello and Sorrells 2006a),which focused on SSR markers across two chromosomesonly. Since LD blocks in the seven chromosomal groupsfor each ESWYTset and in both sets combined were verysimilar, the LD blocks from both sets combined wereadopted in the integrated map. A total of 43 LD blocks,
with an average length of 9.93 cM, were detected acrossall chromosome groups. The longest LD blocks, withapproximate lengths of 64.96 and 87.41 cM, respectively,were observed on chromosomes 1B and 4B.
Linkage maps: The integrated maps with 1644markers (813 DArT’s and 831 SSRs, AFLPs, or RFLPs)are displayed in supplemental Figures S1–S7 for chro-mosome groups 1–7, respectively, at http://www.genetics.org/supplemental/. Of the 813 DArT markers, only 318were polymorphic in the 170 lines. Of these, 242 werelocated on the final integrated map, with 79, 149, and 20DArT markers in genomes A, B, and D, respectively. Nomarker could be located on chromosome 6D due to lownumbers of polymorphic DArT’s per se and to insufficientanchor markers among the segregating populations uti-lized for map development. Polymorphic markers onthe remaining chromosomes ranged from 2 DArT’s onchromosome 5D to 20 DArT’s on chromosome 7B. Thepower of testing marker–trait associations is reducedusing markers with low frequencies; however, this was nota problem in this study, as the average frequency of DArTpolymorphisms was 0.57. A frequency ,5% for theabsent score (‘‘zero’’ allele) was observed for only onemarker (wpt9124). For graphical simplicity we presentthe reduced maps in Figure 2, a–g, where a subset of the831 SSR, AFLP, and RFLP markers and all 242 DArTmarkers corresponding to each chromosome group 1–7,respectively, are included.
Population structure: Population structure was de-termined for each ESWYT individually. Model-basedclustering analyses using the program STRUCTUREand the neighbor-joining clustering algorithm showed apattern of substructure for ESWYT 20 only, which hadseven subpopulations on the basis of the log-likelihoodprofile. Subsets of sister lines included in ESWYT 20were assigned to the same subpopulation, except for thefirst subpopulation where three sister lines from differ-ent subsets were clustered. The STRUCTURE andneighbor-joining clustering algorithm analyses for therest of the ESWYTs taken individually showed a patterntypical of unstructured populations. Taken as a set, the76 lines contained in ESWYT set 1 were grouped into 16subpopulations, while the 94 lines in ESWYT set 2 weregrouped into 15 subpopulations (data not shown).
Association analyses of phenotypic traits: Significantmarkers for each individual ESWYT and trait analysesare presented for LMM1 (supplemental Table S2 athttp://www.genetics.org/supplemental/) and LMM2(supplemental Table S3 at http://www.genetics.org/supplemental/) (the effect of each marker is given onlyfor LMM1). The success in fitting the combined data foreach ESWYT set depended on the trait, the number ofcommon sites, countries, and site–country combina-tions and the LMM considered. For SR, results forESWYT set 1 included ESWYTs 1 and 6, whereas resultsfrom set 2 included only ESWYT 24. For ESWYT set 1,LMM1 was fitted to GY but the model with the partition
1892 J. Crossa et al.
of g into a and i could not be fitted. For ESWYTset 1, PMwas not included because no common sites or site–country combinations were found.
Several DArT markers on different chromosomeswere significant for various traits simultaneously, and
many unmapped DArT markers were significant as well.Only the results of association analysis for ESWYT sets 1and 2 and for both LMMs are shown. To facilitatedescription and interpretation of the results, referenceto numbered LDb’s containing markers in LD is
TABLE 1
Estimates of environment (s2e), genetic (s2
g), genetic 3 environment (s2ge), and pooled within-site error (s2
pool error)variances from a complete random-effect model of five traits, grain yield (GY), leaf rust (LR),
stem rust (SR), yellow (stripe) rust (YR), and powdery mildew (PM) for each of theESWYTs and combined in ESWYT sets 1 and 2
Trait s2e s2
g s2ge s2
A s2AA s2
pool error
ESWYT 1GY 3.757 0.0757 0.1982 0.033 0.0742 0.4663LR 22.87 59.65 61.79 — — 42.90PM 2.473 — — — — 1.092SR 56.94 20.66 69.91 — — 41.28YR 57.40 0 230.8 — — 61.53
ESWYT 6GY 3.717 0.0320 0.2383 0.0793 0.0583 0.5091LR 90.98 8.826 235.4 — — 65.14PM 1.721 0.0052 1.399 — — 1.257SR 37.26 94.81 125.0 — — 58.16YR 89.67 65.31 267.3 — — 64.31
ESWYT 10GY 5.948 0.0543 0.2761 0.0767 0.0841 0.3442LR 206.4 0 187.8 — — 10.95PM 20.59 0.2527 1.363 — — 0.1371SR — — — — — —YR 530.8 96.31 237.6 — — 60.63
Combined ESWYTs 1, 6, 10 (set 1)GY 0 0 1.171 — — 0.6942LR 54.89 23.13 140.3 — — 98.16PM 0 0.2090 1.296 — — 0.8705SRa 58.48 53.02 60.33 — — 64.10YR 203.7 281.9 232.0 — — 59.21
ESWYT 20GY 4.713 0.0307 0.2879 0.1057 0.1062 0.5780LR 103.1 37.26 85.64 — — 87.08PM 1.358 0.7604 0.9025 — — 0.7412SR — — — — — —YR 26.20 177.0 114.8 — — 94.57
ESWYT 24GY 5.303 0.0244 0.2592 0.2121 0.1680 0.4390LR 374.6 11.23 26.73 — — 89.15PM 4.981 0.3801 1.069 — — 1.775SR 2.554 23.55 117.6 — — 86.40YR 55.28 137.3 200.8 — — 75.59
Combined ESWYTs 20 24 (set 2)GY 2.015 0.2968 0.1158 0.2943 0.2587 0.9439LR 138.9 34.23 24.82 — — 89.84PM 0.3492 0.5968 0.9166 — — 1.6256SRa — — — — — —YR 18.90 150.8 111.5 — — 125.7
Estimates are shown of additive plus additive 3 environment (s2A), additive 3 additive plus additive 3 additive 3 environment (s2
AA)fromLMM1partitioningthetotalgenotypicplusgenotypic3environmenteffects(g) intoadditiveplusadditive3environment(a),andadditive 3 additive plus additive 3 additive 3 environment (i) for GY (for ESWYTset 1 the LMM1 with g¼ a 1 i could not be fitted).
a Only ESWYTs 1 and 6 at set 1 and only ESWYT 24 at set 2.
Association Analysis of Historical Wheat 1893

frequently made. The LDb’s are highlighted in Figure 2,a–g.
Significant DArT markers for traits: The mappedand unmapped DArT markers significantly associatedwith LR, SR, PM, YR, and GY (including GYA and GYAA)for ESWYT sets 1 and 2 and for LMM1 and LMM2 aresummarized in Tables 2–6. In addition, we present themost recently published information on the chromosomallocations of genes and quantitative trait loci (QTL) forLR, SR, PM, and YR resistance and for GY, includinggenes for photoperiod insensitivity (Ppd), vernalization(Vrn), earliness per se (Eps), and dwarfism (Rht). Tables2–6 summarize the information depicted in Figure 2, a–g. Significant DArT markers for YR and GY are widelyspread across all chromosomes, with a total of 122 and213 significantly associated DArT markers, respectively,vs. 87, 63, and 61 significant DArT markers for LR, SR,and PM, respectively. Chromosome groups 4 and 5 hadthe lowest number of significant DArT markers acrossall traits (47 and 35, respectively), whereas chromosomegroups 1, 2, 3, 6, and 7 had a total of 132, 64, 99, 85, and
83 significant DArT markers, respectively. A comparisonamong the A, B, and D genomes is of less interest due tothe drastically different numbers of DArT markers thatwere polymorphic within each genome.
DISCUSSION
Association analysis for response to LR: More than50 LR resistance genes have been cataloged in breadwheat; some of them have been reported or are knownto be present in CIMMYT germplasm, including Lr1, -3,-3bg, -10, -13, -14a, -16, -17a, -19, -21, -23, -24, -26, -34, -42,and -46 and the complementary genes Lr27 and Lr31(Singh and Mcintosh 1984; Singh and Gupta 1991;Singh and Rajaram 1991; Sayre et al. 1998; Singh et al.2005) (Table 2). Other known LR genes not known tobe present in any of the lines included in this study arelisted in Table 2. An objective of the CIMMYT wheatbreeding program is to incorporate slow rusting re-sistance to LR and YR into breeding lines to assure long-term control of these diseases (Rajaram et al. 1988;Singh et al. 2005). Slow rusting resistance is conferredby Lr34, Lr46, and other genes with minor additiveeffects (Singh et al. 2005). Several studies have identi-fied QTL associated with slow rusting resistance onother chromosomes (such as 7BL) (Table 2).
In this study, many of the DArT markers significantlyassociated with LR were in the same chromosomeregions as previously reported LR resistance genes orpreviously reported QTL (Table 2). There were alsoregions accounting for LR resistance variation in whichthere were no previously known genes or QTL, such as1AL, 1DL (Figure 2a), 5AS, 5DS (Figure 2e), 6AS, and6AL (Figure 2f) (Table 2). Chromosome 1B had thelargest number of significant markers for LR; some ofthem may be associated with the reported QTL andgenes Lr26 and Lr46. The 1B.1R translocation includesLr26, YR resistance gene Yr9, SR resistance gene Sr31,and PM resistance gene Pm8; it has also shown an effecton GY (and its components) in several spring wheatcultivars (i.e., Seri M82, Genaro T81, Ures T81, andVeery-related lines) included in this study (Villareal
et al. 1991; Singh et al. 1998). Gene Lr46 ½pleiotropic orclosely linked to Yr29 (William et al. 2003) andassociated with PM (Lillemo et al. 2007)� is present incultivar Pavon 76 (included in this study) and associatedwith SSR markers gwm259, wmc44, wmc367, and barc80on 1BL (William et al. 2006). SSR gwm259 is not farfrom DArT markers wPt0944, wPt2526, and wPt4129(Figure 2a), which are significant for LR.
Other significant associations include the one be-tween DArT wPt0100 and LR, which appears to relate toLr16 (Table 2) within the LDb2 of 2BS. This Lr gene hasbeen reported to be linked to wmc661 (McCartney
et al. 2005a) and is 1.1 cM from wPt0100 (Figure 2b).Four DArT markers were significantly associated withLR in 7BL (Figure 2g, Table 2) and could be detecting
Figure 1.—Linkage disequilibrium (LD) (r2) as a functionof map distance of 318 DArT markers in ESWYT set 1 (a) andESWYT set 2 (b). Horizontal lines represent the critical valuefor LD significance.
1894 J. Crossa et al.
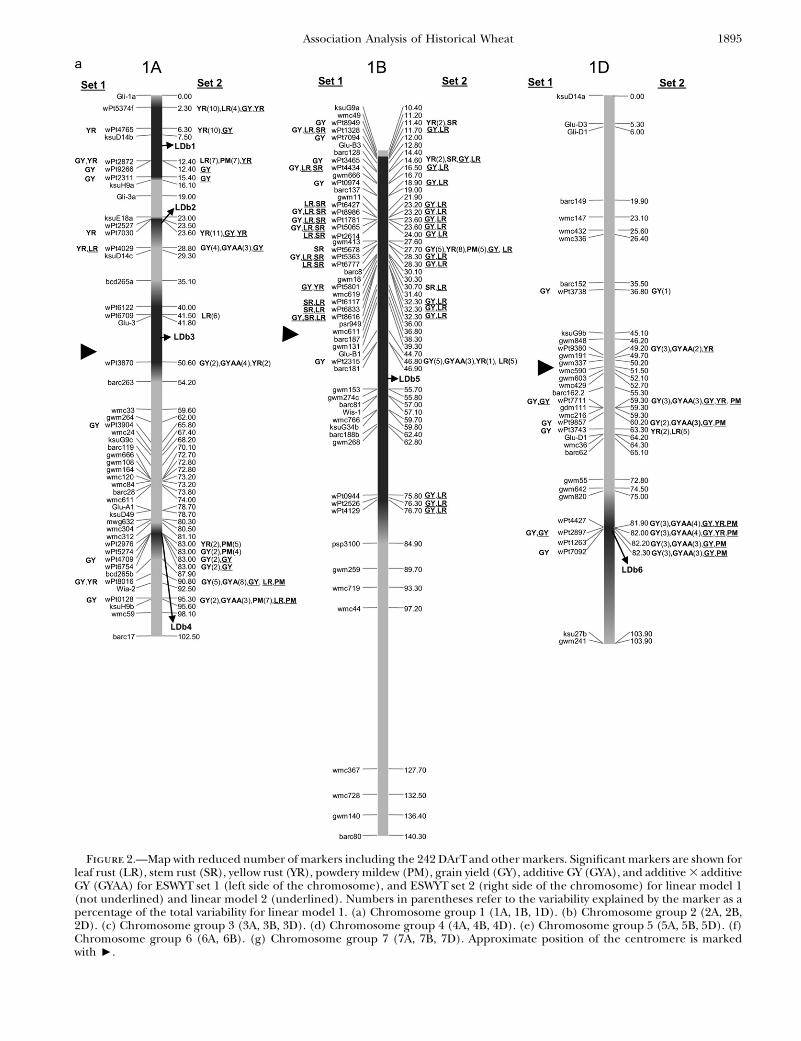
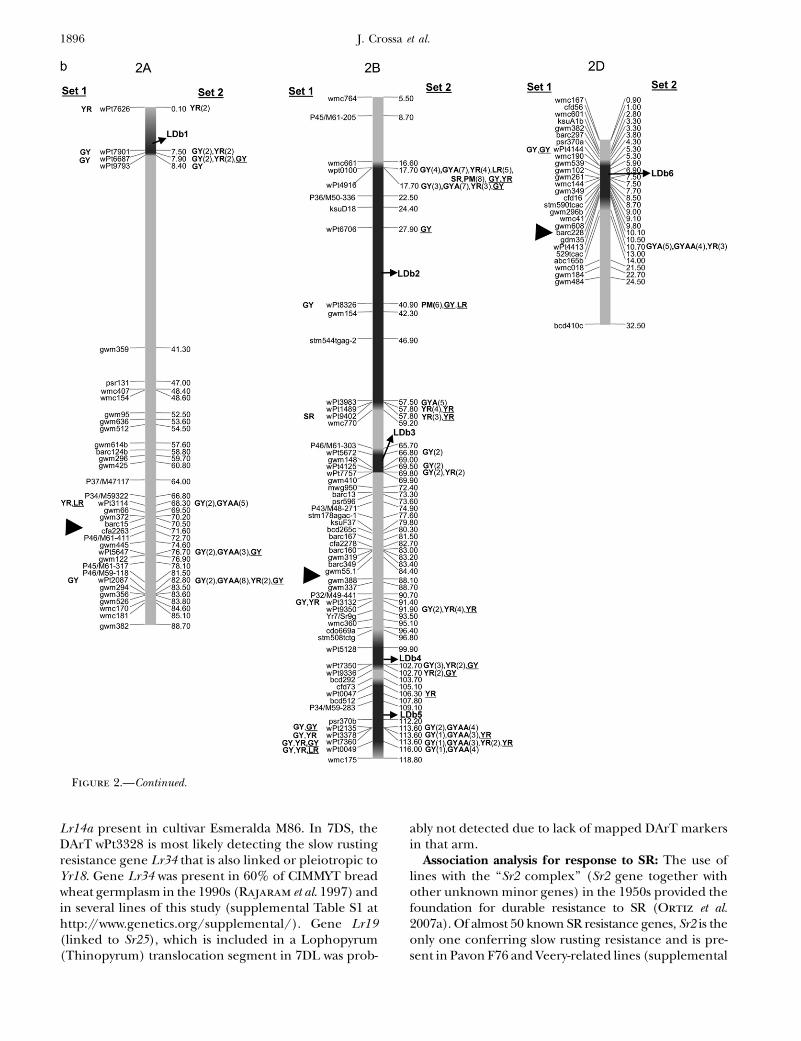
Figure 2.—Map with reduced number of markers including the 242 DArTand other markers. Significant markers are shown forleaf rust (LR), stem rust (SR), yellow rust (YR), powdery mildew (PM), grain yield (GY), additive GY (GYA), and additive 3 additiveGY (GYAA) for ESWYT set 1 (left side of the chromosome), and ESWYT set 2 (right side of the chromosome) for linear model 1(not underlined) and linear model 2 (underlined). Numbers in parentheses refer to the variability explained by the marker as apercentage of the total variability for linear model 1. (a) Chromosome group 1 (1A, 1B, 1D). (b) Chromosome group 2 (2A, 2B,2D). (c) Chromosome group 3 (3A, 3B, 3D). (d) Chromosome group 4 (4A, 4B, 4D). (e) Chromosome group 5 (5A, 5B, 5D). (f)Chromosome group 6 (6A, 6B). (g) Chromosome group 7 (7A, 7B, 7D). Approximate position of the centromere is markedwith <.
Association Analysis of Historical Wheat 1895
Lr14a present in cultivar Esmeralda M86. In 7DS, theDArT wPt3328 is most likely detecting the slow rustingresistance gene Lr34 that is also linked or pleiotropic toYr18. Gene Lr34 was present in 60% of CIMMYT breadwheat germplasm in the 1990s (Rajaram et al. 1997) andin several lines of this study (supplemental Table S1 athttp://www.genetics.org/supplemental/). Gene Lr19(linked to Sr25), which is included in a Lophopyrum(Thinopyrum) translocation segment in 7DL was prob-
ably not detected due to lack of mapped DArT markersin that arm.
Association analysis for response to SR: The use oflines with the ‘‘Sr2 complex’’ (Sr2 gene together withother unknown minor genes) in the 1950s provided thefoundation for durable resistance to SR (Ortiz et al.2007a). Of almost 50 known SR resistance genes, Sr2 is theonly one conferring slow rusting resistance and is pre-sent in Pavon F76 and Veery-related lines (supplemental
Figure 2.—Continued.
1896 J. Crossa et al.
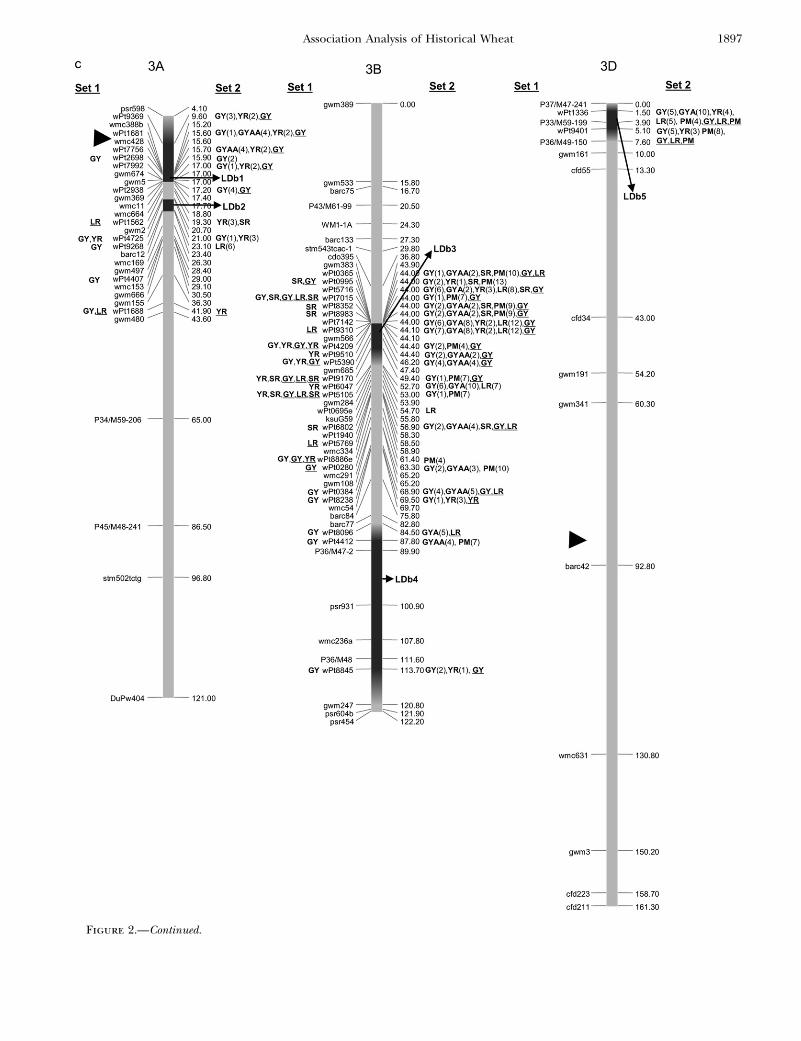
Figure 2.—Continued.
Association Analysis of Historical Wheat 1897

Figure 2.—Continued.
1898 J. Crossa et al.
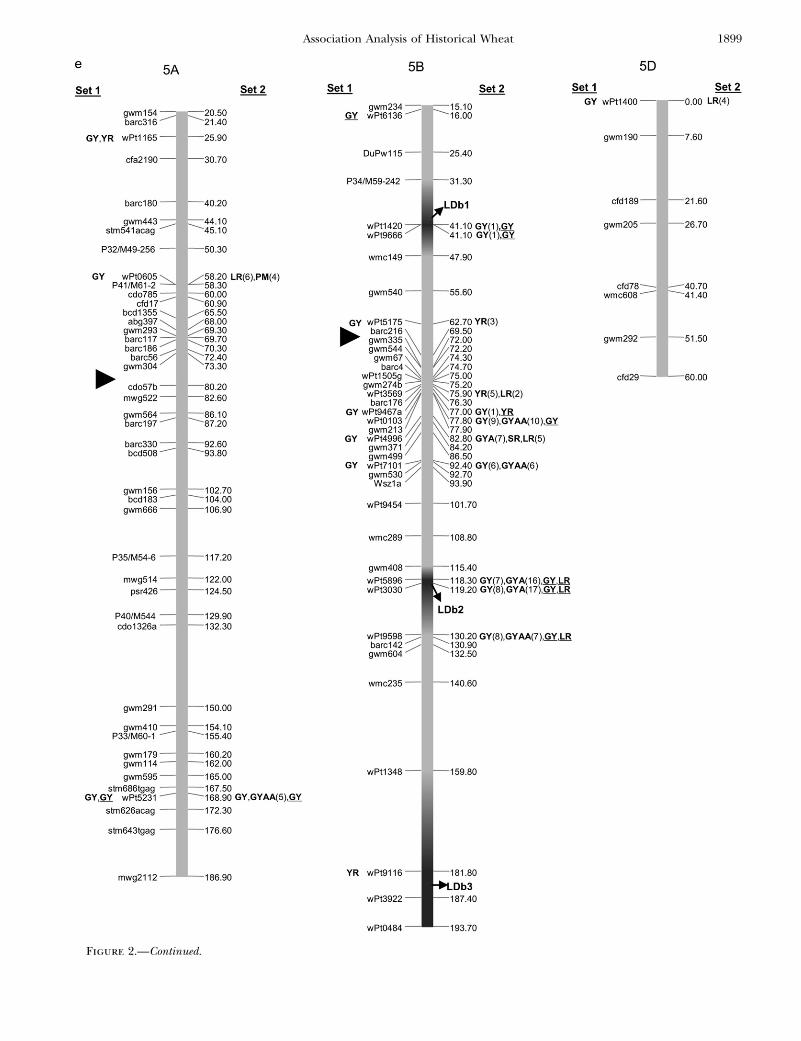
Figure 2.—Continued.
Association Analysis of Historical Wheat 1899
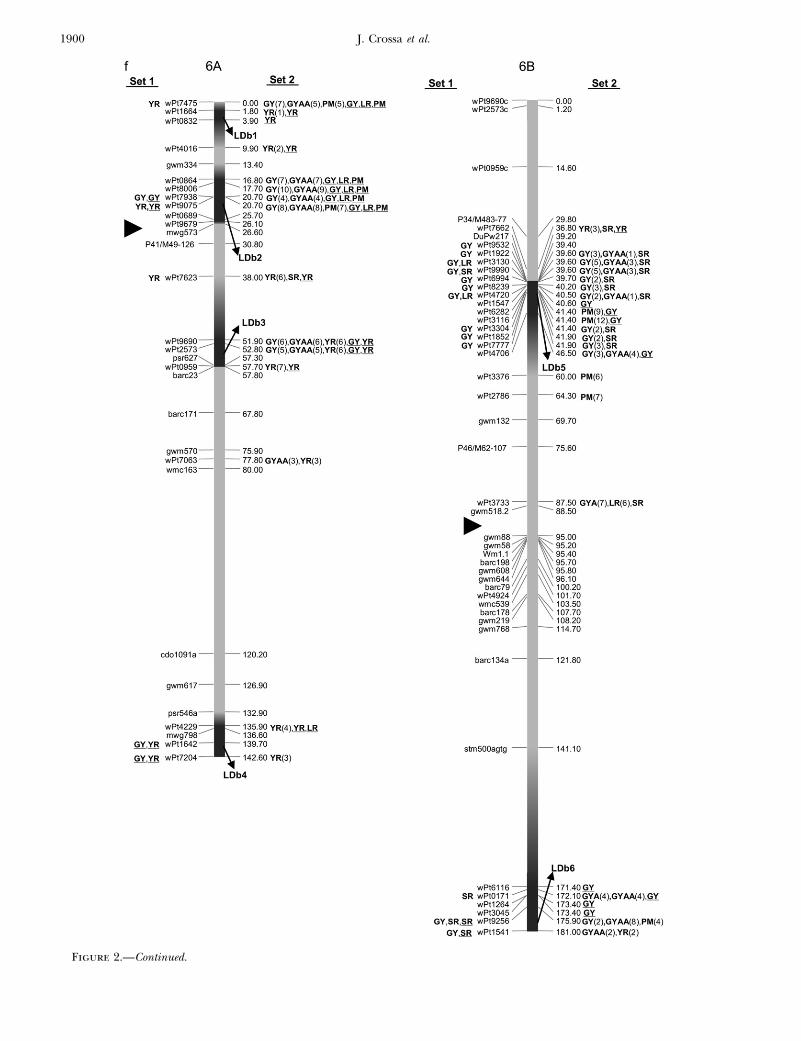
Figure 2.—Continued.
1900 J. Crossa et al.
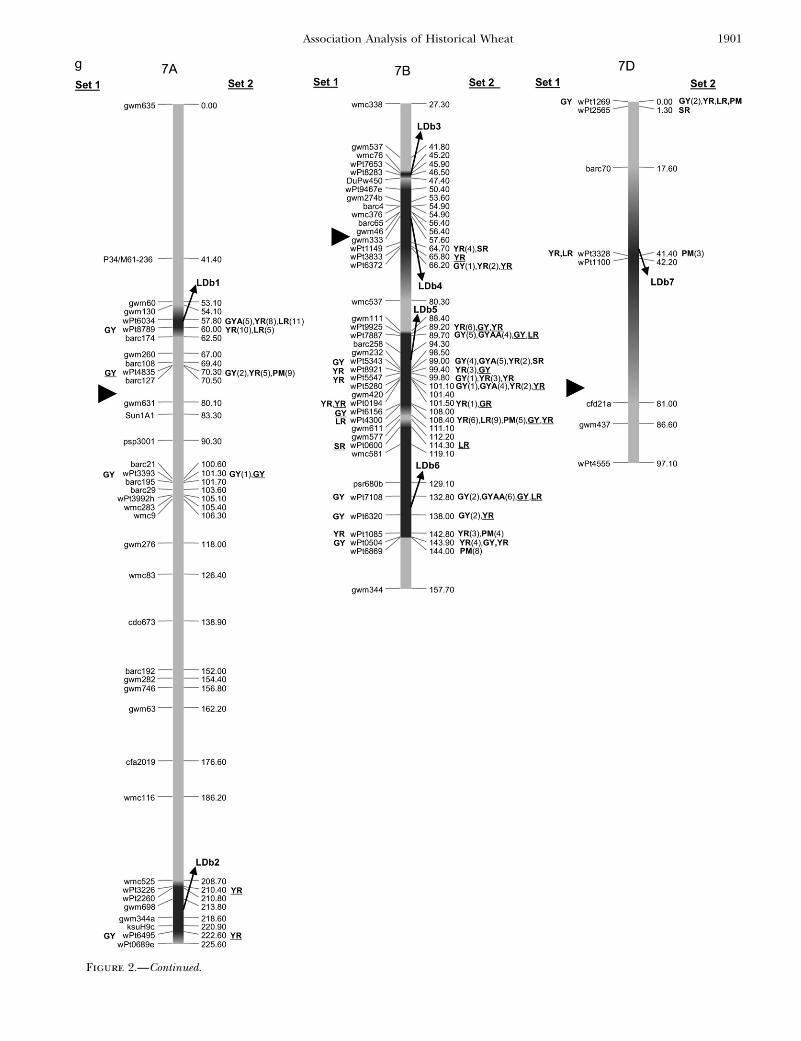
Figure 2.—Continued.
Association Analysis of Historical Wheat 1901
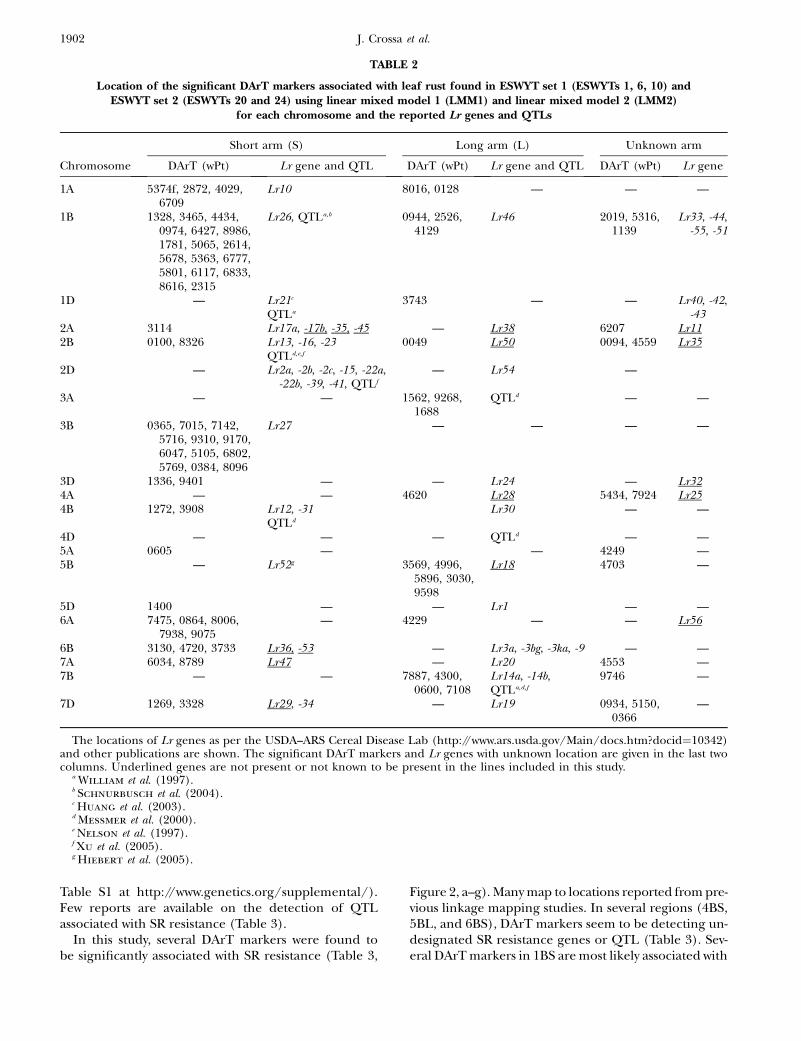
Table S1 at http://www.genetics.org/supplemental/).Few reports are available on the detection of QTLassociated with SR resistance (Table 3).
In this study, several DArT markers were found tobe significantly associated with SR resistance (Table 3,
Figure 2, a–g). Many map to locations reported from pre-vious linkage mapping studies. In several regions (4BS,5BL, and 6BS), DArT markers seem to be detecting un-designated SR resistance genes or QTL (Table 3). Sev-eral DArT markers in 1BS are most likely associated with
TABLE 2
Location of the significant DArT markers associated with leaf rust found in ESWYT set 1 (ESWYTs 1, 6, 10) andESWYT set 2 (ESWYTs 20 and 24) using linear mixed model 1 (LMM1) and linear mixed model 2 (LMM2)
for each chromosome and the reported Lr genes and QTLs
Short arm (S) Long arm (L) Unknown arm
Chromosome DArT (wPt) Lr gene and QTL DArT (wPt) Lr gene and QTL DArT (wPt) Lr gene
1A 5374f, 2872, 4029,6709
Lr10 8016, 0128 — — —
1B 1328, 3465, 4434,0974, 6427, 8986,1781, 5065, 2614,5678, 5363, 6777,5801, 6117, 6833,8616, 2315
Lr26, QTLa,b 0944, 2526,4129
Lr46 2019, 5316,1139
Lr33, -44,-55, -51
1D — Lr21c
QTLa
3743 — — Lr40, -42,-43
2A 3114 Lr17a, -17b, -35, -45 — Lr38 6207 Lr112B 0100, 8326 Lr13, -16, -23
QTLd,e,f
0049 Lr50 0094, 4559 Lr35
2D — Lr2a, -2b, -2c, -15, -22a,-22b, -39, -41, QTLf
— Lr54 —
3A — — 1562, 9268,1688
QTLd — —
3B 0365, 7015, 7142,5716, 9310, 9170,6047, 5105, 6802,5769, 0384, 8096
Lr27 — — — —
3D 1336, 9401 — — Lr24 — Lr324A — — 4620 Lr28 5434, 7924 Lr254B 1272, 3908 Lr12, -31
QTLd
Lr30 — —
4D — — — QTLd — —5A 0605 — — 4249 —5B — Lr52g 3569, 4996,
5896, 3030,9598
Lr18 4703 —
5D 1400 — — Lr1 — —6A 7475, 0864, 8006,
7938, 9075— 4229 — — Lr56
6B 3130, 4720, 3733 Lr36, -53 — Lr3a, -3bg, -3ka, -9 — —7A 6034, 8789 Lr47 — Lr20 4553 —7B — — 7887, 4300,
0600, 7108Lr14a, -14b,QTLa,d,f
9746 —
7D 1269, 3328 Lr29, -34 — Lr19 0934, 5150,0366
—
The locations of Lr genes as per the USDA–ARS Cereal Disease Lab (http://www.ars.usda.gov/Main/docs.htm?docid¼10342)and other publications are shown. The significant DArT markers and Lr genes with unknown location are given in the last twocolumns. Underlined genes are not present or not known to be present in the lines included in this study.
a William et al. (1997).b Schnurbusch et al. (2004).c Huang et al. (2003).d Messmer et al. (2000).e Nelson et al. (1997).f Xu et al. (2005).g Hiebert et al. (2005).
1902 J. Crossa et al.

the presence of Sr31 of the 1B.1R translocation, which ispresent in the Veery-related lines included in this study.In 2BS, wPt0100 was found to be associated with SR, GY,LR, and YR in ESWYT set 2, which agrees with thelocation of Sr23 and is tightly linked to Lr16. Severalsignificant associations for SR were found on chromo-some 3BS, where Sr12 and Sr2 are located. Sr2, linked toLr27, is associated with SSR markers gwm389 andgwm533 (Spielmeyer et al. 2003) and distally located onthe short arm where no DArT markers were mapped. It is,however, possible that the DArT markers wPt0365 andwPt0995 are associated with this gene (Table 3, Figure2c). On chromosome 4AL, three DArT markers in LDb1and one in LDb2 were associated with SR and could beassociated with the presence of Sr7 (Figure 2d).
At the end of 6BL, three DArT markers were associ-ated with SR in ESWYT set 1; they are most likely linkedto Sr11, a gene that is in turn linked to Lr3 (McIntosh
et al. 1995) that is present in a large number of CIMMYTcultivars (Roelfs and McVey 1979), but to which viru-lence has evolved in most countries (this is probablywhy it was not found in ESWYT set 2) (McIntosh et al.1995). Marker wPt0600 in 7BL could be associated withSr17, which is found in a wide range of cultivars,including CIMMYT wheat lines, and which is linked toLr14a and Pm5. Marker wPt3328 in 7DS, correspondingto the position of Lr34/Yr18 (Kerber and Aung 1999),was not significant for SR in this study, despite the factthat Lr34 has previously been associated with enhancedSR resistance.
TABLE 3
Location of the significant DArT markers associated with stem rust in ESWYT set 1 (ESWYTs 1, 6, 10) and ESWYT set 2(ESWYTs 20 and 24) using linear mixed model 1 (LMM1) and linear mixed model 2 (LMM2) for each chromosome
and the reported Sr genes and QTL
Short arm (S) Long arm (L) Unknown arm
Chromosome DArT (wPt) Sr gene and QTL DArT (wPt) Sr gene and QTL DArT (wPt) Sr gene
1A — — — — — —1B 8949, 1328, 3465,
4434, 6427, 8986,1781, 5065, 2614,5678, 5363, 6777,5801, 6117, 6833,8616
Sr31 — Sr14 1139, 2019,1589
—
1D — Sr45 — Sr33 — Sr182A — Sr38 — Sr21 — Sr32, -342B 0100, 9402 Sr19, -23, -36, -40 — Sr9a, -9b, -9d, -9e,
-9f, -9g, -16,-20, -28
— Sr10, -32,-34, -39
2D — Sr6 — — — —3A — — 5662 Sr35 — Sr273B 0365, 0995, 5716,
7015, 8352, 8993,9170, 5105, 6802,
Sr2, -12 — — — —
3D — — — Sr24 — —4A 2788 — 2084, 3795, 7807,
4487Sr37 5434 —
4B 8650 — — Sr7a, -7b — —4D — — — — — Sr415A — — — — — —5B — — 4996 — — —5D — — — Sr30 — —6A — Sr8a, -8b 7623 Sr13, -26 — —6B 7662, 1922, 3130,
9990, 6994, 8239,4720, 3304, 1852,7777, 3733
— 0171, 9256, 1541 Sr11 1541, 5596 —
7A — — — Sr15, -22 4748 —7B — — 1149, 5343, 0600 Sr17 QTLa — —7D 2565 Sr44 — Sr25 3923, 5674
The locations of Sr genes as per the USDA–ARS Cereal Disease Lab (http://www.ars.usda.gov/Main/docs.htm?docid¼10342)and other publications are shown. The significant DArT markers and Sr genes with unknown location are given in the last twocolumns. Underlined genes are not present or not known to be present in the lines included in this study.
a Faris et al. (1999).
Association Analysis of Historical Wheat 1903

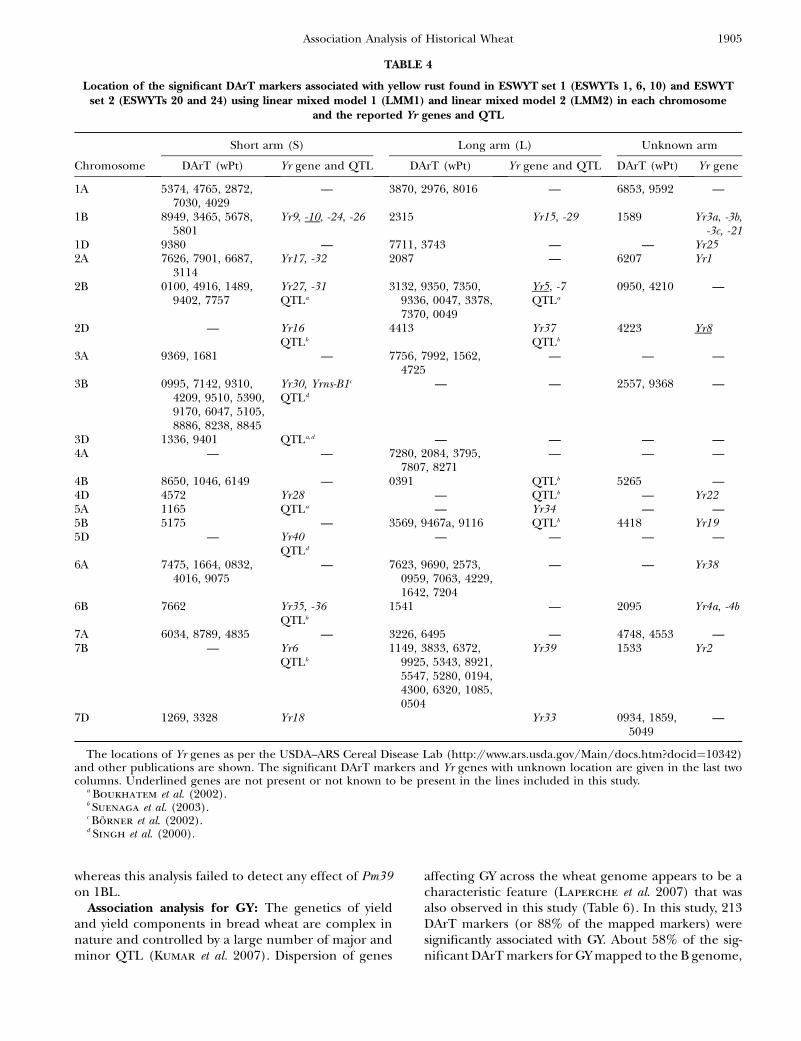
Association analysis for response to yellow rust (YR):According to Suenaga et al. (2003), there is significantdiversity for genes that have minor to intermediate ad-ditive effects on YR resistance. Adult plant resistance toYR and LR in CIMMYT wheat is based on several geneswith minor effects, including Yr18 (pleiotropic or closelylinked to Lr34), Yr29 (pleiotropic or closely linked toLr46), and Yr30, which have been deployed to provide amore durable solution against YR (Singh et al. 2005). Inaddition, of the known seedling YR resistance genes,those reported in CIMMYTwheat lines are, for example,Yr9 (in the 1B.1R translocation), Yr3, Yr1, Yr2, Yr27, Yr7,and Yr6 (McIntosh et al. 1995). In this study, associationwith YR was found in all chromosomes where DArTmarkers have been mapped, except at 5D (Table 4). Sev-eral significant DArT markers were found in regionswhere no YR resistance genes or QTL had been reportedpreviously: i.e., 1AS, 1AL, 1DS, 1DL, 2AL, 3AS, 3AL, 4AL,4BS, 5BS, 6AS, 6AL, 6BL, 7AS, and 7AL (Table 4).
Some significant DArT markers proved to be associ-ated with known YR resistance genes, such as Yr24 at 1B,which is allelic to Yr26 and closely linked to barc187 (Li
et al. 2006) (Figure 2a). Boukhatem et al. (2002) iden-tified two major QTL for durable YR resistance on chro-mosome 2B, of which one was present in Opata 85 andmapped near the SSR marker gwm410. This marker isalso present in LDb3 with wPt7757, which is significantlyassociated with YR (Figure 2b, Table 4). On 2DL, a QTLassociated with a reduction in YR infection type was re-ported to be linked to marker gwm349 (Mallard et al.2005), which in our study is �3 cM from wPt4413 (Fig-ure 2b, Table 4). In addition, Suenaga et al. (2003) de-tected a QTL associated with YR resistance close tomarker gwm349 on 2DL (Figure 2b) within LDb6 nearDArT marker wPt4413. Yr30, at 3BS, has been reportedto be linked to Sr2 and Lr27, and to SSR marker gwm533(Spielmeyer et al. 2003), and may be marked by wPt0995and other DArT markers at LDb3 (Figure 2c) (it is pres-ent in Opata 85 and Pavon F76, included in this study).Singh et al. (2000) and Boukhatem et al. (2002) iden-tified a region on chromosome 3DS associated with YRin Opata 85, which could have been identified by wPt1336and wP19401.
A QTL for adult plant YR resistance in 4BL was linkedto SSRs wmc48c and gwm513 (Suenaga et al. 2003). Inour study, marker wPt6149 was significantly associatedwith YR and located between these two markers (Figure2d). A QTL for adult plant YR resistance in 4D was asso-ciated with marker psp3103 (Suenaga et al. 2003), whichis 8.4 cM from wPt4572 that is significant for YR (Figure2d). The same authors identified a QTL for YR resis-tance in 5BL between SSRs gwm335 and gwm777, whereseveral DArT markers were significantly associated withYR (Table 4, Figure 2e) (see supplemental Figure S15 athttp://www.genetics.org/supplemental/ for the locationof gwm777 on the map including all markers). The onlyreported gene on chromosome 6A is Yr38, which was
recently transferred into wheat from Aegilops sharonensis(Marais et al. 2006). In contrast, this study found severallinked and unlinked DArT markers significantly associ-ated with YR on chromosome 6A in both ESWYT sets.These results indicate the presence of unknown YR re-sistance genes or alleles on this chromosome. On 7B,Suenaga et al. (2003) identified a QTL linked to SSRsgwm333 and gwm46, which in our study are located atLBb4 near wPt1149, wPt3833, and wPt6372, all of whichwere significantly associated, among others, to YR (Table4, Figure 2g). At 7D, the adult plant resistance gene Yr18is most likely being detected by DArTwPt3328 or wPt1100(Figure 2g).
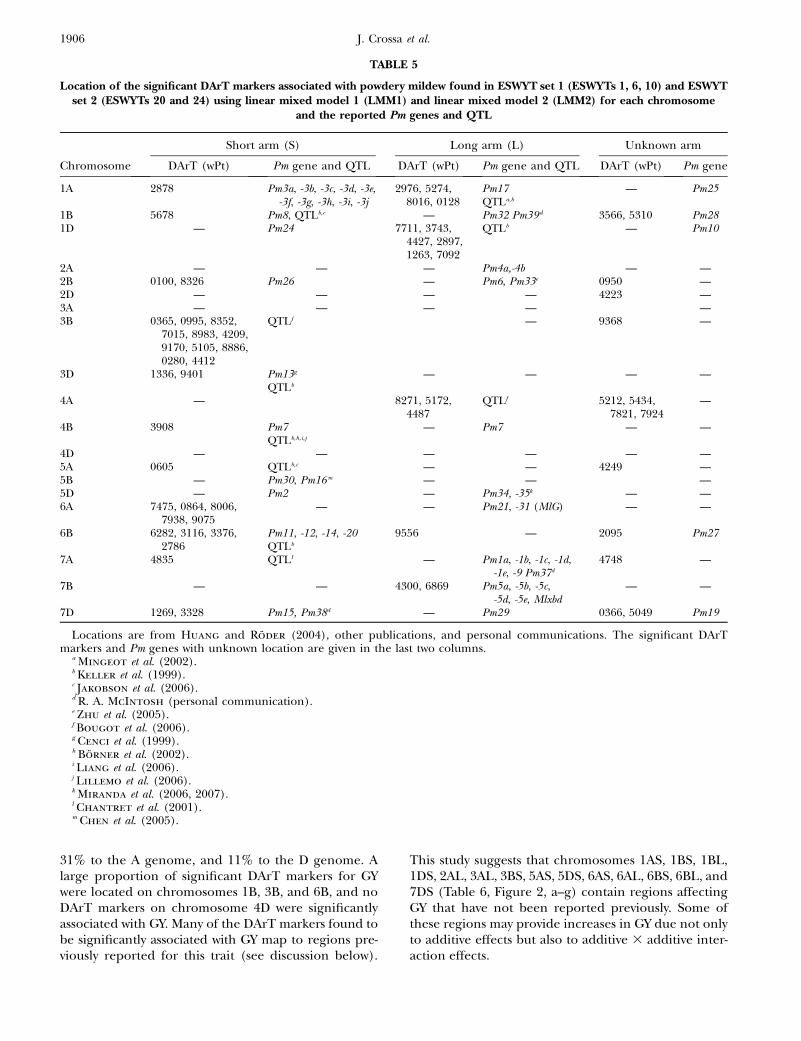
Association analysis for response to PM: CIMMYTbread wheat germplasm is generally susceptible to PMdue to the lack of natural epidemics of B. graminis f.sp.tritici in Mexico. Hence, there has not been direct selec-tion for resistance against this pathogen in the breedingprogram. There is, however, considerable genetic vari-ation for PM resistance in CIMMYT germplasm, as in-dicated by the many significant DArT markers associatedwith the trait in this study. Most of the significant chro-mosomal areas for PM resistance were associated withknown Pm genes or QTL (Table 5). For example, the sig-nificant markers on chromosome arms 1BS, 1DL, 2BS,3DS, 6AS, and 7BL correspond to the locations of Pm8,Pm24, Pm26, Pm13, Pm31, and Pm5, respectively, and thegroups of significant markers for PM resistance on 1AL,3BS, 4AL, 6BS, and 7DS correspond to reported QTL(Table 5). Recently, Nematollahi et al. (2007) detectedPM resistance allele Pm5d at 7BL near SSRs gwm577 andwmc 581. These two SSRs are located in the same LDb6 of7BL on our map (Figure 2g), where wPt6869, significantfor PM, was found (and near wPt4300, significant forPM). There were also many significant DArT markerslocated in areas where no Pm gene or QTL had been re-ported previously, e.g., wPt2872 on 1AS, wPt4427-wPt7092on 1DL, wPt4412 on 3BL, wPt9256 on 6BL, and wPt1085-wPt6869 on 7BL.
It is interesting to note that all the chromosomal areasthat showed a significant effect on PM in this study alsoharbored genetic factors for resistance to at least one ofthe three rust diseases. This indicates that the PM resis-tance at these loci might have been indirectly selectedfor by selection for LR or YR. For example, the race-specific resistance gene Pm8 is co-inherited with Sr31,Lr29, and Yr9 in the 1B.1R translocation, and the Pm5locus on 7BL is linked to Sr17 and Lr14. Such co-inheritance of resistance to PM and the rust diseases isalso evident for race nonspecific adult plant resistance.For example, the Lr34/Yr18 locus on 7DS has beenshown to confer partial resistance to PM (Spielmeyer
et al. 2005; Lillemo et al. 2007), as does the Lr46/Yr29locus on 1BL (Lillemo et al. 2007). These genes havebeen designated Pm38 and Pm39, respectively (R. A.McIntosh, personal communication). The DArTmarker wPt3328 appears to be associated with Pm38,
1904 J. Crossa et al.
whereas this analysis failed to detect any effect of Pm39on 1BL.
Association analysis for GY: The genetics of yieldand yield components in bread wheat are complex innature and controlled by a large number of major andminor QTL (Kumar et al. 2007). Dispersion of genes
affecting GY across the wheat genome appears to be acharacteristic feature (Laperche et al. 2007) that wasalso observed in this study (Table 6). In this study, 213DArT markers (or 88% of the mapped markers) weresignificantly associated with GY. About 58% of the sig-nificant DArT markers for GY mapped to the B genome,
TABLE 4
Location of the significant DArT markers associated with yellow rust found in ESWYT set 1 (ESWYTs 1, 6, 10) and ESWYTset 2 (ESWYTs 20 and 24) using linear mixed model 1 (LMM1) and linear mixed model 2 (LMM2) in each chromosome
and the reported Yr genes and QTL
Short arm (S) Long arm (L) Unknown arm
Chromosome DArT (wPt) Yr gene and QTL DArT (wPt) Yr gene and QTL DArT (wPt) Yr gene
1A 5374, 4765, 2872,7030, 4029
— 3870, 2976, 8016 — 6853, 9592 —
1B 8949, 3465, 5678,5801
Yr9, -10, -24, -26 2315 Yr15, -29 1589 Yr3a, -3b,-3c, -21
1D 9380 — 7711, 3743 — — Yr252A 7626, 7901, 6687,
3114Yr17, -32 2087 — 6207 Yr1
2B 0100, 4916, 1489,9402, 7757
Yr27, -31QTLa
3132, 9350, 7350,9336, 0047, 3378,7370, 0049
Yr5, -7QTLa
0950, 4210 —
2D — Yr16QTLb
4413 Yr37QTLb
4223 Yr8
3A 9369, 1681 — 7756, 7992, 1562,4725
— — —
3B 0995, 7142, 9310,4209, 9510, 5390,9170, 6047, 5105,8886, 8238, 8845
Yr30, Yrns-B1c
QTLd
— — 2557, 9368 —
3D 1336, 9401 QTLa,d — — — —4A — — 7280, 2084, 3795,
7807, 8271— — —
4B 8650, 1046, 6149 — 0391 QTLb 5265 —4D 4572 Yr28 — QTLb — Yr225A 1165 QTLa — Yr34 — —5B 5175 — 3569, 9467a, 9116 QTLb 4418 Yr195D — Yr40
QTLd
— — — —
6A 7475, 1664, 0832,4016, 9075
— 7623, 9690, 2573,0959, 7063, 4229,1642, 7204
— — Yr38
6B 7662 Yr35, -36QTLb
1541 — 2095 Yr4a, -4b
7A 6034, 8789, 4835 — 3226, 6495 — 4748, 4553 —7B — Yr6
QTLb
1149, 3833, 6372,9925, 5343, 8921,5547, 5280, 0194,4300, 6320, 1085,0504
Yr39 1533 Yr2
7D 1269, 3328 Yr18 Yr33 0934, 1859,5049
—
The locations of Yr genes as per the USDA–ARS Cereal Disease Lab (http://www.ars.usda.gov/Main/docs.htm?docid¼10342)and other publications are shown. The significant DArT markers and Yr genes with unknown location are given in the last twocolumns. Underlined genes are not present or not known to be present in the lines included in this study.
a Boukhatem et al. (2002).b Suenaga et al. (2003).c Borner et al. (2002).d Singh et al. (2000).
Association Analysis of Historical Wheat 1905
31% to the A genome, and 11% to the D genome. Alarge proportion of significant DArT markers for GYwere located on chromosomes 1B, 3B, and 6B, and noDArT markers on chromosome 4D were significantlyassociated with GY. Many of the DArT markers found tobe significantly associated with GY map to regions pre-viously reported for this trait (see discussion below).
This study suggests that chromosomes 1AS, 1BS, 1BL,1DS, 2AL, 3AL, 3BS, 5AS, 5DS, 6AS, 6AL, 6BS, 6BL, and7DS (Table 6, Figure 2, a–g) contain regions affectingGY that have not been reported previously. Some ofthese regions may provide increases in GY due not onlyto additive effects but also to additive 3 additive inter-action effects.
TABLE 5
Location of the significant DArT markers associated with powdery mildew found in ESWYT set 1 (ESWYTs 1, 6, 10) and ESWYTset 2 (ESWYTs 20 and 24) using linear mixed model 1 (LMM1) and linear mixed model 2 (LMM2) for each chromosome
and the reported Pm genes and QTL
Short arm (S) Long arm (L) Unknown arm
Chromosome DArT (wPt) Pm gene and QTL DArT (wPt) Pm gene and QTL DArT (wPt) Pm gene
1A 2878 Pm3a, -3b, -3c, -3d, -3e,-3f, -3g, -3h, -3i, -3j
2976, 5274,8016, 0128
Pm17QTLa,b
— Pm25
1B 5678 Pm8, QTLb,c — Pm32 Pm39d 3566, 5310 Pm281D — Pm24 7711, 3743,
4427, 2897,1263, 7092
QTLb — Pm10
2A — — — Pm4a,-4b — —2B 0100, 8326 Pm26 — Pm6, Pm33e 0950 —2D — — — — 4223 —3A — — — — —3B 0365, 0995, 8352,
7015, 8983, 4209,9170, 5105, 8886,0280, 4412
QTLf — 9368 —
3D 1336, 9401 Pm13g
QTLb
— — — —
4A — 8271, 5172,4487
QTLf 5212, 5434,7821, 7924
—
4B 3908 Pm7QTLb,h,i,j
— Pm7 — —
4D — — — — — —5A 0605 QTLb,c — — 4249 —5B — Pm30, Pm16m — — —5D — Pm2 — Pm34, -35k — —6A 7475, 0864, 8006,
7938, 9075— — Pm21, -31 (MlG) — —
6B 6282, 3116, 3376,2786
Pm11, -12, -14, -20QTLb
9556 — 2095 Pm27
7A 4835 QTLl — Pm1a, -1b, -1c, -1d,-1e, -9 Pm37d
4748 —
7B — — 4300, 6869 Pm5a, -5b, -5c,-5d, -5e, Mlxbd
— —
7D 1269, 3328 Pm15, Pm38d — Pm29 0366, 5049 Pm19
Locations are from Huang and Roder (2004), other publications, and personal communications. The significant DArTmarkers and Pm genes with unknown location are given in the last two columns.
a Mingeot et al. (2002).b Keller et al. (1999).c Jakobson et al. (2006).d R. A. McIntosh (personal communication).e Zhu et al. (2005).f Bougot et al. (2006).g Cenci et al. (1999).h Borner et al. (2002).i Liang et al. (2006).j Lillemo et al. (2006).k Miranda et al. (2006, 2007).l Chantret et al. (2001).m Chen et al. (2005).
1906 J. Crossa et al.
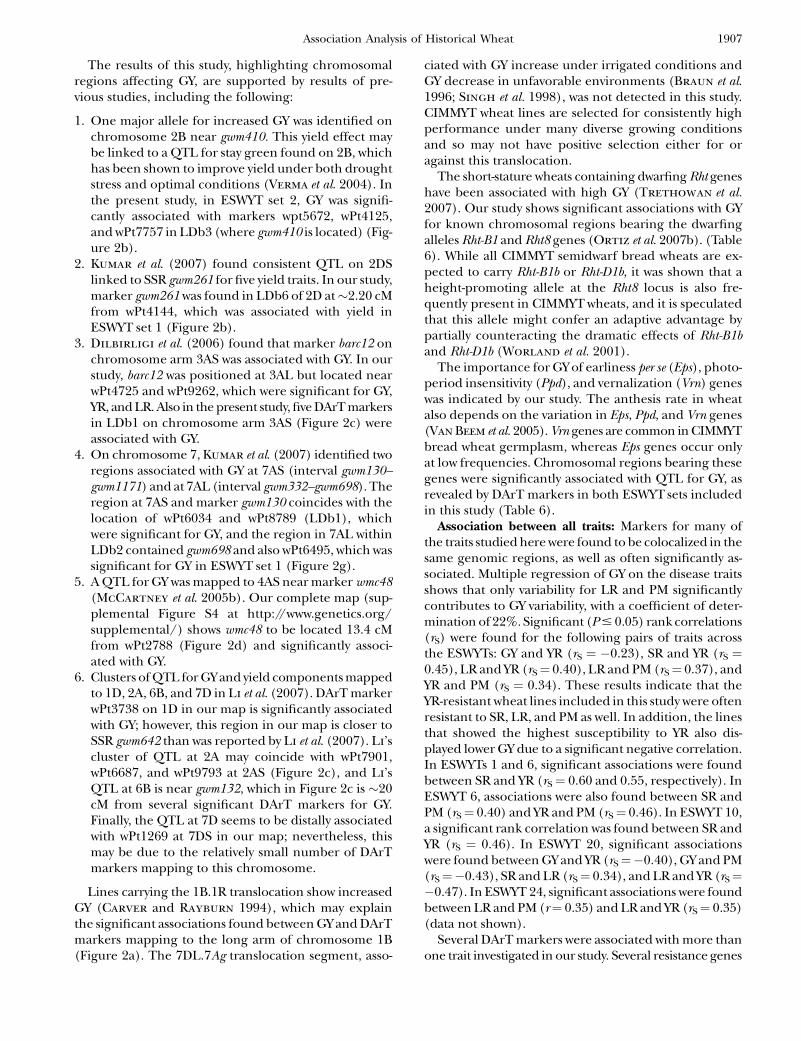
The results of this study, highlighting chromosomalregions affecting GY, are supported by results of pre-vious studies, including the following:
1. One major allele for increased GY was identified onchromosome 2B near gwm410. This yield effect maybe linked to a QTL for stay green found on 2B, whichhas been shown to improve yield under both droughtstress and optimal conditions (Verma et al. 2004). Inthe present study, in ESWYT set 2, GY was signifi-cantly associated with markers wpt5672, wPt4125,and wPt7757 in LDb3 (where gwm410 is located) (Fig-ure 2b).
2. Kumar et al. (2007) found consistent QTL on 2DSlinked to SSR gwm261 for five yield traits. In our study,marker gwm261 was found in LDb6 of 2D at�2.20 cMfrom wPt4144, which was associated with yield inESWYT set 1 (Figure 2b).
3. Dilbirligi et al. (2006) found that marker barc12 onchromosome arm 3AS was associated with GY. In ourstudy, barc12 was positioned at 3AL but located nearwPt4725 and wPt9262, which were significant for GY,YR, and LR. Also in the present study, five DArT markersin LDb1 on chromosome arm 3AS (Figure 2c) wereassociated with GY.
4. On chromosome 7, Kumar et al. (2007) identified tworegions associated with GY at 7AS (interval gwm130–gwm1171) and at 7AL (interval gwm332–gwm698). Theregion at 7AS and marker gwm130 coincides with thelocation of wPt6034 and wPt8789 (LDb1), whichwere significant for GY, and the region in 7AL withinLDb2 contained gwm698 and also wPt6495, which wassignificant for GY in ESWYT set 1 (Figure 2g).
5. A QTL for GY was mapped to 4AS near marker wmc48(McCartney et al. 2005b). Our complete map (sup-plemental Figure S4 at http://www.genetics.org/supplemental/) shows wmc48 to be located 13.4 cMfrom wPt2788 (Figure 2d) and significantly associ-ated with GY.
6. Clusters of QTL for GY and yield components mappedto 1D, 2A, 6B, and 7D in Li et al. (2007). DArT markerwPt3738 on 1D in our map is significantly associatedwith GY; however, this region in our map is closer toSSR gwm642 than was reported by Li et al. (2007). Li’scluster of QTL at 2A may coincide with wPt7901,wPt6687, and wPt9793 at 2AS (Figure 2c), and Li’sQTL at 6B is near gwm132, which in Figure 2c is �20cM from several significant DArT markers for GY.Finally, the QTL at 7D seems to be distally associatedwith wPt1269 at 7DS in our map; nevertheless, thismay be due to the relatively small number of DArTmarkers mapping to this chromosome.
Lines carrying the 1B.1R translocation show increasedGY (Carver and Rayburn 1994), which may explainthe significant associations found between GY and DArTmarkers mapping to the long arm of chromosome 1B(Figure 2a). The 7DL.7Ag translocation segment, asso-
ciated with GY increase under irrigated conditions andGY decrease in unfavorable environments (Braun et al.1996; Singh et al. 1998), was not detected in this study.CIMMYT wheat lines are selected for consistently highperformance under many diverse growing conditionsand so may not have positive selection either for oragainst this translocation.
The short-stature wheats containing dwarfing Rht geneshave been associated with high GY (Trethowan et al.2007). Our study shows significant associations with GYfor known chromosomal regions bearing the dwarfingalleles Rht-B1 and Rht8 genes (Ortiz et al. 2007b). (Table6). While all CIMMYT semidwarf bread wheats are ex-pected to carry Rht-B1b or Rht-D1b, it was shown that aheight-promoting allele at the Rht8 locus is also fre-quently present in CIMMYT wheats, and it is speculatedthat this allele might confer an adaptive advantage bypartially counteracting the dramatic effects of Rht-B1band Rht-D1b (Worland et al. 2001).
The importance for GY of earliness per se (Eps), photo-period insensitivity (Ppd), and vernalization (Vrn) geneswas indicated by our study. The anthesis rate in wheatalso depends on the variation in Eps, Ppd, and Vrn genes(Van Beem et al. 2005). Vrn genes are common in CIMMYTbread wheat germplasm, whereas Eps genes occur onlyat low frequencies. Chromosomal regions bearing thesegenes were significantly associated with QTL for GY, asrevealed by DArT markers in both ESWYT sets includedin this study (Table 6).
Association between all traits: Markers for many ofthe traits studied here were found to be colocalized in thesame genomic regions, as well as often significantly as-sociated. Multiple regression of GY on the disease traitsshows that only variability for LR and PM significantlycontributes to GY variability, with a coefficient of deter-mination of 22%. Significant (P # 0.05) rank correlations(rS) were found for the following pairs of traits acrossthe ESWYTs: GY and YR (rS ¼ �0.23), SR and YR (rS ¼0.45), LR and YR (rS¼ 0.40), LR and PM (rS¼ 0.37), andYR and PM (rS ¼ 0.34). These results indicate that theYR-resistant wheat lines included in this study were oftenresistant to SR, LR, and PM as well. In addition, the linesthat showed the highest susceptibility to YR also dis-played lower GY due to a significant negative correlation.In ESWYTs 1 and 6, significant associations were foundbetween SR and YR (rS¼ 0.60 and 0.55, respectively). InESWYT 6, associations were also found between SR andPM (rS¼ 0.40) and YR and PM (rS¼ 0.46). In ESWYT 10,a significant rank correlation was found between SR andYR (rS ¼ 0.46). In ESWYT 20, significant associationswere found between GY and YR (rS¼�0.40), GY and PM(rS¼�0.43), SR and LR (rS¼ 0.34), and LR and YR (rS¼�0.47). In ESWYT 24, significant associations were foundbetween LR and PM (r¼ 0.35) and LR and YR (rS¼ 0.35)(data not shown).
Several DArT markers were associated with more thanone trait investigated in our study. Several resistance genes
Association Analysis of Historical Wheat 1907

TABLE 6
Location of the significant DArT markers associated with grain yield found in ESWYT set 1 (ESWYTs 1, 6, 10)and ESWYT set 2 (ESWYTs 20 and 24) using linear mixed model 1 (LMM1) and linear mixed
model 2 (LMM2) for each chromosome and the reported QTL
Short arm (S) Long arm (L) Unknown arm
Chromosome DArT (wPt) QTL DArT (wPt) QTL DArT (wPt) QTL
1A 5374, 4765, 2872,9266, 2311, 7030,4029
— 3870, 3904, 5274,4709, 6754, 8016,0128
QTLa,b,c 9592, 1011,6853
QTLd
1B 8949, 1328, 7094,3465, 4434, 0974,6427, 8986, 1781,5065, 5678, 5363,6777, 5801, 6117,6833, 8616
1B.1Rtransl.
2315, 0944, 2526,4129
— 5316, 1139,2019
QTLa,e
1D 3738, 9380 — 7711, 9857, 3743,4427, 2897, 1263,7092
QTLc — QTLb,f
2A 7901, 6687, 9793,3114
Ppd3QTLc,g
5647, 2087 — 6207 QTLe,f,h
2B 0100, 4916, 6706,8326, 3983, 5672,4125, 7757
Ppd2 3132, 9350, 7350,9336, 2135, 3378,7360, 0049
EpsQTLa
0094, 0950,4210
QTLg,i
2D 4144 Ppd1Rht8QTLc
4413 Eps — QTLe,f,h,i
3A 9369, 1681 QTLj 7756, 2698, 7992,2938, 4725, 9268,4407, 1688
— — EpsQTLj,k,l,
3B 0365, 0995, 5716,7015, 8352, 8983,7142, 9310, 4209,9510, 5390, 9170,6047, 5105, 6802,8886, 0280, 0384,8238, 8096, 4412,8845
— — QTLa,c 9368, 2757 VrnQTLf
3D 1365, 9401 — — QTLg — PpdQTLd,h
4A 2788 QTLc,g 7280, 2084, 3795,7807, 8271, 4620,2533
QTLc 4660, 7924 Eps
4B 3908, 6149 Rht-1QTLb
1505, 8292 QTLc,m 3608, 5265 EpsQTLa,h
4D QTLg Rht-2 — QTLc — EpsQTLd
5A 1165, 0605 — 5231 Vrn-A1QTLb
4249 QTLa,b,d,h,n,o
5B 6136, 1420, 9666,5175
— 9467, 0103, 4996,7101, 5896, 3030,9598
Vrn-A2QTLp
4418, 4703,4936
QTLa,d,e,q
5D 1400 — — Vrn-A3Vrn-4
— QTLd
6A 7475, 0864, 8006,7938, 9075
— 9690, 2573, 0959,7063, 1642, 7204
— — QTLa,f,r
6B 9532, 1922, 3130,9990, 6994, 8239,4720, 1547, 6282,3116, 3304, 1852,7777, 4706, 3733
— 6116, 0171, 1264,3045, 9256, 1541
— — EpsQTLa,d
(continued )
1908 J. Crossa et al.

(R genes) affecting different diseases have been reportedto be clustered in specific regions of the genome, suchas Lr20-Sr15-Pm1 (Neu and Keller 2002). These clustersof R genes are important breeding targets, because thetransfer of such a region results in resistance to severalpathogens simultaneously (Neu and Keller 2002). Pleio-tropy or linkage between adult plant resistance genes fordifferent pathogens has also been reported. For exam-ple, Lr34 is completely linked or pleiotropic to Yr18,which is also linked to a gene conditioning tolerance tobarley yellow dwarf virus (Bydv1) (Singh 1993) and to PMresistance (Spielmeyer et al. 2005; Lillemo et al. 2007).In this study, associations between disease resistance andGY were probably caused by the reduction in yield lossdue to susceptibility, since only variability for LR and PMsignificantly contributed to GY variability, explaining 22%of GY variation. This result indicates that ESWYT mate-rials maintained a relatively high level of overall diseaseresistance, with abiotic factors presumably accounting formost of the variation.
Implicit marker effects in statistical models: Thefixed effects of markers are implicitly considered whencomparing the BLUPs of the lines obtained from LMM1by using the variance–covariance matrix of the BLUPs.Modeling the marker effects in this manner has two ad-vantages over the model that explicitly includes markersas fixed effects: (1) information contained in relation-ship matrix A is fully exploited, as its effect is reflected inthe BLUPs of the lines (and in their variance–covariancematrix) and, thus, in the contrast for each marker in eachsubpopulation and across subpopulations; and (2) LMM1can be fitted to avoid nonidentification and overparam-eterization. This last issue is more of a problem whensome lines lack data for some markers. Another pointworth mentioning is that since markers represent attri-butes of lines, an appropriate model would include linesnested within markers (Malosetti et al. 2007) and withinsubpopulations. When markers are explicitly includedin LMM1 and LMM2 as fixed (or random) effects, it isnot clear how the effect of relationship matrix A (or
TABLE 6
(Continued)
Short arm (S) Long arm (L) Unknown arm
Chromosome DArT (wPt) QTL DArT (wPt) QTL DArT (wPt) QTL
7A 6034, 8789, 4835 QTLc 3393, 6495 QTLb,c 2266, 4553,4748
QTLa,n
7B — — 6273, 9925, 7887,5343, 8921, 5547,5280, 0194, 6156,4300, 7108, 6320,0504
QTLb 1533, 9746 VrnB4Vrn5EpsQTLn
7D 1269 — — QTLa,s,7D.7Ag
transl.
0366, 0934,3462, 3923,5049, 5150,5674, 1859
QTLf
Other loci associated with grain yield in wheat are Eps (earliness per se) (Worland 1996; Van Beem et al. 2005), Ppd (photo-period insensitivity) (Worland 1996; Worland et al. 1998; Van Beem et al. 2005), Rht (semidwarf plant height) (Korzun et al.1998; Ellis et al. 2002), and Vrn (vernalization) (Worland 1996; Barret et al. 2002; Yan et al. 2003; Van Beem et al. 2005).
a Marza et al. (2006).b Quarrie et al. (2005, 2006).c Kumar et al. (2007).d Huang et al. (2004).e Huang et al. (2003).f Li et al. (2007).g McCartney et al. (2005b).h Laperche et al. (2007).i Verma et al. (2004).j Dilbirligi et al. (2006).k Ali et al. (2007).l Campbell et al. (2003, 2004).m Kirigwi et al. (2007).n Huang et al. (2006).o Kato et al. (2000).p Miura et al. (1992).q Gonzalez-Hernandez et al. (2004).r Snape et al. (2007).s Groos et al. (2003).
Association Analysis of Historical Wheat 1909
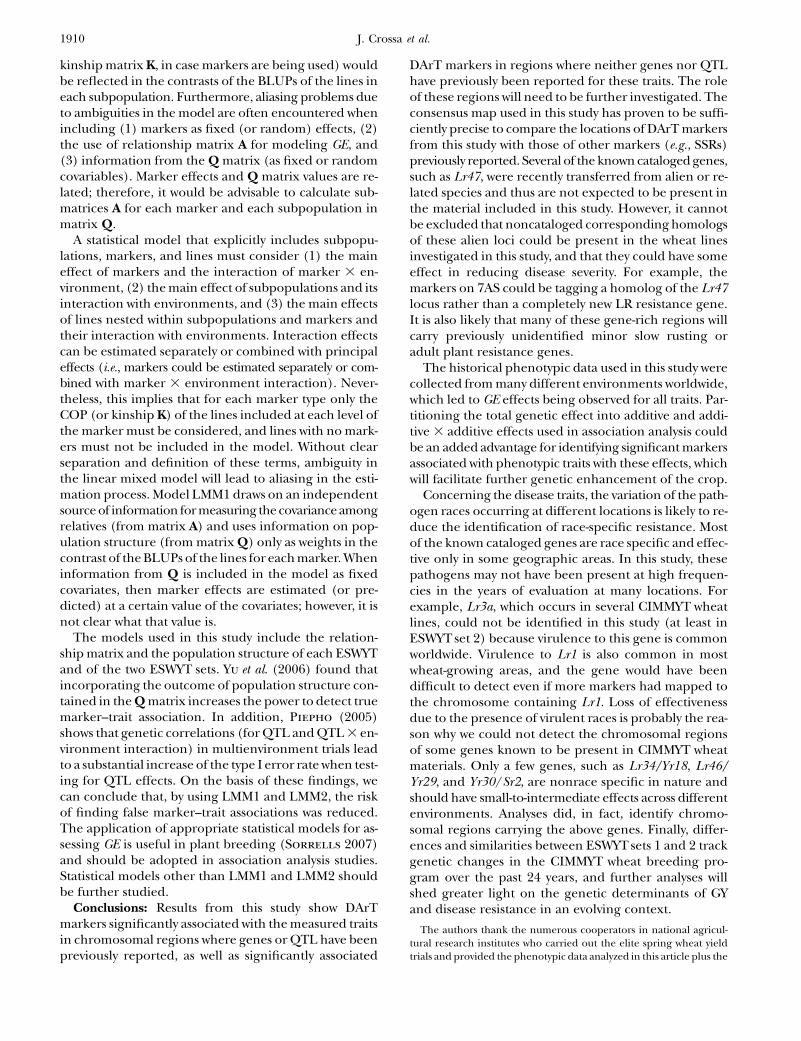
kinship matrix K, in case markers are being used) wouldbe reflected in the contrasts of the BLUPs of the lines ineach subpopulation. Furthermore, aliasing problems dueto ambiguities in the model are often encountered whenincluding (1) markers as fixed (or random) effects, (2)the use of relationship matrix A for modeling GE, and(3) information from the Q matrix (as fixed or randomcovariables). Marker effects and Q matrix values are re-lated; therefore, it would be advisable to calculate sub-matrices A for each marker and each subpopulation inmatrix Q.
A statistical model that explicitly includes subpopu-lations, markers, and lines must consider (1) the maineffect of markers and the interaction of marker 3 en-vironment, (2) the main effect of subpopulations and itsinteraction with environments, and (3) the main effectsof lines nested within subpopulations and markers andtheir interaction with environments. Interaction effectscan be estimated separately or combined with principaleffects (i.e., markers could be estimated separately or com-bined with marker 3 environment interaction). Never-theless, this implies that for each marker type only theCOP (or kinship K) of the lines included at each level ofthe marker must be considered, and lines with no mark-ers must not be included in the model. Without clearseparation and definition of these terms, ambiguity inthe linear mixed model will lead to aliasing in the esti-mation process. Model LMM1 draws on an independentsource of information for measuring the covariance amongrelatives (from matrix A) and uses information on pop-ulation structure (from matrix Q) only as weights in thecontrast of the BLUPs of the lines for each marker. Wheninformation from Q is included in the model as fixedcovariates, then marker effects are estimated (or pre-dicted) at a certain value of the covariates; however, it isnot clear what that value is.
The models used in this study include the relation-ship matrix and the population structure of each ESWYTand of the two ESWYT sets. Yu et al. (2006) found thatincorporating the outcome of population structure con-tained in the Q matrix increases the power to detect truemarker–trait association. In addition, Piepho (2005)shows that genetic correlations (for QTL and QTL 3 en-vironment interaction) in multienvironment trials leadto a substantial increase of the type I error rate when test-ing for QTL effects. On the basis of these findings, wecan conclude that, by using LMM1 and LMM2, the riskof finding false marker–trait associations was reduced.The application of appropriate statistical models for as-sessing GE is useful in plant breeding (Sorrells 2007)and should be adopted in association analysis studies.Statistical models other than LMM1 and LMM2 shouldbe further studied.
Conclusions: Results from this study show DArTmarkers significantly associated with the measured traitsin chromosomal regions where genes or QTL have beenpreviously reported, as well as significantly associated
DArT markers in regions where neither genes nor QTLhave previously been reported for these traits. The roleof these regions will need to be further investigated. Theconsensus map used in this study has proven to be suffi-ciently precise to compare the locations of DArT markersfrom this study with those of other markers (e.g., SSRs)previously reported. Several of the known cataloged genes,such as Lr47, were recently transferred from alien or re-lated species and thus are not expected to be present inthe material included in this study. However, it cannotbe excluded that noncataloged corresponding homologsof these alien loci could be present in the wheat linesinvestigated in this study, and that they could have someeffect in reducing disease severity. For example, themarkers on 7AS could be tagging a homolog of the Lr47locus rather than a completely new LR resistance gene.It is also likely that many of these gene-rich regions willcarry previously unidentified minor slow rusting oradult plant resistance genes.
The historical phenotypic data used in this study werecollected from many different environments worldwide,which led to GE effects being observed for all traits. Par-titioning the total genetic effect into additive and addi-tive 3 additive effects used in association analysis couldbe an added advantage for identifying significant markersassociated with phenotypic traits with these effects, whichwill facilitate further genetic enhancement of the crop.
Concerning the disease traits, the variation of the path-ogen races occurring at different locations is likely to re-duce the identification of race-specific resistance. Mostof the known cataloged genes are race specific and effec-tive only in some geographic areas. In this study, thesepathogens may not have been present at high frequen-cies in the years of evaluation at many locations. Forexample, Lr3a, which occurs in several CIMMYT wheatlines, could not be identified in this study (at least inESWYT set 2) because virulence to this gene is commonworldwide. Virulence to Lr1 is also common in mostwheat-growing areas, and the gene would have beendifficult to detect even if more markers had mapped tothe chromosome containing Lr1. Loss of effectivenessdue to the presence of virulent races is probably the rea-son why we could not detect the chromosomal regionsof some genes known to be present in CIMMYT wheatmaterials. Only a few genes, such as Lr34/Yr18, Lr46/Yr29, and Yr30/Sr2, are nonrace specific in nature andshould have small-to-intermediate effects across differentenvironments. Analyses did, in fact, identify chromo-somal regions carrying the above genes. Finally, differ-ences and similarities between ESWYT sets 1 and 2 trackgenetic changes in the CIMMYT wheat breeding pro-gram over the past 24 years, and further analyses willshed greater light on the genetic determinants of GYand disease resistance in an evolving context.
The authors thank the numerous cooperators in national agricul-tural research institutes who carried out the elite spring wheat yieldtrials and provided the phenotypic data analyzed in this article plus the
1910 J. Crossa et al.
International Maize and Wheat Improvement Center’s internationalnursery and seed distribution units who prepared and distributed theseed and computerized the data. We thank Alma McNab for theEnglish editing.
LITERATURE CITED
Akbari, M., P. Wenzl, V. Caig, J. Carling, L. Xia et al., 2006 Di-versity arrays technology (DArT) for high-throughput profilingof the hexaploid wheat genome. Theor. Appl. Genet. 113:1409–1420.
Ali, M. L., P. S. Baenziger, A. A. Zakaria, M. Shafqat, K. S. Gill
et al., 2007 Mapping QTLs for GY and other agronomic traitslocated on chromosome 3A of wheat. Abstracts of Plant and An-imal Genome XV Conference, January 13–17, 2007, San Diego.(http://www.intl-pag.org/15/abstracts/PAG15_P05c_273.html).
Arbelbide, M., and R. Bernardo, 2006 Mixed-model QTL mappingfor kernel hardness and dough strength in bread wheat. Theor.Appl. Genet. 112: 885–890.
Barret, B., M. Bayram and K. Kidwell, 2002 Identifying AFLP andmicrosatellite markers for vernalization response gene Vrn-B1 inhexaploid wheat using reciprocal mapping populations. PlantBreed. 121: 400–406.
Benjamini, Y., and Y. Hochberg, 1995 Controlling the false discov-ery rate: a practical and powerful approach to multiple testing.J. R. Stat. Soc. Ser. B 57(1): 289–300.
Borner, A., E. Schumann, A. Furste, H. Coster, B. Leithold et al.,2002 Mapping of quantitative trait loci determining agronomicimportant characters in hexaploid wheat (Triticum aestivum L.).Theor. Appl. Genet. 105: 921–936.
Bougot, Y., J. Lemoine, M. T. Pavoine, H. Guyomar’ch, V. Gautier
et al., 2006 A major QTL effect controlling resistance to pow-dery mildew in winter wheat at the adult plant stage. Plant Breed.125: 550–556.
Boukhatem, N., P. V. Baret, D. Mingeot and J. M. Jacquemin,2002 Quantitative loci for resistance against yellow rust intwo wheat-derived recombinant inbred line populations. Theor.Appl. Genet. 104: 111–118.
Braun, H.-J., S. Rajaram and M. Van Ginkel, 1996 CIMMYT’s ap-proach to breeding for wide adaptation. Euphytica 92: 175–183.
Breseghello, F., and M. E. Sorrells, 2006a Association mappingof kernel size and milling quality in wheat (Triticum aestivum L.)cultivars. Genetics 172: 1165–1177.
Breseghello, F., and M. E. Sorrells, 2006b Association analysis asa strategy for improvement of quantitative traits in plants. CropSci. 46: 1323–1330.
Burgueno, J., J. Crossa, P. L. Cornelius, R. Trethowan, G. McLaren
et al., 2007 Modeling additive 3 environment and additive 3 ad-ditive 3 environment using genetic covariances of relatives ofwheat genotypes. Crop Sci. 47: 311–320.
Campbell, B. T., P. S. Baenziger, K. S. Gill, K. M. Eskridge, H. Budak
et al., 2003 Identification of QTLs and environmental interac-tions associated with agronomic traits on chromosome 3A ofwheat. Crop Sci. 43: 1493–1505.
Campbell, B. T., P. S. Baenziger, K. M. Eskridge, H. Budak, N. A.Streck et al., 2004 Using environmental covariates to explaingenotype 3 environment and QTL 3 environment interactionsfor agronomic traits on chromosome 3A of wheat. Crop Sci. 44:620–627.
Carver, B. F., and A. L. Rayburn, 1994 Comparison of relatedwheat stocks possessing 1B or 1RS.1BL chromosomes: agronomicperformance. Crop Sci. 34: 1505–1510.
Cenci,A.,R.D’Ovidio,O.A. Tanzarella, C.CeoloniandE.Porceddu,1999 Identification of molecular markers linked to Pm13, an Aegi-lops longissima gene conferring resistance to powdery mildew inwheat. Theor. Appl. Genet. 98: 448–454.
Chantret, N., D. Mingeot, P. Sourdille, M. Bernard, J. M. Jacquemin
et al., 2001 A major QTL for powdery mildew resistance is stableover time and at two development stages in winter wheat. Theor.Appl. Genet. 103: 962–971.
Chen, X. M., Y. H. Luo, X. C. Xia, L.Q. Xia, X. Chen et al., 2005 Chro-mosomal location of powdery mildew resistance gene Pm16 inwheat using SSR marker analysis. Plant Breed. 124: 225–228.
Cockerham, C. C., 1971 Higher order probability functions of iden-tity of alleles by descent. Genetics 69: 235–246.
Crossa, J., J. Burgueno, P. L. Cornelius, G. McLaren, R. Trethowan
et al., 2006 Covariances of relatives for predicting breeding valuesof wheat genotypes. Crop Sci. 46: 1722–1733.
Cullis, B. R., F. M. Thomson, J. A. Fisher, A. R. Gilmour and R.Thompson, 1996 The analysis of the NSWwheat varietydatabase.II.Variancecomponentestimation.Theor. Appl.Genet.92: 28–39.
Dilbirligi, M., M. Erayman, B. T. Campbell, H. S. Randhawa, P. S.Baenziger et al., 2006 High density mapping and comparativeanalysis of agronomically important traits on wheat chromosome3A. Genomics 88: 74–87.
Ellis, M. H., W. Spielmeyer, K. R. Gale, G. J. Rebetzke and R. A.Richards, 2002 ‘‘Perfect’’markers for the Rht-B1b and Rht-D1bdwarfing genes in wheat. Theor. Appl. Genet. 105: 1038–1042.
Faris, J. D., W. L. Li, D. J. Liu, P. D. Chen and B. S. Gill, 1999 Can-didate gene analysis of quantitative disease resistance in wheat.Theor. Appl. Genet. 98: 219–225.
Flint-Garcia, S. A., J. M. Thornsberry and E. S. Blucker, IV,2003 Structure of linkage disequilibrium in plants. Annu. Rev.Plant. Biol. 54: 357–374.
Gonzalez-Hernandez, J. L., E. M. Elias and S. F. Kianian, 2004 Map-ping genes for grain protein concentration and GYonchromosome5B of Triticum turgidum (L.) var. dicoccoides. Euphytica 139: 217–225.
Groos, C., N. Robert, E. Bervas and G. Charmet, 2003 Geneticanalysis of grain-protein content, GY, and thousand-kernelweight in bread wheat. Theor. Appl. Genet. 106: 1032–1040.
Hiebert, C., J. Thomas and B. McCallum, 2005 Locating thebroad-spectrum wheat leaf rust resistance gene Lr52 (LrW) tochromosome 5B by a new cytogenetic method. Theor. Appl.Genet. 110: 1453–1457.
Huang, X. Q., and M. S. Roder, 2004 Molecular mapping of pow-dery mildew resistance genes in wheat: a review. Euphytica 137:202–223.
Huang, X. Q., H. Coster, M. W. Ganal and M. S. Roder,2003 Advanced backcross QTL analysis for the identificationof quantitative trait loci alleles from wild relatives of wheat (Tri-ticum aestivum L.). Theor. Appl. Genet. 106: 1379–1389.
Huang, X. Q., H. Kempf, M. W. Ganal and M. S. Roder,2004 Advanced backcross QTL analysis in progenies derivedfrom a cross between a German elite winter wheat variety anda synthetic wheat (Triticum aestivum L.). Theor. Appl. Genet.109: 933–943.
Huang, X. Q., S. Cloutier, L. Lycar, N. Radovanovic, D. G.Humphreys et al., 2006 Molecular detection of QTLs for agro-nomic and quality traits in a double haploid population derivedfrom two Canadian wheats (Triticum aestivum L.). Theor. Appl.Genet. 113: 753–766.
Jakobson, I., H. Peusha, L. Timofejeva and K. Jarve, 2006 Adultplant and seedling resistance to powdery mildew in a Triticum aes-tivum x Triticum militinae hybrid line. Theor. Appl. Genet. 112:760–769.
Jannink, J. L., and J. B. Walsh, 2002 Association mapping in plantpopulations, pp. 59–68 in Quantitative Genetics Genomics and PlantBreeding, edited by M. S. Kang. CABI, Wallingford, UK.
Kato, K., H. Miura and S. Sawada, 2000 Mapping QTLs control-ling grain yield and its components on chromosome 5A of wheat.Theor. Appl. Genet. 101: 1114–1121.
Keller, M., B. Keller, G. Schachermayr, M. Winzeler, J. E.Schmid et al., 1999 Quantitative trait loci for resistance againstpowdery mildew in a segregating wheat x spelt population. Theor.Appl. Genet. 98: 903–912.
Kempthorne, O., 1969 An Introduction to Genetics Statistics. IowaState University Press, Ames, IA.
Kerber, E. R., and T. Aung, 1999 Leaf rust resistance gene Lr34 as-sociated with nonsuppression of stem rust resistance in the wheatcultivar Canthatch. Phytopathology 89: 518–521.
Kirigwi, F. M., M. Van Ginkel, G. Brown-Gedira, B. S. Gill, G. M.Paulsen et al., 2007 Markers associated with a QTL for grainyield in wheat under drought. Mol. Breed. 20: 401–413.
Korzun, V., M. S. Roder, M. W. Ganal, A. J. Worland and C. N. Law,1998 Genetic analysis of the dwarfing gene (Rht8) in wheat. Part I.Molecular mapping of Rht8 on the short arm of chromosome2D of bread wheat (Triticum aestivum L.). Theor. Appl. Genet.98: 1104–1109.
Association Analysis of Historical Wheat 1911
Kraakman, A. T. W., R. E. Niks, P. M. M. M. Van den Berg, P. Stam
and F. A. van Eeuwijk, 2004 Linkage disequilibrium mappingof the yield stability in modern spring barley cultivars. Genetics168: 435–446.
Kumar, N., P. L. Kulwal, H. S. Balyan and P. K. Gupta, 2007 QTLmapping for yield and yield contribution traits in two mappingpopulations of bread wheat. Mol. Breed. 19: 163–177.
Laperche, A., M. Brancourt-Hulme, E. Heumez, O. Gardet, E.Hanson et al., 2007 Using genotype x nitrogen interaction var-iables to evaluate the QTL involved in wheat tolerance to nitro-gen constraints. Theor. Appl. Genet. 115: 399–415.
Li, G. Q., Z. F. Li, W. Y. Yang, Y. Zhang, Z. H. He et al., 2006 Molec-ular mapping of stripe rust resistance gene YrCH42 in Chinesewheat cultivar Chuanmai 42 and its allelism with Yr24 andYr26. Theor. Appl. Genet. 112: 1434–1440.
Li, S., J. Jia, X. Wei, X. Zhang, L. Li et al., 2007 A intervarietal ge-netic map and QTL anaysis for yield traits in wheat. Mol. Breed.20: 167–168.
Liang, S. S., K. Suenaga, Z. H. He, Z. L. Wang, H.Y. Liu et al.,2006 Quantitative trait loci mapping for adult-plant resistanceto powdery mildew in bread wheat. Phytopathology 96: 784–789.
Lillemo, M., A. Bjørnstad, B. Asalf, R. P. Singh, J. Huerta-Espino
et al., 2006 Identification of molecular markers associated withpartial resistance to powdery mildew, leaf rust and stripe rust inbread wheat line Saar. EUCARPIA Cereals Section Meeting,November, 2006, Lleida, Spain.
Lillemo, M., R. P. Singh, J. Huerta-Espino, X. M. Chen, Z. H. He
et al., 2007 Leaf rust resistance gene Lr34 is involved in powderymildew resistance of CIMMYT bread wheat line Saar, pp. 97–102in Wheat Production in Stressed Environments (Developments inPlant Breeding, Vol. 12), edited by H. T. Buck, J. E. Nisi andN. Salomon. Proceedings of the 7th International WheatConference, November 27–December 2, 2005, Mar del Plata,Argentina.
Lynch, M., and B. Walsh, 1998 Genetics and Analysis of QuantitativeTraits. Sinauer Associates, Sunderland, MA.
Mallard, S., D. Gaudet, A. Aldeia, C. Abelard, A. L. Besnard et al.,2005 Genetic analysis of durable resistance to yellow rust inbread wheat. Theor. Appl. Genet. 110: 1401–1409.
Malosetti, M., C. G. Van der Linden, B. Vosman and F. E. Van
Eeuwijk, 2007 A mixed-model approach to association map-ping using pedigree information with an illustration of resistanceto Phytophthora infestans in potato. Genetics 175: 879–889.
Marais, G. F., B. McCallum and A. S. Marais, 2006 Leaf rust andstripe rust resistance genes derived from Aegilops sharonensis. Eu-phytica 149: 373–380.
Marza, F., G.-H. Bai, B. F. Carver and W.-C. Zhou, 2006 Quan-titative trait loci for yield and related traits in the wheat popula-tion. Ning7840 3 Clark. Theor. Appl. Genet. 112: 688–698.
McCartney, C. A., D. J. Somers, B. D. McMcallum, J. Thomas, D. J.Humphrey et al., 2005a Microsatellite tagging of the leaf rustresistance gene Lr16 on wheat chromosome 2BSc. Mol. Breed.15: 329–337.
McCartney, C. A., D. J. Somers, D. G. Humphreys, O. Lukow, N.Ames et al., 2005b Mapping quantitative trait loci controllingagronomic traits in the spring wheat cross RL4452 3 ‘AC Do-main’. Genome 48: 870–883.
McIntosh, R. A., C. R. Wellings and R. F. Park, 1995 Wheat Rusts:An Atlas of Resistance Genes. CSIRO, Melbourne, Australia
McLaren, C. G., R. M. Bruskiewich, A. M. Portugal and A. B. Cosico,2005 The International Rice Information System. A platform formeta-analysis of rice crop data. Plant Physiol. 139: 637–642.
Messmer, M. M., R. Seyfarth, M. Keller, G. Schachermayr, M.Winzeler et al., 2000 Genetic analysis of durable leaf rust resis-tance in winter wheat. Theor. Appl. Genet. 100: 419–431.
Mingeot, D., N. Chantret, P. V. Baret, A. Dekeyser, N. Boukhatem
et al., 2002 Mapping QTL involved in adult plant resistance topowdery mildew in the winter wheat line RE714 in two susceptiblegenetic backgrounds. Plant Breed. 121: 133–140.
Miranda, L. M., J. P. Murphy, D. Marshall and S. Leath,2006 Pm34: a new powdery mildew resistance gene transferredfrom Aegilops tauschii Coss. to common wheat (Triticum aestivumL.). Theor. Appl. Genet. 113: 1497–1504.
Miranda, L. M., J. P. Murphy, D. Marshall, C. Cowger and S.Leath, 2007 Chromosomal location of Pm35, a novel Aegilops
tauschii derived powdery mildew resistance gene introgressed in-to common wheat (Triticum aestivum L.). Theor. Appl. Genet.114: 1451–1456.
Miura, H., B. B. Parker and J. W. Snape, 1992 The location of ma-jor genes and associated quantitative trait loci on chromosomearm 5BL of wheat. Theor. Appl. Genet. 85: 197–204.
Nelson, J. C., R. P. Singh, J. E. Autrique and M. E. Sorrells,1997 Mapping genes conferring and suppressing leaf rust resis-tance in wheat. Crop Sci. 37: 1928–1935.
Nematollahi, G., V. Mohler, G. Wenzel, F. J. Zeller and S. L. K.Hsam, 2007 Microsatellite mapping of powdery mildew resis-tance allele Pm5d from common wheat line IGVI-455. Euphytica(in press).
Neu, C. N. S., and B. Keller, 2002 Genetic mapping of the Lr20-Pm1 resistance locus reveals suppressed recombination on chro-mosome arm 7AL in hexaploid wheat. Genome 45: 737–744.
Oakey, H., A. A. Verbyla, W. Pitchford, B. Cullis and H. Kuchel,2006 Joint modeling of additive and non-additive geneticline effects in single field trials. Theor. Appl. Genet. 113(5):809–819.
Ortiz, R., D. Mowbray, C. Dowswell and S. Rajaram, 2007a NormanE. Borlaug: the humanitarian plant scientist who changed the world.Plant Breed. Rev. 28: 1–37.
Ortiz, R., R. Trethowan, G. Ortiz-ferrara, M. Iwanaga, J. H.Dodds et al., 2007b High yield potential, shuttle breeding, ge-netic diversity, and a new international wheat improvement strat-egy. Euphytica 157: 365–384.
Parisseaux, B., and R. Bernardo, 2004 In silico mapping of quan-titative trait loci in maize. Theor. Appl. Genet. 109: 508–514.
Perrier, X., A. Flori and F. Bonnot, 2003 Data analysis methods,pp. 43–76 in Genetic Diversity of Cultivated Tropical Plants, edited byP. Hamon, M. Seguin, X. Perrier and J.-C. Glaszmann. EnfieldScience Publishers, Plymouth, UK.
Piepho, H.-P., 2005 Statistical tests for QTL and QTL-by-environmenteffects in segregating populations derived from line crossa. Theor.Appl. Genet. 110: 561–566.
Pritchard, J. K., M. Stephen and P. Donnely, 2000 Inference onpopulation structure using multilocus genotype data. Genetics155: 945–959.
Quarrie, S. A., A.Steed, C.Calestani, A. Semikhodskii, C.Lebreton
et al., 2005 A high density genetic map of hexaploid wheat (Tri-ticum aestivum L.) from the cross Chinese Spring 3 SQ1 and itsuse to compare QTLs for grain yield across a range of environ-ments. Theor. Appl. Genet. 110: 865–880.
Quarrie, S. A., S. Pekic Quarrie, R. Radosevic, D. Rancic, A.Kaminska et al., 2006 Dissecting a wheat QTL for yield presentin a range of environments: from the QTL to candidate genes. J.Exp. Bot. 57: 2627–2637.
Rajaram, S., R. P. Singh and E. Torres, 1988 Current CIMMYTapproaches in breeding wheat for rust resistance, pp. 101–118in Breeding Strategies for Resistance to the Rusts of Wheat, edited byN. W. Simmonds and S. Rajaram. CIMMYT, Mexico, D.F.,Mexico.
Rajaram, S., R. P. Singh and M. VanGinkel, 1996 Approaches tobreed for wide adaptation, rust resistance and drought, pp. 2–30in Proceedings of the 8th Assembly Wheat Breeding Society of Australia,edited by R. A. Richards, C. W. Wrigley, H. M. Rawson, G. J.Rebetzke, J. L. Davidson and R. I. S. Brettell. The AustralianNational University, Canberra, ACT, Australia.
Rajaram, S., A. Mujeeb-Kazi and R. P. Singh, 1997 Wheat (Triticumaestivum), pp. 75–144 in Genetics, Cytogenetics and Breeding of CropPlants, edited by P. N. Bahl, P. M. Salimath and A. K. Mandal.Oxford & IBH Publishing, New Delhi/Calcutta.
Roelfs, A. P., and D. V. McVey, 1979 Low infection types producedby Puccinia graminis f.sp. tritici. Phytopathology 69: 722–730.
Sawkins, M. C., A. D. Farmer, D. Hoisington, J. Sullivan, A.Tolopko et al., 2004 Comparative map and trait viewer(CMTV): an integrated bioinformatic tool to construct consensusmaps and compare QTL and functional genomics data across ge-nomes and experiments. Plant Mol. Biol. 56: 465–480.
Sayre, K. D., R. P. Singh, J. Huerta-Espino and S. Rajaram, 1998 Ge-netic progress in reducing losses to leaf rust in CIMMYT-derivedMexican spring wheat cultivars. Crop Sci. 38: 654–659.
Schnurbusch, T., S. Paillard, A. Schori, M. Messmer, G.Schachermayr et al., 2004 Dissection of quantitative and durable
1912 J. Crossa et al.
leaf rust resistance in Swiss winter wheat reveals a major resis-tance QTL in the Lr34 chromosomal region. Theor. Appl. Genet.108: 477–484.
Semagn, K., A. Bjornstad, H. Skinnes, A. G. Marøy, Y. Tarkegne
et al., 2006 Distribution of DArT, AFLP and SSR markers in agenetic linkage map of a double haploid hexaploid wheat pop-ulation. Genome 49: 545–555.
Singh, R. P., 1993 Genetic association of gene Bdv1 for tolerance tobarley yellow dwarf virus with genes Lr34 and Yr18 for adult plantresistance to rusts in bread wheat. Plant Dis. 77: 1103–1106.
Singh, R. P., and A. K. Gupta, 1991 Genes for leaf rust resistance inIndian and Pakistani wheats tested with Mexican pathotypes ofPuccinia recondita f.sp. tritici. Euphytica 57: 27–36.
Singh, R. P., and R. A. McIntosh, 1984 Complementary genes forreaction to Puccinia recondita tritici in Triticum aestivum. II. Cytoge-netic studies. Can. J. Genet. Cytol. 26: 736–742.
Singh, R. P., and S. Rajaram, 1991 Resistance to Puccinia recondita f.sp.tritici in 50 Mexican bread wheat cultivars. Crop Sci. 31: 1472–1479.
Singh, R. P., J. Huerta-Espino, S. Rajaram and J. Crossa, 1998 Ag-ronomic effects from chromosome translocations 7DL.7Ag and1Bl.1RS in spring wheat. Crop Sci. 38: 27–33.
Singh, R. P., J. C. Nelson and M. E. Sorrells, 2000 Mapping Yr28and other genes for resistance to stripe rust in wheat. Crop Sci.40: 1148–1155.
Singh, R. P., J. Huerta-Espino and H. M. William, 2005 Geneticsand breeding for durable resistance to leaf and stripe rusts inwheat. Turk. J. Agric. For. 29: 121–127.
Snape, J., M. Foulkes, J. Simmonds, M. Leverington, L. Fish et al.,2007 Dissecting gene 3 environmental effects on wheat yieldsvia QTL and physiological analysis. Euphytica 154: 401–408.
Smith, A., B. R. Cullis and R. Thompson, 2002 Exploring variety-environment data using random effects models with adjustmentfor spatial field trends: part 1. Theory, pp.323–335 in QuantitativeGenetics, Genomics and Plant Breeding, edited by M. S. Kang. CAB,Wallingford, UK.
Sorrells, M. E., 2007 Application of new knowledge, technologies,and strategies to wheat improvement. Euphytica 157: 299–306.
Spielmeyer, W., P. J. Sharp and E. S. Lagudah, 2003 Identificationand validation of markers linked to a broad-spectrum stem rustresistance gene Sr2 in wheat (Triticum aestivum L.). Crop Sci. 43:333–336.
Spielmeyer, W., R. A. McIntosh, J. Kolmer and E. S. Lagudah,2005 Powdery mildew resistance and Lr34/Yr18 genes for dura-ble resistance to leaf and stripe rust cosegregate at a locus on theshort arm of chromosome 7D of wheat. Theor. Appl. Genet. 111:731–735.
Suenaga, K., R. P. Singh, J. Huerta-Espino and H. M. William,2003 Microsatellite markers for Lr34/Yr18 and other quantita-tive trait loci for leaf rust and stripe rust in bread wheat. Phyto-pathology 93: 881–890.
Thornsberry, J. M., M. M. Goodman, J. Doebley, S. Kresovich, D.Nielson et al., 2001 Dwarf8 polymorphisms associate with vari-ation in flowering time. Nat. Genet. 28: 286–289.
Trethowan, R., M. P. Reynolds, I. Ortiz-Monasterio and R. Ortiz,2007 The genetic basis of the Green Revolution in wheat produc-tion. Plant Breed. Rev. 28: 39–58.
Van Beem, J., V. Mohler, R. Lukman, M. Van Ginkel, M. William
et al., 2005 Analysis of genetic factors influencing the develop-mental rate of globally important CIMMYT wheat cultivars. CropSci. 45: 2113–2119.
van Eeuwijk, F. A., J. B. Denis and M. S. Kang, 1996 Incorporatingadditional information on genotypes and environments inmodels for two-way genotype by environment tables, pp.15–49 in Genotype-by-Environment Interaction: New Perspectives,edited by M. S. Kang and H. G. Gauch. CRC Press, BocaRaton, FL.
Verma, V. A., M. J. Foulkes, A. J. Worland, R. Sylvester-Bradley,P. D. S. Caligari et al., 2004 Mapping quantitative trait loci forflag leaf senescence as a yield determinant in winter wheat underoptimal and drought-stressed environments. Euphytica 135: 255–263.
Villareal, R. L., S. Rajaram, A. Mujeeb-Kazi and E. Del Toro,1991 The effect of chromosome 1B/1R translocation on theyield potential of certain spring wheats (Triticum aestivum L.).Plant Breed. 106: 77–81.
William, H. M., D. Hoisington, R. P. Singh and D. Gonzalez-de-Leon, 1997 Detection of quantitative trait loci associatedwith leaf rust resistance in bread wheat. Genome 40: 253–260.
William, H. M, R. P. Singh, J. Huerta-Espino, S. Ortiz Islas and D.Hoisington, 2003 Molecular marker mapping of leaf rust re-sistance Lr46 and its association with stripe rust resistance Yr29in wheat. Phytopathology 93: 153–159.
William, H. M., R. P. Singh, J. Huerta-Espino, G. Palacios and K.Suenaga, 2006 Characterization of genetic loci conferring adultplantresistanceto leaf rust andstriperust in springwheat.Genome49: 977–990.
Worland, A. J., 1996 The influence of flowering time genes on en-vironmental adaptability in European wheats. Euphytica 89:49–57.
Worland, A. J., A. Borner, V. Korzun, W. M. Li, S. Petrovic et al.,1998 The influence of photoperiod genes on the adaptabilityon European winter wheats. Euphytica 100: 385–394.
Worland, A. J., E. J. Sayers and V. Korzun, 2001 Allelic variation atthe dwarfing gene Rht8 locus and its significance in internationalbreeding programmes. Euphytica 119: 155–159.
Yan, L., A. Loukoainov, G. Tranquilli, M. Helguera, M. Hahima
et al., 2003 Positional cloning of the wheat vernalization geneVRN1. Proc. Natl. Acad. Sci. USA 100: 6263–6268.
Yu, J., G. Pressoir, W. H. Briggs, I. Vroh Bi, M. Yamasaki et al.,2006 A unified mixed-model method for association mappingthat counts for multiple level of relatedness. Nat. Genet. 28(2):203–208.
Xu, X., G. Bai, B. F. Carver, G. E. Shaner and R. M. Hunger,2005 Molecular characterization of slow leaf-rusting resistancein wheat. Crop Sci. 45: 758–765.
Zhu, Z. D., R. H. Zhou, X. Y. Kong, Y. C. Dong and J. Z. Jia,2005 Microsatellite markers linked to 2 powdery mildew resis-tance genes introgressed from Triticum carthlicum accession PS5into common wheat. Genome 48: 585–590.
Communicating editor: J. B. Walsh
Association Analysis of Historical Wheat 1913