Phenotypic diversity in cold-tolerant peanut ( Arachis hypogaea L.) germplasm
13
Phenotypic diversity in cold-tolerant peanut (Arachis hypogaea L.) germplasm H. D. Upadhyaya L. J. Reddy S. L. Dwivedi C. L. L. Gowda S. Singh Received: 19 August 2007 / Accepted: 7 August 2008 / Published online: 2 September 2008 Ó The Author(s) 2008. This article is published with open access at Springerlink.com Abstract Tolerance to low temperature is an important prerequisite for optimal performance of peanut (Arachis hypogaea L.) in a number of temperate peanut-growing environments. One hun- dred fifty-eight peanut accessions belonging to five botanical types, known to be tolerant to low temper- ature (12°C) at germination, were evaluated for phenotypic diversity for 15 morphological traits in the 2001 rainy season and for 15 agronomic and two seed quality traits in the 2001 rainy and 2001/2002 post-rainy seasons. Analysis of data, using the residual maximum-likelihood approach indicated that variance components due to genotypes were signif- icant for all traits in the rainy and for all but two traits in the post-rainy season. Clustering based on scores of nine principle components delineated four clusters. The cold-tolerant genotypes and the standard control cultivars in the four clusters differed in mean, variance, and range both during rainy and post-rainy seasons for a range of agronomic traits, indicating the diversity among the clusters. The cold-tolerant accessions were superior to control cultivars for several agronomic traits compared with their respec- tive controls in both the rainy and post-rainy seasons, so their use in breeding should result in genetically diverse cold-tolerant high-yielding peanut cultivars. Keywords Groundnut Á Cold tolerance Á Genetic diversity Á Principal component analysis Introduction Peanut (Arachis hypogaea L.), also known as groundnut, is an important tropical legume grown for both oil production and human food, as it provides a good source of energy, protein, minerals, and vitamins. Peanut production environments are char- acterized by a warm, frost-free period of at least 90 days (Bunting et al. 1985), with mean tempera- tures between 24°C and 33°C, which is the optimum range for growth and dry-matter production (Ketring 1984). The peanut plant shows maximum growth at 28°C but experiences severe metabolic perturbations below 12°C (Bell et al. 1994a). Low temperature results in slow growth of both hypocotyl/radicle and epicotyl (Ketring et al. 1982). Night temperature determines both leaflet CO 2 exchange rate, regardless of day temperature, and the efficiency of use of intercepted photosynthetically active radiation (Sin- clair et al. 1993; Bell et al. 1994b). Low soil temperature delays pod initiation, and reduces num- ber of mature pods/seeds, and seed weight (Golombok and Johanson 1997). H. D. Upadhyaya (&) Á L. J. Reddy Á S. L. Dwivedi Á C. L. L. Gowda Á S. Singh International Crops Research Institute for the Semi-Arid Tropics (ICRISAT), Patancheru 502324, India e-mail: [email protected] 123 Euphytica (2009) 165:279–291 DOI 10.1007/s10681-008-9786-2
-
Upload
independent -
Category
Documents
-
view
2 -
download
0
Transcript of Phenotypic diversity in cold-tolerant peanut ( Arachis hypogaea L.) germplasm
Phenotypic diversity in cold-tolerant peanut(Arachis hypogaea L.) germplasm
H. D. Upadhyaya Æ L. J. Reddy Æ S. L. Dwivedi ÆC. L. L. Gowda Æ S. Singh
Received: 19 August 2007 / Accepted: 7 August 2008 / Published online: 2 September 2008
� The Author(s) 2008. This article is published with open access at Springerlink.com
Abstract Tolerance to low temperature is an
important prerequisite for optimal performance of
peanut (Arachis hypogaea L.) in a number of
temperate peanut-growing environments. One hun-
dred fifty-eight peanut accessions belonging to five
botanical types, known to be tolerant to low temper-
ature (12�C) at germination, were evaluated for
phenotypic diversity for 15 morphological traits in
the 2001 rainy season and for 15 agronomic and two
seed quality traits in the 2001 rainy and 2001/2002
post-rainy seasons. Analysis of data, using the
residual maximum-likelihood approach indicated that
variance components due to genotypes were signif-
icant for all traits in the rainy and for all but two traits
in the post-rainy season. Clustering based on scores
of nine principle components delineated four clusters.
The cold-tolerant genotypes and the standard control
cultivars in the four clusters differed in mean,
variance, and range both during rainy and post-rainy
seasons for a range of agronomic traits, indicating the
diversity among the clusters. The cold-tolerant
accessions were superior to control cultivars for
several agronomic traits compared with their respec-
tive controls in both the rainy and post-rainy seasons,
so their use in breeding should result in genetically
diverse cold-tolerant high-yielding peanut cultivars.
Keywords Groundnut � Cold tolerance �Genetic diversity � Principal component analysis
Introduction
Peanut (Arachis hypogaea L.), also known as
groundnut, is an important tropical legume grown
for both oil production and human food, as it provides
a good source of energy, protein, minerals, and
vitamins. Peanut production environments are char-
acterized by a warm, frost-free period of at least
90 days (Bunting et al. 1985), with mean tempera-
tures between 24�C and 33�C, which is the optimum
range for growth and dry-matter production (Ketring
1984). The peanut plant shows maximum growth at
28�C but experiences severe metabolic perturbations
below 12�C (Bell et al. 1994a). Low temperature
results in slow growth of both hypocotyl/radicle and
epicotyl (Ketring et al. 1982). Night temperature
determines both leaflet CO2 exchange rate, regardless
of day temperature, and the efficiency of use of
intercepted photosynthetically active radiation (Sin-
clair et al. 1993; Bell et al. 1994b). Low soil
temperature delays pod initiation, and reduces num-
ber of mature pods/seeds, and seed weight
(Golombok and Johanson 1997).
H. D. Upadhyaya (&) � L. J. Reddy �S. L. Dwivedi � C. L. L. Gowda � S. Singh
International Crops Research Institute for the Semi-Arid
Tropics (ICRISAT), Patancheru 502324, India
e-mail: [email protected]
123
Euphytica (2009) 165:279–291
DOI 10.1007/s10681-008-9786-2
The importance of cold tolerance in peanut is well
recognized for specific production environments in
North America (Benedict and Ketring 1972; Single-
ton and Pattee 1989; Bell et al. 1994a), Australia
(Bell et al. 1991), India (Bhagat et al. 1992), and
China (Fu et al. 1988). A few cold-tolerant early-
maturing cultivars with ability to germinate in cooler
soils have been released in Canada (Agriculture
Canada 1984, 1989). The low temperatures (\18�C)
at sowing in the winter peanut crop in India result in
slow seedling emergence and poor plant stand. Delay
in seedling emergence extends crop duration beyond
120 days, exposing the crop to high temperatures at
reproductive phase and pod damage due to early
onset of monsoon rains (Bhagat et al. 1988). Poor
germination due to low temperatures in spring-sown
peanut crop has also been reported in China, Nepal,
and Vietnam (Fu et al. 1988; Koirala 1996; Dan and
Hong 1996). Identification and incorporation of cold
tolerance are therefore important peanut breeding
objectives in these countries.
Upadhyaya et al. (2001) screened 1,704 peanut
core collection accessions (Upadhyaya et al. 2003)
and four control cultivars (Gangapuri, M13, ICGS 44,
and ICGS 76), using rolled paper towel testing (Ellis
et al. 1985) for ability to germinate in an incubator
set at 12�C day-night temperature. Seeds of hypogaea
and hirsuta were treated with ethrel (2-chloroethyl-
phosphonic acid) to break seed dormancy prior to
cold-tolerant test. A sufficient quantity of distilled
water was added to the tray so as to keep wet the 3–
4 cm of paper rolls. The number of germinating seeds
was recorded at 10 (fastigiata, vulgaris, aequatori-
ana, and peruviana types) and 15 (hypogaea and
hirsuta types) days after incubation. The hypogaea
types that showed less than 70% germination were
retested, with the seed stored for at least 6 months, to
avoid discrepancies that could arise due to seed
dormancy. This experiment was repeated with the
same number of entries during the 2000/2001 post-
rainy season. In both seasons, accessions that showed
80% or higher germination for one seed source but
not less than 70% from either seed source were
considered tolerant to low temperature at germina-
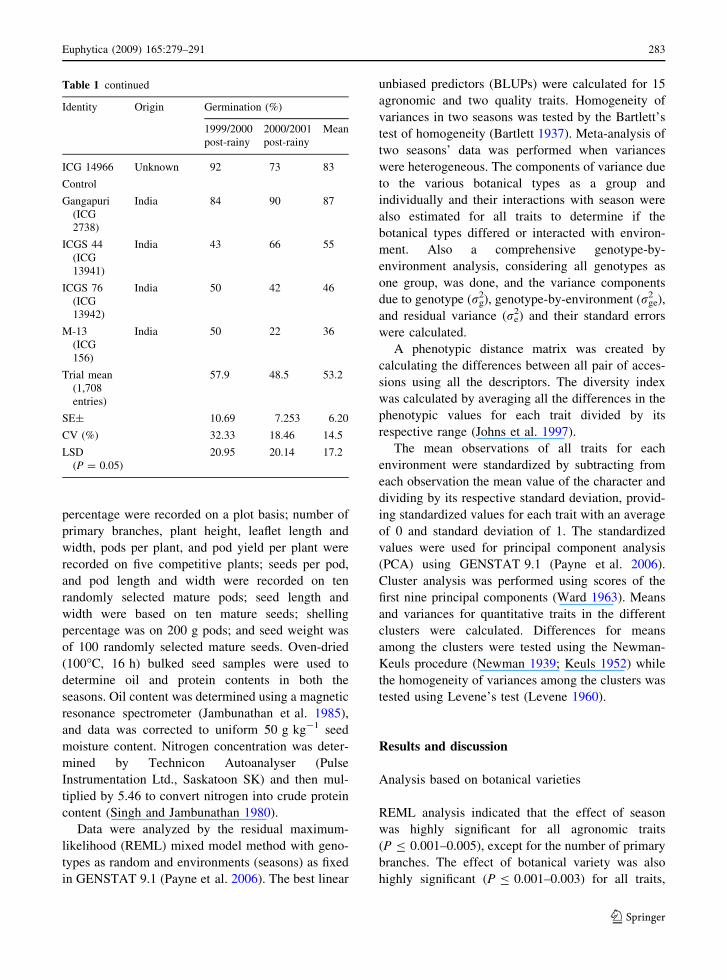
tion. Based on two seasons’ evaluation, 158 peanut
core collection accessions were identified as tolerant
to low temperature (12�C), on the basis of 80% or
higher germination for the best seed source and not
less than 70% from the second source. Mean
percentage seed germination in cold-tolerant entries
ranged from 76% to 96%, compared with 36% to
55% in controls (M13, ICGS 44, and ICGS 76); the
fourth control, Gangapuri, had 87% germination at
12�C (Table 1).
The present study was done to characterize
phenotypic diversity for morphological and agro-
nomic traits in the 158 cold-tolerant germplasm to
identify genetically diverse accessions for use in
peanut breeding to improve cold tolerance at
germination.
Materials and methods
One hundred fifty-eight cold-tolerant peanut acces-
sions, representing five botanical types (4
aequatoriana, 103 fastigiata, 11 peruviana, 5 vulga-
ris, and 35 hypogaea) and four released Indian
control cultivars (Gangapuri, M13, ICGS 44, and
ICGS 76) were evaluated for 15 morphological traits
in field plantings in the 2001 rainy season and for 15
agronomic and two seed quality traits in the 2001/
2002 post-rainy season at ICRISAT, Patancheru,
India. Gangapuri (ICG 2738) belongs to subsp.
fastigiata var. fastigiata (Valencia type) and matures
in about 100 days. ICGS 44 (ICG 13941) belongs to
subsp. fastigiata var. vulgaris (Spanish type), matures
in about 120 days, and is adapted to the irrigated
post-rainy season. Both M13 (ICG 156) and ICGS 76
(ICG 13942) belong to subsp. hypogaea var. hypo-
gaea (Virginia type), mature in 120–135 days, and
are adapted to rainy season conditions.
The experiment was conducted in an alpha design
(Paterson and Williams 1976) with two replications
in the rainy season and three replications in post-
rainy season. Each accession was sown in a one row
plot of 4 m length, with 60 cm between rows and
10 cm between plants in both the seasons. Morpho-
logical descriptors used included growth habit,
branching pattern, stem color, stem hair, leaflet color,
leaflet shape, leaflet hair, flower color, streak color on
flower, peg color, seeds per pod, pod beak, pod
constriction, pod reticulation, and primary seed color
(IBPGR and ICRISAT 1992). Ten mature pods were
randomly selected to record data on pod beak,
constriction, and reticulation. Days to emergence,
days to 50% flowering, pod yield per plot, pod length
and width, seed length and width, and shelling
280 Euphytica (2009) 165:279–291
123
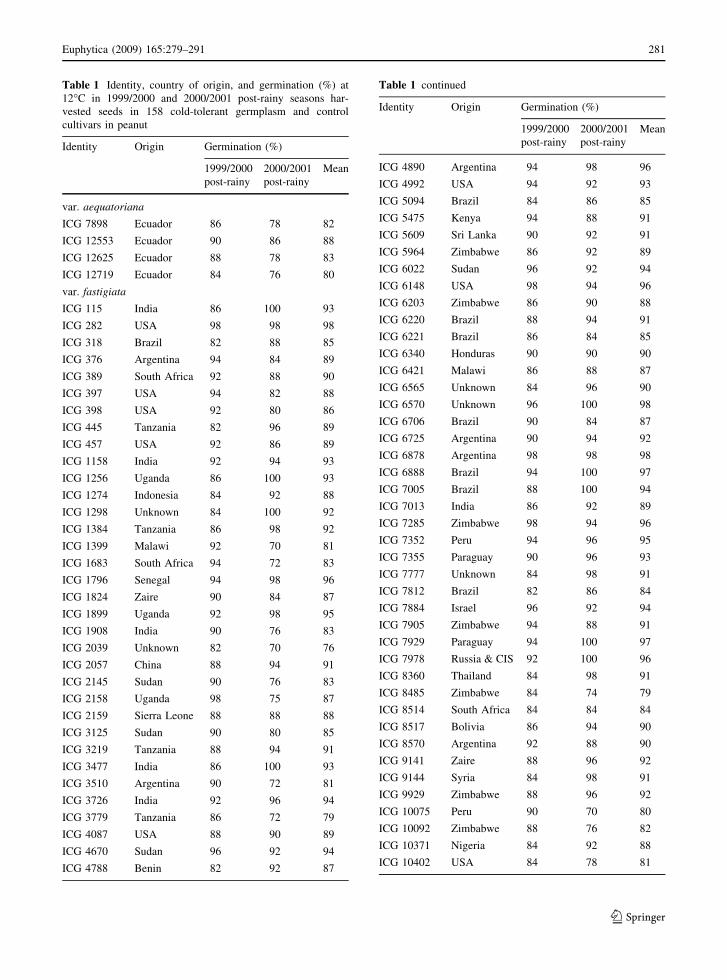
Table 1 Identity, country of origin, and germination (%) at
12�C in 1999/2000 and 2000/2001 post-rainy seasons har-
vested seeds in 158 cold-tolerant germplasm and control
cultivars in peanut
Identity Origin Germination (%)
1999/2000
post-rainy
2000/2001
post-rainy
Mean
var. aequatoriana
ICG 7898 Ecuador 86 78 82
ICG 12553 Ecuador 90 86 88
ICG 12625 Ecuador 88 78 83
ICG 12719 Ecuador 84 76 80
var. fastigiata
ICG 115 India 86 100 93
ICG 282 USA 98 98 98
ICG 318 Brazil 82 88 85
ICG 376 Argentina 94 84 89
ICG 389 South Africa 92 88 90
ICG 397 USA 94 82 88
ICG 398 USA 92 80 86
ICG 445 Tanzania 82 96 89
ICG 457 USA 92 86 89
ICG 1158 India 92 94 93
ICG 1256 Uganda 86 100 93
ICG 1274 Indonesia 84 92 88
ICG 1298 Unknown 84 100 92
ICG 1384 Tanzania 86 98 92
ICG 1399 Malawi 92 70 81
ICG 1683 South Africa 94 72 83
ICG 1796 Senegal 94 98 96
ICG 1824 Zaire 90 84 87
ICG 1899 Uganda 92 98 95
ICG 1908 India 90 76 83
ICG 2039 Unknown 82 70 76
ICG 2057 China 88 94 91
ICG 2145 Sudan 90 76 83
ICG 2158 Uganda 98 75 87
ICG 2159 Sierra Leone 88 88 88
ICG 3125 Sudan 90 80 85
ICG 3219 Tanzania 88 94 91
ICG 3477 India 86 100 93
ICG 3510 Argentina 90 72 81
ICG 3726 India 92 96 94
ICG 3779 Tanzania 86 72 79
ICG 4087 USA 88 90 89
ICG 4670 Sudan 96 92 94
ICG 4788 Benin 82 92 87
Table 1 continued
Identity Origin Germination (%)
1999/2000
post-rainy
2000/2001
post-rainy
Mean
ICG 4890 Argentina 94 98 96
ICG 4992 USA 94 92 93
ICG 5094 Brazil 84 86 85
ICG 5475 Kenya 94 88 91
ICG 5609 Sri Lanka 90 92 91
ICG 5964 Zimbabwe 86 92 89
ICG 6022 Sudan 96 92 94
ICG 6148 USA 98 94 96
ICG 6203 Zimbabwe 86 90 88
ICG 6220 Brazil 88 94 91
ICG 6221 Brazil 86 84 85
ICG 6340 Honduras 90 90 90
ICG 6421 Malawi 86 88 87
ICG 6565 Unknown 84 96 90
ICG 6570 Unknown 96 100 98
ICG 6706 Brazil 90 84 87
ICG 6725 Argentina 90 94 92
ICG 6878 Argentina 98 98 98
ICG 6888 Brazil 94 100 97
ICG 7005 Brazil 88 100 94
ICG 7013 India 86 92 89
ICG 7285 Zimbabwe 98 94 96
ICG 7352 Peru 94 96 95
ICG 7355 Paraguay 90 96 93
ICG 7777 Unknown 84 98 91
ICG 7812 Brazil 82 86 84
ICG 7884 Israel 96 92 94
ICG 7905 Zimbabwe 94 88 91
ICG 7929 Paraguay 94 100 97
ICG 7978 Russia & CIS 92 100 96
ICG 8360 Thailand 84 98 91
ICG 8485 Zimbabwe 84 74 79
ICG 8514 South Africa 84 84 84
ICG 8517 Bolivia 86 94 90
ICG 8570 Argentina 92 88 90
ICG 9141 Zaire 88 96 92
ICG 9144 Syria 84 98 91
ICG 9929 Zimbabwe 88 96 92
ICG 10075 Peru 90 70 80
ICG 10092 Zimbabwe 88 76 82
ICG 10371 Nigeria 84 92 88
ICG 10402 USA 84 78 81
Euphytica (2009) 165:279–291 281
123
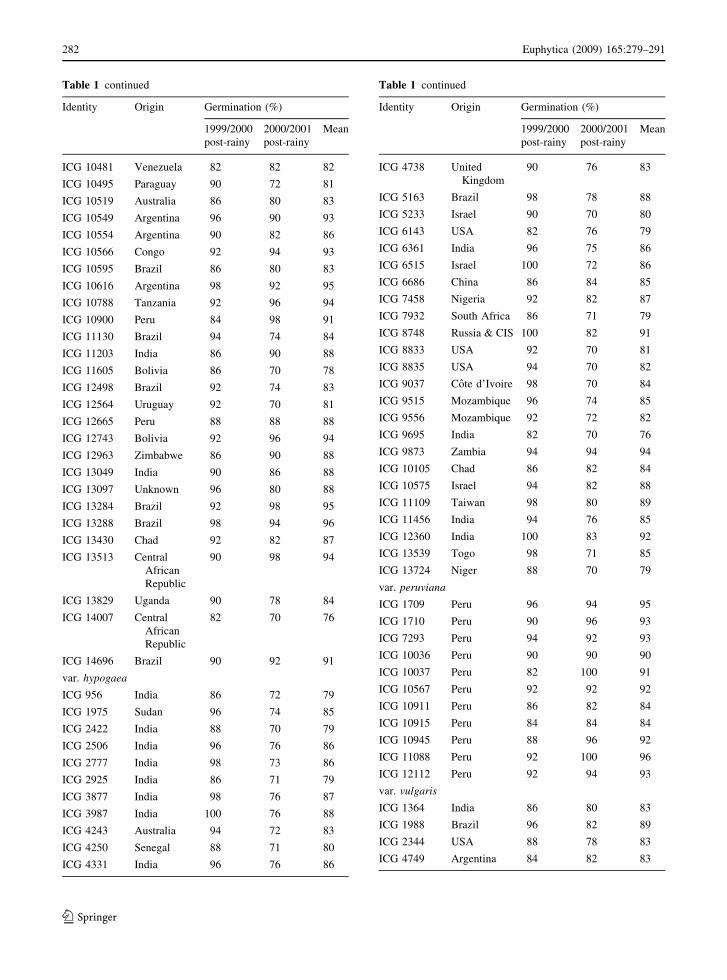
Table 1 continued
Identity Origin Germination (%)
1999/2000
post-rainy
2000/2001
post-rainy
Mean
ICG 10481 Venezuela 82 82 82
ICG 10495 Paraguay 90 72 81
ICG 10519 Australia 86 80 83
ICG 10549 Argentina 96 90 93
ICG 10554 Argentina 90 82 86
ICG 10566 Congo 92 94 93
ICG 10595 Brazil 86 80 83
ICG 10616 Argentina 98 92 95
ICG 10788 Tanzania 92 96 94
ICG 10900 Peru 84 98 91
ICG 11130 Brazil 94 74 84
ICG 11203 India 86 90 88
ICG 11605 Bolivia 86 70 78
ICG 12498 Brazil 92 74 83
ICG 12564 Uruguay 92 70 81
ICG 12665 Peru 88 88 88
ICG 12743 Bolivia 92 96 94
ICG 12963 Zimbabwe 86 90 88
ICG 13049 India 90 86 88
ICG 13097 Unknown 96 80 88
ICG 13284 Brazil 92 98 95
ICG 13288 Brazil 98 94 96
ICG 13430 Chad 92 82 87
ICG 13513 Central
African
Republic
90 98 94
ICG 13829 Uganda 90 78 84
ICG 14007 Central
African
Republic
82 70 76
ICG 14696 Brazil 90 92 91
var. hypogaea
ICG 956 India 86 72 79
ICG 1975 Sudan 96 74 85
ICG 2422 India 88 70 79
ICG 2506 India 96 76 86
ICG 2777 India 98 73 86
ICG 2925 India 86 71 79
ICG 3877 India 98 76 87
ICG 3987 India 100 76 88
ICG 4243 Australia 94 72 83
ICG 4250 Senegal 88 71 80
ICG 4331 India 96 76 86
Table 1 continued
Identity Origin Germination (%)
1999/2000
post-rainy
2000/2001
post-rainy
Mean
ICG 4738 United
Kingdom
90 76 83
ICG 5163 Brazil 98 78 88
ICG 5233 Israel 90 70 80
ICG 6143 USA 82 76 79
ICG 6361 India 96 75 86
ICG 6515 Israel 100 72 86
ICG 6686 China 86 84 85
ICG 7458 Nigeria 92 82 87
ICG 7932 South Africa 86 71 79
ICG 8748 Russia & CIS 100 82 91
ICG 8833 USA 92 70 81
ICG 8835 USA 94 70 82
ICG 9037 Cote d’Ivoire 98 70 84
ICG 9515 Mozambique 96 74 85
ICG 9556 Mozambique 92 72 82
ICG 9695 India 82 70 76
ICG 9873 Zambia 94 94 94
ICG 10105 Chad 86 82 84
ICG 10575 Israel 94 82 88
ICG 11109 Taiwan 98 80 89
ICG 11456 India 94 76 85
ICG 12360 India 100 83 92
ICG 13539 Togo 98 71 85
ICG 13724 Niger 88 70 79
var. peruviana
ICG 1709 Peru 96 94 95
ICG 1710 Peru 90 96 93
ICG 7293 Peru 94 92 93
ICG 10036 Peru 90 90 90
ICG 10037 Peru 82 100 91
ICG 10567 Peru 92 92 92
ICG 10911 Peru 86 82 84
ICG 10915 Peru 84 84 84
ICG 10945 Peru 88 96 92
ICG 11088 Peru 92 100 96
ICG 12112 Peru 92 94 93
var. vulgaris
ICG 1364 India 86 80 83
ICG 1988 Brazil 96 82 89
ICG 2344 USA 88 78 83
ICG 4749 Argentina 84 82 83
282 Euphytica (2009) 165:279–291
123
percentage were recorded on a plot basis; number of
primary branches, plant height, leaflet length and
width, pods per plant, and pod yield per plant were
recorded on five competitive plants; seeds per pod,
and pod length and width were recorded on ten
randomly selected mature pods; seed length and
width were based on ten mature seeds; shelling
percentage was on 200 g pods; and seed weight was
of 100 randomly selected mature seeds. Oven-dried
(100�C, 16 h) bulked seed samples were used to
determine oil and protein contents in both the
seasons. Oil content was determined using a magnetic
resonance spectrometer (Jambunathan et al. 1985),
and data was corrected to uniform 50 g kg-1 seed
moisture content. Nitrogen concentration was deter-
mined by Technicon Autoanalyser (Pulse
Instrumentation Ltd., Saskatoon SK) and then mul-
tiplied by 5.46 to convert nitrogen into crude protein
content (Singh and Jambunathan 1980).
Data were analyzed by the residual maximum-
likelihood (REML) mixed model method with geno-
types as random and environments (seasons) as fixed
in GENSTAT 9.1 (Payne et al. 2006). The best linear
unbiased predictors (BLUPs) were calculated for 15
agronomic and two quality traits. Homogeneity of
variances in two seasons was tested by the Bartlett’s
test of homogeneity (Bartlett 1937). Meta-analysis of
two seasons’ data was performed when variances
were heterogeneous. The components of variance due
to the various botanical types as a group and
individually and their interactions with season were
also estimated for all traits to determine if the
botanical types differed or interacted with environ-
ment. Also a comprehensive genotype-by-
environment analysis, considering all genotypes as
one group, was done, and the variance components
due to genotype (rg2), genotype-by-environment (rge
2 ),
and residual variance (re2) and their standard errors
were calculated.
A phenotypic distance matrix was created by
calculating the differences between all pair of acces-
sions using all the descriptors. The diversity index
was calculated by averaging all the differences in the
phenotypic values for each trait divided by its
respective range (Johns et al. 1997).
The mean observations of all traits for each
environment were standardized by subtracting from
each observation the mean value of the character and
dividing by its respective standard deviation, provid-
ing standardized values for each trait with an average
of 0 and standard deviation of 1. The standardized
values were used for principal component analysis
(PCA) using GENSTAT 9.1 (Payne et al. 2006).
Cluster analysis was performed using scores of the
first nine principal components (Ward 1963). Means
and variances for quantitative traits in the different
clusters were calculated. Differences for means
among the clusters were tested using the Newman-
Keuls procedure (Newman 1939; Keuls 1952) while
the homogeneity of variances among the clusters was
tested using Levene’s test (Levene 1960).
Results and discussion
Analysis based on botanical varieties
REML analysis indicated that the effect of season
was highly significant for all agronomic traits
(P B 0.001–0.005), except for the number of primary
branches. The effect of botanical variety was also
highly significant (P B 0.001–0.003) for all traits,
Table 1 continued
Identity Origin Germination (%)
1999/2000
post-rainy
2000/2001
post-rainy
Mean
ICG 14966 Unknown 92 73 83
Control
Gangapuri
(ICG
2738)
India 84 90 87
ICGS 44
(ICG
13941)
India 43 66 55
ICGS 76
(ICG
13942)
India 50 42 46
M-13
(ICG
156)
India 50 22 36
Trial mean
(1,708
entries)
57.9 48.5 53.2
SE± 10.69 7.253 6.20
CV (%) 32.33 18.46 14.5
LSD
(P = 0.05)
20.95 20.14 17.2
Euphytica (2009) 165:279–291 283
123
except pod and seed width, and 100-seed weight. The
season 9 botanical variety interaction was significant
for nine traits (P B 0.001–0.035), and nonsignificant
for six traits (days to flowering, plant height, pod
width, seed length, shelling percentage, and seed
weight). In the 2001 rainy season, the effect of
botanical variety was significant for five traits (leaf
and pod length, seed width, plot yield, and shelling
percentage) while in the 2001/2002 post-rainy season
botanical variety was significant for all traits except
for pod and seed width, shelling percentage, and seed
weight (data not sown).
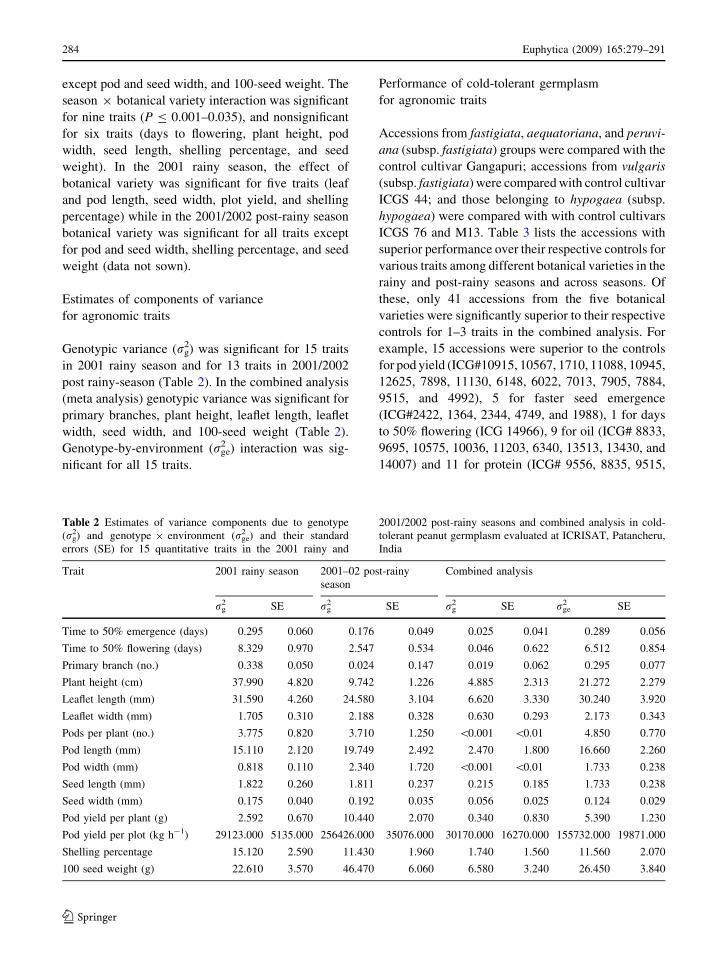
Estimates of components of variance
for agronomic traits
Genotypic variance (rg2) was significant for 15 traits
in 2001 rainy season and for 13 traits in 2001/2002
post rainy-season (Table 2). In the combined analysis
(meta analysis) genotypic variance was significant for
primary branches, plant height, leaflet length, leaflet
width, seed width, and 100-seed weight (Table 2).
Genotype-by-environment (rge2 ) interaction was sig-
nificant for all 15 traits.
Performance of cold-tolerant germplasm
for agronomic traits
Accessions from fastigiata, aequatoriana, and peruvi-
ana (subsp. fastigiata) groups were compared with the
control cultivar Gangapuri; accessions from vulgaris
(subsp. fastigiata) were compared with control cultivar
ICGS 44; and those belonging to hypogaea (subsp.
hypogaea) were compared with with control cultivars
ICGS 76 and M13. Table 3 lists the accessions with
superior performance over their respective controls for
various traits among different botanical varieties in the
rainy and post-rainy seasons and across seasons. Of
these, only 41 accessions from the five botanical
varieties were significantly superior to their respective
controls for 1–3 traits in the combined analysis. For
example, 15 accessions were superior to the controls
for pod yield (ICG#10915, 10567, 1710, 11088, 10945,
12625, 7898, 11130, 6148, 6022, 7013, 7905, 7884,
9515, and 4992), 5 for faster seed emergence
(ICG#2422, 1364, 2344, 4749, and 1988), 1 for days
to 50% flowering (ICG 14966), 9 for oil (ICG# 8833,
9695, 10575, 10036, 11203, 6340, 13513, 13430, and
14007) and 11 for protein (ICG# 9556, 8835, 9515,
Table 2 Estimates of variance components due to genotype
(rg2) and genotype 9 environment (rge
2 ) and their standard
errors (SE) for 15 quantitative traits in the 2001 rainy and
2001/2002 post-rainy seasons and combined analysis in cold-
tolerant peanut germplasm evaluated at ICRISAT, Patancheru,
India
Trait 2001 rainy season 2001–02 post-rainy
season
Combined analysis
rg2 SE rg
2 SE rg2 SE rge
2 SE
Time to 50% emergence (days) 0.295 0.060 0.176 0.049 0.025 0.041 0.289 0.056
Time to 50% flowering (days) 8.329 0.970 2.547 0.534 0.046 0.622 6.512 0.854
Primary branch (no.) 0.338 0.050 0.024 0.147 0.019 0.062 0.295 0.077
Plant height (cm) 37.990 4.820 9.742 1.226 4.885 2.313 21.272 2.279
Leaflet length (mm) 31.590 4.260 24.580 3.104 6.620 3.330 30.240 3.920
Leaflet width (mm) 1.705 0.310 2.188 0.328 0.630 0.293 2.173 0.343
Pods per plant (no.) 3.775 0.820 3.710 1.250 \0.001 \0.01 4.850 0.770
Pod length (mm) 15.110 2.120 19.749 2.492 2.470 1.800 16.660 2.260
Pod width (mm) 0.818 0.110 2.340 1.720 \0.001 \0.01 1.733 0.238
Seed length (mm) 1.822 0.260 1.811 0.237 0.215 0.185 1.733 0.238
Seed width (mm) 0.175 0.040 0.192 0.035 0.056 0.025 0.124 0.029
Pod yield per plant (g) 2.592 0.670 10.440 2.070 0.340 0.830 5.390 1.230
Pod yield per plot (kg h-1) 29123.000 5135.000 256426.000 35076.000 30170.000 16270.000 155732.000 19871.000
Shelling percentage 15.120 2.590 11.430 1.960 1.740 1.560 11.560 2.070
100 seed weight (g) 22.610 3.570 46.470 6.060 6.580 3.240 26.450 3.840
284 Euphytica (2009) 165:279–291
123
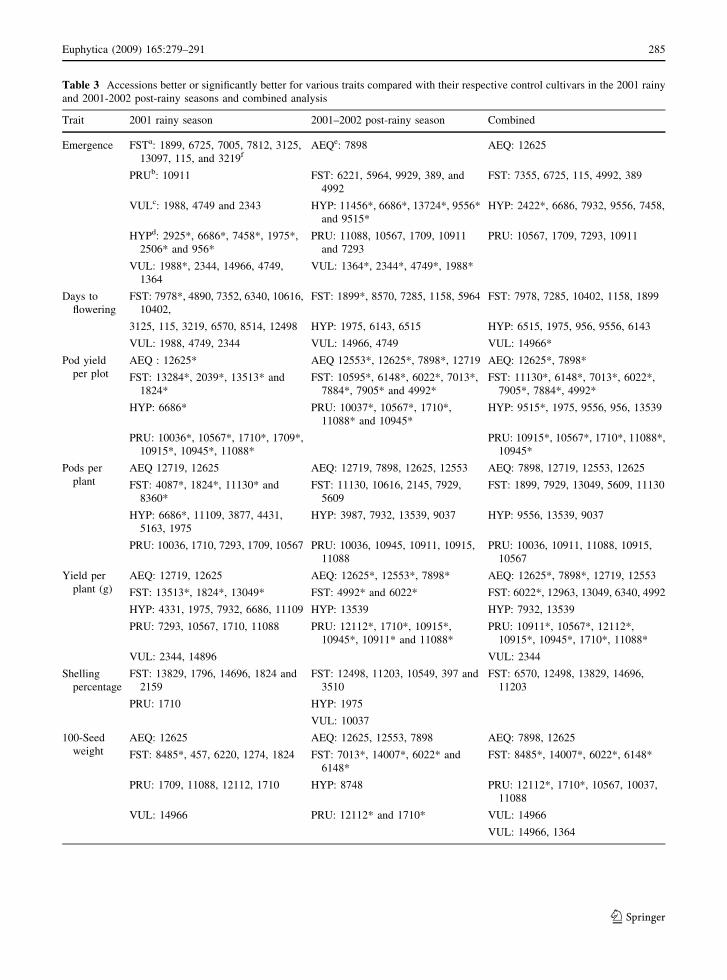
Table 3 Accessions better or significantly better for various traits compared with their respective control cultivars in the 2001 rainy
and 2001-2002 post-rainy seasons and combined analysis
Trait 2001 rainy season 2001–2002 post-rainy season Combined
Emergence FSTa: 1899, 6725, 7005, 7812, 3125,
13097, 115, and 3219fAEQe: 7898 AEQ: 12625
PRUb: 10911 FST: 6221, 5964, 9929, 389, and
4992
FST: 7355, 6725, 115, 4992, 389
VULc: 1988, 4749 and 2343 HYP: 11456*, 6686*, 13724*, 9556*
and 9515*
HYP: 2422*, 6686, 7932, 9556, 7458,
HYPd: 2925*, 6686*, 7458*, 1975*,
2506* and 956*
PRU: 11088, 10567, 1709, 10911
and 7293
PRU: 10567, 1709, 7293, 10911
VUL: 1988*, 2344, 14966, 4749,
1364
VUL: 1364*, 2344*, 4749*, 1988*
Days to
flowering
FST: 7978*, 4890, 7352, 6340, 10616,
10402,
FST: 1899*, 8570, 7285, 1158, 5964 FST: 7978, 7285, 10402, 1158, 1899
3125, 115, 3219, 6570, 8514, 12498 HYP: 1975, 6143, 6515 HYP: 6515, 1975, 956, 9556, 6143
VUL: 1988, 4749, 2344 VUL: 14966, 4749 VUL: 14966*
Pod yield
per plot
AEQ : 12625* AEQ 12553*, 12625*, 7898*, 12719 AEQ: 12625*, 7898*
FST: 13284*, 2039*, 13513* and
1824*
FST: 10595*, 6148*, 6022*, 7013*,
7884*, 7905* and 4992*
FST: 11130*, 6148*, 7013*, 6022*,
7905*, 7884*, 4992*
HYP: 6686* PRU: 10037*, 10567*, 1710*,
11088* and 10945*
HYP: 9515*, 1975, 9556, 956, 13539
PRU: 10036*, 10567*, 1710*, 1709*,
10915*, 10945*, 11088*
PRU: 10915*, 10567*, 1710*, 11088*,
10945*
Pods per
plant
AEQ 12719, 12625 AEQ: 12719, 7898, 12625, 12553 AEQ: 7898, 12719, 12553, 12625
FST: 4087*, 1824*, 11130* and
8360*
FST: 11130, 10616, 2145, 7929,
5609
FST: 1899, 7929, 13049, 5609, 11130
HYP: 6686*, 11109, 3877, 4431,
5163, 1975
HYP: 3987, 7932, 13539, 9037 HYP: 9556, 13539, 9037
PRU: 10036, 1710, 7293, 1709, 10567 PRU: 10036, 10945, 10911, 10915,
11088
PRU: 10036, 10911, 11088, 10915,
10567
Yield per
plant (g)
AEQ: 12719, 12625 AEQ: 12625*, 12553*, 7898* AEQ: 12625*, 7898*, 12719, 12553
FST: 13513*, 1824*, 13049* FST: 4992* and 6022* FST: 6022*, 12963, 13049, 6340, 4992
HYP: 4331, 1975, 7932, 6686, 11109 HYP: 13539 HYP: 7932, 13539
PRU: 7293, 10567, 1710, 11088 PRU: 12112*, 1710*, 10915*,
10945*, 10911* and 11088*
PRU: 10911*, 10567*, 12112*,
10915*, 10945*, 1710*, 11088*
VUL: 2344, 14896 VUL: 2344
Shelling
percentage
FST: 13829, 1796, 14696, 1824 and
2159
FST: 12498, 11203, 10549, 397 and
3510
FST: 6570, 12498, 13829, 14696,
11203
PRU: 1710 HYP: 1975
VUL: 10037
100-Seed
weight
AEQ: 12625 AEQ: 12625, 12553, 7898 AEQ: 7898, 12625
FST: 8485*, 457, 6220, 1274, 1824 FST: 7013*, 14007*, 6022* and
6148*
FST: 8485*, 14007*, 6022*, 6148*
PRU: 1709, 11088, 12112, 1710 HYP: 8748 PRU: 12112*, 1710*, 10567, 10037,
11088
VUL: 14966 PRU: 12112* and 1710* VUL: 14966
VUL: 14966, 1364
Euphytica (2009) 165:279–291 285
123
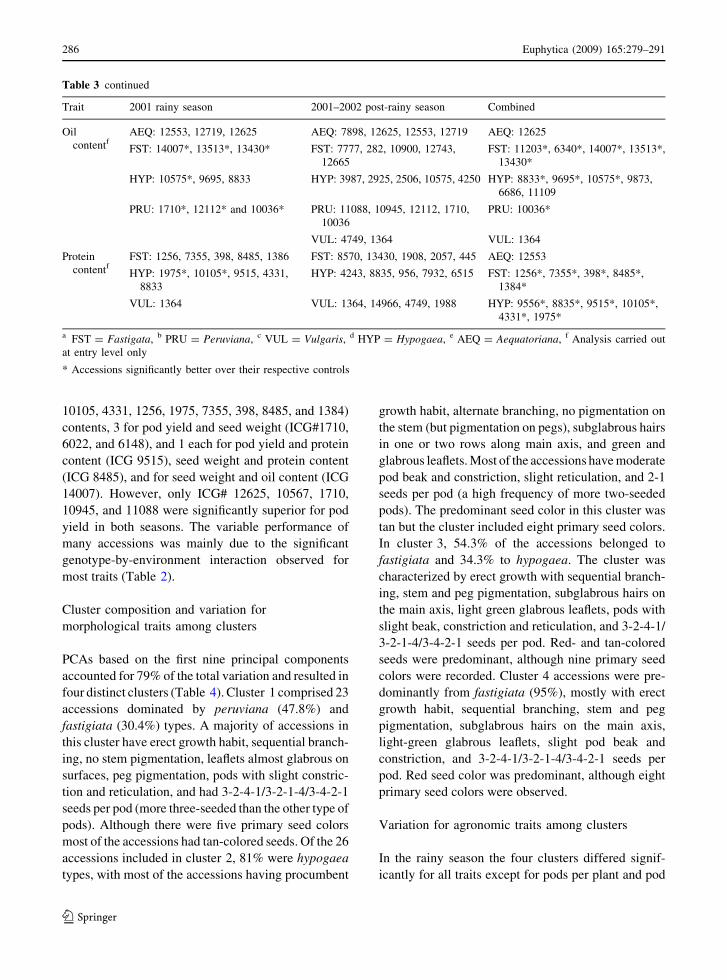
10105, 4331, 1256, 1975, 7355, 398, 8485, and 1384)
contents, 3 for pod yield and seed weight (ICG#1710,
6022, and 6148), and 1 each for pod yield and protein
content (ICG 9515), seed weight and protein content
(ICG 8485), and for seed weight and oil content (ICG
14007). However, only ICG# 12625, 10567, 1710,
10945, and 11088 were significantly superior for pod
yield in both seasons. The variable performance of
many accessions was mainly due to the significant
genotype-by-environment interaction observed for
most traits (Table 2).
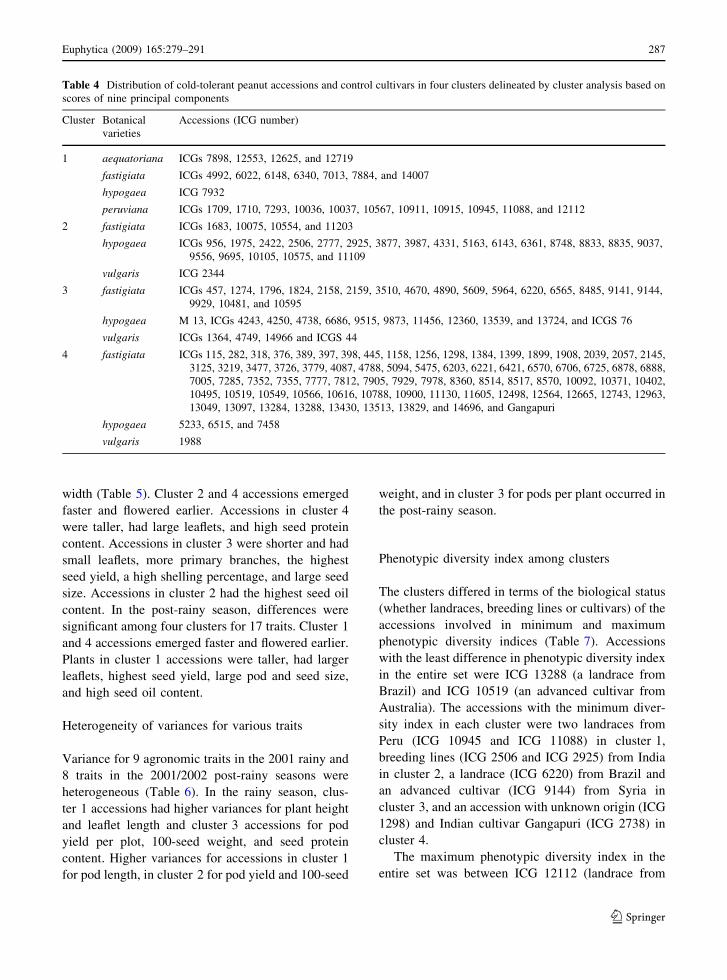
Cluster composition and variation for
morphological traits among clusters
PCAs based on the first nine principal components
accounted for 79% of the total variation and resulted in
four distinct clusters (Table 4). Cluster 1 comprised 23
accessions dominated by peruviana (47.8%) and
fastigiata (30.4%) types. A majority of accessions in
this cluster have erect growth habit, sequential branch-
ing, no stem pigmentation, leaflets almost glabrous on
surfaces, peg pigmentation, pods with slight constric-
tion and reticulation, and had 3-2-4-1/3-2-1-4/3-4-2-1
seeds per pod (more three-seeded than the other type of
pods). Although there were five primary seed colors
most of the accessions had tan-colored seeds. Of the 26
accessions included in cluster 2, 81% were hypogaea
types, with most of the accessions having procumbent
growth habit, alternate branching, no pigmentation on
the stem (but pigmentation on pegs), subglabrous hairs
in one or two rows along main axis, and green and
glabrous leaflets. Most of the accessions have moderate
pod beak and constriction, slight reticulation, and 2-1
seeds per pod (a high frequency of more two-seeded
pods). The predominant seed color in this cluster was
tan but the cluster included eight primary seed colors.
In cluster 3, 54.3% of the accessions belonged to
fastigiata and 34.3% to hypogaea. The cluster was
characterized by erect growth with sequential branch-
ing, stem and peg pigmentation, subglabrous hairs on
the main axis, light green glabrous leaflets, pods with
slight beak, constriction and reticulation, and 3-2-4-1/
3-2-1-4/3-4-2-1 seeds per pod. Red- and tan-colored
seeds were predominant, although nine primary seed
colors were recorded. Cluster 4 accessions were pre-
dominantly from fastigiata (95%), mostly with erect
growth habit, sequential branching, stem and peg
pigmentation, subglabrous hairs on the main axis,
light-green glabrous leaflets, slight pod beak and
constriction, and 3-2-4-1/3-2-1-4/3-4-2-1 seeds per
pod. Red seed color was predominant, although eight
primary seed colors were observed.
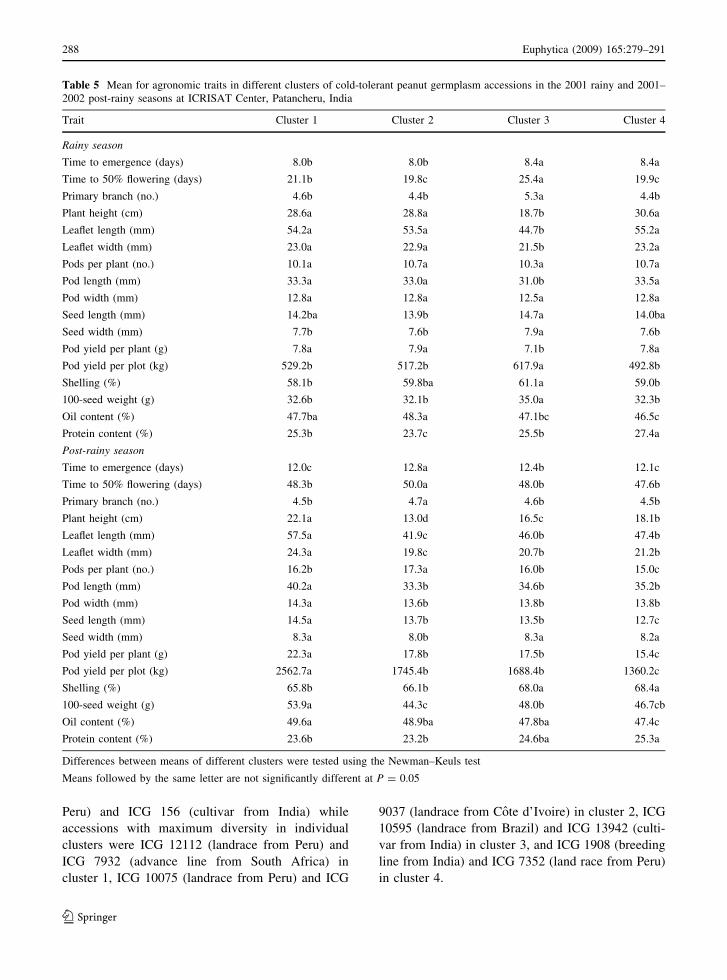
Variation for agronomic traits among clusters
In the rainy season the four clusters differed signif-
icantly for all traits except for pods per plant and pod
Table 3 continued
Trait 2001 rainy season 2001–2002 post-rainy season Combined
Oil
contentfAEQ: 12553, 12719, 12625 AEQ: 7898, 12625, 12553, 12719 AEQ: 12625
FST: 14007*, 13513*, 13430* FST: 7777, 282, 10900, 12743,
12665
FST: 11203*, 6340*, 14007*, 13513*,
13430*
HYP: 10575*, 9695, 8833 HYP: 3987, 2925, 2506, 10575, 4250 HYP: 8833*, 9695*, 10575*, 9873,
6686, 11109
PRU: 1710*, 12112* and 10036* PRU: 11088, 10945, 12112, 1710,
10036
PRU: 10036*
VUL: 4749, 1364 VUL: 1364
Protein
contentfFST: 1256, 7355, 398, 8485, 1386 FST: 8570, 13430, 1908, 2057, 445 AEQ: 12553
HYP: 1975*, 10105*, 9515, 4331,
8833
HYP: 4243, 8835, 956, 7932, 6515 FST: 1256*, 7355*, 398*, 8485*,
1384*
VUL: 1364 VUL: 1364, 14966, 4749, 1988 HYP: 9556*, 8835*, 9515*, 10105*,
4331*, 1975*
a FST = Fastigata, b PRU = Peruviana, c VUL = Vulgaris, d HYP = Hypogaea, e AEQ = Aequatoriana, f Analysis carried out
at entry level only
* Accessions significantly better over their respective controls
286 Euphytica (2009) 165:279–291
123
width (Table 5). Cluster 2 and 4 accessions emerged
faster and flowered earlier. Accessions in cluster 4
were taller, had large leaflets, and high seed protein
content. Accessions in cluster 3 were shorter and had
small leaflets, more primary branches, the highest
seed yield, a high shelling percentage, and large seed
size. Accessions in cluster 2 had the highest seed oil
content. In the post-rainy season, differences were
significant among four clusters for 17 traits. Cluster 1
and 4 accessions emerged faster and flowered earlier.
Plants in cluster 1 accessions were taller, had larger
leaflets, highest seed yield, large pod and seed size,
and high seed oil content.
Heterogeneity of variances for various traits
Variance for 9 agronomic traits in the 2001 rainy and
8 traits in the 2001/2002 post-rainy seasons were
heterogeneous (Table 6). In the rainy season, clus-
ter 1 accessions had higher variances for plant height
and leaflet length and cluster 3 accessions for pod
yield per plot, 100-seed weight, and seed protein
content. Higher variances for accessions in cluster 1
for pod length, in cluster 2 for pod yield and 100-seed
weight, and in cluster 3 for pods per plant occurred in
the post-rainy season.
Phenotypic diversity index among clusters
The clusters differed in terms of the biological status
(whether landraces, breeding lines or cultivars) of the
accessions involved in minimum and maximum
phenotypic diversity indices (Table 7). Accessions
with the least difference in phenotypic diversity index
in the entire set were ICG 13288 (a landrace from
Brazil) and ICG 10519 (an advanced cultivar from
Australia). The accessions with the minimum diver-
sity index in each cluster were two landraces from
Peru (ICG 10945 and ICG 11088) in cluster 1,
breeding lines (ICG 2506 and ICG 2925) from India
in cluster 2, a landrace (ICG 6220) from Brazil and
an advanced cultivar (ICG 9144) from Syria in
cluster 3, and an accession with unknown origin (ICG
1298) and Indian cultivar Gangapuri (ICG 2738) in
cluster 4.
The maximum phenotypic diversity index in the
entire set was between ICG 12112 (landrace from
Table 4 Distribution of cold-tolerant peanut accessions and control cultivars in four clusters delineated by cluster analysis based on
scores of nine principal components
Cluster Botanical
varieties
Accessions (ICG number)
1 aequatoriana ICGs 7898, 12553, 12625, and 12719
fastigiata ICGs 4992, 6022, 6148, 6340, 7013, 7884, and 14007
hypogaea ICG 7932
peruviana ICGs 1709, 1710, 7293, 10036, 10037, 10567, 10911, 10915, 10945, 11088, and 12112
2 fastigiata ICGs 1683, 10075, 10554, and 11203
hypogaea ICGs 956, 1975, 2422, 2506, 2777, 2925, 3877, 3987, 4331, 5163, 6143, 6361, 8748, 8833, 8835, 9037,
9556, 9695, 10105, 10575, and 11109
vulgaris ICG 2344
3 fastigiata ICGs 457, 1274, 1796, 1824, 2158, 2159, 3510, 4670, 4890, 5609, 5964, 6220, 6565, 8485, 9141, 9144,
9929, 10481, and 10595
hypogaea M 13, ICGs 4243, 4250, 4738, 6686, 9515, 9873, 11456, 12360, 13539, and 13724, and ICGS 76
vulgaris ICGs 1364, 4749, 14966 and ICGS 44
4 fastigiata ICGs 115, 282, 318, 376, 389, 397, 398, 445, 1158, 1256, 1298, 1384, 1399, 1899, 1908, 2039, 2057, 2145,
3125, 3219, 3477, 3726, 3779, 4087, 4788, 5094, 5475, 6203, 6221, 6421, 6570, 6706, 6725, 6878, 6888,
7005, 7285, 7352, 7355, 7777, 7812, 7905, 7929, 7978, 8360, 8514, 8517, 8570, 10092, 10371, 10402,
10495, 10519, 10549, 10566, 10616, 10788, 10900, 11130, 11605, 12498, 12564, 12665, 12743, 12963,
13049, 13097, 13284, 13288, 13430, 13513, 13829, and 14696, and Gangapuri
hypogaea 5233, 6515, and 7458
vulgaris 1988
Euphytica (2009) 165:279–291 287
123
Peru) and ICG 156 (cultivar from India) while
accessions with maximum diversity in individual
clusters were ICG 12112 (landrace from Peru) and
ICG 7932 (advance line from South Africa) in
cluster 1, ICG 10075 (landrace from Peru) and ICG
9037 (landrace from Cote d’Ivoire) in cluster 2, ICG
10595 (landrace from Brazil) and ICG 13942 (culti-
var from India) in cluster 3, and ICG 1908 (breeding
line from India) and ICG 7352 (land race from Peru)
in cluster 4.
Table 5 Mean for agronomic traits in different clusters of cold-tolerant peanut germplasm accessions in the 2001 rainy and 2001–
2002 post-rainy seasons at ICRISAT Center, Patancheru, India
Trait Cluster 1 Cluster 2 Cluster 3 Cluster 4
Rainy season
Time to emergence (days) 8.0b 8.0b 8.4a 8.4a
Time to 50% flowering (days) 21.1b 19.8c 25.4a 19.9c
Primary branch (no.) 4.6b 4.4b 5.3a 4.4b
Plant height (cm) 28.6a 28.8a 18.7b 30.6a
Leaflet length (mm) 54.2a 53.5a 44.7b 55.2a
Leaflet width (mm) 23.0a 22.9a 21.5b 23.2a
Pods per plant (no.) 10.1a 10.7a 10.3a 10.7a
Pod length (mm) 33.3a 33.0a 31.0b 33.5a
Pod width (mm) 12.8a 12.8a 12.5a 12.8a
Seed length (mm) 14.2ba 13.9b 14.7a 14.0ba
Seed width (mm) 7.7b 7.6b 7.9a 7.6b
Pod yield per plant (g) 7.8a 7.9a 7.1b 7.8a
Pod yield per plot (kg) 529.2b 517.2b 617.9a 492.8b
Shelling (%) 58.1b 59.8ba 61.1a 59.0b
100-seed weight (g) 32.6b 32.1b 35.0a 32.3b
Oil content (%) 47.7ba 48.3a 47.1bc 46.5c
Protein content (%) 25.3b 23.7c 25.5b 27.4a
Post-rainy season
Time to emergence (days) 12.0c 12.8a 12.4b 12.1c
Time to 50% flowering (days) 48.3b 50.0a 48.0b 47.6b
Primary branch (no.) 4.5b 4.7a 4.6b 4.5b
Plant height (cm) 22.1a 13.0d 16.5c 18.1b
Leaflet length (mm) 57.5a 41.9c 46.0b 47.4b
Leaflet width (mm) 24.3a 19.8c 20.7b 21.2b
Pods per plant (no.) 16.2b 17.3a 16.0b 15.0c
Pod length (mm) 40.2a 33.3b 34.6b 35.2b
Pod width (mm) 14.3a 13.6b 13.8b 13.8b
Seed length (mm) 14.5a 13.7b 13.5b 12.7c
Seed width (mm) 8.3a 8.0b 8.3a 8.2a
Pod yield per plant (g) 22.3a 17.8b 17.5b 15.4c
Pod yield per plot (kg) 2562.7a 1745.4b 1688.4b 1360.2c
Shelling (%) 65.8b 66.1b 68.0a 68.4a
100-seed weight (g) 53.9a 44.3c 48.0b 46.7cb
Oil content (%) 49.6a 48.9ba 47.8ba 47.4c
Protein content (%) 23.6b 23.2b 24.6ba 25.3a
Differences between means of different clusters were tested using the Newman–Keuls test
Means followed by the same letter are not significantly different at P = 0.05
288 Euphytica (2009) 165:279–291
123
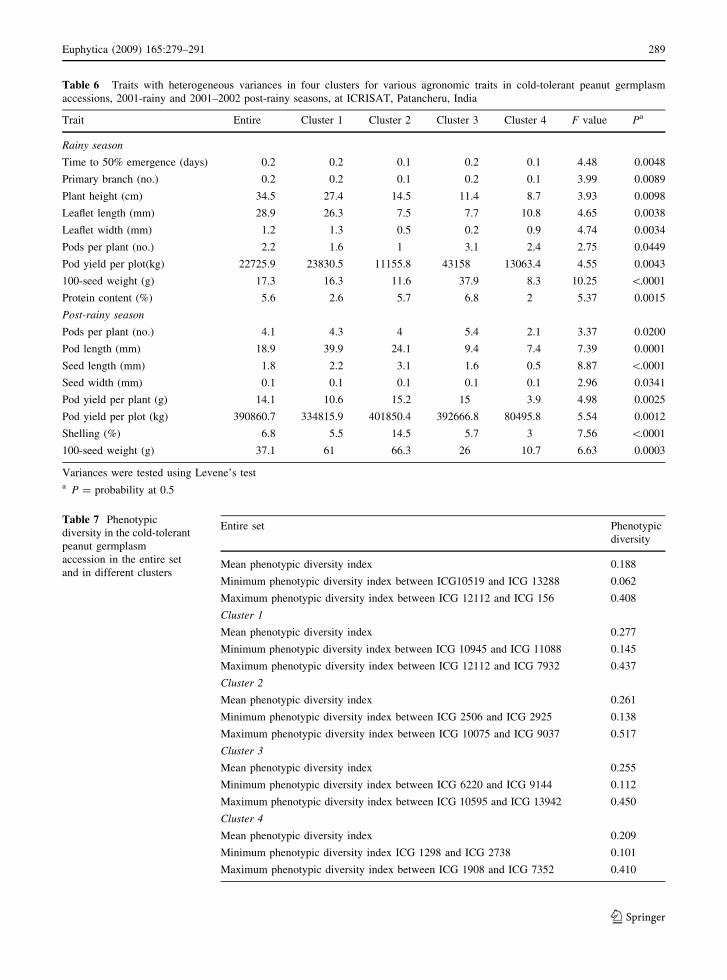
Table 6 Traits with heterogeneous variances in four clusters for various agronomic traits in cold-tolerant peanut germplasm
accessions, 2001-rainy and 2001–2002 post-rainy seasons, at ICRISAT, Patancheru, India
Trait Entire Cluster 1 Cluster 2 Cluster 3 Cluster 4 F value Pa
Rainy season
Time to 50% emergence (days) 0.2 0.2 0.1 0.2 0.1 4.48 0.0048
Primary branch (no.) 0.2 0.2 0.1 0.2 0.1 3.99 0.0089
Plant height (cm) 34.5 27.4 14.5 11.4 8.7 3.93 0.0098
Leaflet length (mm) 28.9 26.3 7.5 7.7 10.8 4.65 0.0038
Leaflet width (mm) 1.2 1.3 0.5 0.2 0.9 4.74 0.0034
Pods per plant (no.) 2.2 1.6 1 3.1 2.4 2.75 0.0449
Pod yield per plot(kg) 22725.9 23830.5 11155.8 43158 13063.4 4.55 0.0043
100-seed weight (g) 17.3 16.3 11.6 37.9 8.3 10.25 \.0001
Protein content (%) 5.6 2.6 5.7 6.8 2 5.37 0.0015
Post-rainy season
Pods per plant (no.) 4.1 4.3 4 5.4 2.1 3.37 0.0200
Pod length (mm) 18.9 39.9 24.1 9.4 7.4 7.39 0.0001
Seed length (mm) 1.8 2.2 3.1 1.6 0.5 8.87 \.0001
Seed width (mm) 0.1 0.1 0.1 0.1 0.1 2.96 0.0341
Pod yield per plant (g) 14.1 10.6 15.2 15 3.9 4.98 0.0025
Pod yield per plot (kg) 390860.7 334815.9 401850.4 392666.8 80495.8 5.54 0.0012
Shelling (%) 6.8 5.5 14.5 5.7 3 7.56 \.0001
100-seed weight (g) 37.1 61 66.3 26 10.7 6.63 0.0003
Variances were tested using Levene’s testa P = probability at 0.5
Table 7 Phenotypic
diversity in the cold-tolerant
peanut germplasm
accession in the entire set
and in different clusters
Entire set Phenotypic
diversity
Mean phenotypic diversity index 0.188
Minimum phenotypic diversity index between ICG10519 and ICG 13288 0.062
Maximum phenotypic diversity index between ICG 12112 and ICG 156 0.408
Cluster 1
Mean phenotypic diversity index 0.277
Minimum phenotypic diversity index between ICG 10945 and ICG 11088 0.145
Maximum phenotypic diversity index between ICG 12112 and ICG 7932 0.437
Cluster 2
Mean phenotypic diversity index 0.261
Minimum phenotypic diversity index between ICG 2506 and ICG 2925 0.138
Maximum phenotypic diversity index between ICG 10075 and ICG 9037 0.517
Cluster 3
Mean phenotypic diversity index 0.255
Minimum phenotypic diversity index between ICG 6220 and ICG 9144 0.112
Maximum phenotypic diversity index between ICG 10595 and ICG 13942 0.450
Cluster 4
Mean phenotypic diversity index 0.209
Minimum phenotypic diversity index ICG 1298 and ICG 2738 0.101
Maximum phenotypic diversity index between ICG 1908 and ICG 7352 0.410
Euphytica (2009) 165:279–291 289
123
Botanical varieties and cold tolerance
Differences for chilling injury among botanical types
of peanut have been reported. Sellschop and Salmon
(1928) found Valencia and Spanish types highly
sensitive while Virginia bunch type had exceptional
hardiness. Bell et al. (1991) reported a positive asso-
ciation between rate of emergence and mean daily
temperature (17.8–23.2�C) in 16 peanut cultivars,
indicating that air temperatures were always lower than
those required for good germination. They however
reported no significant differences (P \ 0.05) in
coefficients of temperature sensitivity either between
cultivars of the same botanical type or between dif-
ferent botanical types. All cultivars used in their study
had similar base temperature (Tb) values for emergence
(13.2�C). However, we found differences between
accessions (irrespective of botanical type) in terms of
their cold tolerance at emergence under lower temper-
atures (12�C) under laboratory conditions (Upadhyaya
et al. 2001), indicating that cold-tolerant accessions
identified in this study captured greater diversity for
base-temperature tolerance at germination.
The cold-tolerant accessions reported in this study
had substantial diversity for most agronomic traits
and thus should be good sources to use in breeding
programs for developing peanut cultivar that germi-
nate at lower temperatures. It will also be interesting
to study the reaction of these cold-tolerant accessions
at various growth stages at which peanut is vulnerable
to cold injury. Some of the identified accessions have
good agronomic potential, and hence their use in
breeding programs will not adversely affect exploi-
tation of additive genetic variance in a self-pollinated
crop such as peanut.
Open Access This article is distributed under the terms of the
Creative Commons Attribution Noncommercial License which
permits any noncommercial use, distribution, and reproduction
in any medium, provided the original author(s) and source are
credited.
References
Agriculture Canada (1984) Modified description of variety.
Peanut (Arachis hypogaea L.), variety OAC Garroy.
Licensed no. 2439
Agriculture Canada (1989) Description of variety. Peanut
(Arachis hypogaea, L.), variety OAC Ruby. Registration
no. 1–82. Agriculture Canada, Ottawa
Bartlett MS (1937) Some examples of statistical methods of
research in agriculture and applied biology. J R Stat Soc
4:137–170
Bell MJ, Shorter R, Mayer R (1991) Cultivar and environ-
mental effects on growth and development of peanuts
(Arachis hypogaea L). 1. Emergence and flowering. Field
Crops Res 27:17–33
Bell MJ, Roy RC, Tollenaar M, Michaels TE (1994a) Impor-
tance of variation in chilling tolerance for peanut
genotypic adaptation to cool short-season environments.
Crop Sci 34:1030–1039
Bell MJ, Gillespie TJ, Roy RC, Michaels TE, Tollenaar M
(1994b) Peanut leaf photosynthetic activity in cool field
environments. Crop Sci 34:1023–1029
Benedict CR, Ketring DL (1972) Nuclear gene affecting
greening in virescent peanut leaves. Plant Physiol 49:974–
976
Bhagat NR, Ahmad T, Lalwani HB, Patra GJ, Acharya D
(1988) Screening of bunch peanut (Arachis hypogaea L.
ssp. fastigiata) germplasm for cold tolerance in India.
Trop Agric (Trinidad) 65:109–112
Bhagat NR, Dayal D, Acharya D (1992) Performance of
Spanish peanuts during winter- summer season at two
locations in India. Trop Agric (Trinidad) 69:93–95
Bunting AH, Gibbons RW, Wynne JC (1985) Peanut (Arachishypogaea L.). In: Summerfield RJ, Roberts EH (eds)
Grain legume crops. Collins, London, pp 747–800
Dan NT, Hong NX (1996) Collaborative research in Vietnam:
needs and opportunities. In Gowda CLL, Ramakrishna A
(eds) Summary proceedings of CLAN country coordina-
tors’ steering committee meeting, 4–6 Dec. 1995,
ICRISAT Patancheru, India, pp 56–58
Ellis RS, Hong TD, Roberts EH (1985) The conduct of seed
germination tests. Handbook of seed technology for
genebanks. Vol. 1. Principles and methodology. IBPGR
Rome, Italy, pp 94–198
Fu JR, Lu XH, Chen RZ, Zang BZ, Liu ZS, Lee ZS, Cai DY
(1988) Osmoconditioning of peanut (Arachis hypogaeaL.) seeds with PEG to improve vigour and some bio-
chemical activities. Seed Sci Technol (Switzerland)
16:197–212
Golombok SD, Johanson C (1997) Effect of soil temperature
on vegetative and reproductive growth and development
in three Spanish genotypes of peanut (Arachis hypogaea).
Peanut Sci 24:67–72
IBPGR and ICRISAT (1992) Descriptors for groundnut.
International Board for Plant Genetic Resources, Rome,
Italy; International Crops Research Institute for the Semi-
Arid Tropics, Patancheru, India, 125 pp
Jambunathan R, Raju SM, Barde P (1985) Analysis of oil
contents of groundnut by nuclear magnetic resonance
spectrometry. J Sci Food Agric 36:162–166
Johns MA, Skroach PW, Nienhuis J, Hinrichsen P, Bascur G,
Munoz-Schick C (1997) Gene pool classification of
common bean landraces from Chile based on RAPD and
morphological data. Crop Sci 37:605–613
Ketring DL (1984) Temperature effects on vegetative and
reproductive development of peanut. Crop Sci 24:877–
882
Ketring DL, Brown RH, Sullivan GA, Johnson BB (1982)
Growth physiology. In: Pattee HE, Young CT (eds)
290 Euphytica (2009) 165:279–291
123
Peanut science and technology. Yoakum, Texas, pp 411–
457
Keuls M (1952) The use of the ‘Studentized range’ in con-
nection with an analysis of variance. Euphytica 1:112–122
Koirala GP (1996) Collaborative research in Nepal: Needs and
opportunities. In Gowda CLL, Ramakrishna A (eds)
Summary proceedings of CLAN country coordinators’
Steering committee meeting, ICRISAT, Patancheru, India,
pp 39–43
Levene H (1960) Robust tests for equality of variances. In:
Olkin I (ed) Contributions to probability and statistics:
essays in honour of Harold Hotelling. Stanford University
Press, Stanford, pp 278–292
Newman D (1939) The distribution of range in samples from a
normal population expressed in terms of an independent
estimate of standard deviation. Biometrika 31:20–30
Paterson HD, Williams ER (1976) A new class of resolvable
incomplete block designs. Biometrika 63:395–400
Payne RW, Harding SA, Murray DA, Soutar DM, Baird DB,
Welham SJ, Kane AF, Gilmour AR, Thompson R, Web-
ster R, Wilson GT (2006) The guide to Genstat release 9,
Part 2: statistics. VSN International, Hemel Hempstead
Sellschop JPF, Salmon SC (1928) The influence of chilling
above the freezing point on certain crop plants. J Agric
Res 37:315–338
Sinclair TR, Bennett JM, Boote KJ (1993) Leaf nitrogen
content, photosynthesis and radiation use efficiency in
peanut. Peanut Sci 20:40–43
Singh U, Jambunathan R (1980) Evaluation of rapid method
for the estimation of protein content in chickpea (Cicerarietinum L.). J Sci Food Agric 31:247–254
Singleton JA, Pattee HE (1989) Effect of chilling injury on
windrowed peanuts. Peanut Sci 16:51–54
Upadhyaya HD, Nigam SN, Singh S (2001) Evaluation of
groundnut core collections to identify sources of tolerance
to low temperature at germination. Indian J Plant Genet
Resour 14:165–167
Upadhyaya HD, Ortiz R, Bramel PJ, Singh S (2003) Devel-
opment of a core collection using taxonomical,
geographical and morphological descriptors. Genetic Res
Crop Evol 50:139–148
Ward J (1963) Hierarchical grouping to optimize an objective
function. J Am Stat Assoc 38:236–244
Euphytica (2009) 165:279–291 291
123