Effector activity of peanut allergens: a critical role for Ara h 2, Ara h 6, and their variants
19
Effector Activity of Peanut Allergens: A critical role for Ara h 2, Ara h 6, and their variants HS Porterfield *,+ , KS Murray *,‡ , DG Schlichting *,+ , X. Chen *,+ , KC Hansen *,‡,° , MW Duncan *,‡, ° , and SC Dreskin *,+ * University of Colorado at Denver, Aurora, CO, USA + Department of Medicine ‡ Department of Pediatrics ° Proteomics Core, School of Medicine Abstract Rationale—An important property of allergens is their ability to cross-link IgE and activate mast cells and basophils. The effector activity of peanut allergens has not been well characterized. Methods—Crude extracts of fresh peanut flour were fractionated by gel filtration. Effector function was assayed by measuring degranulation of RBL SX-38 cells sensitized with IgE from individual sera and from pools of sera of peanut allergic donors. Results—Following gel filtration, 75±7% of the applied protein and 76±16% (n=3) of the applied activity (assayed with a pool of 11 sera) were recovered in the resultant fractions. The majority (85±2%; n=3) of the recovered activity resided in a fraction with a theoretical average molecular weight of ~20 kD and a range of 13–25 kD. When all the individual fractions were recombined, the measured activity was similar to that of the original extract (140±43% when measured with a pool of serum (n=2) and 66±7% when measured with individual sera (n=4)); when all individual fractions excluding the 20 kD fraction were recombined, the measured activity was only 8±2% (n=2) of the original extract when assayed with the serum pool and 10±4% (n=3) when assayed with the individual sera. Two dimensional gel electrophoresis of this biologically active fraction by revealed >60 protein spots . Analysis of 50 of the most prominent spots by matrix-assisted laser-desorption ionization time-of-flight mass spectrometry and of the full mixture by automated tandem mass spectrometry coupled to online capillary liquid chromatography revealed that greater than 97% of the protein mass consisted of Ara h 2.0101, Ara h 2.0201, Ara h 6 isoforms, and variants of these proteins. Conclusions—Ara h 2 and Ara h 6 account for the majority of the effector activity found in a crude peanut extract. Keywords Peanuts; mast cells; basophils; IgE; allergens Introduction Hypersensitivity to foods is now recognized as a worldwide problem [1]. Immediate hypersensitivity reactions to peanuts are unusual in that they are much more prevalent and Corresponding author: SC Dreskin, Division of Allergy and Clinical Immunology, Campus Box B164, 4200 E. Ninth Ave. Denver, CO 80262. Telephone: 303 315-6979. Fax 303 315-7642. E-mail address: [email protected]. NIH Public Access Author Manuscript Clin Exp Allergy. Author manuscript; available in PMC 2010 July 1. Published in final edited form as: Clin Exp Allergy. 2009 July ; 39(7): 1099–1108. doi:10.1111/j.1365-2222.2009.03273.x. NIH-PA Author Manuscript NIH-PA Author Manuscript NIH-PA Author Manuscript
Transcript of Effector activity of peanut allergens: a critical role for Ara h 2, Ara h 6, and their variants

Effector Activity of Peanut Allergens: A critical role for Ara h 2,Ara h 6, and their variants
HS Porterfield*,+, KS Murray*,‡, DG Schlichting*,+, X. Chen*,+, KC Hansen*,‡,°, MW Duncan*,‡,°, and SC Dreskin*,+
*University of Colorado at Denver, Aurora, CO, USA+Department of Medicine‡Department of Pediatrics°Proteomics Core, School of Medicine
AbstractRationale—An important property of allergens is their ability to cross-link IgE and activate mastcells and basophils. The effector activity of peanut allergens has not been well characterized.
Methods—Crude extracts of fresh peanut flour were fractionated by gel filtration. Effectorfunction was assayed by measuring degranulation of RBL SX-38 cells sensitized with IgE fromindividual sera and from pools of sera of peanut allergic donors.
Results—Following gel filtration, 75±7% of the applied protein and 76±16% (n=3) of theapplied activity (assayed with a pool of 11 sera) were recovered in the resultant fractions. Themajority (85±2%; n=3) of the recovered activity resided in a fraction with a theoretical averagemolecular weight of ~20 kD and a range of 13–25 kD. When all the individual fractions wererecombined, the measured activity was similar to that of the original extract (140±43% whenmeasured with a pool of serum (n=2) and 66±7% when measured with individual sera (n=4));when all individual fractions excluding the 20 kD fraction were recombined, the measured activitywas only 8±2% (n=2) of the original extract when assayed with the serum pool and 10±4% (n=3)when assayed with the individual sera. Two dimensional gel electrophoresis of this biologicallyactive fraction by revealed >60 protein spots . Analysis of 50 of the most prominent spots bymatrix-assisted laser-desorption ionization time-of-flight mass spectrometry and of the fullmixture by automated tandem mass spectrometry coupled to online capillary liquidchromatography revealed that greater than 97% of the protein mass consisted of Ara h 2.0101, Arah 2.0201, Ara h 6 isoforms, and variants of these proteins.
Conclusions—Ara h 2 and Ara h 6 account for the majority of the effector activity found in acrude peanut extract.
KeywordsPeanuts; mast cells; basophils; IgE; allergens
IntroductionHypersensitivity to foods is now recognized as a worldwide problem [1]. Immediatehypersensitivity reactions to peanuts are unusual in that they are much more prevalent and
Corresponding author: SC Dreskin, Division of Allergy and Clinical Immunology, Campus Box B164, 4200 E. Ninth Ave. Denver,CO 80262. Telephone: 303 315-6979. Fax 303 315-7642. E-mail address: [email protected].
NIH Public AccessAuthor ManuscriptClin Exp Allergy. Author manuscript; available in PMC 2010 July 1.
Published in final edited form as:Clin Exp Allergy. 2009 July ; 39(7): 1099–1108. doi:10.1111/j.1365-2222.2009.03273.x.
NIH
-PA Author Manuscript
NIH
-PA Author Manuscript
NIH
-PA Author Manuscript

severe than for other legumes and tend to persist into adulthood [2]. Substantial effort hasbeen made to identify the major peanut allergens in hopes of desensitization of patientsspecifically to these proteins, production of peanuts without allergenic activity, and thedevelopment of skin test reagents using recombinant proteins [3–14]. Nine potentiallyimportant allergens of peanut have so far been identified (Ara h 1 - Ara h 8 plus peanutoleosin) [15–20].
The term “major allergen” was originally used by Lowenstein to designate allergens thatcause sensitization in >50% of patients and was later redefined by Marsh et al. to includeonly allergens that elicit an IgE response in >90% of allergic patients [21–23]. Thecharacteristics now widely used to define a “major allergen” are based on those suggestedby the WHO/IUIS Allergen Nomenclature subcommittee in 1994 and include: 1) aprominent band seen with sera from most patients on IgE immunoblots of 1D gels, 2)activity in basophil histamine release (BHR) assays, 3) activity in competitive ELISAassays, and 4) activity in animal models [24]. Finally, 5) the contribution of the allergen tothe total potency of the extract should be demonstrated by depletion studies in which theputatively important allergen is specifically removed from the whole extract and the residualis demonstrated to have reduced activity [23,24]. This fifth criterion aims to address thequantitative contribution a single allergen to the total effector activity of a crude extract. Forexample, de Groot et al. demonstrated that treating a crude extract of cat dander with anti-Fel d 1 significantly diminished the effector activity of the extract as measured in a basophilhistamine release (BHR) assay [25]. Further, purified Fel d 1 contained enough effectoractivity to explain a substantial amount of the activity in the extract [25]. None of the knownpeanut allergens have so far satisfied this fifth criterion.
Ara h 1, Ara h 2, and Ara h 3 were identified as major peanut allergens based on the firstfour criteria but not the fifth [26–29]. Ara h 1 belongs to the vicilin (7S) family of seedstorage proteins. Monomers of 63 kD (seen on immunoblots) form stable 150 kD trimersand higher order multimers [30,31]. Ara h 2 belongs to the conglutin family of seed storageproteins and is related to the 2S albumin family [27]. The C-terminus of Ara h 2 has somehomology with non-specific lipid transfer proteins (nsLTPs) and with several other peanutproteins, specifically Ara h 6, and Ara h 7. Ara h 3, a peanut glycinin belongs to the legumin(11S) family of seed storage proteins. Native glycinin is a 360–380 kD protein constructedfrom 60 kD monomeric units [32,33]. Conformational models of Ara h 2 and Ara h 6 arevirtually superposable, indicating near identical tertiary structures of the two proteins [34].Recently, additional isoforms of Ara h 6 have been described and their clinical reactivitydemonstrated in large patient populations. These findings indicate that Ara h 6 is also amajor allergen [35–37].
In trying to understand the relative contributions of peanut allergens to the overall effectoractivity of a crude peanut extract, separate groups found that whereas Ara h 1 and Ara h 3bind IgE strongly, Ara h 2 is much more potent than Ara h 1 or Ara h 3 in degranulationassays [38–40]. However, selective removal of Ara h 2 from an extract of peanuts minimallyaffects its biologic activity [41]. Finally, Ara h 6, a relatively minor allergen based on itsability to elicit an IgE response, has potent effector activity similar to Ara h 2 [34]. Thesefindings underscore the concept that the ability of an allergen to elicit an IgE response and tobind IgE is not the same as the ability of an allergen to cross-link allergen-specific IgE onmast cells and basophils leading to cell activation.
Here we address the question of which peanut allergens account for the majority of theeffector function in highly peanut-allergic individuals and report that most of the effectoractivity of a saline extract of raw peanuts is due to Ara h 2, Ara h 6, and their variants.
Porterfield et al. Page 2
Clin Exp Allergy. Author manuscript; available in PMC 2010 July 1.
NIH
-PA Author Manuscript
NIH
-PA Author Manuscript
NIH
-PA Author Manuscript

Materials and MethodsSubjects and sera
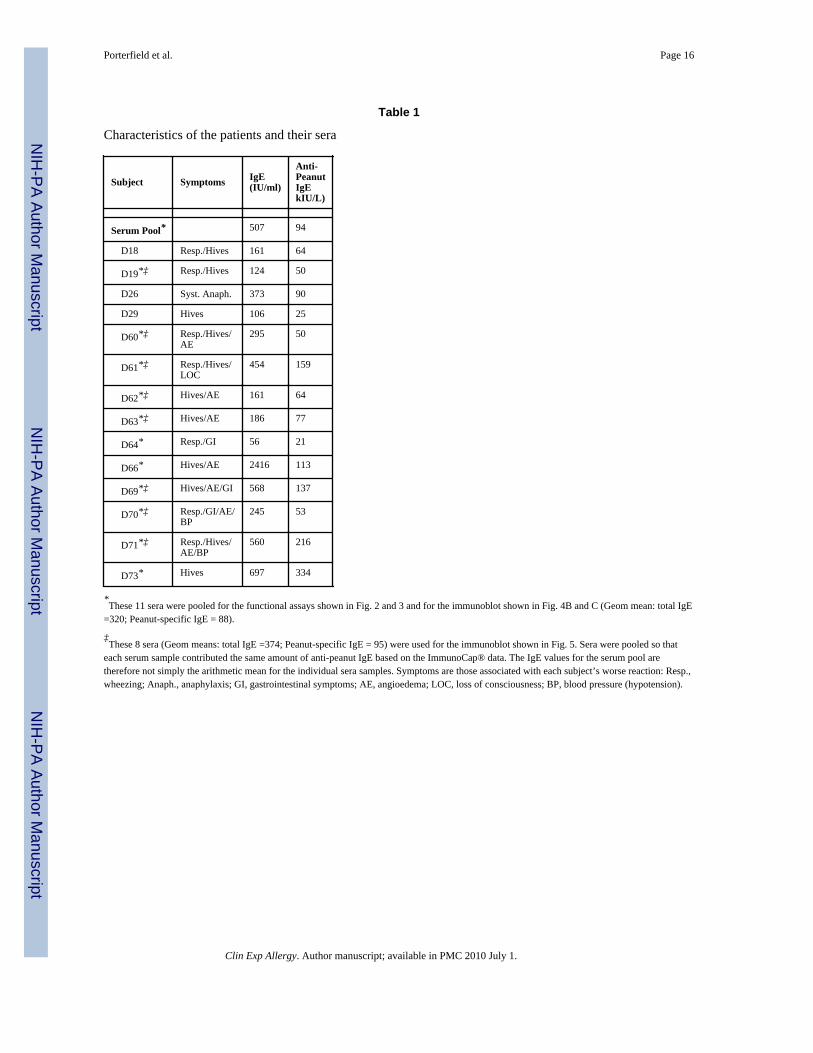
This study was approved by the Institutional Review Board of the University of ColoradoHealth Science Center. All subjects signed informed consent. Individuals were selected onthe basis of having high concentrations of specific IgE to peanuts and at least 10% of theirIgE directed against peanuts. All subjects had a peanut specific IgE > 13 IU/ml on thePharmacia ImmunoCap assay, a level associated with a 95% confidence level of havingclinical reactivity to peanuts [42]. In addition to using individual sera, pools of sera wereused. For these, individual patient sera were combined proportionally based on theconcentration of anti-peanut IgE. This gave pools with 320 and 375 U/ml of total IgE and 88and 95 U/ml of anti-peanut IgE; values similar to what we have previously described [41].The characteristics of the patients and their sera as well as the components of the serumpools are shown in Table 1.
ReagentsCrude Peanut Extracts
Crude peanut extracts were prepared by modification of published protocols [40,43]. RawGeorgia Green peanuts (a gift from Golden Peanut Company, Ashburn, GA, USA) weremanually ground with a mortar and pestle while frozen with liquid nitrogen. The groundpeanuts were then defatted with diethyl ether in a Soxhlet extractor for 2 hours and dried.The defatted peanut flour was resuspended at 1:5 w/v in ice-cold TBS (150 mM NaCl, 50mM Tris, pH 7.4) with EDTA-free protease inhibitors (Roche, Nutley, NJ, USA) and mixedovernight at 4°C. Batches of crude peanut extract (CPE) (31–33 mg/ml) were clarified bycentrifugation and frozen in aliquots at −70°C. Protein concentrations were determined withthe Pierce BCA kit (Pierce, Rockford, IL, USA) using BSA as the standard.
ChromatographyAliquots of CPE were thawed, spun at 10,000 × g for 10 minutes at 4°C and filtered with a0.22 µm filter prior to chromatography. Protein concentration was minimally decreased(4%) by this step. Gel filtration was carried out on either a HiLoad 26/60 Superdex 75 Prep-Grade Column (column volume ~325 ml) at 2 ml/min or a Superdex 200 HR 10/30analytical column (column volume ~24 ml) at 1 ml/min. All runs were performed with anÄKTA FPLC (GE Healthcare Bio-Sciences AB Uppsala, Sweden). Protein concentrations ofthe individual peaks were measured with a BCA kit using BSA as a standard and the relativemolecular masses of each peak were determined by reference to a calibration curve based onknown proteins (i.e., ferritin, 440 kD; BSA, 67 kD; β-lactoglobulin, 35 kD; cytochrome C,13.6 kD; aprotinin, 6.5 kD; and vitamin B12, 1.3 kD). Samples were aliquotted and frozen at−70° C. Proportional amounts of each fraction were recombined to reconstitute the CPE,both with and without the 20 kD fraction.
Electrophoresis and IgE immunoblotsBoth one and two dimensional gel electrophoresis and IgE immunoblots were performed aspreviously described except that PVDF membranes were used throughout and the 2Dimmunoblot was developed with biotinylated mouse anti-human IgE and Strepavidin-HRP(both, Invitrogen, Carlsbad, CA)) [41]. Silver staining was performed with a SilverSnapStain kit (Pierce, Rockland, IL).
Porterfield et al. Page 3
Clin Exp Allergy. Author manuscript; available in PMC 2010 July 1.
NIH
-PA Author Manuscript
NIH
-PA Author Manuscript
NIH
-PA Author Manuscript

RBL SX-38 cell assay and determination of relative EC50 and relative unitsRBL SX-38 cells were grown, sensitized, triggered, and the data analyzed as previouslydescribed [41]. The specificity, sensitivity, and limitations of this assay have beenpreviously described [39,44]. Spontaneous degranulation (buffer) was 14±2% (n=14; mean± SEM) and was subtracted from total degranulation to give the “net degranulation” aspreviously described [41]. In these experiments (n=14), the total degranulation was 56 ± 2%in the presence of 250 ng/ml of CPE and 61±2% with 3 µg/ml of goat anti-human IgE. Aftersubtracting the background for each experiment this gives a net release of 42±2% with CPEand of 47±2% with anti-IgE. In these experiments, CPE (250 ng/ml) gave 91±3% of the netrelease seen with anti-IgE (3 µg/ml). For analysis, the maximal net release with an optimalamount of CPE was arbitrarily set to 100% for each experiment so that results from differentexperiments could be pooled. The EC50 was defined as the concentration of each fractiongiving 50% of the degranulation seen with an optimal concentration of CPE (250 ng/ml).Relative units are used to compare the activity of fractions with each other and with theoriginal CPE. Relative units were determined as the reciprocal of the dilution giving theEC50. For example, if a specific chromatographic fraction when diluted 1000 fold gaveexactly 50% of the maximal activity seen with CPE, it would contain 1000 relative units.Relative activity of the CPE will vary with each serum or pool of serum due to variations inthe amount of IgE, the fraction of the IgE that recognizes peanut proteins, the affinity of thatIgE for peanut proteins, and the intrinsic variability of the assay.
Reduction, Alkylation, and Standard Overnight DigestionDisulfide bonds were reduced by the addition of DTT at a final concentration of 5 mM (pH7.4 using 25 mM ABC) and incubation for 30 minutes at 70 °C. After cooling to roomtemperature, IAM was added (15 mM) and the samples were incubated again (in the dark atroom temperature, 45 minutes). Proteolysis was carried out by adding trypsin (1:50) to theprotein fraction and incubating overnight at 37 °C.
Electrospray Ionization Mass SpectrometrySamples were analyzed on a LTQ-FT Ultra hybrid mass spectrometer. Peptide desalting andseparation were achieved on a dual capillary/nano pump HPLC system (Agilent 1200, PaloAlto, CA). Here, 8 µL of sample was loaded onto a trapping column (ZORBAX 300SB-C18, dimensions 5×0.3 mm 5 µm) and washed at a flow rate of 15 µL/min for 5 minuteswith a mobile phase of water containing 5% CH3CN and 0.1% HCOOH. The trappingcolumn was then placed in-line with the nano-pump at a flow rate of 350 nL/min. Water,with an 85 minute gradient from 8% CH3CN to 40% CH3CN was used to separate thepeptides. The column was made from an in-house pulled 360/100 nm (outer/inner diameter)fused silica capillary packed with Jupiter C18 resin (Penomenex; Torrance, CA). Dataacquisition was performed using Xcalibur (version 2.0.6) software. The LC runs weremonitored in positive ion mode by sequentially recording survey MS scans (m/z 400–2000)in the ICR cell, and 3 × MS2 scan in the ion trap of the most intense ions. After twoacquisitions of a given ion within a 45 seconds window, the ion was excluded from MS/MSanalysis for a further 150 seconds [45,46].
MS Data AnalysisDefault settings of the Raw Distiller program (UCSF) were used to create de-isotopedcentroided peak lists from the raw spectra in the Mascot (x.mgf) format. These peak listswere searched against the NCBInr (20070830; 5,422,622 entries) database withViridiplantae (Green Plants) taxonomy restriction (Mascot™ server, Version 2.2, MatrixScience). Precursor mass tolerance was set to +/− 6 ppm ; fragment ion tolerances were +/−0.8 Da. Trypsin specificity was used allowing for 2 missed cleavage. Met and Pro oxidation
Porterfield et al. Page 4
Clin Exp Allergy. Author manuscript; available in PMC 2010 July 1.
NIH
-PA Author Manuscript
NIH
-PA Author Manuscript
NIH
-PA Author Manuscript

were allowed for and Cys carbamindomethylation was set as a fixed modification. Mascotreporting was filtered to only allow for peptide matches with an ion score of > 6 and aprotein hit requiring a bold red match. The expect cut off used for protein identification wasE < 0.005 [45,46].
ResultsWhen crude peanut extract (CPE) was passed over a gel filtration column (Fig. 1) therecovery of both protein (75±7%) and effector activity (76±16%) were similar (Table 2).The data in Fig. 2 correspond to those in Table 2 and demonstrate that fraction D (Fig. 1),with a theoretical average molecular weight of 20 kDa, which from this point on we willrefer to as the 20 kD fraction (open circles), is more potent than either the CPE (closedsquares), or any other fraction (other open symbols). As shown in Table 3, 85±2% of therecovered activity was found in this fraction when fractions from the preparative columnwere assayed with IgE from the serum pool. Similar results were obtained with fractionsfrom the analytical column assayed with the serum pool and from either column assayedwith individual sera (Table 3). None of the other fractions consistently contained >5% of therecovered activity (data not shown).
To test the hypothesis that the 20 kD fraction contains the majority of the effector activity inour CPE, all fractions were recombined with or without the 20 kD fraction and compared tothe original CPE (Fig. 3). Proportional recombination of all fractions (closed circles)reconstituted the activity found in the CPE (closed squares). Two separate assays with thepool of 11 sera demonstrated that 140±43% of the activity of the original CPE was found inthe reconstituted material (n=2; Fig. 3A and data not shown). However, if all fractionsexcept the 20 kD fraction were reconstituted, the 20 kD-depleted reconstituted material(open circles), had 8±2% when assayed with the serum pool (n=2; Fig. 3A and data notshown) and 10±4% when assayed with individual sera (n=4; Fig.3 B–D and data not shown)of the activity compared to the CPE.
Figure 4 shows the molecular mass distributions of the CPE and the separate fractionscollected following gel filtration. Samples were stained by silver stain (Fig. 4A) and by IgEimmunoblot with a serum pool (Fig. 4B and 4C). Fraction D shows faint bands of 17 and 19kD, presumably Ara h 2. Fraction E, the second most potent fraction (Table 2 and Fig. 2),contains a similar distribution of molecular masses to those seen in fraction D but thecomponents are less abundant. Fractions F and G contained a variety of very faint bands(difficult to visualize in this exposure) that are likely the result of non-specific absorption ofpeanut proteins to the column.
Proteins in the 20 kD fraction were identified by two independent analytical strategies. First,the intact proteins (800 µg) were separated by two dimensional gel-electrophoresis (2D-GE)and stained. The protein spots were excised and digested with trypsin. Mass fingerprintingwas performed by MALDI-TOF mass spectrometry. Almost all of the protein spots wereidentified as variants of Ara h 2 and h 6 (Figure 5, lower image and Table 4, column 7). Thevarious forms of Ara h 2 were grouped into 3 categories: variants of 2.0101 (spots #1–10),variants of 2.0201 (spots #11–23) and those that were indistinguishable (i.e. forms of Ara h2 where only shared peptides were identified; spots #24–27). We found no evidence for thepresence of the Ara h 2 isoforms identified in the literature as 2.0102 and 2.0202. We alsoidentified Ara h 6 (spots #28–45) but could not distinguish between 2 of the possibleisoforms because the spots only contain peptides that are common to both forms (Table 4).A few spots (#24–27) yielded only peptides that were common to Ara h 2 and Ara h 6 andso their absolute identity could not be determined. Based on staining intensity, we estimate
Porterfield et al. Page 5
Clin Exp Allergy. Author manuscript; available in PMC 2010 July 1.
NIH
-PA Author Manuscript
NIH
-PA Author Manuscript
NIH
-PA Author Manuscript

that the isoforms of Ara h 2 and Ara h6 represent greater than 97% of the total protein in thisfraction.
IgE immunoblots were also performed on separate 2D gels to further characterize thecontents of the 20 kD fraction (Figure 5, upper right). To avoid smearing, only 25 µg of the20 kD fraction was run. Spots corresponding to spots 1, 2, 4 (Ara h 2.01) and spots 12, 13,and 14 (Ara h 2) had the strongest immunoreactivity.
A second sample of the same fraction was digested with trypsin and the mixture ofproteolytic peptides was analyzed by liquid chromatography-tandem mass spectrometry(LC-MS/MS) on a high resolution LTQ-ICR mass spectrometer. Consistent with the resultsobtained by 2DE and peptide mass mapping, isoforms of Ara h 2 and h 6 were identified asthe major components of the fraction. Table 4 reports the sequence coverage, proteinidentification score and includes the exponentially modified protein abundance index(emPAI) values as a measure of relative abundances. The emPAI value indicates that greaterthan 97% of the identified proteins in this fraction are variants of Ara h 2 and 6. By LC-MS/MS, the majority of the tryptic peptides can not unambiguously be assigned to a simpleprotein forms and therefore the relative abundances of each variant are inaccessible by thisapproach. However, several isoform-specific tryptic peptides were identified including threethat distinguish the truncated version of Ara h 2 (2.0101 vs. 2.0201) and two forms of Ara h6. Because the multiple protein isoforms were not separated prior to digestion and LC-MS/MS analysis, the peptides we identified for Ara h 2 can only be mapped to the specificisoforms listed in the protein sequence database (2.0101 and 2.0201). Another remarkablefinding is that variants of Ara h 2 and Ara h 6 have highly variable isoelectric pointssuggesting extensive posttranslational modifications.
DiscussionIn these studies we find that the majority (80–90%) of the effector activity of a CPErecovered from a gel filtration column resides in a single fraction comprised of componentsin the 13–25 kD range that we refer to as the 20 kD fraction.
Our analysis of this fraction by matrix-assisted laser-desorption ionization time-of-flightmass spectrometry (MALDI MALDI-TOFMS) and automated tandem mass spectrometrycoupled to online capillary liquid chromatography (LC-MS/MS) identified two isoforms ofAra h 2, two isoforms of Ara h 6, multiple post-translationally modified variants of theseproteins, and small amounts of other known allergens, Ara h 7 and Ara h 8. The few otherproteins shown in Table 4 are of uncertain significance. We estimate that >97% of theprotein mass in the biologically active 20 kD fraction consists of Ara h 2, Ara h 6, and theirvariants (Figure 5). The proteins that, on immunoblot, most strongly bind IgE from peanutallergic subjects are Ara h 2.0101 and Ara h 2.0201 (Figure 5, insert). In previous studies wehave shown that selective removal of ~99 % of Ara h 2 as assessed by 2D gel andimmunoblots resulted in a very small decrement in effector activity [41]. Koppelman andcolleagues have demonstrated that Ara h 6 and Ara h 2 are approximately equipotent asmeasured by skin testing and ex vivo basophil activation [47]. Taking the current findingsand this previous work together, we conclude that Ara h 2, Ara h 6, and their variantsaccount for the majority of the effector allergic activity in peanuts. An important furtherconclusion from these observations is that, although Ara h 1 and Ara h 3 are reported to bemajor peanut allergens based on their ability to bind IgE, they do not co-purify with themajority of the effector activity found in a crude peanut extract and, in their native state, arenot effective cross-linkers of IgE.
Porterfield et al. Page 6
Clin Exp Allergy. Author manuscript; available in PMC 2010 July 1.
NIH
-PA Author Manuscript
NIH
-PA Author Manuscript
NIH
-PA Author Manuscript

The ability of an allergen to effectively cross-link IgE and activate mast cells and basophilsis referred to as its effector activity. By contrast, allergenicity is most commonly used todefine an allergen’s ability to elicit an IgE response, but it is also sometimes used to refer tothe ability of an allergen to elicit an IgE response, the capacity to bind IgE, and/or to effectan IgE-mediated response. Arguably, the allergens with the greatest effector activity are themost clinically important. The effector activity of allergens depends upon: the number ofepitopes, the affinity of those epitopes for IgE, the stereo-orientation of the epitopes, theconcentration and the frequency of the IgE directed against those epitopes, and the molaramount of the protein bearing those epitopes [48–51]. The allergenicity of a protein istherefore not an accurate measure of its effector activity. The RBL SX-38 cells used in thisstudy are an excellent model system for evaluating the effector activity of allergens. This isa stable cell line that effectively binds human IgE and is easy to activate. Data with this cellline are similar to, but more reproducible than those obtained with basophil histaminerelease assays [41].
We acknowledge that this study has some limitations. First, all of the sera used are frompatients with very high levels of anti-peanut IgE. We did this to ensure sufficient sensitivityand a good signal-to-noise response, even in the presence of small concentrations of peanutallergens. Thus, different results may be found in patients with lower amounts of anti-peanutIgE. Second, restrictions in the US require that skin test reagents have investigational newdrug (IND) approval. Consequently, we were not able to perform skin test titrations toindependently verify these findings in vivo. This would be a useful adjunct to these findings.Third, the fractions from the gel filtration accounted for 76±16% of the activity in ouroriginal CPE and 85% of this activity is in the 20kD fraction. So we can say that at least~63% of the original effector activity is in the 20 kD fraction. We have not accounted for the~24% of the activity that was not recovered from the column although, it is most likely thatthis loss was non-specific. Finally, only soluble native proteins were examined andadditional epitopes, potentially from insoluble proteins or generated from proteins of largermolecular mass such as Ara h 1 and Ara h 3, following digestion or during food processingmay be clinically important.
In conclusion, we have shown that for IgE from highly peanut allergic subjects, the peanutproteins, Ara h 2.0101, 2.0201, Ara h 6 isoforms, and their variants account for the majorityof the effector activity in a saline extract of raw Georgia Green peanuts. It remains to beseen if this applies to all species of peanuts, all preparations of peanuts, and to all patientswith peanut allergy.
AcknowledgmentsThe authors thank Drs. Heather Thompson and Shahzad Mustafa for helpful advice. We also thank Drs. Alan Bock,Jerry Koepke, Jeffery Rumbyrt, Katherine VanKerkhove, Karen Andrews, Allen Addinoff, and Leon Greos forreferring patients and our study subjects for their participation.
Supported by an NIH grant, AI052164-01 to Dr. Dreskin, NIH National Center for Research Resources grant M01RR000051 to the University of Colorado at Denver, and institutional funds.
References1. Burks AW. Peanut allergy. Lancet. 2008; 371(9623):1538–1546. [PubMed: 18456104]2. Sampson HA. Food allergy. JAMA. 1997; 278(22):1888–1894. [PubMed: 9396650]3. Burks W, Sampson HA, Bannon GA. Peanut allergens. Allergy. 1998; 53(8):725–730. [PubMed:
9722220]4. Moneret-Vautrin DA. Modifications of allergenicity linked to food technologies. Allerg Immunol
(Paris). 1998; 30(1):9–13. [PubMed: 9503097]
Porterfield et al. Page 7
Clin Exp Allergy. Author manuscript; available in PMC 2010 July 1.
NIH
-PA Author Manuscript
NIH
-PA Author Manuscript
NIH
-PA Author Manuscript

5. Nelson HS, Lahr H, Rule R, Bock A, Leung D. Treatment of anaphylactic sensitivity to peanuts byimmunotherapy with injections of aqueous peanut extract. J Allergy Clin Immunol. 1997; 99(6 Pt1):744–751. [PubMed: 9215240]
6. Li XM, Srivastava K, Grishin A, Huang CK, Schofield B, Burks W, Sampson HA. Persistentprotective effect of heat-killed Escherichia coli producing "engineered," recombinant peanutproteins in a murine model of peanut allergy. J Allergy Clin Immunol. 2003; 112(1):159–167.[PubMed: 12847493]
7. Li XM, Srivastava K, Huleatt JW, Bottomly K, Burks AW, Sampson HA. Engineered recombinantpeanut protein and heat-killed Listeria monocytogenes coadministration protects against peanut-induced anaphylaxis in a murine model. J Immunol. 2003; 170(6):3289–3295. [PubMed: 12626588]
8. Srivastava KD, Kattan JD, Zou ZM, et al. The Chinese herbal medicine formula FAHF-2completely blocks anaphylactic reactions in a murine model of peanut allergy. J Allergy ClinImmunol. 2005; 115(1):171–178. [PubMed: 15637565]
9. Leung DY, Shanahan WR Jr, Li XM, Sampson HA. New approaches for the treatment ofanaphylaxis. Novartis Found Symp. 2004; 257:248–260. discussion 60-4, 76–85. [PubMed:15025403]
10. Scurlock AM, Burks AW. Peanut allergenicity. Ann Allergy Asthma Immunol. 2004; 93 5 Suppl3:S12–S18. [PubMed: 15562869]
11. Dodo H, Konan K, Viquez O. A genetic engineering strategy to eliminate peanut allergy. CurrAllergy Asthma Rep. 2005; 5(1):67–73. [PubMed: 15659267]
12. Scholl I, Boltz-Nitulescu G, Jensen-Jarolim E. Review of novel particulate antigen deliverysystems with special focus on treatment of type I allergy. J Control Release. 2005; 104(1):1–27.[PubMed: 15866331]
13. Li XM. Beyond allergen avoidance: update on developing therapies for peanut allergy. Curr OpinAllergy Clin Immunol. 2005; 5(3):287–292. [PubMed: 15864090]
14. Astier C, Morisset M, Roitel O, et al. Predictive value of skin prick tests using recombinantallergens for diagnosis of peanut allergy. J Allergy Clin Immunol. 2006; 118(1):250–256.[PubMed: 16815163]
15. Burks AW, Cockrell G, Stanley JS, Helm RM, Bannon GA. Recombinant peanut allergen Ara h Iexpression and IgE binding in patients with peanut hypersensitivity. J Clin Invest. 1995; 96(4):1715–1721. [PubMed: 7560062]
16. Stanley JS, King N, Burks AW, et al. Identification and mutational analysis of theimmunodominant IgE binding epitopes of the major peanut allergen Ara h 2. Arch BiochemBiophys. 1997; 342(2):244–253. [PubMed: 9186485]
17. Kleber-Janke T, Crameri R, Appenzeller U, Schlaak M, Becker WM. Selective cloning of peanutallergens, including profilin and 2S albumins, by phage display technology. Int Arch AllergyImmunol. 1999; 119(4):265–274. [PubMed: 10474031]
18. Rabjohn P, Helm EM, Stanley JS, West CM, Sampson HA, Burks AW, Bannon GA. Molecularcloning and epitope analysis of the peanut allergen Ara h 3. J Clin Invest. 1999; 103(4):535–542.[PubMed: 10021462]
19. Pons L, Chery C, Romano A, Namour F, Artesani MC, Gueant JL. The 18 kDa peanut oleosin is acandidate allergen for IgE-mediated reactions to peanuts. Allergy. 2002; 57 Suppl 72:88–93.[PubMed: 12144563]
20. Mittag D, Akkerdaas J, Ballmer-Weber BK, et al. Ara h 8, a Bet v 1-homologous allergen frompeanut, is a major allergen in patients with combined birch pollen and peanut allergy. J AllergyClin Immunol. 2004; 114(6):1410–1417. [PubMed: 15577846]
21. Lowenstein H. Quantitative immunoelectrophoretic methods as a tool for the analysis and isolationof allergens. Prog Allergy. 1978; 25:1–62. [PubMed: 362426]
22. Marsh DG, Goodfriend L, King TP, Lowenstein H, Platts-Mills TA. Allergen nomenclature. BullWorld Health Organ. 1986; 64(5):767–774. [PubMed: 3492310]
23. Chapman, MD. Allergen Nomenclature. In: Lockey, RF.; Bukantz, SC.; Bousquet, J., editors.Allergens and Allergen Immunotherapy. Marcel Dekker, Inc.; 2004. p. 51-64.
24. King TP, Hoffman D, Lowenstein H, Marsh DG, Platts-Mills TA, Thomas W. Allergennomenclature. Allergy. 1995; 50(9):765–774. [PubMed: 8546275]
Porterfield et al. Page 8
Clin Exp Allergy. Author manuscript; available in PMC 2010 July 1.
NIH
-PA Author Manuscript
NIH
-PA Author Manuscript
NIH
-PA Author Manuscript

25. de Groot H, van Swieten P, van Leeuwen J, Lind P, Aalberse RC. Monoclonal antibodies to themajor feline allergen Fel d I. I. Serologic and biologic activity of affinity-purified Fel d I and ofFel d I-depleted extract. J Allergy Clin Immunol. 1988; 82(5 Pt 1):778–786. [PubMed: 2461402]
26. Burks AW, Williams LW, Connaughton C, Cockrell G, O'Brien TJ, Helm RM. Identification andcharacterization of a second major peanut allergen, Ara h II, with use of the sera of patients withatopic dermatitis and positive peanut challenge. J Allergy Clin Immunol. 1992; 90(6 Pt 1):962–969. [PubMed: 1460200]
27. Breiteneder H, Radauer C. A classification of plant food allergens. J Allergy Clin Immunol. 2004;113(5):821–830. quiz 31. [PubMed: 15131562]
28. Sampson HA. Update on food allergy. J Allergy Clin Immunol. 2004; 113(5):805–819. quiz 20.[PubMed: 15131561]
29. Schmitt DA, Cheng H, Maleki SJ, Burks AW. Competitive inhibition ELISA for quantification ofAra h 1 and Ara h 2, the major allergens of peanuts. J AOAC Int. 2004; 87(6):1492–1497.[PubMed: 15675464]
30. Maleki SJ, Kopper RA, Shin DS, Park CW, Compadre CM, Sampson H, Burks AW, Bannon GA.Structure of the major peanut allergen Ara h 1 may protect IgE-binding epitopes from degradation.J Immunol. 2000; 164(11):5844–5849. [PubMed: 10820263]
31. van Boxtel EL, van Beers MM, Koppelman SJ, van den Broek LA, Gruppen H. Allergen Ara h 1occurs in peanuts as a large oligomer rather than as a trimer. J Agric Food Chem. 2006; 54(19):7180–7186. [PubMed: 16968080]
32. Koppelman SJ, Knol EF, Vlooswijk RA, Wensing M, Knulst AC, Hefle SL, Gruppen H, PiersmaS. Peanut allergen Ara h 3: isolation from peanuts and biochemical characterization. Allergy.2003; 58(11):1144–1151. [PubMed: 14616125]
33. Kang I-H, Gallo M. Cloning and charcterization of a novel peanut allergen Ara h 3 isoformdisplaying potentially decreased allergenicity. Plant Science. 2007; 172:345–353.
34. Lehmann K, Schweimer K, Reese G, Randow S, Suhr M, Becker WM, Vieths S, Rosch P.Structure and stability of 2S albumin-type peanut allergens: implications for the severity of peanutallergic reactions. Biochem J. 2006; 395(3):463–472. [PubMed: 16372900]
35. Bernard H, Mondoulet L, Drumare MF, Paty E, Scheinmann P, Thai R, Wal JM. Identification of anew natural Ara h 6 isoform and of its proteolytic product as major allergens in peanut. J AgricFood Chem. 2007; 55(23):9663–9669. [PubMed: 17949050]
36. Flinterman AE, van Hoffen E, den Hartog Jager CF, et al. Children with peanut allergy recognizepredominantly Ara h2 and Ara h6, which remains stable over time. Clin Exp Allergy. 2007; 37(8):1221–1228. [PubMed: 17651153]
37. Peeters AK, Koppelman SJ, van Hoffen E, et al. Does skin prick test reactivity to purified allergenscorrelate with clinical severity of peanut allergy? Clin Exp Allergy. 2007; 37(1):108–115.[PubMed: 17210048]
38. Palmer GW, Dibbern DA, Burks AW, Bannon GA, Bock SA, Porterfield HS, McDermott RA,Dreskin SC. Ara h 2 is greater than 50 times more potent than Ara h 1 in a functional assay ofpeanut protein allergenicity, a difference not appreciated with immunoblots. J Allergy ClinImmunol. 2002; 109:S300.
39. Palmer GW, Dibbern DA, Burks AW, Bannon GA, Bock SA, Porterfield HS, McDermott RA,Dreskin SC. Comparative potency of Ara h 1 and Ara h 2 in immunochemical and functionalassays of allergenicity. Clin Immunol. 2005; 115:301–312.
40. Koppelman SJ, Wensing M, Ertmann M, Knulst AC, Knol EF. Relevance of Ara h1, Ara h2 andAra h3 in peanut-allergic patients, as determined by immunoglobulin E Western blotting, basophil-histamine release and intracutaneous testing: Ara h2 is the most important peanut allergen. ClinExp Allergy. 2004; 34(4):583–590. [PubMed: 15080811]
41. McDermott RA, Porterfield HS, El-Mezayan R, et al. Contribution of Ara h 2 to peanut-specificimmunoglobulin E-mediated, cell activation. Clin Exp Allergy. 2007; 37:752–763. [PubMed:17456223]
42. Maloney JM, Rudengren M, Ahlstedt S, Bock SA, Sampson HA. The use of serum-specific IgEmeasurements for the diagnosis of peanut, tree nut, and seed allergy. J Allergy Clin Immunol.2008; 122(1):145–151. [PubMed: 18502490]
Porterfield et al. Page 9
Clin Exp Allergy. Author manuscript; available in PMC 2010 July 1.
NIH
-PA Author Manuscript
NIH
-PA Author Manuscript
NIH
-PA Author Manuscript

43. Sen M, Kopper R, Pons L, Abraham EC, Burks AW, Bannon GA. Protein structure plays a criticalrole in peanut allergen stability and may determine immunodominant IgE-binding epitopes. JImmunol. 2002; 169(2):882–887. [PubMed: 12097392]
44. Dibbern DJ, Palmer G, Williams P, Bock S, Dreskin S. RBL cells expressiing Human FcεRI are asensitive tool for exploring functional IgE-allergen interactions. J Immunol Methods. 2003;274:37–45. [PubMed: 12609531]
45. Duncan MW, Roder H, Hunsucker SW. Quantitative matrix-assisted laser desorption/ionizationmass spectrometry. Brief Funct Genomic Proteomic. 2008; 7(5):355–370. [PubMed: 19106161]
46. Netea-Maier RT, Hunsucker SW, Hoevenaars BM, Helmke SM, Slootweg PJ, Hermus AR,Haugen BR, Duncan MW. Discovery and validation of protein abundance differences betweenfollicular thyroid neoplasms. Cancer Res. 2008; 68(5):1572–1580. [PubMed: 18316623]
47. Koppelman SJ, de Jong GA, Laaper-Ertmann M, Peeters KA, Knulst AC, Hefle SL, Knol EF.Purification and immunoglobulin E-binding properties of peanut allergen Ara h 6: evidence forcross-reactivity with Ara h 2. Clin Exp Allergy. 2005; 35(4):490–497. [PubMed: 15836759]
48. Maeyama K, Hohman RJ, Metzger H, Beaven MA. Quantitative relationships between aggregationof IgE receptors, generation of intracellular signals, and histamine secretion in rat basophilicleukemia (2H3) cells. Enhanced responses with heavy water. J Biol Chem. 1986; 261(6):2583–2592. [PubMed: 2419319]
49. Torigoe C, Inman JK, Metzger H. An unusual mechanism for ligand antagonism. Science. 1998;281(5376):568–572. [PubMed: 9677201]
50. Knol EF. Requirements for effective IgE cross-linking on mast cells and basophils. Mol Nutr FoodRes. 2006; 50(7):620–624. [PubMed: 16764017]
51. Holowka D, Sil D, Torigoe C, Baird B. Insights into immunoglobulin E receptor signaling fromstructurally defined ligands. Immunol Rev. 2007; 217:269–279. [PubMed: 17498065]
Porterfield et al. Page 10
Clin Exp Allergy. Author manuscript; available in PMC 2010 July 1.
NIH
-PA Author Manuscript
NIH
-PA Author Manuscript
NIH
-PA Author Manuscript

Figure 1.A typical chromatogram following gel filtration (HiLoad 26/60 Superdex 75 Prep-Gradecolumn; column volume ~325 ml) of CPE. Ten ml of clarified CPE (33 mg/ml was appliedand run at 2 ml/min. Absorption at 280 nm is shown on the vertical axis (mAU: milliAbsorption Units). The 20 kD fraction is similarly resolved on Superdex 200 and onSuperdex 75 of large and small configurations. Fractions and theoretical MW: A, ≥250kD;B, 145kD; C, 100kD; D, 20kD; E, 7kD; F, 1kD; G, 0.7kD. Fractions F & G contain proteinsnon-specifically retained by the matrix (see Fig. 4). No proteins were detected in fractions H& I based on silver staining of a1D gel.
Porterfield et al. Page 11
Clin Exp Allergy. Author manuscript; available in PMC 2010 July 1.
NIH
-PA Author Manuscript
NIH
-PA Author Manuscript
NIH
-PA Author Manuscript

Figure 2.Dose response of activity vs. protein concentration for fractions collected from the column(Fig. 1). All values are expressed as a % of maximal degranulation seen with 250 ng/ml ofCPE within each assay. All assays were performed in triplicate and data points are mean ±SD. If standard error bars are not visible, the error was smaller than the symbol. Fig. 2A,assayed with a pool of 11 sera. Fig. 2B–D, assayed with 3 individual sera (B, D19; C, D60;and D, D62). Data are shown for the CPE (■, solid lines) and for fractions A–E (Opensymbols with dashed lines: A,Δ; B,∇; C,◇; D, ○; E, □). Fractions F–K (data not shown)contained less effector activity than other fractions (see Table 2) and are not shown. Thesmall peak between fractions C and D displayed no measurable activity (data not shown).Similar data were obtained with fractions from the analytic column with 4 individual sera (3different from those shown) and with a pool of 10 sera (8 sera different from the serum poolshown).
Porterfield et al. Page 12
Clin Exp Allergy. Author manuscript; available in PMC 2010 July 1.
NIH
-PA Author Manuscript
NIH
-PA Author Manuscript
NIH
-PA Author Manuscript

Figure 3.Dose response of activity vs. protein concentration for CPE (■, solid lines), all fractionsproportionally recombined (●, dashed line), and all fractions except for the 20 kD fractionproportionally recombined (⊗, dashed lines). Fig. 3A, assayed with a pool of 10 sera: Fig. 3B–D, assayed with 3 individual sera (B, D19; C, D60; and D, D61).
Porterfield et al. Page 13
Clin Exp Allergy. Author manuscript; available in PMC 2010 July 1.
NIH
-PA Author Manuscript
NIH
-PA Author Manuscript
NIH
-PA Author Manuscript

Figure 4.1D gels (15 % PAGE) and immunoblots (pool of 10 sera) for the CPE and the fractions A–G. (See Fig. 1.) Lanes (each with 3 µg of protein): CPE and fractions A, B, C, D, E, F, andG as marked. A, silver stain; B & C, IgE immunoblot with the pool of 11 sera diluted 1:5 togive anti-peanut IgE = 18 U/ml. The exposure for B was for1 minute, 12 minutes afteradding the ECL reagent and for C, the exposure was for 15 seconds, 17 minutes after addingthe ECL reagent.
Porterfield et al. Page 14
Clin Exp Allergy. Author manuscript; available in PMC 2010 July 1.
NIH
-PA Author Manuscript
NIH
-PA Author Manuscript
NIH
-PA Author Manuscript
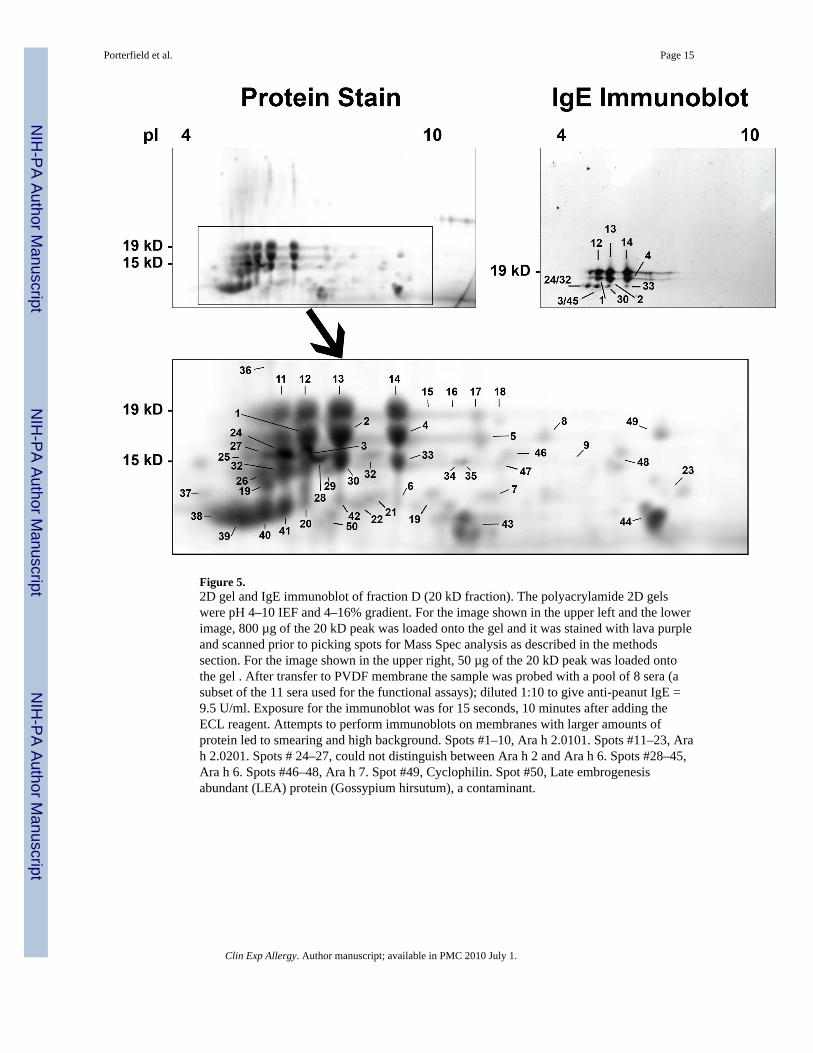
Figure 5.2D gel and IgE immunoblot of fraction D (20 kD fraction). The polyacrylamide 2D gelswere pH 4–10 IEF and 4–16% gradient. For the image shown in the upper left and the lowerimage, 800 µg of the 20 kD peak was loaded onto the gel and it was stained with lava purpleand scanned prior to picking spots for Mass Spec analysis as described in the methodssection. For the image shown in the upper right, 50 µg of the 20 kD peak was loaded ontothe gel . After transfer to PVDF membrane the sample was probed with a pool of 8 sera (asubset of the 11 sera used for the functional assays); diluted 1:10 to give anti-peanut IgE =9.5 U/ml. Exposure for the immunoblot was for 15 seconds, 10 minutes after adding theECL reagent. Attempts to perform immunoblots on membranes with larger amounts ofprotein led to smearing and high background. Spots #1–10, Ara h 2.0101. Spots #11–23, Arah 2.0201. Spots # 24–27, could not distinguish between Ara h 2 and Ara h 6. Spots #28–45,Ara h 6. Spots #46–48, Ara h 7. Spot #49, Cyclophilin. Spot #50, Late embrogenesisabundant (LEA) protein (Gossypium hirsutum), a contaminant.
Porterfield et al. Page 15
Clin Exp Allergy. Author manuscript; available in PMC 2010 July 1.
NIH
-PA Author Manuscript
NIH
-PA Author Manuscript
NIH
-PA Author Manuscript
NIH
-PA Author Manuscript
NIH
-PA Author Manuscript
NIH
-PA Author Manuscript
Porterfield et al. Page 16
Table 1
Characteristics of the patients and their sera
Subject Symptoms IgE(IU/ml)
Anti-PeanutIgEkIU/L)
Serum Pool* 507 94
D18 Resp./Hives 161 64
D19*‡ Resp./Hives 124 50
D26 Syst. Anaph. 373 90
D29 Hives 106 25
D60*‡ Resp./Hives/AE
295 50
D61*‡ Resp./Hives/LOC
454 159
D62*‡ Hives/AE 161 64
D63*‡ Hives/AE 186 77
D64* Resp./GI 56 21
D66* Hives/AE 2416 113
D69*‡ Hives/AE/GI 568 137
D70*‡ Resp./GI/AE/BP
245 53
D71*‡ Resp./Hives/AE/BP
560 216
D73* Hives 697 334
*These 11 sera were pooled for the functional assays shown in Fig. 2 and 3 and for the immunoblot shown in Fig. 4B and C (Geom mean: total IgE
=320; Peanut-specific IgE = 88).
‡These 8 sera (Geom means: total IgE =374; Peanut-specific IgE = 95) were used for the immunoblot shown in Fig. 5. Sera were pooled so that
each serum sample contributed the same amount of anti-peanut IgE based on the ImmunoCap® data. The IgE values for the serum pool aretherefore not simply the arithmetic mean for the individual sera samples. Symptoms are those associated with each subject’s worse reaction: Resp.,wheezing; Anaph., anaphylaxis; GI, gastrointestinal symptoms; AE, angioedema; LOC, loss of consciousness; BP, blood pressure (hypotension).
Clin Exp Allergy. Author manuscript; available in PMC 2010 July 1.

NIH
-PA Author Manuscript
NIH
-PA Author Manuscript
NIH
-PA Author Manuscript
Porterfield et al. Page 17
Tabl
e 2
Effe
ctor
act
ivity
of C
PE a
nd fr
actio
ns fr
om g
el fi
ltrat
ion
Frac
tion
App
rox
aver
age
MW
(ran
ge)
Prot
ein
n=3
runs
Sepa
rate
chr
omat
ogra
phic
runs
*
#1#2
#3
kDm
gR
elat
ive
units
(× 1
0−5 )
CPE
NA
337±
4413
022
816
A34
2(1
67–3
42)
105±
36.
710
0
B14
4(1
17–1
67)
15±1
0.7
0.7
0
C99
(58–
117)
36±3
2.8
2.7
0
D18
( 13–
25)
28±2
108
175
7.2
E7
(4–1
0)14
±09.
82.
30
F0.
7(0
.3–1
)36
±24
20.
30
G<1
17±1
00.
50.
50
>G<1
5±1
00
0
% R
ecov
ery
(act
ivity
)10
0%84
%45
%
% R
ecov
ery
(act
ivity
)m
ean
± SE
M76
±16%
% R
ecov
ery
(pro
tein
)m
ean
± SE
M75
±7%
NA
, not
app
licab
le.
* Sam
ples
from
sepa
rate
chr
omat
ogra
phic
runs
of a
pre
para
tive
prep
arat
ive
Supe
rdex
75
colu
mn
(Fig
. 1).
A fo
urth
run
on a
n an
alyt
ical
col
umn
gave
sim
ilar d
ata
(rec
over
y of
pro
tein
= 7
5%; r
ecov
ery
ofac
tivity
= 6
7%).
Clin Exp Allergy. Author manuscript; available in PMC 2010 July 1.

NIH
-PA Author Manuscript
NIH
-PA Author Manuscript
NIH
-PA Author Manuscript
Porterfield et al. Page 18
Table 3
Proportion of the total activity found in the 20 kD fraction with different columns and multiple sera.
Column Cells sensitizedwith:
Recoveredactivity in 20kD fraction(% of totalrecovered)
PreparativeSuperdex 75
Serum D19 79
Serum D60 88
Serum D62 81
Mean ± SDmeasured witheach of 3 sera
83±5
Mean ± SDmeasured withserum pool(n=3)
85±2
AnalyticalSuperdex 75
D18 81
D19 58
D26 81
D29 98
Mean ± SDmeasured witheach of 4 sera
80 ± 16
Mean ± SDmeasured with asingle serum
89
Clin Exp Allergy. Author manuscript; available in PMC 2010 July 1.

NIH
-PA Author Manuscript
NIH
-PA Author Manuscript
NIH
-PA Author Manuscript
Porterfield et al. Page 19
Tabl
e 4
Prot
ein
Iden
tific
atio
n
Acc
essi
on #
Prot
ein*
Nam
eT
heor
etic
al M
WSe
arch
Scor
eSe
q.C
over
age
emPA
IM
FP ID
Top
scor
eSe
q.C
over
age
gi|1
4861
3175
Ara
h 2
.010
120
907
7907
7385
3.3
192
69
gi|3
1322
017
Ara
h 2
.020
120
212
6596
6921
9.8
191
79
gi|7
5114
094
Ara
h 6
isof
orm
1747
943
2564
122.
217
674
gi|1
7225
991
Ara
h 6
isof
orm
1734
942
7864
125.
916
875
gi|1
4590
4610
Ara
h 8
1620
817
3642
24.1
8163
gi|6
6735
602
LEA
pro
tein
1040
867
242
4.1
8045
gi|1
1518
7464
thio
redo
xin
fold
1752
548
020
0.5
gi|1
5226
956
osm
otin
-like
127
912
346
80.
5
gi|1
8499
LEA
pro
tein
211
965
259
350.
8
gi|8
3776
794
LEA
458
0226
742
2.0
gi|1
5812
1995
Ara
h 7
130
55
gi|3
3341
57C
yclo
phili
n92
43
* All
mat
ches
to A
rach
is h
ypog
aea
prot
ein
sequ
ence
s unl
ess s
tate
d ot
herw
ise
1 Ara
bido
psis
thal
iana
2 Late
em
brog
enes
is a
bund
ant (
LEA
) pro
tein
(Gos
sypi
um h
irsut
um)
Clin Exp Allergy. Author manuscript; available in PMC 2010 July 1.