Mass spectrometric characterization of isoform variants of peanut (< i> Arachis hypogaea ) stem...
14
Mass spectrometric characterization of isoform variants of peanut (Arachis hypogaea) stem lectin (SL-I) Praveen Agrawal, Saravanan Kumar, Hasi Rani Das ⁎ Proteomics and Structural Biology Division, Institute of Genomics and Integrative Biology, Delhi University Campus, Mall Road, Delhi-110 007, India ARTICLE INFO ABSTRACT Article history: Received 28 October 2009 Accepted 10 March 2010 Matrix assisted laser desorption/ionization–time-of-flight (MALDI–TOF) mass spectrometric (MS) analysis of purified Arachis hypogaea stem lectin (SL-I) and its tryptic digests suggested it to be an isoformic glucose/mannose binding lectin. Two-dimensional gel electrophoresis of SL-I indicated six isoforms (A1–A6), which were confirmed by Western blotting and MALDI–TOF MS analysis. Comparative analysis of peptide mass spectra of the isoforms matched with A. hypogaea lectins with three different accession numbers (Q43376_ARAHY, Q43377_ARAHY, Q70DJ5_ARAHY). Tandem mass spectrometric (MS/MS) analysis of tryptic peptides revealed these to be isoformic variants with altered amino acid sequences. Among the peptides, the peptide T12 showed major variation. The 199 Val–Ser–Tyr–Asn 202 sequence in peptide T12 of A1 and A2 was replaced by 199 Leu–Ser–His–Glu 202 in A3 and A4 (T12′) while in A5 and A6 this sequence was 199 Val–Ser–Tyr–Val 202 (T12″). Peptide T1 showed the presence of 10 Asn in the isoforms A1–A5 while in A6 this amino acid was replaced by 10 Lys (T1′). Overall amino acid sequence as identified by MS/MS showed a high degree of similarity between A1, A2 and among A3, A4, A5. Carbohydrate binding domain and adenine binding site seem to be conserved. © 2010 Elsevier B.V. All rights reserved. Keywords: Lectin Isoform Microheterogeneity Mass spectrometry Peptide mass fingerprinting MS/MS based peptide sequencing 1. Introduction Lectins are defined as carbohydrate binding proteins or glycoproteins of non-immune origin that are able to aggluti- nate cells or to precipitate carbohydrates, without having enzymatic activity [1,2]. Lectins are found in all types of living organisms, either in soluble or in membrane-bound form. They are structurally complex molecules with one or more carbohydrate-recognition domains [3]. Legume lectins are a large family of homologous proteins that possess a strong similarity at the level of their amino acid sequences and tertiary structures; however, their carbohydrate specificities and quaternary structures vary widely [4]. Leguminous plants are known to contain lectins abundantly in various organs such as seed, bark, stem, leaf, flower, and root. However, the vegetative tissue lectins are less characterized in comparison to their seed counterpart [5]. The lectins from different parts of plants are reported to exist as a highly complex mixture of isoforms as, the lectins of Robinia pseudoacacia [6], Erythrina genus [7], Acacia constricta [8], Amaranthus leucocarpus [9]. The presence of isoforms have high impact on the biological function of lectins as the existence of number of isoforms might offer an alternative strategy or evolutionary adaptation to recompense the lack of high specificity [10,11]. Peanut (Arachis hypogaea) vegetative tissue lectin SL-I is found to be present in all the tissues of the plant but Abbreviations: 2-DE, Two-dimensional gel electrophoresis; A. hypogaea, Arachis hypogaea; MALDI–TOF MS, Matrix assisted laser desorption/ionization–time-of-flight mass spectrometry; PMF, Peptide mass fingerprinting. ⁎ Corresponding author. Tel.: +91 11 27662581; fax: +91 11 27667471. E-mail addresses: [email protected], [email protected] (H.R. Das). available at www.sciencedirect.com www.elsevier.com/locate/jprot JOURNAL OF PROTEOMICS 73 (2010) 1573 – 1586 1874-3919/$ – see front matter © 2010 Elsevier B.V. All rights reserved. doi:10.1016/j.jprot.2010.03.006
Transcript of Mass spectrometric characterization of isoform variants of peanut (< i> Arachis hypogaea ) stem...
ava i l ab l e a t www.sc i enced i r ec t . com
www.e l sev i e r . com/ loca te / j p ro t
J O U R N A L O F P R O T E O M I C S 7 3 ( 2 0 1 0 ) 1 5 7 3 – 1 5 8 6
Mass spectrometric characterization of isoform variants ofpeanut (Arachis hypogaea) stem lectin (SL-I)
Praveen Agrawal, Saravanan Kumar, Hasi Rani Das⁎
Proteomics and Structural Biology Division, Institute of Genomics and Integrative Biology, Delhi University Campus, Mall Road,Delhi-110 007, India
A R T I C L E I N F O
Abbreviations: 2-DE, Two-dimensional gdesorption/ionization–time-of-flight mass sp⁎ Corresponding author. Tel.: +91 11 27662581
E-mail addresses: [email protected], h
1874-3919/$ – see front matter © 2010 Elsevidoi:10.1016/j.jprot.2010.03.006
A B S T R A C T
Article history:Received 28 October 2009Accepted 10 March 2010
Matrix assisted laser desorption/ionization–time-of-flight (MALDI–TOF) mass spectrometric(MS) analysis of purified Arachis hypogaea stem lectin (SL-I) and its tryptic digests suggestedit to be an isoformic glucose/mannose binding lectin. Two-dimensional gel electrophoresisof SL-I indicated six isoforms (A1–A6), which were confirmed by Western blotting andMALDI–TOF MS analysis. Comparative analysis of peptide mass spectra of the isoformsmatched with A. hypogaea lectins with three different accession numbers (Q43376_ARAHY,Q43377_ARAHY, Q70DJ5_ARAHY). Tandem mass spectrometric (MS/MS) analysis of trypticpeptides revealed these to be isoformic variants with altered amino acid sequences. Amongthe peptides, the peptide T12 showed major variation. The 199Val–Ser–Tyr–Asn202 sequencein peptide T12 of A1 and A2 was replaced by 199Leu–Ser–His–Glu202 in A3 and A4 (T12′) whilein A5 and A6 this sequence was 199Val–Ser–Tyr–Val202 (T12″). Peptide T1 showed thepresence of 10Asn in the isoforms A1–A5 while in A6 this amino acid was replaced by 10Lys(T1′). Overall amino acid sequence as identified byMS/MS showed a high degree of similaritybetween A1, A2 and among A3, A4, A5. Carbohydrate binding domain and adenine bindingsite seem to be conserved.
© 2010 Elsevier B.V. All rights reserved.
Keywords:LectinIsoformMicroheterogeneityMass spectrometryPeptide mass fingerprintingMS/MS based peptide sequencing
1. Introduction
Lectins are defined as carbohydrate binding proteins orglycoproteins of non-immune origin that are able to aggluti-nate cells or to precipitate carbohydrates, without havingenzymatic activity [1,2]. Lectins are found in all types of livingorganisms, either in soluble or in membrane-bound form.They are structurally complex molecules with one or morecarbohydrate-recognition domains [3]. Legume lectins are alarge family of homologous proteins that possess a strongsimilarity at the level of their amino acid sequences andtertiary structures; however, their carbohydrate specificitiesand quaternary structures vary widely [4]. Leguminous plants
el electrophoresis; A. hyectrometry; PMF, Peptide; fax: +91 11 [email protected] (H.R. Das).
er B.V. All rights reserved
are known to contain lectins abundantly in various organssuch as seed, bark, stem, leaf, flower, and root. However, thevegetative tissue lectins are less characterized in comparisonto their seed counterpart [5]. The lectins fromdifferent parts ofplants are reported to exist as a highly complex mixture ofisoforms as, the lectins of Robinia pseudoacacia [6], Erythrinagenus [7], Acacia constricta [8], Amaranthus leucocarpus [9]. Thepresence of isoforms have high impact on the biologicalfunction of lectins as the existence of number of isoformsmight offer an alternative strategy or evolutionary adaptationto recompense the lack of high specificity [10,11].
Peanut (Arachis hypogaea) vegetative tissue lectin SL-I isfound to be present in all the tissues of the plant but
pogaea, Arachis hypogaea; MALDI–TOF MS, Matrix assisted lasermass fingerprinting.
.
1574 J O U R N A L O F P R O T E O M I C S 7 3 ( 2 0 1 0 ) 1 5 7 3 – 1 5 8 6
differentially expressed [12]. This lectin was found to havecytokinin/adenine binding site and was able to antagonizecytokinin function in vitro indicating an important physiolog-ical function of plant lectin [13]. The native purified SL-Iprotein was found to show broad band in SDS-PAGE andappeared to contain more than one molecular weight bands.We speculated that this observation could be due to thepresence of different isomeric forms of SL-I.
The identification of isoforms is very helpful to understandtheir function and that needs a sensitive and specificanalytical tool, as their identification relies on the observationof the local amino acid differences in protein sequence [14–16].Protein isoforms may originate from alternative splicing ofmRNA, single-point mutations, and co- or post-translationalmodifications such as N- or C-terminal truncation, glycosyl-ation, phosphorylation, deamidation and proteolytic clea-vages [17,18]. These modifications often introduce avariation in the molecular mass and net charge of the protein.In order to confirm the presence of isoforms, purified proteinwas analyzed using bottom-up approaches, i.e. separation ofproteins by two-dimensional gel electrophoresis (2-DE) andprotein identification by matrix assisted laser desorption/ionization–time-of-flight MS (MALDI–TOF MS) of proteolyticpeptides.
Here, we report the presence of six different isoforms ofA. hypogaea stem lectin (SL-I) and their partial amino acidsequence generated using mass spectrometry. Mass spectraand amino acid sequence analysis of the tryptic peptidesestablished the existence of amino acid substitutions amongvarious isoforms. However, molecular modeling studiesrevealed no change in carbohydrate binding and adeninebinding domain among the isoforms.
2. Materials and methods
2.1. Plant material and growth conditions
Seeds of A. hypogaea, cultivar ICGS-1, a nodulating variety ofpeanut were obtained from the Indian Agricultural ResearchInstitute, New Delhi, India. Prior to germination, seeds werescarified by treatment with 95% ethanol and rinsed thorough-ly with sterile distilled water. The seeds were then imbibed insterile distilled water for 3 to 4 h at room temperature. Treatedseeds were placed onto sealed petri-plates on moist filterpaper at room temperature in the dark for 48 h. Germinatedseedlings were transferred to 0.8% solidified agar and weregrown under 16 h day/8 h night cycle. Developing shoots werecollected after 14th day, weighed, used immediately or frozenin liquid nitrogen.
2.2. Purification of the lectin
Stem lectin (SL-I) was purified as described previously [19] byaffinity chromatography using Sephadex G-50 beads as matrix(Sigma chemicals co. St. Louis). Five micrograms of purifiedprotein was subjected to 12% SDS-PAGE [20]. Gel was stainedwith Coomassie blue R250 for 1 h and was destained indestaining solution containing 45% methanol, 5% acetic acid.Protein bandwas cut, washedwithMQwater and stored at 4 °C.
2.3. 2-Dimensional gel electrophoresis and immunoblotting
For the first-dimensional separation, the sample (10 µg ofprotein) was loaded onto a 7-cm IPG linear strip (pI 4–7; Bio-Radlaboratories, USA) and isoelectric focusing (IEF) was performedaccording to the manufacturer's manual with slight modifica-tions. Briefly, the voltage was linearly increased from 250 to4000 V for 3 h and it was kept constant at 4000 V for about 2.5 h.Strip was then incubated in an equilibration buffer (50 mM Tris–HCl, pH 8.8, 7 M urea, 2 M thiourea, 20% glycerol, 2% SDS, 65 mMDTT, and a trace of bromophenol blue) for 15 min, followedby anadditional 15 min incubation using a fresh equilibration buffersupplementedwith135mMiodoacetamide (insteadofDTT).Thesecond-dimensional separation was carried out on 12% SDSpolyacrylamide gel (7 cm, 1 mm) following the method ofLaemmli. ForWestern blotting after completion of 2-DE proteinswere electroblotted on to a nitrocellulose (NC) membrane(Millipore Corporation, USA) and blot was probed with anti-SL-Iantibody as described earlier [21]. Briefly, the separated polypep-tides were electrotransferred to NCmembrane for 1 h at 100 V in25mM Tris, 192mM glycine, and 20% (v/v) methanol. Aftertransfer, the membrane was blocked with phosphate bufferedsaline (20mM sodium phosphate buffer, pH 6.8, 0.15 M NaCl, pH7.2, PBS) containing 1% bovine serum albumin and 0.1% (v/v)Tween-20 for1 h.Themembranewas then incubated for2 hwithanti-SL-I antibody (raised against the purified SL-I lectin inrabbit). Themembranewas thenwashedwith PBST buffer thriceand incubated with anti-rabbit IgG horseradish peroxidaseconjugated (1:1000 diluted in PBS containing 0.25% BSA) atroom temperature for 1 h. After extensive washing with PBSTbuffer, the blot was exposed to peroxidase substrate (25 ml PBScontaining 15mg of 4-chloronapthol dissolved in 5mlmethanolwith 0.1% hydrogen peroxide).
2.4. Enzymatic in-gel digestion and peptide extraction
The spots representing protein of interest were excised fromCoomassie stained 2-D gels and subjected to in-gel trypticdigestion according to standard protocol with minor modifi-cations [22]. Briefly, the excised gel pieces were washed with100 µl destaining solution containing 1:1100 mM ammoniumbicarbonate (NH4HCO3) and 100% acetonitrile (ACN) till the gelpieces appeared colorless and then dehydrated in ACN.Reduction of protein was carried out in 100 µl of 10 mM DTTin 50 mM NH4HCO3 at 56 °C for 45 min. Alkylation of proteinwas done in 100 µl of 55 mM iodoacetamide (IAA in 50 mMNH4HCO3). Gel pieces were then destained in 100 µl of solutioncontaining 1:1 ratio of 50 mM NH4HCO3 and 100% ACN. Finaldehydrationwas done in 100%ACN for 15 min. Gel pieceswerethen centrifuged, supernatant discarded and were completelydried in speed vac (Thermo savant, USA) for 20 min. Trypsinsolution (20 ng/µl) (proteomic grade, Sigma chemicals co. St.Louis) was prepared in 25 mM NH4HCO3 and 10 µl of thissolution was added to each Eppendorf tube, kept at 4 °C for30 min for absorption. This was followed by further addition of10 µl of 25 mM NH4HCO3 solution. The samples were kept fordigestion at 37 °C for 16 h. After digestion, samples werecentrifuged and supernatants containing peptides were col-lected and were transferred to the fresh microfuge tubesrinsed with 100% ACN. Ten microliters of peptide extraction
1575J O U R N A L O F P R O T E O M I C S 7 3 ( 2 0 1 0 ) 1 5 7 3 – 1 5 8 6
solution containing 1% triflouroacetic acid (TFA) and 60% ACNwere added to the samples and sonicated for 15 min inultrasonic water bath at room temperature. After centrifuga-tion supernatant containing peptides was collected, pooledwith the respective samples and dried completely in speedvac. For MS analysis peptides were resuspended in 10 µl of0.1% TFA containing 30% ACN.
2.5. Matrix assisted laser desorption/ionization–time-of-flight (MALDI–TOF) analysis of intact protein and trypticpeptides
Mass spectra were acquired in positive linear mode for intactmass analysis of the protein with an acceleration voltage of25 kV. External calibrations were performed using cytochromeC, apomyoglobin and bovine serum albumin (BSA). Proteinswere mixed with sinapinic acid (10 mg/mL in CH3CN/0.1% TFA(30:70, v/v) [23].
Matrix was prepared by dissolving α-cyano-4-hydroxycin-namic acid (Bruker daltonics, Breman, Germany) in 1:2 ACNand 0.1% TFA to make a 1.0 mg/ml solution [24]. It wassonicated for 15 min and centrifuged at 10,000 rpm for 5 min.Two microliters of peptides mixture was mixed with equalamount of matrix clear supernatant and 0.5 µl of this wasspotted on MALDI ground steel target plate (Bruker Daltonics,Breman, Germany). Samples and calibration standards withthe same matrix composition were spotted adjacent toeach other on the target plate for optimal calibrationand enhanced mass accuracy. Spectra were externally cali-brated with the calibration standards of following peptidemass (Angiotensin_II (M+H)+ mono=1046.54180, Angiotensin I(M+H)+mono=1296.68480, Bombesin (M+H)+mono=1347.73450,ACTH_Clip (M+H)+ mono=2093.08620, Somatostatin (M+H)+
mono=3147.47100). Mass spectra were obtained on an UltraflexIII MALDI–TOF–TOF mass spectrometer (Bruker Daltonics, Bre-man, Germany), equipped with a pulsed N2 laser (337 nm).Operating conditions were as follows: ion source 1=19.00 kV ionsource 2=16.50 kV, lens voltage=20.00 kV, optimized pulsed ionextraction time=120 ns,matrix suppression=400 Daandpositivereflectronmode. Around 500 laser shots were collected from onespot from five different positionswith 100 shots per position. Theobtained spectrum was analyzed with the Flexanalysis 3.0 (Bru-ker) and Biotools 3.2 (Bruker) software. With the use ofSophisticated Numerical Annotation Procedure (SNAP) algo-rithm, those peaks with S/N>3 were picked out for PMF withresolutionof 8000. Themass spectrumdatawere submitted to anonlinedatabase (MASCOTversion2.1, http://www.matrixscience.com/) for protein identification. The database search parameterswere set as follows enzyme-trypsin; taxonomy-viridiplantae;fixed modifications-carbamidomethyl (C); variable modifica-tions-oxidation (M); no restriction on protein mass; missedcleavage-1. The PMF data was analyzed after removing thetrypsin autolysis peaks, keratin peaks andmatrix peaksusing theFlexanalysis software version 3.0.
2.6. MS/MS based sequencing and identification
For MS/MS based sequencing and identification of proteinfrom the peptide, the following parameters were used duringacquisition and analysis. The precursor peptide ions were
fragmented in positivemode using the LIFT.lftmethod (BrukerDaltonics, Germany). Briefly; the accelerating voltages wereset to 8.00 kV, 7.15 kV for ion source 1 and ion source 2. Thereflector 1 and 2 were set to 29.5 kV and 13.9 kV respectivelywith Lift 1 and 2 set at 19 kV and 2.8 kV. Calibration was doneusing Angiotensin_II and Substance_P as precursor mass. ThePSD spectra containing sequence specific ions were analyzedusing Flexanalysis software version 3.0 and were sent todatabase search using Biotools software version 3.2. For eachMS/MS spectrum, after being smoothened and subtracted, nomore than 250 peaks with S/N>2 were picked with SNAPalgorithm. The MS tolerance was set to ±100 ppm and that ofMS/MS was set ±0.5 Da.
2.7. Enzymatic deglycosylation
The protein spots corresponding to each isoformwere excisedfrom the gel and treatedwith Peptide-N-glycosidase F (PNGaseF; Roche, Germany) following the method of Kuster et al [25].In-gel chymotrypsin digestionwas performed asmentioned inthe Section 2.4. One unit of chymotrypsin was added inprotein samples and incubated at 30 °C for 16 h.
2.8. Homology based molecular modeling
SwissModel was used to generate structural model of the SL-Iprotein isoforms. For homology modeling, amino acidsequences were submitted to SWISSMODEL [26] using theAutomated mode set at default parameters and models weregenerated using crystal structure of Pterocarpus angolensislectin (PAL) b chain [27,28] structure as search model (PDB Id:1Q8Vb, PAL crystal structure). Manual adjustments werecarried out on the models using the DeepView Swiss-Pdbviewer 4.0.1 and Rasmol 2.7.5. Relative similarity of fit wasdetermined by pairwise measurements of the root meansquare deviation (rmsd) for Cα atoms of all the residues.
3. Results and discussion
The “bottom-up” strategy based on peptide analysis is themost widely used method for protein identification [17]. Aprotein can be identified by the detection of even a singlepeptide but complexities arise in identifying proteins thatshare extensive homology. Theymay be isoforms due to singlebase substitutions or the alternatively spliced products of agene. The presence of truncated genes or sequence arisingfrom technical errors and existence of the same sequenceunder different gene names, complicate protein databasefurther [29]. Existence of several isoforms was observed inFenneropenaeus merguiensis lectin [30], Crocus sativus lectin [31],Acacia constricta lectin [8].
In the present study six isoforms of SL-I lectin expressed inthe stem of A. hypogaea plants unambiguously named as A1,A2, A3, A4, A5, and A6 were identified and their amino acidsequences were determined by peptide mass fingerprinting(PMF) and tandem mass spectrometric (MS/MS) analysis oftryptic peptides. Prior information of all submittedA. hypogaealectinswas very useful to investigate the presence of isoformicvariants. A similar type of analysis was carried out to
1576 J O U R N A L O F P R O T E O M I C S 7 3 ( 2 0 1 0 ) 1 5 7 3 – 1 5 8 6
characterize the 2S albumin isoforms from Brazil nuts(Bertholletia excelsa) [32] and the chitin binding lectin isoformsfrom mistletoe Viscum album L extracts [33].
3.1. Purification and identification of protein by massspectrometry
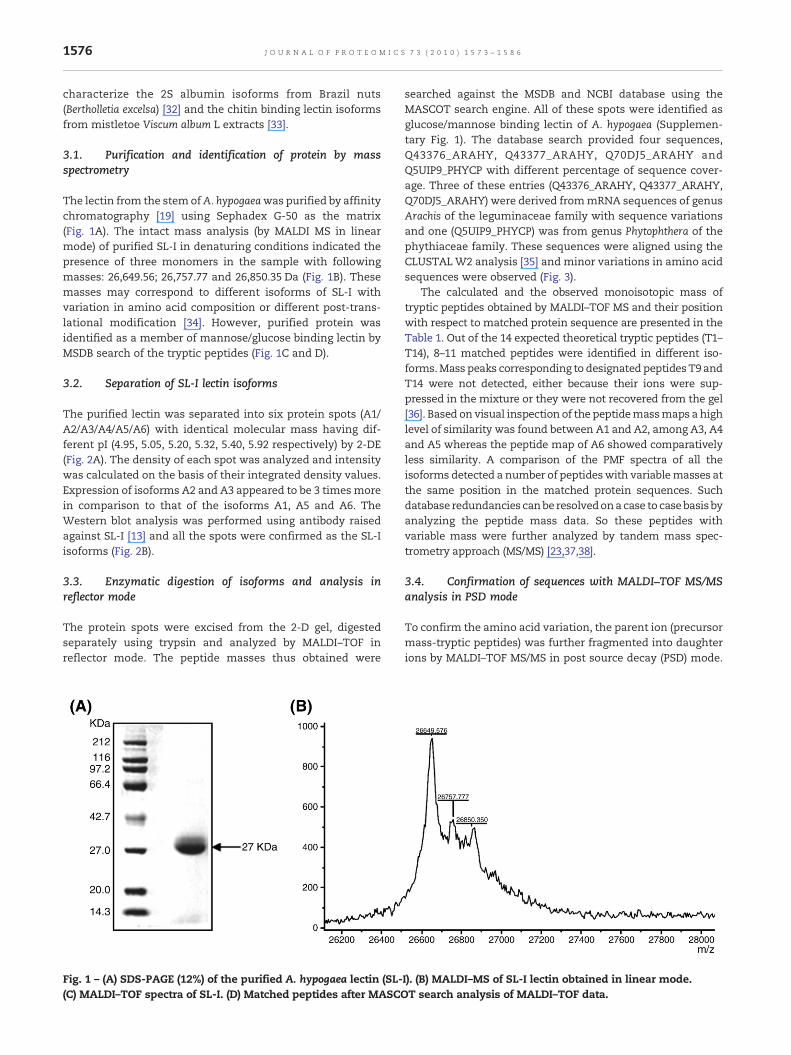
The lectin from the stemofA. hypogaeawas purified by affinitychromatography [19] using Sephadex G-50 as the matrix(Fig. 1A). The intact mass analysis (by MALDI MS in linearmode) of purified SL-I in denaturing conditions indicated thepresence of three monomers in the sample with followingmasses: 26,649.56; 26,757.77 and 26,850.35 Da (Fig. 1B). Thesemasses may correspond to different isoforms of SL-I withvariation in amino acid composition or different post-trans-lational modification [34]. However, purified protein wasidentified as a member of mannose/glucose binding lectin byMSDB search of the tryptic peptides (Fig. 1C and D).
3.2. Separation of SL-I lectin isoforms
The purified lectin was separated into six protein spots (A1/A2/A3/A4/A5/A6) with identical molecular mass having dif-ferent pI (4.95, 5.05, 5.20, 5.32, 5.40, 5.92 respectively) by 2-DE(Fig. 2A). The density of each spot was analyzed and intensitywas calculated on the basis of their integrated density values.Expression of isoforms A2 and A3 appeared to be 3 timesmorein comparison to that of the isoforms A1, A5 and A6. TheWestern blot analysis was performed using antibody raisedagainst SL-I [13] and all the spots were confirmed as the SL-Iisoforms (Fig. 2B).
3.3. Enzymatic digestion of isoforms and analysis inreflector mode
The protein spots were excised from the 2-D gel, digestedseparately using trypsin and analyzed by MALDI–TOF inreflector mode. The peptide masses thus obtained were
Fig. 1 – (A) SDS-PAGE (12%) of the purified A. hypogaea lectin (SL-(C) MALDI–TOF spectra of SL-I. (D) Matched peptides after MASC
searched against the MSDB and NCBI database using theMASCOT search engine. All of these spots were identified asglucose/mannose binding lectin of A. hypogaea (Supplemen-tary Fig. 1). The database search provided four sequences,Q43376_ARAHY, Q43377_ARAHY, Q70DJ5_ARAHY andQ5UIP9_PHYCP with different percentage of sequence cover-age. Three of these entries (Q43376_ARAHY, Q43377_ARAHY,Q70DJ5_ARAHY) were derived frommRNA sequences of genusArachis of the leguminaceae family with sequence variationsand one (Q5UIP9_PHYCP) was from genus Phytophthera of thephythiaceae family. These sequences were aligned using theCLUSTALW2 analysis [35] and minor variations in amino acidsequences were observed (Fig. 3).
The calculated and the observed monoisotopic mass oftryptic peptides obtained by MALDI–TOF MS and their positionwith respect to matched protein sequence are presented in theTable 1. Out of the 14 expected theoretical tryptic peptides (T1–T14), 8–11 matched peptides were identified in different iso-forms.Mass peaks corresponding to designated peptidesT9 andT14 were not detected, either because their ions were sup-pressed in the mixture or they were not recovered from the gel[36]. Based on visual inspection of the peptidemassmaps a highlevel of similarity was found between A1 and A2, among A3, A4and A5 whereas the peptide map of A6 showed comparativelyless similarity. A comparison of the PMF spectra of all theisoforms detected a number of peptideswith variablemasses atthe same position in the matched protein sequences. Suchdatabase redundancies canbe resolvedonacase to casebasisbyanalyzing the peptide mass data. So these peptides withvariable mass were further analyzed by tandem mass spec-trometry approach (MS/MS) [23,37,38].
3.4. Confirmation of sequences with MALDI–TOF MS/MSanalysis in PSD mode
To confirm the amino acid variation, the parent ion (precursormass-tryptic peptides) was further fragmented into daughterions by MALDI–TOF MS/MS in post source decay (PSD) mode.
I). (B) MALDI–MS of SL-I lectin obtained in linear mode.OT search analysis of MALDI–TOF data.
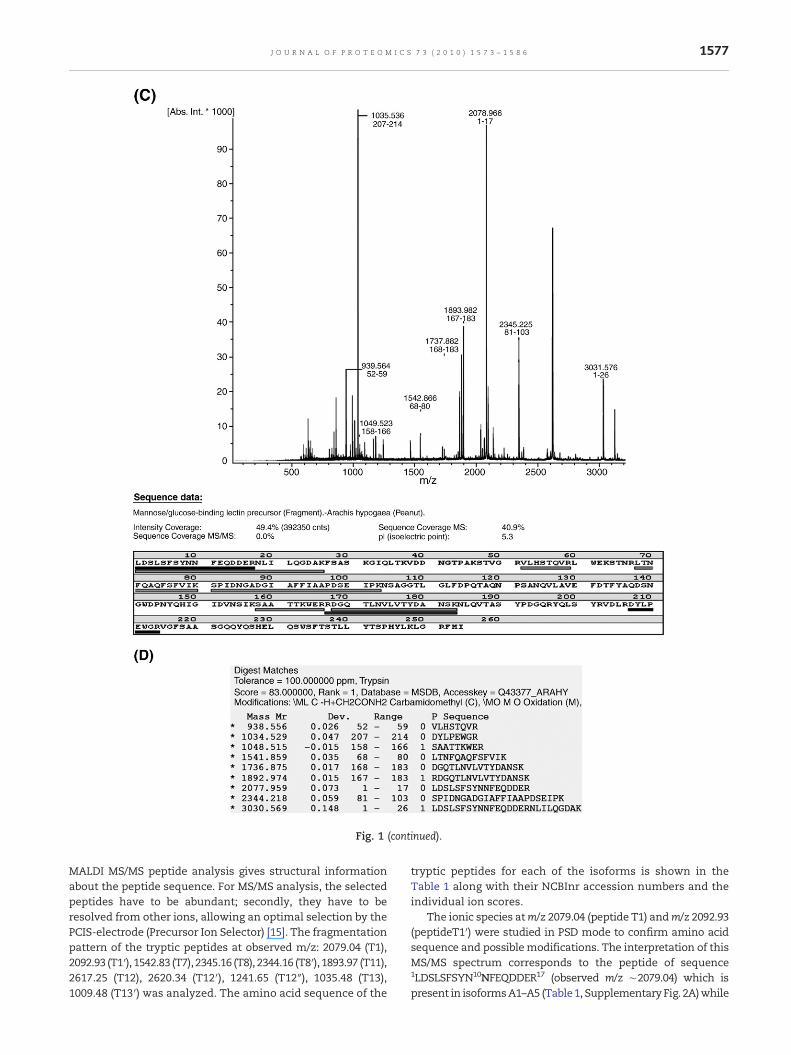
Fig. 1 (continued).
1577J O U R N A L O F P R O T E O M I C S 7 3 ( 2 0 1 0 ) 1 5 7 3 – 1 5 8 6
MALDI MS/MS peptide analysis gives structural informationabout the peptide sequence. For MS/MS analysis, the selectedpeptides have to be abundant; secondly, they have to beresolved from other ions, allowing an optimal selection by thePCIS-electrode (Precursor Ion Selector) [15]. The fragmentationpattern of the tryptic peptides at observed m/z: 2079.04 (T1),2092.93 (T1′), 1542.83 (T7), 2345.16 (T8), 2344.16 (T8′), 1893.97 (T11),2617.25 (T12), 2620.34 (T12′), 1241.65 (T12″), 1035.48 (T13),1009.48 (T13′) was analyzed. The amino acid sequence of the
tryptic peptides for each of the isoforms is shown in theTable 1 along with their NCBInr accession numbers and theindividual ion scores.
The ionic species atm/z 2079.04 (peptide T1) andm/z 2092.93(peptideT1′) were studied in PSD mode to confirm amino acidsequence and possiblemodifications. The interpretation of thisMS/MS spectrum corresponds to the peptide of sequence1LDSLSFSYN10NFEQDDER17 (observed m/z ∼2079.04) which ispresent in isoformsA1–A5 (Table1, SupplementaryFig. 2A)while
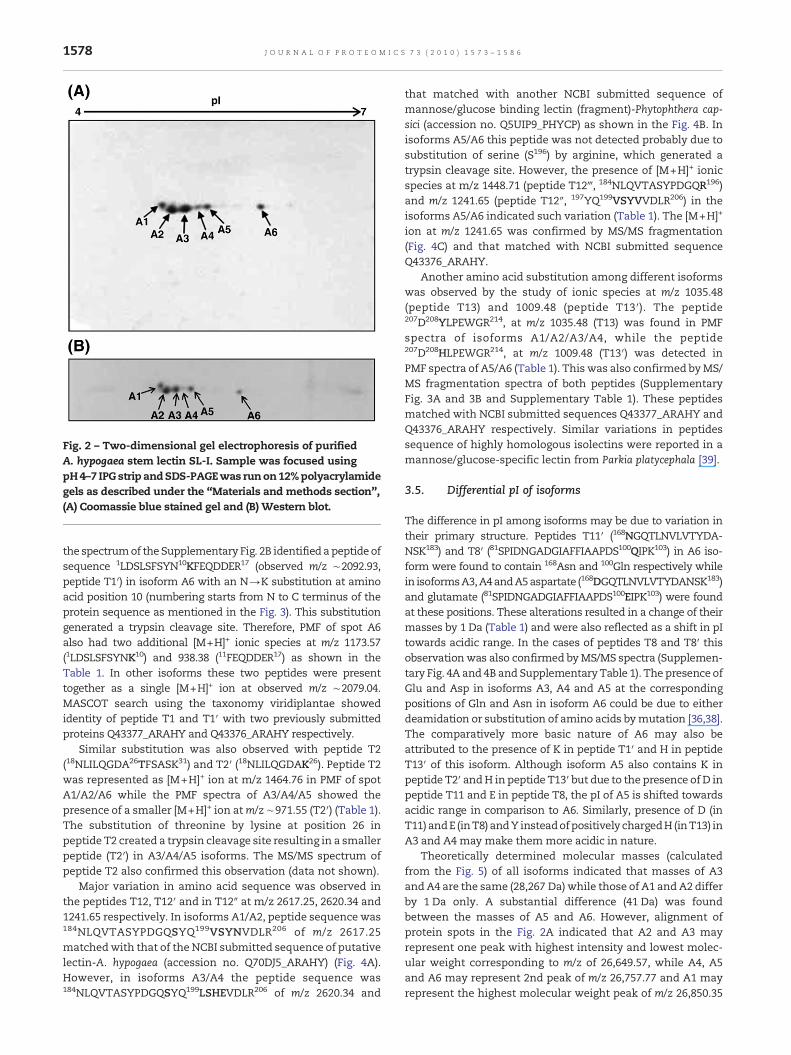
Fig. 2 – Two-dimensional gel electrophoresis of purifiedA. hypogaea stem lectin SL-I. Sample was focused usingpH4–7 IPGstrip andSDS-PAGEwas runon12%polyacrylamidegels as described under the “Materials and methods section”,(A) Coomassie blue stained gel and (B) Western blot.
1578 J O U R N A L O F P R O T E O M I C S 7 3 ( 2 0 1 0 ) 1 5 7 3 – 1 5 8 6
the spectrumof the Supplementary Fig. 2B identified apeptide ofsequence 1LDSLSFSYN10KFEQDDER17 (observed m/z ∼2092.93,peptide T1′) in isoform A6 with an N→K substitution at aminoacid position 10 (numbering starts from N to C terminus of theprotein sequence as mentioned in the Fig. 3). This substitutiongenerated a trypsin cleavage site. Therefore, PMF of spot A6also had two additional [M+H]+ ionic species at m/z 1173.57(1LDSLSFSYNK10) and 938.38 (11FEQDDER17) as shown in theTable 1. In other isoforms these two peptides were presenttogether as a single [M+H]+ ion at observed m/z ∼2079.04.MASCOT search using the taxonomy viridiplantae showedidentity of peptide T1 and T1′ with two previously submittedproteins Q43377_ARAHY and Q43376_ARAHY respectively.
Similar substitution was also observed with peptide T2(18NLILQGDA26TFSASK31) and T2′ (18NLILQGDAK26). Peptide T2was represented as [M+H]+ ion at m/z 1464.76 in PMF of spotA1/A2/A6 while the PMF spectra of A3/A4/A5 showed thepresence of a smaller [M+H]+ ion atm/z ∼971.55 (T2′) (Table 1).The substitution of threonine by lysine at position 26 inpeptide T2 created a trypsin cleavage site resulting in a smallerpeptide (T2′) in A3/A4/A5 isoforms. The MS/MS spectrum ofpeptide T2 also confirmed this observation (data not shown).
Major variation in amino acid sequence was observed inthe peptides T12, T12′ and in T12″ at m/z 2617.25, 2620.34 and1241.65 respectively. In isoforms A1/A2, peptide sequence was184NLQVTASYPDGQSYQ199VSYNVDLR206 of m/z 2617.25matchedwith that of the NCBI submitted sequence of putativelectin-A. hypogaea (accession no. Q70DJ5_ARAHY) (Fig. 4A).However, in isoforms A3/A4 the peptide sequence was184NLQVTASYPDGQSYQ199LSHEVDLR206 of m/z 2620.34 and
that matched with another NCBI submitted sequence ofmannose/glucose binding lectin (fragment)-Phytophthera cap-sici (accession no. Q5UIP9_PHYCP) as shown in the Fig. 4B. Inisoforms A5/A6 this peptide was not detected probably due tosubstitution of serine (S196) by arginine, which generated atrypsin cleavage site. However, the presence of [M+H]+ ionicspecies at m/z 1448.71 (peptide T12‴, 184NLQVTASYPDGQR196)and m/z 1241.65 (peptide T12″, 197YQ199VSYVVDLR206) in theisoforms A5/A6 indicated such variation (Table 1). The [M+H]+
ion at m/z 1241.65 was confirmed by MS/MS fragmentation(Fig. 4C) and that matched with NCBI submitted sequenceQ43376_ARAHY.
Another amino acid substitution among different isoformswas observed by the study of ionic species at m/z 1035.48(peptide T13) and 1009.48 (peptide T13′). The peptide207D208YLPEWGR214, at m/z 1035.48 (T13) was found in PMFspectra of isoforms A1/A2/A3/A4, while the peptide207D208HLPEWGR214, at m/z 1009.48 (T13′) was detected inPMF spectra of A5/A6 (Table 1). This was also confirmed byMS/MS fragmentation spectra of both peptides (SupplementaryFig. 3A and 3B and Supplementary Table 1). These peptidesmatched with NCBI submitted sequences Q43377_ARAHY andQ43376_ARAHY respectively. Similar variations in peptidessequence of highly homologous isolectins were reported in amannose/glucose-specific lectin from Parkia platycephala [39].
3.5. Differential pI of isoforms
The difference in pI among isoforms may be due to variation intheir primary structure. Peptides T11′ (168NGQTLNVLVTYDA-NSK183) and T8′ (81SPIDNGADGIAFFIAAPDS100QIPK103) in A6 iso-form were found to contain 168Asn and 100Gln respectively whilein isoformsA3,A4andA5aspartate (168DGQTLNVLVTYDANSK183)and glutamate (81SPIDNGADGIAFFIAAPDS100EIPK103) were foundat these positions. These alterations resulted in a change of theirmasses by 1 Da (Table 1) and were also reflected as a shift in pItowards acidic range. In the cases of peptides T8 and T8′ thisobservationwas also confirmed byMS/MS spectra (Supplemen-tary Fig. 4A and 4B and Supplementary Table 1). The presence ofGlu and Asp in isoforms A3, A4 and A5 at the correspondingpositions of Gln and Asn in isoform A6 could be due to eitherdeamidation or substitution of amino acids bymutation [36,38].The comparatively more basic nature of A6 may also beattributed to the presence of K in peptide T1′ and H in peptideT13′ of this isoform. Although isoform A5 also contains K inpeptide T2′ andH in peptide T13′ but due to the presence of D inpeptide T11 and E in peptide T8, the pI of A5 is shifted towardsacidic range in comparison to A6. Similarly, presence of D (inT11) andE (inT8) andY insteadofpositively chargedH (inT13) inA3 and A4 may make them more acidic in nature.
Theoretically determined molecular masses (calculatedfrom the Fig. 5) of all isoforms indicated that masses of A3andA4 are the same (28,267 Da) while those of A1 and A2 differby 1 Da only. A substantial difference (41 Da) was foundbetween the masses of A5 and A6. However, alignment ofprotein spots in the Fig. 2A indicated that A2 and A3 mayrepresent one peak with highest intensity and lowest molec-ular weight corresponding to m/z of 26,649.57, while A4, A5and A6 may represent 2nd peak of m/z 26,757.77 and A1 mayrepresent the highest molecular weight peak of m/z 26,850.35
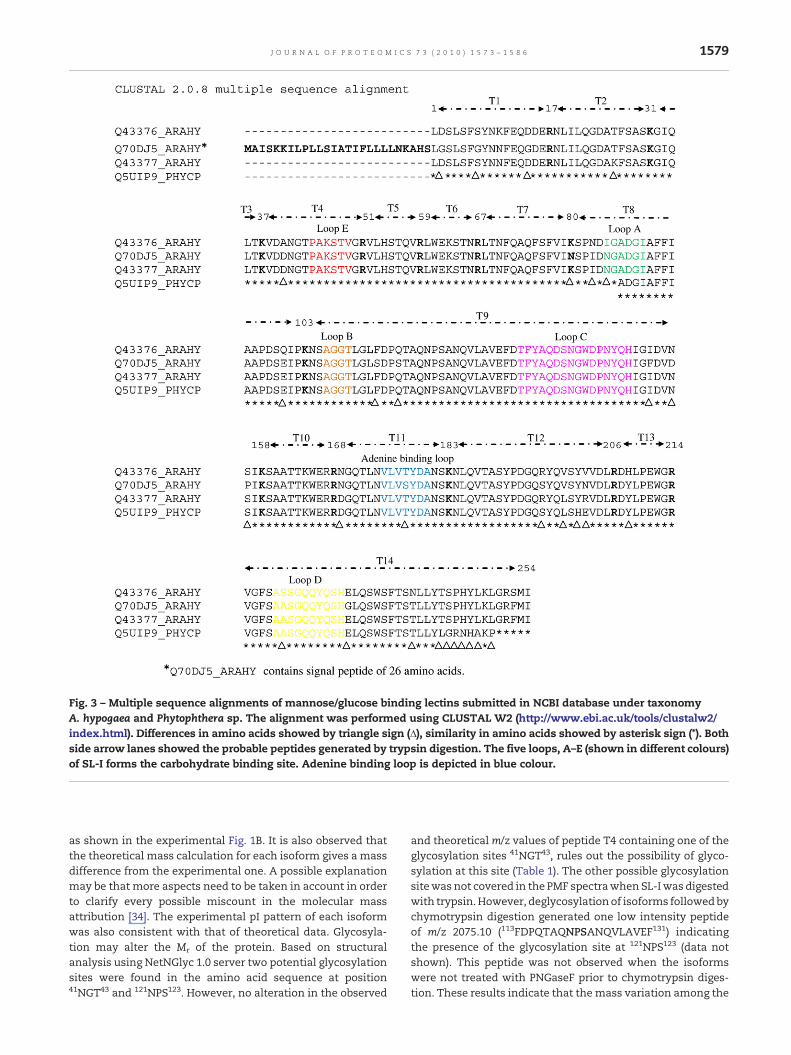
Fig. 3 – Multiple sequence alignments of mannose/glucose binding lectins submitted in NCBI database under taxonomyA. hypogaea and Phytophthera sp. The alignment was performed using CLUSTAL W2 (http://www.ebi.ac.uk/tools/clustalw2/index.html). Differences in amino acids showed by triangle sign (Δ), similarity in amino acids showed by asterisk sign (*). Bothside arrow lanes showed the probable peptides generated by trypsin digestion. The five loops, A–E (shown in different colours)of SL-I forms the carbohydrate binding site. Adenine binding loop is depicted in blue colour.
1579J O U R N A L O F P R O T E O M I C S 7 3 ( 2 0 1 0 ) 1 5 7 3 – 1 5 8 6
as shown in the experimental Fig. 1B. It is also observed thatthe theoretical mass calculation for each isoform gives a massdifference from the experimental one. A possible explanationmay be that more aspects need to be taken in account in orderto clarify every possible miscount in the molecular massattribution [34]. The experimental pI pattern of each isoformwas also consistent with that of theoretical data. Glycosyla-tion may alter the Mr of the protein. Based on structuralanalysis using NetNGlyc 1.0 server two potential glycosylationsites were found in the amino acid sequence at position41NGT43 and 121NPS123. However, no alteration in the observed
and theoretical m/z values of peptide T4 containing one of theglycosylation sites 41NGT43, rules out the possibility of glyco-sylation at this site (Table 1). The other possible glycosylationsitewasnot covered in the PMF spectrawhenSL-Iwas digestedwith trypsin.However, deglycosylationof isoforms followedbychymotrypsin digestion generated one low intensity peptideof m/z 2075.10 (113FDPQTAQNPSANQVLAVEF131) indicatingthe presence of the glycosylation site at 121NPS123 (data notshown). This peptide was not observed when the isoformswere not treated with PNGaseF prior to chymotrypsin diges-tion. These results indicate that themass variation among the
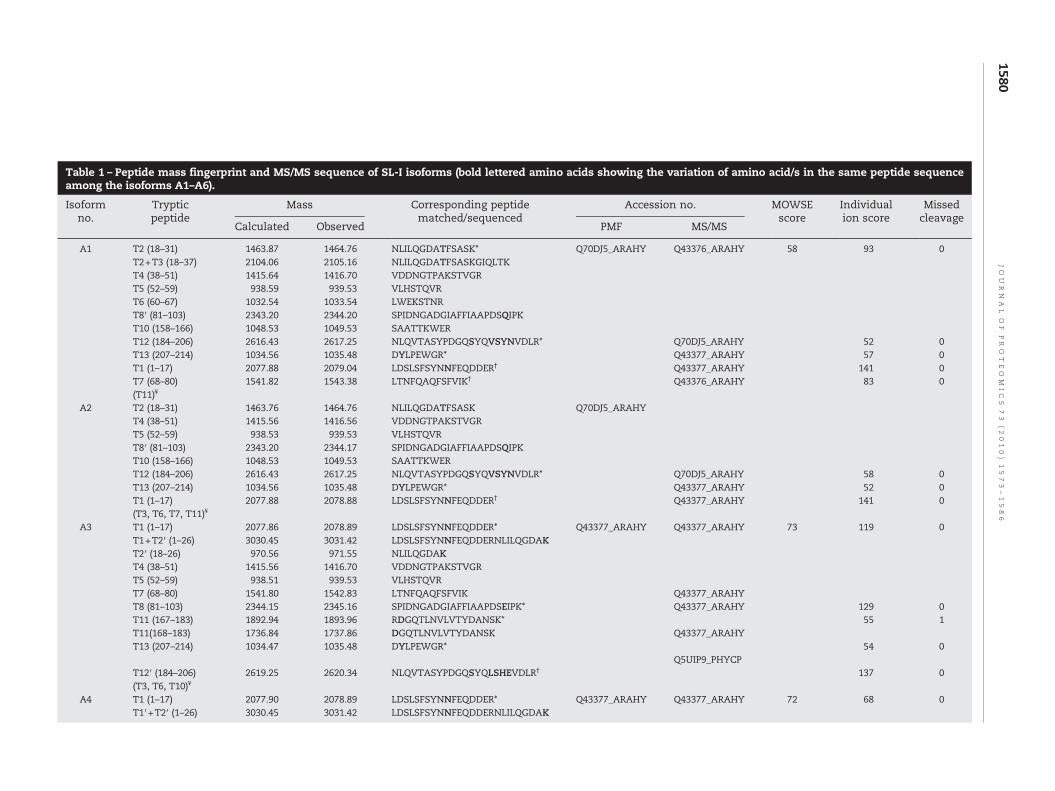
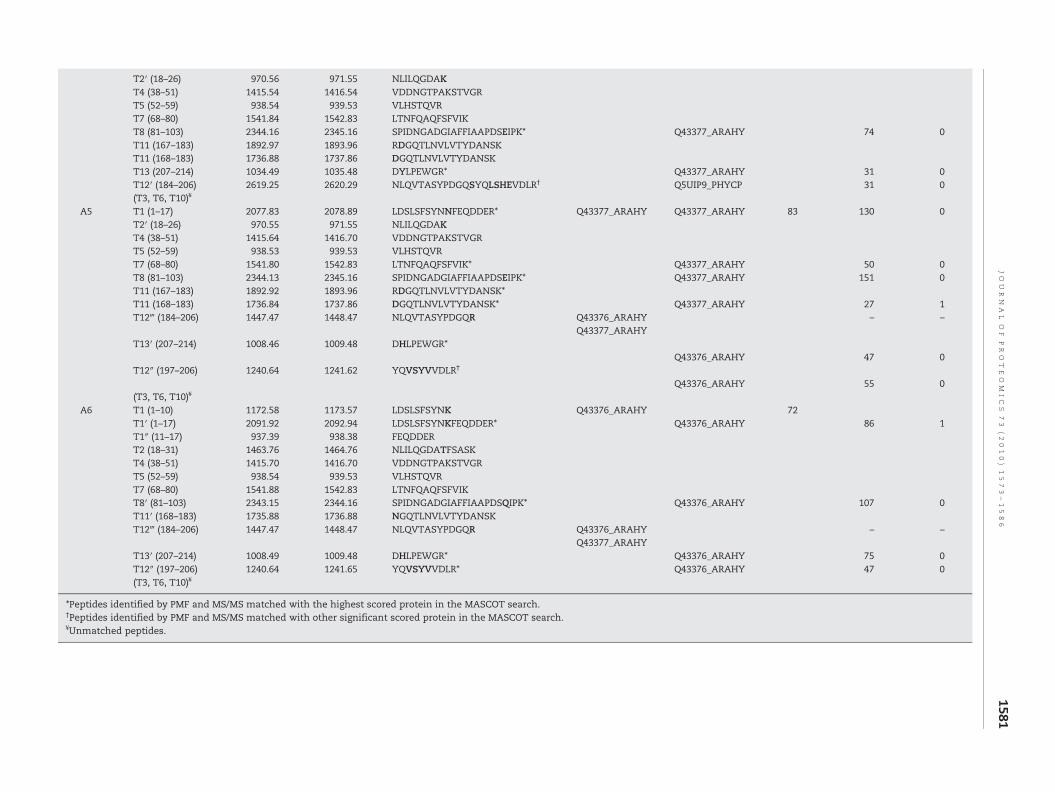
Table 1 – Peptide mass fingerprint and MS/MS sequence of SL-I isoforms (bold lettered amino acids showing the variation of amino acid/s in the same peptide sequenceamong the isoforms A1–A6).
Isoformno.
Trypticpeptide
Mass Corresponding peptidematched/sequenced
Accession no. MOWSEscore
Individualion score
Missedcleavage
Calculated Observed PMF MS/MS
A1 T2 (18–31) 1463.87 1464.76 NLILQGDATFSASK* Q70DJ5_ARAHY Q43376_ARAHY 58 93 0T2+T3 (18–37) 2104.06 2105.16 NLILQGDATFSASKGIQLTKT4 (38–51) 1415.64 1416.70 VDDNGTPAKSTVGRT5 (52–59) 938.59 939.53 VLHSTQVRT6 (60–67) 1032.54 1033.54 LWEKSTNRT8′ (81–103) 2343.20 2344.20 SPIDNGADGIAFFIAAPDSQIPKT10 (158–166) 1048.53 1049.53 SAATTKWERT12 (184–206) 2616.43 2617.25 NLQVTASYPDGQSYQVSYNVDLR* Q70DJ5_ARAHY 52 0T13 (207–214) 1034.56 1035.48 DYLPEWGR* Q43377_ARAHY 57 0T1 (1–17) 2077.88 2079.04 LDSLSFSYNNFEQDDER† Q43377_ARAHY 141 0T7 (68–80) 1541.82 1543.38 LTNFQAQFSFVIK† Q43376_ARAHY 83 0(T11)¥
A2 T2 (18–31) 1463.76 1464.76 NLILQGDATFSASK Q70DJ5_ARAHYT4 (38–51) 1415.56 1416.56 VDDNGTPAKSTVGRT5 (52–59) 938.53 939.53 VLHSTQVRT8′ (81–103) 2343.20 2344.17 SPIDNGADGIAFFIAAPDSQIPKT10 (158–166) 1048.53 1049.53 SAATTKWERT12 (184–206) 2616.43 2617.25 NLQVTASYPDGQSYQVSYNVDLR* Q70DJ5_ARAHY 58 0T13 (207–214) 1034.56 1035.48 DYLPEWGR* Q43377_ARAHY 52 0T1 (1–17) 2077.88 2078.88 LDSLSFSYNNFEQDDER† Q43377_ARAHY 141 0(T3, T6, T7, T11)¥
A3 T1 (1–17) 2077.86 2078.89 LDSLSFSYNNFEQDDER* Q43377_ARAHY Q43377_ARAHY 73 119 0T1+T2′ (1–26) 3030.45 3031.42 LDSLSFSYNNFEQDDERNLILQGDAKT2′ (18–26) 970.56 971.55 NLILQGDAKT4 (38–51) 1415.56 1416.70 VDDNGTPAKSTVGRT5 (52–59) 938.51 939.53 VLHSTQVRT7 (68–80) 1541.80 1542.83 LTNFQAQFSFVIK Q43377_ARAHYT8 (81–103) 2344.15 2345.16 SPIDNGADGIAFFIAAPDSEIPK* Q43377_ARAHY 129 0T11 (167–183) 1892.94 1893.96 RDGQTLNVLVTYDANSK* 55 1T11(168–183) 1736.84 1737.86 DGQTLNVLVTYDANSK Q43377_ARAHYT13 (207–214) 1034.47 1035.48 DYLPEWGR* 54 0
Q5UIP9_PHYCPT12′ (184–206) 2619.25 2620.34 NLQVTASYPDGQSYQLSHEVDLR† 137 0(T3, T6, T10)¥
A4 T1 (1–17) 2077.90 2078.89 LDSLSFSYNNFEQDDER* Q43377_ARAHY Q43377_ARAHY 72 68 0T1′+T2′ (1–26) 3030.45 3031.42 LDSLSFSYNNFEQDDERNLILQGDAK
1580JO
UR
NA
LO
FPR
OT
EO
MIC
S73
(2010)
1573–1586
T2′ (18–26) 970.56 971.55 NLILQGDAKT4 (38–51) 1415.54 1416.54 VDDNGTPAKSTVGRT5 (52–59) 938.54 939.53 VLHSTQVRT7 (68–80) 1541.84 1542.83 LTNFQAQFSFVIKT8 (81–103) 2344.16 2345.16 SPIDNGADGIAFFIAAPDSEIPK* Q43377_ARAHY 74 0T11 (167–183) 1892.97 1893.96 RDGQTLNVLVTYDANSKT11 (168–183) 1736.88 1737.86 DGQTLNVLVTYDANSKT13 (207–214) 1034.49 1035.48 DYLPEWGR* Q43377_ARAHY 31 0T12′ (184–206) 2619.25 2620.29 NLQVTASYPDGQSYQLSHEVDLR† Q5UIP9_PHYCP 31 0(T3, T6, T10)¥
A5 T1 (1–17) 2077.83 2078.89 LDSLSFSYNNFEQDDER* Q43377_ARAHY Q43377_ARAHY 83 130 0T2′ (18–26) 970.55 971.55 NLILQGDAKT4 (38–51) 1415.64 1416.70 VDDNGTPAKSTVGRT5 (52–59) 938.53 939.53 VLHSTQVRT7 (68–80) 1541.80 1542.83 LTNFQAQFSFVIK* Q43377_ARAHY 50 0T8 (81–103) 2344.13 2345.16 SPIDNGADGIAFFIAAPDSEIPK* Q43377_ARAHY 151 0T11 (167–183) 1892.92 1893.96 RDGQTLNVLVTYDANSK*T11 (168–183) 1736.84 1737.86 DGQTLNVLVTYDANSK* Q43377_ARAHY 27 1T12‴ (184–206) 1447.47 1448.47 NLQVTASYPDGQR Q43376_ARAHY – –
Q43377_ARAHYT13′ (207–214) 1008.46 1009.48 DHLPEWGR*
Q43376_ARAHY 47 0T12″ (197–206) 1240.64 1241.62 YQVSYVVDLR†
Q43376_ARAHY 55 0(T3, T6, T10)¥
A6 T1 (1–10) 1172.58 1173.57 LDSLSFSYNK Q43376_ARAHY 72T1′ (1–17) 2091.92 2092.94 LDSLSFSYNKFEQDDER* Q43376_ARAHY 86 1T1″ (11–17) 937.39 938.38 FEQDDERT2 (18–31) 1463.76 1464.76 NLILQGDATFSASKT4 (38–51) 1415.70 1416.70 VDDNGTPAKSTVGRT5 (52–59) 938.54 939.53 VLHSTQVRT7 (68–80) 1541.88 1542.83 LTNFQAQFSFVIKT8′ (81–103) 2343.15 2344.16 SPIDNGADGIAFFIAAPDSQIPK* Q43376_ARAHY 107 0T11′ (168–183) 1735.88 1736.88 NGQTLNVLVTYDANSKT12‴ (184–206) 1447.47 1448.47 NLQVTASYPDGQR Q43376_ARAHY – –
Q43377_ARAHYT13′ (207–214) 1008.49 1009.48 DHLPEWGR* Q43376_ARAHY 75 0T12″ (197–206) 1240.64 1241.65 YQVSYVVDLR* Q43376_ARAHY 47 0(T3, T6, T10)¥
*Peptides identified by PMF and MS/MS matched with the highest scored protein in the MASCOT search.†Peptides identified by PMF and MS/MS matched with other significant scored protein in the MASCOT search.¥Unmatched peptides.
1581JO
UR
NA
LO
FPR
OT
EO
MIC
S73
(2010)
1573–1586
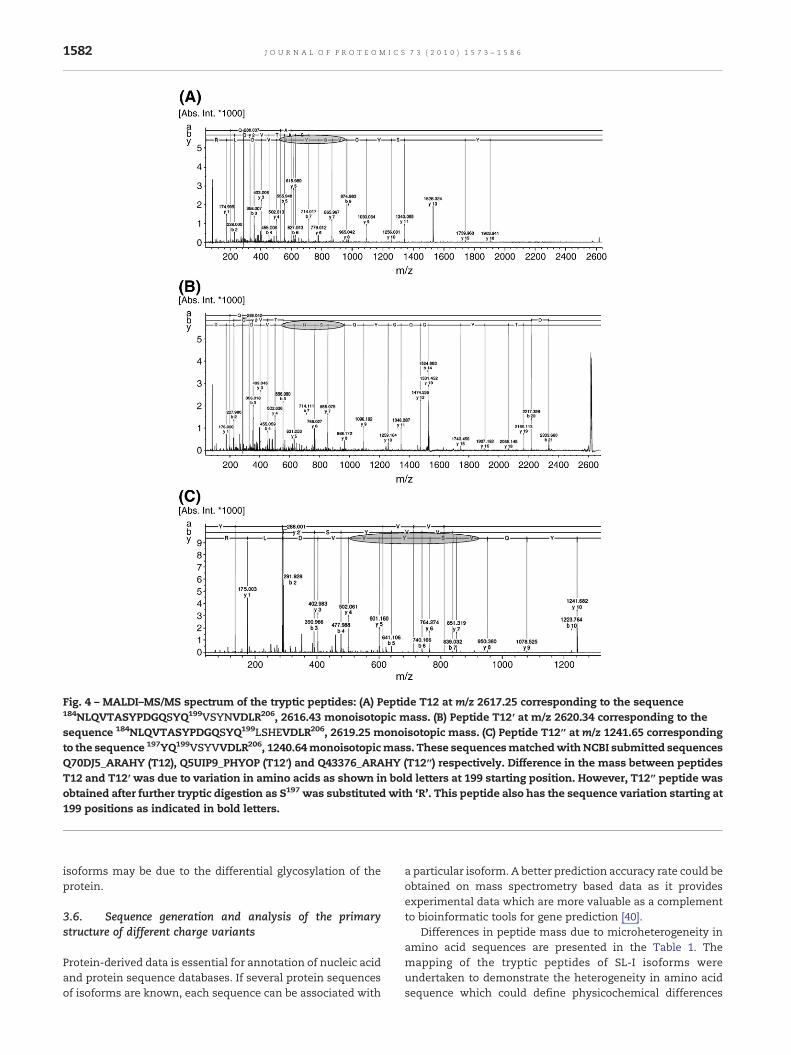
Fig. 4 – MALDI–MS/MS spectrum of the tryptic peptides: (A) Peptide T12 at m/z 2617.25 corresponding to the sequence184NLQVTASYPDGQSYQ199VSYNVDLR206, 2616.43 monoisotopic mass. (B) Peptide T12′ at m/z 2620.34 corresponding to thesequence 184NLQVTASYPDGQSYQ199LSHEVDLR206, 2619.25 monoisotopic mass. (C) Peptide T12″ at m/z 1241.65 correspondingto the sequence 197YQ199VSYVVDLR206, 1240.64monoisotopicmass. These sequencesmatchedwithNCBI submitted sequencesQ70DJ5_ARAHY (T12), Q5UIP9_PHYOP (T12′) and Q43376_ARAHY (T12″) respectively. Difference in the mass between peptidesT12 and T12′ was due to variation in amino acids as shown in bold letters at 199 starting position. However, T12″ peptide wasobtained after further tryptic digestion as S197 was substituted with ‘R’. This peptide also has the sequence variation starting at199 positions as indicated in bold letters.
1582 J O U R N A L O F P R O T E O M I C S 7 3 ( 2 0 1 0 ) 1 5 7 3 – 1 5 8 6
isoforms may be due to the differential glycosylation of theprotein.
3.6. Sequence generation and analysis of the primarystructure of different charge variants
Protein-derived data is essential for annotation of nucleic acidand protein sequence databases. If several protein sequencesof isoforms are known, each sequence can be associated with
a particular isoform. A better prediction accuracy rate could beobtained on mass spectrometry based data as it providesexperimental data which are more valuable as a complementto bioinformatic tools for gene prediction [40].
Differences in peptide mass due to microheterogeneity inamino acid sequences are presented in the Table 1. Themapping of the tryptic peptides of SL-I isoforms wereundertaken to demonstrate the heterogeneity in amino acidsequence which could define physicochemical differences
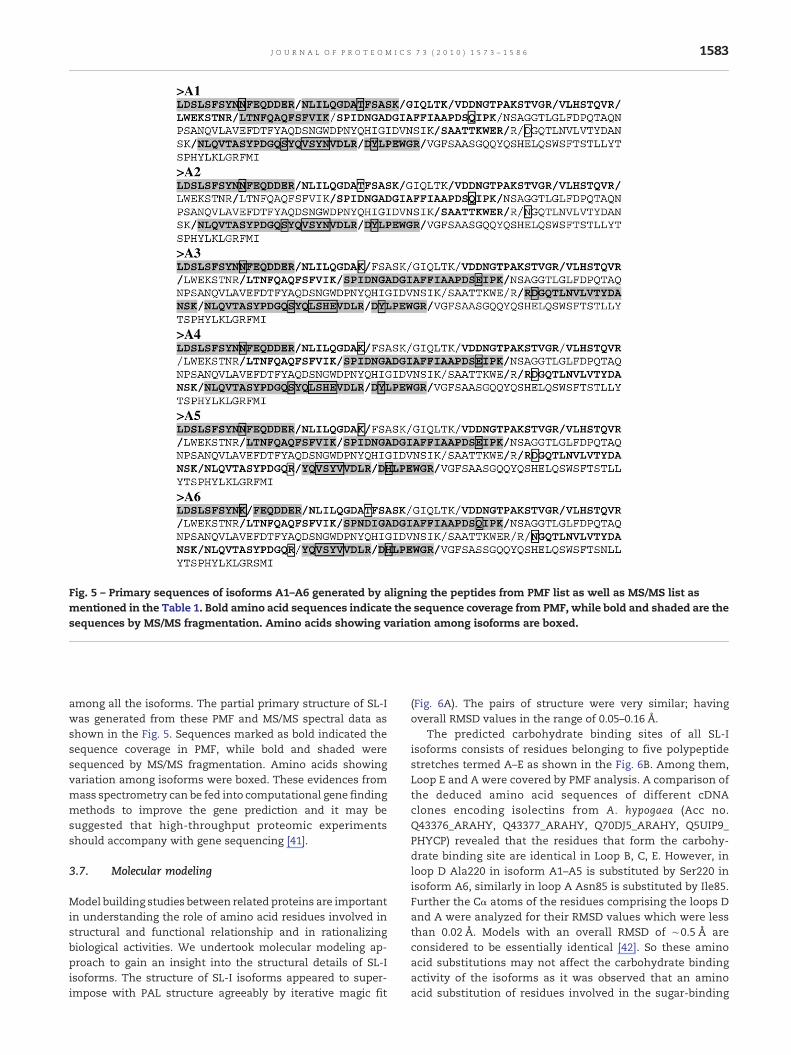
Fig. 5 – Primary sequences of isoforms A1–A6 generated by aligning the peptides from PMF list as well as MS/MS list asmentioned in the Table 1. Bold amino acid sequences indicate the sequence coverage from PMF, while bold and shaded are thesequences by MS/MS fragmentation. Amino acids showing variation among isoforms are boxed.
1583J O U R N A L O F P R O T E O M I C S 7 3 ( 2 0 1 0 ) 1 5 7 3 – 1 5 8 6
among all the isoforms. The partial primary structure of SL-Iwas generated from these PMF and MS/MS spectral data asshown in the Fig. 5. Sequences marked as bold indicated thesequence coverage in PMF, while bold and shaded weresequenced by MS/MS fragmentation. Amino acids showingvariation among isoforms were boxed. These evidences frommass spectrometry can be fed into computational gene findingmethods to improve the gene prediction and it may besuggested that high-throughput proteomic experimentsshould accompany with gene sequencing [41].
3.7. Molecular modeling
Model building studies between related proteins are importantin understanding the role of amino acid residues involved instructural and functional relationship and in rationalizingbiological activities. We undertook molecular modeling ap-proach to gain an insight into the structural details of SL-Iisoforms. The structure of SL-I isoforms appeared to super-impose with PAL structure agreeably by iterative magic fit
(Fig. 6A). The pairs of structure were very similar; havingoverall RMSD values in the range of 0.05–0.16 Å.
The predicted carbohydrate binding sites of all SL-Iisoforms consists of residues belonging to five polypeptidestretches termed A–E as shown in the Fig. 6B. Among them,Loop E and A were covered by PMF analysis. A comparison ofthe deduced amino acid sequences of different cDNAclones encoding isolectins from A. hypogaea (Acc no.Q43376_ARAHY, Q43377_ARAHY, Q70DJ5_ARAHY, Q5UIP9_PHYCP) revealed that the residues that form the carbohy-drate binding site are identical in Loop B, C, E. However, inloop D Ala220 in isoform A1–A5 is substituted by Ser220 inisoform A6, similarly in loop A Asn85 is substituted by Ile85.Further the Cα atoms of the residues comprising the loops Dand A were analyzed for their RMSD values which were lessthan 0.02 Å. Models with an overall RMSD of ∼0.5 Å areconsidered to be essentially identical [42]. So these aminoacid substitutions may not affect the carbohydrate bindingactivity of the isoforms as it was observed that an aminoacid substitution of residues involved in the sugar-binding
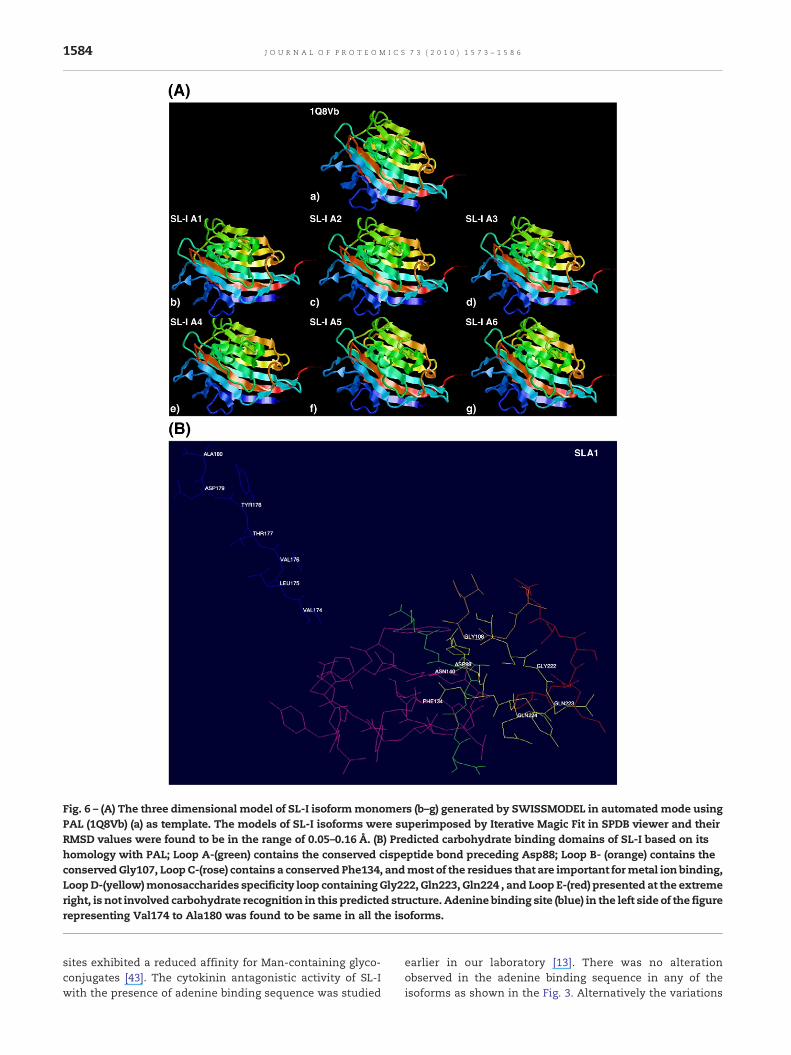
Fig. 6 – (A) The three dimensional model of SL-I isoformmonomers (b–g) generated by SWISSMODEL in automated mode usingPAL (1Q8Vb) (a) as template. The models of SL-I isoforms were superimposed by Iterative Magic Fit in SPDB viewer and theirRMSD values were found to be in the range of 0.05–0.16 Å. (B) Predicted carbohydrate binding domains of SL-I based on itshomology with PAL; Loop A-(green) contains the conserved cispeptide bond preceding Asp88; Loop B- (orange) contains theconservedGly107, LoopC-(rose) contains a conserved Phe134, andmost of the residues that are important formetal ion binding,LoopD-(yellow)monosaccharides specificity loop containingGly222, Gln223, Gln224 , and Loop E-(red) presented at the extremeright, is not involved carbohydrate recognition in this predicted structure. Adenine binding site (blue) in the left side of the figurerepresenting Val174 to Ala180 was found to be same in all the isoforms.
1584 J O U R N A L O F P R O T E O M I C S 7 3 ( 2 0 1 0 ) 1 5 7 3 – 1 5 8 6
sites exhibited a reduced affinity for Man-containing glyco-conjugates [43]. The cytokinin antagonistic activity of SL-Iwith the presence of adenine binding sequence was studied
earlier in our laboratory [13]. There was no alterationobserved in the adenine binding sequence in any of theisoforms as shown in the Fig. 3. Alternatively the variations
1585J O U R N A L O F P R O T E O M I C S 7 3 ( 2 0 1 0 ) 1 5 7 3 – 1 5 8 6
in amino acid sequences of the isoforms are consequentialto preserve their carbohydrate as well as adenine bindingsites. The reason for existence of protein isoforms may be anadaptive mechanism to overcome the deleterious effectsagainst a particular form of protein. This was observed withloxnecrogin isoforms [10], anti insect like proteins [44] andwith some protease inhibitors [45]. The sequence heteroge-neity in some case may provide differential recognition ofvarious isoforms [46]. Whether all these isoforms have thesame affinity for a specific carbohydrate or cytokinin mayonly be evaluated by expressing the cDNAs of all theisoforms in future.
Acknowledgements
Authors wish to thank Prof. R. H. Das, School of Biotechnology,Guru Gobind Singh Indraprastha University, Delhi for goingthrough themanuscript critically. Authors gratefully acknowl-edge Somdutta Sen and Reena Arora, The Centre for GenomicApplication (TCGA), Delhi, for help in interpretation of massspectrometric data. PraveenAgrawal is thankful to the Councilof Scientific and Industrial Research (CSIR), New Delhi, Indiafor awarding the Senior Research Fellowship.
Appendix A. Supplementary data
Supplementary data associated with this article can be found,in the online version, at doi:10.1016/j.jprot.2010.03.006.
R E F E R E N C E S
[1] Goldstein IJ, Hughes RC, Monsigny M, Osawa T, Sharon N.What should be called a lectin? Nature 1980;285:66.
[2] Kocourek J, Horejsi V. Defining a lectin. Nature 1981;290:188.[3] Dodd RB, Drickamer K. Lectin-like proteins in model
organisms: implications for evolution ofcarbohydrate-binding activity. Glycobiology2001;11:71R–9R.
[4] Van Damme EJ, Van Leuven F, Peumans WJ. Isolation,characterization and molecular cloning of the bark lectinsfrom Maackia amurensis. Glycoconj J 1997;14:449–56.
[5] Etzler ME. Plant lectins: molecular and biological aspects. AnnRev Plant Physiol 1985;36:209–34.
[6] Van Damme EJ, Barre A, Smeets K, Torrekens S, Van Leuven F,Rouge P, et al. The bark of Robinia pseudoaccacia contains acomplex mixture of lectins. Plant Physiol1995;107:833–43.
[7] Bonneil E, Young NM, Lis H, Sharon N, Thibault P. Probinggenetic variation and glycoform distribution in lectins of theErythrina genus bymass spectrometry. Arch Biochem Biophys2004;426:241–9.
[8] Guzman-Partida AM, Robles-Burgueno MR, Ortega-Nieblas M,Vazquez-Moreno I. Purification and characterization ofcomplex carbohydrate specific isolectins from wild legumeseeds: Acacia constricta is (vinorama) highly homologous toPhaseolus vulgaris lectins. Biochimie 2004;86:335–42.
[9] Hernandez P, Debray H, Jaekel H, Garfias Y, Jimenez Md MdelC, Martinez-Cairo S, Zentenoo E. Chemical characterizationof the lectin from Amaranthus leucocarpus syn.
Hypocondriacus by 2-D proteome analysis. Glycoconj J2001;18:321–9.
[10] Machado LF, Laugesen S, Botelho ED, Ricart CA, Fontes W,Barbaro KC, et al. Proteome analysis of brown spider venom:identification of loxnecrogin isoforms in Loxosceles gauchovenom. Proteomics 2005;5:2167–76.
[11] Zhu Y, Ng PM, Wang L, Ho B, Ding JL. Diversity in lectinsenables immune recognition and differentiation of widespectrum of pathogens. Int Immunol 2006;18:1671–80.
[12] Singh R, Gautam H, Jayaraman V, Nair G, Das H. Vegetativetissue lectins of peanut (A. hypogaea). Indian J BiochemBiophys 1997;34:72–5.
[13] Pathak M, Singh B, Sharma A, Agrawal P, Pasha S, DasHR, et al. Molecular cloning, expression, and cytokinin(6-benzylaminopurine) antagonist activity of peanut(Arachis hypogaea) lectin SL-I. Plant Mol Biol 2006;62:529–45.
[14] Chamrad DC, Korting G, Stuhler K, Meyer HE, Klose J, BluggelM. Evaluation of algorithms for protein identification fromsequence databases using mass spectrometry data.Proteomics 2004;4:619–28.
[15] Hardouin J, Hubert-Roux M, Delmas AF, Lange C.Identification of isoenzymes using matrix-assisted laserdesorption/ionization time-of-flight mass spectrometry.Rapid Commun Mass Spectrom 2006;20:725–32.
[16] Arnott D, Gawinowicz MA, Kowalak JA, LaneWS, Speicher KD,Turck CW, et al. ABRF-PRG04: differentiation of proteinisoforms. J Biomol Tech 2007;18:124–34.
[17] Claverol S, Burlet-Schiltz O, Gairin JE, Monsarrat B.Characterization of protein variants and post-translationalmodifications: ESI–MS analyses of intact protein eluted frompolyacrylamide gels. Mol Cell Proteomics 2003;2:483–93.
[18] Ghafouri B, Kihlstrom E, Tagesson C, Lindahl M. PLUNC inhuman nasal lavage fluid: multiple isoforms that bind tolipopolysaccharide. Biochim Biophys Acta 2004;1699:57–63.
[19] Singh R, Das HR. Purification of lectins from the stems ofpeanut plants. Glycoconj J 1994;11:282–5.
[20] Laemmli UK. Cleavage of structural proteins during theassembly of the head of bacteriophage T4. Nature 1970;227:680–5.
[21] Raghav SK, Gupta B, Shrivastava A, Das HR. Inhibition oflipopolysaccharide-inducible nitric oxide synthase andIL-1beta through suppression of NF-kappaB activation by3-(1′-1′-dimethyl-allyl)-6-hydroxy-7-methoxy-coumarinisolated from Ruta graveolens L. Eur J Pharmacol 2007;560:69–80.
[22] Speicher K, Kolbas O, Harper S, Speicher D. Systematicanalysis of peptide recoveries from in-gel digestions forprotein identifications in proteome studies. J Biomol Tech2000;11:74–86.
[23] Christiansen M, Jorgensen CS, Laursen I, Hirschberg D, HojrupP, Houen G. Protein chemical characterization of Gc globulin(vitamin D-binding protein) isoforms; Gc-1f, Gc-1s and Gc-2.Biochim Biophys Acta 2007;1774:481–92.
[24] Nordhoff E, Schurenberg M, Thiele G, Lubbert C, Kloeppel K,Theiss D, et al. Sample preparation protocols for MALDI–MS ofpeptides and oligonucleotides using prestructured samplesupports. Int J Mass Spectrom 2003;226:163–80.
[25] Kuster B, Wheeler SF, Hunter AP, Dwek RA, Harvey DJ.Sequencing of N-linked oligosaccharides directly fromprotein gels: In-gel deglycosylation followed bymatrix-assisted laser desorption/ionization massspectrometry and normal-phase high-performance liquidchromatography. Anal Biochem 1997;250:82–101.
[26] Schwede T, Kopp J, Guex N, Peitsch MC. SWISS MODEL—anautomated protein homology-modeling server. Nucleic AcidsRes 2003;31:3381–5.
[27] Loris R, Imberty A, Beeckmans S, Van Driessche E, Read JS,Bouckaert J, et al. Crystal structure of Pterocarpus angolensis
1586 J O U R N A L O F P R O T E O M I C S 7 3 ( 2 0 1 0 ) 1 5 7 3 – 1 5 8 6
lectin in complex with glucose, sucrose, and turanose. J BiolChem 2003;278:16297–303.
[28] Loris R, Van Walle I, De Greve H, Beeckmans S, Deboeck F,Wyns L, et al. Structural basis of oligomannose recognition bythe Pterocarpus angolensis seed lectin. J Mol Biol 2004;335:1227–40.
[29] Nesvizhskii AI, Aebersold R. Interpretation of shotgunproteomic data. Mol Cell Proteomics 2005;4:1419–40.
[30] Rittidach W, Paijit N, Utarabhand P. Purification andcharacterization of a lectin from the banana shrimpFenneropenaeus merguiensis hemolymph. Biochim BiophysActa 2007;1770:106–14.
[31] Escribano J, Rubio A, Alvarez-Orti M, Molina A, Fernandez JA.Purification and characterization of a mannan-binding lectinspecifically expressed in corms of saffron plant (Crocus sativusL.). J Agric Food Chem 2000;48:457–63.
[32] Moreno FJ, Jenkins JA, Mellon FA, Rigby NM, Robertson JA,Wellner N. Clare Mills EN. Mass spectrometry and structuralcharacterization of 2S albumin isoforms from Brazil nuts(Bertholletia excels). Biochim Biophys Acta 2004;1698:175–86.
[33] Stoeva S, Franz M, Wacker R, Krauspenhaar R, Guthohrlein E,Mikhailov A, et al. Primary Structure, isoforms, andmolecularmodeling of a chitin-binding mistletoe lectin. Arch BiochemBiophys 2001;392:23–31.
[34] De Angelis F, Di Tullio A, Spano L, Tucci A. Mass spectrometricstudy of different isoforms of the plant toxin saporin. J MassSpectrom 2001;36:1237–9.
[35] Higgins DG, Thompson JD, Gibson TJ. Using CLUSTAL formultiple sequence alignments. Methods Enzymol 1996;266:383–402.
[36] Sathisha GJ, Prakash YK, Chachadi VB, Nagaraja NN, InamdarSR, Leonidas DD, et al. X-ray sequence ambiguities ofSclerotium rolfsii lectin resolved by mass spectrometry. AminoAcids 2008;35:309–20.
[37] Newton JR, Parkinson D, Clench MR. Strategies forexamination of Alzheimer's disease amyloid precursorprotein isoforms. Anal Bioanal Chem 2006;385:692–9.
[38] Munoz J, Fernandez-Irigoyen J, Santamaria E, Parbel A, ObesoJ, Corrales FJ. Mass spectrometric characterization ofmitochondrial complex I NDUFA10 variants. Proteomics2008;8:1898-08.
[39] Mann K, Farias CM, Del Sol FG, Santos CF, Grangeiro TB,Nagano CS, et al. The amino-acid sequence of theglucose/mannose-specific lectin isolated from Parkiaplatycephala seeds reveals three tandemly arrangedjacalin-related domains. Eur J Biochem 2001;268:4414–22.
[40] Tanner S, Shen Z, Ng J, Florea L, Guigo R, Briggs SP, et al.Improving gene annotation using peptidemass spectrometry.Genome Res 2007;17:231–9.
[41] Mann M, Pandey A. Use of mass spectrometry-derived data toannotate nucleotide and protein sequence databases. TrendsBiochem Sci 2001;26:54–61.
[42] Chothia C, Lesk AM. The relation between the divergence ofsequence and structure in proteins. Embo J 1986;5:823–6.
[43] Barre A, Van Damme EJM, Peumans WJ, Rouge P.Structure–function relationship of monocotmannose-binding lectins. Plant Physiol 1996;112:1531–40.
[44] Zhu-Salzman K, Shade RE, Koiwa H, Salzman RA, NarasimhanM, Bressan RA, et al. Carbohydrate-binding and resistance toproteolysis control insecticidal activity of Griffonia simplicifolialectin II. Proc Natl Acad Sci USA 1998;95:15123–8.
[45] Zhu-salzman K, Salzman RA. Functional mechanics of theplant defensive Griffonia simplicifolia Lectin II: resistance toproteolysis is independent of glycoconjugate binding in theinsect gut. J Econ Entomol 2001;94:1280–4.
[46] Lapko VN, Jiang XY, Smith DL, Song PS. Mass spectrometriccharacterization of oat phytochrome A: isoforms andposttranslational modifications. Protein Sci 1999;8:1032–44.