A linkage map for the B-genome of Arachis (Fabaceae) and its synteny to the A-genome
10
BioMed Central Page 1 of 10 (page number not for citation purposes) BMC Plant Biology Open Access Research article A linkage map for the B-genome of Arachis (Fabaceae) and its synteny to the A-genome Márcio C Moretzsohn* 1 , Andrea VG Barbosa 2 , Dione MT Alves-Freitas 3 , Cristiane Teixeira 1 , Soraya CM Leal-Bertioli 1 , Patrícia M Guimarães 1 , Rinaldo W Pereira 3 , Catalina R Lopes 2 , Marcelo M Cavallari 2 , José FM Valls 1 , David J Bertioli 3 and Marcos A Gimenes 1 Address: 1 Embrapa Recursos Genéticos e Biotecnologia, C.P. 02372, CEP 70.770-900, Brasília, DF, Brazil, 2 Departamento de Genética, IB-UNESP, Rubião Jr, CEP 18618-000, Botucatu, SP, Brazil and 3 Universidade Católica de Brasília, Campus II, SGAN 916, CEP 70.790-160, Brasília, DF, Brazil Email: Márcio C Moretzsohn* - [email protected]; Andrea VG Barbosa - [email protected]; Dione MT Alves- Freitas - [email protected]; Cristiane Teixeira - [email protected]; Soraya CM Leal-Bertioli - [email protected]; Patrícia M Guimarães - [email protected]; Rinaldo W Pereira - [email protected]; Catalina R Lopes - [email protected]; Marcelo M Cavallari - [email protected]; José FM Valls - [email protected]; David J Bertioli - [email protected]; Marcos A Gimenes - [email protected] * Corresponding author Abstract Background: Arachis hypogaea (peanut) is an important crop worldwide, being mostly used for edible oil production, direct consumption and animal feed. Cultivated peanut is an allotetraploid species with two different genome components, A and B. Genetic linkage maps can greatly assist molecular breeding and genomic studies. However, the development of linkage maps for A. hypogaea is difficult because it has very low levels of polymorphism. This can be overcome by the utilization of wild species of Arachis, which present the A- and B- genomes in the diploid state, and show high levels of genetic variability. Results: In this work, we constructed a B-genome linkage map, which will complement the previously published map for the A-genome of Arachis, and produced an entire framework for the tetraploid genome. This map is based on an F 2 population of 93 individuals obtained from the cross between the diploid A. ipaënsis (K30076) and the closely related A. magna (K30097), the former species being the most probable B genome donor to cultivated peanut. In spite of being classified as different species, the parents showed high crossability and relatively low polymorphism (22.3%), compared to other interspecific crosses. The map has 10 linkage groups, with 149 loci spanning a total map distance of 1,294 cM. The microsatellite markers utilized, developed for other Arachis species, showed high transferability (81.7%). Segregation distortion was 21.5%. This B-genome map was compared to the A-genome map using 51 common markers, revealing a high degree of synteny between both genomes. Conclusion: The development of genetic maps for Arachis diploid wild species with A- and B-genomes effectively provides a genetic map for the tetraploid cultivated peanut in two separate diploid components and is a significant advance towards the construction of a transferable reference map for Arachis. Additionally, we were able to identify affinities of some Arachis linkage groups with Medicago truncatula, which will allow the transfer of information from the nearly-complete genome sequences of this model legume to the peanut crop. Published: 7 April 2009 BMC Plant Biology 2009, 9:40 doi:10.1186/1471-2229-9-40 Received: 5 December 2008 Accepted: 7 April 2009 This article is available from: http://www.biomedcentral.com/1471-2229/9/40 © 2009 Moretzsohn et al; licensee BioMed Central Ltd. This is an Open Access article distributed under the terms of the Creative Commons Attribution License (http://creativecommons.org/licenses/by/2.0 ), which permits unrestricted use, distribution, and reproduction in any medium, provided the original work is properly cited.
-
Upload
independent -
Category
Documents
-
view
3 -
download
0
Transcript of A linkage map for the B-genome of Arachis (Fabaceae) and its synteny to the A-genome
BioMed CentralBMC Plant Biology
ss
Open AcceResearch articleA linkage map for the B-genome of Arachis (Fabaceae) and its synteny to the A-genomeMárcio C Moretzsohn*1, Andrea VG Barbosa2, Dione MT Alves-Freitas3, Cristiane Teixeira1, Soraya CM Leal-Bertioli1, Patrícia M Guimarães1, Rinaldo W Pereira3, Catalina R Lopes2, Marcelo M Cavallari2, José FM Valls1, David J Bertioli3 and Marcos A Gimenes1Address: 1Embrapa Recursos Genéticos e Biotecnologia, C.P. 02372, CEP 70.770-900, Brasília, DF, Brazil, 2Departamento de Genética, IB-UNESP, Rubião Jr, CEP 18618-000, Botucatu, SP, Brazil and 3Universidade Católica de Brasília, Campus II, SGAN 916, CEP 70.790-160, Brasília, DF, Brazil
Email: Márcio C Moretzsohn* - [email protected]; Andrea VG Barbosa - [email protected]; Dione MT Alves-Freitas - [email protected]; Cristiane Teixeira - [email protected]; Soraya CM Leal-Bertioli - [email protected]; Patrícia M Guimarães - [email protected]; Rinaldo W Pereira - [email protected]; Catalina R Lopes - [email protected]; Marcelo M Cavallari - [email protected]; José FM Valls - [email protected]; David J Bertioli - [email protected]; Marcos A Gimenes - [email protected]
* Corresponding author
AbstractBackground: Arachis hypogaea (peanut) is an important crop worldwide, being mostly used for edible oilproduction, direct consumption and animal feed. Cultivated peanut is an allotetraploid species with two differentgenome components, A and B. Genetic linkage maps can greatly assist molecular breeding and genomic studies.However, the development of linkage maps for A. hypogaea is difficult because it has very low levels ofpolymorphism. This can be overcome by the utilization of wild species of Arachis, which present the A- and B-genomes in the diploid state, and show high levels of genetic variability.
Results: In this work, we constructed a B-genome linkage map, which will complement the previously publishedmap for the A-genome of Arachis, and produced an entire framework for the tetraploid genome. This map is basedon an F2 population of 93 individuals obtained from the cross between the diploid A. ipaënsis (K30076) and theclosely related A. magna (K30097), the former species being the most probable B genome donor to cultivatedpeanut. In spite of being classified as different species, the parents showed high crossability and relatively lowpolymorphism (22.3%), compared to other interspecific crosses. The map has 10 linkage groups, with 149 locispanning a total map distance of 1,294 cM. The microsatellite markers utilized, developed for other Arachisspecies, showed high transferability (81.7%). Segregation distortion was 21.5%. This B-genome map was comparedto the A-genome map using 51 common markers, revealing a high degree of synteny between both genomes.
Conclusion: The development of genetic maps for Arachis diploid wild species with A- and B-genomes effectivelyprovides a genetic map for the tetraploid cultivated peanut in two separate diploid components and is a significantadvance towards the construction of a transferable reference map for Arachis. Additionally, we were able toidentify affinities of some Arachis linkage groups with Medicago truncatula, which will allow the transfer ofinformation from the nearly-complete genome sequences of this model legume to the peanut crop.
Published: 7 April 2009
BMC Plant Biology 2009, 9:40 doi:10.1186/1471-2229-9-40
Received: 5 December 2008Accepted: 7 April 2009
This article is available from: http://www.biomedcentral.com/1471-2229/9/40
© 2009 Moretzsohn et al; licensee BioMed Central Ltd. This is an Open Access article distributed under the terms of the Creative Commons Attribution License (http://creativecommons.org/licenses/by/2.0), which permits unrestricted use, distribution, and reproduction in any medium, provided the original work is properly cited.
Page 1 of 10(page number not for citation purposes)
BMC Plant Biology 2009, 9:40 http://www.biomedcentral.com/1471-2229/9/40
BackgroundPeanut (Arachis hypogaea L.) is one of the most importantcrops in tropical and subtropical regions of the world.Peanut is used as both human and animal food, being avaluable source of protein and oil [1,2]. The genus Arachis(Leguminosae or Fabaceae) is native to South Americaand contains 80 described species assembled into ninetaxonomical sections, according to their morphology,geographic distribution and sexual compatibility [3,4].The Arachis section includes the species that can becrossed to A. hypogaea and encompasses 29 diploid spe-cies and the tetraploid species A. hypogaea and A. monticola[3,4].
Cultivated peanut is an allotetraploid (2n = 4× = 40 chro-mosomes) with two genome types, A and B, which arefound separately in the wild species of the Arachis section.The A-genome species are diploids characterized by thepresence of a so-called A chromosome pair [5], of reducedsize and with a lower level of euchromatin condensationin comparison to the other chromosomes [6]. Diploidspecies of the section Arachis with 2n = 20 and lacking theA chromosome pair are usually considered to share the B-type genome, although they are much more heterogene-ous and may present variant forms of this B-genome. Onespecies, A. glandulifera, revealed very poor homologieswith all A and B genome taxa, and is considered to have aD genome [7,8]. Three other species show 2n = 18 chro-mosomes [9-11] and their genomic affinities are not clear.
Arachis hypogaea was originated via hybridization of twodiploid wild species, probably A. duranensis (A-genome)and A. ipaënsis (B-genome), followed by a rare spontane-ous duplication of chromosomes [6,12-14]. The resultingtetraploid plant would have been reproductively isolatedfrom its wild diploid relatives. This isolation, coupledwith the origin through a probably single hybridizationevent [13,15-17], leads to a limited genetic diversity ofpeanut, as observed in different studies using molecularmarkers [13,15-17]. In contrast, wild diploid Arachis spe-cies are genetically more diverse [18-20], providing a richsource of variation for agronomical traits, and DNA poly-morphisms for genetic and genomic studies [21-23].
As a consequence, most of the linkage maps developed forArachis included wild species as progenitors, the exceptionbeing the A. hypogaea map that has been recently pub-lished [24]. These maps are based on RFLP [25,26], RAPD[27], and more recently, microsatellite markers [24,28]. Inthis latter study [28] we used a diploid population from across between A. duranensis and the closely related A. sten-osperma, both having A-type genomes, the former beingthe most probable A genome donor to cultivated peanut.This map, which essentially provides genetic informationfor half the genetic component of A. hypogaea, has more
recently been updated with new microsatellites, RGAs,AFLPs, and single-copy gene-based markers (anchormarkers) (unpublished data).
Microsatellite markers are the ideal markers for the devel-opment of linkage maps, as they are multiallelic, highlypolymorphic, typically co-dominant, and PCR-basedmarkers. Additionally, they can often be transferredbetween different populations and even related species[28-31]. Therefore different maps constructed with com-mon microsatellite markers can be aligned, allowinginformation from the different maps to be accumulated,helping to confirm linkage orders and providing informa-tion on the genome evolution of related species.
The aim of this study was to create a linkage map for theArachis B-genome to complement the previously pub-lished A-genome map and effectively to provide a linkagemap for tetraploid peanut in two separate diploid compo-nents. For that, we made an F2 population from a crossbetween the most probable B-genome donor of cultivatedpeanut, A. ipaënsis [13,14], and the very closely related A.magna. In order to facilitate map comparisons we used thesame set of microsatellite markers used for the construc-tion of the A-genome map, with the addition of somerecently published markers, 75 newly developed micros-atellite, 19 EST-STS markers and 11 strategically chosenanchor markers, which are single copy genic markers thatare ideal for the alignment of genomes [32-34].
ResultsInterspecific hybridizationSeveral crossings between A. ipaënsis and A. magna weremade. Seven plants of A. ipaënsis (K30076) and six of A.magna (K30097) were used as female parents (see Addi-tional file 1). A total of 993 flowers were cross-pollinated,of which 515 and 478 had A. ipaënsis and A. magna asfemale parents, respectively. A total of 556 viable seedswere obtained, being 313 (56%) from A. ipaënsis × A.magna crosses and 243 (44%) from A. magna × A. ipaënsiscrosses. Hybrids were identified using the SSR marker Ah-282 visualized in 3% agarose gels. The number of seedsobtained from the 23 self-pollinated F1 individuals washigh, ranging from 50 to 165, with an average of 92. TheF1 plant obtained from cross 4 (see Additional file 1),which produced the highest number of seeds (165) wasselected to generate the F2 mapping population.
Marker development and analysisGenomic microsatellitesForty primer pairs were developed using the threegenomic libraries enriched for AC/TG and AG/TC repeats(see Additional file 2) and were screened against the pro-genitors of the mapping population. Repeats were, asexpected, almost entirely composed of dinucleotides
Page 2 of 10(page number not for citation purposes)
BMC Plant Biology 2009, 9:40 http://www.biomedcentral.com/1471-2229/9/40
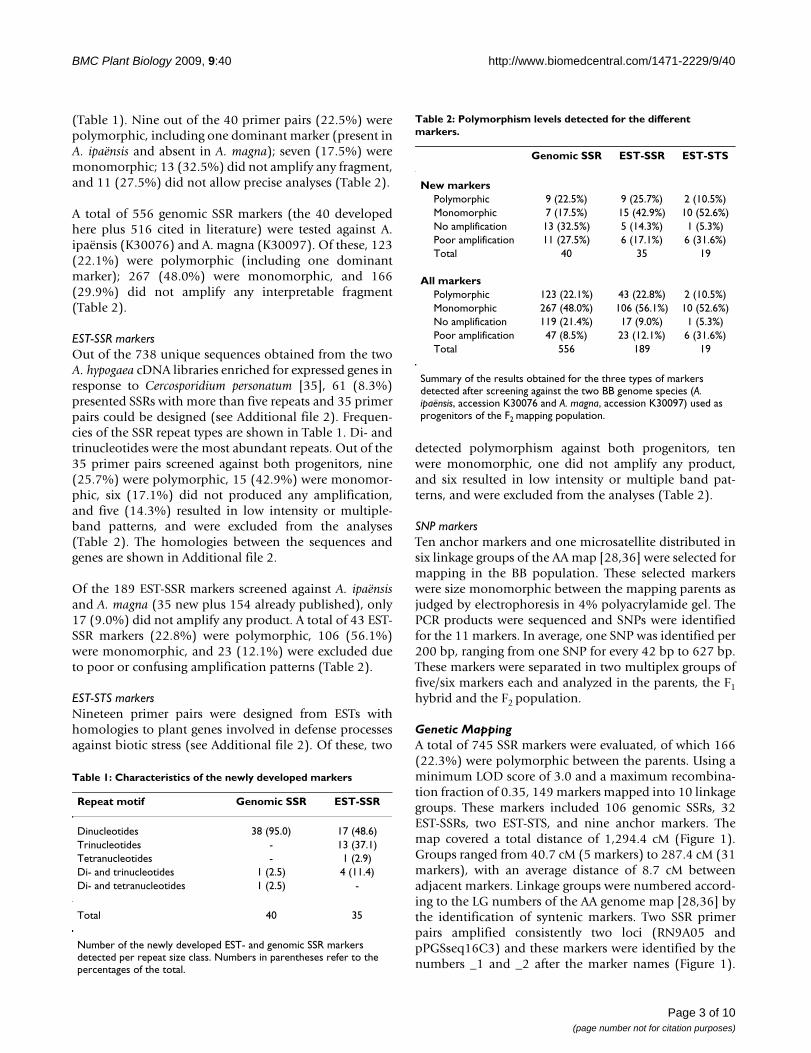
(Table 1). Nine out of the 40 primer pairs (22.5%) werepolymorphic, including one dominant marker (present inA. ipaënsis and absent in A. magna); seven (17.5%) weremonomorphic; 13 (32.5%) did not amplify any fragment,and 11 (27.5%) did not allow precise analyses (Table 2).
A total of 556 genomic SSR markers (the 40 developedhere plus 516 cited in literature) were tested against A.ipaënsis (K30076) and A. magna (K30097). Of these, 123(22.1%) were polymorphic (including one dominantmarker); 267 (48.0%) were monomorphic, and 166(29.9%) did not amplify any interpretable fragment(Table 2).
EST-SSR markersOut of the 738 unique sequences obtained from the twoA. hypogaea cDNA libraries enriched for expressed genes inresponse to Cercosporidium personatum [35], 61 (8.3%)presented SSRs with more than five repeats and 35 primerpairs could be designed (see Additional file 2). Frequen-cies of the SSR repeat types are shown in Table 1. Di- andtrinucleotides were the most abundant repeats. Out of the35 primer pairs screened against both progenitors, nine(25.7%) were polymorphic, 15 (42.9%) were monomor-phic, six (17.1%) did not produced any amplification,and five (14.3%) resulted in low intensity or multiple-band patterns, and were excluded from the analyses(Table 2). The homologies between the sequences andgenes are shown in Additional file 2.
Of the 189 EST-SSR markers screened against A. ipaënsisand A. magna (35 new plus 154 already published), only17 (9.0%) did not amplify any product. A total of 43 EST-SSR markers (22.8%) were polymorphic, 106 (56.1%)were monomorphic, and 23 (12.1%) were excluded dueto poor or confusing amplification patterns (Table 2).
EST-STS markersNineteen primer pairs were designed from ESTs withhomologies to plant genes involved in defense processesagainst biotic stress (see Additional file 2). Of these, two
detected polymorphism against both progenitors, tenwere monomorphic, one did not amplify any product,and six resulted in low intensity or multiple band pat-terns, and were excluded from the analyses (Table 2).
SNP markersTen anchor markers and one microsatellite distributed insix linkage groups of the AA map [28,36] were selected formapping in the BB population. These selected markerswere size monomorphic between the mapping parents asjudged by electrophoresis in 4% polyacrylamide gel. ThePCR products were sequenced and SNPs were identifiedfor the 11 markers. In average, one SNP was identified per200 bp, ranging from one SNP for every 42 bp to 627 bp.These markers were separated in two multiplex groups offive/six markers each and analyzed in the parents, the F1hybrid and the F2 population.
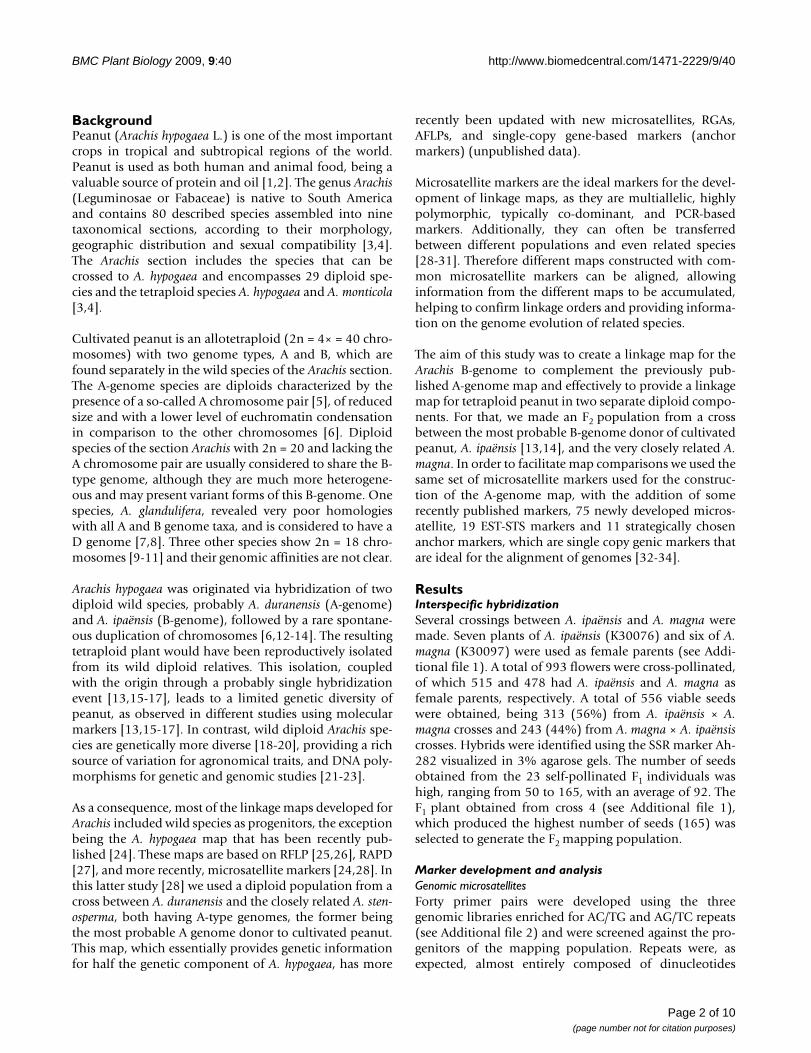
Genetic MappingA total of 745 SSR markers were evaluated, of which 166(22.3%) were polymorphic between the parents. Using aminimum LOD score of 3.0 and a maximum recombina-tion fraction of 0.35, 149 markers mapped into 10 linkagegroups. These markers included 106 genomic SSRs, 32EST-SSRs, two EST-STS, and nine anchor markers. Themap covered a total distance of 1,294.4 cM (Figure 1).Groups ranged from 40.7 cM (5 markers) to 287.4 cM (31markers), with an average distance of 8.7 cM betweenadjacent markers. Linkage groups were numbered accord-ing to the LG numbers of the AA genome map [28,36] bythe identification of syntenic markers. Two SSR primerpairs amplified consistently two loci (RN9A05 andpPGSseq16C3) and these markers were identified by thenumbers _1 and _2 after the marker names (Figure 1).
Table 1: Characteristics of the newly developed markers
Repeat motif Genomic SSR EST-SSR
Dinucleotides 38 (95.0) 17 (48.6)Trinucleotides - 13 (37.1)Tetranucleotides - 1 (2.9)Di- and trinucleotides 1 (2.5) 4 (11.4)Di- and tetranucleotides 1 (2.5) -
Total 40 35
Number of the newly developed EST- and genomic SSR markers detected per repeat size class. Numbers in parentheses refer to the percentages of the total.
Table 2: Polymorphism levels detected for the different markers.
Genomic SSR EST-SSR EST-STS
New markersPolymorphic 9 (22.5%) 9 (25.7%) 2 (10.5%)Monomorphic 7 (17.5%) 15 (42.9%) 10 (52.6%)No amplification 13 (32.5%) 5 (14.3%) 1 (5.3%)Poor amplification 11 (27.5%) 6 (17.1%) 6 (31.6%)Total 40 35 19
All markersPolymorphic 123 (22.1%) 43 (22.8%) 2 (10.5%)Monomorphic 267 (48.0%) 106 (56.1%) 10 (52.6%)No amplification 119 (21.4%) 17 (9.0%) 1 (5.3%)Poor amplification 47 (8.5%) 23 (12.1%) 6 (31.6%)Total 556 189 19
Summary of the results obtained for the three types of markers detected after screening against the two BB genome species (A. ipaënsis, accession K30076 and A. magna, accession K30097) used as progenitors of the F2 mapping population.
Page 3 of 10(page number not for citation purposes)

BMC Plant Biology 2009, 9:40 http://www.biomedcentral.com/1471-2229/9/40
Thirty-two markers (21.5%) out of the 149 mapped mark-ers showed deviation from the expected 1:2:1 ratio, being24 at P < 0.05 and eight at P < 0.01. Of these, 12 markerswere skewed towards A. magna, three markers towards A.ipaënsis, and 17 towards the heterozygote. Linkage groupsB2 and B10 had all distorted markers with an excess of A.magna alleles, while LGs B1, B4, and B7 had all distortedmarkers skewed towards the heterozygote. The threemarkers with an excess of A. ipaënsis alleles grouped onLGs B3, B5 and B8 that also had markers with an excess ofA. magna alleles and towards the heterozygote. Distortedmarkers at P < 0.05 were identified by # (Figure 1). GroupsB6 and B9 had no distorted markers.
Synteny analysisA total of 51 common markers mapped in the AA and BBgenome diploid maps spanned the 10 linkage groups ofboth maps (Figure 1). Seven LGs of the BB map (B1, B2,
B3, B4, B5, B8, and B9) showed direct correspondenceswith seven groups of the AA map. Of these, five had allcommon markers mapped in the same order. From two(LG B8) to 11 (LG B3) collinear loci were identified perlinkage group. The groups B2 and B10 showed commonloci to group A2, and two segmental inversions wereapparent (see Additional file 3). Group B2 was syntenic tothe upper region of LG A2 with five collinear loci, and thegroup B10 in the lower region. Inversions were alsodetected in the LGs B1/A1 and B6/A6. Linkage groups B6and B7 showed split syntenic relationships, with commonmarkers mapping in two LG of the AA map, B6 with A6and A10, and B7 with A7 and A8.
DiscussionThis linkage map was obtained using an F2 populationderived from a cross between A. ipaënsis and A. magna.Several lines of evidence indicate that A. ipaënsis is the
A linkage map for the B-genome of ArachisFigure 1A linkage map for the B-genome of Arachis. Linkage map of Arachis based on an F2 population resultant from the cross A. ipaënsis × A. magna (B-genome). The map consists of 10 linkage groups and 149 codominant markers (genomic SSR, EST-SSR, STS, and SNPs). Distorted markers (P < 0.05) are identified by # after the loci names. Numbers on the left of each group are Kosambi map distances. Syntenic markers between the B- and A-genome maps [28,36] are indicated by colored blocks. Colors were assigned to the A-genome linkage groups so that syntenic LG are represented by corresponding colors.
TC7A02#0.0TC3B047.8AHBGSI1002D0411.1gi-42719.3TC4G1020.3Seq4B1121.2TC3B0522.0RN32F0932.6Leg14934.9pPGPseq5G940.4
Leg19662.3
B7Ah-2800.0gi-71611.8SD02H812.9Seq3A0517.5AHGSTB420.7IPAHM33327.3seq2A0627.5Ah128.0TC6H0329.0Seq16C329.8IPAHM52633.1IPAHM373#46.4seq2A0560.8
Ap32#86.4
B8
RN20C100.0
Leg19911.1
RN27A1041.9TC1D0242.8PM11944.1pPGSseq14E1046.2
IPAHM46862.1
B9
RN22E12#0.0pPGPseq2F057.0RI2A0612.4
seq14G3#43.8
Leg14663.5pPGSseq16C3_2#66.3TC1E01#66.9Ag39#67.5RN31F06#69.7pPGSseq14F4#74.3PM181#84.6pPGSseq18B0186.1PM3293.1
AHBGSI1001D02119.4Ah-282125.5
B10
pPGPseq4F90.0
pPGSseq19D0928.7
TC7E0453.0
RN3E1063.3Seq2D08#69.0IPAHM37777.1Ah3578.1ML2A0585.0
pPGPseq2H8100.7
pPGSseq16H08118.8
Ah30#147.6
PM3167.4gi-0090179.0pPGPseq2C11179.5TC11B11181.1seq16C07181.7RN10F09188.7TC1E06189.9Ag140190.4AHBGSI1001A05202.9RI2D06211.7pPGPseq2B10218.5AHBGSC1003E10-1220.3Ap175221.3TC2A02232.1RN8C09234.8pPGSseq16E6240.1Seq4F10246.8pPGPseq5G2251.3TC7E02#260.1
TC3E02287.4
B3
Ah-3940.0
TC7C0641.1gi-90654.4SI04G8167.1Seq4H0668.7RN31A0569.2AC2H1170.8PM13774.1PM2474.7TC11A0476.8TC1A0277.8RN0x0679.6Seq2G0596.3gi-936 gi-62399.9
B6
Seq12B2#0.0
pPGSseq18G9#27.3pPGPseq4D04#38.6pPGPseq4A0642.8pPGPseq7B0944.1Ah344.3Ah1144.8TC7D0345.3IPAHM40945.8Ah-29647.1AC2C0848.4Ah3951.1pPGPseq3C761.6pPGSseq13A0779.6gi-91996.4Ap152105.1
pPGSseq19C3#128.8
B1
RN10B080.0
PM4510.7
Ah28350.3
AC2B362.9
TC7H1183.8
Leg182106.8
Leg208127.8Leg104135.3
TC7F04#151.3
pPGPseq3A6168.6
AC2D04#189.5PM675200.4TC4A02#202.5AC3C02203.0TC1G04205.1
RN31D03219.8pPGSseq13D1A226.9pPGSseq13D1B229.2
B2
Seq4B09#0.0Ah21#2.2Ah126#5.5
Seq13B9#29.5
TC7G10#47.0Leg14M_Gm#50.4
Ag49#67.7
TC4H07#85.2
PM3598.4pPGPseq3B10102.9TC11C06107.6AHBGSI1007G04108.6
TC5C05124.5AHBGSC1005D05127.3
RN12E01150.0
AHBGSD1003B11172.1
B4
PM360.0gi-4461.4pPGPseq5D053.5TC2B0110.1
Leg83#40.7
B5
Ar1 Ar2 Ar3 Ar4 Ar5 Ar6 Ar7 Ar8 Ar9 Ar10
Page 4 of 10(page number not for citation purposes)

BMC Plant Biology 2009, 9:40 http://www.biomedcentral.com/1471-2229/9/40
most probable donor of the B-genome to A. hypogaea[6,13,14,37,38]. Arachis magna is also a B-genome speciesclosely related to A. ipaënsis, as indicated by crossabilitydata [3], high rates of pollen viability in hybrids [39], andmolecular marker analyses [17,19,20,40]. The high fertil-ity of the crosses and low polymorphism levels betweenthe species (22.3% of SSR markers) observed here supportthis close relationship, and indeed even suggest that thetwo names could actually correspond to a single biologi-cal species. Further studies should be carried out to checkthis hypothesis, as it might have important implicationsfor the incorporation of new wild alleles in cultivated pea-nut: so far there are many collected accessions of A. magnaand only one available accession of A. ipaënsis. However,regardless the taxonomic status of the species, it is clearthat both genomes used to construct the map are similarto the B-genome of A. hypogaea and that the linkage mapis probably a good representation of it.
The DNA polymorphism within this population is lowerthan the populations used for the construction of previ-ously published Arachis maps: 51% for RFLP probes in theA. stenosperma × A. cardenasii derived population [25]; 40%for RFLP probes in the Arachis hypogaea × syntheticamphidiploid {A. batizocoi × (A. cardenasii × A. diogoi)}4×
population [26]; and 47% for SSR markers in the A. duran-ensis × A. stenosperma derived population [28]. This low pol-ymorphism has been compensated by the large number ofSSR markers developed for Arachis over the past few years[19,20,28,40-45], which has enabled the development ofthis linkage map. On the other hand, the segregation distor-tion of 21.5% is in the same range as the distortion foundin many intraspecific maps [46-48]. Linkage groups B2 andB10 had all distorted markers with an excess of A. magnaalleles, while LG B1, B4, and B7 had all distorted markersskewed towards the heterozygote. These groupings of dis-torted markers suggest that some regions of the chromo-some are more prone to segregation distortion, rather thanthe distortion being marker-specific.
All markers evaluated in this study were amplified usingheterologous primers. Most of them were developed for A.hypogaea and A. stenosperma, and 74 markers were devel-oped for species from other sections of the Arachis genus(50 primer pairs for A. pintoi of section Caulorrhizae and24 for A. glabrata of section Rhizomatosae), confirming thehigh transferability of SSR markers within the Arachisgenus. From 745 markers tested, 609 (81.7%) allowed theamplification of PCR products in A. ipaënsis and/or A.magna. As expected, the level of transferability variedamong the different types of primers tested. Microsatel-lites based on expressed genic regions (EST-SSR and STSs)showed higher transferability levels (91.0% and 94.7%,respectively) than random genomic microsatellites(78.6%). This confirms previous findings that markersbased on cDNA sequences are more transferable among
species than random markers, such as genomic SSRs, sincethey are based on coding regions, which are generallymore conserved that non coding regions [49-54].
The number of repeats found in the genomic microsatel-lite markers was, in general, higher (5 to 64 repeats) thanthe number in expressed genic microsatellites (5 to 16repeats). This difference was not reflected in the polymor-phism levels found for these two sources of primers:22.8% of the EST-SSRs and 22.0% of the genomic SSRs.These findings are in agreement with our previous resultsfor wild species and contrasts with cultivated peanut,where longer microsatellites have higher polymorphism[28].
The present map comprised 10 linkage groups, with 149loci spanning a total map distance of 1,294.4 cM, whichcorresponds to the haploid chromosome number of theprogenitor species n = 10 [3]. The total length obtained issimilar to the sizes described for the other two co-domi-nant marker-based linkage maps published for diploidspecies of Arachis: 1,063 cM for an RFLP based map devel-oped using an A. stenosperma × A. cardenasii cross [25] and1,230.9 cM found for a microsatellite based map devel-oped using an A. duranensis × A. stenosperma cross [28].This size is also comparable to half of the 2,210.0 cMfound for a published tetraploid map for Arachis spp. [26].However, seventeen (10.2%) of the 166 segregating mark-ers remained unlinked, suggesting that at least parts of thegenome have not been covered by this map.
Twenty five percent of the mapped markers were devel-oped from cDNA libraries (33 EST-SSR and two STS mark-ers). Some of them had similarity to genes of knownfunction, including genes involved in the photosynthesisprocess and in responses to biotic stresses. For instance,marker AHBGSD1002H08 (LG B8) showed similarity to atissue specific gene coding for a prolin-rich protein of soy-bean (E-value = 3.0 × 10⁻²⁷), that has the expressioninduced by salicylic acid, virus infection, circadian rhythmand salinic and drought stresses, indicating this gene mayhave an important role in the response to multiple inter-nal and external factors [55]. Marker AHBGST1002B04showed similarity to dihiydro-isoflavone redutase (E-value = 3.0 × 10-57), that is an enzyme involved in the syn-thesis of different flavonoids, and some of them, such asflavones and the 3-deoxyanthocyanidina, are involved inthe plant defense process [56]. Linkage maps that containgenic markers can facilitate the finding of genes of inter-est, as ESTs mapping in regions with QTLs are good candi-dates to be involved in the trait and being an alternativeto positional cloning [47,57].
A total of 42 microsatellite markers in common with theA-genome map [28] were placed on this B-genome map.In order to increase the number of shared markers, nine
Page 5 of 10(page number not for citation purposes)
BMC Plant Biology 2009, 9:40 http://www.biomedcentral.com/1471-2229/9/40
anchor markers [32-34] selected from the A-map [36]were placed on the B-map using SNPs. The comparison ofthe 51 shared markers revealed associations betweenmaps and apparently high levels of synteny, since all butone of the B linkage groups show single main correspond-ences to the A-map. This seems largely consistent with theobserved for homeologous groups in the published tetra-ploid map of Arachis [26] with perhaps the main differ-ences being: in the tetraploid study, one large B linkagegroup shows no marker correspondences to the Agenome, whilst in this study no "orphan" linkage groupsare present; and in this study two B linkage groups corre-spond to one A (B2 and B10 to A2), a situation notobserved in the tetraploid map.
The integration of the A- and B-genome Arachis mapseffectively increases the information content of bothmaps. The A-genome map contains candidate genes andQTLs for disease resistance, and has been aligned with thegenomes of the model legumes Lotus and Medicago and
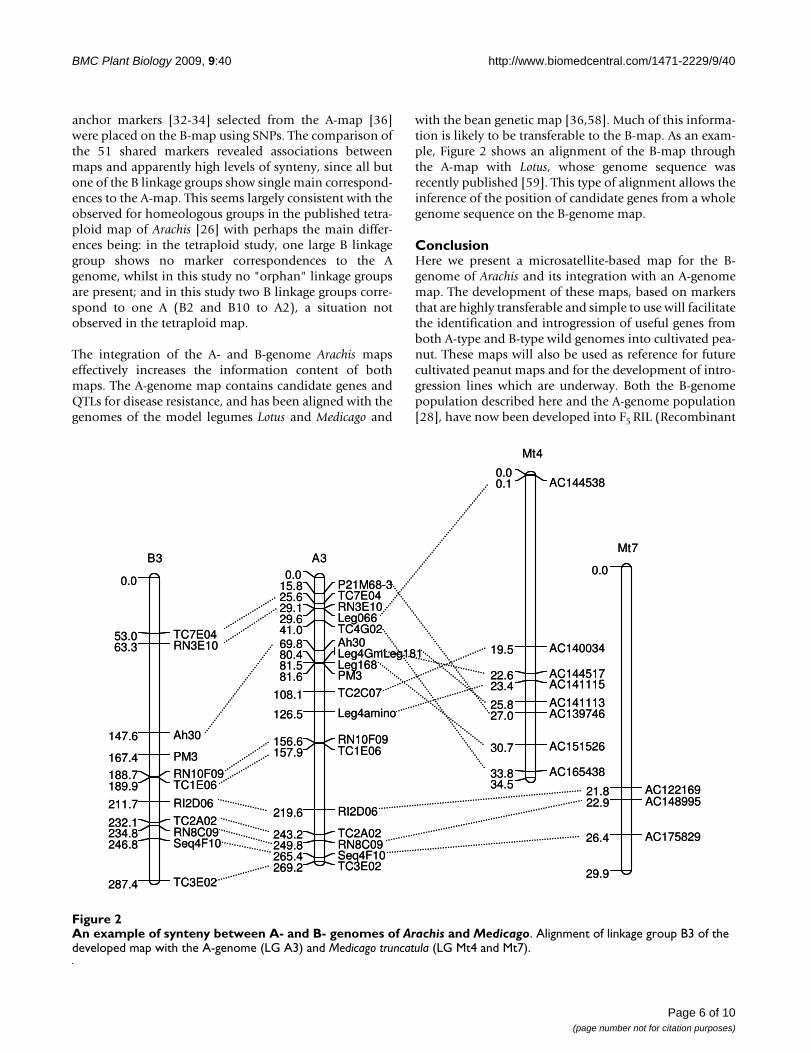
with the bean genetic map [36,58]. Much of this informa-tion is likely to be transferable to the B-map. As an exam-ple, Figure 2 shows an alignment of the B-map throughthe A-map with Lotus, whose genome sequence wasrecently published [59]. This type of alignment allows theinference of the position of candidate genes from a wholegenome sequence on the B-genome map.
ConclusionHere we present a microsatellite-based map for the B-genome of Arachis and its integration with an A-genomemap. The development of these maps, based on markersthat are highly transferable and simple to use will facilitatethe identification and introgression of useful genes fromboth A-type and B-type wild genomes into cultivated pea-nut. These maps will also be used as reference for futurecultivated peanut maps and for the development of intro-gression lines which are underway. Both the B-genomepopulation described here and the A-genome population[28], have now been developed into F5 RIL (Recombinant
An example of synteny between A- and B- genomes of Arachis and MedicagoFigure 2An example of synteny between A- and B- genomes of Arachis and Medicago. Alignment of linkage group B3 of the developed map with the A-genome (LG A3) and Medicago truncatula (LG Mt4 and Mt7).
0.0
AC12216921.8AC14899522.9
AC17582926.4
29.9
Mt7
0.0
TC7E0453.0RN3E1063.3
Ah30147.6
PM3167.4RN10F09188.7TC1E06189.9RI2D06211.7TC2A02232.1RN8C09234.8Seq4F10246.8
TC3E02287.4
B30.0
P21M68-315.8TC7E0425.6RN3E1029.1Leg06629.6TC4G0241.0Ah3069.8Leg4GmLeg18180.4Leg16881.5PM381.6TC2C07108.1
Leg4amino126.5
RN10F09156.6TC1E06157.9
RI2D06219.6
TC2A02243.2RN8C09249.8Seq4F10265.4TC3E02269.2
A3
0.0AC1445380.1
AC14003419.5
AC14451722.6AC14111523.4AC14111325.8AC13974627.0
AC15152630.7
AC16543833.834.5
Mt4
0.0
AC12216921.8AC14899522.9
AC17582926.4
29.9
Mt7
0.0
TC7E0453.0RN3E1063.3
Ah30147.6
PM3167.4RN10F09188.7TC1E06189.9RI2D06211.7TC2A02232.1RN8C09234.8Seq4F10246.8
TC3E02287.4
B30.0
P21M68-315.8TC7E0425.6RN3E1029.1Leg06629.6TC4G0241.0Ah3069.8Leg4GmLeg18180.4Leg16881.5PM381.6TC2C07108.1
Leg4amino126.5
RN10F09156.6TC1E06157.9
RI2D06219.6
TC2A02243.2RN8C09249.8Seq4F10265.4TC3E02269.2
A3
0.0AC1445380.1
AC14003419.5
AC14451722.6AC14111523.4AC14111325.8AC13974627.0
AC15152630.7
AC16543833.834.5
Mt4
Page 6 of 10(page number not for citation purposes)
BMC Plant Biology 2009, 9:40 http://www.biomedcentral.com/1471-2229/9/40
Inbred Lines) populations which will facilitate the evenbroader use of these map and marker resources.
MethodsPlant materialThe F2 population composed of 93 plants was obtained byselfing a unique F1 plant derived from a cross between A.ipaënsis (accession K30076), used as the female parent,and A. magna (K30097), used as the male. AccessionK30097 is the holotype of A. magna, while K30076 origi-nate from the same collection site of the type specimen ofA. ipaënsis [3,4]. Plants were obtained from the BrazilianArachis germplasm collection, maintained at EmbrapaGenetic Resources and Biotechnology – CENARGEN(Brasília-DF, Brazil).
DNA extractionTotal genomic DNA was extracted from young leafletsessentially as described by Grattapaglia & Sederoff (1994)[60]. The quality and quantity of the DNA were evaluatedin 1% agarose gel electrophoresis and spectrophotometer(Genesys 4 – Spectronic).
Marker development and analysisThe same set of microsatellite markers used in Moretz-sohn et al., 2005 [28] was used for screening for polymor-phism between the parents. In addition, some markersrecently published [44,45] were used, as well as the newlydeveloped one, as follows:
Development of genomic DNA libraries enriched for microsatellitesThree libraries were developed using genomic DNA iso-lated from leaves of A. hypogaea (section Arachis), A. gla-brata (section Rhizomatosae) and A. pintoi (sectionCaulorrhizae). For each library, about nine micrograms ofDNA were digested with Sau3AI (Amersham Biosciences,UK) and electrophoresed in 0.8% low melting agarosegels to select fragments ranging from 200 to 600 bp. Theselected fragments were purified from the agarose gelsusing phenol/chloroform, and ligated into Sau3AI specificadaptors (5'-cagcctagagccgaattcacc-3' and 5'-gatcggt-gaaatcggctcaggctg-3'). The ligated fragments were hybrid-ized to biotinylated (AC)15 and (AG)15 oligonucleotidesand isolated using streptavidin-coated magnetic beads(Dynabeads Streptavidin, Dynal Biotech, Norway). Theeluted fragments were amplified using one adaptor-spe-cific primer, cloned into the pGEM-T Easy vector(Promega, WI, USA) and transformed into DH5α E. colicells with blue/white selection (Invitrogen, CA, USA).Plasmid DNAs of the positive clones were isolated usingthe 'CONCERT Rapid Plasmid Purification Miniprep Sys-tem', as described by the manufacturer (Invitrogen, CA,USA) and sequenced with an ABI Prism 377 automatedsequencer using the 'BigDye Terminator Cycle SequencingKit', version 3.1 (Applied Biosystems, CA, USA).
EST-SSR and EST-STS marker developmentEST-SSRs were developed from 883 EST sequencesobtained from a recently constructed Suppression Sub-tractive Hybridization – SSH library of A. hypogaeaenriched for expressed genes in response to Cercosporidiumpersonatum [35] using the software described below. Inaddition, 14 A. hypogaea ESTs were selected due to theirsimilarity to genes involved in defense mechanisms, iden-tified using BlastX analyses [61]. From these, 12 sequenceshad no SSR repeats, but were used for primer design todevelop STS (Sequence tagged sites) markers. Primerswere also designed for an EST of unknown function(AHBGSI1002C10), for a sequence similar to a dienelac-tone hydrolase family protein of Arabidopsis thaliana(AHBGSI1006D06) and for three ESTs of putative intronadjacent sequences (AHBSI1001D05-I1, AHBSI1002C11-I1 and AHBSI1009D07-I2) that were selected using anunpublished software developed by Dr. Wellington Mar-tins, Universidade Católica de Goiás, Brazil.
Primer designSequences were processed and assembled by using theStaden package [62] with the repeat sequence findingmodule TROLL [63] and Primer3 [64]. Sequences withmore than five motif repeats were chosen for primerdesign. The parameters for primer design were: (1) primersize ranging from 18 bp to 25 bp with an optimal lengthof 20 bp; (2) primer Tm (melting temperature) rangingfrom 57°C to 63°C with an optimal temperature of 60°C;and (3) GC content ranging from 40% to 60%. Defaultvalues were used for the other parameters.
PCR amplificationsPCR reactions contained 5 ng of genomic DNA, 1 U of TaqDNA polymerase (Amersham Biosciences), 1× PCR buffer(200 mM Tris pH 8.4, 500 mM KCl), 1.5–2.0 mM MgCl2,200 μM of each dNTP, and 0.4 μM of each primer, in afinal reaction volume of 10 μl. Amplifications were car-ried out in a PTC100 thermocycler (MJ Research Inc., MA,USA). PCR conditions were: 96°C for 5 min, followed by32 cycles of 96°C for 30 s, 48–62°C (annealing tempera-ture depending on primer pair, see Additional file 2) for45 s, 72°C for 1 min, with a final extension for 10 min at72°C. PCR products were separated by electrophoresis ondenaturing polyacrylamide gels (6% acrylamide:bisacryla-mide 29:1, 5 M urea in TBE pH 8.3), stained with silvernitrate [65]. Some SSR markers highly contrastingbetween the progenitors of the mapping population wererun on 3% agarose Metaphor (FMC Bioproducts, PA,USA) gels stained with ethidium bromide.
SNPs identification and analysisTen anchor markers and one microsatellite distributed insix linkage groups of the AA map [28,36] were selected formapping in the BB population. Markers from A-genome
Page 7 of 10(page number not for citation purposes)
BMC Plant Biology 2009, 9:40 http://www.biomedcentral.com/1471-2229/9/40
linkage groups that had few markers in common with aninitial version of the B-map were preferentially chosen.The identification of SNPs and single base extension(SNaPshot) analysis was performed essentially asdescribed by Alves et al. (2008) [66]. Primers weredesigned using the program Primo SNP 3.4, available athttp://www.changbioscience.com/primo/primosnp.html(Chang Bioscience). The SNP in the consensus sequenceof both progenitors was replaced by a degenerated IUPACcode for primer design. Non-homologous polynucle-otides (dGACT)n were added to the 5'-end of each primerto enable the analysis in multiplexes (see Additional file2), using the commercial system ABI PRISM® SNaPshot™Multiplex Kit (Applied Biosystems). Absence of hairpinsand self-complementarity of all SNP primers werechecked by the software Autodimer [67].
Map constructionA total of 745 SSR, 19 STS and 11 SNP markers werescreened against the two progenitors of the mapping pop-ulation. These included the 105 newly developed markers(see Additional file 2) plus another 670 published micro-satellite markers [19,20,28,40-45,68-70]. Polymorphicmarkers were analyzed on the mapping population con-sisting of 93 F2 individuals. A χ2 test was performed to testthe null hypothesis of 1:2:1 segregation on all scoredmarkers. The linkage analysis was done using MapmakerMacintosh version 2.0 [71]. A minimum LOD score of 4.0and maximum recombination fraction (θ) of 0.35 wereset as thresholds for linkage groups determination withthe "group" command. The most likely marker orderwithin each LG was estimated by the matrix correlationmethod using the "first order" command. Marker orderswere confirmed by comparing the log-likelihood of thepossible orders using multipoint analysis ("compare"command) and by permuting all adjacent triple orders("ripple" command). After establishment of the grouporders, the LOD score was set to 3.0 in order to includeadditional markers in the groups. The "try" command wasthen used to determine the exact position of the newmarkers within each group. The new marker orders wereagain confirmed with the "first order", "compare", and/or"ripple" commands. Recombination fractions were con-verted into map distances in centimorgans (cM) using theKosambi's mapping function.
Authors' contributionsAll authors read and approved the final manuscript. MCMcarried out the analysis for genetic map construction, par-ticipated in the synteny analysis and drafted the manu-script. AVGB carried out the mapping populationconstruction, participated in the development and analy-sis of SSR and STS markers and drafting the manuscript.DMTAF carried out the identification and analysis of SNPmarkers. CT and MMC participated in SSR and STS mark-
ers analysis. SCMLB and PMG participated in the SSR andsynteny analyses. RWP coordinated the identification andanalysis of SNP markers. CRL participated in conceivingthe study. JV participated in the conception of the projectand provided the germplasm. DJB participated in SSR, STSand SNP development and analysis, carried out the syn-teny analysis and participated in drafting the manuscript.MAG participated in conceiving the study, coordinatedthe SSR and STS markers development and analysis, andparticipated in drafting the manuscript.
Additional material
AcknowledgementsThis work was funded by Fundação de Amparo à Pesquisa do Estado de São Paulo (FAPESP), PRODETAB Project number 004-01/01, and the Genera-tion Challenge Program Projects G3005.05 and TLI.
References1. Hammons RO: The origin and history of the groundnut. Chap-
man and Hall, London; 1994. 2. Holbrook CC, Stalker HT: Peanut Breeding and Genetic
Resources. Plant Breeding Reviews 2003, 22:297-355.3. Krapovickas A, Gregory WC: Taxonomia del genero Arachis
(Leguminosae). Bonplandia (Argentina) 1994, 8(1–4):1-186.4. Valls JFM, Simpson CE: New species of Arachis L. (Leguminosae)
from Brazil, Paraguay and Bolivia. Bonplandia (Argentina) 2005,14:35-64.
5. Husted L: Cytological studies on the peanut, Arachis. II. Chro-mosome number, morphology and behavior, and their appli-cation to the problem of the origin of the cultivated forms.Cytologia 1936, 7:396-422.
6. Seijo JG, Lavia GI, Fernandez A, Krapovickas A, Ducasse D, MosconeEA: Physical mapping of the 5S and 18S–25S rRNA genes byFISH as evidence that Arachis duranensis and A. ipaënsis are
Additional File 1Data of crossings between A. ipaënsis (accession K30076) and A. magna (K30097). The data provides the number of viable seeds obtained by crossing A. ipaënsis (accession K30076) and A. magna (K30097) and by selfing F1 hybrid individuals.Click here for file[http://www.biomedcentral.com/content/supplementary/1471-2229-9-40-S1.doc]
Additional File 2Features of the newly developed markers. The data provides the details of the new set of markers, being 40 genomic SSR, 35 EST-SSR, 19 STS, and 11 SNPs.Click here for file[http://www.biomedcentral.com/content/supplementary/1471-2229-9-40-S2.xls]
Additional File 3Relationships between the 10 linkage groups of the A- and B-genome maps. The data provides the affinities between the A- and B-genome link-age maps of Arachis.Click here for file[http://www.biomedcentral.com/content/supplementary/1471-2229-9-40-S3.ppt]
Page 8 of 10(page number not for citation purposes)
BMC Plant Biology 2009, 9:40 http://www.biomedcentral.com/1471-2229/9/40
the wild diploid progenitors of A. hypogaea (Leguminosae).American Journal of Botany 2004, 91(9):1294-1303.
7. Stalker HT: A New Species in Section Arachis of Peanuts witha D-Genome. American Journal of Botany 1991, 78(5):630-637.
8. Robledo G, Seijo G: Characterization of the Arachis (Legumi-nosae) D genome using fluorescence in situ hybridization(FISH) chromosome markers and total genome DNAhybridization. Genetics and Molecular Biology 2008, 31(3):717-724.
9. Lavia GI: Karyotypes of Arachis palustris and A. praecox (Sec-tion Arachis), two species with basic chromosome number x= 9. Cytologia 1998, 63(2):177-181.
10. Lavia GI, Fernández A: Genome size in wild and cultivated pea-nut germplasm. Plant Systematics and Evolution 2008, 272(1):1-10.
11. Lavia G, Fernández A, Seijo J: Cytogenetic and molecular evi-dences on the evolutionary relationships among Arachis spe-cies. In Plant Genome: Biodiversity and Evolution, Phanerogams-Angiosperm Volume 1E. Edited by: Sharma A. Enfield, NH: Science Pub-lishers; 2008:101-134.
12. Halward TM, Stalker HT, Larue EA, Kochert G: Genetic variationdetectable with molecular markers among unadapted germ-plasm resources of cultivated peanut and related wild spe-cies. Genome 1991, 34(6):1013-1020.
13. Kochert G, Stalker HT, Gimenes M, Galgaro L, Lopes CR, Moore K:RFLP and cytogenetic evidence on the origin and evolutionof allotetraploid domesticated peanut, Arachis hypogaea(Leguminosae). American Journal of Botany 1996,83(10):1282-1291.
14. Seijo G, Lavia GI, Fernandez A, Krapovickas A, Ducasse DA, BertioliDJ, Moscone EA: Genomic relationships between the culti-vated peanut (Arachis hypogaea, Leguminosae) and its closerelatives revealed by double GISH. American Journal of Botany2007, 94(12):1963-1971.
15. Subramanian V, Gurtu S, Rao RCN, Nigam SN: Identification ofDNA polymorphism in cultivated groundnut using randomamplified polymorphic DNA (RAPD) assay. Genome 2000,43(4):656-660.
16. Herselman L: Genetic variation among Southern African culti-vated peanut (Arachis hypogaea L.) genotypes as revealed byAFLP analysis. Euphytica 2003, 133(3):319-327.
17. Milla SR, Isleib TG, Stalker HT: Taxonomic relationshipsamongArachis sect. Arachis species as revealed by AFLP markers.Genome 2005, 48(1):1-11.
18. Hilu KW, Stalker HT: Genetic relationships between peanutand wild species of Arachis sect Arachis (Fabaceae): Evidencefrom RAPDs. Plant Systematics and Evolution 1995, 198(3–4):167-178.
19. Moretzsohn M, Hopkins M, Mitchell S, Kresovich S, Valls J, Ferreira M:Genetic diversity of peanut (Arachis hypogaea L.) and its wildrelatives based on the analysis of hypervariable regions ofthe genome. BMC Plant Biology 2004, 4(1):11.
20. Bravo JP, Hoshino AA, Angelici CMLCD, Lopes CR, Gimenes MA:Transferability and use of microsatellite markers for thegenetic analysis of the germplasm of some Arachis sectionspecies of the genus Arachis. Genetics and Molecular Biology 2006,29(3):516-524.
21. Kameswara Rao N, Reddy LJ, Bramel PJ: Potential of wild speciesfor genetic enhancement of some semi-arid food crops.Genetic Resources and Crop Evolution 2003, 50(7):707-721.
22. Dwivedi S, Bertioli DJ, Crouch JH, Valls JFM, Upadhyaya HD, FaveroAP, Moretzsohn MC, Paterson AH: Peanut Genetics and Genom-ics: Toward Marker-assisted Genetic Enhancement in Pea-nut (Arachis hypogaea L). In Oilseeds Series: Genome Mapping andMolecular Breeding in Plants Volume 2. Berlim, Heidelberg: Springer;2007:115-151.
23. Stalker HT, Simpson CE: Germplasm resources in Arachis. InAdvances in Peanut Science Edited by: Pattee HE, Stalker HT. Stillwater,OK: American Peanut Research and Education Society, Inc;1995:14-53.
24. Varshney RK, Bertioli DJ, Moretzsohn MC, Vadez V, KrishnamurthyL, Aruna R, Nigam SN, Moss BJ, Seetha K, Ravi K, et al.: The firstSSR-based genetic linkage map for cultivated groundnut(Arachis hypogaea L.). Theoretical and Applied Genetics 2009,118:729-739.
25. Halward T, Stalker HT, Kochert G: Development of an RFLPLinkage Map in Diploid Peanut Species. Theoretical and AppliedGenetics 1993, 87(3):379-384.
26. Burow MD, Simpson CE, Starr JL, Paterson AH: Transmissiongenetics of chromatin from a synthetic amphidiploid to cul-tivated peanut (Arachis hypogaea L.): Broadening the genepool of a monophyletic polyploid species. Genetics 2001,159(2):823-837.
27. Garcia GM, Stalker HT, Shroeder E, Lyerly JH, Kochert G: A RAPD-based linkage map of peanut based on a backcross popula-tion between the two diploid species Arachis stenosperma andA. cardenasii. Peanut Science 2005, 32:1-8.
28. Moretzsohn MC, Leoi L, Proite K, Guimaraes PM, Leal-Bertioli SCM,Gimenes MA, Martins WS, Valls JFM, Grattapaglia D, Bertioli DJ: Amicrosatellite-based, gene-rich linkage map for the AAgenome of Arachis (Fabaceae). Theor Appl Genet 2005,111(6):1060-1071.
29. Choumane W, Winter P, Baum M, Kahl G: Conservation of mic-rosatellite flanking sequences in different taxa of Legumi-nosae. Euphytica 2004, 138(3):239-245.
30. Gutierrez MV, Patto MCV, Huguet T, Cubero JI, Moreno MT, TorresAM: Cross-species amplification of Medicago truncatula mic-rosatellites across three major pulse crops. Theor Appl Genet2005, 110(7):1210-1217.
31. Katzir N, DaninPoleg Y, Tzuri G, Karchi Z, Lavi U, Cregan PB:Length polymorphism and homologies of microsatellites inseveral Cucurbitaceae species. Theoretical and Applied Genetics1996, 93(8):1282-1290.
32. Fredslund J, Schauser L, Madsen LH, Sandal N, Stougaard J: PriFi:using a multiple alignment of related sequences to find prim-ers for amplification of homologs. Nucleic Acids Research 2005,33:W516-W520.
33. Fredslund J, Madsen LH, Hougaard BK, Sandal N, Stougaard J, BertioliD, Schauser L: GeMprospector – online design of cross-speciesgenetic marker candidates in legumes and grasses. NucleicAcids Research 2006, 34:W670-W675.
34. Fredslund J, Madsen LH, Hougaard BK, Nielsen AM, Bertioli D, SandalN, Stougaard J, Schauser L: A general pipeline for the develop-ment of anchor markers for comparative genomics in plants.BMC Genomics 2006, 7:207.
35. Nobile PM, Lopes CR, Barsalobres-Cavallari C, Quecim V, CoutinhoLL, Hoshino AA, Gimenes MA: Peanut genes identified duringinitial phase of Cercosporidium personatum infection. Plant Sci-ence 2008, 174(1):78-87.
36. Bertioli D, Moretzsohn M, Madsen LH, Sandal N, Leal-Bertioli S, Gui-marães P, Hougaard BK, Fredslund J, Schauser L, Nielsen AM, et al.: Acomparison of genome synteny of Arachis with the modellegumes Lotus japonicus and Medicago truncatula reveals anew feature of legume genomes. BMC Genomics 2009, 10:45.
37. Raina SN, Rani V, Kojima T, Ogihara Y, Singh KP, Devarumath RM:RAPD and ISSR fingerprints as useful genetic markers foranalysis of genetic diversity, varietal identification, and phyl-ogenetic relationships in peanut (Arachis hypogaea) cultivarsand wild species. Genome 2001, 44(5):763-772.
38. Fávero AP, Simpson CE, Valls JFM, Vello NA: Study of the evolu-tion of cultivated peanut through crossability studies amongArachis ipaënsis, A.duranensis, and A.hypogaea. Crop Science2006, 46(4):1546-1552.
39. Simpson CE, Faries MJ: Advances in the characterization ofdiversity in section Arachis: archeological evidence, crossingresults and their relationship in understanding the origins ofArachis hypogaea L. In Annals of the III SIRGEALC – Simpósio de Recur-sos Genéticos para a América Latina e Caribe Londrina, Paraná, Brazil;2001:706.
40. Gimenes MA, Hoshino AA, Barbosa AVG, Palmieri DA, Lopes CR:Characterization and transferability of microsatellite mark-ers of the cultivated peanut (Arachis hypogaea). BMC Plant Biol-ogy 2007, 7:9.
41. He G, Meng R, Newman M, Gao G, Pittman R, Prakash CS: Micros-atellites as DNA markers in cultivated peanut (Arachishypogaea L.). BMC Plant Biology 2003, 3(1):3.
42. He GH, Meng RH, Gao H, Guo BZ, Gao GQ, Newman M, PittmanRN, Prakash CS: Simple sequence repeat markers for botani-cal varieties of cultivated peanut (Arachis hypogaea L.).Euphytica 2005, 142(1–2):131-136.
43. Ferguson ME, Burow MD, Schulze SR, Bramel PJ, Paterson AH, Kres-ovich S, Mitchell S: Microsatellite identification and characteri-zation in peanut (A. hypogaea L.). Theor Appl Genet 2004,108(6):1064-1070.
Page 9 of 10(page number not for citation purposes)
BMC Plant Biology 2009, 9:40 http://www.biomedcentral.com/1471-2229/9/40
Publish with BioMed Central and every scientist can read your work free of charge
"BioMed Central will be the most significant development for disseminating the results of biomedical research in our lifetime."
Sir Paul Nurse, Cancer Research UK
Your research papers will be:
available free of charge to the entire biomedical community
peer reviewed and published immediately upon acceptance
cited in PubMed and archived on PubMed Central
yours — you keep the copyright
Submit your manuscript here:http://www.biomedcentral.com/info/publishing_adv.asp
BioMedcentral
44. Proite K, Leal-Bertioli SCM, Bertioli DJ, Moretzsohn MC, da Silva FR,Martins NF, Guimaraes PM: ESTs from a wild Arachis species forgene discovery and marker development. BMC Plant Biology2007, 7:7.
45. Cuc LM, Mace ES, Crouch JH, Quang VD, Long TD, Varshney RK:Isolation and characterization of novel microsatellite mark-ers and their application for diversity assessment in culti-vated groundnut (Arachis hypogaea). BMC Plant Biology 2008,8:55.
46. Sibov ST, De Souza CL, Garcia AAF, Garcia AF, Silva AR, MangolinCA, Benchimol LL, De Souza AP: Molecular mapping in tropicalmaize (Zea mays L.) using microsatellite markers. 1. Mapconstruction and localization of loci showing distorted segre-gation. Hereditas 2003, 139(2):96-106.
47. Flandez-Galvez H, Ford R, Pang EC, Taylor PW: An intraspecificlinkage map of the chickpea (Cicer arietinum L.) genomebased on sequence tagged microsatellite site and resistancegene analog markers. Theor Appl Genet 2003, 106(8):1447-1456.
48. Truco MJ, Antonise R, Lavelle D, Ochoa O, Kozik A, Witsenboer H,Fort SB, Jeuken MJW, Kesseli RV, Lindhout P, et al.: A high-density,integrated genetic linkage map of lettuce (Lactuca spp.).Theor Appl Genet 2007, 115(6):735-746.
49. Chagné D, Chaumeil P, Ramboer A, Collada C, Guevara A, CerveraMT, Vendramin GG, Garcia V, Frigerio JMM, Echt C, et al.: Cross-species transferability and mapping of genomic and cDNASSRs in pines. Theor Appl Genet 2004, 109(6):1204-1214.
50. Gupta PK, Varshney RK: The development and use of microsat-ellite markers for genetic analysis and plant breeding withemphasis on bread wheat. Euphytica 2000, 113(3):163-185.
51. Gupta PK, Rustgi S, Sharma S, Singh R, Kumar N, Balyan HS: Trans-ferable EST-SSR markers for the study of polymorphism andgenetic diversity in bread wheat. Mol Genet Genomics 2003,270(4):315-323.
52. Thiel T, Michalek W, Varshney RK, Graner A: Exploiting EST data-bases for the development and characterization of gene-derived SSR-markers in barley (Hordeum vulgare L.). TheorAppl Genet 2003, 106(3):411-422.
53. Varshney RK, Sigmund R, Borner A, Korzun V, Stein N, Sorrells ME,Langridge P, Graner A: Interspecific transferability and compar-ative mapping of barley EST-SSR markers in wheat, rye andrice. Plant Science 2005, 168(1):195-202.
54. Poncet V, Rondeau M, Tranchant C, Cayrel A, Hamon S, de KochkoA, Hamon P: SSR mining in coffee tree EST databases: poten-tial use of EST-SSRs as markers for the Coffea genus. MolGenet Genomics 2006, 276(5):436-449.
55. He CY, Zhang JS, Chen SY: A soybean gene encoding a proline-rich protein is regulated by salicylic acid, an endogenous cir-cadian rhythm and by various stresses. Theor Appl Genet 2002,104(6–7):1125-1131.
56. Winkel-Shirley B: Biosynthesis of flavonoids and effects ofstress. Current Opinion in Plant Biology 2002, 5(3):218-223.
57. Zheng BS, Yang L, Zhang WP, Mao CZ, Wu YR, Yi KK, Liu FY, Wu P:Mapping QTLs and candidate genes for rice root traits underdifferent water-supply conditions and comparative analysisacross three populations. Theor Appl Genet 2003,107(8):1505-1515.
58. Hougaard BK, Madsen LH, Sandal N, Moretzsohn MD, Fredslund J,Schauser L, Nielsen AM, Rohde T, Sato S, Tabata S, et al.: Legumeanchor markers link syntenic regions between Phaseolus vul-garis, Lotus japonicus, Medicago truncatula and Arachis. Genet-ics 2008, 179(4):2299-2312.
59. Sato S, Nakamura Y, Kaneko T, Asamizu E, Kato T, Nakao M, Sas-amoto S, Watanabe A, Ono A, Kawashima K, et al.: Genome Struc-ture of the Legume, Lotus japonicus. DNA Research 2008,15:227-239.
60. Grattapaglia D, Sederoff R: Genetic Linkage Maps of Eucalyptusgrandis and Eucalyptus urophylla Using a Pseudo-Testcross:Mapping Strategy and RAPD Markers. Genetics 1994,137(4):1121-1137.
61. Altschul SF, Gish W, Miller W, Myers EW, Lipman DJ: Basic LocalAlignment Search Tool. Journal of Molecular Biology 1990,215(3):403-410.
62. Staden R: The Staden sequence analysis package. Molecular Bio-technology 1996, 5(3):233-241.
63. Martins W, de Sousa D, Proite K, Guimaraes P, Moretzsohn M, Ber-tioli D: New softwares for automated microsatellite markerdevelopment. Nucleic Acids Research 2006, 34(4):e31.
64. Castelo AT, Martins W, Gao GR: TROLL-Tandem RepeatOccurrence Locator. Bioinformatics 2002, 18(4):634-636.
65. Creste S, Neto AT, Figueira A: Detection of single sequencerepeat polymorphisms in denaturing polyacrylamidesequencing gels by silver staining. Plant Molecular Biology Reporter2001, 19(4):299-306.
66. Alves DM, Pereira RW, Leal-Bertioli SC, Moretzsohn MC, GuimaraesPM, Bertioli DJ: Development and use of single nucleotide pol-ymorphism markers for candidate resistance genes in wildpeanuts (Arachis spp). Genet Mol Res 2008, 7(3):631-642.
67. Vallone PM, Butler JM: AutoDimer: a screening tool for primer-dimer and hairpin structures. Biotechniques 2004, 37(2):226-231.
68. Hopkins MS, Casa AM, Wang T, Mitchell SE, Dean RE, Kochert GD,Kresovich S: Discovery and characterization of polymorphicsimple sequence repeats (SSRs) in peanut. Crop Science 1999,39(4):1243-1247.
69. Palmieri DA, Hoshino AA, Bravo JP, Lopes CR, Gimenes MA: Isola-tion and characterization of microsatellite loci from the for-age species Arachis pintoi (Genus Arachis). Molecular EcologyNotes 2002, 2(4):551-553.
70. Palmieri DA, Bechara MD, Curi RA, Gimenes MA, Lopes CR: Novelpolymorphic microsatellite markers in section Caulorrhizae(Arachis, Fabaceae). Molecular Ecology Notes 2005, 5(1):77-79.
71. Lander ES, Green P, Abrahamson J, Barlow A, Daly MJ, Lincoln SE,Newburg L: MAPMAKER: an interactive computer packagefor constructing primary genetic linkage maps of experimen-tal and natural populations. Genomics 1987, 1(2):174-181.
Page 10 of 10(page number not for citation purposes)
http://www.ncbi.nlm.nih.gov/entrez/query.fcgi?cmd=Retrieve&db=PubMed&dopt=Abstract&list_uids=7982566
http://www.ncbi.nlm.nih.gov/entrez/query.fcgi?cmd=Retrieve&db=PubMed&dopt=Abstract&list_uids=7982566
http://www.ncbi.nlm.nih.gov/entrez/query.fcgi?cmd=Retrieve&db=PubMed&dopt=Abstract&list_uids=2231712
http://www.ncbi.nlm.nih.gov/entrez/query.fcgi?cmd=Retrieve&db=PubMed&dopt=Abstract&list_uids=2231712
http://www.ncbi.nlm.nih.gov/entrez/query.fcgi?cmd=Retrieve&db=PubMed&dopt=Abstract&list_uids=8837029
http://www.ncbi.nlm.nih.gov/entrez/query.fcgi?cmd=Retrieve&db=PubMed&dopt=Abstract&list_uids=3692487
http://www.ncbi.nlm.nih.gov/entrez/query.fcgi?cmd=Retrieve&db=PubMed&dopt=Abstract&list_uids=3692487