The genome of a songbird
6
LETTERS The genome of a songbird Wesley C. Warren 1 , David F. Clayton 2 , Hans Ellegren 3 , Arthur P. Arnold 4 , LaDeana W. Hillier 1 , Axel Ku ¨nstner 3 , Steve Searle 5 , Simon White 5 , Albert J. Vilella 6 , Susan Fairley 5 , Andreas Heger 7 , Lesheng Kong 7 , Chris P. Ponting 7 , Erich D. Jarvis 8 , Claudio V. Mello 9 , Pat Minx 1 , Peter Lovell 9 , Tarciso A. F. Velho 9 , Margaret Ferris 2 , Christopher N. Balakrishnan 2 , Saurabh Sinha 2 , Charles Blatti 2 , Sarah E. London 2 , Yun Li 2 , Ya-Chi Lin 2 , Julia George 2 , Jonathan Sweedler 2 , Bruce Southey 2 , Preethi Gunaratne 10 , Michael Watson 11 , Kiwoong Nam 3 , Niclas Backstro ¨m 3 , Linnea Smeds 3 , Benoit Nabholz 3 , Yuichiro Itoh 4 , Osceola Whitney 8 , Andreas R. Pfenning 8 , Jason Howard 8 , Martin Vo ¨lker 11 , Bejamin M. Skinner 12 , Darren K. Griffin 12 , Liang Ye 1 , William M. McLaren 6 , Paul Flicek 6 , Victor Quesada 13 , Gloria Velasco 13 , Carlos Lopez-Otin 13 , Xose S. Puente 13 , Tsviya Olender 14 , Doron Lancet 14 , Arian F. A. Smit 15 , Robert Hubley 15 , Miriam K. Konkel 16 , Jerilyn A. Walker 16 , Mark A. Batzer 16 , Wanjun Gu 17 , David D. Pollock 17 , Lin Chen 18 , Ze Cheng 18 , Evan E. Eichler 18 , Jessica Stapley 18 , Jon Slate 19 , Robert Ekblom 19 , Tim Birkhead 19 , Terry Burke 19 , David Burt 20 , Constance Scharff 21 , Iris Adam 21 , Hugues Richard 22 , Marc Sultan 22 , Alexey Soldatov 22 , Hans Lehrach 22 , Scott V. Edwards 23 , Shiaw-Pyng Yang 24 , XiaoChing Li 25 , Tina Graves 1 , Lucinda Fulton 1 , Joanne Nelson 1 , Asif Chinwalla 1 , Shunfeng Hou 1 , Elaine R. Mardis 1 & Richard K. Wilson 1 The zebra finch is an important model organism in several fields 1,2 with unique relevance to human neuroscience 3,4 . Like other song- birds, the zebra finch communicates through learned vocaliza- tions, an ability otherwise documented only in humans and a few other animals and lacking in the chicken 5 —the only bird with a sequenced genome until now 6 . Here we present a structural, functional and comparative analysis of the genome sequence of the zebra finch (Taeniopygia guttata), which is a songbird belong- ing to the large avian order Passeriformes 7 . We find that the over- all structures of the genomes are similar in zebra finch and chicken, but they differ in many intrachromosomal rearrange- ments, lineage-specific gene family expansions, the number of long-terminal-repeat-based retrotransposons, and mechanisms of sex chromosome dosage compensation. We show that song behaviour engages gene regulatory networks in the zebra finch brain, altering the expression of long non-coding RNAs, microRNAs, transcription factors and their targets. We also show evidence for rapid molecular evolution in the songbird lineage of genes that are regulated during song experience. These results indicate an active involvement of the genome in neural processes underlying vocal communication and identify potential genetic substrates for the evolution and regulation of this behaviour. As in all songbirds, singing in the zebra finch is under the control of a discrete neural circuit that includes several dedicated centres in the forebrain termed the ‘song control nuclei’ (for an extensive series of reviews see ref. 8). Neurophysiological studies in these nuclei during singing have yielded some of the most illuminating examples of how vocalizations are encoded in the motor system of a vertebrate brain 9,10 . In the zebra finch, these nuclei develop more fully in the male than in the female (who does not sing), and they change markedly in size and organization during the juvenile period when the male learns to sing 11 . Analysis of the underlying cellular mechanisms of plasticity led to the unexpected discovery of neurogenesis in adult songbirds and life-long replacement of neurons 12 . Sex steroid hormones also contribute to songbird neural plasticity, in part by influencing the survival of new neurons 13 . Some of these effects are probably caused by oestrogen and/or testosterone synthesized within the brain itself rather than just in the gonads 14 . Song perception and memory also involve auditory centres that are present in both sexes, and the mere experience of hearing a song activates gene expression in these auditory centres 15 . The gene res- ponse itself changes as a song becomes familiar over the course of a day 16 or as the context of the experience changes 17 . The act of singing induces gene expression in the male song control nuclei, and these patterns of gene activation also vary with the context of the experi- ence 18 . The function of this changing genomic activity is not yet understood, but it may support or suppress learning and help integ- rate information over periods of hours to days 19 . The chicken genome is the only other bird genome analysed to date 6 . The chicken and zebra finch lineages diverged about 100 million years ago near the base of the avian radiation 7 . By comparing their genomes we can now discern features that are shared (and thus 1 The Genome Center, Washington University School of Medicine, Campus Box 8501, 4444 Forest Park Avenue, St Louis, Missouri 63108, USA. 2 University of Illinois, Urbana- Champaign, Illinois 61801 USA. 3 Uppsala University, Institute for Evolution and Genetics Systems, Norbyva¨gen 18D 752 36 Uppsala, Sweden. 4 University of California- Los Angeles, Los Angeles, California 90056, USA. 5 Wellcome Trust Sanger Institute, Wellcome Trust Genome Campus, Hinxton, Cambridge CB10 1SA, UK. 6 EMBL-EBI, Wellcome Trust Genome Campus, Hinxton, Cambridge CB10 1SD, UK. 7 MRC Functional Genomics Unit, University of Oxford, Department of Physiology, Anatomy and Genetics, South Parks Road, Oxford OX1 3QX, UK. 8 Howard Hughes Medical Institute, Department of Neurobiology, Box 3209, Duke University Medical Center, Durham, North Carolina 27710, USA. 9 Department of Behavioral Neuroscience, Oregon Health & Science University, Portland, Oregon 97239, USA. 10 Department of Biology & Biochemistry, University of Houston, Houston, Texas 77204, USA. 11 Department of Bioinformatics, Institute for Animal Health, Compton Berks RG20 7NN, UK. 12 Department of Biosciences, University of Kent, Canterbury, Kent CT2 7NJ, UK. 13 Instituto Universitario de Oncologia, Departamento de Bioquimica y Biologia Molecular, Universidad de Oviedo, 33006-Oviedo, Spain. 14 Crown Human Genome Center, Department of Molecular Genetics, Weizmann Institute of Science, Rehovot 76100, Israel. 15 Institute for Systems Biology, 1441 North 34th Street, Seattle, Washington 98103-8904, USA. 16 Department of Biological Sciences, Louisiana State University, 202 Life Sciences Building, Baton Rouge, Louisiana 70803, USA. 17 Department of Biochemistry & Molecular Genetics, University of Colorado Health Sciences Center, Mail Stop 8101, Aurora, Colorado 80045, USA. 18 University of Washington, Genome Sciences, Seattle, Washington 98195, USA. 19 Department of Animal & Plant Sciences, University of Sheffield, Sheffield S10 2TN, UK. 20 The Roslin Institute and Royal (Dick) School of Veterinary Studies, Edinburgh University, EH25 9OS, UK. 21 Freie Universitaet Berlin, Institut Biology, Takustr.6, 14195 Berlin, Germany. 22 Department of Vertebrate Genomics, Max Planck Institute for Molecular Genetics, IhnestraBe 73 14195 Berlin, Germany. 23 Department of Organismic and Evolutionary Biology, Harvard University, Cambridge, Massachusetts 02138, USA. 24 Monsanto Company, 800 North Lindbergh Boulevard, St Louis, Missouri 63167, USA. 25 Neuroscience Center, Louisiana State University Health Sciences Center, New Orleans, Louisiana 70112, USA. Vol 464 | 1 April 2010 | doi:10.1038/nature08819 757 Macmillan Publishers Limited. All rights reserved ©2010
Transcript of The genome of a songbird
LETTERS
The genome of a songbirdWesley C. Warren1, David F. Clayton2, Hans Ellegren3, Arthur P. Arnold4, LaDeana W. Hillier1, Axel Kunstner3,Steve Searle5, Simon White5, Albert J. Vilella6, Susan Fairley5, Andreas Heger7, Lesheng Kong7, Chris P. Ponting7,Erich D. Jarvis8, Claudio V. Mello9, Pat Minx1, Peter Lovell9, Tarciso A. F. Velho9, Margaret Ferris2,Christopher N. Balakrishnan2, Saurabh Sinha2, Charles Blatti2, Sarah E. London2, Yun Li2, Ya-Chi Lin2, Julia George2,Jonathan Sweedler2, Bruce Southey2, Preethi Gunaratne10, Michael Watson11, Kiwoong Nam3, Niclas Backstrom3,Linnea Smeds3, Benoit Nabholz3, Yuichiro Itoh4, Osceola Whitney8, Andreas R. Pfenning8, Jason Howard8,Martin Volker11, Bejamin M. Skinner12, Darren K. Griffin12, Liang Ye1, William M. McLaren6, Paul Flicek6,Victor Quesada13, Gloria Velasco13, Carlos Lopez-Otin13, Xose S. Puente13, Tsviya Olender14, Doron Lancet14,Arian F. A. Smit15, Robert Hubley15, Miriam K. Konkel16, Jerilyn A. Walker16, Mark A. Batzer16, Wanjun Gu17,David D. Pollock17, Lin Chen18, Ze Cheng18, Evan E. Eichler18, Jessica Stapley18, Jon Slate19, Robert Ekblom19,Tim Birkhead19, Terry Burke19, David Burt20, Constance Scharff21, Iris Adam21, Hugues Richard22, Marc Sultan22,Alexey Soldatov22, Hans Lehrach22, Scott V. Edwards23, Shiaw-Pyng Yang24, XiaoChing Li25, Tina Graves1,Lucinda Fulton1, Joanne Nelson1, Asif Chinwalla1, Shunfeng Hou1, Elaine R. Mardis1 & Richard K. Wilson1
The zebra finch is an important model organism in several fields1,2
with unique relevance to human neuroscience3,4. Like other song-birds, the zebra finch communicates through learned vocaliza-tions, an ability otherwise documented only in humans and afew other animals and lacking in the chicken5—the only bird witha sequenced genome until now6. Here we present a structural,functional and comparative analysis of the genome sequence ofthe zebra finch (Taeniopygia guttata), which is a songbird belong-ing to the large avian order Passeriformes7. We find that the over-all structures of the genomes are similar in zebra finch andchicken, but they differ in many intrachromosomal rearrange-ments, lineage-specific gene family expansions, the number oflong-terminal-repeat-based retrotransposons, and mechanismsof sex chromosome dosage compensation. We show that songbehaviour engages gene regulatory networks in the zebra finchbrain, altering the expression of long non-coding RNAs,microRNAs, transcription factors and their targets. We also showevidence for rapid molecular evolution in the songbird lineage ofgenes that are regulated during song experience. These resultsindicate an active involvement of the genome in neural processesunderlying vocal communication and identify potential geneticsubstrates for the evolution and regulation of this behaviour.
As in all songbirds, singing in the zebra finch is under the control ofa discrete neural circuit that includes several dedicated centres in theforebrain termed the ‘song control nuclei’ (for an extensive series ofreviews see ref. 8). Neurophysiological studies in these nuclei during
singing have yielded some of the most illuminating examples of howvocalizations are encoded in the motor system of a vertebratebrain9,10. In the zebra finch, these nuclei develop more fully in themale than in the female (whodoes not sing), and they changemarkedlyin size and organization during the juvenile period when the malelearns to sing11. Analysis of the underlying cellular mechanisms ofplasticity led to the unexpected discovery of neurogenesis in adultsongbirds and life-long replacement of neurons12. Sex steroidhormones also contribute to songbird neural plasticity, in part byinfluencing the survival of new neurons13. Some of these effects areprobably caused by oestrogen and/or testosterone synthesized withinthe brain itself rather than just in the gonads14.
Song perception and memory also involve auditory centres thatare present in both sexes, and the mere experience of hearing a songactivates gene expression in these auditory centres15. The gene res-ponse itself changes as a song becomes familiar over the course of aday16 or as the context of the experience changes17. The act of singinginduces gene expression in the male song control nuclei, and thesepatterns of gene activation also vary with the context of the experi-ence18. The function of this changing genomic activity is not yetunderstood, but it may support or suppress learning and help integ-rate information over periods of hours to days19.
The chicken genome is the only other bird genome analysed todate6. The chicken and zebra finch lineages diverged about 100millionyears ago near the base of the avian radiation7. By comparingtheir genomes we can now discern features that are shared (and thus
1The Genome Center, Washington University School of Medicine, Campus Box 8501, 4444 Forest Park Avenue, St Louis, Missouri 63108, USA. 2University of Illinois, Urbana-Champaign, Illinois 61801 USA. 3Uppsala University, Institute for Evolution and Genetics Systems, Norbyvagen 18D 752 36 Uppsala, Sweden. 4University of California- Los Angeles,Los Angeles, California 90056, USA. 5Wellcome Trust Sanger Institute, Wellcome Trust Genome Campus, Hinxton, Cambridge CB10 1SA, UK. 6EMBL-EBI, Wellcome Trust GenomeCampus, Hinxton, Cambridge CB10 1SD, UK. 7MRC Functional Genomics Unit, University of Oxford, Department of Physiology, Anatomy and Genetics, South Parks Road, Oxford OX13QX, UK. 8Howard Hughes Medical Institute, Department of Neurobiology, Box 3209, Duke University Medical Center, Durham, North Carolina 27710, USA. 9Department ofBehavioral Neuroscience, Oregon Health & Science University, Portland, Oregon 97239, USA. 10Department of Biology & Biochemistry, University of Houston, Houston, Texas 77204,USA. 11Department of Bioinformatics, Institute for Animal Health, Compton Berks RG20 7NN, UK. 12Department of Biosciences, University of Kent, Canterbury, Kent CT2 7NJ, UK.13Instituto Universitario deOncologia, Departamento de Bioquimica y BiologiaMolecular, Universidad deOviedo, 33006-Oviedo, Spain. 14CrownHumanGenomeCenter, Departmentof Molecular Genetics, Weizmann Institute of Science, Rehovot 76100, Israel. 15Institute for Systems Biology, 1441 North 34th Street, Seattle, Washington 98103-8904, USA.16Department of Biological Sciences, Louisiana State University, 202 Life Sciences Building, Baton Rouge, Louisiana 70803, USA. 17Department of Biochemistry &Molecular Genetics,University of Colorado Health Sciences Center, Mail Stop 8101, Aurora, Colorado 80045, USA. 18University of Washington, Genome Sciences, Seattle, Washington 98195, USA.19Department of Animal & Plant Sciences, University of Sheffield, Sheffield S10 2TN, UK. 20The Roslin Institute and Royal (Dick) School of Veterinary Studies, Edinburgh University,EH25 9OS, UK. 21Freie Universitaet Berlin, Institut Biology, Takustr.6, 14195 Berlin, Germany. 22Department of Vertebrate Genomics, Max Planck Institute for Molecular Genetics,IhnestraBe 73 14195 Berlin, Germany. 23Department of Organismic and Evolutionary Biology, Harvard University, Cambridge,Massachusetts 02138, USA. 24Monsanto Company, 800North Lindbergh Boulevard, St Louis, Missouri 63167, USA. 25Neuroscience Center, Louisiana State University Health Sciences Center, New Orleans, Louisiana 70112, USA.
Vol 464 | 1 April 2010 |doi:10.1038/nature08819
757Macmillan Publishers Limited. All rights reserved©2010
generally characteristic of birds), and features that are most conspi-cuously different between the two lineages—some of which will berelated to the distinctive neural and behavioural traits of songbirds.
We sequenced and assembled a male zebra finch genome usingmethods described previously6,20. A male (the homogametic sex inbirds) was chosen to maximize coverage of the Z chromosome. Ofthe 1.2 gigabase (Gb) draft assembly, 1.0Gb has been assigned to 33chromosomes and three linkage groups, by using zebra finch geneticlinkage21 and bacterial artificial chromosome (BAC) fingerprintmaps.The genome assembly is of sufficient quality for the analysis presentedhere (see Supplementary Note 1 and Supplementary Table 1). A totalof 17,475 protein-coding genes were predicted from the zebra finchgenome assembly using the Ensembl pipeline supplemented byGpipe gene models (Supplementary Note 1). To extend further thecharacterization of genes relevant to brain and behaviour, we alsosequenced complementary DNAs from the forebrain of zebra finchesat 50 (juvenile, during the critical song learning period) and 850(adult) days post-hatch, mapping these reads (Illumina GA2) tothe protein-coding models (Supplementary Note 1). Of the 17,475protein-coding gene models we find 9,872 (56%) and 10,106 (57%)genes expressed in the forebrain at these two ages (90.7% overlap),respectively. In addition to evidence for developmental regulation,these reads show further splice forms, new exons and untranslatedsequences (Supplementary Figs 1 and 2).
To address issues of large-scale genome structure and evolution, wecompared the chromosomes of zebra finch and chicken using bothsequence alignment and fluorescent in situ hybridization. These ana-lyses showed overall conservation of synteny and karyotype in the twospecies, although the rate of intrachromosomal rearrangement washigh (Supplementary Note 2). We were also surprised to see genes ofthemajor histocompatibility complex (MHC)dispersed across severalchromosomes in the zebra finch, in contrast to the syntenic organiza-tion of both chicken and human MHCs (Supplementary Note 2).
We assessed specific gene losses and expansions in the zebra finchlineage by constructing phylogenies of genes present in the lastcommon ancestor of birds and mammals (Supplementary Note 2and Supplementary Fig. 3). Both the zebra finch and the chickengenome assemblies lack genes encoding vomeronasal receptors, caseinmilk proteins, salivary-associated proteins and enamel proteins—notsurprisingly, as birds lack vomeronasal organs, mammary glands andteeth. Unexpectedly, both species lack the gene for the neuronalprotein synapsin 1 (SYN1); comparative analyses suggest that the lossof SYN1 and flanking genes probably occurred in an ancestor tomodern birds, possibly within the dinosaur lineage (SupplementaryNote 2, Supplementary Table 2 and Supplementary Fig. 4). Both zebrafinch and chicken have extensive repertoires of olfactory receptor-likesequences (Supplementary Note 2 and Supplementary Fig. 5), pro-teases (Supplementary Table 3), and a rich repertoire of neuropeptideand pro-hormone genes.
Compared to mammals, zebra finch has duplications of genesencoding several proteins with known neural functions, includinggrowth hormone, (Supplementary Fig. 3), caspase-3 and b-secretase(Supplementary Table 3). Two large expansions of gene familiesexpressed in the brain seem to have occurred in the zebra finchlineage after the split from mammals. One involves a family relatedto the PAK3 (p21-activated kinase) gene. Thirty-one uninterruptedPAK3-like sequences have been identified in the zebra finch genome,of which 29 are expressed in testis and/or brain (Supplementary Note2). The second involves the PHF7 gene, which encodes a zinc-finger-containing transcriptional control protein. Humans only have asingle PHF7 gene, but remarkably the gene has been duplicated inde-pendently, many times in both the zebra finch and chicken lineages toform species-specific clades of 17 and 18 genes, respectively (Sup-plementary Fig. 6). In the zebra finch these genes are expressed in thebrain (Supplementary Note 2).
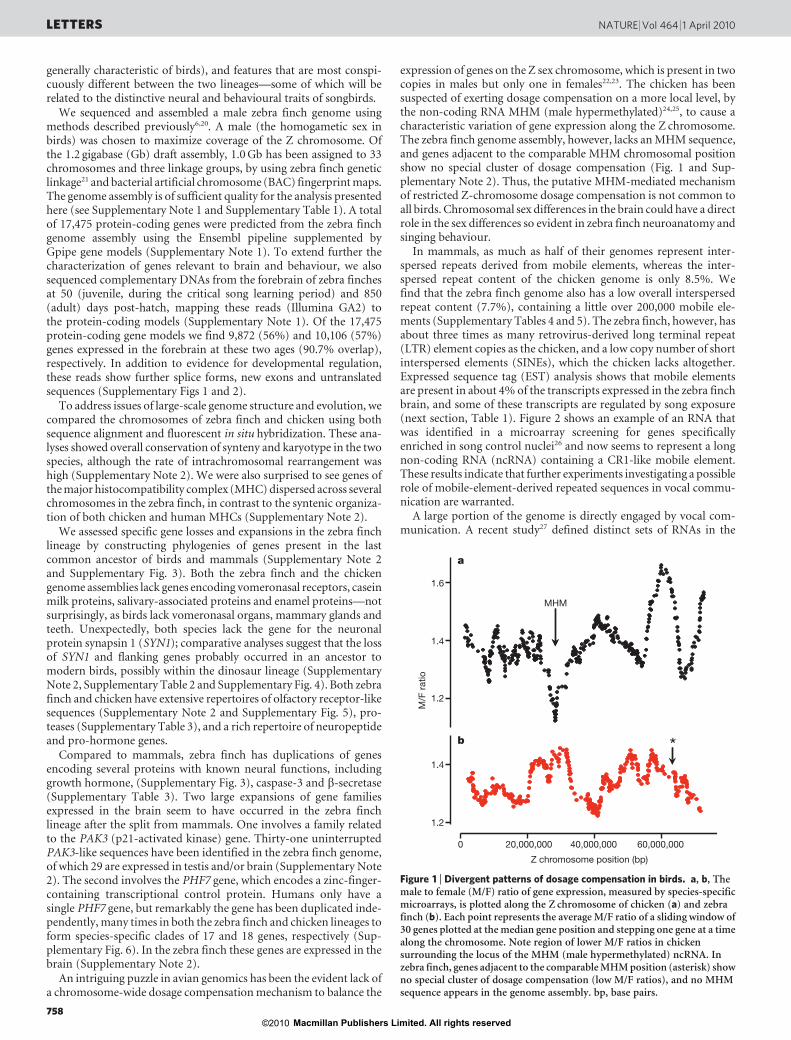
An intriguing puzzle in avian genomics has been the evident lack ofa chromosome-wide dosage compensationmechanism to balance the
expression of genes on the Z sex chromosome, which is present in twocopies in males but only one in females22,23. The chicken has beensuspected of exerting dosage compensation on a more local level, bythe non-coding RNA MHM (male hypermethylated)24,25, to cause acharacteristic variation of gene expression along the Z chromosome.The zebra finch genome assembly, however, lacks anMHM sequence,and genes adjacent to the comparable MHM chromosomal positionshow no special cluster of dosage compensation (Fig. 1 and Sup-plementary Note 2). Thus, the putative MHM-mediated mechanismof restricted Z-chromosome dosage compensation is not common toall birds. Chromosomal sex differences in the brain could have a directrole in the sex differences so evident in zebra finch neuroanatomy andsinging behaviour.
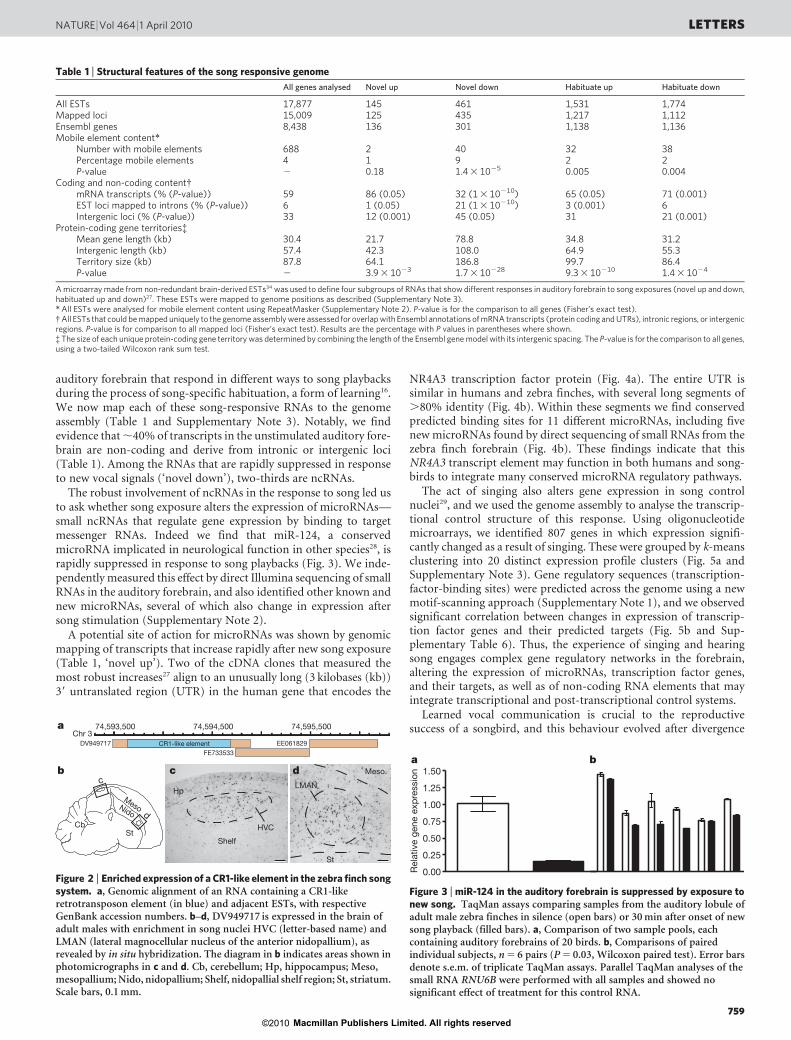
In mammals, as much as half of their genomes represent inter-spersed repeats derived from mobile elements, whereas the inter-spersed repeat content of the chicken genome is only 8.5%. Wefind that the zebra finch genome also has a low overall interspersedrepeat content (7.7%), containing a little over 200,000 mobile ele-ments (Supplementary Tables 4 and 5). The zebra finch, however, hasabout three times as many retrovirus-derived long terminal repeat(LTR) element copies as the chicken, and a low copy number of shortinterspersed elements (SINEs), which the chicken lacks altogether.Expressed sequence tag (EST) analysis shows that mobile elementsare present in about 4% of the transcripts expressed in the zebra finchbrain, and some of these transcripts are regulated by song exposure(next section, Table 1). Figure 2 shows an example of an RNA thatwas identified in a microarray screening for genes specificallyenriched in song control nuclei26 and now seems to represent a longnon-coding RNA (ncRNA) containing a CR1-like mobile element.These results indicate that further experiments investigating a possiblerole of mobile-element-derived repeated sequences in vocal commu-nication are warranted.
A large portion of the genome is directly engaged by vocal com-munication. A recent study27 defined distinct sets of RNAs in the
MHM
*
1.6
1.4
1.4
1.2
1.2
0 20,000,000
Z chromosome position (bp)
40,000,000 60,000,000
M/F
ratio
a
b
Figure 1 | Divergent patterns of dosage compensation in birds. a, b, Themale to female (M/F) ratio of gene expression, measured by species-specificmicroarrays, is plotted along the Z chromosome of chicken (a) and zebrafinch (b). Each point represents the averageM/F ratio of a sliding window of30 genes plotted at the median gene position and stepping one gene at a timealong the chromosome. Note region of lower M/F ratios in chickensurrounding the locus of the MHM (male hypermethylated) ncRNA. Inzebra finch, genes adjacent to the comparableMHMposition (asterisk) showno special cluster of dosage compensation (low M/F ratios), and no MHMsequence appears in the genome assembly. bp, base pairs.
LETTERS NATURE |Vol 464 | 1 April 2010
758Macmillan Publishers Limited. All rights reserved©2010
auditory forebrain that respond in different ways to song playbacksduring the process of song-specific habituation, a form of learning16.We now map each of these song-responsive RNAs to the genomeassembly (Table 1 and Supplementary Note 3). Notably, we findevidence that,40% of transcripts in the unstimulated auditory fore-brain are non-coding and derive from intronic or intergenic loci(Table 1). Among the RNAs that are rapidly suppressed in responseto new vocal signals (‘novel down’), two-thirds are ncRNAs.
The robust involvement of ncRNAs in the response to song led usto ask whether song exposure alters the expression of microRNAs—small ncRNAs that regulate gene expression by binding to targetmessenger RNAs. Indeed we find that miR-124, a conservedmicroRNA implicated in neurological function in other species28, israpidly suppressed in response to song playbacks (Fig. 3). We inde-pendently measured this effect by direct Illumina sequencing of smallRNAs in the auditory forebrain, and also identified other known andnew microRNAs, several of which also change in expression aftersong stimulation (Supplementary Note 2).
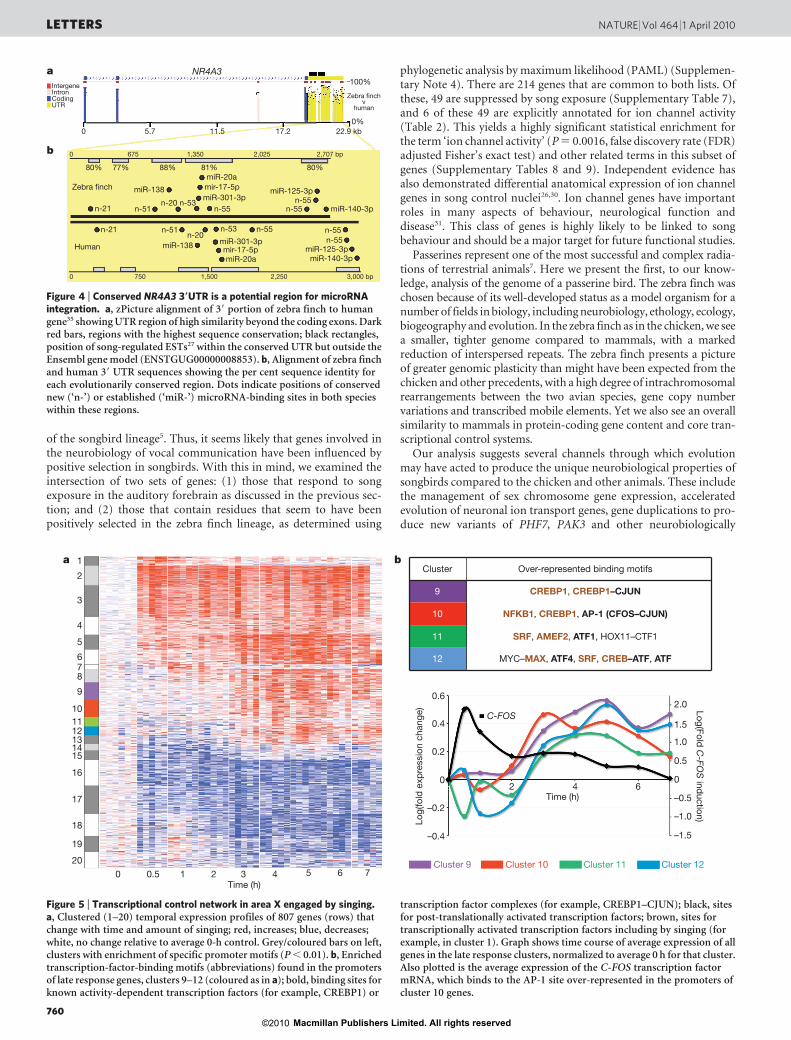
A potential site of action for microRNAs was shown by genomicmapping of transcripts that increase rapidly after new song exposure(Table 1, ‘novel up’). Two of the cDNA clones that measured themost robust increases27 align to an unusually long (3 kilobases (kb))39 untranslated region (UTR) in the human gene that encodes the
NR4A3 transcription factor protein (Fig. 4a). The entire UTR issimilar in humans and zebra finches, with several long segments of.80% identity (Fig. 4b). Within these segments we find conservedpredicted binding sites for 11 different microRNAs, including fivenew microRNAs found by direct sequencing of small RNAs from thezebra finch forebrain (Fig. 4b). These findings indicate that thisNR4A3 transcript element may function in both humans and song-birds to integrate many conserved microRNA regulatory pathways.
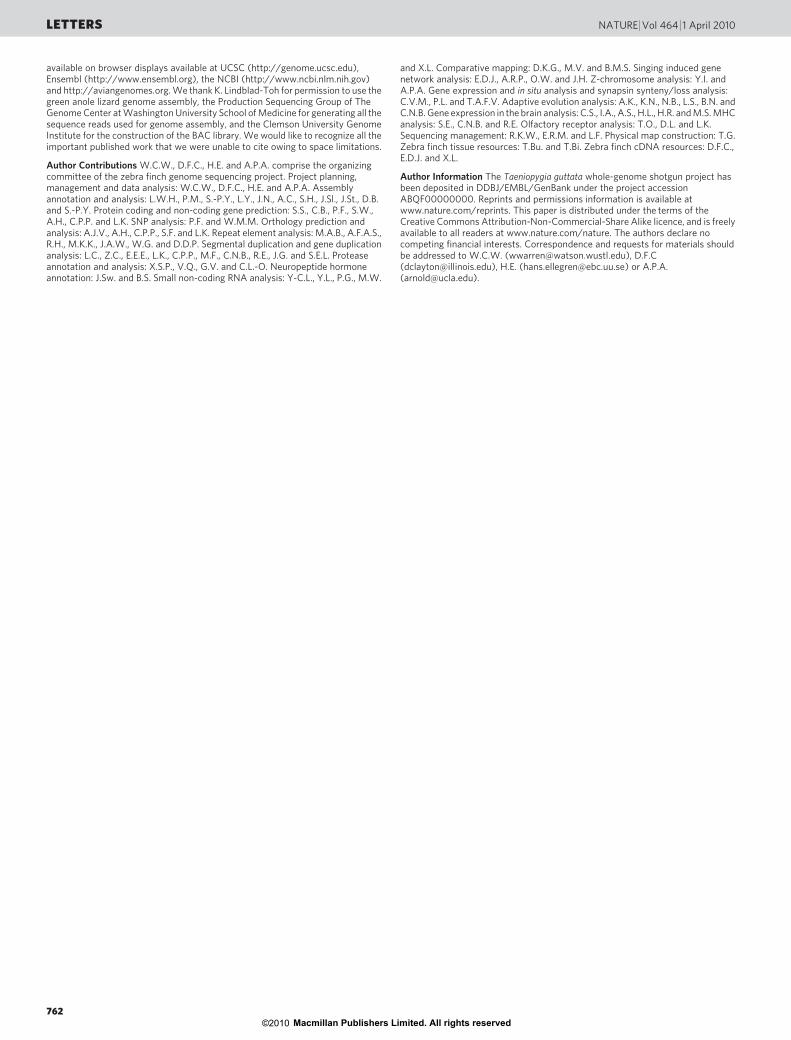
The act of singing also alters gene expression in song controlnuclei29, and we used the genome assembly to analyse the transcrip-tional control structure of this response. Using oligonucleotidemicroarrays, we identified 807 genes in which expression signifi-cantly changed as a result of singing. These were grouped by k-meansclustering into 20 distinct expression profile clusters (Fig. 5a andSupplementary Note 3). Gene regulatory sequences (transcription-factor-binding sites) were predicted across the genome using a newmotif-scanning approach (Supplementary Note 1), and we observedsignificant correlation between changes in expression of transcrip-tion factor genes and their predicted targets (Fig. 5b and Sup-plementary Table 6). Thus, the experience of singing and hearingsong engages complex gene regulatory networks in the forebrain,altering the expression of microRNAs, transcription factor genes,and their targets, as well as of non-coding RNA elements that mayintegrate transcriptional and post-transcriptional control systems.
Learned vocal communication is crucial to the reproductivesuccess of a songbird, and this behaviour evolved after divergence
Table 1 | Structural features of the song responsive genome
All genes analysed Novel up Novel down Habituate up Habituate down
All ESTs 17,877 145 461 1,531 1,774Mapped loci 15,009 125 435 1,217 1,112Ensembl genes 8,438 136 301 1,138 1,136Mobile element content*
Number with mobile elements 688 2 40 32 38Percentage mobile elements 4 1 9 2 2P-value 2 0.18 1.43 1025 0.005 0.004
Coding and non-coding content{mRNA transcripts (% (P-value)) 59 86 (0.05) 32 (13 10210) 65 (0.05) 71 (0.001)EST loci mapped to introns (% (P-value)) 6 1 (0.05) 21 (13 10210) 3 (0.001) 6Intergenic loci (% (P-value)) 33 12 (0.001) 45 (0.05) 31 21 (0.001)
Protein-coding gene territories{Mean gene length (kb) 30.4 21.7 78.8 34.8 31.2Intergenic length (kb) 57.4 42.3 108.0 64.9 55.3Territory size (kb) 87.8 64.1 186.8 99.7 86.4P-value 2 3.93 1023 1.73 10228 9.33 10210 1.43 1024
Amicroarray made from non-redundant brain-derived ESTs34 was used to define four subgroups of RNAs that show different responses in auditory forebrain to song exposures (novel up and down,habituated up and down)27. These ESTs were mapped to genome positions as described (Supplementary Note 3).*All ESTs were analysed for mobile element content using RepeatMasker (Supplementary Note 2). P-value is for the comparison to all genes (Fisher’s exact test).{All ESTs that could bemapped uniquely to the genome assemblywere assessed for overlapwith Ensembl annotations ofmRNA transcripts (protein coding andUTRs), intronic regions, or intergenicregions. P-value is for comparison to all mapped loci (Fisher’s exact test). Results are the percentage with P values in parentheses where shown.{The size of each unique protein-coding gene territory was determined by combining the length of the Ensembl genemodel with its intergenic spacing. The P-value is for the comparison to all genes,using a two-tailed Wilcoxon rank sum test.
c d Meso.
St
b
d
Hp
Shelf
HVC
LMAN
CbSt
Nido
Meso
c
DV949717 CR1-like elementFE733533
EE061829Chr 3
74,593,500 74,594,500 74,595,500a
Figure 2 | Enriched expression of a CR1-like element in the zebra finch songsystem. a, Genomic alignment of an RNA containing a CR1-likeretrotransposon element (in blue) and adjacent ESTs, with respectiveGenBank accession numbers. b–d, DV949717 is expressed in the brain ofadult males with enrichment in song nuclei HVC (letter-based name) andLMAN (lateral magnocellular nucleus of the anterior nidopallium), asrevealed by in situ hybridization. The diagram in b indicates areas shown inphotomicrographs in c and d. Cb, cerebellum; Hp, hippocampus; Meso,mesopallium;Nido, nidopallium; Shelf, nidopallial shelf region; St, striatum.Scale bars, 0.1mm.
0.00
0.25
0.50
0.75
1.00
1.25
1.50a b
Rel
ativ
e ge
ne e
xpre
ssio
n
Figure 3 | miR-124 in the auditory forebrain is suppressed by exposure tonew song. TaqMan assays comparing samples from the auditory lobule ofadult male zebra finches in silence (open bars) or 30min after onset of newsong playback (filled bars). a, Comparison of two sample pools, eachcontaining auditory forebrains of 20 birds. b, Comparisons of pairedindividual subjects, n5 6 pairs (P5 0.03, Wilcoxon paired test). Error barsdenote s.e.m. of triplicate TaqMan assays. Parallel TaqMan analyses of thesmall RNA RNU6B were performed with all samples and showed nosignificant effect of treatment for this control RNA.
NATURE |Vol 464 | 1 April 2010 LETTERS
759Macmillan Publishers Limited. All rights reserved©2010
of the songbird lineage5. Thus, it seems likely that genes involved inthe neurobiology of vocal communication have been influenced bypositive selection in songbirds. With this in mind, we examined theintersection of two sets of genes: (1) those that respond to songexposure in the auditory forebrain as discussed in the previous sec-tion; and (2) those that contain residues that seem to have beenpositively selected in the zebra finch lineage, as determined using
phylogenetic analysis bymaximum likelihood (PAML) (Supplemen-tary Note 4). There are 214 genes that are common to both lists. Ofthese, 49 are suppressed by song exposure (Supplementary Table 7),and 6 of these 49 are explicitly annotated for ion channel activity(Table 2). This yields a highly significant statistical enrichment forthe term ‘ion channel activity’ (P5 0.0016, false discovery rate (FDR)adjusted Fisher’s exact test) and other related terms in this subset ofgenes (Supplementary Tables 8 and 9). Independent evidence hasalso demonstrated differential anatomical expression of ion channelgenes in song control nuclei26,30. Ion channel genes have importantroles in many aspects of behaviour, neurological function anddisease31. This class of genes is highly likely to be linked to songbehaviour and should be a major target for future functional studies.
Passerines represent one of the most successful and complex radia-tions of terrestrial animals7. Here we present the first, to our know-ledge, analysis of the genome of a passerine bird. The zebra finch waschosen because of its well-developed status as a model organism for anumber of fields inbiology, includingneurobiology, ethology, ecology,biogeography and evolution. In the zebra finch as in the chicken,we seea smaller, tighter genome compared to mammals, with a markedreduction of interspersed repeats. The zebra finch presents a pictureof greater genomic plasticity than might have been expected from thechicken and other precedents, with a high degree of intrachromosomalrearrangements between the two avian species, gene copy numbervariations and transcribed mobile elements. Yet we also see an overallsimilarity to mammals in protein-coding gene content and core tran-scriptional control systems.
Our analysis suggests several channels through which evolutionmay have acted to produce the unique neurobiological properties ofsongbirds compared to the chicken and other animals. These includethe management of sex chromosome gene expression, acceleratedevolution of neuronal ion transport genes, gene duplications to pro-duce new variants of PHF7, PAK3 and other neurobiologically
NR4A3IntergeneIntronCodingUTR
a
b
100%
0%
Zebra !nchv
human
0
80% 77% 88% 81% 80%
0
0 750 1,500 2,250 3,000 bp
2,707 bp2,0251,350675
5.7 11.5 17.2 22.9 kb
Zebra !nch
Human
n-21
n-21 n-51
n-53n-20
n-51
miR-138
n-55
n-55n-55n-55
n-20 n-53n-55
n-55miR-140-3p
miR-140-3p
miR-125-3p
miR-125-3p
miR-20a
miR-20a
miR-138 mir-17-5p
mir-17-5p
miR-301-3p
miR-301-3p
Figure 4 | Conserved NR4A3 39UTR is a potential region for microRNAintegration. a, zPicture alignment of 39 portion of zebra finch to humangene35 showingUTR region of high similarity beyond the coding exons. Darkred bars, regions with the highest sequence conservation; black rectangles,position of song-regulated ESTs27 within the conserved UTR but outside theEnsembl genemodel (ENSTGUG00000008853). b, Alignment of zebra finchand human 39 UTR sequences showing the per cent sequence identity foreach evolutionarily conserved region. Dots indicate positions of conservednew (‘n-’) or established (‘miR-’) microRNA-binding sites in both specieswithin these regions.
a b1
2
3
4
5
678
9
101112131415
16
17
18
19
200 0.5 1 2 3 4 65 7
Time (h)
9 CREBP1, CREBP1–CJUN
NFKB1, CREBP1, AP-1 (CFOS–CJUN)
SRF, AMEF2, ATF1, HOX11–CTF1
MYC–MAX, ATF4, SRF, CREB–ATF, ATF
10
11
12
Cluster Over-represented binding motifs
C-FOS
Time (h)
0.6
0.4
0.2
0
–0.2
–0.4
Log(
fold
exp
ress
ion
chan
ge) 2.0
1.0
–1.0
0.5
–0.5
042 6
1.5
–1.5
Cluster 9 Cluster 10 Cluster 11 Cluster 12
Log(Fold C-FO
S induction)
Figure 5 | Transcriptional control network in area X engaged by singing.a, Clustered (1–20) temporal expression profiles of 807 genes (rows) thatchange with time and amount of singing; red, increases; blue, decreases;white, no change relative to average 0-h control. Grey/coloured bars on left,clusters with enrichment of specific promoter motifs (P, 0.01). b, Enrichedtranscription-factor-binding motifs (abbreviations) found in the promotersof late response genes, clusters 9–12 (coloured as in a); bold, binding sites forknown activity-dependent transcription factors (for example, CREBP1) or
transcription factor complexes (for example, CREBP1–CJUN); black, sitesfor post-translationally activated transcription factors; brown, sites fortranscriptionally activated transcription factors including by singing (forexample, in cluster 1). Graph shows time course of average expression of allgenes in the late response clusters, normalized to average 0 h for that cluster.Also plotted is the average expression of the C-FOS transcription factormRNA, which binds to the AP-1 site over-represented in the promoters ofcluster 10 genes.
LETTERS NATURE |Vol 464 | 1 April 2010
760Macmillan Publishers Limited. All rights reserved©2010

important genes, and a new arrangement of MHC genes. Mostnotably, our analyses suggest a large recruitment of the genomeduring vocal communication, including the extensive involvementof ncRNAs. It has been proposed that ncRNAs have a contributingrole in enabling or driving the evolution of greater complexity inhumans and other complex eukaryotes32. Seeing that learned vocalcommunication itself is a phenomenon that has emerged only insome of the most complex organisms, perhaps ncRNAs are a nexusof this phenomenon.
Much work will be needed to establish the actual functional sig-nificance of many of these observations and to determine when theyarose in avian evolution. This work can now be expedited with therecent development of a method for transgenesis in the zebra finch33.An important general lesson, however, is that dynamic and seren-dipitous aspects of the genome may have unexpected roles in theelaborate vocal communicative capabilities of songbirds.
METHODS SUMMARYSequence assembly. Sequenced reads were assembled and attempts weremade toassign the largest contiguous blocks of sequence to chromosomes using a geneticlinkage map21, fingerprint map and synteny with the chicken genome assemblyGallus_gallus-2.1, a revised version of the original draft6 (SupplementaryNote 1).Genes. Gene orthology assignment was performed using the EnsemblComparaGeneTrees pipeline and theOPTIC pipeline (Supplementary Note 1). Orthologyrate estimation was performed with PAML (pairwisemodel5 0, Nssites5 0). Inall cases, codon frequencies were estimated from the nucleotide composition ateach codon position (F3X4 model).Gene expression and evolution. Methods for Illumina read counting, in situhybridization, TaqMan RT–PCR, microarrays, regulatory motif and evolution-ary rate analyses are given in Supplementary Notes 1–4.
Received 30 September 2009; accepted 6 January 2010.
1. Zann, R. A. The Zebra Finch: A Synthesis of Field and Laboratory Studies (OxfordUniv, Press, 1996).
2. Clayton, D. F., Balakrishnan, C. N. & London, S. E. Integrating genomes, brain andbehavior in the study of songbirds. Curr. Biol. 19, R865–R873 (2009).
3. Nottebohm, F. in Hope For a New Neurology (ed. Nottebohm, F.) (New YorkAcademy of Science, 1985).
4. Doupe, A. J. & Kuhl, P. K. Birdsong and human speech: common themes andmechanisms. Annu. Rev. Neurosci. 22, 567–631 (1999).
5. Jarvis, E. D. Learned birdsong and the neurobiology of human language. Ann. NYAcad. Sci. 1016, 749–777 (2004).
6. Hillier, L. W. et al. Sequence and comparative analysis of the chicken genomeprovide unique perspectives on vertebrate evolution. Nature 432, 695–716(2004).
7. Hackett, S. J. et al. A phylogenomic study of birds reveals their evolutionaryhistory. Science 320, 1763–1768 (2008).
8. Zeigler, H. P. &Marler, P. Behavioral Neurobiology of Bird SongVol. 1016 (NewYorkAcademy of Sciences, 2004).
9. Hahnloser, R. H., Kozhevnikov, A. A. & Fee, M. S. An ultra-sparse codeunderlies the generation of neural sequences in a songbird. Nature 419, 65–70(2002).
10. Mooney, R. Neural mechanisms for learned birdsong. Learn. Mem. 16, 655–669(2009).
11. Konishi, M. & Akutagawa, E. Neuronal growth, atrophy and death in a sexuallydimorphic song nucleus in the zebra finch brain. Nature 315, 145–147 (1985).
12. Goldman, S. A. & Nottebohm, F. Neuronal production, migration, anddifferentiation in a vocal control nucleus of the adult female canary brain. Proc.Natl Acad. Sci. USA 80, 2390–2394 (1983).
13. Nottebohm, F. The road we travelled: discovery, choreography, and significanceof brain replaceable neurons. Ann. NY Acad. Sci. 1016, 628–658 (2004).
14. London, S. E., Remage-Healey, L. & Schlinger, B. A. Neurosteroid production in thesongbird brain: A re-evaluation of core principles. Front. Neuroendocrinol. 30,302–314 (2009).
15. Mello,C.V., Vicario,D.S.&Clayton,D. F. Songpresentation inducesgeneexpressionin the songbird forebrain. Proc. Natl Acad. Sci. USA 89, 6818–6822 (1992).
16. Dong, S. & Clayton, D. F. Habituation in songbirds. Neurobiol. Learn. Mem. 92,183–188 (2009).
17. Woolley, S. C. &Doupe, A. J. Social context-induced song variation affects femalebehavior and gene expression. PLoS Biol. 6, e62 (2008).
18. Jarvis, E. D., Scharff, C., Grossman, M. R., Ramos, J. A. & Nottebohm, F. For whomthe bird sings: context-dependent gene expression. Neuron 21, 775–788 (1998).
19. Clayton, D. F. The genomic action potential. Neurobiol. Learn. Mem. 74, 185–216(2000).
20. Warren,W. C. et al.Genome analysis of the platypus reveals unique signatures ofevolution. Nature 453, 175–183 (2008).
21. Stapley, J., Birkhead, T. R., Burke, T. & Slate, J. A linkage map of the zebra finchTaeniopygia guttata provides new insights into avian genome evolution. Genetics179, 651–667 (2008).
22. Itoh, Y. et al. Dosage compensation is less effective in birds than in mammals. J.Biol. 6, 2 (2007).
23. Ellegren, H. et al. Faced with inequality: chicken do not have a general dosagecompensation of sex-linked genes. BMC Biol. 5, 40 (2007).
24. Teranishi, M. et al. Transcripts of the MHM region on the chicken Z chromosomeaccumulate as non-coding RNA in the nucleus of female cells adjacent to theDMRT1 locus. Chromosome Res. 9, 147–165 (2001).
25. Arnold, A. P., Itoh, Y. &Melamed, E. A bird’s-eye view of sex chromosome dosagecompensation. Annu. Rev. Genomics Hum. Genet. 9, 109–127 (2008).
26. Lovell, P. V., Clayton, D. F., Replogle, K. L. & Mello, C. V. Birdsong‘‘transcriptomics’’: neurochemical specializations of the oscine song system. PLoSOne 3, e3440 (2008).
27. Dong, S. et al. Discrete molecular states in the brain accompany changingresponses to a vocal signal. Proc. Natl Acad. Sci. USA 106, 11364–11369 (2009).
28. Makeyev, E. V. & Maniatis, T. Multilevel regulation of gene expression bymicroRNAs. Science 319, 1789–1790 (2008).
29. Wada, K. et al. A molecular neuroethological approach for identifying andcharacterizing a cascade of behaviorally regulated genes. Proc. Natl Acad. Sci. USA103, 15212–15217 (2006).
30. Wada, K., Sakaguchi, H., Jarvis, E. D. & Hagiwara, M. Differential expression ofglutamate receptors in avian neural pathways for learned vocalization. J. Comp.Neurol. 476, 44–64 (2004).
31. Cooper, E. C. & Jan, L. Y. Ion channel genes and human neurological disease:recent progress, prospects, and challenges. Proc. Natl Acad. Sci. USA 96,4759–4766 (1999).
32. Mattick, J. S. RNA regulation: a new genetics? Nature Rev. Genet. 5, 316–323(2004).
33. Agate, R. J., Scott, B. B., Haripal, B., Lois, C. & Nottebohm, F. Transgenic songbirdsoffer an opportunity to develop a genetic model for vocal learning. Proc. Natl Acad.Sci. USA 106, 17963–17967 (2009).
34. Replogle, K. et al. The Songbird Neurogenomics (SoNG) Initiative: community-based tools and strategies for study of brain gene function and evolution. BMCGenomics 9, 131 (2008).
35. Ovcharenko, I., Loots, G. G., Hardison, R. C., Miller, W. & Stubbs, L. zPicture:dynamic alignment and visualization tool for analyzing conservation profiles.Genome Res. 14, 472–477 (2004).
Supplementary Information is linked to the online version of the paper atwww.nature.com/nature.
Acknowledgements The sequencing of zebra finch was funded by the NationalHuman Genome Research Institute (NHGRI). Further research support includedgrants toD.F.C. (NIH RO1NS045264 and RO1NS051820), H.E. (Swedish ResearchCouncil and Knut and Alice Wallenberg Foundation), E.D.J. (HHMI, NIH DirectorsPioneer Award and R01 DC007218), M.A.B. (NIH RO1 GM59290) and J.S.(Biotechnology and Biological Sciences Research Council grant numberBBE0175091). Resources for exploring the sequence and annotation data are
Table 2 | Song-suppressed ion channel genes under positive selection
Gene Description Branch Dv Sites PS/total
CACNA1B Voltage-dependent N-type calcium channel subunit a-1B 0.016 9/2,484CACNA1G Voltage-dependent T-type calcium channel subunit a-1G 0.044* 2/2,468GRIA2 Glutamate receptor 2 precursor (GluR-2, AMPA 2) 0.231* 17/948GRIA3 Glutamate receptor 3 precursor (GluR-3, AMPA 3) 20.010 4/894KCNC2 Potassium voltage-gated channel subfamily C member 2 (Kv3.2) 0.315* 32/654TRPV1 Transient receptor potential cation channel subfamily V member 1 20.067 3/876
These six genes are suppressed by song exposure (FDR5 0.05)27 and they show evidence of positive selection in the zebra finch relative to chicken (P, 1023, Supplementary Note 3). Branch Dvdenotes the difference in the non-synonymous to synonymous substitution ratio (dN/dS) between zebra finch and other birds (chicken and the ancestral branch leading to chicken and zebra finch).Positive values indicate that the gene is rapidly evolving, whereas negative values indicate genes evolving more slowly. Sites PS/total denotes the number of individual sites with empirical Bayesposterior probability greater than 0.95 ofv. 1 (positive selection) in the finch versus the total number of residues in the protein, from branch-site model analysis implemented in PAML. Note thatgenes can show overall slower evolution in the branch model yet show evidence of significant positive selection at specific sites.*Gene-wide differences that were significant (P , 0.05) by a likelihood ratio test.
NATURE |Vol 464 | 1 April 2010 LETTERS
761Macmillan Publishers Limited. All rights reserved©2010
available on browser displays available at UCSC (http://genome.ucsc.edu),Ensembl (http://www.ensembl.org), the NCBI (http://www.ncbi.nlm.nih.gov)and http://aviangenomes.org.We thank K. Lindblad-Toh for permission to use thegreen anole lizard genome assembly, the Production Sequencing Group of TheGenomeCenter atWashington University School ofMedicine for generating all thesequence reads used for genome assembly, and the Clemson University GenomeInstitute for the construction of the BAC library. We would like to recognize all theimportant published work that we were unable to cite owing to space limitations.
Author Contributions W.C.W., D.F.C., H.E. and A.P.A. comprise the organizingcommittee of the zebra finch genome sequencing project. Project planning,management and data analysis: W.C.W., D.F.C., H.E. and A.P.A. Assemblyannotation and analysis: L.W.H., P.M., S.-P.Y., L.Y., J.N., A.C., S.H., J.Sl., J.St., D.B.and S.-P.Y. Protein coding and non-coding gene prediction: S.S., C.B., P.F., S.W.,A.H., C.P.P. and L.K. SNP analysis: P.F. and W.M.M. Orthology prediction andanalysis: A.J.V., A.H., C.P.P., S.F. and L.K. Repeat element analysis: M.A.B., A.F.A.S.,R.H., M.K.K., J.A.W., W.G. and D.D.P. Segmental duplication and gene duplicationanalysis: L.C., Z.C., E.E.E., L.K., C.P.P., M.F., C.N.B., R.E., J.G. and S.E.L. Proteaseannotation and analysis: X.S.P., V.Q., G.V. and C.L.-O. Neuropeptide hormoneannotation: J.Sw. and B.S. Small non-coding RNA analysis: Y-C.L., Y.L., P.G., M.W.
and X.L. Comparative mapping: D.K.G., M.V. and B.M.S. Singing induced genenetwork analysis: E.D.J., A.R.P., O.W. and J.H. Z-chromosome analysis: Y.I. andA.P.A. Gene expression and in situ analysis and synapsin synteny/loss analysis:C.V.M., P.L. and T.A.F.V. Adaptive evolution analysis: A.K., K.N., N.B., L.S., B.N. andC.N.B. Gene expression in the brain analysis: C.S., I.A., A.S., H.L., H.R. andM.S.MHCanalysis: S.E., C.N.B. and R.E. Olfactory receptor analysis: T.O., D.L. and L.K.Sequencing management: R.K.W., E.R.M. and L.F. Physical map construction: T.G.Zebra finch tissue resources: T.Bu. and T.Bi. Zebra finch cDNA resources: D.F.C.,E.D.J. and X.L.
Author Information The Taeniopygia guttata whole-genome shotgun project hasbeen deposited in DDBJ/EMBL/GenBank under the project accessionABQF00000000. Reprints and permissions information is available atwww.nature.com/reprints. This paper is distributed under the terms of theCreative Commons Attribution-Non-Commercial-Share Alike licence, and is freelyavailable to all readers at www.nature.com/nature. The authors declare nocompeting financial interests. Correspondence and requests for materials shouldbe addressed to W.C.W. ([email protected]), D.F.C([email protected]), H.E. ([email protected]) or A.P.A.([email protected]).
LETTERS NATURE |Vol 464 | 1 April 2010
762Macmillan Publishers Limited. All rights reserved©2010