A Grid-Enabled Service for High-Throughput Genome Analysis
11
A Grid-Enabled Service for High-Throughput Genome Analysis Alex Rodriguez 1 Dinanath Sulakhe 1 Elizabeth Marland 1 Veronika Nefedova 1 Natalia Maltsev 1 Michael Wilde 1 Ian Foster 1,2 1 Math and Computer Science Division, Argonne National Laboratory, Argonne, IL 60439, USA 2 Department of Computer Science, University of Chicago, Chicago, IL 60637, USA 1 Introduction During the past decade, the scientific community has witnessed an unprecedented accumulation of gene sequence data and data related to the physiology and biochemistry of organisms. More than 178 genomes have been sequenced and 874 organisms are at various levels of completion [24]. In order to exploit the enormous scientific value of this information for understanding biological systems, the information must be integrated, analyzed, graphically displayed and ultimately modeled computationally [1]. The emerging systems biology approach requires the development of high-throughput computational environments that integrate (i) large amounts of genomic and experimental data and (ii) powerful tools and algorithms for knowledge discovery and data mining. Most of these tools and algorithms are CPU-intensive, requiring computational resources beyond those available to researchers at a single location. The aggregated and distributed computational and storage infrastructure of the Grid offers an ideal platform for mining biological information at this large scale. The efficiency and power of comparative analysis for obtaining scientific insights into functionality and evolutionary history of genes and protein families is well established [11]. The Grid will allow researchers to use and mix the resources of remote sites and supercomputer resources for the comparative analysis calculations, as well as for the protein’s functional analysis. Not only will the Grid provide added resources for computations, but also, the Grid can facilitate virtual collaborations that share distributed data and computational resources, as well as provide temporary additional storage capacity for protein-similarity results. The first and most crucial step in genome analysis is the assignment of function to genes. The efficiency and accuracy of such predictions is achieved by the use of a variety of bioinformatics tools and approaches (e.g. analysis of global similarities [3][4][5], domain and motif analysis [6][7][8], analysis of the relevant structural [9][10] and functional information). This process can be extremely tedious, time-consuming, and prone to human error if it were to be done by manually scheduled computations. To address this problem, we have developed GADU – the Genome Analysis and Database Update system – an automated, high-performance, scalable computational pipeline for the data acquisition and analysis of sequenced genomes. GADU allows efficient automation of the major steps of genome analysis: data acquisition and analysis by variety of tools and algorithms, as well as result storage and annotation. GADU can be used as a stand-alone server, or it can be incorporated into established frameworks of other systems and pipelines for analysis of large volumes of sequence data (e.g., WIT [11] in our case).
-
Upload
independent -
Category
Documents
-
view
1 -
download
0
Transcript of A Grid-Enabled Service for High-Throughput Genome Analysis

A Grid-Enabled Service for High-Throughput Genome Analysis
Alex Rodriguez1 Dinanath Sulakhe1 Elizabeth Marland1 Veronika Nefedova1 Natalia Maltsev1 Michael Wilde1 Ian Foster1,2
1 Math and Computer Science Division, Argonne National Laboratory, Argonne, IL 60439, USA
2 Department of Computer Science, University of Chicago, Chicago, IL 60637, USA
1 Introduction During the past decade, the scientific community has witnessed an unprecedented accumulation of gene sequence data and data related to the physiology and biochemistry of organisms. More than 178 genomes have been sequenced and 874 organisms are at various levels of completion [24]. In order to exploit the enormous scientific value of this information for understanding biological systems, the information must be integrated, analyzed, graphically displayed and ultimately modeled computationally [1]. The emerging systems biology approach requires the development of high-throughput computational environments that integrate (i) large amounts of genomic and experimental data and (ii) powerful tools and algorithms for knowledge discovery and data mining. Most of these tools and algorithms are CPU-intensive, requiring computational resources beyond those available to researchers at a single location. The aggregated and distributed computational and storage infrastructure of the Grid offers an ideal platform for mining biological information at this large scale.
The efficiency and power of comparative analysis for obtaining scientific insights into functionality and evolutionary history of genes and protein families is well established [11]. The Grid will allow researchers to use and mix the resources of remote sites and supercomputer resources for the comparative analysis calculations, as well as for the protein’s functional analysis. Not only will the Grid provide added resources for computations, but also, the Grid can facilitate virtual collaborations that share distributed data and computational resources, as well as provide temporary additional storage capacity for protein-similarity results.
The first and most crucial step in genome analysis is the assignment of function to genes. The efficiency and accuracy of such predictions is achieved by the use of a variety of bioinformatics tools and approaches (e.g. analysis of global similarities [3][4][5], domain and motif analysis [6][7][8], analysis of the relevant structural [9][10] and functional information). This process can be extremely tedious, time-consuming, and prone to human error if it were to be done by manually scheduled computations.
To address this problem, we have developed GADU – the Genome Analysis and Database Update system – an automated, high-performance, scalable computational pipeline for the data acquisition and analysis of sequenced genomes. GADU allows efficient automation of the major steps of genome analysis: data acquisition and analysis by variety of tools and algorithms, as well as result storage and annotation. GADU can be used as a stand-alone server, or it can be incorporated into established frameworks of other systems and pipelines for analysis of large volumes of sequence data (e.g., WIT [11] in our case).

GADU’s flexible architecture allows modifications to the user-defined genome analysis process according to individual needs and requirements. It can function in an automated mode as well as interactively through a web-based interface.
In this paper we describe the implementation of GADU, our experiences using it on the Grid, our findings from this experience, and our plans for increasing the application’s computational power and speed through further Grid integration and enhancement.
2 Implementation GADU consists of three conceptual modules (Figure 1). A Data acquisition module periodically searches for new data in a set of public genome databases: NCBI [12], JGI [13], TIGR [14], PDB [15], and Swiss-Prot [17]. It then updates the GADU server with genome data and annotations from these sources
A data analysis module uses a scalable Grid technology-based backend for high-throughput analysis of genomic data by multiple bioinformatics tools and analytical workflows. The use of scalable computational resources is essential for annotation of hypothetical genes in newly sequenced genomes. The analysis module is the most compute-intensive module of the three and requires the use of a Grid backend in order to scale the number of jobs requested by the user for computation of the genome analysis calculations in a time-efficient manner.
A data storage module stores the computed results into relational databases for easy access via user interfaces or by other sequence analysis algorithms.
In order to perform genetic sequence analysis and assign potential functions to unknown genes, every sequence in a genome must be processed by a number of comparative-analysis tools and algorithms.
ct
GADU Data Flow
BLAST
BLOCKS
PFAM
Tool n
Parallel Data Analysis
Analysis Module
NCBI . . . .
DB nJGIPublic Databases:Genome and DB
data User Interface:Select genome
to process
Local Data Storage
Acquisition Module
Local Directory Data Storage
DB
nr PDB . . DB k
Genomes
NCBI JGI . . DB k
Genome Relational Database
Storage Module
Relational DB
AnnotationsTools Output
InputGenome
output
GADU Data Flow
BLAST
BLOCKS
PFAM
Tool n
Parallel Data Analysis
Analysis Module
NCBI . . . .
DB nJGIPublic Databases:Genome and DB
data User Interface:Select genome
to process
Local Data Storage
Acquisition Module
Local Directory Data Storage
DB
nr PDB . . DB k
Genomes
NCBI JGI . . DB k
Local Directory Data Storage
DB
nr PDB . . DB k
DB
nr PDB . . DB k
Genomes
NCBI JGI . . DB k
Genomes
NCBI JGI . . DB k
Genome Relational Database
Storage Module
Relational DB
AnnotationsTools Output
InputGenome
output
Figure 1: GADU workflow, showing thethree modules: acquisition, analysis and
Most of these tools and algorithms are omputationally intensive (e.g. BLAST [3], PFAM 7], BLOCKS [8], TMHMM [17]) and ypically take a sequence as an input and compare the sequence alignment with a dataset
library of varied size. These tools can be combined to run in parallel or in series, and in various orders (Figure 2), forming complex workflows to acquire specific knowledge about the query protein sequences. In addition, one can run “result-parsers” on the outputs to mine specific results from the sequence comparison tools.

The GADU environment comprises four elements:
1. An integrated computational environment containing tools and algorithms for analysis of the biological data.
2. Pre-defined as well as customized scientific pipelines for efficient analysis of biological data using the different tools and algorithms mentioned above.
3. Grid infrastructure for performing CPU intensive tasks (composed by GADU), using distributed technologies like Condor, Globus, Chimera, and the Java CoG kit.
low
4. A Web portal interface to access the GNARE server and its components listed above using Jakarta – Jetspeed.
Jazz/ANL
Grid3
UofWiscJazz/ANL
Grid3
UofWisc
Grid
A
B
D
C A
B
C
D A
D
B
C
C
DA
B
Automatic Workflows Created as per UserRequest or Project
GADU - GServer
A
B
D
C A
B
C
D A
D
B
C
C
DA
B
A
B
D
C
A
B
D
C A
B
C
DA
B
C
D A
D
B
C
A
D
B
C
C
DA
B
C
DA
B
Automatic Workflows Created as per UserRequest or Project
GADU - GServer
Automatic Workflows Created as per UserRequest or Project
GADU - GServer
Hit and Run Registered Groups Collaborators
Interface to theServer
Jets
peed
Hit and Run Registered Groups CollaboratorsPublic Registered Groups CollaboratorsEnd Users
Interface to theServer
Jets
peed
Dat
a F
and
Sto
rage
at v
ario
us le
vels
Chi
mer
a, C
ondo
r, G
lobu
s
Figure 2: GADU-GNARE system environment
Sequence analysis is typically computationally intensive: analysis of a bacterial genome of 4000 sequences by three bioinformatics tools (BLAST, PFAM, and BLOCKS) requires 12,000 steps, each taking on the order of 30 seconds of run time. In some cases, depending on the size of the input sequence, dataset libraries and processor speed, a single step could easily take up to 3 minutes to complete. In a Grid environment, we can distribute these steps among a large number of resources and thus achieve dramatic speedups.
In order to submit the user-defined workflow sequences into a Grid environment, the workflow must be turned into an executable form. To accomplish this, we use a “virtual data language” (VDL) implemented by the Chimera system [18]. VDL permits workflows to be specified as a graph of “transformation” invocations. Transformations are abstract interfaces that describe an application program such as BLAST, BLOCKS, result-parser, etc. Transformations are invoked by “derivations” – the “function calls” that specify inputs such as genome sequence files, output files from comparative analysis tools, and textual parameters. VDL provides simplified, abstract access to large-scale Grid computation and storage resources. It also provides: the ability to accurately track the provenance of results of the workflows results, describing how they were obtained from transformations of input data; the ability to discover data through tools that search for specific transformations; the ability to produce new analysis work based on previously executed work, which allows for the comparison of transformation patterns executed at different times; and the ability to audit and disseminate results.
Figure 3 illustrates the visual display of provenance for a six-stage workflow for a simple comparative analysis of 100 protein sequences. The six stages include the data transfers to and from Grid storage servers, partitioning input data for the subsequent BLAST process, parsing of specific information the user wants to capture from protein sequences, and concatenation of final results.

inputfile.1
compbio::FileBreaker/ID001
jobNo_1_1.Block2
compbio::BLAST/ID006out.jobNo_1_1.Block2
compbio::BlastParser/ID007
parse.out.jobNo_1_1.Block2
compbio::cat/ID012
outfile.jobNo_1_1.BLASTPIR
inputfile.1
compbio::FileBreaker/ID001
jobNo_1_1.Block2
compbio::BLAST/ID006out.jobNo_1_1.Block2
compbio::BlastParser/ID007
parse.out.jobNo_1_1.Block2
compbio::cat/ID012
outfile.jobNo_1_1.BLASTPIR
Figure 3: Left, a Six-step BLAST workflow with 5-way parallelism. At right, the center-path details.
The VDL fragments shown below specify transformations FileBreaker and BLAST, and also a derivation of FileBreaker, which specifies the actual inputs to that transformation. In this case the inputs to each of the transformations would be the genome sequence file and the subsequent output files of each of the transformations.
TR FileBreaker(input filename, none nodes, output sequences[], none species) { argument = ${species}; argument = ${filename}; argument = ${nodes}; profile globus.maxwalltime = "300"; } TR BLAST( none OutPre, none evalue, input query[], none type ) { argument = ${OutPre}; argument = ${evalue}; profile globus.maxwalltime = "300"; }... DV jobNo_1_1separator->FileBreaker( filename=@{input:"inputfile.1"|rt}, nodes="5", sequences=[@{output:"job1.0":"tmp"}, @{output:"job1.1":"tmp"}, @{output:"job1.2":"tmp"}, @{output:"job1.3":"tmp"}, @{output:"job1.4":"tmp"} ], species="Aeropyrum_Pernix" );...
The VDL transformation definitions (“TR”, above) act as function definitions and specify the formal arguments to an application, and the details of how those arguments are passed to and from the application represented by the TR definition. Calls to a transformation are called “derivations,” and are defined by “DV” statements, which specify the actual arguments to be passed to a transformation. File names used as
arguments in DV statements are “logical names”, mapped to physical file names at run time.
Data transfer for VDL is performed automatically and transparently for the user. For example, the physical file for the logical filename “inputfile.1” will be transferred automatically to the site selected for execution of the FileBreaker transformation via GridFTP [2], which provides secure, efficient data movement in Grid environments. Input files to transformations are automatically located in the Grid by searching for physical copies of a logical file in a replica location service such as RLS [29]. Output files are automatically cataloged in the same location service for use in subsequent transformations and workflows. In the transformation “BLAST”, above, we use the “profile” feature of VDL to specify the run-time limit for that process. VDL profiles permit parameters to be passed to components of the run-time environment.
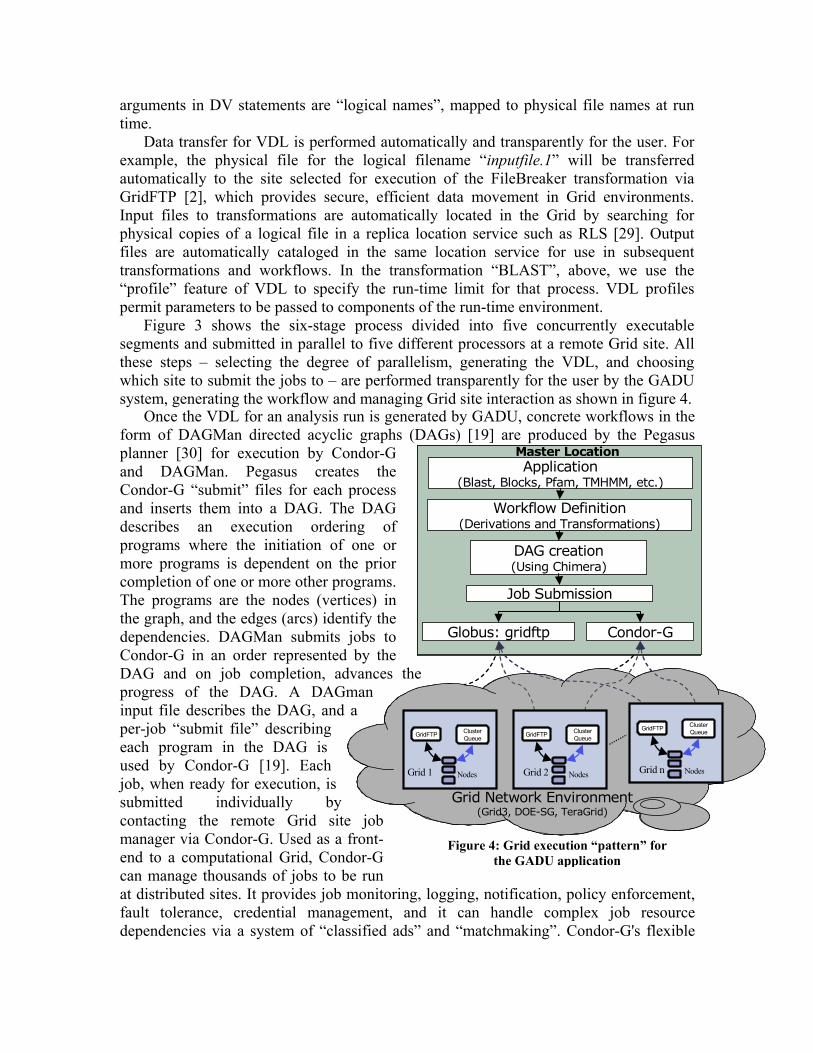
Figure 3 shows the six-stage process divided into five concurrently executable segments and submitted in parallel to five different processors at a remote Grid site. All these steps – selecting the degree of parallelism, generating the VDL, and choosing which site to submit the jobs to – are performed transparently for the user by the GADU system, generating the workflow and managing Grid site interaction as shown in figure 4.
Application(Blast, Blocks, Pfam, TMHMM, etc.)
Workflow Definition(Derivations and Transformations)
DAG creation(Using Chimera)
Job Submission
Master Location
Condor-GGlobus: gridftp
Grid Network Environment(Grid3, DOE-SG, TeraGrid)
ClusterQueueGridFTP Cluster
QueueGridFTPClusterQueueGridFTP
Grid 1 Nodes Grid 2 Nodes Grid n Nodes
ondor-G s the
process DAG
ing of one or he prior
grams. tices) in ntify the jobs to by the vances the
an a
e job front-
Once the VDL for an analysis run is generated by GADU, concrete workflows in the form of DAGMan directed acycliplanner [30] for execution by Cand DAGMan. Pegasus createCondor-G “submit” files for eachand inserts them into a DAG. Thedescribes an execution ordeprograms where the initiation omore programs is dependent on completion of one or more other proThe programs are the nodes (vethe graph, and the edges (arcs) idedependencies. DAGMan submitsCondor-G in an order representeDAG and on job completion, adprogress of the DAG. A DAGminput file describes the DAG, anper-job “submit file” describing each program in the DAG is used by Condor-G [19]. Each job, when ready for execution, issubmitted individually by contacting the remote Grid simanager via Condor-G. Used as aend to a computational Grid, Condor-G can manage thousands of jobs to be run at distributed sites. It provides job monitoring, lofault tolerance, credential management, and idependencies via a system of “classified ads” an
c graphs (DAGs) [19] are produced by the Pegasus
rft
r
d
d
t
Figure 4: Grid execution “pattern” forthe GADU application
gging, notification, policy enforcement, t can handle complex job resource d “matchmaking”. Condor-G's flexible

and intuitive commands are appropriate for use directly by end-users, as well as for interfacing with higher-level task brokers and web portals.
The current Grid execution environment for GADU consists of Grid2003 resources [20], including Argonne’s LCRC cluster [21], a DOE Science Grid facility [29]. These resources make available over 2700 CPUs. Currently, we are in the process of inco
peline has been used extensively by the computational biology nal Laboratory as well as other bioinformatics organizations such Resources (PIR) [23] and the Fellowship for the Interpretation of
PIR and air-wise com
how the use of more resources provides us with increasing returns, by showing the
l as other bioinformatics organizations such Resources (PIR) [23] and the Fellowship for the Interpretation of
PIR and air-wise com
how the use of more resources provides us with increasing returns, by showing the
rporating more Grid2003 sites into the GADU execution environment, as well as adding other resources from the TeraGrid [22] and DOE Science-Grid. Via GridFTP and Condor-G, sequence data can be transferred and comparatively analyzed by running several executables such as BLAST, PFAM, BLOCKS, etc. on each of the sequences, and by running numerous sets of sequences concurrently on a large number of processors in the Grid environment.
3 Performance The automated GADU pigroup at Argonne Natioas Protein Information as Protein Information Genomes (FIG). We have developed and continue to develop automated analytical pipelines for these organizations so that they can manage and submit their computer-intensive jobs to the Grid. Currently, we can support the static versions of their pipelines. In the future we plan to allow users to define their workflows interactively, via a web interface.
Genomes (FIG). We have developed and continue to develop automated analytical pipelines for these organizations so that they can manage and submit their computer-intensive jobs to the Grid. Currently, we can support the static versions of their pipelines. In the future we plan to allow users to define their workflows interactively, via a web interface.
Run A: Run B:
F ns of t e same bacteria genome on 35 and 25 processo .
Th le execution traces in Figure 5 illus erf r PIR, processing 100 sequences. More complex runs are currently performed repea dly for the
F ns of t e same bacteria genome on 35 and 25 processo .
Th le execution traces in Figure 5 illus erf r PIR, processing 100 sequences. More complex runs are currently performed repea dly for the
-
time (seconds)
stage - in Blast process Stage out stage-in Blast process stag
time (seconds)
1673 sec.
25 CPU
2500 sec.
35 CPU
e - out
ie sa
ie sa
gugurm
rm
e 5: Blast re 5: Blast ruu hh rorm
rorm
ss d
d pp tratetratess aa small run small run pp ee fofo
tete FIG organizations. The analysis of the data for FIG consists of p FIG organizations. The analysis of the data for FIG consists of p
parisons of a database of 1.8 million protein sequences against itself. To analyze this data we utilized about 250 nodes from the DOE Science Grid LCRC site. The complete file was processed in an 84 hour run. A single blast process for one sequence on a local 500 MHz desktop against a large database of about 0.5 GB may take up to 3 minutes. If the 1.8 million sequences were to be done in one such CPU, this process could take over 90,000 hours. This is equivalent to 3750 days or 10.3 years. Figure 5 shows graphically
parisons of a database of 1.8 million protein sequences against itself. To analyze this data we utilized about 250 nodes from the DOE Science Grid LCRC site. The complete file was processed in an 84 hour run. A single blast process for one sequence on a local 500 MHz desktop against a large database of about 0.5 GB may take up to 3 minutes. If the 1.8 million sequences were to be done in one such CPU, this process could take over 90,000 hours. This is equivalent to 3750 days or 10.3 years. Figure 5 shows graphically

processors used for each job against a time scale. The figure is a graph provided by kickstart, the Chimera transformation invocation and execution monitor [25], which automatically logs the run-time statistics of all work performed on the remote Grids. (For convenience, only a portion of the complete graphs are illustrated.) The figure shows two runs on the same microorganism (Mycoplasma Genitalium). Run A, which was done on 35 CPUs, took proportionally less time than run B, which was performed on 25 CPUs. The traces show three major phases of execution: the stage-in process at the very beginning, the blast executables performed in parallel on the assigned processors and the stage-out process, which corresponds to the end of the job.
There is also some overhead in the time to process these workflows, due to data transfer and reformatting of data and presentation of the final output. These are acceptable in virtually all cases, as the increasing returns from the availability of greater amounts of computing resources outweighs the overhead time added to the calculation due to file transfers and file setup. However, one obstacle to utilizing more processing nodes is the competition with users from other projects for the resources. In our case, each transformation call through a derivation constitutes a job requesting one processor. As soon as one job is finished, it gives up the processing node to the next job in the local scheduler’s queue, even if it is not a process in our DAG. Thus, we are in constant competition for processors to fulfill our needs. This competition in turn increases idle time within the workflow: the amount of time in which our comparative analysis jobs sit idle because there are no resources available. In a similar example to the one described above, we took 1600 sequences instead of 100 and submitted it to 50 processing nodes in a GRID3 site. The table below shows the performance results of a 1600 sequence run. Note that about one fourth of the time was spent idle. Reducing this idle time while retaining the desired fine-grain job size is discussed further in the next section.
Sequences in the genome 1618 Number of CPUs requested 50 Idle CPU time 267 minutes (5.5 minutes per node) Active CPU time 646 minutes Actual time for completion 31 minutes
A analysis w that we have run on the Grid through GADU to date is as follows. The first GADU BLAST runs were done in March 2003, processing a peak of 59 Genomes in 24 hou ays of processing time were delivered, generating 50 GB of data, using a 10,000 Grid jobs performing ove
ly updates of about 80,000 sequences per month.
summary of the genomics ork
rs. 67 CPU-dpproximately
r 200,000 BLAST executions. (Note that we batched multiple executions into one job to reduce scheduling overhead). This run demonstrated a greater than five-fold improvement in turnaround time: less than one hour per genome, compared to a previous average of about five hours/genome.
GADU production runs began in August 2003, and in the first quarter of production processed 3.2 million sequences with BLAST. The first big run (for FIG) consisted of 1.8 million sequences (approximately 900MB) processed by BLAST and the result-parser, followed by subsequent month
The first production run for PIR was in November 2003, using the same process as for FIG, but on 1.2 million sequences. This was repeated in January 2004. In February 2004 we started running workflows of the BLOCKS application and the result-parser on

the Grid. The initial run processed 100,000 sequences. From January-March 2004 we processed 1.3 million sequences with BLAST and 100,000 with BLOCKS.
4 Experiences, Problems and Solutions We describe in this section various experiences encountered in mapping GADU work
by these experiences. T emote Grid sites we created a “tar” file
of oackage our tar
arc
ore advanced “just in time” planners that automatically sele
d on Grid gatekeepers, job managers, and local schedulers, esp
nents that we are using, and inte
nformation service (MD
to the Grid, and the future improvements suggestedo install the genomics application codes on r
ur executables, which was extracted and installed at each remote site through globus-job-run commands. To further automate this process, we intend to p
hive as a Pacman [26] package, and to integrate it with the site-environment description standards of Grid3, disseminated to Grid clients through the MDS directory service [27]. The final stage of this automation will involve the automatic installation of the application packages on sites through virtual data dependencies and the job planners that select sites for execution.
Currently, large runs are manually load-balanced across a set of candidate execution sites. This approach is labor-intensive, as it requires manual progress monitoring of large runs and manual recovery. M
ct sites based on available resources and that skip past inaccessible Grid sites are now being tested, and will make this process more automatic while providing significant throughput improvements.
Currently, it is desirable to break large runs into program executions of fairly fine grain, each running on the order of 15 to 30 minutes. At this job size, our large runs currently put significant loa
ecially when we try to make significant utilization of larger Grid sites, on the order of 200 or more CPUs. Additionally, some sites that we would like to use at have scheduling policies that are heavily biased towards running small numbers of large parallel multi-CPU jobs. For both of these reasons, once a site is selected for processing, we would like to optimize the mechanisms used to send a steady stream of small jobs to a site for processing. To meet all these requirements, we plan to explore the use of Condor “glide-ins” [19] to “tunnel” into a site, allocate a quantity of CPUs, and rapidly schedule a large number of small jobs on those resources without the repeated overhead of Grid authentication, job monitoring, and input/output transfer.
While our workflows are long-running, we have not yet integrated into our workflow executor the ability to renew an expired proxy transparently to the overall workflow. The facilities to support this now exist in the Grid compo
grating this capability into our workflow execution would add robustness and remove yet another need for manual involvement in long-running workflows.
In the near future, we expect to be running single workflows across at least three Grid “domains”: Grid2003, DOE Science Grid, and TeraGrid. This environment will require harmonization across these grids of the data returned by the Grid i
S), and of file system access and layout conventions (in terms of shared filesystem access vs. private per-node access, and in terms of how applications locate their private data, Grid data, temporary storage, application code, and other directories needed for grid job operations). These conventions have been codified differently in each of Grid2003, the European Data Grid, the LHC Computing Grid, and Teragrid, and either harmonization of these conventions across these different Grids will be required, or,

more likely in the near-term, the workflow executor will need to perform the necessary multi-grid adaptations.
One problem that we have dealt with successfully in GADU processing, albeit in an ad-hoc manner, is the balancing of physical data files across directories within large wor
ill req
kstart” job invocation/execution monitor pro
a cale distributed Grid infrastructure, it is also tive environment where scientists and researchers
er groups and ANL for analysis of the biological data.
.
kflows, of which many segments may run on the same site and hence hit the same shared data file directory. This concurrent access to large numbers of files was a severe problem in our early work on the LCRC cluster, whose shared file system was heavily optimized for high data rates to large files, but which suffered severe, system-crippling performance degradation with high creation rates of large numbers of relatively small files within a single directory. Every file system has a “breaking point” with respect to the processing of large directories, and we need to integrate into our workflow executors a scalable convention for dynamic load balancing of physical files across directories.
Somewhat related to this problem, in order to permit many users to concurrently schedule jobs through GADU from a single submission site, we anticipate that we w
uire a Grid service layer that imparts a multi-user directory structure within the logical-file namespace of the replica location service. (We currently use a single RLS for all of the files from a single GADU job submission host.) The opportunity exists to obtain further workflow speedup from the ability to batch multiple small file transfers in a single invocation of our GridFTP data transfer client, globus-url-copy. Experimental versions of this capability have been created, and need to be integrated into our concrete workflow planner for performance evaluation.
Finally, we have only limited experience within the GADU system for the capture of virtual data “invocation” records from the “kic
vided with Chimera [25]. We have had at least one situation in which an enhanced version of kickstart would have proven extremely valuable. In one run, on a particular Grid site, a large number of BLAST outputs were mysteriously corrupted. The suspected cause of this corruption was an incompatible shared library on some or all of the hosts at this site. Reliable kickstart records, enhanced to provide the signature of all shared libraries within the executable’s library path, would have been an indispensable debugging tool, and should become standard part of all captured provenance.
5 Next Steps and Future Plans In ddition to harnessing the large-snecessary to provide a secure collaboracan discuss, share, and analyze data. In order to provide such an environment for research in genome analysis, we are developing GNARE (Genome Analysis Research Environment). GNARE (Figure 2) is a public genome analysis server that includes following components:
1. An Integrated Computational Environment containing tools and algorithms developed by oth
2. Pre-defined as well as customized scientific pipelines for efficient analysis of biological data using the different tools and algorithms mentioned above
3. Grid infrastructure for performing CPU intensive tasks (via GADU), using distributed technologies (Condor, Globus, Chimera, Java CoG kit).
4. A Web portal as an interface to access the GNARE server and its components listed above using Jakarta and Jetspeed.

5. Managing workflows that run transparently across multiple heterogeneous execution environments, in particular across mixed IA32-IA64 platforms.
6 tomated GADU system can decrease substantially the time and the ction required for genome analysis. Its modular architecture permits
diff
to the following individuals who contributed valuable advice r, Michael Milligan, Von Welch, Miron Livny, Zachary Miller,
1. Ideker, T., Galitski, T., Hood, L. (2001) A new approach to decoding life: systems biology. enomics Hum. Genet., 2, 343-372.
d p. 749-771..
protein database search
4.
y searches: a comparison of Smith-Waterman in
6. Database, 2003 brings increased
7. m protein families database.
Nucleic Acids Res., 30, 276-280.
6. Utilization of VDL to capture the provenance of the all data captured and stored by GADU, including the final relational database of sequence data.
Conclusion The use of the au
amount of user interaerent genome analysis steps to be performed efficiently. This feature is especially
useful for simultaneous analysis of multiple genomes. Availability of new experimental results concerning functions of proteins, previously annotated as hypothetical, as well as improvements in the sensitivity and accuracy of bioinformatics tools, requires periodic revisiting of previously annotated genomes and reassignment of functions using this newly acquired knowledge. The increased efficiency of genome analysis offered by the GADU system and the Grid considerably simplifies the analysis of newly sequenced genomes as well as previously annotated genomes. GNARE can be an interface to leverage Grid resources for all biologists interested in performing such complex computations. It can hide the complex technologies involved in using distributed Grid resources and help users perform faster and better analyses.
Acknowledgements We extend special thanksand support: Jens VoeckleJames Frey, Terry Disz, Robert Olson, Ross Overbeek, Susan Coghlan, and the systems support groups of MCS, GRID2003, Globus, Condor, and iVDGL VDT. This work was supported in part by the U.S. Department of Energy under Contract W-31-109-ENG-38, and by the National Science Foundation under grants 86044 (GriPhyN), 122557 (iVDGL), and the NCSA Alliance Expedition “A PACI Petascale Data Quest” (PDQ).
References
Annu. Rev. G2. Allcock, W., et al., Data Management and Transfer in High-Performance Computational Gri
Environments. Parallel Computing, 2002. 28(5): 3. Altschul, S.F., Madden, T.L., Schaffer, A.A., Zhang, J., Zhang, Z., Miller, W., Lipman, D.J.
(1997) Gapped BLAST and PSI-BLAST: a new generation of programs. Nucleic Acids Res., 25, 3389-3402. Pearson, W.R. (1994) Using the FASTA program to search protein and DNA sequencedatabases. Methods Mol Biol., 24, 307-331.
5. Shpaer, E.G., Robinson, M., Yee, D., Candlin, J.D., Mines, R., Hunkapiller, T. (1996) Sensitivity and selectivity in protein similarithardware to BLAST and FASTA. Genomics, 38, 179-191. Mulder, N.J., Apweiler, R., Attwood, T.K., Bairoch, A., Barrell, D., Bateman, A., Binns, D., Biswas, M., Bradley, P., Bork, P., et al. (2003) The InterProcoverage and new features. Nucleic Acids Res., 31, 315-318. Bateman, A., Birney, E., Cerruti, L., Durbin, R., Etwiller, L., Eddy, S.R., Griffiths Jones, S., Howe, K.L., Marshall, M., Sonnhammer, E.L. (2002) The Pfa

8. Henikoff, S., Henikoff, J.G., Pietrokovski, S. (1999) Blocks+: a non-redundant database of protein alignment blocks derived from multiple compilations. Bioinformatics, 15, 471-479. Pearl, F.M., Bennett, C.F., Bray, J9. .E., Harrison, A.P., Martin, N., Shepherd, A., Sillitoe, I.,
e
11. ides, N., Fonstein,
Thornton, J., Orengo, C.A. (2003) The CATH database: an extended protein family resourcefor structural and functional genomics. Nucleic Acids Res., 31, 452-455.
10. Lo Conte, L., Brenner, S.E., Hubbard, T.J., Chothia, C., Murzin, A.G. (2002) SCOP databasin 2002: refinements accommodate structural genomics. Nucleic Acids Res., 30, 264-267. Overbeek, R., Larsen, N., Pusch, G.D., D'Souza, M., Selkov, E. Jr., KyrpM., Maltsev, N., Selkov, E. (2000) WIT: integrated system for high-throughput genome sequence analysis and metabolic reconstruction. Nucleic Acids Res., 28, 123-125.
12. NCBI, National Center for Biotechnology Information, http://www.ncbi.nlm.nih.gov JGI, Department of Energy Joint Genome Institute, http://www.jgi.doe.gov13. TIGR, The Institute for Genomic Research, http://www.tigr.org14.
15. PDB, The Protein Data Bank, http://www.rcsb.org/pdb/ 16. Swiss-Prot, The Swiss-Prot Protein Knowledgebase, http://us.expasy.org/sprot/
17. Krogh, Anders, Prediction of transmembrane helices in proteins,http://www.cbs.dtu.dk/services/TMHMM/
18. Foster, J. Voeckler, M. Wilde, and Y. Zhou. Chimera: A virtual data system for representing, 4th Conference on
ent, Edinburgh, Scotland, July 2002. querying, and automating data derivation. In Proceedings of the 1Scientific and Statistical Database Managem
19. Condor Manual Version 6.4, Miron Livny, University of Wisconsin-Madison http://www.cs.wisc.edu/condor/manual/v6.4/Contents.html The Grid2003 Project, The Grid2003 Production Grid: Principles and Practice. 20020. 4,
21. t, Technical Report, iVDGL, www.ivdgl.org. LCRC, The Argonne National Laboratory Computing Projechttp://www.lcrc.anl.gov/jazz/index.php Catlett, C., The TeraGrid: A Primer. www.te22. ragrid.org. 2002..
Chen, Z. Hu, R. Ledley, P. ng, W. Barker. The Protein Information Resource.
23. C. H. Wu, L. Yeh, H. Huang, L. Arminski, J. Castro-Alvear, Y.Kourtesis, B. Suzek, C. Vinayaka, J. ZhaNucleic Acids Research, 31: 345-347, 2003.
24. GOLD: http://wit.integratedgenomics.com/GOLD/ Chimera Users Guide, http://www.griphyn.org/chimera/release.html25. Pacman Package Manager, http://physics.bu.e26. du/~youssef/pacman/
, K. Grid Information Services for High Performance
29. iencegrid.org
27. Czajkowski, K., Fitzgerald, S., Foster, I., KesselmanDistributed Resource Sharing. 10th IEEE International Symposium onDistributed Computing. 2001.
28. Chervenak, A., et al. Giggle: A Framework for Constructing Scalable Replica Location Services. SC'02: High Performance Networking and Computing. 2002. DOE Science Grid, www.doesc
Y. rbree, R. Cavanaugh,
, no. 1, 2003, pp. 25-39.
30. Mapping Abstract Complex Workflows onto Grid Environments, E. Deelman, J. Blythe, Gil, C. Kesselman, G. Mehta, K. Vahi, K. Blackburn, A. Lazzarini, A. AS. Koranda, Journal of Grid Computing, Vol.1