goettingen minipig genome - eDiss
153
SEQUENCE-BASED ANALYSES OF THE GOETTINGEN MINIPIG GENOME Dissertation zur Erlangung des Doktorgrades der Fakultät für Agrarwissenschaften der Georg-August-Universität Göttingen vorgelegt von Christian Reimer geboren in Goslar Göttingen, im März 2018
-
Upload
khangminh22 -
Category
Documents
-
view
1 -
download
0
Transcript of goettingen minipig genome - eDiss
SEQUENCE-BASED ANALYSES
OF THE
GOETTINGEN MINIPIG GENOME
Dissertation
zur Erlangung des Doktorgrades
der Fakultät für Agrarwissenschaften
der Georg-August-Universität Göttingen
vorgelegt von
Christian Reimer
geboren in Goslar
Göttingen, im März 2018

D7
1. Referent: Prof. Dr. Henner Simianer
2. Referent: Prof. Dr. Jens Tetens
Tag der mündlichen Prüfung: 9.5.2018
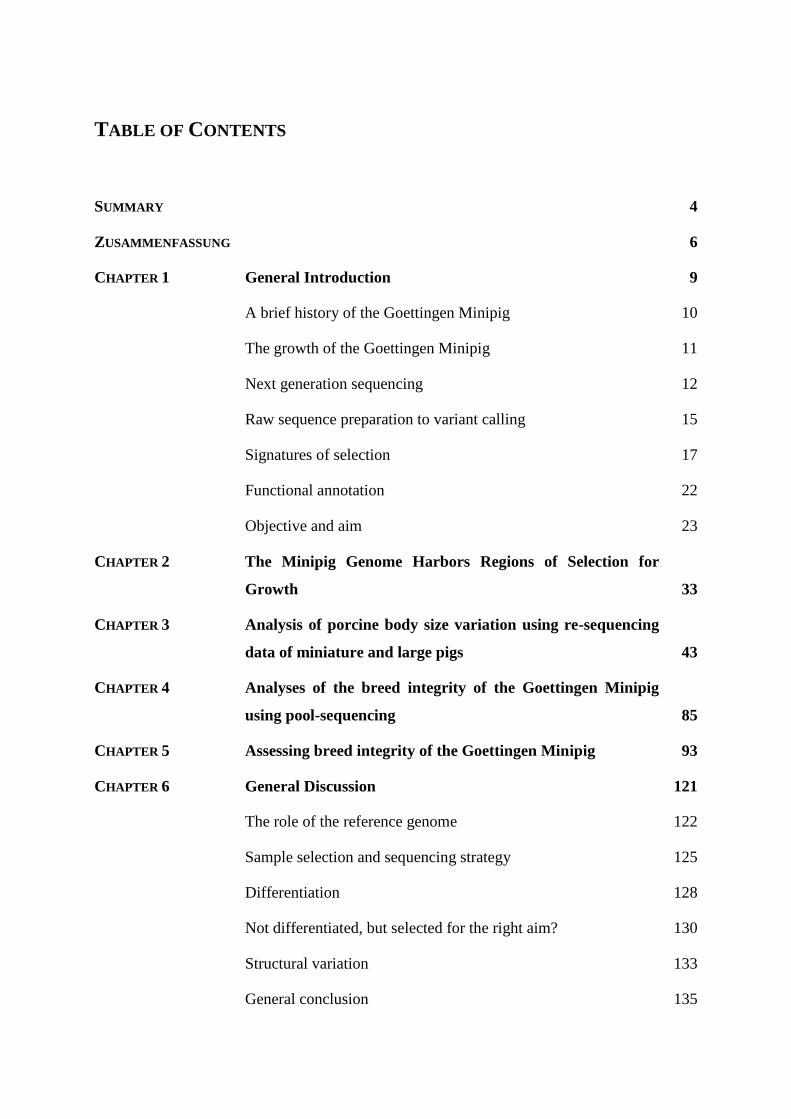
TABLE OF CONTENTS
SUMMARY 4
ZUSAMMENFASSUNG 6
CHAPTER 1 General Introduction
A brief history of the Goettingen Minipig
The growth of the Goettingen Minipig
Next generation sequencing
Raw sequence preparation to variant calling
Signatures of selection
Functional annotation
Objective and aim
9
10
11
12
15
17
22
23
CHAPTER 2 The Minipig Genome Harbors Regions of Selection for
Growth
33
CHAPTER 3 Analysis of porcine body size variation using re-sequencing
data of miniature and large pigs
43
CHAPTER 4 Analyses of the breed integrity of the Goettingen Minipig
using pool-sequencing
85
CHAPTER 5 Assessing breed integrity of the Goettingen Minipig 93
CHAPTER 6 General Discussion
The role of the reference genome
Sample selection and sequencing strategy
Differentiation
Not differentiated, but selected for the right aim?
Structural variation
General conclusion
121
122
125
128
130
133
135
4 Summary
SUMMARY
Among the known pig breeds, the Göttingen Miniature Pig (GMP) stands out due to its
special characteristics and history. Its current appearance dates back to the 1960´s when
animal scientists from Goettingen took the effort to breed a particularly small, white-coated
pig for laboratory use. For this purpose, a total of three breeds with different characteristics,
the Minnesota Minipig, the Vietnamese Potbellied Pig and the German Landrace were
crossed until the new breed met the expectations. With a weight of 35 to 45 kg, adult minipigs
are considerably smaller than normal sized fattening breeds and pigmentation has almost
disappeared. Although the breeding of the GMP has been scientifically accompanied from the
beginning, the exact background of the dwarfism is so far unknown.
In recent years, more and more molecular genetic techniques have entered into animal
breeding, and so today's Next Generation Sequencing (NGS) allows the entire genome of an
individual to be deciphered at an acceptable cost. This technique will now be used in this
study to further investigate the genetic background of size of the GMP. In addition, the
breeding of a laboratory animal in very few isolated stocks implies that the danger of
population stratification, sub-division of the parent population into sub-populations with
different characteristics, is omnipresent but not desired. In this regard, on the basis of NGS
data we try to identify possible differentiation between the individual breeding stocks and to
assess whether breeding countermeasures are necessary.
In chapters 2 and 3, we use whole genome sequence data from various large-breed pig breeds
to compare them to full-genome sequence data from ten miniature female Goettingen
Minipigs and ten MiniLEWE, another miniature pig breed, as well as a DNA pool made up
from ten other MiniLEWEs. Assuming that selection for a small size favoured similar genes
in the two miniature swine breeds, we searched for regions in the genome where the genetic
variability was reduced due to directional selection but at the same time the regions were
highly differentiated from the respective regions in large breeds. Depending on the thresholds
used for the three statistics "expected heterozygosity" and FST, as well as the "composite
likelihood ratio test" (CLR), which is based on the distribution of allele frequencies, different
genome parts were detected: while 15.7% of the autosomal genome were identified in the first
approach in chapter 2 as signatures of selection, these were only 2% in the second section in
chapter 3, using much sharper limits. Already the first approach showed that the expected
heterozygosity and the CLR test complemented each other by identifying different regions in
Summary 5
which various candidate genes for growth, such as TGFβ and DDR2, could be localized. In
the second part in chapter 3, however, the more specific approach significantly reduced the
number of regions to be examined. Thus, two possible mechanisms could be identified as a
basis for short stature: changes in the MAP kinase pathway and a possible insulin resistance.
Furthermore, by analyzing genotype data from a cross-breeding experiment between GMP
and large pigs, the inheritance of an exceptionally large swept haplotype on chromosome X
could be clarified and shown to account for about 3% of body length in the F2 cross-breds.
In chapters 4 and 5, the population structure of today's GMP, which today is bred in one
stock each in Relliehausen in Germany, North Rose in the USA, Nisshin in Japan and two
stocks in Dalmose in Denmark, is examined in more detail. From each of the five independent
breeding stocks a representative sample of 20 animals was taken. The DNA of every ten of
these animals was pooled in a "DNA pool" so that a total of ten pools, two per stock, could be
re-sequenced. In addition, data from all breeds already used in the first study were added. By
estimating the differentiation between stocks, based on the FST values for each locus, it was
shown in chapter 4 that GMP is clearly differentiated from other breeds. Nevertheless, there
are signs of a beginning separation into three groups: Relliehausen, North Rose and a group
consisting of the two Danish stocks and Japan. On the basis of the functional annotation of the
SNPs it could be shown that this differentiation takes place mainly in genome regions, which
probably are not related to the target phenotypes of the GMP. In the extension of these studies
in chapter 5, a KEGG pathway analysis attempts to better understand complex biological
relationships between genes. This analysis has shown that the individual stocks are not
differentiated in most the 316 pathways. However, significant differentiation in the pathway
"glutamatergic synapse", which could be related to behavioral traits, could be found between
a Danish population and the unit in North Rose. When looking at the overall remaining
genetic variability, it became clear that the conservation breeding program in Relliehausen has
led to this stock today having the greatest genetic diversity and thus to be regarded as the gene
reserve of the GMP breed.
Overall, it was shown that the entire genome of the Goettingen miniature pig can be examined
in much greater detail using NGS technology than was the case with SNP marker arrays. The
possibility of direct analysis of potentially functional variation, including structural variation,
appears to be a great benefit. Nevertheless, their use will be limited to relatively small sample
sizes for the foreseeable future, due to the high costs compared to SNP arrays.

6 Zusammenfassung
ZUSAMMENFASSUNG
Unter den bekannten Schweinerassen sticht das Göttinger Miniaturschwein (GMP) aufgrund
seiner besonderen Eigenschaften und Historie heraus. Es geht in seiner heutigen Form auf die
Bestrebungen Göttinger Tierzüchter in den 1960er Jahren zurück, ein besonders kleines, rein
weißes Schwein für den Laboreinsatz zu züchten. Dazu wurden insgesamt drei Rassen mit
unterschiedlichsten Eigenschaften, das Minnesota Minischwein, das Vietnamesische
Hängebauchschwein und die Deutsche Landrasse gezielt miteinander verpaart, bis die neue
Rasse den Erwartungen entsprach. Mit einem Gewicht von 35 bis 45 kg sind adulte
Minischweine erheblich kleiner als normale, zur Nahrungsgewinnung eingesetzte Rassen und
Pigmentierung kommt nahezu nicht mehr vor. Obwohl die Zucht des GMP seit Anbeginn
wissenschaftlich begleitet wird, liegen die genauen Hintergründe der Verzwergung bislang im
Unklaren.
In den letzten Jahren haben immer mehr molekulargenetische Techniken in die Tierzucht
Einzug gehalten und so ist es heute durch so genanntes „Next-Generation-Sequencing“ (NGS)
möglich, das gesamte Genom eines Individuums zu annehmbaren Kosten zu entschlüsseln.
Diese Technik wird nun in dieser Studie dazu genutzt, um das Größenwachstum beim GMP
genauer zu untersuchen. Darüber hinaus bringt die Zucht eines Labortieres in sehr wenigen
isolierten Beständen es mit sich, dass die Gefahr einer Populationsstratifikation, des
Auseinanderdriftens der Ausgangsrasse in Unterrassen mit unterschiedlichen Eigenschaften,
allgegenwärtig, jedoch nicht gewünscht ist. Diesbezüglich versuchen wir auf der Basis von
NGS-Daten, eventuelle Differenzierung zwischen den einzelnen Zuchtbeständen zu finden
und einzuschätzen, ob züchterische Gegenmaßnahmen nötig sind.
In Kapitel 2 und 3 verwenden wir Vollgenomsequenzdaten von verschiedenen
Großschweinerassen, um sie mit Vollgenomsequenzdaten von zehn weiblichen Göttinger
Miniaturschweinen und zehn MiniLEWE, einer weiteren Miniaturschweinerasse, sowie eines
DNA-pools aus zehn MiniLEWE zu vergleichen. In der Annahme, dass Selektion auf eine
geringe Größe in den beiden Minischweinerassen ähnliche Gene favorisiert hat, suchten wir
dabei nach Regionen im Genom, in denen die genetische Variabilität infolge gerichteter
Selektion deutlich vermindert ist, welche sich aber gleichzeitig stark von denen der
Großschweine unterscheiden. Abhängig von den verwendeten Schwellenwerten für die drei
verwendeten Statistiken „erwartete Heterozygotie“ und FST, sowie dem auf der Verteilung der
Allelfrequenzen basierenden „Composite likelihood ratio test“ (CLR) wurden
unterschiedliche Genomanteile detektiert: Während der erste Ansatz in Kapitel 2 in 15.7 %

Zusammenfassung 7
des autosomalen Genoms Spuren von Selektion identifizierte, waren dies im zweiten
Abschnitt in Kapitel 3, durch die Nutzung deutlich schärferer Grenzwerte, nur 2 %. Bereits
der erste Ansatz zeigte, dass die erwartete Heterozygotie und der CLR Test sich ergänzten,
indem sie unterschiedliche Regionen identifizierten, in denen unter anderem diverse
Kandidatengene für Wachstum, zum Beispiel TGFβ und DDR2, lokalisiert werden konnten.
In zweiten Ansatz in Kapitel 3 konnte durch das spezifischere Vorgehen dagegen die Anzahl
der zu untersuchenden Regionen deutlich vermindert werden. So konnten zwei mögliche
Mechanismen, zum einen Veränderungen im MAP-Kinase-Weg und eine mögliche
Insulinresistenz als Grundlage des Minderwuchses identifiziert werden. Des Weiteren konnte
durch die Analyse von Genotyp-Daten aus einem Kreuzungsexperiment zwischen GMP und
Großschweinen, die Vererbung eines außergewöhnlich großen Haplotyps auf Chromosom X
geklärt und gezeigt werden, dass dieser etwa 3 % der Körperlänge der Minischweine erklärt.
In den Kapiteln 4 und 5 wird die Populationsstruktur des heutigen GMP näher untersucht,
welches in jeweils einem Bestand in Relliehausen in Deutschland, North Rose in den USA,
Nisshin in Japan und zwei Beständen in Dalmose in Dänemark, gezüchtet wird. Dazu wurde
aus jedem der fünf unabhängigen Zuchtbestände eine möglichst repräsentative Stichprobe von
schlussendlich jeweils 20 Tieren genommen. Die DNA von jeweils zehn dieser Tiere wurde
in einem „DNA-Pool“ zusammengefasst, sodass insgesamt zehn Pools, zwei je Bestand,
sequenziert werden konnten. Zusätzlich wurden alle bereits in der ersten Studie verwendeten
Rassen hinzugenommen. Durch Abschätzung der Differenzierung zwischen den Beständen,
anhand der FST Werte für jeden einzelnen Locus, konnte in Kapitel 4 gezeigt werden, dass
das GMP eindeutig von anderen Rassen abzugrenzen ist. Trotzdem finden sich Anzeichen für
eine beginnende Auftrennung in drei Gruppen: Relliehausen, North Rose und eine Gruppe
bestehend aus den beiden Dänischen Beständen und Japan. Trotzdem konnte auf Basis der
funktionellen Annotation der SNPs gezeigt werden, dass diese Ausdifferenzierung vor allem
in Genomregionen stattfindet, welche vermutlich nicht in Verbindung mit den Zielmerkmalen
stehen. In der Erweiterung dieser Untersuchungen in Kapitel 5 wird in Form einer KEGG-
Pathwayanalyse versucht, komplexe biologische Zusammenhänge zwischen Genen besser zu
erfassen. Diese Analyse hat gezeigt, dass die einzelnen Bestände in den 316 untersuchten
Pathways nahezu nie voneinander differenziert sind. Jedoch konnte zwischen einem
Dänischen Bestand und der Einheit in North Rose signifikante Differenzierung im Pathway
„Glutamatergic synapse“ gefunden werden, welcher mit Verhaltensmerkmalen in Verbindung
stehen könnte. Bei der Betrachtung der insgesamt verbleibenden genetischen Variabilität

8 Zusammenfassung
wurde deutlich, dass das Erhaltungszuchtprogramm in Relliehausen dazu geführt hat, dass
dieser Bestand heute die größte genetische Diversität aufweist und somit als Genreserve des
GMP zu betrachten ist.
Insgesamt zeigte sich, dass das gesamte Genom des Göttinger Miniaturschweins mit Hilfe der
NGS-Technologie deutlich detaillierter untersucht werden kann, als dies noch mit SNP-
Markerarrays der Fall war. Die Möglichkeit der direkten Analyse potentiell funktioneller
Variation, inklusive struktureller Variation, erscheint als großer Gewinn. Trotzdem wird ihr
Einsatz auf absehbare Zeit aufgrund der hohen Kosten im Vergleich zu SNP-Arrays, auf
relativ geringe Stichprobenumfänge begrenzt bleiben.

CHAPTER 1
General Introduction
10 Chapter 1
A brief history of the Goettingen Minipig
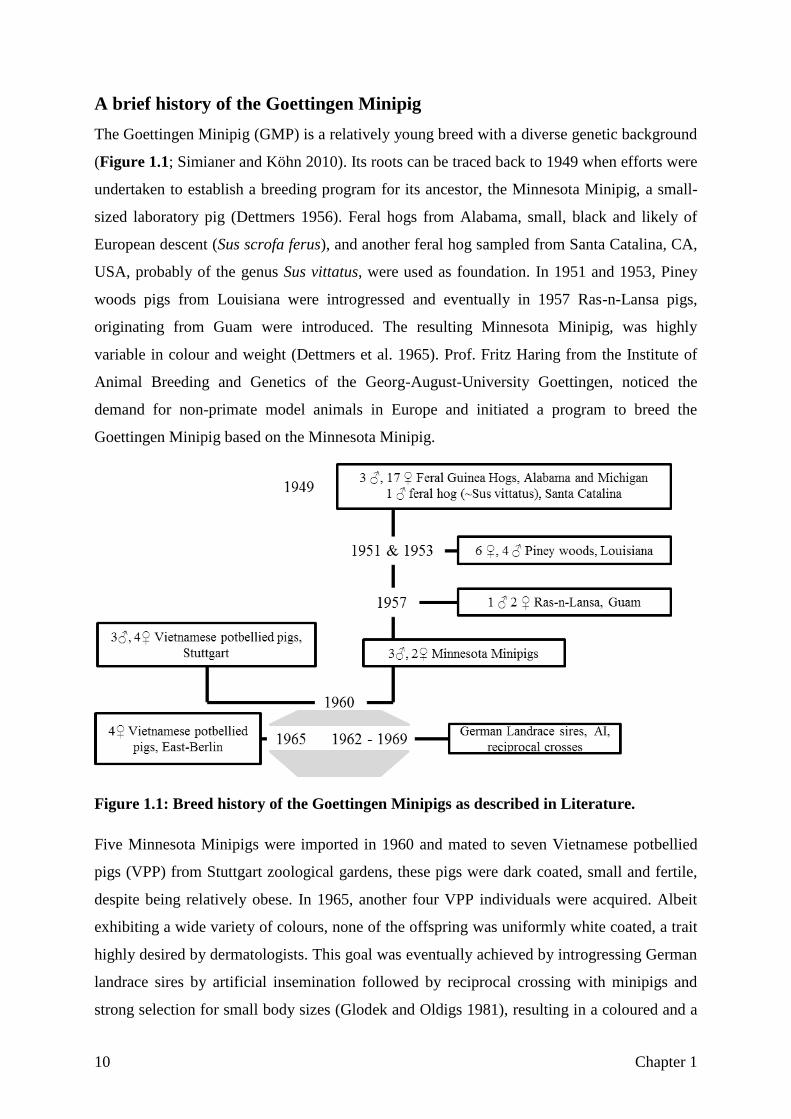
The Goettingen Minipig (GMP) is a relatively young breed with a diverse genetic background
(Figure 1.1; Simianer and Köhn 2010). Its roots can be traced back to 1949 when efforts were
undertaken to establish a breeding program for its ancestor, the Minnesota Minipig, a small-
sized laboratory pig (Dettmers 1956). Feral hogs from Alabama, small, black and likely of
European descent (Sus scrofa ferus), and another feral hog sampled from Santa Catalina, CA,
USA, probably of the genus Sus vittatus, were used as foundation. In 1951 and 1953, Piney
woods pigs from Louisiana were introgressed and eventually in 1957 Ras-n-Lansa pigs,
originating from Guam were introduced. The resulting Minnesota Minipig, was highly
variable in colour and weight (Dettmers et al. 1965). Prof. Fritz Haring from the Institute of
Animal Breeding and Genetics of the Georg-August-University Goettingen, noticed the
demand for non-primate model animals in Europe and initiated a program to breed the
Goettingen Minipig based on the Minnesota Minipig.
Figure 1.1: Breed history of the Goettingen Minipigs as described in Literature.
Five Minnesota Minipigs were imported in 1960 and mated to seven Vietnamese potbellied
pigs (VPP) from Stuttgart zoological gardens, these pigs were dark coated, small and fertile,
despite being relatively obese. In 1965, another four VPP individuals were acquired. Albeit
exhibiting a wide variety of colours, none of the offspring was uniformly white coated, a trait
highly desired by dermatologists. This goal was eventually achieved by introgressing German
landrace sires by artificial insemination followed by reciprocal crossing with minipigs and
strong selection for small body sizes (Glodek and Oldigs 1981), resulting in a coloured and a

Chapter 1 11
uniformly white coated line. Since then, the pedigree, growth and fertility phenotypes have
been completely recorded
The growth of the Goettingen Minipig
When the idea to use miniature pigs in laboratory research came up at the Hormel Institute of
University of Minnesota in the 1940’s (Dettmers et al. 1965) focus was set on reduction of
body size. The intention was to use the pig, due to physiological similarities to humans, but a
reduced size would prove advantageous in laboratory and pharmacological testing. This aim
was attained, when the GMP was established in the 1960’s (Simianer and Köhn 2010) and
today the Goettingen Minipig is considered to be the smallest pig breed (Figure 1.2) under a
controlled breeding scheme (Swindle et al. 2012).
Figure 1.2: Growth curve from all non-pregnant GMP from Denmark. Estimated mean
and standard deviation based on recording in 2015-2017.
The dwarfism of the GMP is characterized by a proportional miniaturization (Simianer and
Köhn 2010), and does not involve features such as achondroplasia. Since some of the
ancestral breeds, selected for their small size, originate from islands, this type is deemed to be
a form of insular dwarfism (Simianer and Köhn 2010), a mechanism that generally leads to
diminishment of body size of island based mammals and other isolated species, and is thought
12 Chapter 1
to have evolved to cope with restricted nutrition in isolated habitats (Lomolino 2005). Albeit
not on an island, pygmies were exposed to similar conditions in rainforest, possibly leading to
short stature (Perry and Dominy 2009). Their physiological background is supposedly a
deficiency of the pituitary gland, administering IGF 1 (Merimee et al. 1987), and a defect in
the growth hormone receptor GHR (Merimee et al. 1989). IGF 1 and IGF 2 play an important
role in swine growth processes as well (Van Laere et al. 2003; Jeon et al. 1999; Owens et al.
1990) and one first applications of gene editing on livestock was the knock-out of GHR in
pigs, resulting in a drastic reduction of size (Cyranoski 2015). Former studies using SNP
arrays on the GMP (Gaerke et al. 2014) identified additional candidate genes for growth, such
as SOCS2, TXN, DDR2 and GRB10. To this day, size inheritance remains poorly understood.
Next generation sequencing
The advent of molecular biotechnologies in livestock sciences changed the way animal
breeders elucidate the genetic background of phenotypic traits. Today, SNP arrays are widely
used, both for active breeding, as implemented in genomic selection, as well as for
investigatory purposes, as in genome wide association studies (GWAS). While high-
throughput genotyping arrays were still gaining importance in the aforementioned fields, the
publication of several livestock genomes, beginning with the chicken genome in 2004 (Hillier
et al. 2004), followed by the horse genome (Assembly 2007, Wade et al. 2009), the cow
genome (Elsik et al. 2009), and the pig genome (Groenen et al. 2012), enabled the use of
techniques collectively called ‘next generation sequencing’ (NGS) or ‘massively parallel
sequencing’ (not to be confused with ‘third generation sequencing’). Different to SNP arrays,
which rely on already known polymorphic positions and are specifically designed based on a
predefined discovery set of animal samples, NGS is based on the re-sequencing of a whole
genome. First sequencing approaches like Maxam-Gilbert- or Sanger-Sequencing were
expensive and slow (by current standards) and were restricted to short sequences of specific
loci. Sanger’s dideoxynucleotide sequencing became what is known as ‘first-generation-
sequencing’ (Liu et al. 2012). This technique was used to produce the first de-novo sequence
of the human genome (Lander et al. 1999) which took about 13 years and USD $100M.
(NHGRI 2016). Second-generation sequencing or ‘pyrosequencing’ was introduced after a
new mechanism of measuring pyrophosphate synthesis was discovered (Nyrén and Lundin
1985), that could visualize DNA synthesis in real-time without using radio- or fluorescently-
labeled dNTPs and electrophoresis (Heather and Chain 2016). Both, Sanger- and
pyrosequencing require DNA polymerase to synthesize the complement strand to the
Chapter 1 13
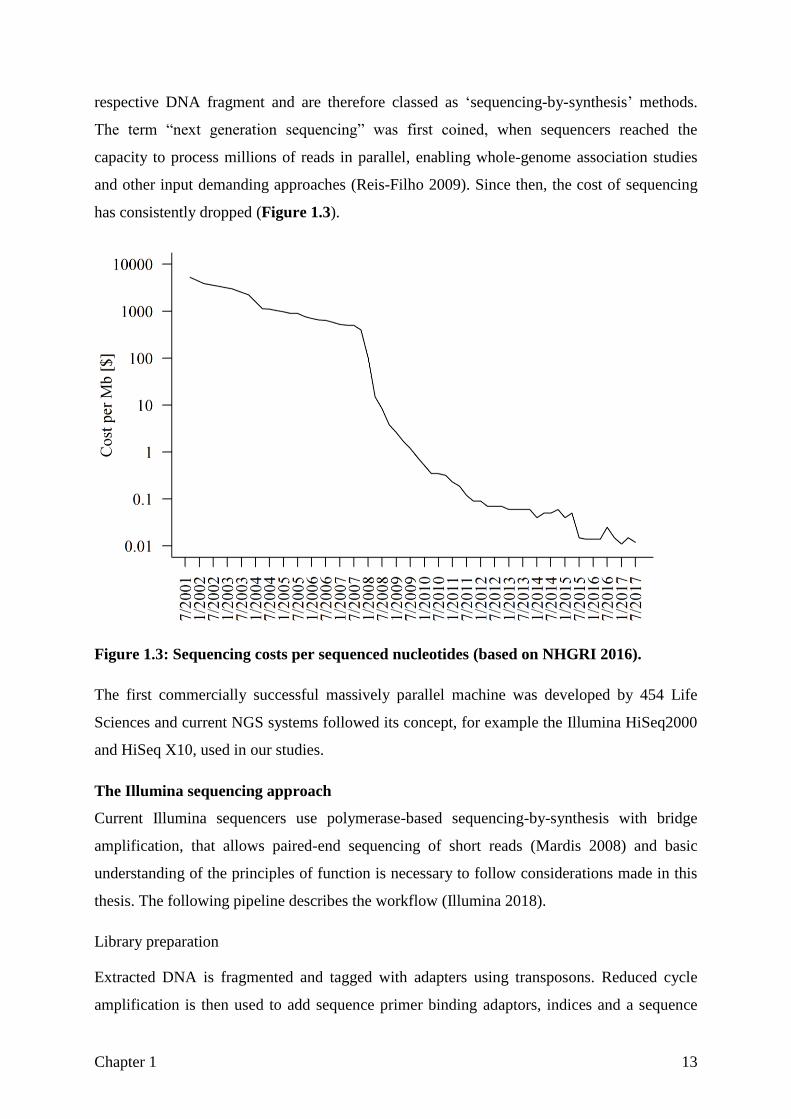
respective DNA fragment and are therefore classed as ‘sequencing-by-synthesis’ methods.
The term “next generation sequencing” was first coined, when sequencers reached the
capacity to process millions of reads in parallel, enabling whole-genome association studies
and other input demanding approaches (Reis-Filho 2009). Since then, the cost of sequencing
has consistently dropped (Figure 1.3).
Figure 1.3: Sequencing costs per sequenced nucleotides (based on NHGRI 2016).
The first commercially successful massively parallel machine was developed by 454 Life
Sciences and current NGS systems followed its concept, for example the Illumina HiSeq2000
and HiSeq X10, used in our studies.
The Illumina sequencing approach
Current Illumina sequencers use polymerase-based sequencing-by-synthesis with bridge
amplification, that allows paired-end sequencing of short reads (Mardis 2008) and basic
understanding of the principles of function is necessary to follow considerations made in this
thesis. The following pipeline describes the workflow (Illumina 2018).
Library preparation
Extracted DNA is fragmented and tagged with adapters using transposons. Reduced cycle
amplification is then used to add sequence primer binding adaptors, indices and a sequence
14 Chapter 1
complementary to the oligonucleotides (oligos) on the sequencers flow cell, to each side of
the read. Thus, the read can be tagged to the flow cell using the complementary regions,
identified by the index, and sequencing can be initiated at the primer binding site.
Cluster Amplification
The bottom of each channel of the flow cell is covered by lawn of two types of oligos, which
are complementary to the oligos, tagged to each side of the fragmented DNA. The fragments
are washed over the channel and adhere to one type of oligos. The flow cell oligo sequence is
then elongated by a polymerase along the original template. That double strand is denatured
and the original template is removed. The template folds over to the second type of oligo,
forming a bridge, during a process called bridge amplification. The complementary strand is
synthesized along the bridge and the double-stranded bridge is denatured, resulting in single-
stranded forward and reverse strand being hybridized to the oligos. This process is repeated
over and over to produce millions of clusters of clones of each read. Eventually the reverse
strands are removed from the flow cell, and the free complementary region of the forward
strand is blocked to prevent undesired bridge amplification. At the end of clustering, the
channel contains clusters of single forward strands fixed on the first type of oligos and free
second type oligos.
Sequencing
The sequencing primer is hybridized to the 5’ end. Fluorescently tagged nucleotides are
provided and the complementary nucleotide is hybridized to the forward strand. The
hybridized nucleotide emits a light signal which is detected and specific for each of the four
possible nucleotides. Each Nucleotide is initially blocked to prevent hybridization of more
than one base, ensuring, so that only one base is read per cycle. After a certain number of
cycles (Our study: HiSeq2000: 100; HiSeqX10: 150) the double strand is denatured and the
index primer is amplified. The index of the read is sequenced as the read before. Primer and
index are denatured and the 5’ oligo region left unprotected, so the read can perform bridge
amplification to the second type oligo on the flow cell. The second index is read to identify
the two paired mate reads. The bridge is denatured and the forward read removed. The reverse
read is sequenced as the forward read before.
Chapter 1 15
Raw sequence preparation to variant calling
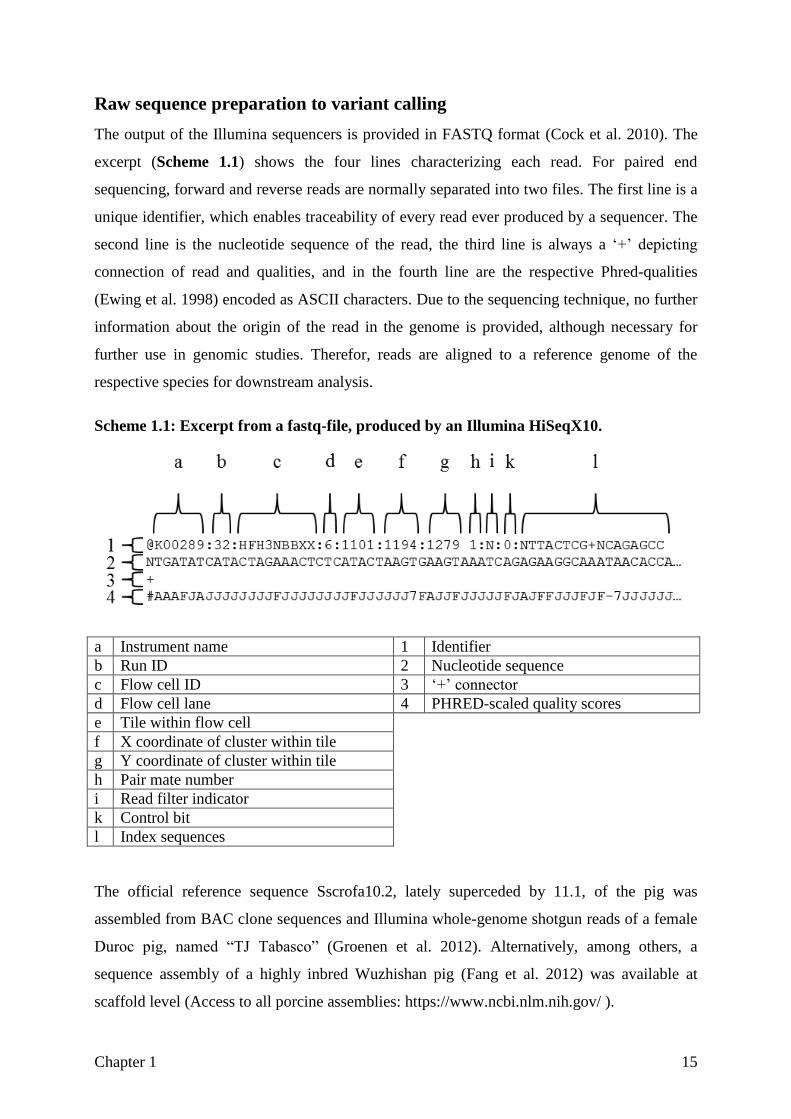
The output of the Illumina sequencers is provided in FASTQ format (Cock et al. 2010). The
excerpt (Scheme 1.1) shows the four lines characterizing each read. For paired end
sequencing, forward and reverse reads are normally separated into two files. The first line is a
unique identifier, which enables traceability of every read ever produced by a sequencer. The
second line is the nucleotide sequence of the read, the third line is always a ‘+’ depicting
connection of read and qualities, and in the fourth line are the respective Phred-qualities
(Ewing et al. 1998) encoded as ASCII characters. Due to the sequencing technique, no further
information about the origin of the read in the genome is provided, although necessary for
further use in genomic studies. Therefor, reads are aligned to a reference genome of the
respective species for downstream analysis.
Scheme 1.1: Excerpt from a fastq-file, produced by an Illumina HiSeqX10.
a Instrument name 1 Identifier
b Run ID 2 Nucleotide sequence
c Flow cell ID 3 ‘+’ connector
d Flow cell lane 4 PHRED-scaled quality scores
e Tile within flow cell
f X coordinate of cluster within tile
g Y coordinate of cluster within tile
h Pair mate number
i Read filter indicator
k Control bit
l Index sequences
The official reference sequence Sscrofa10.2, lately superceded by 11.1, of the pig was
assembled from BAC clone sequences and Illumina whole-genome shotgun reads of a female
Duroc pig, named “TJ Tabasco” (Groenen et al. 2012). Alternatively, among others, a
sequence assembly of a highly inbred Wuzhishan pig (Fang et al. 2012) was available at
scaffold level (Access to all porcine assemblies: https://www.ncbi.nlm.nih.gov/ ).
16 Chapter 1
Alignment
Alignment is the process of mapping every read to the reference genome. Since the
appearance of next-generation sequence data, a range of programs have been developed for
this purpose (Fonseca et al. 2012; Fonseca 2014). Among the most popular might be BLAST
(Altschul et al. 1990), Bowtie (Langmead et al. 2009) and BWA (Li and Durbin 2009). The
latter two are specifically designed to align NGS data. These programs have been constantly
updated, and shown to be well balanced in terms of sensitivity, false positive rate,
computation time and memory requirements (Otto et al. 2014; ECSEQ 2014). Both Bowtie
and BWA rely on the Burrows-Wheeler pattern matching algorithm.
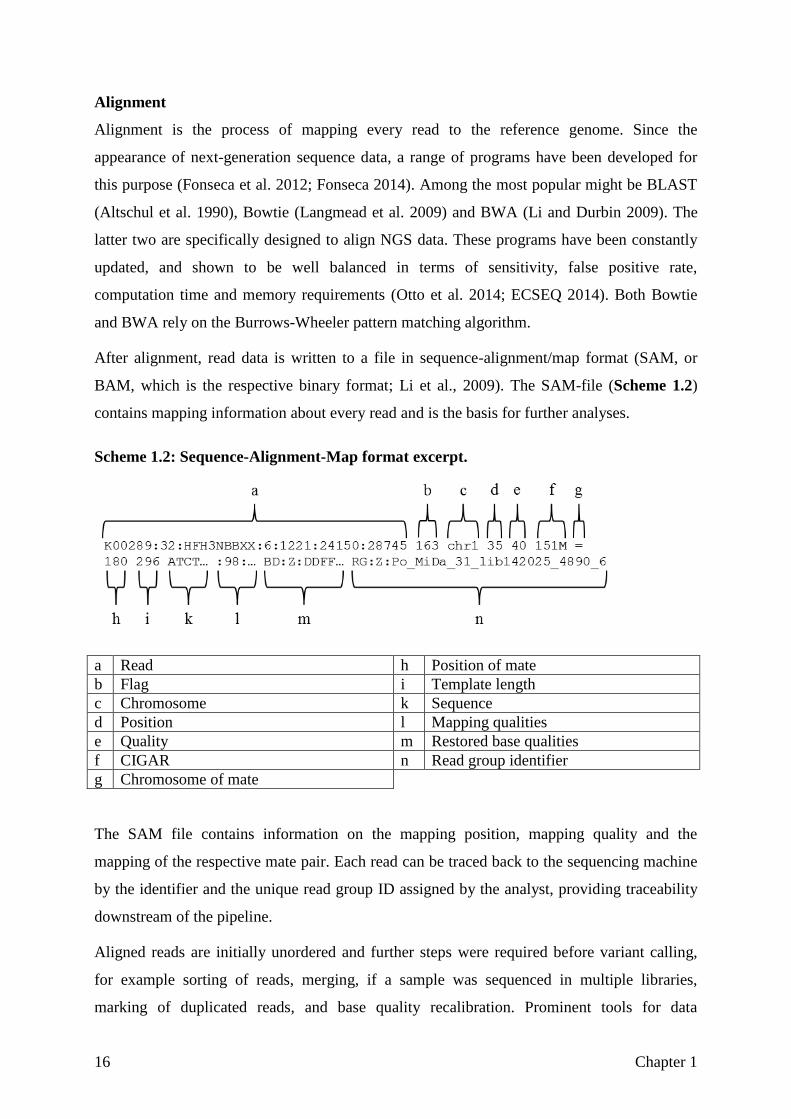
After alignment, read data is written to a file in sequence-alignment/map format (SAM, or
BAM, which is the respective binary format; Li et al., 2009). The SAM-file (Scheme 1.2)
contains mapping information about every read and is the basis for further analyses.
Scheme 1.2: Sequence-Alignment-Map format excerpt.
a Read h Position of mate
b Flag i Template length
c Chromosome k Sequence
d Position l Mapping qualities
e Quality m Restored base qualities
f CIGAR n Read group identifier
g Chromosome of mate
The SAM file contains information on the mapping position, mapping quality and the
mapping of the respective mate pair. Each read can be traced back to the sequencing machine
by the identifier and the unique read group ID assigned by the analyst, providing traceability
downstream of the pipeline.
Aligned reads are initially unordered and further steps were required before variant calling,
for example sorting of reads, merging, if a sample was sequenced in multiple libraries,
marking of duplicated reads, and base quality recalibration. Prominent tools for data
Chapter 1 17
preparation are for example Samtools (Li et al. 2009), Picard (Picard 2009), or the Genome
analysis toolkit, GATK (Van der Auwera et al. 2013).
Variant calling
Variant calling is the process of identification of polymorphisms in the aligned sequence
reads compared to the reference sequence. In the simplest case, the absence of sequencing
errors and high read coverage, a variant would be every deviation from the reference
sequence, found in the sequence reads, or for heterozygous loci, reads supporting any of two
different alleles. A variant and genotype could easily be determined by counting alleles.
Normally, both are done in two steps, where first a variable position is identified and then
individuals’ genotypes at the respective position are determined (Nielsen et al. 2011). Current
variant callers, such as Samtools mpileup (Li et al. 2009), FreeBayes (Garrison and Marth
2012), or GATK haplotype caller rely on Bayesian methods, rather than simple allele
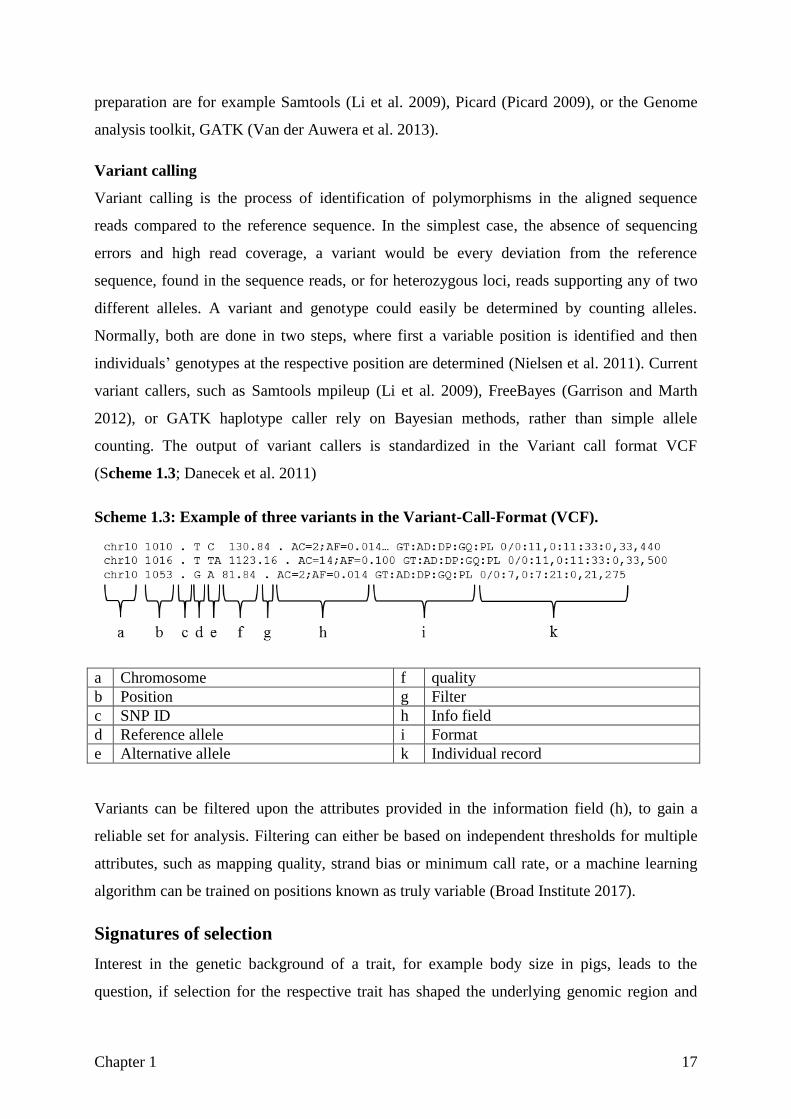
counting. The output of variant callers is standardized in the Variant call format VCF
(Scheme 1.3; Danecek et al. 2011)
Scheme 1.3: Example of three variants in the Variant-Call-Format (VCF).
a Chromosome f quality
b Position g Filter
c SNP ID h Info field
d Reference allele i Format
e Alternative allele k Individual record
Variants can be filtered upon the attributes provided in the information field (h), to gain a
reliable set for analysis. Filtering can either be based on independent thresholds for multiple
attributes, such as mapping quality, strand bias or minimum call rate, or a machine learning
algorithm can be trained on positions known as truly variable (Broad Institute 2017).
Signatures of selection
Interest in the genetic background of a trait, for example body size in pigs, leads to the
question, if selection for the respective trait has shaped the underlying genomic region and

18 Chapter 1
how this can be detected? The arrival of the NGS techniques described above, facilitated
gathering information on the (almost) whole genome of an individual, enabling assessment of
total genetic variation.
The theory of neo-darwinian selection states that a large proportion of variation has
consequences for the fitness of the organism and most variants are therefore subjected to
selective pressures (Nei 2005). In contrast, the neutral theory of selection (Kimura 1969)
states that most of the variation in the genome is neutral and changes in allele frequency, or
fixation, are in the most part due to genetic drift rather than selection.
In both theories, variable loci with effects on fitness, captured as the probability of an allele to
be conveyed into the next generation, are prone to selective pressures, resulting in frequency
changes of the favourable allele. In animal breeding scenarios, the chance to reproduce is
highly dependent on an individual carrying a desired phenotype, and therefore being chosen
for mating. The selection coefficient (Gillespie 2004), describes difference in fitness for two
alleles by estimating the relative selective pressure against an undesired allele/genotype.
While the selection coefficient can be relatively minor, as in the case of lactose tolerance
(Bersaglieri et al. 2004), long term evolutionary pressures will eventually lead to fixation of
the causative variant at the beneficial allele. This holds also if in the biallelic case the
homozygous genotype is preferable. Dependent on whether the mutant allele or the ancestral
allele are desired, selection is positive or negative, respectively, but both categories are
counted as directional selection. In the case of over-dominance, the heterozygous genotype is
favoured, and both alleles are maintained at intermediate frequencies, which is then called
balancing selection. (Nielsen 2005).
Under directional selection, not only will the variant itself be fixed, but also the variant alleles
in the vicinity of the selected allele will be co-selected due to genetic linkage. This is the so-
called ‘hitch-hiking effect’ of the favourable gene (Smith and Haigh 1974). In the case of
directional selection, this results in diminished variability around the selected locus. Such a
region is called a ‘selective sweep’ (Pritchard et al. 2010) and is one case of a signature of
past selection.
The selective sweep facilitates the identification of the location of the causative variant since
neighboring variants exhibit similar genetic features as the causative variant. These features
can be classified in the following categories:
Chapter 1 19
Decrease in variability
Selection pressure will fix the favorable allele in the directional case, resulting in decreased
nucleotide diversity (Nei and Li 1979) or decreased expected heterozygosity within the
selective sweep (Smith and Haigh 1974).
Differentiation
When selection favours different alleles in different populations, allele frequencies at such a
locus will diverge. The classic measure of differentiation between subpopulations is Wright’s
FST, introduced by Wright (1950). It is based on the inbreeding coefficient, which is defined
as the probability of both alleles carried by an individual being identical by descent (Falconer
and Mackay 1996) and its effect of shrinking heterozygosity. In the absence of inbreeding, the
number of heterozygotes would be expected to be 2𝑝(1 − 𝑝) with 𝑝 being the allele
frequency of one allele (Weir 1996), but with inbreeding it is 2𝑝(1 − 𝑝) − 2𝐹𝑝(1 − 𝑝) with
𝐹 being the inbreeding coefficient (Wright 1950). Another way to interpret 𝐹 is as being the
correlation between the two gametes of an individual (Holsinger and Weir 2009). Faced with
the problem of inbreeding in sub-populations, Wright (1950) split the inbreeding coefficient 𝐹
into three components 𝐹𝐼𝑇 (1), 𝐹𝑆𝑇 (2) and 𝐹𝐼𝑆 (3), which can be interpreted as co- ancestries
(Holsinger and Weir 2009): (1) co-ancestry of the alleles of an individual in relation to the
entire population (‘inbreeding’), (2), co-ancestry of two randomly chosen alleles in a
subpopulation in comparison to the entire population and (3), the co-ancestry of an
individual’s alleles relative to its sub-population. Even more simple, Hudson et al. (1992)
define 𝐹𝑆𝑇 as 1 −𝐻𝑤
𝐻𝑏, with 𝐻𝑤 being the average number of differences between two
sequences randomly sampled from the same sub-population and 𝐻𝑏 being the average number
of differences between sequences sampled from two sub-populations. The three F-values are
interrelated as 𝐹𝑆𝑇 =𝐹𝐼𝑇−𝐹𝐼𝑆
1−𝐹𝐼𝑆 (Wright 1950) which is equal to (1 − 𝐹𝐼𝑇) = (1 − 𝐹𝑆𝑇)(1 − 𝐹𝐼𝑆)
(Weir and Cockerham 1984). 𝐹𝑆𝑇 is therefore a measure of differentiation between sub-
populations. As a result, 𝐹𝑆𝑇 can also be used to detect diversifying or balancing selection
between two subpopulations (Bowcock et al. 1991).
Since sequencing provides genome wide sets of variants, the 𝐹𝑆𝑇 distribution under neutrality
no longer needs to be assumed or modeled, but can simply be quantified, and outliers in
extreme tails of this distribution can be considered as candidate loci under selection (Akey et
al. 2002). Also, neighboring 𝐹𝑆𝑇 values in regions under selection appear to be highly
correlated and 𝐹𝑆𝑇 in coding SNPs has been found to be lower than at non-coding loci, which

20 Chapter 1
may explain a functional constraint of these variant classes (Akey et al. 2002). 𝐹𝑆𝑇 is widely
used in studies of selection in livestock (Leno-Colorado et al. 2017; Rubin et al. 2012;
Wilkinson et al. 2013).
Linkage disequilibrium decay and number of haplotypes
In a finite population, favourable mutations are contained in a limited number of haplotypes.
When selective pressure promotes a favourable allele, the respective haplotype or haplotypes
are co-selected due to linkage which results in an increased level of linkage disequilibrium
(LD; Barton 2000) that can be used to identify a selective sweep (Pérez O’Brien et al. 2014;
Gholami et al. 2015). Prominent tests are EHH (extended haplotype homozygosity, Sabeti et
al. 2002), which aims to identify highly frequent haplotypes that are longer than expected
under normal recombination, or iHS (integrated haplotype score; Voight et al. 2006), which
identifies loci where the derived allele is preferred and the respective haplotype is
unexpectedly long. The latter is considered optimal to identify ongoing positive selection.
Both measures have been extensively used to identify selective sweeps (Qanbari et al. 2011;
Bomba et al. 2015).
Allele frequency spectrum
Under the neutral theory (Kimura 1991), it is expected that the number of polymorphisms at a
site are in a relation to the number of pairwise differences between individual sequences at
that site (Tajima 1989). This means, that if in a region with many segregating loci individuals
differ at a relatively low number of these loci, this might be interpreted as a preference for
certain haplotypes and therefore a sign of selection. The derived test, Tajima’s D, provides a
statistic that compares the mean number of differences to the number of segregating sites. It is
scaled, so under neutrality the D-value is expected to be zero. A value below zero indicates
less differences than expected, i.e. rare alleles at high numbers, which can be interpreted as a
sign of positive selection, whereas a value higher than zero indicates unexpectedly high
number of differences, i.e. an excess of common variants, being a sign of balancing selection.
Selection also shapes the allele frequency spectrum in a characteristic way (Figure 1.4) and
modern tests aim to identify differences in the allele frequency distribution (Bustamante et al.
2001).

Chapter 1 21
Figure 1.4: Allele frequency spectra in genomic regions under different types of selection
(modified from Nielsen 2005).
A method based on composite likelihood (Kim and Stephan 2002), which compares the
maximum composite likelihood estimated under a model of no selection against the
composite likelihood under a model allowing selection, became prominent when detecting
sweeps in the upcoming DNA data (Nielsen et al. 2005). This model was improved by
replacing the composite likelihood of a model without selective sweeps by the composite
likelihood estimated from the dataset itself (Nielsen et al. 2005). This approach also accounts
for the ubiquitous problems of uncertainty in assumptions, such as recombination rates or
population history when modeling and also ascertainment bias in the SNP data
McDonald- Kreitman-tests
The McDonald-Kreitman test evaluates the abundance of mutations in coding regions of
genes (McDonald and Kreitman 1991). In principle, mutations in coding regions can be
categorized into protein-changing non-synonymous mutations, and neutral synonymous
mutations (Nielsen 2005). The assumption is that the ratio of substitutions of these two
mutation types between species and the ratio of polymorphic mutations of both types within
species should be balanced. Selection can alter those ratios since it is expected to affect the
non-synonymous rather than the synonymous mutations. Depending on the type of selection,
22 Chapter 1
positive or negative, the relative number of non-synonymous substitutions will either increase
or decrease. This test can be enhanced by applying it to multiple sub-populations and
comparing the ratios within a subpopulation and between the contrasts, to find genes under
selection.
The statistics presented here, were chosen to give a notion of the basic principles of the
detection of signatures of selection. Most scenarios hold for a hard sweep, a hitchhiking
signature following to beneficial allele being swept through the population by selective
pressure. But it should be mentioned, that there are also soft sweeps, not necessarily
accompanied by a hitchhiking signature or polygenic adaptation (Pritchard et al. 2010).
Additionally, numerous sophisticated statistics have been developed, sometimes by extending
aforementioned methods by cross-population testing, e.g. XP-EHH or XP-CLR (Sabeti et al.
2007; Chen et al. 2010), sometimes combining known approaches (Grossman et al. 2010; Ma
et al. 2015).
Functional annotation
Approaches, like the aforementioned McDonald-Kreitman test require precise knowledge if a
mutant allele is synonymous or non-synonymous. On the other hand NGS studies produce
vast amounts of data, with millions of variants being discovered, normally in the form of
SNPs or short insertions or deletions (InDels). Obviously, an individual evaluation of each
variant is impossible and more efficient approaches are needed (Wang et al. 2010a).
Approximately only 1.2 % of mammalian genomes represent coding regions (Human Genome
Sequencing Consortium 2004). Common annotation tools, e.g. ANNOVAR (Wang et al.
2010a), use gene databases such as Ensembl (Aken et al. 2016) to determine if a variant is
located in a coding region or, for example, in between of genes. They also incorporate
annotated mRNA sequences and known variants, and can be used for analyses involving
livestock, although this information is mostly derived for model organisms, such as humans
or mice. It is well understood which amino-acid a codon-triplet of respective mRNA is
translated in protein-biosynthesis (Matthaei and Nirenberg 1961; Nirenberg and Matthaei
1961), but this does not predict if the replacement of an certain amino acid has functional
constraint on the resulting protein. Therefore, approaches such as SIFT (Sorting-Intolerant-
From-Tolerant; Ng and Henikoff 2003) and GERP (Genomic Evolutionary Rate Profiling;
Cooper et al. 2005) have been developed. Both assume that an amino acid change is more
likely to have functional consequence when it is highly conserved in homologous sequences,
derived from related protein sequences (SIFT; Ng and Henikoff 2001) or multiple sequence

Chapter 1 23
alignment of a set of related species from the same class, e.g. mammals (GERP; Cooper et al.
2005). Besides relatively easily identifiable coding mutations, as described before, it is known
that there are various other mutations with functional consequence. Initiatives such as
FAANG aim at further characterizing these variations in livestock (Andersson et al. 2015).
Objective and aim
Marker based approaches, microsatellites and SNP-arrays, have been utilized in research in
livestock for many years (Womack 2005). The arrival of affordable massively parallel
sequencing offers new opportunities to reveal the genetic basis of interesting traits. Thus, in
theory causal variants can be identified directly, rather than just via their hitchhiking effect on
surrounding markers, especially employing recent developments such as reverse genetics.
Recent studies have proven that analysis of NGS data is a powerful means to elucidate the
genetic background of phenotypically complex traits. Prominent examples are gait patterns in
the horse (Andersson et al. 2012), comb morphology in the chicken (Imsland et al. 2012) and
coat colour in the swine (Rubin et al. 2012). Another feature of NGS variant sets is that they
are relatively less affected by ascertainment bias than SNP-arrays, which are suited for a
specific set of discovery populations (Malomane et al. 2018), and could therefore be used to
calculate unbiased estimates of variation and differentiation in breeds not in the discovery set.
The Goettingen Minipig as a highly controlled breed of exceptionally small body size, is a
highly promising candidate to eluciade the genetics behind miniaturization in pigs. For
several reasons, it has been bred in separated stocks. While the breeding programme focuses
on the management of inbreeding and minimisation of population divergence, the processes
that have influenced the genome as a result of the separation of the breeding units are of
particular interest to the breeders.
This study aims to use whole-genome re-sequencing to characterize the following
fundamental aspects relating to the Goettingen Minipig genome:
1. What is the genetic background of the body size difference between conventional
fattening pigs and two breeds of minipigs, the GMP and the MiniLEWE?
2. Is there stratification between isolated GMP breeding stocks, and could the high
resolution and low ascertainment bias of NGS data enhance its assessment?
24 Chapter 1
References
Aken BL, Ayling S, Barrell D, Clarke L, Curwen V, Fairley S, Fernandez Banet J, Billis K,
García Girón C, Hourlier T, et al. 2016. The Ensembl gene annotation system. Database
2016: baw093.
Akey JM, Zhang G, Zhang K, Jin L, Shriver MD. 2002. Interrogating a high-density SNP
map for signatures of natural selection. Genome Res 12: 1805–14.
Altschul SF, Gish W, Miller W, Myers EW, Lipman DJ. 1990. Basic local alignment search
tool. J Mol Biol 215: 403–410.
Andersson L, Archibald AL, Bottema CD, Brauning R, Burgess SC, Burt DW, Casas E,
Cheng HH, Clarke L, Couldrey C, et al. 2015. Coordinated international action to
accelerate genome-to-phenome with FAANG, the Functional Annotation of Animal
Genomes project. Genome Biol 16: 57.
Andersson LS, Larhammar M, Memic F, Wootz H, Schwochow D, Rubin C-J, Patra K,
Arnason T, Wellbring L, Hjälm G, et al. 2012. Mutations in DMRT3 affect locomotion
in horses and spinal circuit function in mice. Nature 488: 642–6.
Barton NH. 2000. Genetic hitchhiking. Philos Trans R Soc B Biol Sci 355: 1553–1562.
Bersaglieri T, Sabeti PC, Patterson N, Vanderploeg T, Schaffner SF, Drake JA, Rhodes M,
Reich DE, Hirschhorn JN. 2004. Genetic signatures of strong recent positive selection at
the lactase gene. Am J Hum Genet 74: 1111–20.
Bomba L, Nicolazzi EL, Milanesi M, Negrini R, Mancini G, Biscarini F, Stella A, Valentini
A, Ajmone-Marsan P. 2015. Relative extended haplotype homozygosity signals across
breeds reveal dairy and beef specific signatures of selection. Genet Sel Evol 47: 25.
Bowcock AM, Kidd JR, Mountain JL, Hebert JM, Carotenuto L, Kidd KK, Cavalli-Sforza
LL. 1991. Drift, admixture, and selection in human evolution: a study with DNA
polymorphisms. Proc Natl Acad Sci U S A 88: 839–43.
Broad Institute. 2017. GATK Best Practice. https://software.broadinstitute.org/gatk/
Bustamante CD, Wakeley J, Sawyer S, Hartl DL. 2001. Directional Selection and the Site-
Frequency Spectrum. Genetics 159.
Chen H, Patterson N, Reich D. 2010. Population differentiation as a test for selective sweeps.
Genome Res 20: 393–402.
Chapter 1 25
Cock PJA, Fields CJ, Goto N, Heuer ML, Rice PM. 2010. The Sanger FASTQ file format for
sequences with quality scores, and the Solexa/Illumina FASTQ variants. Nucleic Acids
Res 38: 1767–1771.
Cooper GM, Stone EA, Asimenos G, NISC Comparative Sequencing Program ED, Green
ED, Batzoglou S, Sidow A. 2005. Distribution and intensity of constraint in mammalian
genomic sequence. Genome Res 15: 901–13.
Cyranoski D. 2015. Gene-edited “micropigs” to be sold as pets at Chinese institute. Nature
526: 18–18.
Danecek P, Auton A, Abecasis G, Albers CA, Banks E, DePristo MA, Handsaker RE, Lunter
G, Marth GT, Sherry ST, et al. 2011. The variant call format and VCFtools.
Bioinformatics 27: 2156–8.
Dettmers A. 1956. Die Zucht eines neuen „Versuchstieres”, des Miniaturschweines in
Amerika. Zeitschrift für Tierzüchtung und Züchtungsbiologie 68: 37–41.
Dettmers AE, Rempel WE, Comstock RE. 1965. Selection for Small Size in Swine. J Anim
Sci 24: 216–220.
ECSEQ. 2014. NGS Read Mapper Comparison.
Elsik CG, Tellam RL, Worley KC, Gibbs RA, Muzny DM, Weinstock GM, Adelson DL,
Eichler EE, Elnitski L, Guigó R, et al. 2009. The genome sequence of taurine cattle: a
window to ruminant biology and evolution. Science 324: 522–8.
Ewing B, Hillier L, Wendl MC, Green P. 1998. Base-calling of automated sequencer traces
using phred. I. Accuracy assessment. Genome Res 8: 175–85.
Falconer DS, MacKay TFC. 1996. Introduction to quantitative genetics. 4th ed. Longman,
Burnt Mill, England.
Fang X, Mou Y, Huang Z, Li Y, Han L, Zhang Y, Feng Y, Chen Y, Jiang X, Zhao W, et al.
2012. The sequence and analysis of a Chinese pig genome. Gigascience 1: 16.
Fonseca NA. 2014. What is the best NGS alignment software?
Fonseca NA, Rung J, Brazma A, Marioni JC. 2012. Tools for mapping high-throughput
sequencing data. Bioinformatics 28: 3169–3177.
26 Chapter 1
Gaerke C, Ytournel F, Sharifi a. R, Pimentel ECG, Ludwig A, Simianer H. 2014. Footprints
of recent selection and variability in breed composition in the Göttingen Minipig
genome. Anim Genet 381–391.
Garrison E, Marth G. 2012. Haplotype-based variant detection from short-read sequencing.
arXiv 1207.3907.
Gholami M, Reimer C, Erbe M, Preisinger R, Weigend A, Weigend S, Servin B, Simianer H.
2015. Genome Scan for Selection in Structured Layer Chicken Populations Exploiting
Linkage Disequilibrium Information ed. Y. Cao. PLoS One 10: e0130497.
Gillespie JH. 2004. Population Genetics - A Concise Guide. 2 nd. John Hopkins University
Press, Baltimore & London.
Glodek P, Oldigs B. 1981. Das Göttinger Miniaturschwein. Parey, Berlin and Hamburg.
Groenen MAM, Archibald AL, Uenishi H, Tuggle CK, Takeuchi Y, Rothschild MF, Rogel-
gaillard C, Park C, Megens H, Li S, et al. 2012. Analyses of pig genomes provide
insight into porcine demography and evolution. Nature 491: 393–398.
Grossman SR, Shlyakhter I, Shylakhter I, Karlsson EK, Byrne EH, Morales S, Frieden G,
Hostetter E, Angelino E, Garber M, et al. 2010. A composite of multiple signals
distinguishes causal variants in regions of positive selection. Science 327: 883–6.
Heather JM, Chain B. 2016. The sequence of sequencers: The history of sequencing DNA.
Genomics 107: 1–8.
Hillier LW, Miller W, Birney E, Warren W, Hardison RC, Ponting CP, Bork P, Burt DW,
Groenen MAM, Delany ME, et al. 2004. Sequence and comparative analysis of the
chicken genome provide unique perspectives on vertebrate evolution. Nature 432: 695–
716.
Holsinger KE, Weir BS. 2009. Genetics in geographically structured populations: defining,
estimating and interpreting F(ST). Nat Rev Genet 10: 639–50.
Hudson RR, Slatkin M, Maddison WP. 1992. Estimation of levels of gene flow from DNA
sequence data. Genetics 132: 583–9.
Human Genome Sequencing Consortium I. 2004. Finishing the euchromatic sequence of the
human genome. Nature 431: 931–945.
Illumina. 2018. An introduction to Next-Generation Sequencing Technology.
Chapter 1 27
Imsland F, Feng C, Boije H, Bed’hom B, Fillon V, Dorshorst B, Rubin C-J, Liu R, Gao Y, Gu
X, et al. 2012. The Rose-comb mutation in chickens constitutes a structural
rearrangement causing both altered comb morphology and defective sperm motility.
PLoS Genet 8: e1002775.
Jeon J-T, Carlborg Ö, Törnsten A, Giuffra E, Amarger V, Chardon P, Andersson-Eklund L,
Andersson K, Hansson I, Lundström K, et al. 1999. A paternally expressed QTL
affecting skeletal and cardiac muscle massin pigs maps to the IGF2 locus. Nat Genet 21:
157–158.
Kim Y, Stephan W. 2002. Detecting a Local Signature of Genetic Hitchhiking Along a
Recombining Chromosome. Genetics 160: 765–777.
Kimura M. 1991. The neutral theory of molecular evolution: A review of recent evidence.
Japanese J Genet 66: 367–386.
Kimura M. 1969. The rate of molecular evolution considered from the standpoint of
population genetics. Proc Natl Acad Sci U S A 63: 1181–8.
Lander ES, Cargill M, Altshuler D, Ireland J, Sklar P, Ardlie K, Patil N, Lane CR, Lim EP,
Kalyanaraman N, et al. 1999. Characterization of single-nucleotide polymorphisms in
coding regions of human genes. Nat Genet 22: 231–238.
Langmead B, Trapnell C, Pop M, Salzberg SL. 2009. Ultrafast and memory-efficient
alignment of short DNA sequences to the human genome. Genome Biol 10: R25.
Leno-Colorado J, Hudson NJ, Reverter A, Pérez-Enciso M. 2017. A Pathway-Centered
Analysis of Pig Domestication and Breeding in Eurasia. G3 (Bethesda) 7: 2171–2184.
Li H, Durbin R. 2009. Fast and accurate short read alignment with Burrows-Wheeler
transform. Bioinformatics 25: 1754–60.
Li H, Handsaker B, Wysoker A, Fennell T, Ruan J, Homer N, Marth G, Abecasis G, Durbin
R. 2009. The Sequence Alignment/Map format and SAMtools. Bioinformatics 25:
2078–9.
Liu L, Li Y, Li S, Hu N, He Y, Pong R, Lin D, Lu L, Law M. 2012. Comparison of Next-
Generation Sequencing Systems. J Biomed Biotechnol 2012: 1–11.
Lomolino M V. 2005. Body size evolution in insular vertebrates: generality of the island rule.
J Biogeogr 32: 1683–1699.

28 Chapter 1
Ma Y, Ding X, Qanbari S, Weigend S, Zhang Q, Simianer H. 2015. Properties of different
selection signature statistics and a new strategy for combining them. Heredity (Edinb)
115: 426–436.
Malomane DK, Reimer C, Weigend S, Weigend A, Sharifi AR, Simianer H. 2018. Efficiency
of different strategies to mitigate ascertainment bias when using SNP panels in diversity
studies. BMC Genomics 19: 22.
Mardis ER. 2008. The impact of next-generation sequencing technology on genetics. Trends
Genet 24: 133–141.
Matthaei JH, Nirenberg MW. 1961. Characteristics and stabilization of DNAase-sensitive
protein synthesis in E. coli extracts. Proc Natl Acad Sci U S A 47: 1580–8.
McDonald JH, Kreitman M. 1991. Adaptive protein evolution at the Adh locus in Drosophila.
Nature 351: 652–654.
Merimee TJ, Hewlett BS, Wood W, Bowcock AM, Cavalli-Sforza LL. 1989. The growth
hormone receptor gene in the African pygmy. Trans Assoc Am Physicians 102: 163–9.
Merimee TJ, Zapf J, Hewlett B, Cavalli-Sforza LL. 1987. Insulin-like Growth Factors in
Pygmies. N Engl J Med 316: 906–911.
Nei M. 2005. Selectionism and neutralism in molecular evolution. Mol Biol Evol 22: 2318–
42.
Nei M, Li WH. 1979. Mathematical model for studying genetic variation in terms of
restriction endonucleases. Proc Natl Acad Sci U S A 76: 5269–73.
Ng PC, Henikoff S. 2001. Predicting deleterious amino acid substitutions. Genome Res 11:
863–74.
Ng PC, Henikoff S. 2003. SIFT: Predicting amino acid changes that affect protein function.
Nucleic Acids Res 31: 3812–4.
NHGRI. 2016. The Cost of Sequencing a Human Genome - National Human Genome
Research Institute (NHGRI). https://www.genome.gov/sequencingcosts/.
Nielsen R, Paul JS, Albrechtsen A, Song YS. 2011. Genotype and SNP calling from next-
generation sequencing data. Nat Rev Genet 12: 443–451.
Nielsen R, Williamson S, Kim Y, Hubisz MJ, Clark AG, Bustamante C. 2005. Genomic scans
for selective sweeps using SNP data. Genome Res 15: 1566–1575.

Chapter 1 29
Nielsen RO. 2005. Molecular signatures of natural selection. Annu Rev Genet 39: 197–218.
Nirenberg MW, Matthaei JH. 1961. The dependence of cell-free protein synthesis in E. coli
upon naturally occurring or synthetic polyribonucleotides. Proc Natl Acad Sci U S A 47:
1588–602.
Nyrén P, Lundin A. 1985. Enzymatic method for continuous monitoring of inorganic
pyrophosphate synthesis. Anal Biochem 151: 504–509.
Otto C, Stadler PF, Hoffmann S. 2014. Lacking alignments? The next-generation sequencing
mapper segemehl revisited. Bioinformatics 30: 1837–1843.
Owens PC, Johnson RJ, Campbell RG, Ballard FJ. 1990. Growth hormone increases insulin-
like growth factor-I (IGF-I) and decreases IGF-II in plasma of growing pigs. J
Endocrinol 124: 269–75.
Pérez O’Brien AM, Utsunomiya YT, Mészáros G, Bickhart DM, Liu GE, Van Tassell CP,
Sonstegard TS, Da Silva MVB, Garcia JF, Sölkner J. 2014. Assessing signatures of
selection through variation in linkage disequilibrium between taurine and indicine
cattle. Genet Sel Evol 46: 19.
Perry GH, Dominy NJ. 2009. Evolution of the human pygmy phenotype. Trends Ecol Evol
24: 218–225.
Picard. 2009. http://picard.sourceforge.net/. Accessed 2013-07-26.
Pritchard JK, Pickrell JK, Coop G. 2010. The genetics of human adaptation: hard sweeps, soft
sweeps, and polygenic adaptation. Curr Biol 20: R208-15.
Qanbari S, Gianola D, Hayes B, Schenkel F, Miller S, Moore S, Thaller G, Simianer H. 2011.
Application of site and haplotype-frequency based approaches for detecting selection
signatures in cattle. BMC Genomics 12: 318.
Reis-Filho JS. 2009. Next-generation sequencing. Breast Cancer Res 11: S12.
Rubin C-J, Megens HJ, Martinez Barrio A, Maqbool K, Sayyab S, Schwochow D, Wang C,
Carlborg O, Jern P, Jorgensen CB, et al. 2012. Strong signatures of selection in the
domestic pig genome. Proc Natl Acad Sci U S A 109: 19529–19536.
Sabeti PC, Reich DE, Higgins JM, Levine HZP, Richter DJ, Schaffner SF, Gabriel SB, Platko
J V., Patterson NJ, McDonald GJ, et al. 2002. Detecting recent positive selection in the
human genome from haplotype structure. Nature 419: 832–837.
30 Chapter 1
Sabeti PC, Varilly P, Fry B, Lohmueller J, Hostetter E, Cotsapas C, Xie X, Byrne EH,
McCarroll SA, Gaudet R, et al. 2007. Genome-wide detection and characterization of
positive selection in human populations. Nature 449: 913–918.
Simianer H, Köhn F. 2010. Genetic management of the Göttingen Minipig population. J
Pharmacol Toxicol Methods 62: 221–6.
Smith JM, Haigh J. 1974. The hitch-hiking effect of a favourable gene. Genet Res 23: 23.
Swindle MM, Makin A, Herron AJ, Clubb FJ, Frazier KS. 2012. Swine as models in
biomedical research and toxicology testing. Vet Pathol 49: 344–56.
Tajima F. 1989. Statistical method for testing the neutral mutation hypothesis by DNA
polymorphism. Genetics 123: 585–95.
Van der Auwera GA, Carneiro MO, Hartl C, Poplin R, del Angel G, Levy-Moonshine A,
Jordan T, Shakir K, Roazen D, Thibault J, et al. 2013. From FastQ Data to High-
Confidence Variant Calls: The Genome Analysis Toolkit Best Practices Pipeline. In
Current Protocols in Bioinformatics, p. 11.10.1-11.10.33, John Wiley & Sons, Inc.,
Hoboken, NJ, USA.
Van Laere A-S, Nguyen M, Braunschweig M, Nezer C, Collette C, Moreau L, Archibald AL,
Haley CS, Buys N, Tally M, et al. 2003. A regulatory mutation in IGF2 causes a major
QTL effect on muscle growth in the pig. Nature 425: 832–6.
Voight BF, Kudaravalli S, Wen X, Pritchard JK. 2006. A Map of Recent Positive Selection in
the Human Genome ed. L. Hurst. PLoS Biol 4: e72.
Wade CM, Giulotto E, Sigurdsson S, Zoli M, Gnerre S, Imsland F, Lear TL, Adelson DL,
Bailey E, Bellone RR, et al. 2009. Genome sequence, comparative analysis, and
population genetics of the domestic horse. Science 326: 865–7.
Wang K, Li M, Hakonarson H. 2010. ANNOVAR: functional annotation of genetic variants
from high-throughput sequencing data. Nucleic Acids Res 38: e164.
Weir BS. 1996. Genetic data analysis II: methods for discrete population genetic data.
Sinauer Associates, Sunderland, Massachusetts.
Weir BS, Cockerham CC. 1984. Estimating F-Statistics for the Analysis of Population
Structure. Evolution (N Y) 38: 1358.
Chapter 1 31
Wilkinson S, Lu ZH, Megens H-J, Archibald AL, Haley C, Jackson IJ, Groenen MAM,
Crooijmans RPMA, Ogden R, Wiener P. 2013. Signatures of Diversifying Selection in
European Pig Breeds ed. P.M. Visscher. PLoS Genet 9: e1003453.
Womack JE. 2005. Advances in livestock genomics: opening the barn door. Genome Res 15:
1699–705.
Wright S. 1950. Genetical structure of populations. Nature 166: 247–249.

CHAPTER 2
The Minipig Genome Harbors Regions of Selection for Growth
C. Reimer1, C.-J. Rubin
2, S. Weigend
3, K.-H. Waldmann
4, O. Distl
4 and H.
Simianer1.
1Georg-August-University, Göttingen, Germany
2Uppsala University, Sweden
3Institute of Farm Animal Genetics of the Friedrich-Loeffler-Institut, Neustadt-Mariensee,
Germany
4University of Veterinary Medicine, Hannover, Germany
Published in:
Proceedings of the 10th
World Congress of Genetics Applied to Livestock Production.

34 Chapter 2
Abstract
The whole genome resequencing (WGS) data of 46 normal sized pigs, either domestic or
wild, was compared to WGS from 11 Göttingen Minipigs, 2 Berlin Minipigs, 2 Xiang pigs
and one DNA pool comprising 10 Berlin Minipigs. Expected heterozygosity in the minipigs
and fixation between both groups where used as a measure to find selective sweeps
introduced during the selection for low body size in the minipig. 166 such candidate regions
were defined and further annotated. Gene Ontology overrepresentation analysis revealed
significant enrichment of terms related to growth. A large set of contained genes has been
found, which have influence on i.e. growth and bone development. TGFβ and plenty of its
altering genes were identified.
Keywords: minipig, sequencing, growth
Introduction
The Göttingen Minipig (GMP) is one of the smallest pig breeds in the world. It was bred at
the University of Göttingen, Germany, in the 1960´s to fulfill the rising needs for laboratory
animals (Simianer and Köhn 2010). The Vietnamese Potbellied Pig, the Minnesota Minipig
and the German Landrace were used as founder breeds. Intense selection led to a white-coated
animal with less than 45 kg at an age of two years. This constitution makes it a promising
candidate to reveal the genetic basis of growth and body size when compared to normal sized
pig breeds.
A previous study (Gaerke et al. 2014) using 60 k SNP data revealed that alleles from all
founder breeds can still be found in the genome of the GMP, but the proportions deviated
significantly from the composition expected from the pedigree. Extreme differences between
expected and observed breed composition in some genomic regions can be attributed to
selection for low body weight and white skin color. These signatures of selection occur in
regions where genes with known relevance for growth (e.g. SOCS2, TXN, DDR2 and
GRB10) are located. Another finding was that information derived from the 60 k SNP
markers is not sufficient to make a reliable statement on the genetic background of small body
size in miniature pigs.
Next Generation Sequencing (NGS) technology provides the possibility to obtain whole
genome data from many individuals at a reasonable price. The porcine reference genome was
published in 2012 (Groenen et al. 2012) and first studies (Rubin et al. 2012) suggested that
whole genome resequencing is a viable approach to identify regions under anthropogenic
selection, since this method provides a much more comprehensive insight into genomic

Chapter 2 35
variability based on SNPs and other types of variation such as structural variants than do SNP
arrays. Even causal mutations have been derived from this data directly (Andersson et al.
2012; Imsland et al. 2012). However, minipigs have not been included in any of these studies
so far.
Materials and Methods
Public Data. From the European Nucleotide Archive (ENA) sequence data from 37 domestic
pigs, 11 wild boars from Asia and Europe, respectively, underlying the study of Rubin et al.
(2012) and a Göttingen Minipig (Vamathevan et al. 2013) were downloaded.
Minipig Sampling. Blood samples were obtained from 10 individuals from the University
owned stock and 2 individuals from the Berlin Minipig housed at the University of Veterinary
Medicine, Hannover. A DNA pool from 10 Berlin Minipigs was added. All samples were
sequenced with 10X coverage on the NGS-Platform at Uppsala University.
Basic Data Preparation. Raw sequence data was aligned to the Sus Scrofa 10.2 reference
genome (Groenen et al. 2012) using BWA (Li and Durbin 2009), were sorted by Samtools (Li
et al. 2009) and duplicates were marked with Picard tools (Picard 2009). Finally SNPs were
called using the GATK (DePristo et al. 2011; McKenna et al. 2010).
Filtering. First indels and non biallelic SNV were discarded. In the second step SNP sets
were filtered to remove unreliable SNP calls. Therefore SNPs in clusters with >5 SNPs in 20
basepairs, with BaseQualityRankSum <-5.5 or >5.5, MappingQualityRankSum <-11 or >11,
ReadPosRankSum <-6, FisherStrand values >45, a Mapping Quality <30, and a Depth of
Coverage <90X or >840X were discarded. To pass subsequent genotype filtering an
individual needed a genotyping quality >20 and a pool needed a coverage >4 reads at this
position.
In silico pooling. To avoid an over-influence of highly represented breeds, animals of these
breeds were pooled. For each locus, the mean reference allele frequency was calculated, and
only loci with at least a 50% genotyping rate were included. Afterwards, two contrasting
groups (minipig vs. normal sized pigs) were formed. The in-silico pooled minipig group
contained the information of 11 Göttingen Minipigs, 2 Berlin Minipigs, the Berlin Minipig
pool and two Xiang pigs from China, which turned out to actually be minipigs (Zhang et al.
2005)
36 Chapter 2
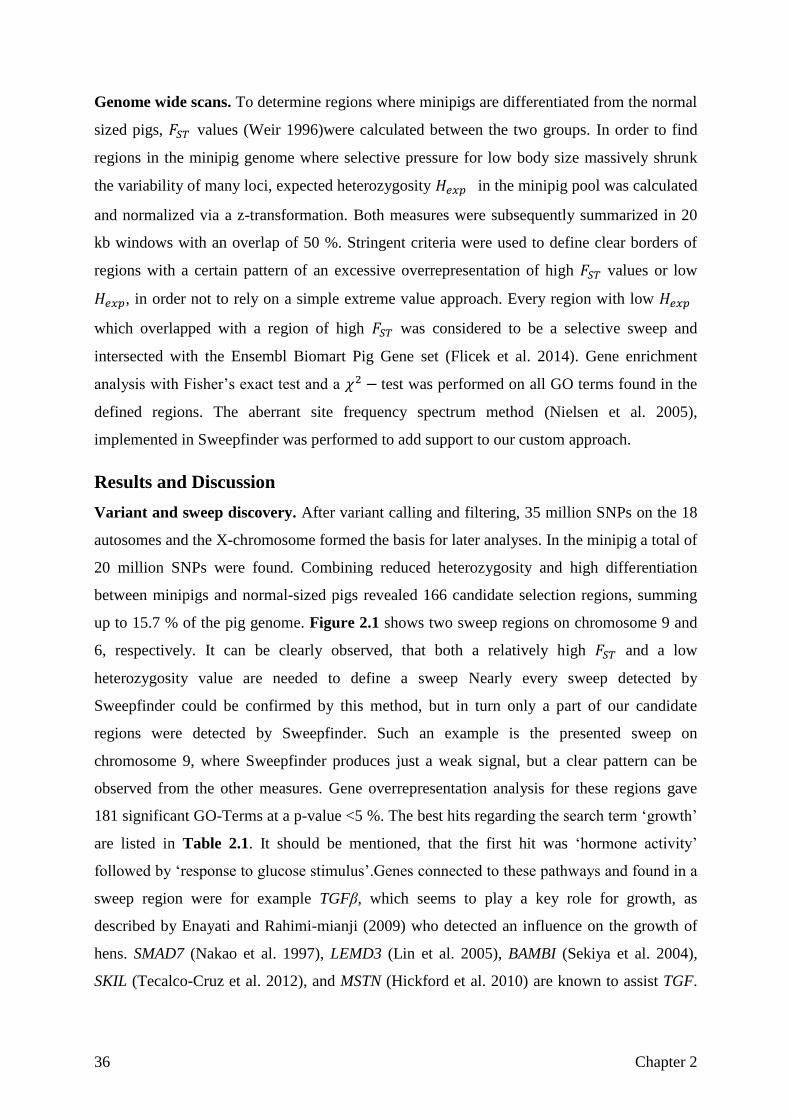
Genome wide scans. To determine regions where minipigs are differentiated from the normal
sized pigs, 𝐹𝑆𝑇 values (Weir 1996)were calculated between the two groups. In order to find
regions in the minipig genome where selective pressure for low body size massively shrunk
the variability of many loci, expected heterozygosity 𝐻𝑒𝑥𝑝 in the minipig pool was calculated
and normalized via a z-transformation. Both measures were subsequently summarized in 20
kb windows with an overlap of 50 %. Stringent criteria were used to define clear borders of
regions with a certain pattern of an excessive overrepresentation of high 𝐹𝑆𝑇 values or low
𝐻𝑒𝑥𝑝, in order not to rely on a simple extreme value approach. Every region with low 𝐻𝑒𝑥𝑝
which overlapped with a region of high 𝐹𝑆𝑇 was considered to be a selective sweep and
intersected with the Ensembl Biomart Pig Gene set (Flicek et al. 2014). Gene enrichment
analysis with Fisher’s exact test and a 𝜒2 − test was performed on all GO terms found in the
defined regions. The aberrant site frequency spectrum method (Nielsen et al. 2005),
implemented in Sweepfinder was performed to add support to our custom approach.
Results and Discussion
Variant and sweep discovery. After variant calling and filtering, 35 million SNPs on the 18
autosomes and the X-chromosome formed the basis for later analyses. In the minipig a total of
20 million SNPs were found. Combining reduced heterozygosity and high differentiation
between minipigs and normal-sized pigs revealed 166 candidate selection regions, summing
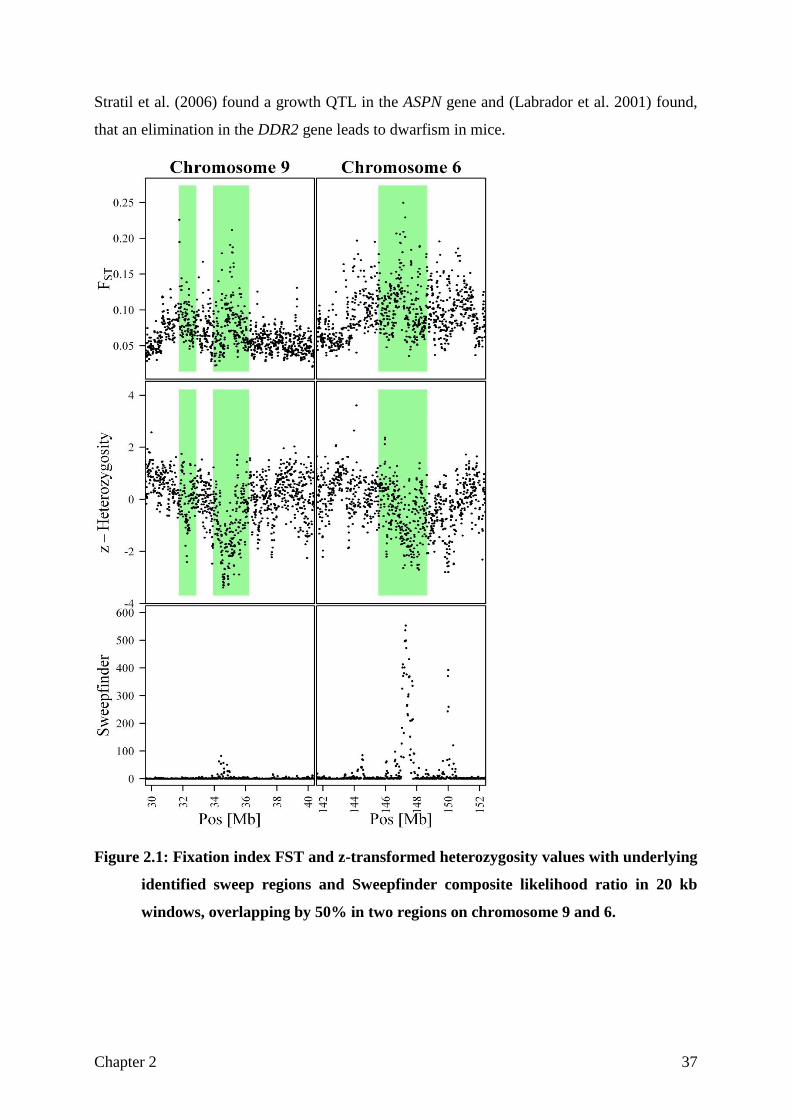
up to 15.7 % of the pig genome. Figure 2.1 shows two sweep regions on chromosome 9 and
6, respectively. It can be clearly observed, that both a relatively high 𝐹𝑆𝑇 and a low
heterozygosity value are needed to define a sweep Nearly every sweep detected by
Sweepfinder could be confirmed by this method, but in turn only a part of our candidate
regions were detected by Sweepfinder. Such an example is the presented sweep on
chromosome 9, where Sweepfinder produces just a weak signal, but a clear pattern can be
observed from the other measures. Gene overrepresentation analysis for these regions gave
181 significant GO-Terms at a p-value <5 %. The best hits regarding the search term ‘growth’
are listed in Table 2.1. It should be mentioned, that the first hit was ‘hormone activity’
followed by ‘response to glucose stimulus’.Genes connected to these pathways and found in a
sweep region were for example TGFβ, which seems to play a key role for growth, as
described by Enayati and Rahimi-mianji (2009) who detected an influence on the growth of
hens. SMAD7 (Nakao et al. 1997), LEMD3 (Lin et al. 2005), BAMBI (Sekiya et al. 2004),
SKIL (Tecalco-Cruz et al. 2012), and MSTN (Hickford et al. 2010) are known to assist TGF.
Chapter 2 37
Stratil et al. (2006) found a growth QTL in the ASPN gene and (Labrador et al. 2001) found,
that an elimination in the DDR2 gene leads to dwarfism in mice.
Figure 2.1: Fixation index FST and z-transformed heterozygosity values with underlying
identified sweep regions and Sweepfinder composite likelihood ratio in 20 kb
windows, overlapping by 50% in two regions on chromosome 9 and 6.

38 Chapter 2
Table 2.1: Growth linked GO terms.
GO P GO Description
0071363 0.018 cellular response to growth factor stimulus
0001832 0.027 blastocyst growth
0035264 0.053 multicellular organism growth
0003416 0.072 endochondral bone growth
0036120 0.072 cellular response to platelet-derived growth factor stimulus
0045927 0.072 positive regulation of growth
0008083 0.079 growth factor activity
0030512 0.087 negative regulation of transforming growth factor beta receptor signaling
pathway
GO: Biomart GO-Term accession, P: Fisher´s exact test p-value
Conclusion
By using variation data from whole genome resequencing even narrow sweep regions can be
detected, just by the right combination of simple measures. The contrast of several normal
sized and several minipig breeds increased the chance of finding differentiation associated
with growth and size only. Annotation with Ensembl Genes and enrichment analysis revealed
a sensible set of genes related to growth. TGFβ and Genes which are known to have influence
on it seem to play an important role in the search for the genetic basis of low body size in
pigs.
Acknowledgement
The computation was done on the servercluster of the Uppsala Multidisciplinary Center for
Advanced Computational Science (UPPMAX) provided by SNIC under project number
p2010044.
We would like to thank Ellegaard Göttingen Minipigs A/S for the financial support of our
minipig projects.
We appreciate the funding by the European Science Foundation within the framework
„Advances in Farm Animal Genomics“ and by the DAAD U4 network for the stay in
Uppsala.

Chapter 2 39
References
Andersson LS, Larhammar M, Memic F, Wootz H, Schwochow D, Rubin C-J, Patra K,
Arnason T, Wellbring L, Hjälm G, et al. 2012. Mutations in DMRT3 affect locomotion
in horses and spinal circuit function in mice. Nature 488: 642–6.
DePristo MA, Banks E, Poplin R, Garimella K V, Maguire JR, Hartl C, Philippakis AA, del
Angel G, Rivas MA, Hanna M, et al. 2011. A framework for variation discovery and
genotyping using next-generation DNA sequencing data. Nat Genet 43: 491–8.
Enayati B, Rahimi-mianji G. 2009. Genomic growth hormone , growth hormone receptor and
transforming growth factor β -3 gene polymorphism in breeder hens of Mazandaran
native fowls. African J Biotechnol 8: 3154–3159.
Flicek P, Amode MR, Barrell D, Beal K, Billis K, Brent S, Carvalho-Silva D, Clapham P,
Coates G, Fitzgerald S, et al. 2014. Ensembl 2014. Nucleic Acids Res 42: D749–D755.
Gaerke C, Ytournel F, Sharifi a. R, Pimentel ECG, Ludwig A, Simianer H. 2014. Footprints
of recent selection and variability in breed composition in the Göttingen Minipig
genome. Anim Genet 381–391.
Groenen MAM, Archibald AL, Uenishi H, Tuggle CK, Takeuchi Y, Rothschild MF, Rogel-
gaillard C, Park C, Megens H, Li S, et al. 2012. Analyses of pig genomes provide
insight into porcine demography and evolution. Nature 491: 393–398.
Hickford JGH, Forrest RH, Zhou H, Fang Q, Han J, Frampton CM, Horrell AL. 2010.
Polymorphisms in the ovine myostatin gene (MSTN) and their association with growth
and carcass traits in New Zealand Romney sheep. Anim Genet 41: 64–72.
Imsland F, Feng C, Boije H, Bed’hom B, Fillon V, Dorshorst B, Rubin C-J, Liu R, Gao Y, Gu
X, et al. 2012. The Rose-comb mutation in chickens constitutes a structural
rearrangement causing both altered comb morphology and defective sperm motility.
PLoS Genet 8: e1002775.
Labrador JP, Azcoitia V, Tuckermann J, Lin C, Olaso E, Mães S, Brückner K, Goergen JL,
Lemke G, Yancopoulos G, et al. 2001. The collagen receptor DDR2 regulates
proliferation and its elimination leads to dwarfism. EMBO Rep 2: 446–452.
Li H, Durbin R. 2009. Fast and accurate short read alignment with Burrows-Wheeler
transform. Bioinformatics 25: 1754–60.
40 Chapter 2
Li H, Handsaker B, Wysoker A, Fennell T, Ruan J, Homer N, Marth G, Abecasis G, Durbin
R. 2009. The Sequence Alignment/Map format and SAMtools. Bioinformatics 25:
2078–9.
Lin F, Morrison JM, Wu W, Worman HJ. 2005. MAN1, an integral protein of the inner
nuclear membrane, binds Smad2 and Smad3 and antagonizes transforming growth
factor-β signaling. Hum Mol Genet 14: 437–445.
McKenna A, Hanna M, Banks E, Sivachenko A, Cibulskis K, Kernytsky A, Garimella K,
Altshuler D, Gabriel S, Daly M, et al. 2010. The Genome Analysis Toolkit: a
MapReduce framework for analyzing next-generation DNA sequencing data. Genome
Res 20: 1297–303.
Nakao A, Afrakhte M, Morén A, Nakayama T, Christian JL, Heuchel R, Itoh S, Kawabata M,
Heldin N-E, Heldin C-H, et al. 1997. Identification of Smad7, a TGFbeta-inducible
antagonist of TGF-beta signalling. Nature 389: 631–635.
Nielsen R, Williamson S, Kim Y, Hubisz MJ, Clark AG, Bustamante C. 2005. Genomic scans
for selective sweeps using SNP data. Genome Res 15: 1566–1575.
Picard. 2009. http://picard.sourceforge.net/. Accessed 2013-07-26.
Rubin C-J, Megens HJ, Martinez Barrio A, Maqbool K, Sayyab S, Schwochow D, Wang C,
Carlborg O, Jern P, Jorgensen CB, et al. 2012. Strong signatures of selection in the
domestic pig genome. Proc Natl Acad Sci U S A 109: 19529–19536.
Sekiya T, Adachi S, Kohu K, Yamada T, Higuchi O, Furukawa Y, Nakamura Y, Nakamura T,
Tashiro K, Kuhara S, et al. 2004. Identification of BMP and Activin Membrane-bound
Inhibitor (BAMBI), an Inhibitor of Transforming Growth Factor-β Signaling, as a
Target of the β-Catenin Pathway in Colorectal Tumor Cells. J Biol Chem 279: 6840–
6846.
Simianer H, Köhn F. 2010. Genetic management of the Göttingen Minipig population. J
Pharmacol Toxicol Methods 62: 221–6.
Stratil A, Van Poucke M, Bartenschlager H, Knoll A, Yerle M, Peelman LJ, Kopečný M,
Geldermann H. 2006. Porcine OGN and ASPN: Mapping, polymorphisms and use for
quantitative trait loci identification for growth and carcass traits in a Meishan x Piétrain
intercross. Anim Genet 37: 415–418.

Chapter 2 41
Tecalco-Cruz AC, Sosa-Garrocho M, Vázquez-Victorio G, Ortiz-García L, Domínguez-
Hüttinger E, Macías-Silva M. 2012. Transforming growth factor-β/SMAD target gene
SKIL is negatively regulated by the transcriptional cofactor complex SNON-SMAD4. J
Biol Chem 287: 26764–26776.
Vamathevan JJ, Hall MD, Hasan S, Woollard PM, Xu M, Yang Y, Li X, Wang X, Kenny S,
Brown JR, et al. 2013. Minipig and beagle animal model genomes aid species selection
in pharmaceutical discovery and development. Toxicol Appl Pharmacol 270: 149–157.
Weir BS. 1996. Genetic data analysis II: methods for discrete population genetic data. Sinauer
Associates, Sunderland, Massachusetts.
Zhang Y, Zhang Y-Y, Zeng Q, Zhang Q. 2005. Determination of growth and development
and reproduction traits of Jianbai Xiang Pigs. J Mt Agric Biol 24: 497–500.


CHAPTER 3
Analysis of porcine body size variation using re-sequencing data of
miniature and large pigs
1C. Reimer,
2C.-J. Rubin,
1A.R. Sharifi,
1N.-T. Ha,
3S. Weigend,
4K.-H.
Waldmann, 5O. Distl,
6S. D. Pant,
7M. Fredholm,
8M. Schlather,
1H. Simianer
1Center for Integrated Breeding Research, Animal Breeding and Genetics Group, Department
of Animal Sciences, University of Goettingen, Albrecht-Thaer-Weg 3, 37017 Goettingen,
Germany
2Science for Life Laboratory, Department of Medical Biochemistry and Microbiology,
Uppsala University, Uppsala Biomedicinska centrum BMC, Husargatan 3, 75237 Uppsala,
Sweden
3Institute of Farm Animal Genetics of the Friedrich-Loeffler-Institut, Höltystraße 10, 31535
Neustadt-Mariensee, Germany
4Clinic for Swine, Small Ruminants, Forensic Medicine and Ambulatory Service, University
of Veterinary Medicine – Foundation, Bischofsholer Damm 15, 30173 Hannover, Germany
5Institute of Animal Breeding and Genetics, University of Veterinary Medicine - Foundation,
Bünteweg 17p, 30559 Hannover, Germany
6Graham Centre for Agricultural Innovation, School of Animal & Veterinary Sciences,
Charles Sturt University, Locked Bag 588, Boorooma St. Wagga Wagga, NSW, Australia
7Section of Animal Genetics, Bioinformatics, and Breeding, Department of Veterinary- and
Animal Sciences, University of Copenhagen, Grønnegårdsvej 3, 1870 Frederiksberg C,
Denmark
8School of Business Informatics and Mathematics, University of Mannheim, A5 6, 68131
Under review in BMC Genomics
44 Chapter 3
Abstract
Background: Domestication has led to substantial phenotypic and genetic variation in
domestic animals. In pigs, the size of so called minipigs differs by one order of magnitude
compared to breeds of normally sized pigs. We used biallelic SNPs identified from re-
sequencing data to compare various publicly available wild and domestic populations against
two minipig breeds to gain better understanding of the genetic background of the extensive
body size variation. We combined two complementary measures, expected heterozygosity and
the composite likelihood ratio test implemented in “SweepFinder”, to identify signatures of
selection in Minipigs. We intersected these sweep regions with a measure of differentiation,
namely 𝐹𝑆𝑇, to remove regions of low variation across pigs. An extraordinary large sweep
between 52 and 61 Mb on chromosome X was separately analyzed based on SNP-array data
of F2 individuals from a cross of Goettingen Minipigs and large pigs.
Results: Selective sweep analysis identified putative sweep regions for growth and
subsequent gene annotation provided a comprehensive set of putative candidate genes,
including MAPK1 and PPARG. A long swept haplotype on chromosome X, descending from
the Goettingen Minipig founders was associated with a reduction of adult body length by 3 %
in F2 cross-breds.
Conclusion: The resulting set of genes in putative sweep regions implies that the genetic
background of body size variation in pigs is polygenic rather than mono- or oligogenic.
Identified genes suggest involvement of the MAPK pathway and a possible insulin resistance
to play a key role in miniaturization. A size QTL located within the sweep on chromosome X
is, with an estimated effect of 3 % on body length, comparable to the largest known in pigs or
other species. The androgen receptor AR, previously known to influence pig performance and
carcass traits, is the most obvious potential candidate gene within this region.
Keywords: Goettingen Minipig, whole genome resequencing, body size, X -
chromosomal QTL
Background
The livestock species of today display vast phenotypic variation. Domestication has shaped
these species by increasing the variation in traits related to, performance, fitness, morphology
and appearance, thereby changing the - phenotypically rather uniform - wild ancestors to the
illustrious collection of our modern breeds. Focusing on body size, Haldane (1927) discussed
a general principle why the horse is larger than the rabbit, or the cow is larger than the pig,

Chapter 3 45
and suggested that there must be a right size for a certain form of a body and a change in size
must be accompanied with a change in form. In contradiction to that, we see a wide range of
body size or weight in just one species. Taking the example of pigs (Sus scrofa), the process
of domestication of the wild boar led to animals that span from large fattening pigs to the so
called ‘miniature pigs’ or simplified ‘minipigs’. Their sizes differ by up to one order of
magnitude. Among the minipigs the Goettingen Minipig (GMP) is one of the smallest breeds
under a stringent breeding scheme (Simianer and Köhn 2010; Swindle et al. 2012). The
Goettingen Minipig is a composite breed developed in the 1960’s at the former Institute of
Animal Breeding and Genetics at the Georg-August-University Göttingen in Germany. It was
founded by crossing Minnesota Minipigs (MMP) with Vietnamese Potbellied Pigs (VPP).
Later German Landrace pigs (LAR) were introduced to produce uniformly white animals
(Glodek and Oldigs 1981). This pig breed shows a form of miniaturization called
“proportional dwarfism” and Simianer and Köhn (2010) suggested that this is a form of
pituitary dwarfism, caused by lower secretion of growth hormones from the pituitary gland,
leading to a decreased secretion of the insulin-like growth factor 1 (IGF1).
The availability of porcine SNP chips offers the possibility to screen the genome for regions
carrying genetic variants associated with the reduced size of minipigs. Gaerke et al. (2014)
conducted a study on signatures of selection in GMP, MMP, VPP and LAR, using a 60k SNP
chip. They found that alleles from all founder breeds were still segregating in the GMP and
identified numerous putatively positively selected regions in the GMP. They suggested that a
pathway connecting SOCS2 and GRB10 with IGF1 could exist that plays an important role in
the dwarfism of the GMP. Due to the limited marker density of the SNP array it was not
possible to reveal causal mutations.
The current reference genome is based on the sequence of a Duroc pig and the first studies,
using this reference to provide insight into the porcine demography and evolution (Groenen et
al. 2012) and into the patterns that domestication and anthropogenic selection have left in the
porcine genome (Rubin et al. 2012), were published in 2012. While these studies used diverse
sets of pig breeds from all over the world, minipigs were not included. The very same month,
the genome of a highly inbred Chinese Wuzhishan minipig was published (Fang et al. 2012)
as an additional reference genome for Asian pigs, which have been domesticated
independently from the European pigs (Giuffra et al. 2000). The present study aims at
comparing WGS data of a diverse set of pig breeds to unveil the genetic mechanisms behind
body size variation, and more specifically the miniaturization in pigs. Towards this aim, we

46 Chapter 3
compared a group of miniature pig breeds to a group of large pig breeds by screening for
highly differentiated regions under selection in the minipigs. Such candidate regions were
subsequently screened for candidate genes with a putative effect on growth or body size, and
the postulated effects on body-size of one of the identified candidate region was confirmed
with data of an independent crossbreeding experiment.
Results
Number of SNPs
Biallelic SNPs are the most common class of variants used in genetic studies of animal
genomes. Due to the explorative nature of SNP calling from WGS data, the number of SNPs
is an indicator of variability in the analysed dataset, but also of strictness of the variant
discovery and filtering. SNP calling from the DNA sequencing data revealed 46 × 106
biallelic SNPs genome-wide, of which 29 × 106 were polymorphic or fixed for the alternative
allele in the minipigs. After filtering, 35 × 106 loci remained for all samples and 19.8 × 10
6 for
the minipigs, respectively, 19 × 106 in the European domestics, 9.4 × 10
6 in the European wild
boars, 19.5 × 10⁶ in the Asian domestics and 19.2 × 10
6 in the Asian wild boars. Subsequent
in-silico pooling left 27.6 × 10⁶ loci with sufficient information to compare minipigs against
large pigs.
Phylogeny
When comparing large pig breeds to minipigs, it is important to account for stratification
within each contrasting group to ensure, that no breed specific signals will be identified.
Therefore each group should be made up from phylogenetically different breeds, which in an
optimal case share just the small or large body size, respectively. The analysis of genetic
distances between sampled breeds revealed a clear division of European and Asian large pigs,
with minipigs clustering closer to the Asian pigs (Figure 3.1). Estimation of 𝐹𝑆𝑇 also showed
that the minipigs were closer to the Asian breeds than to the European breeds (𝐹𝑆𝑇 = 0.08 and
0.12, respectively), while both minipig breeds were marginally closer to the domestic groups
of both continents than to the respective wild boars. This effect is smaller for the GMP (GMP
to European domestic/ wild: 0.14, 0.16; GMP to Asian domestic/ wild: 0.10, 0.11), whereas
there is clear distinction for the BMP, which is much closer to both domestic groups than to
the wild boars (BMP to European domestic/ wild: 0.07, 0.14; BMP to Asian domestic/ wild:
0.08, 0.11). The 𝐹𝑆𝑇 value between both minipig groups is 0.09. The highest differentiation
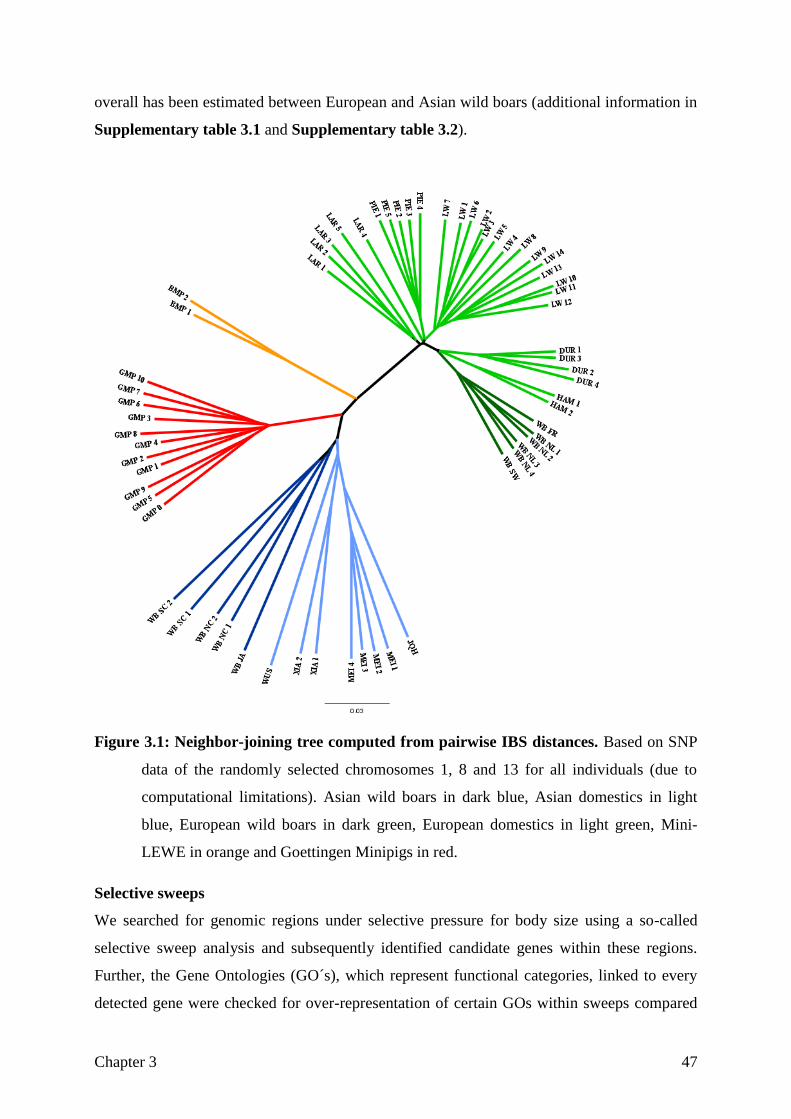
Chapter 3 47
overall has been estimated between European and Asian wild boars (additional information in
Supplementary table 3.1 and Supplementary table 3.2).
Figure 3.1: Neighbor-joining tree computed from pairwise IBS distances. Based on SNP
data of the randomly selected chromosomes 1, 8 and 13 for all individuals (due to
computational limitations). Asian wild boars in dark blue, Asian domestics in light
blue, European wild boars in dark green, European domestics in light green, Mini-
LEWE in orange and Goettingen Minipigs in red.
Selective sweeps
We searched for genomic regions under selective pressure for body size using a so-called
selective sweep analysis and subsequently identified candidate genes within these regions.
Further, the Gene Ontologies (GO´s), which represent functional categories, linked to every
detected gene were checked for over-representation of certain GOs within sweeps compared
48 Chapter 3
to the unselected background, to identify functional categories rather than single candidates.
The selective sweep analysis revealed considerable parts of the genome as putatively being
targeted by selection for growth. Not every chromosome was affected equally. Most of the 49
identified signals extended between 1 Mb and 2.5 Mb, but one on chromosome 14 reached
nearly 10 Mb. The other large signals were located on chromosomes 5 (2.8 and 4.3 Mb), 8
(4.6 Mb), 13 (5.2 and 2.9 Mb), 14 (3.6 Mb) (Figure 3.2) and chromosome X (48 Mb; not
shown). SweepFinder detected fewer, but larger regions, whereas the regions detected by
decreased heterozygosity were more numerous but smaller. The exceptionally large region on
chromosome 14 consists of an accumulation of many small signals reflecting reduced
heterozygosity and two large signals from SweepFinder. The union of both signals gives a
nearly uninterrupted huge selective sweep signal.
Genes in Sweeps and their functions
The Ensembl porcine gene set 79 annotation within sweep regions on the autosomes revealed
524 genes (Supplementary table 3.3).
Gene ontology over-representation
In total, we analyzed 2006 unique GO terms linked with genes located in putative sweep
regions. 55 of these gene ontologies were found to be significantly overrepresented within
sweeps by using a Fisher´s exact test P-value lower than the 5 % quantile threshold of the
empirical distribution function for the respective ontology. Table 3.1 shows a selection of
gene ontologies over-represented in putative sweeps (see also Supplementary table 3.4).
A literature review for all genes belonging to statistically significant GO terms with a focus
on properties characterizing minipigs revealed a comprehensive set of genes with interesting
putative functions (Table 3.2). Among them are genes like COMT and PATZ1with direct
effects on growth or size in other organisms, ACOT4 and PKP2, which are involved in growth
factor signaling, or genes directly linked to growth in swine, for example PPARG that is
suspected to be a key factor in porcine growth, conformation and fatness. Additionally, we
found a considerable number of genes with links to the MAPK signaling cascade, e.g.
MAPK1 and PTPRR, involved in glucose and lipid metabolism, or putatively responsible for
insulin resistance or diabetes type II or obesity.
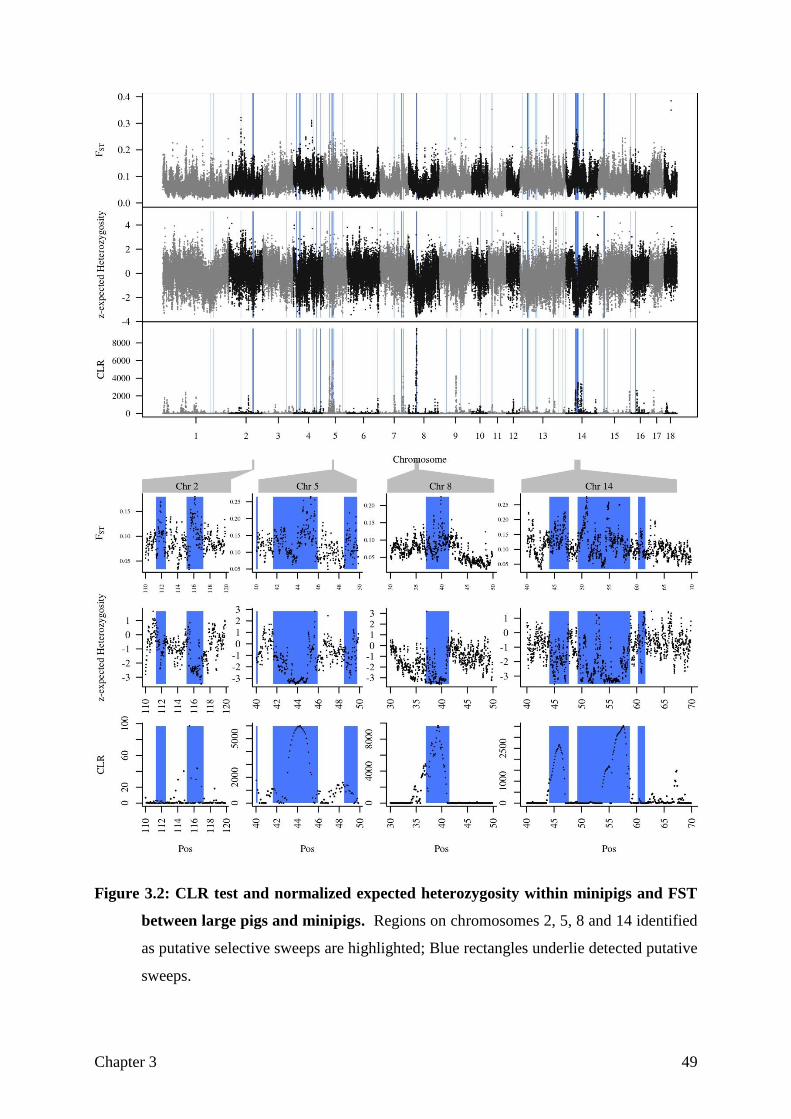
Chapter 3 49
Figure 3.2: CLR test and normalized expected heterozygosity within minipigs and FST
between large pigs and minipigs. Regions on chromosomes 2, 5, 8 and 14 identified
as putative selective sweeps are highlighted; Blue rectangles underlie detected putative
sweeps.
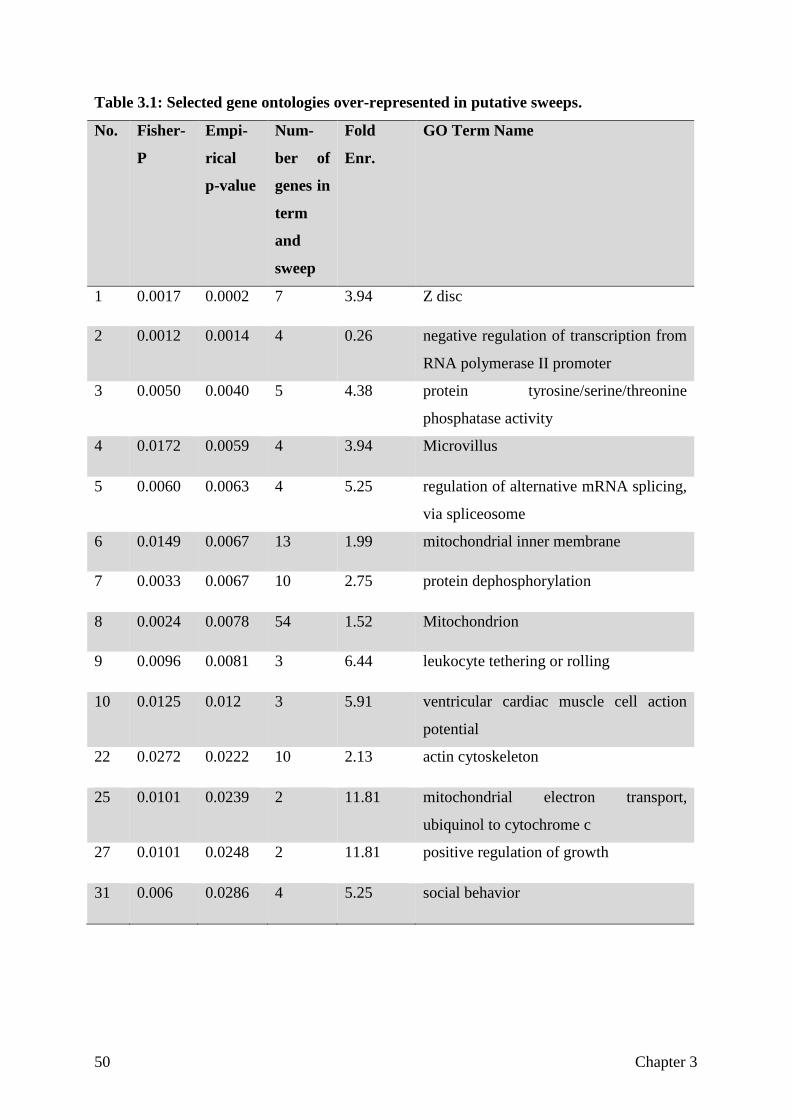
50 Chapter 3
Table 3.1: Selected gene ontologies over-represented in putative sweeps.
No. Fisher-
P
Empi-
rical
p-value
Num-
ber of
genes in
term
and
sweep
Fold
Enr.
GO Term Name
1 0.0017 0.0002 7 3.94 Z disc
2 0.0012 0.0014 4 0.26 negative regulation of transcription from
RNA polymerase II promoter
3 0.0050 0.0040 5 4.38 protein tyrosine/serine/threonine
phosphatase activity
4 0.0172 0.0059 4 3.94 Microvillus
5 0.0060
0.0063 4 5.25 regulation of alternative mRNA splicing,
via spliceosome
6 0.0149 0.0067 13 1.99 mitochondrial inner membrane
7 0.0033 0.0067 10 2.75 protein dephosphorylation
8 0.0024 0.0078 54 1.52 Mitochondrion
9 0.0096 0.0081 3 6.44 leukocyte tethering or rolling
10 0.0125 0.012 3 5.91 ventricular cardiac muscle cell action
potential
22 0.0272 0.0222 10 2.13 actin cytoskeleton
25 0.0101 0.0239 2 11.81 mitochondrial electron transport,
ubiquinol to cytochrome c
27 0.0101 0.0248 2 11.81 positive regulation of growth
31 0.006 0.0286 4 5.25 social behavior
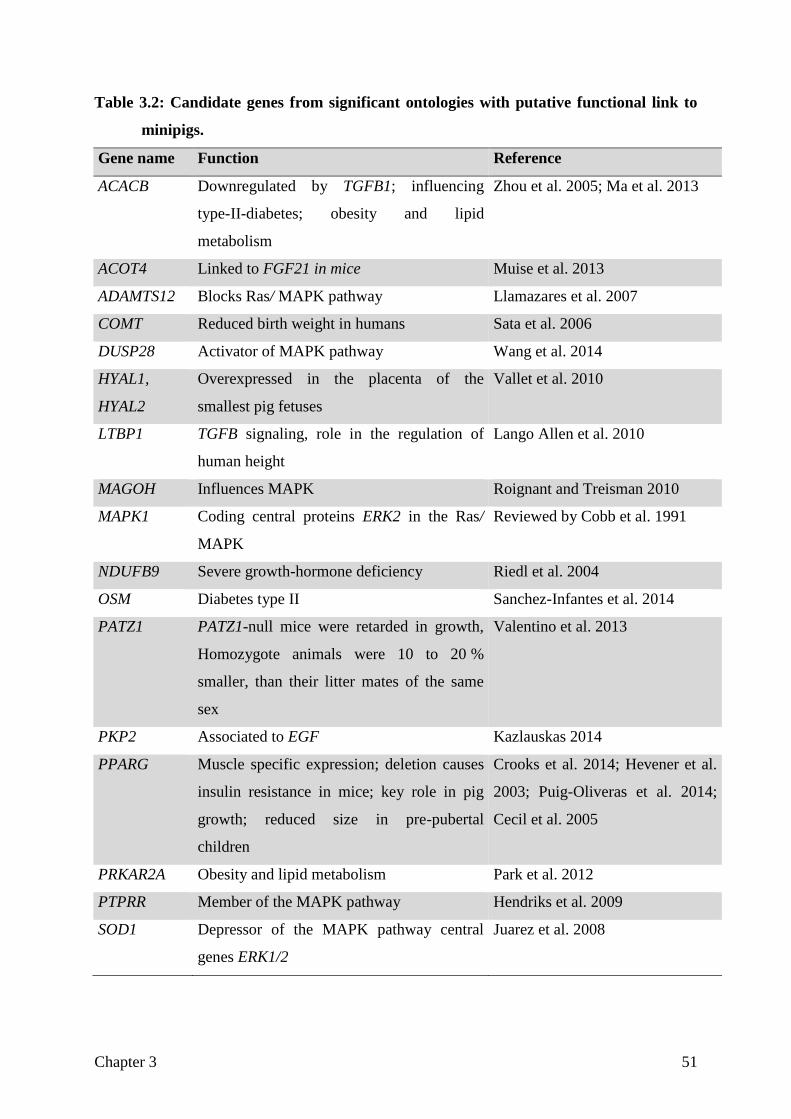
Chapter 3 51
Table 3.2: Candidate genes from significant ontologies with putative functional link to
minipigs.
Gene name Function Reference
ACACB Downregulated by TGFB1; influencing
type-II-diabetes; obesity and lipid
metabolism
Zhou et al. 2005; Ma et al. 2013
ACOT4 Linked to FGF21 in mice Muise et al. 2013
ADAMTS12 Blocks Ras/ MAPK pathway Llamazares et al. 2007
COMT Reduced birth weight in humans Sata et al. 2006
DUSP28 Activator of MAPK pathway Wang et al. 2014
HYAL1,
HYAL2
Overexpressed in the placenta of the
smallest pig fetuses
Vallet et al. 2010
LTBP1 TGFB signaling, role in the regulation of
human height
Lango Allen et al. 2010
MAGOH Influences MAPK Roignant and Treisman 2010
MAPK1 Coding central proteins ERK2 in the Ras/
MAPK
Reviewed by Cobb et al. 1991
NDUFB9 Severe growth-hormone deficiency Riedl et al. 2004
OSM Diabetes type II Sanchez-Infantes et al. 2014
PATZ1 PATZ1-null mice were retarded in growth,
Homozygote animals were 10 to 20 %
smaller, than their litter mates of the same
sex
Valentino et al. 2013
PKP2 Associated to EGF Kazlauskas 2014
PPARG Muscle specific expression; deletion causes
insulin resistance in mice; key role in pig
growth; reduced size in pre-pubertal
children
Crooks et al. 2014; Hevener et al.
2003; Puig-Oliveras et al. 2014;
Cecil et al. 2005
PRKAR2A Obesity and lipid metabolism Park et al. 2012
PTPRR Member of the MAPK pathway Hendriks et al. 2009
SOD1 Depressor of the MAPK pathway central
genes ERK1/2
Juarez et al. 2008

52 Chapter 3
Strong selective sweep on chromosome X
The major selective sweep on chr. X known from the studies of Rubin et al. (2012) and Ai et
al. (2015) is also found in the minipigs. It is known that this sweep consists of two majorly
un-recombining haplotypes of about 9 and 39 Mb, respectively. Figure 3.3A shows a
substantial decrease of the expected heterozygosity within the minipigs in a 48 Mb region in
the middle of chromosome X between 52 Mb and 100 Mb. The fixation index shows that this
region consists of two separate sub-regions. The first part, approximately inside the interval
52 Mb to 61 Mb, appears to be unique to the minipigs, whereas the moderate level of
differentiation in the second part implies that the minipigs are similar to some breeds of the
large pig group. We postulated that this genomic region might have an effect on body size and
therefore utilized data of a former cross-breeding experiment, to estimate QTL effects for
each existent haplotype.
The phylogenetic tree of all sequenced animals based on all markers inside the first region
(Figure 3.4) shows that the haplotype carried by the minipigs is shared with only the Xiang
pigs and two wild boars from South China. The sub-tree for the second region clusters the
samples into two main groups, the first comprising the minipigs, the Xiang, the Meishan, the
Jiangquhai and the South Chinese wild boars, and the second all European breeds and the
wild boars from North China and Japan.
Analysis of SNP chip data
Since the haplotype carried in the region chrX:52- 61 Mb appears to be typical for minipigs,
we used genotyping data from two former studies (Gaerke et al. 2014; Pant et al. 2015) to
determine the haplotypic state of animals with recorded phenotypes in order to enable the
estimation of the effect of the minipig haplotype on size. The Illumina PorcineSNP60
BeadChip contains 23 SNPs located on chromosome X between 52 and 61 Mb according to
the current map based on the genome build 10.2. Filtering removed 7 individuals for poor
genotyping (call rate < 10 %), 3 SNPs that were missing and 13 SNPs, which had a low minor
allele frequency. 8 SNPs (Supplementary table 3.5) passed the filtering, three of them in the
beginning of the region around 53 Mb (MARC0056564, MARC0046345, H3GA0051807),
three in the center around 57 Mb (INRA0056742, H3GA0051810, MARC0013223) and two
at the end around 60 Mb (INRA0056744, H3GA0051814). At the first three loci, all minipigs
carry a guanine, a cytosine and a guanine, respectively, but also two Duroc females from the
Danish study are heterozygous and convey this allele to the subsequent generations of cross-
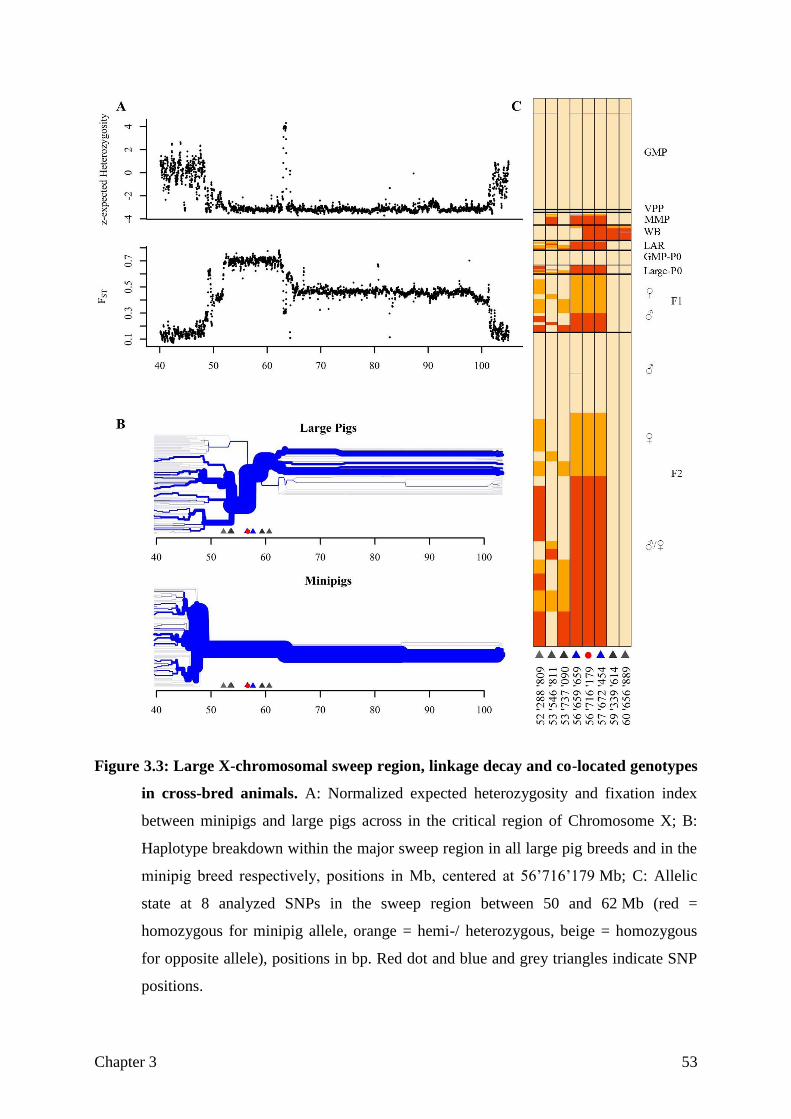
Chapter 3 53
Figure 3.3: Large X-chromosomal sweep region, linkage decay and co-located genotypes
in cross-bred animals. A: Normalized expected heterozygosity and fixation index
between minipigs and large pigs across in the critical region of Chromosome X; B:
Haplotype breakdown within the major sweep region in all large pig breeds and in the
minipig breed respectively, positions in Mb, centered at 56’716’179 Mb; C: Allelic
state at 8 analyzed SNPs in the sweep region between 50 and 62 Mb (red =
homozygous for minipig allele, orange = hemi-/ heterozygous, beige = homozygous
for opposite allele), positions in bp. Red dot and blue and grey triangles indicate SNP
positions.
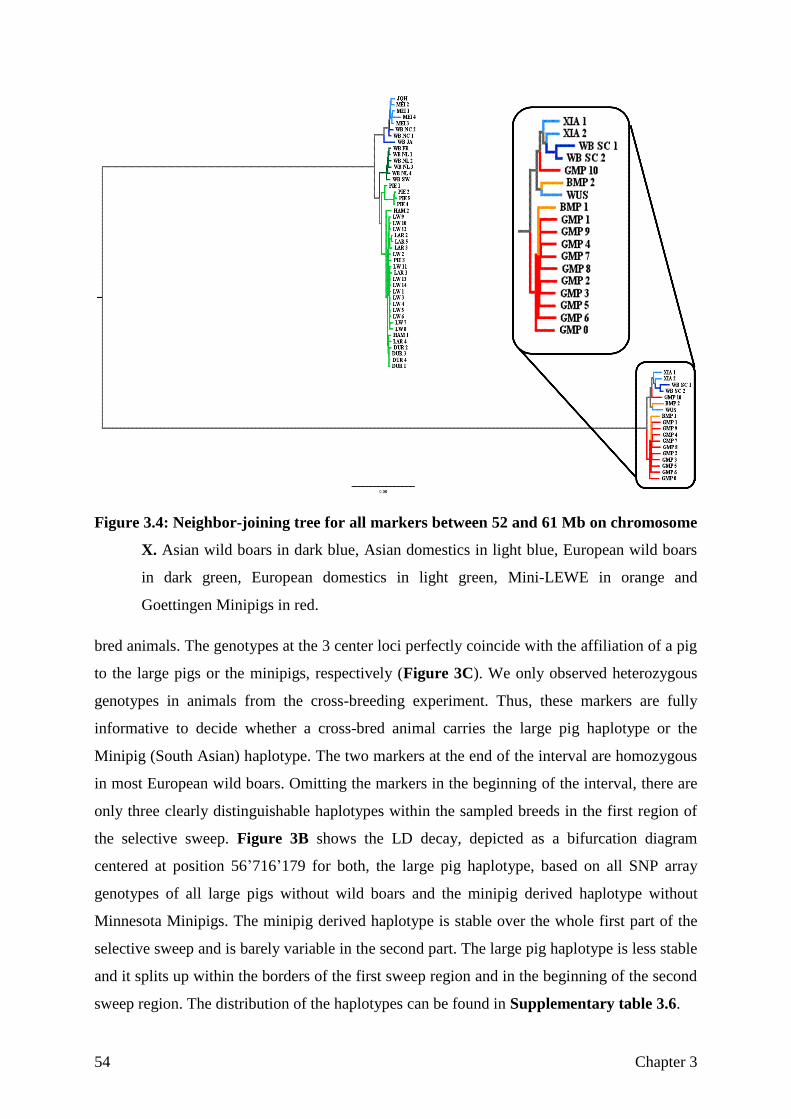
54 Chapter 3
Figure 3.4: Neighbor-joining tree for all markers between 52 and 61 Mb on chromosome
X. Asian wild boars in dark blue, Asian domestics in light blue, European wild boars
in dark green, European domestics in light green, Mini-LEWE in orange and
Goettingen Minipigs in red.
bred animals. The genotypes at the 3 center loci perfectly coincide with the affiliation of a pig
to the large pigs or the minipigs, respectively (Figure 3C). We only observed heterozygous
genotypes in animals from the cross-breeding experiment. Thus, these markers are fully
informative to decide whether a cross-bred animal carries the large pig haplotype or the
Minipig (South Asian) haplotype. The two markers at the end of the interval are homozygous
in most European wild boars. Omitting the markers in the beginning of the interval, there are
only three clearly distinguishable haplotypes within the sampled breeds in the first region of
the selective sweep. Figure 3B shows the LD decay, depicted as a bifurcation diagram
centered at position 56’716’179 for both, the large pig haplotype, based on all SNP array
genotypes of all large pigs without wild boars and the minipig derived haplotype without
Minnesota Minipigs. The minipig derived haplotype is stable over the whole first part of the
selective sweep and is barely variable in the second part. The large pig haplotype is less stable
and it splits up within the borders of the first sweep region and in the beginning of the second
sweep region. The distribution of the haplotypes can be found in Supplementary table 3.6.
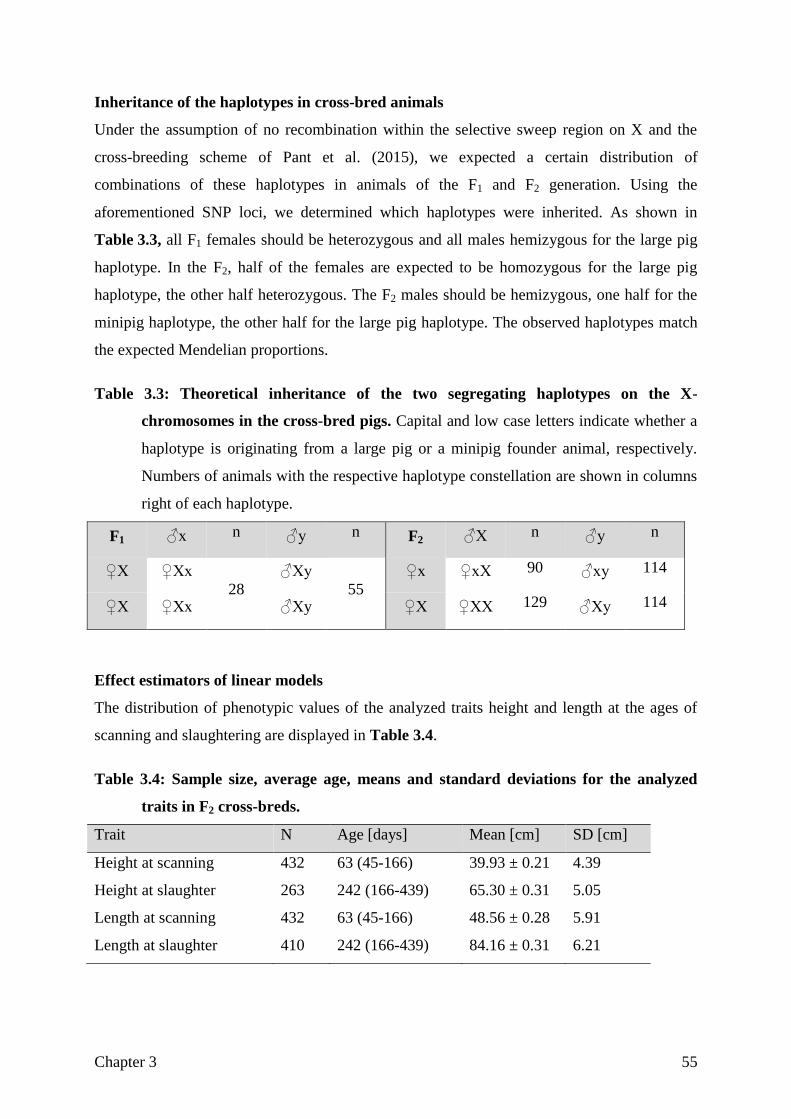
Chapter 3 55
Inheritance of the haplotypes in cross-bred animals
Under the assumption of no recombination within the selective sweep region on X and the
cross-breeding scheme of Pant et al. (2015), we expected a certain distribution of
combinations of these haplotypes in animals of the F1 and F2 generation. Using the
aforementioned SNP loci, we determined which haplotypes were inherited. As shown in
Table 3.3, all F1 females should be heterozygous and all males hemizygous for the large pig
haplotype. In the F2, half of the females are expected to be homozygous for the large pig
haplotype, the other half heterozygous. The F2 males should be hemizygous, one half for the
minipig haplotype, the other half for the large pig haplotype. The observed haplotypes match
the expected Mendelian proportions.
Table 3.3: Theoretical inheritance of the two segregating haplotypes on the X-
chromosomes in the cross-bred pigs. Capital and low case letters indicate whether a
haplotype is originating from a large pig or a minipig founder animal, respectively.
Numbers of animals with the respective haplotype constellation are shown in columns
right of each haplotype.
F1 ♂x n ♂y n F2 ♂X n ♂y n
♀X ♀Xx
28
♂Xy
55
♀x ♀xX 90 ♂xy 114
♀X ♀Xx ♂Xy ♀X ♀XX 129 ♂Xy 114
Effect estimators of linear models
The distribution of phenotypic values of the analyzed traits height and length at the ages of
scanning and slaughtering are displayed in Table 3.4.
Table 3.4: Sample size, average age, means and standard deviations for the analyzed
traits in F2 cross-breds.
Trait N Age [days] Mean [cm] SD [cm]
Height at scanning 432 63 (45-166) 39.93 ± 0.21 4.39
Height at slaughter 263 242 (166-439) 65.30 ± 0.31 5.05
Length at scanning 432 63 (45-166) 48.56 ± 0.28 5.91
Length at slaughter 410 242 (166-439) 84.16 ± 0.31 6.21
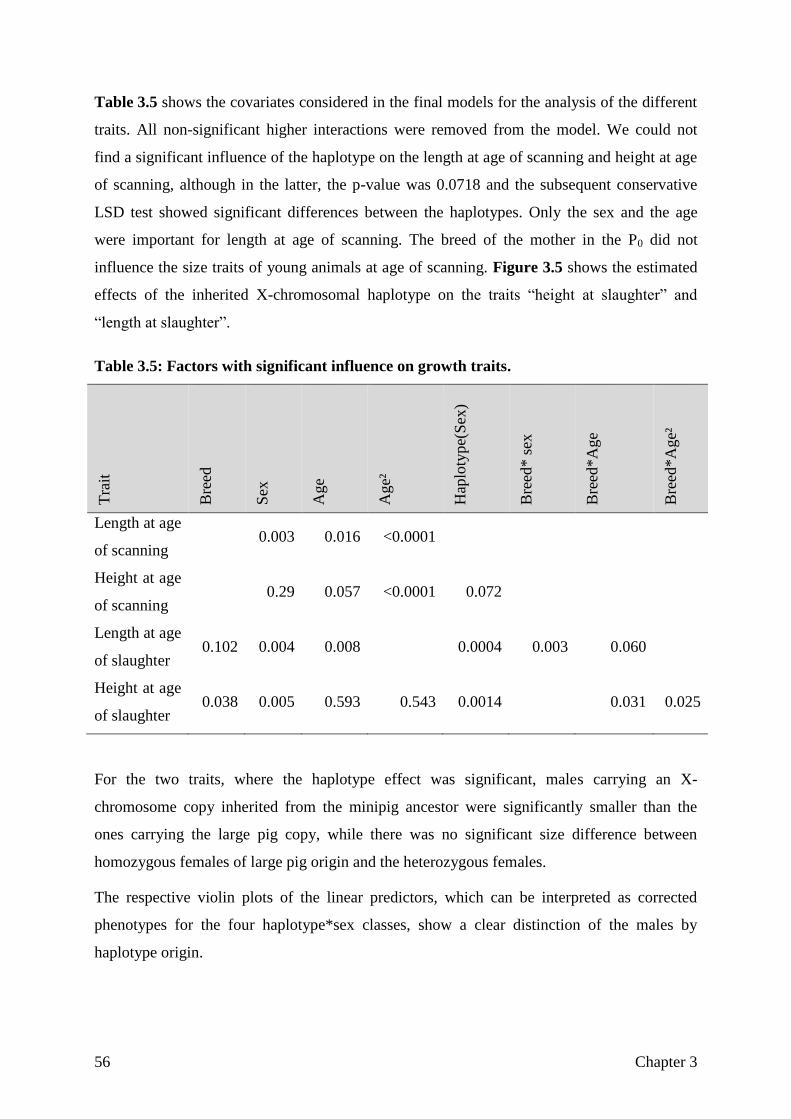
56 Chapter 3
Table 3.5 shows the covariates considered in the final models for the analysis of the different
traits. All non-significant higher interactions were removed from the model. We could not
find a significant influence of the haplotype on the length at age of scanning and height at age
of scanning, although in the latter, the p-value was 0.0718 and the subsequent conservative
LSD test showed significant differences between the haplotypes. Only the sex and the age
were important for length at age of scanning. The breed of the mother in the P0 did not
influence the size traits of young animals at age of scanning. Figure 3.5 shows the estimated
effects of the inherited X-chromosomal haplotype on the traits “height at slaughter” and
“length at slaughter”.
Table 3.5: Factors with significant influence on growth traits.
Tra
it
Bre
ed
Sex
Age
Age²
Hap
loty
pe(
Sex
)
Bre
ed* s
ex
Bre
ed*A
ge
Bre
ed*A
ge²
Length at age
of scanning 0.003 0.016 <0.0001
Height at age
of scanning 0.29 0.057 <0.0001 0.072
Length at age
of slaughter 0.102 0.004 0.008 0.0004 0.003 0.060
Height at age
of slaughter 0.038 0.005 0.593 0.543 0.0014 0.031 0.025
For the two traits, where the haplotype effect was significant, males carrying an X-
chromosome copy inherited from the minipig ancestor were significantly smaller than the
ones carrying the large pig copy, while there was no significant size difference between
homozygous females of large pig origin and the heterozygous females.
The respective violin plots of the linear predictors, which can be interpreted as corrected
phenotypes for the four haplotype*sex classes, show a clear distinction of the males by
haplotype origin.
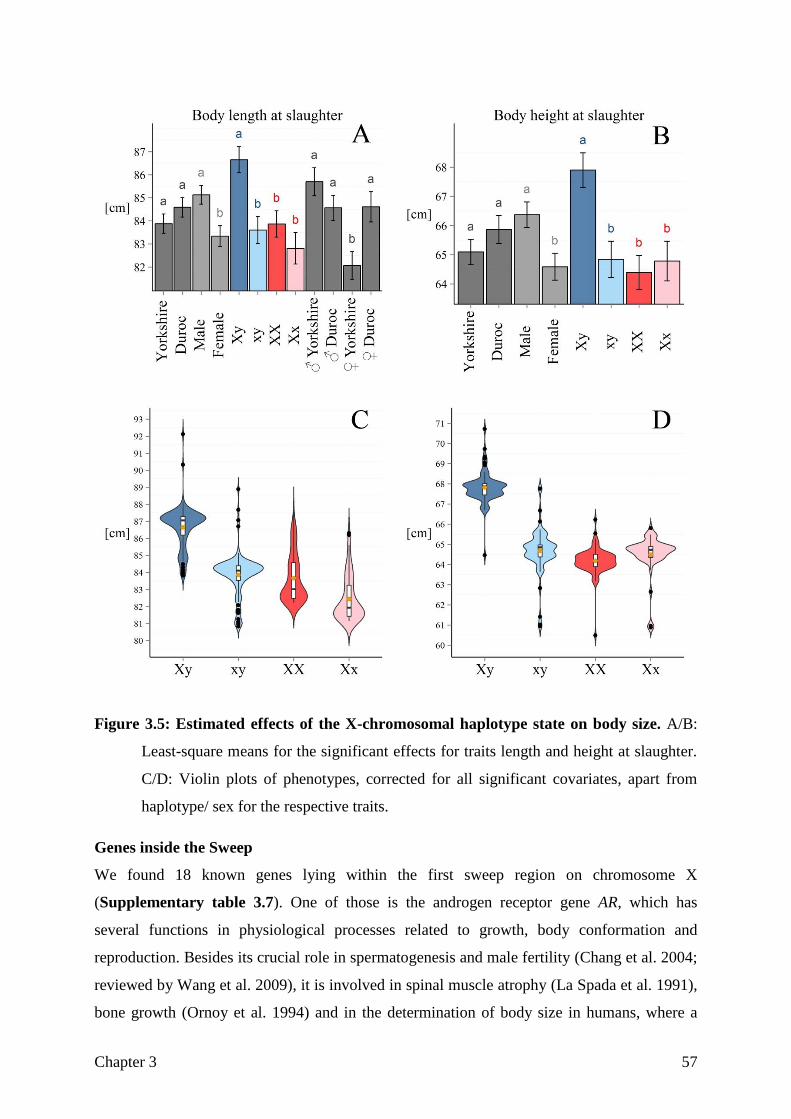
Chapter 3 57
Figure 3.5: Estimated effects of the X-chromosomal haplotype state on body size. A/B:
Least-square means for the significant effects for traits length and height at slaughter.
C/D: Violin plots of phenotypes, corrected for all significant covariates, apart from
haplotype/ sex for the respective traits.
Genes inside the Sweep
We found 18 known genes lying within the first sweep region on chromosome X
(Supplementary table 3.7). One of those is the androgen receptor gene AR, which has
several functions in physiological processes related to growth, body conformation and
reproduction. Besides its crucial role in spermatogenesis and male fertility (Chang et al. 2004;
reviewed by Wang et al. 2009), it is involved in spinal muscle atrophy (La Spada et al. 1991),
bone growth (Ornoy et al. 1994) and in the determination of body size in humans, where a
58 Chapter 3
mild supply of testosterone to boys of under-average size stimulated growth and sexual
development without compromising final height (Richman and Kirsch 1988). Mice with a
knock-out of the AR suffer a late onset of obesity while being normally sensitive to insulin
(Fan et al. 2005). Additionally AR is activated by the growth factors IGF, KGF and EGF in
tumors (Culig et al. 1994).
Discussion
This is the first study using whole genome resequencing to discover signatures of selection for
body size comparing minipigs against individual and pool data of various pig breeds. Direct
comparison of contrast, made up from various pig breeds each, mainly differentiated in body
size only, appeared as a powerful approach to determine the genetic background of growth
and size in minipigs. The high informational density of the next-generation-sequencing data
promised deeper insights as the array based approaches before.
SNP Calling
One of the often discussed issues for the quality of WGS studies is the quality of the
alignment and the depth at which samples have been sequenced. The proportion of aligned
reads to the current reference genome of a Duroc (Groenen et al. 2012) was roughly 90 % for
GMP and 87 % for BMP, similar to the proportion we find in European and Asian domestics
and confirms Frantz et al. (2013) findings when mapping the WGS data of Asian wild boars
(Sus verrucosus) against the Duroc reference . When the de novo assembled GMP genome
with a length of 2.44 Gb (Vamathevan et al. 2013) was mapped against the Duroc reference of
2.3 Gb, about 96 % could be placed on chromosomes. Therefore, using the Duroc reference
genome to evaluate minipig genomes appears appropriate, although there is an inherent risk of
missing out important parts of the genome.
The number of discovered SNPs in a genome depends on the sequence identity between the
reference genome and the examined samples, which is in turn dependent on the phylogenetic
distance, the variation inside the breeds and the number of individuals. Additionally, the
reliability of calling SNPs and determining genotypes from WGS data is also dependent on
the sequencing depth, where for example reliable calling of a homozygous (heterozygous)
SNP requires 15X (30X) coverage (Sims et al. 2014). From this point of view, the coverage of
all minipigs was sufficient for SNP detection, but proper genotype assignment could be
improved by resequencing at higher depth.
Chapter 3 59
Phylogeny
Analysis of the genetic distance and FST of the sequenced animals showed a clear
differentiation between European and Asian pig breeds. This result is in agreement with the
current scientific consensus, that domestication occurred independently in Europe and Asia
around 9000 years ago (Giuffra et al. 2000). In contrast to European breeds which evolved
straight from the wild boar (Scandura et al. 2008), the history of Asian pigs is more complex:
After dispersal into the islands and Oceania, interrupted by feral states, pigs were eventually
transferred to the Asian mainland (Larson et al. 2007). Later, the Chinese populations
diverged into a northern and a southern strain (Ai et al. 2015). Our results confirm the gap
between south Chinese (Xiang, Wuzhishan) and north Chinese domestic breeds (Jiangquhai,
Meishan) but appear less clear than in Ai et al. (2015).
In the phylogenetic tree, the Goettingen and the Mini-LEWE are located between the Asian
and the European cluster. Looking at the breed histories, both breeds are synthetic crosses of
the Vietnamese Potbellied Pig with European breeds. In the case of the Mini-LEWE, the
crossing partner was the Saddleback pig and “Deutsches veredeltes Landschwein”
(comparable to Large White) (Leucht et al. 1982). The GMP was established using German
Landrace and the Minnesota Minipig (Glodek and Oldigs 1981), itself a cross bred of five
breeds of not completely resolved but mostly north American feral, possibly Asian origin
(Dettmers 1956). This might be the reason for the BMP being closer to the European cluster
than the GMP.
Signatures of selection
Polygenic effect of autosomal genes on growth
This study compares two contrasting groups in order to reveal the genetic background of the
reduced body size: various large pig breeds from all over the world versus a group of two
minipig breeds. Such a study design has been proven efficient before in detecting regions of
differentiating selection before in chicken (Rubin et al. 2010) and pigs (Rubin et al. 2012) and
has revealed comprehensive sets of candidate genes in both studies. Although it is known that
low recombination rates in combination with inbreeding have the potential to produce
signatures similar to selective sweeps (Bosse et al. 2012), the inclusion of two genetically
distinct minipig breeds should attenuate this problem. We discovered numerous putative
sweep regions containing a comprehensive gene set and a first conclusion could, therefore, be
that the genetic background of size differentiation is rather polygenic than mono- or oligo

60 Chapter 3
genic. This is not surprising, since it is known for other vertebrate species like humans (Lango
Allen et al. 2010) and chicken (Jacobsson et al. 2005) that growth has a polygenic
background. The consecutive analysis of over-representation for the respective gene
ontologies provided a similar picture. A variety of ontologies reached significance,
comprising ontologies with functions related to growth traits and energy metabolism, like
“mitochondrion” and “positive regulation of growth”. The most significantly enriched
ontology was ‘Z disc’, referring to a structural element of the muscle. The overrepresentation
of genes related to mitochondria suggests that the energy metabolism might be a key element
for growth restriction in minipigs. Some of the genes in significantly enriched ontologies are
known to have direct effects on growth and size development or even dwarfism: A COMT
variant increases the risk of having children with reduced birth weight (Sata et al. 2006),
knock out of TPST2 or PATZ1 leads to growth retardation in mice (Sasaki et al. 2007;
Valentino et al. 2013).
A former study by Gaerke et al. (2014) on the same GMP stock using a 60k SNP array came
to similar results. They also discovered numerous regions under putative selection comprising
several genes with known effect on growth and suggested a pathway connecting SOCS2,
GRB10 and IGF1 as potential cause of small body size in minipigs. This finding supported the
hypothesis of Simianer and Köhn (2010), that the minipig experiences a form of pituitary
dwarfism, comparable to Shetland pony and Dexter cattle, supposedly caused by a deficiency
of IGF1. This hypotheses seems natural, since the effect of IGF1 on growth in, for example,
Pygmies (Merimee et al. 1981) is known for long. In case of a mutation in an IGF gene, a
signature of selection would be expected around the respective gene as it was found in dogs,
where small breeds carry a unique coding sequence of IGF1 (Sutter et al. 2007). However,
using WGS data, we did not observe striking signals of selection near any of the known IGF
genes or receptor loci. This coincides with findings of Zenobi et al. (Zenobi et al. 1988) who
concluded that the size difference between normal sized and minipigs is neither related to
serum levels of IGF1 or IGF2, nor to a missing response to or reduced secretion of growth
hormones. Reduced transcription, manifested in low transcription levels of the IGF genes or
other growth hormones, could be ruled out and alterations in the underlying genes seem
unlikely. But still the insulin growth factor signaling cascade is a widely considered key
mechanism for growth. Our results suggest an alternative function: A possible mechanism
behind the dwarf phenotype could be a resistance of the target tissues to insulin. Symptoms of
this, i.e. a hampered blood glucose clearance after insulin stimulation, which could be
Chapter 3 61
facilitated by a disordered lipid metabolism (Savage et al. 2007) or an intrauterine growth
restriction (Jaquet et al. 2000) have been found in a feeding trial with Goettingen Minipigs
(Larsen et al. 2006). Focusing on the breeds used in the cross-breeding for GMPs, the
Vietnamese Potbellied Pig was the smallest, but also the most obese one (Glodek and Oldigs
1981). Even after generations of closed breeding, the major part of the GMP genome can be
attributed to the VPP (Gaerke et al. 2014), suspected to be the origin for the genetically
determined tendency to obesity of current GMPs. The detected signatures of selection
contained genes either directly influencing insulin resistance or traits such as obesity or
muscle fiber composition. Among these genes PPARG is an outstanding candidate, having
direct effects on insulin resistance (Hevener et al. 2003) and muscle fibers (Crooks et al.
2014). Furthermore its effect on growth has been proven before in humans and pigs (Puig-
Oliveras et al. 2014; Cecil et al. 2005)
Another kind of proportional dwarfism is caused by growth hormone (GH) deficiency
(Baumann 1999) which resembles the phenotype of the “Laron dwarfism”, that is
accompanied by severe growth retardation and obesity (Laron et al. 1992). GH is also
secreted in the pituitary gland and it was recently communicated that a knock-out of the
growth hormone receptor gene GHR using genome editing technology led to further
miniaturization of a bama minipig at 15 kg maturity weight (Cyranoski 2015). However,
focusing on genes belonging to GH or its receptor genes, we find only the CLR test to show
increased evidence of selection about 1 Mb away from GHR, but no sign of differentiation
between the large and the minipig group. Therefore our results do not support the hypothesis
that selection on one of the GH genes is underlying the minipig dwarfism.
Several genes within signatures of selection that were also comprised in significant GO terms
influence TGFB and FGF, which have a known influence on growth (Stuhlmeier and
Pollaschek 2004; Eguchi et al. 2001). Both are known to be involved in the mitogen activated
protein kinase pathway (MAPK) that controls cell proliferation and differentiation.
Klingseisen and Jackson (Klingseisen and Jackson 2011) report that this pathway plays a
prominent role in growth processes and in the primordial dwarfism. This form of dwarfism
leads to a proportional growth restriction causing a phenotype similar to the pituitary
dwarfism. We found the central gene MAPK1 of the Ras/ MAPK pathway in one of the
largest sweep regions and other pathway genes, i.e. PTPRR and MAGOH, which hamper the
MAPK signaling cascade, to lie inside strong selective sweeps. Other genes found to be under
putative selection, i.e. ACOT4, ATG7, COL7A1 and ACACB, interact or are directly

62 Chapter 3
influenced by TGFB and FGF. The MAPK pathway gene MAPKAPK3, located in a large
sweep on chromosome 13, is known to be involved in the mediation of growth inhibiting
signals (Mayer et al. 2001) and has been found differentially expressed in the pituitary gland
between the large and miniature strain of the Diannan pig (Yonggang 2010). Hence, these
genes are likely to be involved in the minipig growth processes and make the MAPK-pathway
a strong candidate contributing to the growth restriction in minipigs.
Major effect of the X chromosomal sweep
The porcine X-chromosome carries a selective sweep of outstanding extent (Rubin et al.
2012). Using the Chinese Wuzhishan genome reference, Ai et al. (2015) located this region of
48 Mb within the borders of 44 to 91.5 Mb, which corresponds to the region 52 to 100 Mb on
the Duroc reference that we identified as a selective sweep exhibiting low expected
heterozygosity in minipigs. We conclude from the same size of the region, the inclusion of
partly the same samples in both studies and the nearly completely conserved haplotypes in our
SNP chip analysis, that these two regions are analogous to each other. A sweep of comparable
physical size was not found in recent selection signature studies in horse (Petersen et al.
2013), sheep (Kijas et al. 2012), chicken (Rubin et al. 2010), dogs (Axelsson et al. 2013) or
rabbits (Carneiro et al. 2014), suggesting that this region might carry vital genetic variations
kept together due to haplotype effects or that recombination in the region is suppressed. Ai et
al. (2015) found a recombination breakpoint between a 14 Mb and a 34 Mb stretch, leading to
three major groups of haplotypes, a European, a Southern Chinese and a Northern Chinese
recombined haplotype. They explained the high differentiation of these three haplotypes with
an introgression from a common ancestor even before domestication followed by a strong
selective pressure for habitats in high altitudes. They concluded that this large region
remained consistent over long time, since the estimated low recombination rate in this region
could facilitate larger sweeps (Nachman 2001). They speculated that the reason for decreased
variation was an enrichment of poly(T) sequences leading to a reduced recombination rate as
known from human genomes (Kong et al. 2002). Using the Duroc reference for the analysis
of our resequencing data, we find that the minipigs might carry a recombined haplotype
different from the Asian and European samples we employed. This haplotype could be
identified as the southern Chinese haplotype, based on the Wuzhishan samples considered in
both studies. The SNP chip data within the first sweep region (52-61 Mb) shows that the
founder breeds must have provided both the European and the South Asian haplotype into the
GMP during breed establishment: The Vietnamese Potbellied Pig carries the South Chinese
Chapter 3 63
haplotype, while the Landrace carries the haplotype found in European wild boars and the
Minnesota Minipigs carries both haplotypes. Thus it is surprising that we can solely detect the
South Chinese haplotype in our current GMP stock, suggesting that the European haplotype
must have disappeared during breed consolidation. Since the GMP was always selected for
small size and high fertility, these two traits might underlie the selection against the European
haplotype.
The subsequent evaluation of an F2 generation from a GMP x Yorkshire and a GMP x Duroc
cross for four body size traits showed that males inheriting the GMP haplotype were
significantly smaller than a male carrying the European haplotype for three of the four traits,
while there was no significant effect on the fourth trait (Length at scanning). These results
confirm that the analyzed region carries an allele influencing body size. Due to the cross-
breeding scheme no females carrying only the minipig haplotypes on both chromosomes were
available. The lack of a significant differentiation between females carrying the large pig
haplotype on both copies of the chromosome X and heterozygous females indicates that the
large pig haplotype could carry an allele that is dominant over the allele of the minipig
haplotype covering the effect of the GMP allele, even though another study (Trakooljul 2004)
found that the respective minipig allele of the androgen receptor AR, located in this
haplotype, was dominant over a Duroc derived copy. It also could be due to the mosaic nature
of the X-chromosomal activation pattern in female eutherians (Payer and Lee 2008). At the
single cell level, half of the body cells are deemed to carry either an active copy of the large
haplotype or the GMP haplotype. Therefore, cells carrying the large pig haplotype might
attenuate the size decreasing effect of the cells carrying the GMP copy.
The differences of 3.5 % (3 cm) in body length at the age of slaughtering and 4.4 % (3 cm) in
height at age of slaughtering are QTL effects of considerable magnitude. Reviewing other
QTL studies on size, height and growth shows that the underlying QTL architecture can be
highly different dependent on trait or organism. Whereas, in humans, height is a highly
heritable trait, influenced by at minimum 180 genetic loci (Lango Allen et al. 2010) and SNP
effects explain up to 45 % of the phenotypic variance (Yang et al. 2010), only a small portion
could be attributed to QTLs. Gudbjartsson et al. (2008) identified 27 QTL explaining only
3.7 % of the population variance in height, composed of single effects of about 0.3 to 0.6 cm,
which was confirmed by other studies (Visscher 2008: 0.4 to 0.8 cm average effect size for a
QTL; Hirschhorn and Lettre 2009: 0.3 to 0.6 cm effect on adult height). In domestic animals,
larger QTL effects have been found. Signer-Hasler et al. (2012) reported that two QTL
64 Chapter 3
together explain 18.2 % of the heritable genetic variation in horses (~0.5 cm and ~1 cm for
height at withers, respectively). They suggest the higher efficiency of QTL studies in
domestic animals compared to humans to be due to the existence of isolated populations with
reduced heterogeneity. In a cattle cross breeding scheme, a QTL next to PLAG1, CHCHD7
and MOS was found with an allele substitution effect of 2 cm height at withers (Karim et al.
2011). Rubin et al. (2012) found that genotype combinations at two loci, LCORL and PLAG1,
together explained a difference of 5.3 cm in body length in domestic pigs. Since we could not
find signals of selection neither at LCORL nor PLAG1 in our study, it is noticeable that the
effect size of the chrX locus described herein has a similar effect size. Among the genes
located in this region, the androgen receptor appears to be the most prominent candidate for a
gene underlying the growth differences between pigs carrying opposite haplotypes, since AR
is influenced by several growth factors (Culig et al. 1994), has known function in growth
processes (Ornoy et al. 1994; Richman and Kirsch 1988) and underlies the obesity phenotype
that is commonly found in minipigs (Fan et al. 2005; Johansen et al. 2001). Another study on
the effect of the AR (Trakooljul et al. 2004) on performance and carcass traits based on a
cross-breeding experiment made up with Duroc and MiniLEWE also found that Duroc and
MiniLEWE carry different copies of the AR. It could be shown that the MiniLEWE allele led
to higher expression of the AR in several tissues including the uterus, and had effect on
several performance and carcass traits. The haplotype that contains AR carried by all studied
GMP was most likely identical to the aforementioned MiniLEWE allele and introduced by the
Vietnamese Potbellied Pig during breed foundation. This pig breed was originally not only
chosen for its small size, but also for the much higher litter size compared to the Minnesota
Minipig (Glodek and Oldigs 1981). Since there is a correlation between body size and litter
size in mammals (Tuomi 1980), which Ferguson et al. (1984) estimated to be r = 0.2 in pigs,
the current breeding scheme for low body weight and high fertility might have favored the
Asian haplotype and AR could be one of the underlying causal genes.
Conclusion
Comparison of WGS data of minipigs against data of various large pig breeds is a logical
approach in order to reveal the genetic background of body size in pigs. Signature of selection
analysis with multiple complementary methods provided a comprehensive set of putative
sweep regions, spanning approximately 2 % of the autosomal genome. The set of associated
genes and the consecutive GO term overrepresentation analysis suggest that energy
metabolism, alterations in the MAPK pathway, and a possible insulin resistance might be key

Chapter 3 65
elements in body size inheritance of miniature pigs. Additionally, the density of resequencing
data proved to be especially useful to analyze a large sweep region on chromosome X, since
the SNP chip available so far holds just few SNPs of limited information in that region. We
identified three SNPs on the genotyping chip, serving as perfect markers to determine the
respective haplotypic state of an individual in future studies. The effect size of the QTL of
3 cm in body length and height underlying this selective sweep is comparable to the largest
QTL for body size traits known from other studies in mammals. It, therefore promises
interesting implications even for practical breeding.
Methods
Analysis of whole genome resequencing data
Samples and raw data preparation
We extracted DNA from 10 representative contemporary GMP sows from the experimental
herd of the University of Goettingen. DNA from 2 Mini-LEWE (BMP) sows, a miniature
breed developed in Berlin, Germany and a DNA-pool of 10 female BMPs from the University
of Veterinary Medicine Hannover was also prepared. Whole genome re-sequencing was
performed at the Science for Life laboratory at Uppsala University, Sweden on an Illumina
HighSeq2000 as paired end sequencing with an aim average sequencing depth of 12X. The
raw sequencing data is deposited in ENA under project accession (to be added).
We added Publicly available re-sequencing data underlying the studies of Rubin et al. (2012),
Fang et al. (2012) and Vamathevan et al. (2013). These samples contained breeds of Asian and
European origin, both domestic and wild, and comprised animals of the breeds Duroc (DUR),
Hampshire (HAM), Jiangquhai (JQH), Large White (LW), Landrace (LAR), Meishan (MEI),
Pietrain (PIE), Xiang (XIA), European wild boars (WB FR, WB NL, WB SW), Asian wild
boars (WB SC, WB NC, WB JA), a Wuzhishan (WUS) and one Goettingen Minipig (GMP)
(Supplementary table 3.8).
We aligned all sequence reads to the reference genome susScrofa3 (build 10.2;Groenen et al.
2012) using the Burrows-Wheeler algorithm as implemented in the software bwa (Li and
Durbin 2009). The read trimming parameter was set to q=5. We then sorted the alignments
with Samtools (Li et al. 2009) and used Picard tools (Picard 2009) to mark duplicates without
removal, to down-sample the data of the single Goettingen Minipig to a coverage comparable
to the other minipig individuals and to construct indices for the alignments. Single Nucleotide

66 Chapter 3
Polymorphisms (SNPs) were called with GATKs Unified Genotyper (DePristo et al. 2011;
McKenna et al. 2010).
In order to obtain a reliable dataset for the selective sweep analysis, we applied a stringent
filtering process on the variant call set, by first removing InDels and multi-allelic SNPs and
filtering with GATK for a comprehensive set of quality criteria described in the methods
section. The filters for chromosome X were adjusted separately taking into account the
reduced depth of this chromosome in males. In addition, to keep a sample record a minimum
genotype quality (GQ) of 20 was required for sequenced individuals and a minimum depth of
coverage of 4 was required for pools.
In-silico pooling
For further analyses we constructed two contrasting in-silico pools: the large pig virtual pool
(LPP) made up of Duroc, Hampshire, Jiangquhai, Large White, Landrace, Meishan, Pietrain,
the European wild boars and the Asian wild boars. The minipig in-silico pool (MPP)
comprised the Goettingen Minipigs, the Mini-LEWE and the Mini-LEWE-pool. For this, we
calculated the reference allele frequency per breed for each locus. For each called SNP, the
reference allele frequency in each in-silico pool was then calculated as the unweighted
average of the respective breed reference allele frequencies. SNP loci for which less than
50 % of the breeds in one of the two groups had a record were excluded.
Selection signature detection
For the detection of genomic regions with influence on the small size of the minipigs, we
calculated heterozygosity and FST with custom R scripts (R Core Team 2015) and combined it
with the composite likelihood ratio (CLR) test, implemented in SweepFinder (Nielsen et al.
2005).
We calculated expected heterozygosity per locus as 𝐻𝑒𝑥𝑝 = 2𝑝(1 − 𝑝) where 𝑝 is the
reference allele frequency in the MPP and afterwards averaged it in sliding windows of
100 kb with 80 % overlap. We then normalized the 𝐻𝑒𝑥𝑝values of individual windows into Z-
scores by adjusting the value using the mean and standard deviation derived from all 100 kb
windows along autosomes and the X-chromosome independently. We defined candidate
selective sweeps using an outlier approach whereby a window that fell below a value of -2.34
(lowest 1 %) was required to initially call a sweep, such sweeps were then extended to each
side until values exceeded -1.64 (lowest 5 %).
Chapter 3 67
The CLR test (Nielsen et al. 2005), implemented in SweepFinder was applied to the same
100 kb windows of the filtered SNP data of all individuals belonging to the Goettingen
Minipigs and the Mini-LEWE. We excluded invariable loci across both groups and took the
highest 1 % of the signals further analysis.
The differentiation between the LPP and the MPP was determined by the fixation index
𝐹𝑆𝑇 =∑ 𝑛𝑖(𝑝𝑖−�̅�)2/(2𝑛)̅̅ ̅
�̅�(1−�̅�)
altered after Weir (1996), where 𝑝𝑖 is the frequency of the reference allele in group i, �̅� is the
weighted mean frequency of the first allele in both groups, 𝑛𝑖 is the number of samples within
a group i, and �̅� is the average group size. We averaged the values across the same windows
of 100 kb with 80% overlap as for heterozygosity and detected regions of increased
differentiation by the same method as used for expected heterozygosity, with the highest 1 %
and 5 % of the actual values taken as thresholds.
A selective sweep was assumed, when regions showing decreased expected heterozygosity in
the minipig or by the composite likelihood ratio test overlapped with signals of high
differentiation between the two groups. We required a minimum width of 200 kb and
extended the final regions by 0.5 Mb to each side. Figure 3.6 shows the proportions of the
autosomes detected to be under putative selective pressure. The CLR test detected 1 % of the
genome as putative sweeps of which 59 % intersected with outstanding FST signals. The
heterozygosity signature method found 5.3 % of the genome to be under selection, ~30 %
thereof (1.6 % of the genome) intersecting with extreme FST signals. 0.3 % of the whole
genome was shared between CLR and heterozygosity signature. Finally, we used the union of
CLR and expected Heterozygosity signals intersecting with FST for further analysis.

68 Chapter 3
Figure 3.6: Overlaps between selection signature detection methods.
Phylogeny
We constructed phylogenetic trees from biallelic SNPs, extracted from filtered VCF-files with
VCFtools (Danecek et al. 2011) and from array data with customized R-code. We calculated
the pairwise distance with Plink (Purcell et al. 2007) as 1 - similarity between samples, where
similarity was the proportion of a genome of an individual being identical by state (IBS) with
another animal’s genome. We constructed the neighbor joining tree using PHYLIP
(Felsenstein 1989), calculated Pairwise 𝐹𝑆𝑇 values from all autosomal SNP loci with 90 % or
more animals with genotypes that passed filters, in each contrasting combination of the
individual data of European breeds, Asian breeds and minipigs and for the subgroups
European domestic breeds, European wild boars, Asian domestics, Asian wild boars,
Goettingen Minipigs and Mini-LEWE, respectively (additional information on the groups can
be found in Supplementary table 3.1 and Supplementary table 3.2). Subsequently, we
averaged values at all loci to gain a genome wide 𝐹𝑆𝑇 value.
Gene annotation and gene overrepresentation analysis
We annotated genes within regions of interest using the Ensembl Pig Gene set 79
(Cunningham et al. 2014) and, subsequently, conducted a gene ontology (GO)
overrepresentation analysis by using Fisher´s exact test (Sachs and Hedderich 2006). We
calculated fold enrichment as FE

Chapter 3 69
,
with being the number of genes within a sweep and the respective gene ontology, being
the number of genes within a sweep but outside the respective gene ontology, being the
number of genes in a respective gene ontology but outside a sweep and being the number of
genes outside a sweep and outside the respective gene ontology (Cramér 1945; Gene
Ontology Consortium 2015). All statistics were applied on all GO terms for which genes had
been found within a putative selective sweep. To account for possible bias resulting from
assumption violations of the Fisher´s exact test (e.g. independency of the genes) as well as the
multiple testing problem, we conducted a permutation analysis to construct empirical
significance thresholds for the calculated p-values. To this end, we shifted the set of sweep
regions along the genome by a random number of base pairs between 1 and the genome
length, while retaining sweep sizes. Genes were then annotated to the shifted set of sweep
regions and Fisher´s exact test p-value was re-estimated for each ontology term found in our
original annotation. This random shifting should assure the resulting p-values to reflect the
case when the null hypothesis is true. Based on 5000 replications, the 5 % quantile threshold
was taken to determine the significance threshold for each gene ontology term.
Independent validation of a major sweep on the X-chromosome
For a large sweep region in the middle of chromosome X, we used additional SNP array
genotype data and phenotypic data from two other studies (Gaerke et al. 2014; Pant et al.
2015) for a more comprehensive examination of this region and its effect on growth.
The samples from Gaerke et al. (2014) comprised 154 GMP, 11 MMP, 4 VPP, 16 European
WB and 11 LAR. Pant et al. (2015) conducted an F2 cross-breeding experiment in which
Duroc and Yorkshire females, respectively, were crossed with Goettingen Minipig males.
This study provided X-chromosomal genotypes of 21 GMP males, 6 Duroc and 7 Yorkshire
females, 83 F1 animals and 454 F2 animals. All samples were genotyped with the Illumina
PorcineSNP60 BeadChip. Size phenotypes for the F2 animals were also provided.
SNPs within the region of interest, 52 to 61 Mb on the X-chromosome were identified. We
used Plink (Purcell et al. 2007) to filter out individuals with more than 90 % missing
genotypes and SNPs with less than 90 % genotyping rate or a minor allele frequency of less
than 1 %. Under the assumption of no recombination between the haplotypes of the European,
Asian and minipig breeds we searched for loci being fixed within a group but showing
dcba
caba
aFE
))((
a b
c
d
70 Chapter 3
different states between groups. We then used such informative SNPs to determine the origin
of the two haplotypes in the F2 animals.
Based on the results of the sequence-based analysis, we hypothesized that the origin of the
haplotype in the considered region should affect the body size of F2 animals. We therefore
classified F2 animals in three groups: Homozygous females or hemizygous males carrying the
Duroc/ Yorckshire haplotype as first class, heterozygous females as the second class and
hemizygous males carrying the minipig haplotype as the third class. These classes were
subsequently modeled as a fixed effect nested within sex.
Effects of the minipig haplotype on the four phenotypical traits “shoulder height at slaughter”,
“body length at slaughter”, “shoulder height at age of scanning” and “body length at age of
scanning” were estimated using proc “mixed” from SAS 9.4 (SAS 2017). The full model was
where is the dependent variable, is the fixed effect of the breed of the female ancestor
in the founder generation (𝑖 = 1,2), is the sex, is the animal’s age at measurement in
days, is the haplotype, either 1 for homozygous females and hemizygous males carrying
the large pig haplotype, 2 for heterozygous females and 3 for hemizygous males carrying the
minipig haplotype. Each depicts the linear regression coefficient of the age or
the respective interaction of a factor with age. is the residual error. The full model was
reduced by stepwise backward selection of factors with the highest p-values until only
significant factors remained.
We employed the R package “rehh” (Gautier and Vitalis 2012) to estimate the extension of
the two haplotypes and the decay of linkage disequilibrium around the central position of SNP
‘H3GA0051810’ (56’716’179 bp). Genes within this region were annotated with the Ensembl
Pig Gene set 79 (Cunningham et al. 2014). Finally, QTL known from former studies located
in this region were retrieved from the Pig QTL database (Hu et al. 2013, Results not shown).
List of abbreviations
BMP: Mini-LEWE; Minischwein Lehnitz-Wendefeld
Chr: Chromosome
CLR: Composite likelihood ratio test
ijkjkij
jkiijiijijijkijijjiijk
eSHAb
SHBABbABbSBSHAbAbSBy
))((
)()()()(
5
2
43
2
21
ijky iB
jS ijkA
kH
)5,...,1( lbl
ijke
Chapter 3 71
DNA: Deoxyribonucleic acid
DUR: Duroc
ENA: European Nucleotide Archive
GATK: Genome Analysis Toolkit
GMP: Goettingen Minipig
GO: Gene ontology
GQ: Genotype quality
HAM: Hampshire
IBS: Identical by state
JQH: Jiangquhai
LAR: Landrace
LD: Linkage disequilibrium
LPP: Large pig pool
LSD: least significant difference
LW: Large White
MEI: Meishan
Mb: Mega base pairs, 10^6 base pairs
MMP: Minnesota Minipig
MPP: Minipig pool
PIE: Pietrain
QTL: Quantitative trait loci
SNP: Single nucleotide polymorphism
VCF: Variant call format
VPP: Vietnamese Potbellied Pig
WB FR: Wild boar France
WB JA: Wild boar Japan
72 Chapter 3
WB NL: Wild boar Netherlands
WB NC: Wild boar North China
WB SC: Wild boar South China
WB SW: Wild boar Switzerland
WGS: Whole genome sequencing
WUS: Wuzhishan
XIA: Xiang
Declarations
Ethics approval and consent to participate
Goettingen Minipig and MiniLEWE blood samples were obtained within the course of
obligatory health screening, conducted by a state approved veterinarian. No sampling was
done for this study in particular.
Consent for publication
Not applicable
Availability of data
The various datasets supporting the conclusions of this article are available in the European
Nucleotide Archive or Sequence Read Archive and Datadryad:
ENA accessions for FASTQ files of samples from Rubin et al. (2012): ERR173170,
ERR173171, ERR173172, ERR173173, ERR173174, ERR173175, ERR173179,
ERR173180, ERR173181, ERR173182, ERR173183, ERR173184, ERR173185,
ERR173186, ERR173187, ERR173188, ERR173189, ERR173190, ERR173191,
ERR173192, ERR173193, ERR173194, ERR173195, ERR173196, ERR173197,
ERR173198, ERR173199, ERR173200, ERR173201, ERR173202, ERR173204,
ERR173205, ERR173206, ERR173207, ERR173208, ERR173212, ERR173213,
ERR173214, ERR173215, ERR173216, ERR173217, ERR173218, ERR173219,
ERR173220, ERR173221, ERR173222, ERR173223, ERR173224; Wuzhishan Samples from
Fang et al. (2012): SRR448575, SRR448588, SRR448589, SRR448591, inititially accessed
through ftp://climb.genomics.cn/pub/10.5524/100001_101000/100031/reads/; SRA
accessions for GMP samples from Vamathevan et al. (2013): SRR578029, SRR578191,
SRR578192; ENA accessions for the GMP and Mini-LEWE data: PRJEB27654; F2 cross

Chapter 3 73
breeding data from Pant et al. (2015): http://datadryad.org/resource/doi:10.5061/dryad.3jj7f;
SNP data from Gaerke et al. (2014): Please send inquiries to [email protected].
Competing interests
The authors declare that they have no competing interests.
Author contributions
CR analyzed the data and wrote the manuscript, CR, CJR, HS designed the project and the
strategy for the data analysis, CR and ARS developed the linear model used for QTL
identification on the X chromosome, NTH suggested the empirical correction of the multiple
testing in the GO term analysis, KHW and OD provided samples of the Mini-LEWE, SW
contributed to the GMP sampling strategy, designed, financed and conducted the DNA
preparation and the DNA pooling. MS developed an efficient algorithm for overlapping
windows. SDP and MF provided the X-chromosome data of the cross-bred pigs. All authors
discussed and reviewed the manuscript.
Acknowledgements and Funding
The computation was done on the server cluster of the SciLifeLab Compute and Storage
(UPPNEX) provided by the Swedish National Infrastructure for Computing (SNIC).
We would like to thank Ellegaard Göttingen Minipigs A/S for the financial support of our
minipig projects. We would like to acknowledge the SNP&Seq platform at the Science For
Life Laboratory in Uppsala for sequencing the minipig samples.
We appreciate the funding by the European Science Foundation within the framework
„Advances in Farm Animal Genomic Resources“, and by the DAAD U4 network for the stay
in Uppsala.
References
Ai H, Fang X, Yang B, Huang Z, Chen H, Mao L, Zhang F, Zhang L, Cui L, He W, et al.
2015. Adaptation and possible ancient interspecies introgression in pigs identified by
whole-genome sequencing. Nat Genet 47: 217–25.
Axelsson E, Ratnakumar A, Arendt M-L, Maqbool K, Webster MT, Perloski M, Liberg O,
Arnemo JM, Hedhammar A, Lindblad-Toh K. 2013. The genomic signature of dog
domestication reveals adaptation to a starch-rich diet. Nature 495: 360–4.
74 Chapter 3
Baumann G. 1999. Mutations in the growth hormonereleasing hormone receptor: a new form
of dwarfism in humans. Growth Horm IGF Res 9: 24–30.
Bosse M, Megens H-J, Madsen O, Paudel Y, Frantz LAF, Schook LB, Crooijmans RPMA,
Groenen MAM. 2012. Regions of homozygosity in the porcine genome: consequence of
demography and the recombination landscape. PLoS Genet 8: e1003100.
Carneiro M, Rubin C-J, Di Palma F, Albert FW, Alfoldi J, Barrio AM, Pielberg G, Rafati N,
Sayyab S, Turner-Maier J, et al. 2014. Rabbit genome analysis reveals a polygenic basis
for phenotypic change during domestication. Science 345: 1074–1079.
Cecil JE, Fischer B, Doney ASF, Hetherington M, Watt P, Wrieden W, Bolton-Smith C,
Palmer CNA. 2005. The Pro12Ala and C-681G variants of the PPARG locus are
associated with opposing growth phenotypes in young schoolchildren. Diabetologia 48:
1496–502.
Chang C, Chen Y-T, Yeh S-D, Xu Q, Wang R-S, Guillou F, Lardy H, Yeh S. 2004. Infertility
with defective spermatogenesis and hypotestosteronemia in male mice lacking the
androgen receptor in Sertoli cells. Proc Natl Acad Sci 101: 6876–6881.
Cobb MH, Boulton TG, Robbins DJ. 1991. Extracellular signal-regulated kinases: ERKs in
progress. Cell Regul 2: 965–78.
Cramér H. 1945. Mathematical methods of statistics. Almqvist & Wiksells, Uppsala, Sweden.
Crooks DR, Natarajan TG, Jeong SY, Chen C, Park SY, Huang H, Ghosh MC, Tong W-H,
Haller RG, Wu C, et al. 2014. Elevated FGF21 secretion, PGC-1α and ketogenic
enzyme expression are hallmarks of iron-sulfur cluster depletion in human skeletal
muscle. Hum Mol Genet 23: 24–39.
Culig Z, Hobisch A, Cronauer M V, Radmayr C, Trapman J, Hittmair A, Bartsch G, Klocker
H. 1994. Androgen receptor activation in prostatic tumor cell lines by insulin-like
growth factor-I, keratinocyte growth factor, and epidermal growth factor. Cancer Res
54: 5474–8.
Cunningham F, Amode MR, Barrell D, Beal K, Billis K, Brent S, Carvalho-Silva D, Clapham
P, Coates G, Fitzgerald S, et al. 2014. Ensembl 2015. Nucleic Acids Res F: D662-669.
Cyranoski D. 2015. Gene-edited “micropigs” to be sold as pets at Chinese institute. Nature
526: 18–18.
Chapter 3 75
Danecek P, Auton A, Abecasis G, Albers CA, Banks E, DePristo MA, Handsaker RE, Lunter
G, Marth GT, Sherry ST, et al. 2011. The variant call format and VCFtools.
Bioinformatics 27: 2156–8.
DePristo MA, Banks E, Poplin R, Garimella K V, Maguire JR, Hartl C, Philippakis AA, del
Angel G, Rivas MA, Hanna M, et al. 2011. A framework for variation discovery and
genotyping using next-generation DNA sequencing data. Nat Genet 43: 491–8.
Dettmers A. 1956. Die Zucht eines neuen „Versuchstieres”, des Miniaturschweines in
Amerika. Zeitschrift für Tierzüchtung und Züchtungsbiologie 68: 37–41.
Eguchi S, Dempsey PJ, Frank GD, Motley ED, Inagami T. 2001. Activation of MAPKs by
Angiotensin II in Vascular Smooth Muscle Cells: Metalloprotease-dependent EGF
Receptor Activation is Required for Activation of ERK and p38 MAPK but not for
JNK. J Biol Chem 276: 7957–7962.
Fan W, Yanase T, Nomura M, Okabe T, Goto K, Sato T, Kawano H, Kato S, Nawata H.
2005. Androgen receptor null male mice develop late-onset obesity caused by decreased
energy expenditure and lipolytic activity but show normal insulin sensitivity with high
adiponectin secretion. Diabetes 54: 1000–8.
Fang X, Mou Y, Huang Z, Li Y, Han L, Zhang Y, Feng Y, Chen Y, Jiang X, Zhao W, et al.
2012. The sequence and analysis of a Chinese pig genome. Gigascience 1: 16.
Felsenstein J. 1989. PHYLIP -- Phylogeny Inference Package (Version 3.2). Cladistics 5:
165–166.
Ferguson PW, Harvey WR, Irvin KM. 1984. Genetic, Phenotypic and Environmental
Relationships between Sow Body Weight and Sow Productivity Traits. J Anim Sci 60:
375–384.
Frantz LAF, Schraiber JG, Madsen O, Megens H-J, Bosse M, Paudel Y, Semiadi G, Meijaard
E, Li N, Crooijmans RPMA, et al. 2013. Genome sequencing reveals fine scale
diversification and reticulation history during speciation in Sus. Genome Biol 14: R107.
Gaerke C, Ytournel F, Sharifi a. R, Pimentel ECG, Ludwig A, Simianer H. 2014. Footprints
of recent selection and variability in breed composition in the Göttingen Minipig
genome. Anim Genet 381–391.
Gautier M, Vitalis R. 2012. rehh: an R package to detect footprints of selection in genome-
wide SNP data from haplotype structure. Bioinformatics 28: 1176–7.

76 Chapter 3
Gene Ontology Consortium TGO. 2015. Gene Ontology Consortium: going forward. Nucleic
Acids Res 43: D1049-56.
Giuffra E, Kijas JMH, Amarger V, Carlborg O, Jeon J-T, Andersson L. 2000. The Origin of
the Domestic Pig: Independent Domestication and Subsequent Introgression. Genetics
154: 1785–1791.
Glodek P, Oldigs B. 1981. Das Göttinger Miniaturschwein. Parey, Berlin and Hamburg.
Groenen MAM, Archibald AL, Uenishi H, Tuggle CK, Takeuchi Y, Rothschild MF, Rogel-
gaillard C, Park C, Megens H, Li S, et al. 2012. Analyses of pig genomes provide
insight into porcine demography and evolution. Nature 491: 393–398.
Gudbjartsson DF, Walters GB, Thorleifsson G, Stefansson H, Halldorsson B V, Zusmanovich
P, Sulem P, Thorlacius S, Gylfason A, Steinberg S, et al. 2008. Many sequence variants
affecting diversity of adult human height. Nat Genet 40: 609–615.
Haldane JBS. 1927. On Being The Right Size. In Possible Worlds, Chatto & Windus,
London.
Hendriks WJAJ, Dilaver G, Noordman YE, Kremer B, Fransen JAM. 2009. PTPRR protein
tyrosine phosphatase isoforms and locomotion of vesicles and mice. Cerebellum 8: 80–
8.
Hevener AL, He W, Barak Y, Le J, Bandyopadhyay G, Olson P, Wilkes J, Evans RM,
Olefsky J. 2003. Muscle-specific Pparg deletion causes insulin resistance. Nat Med 9:
1491–7.
Hirschhorn JN, Lettre G. 2009. Progress in genome-wide association studies of human height.
Horm Res 71 Suppl 2: 5–13.
Hu Z-L, Park CA, Wu X-L, Reecy JM. 2013. Animal QTLdb: an improved database tool for
livestock animal QTL/association data dissemination in the post-genome era. Nucleic
Acids Res 41: D871-9.
Jacobsson L, Park H-B, Wahlberg P, Fredriksson R, Perez-Enciso M, Siegel PB, Andersson
L. 2005. Many QTLs with minor additive effects are associated with a large difference
in growth between two selection lines in chickens. Genet Res 86: 115.

Chapter 3 77
Jaquet D, Gaboriau A, Czernichow P, Levy-Marchal C. 2000. Insulin resistance early in
adulthood in subjects born with intrauterine growth retardation. J Clin Endocrinol
Metab 85: 1401–6.
Johansen T, Hansen HS, Richelsen B, Malmlöf R. 2001. The obese Göttingen minipig as a
model of the metabolic syndrome: dietary effects on obesity, insulin sensitivity, and
growth hormone profile. Comp Med 51: 150–5.
Juarez JC, Manuia M, Burnett ME, Betancourt O, Boivin B, Shaw DE, Tonks NK, Mazar AP,
Doñate F. 2008. Superoxide dismutase 1 (SOD1) is essential for H2O2-mediated
oxidation and inactivation of phosphatases in growth factor signaling. Proc Natl Acad
Sci U S A 105: 7147–52.
Karim L, Takeda H, Lin L, Druet T, Arias JAC, Baurain D, Cambisano N, Davis SR, Farnir
F, Grisart B, et al. 2011. Variants modulating the expression of a chromosome domain
encompassing PLAG1 influence bovine stature. Nat Genet 43: 405–13.
Kazlauskas A. 2014. Plakophilin-2 promotes activation of epidermal growth factor receptor.
Mol Cell Biol 34: 3778–9.
Kijas JW, Lenstra JA, Hayes B, Boitard S, Porto Neto LR, San Cristobal M, Servin B,
McCulloch R, Whan V, Gietzen K, et al. 2012. Genome-wide analysis of the world’s
sheep breeds reveals high levels of historic mixture and strong recent selection. PLoS
Biol 10: e1001258.
Kirn-Safran CB, Oristian DS, Focht RJ, Parker SG, Vivian JL, Carson DD. 2007. Global
growth deficiencies in mice lacking the ribosomal protein HIP/RPL29. Dev Dyn 236:
447–60.
Klingseisen A, Jackson AP. 2011. Mechanisms and pathways of growth failure in primordial
dwarfism. Genes Dev 25: 2011–24.
Kong A, Gudbjartsson DF, Sainz J, Jonsdottir GM, Gudjonsson SA, Richardsson B,
Sigurdardottir S, Barnard J, Hallbeck B, Masson G, et al. 2002. A high-resolution
recombination map of the human genome. Nat Genet 31: 241–247.
La Spada AR, Wilson EM, Lubahn DB, Harding AE, Fischbeck KH. 1991. Androgen
receptor gene mutations in X-linked spinal and bulbar muscular atrophy. Nature 352:
77–9.
78 Chapter 3
Lango Allen H, Estrada K, Lettre G, Berndt SI, Weedon MN, Rivadeneira F, Willer CJ,
Jackson AU, Vedantam S, Raychaudhuri S, et al. 2010. Hundreds of variants clustered
in genomic loci and biological pathways affect human height. Nature 467: 832–8.
Laron Z, Anin S, Klipper-Aurbach Y, Klinger B. 1992. Effects of insulin-like growth factor
on linear growth, head circumference, and body fat in patients with Laron-type
dwarfism. Lancet 339: 1258–1261.
Larsen MO, Rolin B, Wilken M, Carr RD, Svendsen O. 2006. High-Fat High-Energy Feeding
Impairs Fasting Glucose and Increases Fasting Insulin Levels in the Göttingen Minipig.
Ann N Y Acad Sci 967: 414–423.
Larson G, Cucchi T, Fujita M, Matisoo-Smith E, Robins J, Anderson A, Rolett B, Spriggs M,
Dolman G, Kim T-H, et al. 2007. Phylogeny and ancient DNA of Sus provides insights
into neolithic expansion in Island Southeast Asia and Oceania. Proc Natl Acad Sci U S
A 104: 4834–9.
Leucht W, Gregor G, Stier H. 1982. Einführung in die Versuchstierkunde, Band IV: Das
Miniaturschwein - Versuchs- und Modelltier in Medizin und Biologie. VEB Gustav
Fischer Verlag, Jena, Germany.
Li H, Durbin R. 2009. Fast and accurate short read alignment with Burrows-Wheeler
transform. Bioinformatics 25: 1754–60.
Li H, Handsaker B, Wysoker A, Fennell T, Ruan J, Homer N, Marth G, Abecasis G, Durbin
R. 2009. The Sequence Alignment/Map format and SAMtools. Bioinformatics 25:
2078–9.
Llamazares M, Obaya AJ, Moncada-Pazos A, Heljasvaara R, Espada J, López-Otín C, Cal S.
2007. The ADAMTS12 metalloproteinase exhibits anti-tumorigenic properties through
modulation of the Ras-dependent ERK signalling pathway. J Cell Sci 120: 3544–52.
Ma L, Murea M, Snipes JA, Marinelarena A, Krüger J, Hicks PJ, Langberg KA, Bostrom
MA, Cooke JN, Suzuki D, et al. 2013. An ACACB variant implicated in diabetic
nephropathy associates with body mass index and gene expression in obese subjects.
PLoS One 8: e56193.
Mayer IA, Verma A, Grumbach IM, Uddin S, Lekmine F, Ravandi F, Majchrzak B, Fujita S,
Fish EN, Platanias LC. 2001. The p38 MAPK pathway mediates the growth inhibitory
effects of interferon-alpha in BCR-ABL-expressing cells. J Biol Chem 276: 28570–7.

Chapter 3 79
McKenna A, Hanna M, Banks E, Sivachenko A, Cibulskis K, Kernytsky A, Garimella K,
Altshuler D, Gabriel S, Daly M, et al. 2010. The Genome Analysis Toolkit: a
MapReduce framework for analyzing next-generation DNA sequencing data. Genome
Res 20: 1297–303.
Merimee TJ, Zapf J, Froesch ER. 1981. Dwarfism in the Pygmy. N Engl J Med 305: 965–968.
Muise ES, Souza S, Chi A, Tan Y, Zhao X, Liu F, Dallas-Yang Q, Wu M, Sarr T, Zhu L, et
al. 2013. Downstream signaling pathways in mouse adipose tissues following acute in
vivo administration of fibroblast growth factor 21. PLoS One 8: e73011.
Nachman MW. 2001. Single nucleotide polymorphisms and recombination rate in humans.
Trends Genet 17: 481–485.
Nielsen R, Williamson S, Kim Y, Hubisz MJ, Clark AG, Bustamante C. 2005. Genomic scans
for selective sweeps using SNP data. Genome Res 15: 1566–1575.
Ornoy A, Giron S, Aner R, Goldstein M, Boyan BD, Schwartz Z. 1994. Gender dependent
effects of testosterone and 17β-estradiol on bone growth and modelling in young mice.
Bone Miner 24: 43–58.
Pant SD, Karlskov-Mortensen P, Jacobsen MJ, Cirera S, Kogelman LJA, Bruun CS, Mark T,
Jørgensen CB, Grarup N, Appel EVR, et al. 2015. Comparative Analyses of QTLs
Influencing Obesity and Metabolic Phenotypes in Pigs and Humans. PLoS One 10:
e0137356.
Payer B, Lee JT. 2008. X chromosome dosage compensation: how mammals keep the
balance. Annu Rev Genet 42: 733–772.
Petersen JL, Mickelson JR, Rendahl AK, Valberg SJ, Andersson LS, Axelsson J, Bailey E,
Bannasch D, Binns MM, Borges AS, et al. 2013. Genome-Wide Analysis Reveals
Selection for Important Traits in Domestic Horse Breeds ed. J.M. Akey. PLoS Genet 9:
e1003211.
Picard. 2009. http://picard.sourceforge.net/. Accessed 2013-07-26.
Puig-Oliveras A, Ballester M, Corominas J, Revilla M, Estellé J, Fernández AI, Ramayo-
Caldas Y, Folch JM. 2014. A co-association network analysis of the genetic
determination of pig conformation, growth and fatness. PLoS One 9: e114862.

80 Chapter 3
Purcell S, Neale B, Todd-Brown K, Thomas L, Ferreira MAR, Bender D, Maller J, Sklar P,
de Bakker PIW, Daly MJ, et al. 2007. PLINK: a tool set for whole-genome association
and population-based linkage analyses. Am J Hum Genet 81: 559–75.
R Core Team. 2015. R: A language and environment for statistical computing. http://www.r-
project.org/.
Richman RA, Kirsch LR. 1988. Testosterone treatment in adolescent boys with constitutional
delay in growth and development. N Engl J Med 319: 1563–7.
Riedl S, Giedion A, Schweitzer K, Müllner-Eidenböck A, Grill F, Frisch H, Lüdecke H-J.
2004. Pronounced short stature in a girl with tricho-rhino-phalangeal syndrome II
(TRPS II, Langer-Giedion syndrome) and growth hormone deficiency. Am J Med Genet
A 131: 200–3.
Roignant J-Y, Treisman JE. 2010. Exon Junction Complex Subunits Are Required to Splice
Drosophila MAP Kinase, a Large Heterochromatic Gene. Cell 143: 238–250.
Rubin C-J, Megens HJ, Martinez Barrio A, Maqbool K, Sayyab S, Schwochow D, Wang C,
Carlborg O, Jern P, Jorgensen CB, et al. 2012. Strong signatures of selection in the
domestic pig genome. Proc Natl Acad Sci U S A 109: 19529–19536.
Rubin C-J, Zody MC, Eriksson J, Meadows JRS, Sherwood E, Webster MT, Jiang L, Ingman
M, Sharpe T, Ka S, et al. 2010. Whole-genome resequencing reveals loci under
selection during chicken domestication. Nature 464: 587–591.
Sachs L, Hedderich J. 2006. Angewandte Statistik. 12. Springer-Verlag, Berlin Heidelberg
New York.
Sanchez-Infantes D, White UA, Elks CM, Morrison RF, Gimble JM, Considine R V, Ferrante
AW, Ravussin E, Stephens JM. 2014. Oncostatin m is produced in adipose tissue and is
regulated in conditions of obesity and type 2 diabetes. J Clin Endocrinol Metab 99:
217–25.
SAS. 2017. SAS/STAT(R) 13.1 User’s Guide.
https://support.sas.com/documentation/cdl/en/statug/66859/HTML/default/viewer.htm,
Accessed 2017-04-26.
Sasaki N, Hosoda Y, Nagata A, Ding M, Cheng J-M, Miyamoto T, Okano S, Asano A,
Miyoshi I, Agui T. 2007. A mutation in Tpst2 encoding tyrosylprotein sulfotransferase
causes dwarfism associated with hypothyroidism. Mol Endocrinol 21: 1713–21.
Chapter 3 81
Sata F, Yamada H, Suzuki K, Saijo Y, Yamada T, Minakami H, Kishi R. 2006. Functional
maternal catechol-O-methyltransferase polymorphism and fetal growth restriction.
Pharmacogenet Genomics 16: 775–81.
Savage DB, Petersen KF, Shulman GI. 2007. Disordered lipid metabolism and the
pathogenesis of insulin resistance. Physiol Rev 87: 507–20.
Scandura M, Iacolina L, Crestanello B, Pecchioli E, Di Benedetto MF, Russo V, Davoli R,
Apollonio M, Bertorelle G. 2008. Ancient vs. recent processes as factors shaping the
genetic variation of the European wild boar: are the effects of the last glaciation still
detectable? Mol Ecol 17: 1745–62.
Signer-Hasler H, Flury C, Haase B, Burger D, Simianer H, Leeb T, Rieder S. 2012. A
genome-wide association study reveals loci influencing height and other conformation
traits in horses. PLoS One 7: e37282.
Silver DL, Watkins-Chow DE, Schreck KC, Pierfelice TJ, Larson DM, Burnetti AJ, Liaw H-
J, Myung K, Walsh CA, Gaiano N, et al. 2010. The exon junction complex component
Magoh controls brain size by regulating neural stem cell division. Nat Neurosci 13:
551–558.
Simianer H, Köhn F. 2010. Genetic management of the Göttingen Minipig population. J
Pharmacol Toxicol Methods 62: 221–6.
Sims D, Sudbery I, Ilott NE, Heger A, Ponting CP. 2014. Sequencing depth and coverage:
key considerations in genomic analyses. Nat Rev Genet 15: 121–32.
Stuhlmeier KM, Pollaschek C. 2004. Differential effect of transforming growth factor beta
(TGF-beta) on the genes encoding hyaluronan synthases and utilization of the p38
MAPK pathway in TGF-beta-induced hyaluronan synthase 1 activation. J Biol Chem
279: 8753–60.
Sutter NB, Bustamante CD, Chase K, Gray MM, Zhao K, Zhu L, Padhukasahasram B,
Karlins E, Davis S, Jones PG, et al. 2007. A Single IGF1 Allele Is a Major Determinant
of Small Size in Dogs. Science (80- ) 316: 112–115.
Swindle MM, Makin A, Herron AJ, Clubb FJ, Frazier KS. 2012. Swine as models in
biomedical research and toxicology testing. Vet Pathol 49: 344–56.
82 Chapter 3
Trakooljul N. 2004. Molecular and association analyses of the androgen receptor gene as a
candidate for production and reproduction traits in pigs. University of Bonn.
Trakooljul N, Ponsuksili S, Schellander K, Wimmers K. 2004. Polymorphisms of the porcine
androgen receptor gene affecting its amino acid sequence and expression level. Biochim
Biophys Acta - Gene Struct Expr 1678: 94–101.
Tuomi J. 1980. Mammalian reproductive strategies: A generalized relation of litter size to
body size. Oecologia 45: 39–44.
Valentino T, Palmieri D, Vitiello M, Simeone A, Palma G, Arra C, Chieffi P, Chiariotti L,
Fusco A, Fedele M. 2013. Embryonic defects and growth alteration in mice with
homozygous disruption of the Patz1 gene. J Cell Physiol 228: 646–53.
Vallet JL, Miles JR, Freking BA. 2010. Effect of fetal size on fetal placental hyaluronan and
hyaluronoglucosaminidases throughout gestation in the pig. Anim Reprod Sci 118: 297–
309.
Vamathevan JJ, Hall MD, Hasan S, Woollard PM, Xu M, Yang Y, Li X, Wang X, Kenny S,
Brown JR, et al. 2013. Minipig and beagle animal model genomes aid species selection
in pharmaceutical discovery and development. Toxicol Appl Pharmacol 270: 149–157.
Visscher PM. 2008. Sizing up human height variation. Nat Genet 40: 489–90.
Wang D, Han S, Peng R, Jiao C, Wang X, Han Z, Li X. 2014. DUSP28 contributes to human
hepatocellular carcinoma via regulation of the p38 MAPK signaling. Int J Oncol 45:
2596–2604.
Wang R-S, Yeh S, Tzeng C-R, Chang C. 2009. Androgen Receptor Roles in Spermatogenesis
and Fertility: Lessons from Testicular Cell-Specific Androgen Receptor Knockout
Mice. Endocr Rev 30: 119–132.
Weir BS. 1996. Genetic data analysis II: methods for discrete population genetic data. Sinauer
Associates, Sunderland, Massachusetts.
Yang J, Benyamin B, McEvoy BP, Gordon S, Henders AK, Nyholt DR, Madden PA, Heath
AC, Martin NG, Montgomery GW, et al. 2010. Common SNPs explain a large
proportion of the heritability for human height. Nat Genet 42: 565–9.
Chapter 3 83
Yonggang L. 2010. A novel porcine gene, MAPKAPK3, is differentially expressed in the
pituitary gland from mini-type Diannan small-ear pigs and large-type Diannan small-ear
pigs. Mol Biol Rep 37: 3345–9.
Zenobi PD, Guler H-P, Zapf J, Froesch ER. 1988. Insulin-like growth factors in the Gottinger
miniature-pig. Eur J Endocrinol 117: 343–352.
Zhou S, Lechpammer S, Greenberger JS, Glowacki J. 2005. Hypoxia Inhibition of
Adipocytogenesis in Human Bone Marrow Stromal Cells Requires Transforming
Growth Factor- /Smad3 Signaling. J Biol Chem 280: 22688–22696.
84 Chapter 3
Supplementary Material
Accessible through: https://figshare.com/s/228890c2f2675409d6cd
Supplementary table 3.1: Genome-wide estimated FST values between different contrasts of
breed groups for all loci with call-rate ≥ 90 %, over diagonal, standard errors below diagonal
Supplementary table 3.2: Genome-wide estimated FST values between different contrasts of
breed groups for all loci with call-rate ≥ 90 %, over diagonal, standard errors below diagonal
Supplementary table 3.3: Putative selective sweeps with genes contained
Supplementary table 3.4: Significantly overrepresented GO-Terms in selective sweeps
Supplementary table 3.5: Overview of SNPs in the region from 52 to 61 Mb on
chromosome X, including results of filtering
Supplementary table 3.6: Occurring haplotypes in region 52 to 61 Mb on chromosome X
and numbers of carrier animals
Supplementary table 3.7: Genes located in first region of large sweep on chromosome X
Supplementary table 3.8: Overview of sampled breeds and descriptive statistics of the re-
sequenced samples
CHAPTER 4
Analyses of the breed integrity of the Goettingen Minipig using pool-
sequencing
C. Reimer1, N.T. Ha
1, A.R. Sharifi
1, S. Weigend
2, J. Geibel
1, H. Simianer
1
1University of Goettingen, Department of Animal Sciences, Albrecht-Thaer-Weg 3, 37075
Göttingen, Germany
2Friedrich-Loeffler-Institut, Institute of Farm Animal Genetics, Höltystraße 10, 31535
Neustadt-Mariensee, Germany
Published in:
Proceedings of the 11th
World Congress of Genetics Applied to Livestock Production.
86 Chapter 4
Summary
The Goettingen Minipig (GMP), one of the smallest pig breeds, is an established animal
model in medical research. The GMP is bred in five isolated stocks and it is of foremost
importance to ensure the integrity of the different strains. We sequenced two DNA-pools from
every stock and added samples from a diverse set of pig breeds from an earlier study. We
estimated the pairwise fixation index for all pools, conducted principal component analyses
(PCA) and functionally annotated all loci. The PCA revealed, that the GMP is easy to
discriminate from all other breeds, but that there also is a certain level of differentiation
between the five stocks. Annotation of all loci showed that critical functional classes, such as
stop codons, were relatively underrepresented and rarely located in genes important in
minipig breeding. We conclude that there is a certain level of stratification within the GMP,
which might not be compromising breed integrity yet.
Keywords: Goettingen Minipig, pool sequencing, differentiation
Introduction
The Goettingen Minipig (GMP), one of the smallest pig breeds in the world, was established
by crossing Minnesota Minipigs, Vietnamese Potbellied Pigs and German Landrace at the
former Institute of Animal Breeding and Genetics of the University of Goettingen in the
1960s (Simianer and Köhn 2010). The university owned stock is kept at the research farm
Relliehausen (RE). In 1992, a collaboration with Ellegaard Göttingen Minipigs A/S from
Dalmose, DK, was started by opening unit DA1. In 2006, animals from DA2 (descendent
from DA1) were brought to North Rose, NY, as foundation for a North American population.
DA1 was closed down. The next separation happened in 2009 with the opening of a second
barrier in Dalmose (DA3). Since the opening of the first Asian facility in Nisshin, Japan (NI)
in 2013, branched off from DA3, there are now five active breeding stocks in service
worldwide without exchange of animals. Even though all stocks underlie a fully documented
and centrally controlled breeding scheme and are bred for the same breeding goal, the genetic
isolation might harbor the risk of stratification. As the GMP is today one of the standard non-
rodent animal models in medical research, its uniformity and clear characterization are of
foremost importance (Bollen and Ellegaard 1997).
This study aims at identifying the traces that separation might have left in the genomes of the
different populations, predict their consequences and form the base for a decision-making
process as to when interchange of animals is inevitable to maintain the breed integrity.
Chapter 4 87
Material and Methods
30 females representative for the respective stock were chosen for DNA sampling from every
unit based on measures of pedigree-based relationship. The technically best 20 DNA extracts
were randomly assigned to two groups of 10 individuals each and equimolarly pooled. Pools
were sequenced at a depth of aimed 30X as paired reads on an Illumina X10. All reads were
aligned to the reference genome susScr3 (build 10.2; Groenen et al. 2012) with BWA 0.7.2.
(Li and Durbin 2009). The subsequent bam file preparation and variant calling followed the
“GATK Best Practice” protocol (Broad Institute 2017). Due to unavailability of a high
confidence learning SNP set, the 5 % SNPs with highest quality, that were also contained in
dbSNP, were chosen for variant recalibration from the raw callset. Corresponding variants of
various pig breeds from an earlier study (Reimer et al. 2014) were added. Individual data was
virtually pooled by summation of all reference and alternative reads, respectively.
Monomorphic loci were discarded, also, when a subset was used.
Reference allele frequency 𝑝𝑖 was calculated for every pool as number of reads supporting the
reference allele, divided by the total coverage at the respective locus. Wright´s fixation index
was estimated pairwise (eq.1; Eding and Bennewitz 2007). A UPGMA tree, based on 100
subsamples of 50’000 SNPs ('phangorn 2.2.0'; Schliep 2011) and a principal component
analysis were computed with R (R Core Team 2015). All loci were annotated with Ensembl´s
variant effect predictor (McLaren et al. 2016).
𝐹𝑆𝑇 =𝐻𝑇 − 𝐻𝑆
𝐻𝑇=
𝑝∗(1−𝑝) − 𝑝1∗(1−𝑝1)+𝑝2∗(1−𝑝2)
2
𝑝∗(1−𝑝), with 𝑝 =
𝑝1 + 𝑝2
2 (1)
Results and Discussion
The UPGMA tree (Figure 4.1) shows that the GMP can still be considered a very distinct
breed when compared to other pig breeds. Resampling shows a high robustness of the
estimated tree, even when subsets of 50’000 SNPs were used.
In the PCA (Figure 4.2), the first principal component (PC) explains 78 % and the second
8 %. The first PC explains the variation between the GMP and all other breeds, while the
second discriminates GMP from European and Asian (including Mini-LEWE) populations. It
is remarkable, that the first component does not explain the difference between large pigs and
minipigs, since the Mini-LEWE is also a minipig, but has a different genetic background than
the GMP.
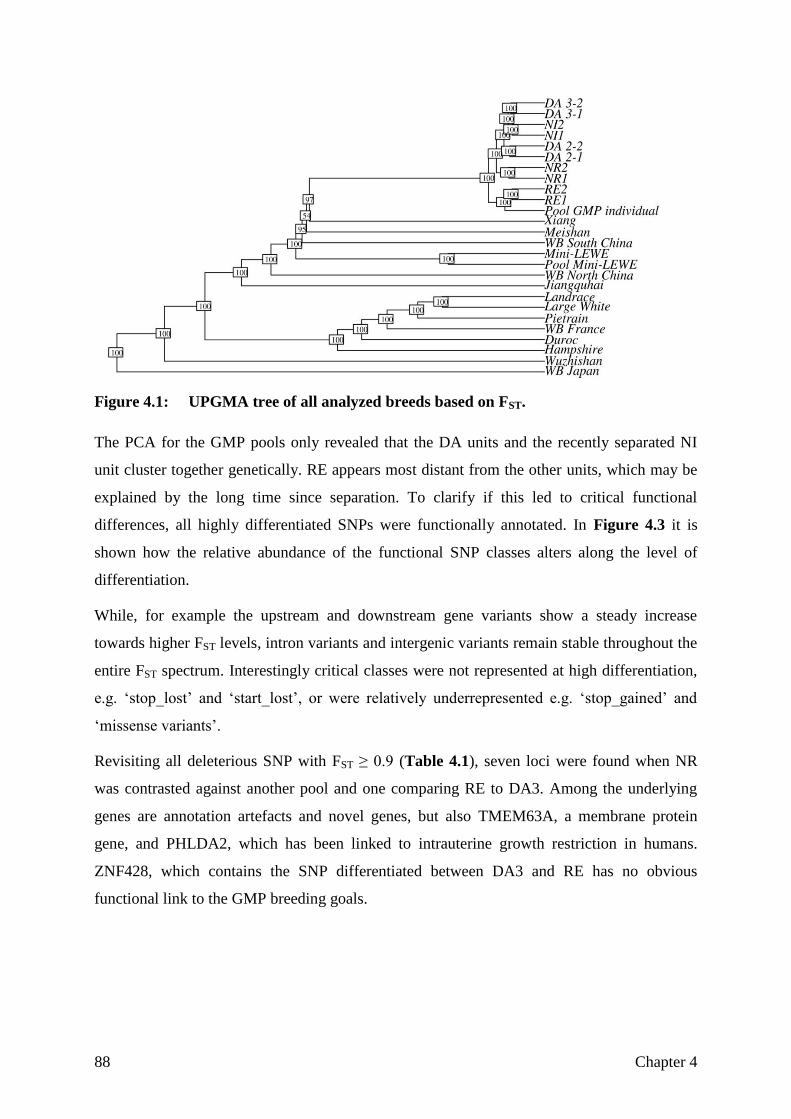
88 Chapter 4
Figure 4.1: UPGMA tree of all analyzed breeds based on FST.
The PCA for the GMP pools only revealed that the DA units and the recently separated NI
unit cluster together genetically. RE appears most distant from the other units, which may be
explained by the long time since separation. To clarify if this led to critical functional
differences, all highly differentiated SNPs were functionally annotated. In Figure 4.3 it is
shown how the relative abundance of the functional SNP classes alters along the level of
differentiation.
While, for example the upstream and downstream gene variants show a steady increase
towards higher FST levels, intron variants and intergenic variants remain stable throughout the
entire FST spectrum. Interestingly critical classes were not represented at high differentiation,
e.g. ‘stop_lost’ and ‘start_lost’, or were relatively underrepresented e.g. ‘stop_gained’ and
‘missense variants’.
Revisiting all deleterious SNP with FST ≥ 0.9 (Table 4.1), seven loci were found when NR
was contrasted against another pool and one comparing RE to DA3. Among the underlying
genes are annotation artefacts and novel genes, but also TMEM63A, a membrane protein
gene, and PHLDA2, which has been linked to intrauterine growth restriction in humans.
ZNF428, which contains the SNP differentiated between DA3 and RE has no obvious
functional link to the GMP breeding goals.
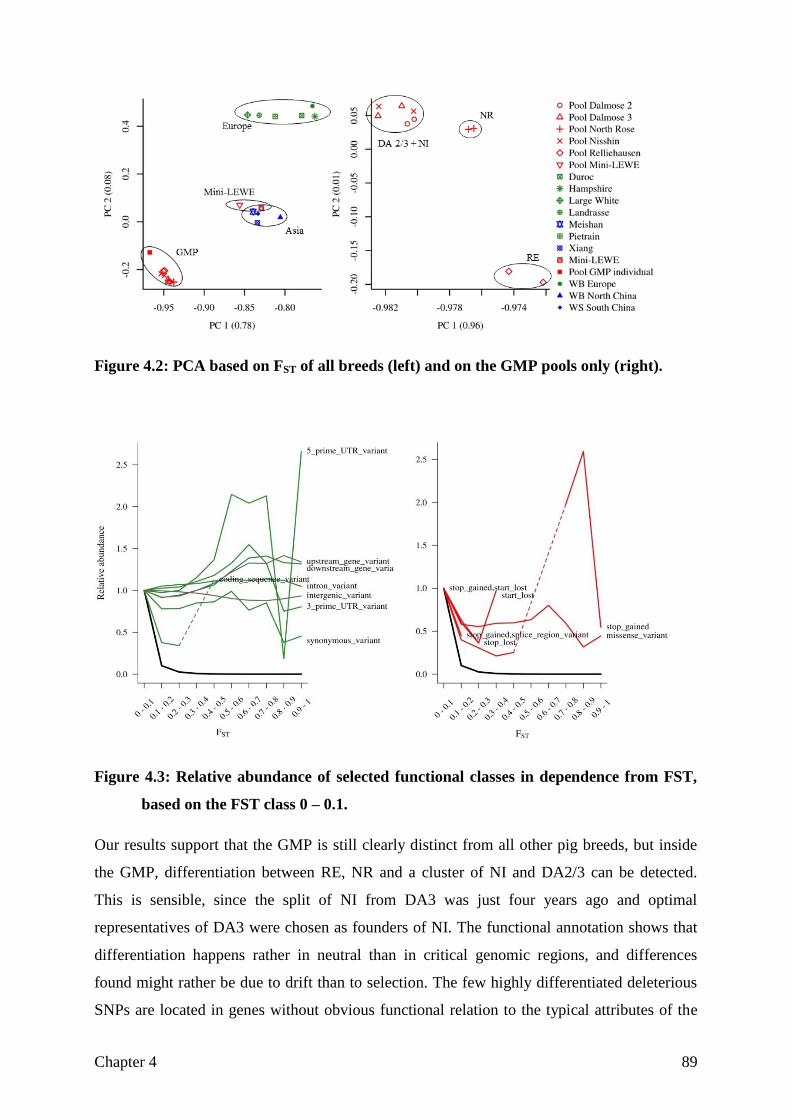
Chapter 4 89
Figure 4.2: PCA based on FST of all breeds (left) and on the GMP pools only (right).
Figure 4.3: Relative abundance of selected functional classes in dependence from FST,
based on the FST class 0 – 0.1.
Our results support that the GMP is still clearly distinct from all other pig breeds, but inside
the GMP, differentiation between RE, NR and a cluster of NI and DA2/3 can be detected.
This is sensible, since the split of NI from DA3 was just four years ago and optimal
representatives of DA3 were chosen as founders of NI. The functional annotation shows that
differentiation happens rather in neutral than in critical genomic regions, and differences
found might rather be due to drift than to selection. The few highly differentiated deleterious
SNPs are located in genes without obvious functional relation to the typical attributes of the
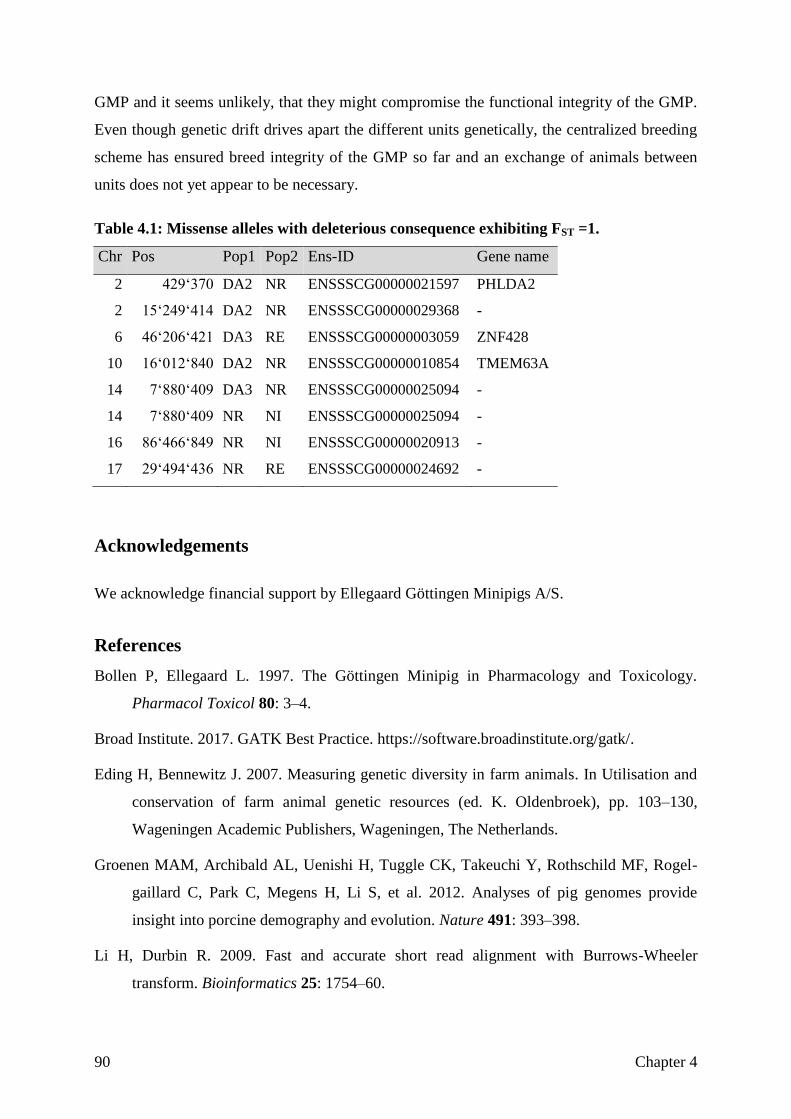
90 Chapter 4
GMP and it seems unlikely, that they might compromise the functional integrity of the GMP.
Even though genetic drift drives apart the different units genetically, the centralized breeding
scheme has ensured breed integrity of the GMP so far and an exchange of animals between
units does not yet appear to be necessary.
Table 4.1: Missense alleles with deleterious consequence exhibiting FST =1.
Chr Pos Pop1 Pop2 Ens-ID Gene name
2 429‘370 DA2 NR ENSSSCG00000021597 PHLDA2
2 15‘249‘414 DA2 NR ENSSSCG00000029368 -
6 46‘206‘421 DA3 RE ENSSSCG00000003059 ZNF428
10 16‘012‘840 DA2 NR ENSSSCG00000010854 TMEM63A
14 7‘880‘409 DA3 NR ENSSSCG00000025094 -
14 7‘880‘409 NR NI ENSSSCG00000025094 -
16 86‘466‘849 NR NI ENSSSCG00000020913 -
17 29‘494‘436 NR RE ENSSSCG00000024692 -
Acknowledgements
We acknowledge financial support by Ellegaard Göttingen Minipigs A/S.
References
Bollen P, Ellegaard L. 1997. The Göttingen Minipig in Pharmacology and Toxicology.
Pharmacol Toxicol 80: 3–4.
Broad Institute. 2017. GATK Best Practice. https://software.broadinstitute.org/gatk/.
Eding H, Bennewitz J. 2007. Measuring genetic diversity in farm animals. In Utilisation and
conservation of farm animal genetic resources (ed. K. Oldenbroek), pp. 103–130,
Wageningen Academic Publishers, Wageningen, The Netherlands.
Groenen MAM, Archibald AL, Uenishi H, Tuggle CK, Takeuchi Y, Rothschild MF, Rogel-
gaillard C, Park C, Megens H, Li S, et al. 2012. Analyses of pig genomes provide
insight into porcine demography and evolution. Nature 491: 393–398.
Li H, Durbin R. 2009. Fast and accurate short read alignment with Burrows-Wheeler
transform. Bioinformatics 25: 1754–60.
Chapter 4 91
McLaren W, Gil L, Hunt SE, Riat HS, Ritchie GRS, Thormann A, Flicek P, Cunningham F.
2016. The Ensembl Variant Effect Predictor. Genome Biol 17: 122.
R Core Team. 2015. R: A language and environment for statistical computing. http://www.r-
project.org/.
Reimer C, Rubin C-J, Weigend S, Waldmann K-H, Distl O, Simianer H. 2014. The Minipig
Genome Harbors Regions of Selection for Growth. 10th World Congr Genet Appl to
Livest Prod Proceedings; Vancouver, BC, Canada ; August 17-22, 2014.
Schliep KP. 2011. phangorn: phylogenetic analysis in R. Bioinformatics 27: 592–593.
Simianer H, Köhn F. 2010. Genetic management of the Göttingen Minipig population. J
Pharmacol Toxicol Methods 62: 221–6.

CHAPTER 5
Assessing breed integrity of the Goettingen Minipig
1C. Reimer,
1N.-T. Ha,
1A.R. Sharifi,
1J. Geibel,
2L.F.Mikkelsen,
3S. Weigend,
1H.
Simianer
1University of Goettingen, Department of Animal Sciences, Center for Integrated Breeding
Research, Animal Breeding and Genetics Group, Albrecht-Thaer-Weg 3, 37017 Goettingen,
Germany
2Ellegaard Göttingen Minipigs A/S, Soroe Landevej 302, 4261 Dalmose, Denmark
3Institute of Farm Animal Genetics of the Friedrich-Loeffler-Institut, Höltystraße 10, 31535
Neustadt-Mariensee, Germany
In preparation
94 Chapter 5
Abstract
The Goettingen Minipig (GMP) is the smallest pig breed under a controlled breeding scheme
and is bred in five isolated stocks. The genetic isolation harbors the risk of stratification which
might compromise the identity of the breed and its usability as an animal model. We
conducted whole genome sequencing of two DNA-pools per stock to assess genomic
differentiation within and between stocks. FST and Reynolds distance as measures of
differentiation and genetic distance were estimated for about 13M biallelic autosomal SNP
loci. These data were complemented with sequence data from 13 other pig breeds from public
data repositories. Based on FST, a phylogenetic tree, principal component analysis (PCA) and
evaluation of functional SNP classes was conducted. An F-test was performed to reveal
significantly differentiated allele frequencies between stocks, further a pathway analysis was
conducted. Variation per stock was quantified as expected heterozygosity. Phylogeny and
PCA showed that the GMP is easily discriminable from all other breads, but that there is also
differentiation between the GMP stocks. Dependent on the contrast between GMP stocks, 4 to
14 % of all loci have significantly different allele frequencies. Functional annotation revealed
that functionally non-neutral loci are less prone to differentiation which suggests, that the
underlying mechanism is rather drift than selection. The pathway analysis detected
differentiation between two stocks in pathway ‘Glutamatergic synapse’ with putative effect
on behaviour. The Relliehausen stock appears to be the genetically most variable and could be
a valuable resource if animal exchange is required to maintain uniformity of the GMP.
Introduction
The Goettingen Minipig (GMP) is a model organism with growing importance (Swindle et al.
2012). Bred in the 1960´s by crossing Minnesota Minipigs, Vietnamese Potbellied pigs and
German Landrace, the breed is under a fully documented, closed breeding scheme ever since.
The first unit was founded at the research farm of the University of Göttingen in Friedland
and later resettled to the Relliehausen research farm. Due to the growing interest of customers
in GMPs, this facility could not satisfy the demand anymore and therefor collaboration with
Ellegaard Göttingen Minipigs A/S in Dalmose, Denmark was established in 1992. In 2003
animals from this stock were brought to Marshall BioResources, North Rose, New York as
the basis of a North American GMP breeding scheme. In 2009 a second barrier was
established in Dalmose, based on breeders from the first barrier, to increase the production
and improve the housing conditions. With the latest transfer, animals from Dalmose were
brought to a breeding unit in Nisshin, Japan in 2013. After the initial animal transfer, stocks

Chapter 5 95
remained under closed breeding without any genetic exchange, albeit being under a common
breeding scheme, coordinated by the animal breeding and genetics group at the University of
Göttingen, Germany.
Managing the GMP in independent stocks is beneficial from a hygienic point of view.
Additionally a production unit close to the main sales market minimizes negative effects on
animal welfare through long transports and prevents import regulations. On the other hand
splitting a population reduces the effective population size of each sub-population, which
increases the risk of genetic drift or the manifestation of recessive disorders (Fitzpatrick and
Evans 2009). Two concepts to counter these risks are purging of deleterious variants (Hedrick
1994) or maintenance of genetic diversity (Bosse et al. 2015). Lacy (1987) argues that drift is
the most important factor in loss of genetic variance when effective population sizes are low,
as in case of the GMP (Gaerke et al. 2014), and the only effective measure to mitigate adverse
effects would be animal exchange.
In this study we try to assess whether the genetic management was able to maintain the
uniformity of the breed GMP, or if the isolated production units are already genetically
diversified such that an exchange of breeders is inevitable. This was done by re-sequencing
two representative DNA pools from each unit: candidates were sampled for low average
relationship within a pool, but elevated relationship towards the remaining stock, allowing an
assessment of the diversity within and between units.
Material and Methods
Samples
A joint pedigree was created from the pedigrees of all five separated facilities (Relliehausen
(RE); Dalmose barrier 2 and 3 (DA2, DA3); North Rose (NR); Nisshin (NI)). Numerator
relationship matrices were constructed with Wrights coefficient of relationship (Wright 1922)
for each stock and all animals alive within a stock in November 2015. A set of 30 individuals
was selected for blood sampling with the following procedure in each facility, respectively:
all candidates available for blood sampling consisting of only non-pregnant, healthy sows
without genetic disorders were identified. A subset of 30 animals was randomly sampled from
this list and the relationship within the set ( a ) and between the animals in the set and all
remaining animals in the stock ( b ) calculated. Both values were combined in an index
baI *2.0*8.0 , to minimize relationship within the samples while maximizing
relationship with the sample and the remaining stock. This sampling was repeated up to
96 Chapter 5
25’000 times and restarted every time a new index value went below the previously recorded
one. The procedure was stopped after 25’000 rounds without improvement.
DNA of two times ten animals per stock, randomly chosen from the available samples from
the previously selected 30 candidates, was pooled using equimolar amounts of the individual
DNA. 150 bp paired-end sequencing was done on an Illumina HiSeq X Ten with an aim
coverage of 30X and an insertsize of about 420 bp. Raw data was aligned to the reference
genome susScr3 (build 10.2, Groenen et al. 2012) with BWA 0.7.12 (Li and Durbin 2009),
sorting, merging of different libraries and marking duplicates were done with Picard tools
2.0.1 (Picard 2009), base qualities were recalibrated with GATKs BQSR (McKenna et al.
2010; Van der Auwera et al. 2013) using the available SNPs from dbSNP as validation
(Sherry et al. 2001). Biallelic SNPs were called with the Haplotype Caller from GATK 3.4-
46. SNPs were filtered with the VariantScoreRecalibration tool of GATK that uses machine
learning to assess the validity of a SNP. Since there was no high quality reference set
available, the 5 % SNPs with highest quality from our callset, which were also represented in
the dbSNP database, were used to train the model incorporating the variant attributes
QualitybyDepth (QD), MappingQuality (MQ), MQRankSumTest,
ReadPositionRankSumTest, FisherStrand (FS), StrandOddsRatio(SOR) and depth (DP). A
truth sensitivity filter level of 99.9 was applied.
For all loci, also represented in the study of Reimer et al. (2014, Table 5.1), biallelic SNP
data of 13 various pig breeds (Rubin et al. 2012; Fang et al. 2012; Vamathevan et al. 2013)
were added to allow inter-breed comparisons. Monomorphic loci and loci without records
were removed.
Fixation index and Reynolds distance
Fixation index (FST) and Reynolds distance (DR) were estimated between breed pools.
Therefore read information of individuals was virtually pooled by breed-wise summation of
reads supporting the reference and the alternative allele, respectively.
Reference allele frequency in each breed 𝑘 per locus was estimated as 𝑝𝑘 =𝑅𝑟𝑒𝑓
𝑅𝑟𝑒𝑓 +𝑅𝑎𝑙𝑡, with
𝑅𝑟𝑒𝑓/𝑎𝑙𝑡 depicting the number of reads supporting either the reference or alternative allele,
and 𝐹𝑆𝑇 calculated per locus as 𝐹𝑆𝑇 =𝐻𝑇 − 𝐻𝑆
𝐻𝑇=
𝑝∗(1−𝑝) − 𝑝1∗(1−𝑝1)+𝑝2∗(1−𝑝2)
2
𝑝∗(1−𝑝), with 𝑝 =
𝑝1 + 𝑝2
2.
Reynolds distance was estimated as 𝐷𝑅 =1
2∗
∑ (𝑝1𝑖−𝑝2𝑖)²2𝑖=1
1−∑ 𝑝1𝑖𝑝𝑝2𝑖2𝑖=1
, where 𝑖 reflects the 𝑖𝑡ℎ allele at a
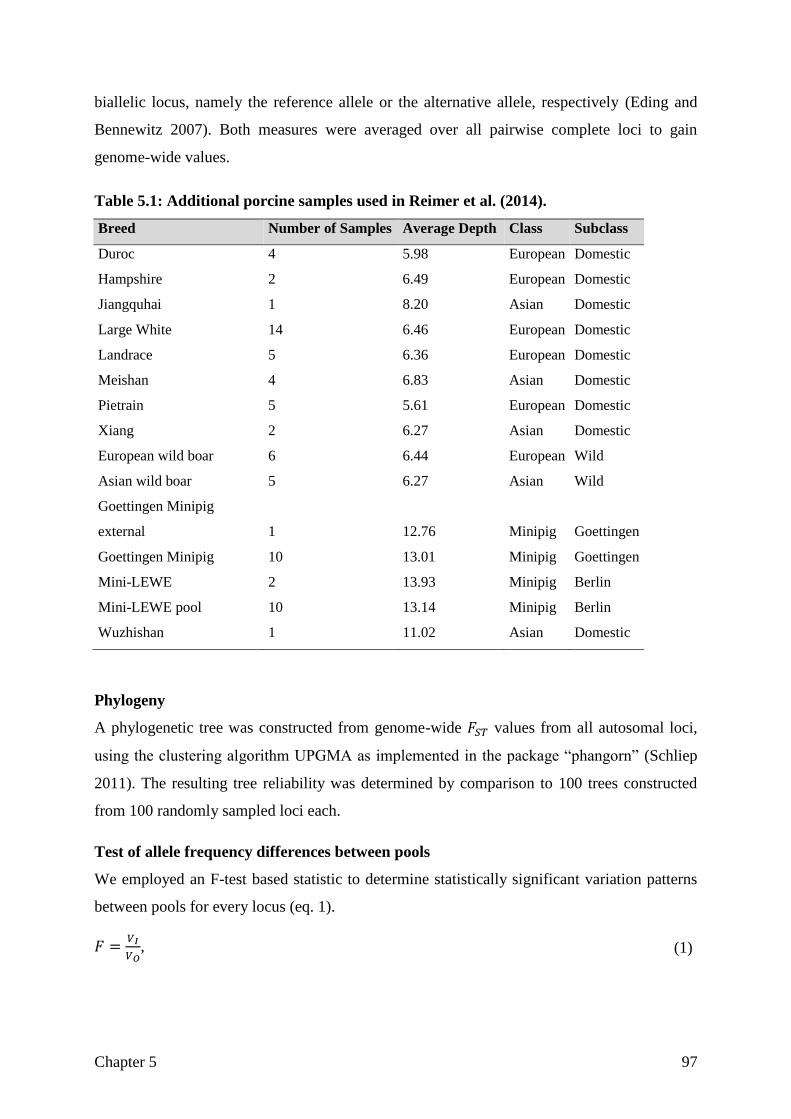
Chapter 5 97
biallelic locus, namely the reference allele or the alternative allele, respectively (Eding and
Bennewitz 2007). Both measures were averaged over all pairwise complete loci to gain
genome-wide values.
Table 5.1: Additional porcine samples used in Reimer et al. (2014).
Breed Number of Samples Average Depth Class Subclass
Duroc 4 5.98 European Domestic
Hampshire 2 6.49 European Domestic
Jiangquhai 1 8.20 Asian Domestic
Large White 14 6.46 European Domestic
Landrace 5 6.36 European Domestic
Meishan 4 6.83 Asian Domestic
Pietrain 5 5.61 European Domestic
Xiang 2 6.27 Asian Domestic
European wild boar 6 6.44 European Wild
Asian wild boar 5 6.27 Asian Wild
Goettingen Minipig
external 1 12.76 Minipig Goettingen
Goettingen Minipig 10 13.01 Minipig Goettingen
Mini-LEWE 2 13.93 Minipig Berlin
Mini-LEWE pool 10 13.14 Minipig Berlin
Wuzhishan 1 11.02 Asian Domestic
Phylogeny
A phylogenetic tree was constructed from genome-wide 𝐹𝑆𝑇 values from all autosomal loci,
using the clustering algorithm UPGMA as implemented in the package “phangorn” (Schliep
2011). The resulting tree reliability was determined by comparison to 100 trees constructed
from 100 randomly sampled loci each.
Test of allele frequency differences between pools
We employed an F-test based statistic to determine statistically significant variation patterns
between pools for every locus (eq. 1).
𝐹 =𝑉𝐼
𝑉𝑂, (1)
98 Chapter 5
where 𝑉𝐼 is the pooled variance within a unit, e.g. RE1 and RE2, estimated as 𝑉𝐼 =
𝑝𝑅𝐸1+𝑝𝑅𝐸2
2∗ (1 −
𝑝𝑅𝐸1+𝑝𝑅𝐸2
2) ∗
2
10, and where 𝑉𝑂 represents the variance between the
aforementioned unit and a remote pool, e.g. NI1 estimated as 𝑝𝑅𝐸1+𝑝𝑁𝐼2
2∗ (1 −
𝑝𝑅𝐸1+𝑝𝑁𝐼2
2) ∗
2
10. Degrees of freedom where assumed nine, for every pool was made up from ten animals.
Heterozygosity, fixed alleles and private polymorphisms
Expected heterozygosity at locus 𝑖 was estimated from original pools and the virtual pool for
each stock as 𝐻𝑒𝑥𝑝𝑖= 2 ∗ 𝑝𝑖 ∗ (1 − 𝑝𝑖), where 𝑝𝑖 is the reference allele frequency. It was
further assessed whether a single stock was fixed for one allele, while the others were fixed
for the other allele. To assess variability remaining in only one stock, loci where all stocks
apart from one were fixed, were identified. This was done both for the subset of loci without
missing information and for loci where single stocks had missing information.
Annotation
Loci identified in the aforementioned tests were functionally annotated with the Ensemble
Genes database (version 89; Sscrofa 10.2; Aken et al. 2016).
Gene and pathway analyses
For each comparison, we used the SNP-wise FST-values to identify genes and pathways that
are enriched with highly differentiated SNPs between the contrasts. To this end, we first
created a SNP to gene annotation based on the Ensembl Genes database (version 89; Sscrofa
10.2). We then performed a Kolmogorov-Smirnov test to test whether the distribution of the
FST-values within each gene significantly differs from the distribution of all the FST-values on
the respective chromosome. To correct for multiple testing we permuted the gene positions
and repeated the analyses with the permuted set of genes. We then used the p-values of the
permutation test to obtain a genome-wide significance threshold for our p-values. Using the
KEGG database (Kanehisa and Goto 2000), we subsequently annotated the Ensembl genes to
KEGG pathways. In a similar fashion to the gene analyses, we performed a Kolmogorov-
Smirnov test to compare the p-values of the genes in each annotated pathway to the p-values
of all genes.
Results
Sampling of the optimally representative candidates for pooling based on relationship
measures resulted in candidate sets which exhibited lower inner-set mean relationship

Chapter 5 99
coefficients (a) compared to the mean relationship of the candidate set with the remaining
stock mates (b). Both, the absolute level of relationship and the difference between a and b
were lowest for RE and highest for NR, while DA2 and 3 and NI were at the same level and
exhibited similar difference between a and b (Table 5.2).
Variant calling discovered 21’779’266 raw SNPs, with 3’185’086 SNP thereof not
documented in dbSNP. After variant quality score recalibration 16’000’684 total SNPs and
937’592 novel SNPs were retained. Intersection with the data set of various pig breeds and
discarding of monomorphic loci provided a set of 15’022’059 analysis ready SNPs on
chromosomes 1 to 18 and X.
Table 5.2: Mean coefficients of relationship within a stock sample and between the
sample and the remaining stock, including number of successfully extracted
probes.
RE DA2 DA3 NR NI
Relationship within sample 0.357 0.396 0.396 0.403 0.387
Relationship Sample/ Remaining Stock 0.376 0.404 0.402 0.410 0.397
Successful DNA extractions 28 24 23 28 24
Differentiation and distance measures
As measures of differentiation and genetic distance between the different breeds FST and
Reynolds genetic distance (DR) were estimated. When applied on the variable set of large
breeds and minipig pools, both measures provided a similar picture of three strongly
differentiated groups (Figure 5.1). In principle, these three groups were the minipigs, the
European breeds and the Asian breeds, respectively, with the exception, that the Mini-LEWE
pools clustered with the Asian group. Comparing FST against DR, the latter showed generally
higher estimates, relatively inflated at moderate levels of differentiation/ distance
(Figure 5.2), but provided in general a very similar picture. Therefore, only FST was used for
later purposes, such as the functional annotation. Focusing on the differentiation within the
three groups, the GMP exhibited the lowest average differentiation (FST: 0.05; DR: 0.09; see
also Supplementary table 5.1), the European (FST: 0.17; DR: 0.26) the second lowest and the
Asian the highest (FST: 0.27; DR: 0.36) (Table 5.3). The average differentiation to other
groups was higher than the differentiation within the own group, clearly so for minipigs and
for European breeds, but not as clear for the Asian breeds. These exposed an even lower

100 Chapter 5
average DR (0.34 vs 0.36) and FST (0.25 vs. 0.27) to the GMP than within the group of Asian
breeds.
Figure 5.1: PCA of pairwise genome-wide FST including all pools (top) and GMP DNA
pools only (bottom); Variance explained by PC in brackets. Distribution of PC´s
on the right.
Principal component analysis of DR and FST resembled each other with only marginal
deviations (r > 0.99). The first component accounts for 78 % of the variation in FST values and
discriminates between the GMP and the other breeds, while the second component, explaining
eight percent, separates the GMP, Asian and European breeds. Analyzing the GMP
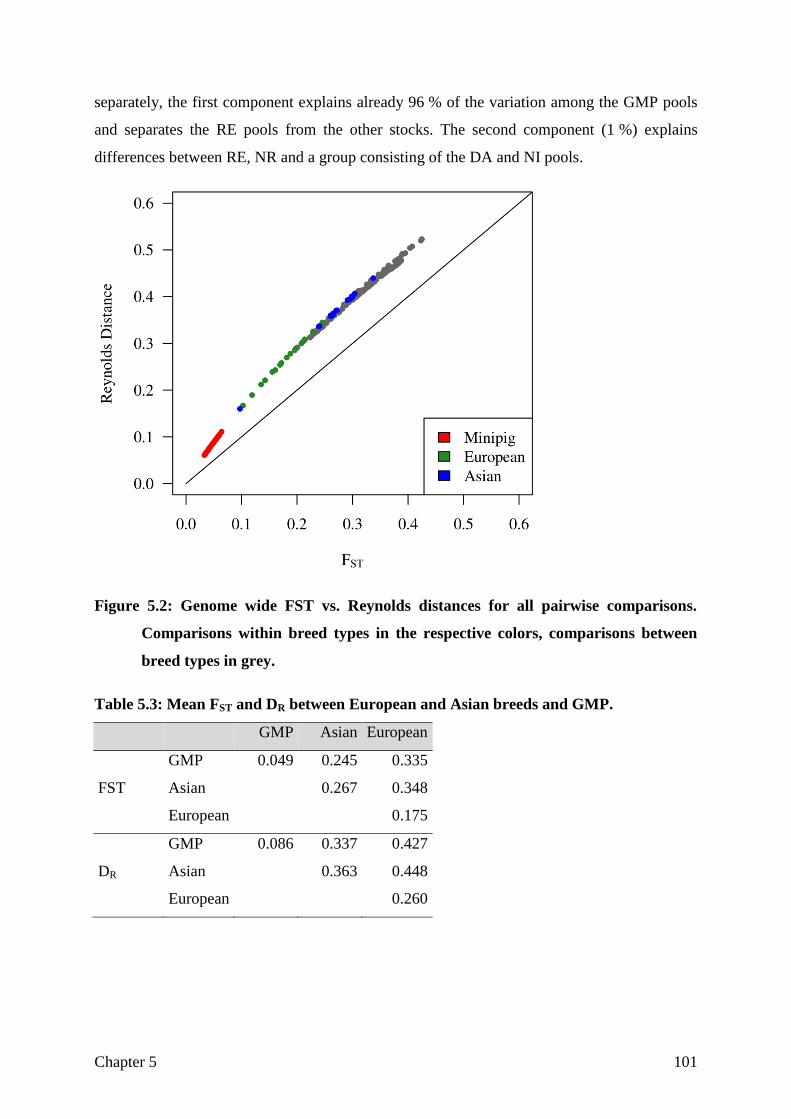
Chapter 5 101
separately, the first component explains already 96 % of the variation among the GMP pools
and separates the RE pools from the other stocks. The second component (1 %) explains
differences between RE, NR and a group consisting of the DA and NI pools.
Figure 5.2: Genome wide FST vs. Reynolds distances for all pairwise comparisons.
Comparisons within breed types in the respective colors, comparisons between
breed types in grey.
Table 5.3: Mean FST and DR between European and Asian breeds and GMP.
GMP Asian European
GMP 0.049 0.245 0.335
FST Asian 0.267 0.348
European 0.175
GMP 0.086 0.337 0.427
DR Asian
0.363 0.448
European
0.260
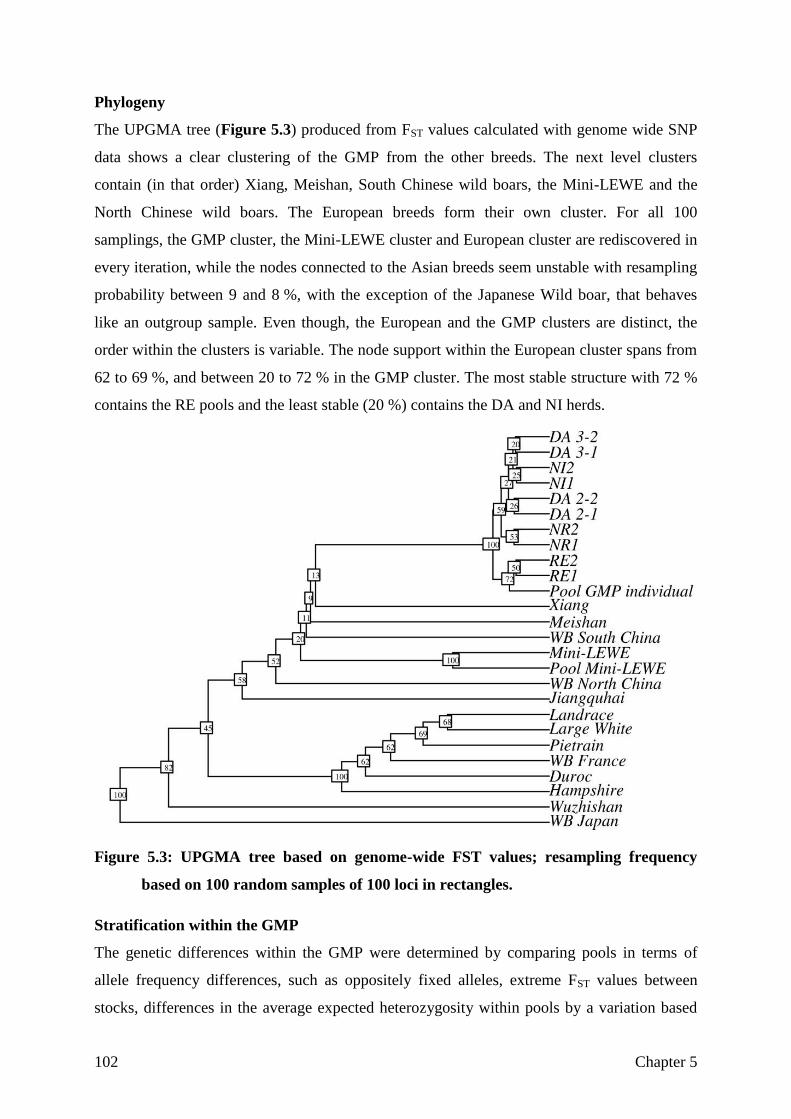
102 Chapter 5
Phylogeny
The UPGMA tree (Figure 5.3) produced from FST values calculated with genome wide SNP
data shows a clear clustering of the GMP from the other breeds. The next level clusters
contain (in that order) Xiang, Meishan, South Chinese wild boars, the Mini-LEWE and the
North Chinese wild boars. The European breeds form their own cluster. For all 100
samplings, the GMP cluster, the Mini-LEWE cluster and European cluster are rediscovered in
every iteration, while the nodes connected to the Asian breeds seem unstable with resampling
probability between 9 and 8 %, with the exception of the Japanese Wild boar, that behaves
like an outgroup sample. Even though, the European and the GMP clusters are distinct, the
order within the clusters is variable. The node support within the European cluster spans from
62 to 69 %, and between 20 to 72 % in the GMP cluster. The most stable structure with 72 %
contains the RE pools and the least stable (20 %) contains the DA and NI herds.
Figure 5.3: UPGMA tree based on genome-wide FST values; resampling frequency
based on 100 random samples of 100 loci in rectangles.
Stratification within the GMP
The genetic differences within the GMP were determined by comparing pools in terms of
allele frequency differences, such as oppositely fixed alleles, extreme FST values between
stocks, differences in the average expected heterozygosity within pools by a variation based
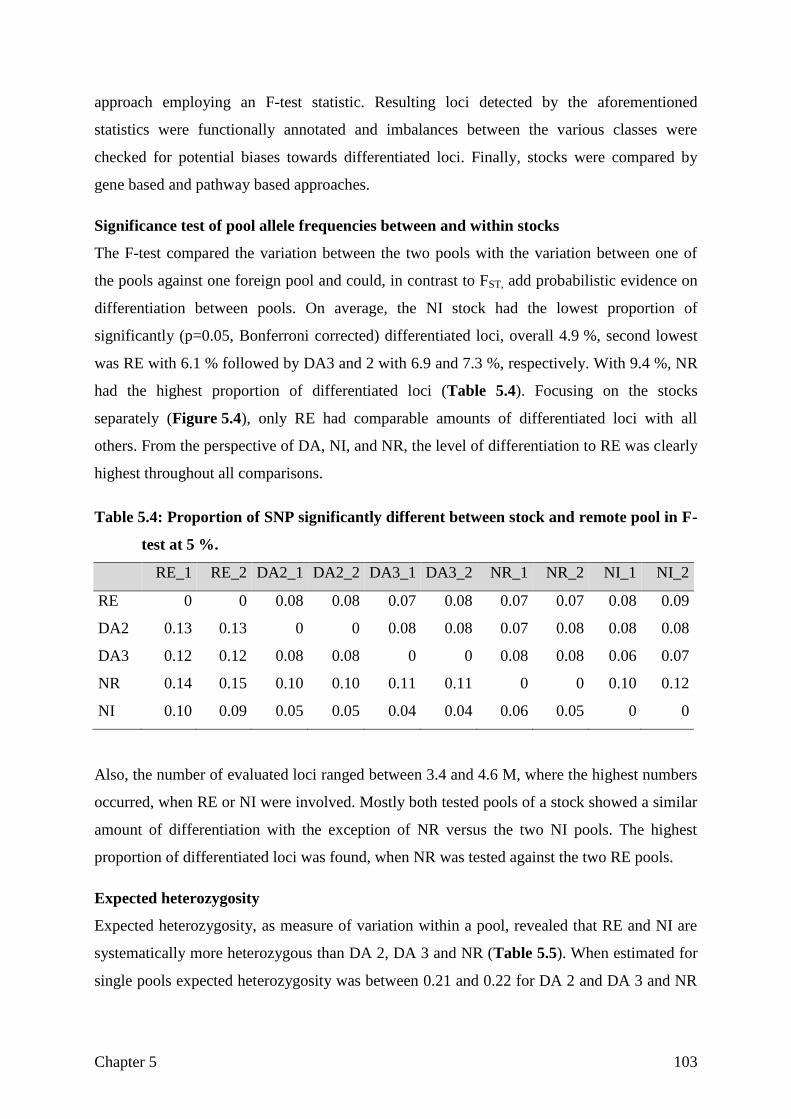
Chapter 5 103
approach employing an F-test statistic. Resulting loci detected by the aforementioned
statistics were functionally annotated and imbalances between the various classes were
checked for potential biases towards differentiated loci. Finally, stocks were compared by
gene based and pathway based approaches.
Significance test of pool allele frequencies between and within stocks
The F-test compared the variation between the two pools with the variation between one of
the pools against one foreign pool and could, in contrast to FST, add probabilistic evidence on
differentiation between pools. On average, the NI stock had the lowest proportion of
significantly (p=0.05, Bonferroni corrected) differentiated loci, overall 4.9 %, second lowest
was RE with 6.1 % followed by DA3 and 2 with 6.9 and 7.3 %, respectively. With 9.4 %, NR
had the highest proportion of differentiated loci (Table 5.4). Focusing on the stocks
separately (Figure 5.4), only RE had comparable amounts of differentiated loci with all
others. From the perspective of DA, NI, and NR, the level of differentiation to RE was clearly
highest throughout all comparisons.
Table 5.4: Proportion of SNP significantly different between stock and remote pool in F-
test at 5 %.
RE_1 RE_2 DA2_1 DA2_2 DA3_1 DA3_2 NR_1 NR_2 NI_1 NI_2
RE 0 0 0.08 0.08 0.07 0.08 0.07 0.07 0.08 0.09
DA2 0.13 0.13 0 0 0.08 0.08 0.07 0.08 0.08 0.08
DA3 0.12 0.12 0.08 0.08 0 0 0.08 0.08 0.06 0.07
NR 0.14 0.15 0.10 0.10 0.11 0.11 0 0 0.10 0.12
NI 0.10 0.09 0.05 0.05 0.04 0.04 0.06 0.05 0 0
Also, the number of evaluated loci ranged between 3.4 and 4.6 M, where the highest numbers
occurred, when RE or NI were involved. Mostly both tested pools of a stock showed a similar
amount of differentiation with the exception of NR versus the two NI pools. The highest
proportion of differentiated loci was found, when NR was tested against the two RE pools.
Expected heterozygosity
Expected heterozygosity, as measure of variation within a pool, revealed that RE and NI are
systematically more heterozygous than DA 2, DA 3 and NR (Table 5.5). When estimated for
single pools expected heterozygosity was between 0.21 and 0.22 for DA 2 and DA 3 and NR
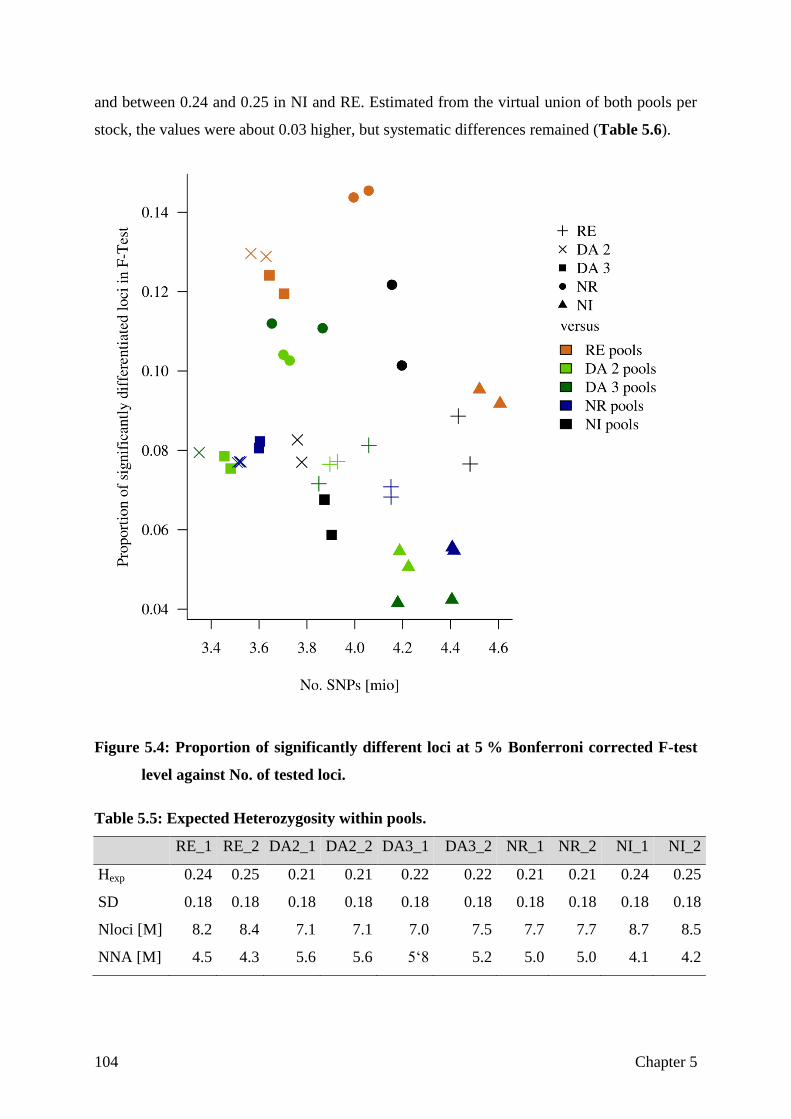
104 Chapter 5
and between 0.24 and 0.25 in NI and RE. Estimated from the virtual union of both pools per
stock, the values were about 0.03 higher, but systematic differences remained (Table 5.6).
Figure 5.4: Proportion of significantly different loci at 5 % Bonferroni corrected F-test
level against No. of tested loci.
Table 5.5: Expected Heterozygosity within pools.
RE_1 RE_2 DA2_1 DA2_2 DA3_1 DA3_2 NR_1 NR_2 NI_1 NI_2
Hexp 0.24 0.25 0.21 0.21 0.22 0.22 0.21 0.21 0.24 0.25
SD 0.18 0.18 0.18 0.18 0.18 0.18 0.18 0.18 0.18 0.18
Nloci [M] 8.2 8.4 7.1 7.1 7.0 7.5 7.7 7.7 8.7 8.5
NNA [M] 4.5 4.3 5.6 5.6 5‘8 5.2 5.0 5.0 4.1 4.2
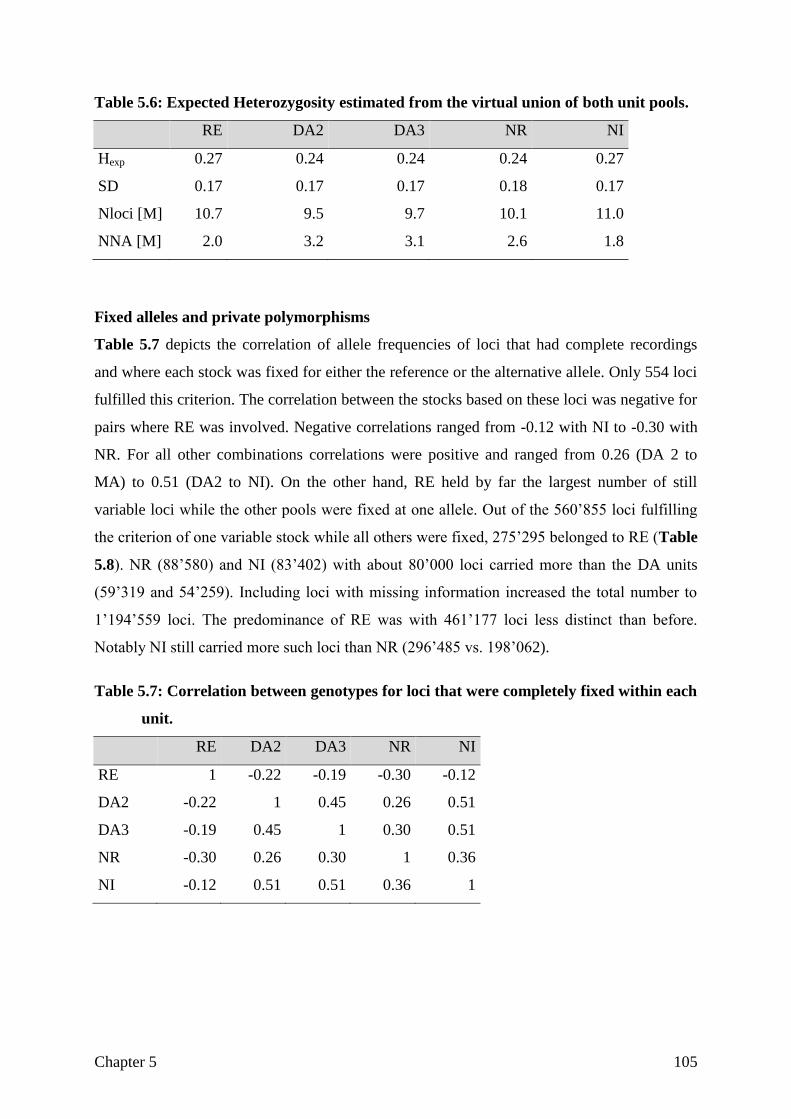
Chapter 5 105
Table 5.6: Expected Heterozygosity estimated from the virtual union of both unit pools.
RE DA2 DA3 NR NI
Hexp 0.27 0.24 0.24 0.24 0.27
SD 0.17 0.17 0.17 0.18 0.17
Nloci [M] 10.7 9.5 9.7 10.1 11.0
NNA [M] 2.0 3.2 3.1 2.6 1.8
Fixed alleles and private polymorphisms
Table 5.7 depicts the correlation of allele frequencies of loci that had complete recordings
and where each stock was fixed for either the reference or the alternative allele. Only 554 loci
fulfilled this criterion. The correlation between the stocks based on these loci was negative for
pairs where RE was involved. Negative correlations ranged from -0.12 with NI to -0.30 with
NR. For all other combinations correlations were positive and ranged from 0.26 (DA 2 to
MA) to 0.51 (DA2 to NI). On the other hand, RE held by far the largest number of still
variable loci while the other pools were fixed at one allele. Out of the 560’855 loci fulfilling
the criterion of one variable stock while all others were fixed, 275’295 belonged to RE (Table
5.8). NR (88’580) and NI (83’402) with about 80’000 loci carried more than the DA units
(59’319 and 54’259). Including loci with missing information increased the total number to
1’194’559 loci. The predominance of RE was with 461’177 loci less distinct than before.
Notably NI still carried more such loci than NR (296’485 vs. 198’062).
Table 5.7: Correlation between genotypes for loci that were completely fixed within each
unit.
RE DA2 DA3 NR NI
RE 1 -0.22 -0.19 -0.30 -0.12
DA2 -0.22 1 0.45 0.26 0.51
DA3 -0.19 0.45 1 0.30 0.51
NR -0.30 0.26 0.30 1 0.36
NI -0.12 0.51 0.51 0.36 1
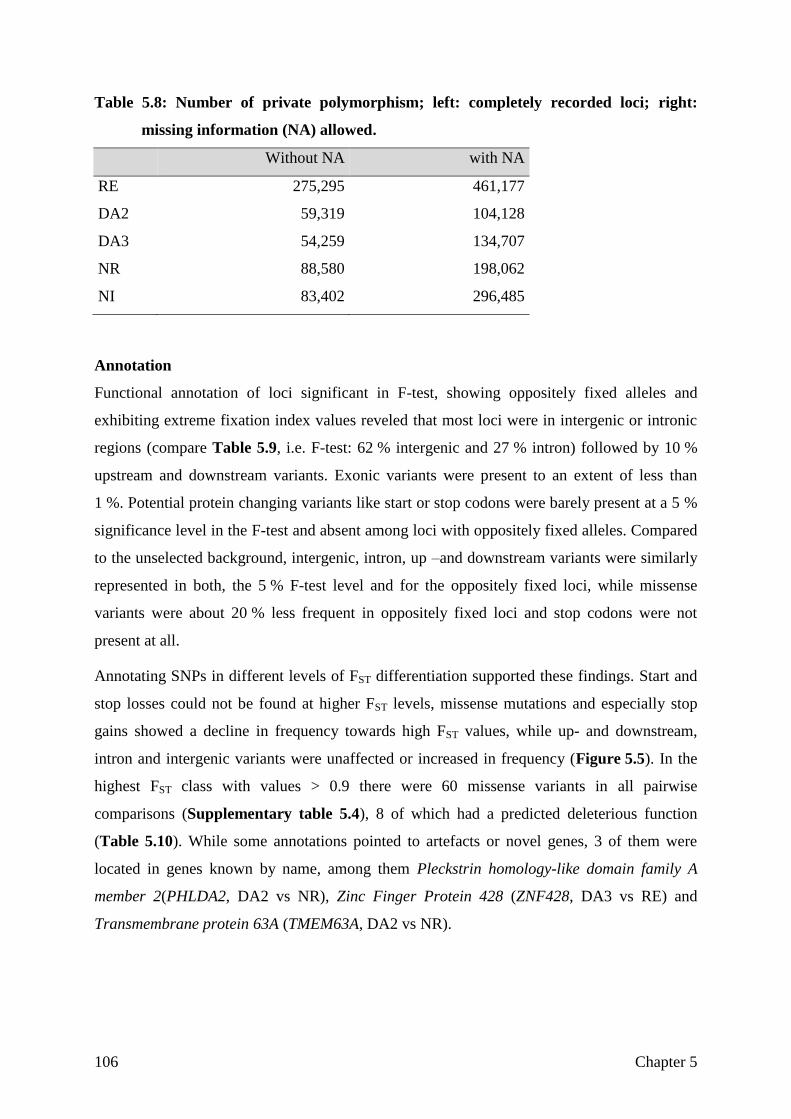
106 Chapter 5
Table 5.8: Number of private polymorphism; left: completely recorded loci; right:
missing information (NA) allowed.
Without NA with NA
RE 275,295 461,177
DA2 59,319 104,128
DA3 54,259 134,707
NR 88,580 198,062
NI 83,402 296,485
Annotation
Functional annotation of loci significant in F-test, showing oppositely fixed alleles and
exhibiting extreme fixation index values reveled that most loci were in intergenic or intronic
regions (compare Table 5.9, i.e. F-test: 62 % intergenic and 27 % intron) followed by 10 %
upstream and downstream variants. Exonic variants were present to an extent of less than
1 %. Potential protein changing variants like start or stop codons were barely present at a 5 %
significance level in the F-test and absent among loci with oppositely fixed alleles. Compared
to the unselected background, intergenic, intron, up –and downstream variants were similarly
represented in both, the 5 % F-test level and for the oppositely fixed loci, while missense
variants were about 20 % less frequent in oppositely fixed loci and stop codons were not
present at all.
Annotating SNPs in different levels of FST differentiation supported these findings. Start and
stop losses could not be found at higher FST levels, missense mutations and especially stop
gains showed a decline in frequency towards high FST values, while up- and downstream,
intron and intergenic variants were unaffected or increased in frequency (Figure 5.5). In the
highest FST class with values > 0.9 there were 60 missense variants in all pairwise
comparisons (Supplementary table 5.4), 8 of which had a predicted deleterious function
(Table 5.10). While some annotations pointed to artefacts or novel genes, 3 of them were
located in genes known by name, among them Pleckstrin homology-like domain family A
member 2(PHLDA2, DA2 vs NR), Zinc Finger Protein 428 (ZNF428, DA3 vs RE) and
Transmembrane protein 63A (TMEM63A, DA2 vs NR).

Chapter 5 107
Table 5.9: Relative amount of significantly differentiated and oppositely fixed loci per
functional class and relative abundance of loci in differentiated classes in
comparison to all background loci.
Relative amount of loci
per class
Relative abundance
compared to background
5 % bonf Opp. Fixed 5 % bonf Opp. fixed
3_prime_UTR_variant 0.3916 0.5342 1.0168 1.3002
5_prime_UTR_variant 0.0721 0.0981 1.0081 2.0146
coding_sequence_variant 0.0001 0 0.3129 0
downstream_gene_variant 5.0820 5.7021 0.9992 1.0587
intergenic_variant 61.6988 62.1784 0.9999 1.0083
intron_variant 26.9416 26.3410 0.9974 0.9898
missense_variant 0.2786 0.2617 0.9992 0.8039
start_lost 0.0006 0 1.0470 0
stop_gained 0.0030 0 0.9434 0
stop_gained,splice_region_variant 0.0001 0 0.5743 0
stop_gained,start_lost 0.0000 0 0 0
stop_lost 0.0001 0 0.9208 0
synonymous_variant 0.4815 0.3707 0.9977 0.8098
upstream_gene_variant 5.0498 4.5137 1.0169 0.8840
Table 5.10: Annotation of deleterious missense variants with pairwise FST of 1.
Chr Pos [bp] Pool 1 Pool 2 Ensembl ID RS ID SIFT Gene name
2 429‘370 DA_2 NR_4 ENSSSCG00000021597 rs320902190 0.03 PHLDA2
2 15‘249‘414 DA_2 NR_4 ENSSSCG00000029368 - 0 -
6 46‘206‘421 DA_3 RE_1 ENSSSCG00000003059 - 0.02 ZNF428
10 16‘012‘840 DA_2 NR_4 ENSSSCG00000010854 rs792023778 0.01 TMEM63A
14 7‘880‘409 DA_3 NR_4 ENSSSCG00000025094 - 0.01 -
14 7‘880‘409 NR_4 NI_5 ENSSSCG00000025094 - 0.01 -
16 86‘466‘849 NR_4 NI_5 ENSSSCG00000020913 rs711954795 0.04 -
17 29‘494‘436 NR_4 RE_1 ENSSSCG00000024692 rs344262225 0.03 -

108 Chapter 5
Figure 5.5: Relative abundance of functional SNP classes in dependence from pairwise
FST bewteen units.
Chapter 5 109
Annotation of loci with variability in only one stock, while all other stocks were fixed,
resembled the fractions of functional classes already known from the F-test and FST
annotations (Table 5.11), but due the higher number of private variable loci in RE, the
absolute numbers of loci annotated to potentially protein changing classes, such as missense
mutations, was therefore higher in RE (1’499) than in all other stocks. Both DA stocks carried
the lowest number of missense mutations (356 and 325). Still, every stock carried at least one
stop codon gain or loss, RE even 11.
Gene based and pathway tests
The Kolmogorov-Smirnov based on pairwise testing of 316 annotated KEGG pathways
detected only the pathway “Glutamatergic synapse” to be differentiated between DA3 and NR
at the 5 % Bonferroni corrected level. Glutamatergic synapses are involved in signal
transduction, specifically neuronal excitability, in the nervous system (Bergles et al. 2000)
and are vital for brain function (Siddoway et al. 2011). No single gene was found to be
significantly differentiated.
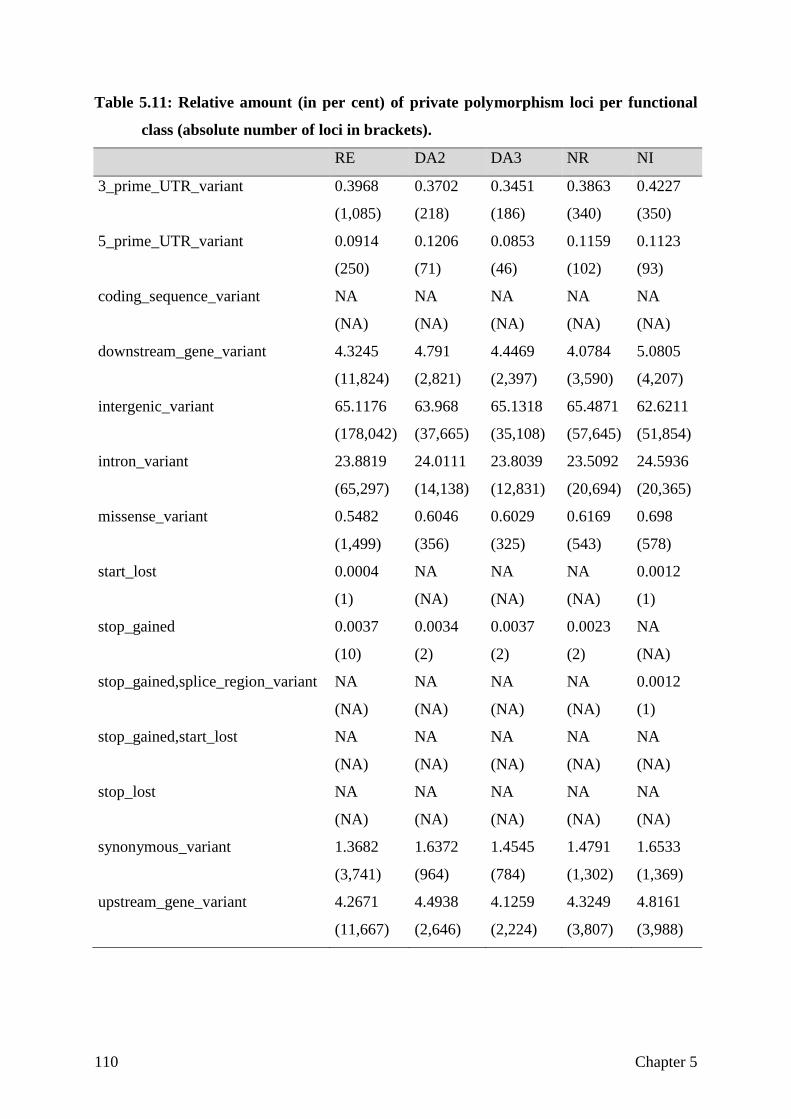
110 Chapter 5
Table 5.11: Relative amount (in per cent) of private polymorphism loci per functional
class (absolute number of loci in brackets).
RE DA2 DA3 NR NI
3_prime_UTR_variant 0.3968
(1,085)
0.3702
(218)
0.3451
(186)
0.3863
(340)
0.4227
(350)
5_prime_UTR_variant 0.0914
(250)
0.1206
(71)
0.0853
(46)
0.1159
(102)
0.1123
(93)
coding_sequence_variant NA
(NA)
NA
(NA)
NA
(NA)
NA
(NA)
NA
(NA)
downstream_gene_variant 4.3245
(11,824)
4.791
(2,821)
4.4469
(2,397)
4.0784
(3,590)
5.0805
(4,207)
intergenic_variant 65.1176
(178,042)
63.968
(37,665)
65.1318
(35,108)
65.4871
(57,645)
62.6211
(51,854)
intron_variant 23.8819
(65,297)
24.0111
(14,138)
23.8039
(12,831)
23.5092
(20,694)
24.5936
(20,365)
missense_variant 0.5482
(1,499)
0.6046
(356)
0.6029
(325)
0.6169
(543)
0.698
(578)
start_lost 0.0004
(1)
NA
(NA)
NA
(NA)
NA
(NA)
0.0012
(1)
stop_gained 0.0037
(10)
0.0034
(2)
0.0037
(2)
0.0023
(2)
NA
(NA)
stop_gained,splice_region_variant NA
(NA)
NA
(NA)
NA
(NA)
NA
(NA)
0.0012
(1)
stop_gained,start_lost NA
(NA)
NA
(NA)
NA
(NA)
NA
(NA)
NA
(NA)
stop_lost NA
(NA)
NA
(NA)
NA
(NA)
NA
(NA)
NA
(NA)
synonymous_variant 1.3682
(3,741)
1.6372
(964)
1.4545
(784)
1.4791
(1,302)
1.6533
(1,369)
upstream_gene_variant 4.2671
(11,667)
4.4938
(2,646)
4.1259
(2,224)
4.3249
(3,807)
4.8161
(3,988)
Chapter 5 111
Discussion
The aim of our study was to identify, if the integrity of the breed Goettingen Minipig was
compromised by the current production and genetic management system that relies on genetic
isolation of production units. First, the classification of the GMP samples in the context of
various pig breeds representing worldwide porcine genetic variation was evaluated with
phylogenetic and population genetic methods. Second, genetic identity within the breed was
assessed by multiple approaches describing variability within and differentiation between the
separated stocks.
Discriminability of the Goettingen Minipig from other pig breeds
Our PCA results based on Reynolds distance and FST show clearly distinct groups of
European pigs, Asian pigs and Goettingen Minipigs. The distance between the European and
Asian breeds reflects the current scientific consensus that domestication happened
independently in Europe and Asia about 9000 year ago (Giuffra et al. 2000). The European
breeds appear generally closer to each other, which might be explained, through the different
domestication processes in both centers: while the European breeds emerged more or less
directly from relatively uniform wild boar strains (Scandura et al. 2008), the Asian
domestication history is characterized by complex human driven dispersal of domesticated
pigs in the south east Asian archipelagos, sometimes interrupted by feral states, before pigs
eventually reached the Asian mainland (Larson et al. 2007). This might explain why the
European group clusters closely together in the UPGMA tree with higher resampling support
than the Asian group. The tree based on genome wide SNP, clusters on one hand Xiang,
Meishan and the South Chinese wild boars and on the other hand Jiangquhai and the North
Chinese wild boars together, interrupted by the Mini-LEWE. This is in contradiction to Ai et
al. (2015) where Meishan clustered together with the North Chinese wild boars and could
also support the low resampling probabilities found among the Asian breeds. The Mini-
LEWE, a composite miniature breed, developed by crossing Vietnamese potbellied pigs,
Saddlebacks and German Landrace, is in our study represented by a DNA pool of 10 females
and a virtual pool made up from two sequenced individuals. Although it appears, that
individual sequences are not fully comparable to pools, since we found that mixing of
individual and pool sequences leads to clustering of the respective sample types (Results not
shown). Still, the virtual and the DNA Mini-LEWE pools are clearly identified as one breed.
Therefore the virtual pooling seems to be a suitable measure to make different types of data
comparable. In the case of the GMP, both types were mixed and each analysis, PCA and the
112 Chapter 5
UPGMA tree shows, that it is easily discriminable from all other breeds. The phylogenetic
tree supports a GMP clade with 100 % resampling support, which is located among the Asian
pig breeds. This can be explained by the cross-breeding history in which Vietnamese
potbellied pigs, Minnesota Minipigs and German Landrace were involved (Glodek and Oldigs
1981). An earlier study (Gaerke et al. 2014) estimated that about 70 % of the GMP genome
are of Asian origin. In the PCA, the first component identifies the difference between the
GMP and all others as the main source of variation, accounting for 78 % of the genetic
variability. Following the interpretation of Kim et al. (2005), the average FST between the
three groups lying between 0.25 and 0.35 suggests, that still a major part of the total
variability can be assigned to differences among individuals. Anyway, albeit using
microsatellite data, they encountered similar estimates for FST values in a set of breeds
comparable to this study. Therefore we conclude that the GMP is still a distinct breed that can
be easily distinguished from other breeds.
Variation and Differentiation within and between the GMP pools
While it seems particularly easy to distinguish the GMP from other pig breeds, it is more
difficult, but relevant from a breeders’ point of view, to determine, if genetic isolation of the
five breeding units has led to differentiated subpopulations. Applying PCA on the
differentiation and distance measures (FST and DR) between the ten GMP pools, we were able
to see a trend to three subgroups consisting of NR, RE, and a cluster comprising NI and DA,
respectively. The presence of a certain level of stratification is expected and has been
observed before, i.e. in studies in dogs (Quignon et al. 2007) or sheep (Kijas et al. 2009). In
the latter study, several breeds with heterogeneous breeding background split into sub
clusters, for example dependent on their origin (American Suffolk vs British Suffolk, FST ~
0.058 - 0.064; African vs American Dorpers, FST = 0.053) or phenotypic differences
(Australian Poll Dorset vs American Dorset, FST = 0.082), while New Zealand and American
Texel appeared indistinguishable (FST = 0.025). Studies comparing clearly distinct pig and
cattle breeds, respectively, found FST values between 0.06 and 0.40 (Ai et al. 2013; McKay et
al. 2008). FST of ~ 0.1 was found between relatively similar breeds, for example Large White
and Landrace, while values higher 0.3 indicated major differentiation, such as between
Nellore and Holstein cattle or Asian and European pig breeds. These values matched our
findings between the European, Asian and GMP groups. Within the GMP, even two randomly
composed pools from the same unit had a minimum differentiation of about 0.035. Between
the aforementioned clusters FST was about 0.05 and therefore close to the differentiation
Chapter 5 113
observed between the sheep breeds from separate origins. We explain this by genetic drift and
slight differences in the actual breeding management, since the three clusters also belong to
the three partners in GMP breeding, even though all follow generally the same breeding goal.
Comparing our results with the FST levels found in the aforementioned studies implicates that
our stocks might be at the edge of splitting into sub-populations, and, when focusing on
individual loci, we expected that not all genomic regions between all pairwise combinations
of the five units to be similarly differentiated. The F-test (Table 5.4) identified about 4 to
14.5 % of the genome to be objected by differentiation which covers the range found in a
comparable study by Amaral et al. (2011). We hypothesize that genetic differentiation should
be attributed to drift rather than to selection, if it affects neutral loci relatively more than loci
with putative harmful consequences on protein translation, such as stop codon gains or
deleterious missense mutations. This was supported by an underrepresentation of detrimental
variation among highly differentiated loci. The eight loci representing deleterious missense
mutations with maximum FST were located in genes without known sensible relation to traits
important in the GMP. Seven of these SNPs are identified when the NR subpopulation is
involved in a pairwise comparison, indicating that NR might have drifted apart from the
remaining populations relative more than the others. When focusing on the subset of loci
where all units are fixed for either allele, it is striking, that RE more often seems to be fixed
for the opposite allele compared to the other stocks, as reflected by the negative pairwise
correlation of the frequencies with the other units.
While the analysis of single crucial mutations could be misleading due to the complex nature
of many traits of interest, integration of systems biology approaches, specifically pathway
annotations, might be beneficial (Stranger et al. 2011). The only pathway found differentiated
between stocks, DA3 and NR, was ‘Glutamatergic synapse’, regulating the neuronal
excitability (Niswender and Conn 2010), which could lead to differences of the neuronal
signal transduction. Besides being involved in disorders such as schizophrenia and depression
(Sanacora et al. 2008; Meador-Woodruff et al. 2003), constraints in signal transduction are
also known to alter the locomotion and behavior of the respective organism (Chiel and Beer
1997; Picetti et al. 1997) and could be explained by hidden selection due to different handling
strategies. Anyway, no additional differentiation could be found between one of the two
aforementioned stocks and another stock in this pathway. Therefore, differentiation is rather
likely to be incidental, than systematic, since handling or phenotype selection on behaviour is
the same in DA2 and DA3. When we looked at expected heterozygosity as a measure of
114 Chapter 5
variability, RE and NI exhibit the highest values. It is even more notable, that RE holds more
private polymorphisms than all other units together, making it an indispensable resource of
genetic variability. We explain this with the consequent implementation of the mating scheme
based on the optimum genetic contribution concept (Meuwissen 1997) in RE.
Not only is the preservation of a common genetic identity for all stocks of the GMP important
(Bollen and Ellegaard 1997), but also the risk of inbreeding depression and loss of variation
due to drift is increased in the artificially reduced subpopulations (Lacy 1987). To counter this
in future, two strategies appear feasible: First, the exchange of genetic material, e.g. via
artificial insemination, and second, selection of a most diverse set of breeders as basis for
future breeding. The first strategy, commonly used by dog breeders, would harbor various
risks of spreading diseases and disorders between units. In this scenario, semen from RE, the
major reservoir of remaining variability, should be used to inseminate breeders in the other
units. The second option of selecting a most diverse set of breeders from the respective unit
also has the potential to increase heterozygosity, as can be observed in NI whose founding
population was established in that very way. It can be taken as an example of the Bulmer
effect (Bulmer 1971) that genetic variation in the relatively large stock of DA3 wasn’t lost
while selection and assortative mating was conducted, and could be largely recovered when
the NI founders were chosen for maximum diversity.
Conclusion
Our study based on assessment of differentiation between the genetically isolated breeding
units of the GMP found evidence for stratification, even though it appears less than in other
breeds, and the whole GMP breed is still easily discriminable from other pig breeds.
Functional annotation revealed, that loci with functional consequences are less differentiated
than neutral loci, which implies that the forces differentiating the units appear to be rather
drift than selective pressures. The pathway analyses, used to analyze more complex
inheritance of traits, could identify just one pathway with possible link to behavior as being
differentiated between two stocks.
Albeit animal exchange seems not yet necessary, the RE subpopulation harbors the highest
amount of genetic variation and seems to be most similar to the other units in pathways
related to human diseases and appears therefore as the potential source for exchange animals.
Competing interests
The authors declare that there are no competing interests.

Chapter 5 115
Author contributions
CR, LFM and HS conceived the study and organized the sampling. CR conducted most
analyses and wrote the manuscript. JG assisted in raw data preparation and variant calling,
NTH provided the gene-based and pathway tests, ARS designed the F-test-statistic, SW
designed and performed DNA extraction and pooling. All authors were involved in
interpretation of the results and agreed on the final version of the manuscript.
Acknowledgements
We acknowledge financial support by Ellegaard Göttingen Minipigs A/S. We are especially
grateful to all technical and scientific staff involved in obtaining the blood samples and
managing the shipment, namely Pernille Birch, Ann-Sofie Søndergaard, Ron Eisenmenger,
Bambi Jasmin, Courtney Wadsworth, Naoki Hayashi, Kyo Ki. We thank the authors of the
respective studies to make their sequence data publicly accessible.
Ethics statement
Blood samples were obtained within the course of the regular health monitoring schemes by
state approved veterinarians, in accordance with the respective national regulations.
References
Ai H, Fang X, Yang B, Huang Z, Chen H, Mao L, Zhang F, Zhang L, Cui L, He W, et al.
2015. Adaptation and possible ancient interspecies introgression in pigs identified by
whole-genome sequencing. Nat Genet 47: 217–25.
Ai H, Huang L, Ren J. 2013. Genetic Diversity, Linkage Disequilibrium and Selection
Signatures in Chinese and Western Pigs Revealed by Genome-Wide SNP Markers ed.
C.A. Kozak. PLoS One 8: e56001.
Aken BL, Ayling S, Barrell D, Clarke L, Curwen V, Fairley S, Fernandez Banet J, Billis K,
García Girón C, Hourlier T, et al. 2016. The Ensembl gene annotation system. Database
2016: baw093.
Amaral AJ, Ferretti L, Megens H-J, Crooijmans RPMA, Nie H, Ramos-Onsins SE, Perez-
Enciso M, Schook LB, Groenen MAM. 2011. Genome-Wide Footprints of Pig
Domestication and Selection Revealed through Massive Parallel Sequencing of Pooled
DNA ed. H. Ellegren. PLoS One 6: e14782.
116 Chapter 5
Bergles DE, Roberts JDB, Somogyi P, Jahr CE. 2000. Glutamatergic synapses on
oligodendrocyte precursor cells in the hippocampus. Nature 405: 187–191.
Bollen P, Ellegaard L. 1997. The Göttingen Minipig in Pharmacology and Toxicology.
Pharmacol Toxicol 80: 3–4.
Bosse M, Megens H-J, Madsen O, Crooijmans RPMA, Ryder OA, Austerlitz F, Groenen
MAM, de Cara MAR. 2015. Using genome-wide measures of coancestry to maintain
diversity and fitness in endangered and domestic pig populations. Genome Res 25: 970–
981.
Bulmer MG. 1971. The Effect of Selection on Genetic Variability. Am Nat 105: 201–211.
Chiel HJ, Beer RD. 1997. The brain has a body: adaptive behavior emerges from interactions
of nervous system, body and environment. Trends Neurosci 20: 553–557.
Eding H, Bennewitz J. 2007. Measuring genetic diversity in farm animals. In Utilisation and
conservation of farm animal genetic resources (ed. K. Oldenbroek), pp. 103–130,
Wageningen Academic Publishers, Wageningen, The Netherlands.
Fang X, Mou Y, Huang Z, Li Y, Han L, Zhang Y, Feng Y, Chen Y, Jiang X, Zhao W, et al.
2012. The sequence and analysis of a Chinese pig genome. Gigascience 1: 16.
Fitzpatrick JL, Evans JP. 2009. Reduced heterozygosity impairs sperm quality in endangered
mammals. Biol Lett 5: 320–3.
Gaerke C, Ytournel F, Sharifi a. R, Pimentel ECG, Ludwig A, Simianer H. 2014. Footprints
of recent selection and variability in breed composition in the Göttingen Minipig
genome. Anim Genet 381–391.
Giuffra E, Kijas JMH, Amarger V, Carlborg O, Jeon J-T, Andersson L. 2000. The Origin of
the Domestic Pig: Independent Domestication and Subsequent Introgression. Genetics
154: 1785–1791.
Glodek P, Oldigs B. 1981. Das Göttinger Miniaturschwein. Parey, Berlin and Hamburg.
Groenen MAM, Archibald AL, Uenishi H, Tuggle CK, Takeuchi Y, Rothschild MF, Rogel-
gaillard C, Park C, Megens H, Li S, et al. 2012. Analyses of pig genomes provide
insight into porcine demography and evolution. Nature 491: 393–398.
Hedrick PW. 1994. Purging inbreeding depression and the probability of extinction: full-sib
mating. Heredity (Edinb) 73: 363–372.
Chapter 5 117
Kanehisa M, Goto S. 2000. KEGG: kyoto encyclopedia of genes and genomes. Nucleic Acids
Res 28: 27–30.
Kijas JW, Townley D, Dalrymple BP, Heaton MP, Maddox JF, McGrath A, Wilson P,
Ingersoll RG, McCulloch R, McWilliam S, et al. 2009. A Genome Wide Survey of SNP
Variation Reveals the Genetic Structure of Sheep Breeds ed. H. Ellegren. PLoS One 4:
e4668.
Kim TH, Kim KS, Choi BH, Yoon DH, Jang GW, Lee KT, Chung HY, Lee HY, Park HS,
Lee JW. 2005. Genetic structure of pig breeds from Korea and China using
microsatellite loci analysis. J Anim Sci 83: 2255.
Lacy RC. 1987. Loss of Genetic Diversity from Managed Populations: Interacting Effects of
Drift, Mutation, Immigration, Selection, and Population Subdivision. Conserv Biol 1:
143–158.
Larson G, Cucchi T, Fujita M, Matisoo-Smith E, Robins J, Anderson A, Rolett B, Spriggs M,
Dolman G, Kim T-H, et al. 2007. Phylogeny and ancient DNA of Sus provides insights
into neolithic expansion in Island Southeast Asia and Oceania. Proc Natl Acad Sci U S
A 104: 4834–9.
Li H, Durbin R. 2009. Fast and accurate short read alignment with Burrows-Wheeler
transform. Bioinformatics 25: 1754–60.
McKay SD, Schnabel RD, Murdoch BM, Matukumalli LK, Aerts J, Coppieters W, Crews D,
Neto E, Gill CA, Gao C, et al. 2008. An assessment of population structure in eight
breeds of cattle using a whole genome SNP panel. BMC Genet 9: 37.
McKenna A, Hanna M, Banks E, Sivachenko A, Cibulskis K, Kernytsky A, Garimella K,
Altshuler D, Gabriel S, Daly M, et al. 2010. The Genome Analysis Toolkit: a
MapReduce framework for analyzing next-generation DNA sequencing data. Genome
Res 20: 1297–303.
Meador-Woodruff JH, Clinton SM, Beneyto M, McCullumsmith RE. 2003. Molecular
Abnormalities of the Glutamate Synapse in the Thalamus in Schizophrenia. Ann N Y
Acad Sci 1003: 75–93.
Meuwissen TH. 1997. Maximizing the response of selection with a predefined rate of
inbreeding. J Anim Sci 75: 934.
118 Chapter 5
Niswender CM, Conn PJ. 2010. Metabotropic Glutamate Receptors: Physiology,
Pharmacology, and Disease. Annu Rev Pharmacol Toxicol 50: 295–322.
Picard. 2009. http://picard.sourceforge.net/. Accessed 2013-07-26.
Picetti R, Saiardi A, Samad TA, Bozzi Y, Baik J-H, Borrelli E. 1997. Dopamine D2
Receptors in Signal Transduction and Behavior. Crit Rev Neurobiol 11: 121–142.
Quignon P, Herbin L, Cadieu E, Kirkness EF, Hédan B, Mosher DS, Galibert F, André C,
Ostrander EA, Hitte C. 2007. Canine Population Structure: Assessment and Impact of
Intra-Breed Stratification on SNP-Based Association Studies ed. P. Awadalla. PLoS
One 2: e1324.
Reimer C, Rubin C-J, Weigend S, Waldmann K-H, Distl O, Simianer H. 2014. The Minipig
Genome Harbors Regions of Selection for Growth. 10th World Congr Genet Appl to
Livest Prod Proceedings; Vancouver, BC, Canada ; August 17-22, 2014.
Rubin C-J, Megens HJ, Martinez Barrio A, Maqbool K, Sayyab S, Schwochow D, Wang C,
Carlborg O, Jern P, Jorgensen CB, et al. 2012. Strong signatures of selection in the
domestic pig genome. Proc Natl Acad Sci U S A 109: 19529–19536.
Sanacora G, Zarate CA, Krystal JH, Manji HK. 2008. Targeting the glutamatergic system to
develop novel, improved therapeutics for mood disorders. Nat Rev Drug Discov 7: 426–
437.
Scandura M, Iacolina L, Crestanello B, Pecchioli E, Di Benedetto MF, Russo V, Davoli R,
Apollonio M, Bertorelle G. 2008. Ancient vs. recent processes as factors shaping the
genetic variation of the European wild boar: are the effects of the last glaciation still
detectable? Mol Ecol 17: 1745–62.
Schliep KP. 2011. phangorn: phylogenetic analysis in R. Bioinformatics 27: 592–593.
Sherry ST, Ward M-H, Kholodov M, Baker J, Phan L, Smigielski EM, Sirotkin K. 2001.
dbSNP: the NCBI database of genetic variation. Nucleic Acids Res 29: 308–311.
Siddoway B, Hou H, Xia H. 2011. Glutamatergic Synapses: Molecular Organisation. In eLS,
John Wiley & Sons, Ltd, Chichester, UK.
Stranger BE, Stahl EA, Raj T. 2011. Progress and promise of genome-wide association
studies for human complex trait genetics. Genetics 187: 367–83.
Chapter 5 119
Swindle MM, Makin A, Herron AJ, Clubb FJ, Frazier KS. 2012. Swine as models in
biomedical research and toxicology testing. Vet Pathol 49: 344–56.
Vamathevan JJ, Hall MD, Hasan S, Woollard PM, Xu M, Yang Y, Li X, Wang X, Kenny S,
Brown JR, et al. 2013. Minipig and beagle animal model genomes aid species selection
in pharmaceutical discovery and development. Toxicol Appl Pharmacol 270: 149–157.
Van der Auwera GA, Carneiro MO, Hartl C, Poplin R, del Angel G, Levy-Moonshine A,
Jordan T, Shakir K, Roazen D, Thibault J, et al. 2013. From FastQ Data to High-
Confidence Variant Calls: The Genome Analysis Toolkit Best Practices Pipeline. In
Current Protocols in Bioinformatics, p. 11.10.1-11.10.33, John Wiley & Sons, Inc.,
Hoboken, NJ, USA.
Wright S. 1922. Coefficients of Inbreeding and Relationship. Am Nat 56: 330–338.
Supplementary Material
Accessible through: https://figshare.com/s/228890c2f2675409d6cd
Supplementary table 5.1: Genome wide FST (upper triangle) and Reynolds distance (lower
triangle)
Supplementary table 5.2: Number of SNPs significant at 5% Bonferroni corrected
significance level in F-Test
Supplementary table 5.3: Functional annotation of SNPs oppositely fixed between one unit
and a distant pool from another unit
Supplementary table 5.4: Functional annotation of SNPs dependent on the FST value
between two units


CHAPTER 6
General Discussion
122 Chapter 6
General discussion
This thesis aimed to evaluate the potential of next-generation sequencing in the Goettingen
Minipig for discovery of the genetic background of miniaturization and to elucidate the effect
of population subdivision on the genome. It has taken place during a period of massive
progress in the field of sequencing studies on livestock. In retrospect, some decisions
naturally would have been taken differently, if the technological progress was foreseeable
right from the start. This chapter discusses the important role of the chosen reference genome
Sscrofa 10.2 and possible alternatives, as well as the chosen sequencing strategy including
sample selection. It addresses what the possible role of highly differentiated functional SNPs
might be and how results can be interpreted. The second study focused only on
differentiation, so in turn, one section tries to elucidate if our stocks are not only non-
differentiated, but if selection is actually targeting the same genes in all stocks. Finally, we
present some initial results of a preliminary study on structural variation and its potential
impact on the GMP.
The role of the reference genome
Application of next generation sequencing techniques in livestock have provided detailed
knowledge about the inheritance and genetic background of relevant traits (Andersson et al.
2012; Imsland et al. 2012; Herrero-Medrano et al. 2014). Nevertheless, few of these studies,
even though the term is regularly used, revealed true whole genome sequencing (WGS),
which can be understood as the de-novo assembly of a complete genome, in the narrow sense.
Most of these approaches should rather be considered as what is named whole-genome re-
sequencing (WGR, Bentley 2006). In contrast to WGS, WGR relies on a reference genome,
which must be assembled beforehand. The samples, mostly sequenced in short reads, can then
be mapped against the known reference genome to identify genetic dissimilarities.
The quality of WGR studies is of course dependent on the representation of the regions of
interest, which are unknown prior to the analysis, in the chosen reference sequence. An
interesting example to illustrate this is coat colour in the swine. Rubin et al. (2012) found that
a combination of duplications and a splice mutation underlie the belted and uniformly white
coat phenotypes, using the reference sequence of a Duroc pig (Archibald et al. 2010), which
itself is of wild-type coat colour. However, if for example, a landrace sow had been chosen as
the reference animal, that duplicated structure would not have been identified easily.
Therefore, the choice of an appropriate reference genome is of foremost importance for the
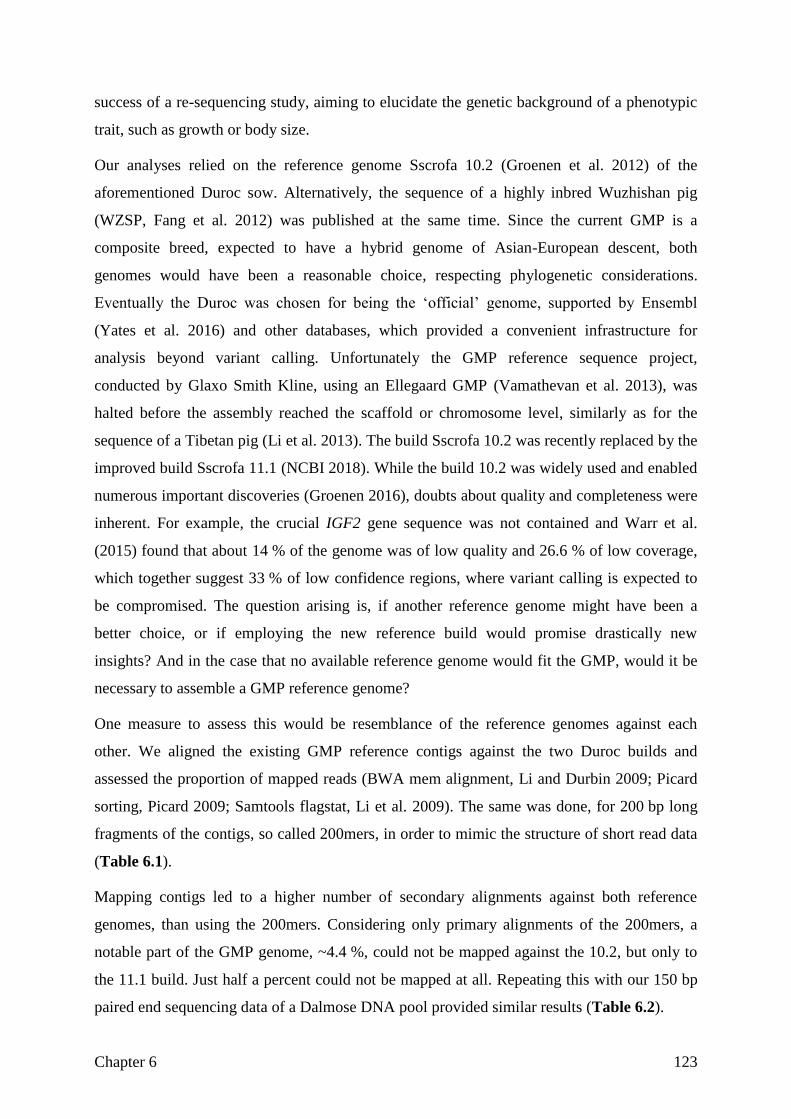
Chapter 6 123
success of a re-sequencing study, aiming to elucidate the genetic background of a phenotypic
trait, such as growth or body size.
Our analyses relied on the reference genome Sscrofa 10.2 (Groenen et al. 2012) of the
aforementioned Duroc sow. Alternatively, the sequence of a highly inbred Wuzhishan pig
(WZSP, Fang et al. 2012) was published at the same time. Since the current GMP is a
composite breed, expected to have a hybrid genome of Asian-European descent, both
genomes would have been a reasonable choice, respecting phylogenetic considerations.
Eventually the Duroc was chosen for being the ‘official’ genome, supported by Ensembl
(Yates et al. 2016) and other databases, which provided a convenient infrastructure for
analysis beyond variant calling. Unfortunately the GMP reference sequence project,
conducted by Glaxo Smith Kline, using an Ellegaard GMP (Vamathevan et al. 2013), was
halted before the assembly reached the scaffold or chromosome level, similarly as for the
sequence of a Tibetan pig (Li et al. 2013). The build Sscrofa 10.2 was recently replaced by the
improved build Sscrofa 11.1 (NCBI 2018). While the build 10.2 was widely used and enabled
numerous important discoveries (Groenen 2016), doubts about quality and completeness were
inherent. For example, the crucial IGF2 gene sequence was not contained and Warr et al.
(2015) found that about 14 % of the genome was of low quality and 26.6 % of low coverage,
which together suggest 33 % of low confidence regions, where variant calling is expected to
be compromised. The question arising is, if another reference genome might have been a
better choice, or if employing the new reference build would promise drastically new
insights? And in the case that no available reference genome would fit the GMP, would it be
necessary to assemble a GMP reference genome?
One measure to assess this would be resemblance of the reference genomes against each
other. We aligned the existing GMP reference contigs against the two Duroc builds and
assessed the proportion of mapped reads (BWA mem alignment, Li and Durbin 2009; Picard
sorting, Picard 2009; Samtools flagstat, Li et al. 2009). The same was done, for 200 bp long
fragments of the contigs, so called 200mers, in order to mimic the structure of short read data
(Table 6.1).
Mapping contigs led to a higher number of secondary alignments against both reference
genomes, than using the 200mers. Considering only primary alignments of the 200mers, a
notable part of the GMP genome, ~4.4 %, could not be mapped against the 10.2, but only to
the 11.1 build. Just half a percent could not be mapped at all. Repeating this with our 150 bp
paired end sequencing data of a Dalmose DNA pool provided similar results (Table 6.2).
124 Chapter 6
This indicates that repeating the experiment with the new reference genome, probably
including more samples, could lead to substantially improved results, since we must assume,
that about 5 % of the GMP genome are not represented in the 10.2 reference, including
important genes, i.e. IGF2, and further 30 % of the represented regions are of low confidence.
At this point it seems that the new reference genome 11.1 is suitable enough for the GMP and
there is no need to develop a GMP reference genome.
Table 6.1: Statistics of mapping the GMP reference against Duroc builds 10.2 and 11.1.
SscrofaMinipig Contigs 200mers
10.2 11.1 10.2 11.1
Raw reads 231.585 231.585 11.908.496 11.908.496
reads total 515.052 320.704 12.309.864 12.072.650
Mapped 507.762 319.889 11.713.065 12.013.643
secondary 283.467 89.119 401.368 164.154
unmapped 7.290 815 596.799 59.007
Mapped 96.85% 99.65% 94.99% 99.50%
mapped [%], incl. Secondary 98.58% 99.75% 95.15% 99.51%
Secondary of mapped reads [%] 55.83% 27.86% 3.43% 1.37%
Table 6.2: Statistics of mapping a Dalmose pool against Duroc reference.
Da_21 10.2 11.1
Raw reads 467.844.016 467.844.016
Reads total 479.698.361 474.464.862
mapped 457.643.218 471.766.607
properly paired 391.281.350 421.321.004
secondary 11.854.345 6.620.846
unmapped 22.055.143 2.698.255
mapped [%] 95.29% 99.42%
mapped [%], incl. Secondary 95.40% 99.43%
Secondary of mapped reads [%] 2.59% 1.40%
Chapter 6 125
Sample selection and sequencing strategy
The costs of sequencing are constantly decreasing (NHGRI 2016) which we experienced in
majorly different prices for our two projects, where sequencing was conducted with a time
difference of just three years. A mammalian genome at a decent coverage of ~15X would cost
about 1,500€ today, which is 10 to 15 times more expensive than array genotyping. This
effectively limits the number of samples in a study. A cost effective approach chosen in other
studies (Zhu et al. 2012) is to sequence DNA pools instead of individual samples. In pool-seq,
equimolar amounts of DNA from individuals are pooled and sequenced as one sample, which
makes it impossible to determine the origin of each read or construct long haplotypes from
short reads, without further methods, such as barcoding. It has been shown that allele
frequencies, estimated from reads counts, are sufficiently reliable (Anand et al. 2016; Zhu et
al. 2012). Still, there are some disadvantages: Pool-seq is inherently afflicted with a bias
introduced by pooling and sequencing errors (Kofler et al. 2011), which is particularly due to
a problem of differentiating between these error types and real rare variants. Rare variants are
defined as variants with a minor allele frequency less than 1 % (Anand et al. 2016) to less
than 5 % (Kim et al. 2010) and are assumed to explain a major part of genetic variation
(Anand et al. 2016). Furthermore, many current statistical approaches to identify rare variants
were initially not designed for pool-seq data (Wang et al. 2010b). In addition, 𝐹𝑆𝑇 estimates
from pooled and individual sequences seem to be differently distributed (Bersaglieri et al.
2004; Akey et al. 2002), a finding we also noticed in chapter 5. A possible explanation is a
high number of falsely positive detected differentiations, when either coverage or sample size
are too low. Lynch et al. (2014) estimated that at minimum of both 100 samples and 100X
coverage are necessary to reliably asses differentiation and reduce the number of false
positives. On the other hand, sequencing much deeper is not seen as an improvement.
Approximately 1X coverage per animal per sample in a pool should be optimal in terms of
cost-efficiency (Lynch et al. 2014). While we sequenced our pools in chapters 4 and 5 to
sufficient depth according to that study, our sample sizes were far below those suggested,
implying that a significant proportion of the differentiated variants observed may be false
positives. Another strategy that we took in chapters 2 and 3, is to estimate allele frequencies
from genotypes based on individual sequencing. Kim et al. (2011) outlined that this should be
done with caution when individual samples were sequenced at low to medium coverage
(< 15X), since again, rare allele estimates are expected to be biased. If it was necessary,
genotypes should not be filtered on genotype confidence, which we actually performed, albeit

126 Chapter 6
in a relatively lenient manner. Despite all these possible disadvantages, pool sequencing has
frequently proven to be especially useful to enlighten the background of interesting traits,
albeit often violating the aforementioned rules (Carneiro et al. 2014; Rubin et al. 2010;
Lamichhaney et al. 2012).
The major strategical advantage of preferring pool-seq over individual sequencing is the
larger number of samples to be included at the same cost, which facilitates incorporation of
multiple breeds or multiple strains of the same breed. This in turn is expected to improve the
power of differentiation studies by eradicating artefacts based on stratification (Schlötterer
2002; Zhu et al. 2012). We tried to incorporate this by including a second miniature breed, the
MiniLEWE in chapters 2 and 3, and by sequencing two pools per stock as described in
chapters 4 and 5. With a focus on body size, breeds to be involved in future could be Bama
pigs from China (Liu et al. 2008) or the pygmy hog Sus salvanius/ Porcula salvania (Funk et
al. 2007). One point that should be mentioned is, that all these analyses including multiple
miniature breeds, are based on the hypothesis that their miniaturization has a common genetic
background, which is debatable with respect to the situation in humans (Merimee et al. 1989;
Klingseisen and Jackson 2011; Mayer et al. 2001).
Figure 6.1 shows expected heterozygosity, estimated from the GMP pools from the second
study (chapters 4 and 5) and the MiniLEWE and GMP samples from the first study
(chapters 2 and 3). Chromosome 5 carries a region we identified as a major selective sweep
between 40 to 46 Mb in the first study, which could serve as an example for different results
due to different experimental setting as they were mentioned before. Revisiting the same
region in the pool data, the strong signature is not observed. Possible explanations could be
different variant calling algorithms, different filtering strategies, the aforementioned
differences between pool and individual sequencing or simply a sampling error due to a low
number of GMP samples. However, in both types of data, this region shows irregular
behavior, elevated heterozygosity in the pools and diminished heterozygosity in the old
samples, which also incorporated a MiniLEWE pool of ten sows. Both datasets show
concordance in the remaining genome, but we feel that this issue cannot be resolved based on
the current analyses and requires further research.

Chapter 6 127
Figure 6.1: Expected heterozygosity, averaged in 250 SNP windows along chromosome
5. Respective sweep region highlighted in green.
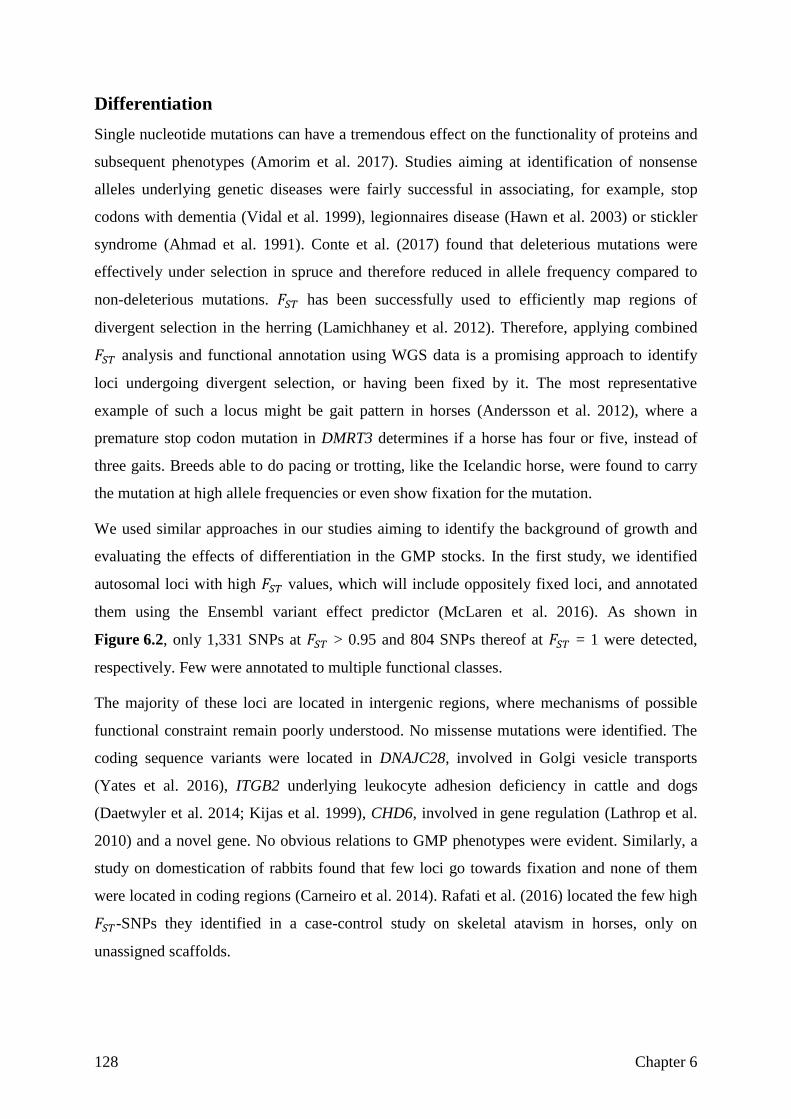
128 Chapter 6
Differentiation
Single nucleotide mutations can have a tremendous effect on the functionality of proteins and
subsequent phenotypes (Amorim et al. 2017). Studies aiming at identification of nonsense
alleles underlying genetic diseases were fairly successful in associating, for example, stop
codons with dementia (Vidal et al. 1999), legionnaires disease (Hawn et al. 2003) or stickler
syndrome (Ahmad et al. 1991). Conte et al. (2017) found that deleterious mutations were
effectively under selection in spruce and therefore reduced in allele frequency compared to
non-deleterious mutations. 𝐹𝑆𝑇 has been successfully used to efficiently map regions of
divergent selection in the herring (Lamichhaney et al. 2012). Therefore, applying combined
𝐹𝑆𝑇 analysis and functional annotation using WGS data is a promising approach to identify
loci undergoing divergent selection, or having been fixed by it. The most representative
example of such a locus might be gait pattern in horses (Andersson et al. 2012), where a
premature stop codon mutation in DMRT3 determines if a horse has four or five, instead of
three gaits. Breeds able to do pacing or trotting, like the Icelandic horse, were found to carry
the mutation at high allele frequencies or even show fixation for the mutation.
We used similar approaches in our studies aiming to identify the background of growth and
evaluating the effects of differentiation in the GMP stocks. In the first study, we identified
autosomal loci with high 𝐹𝑆𝑇 values, which will include oppositely fixed loci, and annotated
them using the Ensembl variant effect predictor (McLaren et al. 2016). As shown in
Figure 6.2, only 1,331 SNPs at 𝐹𝑆𝑇 > 0.95 and 804 SNPs thereof at 𝐹𝑆𝑇 = 1 were detected,
respectively. Few were annotated to multiple functional classes.
The majority of these loci are located in intergenic regions, where mechanisms of possible
functional constraint remain poorly understood. No missense mutations were identified. The
coding sequence variants were located in DNAJC28, involved in Golgi vesicle transports
(Yates et al. 2016), ITGB2 underlying leukocyte adhesion deficiency in cattle and dogs
(Daetwyler et al. 2014; Kijas et al. 1999), CHD6, involved in gene regulation (Lathrop et al.
2010) and a novel gene. No obvious relations to GMP phenotypes were evident. Similarly, a
study on domestication of rabbits found that few loci go towards fixation and none of them
were located in coding regions (Carneiro et al. 2014). Rafati et al. (2016) located the few high
𝐹𝑆𝑇-SNPs they identified in a case-control study on skeletal atavism in horses, only on
unassigned scaffolds.
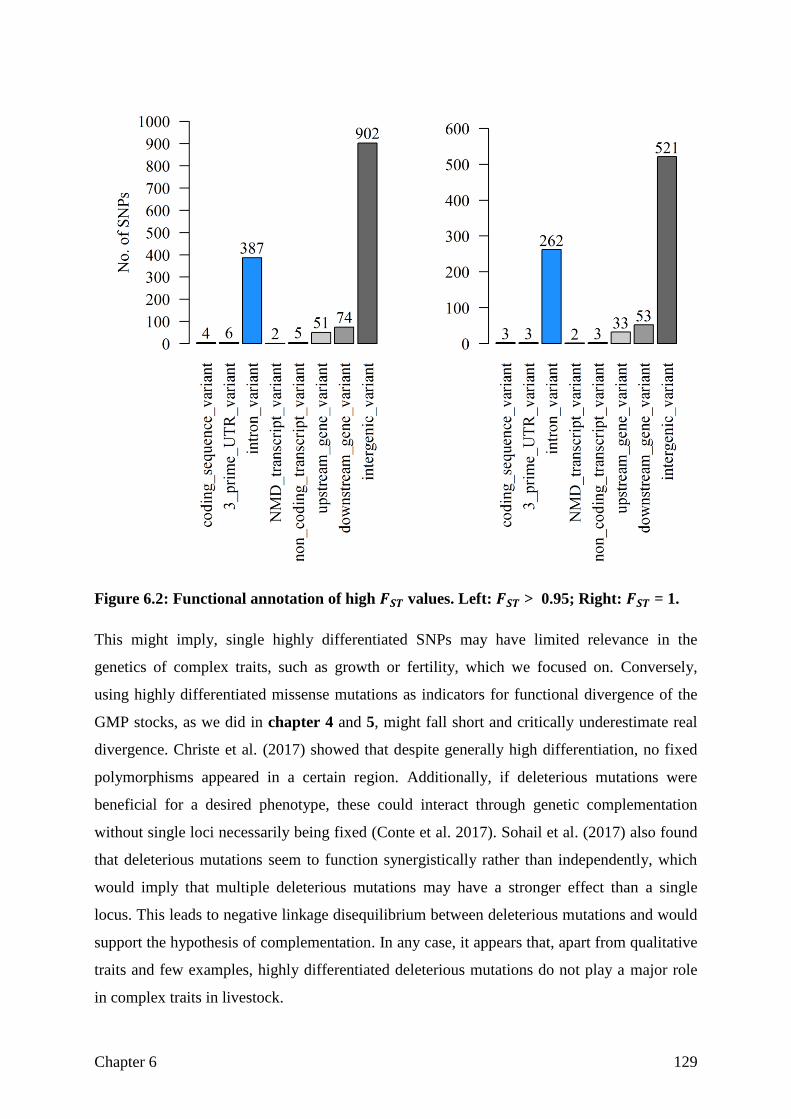
Chapter 6 129
Figure 6.2: Functional annotation of high 𝑭𝑺𝑻 values. Left: 𝑭𝑺𝑻 > 0.95; Right: 𝑭𝑺𝑻 = 1.
This might imply, single highly differentiated SNPs may have limited relevance in the
genetics of complex traits, such as growth or fertility, which we focused on. Conversely,
using highly differentiated missense mutations as indicators for functional divergence of the
GMP stocks, as we did in chapter 4 and 5, might fall short and critically underestimate real
divergence. Christe et al. (2017) showed that despite generally high differentiation, no fixed
polymorphisms appeared in a certain region. Additionally, if deleterious mutations were
beneficial for a desired phenotype, these could interact through genetic complementation
without single loci necessarily being fixed (Conte et al. 2017). Sohail et al. (2017) also found
that deleterious mutations seem to function synergistically rather than independently, which
would imply that multiple deleterious mutations may have a stronger effect than a single
locus. This leads to negative linkage disequilibrium between deleterious mutations and would
support the hypothesis of complementation. In any case, it appears that, apart from qualitative
traits and few examples, highly differentiated deleterious mutations do not play a major role
in complex traits in livestock.
130 Chapter 6
Not differentiated, but selected for the right aim?
Chapters 4 and 5 focused on differentiation between the five GMP production stocks, due to
the interest surrounding if the stocks had diverged in traits important for the functionality of
the GMP as a model animal. Conversely, reduced differentiation in genomic regions
underlying the goal traits, fertility and growth could be interpreted as evidence that the current
breeding scheme affects the same genes in all stocks similarly. As the study on growth
demonstrated, the genetic background of growth is polygenic rather than oligogenic, and
fertility is already a multifactorial (probably highly polygenic) and not easy to define trait. An
important measure of fertility in pigs is litter size, which is influenced by various parameters
(Clark et al. 1988); among others male fertility (Lawlor and Lynch 2007), prenatal mortality
(Spötter and Distl 2006) and ovulation rate (Rothschild et al. 1997). It is known from sheep
that single genes with major effect exist, e.g. the Booroola gene (Fogarty 2009; Davis 2004),
and the estrogen receptor ESR is associated with a major QTL for litter size in pigs
(Rothschild et al. 1997), although this seems to be highly variable between different
populations (Drogemuller et al. 2001; Wu et al. 2006). Otherwise, most fertility traits in
common populations presumably have a polygenic background (Ferlin et al. 2007; Chen et al.
2001; Davis 2004). In such case, pathway analysis is expected to outperform approaches
focusing on single loci (Torkamani et al. 2008). Using the KEGG based pathway analyses
described in chapter 5, but focusing on pathways that were especially undifferentiated,
resulted in 83 out of the 316 total pathways identified. The majority of these pathways belong
to the functional classes ‘Metabolism’, ‘Organismal Systems’ and ‘Human Diseases’. The
stocks with the highest number of undifferentiated pathways were NI in ‘Metabolism’ and
‘Environmental Information Processing’ (EIP), NR in ‘Organismal Systems’, ‘Human
Diseases’ and ‘Cellular Processes’ (together with NI) and DA2 in ‘Genetic Information
Processing’ (GIP). Lowest frequencies were seen for DA3 in ‘Metabolism’, for RE in
‘Organismal Systems’, ‘Human Diseases’ and ‘Cellular Processes’, for DA3 in ‘GIP’ and
‘EIP’ (Figure 6.3). Pathways were rarely ever undifferentiated between all units in all
contrasts (Figure 6.4). The only example for this is “Olfactory transduction”, but mostly, a
unit was only significantly indifferent against one or two other units. Higher numbers were,
for example, seen in ‘Steroid hormone biosynthesis’ (NR vs RE and DA3), ‘Retinol
metabolism’ (DA2 vs RE, DA3 and NR), or ‘Fluid shear stress and artherosclerosis’ (NI vs
DA2, DA3 and NR).
Chapter 6 131
Figure 6.3: Number of pairwise significantly undifferentiated pathways by stock and
functional category of pathway. Grey shading indicates number of pathways per
class showing any significant similarity. GIP/ EIP = Genetic/ Environmental
information processing.
‘Olfactory transduction’, the only pathway undifferentiated between all stocks has been found
to be associated with highly conserved genomic regions, putatively under balancing selection,
in an earlier study on domestic and wild pigs (Amaral et al. 2011). Olfactory perception as
one of the basic sensory functions is important in many species and similarly organized (Ache
and Young 2005). The underlying gene family is one of the largest, with a notable proportion
of pseudogenes (Ache and Young 2005; Gilad et al. 2003), and genes exhibiting higher
heterozygosity than expected (Alonso et al. 2008). ‘Steroid hormone biosynthesis’ is directly
linked to reproductive performance (Penning et al. 2000; Dohle et al. 2003) and has been
found to be differentiated between Asian and European pigs (Leno-Colorado et al. 2017).
This might imply that selection for reproduction in the GMP might have favoured alleles from
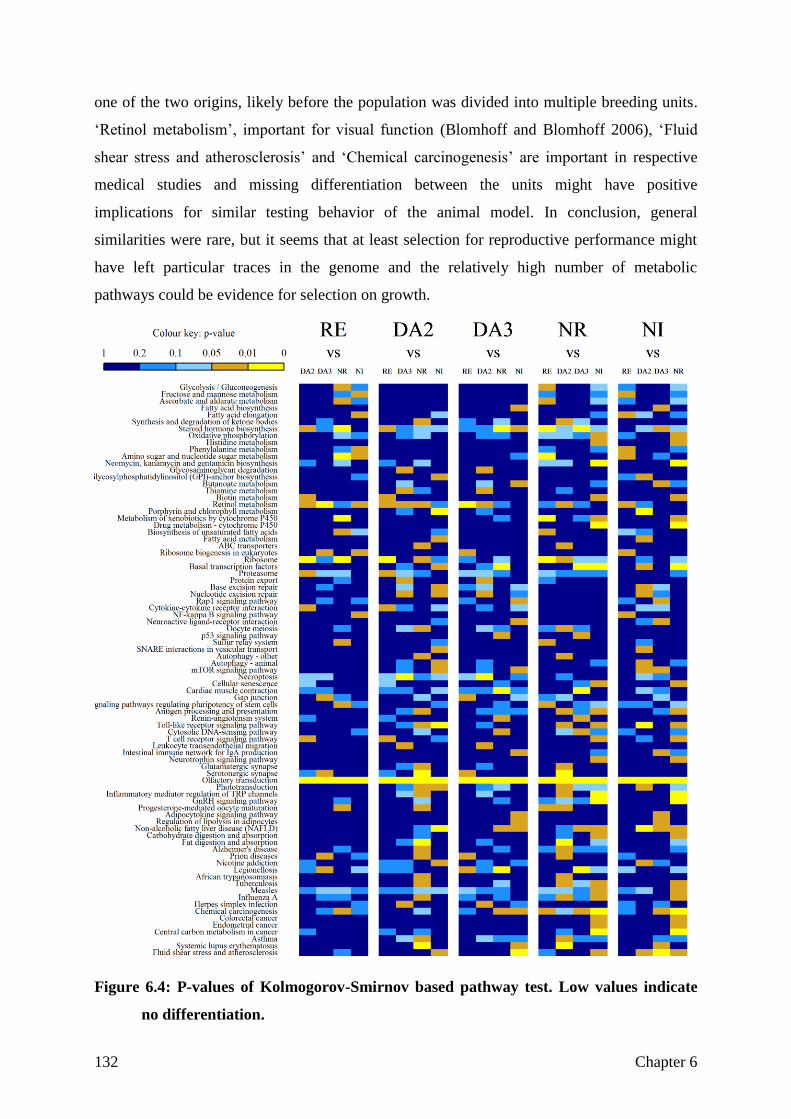
132 Chapter 6
one of the two origins, likely before the population was divided into multiple breeding units.
‘Retinol metabolism’, important for visual function (Blomhoff and Blomhoff 2006), ‘Fluid
shear stress and atherosclerosis’ and ‘Chemical carcinogenesis’ are important in respective
medical studies and missing differentiation between the units might have positive
implications for similar testing behavior of the animal model. In conclusion, general
similarities were rare, but it seems that at least selection for reproductive performance might
have left particular traces in the genome and the relatively high number of metabolic
pathways could be evidence for selection on growth.
Figure 6.4: P-values of Kolmogorov-Smirnov based pathway test. Low values indicate
no differentiation.
Chapter 6 133
Structural variation
All analyses presented in this thesis ignore other types of variation than biallelic SNPs, such
as short InDels and all forms of larger structural variation, as well as multi-allelic SNPs.
Nonetheless, it is undisputed that structural variation plays a significant role in genetics, while
there are different opinions regarding the amount of genetic variation they explain: According
to Tattini et al. (2015) they account for about 1 % of genetic variation, while Stankiewicz and
Lupski (2010) argue they might have higher impact than biallelic SNPs.
Famous examples of livestock phenotypes related to structural variation are muffs and beard
in chicken, based on multiple duplications (Guo et al. 2016), an inversion underlying comb
morphology (Imsland et al. 2012) and colour patterns in swine, also regulated by duplications
(Rubin et al. 2012). Structural variation (SV), such as inversion or deletions is also likely to
have deleterious effect on gene function, as demonstrated by Imsland et al. (2012), where
disruption of CCDC108 located at an inversional breakpoint impairs sperm motility in cocks.
We used DELLY (Rausch et al. 2012) to call autosomal inversions, deletions and duplications
from the individually sequenced GMP samples (Chapters 2 and 3) and restricted calls to a
minimum length of 500 bp and maximum length of 25 Mb. We annotated genes (Yates et al.
2016) in all deletions (DEL) and inversions (INV), where at least 80 % of the samples were
heterozygous or homozygous for the SV compared to the reference genome and all
duplications (DUP) which were exhibited by all samples. These were in total 2,929 DEL
(median length 1,257 bp), 5,065 DUP (median length 43 kb) and 2,149 INV (median length
61 kb). Figure 6.5 shows the length of the genome covered by SVs, in total about 11.6 % of
the Duroc reference length. As a proof of principle for the method, the duplicated structures at
the KIT locus were detected as they would have been expected in a uniformly white coated
pig (Rubin et al. 2012). Additionally SVs were co-located with several candidate genes for
growth (Figure 6.6), such as TGFβ2 and TGFβRAP1, and a large inversion spans the position
of the growth hormone receptor GHR, a gene known to maintain regular size in pigs and
leading to miniaturization when impaired (Cyranoski 2015). These first results indicate that
structural variation is inherent in the GMP and is likely to play an important role in its
genome, but further research is needed to validate these initial findings. Additional
information can be found in Reimer and Simianer (2016).

134 Chapter 6
Figure 6.5: Total length of deletions, inversions and duplications in GMP samples.
Figure 6.6: Genome wide distribution of duplications (DUP), inversions (INV) and
deletions (DEL) and three selected regions around the KIT locus, TGFB2 and
GHR.
Chapter 6 135
General conclusion
This study demonstrates the capability of NGS to detect signatures of selection from small
numbers of miniature pigs and to assess population structure among sub-populations of the
same breed. It was conducted during a period of major advancements in genome research on
livestock, using whole genome re-sequencing. Here we would like to emphasize some of the
findings which could be a help to future projects. Despite ongoing decreases in sequencing
costs, NGS is still a relatively expensive technique, limiting sample sizes. If the aim of a
study is to analyze the genetic background of a trait by comparison between two groups
expressing the trait of interesting differently, using pool-sequencing could be beneficial
through inclusion of more samples from different strains or breeds. In any case, multiple
reference genomes are available, the best suited should be identified beforehand, to ensure
high mapping rates of the re-sequenced genomes. We found that, even though deleterious
mutations are an obvious candidate to underlie traits of interest or to explain differences
between different sub-populations, the prevalence of highly differentiated deleterious
mutations seems to be low and they might rarely be of high relevance for our analyzed traits.
Alternatively pathway analyses seem to be a particularly powerful tool to integrate biological
information into quantitative analysis and appear well suited to characterize the genetics
behind quantitative traits such as fertility. Also, the importance of structural variation seems
to be widely underestimated and we suggest, its incorporation in similar future studies should
be strongly considered.
References
Ache BW, Young JM. 2005. Olfaction: Diverse Species, Conserved Principles. Neuron 48:
417–430.
Ahmad NN, Ala-Kokko L, Knowlton RG, Jimenez SA, Weaver EJ, Maguire JI, Tasman W,
Prockop DJ. 1991. Stop codon in the procollagen II gene (COL2A1) in a family with
the Stickler syndrome (arthro-ophthalmopathy). Proc Natl Acad Sci U S A 88: 6624–7.
Akey JM, Zhang G, Zhang K, Jin L, Shriver MD. 2002. Interrogating a high-density SNP
map for signatures of natural selection. Genome Res 12: 1805–14.
Alonso S, Lopez S, Izagirre N, de la Rua C. 2008. Overdominance in the Human Genome and
Olfactory Receptor Activity. Mol Biol Evol 25: 997–1001.
Amaral AJ, Ferretti L, Megens H-J, Crooijmans RPMA, Nie H, Ramos-Onsins SE, Perez-
Enciso M, Schook LB, Groenen MAM. 2011. Genome-Wide Footprints of Pig
136 Chapter 6
Domestication and Selection Revealed through Massive Parallel Sequencing of Pooled
DNA ed. H. Ellegren. PLoS One 6: e14782.
Amorim CEG, Gao Z, Baker Z, Diesel JF, Simons YB, Haque IS, Pickrell J, Przeworski M.
2017. The population genetics of human disease: The case of recessive, lethal mutations
ed. P.W. Messer. PLOS Genet 13: e1006915.
Anand S, Mangano E, Barizzone N, Bordoni R, Sorosina M, Clarelli F, Corrado L, Martinelli
Boneschi F, D’Alfonso S, De Bellis G. 2016. Next Generation Sequencing of Pooled
Samples: Guideline for Variants’ Filtering. Sci Rep 6: 33735.
Andersson LS, Larhammar M, Memic F, Wootz H, Schwochow D, Rubin C-J, Patra K,
Arnason T, Wellbring L, Hjälm G, et al. 2012. Mutations in DMRT3 affect locomotion
in horses and spinal circuit function in mice. Nature 488: 642–6.
Archibald AL, Bolund L, Churcher C, Fredholm M, Groenen MAM, Harlizius B, Lee K-T,
Milan D, Rogers J, Rothschild MF, et al. 2010. Pig genome sequence--analysis and
publication strategy. BMC Genomics 11: 438.
Bentley DR. 2006. Whole-genome re-sequencing. Curr Opin Genet Dev 16: 545–552.
Bersaglieri T, Sabeti PC, Patterson N, Vanderploeg T, Schaffner SF, Drake JA, Rhodes M,
Reich DE, Hirschhorn JN. 2004. Genetic signatures of strong recent positive selection at
the lactase gene. Am J Hum Genet 74: 1111–20.
Blomhoff R, Blomhoff HK. 2006. Overview of retinoid metabolism and function. J Neurobiol
66: 606–630.
Carneiro M, Rubin C-J, Di Palma F, Albert FW, Alfoldi J, Barrio AM, Pielberg G, Rafati N,
Sayyab S, Turner-Maier J, et al. 2014. Rabbit genome analysis reveals a polygenic basis
for phenotypic change during domestication. Science (80- ) 345: 1074–1079.
Chen K, Li N, Huang L, Zhang Q, Zhang J, Sun S, Luo M, Wu C. 2001. The combined
genotypes effect of ESR and FSHβ genes on litter size traits in five different pig breeds.
Chinese Sci Bull 46: 140–143.
Christe C, Stölting KN, Paris M, Fraїsse C, Bierne N, Lexer C. 2017. Adaptive evolution and
segregating load contribute to the genomic landscape of divergence in two tree species
connected by episodic gene flow. Mol Ecol 26: 59–76.
Chapter 6 137
Clark LK, Leman AD, Morris R. 1988. Factors influencing litter size in swine: parity-one
females. J Am Vet Med Assoc 192: 187–94.
Conte GL, Hodgins KA, Yeaman S, Degner JC, Aitken SN, Rieseberg LH, Whitlock MC.
2017. Bioinformatically predicted deleterious mutations reveal complementation in the
interior spruce hybrid complex. BMC Genomics 18: 970.
Cyranoski D. 2015. Gene-edited “micropigs” to be sold as pets at Chinese institute. Nature
526: 18–18.
Daetwyler HD, Capitan A, Pausch H, Stothard P, van Binsbergen R, Brøndum RF, Liao X,
Djari A, Rodriguez SC, Grohs C, et al. 2014. Whole-genome sequencing of 234 bulls
facilitates mapping of monogenic and complex traits in cattle. Nat Genet 46: 858–865.
Davis G. 2004. Fecundity genes in sheep. Anim Reprod Sci 82–83: 247–253.
Dohle GR, Smit M, Weber RFA. 2003. Androgens and male fertility. World J Urol 21: 341–
345.
Drogemuller C, Hamann H, Distl O. 2001. Candidate gene markers for litter size in different
German pig lines. J Anim Sci 79: 2565.
Fang X, Mou Y, Huang Z, Li Y, Han L, Zhang Y, Feng Y, Chen Y, Jiang X, Zhao W, et al.
2012. The sequence and analysis of a Chinese pig genome. Gigascience 1: 16.
Ferlin A, Raicu F, Gatta V, Zuccarello D, Palka G, Foresta C. 2007. Male infertility: role of
genetic background. Reprod Biomed Online 14: 734–745.
Fogarty NM. 2009. A review of the effects of the Booroola gene (FecB) on sheep production.
Small Rumin Res 85: 75–84.
Funk SM, Verma SK, Larson G, Prasad K, Singh L, Narayan G, Fa JE. 2007. The pygmy hog
is a unique genus: 19th century taxonomists got it right first time round. Mol Phylogenet
Evol 45: 427–436.
Gilad Y, Bustamante CD, Lancet D, Pääbo S. 2003. Natural Selection on the Olfactory
Receptor Gene Family in Humans and Chimpanzees. Am J Hum Genet 73: 489–501.
Groenen MAM. 2016. A decade of pig genome sequencing: A window on pig domestication
and evolution. Genet Sel Evol 48: 23.
138 Chapter 6
Groenen MAM, Archibald AL, Uenishi H, Tuggle CK, Takeuchi Y, Rothschild MF, Rogel-
gaillard C, Park C, Megens H, Li S, et al. 2012. Analyses of pig genomes provide
insight into porcine demography and evolution. Nature 491: 393–398.
Guo Y, Gu X, Sheng Z, Wang Y, Luo C, Liu R, Qu H, Shu D, Wen J, Crooijmans RPMA, et
al. 2016. A Complex Structural Variation on Chromosome 27 Leads to the Ectopic
Expression of HOXB8 and the Muffs and Beard Phenotype in Chickens ed. T. Leeb.
PLOS Genet 12: e1006071.
Hawn TR, Verbon A, Lettinga KD, Zhao LP, Li SS, Laws RJ, Skerrett SJ, Beutler B,
Schroeder L, Nachman A, et al. 2003. A common dominant TLR5 stop codon
polymorphism abolishes flagellin signaling and is associated with susceptibility to
legionnaires’ disease. J Exp Med 198: 1563–72.
Herrero-Medrano J, Megens H-J, Groenen MA, Bosse M, Pérez-Enciso M, Crooijmans RP.
2014. Whole-genome sequence analysis reveals differences in population management
and selection of European low-input pig breeds. BMC Genomics 15: 601.
Imsland F, Feng C, Boije H, Bed’hom B, Fillon V, Dorshorst B, Rubin C-J, Liu R, Gao Y, Gu
X, et al. 2012. The Rose-comb mutation in chickens constitutes a structural
rearrangement causing both altered comb morphology and defective sperm motility.
PLoS Genet 8: e1002775.
Kijas JMH, Bauer TR, Gäfvert S, Marklund S, Trowald-Wigh G, Johannisson A, Hedhammar
Å, Binns M, Juneja RK, Hickstein DD, et al. 1999. A Missense Mutation in the β-2
Integrin Gene (ITGB2) Causes Canine Leukocyte Adhesion Deficiency. Genomics 61:
101–107.
Kim SY, Li Y, Guo Y, Li R, Holmkvist J, Hansen T, Pedersen O, Wang J, Nielsen R. 2010.
Design of association studies with pooled or un-pooled next-generation sequencing
data. Genet Epidemiol 34: 479–91.
Kim SY, Lohmueller KE, Albrechtsen A, Li Y, Korneliussen T, Tian G, Grarup N, Jiang T,
Andersen G, Witte D, et al. 2011. Estimation of allele frequency and association
mapping using next-generation sequencing data. BMC Bioinformatics 12: 231.
Klingseisen A, Jackson AP. 2011. Mechanisms and pathways of growth failure in primordial
dwarfism. Genes Dev 25: 2011–24.
Chapter 6 139
Kofler R, Orozco-terWengel P, De Maio N, Pandey RV, Nolte V, Futschik A, Kosiol C,
Schlötterer C. 2011. PoPoolation: a toolbox for population genetic analysis of next
generation sequencing data from pooled individuals. PLoS One 6: e15925.
Lamichhaney S, Martinez Barrio A, Rafati N, Sundström G, Rubin C-J, Gilbert ER, Berglund
J, Wetterbom A, Laikre L, Webster MT, et al. 2012. Population-scale sequencing
reveals genetic differentiation due to local adaptation in Atlantic herring. Proc Natl
Acad Sci U S A 109: 19345–50.
Lathrop MJ, Chakrabarti L, Eng J, Harker Rhodes C, Lutz T, Nieto A, Denny Liggitt H,
Warner S, Fields J, Stöger R, et al. 2010. Deletion of the Chd6 exon 12 affects motor
coordination. Mamm Genome 21: 130–142.
Lawlor PG, Lynch PB. 2007. A review of factors influencing litter size in Irish sows. Ir Vet J
60: 359.
Leno-Colorado J, Hudson NJ, Reverter A, Pérez-Enciso M. 2017. A Pathway-Centered
Analysis of Pig Domestication and Breeding in Eurasia. G3 (Bethesda) 7: 2171–2184.
Li H, Durbin R. 2009. Fast and accurate short read alignment with Burrows-Wheeler
transform. Bioinformatics 25: 1754–60.
Li H, Handsaker B, Wysoker A, Fennell T, Ruan J, Homer N, Marth G, Abecasis G, Durbin
R. 2009. The Sequence Alignment/Map format and SAMtools. Bioinformatics 25:
2078–9.
Li M, Tian S, Jin L, Zhou G, Li Y, Zhang Y, Wang T, Yeung CKL, Chen L, Ma J, et al. 2013.
Genomic analyses identify distinct patterns of selection in domesticated pigs and
Tibetan wild boars. Nat Genet 45: 1431–1438.
Liu Y, Zeng B, Shang H, Cen Y, Wei H. 2008. Bama miniature pigs (Sus scrofa domestica)
as a model for drug evaluation for humans: comparison of in vitro metabolism and in
vivo pharmacokinetics of lovastatin. Comp Med 58: 580–7.
Lynch M, Bost D, Wilson S, Maruki T, Harrison S. 2014. Population-genetic inference from
pooled-sequencing data. Genome Biol Evol 6: 1210–8.
Mayer IA, Verma A, Grumbach IM, Uddin S, Lekmine F, Ravandi F, Majchrzak B, Fujita S,
Fish EN, Platanias LC. 2001. The p38 MAPK pathway mediates the growth inhibitory
effects of interferon-alpha in BCR-ABL-expressing cells. J Biol Chem 276: 28570–7.
140 Chapter 6
McLaren W, Gil L, Hunt SE, Riat HS, Ritchie GRS, Thormann A, Flicek P, Cunningham F.
2016. The Ensembl Variant Effect Predictor. Genome Biol 17: 122.
Merimee TJ, Hewlett BS, Wood W, Bowcock AM, Cavalli-Sforza LL. 1989. The growth
hormone receptor gene in the African pygmy. Trans Assoc Am Physicians 102: 163–9.
NCBI. 2018. Sus scrofa breed Duroc isolate TJ Tabasco, whole genome shotgun sequencing
project. https://www.ncbi.nlm.nih.gov/nuccore/AEMK00000000.2/
NHGRI. 2016. The Cost of Sequencing a Human Genome - National Human Genome
Research Institute (NHGRI). https://www.genome.gov/sequencingcosts/.
Penning TM, Burczynski ME, Jez JM, Hung CF, Lin HK, Ma H, Moore M, Palackal N,
Ratnam K. 2000. Human 3alpha-hydroxysteroid dehydrogenase isoforms (AKR1C1-
AKR1C4) of the aldo-keto reductase superfamily: functional plasticity and tissue
distribution reveals roles in the inactivation and formation of male and female sex
hormones. Biochem J 351: 67–77.
Picard. 2009. http://picard.sourceforge.net/. Accessed 2013-07-26.
Rafati N, Andersson LS, Mikko S, Feng C, Raudsepp T, Pettersson J, Janecka J, Wattle O,
Ameur A, Thyreen G, et al. 2016. Large Deletions at the SHOX Locus in the
Pseudoautosomal Region Are Associated with Skeletal Atavism in Shetland Ponies. G3
(Bethesda) g3.116.029645-.
Rausch T, Zichner T, Schlattl A, Stütz AM, Benes V, Korbel JO. 2012. DELLY: structural
variant discovery by integrated paired-end and split-read analysis. Bioinformatics 28:
i333–i339.
Reimer C, Simianer H. 2016. Untersuchung großer struktureller Variationen im Genom des
Göttinger Miniaturschweins. In Tagungsband zur Jahrestagung der DGfZ 2016. Berlin.
Rothschild MF, Messer LA, Vincent A. 1997. Molecular approaches to improved pig fertility.
J Reprod Fertil Suppl 52: 227–36.
Rubin C-J, Megens HJ, Martinez Barrio A, Maqbool K, Sayyab S, Schwochow D, Wang C,
Carlborg O, Jern P, Jorgensen CB, et al. 2012. Strong signatures of selection in the
domestic pig genome. Proc Natl Acad Sci U S A 109: 19529–19536.

Chapter 6 141
Rubin C-J, Zody MC, Eriksson J, Meadows JRS, Sherwood E, Webster MT, Jiang L, Ingman
M, Sharpe T, Ka S, et al. 2010. Whole-genome resequencing reveals loci under
selection during chicken domestication. Nature 464: 587–591.
Schlötterer C. 2002. A microsatellite-based multilocus screen for the identification of local
selective sweeps. Genetics 160: 753–63.
Sohail M, Vakhrusheva OA, Sul JH, Pulit SL, Francioli LC, Genome of the Netherlands
Consortium G of the N, Alzheimer’s Disease Neuroimaging Initiative ADN, van den
Berg LH, Veldink JH, de Bakker PIW, et al. 2017. Negative selection in humans and
fruit flies involves synergistic epistasis. Science 356: 539–542.
Spötter A, Distl O. 2006. Genetic approaches to the improvement of fertility traits in the pig.
Vet J 172: 234–247.
Stankiewicz P, Lupski JR. 2010. Structural Variation in the Human Genome and its Role in
Disease. Annu Rev Med 61: 437–455.
Tattini L, D’Aurizio R, Magi A. 2015. Detection of Genomic Structural Variants from Next-
Generation Sequencing Data. Front Bioeng Biotechnol 3: 92.
Torkamani A, Topol EJ, Schork NJ. 2008. Pathway analysis of seven common diseases
assessed by genome-wide association. Genomics 92: 265–272.
Vamathevan JJ, Hall MD, Hasan S, Woollard PM, Xu M, Yang Y, Li X, Wang X, Kenny S,
Brown JR, et al. 2013. Minipig and beagle animal model genomes aid species selection
in pharmaceutical discovery and development. Toxicol Appl Pharmacol 270: 149–157.
Vidal R, Frangione B, Rostagno A, Mead S, Révész T, Plant G, Ghiso J. 1999. A stop-codon
mutation in the BRI gene associated with familial British dementia. Nature 399: 776–
781.
Wang T, Lin C-Y, Rohan TE, Ye K. 2010. Resequencing of pooled DNA for detecting
disease associations with rare variants. Genet Epidemiol 34: 492–501.
Warr A, Robert C, Hume D, Archibald AL, Deeb N, Watson M. 2015. Identification of Low-
Confidence Regions in the Pig Reference Genome (Sscrofa10.2). Front Genet 6: 338.
Wu Z-F, Liu D-W, Wang Q-L, Zeng H-Y, Chen Y-S, Zhang H. 2006. Study on the
Association Between Estrogen Receptor Gene (ESR) and Reproduction Traits in
Landrace Pigs. Acta Genet Sin 33: 711–716.
142 Chapter 6
Yates A, Akanni W, Amode MR, Barrell D, Billis K, Carvalho-Silva D, Cummins C,
Clapham P, Fitzgerald S, Gil L, et al. 2016. Ensembl 2016. Nucleic Acids Res 44:
D710–D716.
Zhu Y, Bergland AO, González J, Petrov DA. 2012. Empirical validation of pooled whole
genome population re-sequencing in Drosophila melanogaster. PLoS One 7: e41901.

APPENDIX

144
Acknowledgements
Meinem Doktorvater Prof. Dr. Henner Simianer möchte ich für all die Möglichkeiten
danken, die er mir eröffnet hat, seien es Forschungsaufenthalte oder Kongresse. Darüber
hinaus für seine Betreuung, die mir immer genug Freiraum für eigene Gedanken gelassen
hat, was für ihn aber sicher nicht immer leicht gewesen sein dürfte.
Prof. Dr. Jens Tetens danke ich für die Übernahme der Zweitprüferschaft und seine
Hilfestellungen in molekulargenetischen Fragen.
Dr. Steffen Weigend danke ich für die Übernahme des Prüfungsbeisitzes und, ebenso wie
seiner Frau Annett Weigend, für die wichtige Rolle bei der Beschaffung und Aufbereitung
sämtlicher DNA Proben.
Min uppskattning går till Dr. Carl-Johan Rubin för att husera mig i Uppsala, för att
introducera mig till NGS analys och för att vara en samvetsgrann granskare av mitt arbete.
Det var inte alltid lätt att införliva dina kommentarer, men alltid givande.
Bedanken möchte ich mich auch bei Frau Döring, die mein fehlendes Talent für jegliche
administrative Arbeit in bester Weise ausgeglichen hat.
I would like to thank the Ellegaard family and all the people from Ellegaard Göttingen
Minipigs A/S, who I met during the years, for their constant support and their hospitality
during the visits to Dalmose.
Otto Schwerdtfeger und Knut Salzmann sei für ihr Engagement bei der Umsetzung der
praktischen Aspekte der Göttinger Minischweinezucht gedankt, das auch über die normale
Dienstpflicht hinausging.
I would also like to thank Dr. Alexander Hayward for influential meetings in Uppsala and
the spontaneous proof-reading of this thesis, as well as my sister Susanne.
Der Arbeitsgruppe und allen Kollegen, die immer bereit waren auch kurzfristig zu helfen, sei
hier für ihre Unterstützung und Zusammenarbeit gedankt.
Meinen Freunden und meiner Familie danke ich an dieser Stelle für ihre Unterstützung,
insbesondere meinen Eltern und Großeltern.
145
Curriculum vitae
Christian Reimer
Date of Birth 1984-11-22
Place of Birth Goslar, Germany
University education
2006-2009 B.Sc. Agriculture - Animal Sciences, University of Göttingen, Bachelor Thesis:
“Einflussfaktoren auf die Fruchtbarkeitsleistung von Mutterschafen in
Thüringen“ (Influencing factors on the proliferation of ewes in Thuringia)
under supervision of Prof. Dr. S. König and Dr. E. Moors.
2009-2012 M.Sc. Agriculture - Animal Sciences, University of Göttingen
Master Thesis: “Möglichkeiten der genomischen Selektion in kleinen Rassen
am Beispiel Gelbvieh” (Chances of genomic selection in small breeds taking
the example of ‘Gelbvieh’) under supervision of Prof. Dr. H. Simianer and Dr.
M. Erbe.
2012-today PhD Student, Animal Breeding and Genetics Group, Department of Animal
Sciences, University of Goettingen. Thesis topic: “Sequence-Based Analyses
of the Goettingen Minipig Genome” under supervision of Prof. Dr. H.
Simianer.
Research stays
4/2013 - 6/2013 Department of Medical Biochemistry and Microbiology, Uppsala
University, Prof. Dr. Leif Andersson and Dr. Carl-Johan Rubin;
Financed by a grant from the European Science Foundation.
11/2013 – 12/2013 Department of Medical Biochemistry and Microbiology, Uppsala
University, Prof. Dr. Leif Andersson and Dr. Carl-Johan Rubin;
Financed by a grant from DAAD U4 Network.
Courses
8/2011 Synbreed Summer School, Herrsching, Bavaria “Next generation sequence
analysis: Practice and departure to new frontiers”

146
10/2012 ESF Summer School, Pag, Croatia“Livestock: “Conservation Genomics: Data,
Tools and Trends”, LivConGen2012 GRANT financed by the European
Science Foundation (ESF)
10/2014 Synbreed Summer School, Herrsching, Bavaria “From SNPs to gene netwoks”
8/2015 EAAP/CUP “Workshop on Writing and Presenting Scientific Papers”,
Warsaw, Poland
2/2016 Course of the Society for Animal Sciences (GfT) „Statistische Methoden in
Quantitativer Genetik und Tierzüchtung“ (Statistical Methods in Quantitative
Genetics and Animal Breeding), Schwarzenau, Germany
Teaching
10/ 2012 Excercise on linkage disequilibrium and effective population size, ESF
Summer School “Livestock: ‘Conservation Genomics: Data, Tools and
Trends’”, Pag, Croatia
WS 2012/13 Lecture „Kopplungsungleichgewicht“ (Linkage Disequilibrium), Angewandte
Methoden der Tierzucht, Master courses Agricultural sciences, GAU Göttingen
SS 2015 Lecture „Selektionstheorie“ (Selection theory), Quantitativ-genetische
Methoden der Tierzucht, Masters course Agricultural sciences, GAU Göttingen
SS 2015 Weekly excercises, Quantitativ-genetische Methoden der Tierzucht, Masters
course Agricultural sciences, GAU Göttingen
SS 2016 Weekly excercises, Quantitativ-genetische Methoden der Tierzucht, Masters
course Agricultural sciences, GAU Göttingen
SS 2017 Weekly excercises, Quantitativ-genetische Methoden der Tierzucht, Masters
course Agricultural sciences, GAU Göttingen
WS 2017/18 Lectures and excercises, Quantitative Genetics and Population Genetics,
Masters course International Plant and Animal Breeding, GAU Göttingen
Scholarships and grants
10/2012 LivConGen2012 GRANT of the European Science Foundation (ESF) for ESF
Summer School auf Pag, Kroatien

147
4/2013 ESF Exchange Grant 'Advances in Farm Animal Genomic Resources' for first
research stay in Uppsala
11/2013 DAAD U4 Netzwerk travel grant for second stay in Uppsala
8/2014 Travel grant Göttingen international for participation in 10th
WCGALP in
Vancouver, Canada
8/2015 EAAP Conference scholarship 2015 for the society’s annual meeting in
Warsaw and the associated course „Writing and presenting papers“

148
Publications
Refereed publications
Reimer, C., Rubin, C.-J., Weigend, S., Waldmann, K.-H., Distl, O., Simianer, H. (2014) The
Minipig Genome Harbors Regions of Selection for Growth. Proceedings, 10th
World
Congress of Genetics Applied to Livestock Production, Vancouver, Kanada
Gholami, M., Reimer, C., Erbe, M., Preisinger, R., Weigend, A., Weigend, S., Servin, B.,
Simianer, H. (2015) Genome Scan for Selection in Structured Layer Chicken
Populations Exploiting Linkage Disequilibrium Information. PLOS One, DOI:
10.1371/journal.pone.0130497.
Ni, G., Strom, T.M., Pausch, H., Reimer, C., Preisinger, R., Simianer, H., Erbe, M. (2015)
Comparison among three variant callers and assessment of the accuracy of
imputation from SNP array data to whole-genome sequence level in chicken. BMC
Genom., 16:824, doi:10.1186/s12864-015-2059-2.
Ha, N.T. Drögemüller, C., Reimer, C., Schitz-Hsu, F., Bruckmaier, R.M., Simianer, H.,
Gross, J.J. (2017) Liver transcriptome analysis reveals important factors involved in
the metabolic adaptation of the transition cow. J Dairy Sci. doi: 10.3168/jds.2016-
12454.
Malomane, D.K., Reimer, C., Weigend, S., Weigend, A., Simianer, H. (2018) Efficiency of
different strategies to mitigate ascertainment bias when using SNP panels in diversity
studies. BMC Genomics. 19: 22
Reimer, C., Ha, N.-T., Sharifi
, A.R, Weigend
, S., Geibel
, J., H. Simianer, H. (2018) Analyses
of the breed integrity of the Goettingen Minipig using pool-sequencing. Proceedings,
11th
World Congress of Genetics Applied to Livestock Production, Auckland, New
Zealand.
Geibel, J., Weigend, S., Weigend, A., Reimer, C., Pook, T., Simianer, H. (2018) Array
Design and SNP Ascertainment Bias. Proceedings, 11th
World Congress of Genetics
Applied to Livestock Production, Auckland, New Zealand.
Malomane, D.K., Reimer, C., Weigend, S., Weigend, A., Simianer, H (2018). The
contribution of genomic regions to genetic variation in global chicken populations.
Proceedings, 11th
World Congress of Genetics Applied to Livestock Production,
Auckland, New Zealand.
Martini, J.W.R., Schrauf, M.F., Garcia-Baccino, C.A., Pimentel, E.C.G., Munilla, S.,
Rogberg-Munoz, A., Cantet, R.J.C., Reimer, C., Gao, N., Wimmer, V., Simianer, H.
149
(accepted 2018) The effect of the H^-1 scaling factors Tau and Omega on the
structure of H in the single-step procedure. Genetics Selection Evolution.
Cardoso, D.F., Albuquerque, L.G., Reimer, C., Qanbari, S., Erbe, M., Vieira do Nascimento,
A., Venturini, G.C., Becker Scalez, D.C., Baldi, F., Camargo, M.F., Mercadente,
M.E.Z., Goncalves Cyrillo, J.N., Simianer, H., Tonhati, H. (accepted 2018) Genome-
wide scan reveals population stratification and footprints of recent selection in
Nelore cattle. Genetics Selection Evolution.
Reimer, C., Rubin, C.-J., Sharifi, A.R., Ha, N.-T., Weigend, S., Waldmann, K.-H., Distl, O.,
Pant, S.D., Fredholm, M., Schlather, M., Simianer, H. (submitted to BMC
Genomics) Analysis of porcine body size variation using re-sequencing data of
miniature and large pigs.
Reimer, C., Ha, N.-T., Sharifi, A.R., Weigend, S., Geibel, J., Mikkelsen, L..F., Weigend, S.,
Simianer, H. (in preparation) Assessing breed integrity of the Goettingen Minipig.
Theatre presentations
Reimer, C., Rubin, C.-J., Simianer, H. (2013) Die Diversifikation von Minischweinen von
anderen Schweinerassen auf der Basis von genomweiten Sequenzdaten. Annual
meeting of the DGfZ, Göttingen, Germany.
Gholami, M., Reimer, C., Erbe, M., Preisinger, R., Weigend, A., Weigend, S., Servin, B.,
Simianer, H. (2014) Genome scan for selection signatures in layer chicken
populations. Annual meeting of the DGfZ, Dummerstorf, Germany.
Reimer, C., Kramer, M., Erbe, M., Bapst, B., Bieber, A., Simianer, H. (2014) Novel
Functional Traits in Low Input Dairy Cattle: Genetic Characterisation and the
Potential of Genomic Selection. LowinputBreeds final meeting, Newcastle
University, Newcastle, United Kingdom.
Reimer, C., Rubin, C.-J., Weigend, S., Waldmann, K.-H., Distl, O., Simianer, H. (2014) The
Minipig Genome Harbors Regions of Selection for Growth. 10th
World Congress of
Genetics Applied to Livestock Production, Vancouver, Kanada.
Reimer, C., Rubin, C.-J., Simianer, H. (2014) Warum ist das Minischwein so klein? Seminar
für Nutztierwissenschaften, Göttingen, Germany.
Reimer, C., Schlather, M., Distl, O., Simianer, H. (2014) Jeder Signatur ihr
Beobachtungsfenster: Flexible Dimensionierung von Beobachtungsfenstern bei der
150
Suche nach Selektionssignaturen im Minischweinegenom. Annual meeting of the
DGfZ, Dummerstorf, Germany.
Reimer, C., Yin, T., Bapst, B., Simianer, H., König, S. (2014) Genetic analysis of Brown
Swiss cows from low input farms in Switzerland. LowinputBreeds final meeting,
Newcastle University, Newcastle, United Kingdom.
Ni, G., Strom, T.M., Pausch, H., Reimer, C., Preisinger, R., Simianer, H., Erbe, M. (2015)
Accuracy of imputation from SNP array data to sequence level in chicken. Annual
meeting of the DGfZ, Berlin, Germany.
Cardoso, D.F., Venturini, G.C., Mercadante, M.E.Z., Cyrillo, J.N.S.G., Erbe, M., Reimer, C.,
Simianer, H. (2015) Use of Wright´s fixation index (Fst) to detect potential selective
sweeps in Nelore Cattle. EAAP/ EVT annual meeting, Warsaw, Poland.
Reimer, C., Rubin, C.-J., Weigend, S., Waldmann, K.H., Distl, O., Simianer, H. (2015)
Analysis of resequencing data suggests that the minipig carries complex disease
alleles. EAAP/ EVT annual meeting, Warsaw, Poland.
Reimer, C., Sharifi, A.R., Rubin, C.-J., Weigend, S., Waldmann, K.-H., Distl, O., Pant, S.D.,
Fredholm, M., Simianer, H. (2015) Ein außergewöhnlicher Haplotyp auf
Chromosom X des Minischweines und sein Effekt auf die Körpergröße. Annual
meeting of the DGfZ, Berlin, Germany.
Reimer, C., Sharifi, A.R., Rubin, C.-J., Weigend, S., Waldmann, K.H., Distl, O., Pant, S.D.,
Fredholm, M., Simianer, H. (2015) Sequenzbasierte Analyse der Körpergröße im
Vergleich von Mini- und Großschweinen. Genetics-statistical committee of the
DGfZ e.V., Bad Sassendorf, Germany.
Malomane, D.K., Reimer, C., Weigend, S., Sharifi, A.R., Simianer, H. (2016) Comparisons
of allele frequencies estimated from whole genome re-sequencing data and high-
density genotyping array in chicken. Annual meeting of the DGfZ, Hanover,
Germany.
Reimer, C., Simianer, H. (2016) Untersuchung großer struktureller Variationen im Genom
des Göttinger Miniaturschweins. Annual meeting of the DGfZ, Hanover, Germany.
Reimer, C., Sharifi, A.R., Rubin, C.J., Weigend, S., Waldmann, K.H., Distl, O., Pant, S.D.,
Fredholm, M., Simianer, H. (2016) A large X-chromosomal haplotype is associated
with small body size of minipigs. EAAP/ EVT annual meeting, Belfast, United
Kingdom.
151
Sharifi, A.R., Reimer, C., Ha, N.T., Erbe, M., Cavero, D., Preisinger, R., Simianer, H. (2016)
Genetic Analysis of Feather Pecking and Mortality in Laying Hens. EAAP/ EVT
annual meeting, Belfast, United Kingdom.
Geibel, J., Weigend, S., Weigend, A., Reimer, C., Pook, T., Simianer, H. (2017) Array
Design und SNP Ascertainment Bias. Annual meeting of the DGfZ, Stuttgart,
Germany.
Malomane, D.K., Reimer, C., Weigend, S., Weigend, A., Sharifi, A.R., Simianer, H. (2017)
The effectiveness of different filtering strategies to reduce the effects of
ascertainment bias when using SNP panels in a chicken diversity study. WPSA 2017,
Saint-Malo, France.
Reimer, C., Geibel, J., Weigend, S., Simianer, H. (2017) Analyse der Rassenintegrität des
Göttinger Miniaturschweins anhand gepoolter Sequenzdaten. Annual meeting of the
DGfZ, Stuttgart, Germany.
Reimer, C., Ha, N.-T., Sharifi
, A.R, Weigend
, S., Geibel
, J., H. Simianer, H. (2018) Analyses
of the breed integrity of the Goettingen Minipig using pool-sequencing. 11th
World
Congress of Genetics Applied to Livestock Production, Auckland, New Zealand.
Posters
Malomane, D.K., Reimer, C., Weigend, S., Weigend, A., Sharifi, A.R., Simianer, H. (2017)
The effectiveness of different filtering strategies to reduce the effects of
ascertainment bias when using SNP panels in a chicken diversity study. WPSA 2017,
Saint-Malo, Frankreich.
Geibel, J., Weigend, S., Weigend, A., Reimer, C., Pook, T., Simianer, H. (2018) Array
Design and SNP Ascertainment Bias. 11th
World Congress of Genetics Applied to
Livestock Production, Auckland, New Zealand.
Malomane, D.K., Reimer, C., Weigend, S., Weigend, A., Simianer, H (2018). The
contribution of genomic regions to genetic variation in global chicken populations.
11th
World Congress of Genetics Applied to Livestock Production, Auckland, New
Zealand.

152

153
Anlage 3: E r k l ä r u n g e n
1. Hiermit erkläre ich, dass diese Arbeit weder in gleicher noch in ähnlicher Form bereits
anderen Prüfungsbehörden vorgelegen hat.
Weiter erkläre ich, dass ich mich an keiner anderen Hochschule um einen Doktorgrad
beworben habe.
Göttingen, den ...............................
.............................................................
(Unterschrift)
2. Hiermit erkläre ich eidesstattlich, dass diese Dissertation selbständig und ohne unerlaubte
Hilfe angefertigt wurde.
Göttingen, den ..........................................
.......................................................................
(Unterschrift)