
Language Profiles of Children with SLI Using the CHILDES System
23
Language Profiles of Children with SLI Using the CHILDES System Dafna Yitzhaki Bar Ilan University October 2002
Transcript of Language Profiles of Children with SLI Using the CHILDES System

Language Profiles of Children with SLI
Using the CHILDES System
Dafna Yitzhaki
Bar Ilan University
October 2002
2
1. Abstract
This paper looks at the language of four children with specific language
impairment (SLI) aged 4:3 to 6:6 years in comparison to language profiles of a group
of 52 younger normally developing children (the ‘New England group’), checked at
two age points (20 months and 30 months), by Pan (1994). Speech samples of the
study and the control group subjects interacting with their mothers were taken from an
on-line database of child language conversations (the CHILDES system) and the
analysis was done using the computational program CLAN provided by the system.
Language profiles of the four SLI subjects were created using four language
measures of three different language subsystems. The language measures were chosen
following Pan’s (1994) study, in order to be able to correctly compare between the
SLI subjects and the control group. Morphosyntactic complexity was measured by the
mean length of 50 utterances (MLU50) and the mean length of 5 longest utterances
(MLU5). Lexical diversity was measured using the ratio between total number of
words used and number of different words (Type-Token Ratio or TTR).
Conversational participation was evaluated using the MLT ratio, which is the ratio
between the mean length of the child’s and the mother’s turns.
The basic hypothesis checked was that the language of language-impaired
children should be evaluated while looking simultaneously at a number of
subsystems, that is, the way the language-impaired child functions in a variety of
linguistic aspects such as grammar, lexicon and pragmatics.
Three out of the four SLI subjects presented ‘non-flat’ individual profiles,
having different weaknesses and strengths across the language domains. As a group,
the subjects’ morphosyntactic level (as measured by MLU50) was found compatible
with that of the control group at 20 months, while the subjects’ conversational
participation (as measured by MLT ratio) was found to be much higher or much lower
than the control group’s mean score for this measure.
This variability in the SLI subjects’ performance across the language
subsystems suggests a complex linguistic behavior of the language-impaired child. In
order to properly understand this population’s deficiencies and strengths, it seems
meaningful to evaluate their language by looking at a number of language domains
and the interaction between them and not at a specific subsystem.
The nature of computerized systems such as the CLAN within the CHILDES
enables us to conduct such cross-subsystem analyses relatively easily.
3
2. Introduction
2.1 Specific Language Impairment (SLI)
Over the past several decades, many attempts have been made to characterize
the nature of language disorders in children. As the exact etiology is still not known,
children have usually been defined as having a specific language impairment (SLI) by
exclusion, meaning, a child who performs a significant language deficit and is
otherwise normal in respect of intellectual abilities and neurological status, with
normal hearing and no significant medical history. The most common view has been
that the linguistic skills of children with SLI look very much like those of normally
developing children at the same morphosyntactic level. In other words, SLI children
are believed to follow the same course as that of typically developing children but at a
slower rate with a more severe deficit in grammar (Fletcher & Ingham, 1996).
Another view, thought, less popular, claims that language impaired children develop a
linguistic system which deviates from normal developmental patterns, that is, the
language impaired children may never achieve the language skills of their peers, even
as adults (Miller and Klee 1996).
The majority of research in this area has been made on single aspects of the
language performance, providing information about SLI children’s behavior in
different linguistic subsystems. Lahey & Edwards (1999), for example, suggested that
SLI children have naming problems which are related to both semantic and
phonological aspects of the words. Bishop, Bishop, Bright, Delaney & Tallal (1999)
have found clear evidences for phonological processing deficits of children with
language impairment. Brinton, Fujiki & McKee (1998) looked at pragmatics skills of
SLI children and found that on aspects such as negotiation skills, they performed
worse than normally developing children and on other aspects, such as conversational
participation, they did not differ from their normal same-age peers.
This type of research is, of course, extremely valuable in proving us insights
into the nature of the disorder. However, at the same time, it is important to consider
the interaction between the different levels of language performance. Arguments have
been presented that research focusing on the identification of individual variables as
characterizing a disordered performance may be inadequate thus suggesting to
4
evaluate the disorder of language impairment across different linguistic levels
(Rollins, 1994).
2.2 The CHILDES system
The Child Language Data Exchange System (CHILDES) is an international
facility centered at Carnegie Mellon University. The project was founded in 1984 by
The MacArthur Foundation and directed by two well-known child language
researchers, Brian MacWhinney and Catherine Snow. The system is dedicated to
facilitating the study of language learning by both children and adults. The CHILDES
system involves three integrated components:
1. A system for discourse notation and coding called CHAT (Codes for the
Human Analysis of Transcripts).
2. A series of programs for analyzing conversational data collectively known as
the CLAN which stands for the Computerized Language Analysis. The CLAN
programs provide methods for the study of phonological, morphological,
syntactic, discourse and narrative development in language learners. Some
example analyses include frequency counts of words, word searches, and
specific counts of elements within the conversations. CLAN was originally
written by Leonid Spektor at Carnegie Mellon University, though later
developed by various other scientists.
3. A large database of language transcripts. The database includes corpora from
over 100 researchers in 26 languages. All transcripts have been put into the
CHAT format in order to crate a uniform database
This project is an ongoing project and language data is constantly entered into it.
The CHILDES is widely used by researchers in the field of child language and there
is now a total of 1200 published articles written about child language acquisition and
development that are based on it.
2.3 Basic measures of child language
A large number of language measuring tools have been developed over the
years in order to assist clinicians and researchers to evaluate the development of
children’s language. There are, of course, many ways in which a language profile of a

5
child can be formed. In order to be able to correctly compare the SLI subjects (the
current study group) to the New England group (the control group) the profile that is
going to be created will follow the New England study’s measures. Following is a
review of the 4 language measures used by Pan 1994 to create the language profiles of
the New England group:
2.3.1 Mean Length of Utterance
Mean length of utterance (MLU) has been first introduced by Brown (1973) as
a simple index to evaluate the grammatical complexity of a child’s language. MLU is
the average length of a child’s utterance, determined by the number of meaningful
units, or morphemes1, rather than words. Brown claimed that the acquisition of
grammatical morphemes reflected syntactic growth. Brown described the growth in
MLU in 5 stages:
Stage I MLU 1.0-2.0
Stage II MLU 2.0-2.5
Stage III MLU 2.5-3.0
Stage IV MLU 3.0-3.5
Stage V MLU 3.5-4.0
This basic categorizations has been later developed into a more detailed index2:
MLU Brown’s stage Age range Age range (within 1 SD)
1.01-1.49 Early stage I 19-22 months 16-26 months
1.50-1.99 Late stage I 23-26 months 18-31 months
2.00-2.49 Stage II 27-30 months 21-35 months
2.50-2.99 Stage III 31-34 months 24-42 months
3.00-3.49 Stage IV 35-38 months 28-45 months
3.50-3.99 Late IV-Early V 39-42 months 31-50 months
4.00-4.49 Late stage V 43-46 months 37-52 months
4.50+ Post stage V 47+ months 41+ months
1 morphemes include simple content words such as cat, play, red, function words such as no, the, you;
and affixes or grammatical inflections such as un-, -s, -ed 2 based on a linear fit of a sample of 123 upper-middle class children (17-59 months of age) from
Madison, Wisconsin. (Miller and Chapman 1981)

6
It is important to note that over the years, a number of researchers have argued
that the correlation between MLU and age is problematic (Klee & Fitzgerald, 1985)
especially beyond the age of 42 months (Scarborough, Wyckoff & Davidson, 1986).
Nonetheless, MLU is widely used by both clinicians and researchers and is one of the
most acceptable tools for evaluating the grammatical level of normal children as well
as language-impaired populations.
2.3.2 MLU of 5 longest utterances (MLU5)
The mean length of 5 longest utterances in a child’s speech sample is believed
to provide an indication of the upper limits of the child’s grammatical skills at a given
point of time. Bennett, James & Prosek (in Pan 1994) suggest that MLU5 is accepted
to be approximately 3 times greater than the child’s MLU score, in normally
developing children.
2.3.3 Type Token Ratio (TTR)
Type token ratio (TTR) is the ratio between the number of different words
used by a speaker and the total number of words the speaker produced in the speech
sample. If a child produced 50 different words in a sample of 100 words, his or her
TTR would be 50/100 or 0.5. If they only used 40 different words for that sample, it
would decrease to 0.4 and so on. Templin (1957) was the first to introduce this
measurement in her study of 480 3 to 8 year old children. TTR is one of the most
widely used indicators for the child’s lexical diversity.
2.3.4 Mean Length of Turn Ratio (MLT Ratio)
Mean length of turn (MLT) is the mean number of words a speaker produces
over a turn. Snow, 1977 found MLT to be a good measure for conversational
participation in her study on infants. Pan, 1994 suggested to calculate the MLT ratio
by dividing the child’s MLT by the mother’s. The idea behind it is that as children
grow older, they take a greater part in the conversation, their turns are beginning to be
more comparable to the adult partners and MLT ratio should approach 1.00.

7
2.4 Research Goals
1. To use data from a sizable sample of normally developing children regarding
their average (mean) performance and degree of variation (standard deviation)
as a control group to the study group.
2. To create language profiles of 4 SLI subjects across 3 language domains,
following the control group’s profiles.
3. To explore whether the language performance of the SLI subjects is constant
across domains relative to the performance of the control group at 20 and 30
months.
4. To explore whether the SLI subjects’ language performance is compatible with
the language performance of their normal counterparts at 20 months or is it more
compatible with those at 30 months.

8
3. Method
3.1 SLI subjects3
The speech sample of the SLI subjects were taken from the Conti-Ramsden
corpus4 based on a study conducted by Conti-Ramsden in England. The families in
the study were contacted through a network of speech therapists and professional
colleagues. All families were white, intact (father and mother living together at home)
and monolingual. All parents had secondary education. The mothers were all
housewives. The children ranged in age from 4:3 to 6:6. All subjects presented with
sever expressive language delays as measured by MLU5. All subjects presented
nonverbal abilities within normal limits:
Subject CA COMP_AGE MA IQ
Sid 4:09 4:10 5:10 110
Rick 6:09 6:06 6:06 108
Kate 4:09 3:10 4:03 95
Clay 5:10 5:04 4:09 85
CA= chronological age; COM_AGE= comprehension age as measured by the PLS;
MA= mental age measured by the Leiter International Performance Scale; IQ=
intelligence measured by the Leiter International Performance Scale
All subjects passed a neurological screening and a hearing screening. There
was no history of chronic otitis media. All subjects were receiving speech therapy in
the clinic or were enrolled in language-based classrooms. The analysis is based on the
videotaped and transcribed mother-child free play interactions. Each interaction is
approximately 15 minutes long.
3 All information regarding the subjects is taken from the CHILDES database manual (MacWhinny,
2000 clinical corpora – Conti-Ramsden 1 p.194-199). The manual provides a detailed documentation
of all the material in the system’s database. 4 The Conti-Ramsden study compared the language of 5 SLI subjects to their MLU matched siblings.
For the purpose of the current study only the information regarding the SLI subjects is presented. 5 According to the manual, the MLU scores were within Brown’s Stage I and II (see section 2.3.1 in the
introduction) when according to the subjects’ chronological age, the scores should have been within
Post- Stage V. The exact MLU scores are not given in the manual.

9
3.2 Control group6
The control group’s data consists of speech samples of a group of normally
developing children checked at two age points. The speech samples were taken from
the New England Corpus of the CHILDES database. The corpus includes data from a
longitudinal study (Dale, Bates, Reznick, & Morisset, 1989) on 52 normally
developing children at 14, 20 and 30 months of age. For the purpose of the current
study only the samples of the interactions at 20 and 30 months were used. All subjects
are from English speaking families. The sample includes half girls and half boys and
equal proportion of children from families of lower-middle and upper-middle
socioeconomic status. Children with indications of medical or other developmental
problems were excluded. The analysis is based on the videotaped and transcribed
mother-child free play interactions. Each interaction is approximately 20 minutes
long.
3.3 Creating the language profiles – The CLAN Procedures
The language profiles of the SLI subjects consisted of 4 basic measures: Mean
Length of 50 Utterances (MLU50), MLU of five longest utterances (MLU5), type-
token ratio (TTR) and Mean Length of Turn ratio (MLT ratio). All decisions
regarding the calculations of the measures were applied to all SLI subjects following
the decisions made for the control group. The relevant CLAN analysis tools along
with the specific considerations for each measure will be described below. Note that
for each measure, an example output is given along with an explanation. The specific
figure that was taken from the output is marked in boldface.
1. Mean Length of Turn (MLU) was calculated for each child on the first 50
utterances of the sample. Using 50 utterances for MLU analysis (and not 100 as
was initially recommended by Brown, 1973) is a decision taken by many
researchers in the past and found to be valid. (See, for example, Pan, 1994).
Following is an example of the MLU command used to calculate Kate’s MLU and
the output the program produced.
6 Information regarding the subjects was taken from the CHILDES database manual (MacWhinny,
2000 English corpora – New England p.78-81) and from Dale, Bates, Reznick, & Morisset, 1989.

10
Original output:
mlu +t*chi +z1U-50U kate.cha
Sun Sep 29 19:19:32 2002
mlu (26-Sep-2002) is conducting analyses on:
ONLY speaker main tiers matching: *CHI;
****************************************
From file <kate.cha<
MLU for Speaker: *CHI:
MLU (xxx and yyy are EXCLUDED from the utterance and morpheme counts:(
Number of: utterances = 50, morphemes = 91
Ratio of morphemes over utterances = 1.820
Standard deviation = 1.119
Explanation:
mlu = the name of the command used
t*chi = directs the program to look at the child’s utterances only
z1U-50U = directs the program to look at the first 50 utterances only
kate.cha = the child language transcript to be analyzed
xxx and yyy = unintelligible speech (utterances containing these symbols are
excluded from the MLU count)
2. MLU5 computed the mean length in morphemes of each child’s five longest
utterances. Following is an example of the MLU and MAXWD commands used to
calculate sid’s MLU5 and the output the program produced.
Original output:
maxwd +t*chi +g2 +c5 +d1 sid.cha | mlu
Mon Sep 30 10:25:34 2002
maxwd (26-Sep-2002) is conducting analyses on:
ONLY speaker main tiers matching: *CHI;
****************************************
From pipe input
MLU for Speaker: *CHI:
MLU (xxx and yyy are EXCLUDED from the utterance and morpheme counts:(
Number of: utterances = 5, morphemes = 16
Ratio of morphemes over utterances = 3.200
Standard deviation = 0.447

11
Explanation:
maxwd = the name of the command used (short for ‘maximum word’)
= directs the program to look at the child’s utterances only
+c5 = directs the program to identify the five longest utterances
| mlu = pipe the output to the MLU program
(t*chi, sid.cha = see explanation following MLU output)
3. Type Toke ratio (TTR) was calculated for each child using the frequency
command called ‘FREQ’. This analysis calculates the ratio between the number of
different words used by the child (types) and the overall number of words he or
she used (tokens). As was done in the New England corpus (the control group),
inflected forms of nouns and verbs were not counted as separate word types but
rather as tokens of the uninflected form. Following is an example of the FREQ
command used to calculate Rick’s TTR:
Original output:
freq +t*chi +s*-%% rick.cha
Sun Sep 29 19:26:50 2002
freq (26-Sep-2002) is conducting analyses on:
ONLY speaker main tiers matching: *CHI;
****************************************
78 Total number of different word types used
184 Total number of words (tokens(
0.424 Type/Token ratio
Explanation:
freq = the name of the command used (short for ‘frequency’)
s*-%% = directs the program to consider inflected forms as tokens by ignoring
hyphens within a word
t*chi, rick.cha = (see explanation following MLU output)
4. Mean Length of Turn ratio (MLT ratio) was calculated in 3 steps. First the MLT
command was used to produce each child’s MLT. In the next step MLT scores
were produced for each mother. Finally the ratio between each mother-child pair
was calculated. The MLT output allows us to consider MLT either in terms of
words per turn or utterance per turn. Following the analysis done for the New
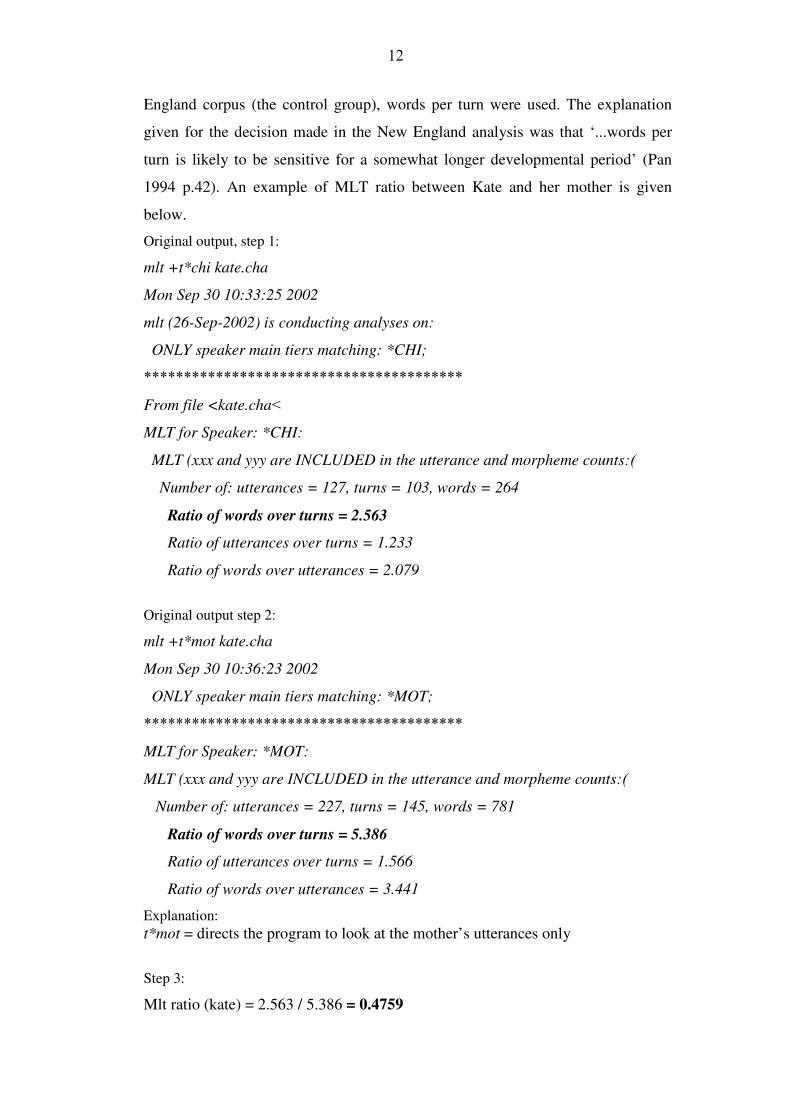
12
England corpus (the control group), words per turn were used. The explanation
given for the decision made in the New England analysis was that ‘...words per
turn is likely to be sensitive for a somewhat longer developmental period’ (Pan
1994 p.42). An example of MLT ratio between Kate and her mother is given
below.
Original output, step 1:
mlt +t*chi kate.cha
Mon Sep 30 10:33:25 2002
mlt (26-Sep-2002) is conducting analyses on:
ONLY speaker main tiers matching: *CHI;
****************************************
From file <kate.cha<
MLT for Speaker: *CHI:
MLT (xxx and yyy are INCLUDED in the utterance and morpheme counts:(
Number of: utterances = 127, turns = 103, words = 264
Ratio of words over turns = 2.563
Ratio of utterances over turns = 1.233
Ratio of words over utterances = 2.079
Original output step 2:
mlt +t*mot kate.cha
Mon Sep 30 10:36:23 2002
ONLY speaker main tiers matching: *MOT;
****************************************
MLT for Speaker: *MOT:
MLT (xxx and yyy are INCLUDED in the utterance and morpheme counts (:
Number of: utterances = 227, turns = 145, words = 781
Ratio of words over turns = 5.386
Ratio of utterances over turns = 1.566
Ratio of words over utterances = 3.441
Explanation:
t*mot = directs the program to look at the mother’s utterances only
Step 3:
Mlt ratio (kate) = 2.563 / 5.386 = 0.4759

13
4. Results
Table 1: Raw scores for the 4 measures for the SLI subjects7
Subject Mlu_50 Mlu_5 TTR MLT ratio
Clay 1.204 2.0 0.607 0.119
Sid 1.5 3.2 0.385 0.236
Kate 1.820 5.6 0.406 0.476
Rick 2.440 4.8 0.424 0.44
Table 2: z-scores for the SLI subjects as compared to the New England group at
20 months and 30 months8
Subject Mlu_50 MLU_5 TTR MLT
ratio
20
month
30
month
20
month
30
month
20
month
30
month
20
month
30
month
Clay
-0.49 -1.68 -0.65 -1.65 1.67 4.08 -1.69 -1.84
Sid 0.25 -1.23 0.27 -1.31 -0.48 0.50 -0.13 -1.26
Kate 1.05 -0.75 2.10 -0.64 -0.33 0.75 3.07 -0.06
Rick 2.60 0.18 1.49 -0.86 -0.09 1.08 2.59 -0.24
7 All scores given in the table were calculated for the current analysis and are not taken from an outside
source. 8 Scores were calculated based on the New England data, given in Appendix 1
14
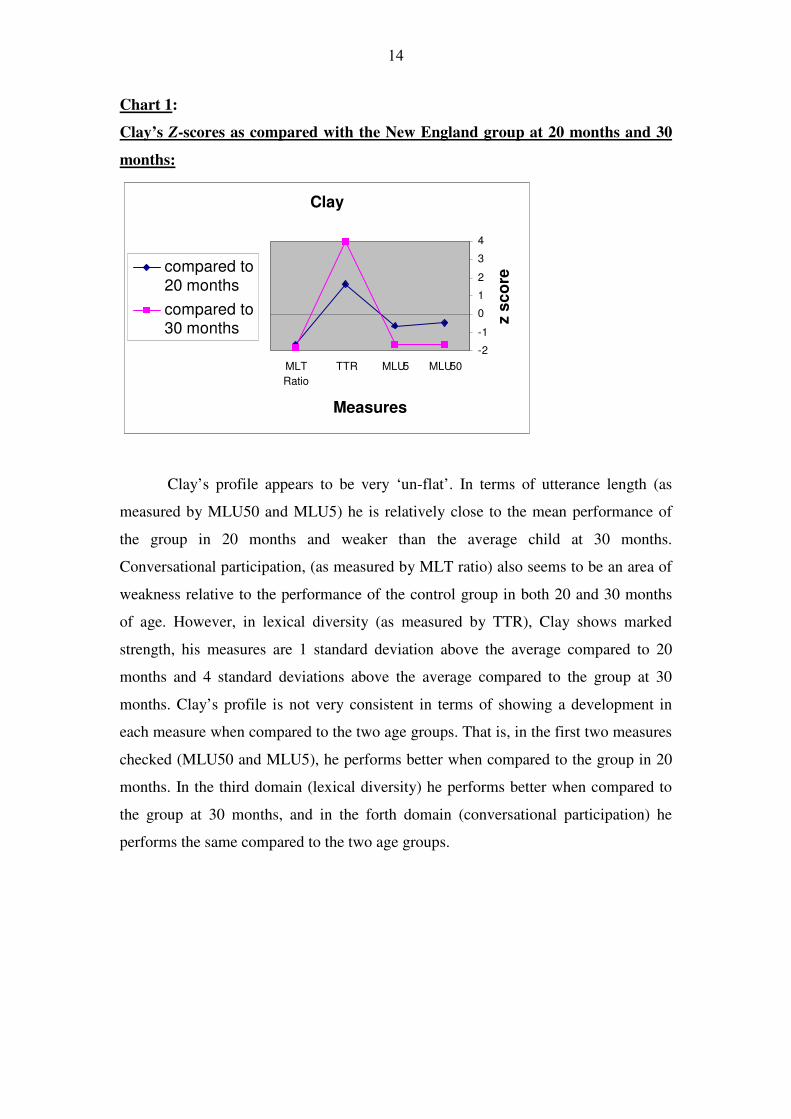
Chart 1:
Clay’s Z-scores as compared with the New England group at 20 months and 30
months:
Clay
-2
-1
0
1
2
3
4
MLU50MLU5TTRMLT
Ratio
Measures
z s
co
re
compared to
20 months
compared to30 months
Clay’s profile appears to be very ‘un-flat’. In terms of utterance length (as
measured by MLU50 and MLU5) he is relatively close to the mean performance of
the group in 20 months and weaker than the average child at 30 months.
Conversational participation, (as measured by MLT ratio) also seems to be an area of
weakness relative to the performance of the control group in both 20 and 30 months
of age. However, in lexical diversity (as measured by TTR), Clay shows marked
strength, his measures are 1 standard deviation above the average compared to 20
months and 4 standard deviations above the average compared to the group at 30
months. Clay’s profile is not very consistent in terms of showing a development in
each measure when compared to the two age groups. That is, in the first two measures
checked (MLU50 and MLU5), he performs better when compared to the group in 20
months. In the third domain (lexical diversity) he performs better when compared to
the group at 30 months, and in the forth domain (conversational participation) he
performs the same compared to the two age groups.

15
Chart 2:
Sid’s Z-scores as compared with the New England group at 20 months and 30
months:
Sid
-2
-1
0
1
2
3
4
MLU50MLU5TTRMLT Ratio
Measures
z s
co
re
compared to20 months
compered to
30 months
Sid shows a relatively ‘flat’ profile, his z-scores on each measure fall between
–1.5 – 0.5. In terms of utterance length and conversational participation (MLU50,
MLU5 and MLT ratio), he performs very much like the group of 20 months and about
1.5 standard deviations below the group of 30 months. Accept for the performance in
lexical diversity (TTR) the measures in the 3 other domains are better when compared
to the group in 20 months than when compared to the performance of the group in 30
months.
Chart 3:
Kate’s Z-scores as compared with the New England group at 20 months and 30
months:
Kate
-2
-1
0
1
2
3
4
MLU50MLU5TTRMLT Ratio
Measures
z s
co
re
compared to20 months
compared to
30 months
16
While Kate’s profile is very much similar to the performance of the group at
30 months (only 1 standard deviation below or above the average in all 4 measures), it
is very uneven when compared to the group at 20 months. Her z-scores in 3 measures
(MLU50, MLU5 and MLT ratio) are up to 3 standard deviations above the average of
the group at 20 months while her score in lexical diversity is compatible with the
average for that age group. Similar to Sid’s profile, we see that Kate performs better
when compared to the group at 20 months on 3 out of the four language domains.
TTR is again, the only measure that the subject performs better when compared to the
group at 30 months.
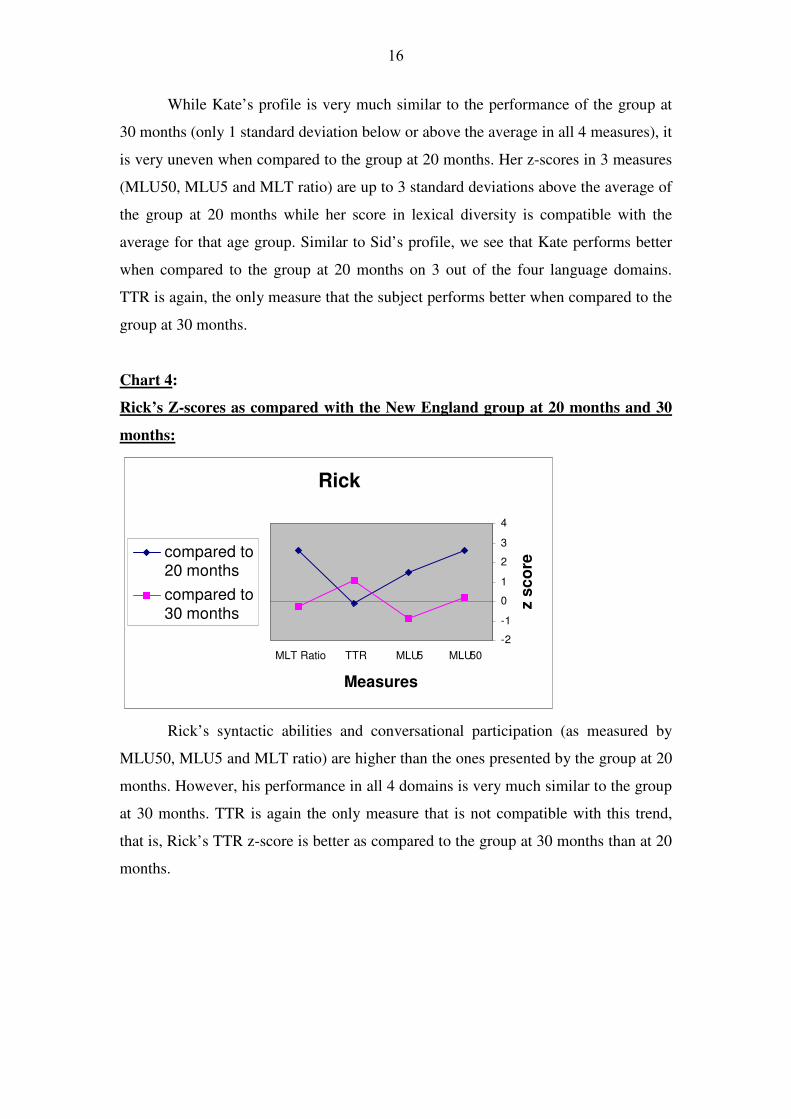
Chart 4:
Rick’s Z-scores as compared with the New England group at 20 months and 30
months:
Rick
-2
-1
0
1
2
3
4
MLU50MLU5TTRMLT Ratio
Measures
z s
co
re
compared to20 months
compared to
30 months
Rick’s syntactic abilities and conversational participation (as measured by
MLU50, MLU5 and MLT ratio) are higher than the ones presented by the group at 20
months. However, his performance in all 4 domains is very much similar to the group
at 30 months. TTR is again the only measure that is not compatible with this trend,
that is, Rick’s TTR z-score is better as compared to the group at 30 months than at 20
months.

17
When evaluating the 4 SLI subjects’ profiles simultaneously, we find the
following trends:
MLU50: Except for Rick, the subjects present an MLU50 z-score that is 0.5-1
standard deviation around the MLU50 score of the control group at 20 months and 1-
1.5 standard deviations below the MLU50 score at 30 months. That is, 3 of the 4
subjects’ MLU50 level is more compatible with the MLU50 score of the group at 20
months than the MLU50 score at 30 months.
MLU5: Two of the subjects (Clay and Sid) present an MLU5 z-score which is
more compatible with the average score at 20 months. Kate and Rick’s MLU5 score is
closer to the group’s score at 30 months.
TTR: Except for Clay, the 3 subjects’ TTR score is very much similar to the
group’s score at 20 months (within 0.5 standard deviation), and higher than the
group’s score at 30 months (up to 1 standard deviation above). As can be seen from
the charts, TTR is the only measure in which all 4 subjects scored higher when
compared to 30 months as oppose to 20 months. This issue will be further referred to
in the discussion.
MLT ratio: The subjects’ conversational participation as measured by MLT ratio
shows an inconsistent behavior. Two subjects (Rick and Kate) scored very highly
compared to the control group’s score at 20 months (around 3 standard deviations
above) and similar to the group at 30 months. Sid performed similar to the control
group at both age points and Clay much lower than the group at both age points
(about 2 standard deviations below).
Scores compared to the control group at 20 months as oppose to scores compared
to the control group at 30 months: All scores of the 4 subjects in 3 of the measures
(MLU50, MLU5 and MLT ratio) are higher when compared to the group at 20
months as oppose to 30 months. The only exception is the TTR measure. Although we
would expect the SLI subjects’ performance to decrease when compared to older
children, the results of the TTR measure behaved the opposite. As mentioned above,
this issue will be referred to in the discussion.
Individual differences across measures: Except for Sid who demonstrates a ‘flat’
profile, the other 3 subjects’ profiles are very much uneven, showing different
strengths and weaknesses across the language domains. Clay, for example, performs
relatively well in terms of lexical diversity (as measured by TTR) and relatively
poorly in terms of conversational participation (as measured by MLT ratio). Rick and

18
Kate, on the other hand, scored much better in the conversational measure compared
to the group at 20 months while their scores in the lexical measure were compatible
with the group’s mean score.
19
5. Discussion
This paper aimed at looking at the language performance of children with SLI
in comparison with younger normally developing children across a number of
language domains suggesting that this might shed light on the strengths and
weaknesses of SLI children across the language subsystems. Indeed, this has been
demonstrated in the results presented above.
With regards to morphosyntactic level of the SLI subjects, 3 out of the 4 SLI
subjects demonstrated a morphosyntactic delay of about 2 to 3 years (MLU50 and
MLU5 being compatible with those of 20 to 30 months old normally developing
children). This is very unsurprising, knowing that SLI children are usually
characterized as having morphosyntactic difficulties.
Lexical diversity (as measured by TTR) was found compatible with the
control group’s score at 20 months and slightly higher than the group’s score at 30
months. As was mentioned in the results section, these findings are very much
problematic. We would not expect the SLI children to perform lexically like 20
months year olds and at the same time better than 30 months year olds. Assuming that
the lexical abilities of normally developing children develop constantly, we would
expect the SLI children’s performance to decrease when compared to older children.
Additionally, we’ve seen that the SLI subjects’ performance decreased for all other
measures when compared to older children. The explanation seems to be more related
to the interpretation of the measure itself than to the lexical abilities of the subjects.
As can be seen in Appendix 1, while the control group’s scores increased for the 3
other measures, the TTR score decreased between the two age points (from 0.433 at
20 months to 0.355 at 30 months). In other words, according to the TTR scores, the
ratio between the number of different words used by the subjects in the control group
and the total number of words they used decreased. This finding can be explained by
suggesting that the children did not add new words to their vocabulary, which would
of course be a very unreasonable explanation. An alternative explanation is simply,
that this measure could not capture the lexical development between 20 to 30 months
of age due to possible interrupting factors such as being too sensitive to the context of
the interaction or other factors. This explains the problem of the SLI subjects’ relative
high scores compared to the TTR scores at 30 months. If we assume that the TTR

20
results of the control group at 20 months are more representative than at 30 months,
we might be able to suggest that the SLI subjects’ lexical performance as measured by
TTR is compatible with those of 2 to 3 years younger normally developing children.
The SLI subjects’ conversational participation (as measured by the ratio
between the mean length of the child’s turn and the mother’s turn) does not seem to
be compatible with the control group’s results, being much lower or much higher than
the control group’s average score. This is an interesting finding which might suggest
that the pragmatic abilities of children with SLI, as represented through their
conversational participation are independent of their lexical and morphosyntactic
development. In other words, an SLI child’s pragmatic behavior might be relatively
well in the presence of other language difficulties, or, alternatively, it could be even
worse than his or her performance in other language areas. This could be explained by
the fact that pragmatic behavior is in many times related to factors which are not
linguistic in nature such as age, social experience, level of self esteem that might
contribute or damage the SLI child’s ability to participate in a conversation.
With regards to the question whether the SLI subjects’ scores are generally
more compatible with 20 or 30 months old normally developing children, the answer
is again not straightforward. 3 out of the 4 subjects’ profiles are generally closer to the
30 months old profile while only one profile (Clay’s) is closer to the 20 months’.
Considering the fact that the MLU50 of the subjects was generally more compatible
with the 20 months old group, we get an additional support to the approach suggesting
that the language performance of children with SLI should be viewed by looking at
different linguistics skills.
21
6. Conclusions
The study reported in this paper evaluated the language performance of 4 SLI
subjects in comparison with 2 groups of younger normally developing children.
Language profiles of the SLI subjects were created using 4 linguistic measures in 3
language domains: morphosyntactic skills, measured by MLU of 50 utterances
(MLU50) and MLU of 5 longest utterances (MLU5), lexical diversity, measured by
type token ratio (TTR) and conversational participation, measured by mean length of
turn ratio between the child and his or her conversational partner (MLT ratio). The
analysis aimed at checking whether it is valuable to evaluate SLI subjects across
different language subsystems as oppose to concentrating on a specific linguistic skill.
The results reported in the study indicate that the evaluation of the language
performance of SLI children across the language subsystems is indeed meaningful. As
individuals, most of the SLI subjects (3 out of 4) performed differently across the
measures, having other areas as their strengths and weaknesses. A specific subject
could appear to perform worse than 20 months old children in terms of
morphosyntactic skills but much better when conversational participation was
evaluated. Additionally, as a group, the SLI subjects created a complex impression.
While morphosyntactic skills were compatible with those of the control group at 20
and 30 months, the conversational participation was either much lower or much
higher.
The results seem to be leading in one direction. It appears that the SLI children
in the study, possibly like other children with SLI, are using their strengths in one
language area to compensate for their weaknesses in other areas. Even within this
small study group, we’ve seen a relatively ‘flat’ profile and profiles which varied in
the subjects’ weak and strong points. Therefore, in order to properly understand and
evaluate the language difficulties of children with SLI, we cannot concentrate on a
specific language subsystem, but try to look at the relationship between a number of
language domains.
Further research should check this suggestion for a larger group of SLI
subjects, and of different age groups. Additionally, further research could use
alternative language measures than the ones used for this study. More specifically, a
more reliable measure for lexical development could be used or a better way to
evaluate the Type-Token ratio measure across different age groups.
22
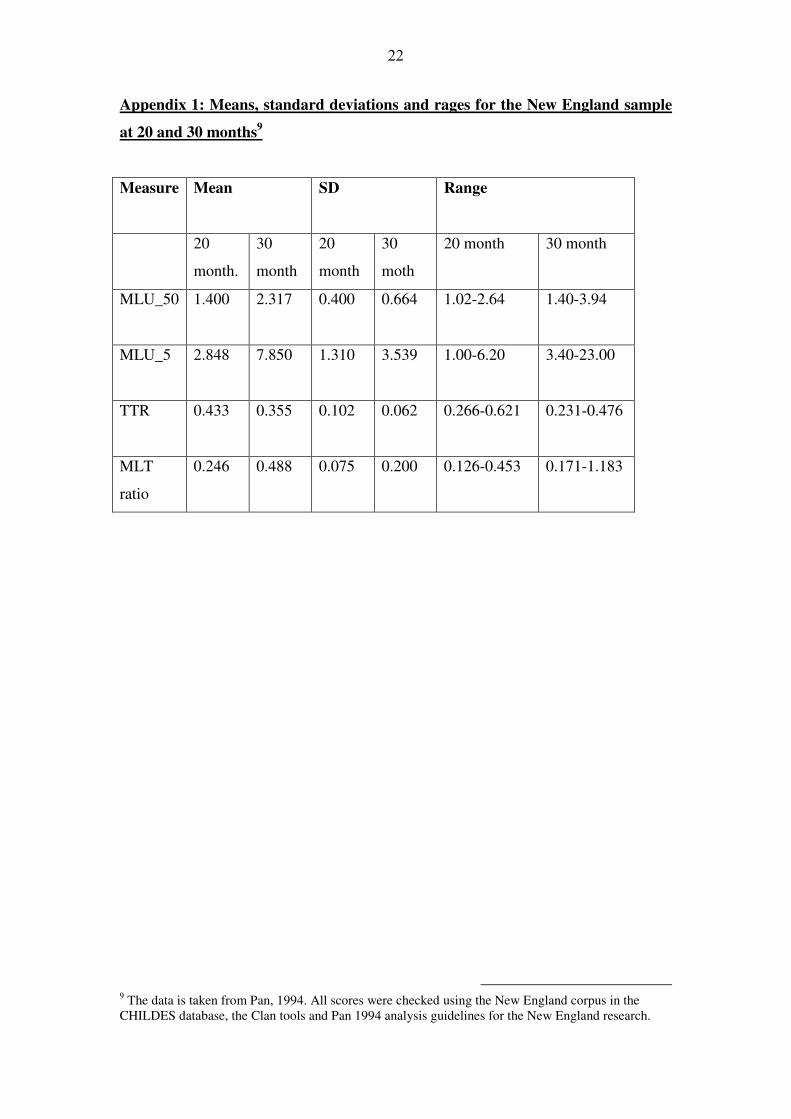
Appendix 1: Means, standard deviations and rages for the New England sample
at 20 and 30 months9
Measure Mean SD Range
20
month.
30
month
20
month
30
moth
20 month 30 month
MLU_50
1.400 2.317 0.400 0.664 1.02-2.64 1.40-3.94
MLU_5
2.848 7.850 1.310 3.539 1.00-6.20 3.40-23.00
TTR
0.433 0.355 0.102 0.062 0.266-0.621 0.231-0.476
MLT
ratio
0.246 0.488 0.075 0.200 0.126-0.453 0.171-1.183
9 The data is taken from Pan, 1994. All scores were checked using the New England corpus in the
CHILDES database, the Clan tools and Pan 1994 analysis guidelines for the New England research.
23
References
Bishop, D.V.M., Bishop, S.J., Bright, P., James, C, Delaney, T, & Tallal, P. (1999). Different
Origin of Auditory and Phonological Processing Problems in Children With Language
Impairment: Evidence From a Twin Study. Journal of Speech, Language, and Hearing
Research, 42, 155-168.
Brinton, B., Fujiki, M. & Mckee, L. (1998). Negotiation Skills of Children With Specific
Language Impairment. Journal of Speech, Language , and Hearing Research, 41 (4) 927-940.
Brown, R. (1973). A first language: The early stages. Cambridge, MA: Harvard University
Press.
CHILDES http://childes.psy.cmu.edu/
Dale, P., Bates, E., Reznick, S., & Morisset, C. (1989). The validity of a parent report
instrument. Journal of Child Language, 16, 239-249.
Flathcer P., & Ingham, R. (1996) Grammatical impairment. In Fletcher, P & MacWhinney, B.
(Ed), The Handbook of Child Language. Oxford, UK, Blackwell Publishers Ltd.
Klee, T., & Fitzgerald, M. (1985) The relation between grammatical development and MLU
in morphemes. Journal of child language, 12 251-269
Lahey, M. & Edwars, J. (1999). Naming Errors of Children With Specific Language
Impairment. Journal of Speech, Language , and Hearing Research 42, 195-205.
MacWhinney, B. (2000) The CHILDES Project. Volume II: The Database. Mahwah, NJ:
Lawrence Erlabaum Associates.
Miller J.F, & Chapman, R. (1981) Research note: The relation between age and MLU in
morphemes. Journal of speech and hearing research, 24 154-61
Miller, J.F & Klee, T (1996). Computational Approaches to the Analysis of Language
Impairment. In Fletcher, P & MacWhinney, B. (Ed), The Handbook of Child Language.
Oxford, UK, Blackwell Publishers Ltd.
Pan, B.A (1994). Basic Measures of Child Language. In Sokolov, J.L & Snow, C.E (Ed).
Handbook of Research in language development using CHILDES. Hillsdale, NJ: Lawrence
Erlabaum Associates.
Rollins, P.R (1994). Language Profiles of Children with Specific Language Impairment. In
Sokolov, J.L & Snow, C.E (Ed). Handbook of Research in language development using
CHILDES. Hillsdale, NJ: Lawrence Erlabaum Associates.
Scarborough, H., Wyckoff, J., & Davidson, R. (1986). A reconsideration of the relation
between age and the mean utterance length. Journal of speech and Hearing Research, 29,
394-399.
Snow, C.E. (1977) The development of conversation between mothers and babies. Journal of
Child Language, 4 1-22
Templin, M.C. (1957). Certain language skills in children. Minneapolis: University of
Minnesota Press. p.105-120