Phytochemical and Biological Investigation of Arachis hypogaea
124
Phytochemical and Biological Investigation of Arachis hypogaea A thesis report submitted to the department of Pharmacy, East West University, Bangladesh, in partial fulfillment of the requirements for the degree of B. Pharm Submitted by: Nazia Afrin ID: 2012-1-70-047 Dissertation Supervisor: Dr. Repon Kumer Saha Assistant Professor
-
Upload
khangminh22 -
Category
Documents
-
view
0 -
download
0
Transcript of Phytochemical and Biological Investigation of Arachis hypogaea

Phytochemical and Biological Investigation of Arachis hypogaea
A thesis report submitted to the department of Pharmacy, East West University, Bangladesh, in
partial fulfillment of the requirements for the degree of B. Pharm
Submitted by:
Nazia Afrin
ID: 2012-1-70-047
Dissertation Supervisor:
Dr. Repon Kumer Saha
Assistant Professor

Endorsement by the Chairperson
This is to certify that the dissertation, entitled “Phytochemical and Biological Investigation of
Arachis hypogaea” Is a thesis work done by Nazia Afrin (ID: 2012-1-70-047) in partial
fulfillment of the requirements for the degree of B.Pharm. We further certify that all the sources
of information and laboratory facilities availed in this connection is duly acknowledged.
_________________________
Dr. Shamsun Nahar Khan
Chairperson & Associate Professor
Department of Pharmacy
East West University
Aftabnagar, Dhaka-1212
Certificate by the Invigilator
This is to certify that the dissertation, “Phytochemical and Biological Investigation of Arachis
hpogaea” is a thesis work done by Nazia Afrin (ID: 2012-1-70-047), in partial fulfillment of the
requirements for the degree of B.Pharm. We further certify that all the sources of information
and laboratory facilities availed in this connection is duly acknowledged.
________________________________
Dr. Repon Kumer Saha
Supervisor
Assistant Professor
Department of Pharmacy
East West University
Aftabnagar, Dhaka – 1212.

Declaration by the Candidate
I, Nazia Afrin (ID:2012-1-70-047), hereby declare that the dissertation entitled “Phytochemical
and Biological Investigation of Arachis hypogaea” , submitted by me to the Department of
Pharmacy, East West University, in the partial fulfillment of the requirement for the degree of
Bachelor of Pharmacy is a genuine & authentic thesis work carried out by me during Fall 201-
Spring 201 under the supervision and guidance of Dr. Repon Kumer Saha, Assistant Professor,
Department of Pharmacy, East West University.
___________________________
Nazia Afrin
ID# 2012-1-70-047
Department of Pharmacy
East West University
Aftabnagar, Dhaka-1212.

ACKNOWLEDGEMENT
All praise to the Almighty for giving the ability to complete my B.Pharm thesis & then
opportunity to study in this topic.
It is my pleasure and immense privilege to express my regards and gratitude to my respected
teacher and supervisor Dr. Repon Kumer Saha, Department of Pharmacy, Assistant Professor of
Pharmacy, East West University; for his constant supervision and support, optimistic counseling
and continuous backup to carry out the thesis work as well as to prepare this dissertation.
I would like to acknowledge the support of our respected teacher Dr. Shamsun Nahar Khan,
Professor, Chairperson, Department of Pharmacy, East West University.
I would also like to extend my gratitude to all the research students in the lab, lab officers and
other staffs of the Faculty of Pharmacy for their help and assistance, friendly and earnest
cooperation which enabled me to work in a very congenial and comfortable ambience.
Last but not the least; I would like to express my gratitude to my family, and friends for their
wholehearted inspiration during my work.
TABLE OF CONTENTS
TOPIC PAGENO.
Abstract 1
Rationale And Objective Of The Work 2
UNIT ONE: INTRODUCTION 4
History Of Medicinal Plants 7
Natural Product Research & Drug Discovery 7
The Plants Role In Human 8
Approaches To Natural Product Research And Drug Discovery 9
Older Approach
Modern Approach 10
10
History Of Traditional Medicinal Practices In Bangladesh 11
Use Of Plant Waste 13
Overview Of The Family Fabaceae 14
Description Of The Plant 17
Growth And Development: 19
Harvesting 20
Taxonomy 21
Nutritional Value Of Peanut 21
Uses Of Peanut 23
Chemical Components Of Peanut 25
Chemical Components Of Peanut Shell 25
Related Chemical Structures: 26
UNIT TWO: LITERATURE REVEIW 29
Nutritional Value Of Seeds 30
Composition Of Peanut Shells 30
Physical Properties Of Shells 30
Protein Solubility 30
Anti-Nutritional Analysis 31
Groundnut Responses On Growth To Seed Irradiation & Fertilizer 31
Adsorptive Activity Of Shells 31
Pharmacological Activity 31
Epidemiological Studies on Nut Consumption & Reduction of heart disease, Type-2
diabetes and Inflammation. 32
Health Benefits of Nut Consumption 33
Antioxidant capacity, nutritional and phytochemical content of peanut shells and
roots 34
Chemical Characteristics (acid Value And Iodine Value) Of Peanut Oil 34
Anti inflammatory and Antioxidant Activity of Peanut skin 34
Anti cancer properties of peanut plant 35
UNIT THREE: IDENTIFICATION AND PREPARATION OF PLANT EXTRACT 36
Plant Collection And Identification 37
Drying Of Plant Sample 37
Drying Of Plant Sample 37
Grinding Of Dried Sample 37
Maceration Of Dried Powdered Sample 37
Principle
Procedure 38
38
Filtration Of The Extract 39
Sample Concentration By Rotary Evaporation Technique 39
Principle
Affecting Factors
Procedure
39
40
41
Sample Concentration By Vacuum Liquid Chromatography (Vlc) Technique. 41
Principle
Apparatus
Reagents
Procedure
Equipments And Other Necessary Tools
Chemicals And Other Reagents
Solvents For Experiments
41
42
42
43
43
43
44
Lectin Extract Preparation 44
Equipments And Other Necessary Tools
Salt And Solution
Procedure
44
44
44
UNIT FOUR : METHODS AND MATERIAL 46
A. Thin Layer Chromatography (TLC) 47
Principle
Solvent Systems Of Thin Layer Chromatography 47
47
48
Apparatus Used For Thin Layer Chromatography
Chemicals Needed For Thin Layer Chromatography
Procedure For Thin Layer Chromatography
Charring With H2so4
Staining With DPPH (2, 2-Diphenyl-1-Picrylhydrazyl)
Staining With FC (Folin-Ciocalteu) Reagent
46
51
52
53
53
B. Thin Layer Chromatography(TLC) Of Lectin Extract 54
Principle 54
Materials Required 54
Reagents 54
Procedure 55
Charring Of TLC Plates 56
Materials
Spreading Procedure Of TLC Plate Of Protein Test
Spreading Procedure Of TLC Plate Of Carbohydrate Test
56
56
56
C. Anti-Oxidant Tests 57
Materials Required 57
Procedure 57
Principle Of DPPH Test 57
Equipment And Materials Required 58
Procedure 58
Standard Preparation 59
Sample Preparation: 59
Blank Preparation 55
D. Antimicrobial Screening Of VLC Fraction By Using Agar Diffusion Method 60
Principle Of Disc Diffusion Method 60
Equipment And Materials Required 60
Test Organisms 61
The Culture Medium And Its Composition
Ingredients
Preparation Of The Medium
Sterilization Procedure
Preparation Of The Test Plates
Standard Discs
Blank Discs
Preparation Of Sample Discs With Test Samples
61
61
61
62
62
62
62
Procedure Of Disc Diffusion Method 63
Minimum Inhibitory concentration of methanol extract of Arachis hypogaea
cyclohexane fractions 64
E. In Vitro Anti-Diabetic Test 65
Glucose Uptake In Yeast Cells 65
Equipment And Materials Required 65
Preparation Of Glucose Solution 66
Standard Preparation 66
Sample Preparation 66
Blank Preparation 66
Procedure 67
F. In Vitro anti-inflammatory Test 67
Preparation Of Human Red Blood Cells (HRBC) Suspension 67
Heat Induced Hemolysis 67
Equipment And Materials Required 68
Standard Preparation 68
Sample Preparation 69
Blank Preparation 69
Procedure 69
G. Heamagglutination Assay 70
Principle 70
Equipment And Materials Required 70
RBC Preparation 71
Procedure 71
UNIT FIVE : RESULTS 72
1. Thin Layer Chromatography 73
2. DPPH Radical Scavenging Activity 76
3. Anti – Diabetic Activity 79
4. Anti-Bacterial Activity 82
Minimum Inhibitory Concentation 89
5. Anti-Inflammatory Activity 90
6. Hemagglutination Inhibition Assay 91
UNIT SIX : DISCUSSION 95
1. 1. Thin Layer Chromatography 96
2. Anti Bacterial Activity 96
3. DPPH Test 97
4. Thin Layer Chromatography Of Lectin Extract 97
5. In Vitro Anti-Diabetic Test 98
6. Hemagglution Inhibition Induced By Of Arachis Hypogaea Primary VLC
Fractions 98
UNIT SEVEN: CONCLUSION 99
UNIT EIGHT: REFERENCE 101
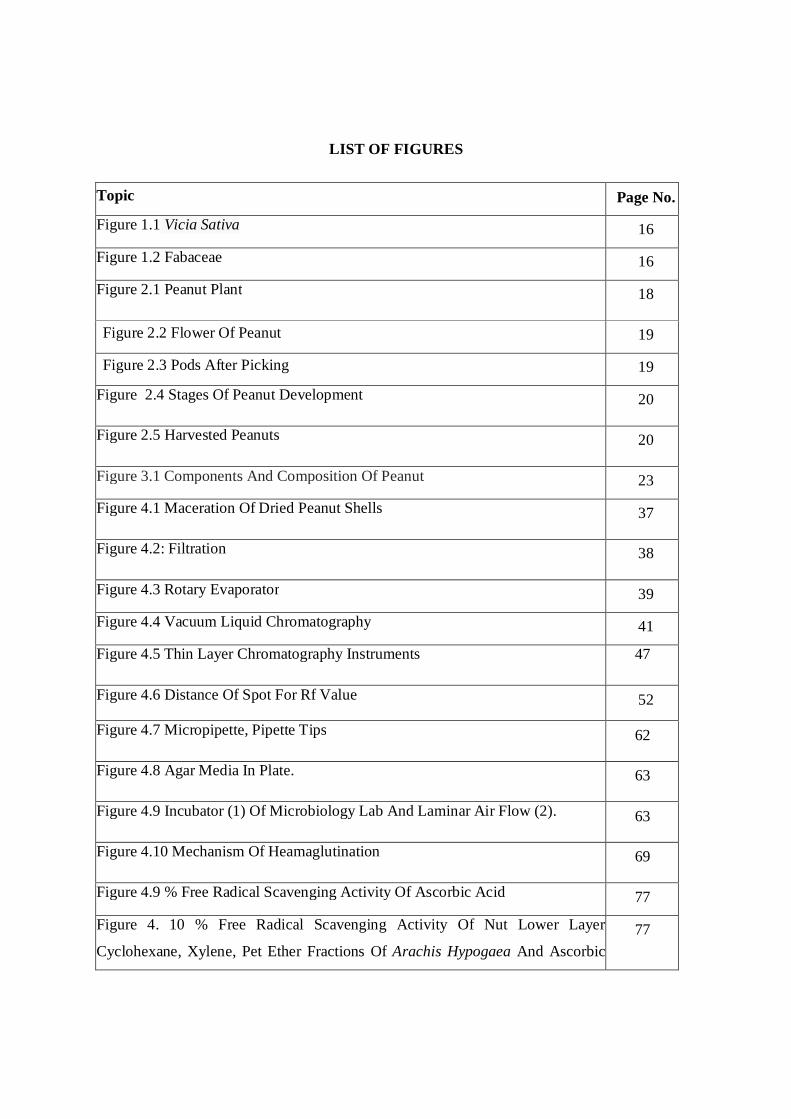
LIST OF FIGURES
Topic Page No.
Figure 1.1 Vicia Sativa 16
Figure 1.2 Fabaceae 16
Figure 2.1 Peanut Plant 18
Figure 2.2 Flower Of Peanut 19
Figure 2.3 Pods After Picking 19
Figure 2.4 Stages Of Peanut Development 20
Figure 2.5 Harvested Peanuts 20
Figure 3.1 Components And Composition Of Peanut 23
Figure 4.1 Maceration Of Dried Peanut Shells 37
Figure 4.2: Filtration 38
Figure 4.3 Rotary Evaporator 39
Figure 4.4 Vacuum Liquid Chromatography 41
Figure 4.5 Thin Layer Chromatography Instruments 47
Figure 4.6 Distance Of Spot For Rf Value 52
Figure 4.7 Micropipette, Pipette Tips 62
Figure 4.8 Agar Media In Plate. 63
Figure 4.9 Incubator (1) Of Microbiology Lab And Laminar Air Flow (2). 63
Figure 4.10 Mechanism Of Heamaglutination 69
Figure 4.9 % Free Radical Scavenging Activity Of Ascorbic Acid 77
Figure 4. 10 % Free Radical Scavenging Activity Of Nut Lower Layer
Cyclohexane, Xylene, Pet Ether Fractions Of Arachis Hypogaea And Ascorbic 77
Acid.
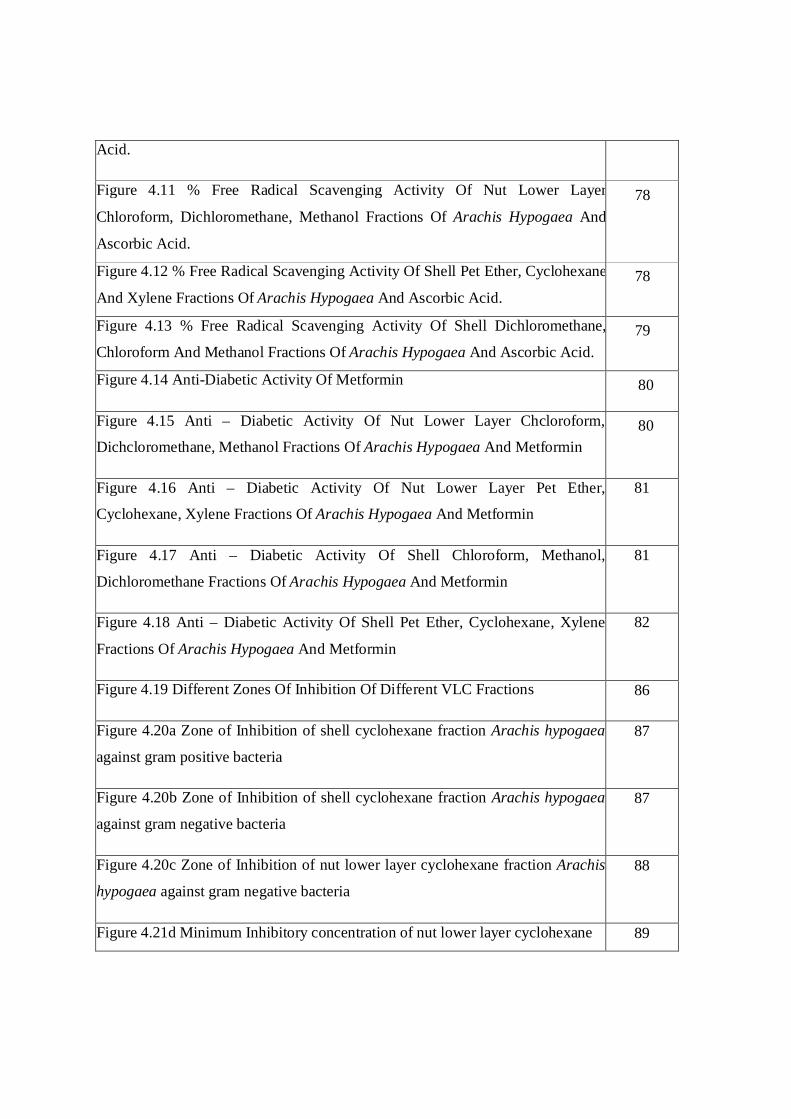
Figure 4.11 % Free Radical Scavenging Activity Of Nut Lower Layer
Chloroform, Dichloromethane, Methanol Fractions Of Arachis Hypogaea And
Ascorbic Acid.
78
Figure 4.12 % Free Radical Scavenging Activity Of Shell Pet Ether, Cyclohexane
And Xylene Fractions Of Arachis Hypogaea And Ascorbic Acid. 78
Figure 4.13 % Free Radical Scavenging Activity Of Shell Dichloromethane,
Chloroform And Methanol Fractions Of Arachis Hypogaea And Ascorbic Acid. 79
Figure 4.14 Anti-Diabetic Activity Of Metformin 80
Figure 4.15 Anti – Diabetic Activity Of Nut Lower Layer Chcloroform,
Dichcloromethane, Methanol Fractions Of Arachis Hypogaea And Metformin 80
Figure 4.16 Anti – Diabetic Activity Of Nut Lower Layer Pet Ether,
Cyclohexane, Xylene Fractions Of Arachis Hypogaea And Metformin
81
Figure 4.17 Anti – Diabetic Activity Of Shell Chloroform, Methanol,
Dichloromethane Fractions Of Arachis Hypogaea And Metformin
81
Figure 4.18 Anti – Diabetic Activity Of Shell Pet Ether, Cyclohexane, Xylene
Fractions Of Arachis Hypogaea And Metformin
82
Figure 4.19 Different Zones Of Inhibition Of Different VLC Fractions 86
Figure 4.20a Zone of Inhibition of shell cyclohexane fraction Arachis hypogaea
against gram positive bacteria
87
Figure 4.20b Zone of Inhibition of shell cyclohexane fraction Arachis hypogaea
against gram negative bacteria
87
Figure 4.20c Zone of Inhibition of nut lower layer cyclohexane fraction Arachis
hypogaea against gram negative bacteria
88
Figure 4.21d Minimum Inhibitory concentration of nut lower layer cyclohexane 89
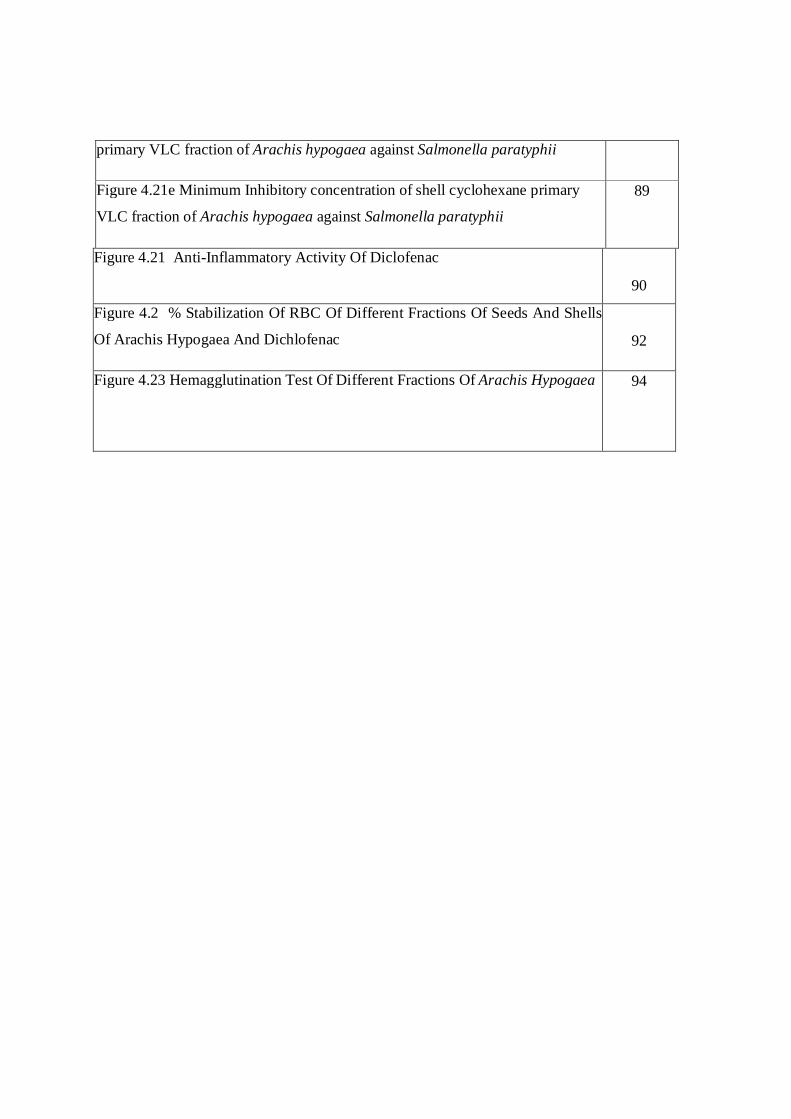
primary VLC fraction of Arachis hypogaea against Salmonella paratyphii
Figure 4.21e Minimum Inhibitory concentration of shell cyclohexane primary
VLC fraction of Arachis hypogaea against Salmonella paratyphii
89
Figure 4.21 Anti-Inflammatory Activity Of Diclofenac
90
Figure 4.2 % Stabilization Of RBC Of Different Fractions Of Seeds And Shells
Of Arachis Hypogaea And Dichlofenac
92
Figure 4.23 Hemagglutination Test Of Different Fractions Of Arachis Hypogaea
94
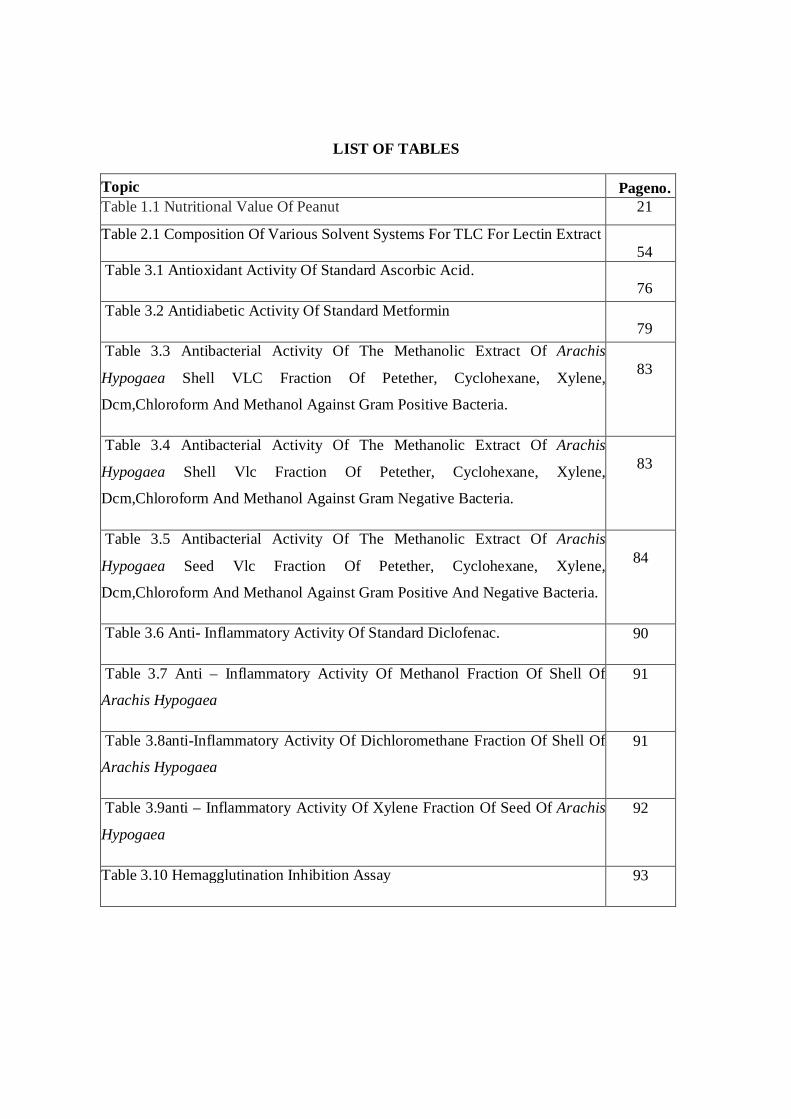
LIST OF TABLES
Topic Pageno. Table 1.1 Nutritional Value Of Peanut 21
Table 2.1 Composition Of Various Solvent Systems For TLC For Lectin Extract 54
Table 3.1 Antioxidant Activity Of Standard Ascorbic Acid. 76
Table 3.2 Antidiabetic Activity Of Standard Metformin 79
Table 3.3 Antibacterial Activity Of The Methanolic Extract Of Arachis
Hypogaea Shell VLC Fraction Of Petether, Cyclohexane, Xylene,
Dcm,Chloroform And Methanol Against Gram Positive Bacteria.
83
Table 3.4 Antibacterial Activity Of The Methanolic Extract Of Arachis
Hypogaea Shell Vlc Fraction Of Petether, Cyclohexane, Xylene,
Dcm,Chloroform And Methanol Against Gram Negative Bacteria.
83
Table 3.5 Antibacterial Activity Of The Methanolic Extract Of Arachis
Hypogaea Seed Vlc Fraction Of Petether, Cyclohexane, Xylene,
Dcm,Chloroform And Methanol Against Gram Positive And Negative Bacteria.
84
Table 3.6 Anti- Inflammatory Activity Of Standard Diclofenac. 90
Table 3.7 Anti – Inflammatory Activity Of Methanol Fraction Of Shell Of
Arachis Hypogaea
91
Table 3.8anti-Inflammatory Activity Of Dichloromethane Fraction Of Shell Of
Arachis Hypogaea
91
Table 3.9anti – Inflammatory Activity Of Xylene Fraction Of Seed Of Arachis
Hypogaea
92
Table 3.10 Hemagglutination Inhibition Assay 93

1 | P a g e
ABSTRACT
Objective: Groundnut [Peanut] (Arachis hypogaea L.) is one of the world’s most popular oil
seed crops which is grown as an annual plant but perennial growth is possible in climates which
are warm until harvest. The objective of this study is pharmacological activities investigation and
comparison among different varieties of Arachis hypogea available in Bangladesh.
Methods: Thin layer chormatogarphy were used to detect the presence of various types of
compound in crude methanolic extracts derived from the Arachis hypogaea pods and shells.
Crude plant powders were extracted sequentially with methanol and then undergone vacuum
Liguid Chrmatograpy (VLC). Later the various fractions were screened for the presence of
significant anti-diabetic, antimicrobial and anti-inflammatory pharmacological activity. Disc
diffusion assay was performed to show the antibacterial effect using gram positive, gram
negative strains of bacteria and fungi. In vitro antioxidant effects were measured by DPPH
scavenging assay. In vitro anti- diabetic assay was carried out by Glucose uptake in Yeast cells
Finally, the anti-inflammatory activities of different fraction of Arachis hypogaea were
investigated for In-vitro anti-inflammatory activity by human red blood cell membrane
stabilization (HRBC) method. Lastly, receptor binding activities were performed by
hemagglutination inhibition assay.
Result: The different fractions of Arachis hypogaea have shown high antioxidant and anti
diabetic activities. In addition the shell and nut lower layers of primary VLC fractions have
shown relatively good anti bacterial activities, notably the against Gram negative strains.
However, very few samples have exhibited anti inflammatory properties. Those worthy of
mention are shell dichloromethane and methanol fractions of primary VLC fractions. In addition
the nut lower layer xylene fractions have shown substantial anti inflammatory activity. Lastly,
the receptor binding activity of both shell and nut lower layer primary VLC fractions have failed
to show any activity.
Conclusion: Under phytochemical analysis, antioxidant test & Chemical screening was done.
The antioxidant property found in crude methanolic extracts derived from the Arachis hypogaea
shells was notable.
2 | P a g e
RATIONALE OF THE WORK
Groundnut [Peanut] (Arachis hypogaea L.) is one of the world’s most popular oil seed crops
which is grown as an annual plant but perennial growth is possible in climates which are warm
until harvest. It is best cultivated in well drained sandy or sandy loam soils with pH ranging from
5.5 to 6.5. Its high content of oil and protein makes it an important commodity for both human
use and livestock feed. Moreover, shells are sometimes used as fuel, for the generation of
electricity.
(Imam et al, 2014)
Fabaceae, also called Leguminosae, pea family of flowering plants (angiosperms), within the
order Fabales. Fabaceae, which is the third largest family among the angiosperms after
Orchidaceae (orchid family) and Asteraceae (aster family), consists of more than 700 genera and
about 20,000 species of trees, shrubs, vines, and herbs and is worldwide in distribution. Peanut
belongs to the family Fabaceae (commonly known as the bean, pea or legume family). It is
an annual herbaceous plant growing 30 to 50 cm (1.0 to 1.6 ft) tall.
The leaves are nyctinastic, opposite, pinnate with four leaflets (two opposite pairs; no terminal
leaflet); each leaflet is 1 to 7 cm (⅜ to 2¾ in) long and 1 to 3 cm (⅜ to 1 inch) across.
Arachis hypogea is an annual spreading, branched herb, stem 30-80 cm long. The leaves are 8-12
cm long, imparipinnate, with leaflets of the shape oblong to obovate, 2-5 cm long. The flowers
are axillary, few, fascicled, yellow, about 8 mm long. Pods are 1-5 cm long, oblong, constricted
between seeds, ripening underground. Unripe fruit is lactagogue. Seed and seed oils are
astringent to the bowels. The oil is aperient and emollient; used as a substitute for olive oil. The
oil predominates in mono unsaturated fats, beneficial for cardiac patients, also preventive of
heart attacks. Ethanolic extract of defatted peanuts shortened bleeding time; had excitatory
effects on smooth muscles of experimental animals, but inhibitory effect on isolated frog heart
(Asolkar et al., 1992).
3 | P a g e
The aim of this research project was to carry out the characterization of the functional molecules
present in the methanolic extract of leaves of the Arachis hypogaea and investigate their
biological activities.
4 | P a g e
UNIT ONE- INTRODUCTION
5 | P a g e
INTRODUCTION
Plants, also called green plants, are multicellular eukaryotes of the kingdom Plantae. They form
an unranked clade Viridiplantae(Latin for green plants) that includes the flowering
plants, conifers andother gymnosperms, ferns, clubmosses, hornworts, liverworts,mosses and
the green algae. Green plants exclude the red and brown algae,
the fungi, archaea, bacteria and animals.
Precise numbers are difficult to determine, but as of 2010, there are thought to be 300–315
thousand species of plants, of which the great majority, some 260–290 thousand, are seed
plants. Green plants provide most of the world's molecular oxygen and are the basis of most of
the earth's ecologies, especially on land. Plants that produce grains, fruits and vegetables form
mankind's basic foodstuffs, and have been domesticated for millennia. Plants are used as
ornaments and, until recently and in great variety, they have served as the source of most
medicines and drugs. The scientific study of plants is known as botany, a branch of biology.
The study of plant uses by people is termed economic botany or ethnobotany; some consider
economic botany to focus on modern cultivated plants, while ethnobotany focuses on indigenous
plants cultivated and used by native peoples. Human cultivation of plants is part of agriculture,
which is the basis of human civilization. Plant agriculture is subdivided
into agronomy, horticulture and forestry.
Thousands of plant species are cultivated for aesthetic purposes as well as to provide shade,
modify temperatures, reduce wind, abate noise, provide privacy, and prevent soil erosion. Plants
are the basis of a multi-billion dollar per year tourism industry which includes travel to historic
gardens, national parks, rainforests, forests with colorful autumn leaves, and the National Cherry
Blossom Festival.
Plants are the source of many natural products such as essential oils, natural dyes, pigments,
waxes, resins, tannins, alkaloids, amber and cork. Products derived from plants include soaps,
shampoos, perfumes, cosmetics, paint, varnish, turpentine, rubber, latex, lubricants, linoleum,
6 | P a g e
plastics, inks, and gums. Renewable fuels from plants include firewood, peat and many
other biofuels. Coal and petroleum are fossil fuels derived from the remains of plants. Olive
oil has been used in lamps for centuries to provide illumination.
Plants are also a primary source of basic chemicals, both for their medicinal and physiological
effects, as well as for the industrial synthesis of a vast array of organic chemicals. Medicines
derived from plants
include aspirin, taxol, morphine, quinine, reserpine, colchicine, digitalis and vincristine. There
are hundreds of herbal supplements such as ginkgo, Echinacea, feverfew, and Saint John's
wort. Pesticides derived from plants include nicotine, rotenone, strychnine and pyrethrins.
Certain plants contain psychotropic chemicals which are extracted and ingested,
including tobacco, cannabis (marijuana), opium, and cocaine. Poisons from plants include ricin,
hemlock and curare.
In genetics, the breeding of pea plants allowed Gregor Mendel to derive the basic laws governing
inheritance, and examination of chromosomes in maize allowed Barbara McClintock to
demonstrate their connection to inherited traits. The plant Arabidopsis thaliana is used in
laboratories as a model organism to understand how genes control the growth and development
of plant structures. Space stations or space colonies may one day rely on plants for life support.
7 | P a g e
HISTORY OF MEDICINAL PLANT
Medicinal plants continue to be an important therapeutic aid for alleviating ailments of
humankind. Search for eternal health and longevity and to seek remedy to relieve pain and
discomfort prompted the early man to explore his immediate natural surrounding and tried many
plants, animal products and minerals and developed a variety of therapeutic agents. Over
millenia that followed the effective agents amongst them were selected by the process of trial,
error, empirical reasoning and even by experimentation. These efforts have gone in history by
the name discovery of 'medicine'. In many eastern cultures such as those of India, China and the
Arab/Persian world this experience was systematically recorded and incorporated into regular
system of medicine that refined and developed and became a part of the Materia Medica of these
countries. The ancient civilization of India, China, Greece, Arab and other countries of the world
developed their systems of medicine independent of each other but all of them were
predominantly plant based. But the theoretical foundation and the insights and in depth
understanding on the practice of medicine that we find in Ayurveda is much superior among
organized ancient systems of medicine (Rahman, 2007).
Natural product research and drug discovery
Nature appears to be a therapeutic cornucopia to treat superfluity of diseases ranging from
common cold to multifarious type of illness since the dawn of civilization. Overwhelming
evidence has accumulated showing that natural products from plants, microorganisms and
marine organisms comprise major portion of the total repertoire of the available therapeutic
drugs. Products of natural origins are often called natural products. Natural products include: an
entire organism (e.g., a plant, an animal, or a microorganism) that has not undergone any kind of
processing or treatment other than a simple process of preservation (e.g., drying), part of an
organism (e.g., leaves or flowers of a plant, an isolated animal organ), an extract of an organism
or part of an organism, and exudates, and pure compounds (e.g., alkaloids, glycosides, sugars,
8 | P a g e
flavonoids, coumarins, lignans, steroids, terpenoids, etc.) isolated from plants, animals, or
microorganisms (Samuelsson, 1999). However, in most cases the term natural products refer to
secondary metabolites, small molecules (mol wt <2000 amu) produced by an organism that are
not strictly necessary for the survival of the organism (Cannell, 1998).
Natural products have played a key role in drug discovery research, as many medicines are either
natural products or derivatives thereof. Indeed, it is estimated that about 40% of all medicines is
either natural products or their semi-synthetic derivatives. This may not be surprising as herbal
medicine is a tradition of healthcare since ancient times and natural extracts screening has been
one of the roots of drug discovery research, where erythromycin and rifampicin (bacterial
infections), statins (hyperlipidemia), quinines and artimesinin (malaria), paclitaxel, vinblastine
and vincristine (cancer), are a few well-known natural products-based medicines. For bacterial
infections, over 80% of all medicines in clinical use is either natural products or their derivatives,
while for anticancer agents over 60% of all drugs is either natural products or derivatives thereof;
examples of several potential lead molecules are vincristine, vinblastine, taxol, camptothecin,
podophyllotoxin, combretastatins, etc which have been isolated from plants for successful use in
cancer treatment (Newman and Cragg, 2007). In earlier times, all drugs and medicinal agents
were derived from natural substances, and most of these remedies
The Plants Role in Human:
A modern dictionary defines health as soundness of physical, mental or moral condition
especially freedom from pain or diseases. But true health is more than that- it includes the joy of
living, the power and ability to lead a satisfying and purposeful life.
Modern drugs or conventional medicine is often viewed as impersonal, emphasizing crisis
intervention. It is not only expensive also many of them bring about side effect, which are
sometimes more dangerous than the disease itself. Plants contain natural substances that can
promote health and alleviate illness. They are source of medicines directly. The origins of
medicine are tied up with plants. Alcohol was produced from starch early in civilization for use
as a beverage preservative, but also as a surface sterilizing agent. Quinine from plant bark
prevents malaria. Morphine, codeine, and cocaine are useful as local anesthetics and serveother
9 | P a g e
purposes through side effects too. Digitoxin from foxglove has been used to regulate heartbeat.
Caffeine from plants is an important daily stimulant for many humans. Nicotine and A-9-THC
are important recreational drugs. There are probably many more important medicines to be found
in the tropical forests of the world where countless species remain unknown. Medicinal drugs
now used in the developed world come from only about 95 of the 250,000 known species of
flowering plants on earth. The study of new plants can and has led to the creation of medicines
that can save lives and cure illnesses. As the tropical rainforest shrinks day by day, the potential
to discover new plants shrinks as well, yet few researchers are actively seeking new plant species
in the jungles of South America.
Approaches to natural product research and drug discovery:
Different approaches to drug discovery from plants can be enumerated as: random selection
followed by chemical screening, random selection followed by one or more biological assays,
follow-up of biological activity reports, follow-up of ethno medical (traditional medicine) use of
plants, use of appropriate plant parts as such in powdered form or preparation of enriched /
standardised extracts (herbal product development), use of a plant product, biologically potent
but beset with other issues, as a lead for further chemistry, and single new compounds as drugs.
The objective of the later approach is the targeted isolation of new bioactive plant products, i.e.
lead substances with novel structures and novel mechanisms of action. This approach has
provided a few classical examples, but the problem most often encountered here is not enough
availability. The problem of availability can be overcome by semi-synthesis/synthesis or using
tissue culture techniques (by genetically modifying the biosynthetic pathway of the compound of
interest).
Drug discovery from plants involves a multidisciplinary approach combining botanical,
ethnobotanical, phytochemical and biological techniques. The search for bioactive chemicals
from the unstudied part of the plant kingdom can be conducted essentially with three methods
(Cotton, 1996): the random method involves the collection of all plants found in a given area of
study, phylogenetic targeting means the collection of all members of those plant families which
are known to be rich in bioactive compounds, and the ethnobotanical approach is based on the
traditional knowledge of medicinal plant use. It has been suggested that the ethno-directed
10 | P a g e
sampling is most likely to succeed in identifying drugs for use in the treatment of
gastrointestinal, inflammatory and dermatological complaints. Strategies for research in the area
of natural products have evolved quite significantly over the last couple of decades. These can be
broadly divided into two categories:
Older approach
Focused on chemistry of compounds from natural sources, but not on activity.
Straightforward isolation and identification of compounds from natural sources followed
by testing of biological activity in animal model.
Chemotaxonomic investigation.
Selection of organisms primarily based on ethnopharmacological information, folkloric
reputations, or traditional uses.
Modern approach
Bioassay-directed (mainly in vitro) isolation and identification of active lead compounds
from natural sources.
Production of natural products libraries.
Production of active compounds by cell or tissue culture, genetic manipulation, natural
combinatorial chemistry and so on.
More focused on bioactivity.
Introduction of the concepts of dereplication, chemical fingerprinting, and metabolomics.
Selection of organisms based on ethno pharmacological information, folkloric
reputations, or traditional uses, and also those randomly selected.
11 | P a g e
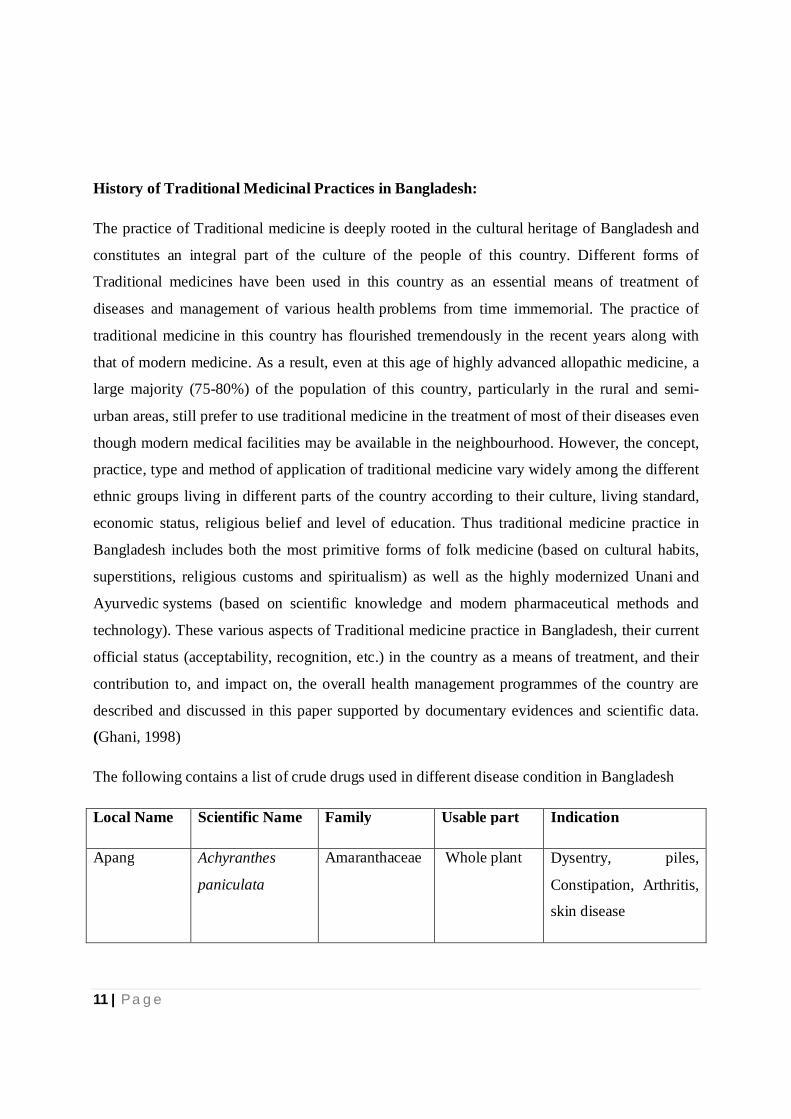
History of Traditional Medicinal Practices in Bangladesh:
The practice of Traditional medicine is deeply rooted in the cultural heritage of Bangladesh and
constitutes an integral part of the culture of the people of this country. Different forms of
Traditional medicines have been used in this country as an essential means of treatment of
diseases and management of various health problems from time immemorial. The practice of
traditional medicine in this country has flourished tremendously in the recent years along with
that of modern medicine. As a result, even at this age of highly advanced allopathic medicine, a
large majority (75-80%) of the population of this country, particularly in the rural and semi-
urban areas, still prefer to use traditional medicine in the treatment of most of their diseases even
though modern medical facilities may be available in the neighbourhood. However, the concept,
practice, type and method of application of traditional medicine vary widely among the different
ethnic groups living in different parts of the country according to their culture, living standard,
economic status, religious belief and level of education. Thus traditional medicine practice in
Bangladesh includes both the most primitive forms of folk medicine (based on cultural habits,
superstitions, religious customs and spiritualism) as well as the highly modernized Unani and
Ayurvedic systems (based on scientific knowledge and modern pharmaceutical methods and
technology). These various aspects of Traditional medicine practice in Bangladesh, their current
official status (acceptability, recognition, etc.) in the country as a means of treatment, and their
contribution to, and impact on, the overall health management programmes of the country are
described and discussed in this paper supported by documentary evidences and scientific data.
(Ghani, 1998)
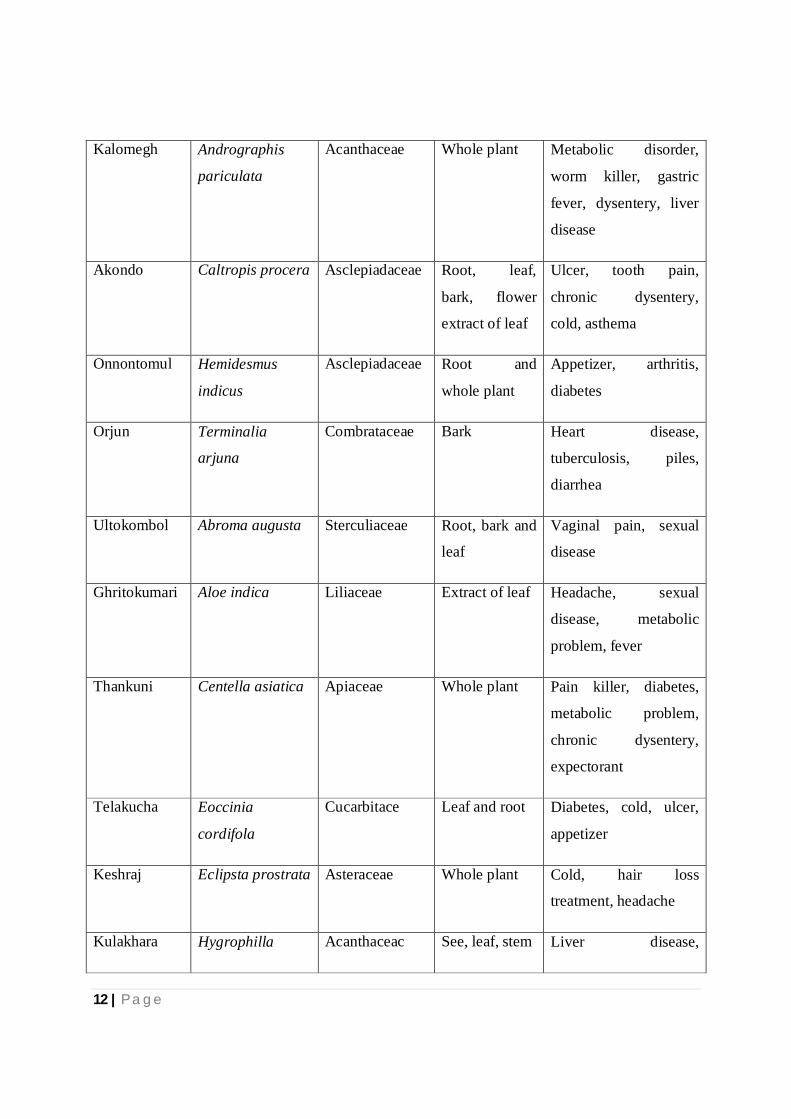
The following contains a list of crude drugs used in different disease condition in Bangladesh
Local Name Scientific Name Family Usable part Indication
Apang Achyranthes
paniculata
Amaranthaceae Whole plant Dysentry, piles,
Constipation, Arthritis,
skin disease
12 | P a g e
Kalomegh Andrographis
pariculata
Acanthaceae Whole plant Metabolic disorder,
worm killer, gastric
fever, dysentery, liver
disease
Akondo Caltropis procera Asclepiadaceae Root, leaf,
bark, flower
extract of leaf
Ulcer, tooth pain,
chronic dysentery,
cold, asthema
Onnontomul Hemidesmus
indicus
Asclepiadaceae Root and
whole plant
Appetizer, arthritis,
diabetes
Orjun Terminalia
arjuna
Combrataceae Bark Heart disease,
tuberculosis, piles,
diarrhea
Ultokombol Abroma augusta Sterculiaceae Root, bark and
leaf
Vaginal pain, sexual
disease
Ghritokumari Aloe indica Liliaceae Extract of leaf Headache, sexual
disease, metabolic
problem, fever
Thankuni Centella asiatica Apiaceae Whole plant Pain killer, diabetes,
metabolic problem,
chronic dysentery,
expectorant
Telakucha Eoccinia
cordifola
Cucarbitace Leaf and root Diabetes, cold, ulcer,
appetizer
Keshraj Eclipsta prostrata Asteraceae Whole plant Cold, hair loss
treatment, headache
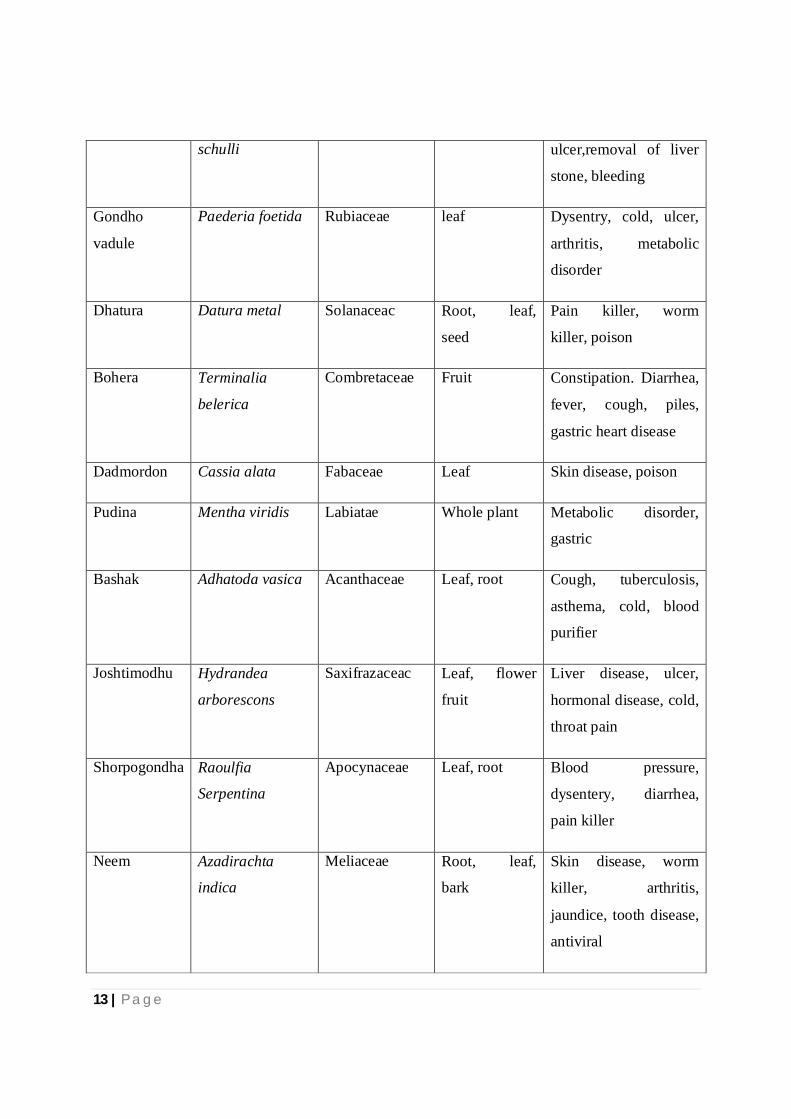
Kulakhara Hygrophilla Acanthaceac See, leaf, stem Liver disease,
13 | P a g e
schulli ulcer,removal of liver
stone, bleeding
Gondho
vadule
Paederia foetida Rubiaceae leaf Dysentry, cold, ulcer,
arthritis, metabolic
disorder
Dhatura Datura metal Solanaceac Root, leaf,
seed
Pain killer, worm
killer, poison
Bohera Terminalia
belerica
Combretaceae Fruit Constipation. Diarrhea,
fever, cough, piles,
gastric heart disease
Dadmordon Cassia alata Fabaceae Leaf Skin disease, poison
Pudina Mentha viridis Labiatae Whole plant Metabolic disorder,
gastric
Bashak Adhatoda vasica Acanthaceae Leaf, root Cough, tuberculosis,
asthema, cold, blood
purifier
Joshtimodhu Hydrandea
arborescons
Saxifrazaceac Leaf, flower
fruit
Liver disease, ulcer,
hormonal disease, cold,
throat pain
Shorpogondha Raoulfia
Serpentina
Apocynaceae Leaf, root Blood pressure,
dysentery, diarrhea,
pain killer
Neem Azadirachta
indica
Meliaceae Root, leaf,
bark
Skin disease, worm
killer, arthritis,
jaundice, tooth disease,
antiviral
14 | P a g e
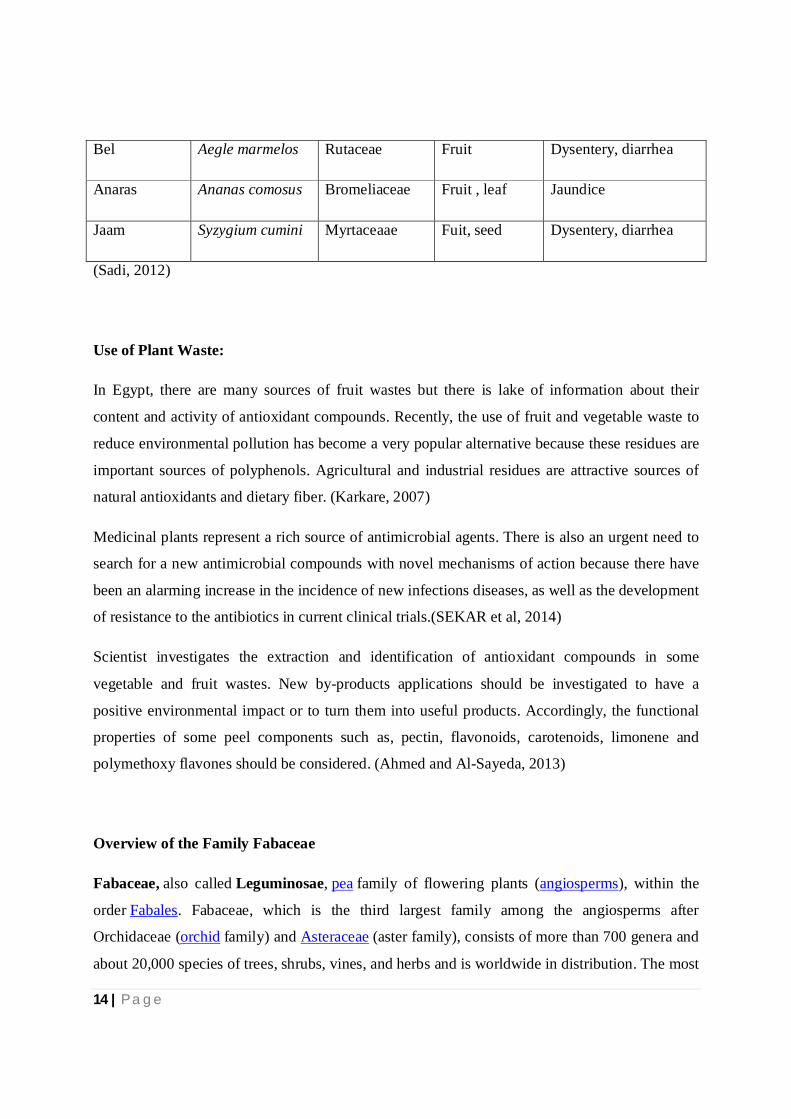
Bel Aegle marmelos Rutaceae Fruit Dysentery, diarrhea
Anaras Ananas comosus Bromeliaceae Fruit , leaf Jaundice
Jaam Syzygium cumini Myrtaceaae Fuit, seed Dysentery, diarrhea
(Sadi, 2012)
Use of Plant Waste:
In Egypt, there are many sources of fruit wastes but there is lake of information about their
content and activity of antioxidant compounds. Recently, the use of fruit and vegetable waste to
reduce environmental pollution has become a very popular alternative because these residues are
important sources of polyphenols. Agricultural and industrial residues are attractive sources of
natural antioxidants and dietary fiber. (Karkare, 2007)
Medicinal plants represent a rich source of antimicrobial agents. There is also an urgent need to
search for a new antimicrobial compounds with novel mechanisms of action because there have
been an alarming increase in the incidence of new infections diseases, as well as the development
of resistance to the antibiotics in current clinical trials.(SEKAR et al, 2014)
Scientist investigates the extraction and identification of antioxidant compounds in some
vegetable and fruit wastes. New by-products applications should be investigated to have a
positive environmental impact or to turn them into useful products. Accordingly, the functional
properties of some peel components such as, pectin, flavonoids, carotenoids, limonene and
polymethoxy flavones should be considered. (Ahmed and Al-Sayeda, 2013)
Overview of the Family Fabaceae
Fabaceae, also called Leguminosae, pea family of flowering plants (angiosperms), within the
order Fabales. Fabaceae, which is the third largest family among the angiosperms after
Orchidaceae (orchid family) and Asteraceae (aster family), consists of more than 700 genera and
about 20,000 species of trees, shrubs, vines, and herbs and is worldwide in distribution. The most
15 | P a g e
important commercial species include Glycine max(soybean), Pisum sativum (garden
pea), Arachis hypogaea (peanut [groundnut]), and Medicago sativa (alfalfa [lucerne]). Most
woody species are tropical; herbaceous (i.e., nonwoody) species occur mainly in temperate
regions. (Encyclopedia Britannica, 2015)
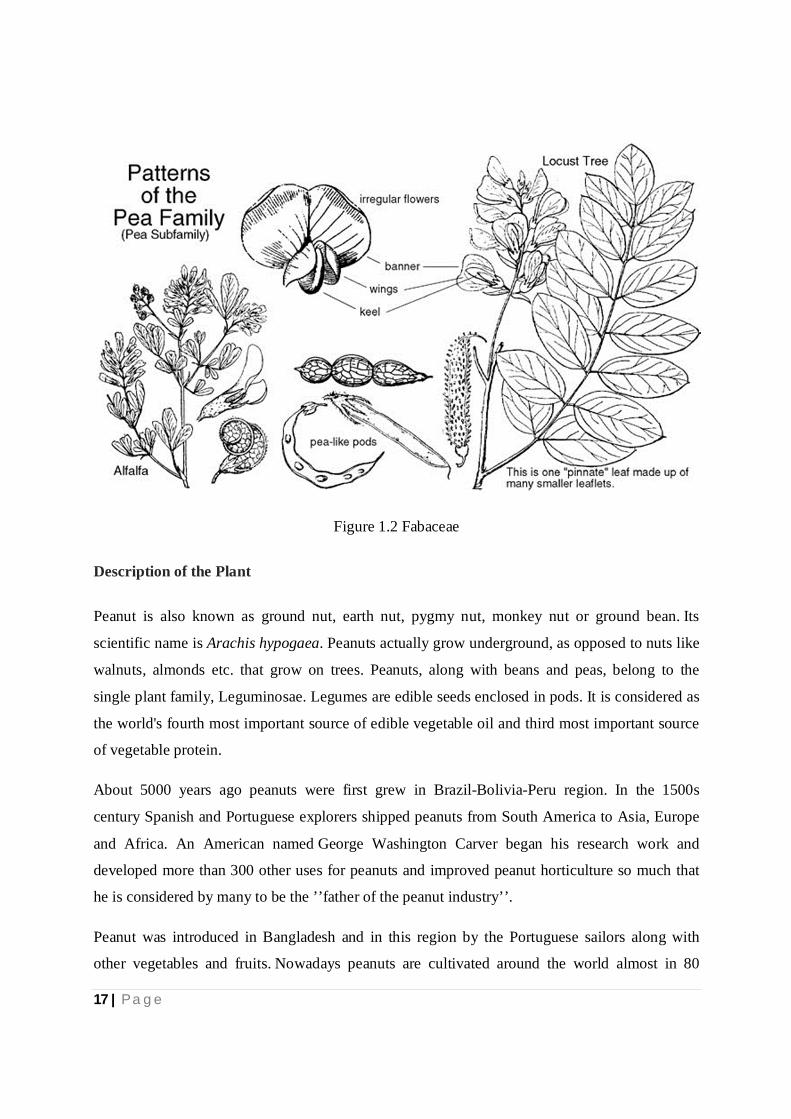
The leaves are stipulate, nearly always alternate, and range from pinnately or palmately
compound to simple. Like the other legume families the petiole base is commonly enlarged into
a pulvinus. The flowers are strongly perigynous, zygomorphic, and commonly in racemes,
spikes, or heads. The perianth commonly consists of a calyx and corolla of 5 segments each. The
petals are overlapping (imbricate) in bud with the posterior petal (called the banner or flag)
outermost (i.e., exterior) in position. The petals are basically distinct except for variable
connation of the two lowermost ones called the keel petals. The lateral petals are often called the
wings. The androecium most commonly consists of 10 stamens in two groups (i.e., they are
diadelphous with 9 stamens in one bundle and the 10th stamen more or less distinct). The pistil is
simple, comprising a single style and stigma, and a superior ovary with one locule containing 2-
many marginal ovules. The fruit is usually a legume. The fruit is technically called a legume or
pod. It is composed of a single seed-bearing carpel that splits open along two seams. Legume
fruits come in an enormous variety of shapes and sizes, including indehiscent pods that do not
split open. Of all the legumes, the peanut is especially fascinating because it develops below the
ground.
Fabaceae, range in habit from giant to small annual herbs, with the majority being herbaceous
perennials. Plants have indeterminate inflorescences, which are sometimes reduced to a single
flower. The flowers have a short hypanthium and a single carpel with a short gynophore, and
after fertilization produce fruits that are legumes. The Leguminosae have a wide variety
of growth forms including trees, shrubs or herbaceous plants or even vines or lianas. The
herbaceous plants can be annuals, biennials or perennials, without basal or terminal leaf
aggregations. They are upright plants, epiphytesor vines. The latter support themselves by means
of shoots that twist around a support or through cauline or foliar tendrils. Plants can be
heliophytes, mesophytes or xerophytes.
16 | P a g e
Many species have leaves with structures that attract ants that protect the plant from herbivore
insects (a form of mutualism). Extrafloral nectariesare common among the Mimosoideae and the
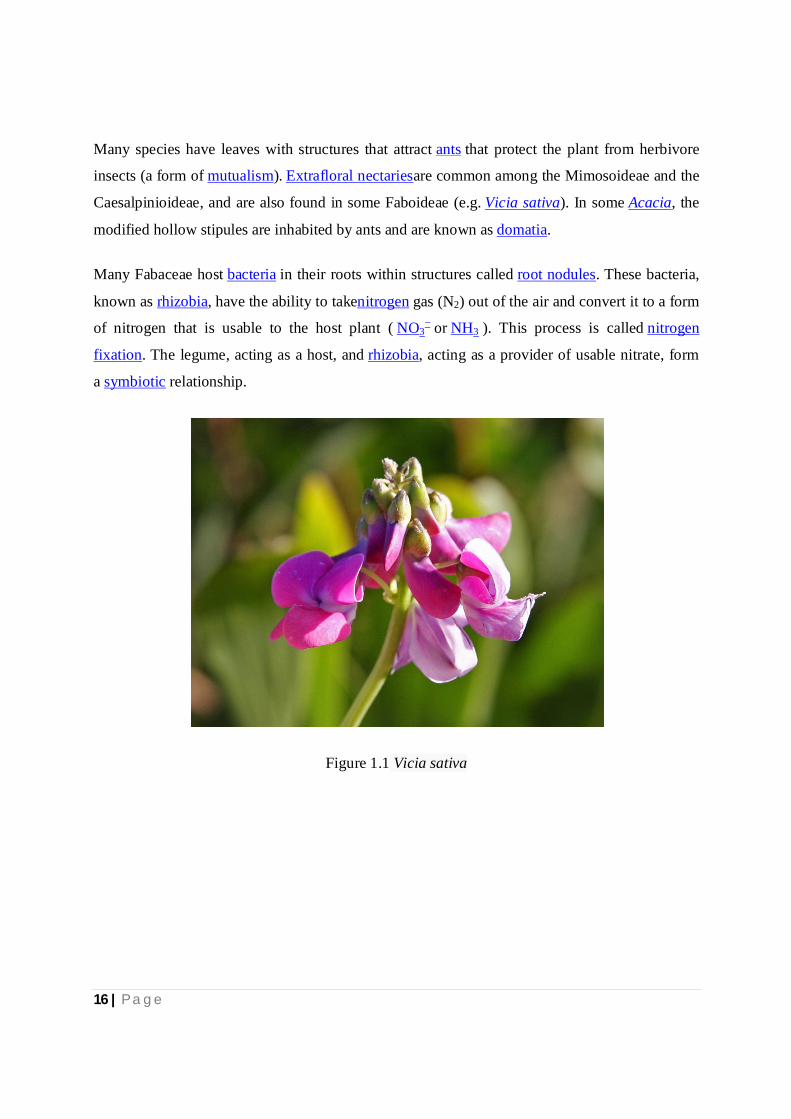
Caesalpinioideae, and are also found in some Faboideae (e.g. Vicia sativa). In some Acacia, the
modified hollow stipules are inhabited by ants and are known as domatia.
Many Fabaceae host bacteria in their roots within structures called root nodules. These bacteria,
known as rhizobia, have the ability to takenitrogen gas (N2) out of the air and convert it to a form
of nitrogen that is usable to the host plant ( NO3− or NH3 ). This process is called nitrogen
fixation. The legume, acting as a host, and rhizobia, acting as a provider of usable nitrate, form
a symbiotic relationship.
Figure 1.1 Vicia sativa
17 | P a g e
Figure 1.2 Fabaceae
Description of the Plant
Peanut is also known as ground nut, earth nut, pygmy nut, monkey nut or ground bean. Its
scientific name is Arachis hypogaea. Peanuts actually grow underground, as opposed to nuts like
walnuts, almonds etc. that grow on trees. Peanuts, along with beans and peas, belong to the
single plant family, Leguminosae. Legumes are edible seeds enclosed in pods. It is considered as
the world's fourth most important source of edible vegetable oil and third most important source
of vegetable protein.
About 5000 years ago peanuts were first grew in Brazil-Bolivia-Peru region. In the 1500s
century Spanish and Portuguese explorers shipped peanuts from South America to Asia, Europe
and Africa. An American named George Washington Carver began his research work and
developed more than 300 other uses for peanuts and improved peanut horticulture so much that
he is considered by many to be the ’’father of the peanut industry’’.
Peanut was introduced in Bangladesh and in this region by the Portuguese sailors along with
other vegetables and fruits. Nowadays peanuts are cultivated around the world almost in 80
18 | P a g e
countries. In Bangladesh peanuts are cultivated in Noakhali, Faridpur, Kishoreganj, Patuakhaliu,
Rangpur and Dhaka districts in 35000 hectors of lands and about 40,000 metric tons of peanuts
produced annually.
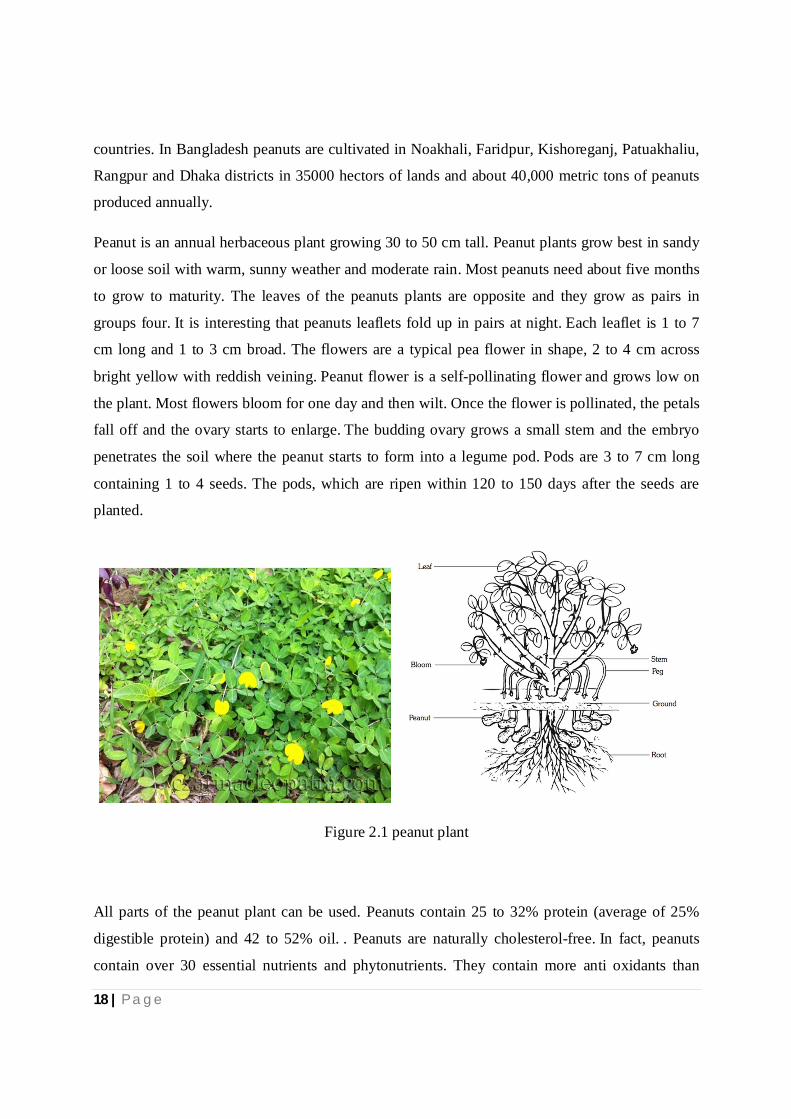
Peanut is an annual herbaceous plant growing 30 to 50 cm tall. Peanut plants grow best in sandy
or loose soil with warm, sunny weather and moderate rain. Most peanuts need about five months
to grow to maturity. The leaves of the peanuts plants are opposite and they grow as pairs in
groups four. It is interesting that peanuts leaflets fold up in pairs at night. Each leaflet is 1 to 7
cm long and 1 to 3 cm broad. The flowers are a typical pea flower in shape, 2 to 4 cm across
bright yellow with reddish veining. Peanut flower is a self-pollinating flower and grows low on
the plant. Most flowers bloom for one day and then wilt. Once the flower is pollinated, the petals
fall off and the ovary starts to enlarge. The budding ovary grows a small stem and the embryo
penetrates the soil where the peanut starts to form into a legume pod. Pods are 3 to 7 cm long
containing 1 to 4 seeds. The pods, which are ripen within 120 to 150 days after the seeds are
planted.
Figure 2.1 peanut plant
All parts of the peanut plant can be used. Peanuts contain 25 to 32% protein (average of 25%
digestible protein) and 42 to 52% oil. . Peanuts are naturally cholesterol-free. In fact, peanuts
contain over 30 essential nutrients and phytonutrients. They contain more anti oxidants than
19 | P a g e
grapes, green tea, tomatoes, spinach, broccoli and carrots. Despite of its utility some people are
allergic to peanuts.
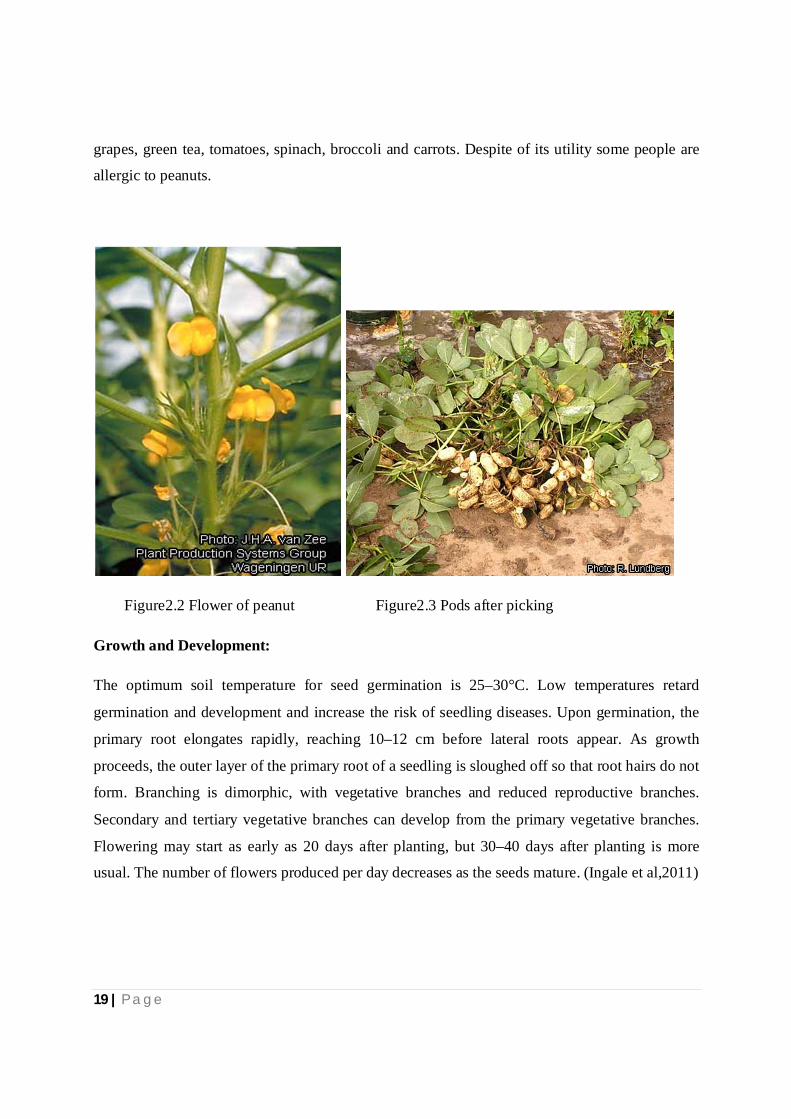
Figure2.2 Flower of peanut Figure2.3 Pods after picking
Growth and Development:
The optimum soil temperature for seed germination is 25–30°C. Low temperatures retard
germination and development and increase the risk of seedling diseases. Upon germination, the
primary root elongates rapidly, reaching 10–12 cm before lateral roots appear. As growth
proceeds, the outer layer of the primary root of a seedling is sloughed off so that root hairs do not
form. Branching is dimorphic, with vegetative branches and reduced reproductive branches.
Secondary and tertiary vegetative branches can develop from the primary vegetative branches.
Flowering may start as early as 20 days after planting, but 30–40 days after planting is more
usual. The number of flowers produced per day decreases as the seeds mature. (Ingale et al,2011)

20 | P a g e
Figure 2.4 Stages of peanut development
Harvesting:
Groundnut seeds are often planted at a depth of 4–7 cm at a rate of 60–80 kg/ha. Groundnut pods
intended for sowing are often hand-shelled 1–2 weeks before sowing. Only fully mature pods are
selected. Before sowing, groundnut seed may be treated with a fungicide to control seedling
diseases. In general, early sowing improves yields and seed quality. (Ingale et al,2011)
Figure 2.5 harvested peanuts
21 | P a g e
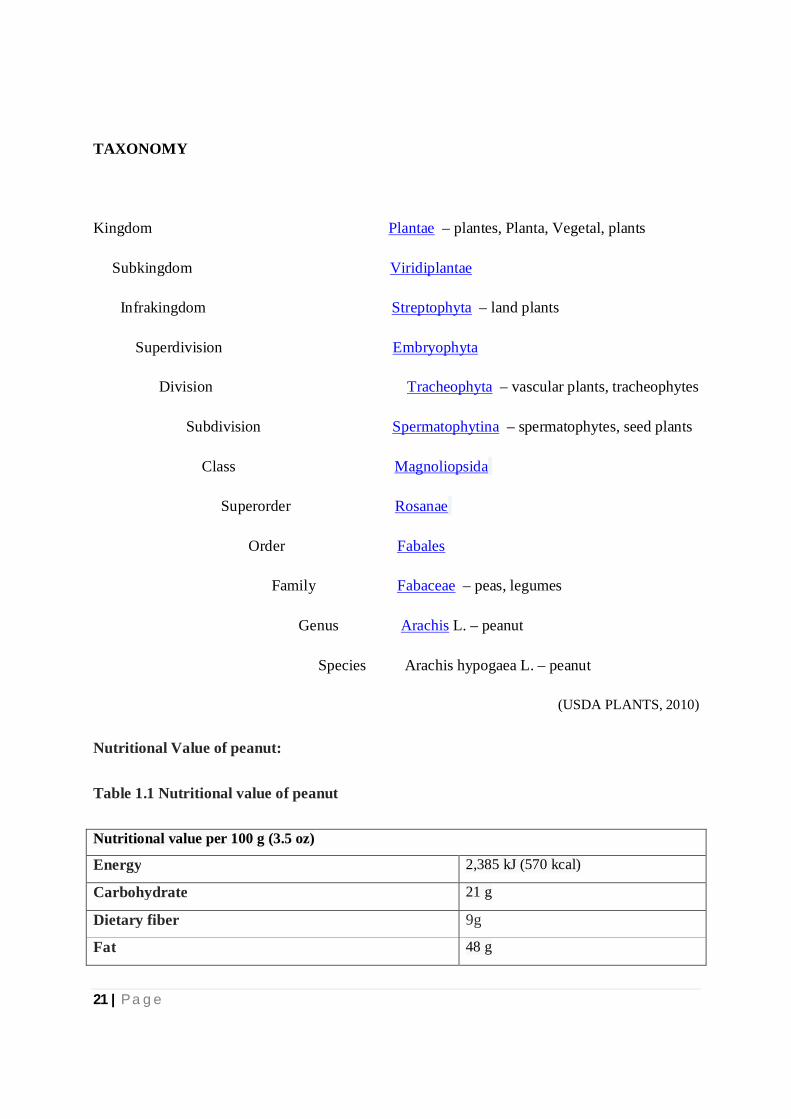
TAXONOMY
Kingdom Plantae – plantes, Planta, Vegetal, plants
Subkingdom Viridiplantae
Infrakingdom Streptophyta – land plants
Superdivision Embryophyta
Division Tracheophyta – vascular plants, tracheophytes
Subdivision Spermatophytina – spermatophytes, seed plants
Class Magnoliopsida
Superorder Rosanae
Order Fabales
Family Fabaceae – peas, legumes
Genus Arachis L. – peanut
Species Arachis hypogaea L. – peanut
(USDA PLANTS, 2010)
Nutritional Value of peanut:
Table 1.1 Nutritional value of peanut
Nutritional value per 100 g (3.5 oz)
Energy 2,385 kJ (570 kcal)
Carbohydrate 21 g
Dietary fiber 9g
Fat 48 g
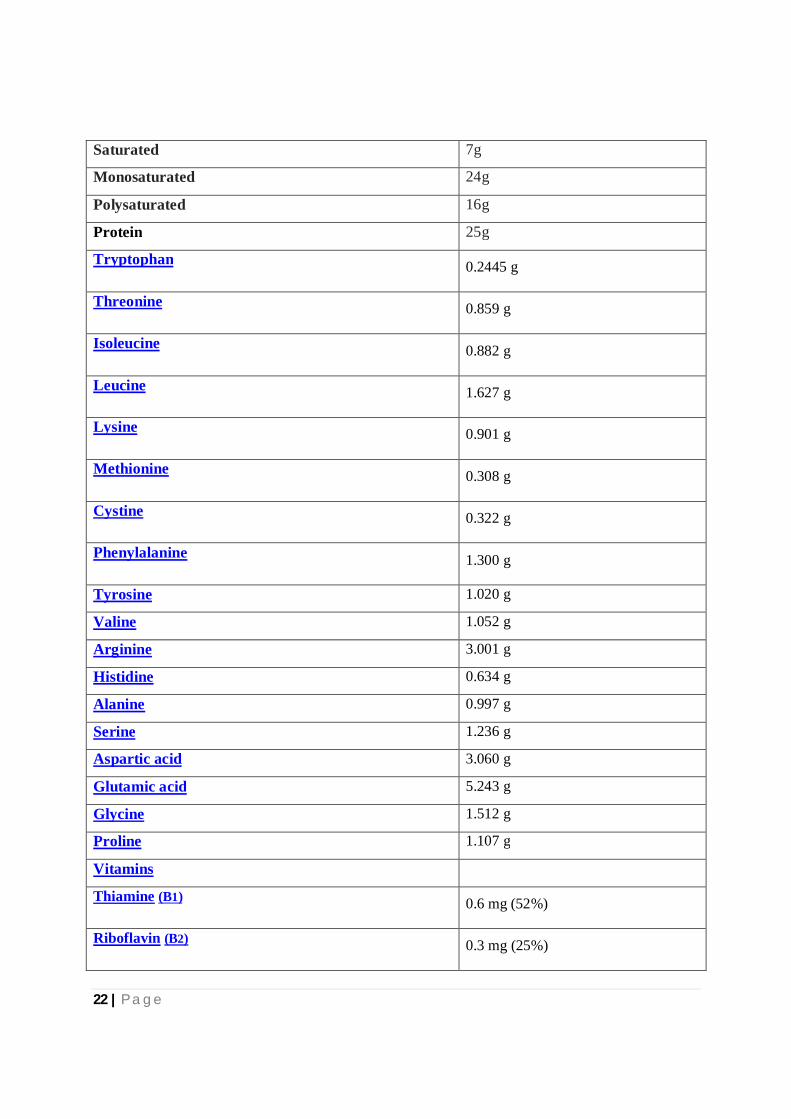
22 | P a g e
Saturated 7g
Monosaturated 24g
Polysaturated 16g
Protein 25g
Tryptophan 0.2445 g
Threonine 0.859 g
Isoleucine 0.882 g
Leucine 1.627 g
Lysine 0.901 g
Methionine 0.308 g
Cystine 0.322 g
Phenylalanine 1.300 g
Tyrosine 1.020 g
Valine 1.052 g
Arginine 3.001 g
Histidine 0.634 g
Alanine 0.997 g
Serine 1.236 g
Aspartic acid 3.060 g
Glutamic acid 5.243 g
Glycine 1.512 g
Proline 1.107 g
Vitamins
Thiamine (B1) 0.6 mg (52%)
Riboflavin (B2) 0.3 mg (25%)
23 | P a g e
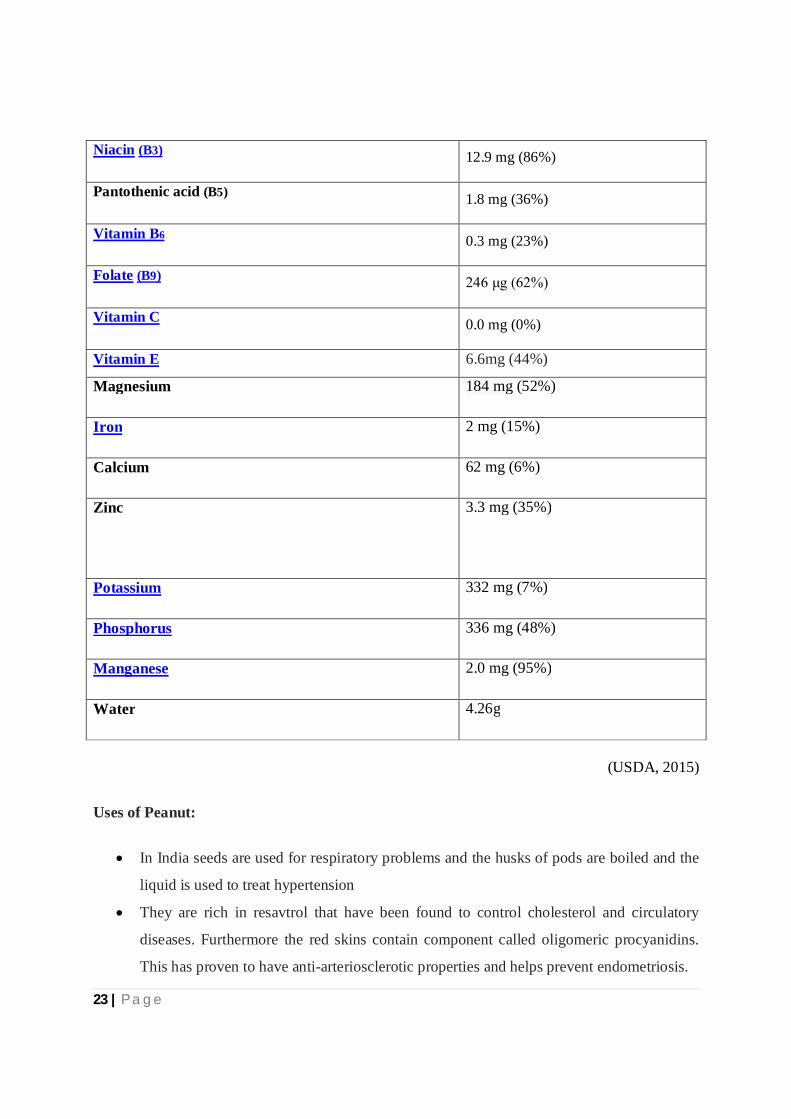
Niacin (B3) 12.9 mg (86%)
Pantothenic acid (B5) 1.8 mg (36%)
Vitamin B6 0.3 mg (23%)
Folate (B9) 246 μg (62%)
Vitamin C 0.0 mg (0%)
Vitamin E 6.6mg (44%)
Magnesium 184 mg (52%)
Iron 2 mg (15%)
Calcium 62 mg (6%)
Zinc 3.3 mg (35%)
Potassium 332 mg (7%)
Phosphorus 336 mg (48%)
Manganese 2.0 mg (95%)
Water 4.26g
(USDA, 2015)
Uses of Peanut:
In India seeds are used for respiratory problems and the husks of pods are boiled and the
liquid is used to treat hypertension
They are rich in resavtrol that have been found to control cholesterol and circulatory
diseases. Furthermore the red skins contain component called oligomeric procyanidins.
This has proven to have anti-arteriosclerotic properties and helps prevent endometriosis.
24 | P a g e
Togather, resavtrol and oligomeric procyanidins helps fight cancer
It contains phytoestrogen genisteins that help prevent hot flushes or depression related to
PMS. Along with helping to prevent the formation of cancer cells, it also prevents vision
loss and macular degeneration in diabetic patients.
Peanuts possess galactogouge properties.
Peanuts boost the immune system and prevent lymphatic disorders
Peanut oil obtained from cold pressing has medicinal uses
(Botanical, 2015)
Chemical Constituents:
25 | P a g e
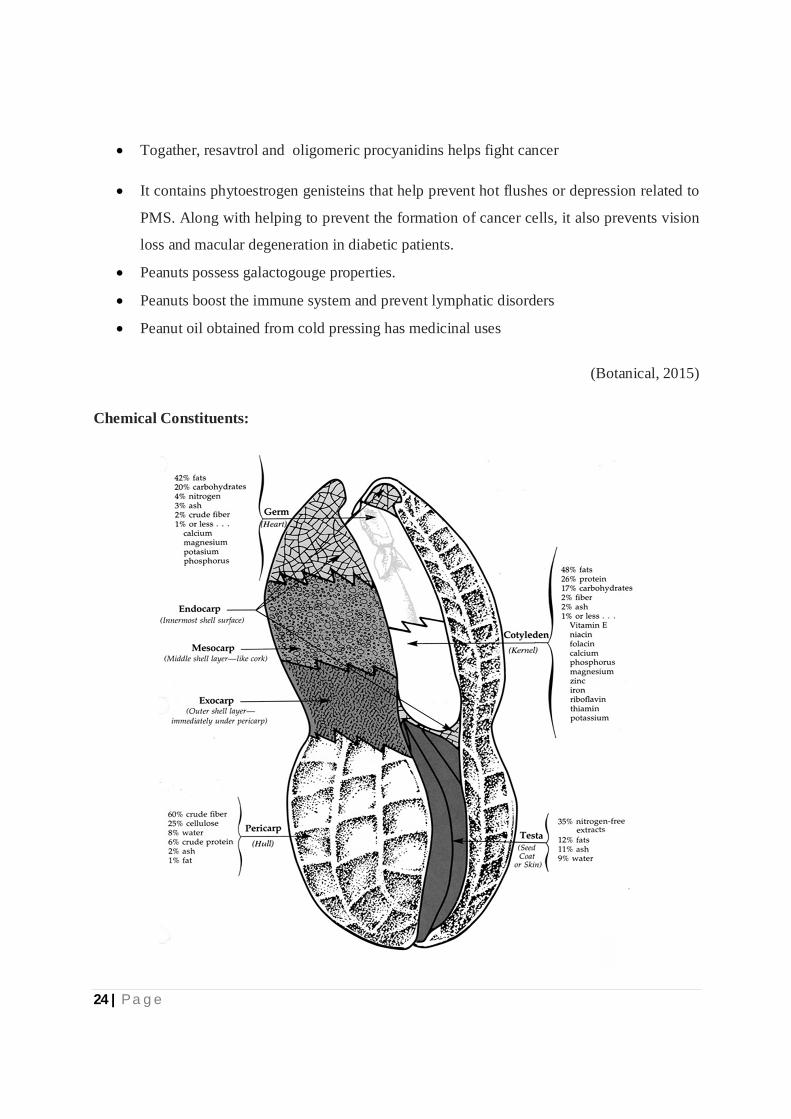
Figure 3.1 Components and Composition of peanut
Chemical components of peanut-
Acids- Arachidic Acids, aspartic acid, behenic acid, cholorogenic acid, stearic acid, gadoleic
acid, gentisic acid, lauric acid, linoleic acid, oleic acid, p-coumaric acid, palmitic,
palmitoleic, ascorbic acid
Arachin
Lecithin
Flavonoid- quercetin
Amino acids- aspartic acid, glutamic acid, alanine, arginine, cysteine, phaenylalanine,
methionine, proline, serine, tyrosine, glucine ,lycine, leucine, isoleucine, histidine,
threonine, tryptophan, valine
Minerals- aluminium, sulfur, cadmium, zinc, copper, boron, copper, iron, selenium,
sodium, calcium, magnesium, phosphorus, potassium
Fat
Carbohydrates, cellulose
Vitamins- niacin, folacin, riboflavin, thiamin
(Botanical, 2015)
Chemical components of peanut shell-
Poteins- 8.2%
Carbohydrates- 2.5%
Lignin- 28%
Cellulose- 37%
Hemicelluloses- 18.7%
(Jaishankar et al, 2014)

26 | P a g e
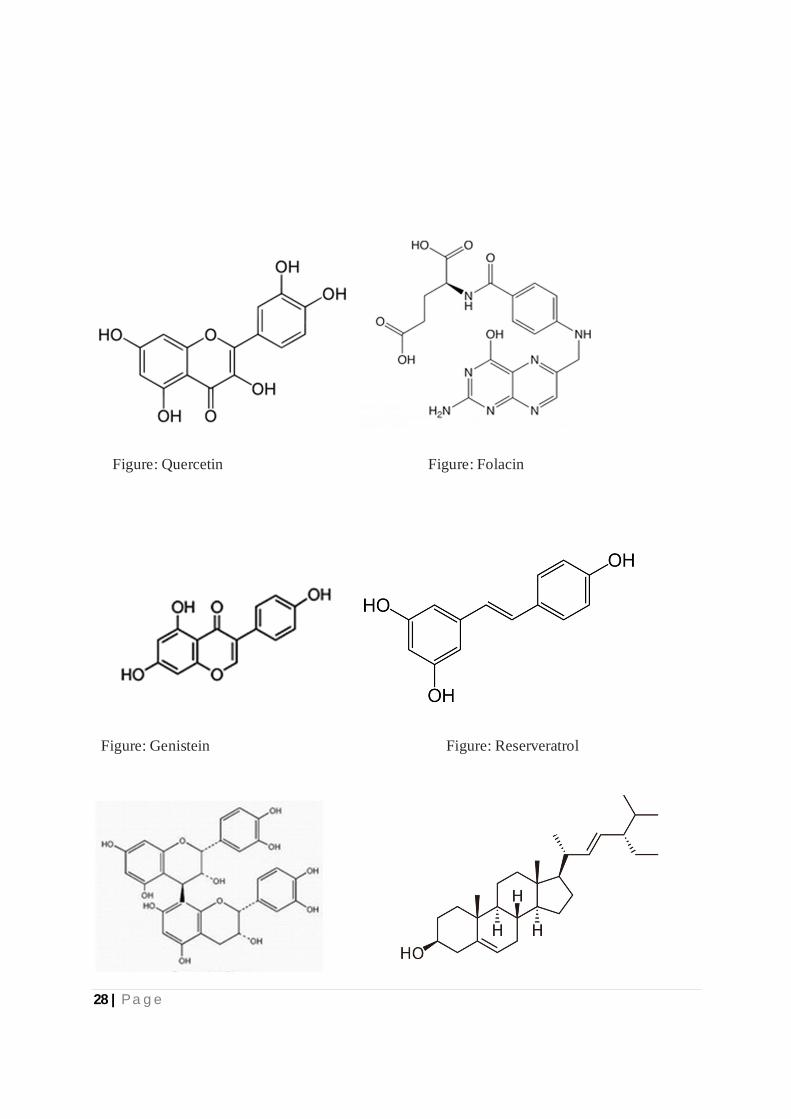
Related Chemical Structures:
Figure: Behenic acid Figure: Cholorogenic acid
Figure: Arachidonic acid Figure: Gentisic acid
Figure: Gadoleic acid Figure: Stearic Acid
Figure: Lauric acid Figure: p-coumaric acid
27 | P a g e
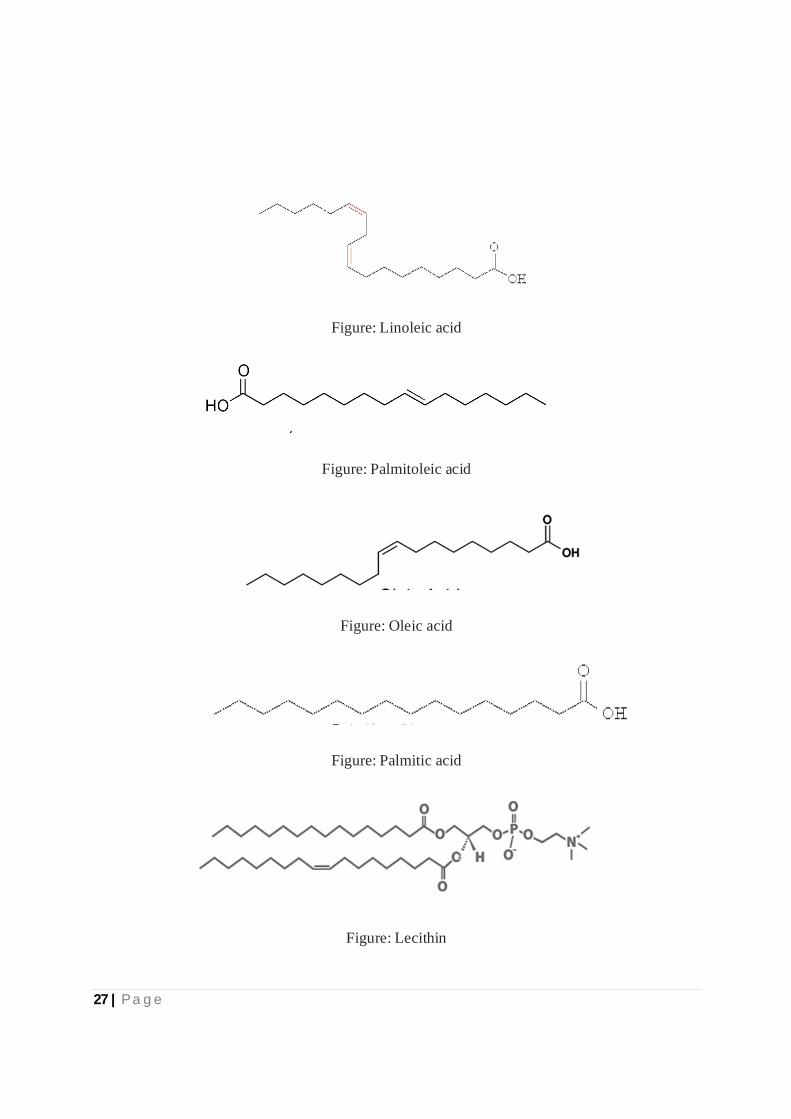
Figure: Linoleic acid
Figure: Palmitoleic acid
Figure: Oleic acid
Figure: Palmitic acid
Figure: Lecithin
28 | P a g e
Figure: Quercetin Figure: Folacin
Figure: Genistein Figure: Reserveratrol
29 | P a g e
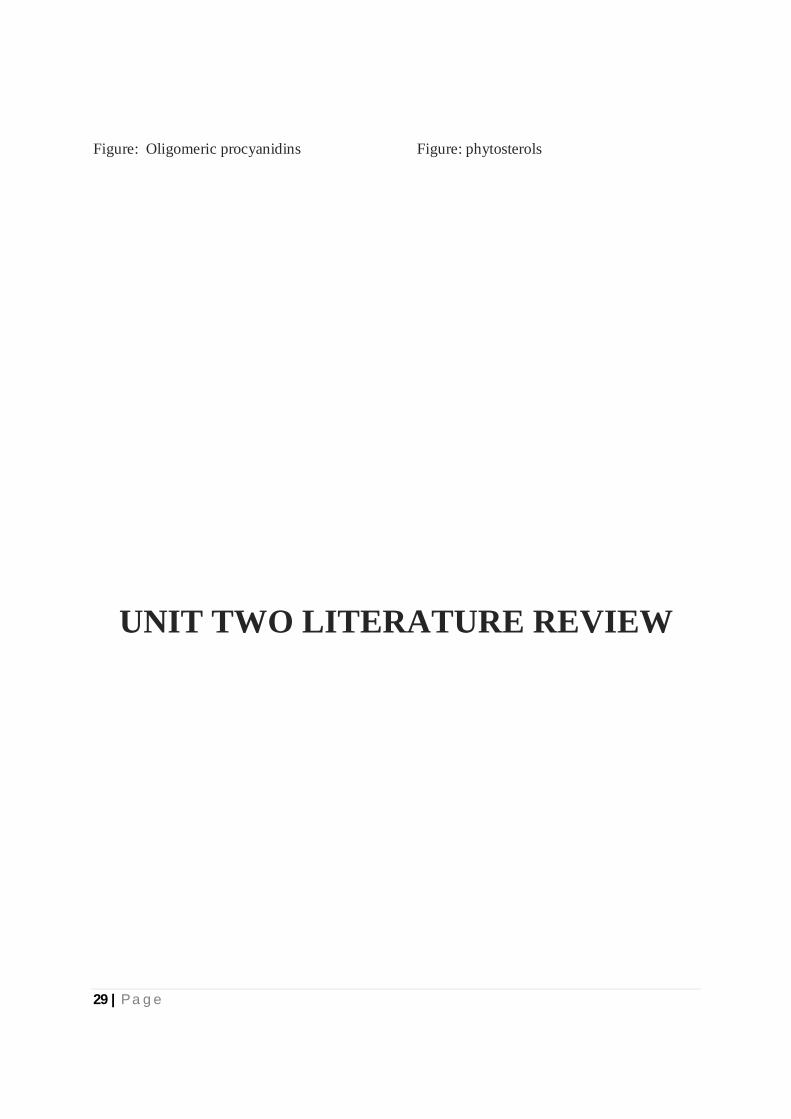
Figure: Oligomeric procyanidins Figure: phytosterols
UNIT TWO LITERATURE REVIEW

30 | P a g e
LITERATURE REVIEW
Nutritional value of seeds
The result showed that the groundnut seed contain:
Moisture (5.529%),
Crude fibre (1.149%)
Lipid (46.224%)
Crude protein (25.20%)
Carbohydrate (21.26%)
Ash (2.577%)
The very high oil content of peanuts
(35 to 40%)
Calcium (0.087%)
Phosphorus (0.29%)
Energy (601.856%).
Fatty acid(saturated and unsaturated)
10.44 and 33.51%
(Batal et al, 2005)
Composition of peanut shells
Peanut shells were selected on the basis of its freshness, dryness and hard structure. It contains:
8.2% of protein, 28.8% of lignin, 37.0% of cellulose, 18.7% of hemicelluloses and 2.5% of
carbohydrates.
Physical Properties of shells
I. Its bulk density was 120-140 kg/m3
II. Ash melting point (K)>1200. ( Monisha et al, 2014)
Protein Solubility
The protein solubility at different pH ranging from 0.5 to 13.5, the maximum seeds proteins were
extracted at pH 12. The serine has not been reported in the seed protein and the seed was found
to contain highest amount of proline (6.412%).
31 | P a g e
Anti-nutritional analysis
The anti-nutritional analysis shows that cyanide content 4.818 HCN/100 g, tannin 0.412/100 g,
oxalate 0.180/100g. (Ingale S.,Shrivatava S.K., 2011)
Groundnut responses on growth to seed irradiation & fertilizer
Groundnut seeds are mainly comprised of protein, fat and carbohydrate and that is what
make it sensitive to radiation induced stress, but unlike the suppressive effect high gamma
rays (0.7- 2.3 KGy) have on germination and growth parameters of groundnut low doses
have been reported to be beneficial stated that gamma rays produce radicals that can damage
and affect differentially plant morphology, anatomy, biochemistry, and physiology
depending on the irradiation level. They added that lower exposures to gamma rays were
sometimes stimulatory and that several studies reported improvement of agronomic
characteristics by using gamma radiation. (Imam et al, 2014)
Increased pod yield and root- shoot ratio as a result of N addition. Nitrogen is known to be
an important determinant of plant growth and development, and this might explain the
increased yield in response to increased Nitrogen application. (Imam et al, 2014)
Adsorptive activity of shells
Making use of peanut shells as bio-adsorbents is an effective method to adsorb toxic heavy
metals from effluents not polluting the ground water and at the same time utilizing the discarded
open agricultural wastes in the environment for a useful purpose of waste water treatment.(
Monisha et al,2014)
Pharmacological Activity
Receptor Binding Activity
hemagglutinin activity for goat blood group is 1:8
No haemagglutinin activity for chicken and human blood group,
No trypsin inhibition was found. (Ingale S.,Shrivatava S.K., 201)
32 | P a g e
Epidemiological Studies on Nut Consumption & Reduction of heart disease, Type-2
diabetes and Inflammation.
Epidemiologic studies have associated nut consumption with a reduced incidence of coronary
heart disease and gallstones in both genders and diabetes in women. Limited evidence also
suggests beneficial effects on hypertension, cancer, and inflammation. Interventional studies
consistently show that nut intake has a cholesterol-lowering effect, even in the context of healthy
diets, and there is emerging evidence of beneficial effects on oxidative stress, inflammation, and
vascular reactivity. Blood pressure, visceral adiposity and the metabolic syndrome also appear to
be positively influenced by nut consumption. Thus it is clear that nuts have a beneficial impact
on many cardiovascular risk factors. Contrary to expectations, epidemiologic studies and clinical
trials suggest that regular nut consumption is unlikely to contribute to obesity and may even help
in weight loss.
US Food and Drug Administration issued a health claim for nuts because of the link between nut
consumption and a reduced risk of both CHD and intermediate biomarkers, such as blood
cholesterol. The scientific evidence behind the proposal of nuts as cardio-protective foods stem
from both epidemiological observations suggesting a consistent inverse association between the
frequency of nut intake and development of CHD and numerous short-term clinical trials
showing beneficial effects of nut intake on the lipid profile and other intermediate markers of
CHD. A study of 987 diabetic women from the prospective Nurses’ Health Study showed a
direct association between nut consumption and increased plasma levels of adiponectin, an
adipose tissue-secreted cytokine with anti-inflammatory and ant atherosclerotic properties. The
third study was carried out in 772 older subjects at high risk for CHD living in Spain Nutrients
2010, 2 659 for the purpose of assessing adherence to the Mediterranean dietary pattern and its
food components in relation to levels of soluble inflammatory markers. Adjusted mean serum
levels of intercellular adhesion molecule-1 (ICAM-1), but not those of CRP or IL-6, decreased
across increasing tertiles of nut consumption.
There were a limited number of hemorrhagic strokes in the highest categories of nut
consumption, thus further studies are clearly warranted to confirm or discard this improbable
adverse effect of nuts.
33 | P a g e
There was an inverse relationship between nut intake and hypertension in lean subjects but not in
those who were overweight or obese at baseline.
Nut consumption was inversely associated with risk of type-2 diabetes after multivariate
adjustment for traditional risk factors, with relative risks across categories of nut consumption
for a 28 g serving of 1.0, 0.92, 0.84 and 0.73. Considering only lean women, a 45% risk
reduction was observed in those consuming nuts five times or more per week. Consumption of
peanut butter was also inversely associated with type-2 diabetes with an adjusted relative risk of
0.79 in women consuming peanut butter more than four times a week compared with those who
never or almost never ate peanut butter.
Health Benefits of Nut Consumption
Nuts are also rich sources of other bioactive macronutrients that have the potential to beneficially
affect metabolic and cardiovascular outcomes. They are an excellent source of protein
(approximately 25% of energy) and often have a high content of L-arginine . As this amino acid
is the precursor of the endogenous vasodilator, nitric oxide (NO), nut intake might help improve
vascular reactivity. Nuts contain sizeable amounts of folate, a B-vitamin necessary for normal
cellular function that plays an important role in detoxifying homocysteine Nuts are also rich
sources of antioxidant vitamins (e.g., tocopherols) and phenolic compounds, also bioavailable
after consumption and capable of providing a significant antioxidant load. Almonds in particular
are especially rich in α-tocopherol. Nuts are cholesterol-free, but their fatty fraction contains
sizeable amounts of chemically related noncholesterol sterols belonging to a heterogeneous
group of compounds known as plant sterols or phytosterols. Phytosterols interfere with
cholesterol absorption and thus help lower blood cholesterol when present in sufficient amounts
in the intestinal lumen.
(Ross, 2010)
34 | P a g e
Antioxidant capacity, nutritional and phytochemical content of peanut shells and roots
Shell and roots of peanut had a significant amount of total dietary fiber, protein and ash content.
Therefore, they can be utilized as feed or prebiotic compound. These peanut by-products also
showed levels of total saponins and phytic acid below the ant nutritional factor threshold.Peanut
roots had the highest phenolic, saponins and alkaloid contents. Positive correlations between
these phytochemical contents and DPPH radical scavenging activity were found for peanut shells
and peanut roots.
i) Phenolic compounds that possess redox properties which lead to the antioxidative
capacities (Siddhuraju and Becker, 2003) may be present in peanut shells and roots.
ii) Specific alkaloid classes such as quinolone alkaloid with antioxidant activity (Chung
and Woo, 2001) may be present in peanut shells and roots.
iii) Saponins that act as chelators of transition metals (Cu2+ or Fe2+) and results in
diminished cellular sensitivity to oxidant damage (Amzal et al., 2008) may be present
in peanut shells and roots.
( Sim et al, 2010)
Chemical Characteristics (acid Value And Iodine Value) Of Peanut Oil
The high iodine value denotes high degree of unsaturation of the oil caused by the extent of
oxidation and degree of heat treatment during oil processing (Kirk and Sawyer, 1991). Peanut oil
has a high smoke point relative to many other cooking oils, so is commonly used for frying
foods. Its major component fatty acids are oleic acid (46.8% as olein), linoleic acid (33.4% as
linolein), and palmitic acid (10.0% as palmitin)
(Mandloi et al, 2014)
Anti inflammatory and Antioxidant Activity of Peanut skin
The in vitro antioxidant activity of peanut skin extracts (PSE) has been reported but the
associated anti-inflammatory properties have not been widely examined. This study investigated
the anti-inflammatory effects of PSE on the pro-inflammatory enzyme, Cyclooxygenase-2
35 | P a g e
(COX-2) protein expression, on its downstream product, prostaglandin E2 (PGE2), and on
nitrous oxide (NO) levels. Acetone peanut skin extracts and ethanol peanut skin extracts
suggesting that A-PSE and E-PSE not also possess similar antioxidant properties, but also exhibit
similar anti-inflammatory effects. (Lewis et al, 2013)
Anti cancer properties of peanut plant
When infected by a microbial pathogen, the peanut plant (Arachis hypogaea) becomes a potent
producer of a distinctive set of stilbene-derived phytoalexins.3-5 Peanut stilbenoids have been
considered the major sustaining factor of the plant’s resistance to diseases. In addition, the health
benefits of resveratrol (24) (Figure 1) from peanuts.
Anticancer properties of selected peanut stilbenoids, arachidin-1, arachidin-3, trans-30 -
isopentadienyl-3, 5, and 40 -trihydroxystilbene, and resveratrol (24) were investigated.
Arachidin-1 (1) appreciably induced mitochondrionmediated apoptosis at low concentrations and
was demonstrated to be an effective anticancer agent that was capable of inducing caspase-
independent death of cancer cells with mutations in apoptotic genes. (Sobolev et al, 2011)
Peanuts play a crucial role in weight management. Epidemiological studies have provided useful
information on beneficial effects of nuts which also includes peanuts. Even though peanuts are
rich in fats, they can still be included in diet for weight loss. Metal ions which are cofactors for
many enzymes, vitamins that are not synthesized in the body, poly unsaturated and
monounsaturated fatty acids, whose consumption can increase the levels of HDL cholesterol
which is good for the heart, are present in peanuts. A diet including peanuts could provide all
these vital nutrients, and play a critical role in preventing disease and promoting good health.
(Settaluri et al, 2012)
36 | P a g e
UNIT THREE: PLANT COLLECTION &
IDENTIFICATION
37 | P a g e
PLANT COLLECTION & IDENTIFICATION
Plant Collection And Identification
The nuts were collected from Savar, Dhaka, Bangladesh during April, 2015 and identified by the
taxonomist of the Bangladesh National Herbarium, Mirpur, and Dhaka. A voucher specimen of
the plant Arachis hypogaea was deposited (Accession No.: 42269) in the herbarium for further
reference.
Drying Of Plant Sample
After the collection of sample it needs to be dried to make the sample extract. In general the
plant material should be dried at temperature below 30 degree C to avoid the decomposition of
thermo labile compounds. So sun drying can be very effective but drawback is sometimes water
molecules are absorbed by the sample and hence fungus growth can affect the phytochemical
study. The seeds along with the test a were dried in the sun light thus chemical decomposition
does not take place.
Grinding Of Dried Sample
Small amount of plant material can be milled using grinder or blender. But if the sample is in
high amount then it is easier to get powdered sample by grinding from a spice mill. Grinding
improves the efficiency of extraction by increasing surface area. It also decreases the amount of
solvent required for the extraction. The dried samples were ground to coarse powder with a
mechanical grinder (Blender) and powdered samples were kept in clean closed containers
pending extraction. During grinding of samples, the grinder was thoroughly cleaned to avoid
contamination with any remnant of previously ground material or other foreign matter deposited
on the grinder.
Maceration Of Dried Powdered Sample
Principle
The choice of extraction procedure depends on the nature of the plant material and the
components to be isolated. The principle of solid-liquid extraction is that when a solid material
comes in contact with a solvent, the soluble components in the solid material move to the
38 | P a g e
solvent. Thus, solvent extraction of plant material results in the mass transfer of soluble active
principle (medicinal ingredient) to the solvent, and this takes place in a concentration gradient.
The rate of mass transfer decreases as the concentration of active principle in the solvent
increases, until equilibrium is reached and the concentration of active principle in the solid
material and the solvent are the same. Thereafter, there will no longer be a mass transfer of the
active principle from plant material to the solvent. Since mass transfer of the active principle also
depends on its solubility in the solvent, heating the solvent can enhances the mass transfer.
Moreover, if the solvent in equilibrium with the plant material is replaced with fresh solvent, the
concentration gradient is changed.
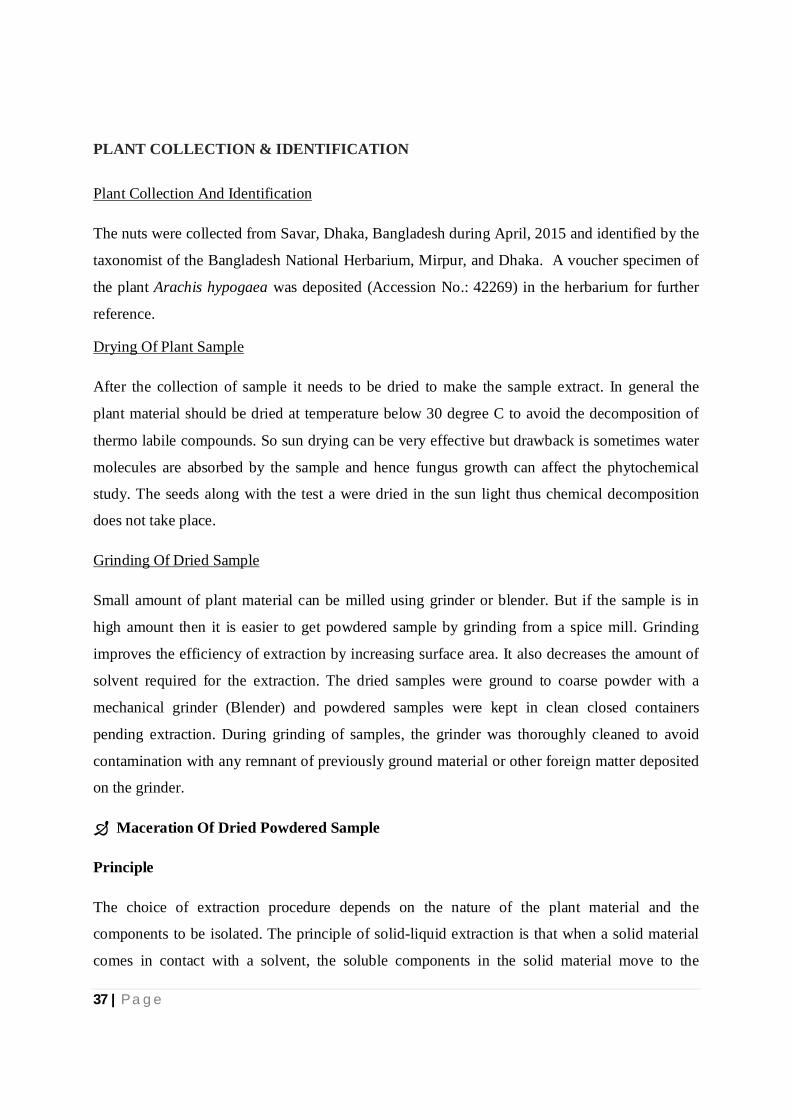
Figure 4.1 Maceration of dried peanut shells
Procedure
After getting the sample as dried powdered, the sample (500 Gram) was then soaked in 1000 ml
of methanol for 5 days, the process is known as maceration technique. A glass made jar with
plastic cover was taken and washed thoroughly with ethanol and dried. Then the dried powder
sample was taken in the jar. After that methanol (1000 ml) was poured into the jar up to 1-inch
height above the sample surface as it can sufficiently cover the sample surface. The plastic cover
with aluminum foil was closed properly to resist the entrance of air into the jar. This process was
performed for 5 days. The jar was shaken in several times during the process to get better
extraction.
39 | P a g e
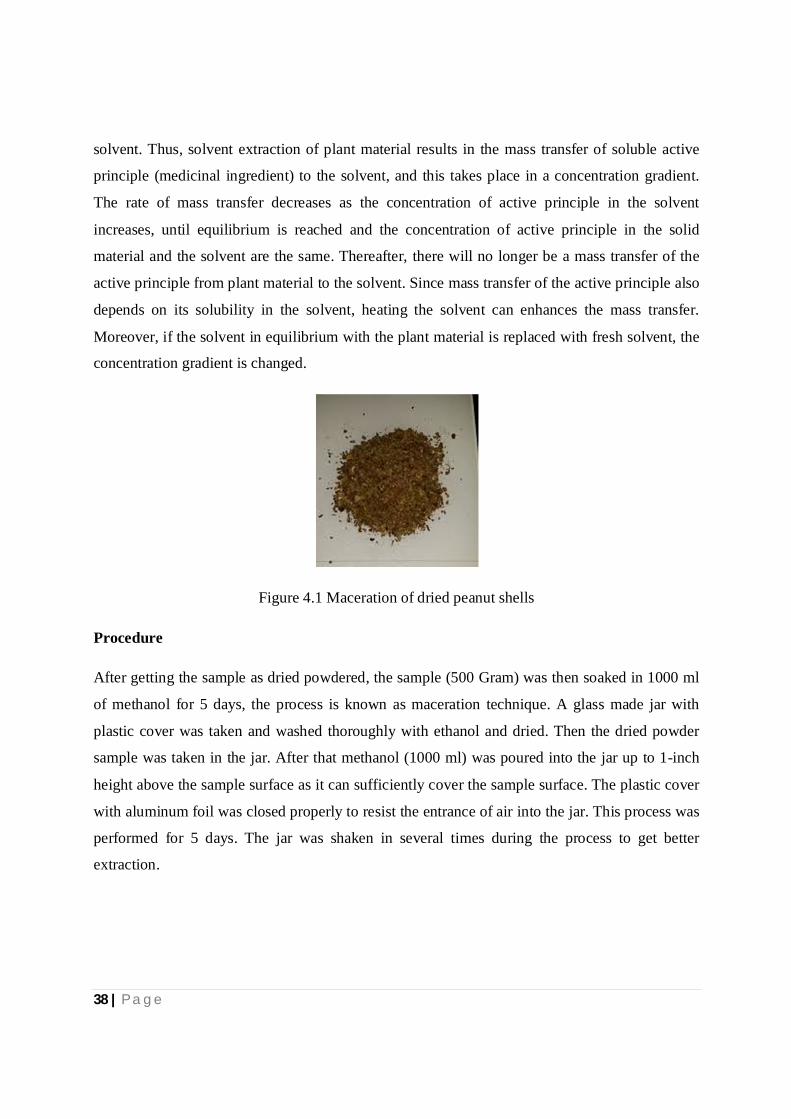
Filtration Of The Extract
After the extraction process the plant extracts was filtered with sterilized cotton filter. The cotton
was rinsed with ethanol and fitted in a funnel. The filtrate was collected in a beaker. Then again
it was filtered and this time What man's filter was used for getting more clear extract which
would be useful making the sample more concentrate in Rotary Evaporation Technique. Then the
filtrate was taken into a volumetric flask and covered with aluminum foil paper and was prepared
for rotary evaporation.
Figure 4.2: Filtration
Sample Concentration By Rotary Evaporation Technique
Principle
• A rotary evaporator is a device used in chemical laboratories for the efficient and gentle
removal of solvents from samples by evaporation. Rotary evaporators are also used in
molecular cooking for the preparation of distillates and extracts. A rotary evaporator
consists of following parts-
A motor unit that rotates the evaporation flask or vial containing the user's sample.
A vapor duct that is the axis for sample rotation, and is a vacuum-tight conduit for the
vapor being drawn off of the sample.
A vacuum system, to substantially reduce the pressure within the evaporator system.
A heated fluid bath (generally water) to heat the sample.

40 | P a g e
A condenser with either a coil passing coolant, or a "cold finger" into which coolant
mixtures such as dry ice and acetone are placed.
A condensate-collecting flask at the bottom of the condenser, to catch the distilling
solvent after it re-condenses.
A mechanical or motorized mechanism to quickly lift the evaporation flask from the
heating bath.
Figure 4.3 Rotary evaporator
Affecting Factors
There are factors, omission of any one of the following factor may interfere the sample
concentration procedure and thus which may interfere the phytochemical investigation.
Remove the flask from the heat bath.
41 | P a g e
• Opening the stopcock.
• Heating the rotor.
• Turning off the vacuum/aspirator.
• Disconnecting the flask.
• Dropping flask in heat bath.
Procedure
After the filtration process two parts were obtained namely 'residue part' and 'filtered part or
filtrate. The filtrate part, which contains the substance soluble in methanol, was putted into a
1000 ml round bottom flask (BOROSOL) and then the flask was placed in a rotary evaporator.
The evaporation was done at 45 degree Celsius temperature. The number of rotation per minute
was selected as 130 RPM. The pressure of the vacuum pumper machine (Biometra) was 6 bar.
The water flow through the distillation chamber was also provided in a satisfactory flow rate.
When the evaporation seemed to be satisfactory, then the methanolic extract was collected in a
100 mi beaker. The evaporator flask was rinsed by diethyl ether. Then the beaker was covered
with aluminum foil paper and kept on the water bath for 60 minutes and the temperature of water
bath maintained as 50' C. Finally the concentrated methanolic extract was found and stored in the
laboratory refrigerator from which the extract was used for many chemical investigations.
SAMPLE CONCENTRATION BY VACUUM LIQUID CHROMATOGRAPHY
(VLC) TECHNIQUE
Principle

42 | P a g e
Chromatographic purification is an integrated part of organic synthesis. The Dry Column
Vacuum Chromatography presented here, has excellent resolving power, is easily applied to
large scale chromatography (up to 100 g) and is fast. Furthermore, the technique is economical
and environmentally friendly due to significant reductions in solvent and the amount of silica
used. Therefore, it is an excellent alternative to the commonly used Flash Column
Chromatography for purification in organic synthesis.
Figure 4.4 Vacuum Liquid Chromatography
Apparatus
• VLC chamber.
• Filter paper
Reagents
• Silica gel
• Hexane methanol
• Cyclohexane
• Chloroform
• Dichloromethane.
• N-butanol
• Ethanol

43 | P a g e
Procedure
500gm Methanol extract of Arachis hypogaea was further exploited in an attempt to isolate the
active principle which exhibited the antibacterial activity. In the isolation procedure, different
fractions were obtained by using vacuum liquid chromatography apparatus . A sintered glass
Buckner funnel attached to a vacuum line was packed with TLC grade silica gel. The silica gel
was compressed under vacuum in order to achieve a uniform layer in order to get a better
separation. The methanol extract was added to an amount (200 mg) of silica gel in order to make
a smooth paste. Pet ether, cyclohexane, xylene, dichloromethane, chloroform and methanol were
used as mobile phase in different ratios of increasing polarity from petether to methanol. The
mixture was separated according to the polarity of solvents. Each fraction was collected in a
separate 100ml beakers. The fractions were monitored by thin layer chromatography. The most
active fractions having the similar thin layer chromatography profile were pooled together.
Equipments and other necessary tools
During the extraction procedure and for various phytochemical tests many equipments and
materials were used. Some of them are TLC plate, TLC tank, scale, pencil, TLC plate cutter,
capillary tube, mortar and pestle, laminar air flow cabinet, loop, burner, micropipette tip, Petri
dishes, glass rod, cotton, filter paper, funnel, hot plate, centrifugal machine, autoclave, glassware
washers, stirrer, UV spectroscopy, knife, ephedrine tube, Whatman’s filter paper, paper disc,
incubator, vortex machine, PH meter. analytical balance, beaker (in various size), pipette, micro-
pipette, rotary evaporator, hot air oven, dryer, storage cabinet, spatula, test tube, volumetric
flask, conical flask, test tube holder, test tube rack, aluminum foil paper, scotch tape, refrigerator,
water bath, electronic shaker, ultra violate lamp, mask, gloves, lab coat, sprayer, reagent bottle.
Chemicals and other reagents
Ferric chloride, Sodium carbonate, deionized water, Gallic acid, Sodium nitrite, Aluminum
chloride, Sodium hydroxide, Hydrogen peroxide, Normal saline, Wagner's reagent, Hydrochloric
acid, Glacial acetic acid, Ammonia, Phoshomolybdic acid, Acetic anhydride, Alcoholic ferric
chloride, 5-aqua copper sulphate, Sodium potassium tartrate, DPPH (2,2-diphenyl-1-
picrylhydrazyl), Sulfuric acid, Folin reagent, Ciocalteu reagent, prolein amino acid (protein), 1-
butanol, glacial acetic acid, Ninhydrine solution, Glucose, Galactose, Maltose, Lactose, Acetone,
44 | P a g e
Phosphate buffer, Anisaldehyde, L-Ascorbic acid, potassium ferricyanide, Ttrichloro acetic acid
(TCA)
Solvents for experiments
Dichloromethane, Benzene, Ammonium hydroxide, Formic acid, Dimethylsulfoxide (DMSO),
Acetone, Chloroform, Distilled water, Ethanol, Methanol, Diethyl ether, Acetic acid, n-Hexane,
Ethyl acetate .
Lectin Extract Preparation
Equipments and other necessary tools
• Centrifuge machine.
• Filter paper.
Salt and solution
• PBS solution(pH -7.4)
• Ammonium sulphate.
Procedure
1. Fruits of Arachis hypogaea were collected from Savar, Dhaka.
2. The fruits were shade dried, seeds were removed and fruits were ground mechanically.
3. One hundred grams of powder was extracted overnight with 700 ml of PBS, pH 7.4, at 4°C.
4. The suspension was centrifuged at 12,000 g for 30 min.
5. The clear supernatant (crude extract) was subjected to 60% ammonium sulphate fractionation
and the protein pellets were collected by centrifugation as described above.
6. The pellet was re-suspended in PBS, pH 7.4 and dialyzed exhaustively against the same
buffer for a period of 48 h.

45 | P a g e
7. The resulting suspension was centrifuged at 12,000 g for 10 min and the supernatant was used
for further analysis. (Hou Y. et. al., 2010)
46 | P a g e
UNIT FOUR: METHOD & MATERIAL

47 | P a g e
METHOD AND MATERIAL:
A. Thin Layer Chromatography:
Thin layer chromatography (TLC) is a chromatographic technique used to separate the
components of a mixture using a thin stationary phase supported by an inert backing. It may be
performed on the analytical scale as a means of monitoring the progress of a reaction, or on the
preparative scale to purify small amounts of a compound. TLC is an analytical tool widely used
because of its simplicity, relative low cost, high sensitivity, and speed of separation .TLC
functions on the same principle as all chromatography: a compound will have different affinities
for the mobile and stationary phases, and this affects the speed at which it migrates. The goal of
TLC is to obtain well defined, well separated spots.
Principle of Thin Layer Chromatography:
A TLC plate is a sheet of glass, metal, or plastic which is coated with a thin layer of a solid
adsorbent (usually silica or alumina). A small amount of the mixture to be analyzed is spotted
near the bottom of this plate. The TLC plate is then placed in a shallow pool of a solvent in a
developing chamber so that only the very bottom of the plate is in the liquid. This liquid, or the
eluent, is the mobile phase, and it slowly rises up the TLC plate by capillary action.
As the solvent moves past the spot that was applied, equilibrium is established for each
component of the mixture between the molecules of that component which are adsorbed on the
solid and the molecules which are in solution. In principle, the components will differ in
solubility and in the strength of their adsorption to the adsorbent and some components will be
carried farther up the plate than others. When the solvent has reached the top of the plate, the
plate is removed from the developing chamber, dried, and the separated components of the
mixture are visualized. If the compounds are colored, visualization is straightforward. Usually
the compounds are not colored, so a UV lamp is used to visualize the plates. (The plate itself
contains a fluorescent dye which glows everywhere except where an organic compound is on the
plate). (Orgchem.colorado.edu, 2015)

48 | P a g e
Figure 4.5 Thin layer chromatography instruments
Solvent Systems of Thin Layer Chromatography
Determining the optimum solvent mixture for your TLC experiment can be challenging, as there
are no steadfast rules governing this procedure. It is almost entirely a matter of building
experience through trial and error. However, understanding how chromatography works can
make your guesswork a bit more educated.
While we have discussed a number of different interactions that occur between the mobile phase,
the stationary phase, and the accompanying analyte, the factor that is most important here is
polarity. The analyte exists in equilibrium between the stationary and mobile phases. If there
exists a greater polar attraction between the solvent and the analyte than the silica and the
analyte, then the analyte will spend more time traveling in the mobile phase along the plate than
it will being attached to the stationary phase. The greater the polarity of a solvent, the faster the
elution. However, this is all relative to the polarity of the analyte itself. If the analyte has a
greater polarity than the solvent, it will remain more easily attached to the silica. Thus, different
analytes behave differently to the polarity of a solvent, depending on their own polarities. By
experimenting with solvent mixtures and keeping in mind this idea of polarity, one can achieve a
desirable separation. (Umich.edu,n.d.)
49 | P a g e
Solvent Systems of TLC
Nonpolar basic solvent
Benzene 9 ml
Ethanol 1 ml
Ammonium hydroxide 0.1 ml
Intermediate polar solvent
Chloroform 5 ml
Ethyl acetate 4 ml
Acetic acid 1 ml
Polar Basic solvent
Ethyl acetate 8 ml
Ethanol 1.2 ml
Water 0.8 ml
Apparatus used for Thin Layer Chromatography
SL. Apparatus Image
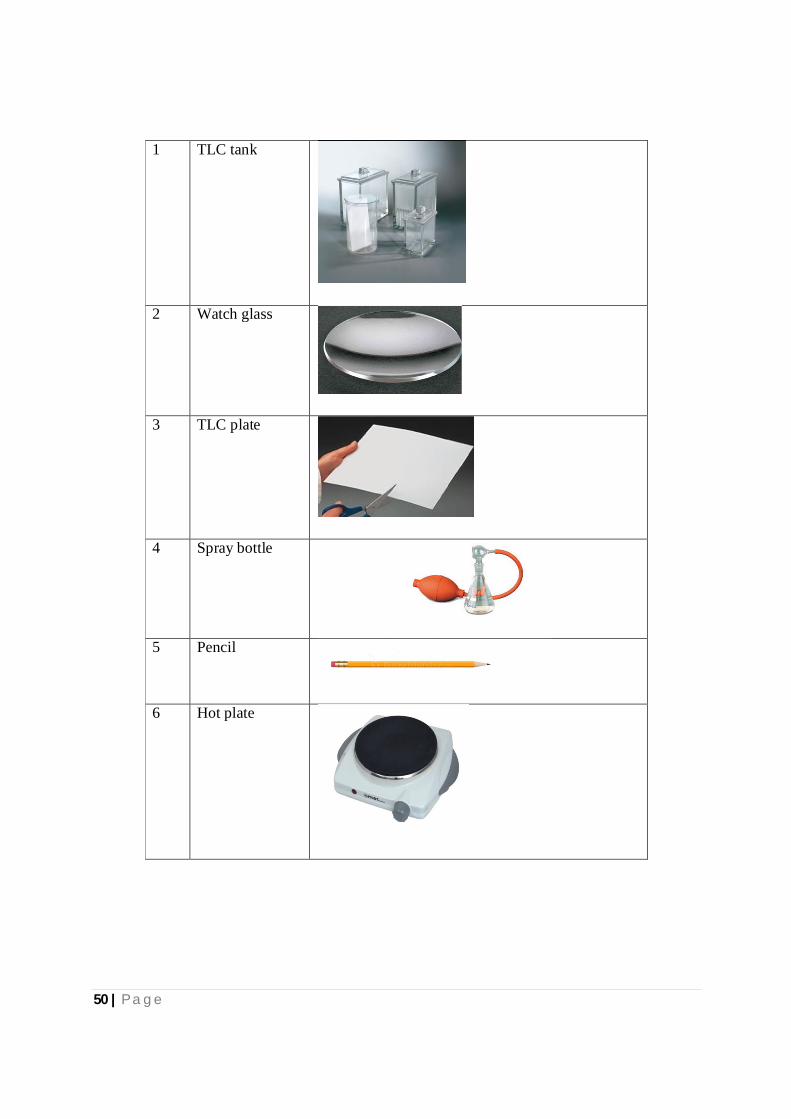
50 | P a g e
1 TLC tank
2 Watch glass
3 TLC plate
4 Spray bottle
5 Pencil
6 Hot plate
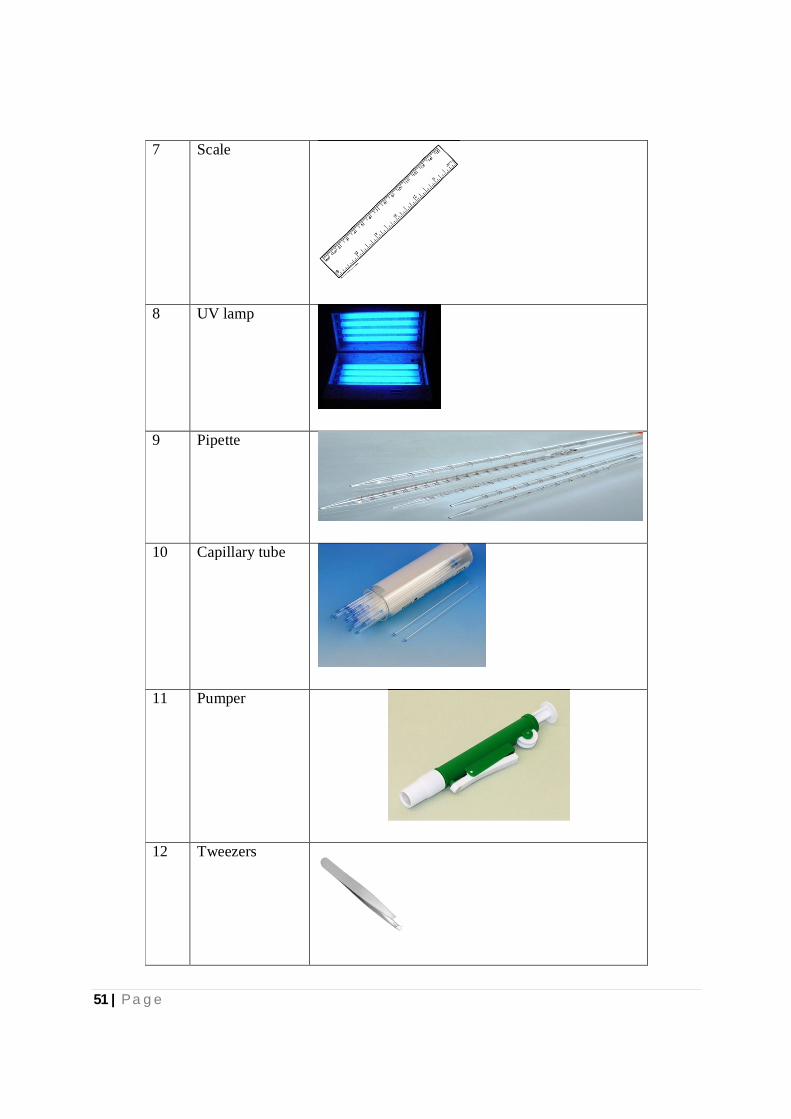
51 | P a g e
7 Scale
8 UV lamp
9 Pipette
10 Capillary tube
11 Pumper
12 Tweezers
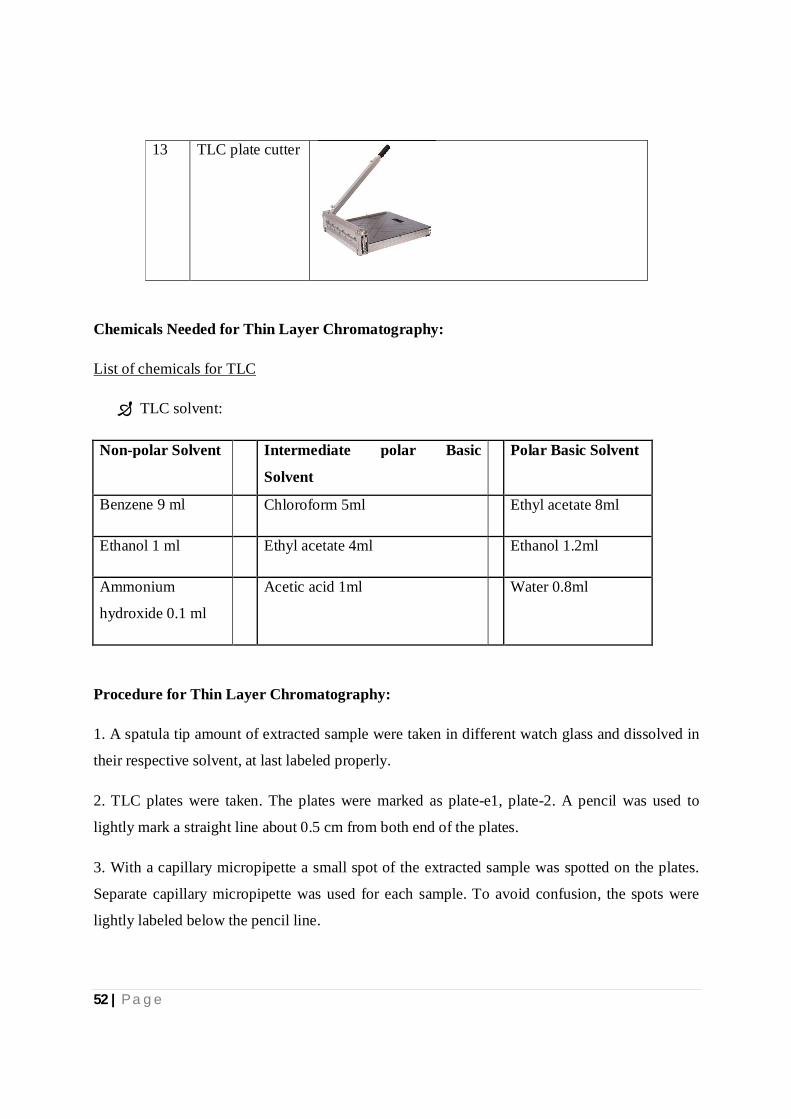
52 | P a g e
13 TLC plate cutter
Chemicals Needed for Thin Layer Chromatography:
List of chemicals for TLC
TLC solvent:
Non-polar Solvent Intermediate polar Basic
Solvent
Polar Basic Solvent
Benzene 9 ml Chloroform 5ml Ethyl acetate 8ml
Ethanol 1 ml Ethyl acetate 4ml Ethanol 1.2ml
Ammonium
hydroxide 0.1 ml
Acetic acid 1ml Water 0.8ml
Procedure for Thin Layer Chromatography:
1. A spatula tip amount of extracted sample were taken in different watch glass and dissolved in
their respective solvent, at last labeled properly.
2. TLC plates were taken. The plates were marked as plate-e1, plate-2. A pencil was used to
lightly mark a straight line about 0.5 cm from both end of the plates.
3. With a capillary micropipette a small spot of the extracted sample was spotted on the plates.
Separate capillary micropipette was used for each sample. To avoid confusion, the spots were
lightly labeled below the pencil line.
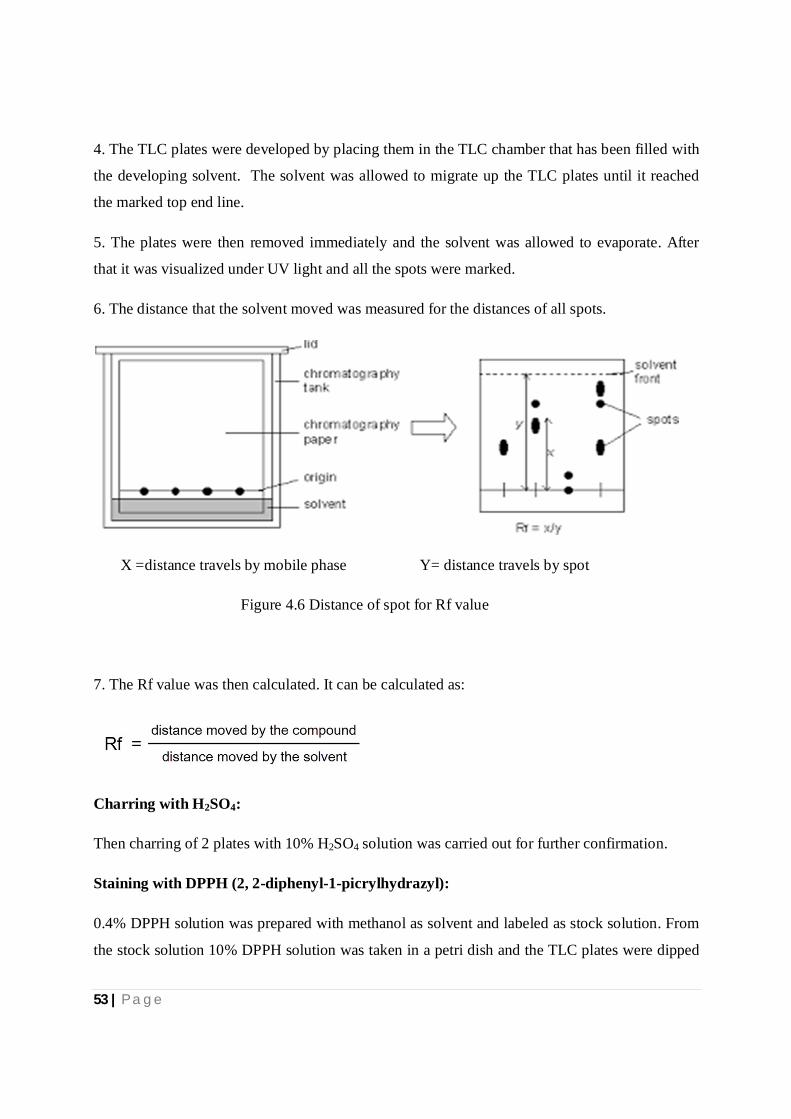
53 | P a g e
4. The TLC plates were developed by placing them in the TLC chamber that has been filled with
the developing solvent. The solvent was allowed to migrate up the TLC plates until it reached
the marked top end line.
5. The plates were then removed immediately and the solvent was allowed to evaporate. After
that it was visualized under UV light and all the spots were marked.
6. The distance that the solvent moved was measured for the distances of all spots.
X =distance travels by mobile phase Y= distance travels by spot
Figure 4.6 Distance of spot for Rf value
7. The Rf value was then calculated. It can be calculated as:
Charring with H2SO4:
Then charring of 2 plates with 10% H2SO4 solution was carried out for further confirmation.
Staining with DPPH (2, 2-diphenyl-1-picrylhydrazyl):
0.4% DPPH solution was prepared with methanol as solvent and labeled as stock solution. From
the stock solution 10% DPPH solution was taken in a petri dish and the TLC plates were dipped
54 | P a g e
in it. The plate was visually observed for a color change after sometime. All the processes were
carried out in dark place. The antioxidant active regions became yellow in color.
Staining with FC (Folin-Ciocalteu) reagent:
Staining with FC reagent was carried out as the same procedure above with plates. 10% FC
solution was prepared with water as the solvent. The antioxidant active regions became yellow/
white in color.
B. THIN LAYER CHROMATOGRAPHY (TLC) OF LECTIN EXTRACT
Principle
Thin layer chromatography is used to separate mixtures of compounds. It gives qualitative idea
about the components that are present in a mixture. The experiment is usually conducted on a
sheet of aluminum foil that has been coated with silica. This acts as the stationery phase for the
mixture. The solvent or solvent system that runs on the stationery phase by capillary action and
conducts the separation, this is known as the mobile phase. Once the sample has been spotted on,
the plate and the mobile phase run, different components of the mixture separate differently due
to their relative affinities for the stationery and mobile phases. Heavier components or the ones
more attracted to the stationery phase remain at the bottom while components that are light and
more soluble in the mobile phase travel up with it. The relative separation of the components can
be studied by calculating the Retardation Factor (Rf), which is the ratio of the distance of
migration of a particular substance to the distance of migration of the solvent front.
Materials Required
• Silica coated TLC plate.
• TLC tank.
• Spotting capillary tubes.
• Tweezers.
• Pipette.
• Pipette filter.
• Test tubes.
• Solvents.
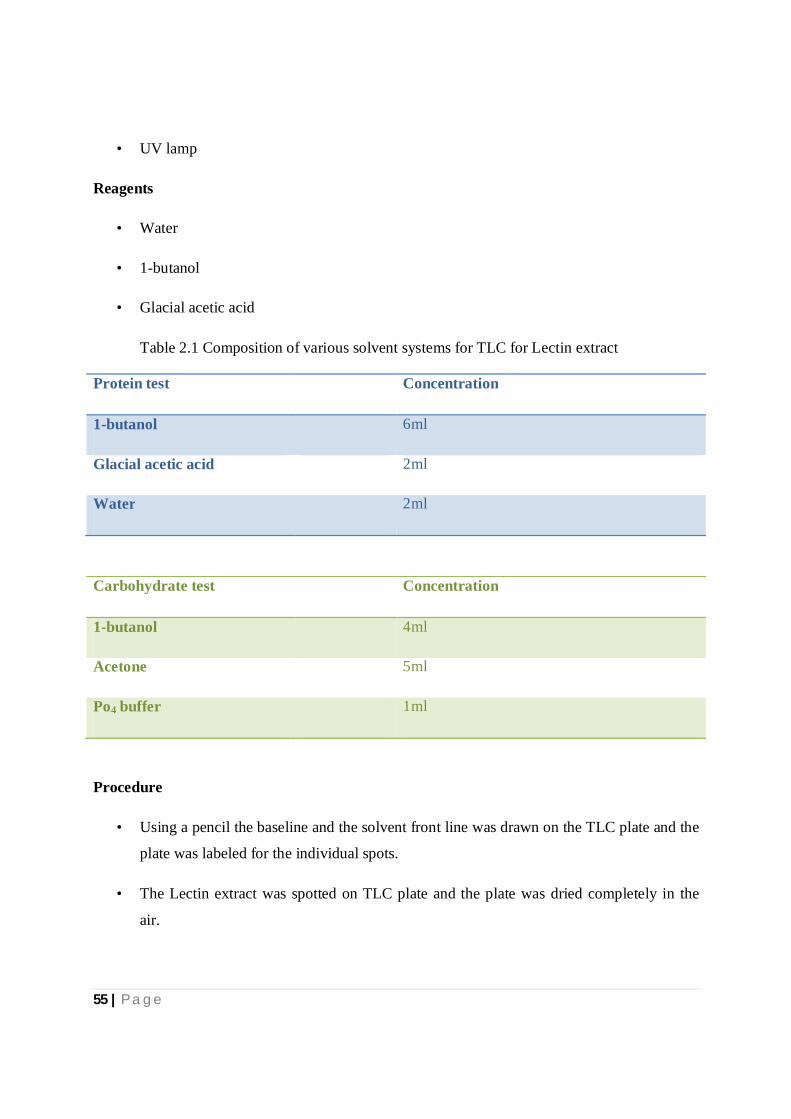
55 | P a g e
• UV lamp
Reagents
• Water
• 1-butanol
• Glacial acetic acid
Table 2.1 Composition of various solvent systems for TLC for Lectin extract
Protein test Concentration
1-butanol 6ml
Glacial acetic acid 2ml
Water 2ml
Carbohydrate test Concentration
1-butanol 4ml
Acetone 5ml
Po4 buffer 1ml
Procedure
• Using a pencil the baseline and the solvent front line was drawn on the TLC plate and the
plate was labeled for the individual spots.
• The Lectin extract was spotted on TLC plate and the plate was dried completely in the
air.
56 | P a g e
• In a TLC tank the solvent system was added. A strip of filter paper was inserted into the
tank so that its bottom touched the solvent. The lid of the tank was closed and left to rest
for a few minutes so that the solvent system could travel up the filter paper and saturate
the chamber.
• Using a pair of tweezers the TLC plates were placed in the chamber carefully so that the
baseline did not touch the solvent.
• The plate was left in the tank so that the solvent system could run up the plate by
capillary action and develop the spots.
• The plate was removed from the tank using a pair of tweezers once the solvent had
reached the solvent line. The plate was then allowed to dry completely.
• Three types of solvent system were used based on difference in polarity for the detection
of different compounds.
• The developed plate was then viewed under UV light for the detection of bands and
spots.
Charring of TLC plates
Materials
Tweezers.
2% ninhydrin
Ethanol solution.
Hot plate.
Petri dish.
H2SO4
Anisaldehyde
Spreading Procedure of TLC plate of Protein test
• 1 gm ninhydrin was added in 50 ml ethanol to produce 2% ninhyrdin solution.
• 1 ml of ninhydrin solution was added to 9 ml of ethanol which was taken in a Petri dish.
57 | P a g e
• The TLC plate was dipped in this solution using tweezers with the silica face down.
• The plate was left in the open for 10 minutes to allow for drying.
• A hot plate was heated to about 90 degree C and the plates were heated until the spots
developed.
Spreading Procedure of TLC plate of Carbohydrate test
• 1 drop anisaldehyde added with 5 ml Distil H2O.
• 10µl H2SO4 added in this solution which was taken in a Petri dish.
• The TLC plate was dipped in this solution using tweezers with the silica face down.
• The plate was left in the open for 10 minutes to allow for drying.
• A hot plate was heated to about 90 degree C and the plates were heated until the spots
developed.( Saha, et.al.,2014)
C. Anti-oxidant tests:
DPPH Charring Process Of TLC Plate
Materials Required
4% DPPH stock solution (1%),
Methanol (9 ml).
Test Tube.
Pipette.
Pipette filter.
Petri dish and Tweezers.
Procedure
0.4% solution of DPPH was prepared by adding 9 ml of methanol to 1 ml of 4% DPPH
stock solution. The procedure was carried out in a dark room as DPPH is light sensitive.
By using tweezers the developed TLC plates would be dipped into this solution on the
silica face down.
The plates were left in the dark room for 30 minutes for the color to develop after which
they were observed for the formation of yellow, golden / brown color on the background
58 | P a g e
of purple. This coloration indicates the presence of compounds that have antioxidant
properties (Milena, N., 2011).
Principle of DPPH test:
This is known as a standard 2, 2-Diphenyl-1-picrylhydrazyl (DPPH) Assay. The DPPH assay is
popular in natural product antioxidant studies. One of the reasons is that this method is simple
and sensitive. This assay is based on the theory that a hydrogen donor is an antioxidant. It
measures compounds that are radical scavengers. Figure below, shows the mechanism by which
DPPH• accepts hydrogen from an antioxidant. DPPH• is one of the few stable and commercially
available organic nitrogen radicals (1). The antioxidant effect is proportional to the
disappearance of DPPH• in test samples. Monitoring DPPH• with a UV spectrometer has
become the most commonly used method because of its simplicity and accuracy. DPPH• shows a
strong absorption maximum at 517 nm (purple). The color turns from purple to yellow followed
by the formation of DPPH upon absorption of hydrogen from an antioxidant. This reaction is
stoichiometric with respect to the number of hydrogen atoms absorbed. Therefore, the
antioxidant effect can be easily evaluated by following the decrease of UV absorption at 517 nm.
(J. Lewis, 2012)
Equipment and Materials Required
1. Test tube
2. Foil paper
3. Micro pipette
4. UV Spectometer
5. Mortar & pestle
6. Filter paper
7. Funnel
8. Beaker
9. DPPH
10. Methanol
11. Distill water
59 | P a g e
Procedure
a) The DPPH radical scavenging method was used for the determination of the antioxidant
capacity of the extracts. Different concentrations of the plant extract were added to methanol
solution of DPPH.
b) Different concentrations of L-Ascorbic acid (2-10 mg/ml) were used as the standard
antioxidant.
c) After 30 min at room temperature, the absorbance values were measured at 517 nm on a
spectrophotometer and converted into the percentage antioxidant activity using the equation,
DPPH antiradical scavenging capacity (%) = [(Ab. of control – Ab. of sample)/Ab. of control] ×
100.
d) Different concentrations of plant extract solution was used as a blank, while DPPH solution
plus methanol was used as a control.
e) The IC50 values were calculated by the sigmoid non-linear regression model using plots,
where the abscissa represented the concentration of tested plant extracts and the ordinate the
average percent of scavenging capacity. IC50values denote the concentration of the sample
required to scavenge 50% of DPPH radicals.
Standard Preparation:
1) 250 mg Ceevit Tablet (Square) was crushed in mortar and pestle.
2) 100 ml distilled water was added and the solution was filtered.
3) It was then diluted by 10 times (2 ml of the filtered solution was taken and 18 ml water
added).
4) The solution was taken in 5 test tubes to prepare 5 different concentrations.
5) 1ml, 2ml, 2ml, 4ml and 5ml solution were taken in 5 different test tubes and the volume
adjusted to 5 ml with water in all the test tubes.
Sample Preparation:
60 | P a g e
1) 100 μL of extracted sample was added in to first test tube which contain 2 ml methanol.
2) From the first test tube 1ml solution was taken in to second test tube which contain 1 ml
methanol.
3) The procedure was continued for other 3 test tube for having total five different
concentrations.
4) 1ml solution was discarded from the last test tube.
5) The volume was adjusted to 4 ml with methanol in all the test tubes.
Blank Preparation:
Blank was prepared by adding 4 ml methanol in a test tube. In all the test tubes 100 μL DPPH
solution was added in dark and left for 30 minutes. After that UV absorbance was measured in
UV machine at 517 nm.
D. Antimicrobial Screening of VLC Fraction by using Agar Diffusion Method
Principle of Disc diffusion method:
When a filter paper disc impregnated with a chemical is placed on agar the chemical will diffuse
from the disc into the agar. This diffusion will place the chemical in the agar only around the
disc. The solubility of the chemical and its molecular size will determine the size of the area of
chemical infiltration around the disc. If an organism is placed on the agar it will not grow in the
area around the disc if it is susceptible to the chemical. This area of no growth around the disc is
known as a “zone of inhibition”.
Equipment and Materials Required
1. Petri dish 2. Disc
3. Watch glass 4. Tweezers
61 | P a g e
5. Micro pipette 6. Autoclave machine
7. Laminar air flow 8. Incubator
9. Spreader 10. Spatula
11. Ethanol 12.Nutrient agar
13. Distill water 14.Sodium chloride
15. Antibiotic (Ciprofloxacin)
Test Organisms
I. Gram Negative
Bacteria
Salmonella typhi
E.coli
Pseudomonas
Shigella dysentery
Salmonella
paratyphi
Vibriomimicus
Shigella boydii
II. Gram Positive
Bacteria
Staphylococcus
aureus
Streptococcus
pyrogeny
Beta Hemolyte
streptococcus
Bacillus cereus
Bacillus subtilis
III. Fungi
Candia albicans
Bacillus
megaterium
Saccharomyces
cerevisiae
Aspergillus niger
Kleb siella
The Culture Medium and Its Composition
Nutrient agar was used to conduct the antimicrobial screening using the disc diffusion method.
The nutrient agar was bought from the market. Nutrient agar contains the following substances:
62 | P a g e
Ingredients
Bacto peptone - 0.5gm
Sodium chloride - 0.5gm
Bacto yeast extract - 1.0gm
Bacto agar - 2.0gm
Distilled water (Qs) - 100ml
Preparation of the Medium
First of all, the amount of nutrient agar needed was calculated and then added to distilled water
in an agar bottle and mixed thoroughly. It was then autoclaved to dissolve the agar and sterilize
it.
Sterilization Procedure
Sterilization is a term referring to any process that eliminates (removes) or kills all forms of life,
including transmissible agents (such as fungi, bacteria, viruses, spore forms, etc.) present in a
specified region, such as a surface, a volume of fluid, medication, or in a compound such as
biological culture media. In order to avoid any type of contamination and cross contamination by
the test organisms the antimicrobial screening was done in Laminar Hood and all types of
precautions were highly maintained. UV light was switched on one hour before working in the
Laminar Hood. Petri dishes and other glassware were sterilized by autoclaving at a temperature
of 121ºC and a pressure of 15-lbs/sq. inch for 20 minutes. Micropipette tips, cotton, forceps,
blank discs etc. were also sterilized.
Preparation of the Test Plates
a. The test organisms were transferred from the subculture to petri dish containing the required
amount of melted and sterilized agar medium as required by the size of the dish.
b. The bacterial and fungal suspension was taken by a loop and mixed with normal saline with
the help of vortex machine.
c. Then a sterilized cotton bud was taken and dipped into the bacterial/ fungal suspension.
Then the bacterial/fungal sample is applied to the Petri dish with the help of this cotton bud.
d. The swabbing was done carefully so that the microorganisms would be spread out evenly on
the dish.
Standard Discs
63 | P a g e
These were used as positive control to ensure the activity of standard antibiotic against the test
organisms as well as for comparison of the response produced by the known antimicrobial agent
with that of the test sample. In this investigation Ciprofloxacin (30μg/disc) standard disc was
used as the reference.
Blank Discs
These were used as negative controls, which ensure that the residual solvents (left over the discs
even after air-drying) and the filter paper were not active themselves. Here the negative control
used was methanol.
Preparation of sample discs with test samples
a. In a specific volume of solvent, measured amount of each test sample was dissolved to
obtain the desired concentrations in an aseptic condition.
b. For the each extract of husk, a stock solution of 10mg/ml was prepared and was used
directly.
c. Sterilized metrical filter paper discs were taken in a blank Petri dish under the laminar hood.
Then discs were soaked with solutions of 10μl of test samples and dried.
Procedure of Disc diffusion method:
1. Six different bacterial strains of gram positive, six different strains of gram negative bacteria
were used to carry out this assay.
2. Nutrient agar was used as the culture media. Stocks of these bacterial solutions were revived
in nutrient agar by incubating at 370C for 24 hrs.
3. A single disk diffusion method was used to assess the presence of antimicrobial activities of
the extract.
4. Whatman filter paper were punched, and 0.6 cm disks were collected in a beaker. The beaker
with petri dishes, forceps, tips, spreader were covered with foil paper and autoclaved.
5.5 µl of extracted sample were loaded per disc with the help of micropipette.
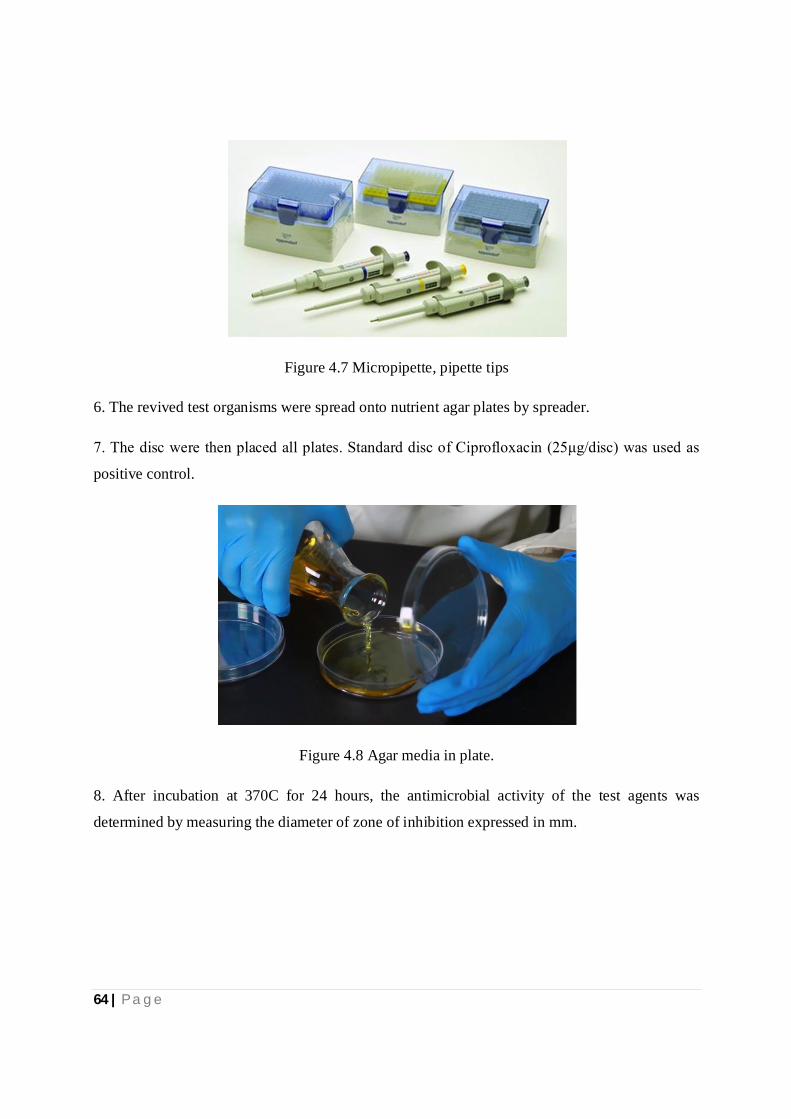
64 | P a g e
Figure 4.7 Micropipette, pipette tips
6. The revived test organisms were spread onto nutrient agar plates by spreader.
7. The disc were then placed all plates. Standard disc of Ciprofloxacin (25μg/disc) was used as
positive control.
Figure 4.8 Agar media in plate.
8. After incubation at 370C for 24 hours, the antimicrobial activity of the test agents was
determined by measuring the diameter of zone of inhibition expressed in mm.
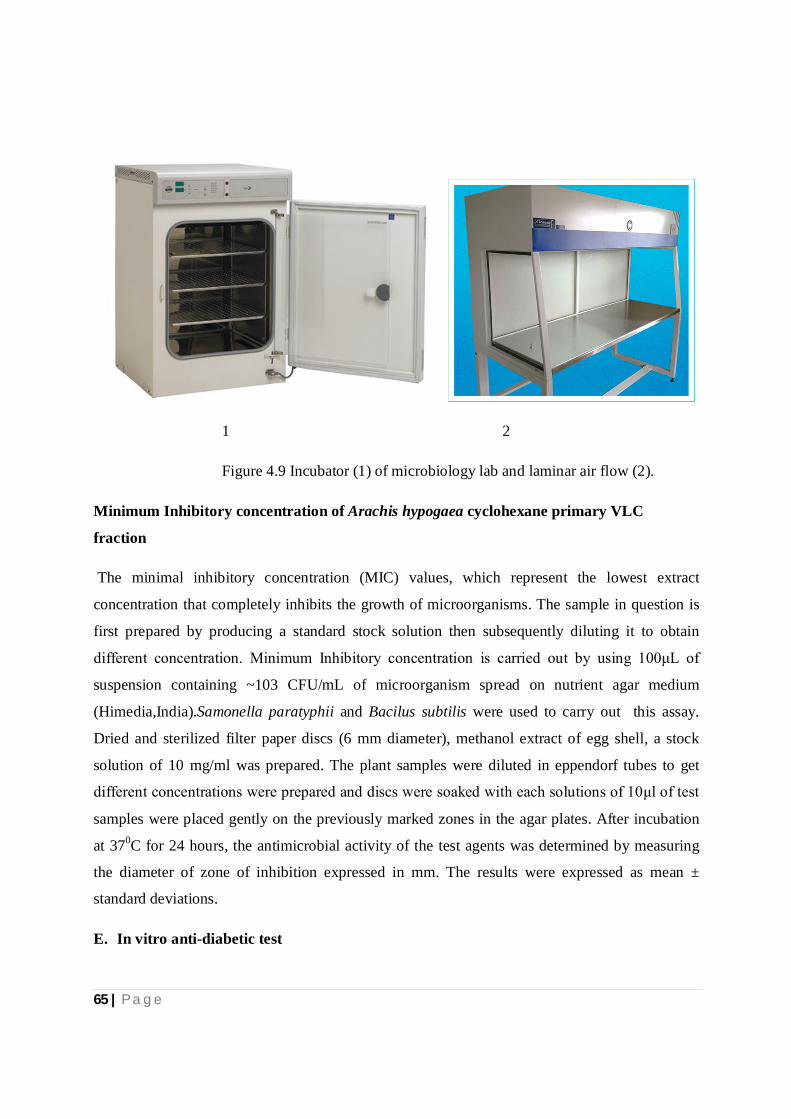
65 | P a g e
1 2
Figure 4.9 Incubator (1) of microbiology lab and laminar air flow (2).
Minimum Inhibitory concentration of Arachis hypogaea cyclohexane primary VLC
fraction
The minimal inhibitory concentration (MIC) values, which represent the lowest extract
concentration that completely inhibits the growth of microorganisms. The sample in question is
first prepared by producing a standard stock solution then subsequently diluting it to obtain
different concentration. Minimum Inhibitory concentration is carried out by using 100μL of
suspension containing ~103 CFU/mL of microorganism spread on nutrient agar medium
(Himedia,India).Samonella paratyphii and Bacilus subtilis were used to carry out this assay.
Dried and sterilized filter paper discs (6 mm diameter), methanol extract of egg shell, a stock
solution of 10 mg/ml was prepared. The plant samples were diluted in eppendorf tubes to get
different concentrations were prepared and discs were soaked with each solutions of 10μl of test
samples were placed gently on the previously marked zones in the agar plates. After incubation
at 370C for 24 hours, the antimicrobial activity of the test agents was determined by measuring
the diameter of zone of inhibition expressed in mm. The results were expressed as mean ±
standard deviations.
E. In vitro anti-diabetic test
66 | P a g e
Glucose uptake in Yeast cells
The commercial baker’s yeast in distilled water was subjected to repeated centrifugation
(3,000×g, 5 min) until clear supernatant fluids were obtained and a 10% (v/v) of the suspension
was prepared in distilled water. Various concentrations of plant extracts were added to 1mL of
glucose solution and incubated together for 10 min at 37 °C. Reaction was started by adding 100
μL of yeast suspension followed by vortexing and further incubation at 37 °C for 60 min. After
60 min, the tubes were centrifuged (2,500 × g, 5 min) and amount of glucose was estimated in
the supernatant (Cirillo, 1962). The percentage increase in glucose uptake by yeast cells was
calculated using the following equation:
Increase in glucose uptake (%) = –
× 100
Where, Abs=control is the absorbance of the control reaction (containing all reagents except the
test sample)
Abs sample = the absorbance of the test sample. All the experiments were carried out in
triplicates. (Mishra, Kavrekar and Nair, 2013)
Equipment and Materials Required
1. Test tube
2. Beaker
3. Funnel
4. Micropipette
5. Filter paper
6. Incubator
7. Centrifuge machine
8. UV spectrometer
9. Distill water
10. Glucose
11. Yeast
12. Metformin
Preparation of glucose solution:

67 | P a g e
2gm glucose was added to 5 ml distilled water. Required amount of glucose solution was
prepared by this procedure.
Standard preparation:
1. 500 mg metformin Tablet was crushed in mortar and pestle.
2. 100 ml distilled water was added and the solution was filtered.
3. 500 µl filtered solution was taken in the first test tube which contain 1.5 ml glucose solution.
4. Then serial dilution was done to have 5 different concentrations.
Sample preparation:
a. 100 μL of extracted sample was added in to first test tube which contains 2 ml glucose
solution.
b. Serial dilution was done to have 5 different concentrations.
Blank preparation:
1ml glucose solution without sample and standard was used as blank.
Procedure:
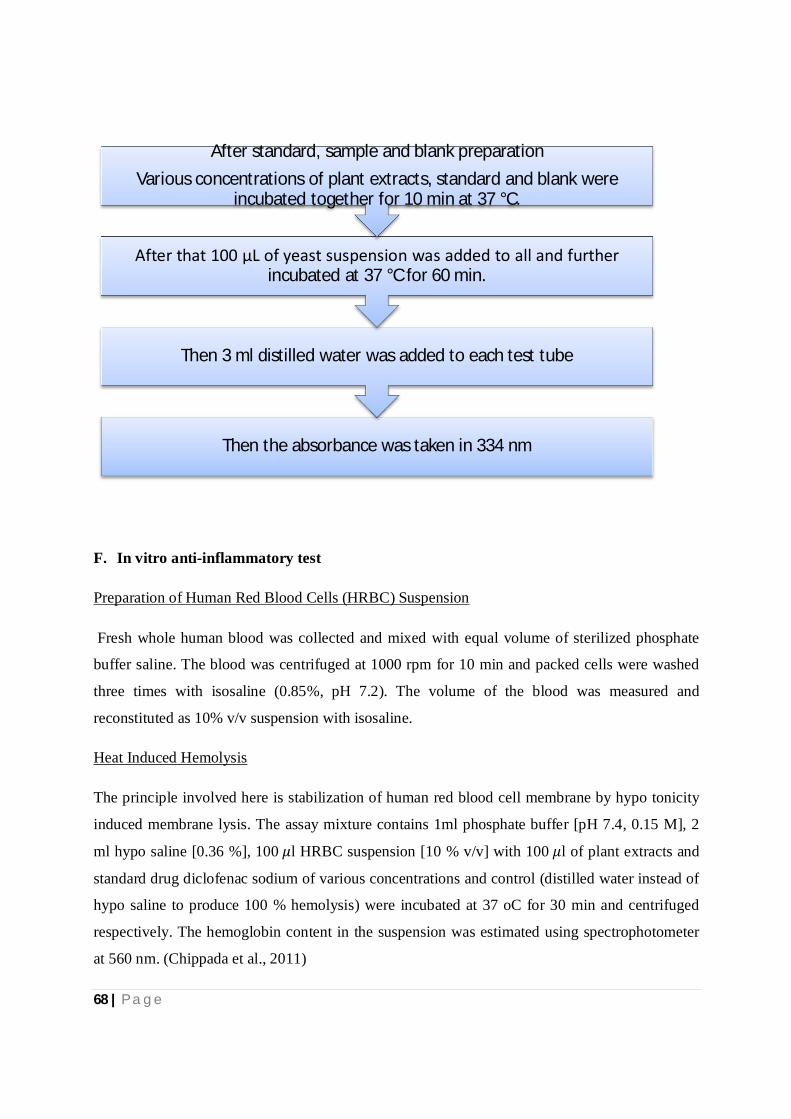
68 | P a g e
F. In vitro anti-inflammatory test
Preparation of Human Red Blood Cells (HRBC) Suspension
Fresh whole human blood was collected and mixed with equal volume of sterilized phosphate
buffer saline. The blood was centrifuged at 1000 rpm for 10 min and packed cells were washed
three times with isosaline (0.85%, pH 7.2). The volume of the blood was measured and
reconstituted as 10% v/v suspension with isosaline.
Heat Induced Hemolysis
The principle involved here is stabilization of human red blood cell membrane by hypo tonicity
induced membrane lysis. The assay mixture contains 1ml phosphate buffer [pH 7.4, 0.15 M], 2
ml hypo saline [0.36 %], 100휇l HRBC suspension [10 % v/v] with 100휇l of plant extracts and
standard drug diclofenac sodium of various concentrations and control (distilled water instead of
hypo saline to produce 100 % hemolysis) were incubated at 37 oC for 30 min and centrifuged
respectively. The hemoglobin content in the suspension was estimated using spectrophotometer
at 560 nm. (Chippada et al., 2011)
Then the absorbance was taken in 334 nm
Then 3 ml distilled water was added to each test tube
After that 100 μL of yeast suspension was added to all and further incubated at 37 °C for 60 min.
After standard, sample and blank preparation Various concentrations of plant extracts, standard and blank were
incubated together for 10 min at 37 °C.
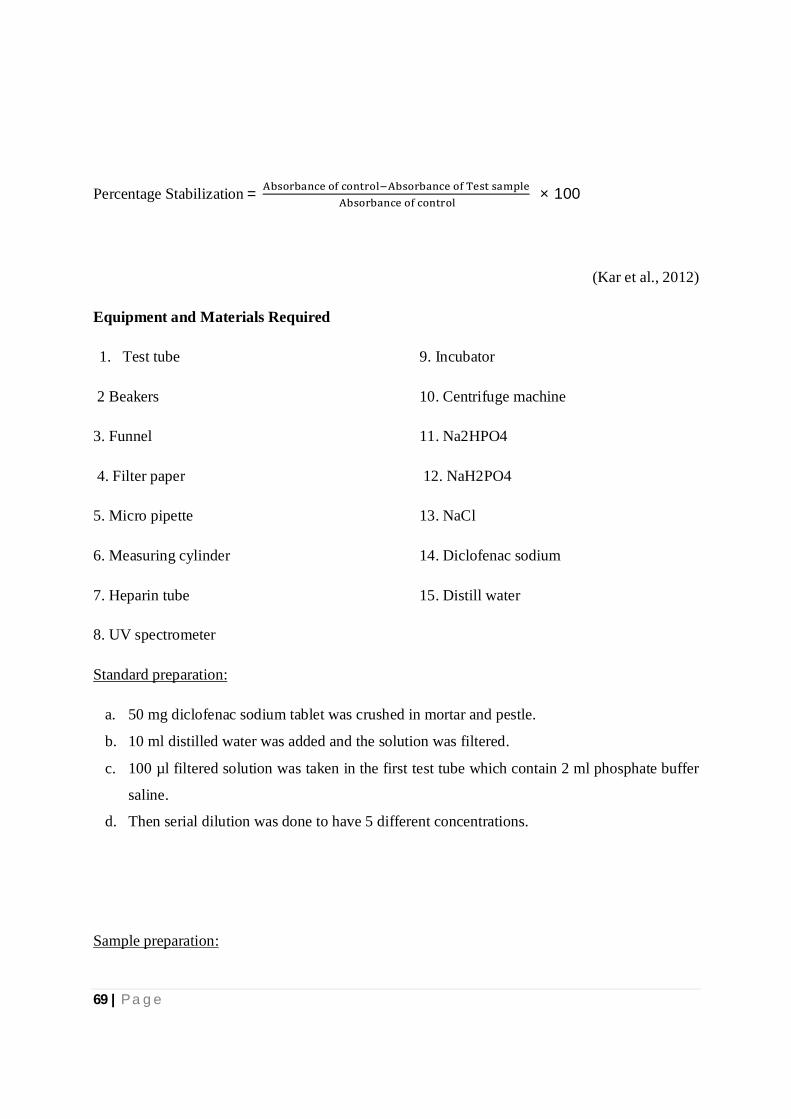
69 | P a g e
Percentage Stabilization=
× 100
(Kar et al., 2012)
Equipment and Materials Required
1. Test tube
2 Beakers
3. Funnel
4. Filter paper
5. Micro pipette
6. Measuring cylinder
7. Heparin tube
8. UV spectrometer
9. Incubator
10. Centrifuge machine
11. Na2HPO4
12. NaH2PO4
13. NaCl
14. Diclofenac sodium
15. Distill water
Standard preparation:
a. 50 mg diclofenac sodium tablet was crushed in mortar and pestle.
b. 10 ml distilled water was added and the solution was filtered.
c. 100 µl filtered solution was taken in the first test tube which contain 2 ml phosphate buffer
saline.
d. Then serial dilution was done to have 5 different concentrations.
Sample preparation:
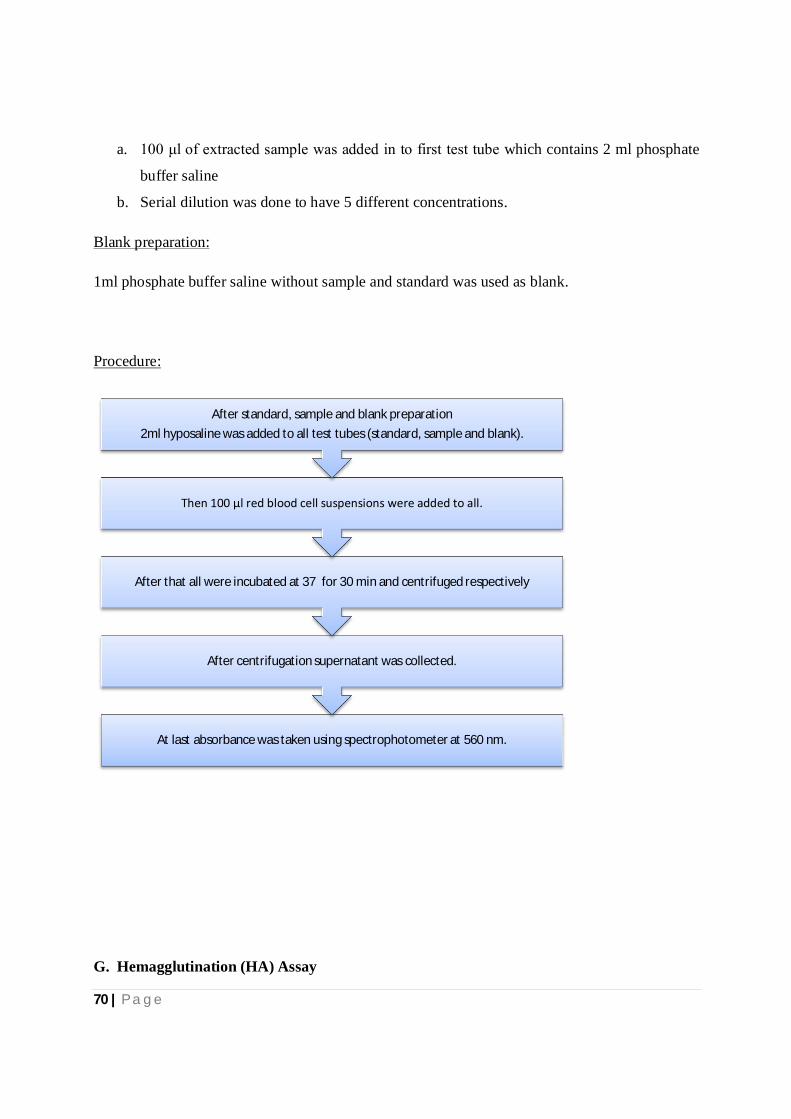
70 | P a g e
a. 100 μl of extracted sample was added in to first test tube which contains 2 ml phosphate
buffer saline
b. Serial dilution was done to have 5 different concentrations.
Blank preparation:
1ml phosphate buffer saline without sample and standard was used as blank.
Procedure:
G. Hemagglutination (HA) Assay
At last absorbance was taken using spectrophotometer at 560 nm.
After centrifugation supernatant was collected.
After that all were incubated at 37 for 30 min and centrifuged respectively
Then 100 μl red blood cell suspensions were added to all.
After standard, sample and blank preparation 2ml hyposaline was added to all test tubes (standard, sample and blank).
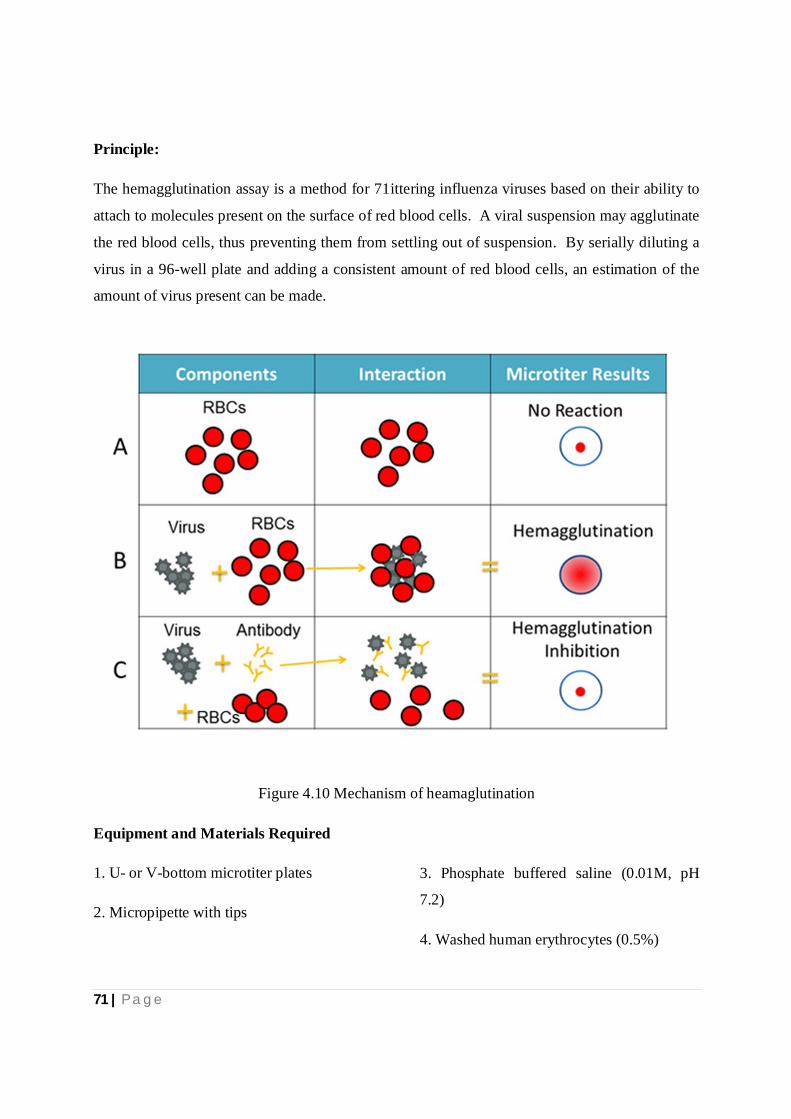
71 | P a g e
Principle:
The hemagglutination assay is a method for 71ittering influenza viruses based on their ability to
attach to molecules present on the surface of red blood cells. A viral suspension may agglutinate
the red blood cells, thus preventing them from settling out of suspension. By serially diluting a
virus in a 96-well plate and adding a consistent amount of red blood cells, an estimation of the
amount of virus present can be made.
Figure 4.10 Mechanism of heamaglutination
Equipment and Materials Required
1. U- or V-bottom microtiter plates
2. Micropipette with tips
3. Phosphate buffered saline (0.01M, pH
7.2)
4. Washed human erythrocytes (0.5%)
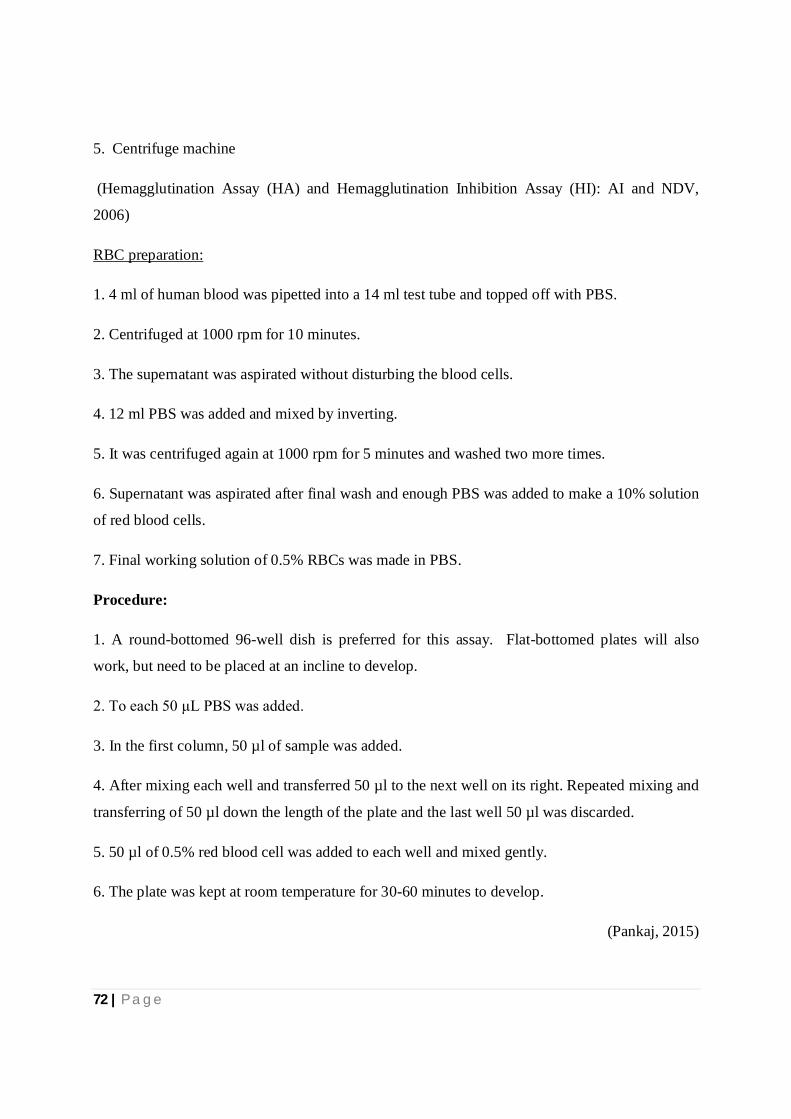
72 | P a g e
5. Centrifuge machine
(Hemagglutination Assay (HA) and Hemagglutination Inhibition Assay (HI): AI and NDV,
2006)
RBC preparation:
1. 4 ml of human blood was pipetted into a 14 ml test tube and topped off with PBS.
2. Centrifuged at 1000 rpm for 10 minutes.
3. The supernatant was aspirated without disturbing the blood cells.
4. 12 ml PBS was added and mixed by inverting.
5. It was centrifuged again at 1000 rpm for 5 minutes and washed two more times.
6. Supernatant was aspirated after final wash and enough PBS was added to make a 10% solution
of red blood cells.
7. Final working solution of 0.5% RBCs was made in PBS.
Procedure:
1. A round-bottomed 96-well dish is preferred for this assay. Flat-bottomed plates will also
work, but need to be placed at an incline to develop.
2. To each 50 μL PBS was added.
3. In the first column, 50 µl of sample was added.
4. After mixing each well and transferred 50 µl to the next well on its right. Repeated mixing and
transferring of 50 µl down the length of the plate and the last well 50 µl was discarded.
5. 50 µl of 0.5% red blood cell was added to each well and mixed gently.
6. The plate was kept at room temperature for 30-60 minutes to develop.
(Pankaj, 2015)

73 | P a g e
UNIT FIVE: RESULTS
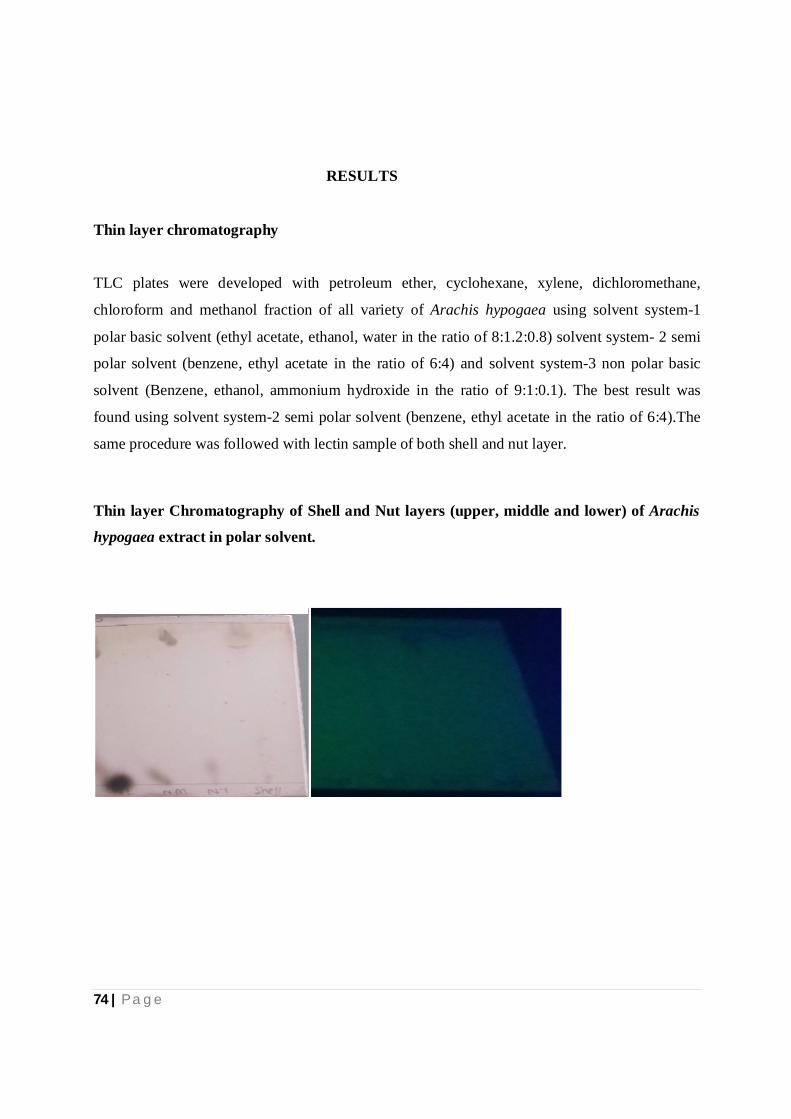
74 | P a g e
RESULTS
Thin layer chromatography
TLC plates were developed with petroleum ether, cyclohexane, xylene, dichloromethane,
chloroform and methanol fraction of all variety of Arachis hypogaea using solvent system-1
polar basic solvent (ethyl acetate, ethanol, water in the ratio of 8:1.2:0.8) solvent system- 2 semi
polar solvent (benzene, ethyl acetate in the ratio of 6:4) and solvent system-3 non polar basic
solvent (Benzene, ethanol, ammonium hydroxide in the ratio of 9:1:0.1). The best result was
found using solvent system-2 semi polar solvent (benzene, ethyl acetate in the ratio of 6:4).The
same procedure was followed with lectin sample of both shell and nut layer.
Thin layer Chromatography of Shell and Nut layers (upper, middle and lower) of Arachis
hypogaea extract in polar solvent.
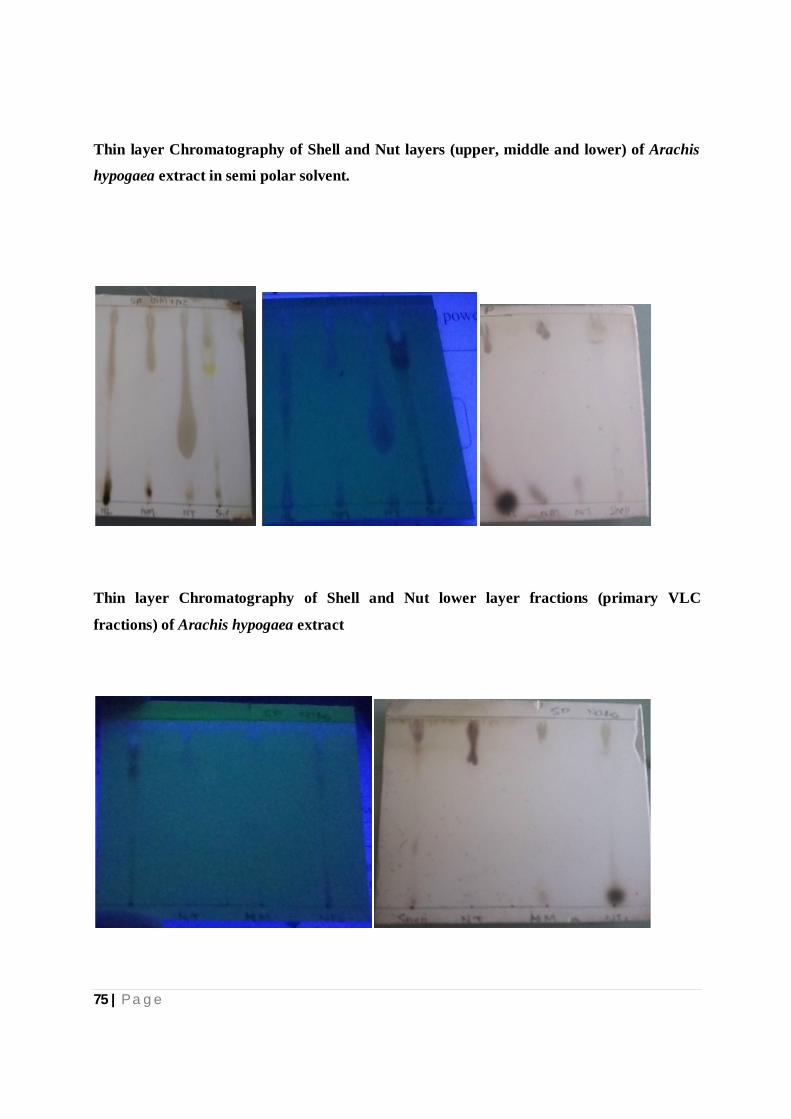
75 | P a g e
Thin layer Chromatography of Shell and Nut layers (upper, middle and lower) of Arachis
hypogaea extract in semi polar solvent.
Thin layer Chromatography of Shell and Nut lower layer fractions (primary VLC
fractions) of Arachis hypogaea extract
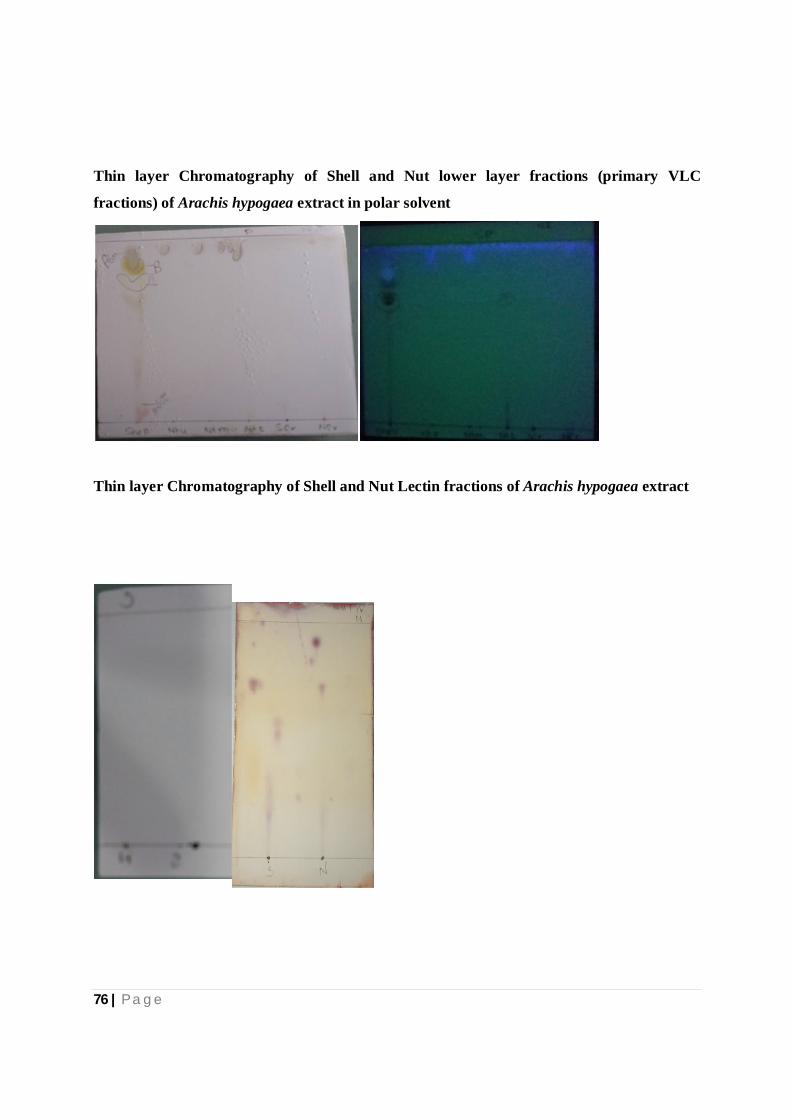
76 | P a g e
Thin layer Chromatography of Shell and Nut lower layer fractions (primary VLC
fractions) of Arachis hypogaea extract in polar solvent
Thin layer Chromatography of Shell and Nut Lectin fractions of Arachis hypogaea extract
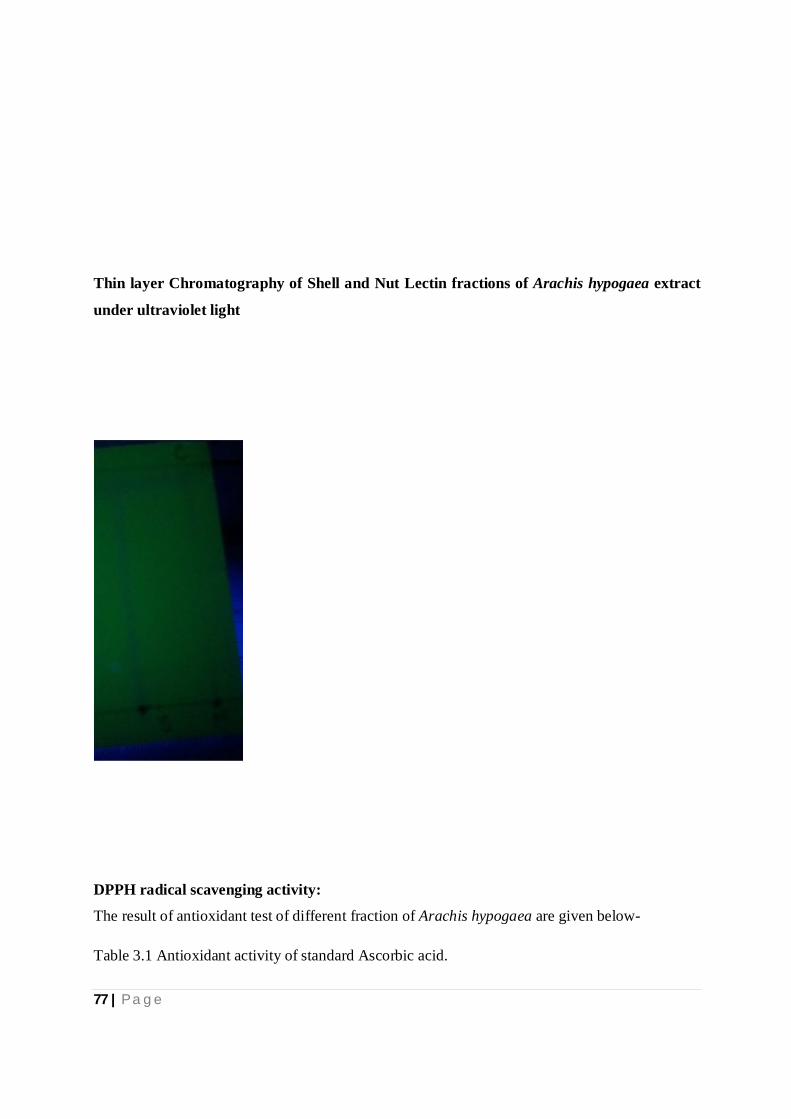
77 | P a g e
Thin layer Chromatography of Shell and Nut Lectin fractions of Arachis hypogaea extract
under ultraviolet light
DPPH radical scavenging activity:
The result of antioxidant test of different fraction of Arachis hypogaea are given below-
Table 3.1 Antioxidant activity of standard Ascorbic acid.
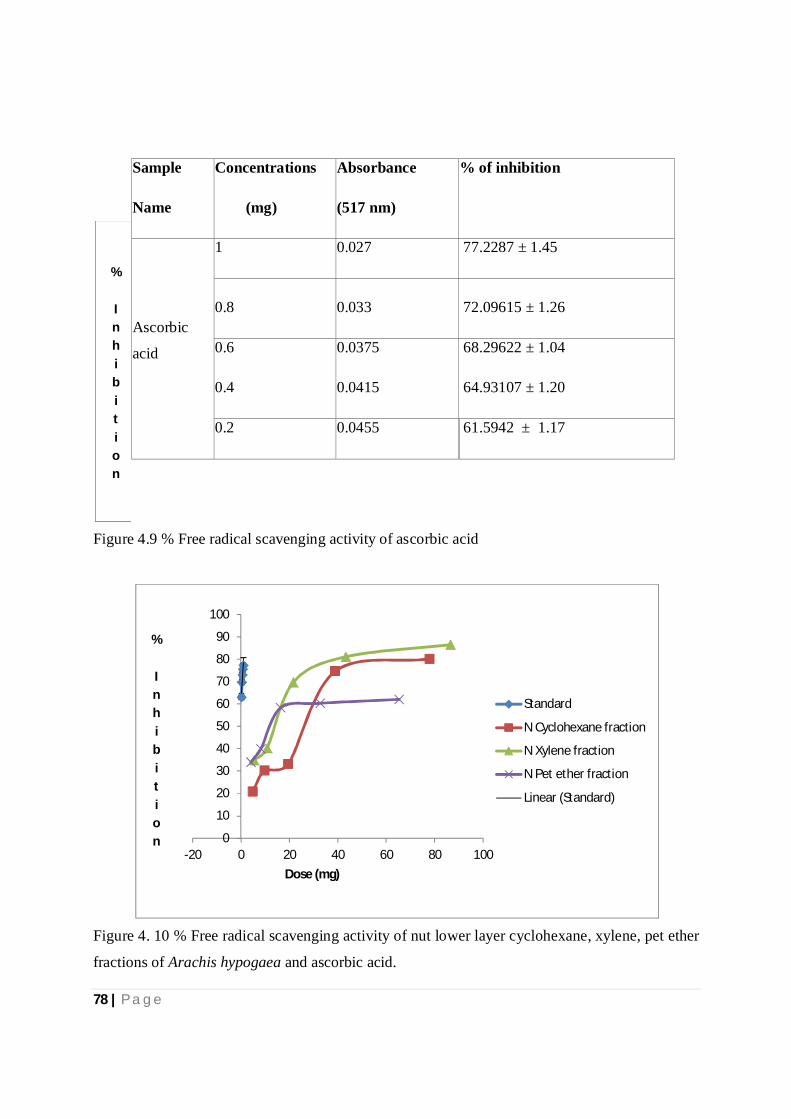
78 | P a g e
Figure 4.9 % Free radical scavenging activity of ascorbic acid
Figure 4. 10 % Free radical scavenging activity of nut lower layer cyclohexane, xylene, pet ether
fractions of Arachis hypogaea and ascorbic acid.
% Inhibition
0
10
20
30
40
50
60
70
80
90
100
-20 0 20 40 60 80 100
% Inhibition
Dose (mg)
Standard
N Cyclohexane fraction
N Xylene fraction
N Pet ether fraction
Linear (Standard)
Sample
Name
Concentrations
(mg)
Absorbance
(517 nm)
% of inhibition
Ascorbic
acid
1 0.027 77.2287 ± 1.45
0.8 0.033 72.09615 ± 1.26
0.6 0.0375 68.29622 ± 1.04
0.4 0.0415 64.93107 ± 1.20
0.2 0.0455 61.5942 ± 1.17
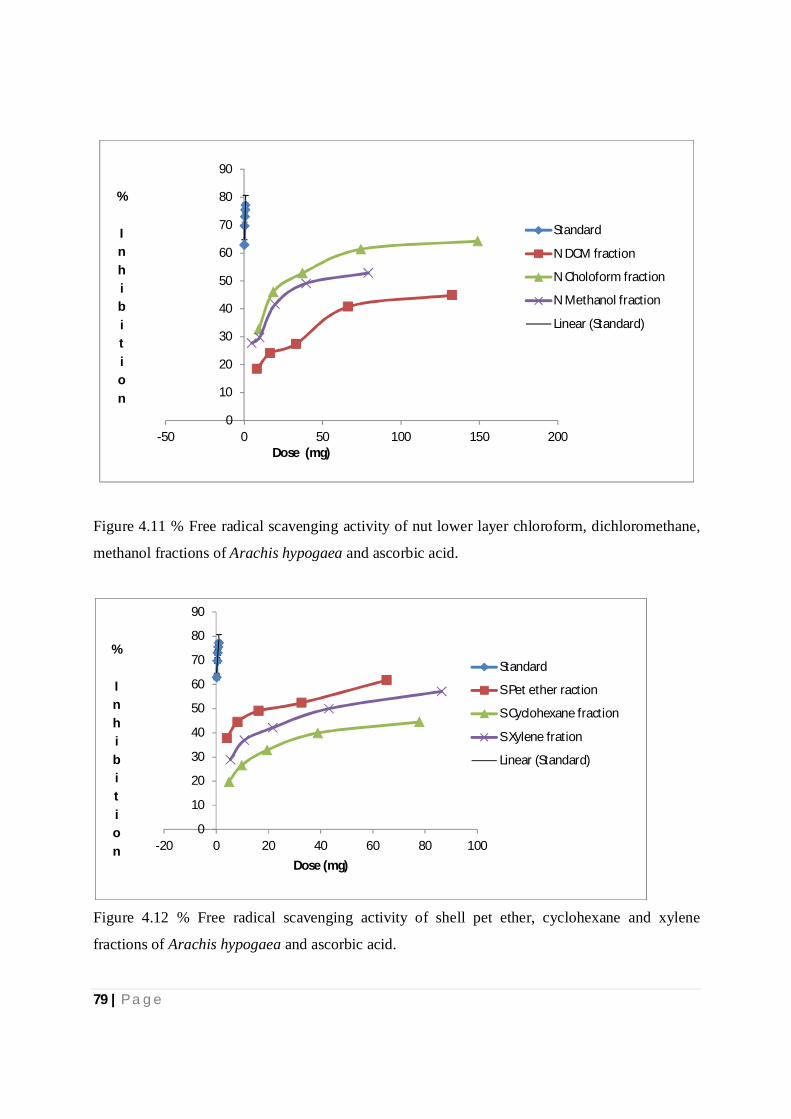
79 | P a g e
Figure 4.11 % Free radical scavenging activity of nut lower layer chloroform, dichloromethane,
methanol fractions of Arachis hypogaea and ascorbic acid.
Figure 4.12 % Free radical scavenging activity of shell pet ether, cyclohexane and xylene
fractions of Arachis hypogaea and ascorbic acid.
0
10
20
30
40
50
60
70
80
90
-50 0 50 100 150 200
% Inhibition
Dose (mg)
Standard
N DCM fraction
N Choloform fraction
N Methanol fraction
Linear (Standard)
0
10
20
30
40
50
60
70
80
90
-20 0 20 40 60 80 100
% Inhibition
Dose (mg)
Standard
S Pet ether raction
S Cyclohexane fraction
S Xylene fration
Linear (Standard)
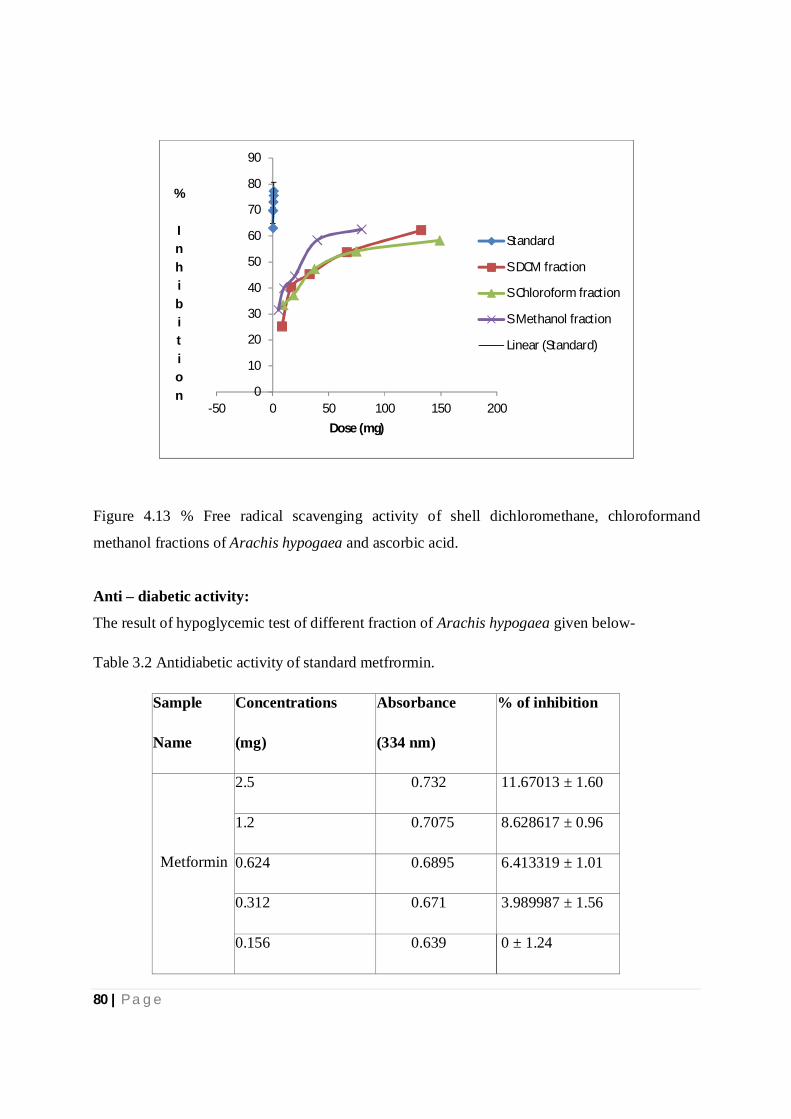
80 | P a g e
Figure 4.13 % Free radical scavenging activity of shell dichloromethane, chloroformand
methanol fractions of Arachis hypogaea and ascorbic acid.
Anti – diabetic activity:
The result of hypoglycemic test of different fraction of Arachis hypogaea given below-
Table 3.2 Antidiabetic activity of standard metfrormin.
Sample
Name
Concentrations
(mg)
Absorbance
(334 nm)
% of inhibition
Metformin
2.5 0.732 11.67013 ± 1.60
1.2 0.7075 8.628617 ± 0.96
0.624 0.6895 6.413319 ± 1.01
0.312 0.671 3.989987 ± 1.56
0.156 0.639 0 ± 1.24
0
10
20
30
40
50
60
70
80
90
-50 0 50 100 150 200
% Inhibition
Dose (mg)
Standard
S DCM fraction
S Chloroform fraction
S Methanol fraction
Linear (Standard)
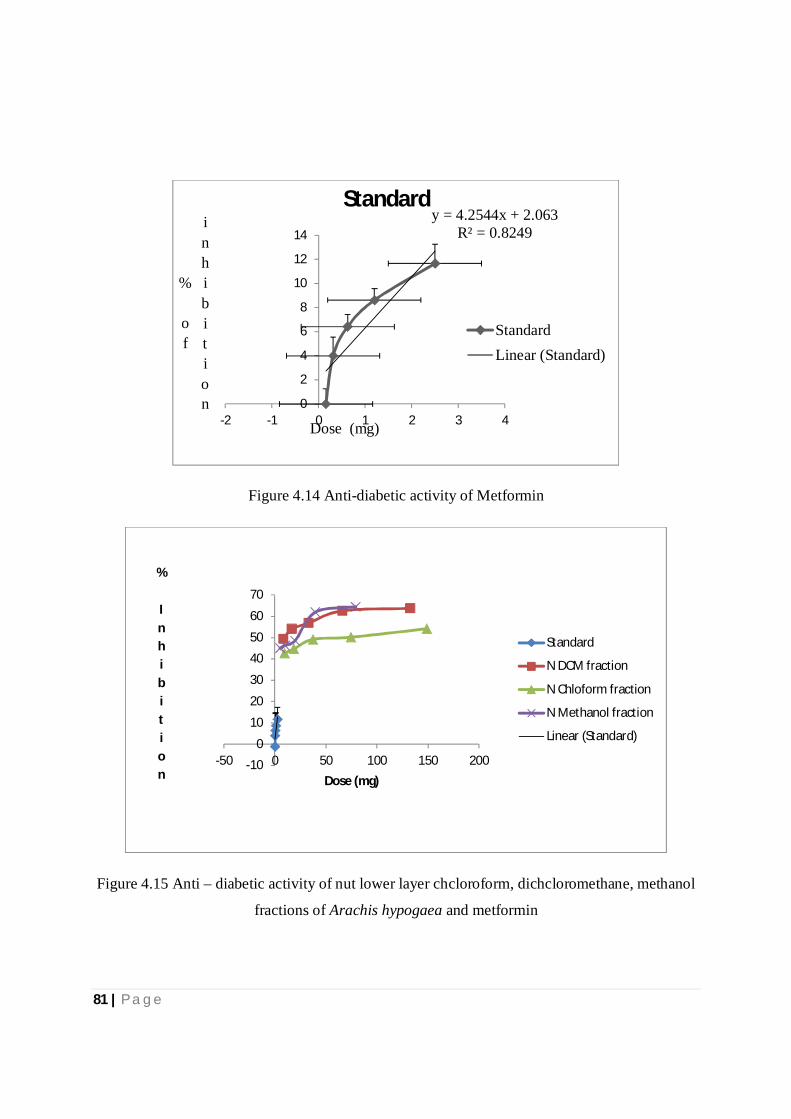
81 | P a g e
Figure 4.14 Anti-diabetic activity of Metformin
Figure 4.15 Anti – diabetic activity of nut lower layer chcloroform, dichcloromethane, methanol
fractions of Arachis hypogaea and metformin
y = 4.2544x + 2.063 R² = 0.8249
0
2
4
6
8
10
12
14
-2 -1 0 1 2 3 4
% of
inhibition Dose (mg)
Standard
StandardLinear (Standard)
-10
0
10
20
30
40
50
60
70
-50 0 50 100 150 200
% Inhibition
Dose (mg)
Standard
N DCM fraction
N Chloform fraction
N Methanol fraction
Linear (Standard)
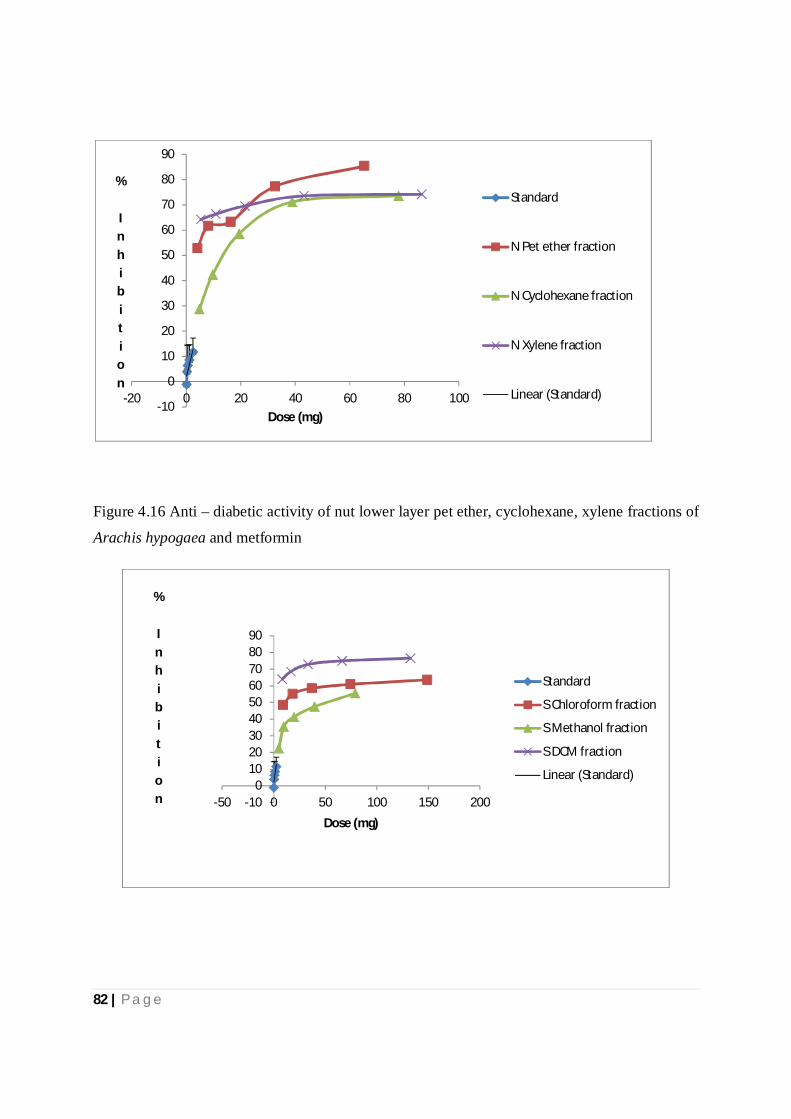
82 | P a g e
Figure 4.16 Anti – diabetic activity of nut lower layer pet ether, cyclohexane, xylene fractions of
Arachis hypogaea and metformin
-10
0
10
20
30
40
50
60
70
80
90
-20 0 20 40 60 80 100
% Inhibition
Dose (mg)
Standard
N Pet ether fraction
N Cyclohexane fraction
N Xylene fraction
Linear (Standard)
-100
102030405060708090
-50 0 50 100 150 200
% Inhibition Dose (mg)
Standard
S Chloroform fraction
S Methanol fraction
S DCM fraction
Linear (Standard)
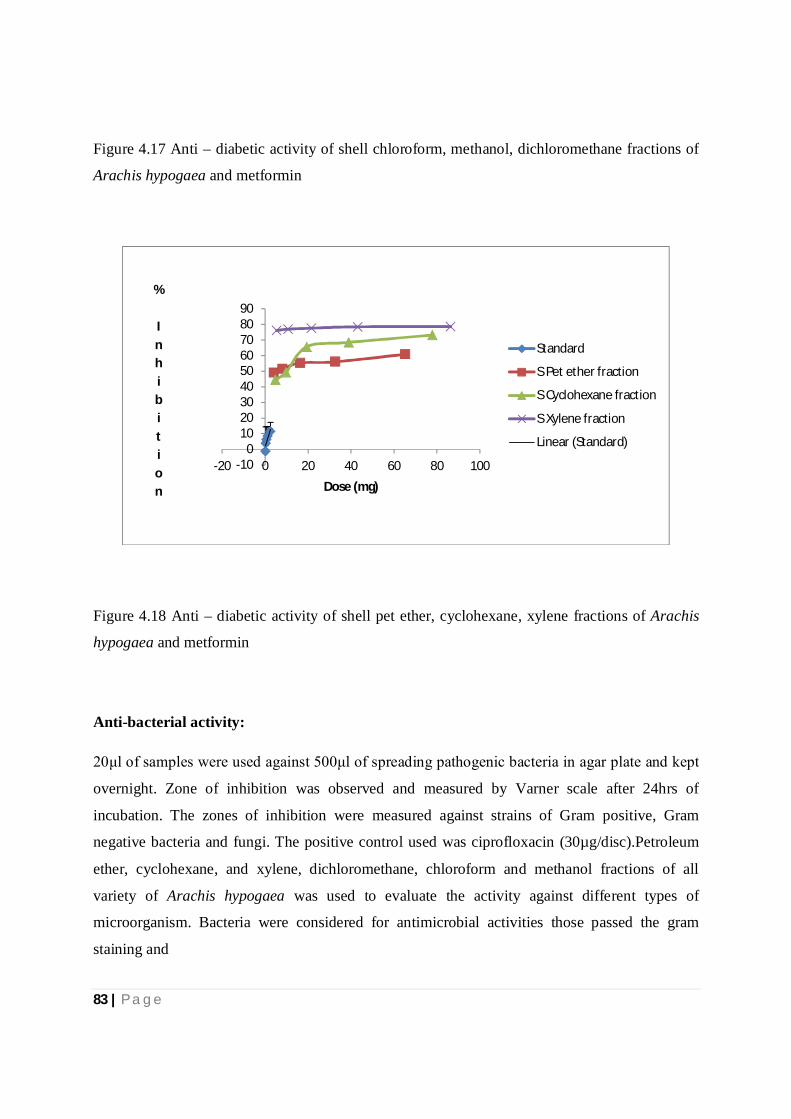
83 | P a g e
Figure 4.17 Anti – diabetic activity of shell chloroform, methanol, dichloromethane fractions of
Arachis hypogaea and metformin
Figure 4.18 Anti – diabetic activity of shell pet ether, cyclohexane, xylene fractions of Arachis
hypogaea and metformin
Anti-bacterial activity:
20μl of samples were used against 500μl of spreading pathogenic bacteria in agar plate and kept
overnight. Zone of inhibition was observed and measured by Varner scale after 24hrs of
incubation. The zones of inhibition were measured against strains of Gram positive, Gram
negative bacteria and fungi. The positive control used was ciprofloxacin (30µg/disc).Petroleum
ether, cyclohexane, and xylene, dichloromethane, chloroform and methanol fractions of all
variety of Arachis hypogaea was used to evaluate the activity against different types of
microorganism. Bacteria were considered for antimicrobial activities those passed the gram
staining and
-100
102030405060708090
-20 0 20 40 60 80 100
% Inhibition
Dose (mg)
Standard
S Pet ether fraction
S Cyclohexane fraction
S Xylene fraction
Linear (Standard)
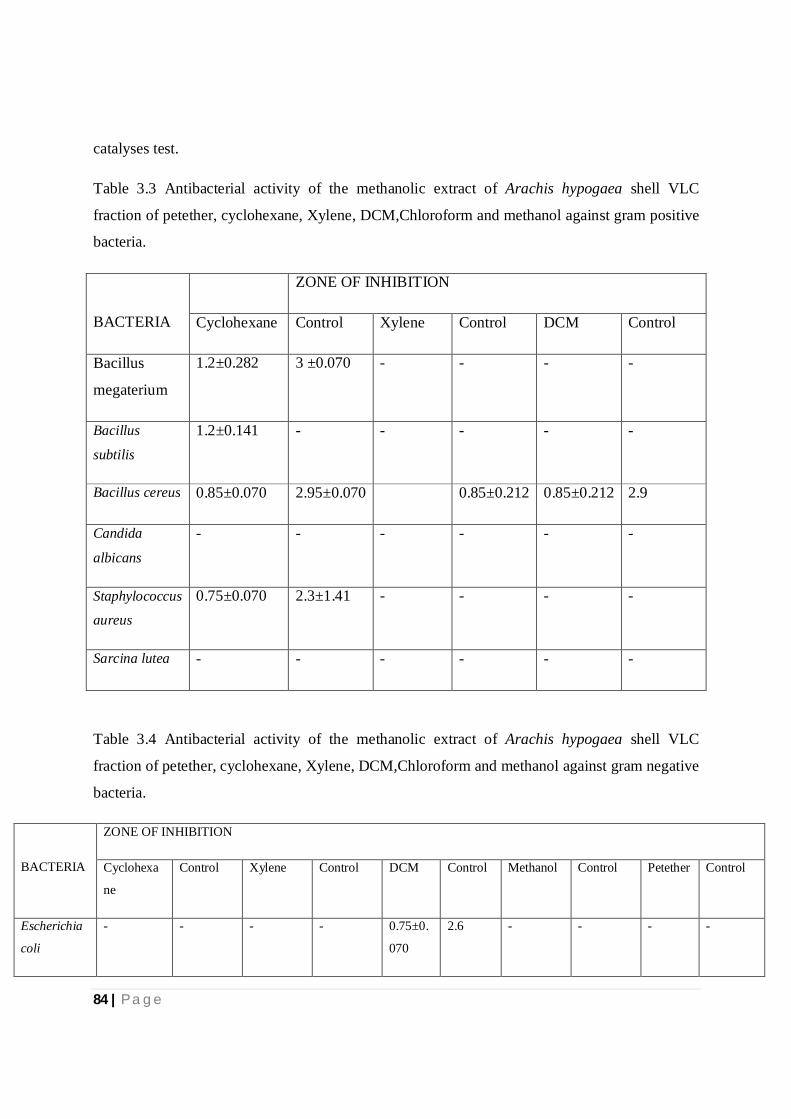
84 | P a g e
catalyses test.
Table 3.3 Antibacterial activity of the methanolic extract of Arachis hypogaea shell VLC
fraction of petether, cyclohexane, Xylene, DCM,Chloroform and methanol against gram positive
bacteria.
BACTERIA
ZONE OF INHIBITION
Cyclohexane Control Xylene Control DCM Control
Bacillus
megaterium
1.2±0.282 3 ±0.070 - - - -
Bacillus
subtilis 1.2±0.141 - - - - -
Bacillus cereus 0.85±0.070 2.95±0.070 0.85±0.212 0.85±0.212 2.9
Candida
albicans - - - - - -
Staphylococcus
aureus 0.75±0.070 2.3±1.41 - - - -
Sarcina lutea - - - - - -
Table 3.4 Antibacterial activity of the methanolic extract of Arachis hypogaea shell VLC
fraction of petether, cyclohexane, Xylene, DCM,Chloroform and methanol against gram negative
bacteria.
BACTERIA
ZONE OF INHIBITION
Cyclohexa
ne
Control Xylene Control DCM Control Methanol Control Petether Control
Escherichia
coli
- - - - 0.75±0.
070
2.6 - - - -
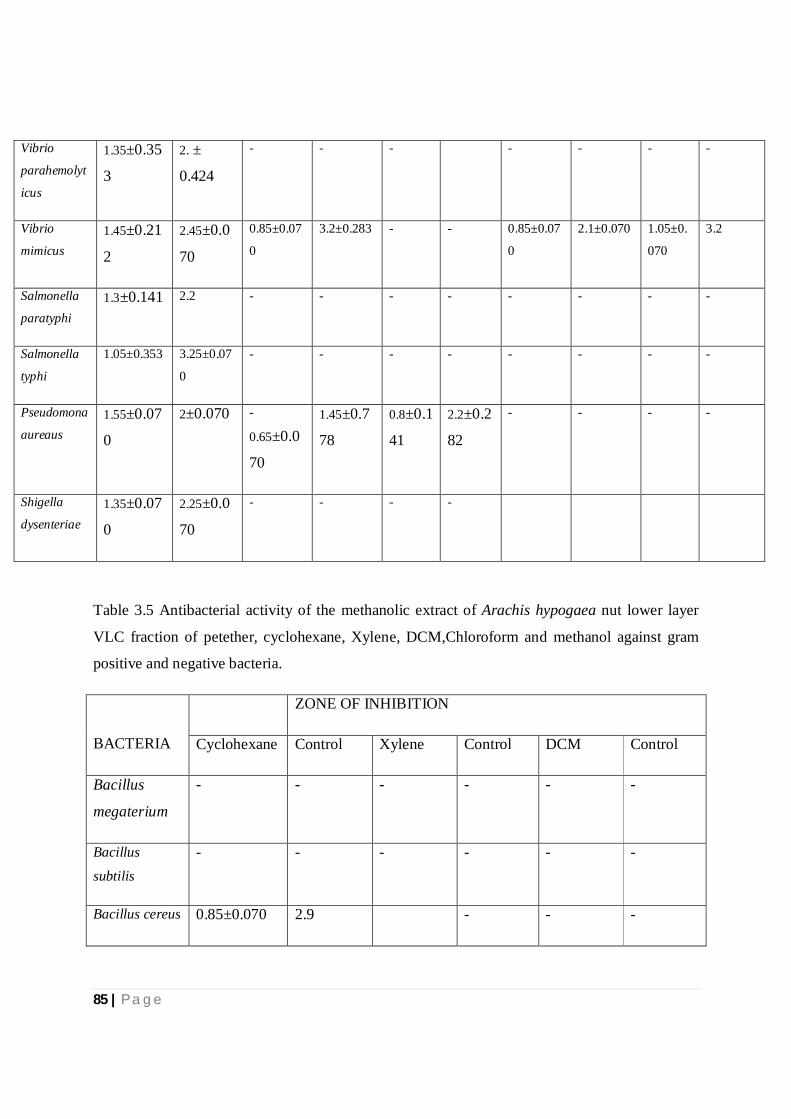
85 | P a g e
Vibrio
parahemolyt
icus
1.35±0.35
3
2. ±
0.424
- - - - - - -
Vibrio
mimicus 1.45±0.21
2
2.45±0.0
70
0.85±0.07
0
3.2±0.283 - - 0.85±0.07
0
2.1±0.070 1.05±0.
070
3.2
Salmonella
paratyphi 1.3±0.141 2.2 - - - - - - - -
Salmonella
typhi
1.05±0.353 3.25±0.07
0
- - - - - - - -
Pseudomona
aureaus 1.55±0.07
0
2±0.070 -
0.65±0.0
70
1.45±0.7
78
0.8±0.1
41
2.2±0.2
82
- - - -
Shigella
dysenteriae 1.35±0.07
0
2.25±0.0
70
- - - -
Table 3.5 Antibacterial activity of the methanolic extract of Arachis hypogaea nut lower layer
VLC fraction of petether, cyclohexane, Xylene, DCM,Chloroform and methanol against gram
positive and negative bacteria.
BACTERIA
ZONE OF INHIBITION
Cyclohexane Control Xylene Control DCM Control
Bacillus
megaterium
- - - - - -
Bacillus
subtilis - - - - - -
Bacillus cereus 0.85±0.070 2.9 - - -
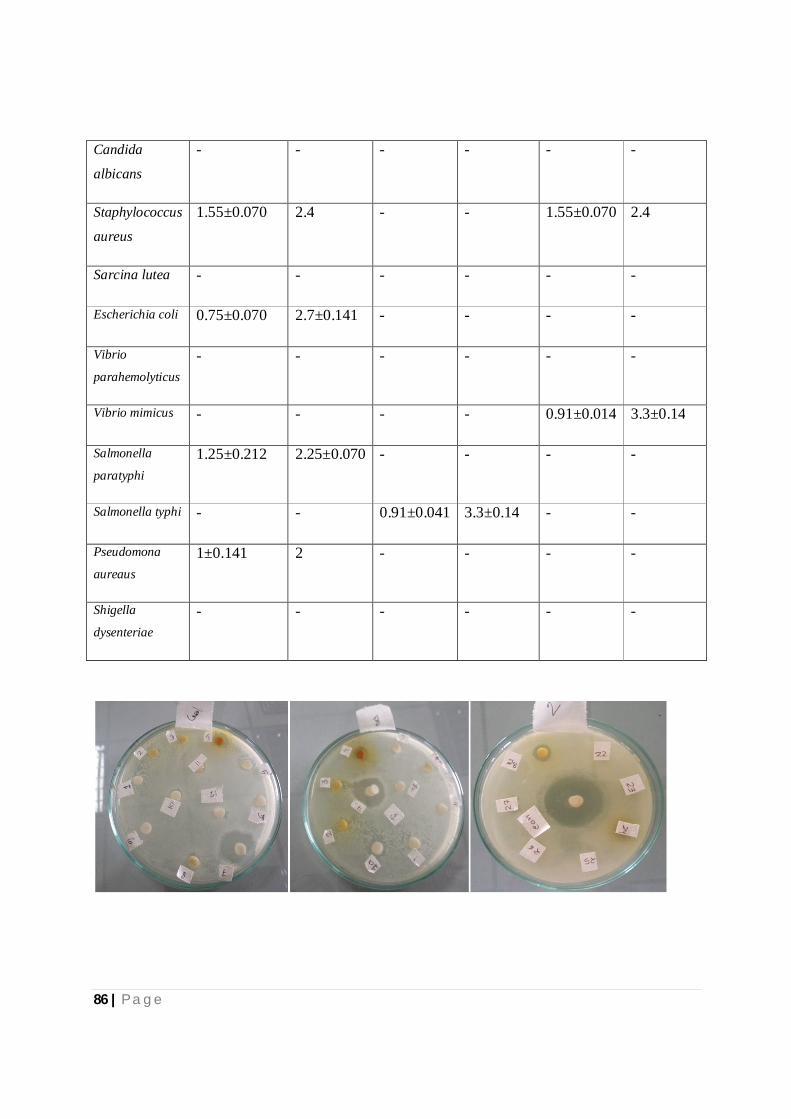
86 | P a g e
Candida
albicans - - - - - -
Staphylococcus
aureus 1.55±0.070 2.4 - - 1.55±0.070 2.4
Sarcina lutea - - - - - -
Escherichia coli 0.75±0.070 2.7±0.141 - - - -
Vibrio
parahemolyticus - - - - - -
Vibrio mimicus - - - - 0.91±0.014 3.3±0.14
Salmonella
paratyphi 1.25±0.212 2.25±0.070 - - - -
Salmonella typhi - - 0.91±0.041 3.3±0.14 - -
Pseudomona
aureaus 1±0.141 2 - - - -
Shigella
dysenteriae - - - - - -
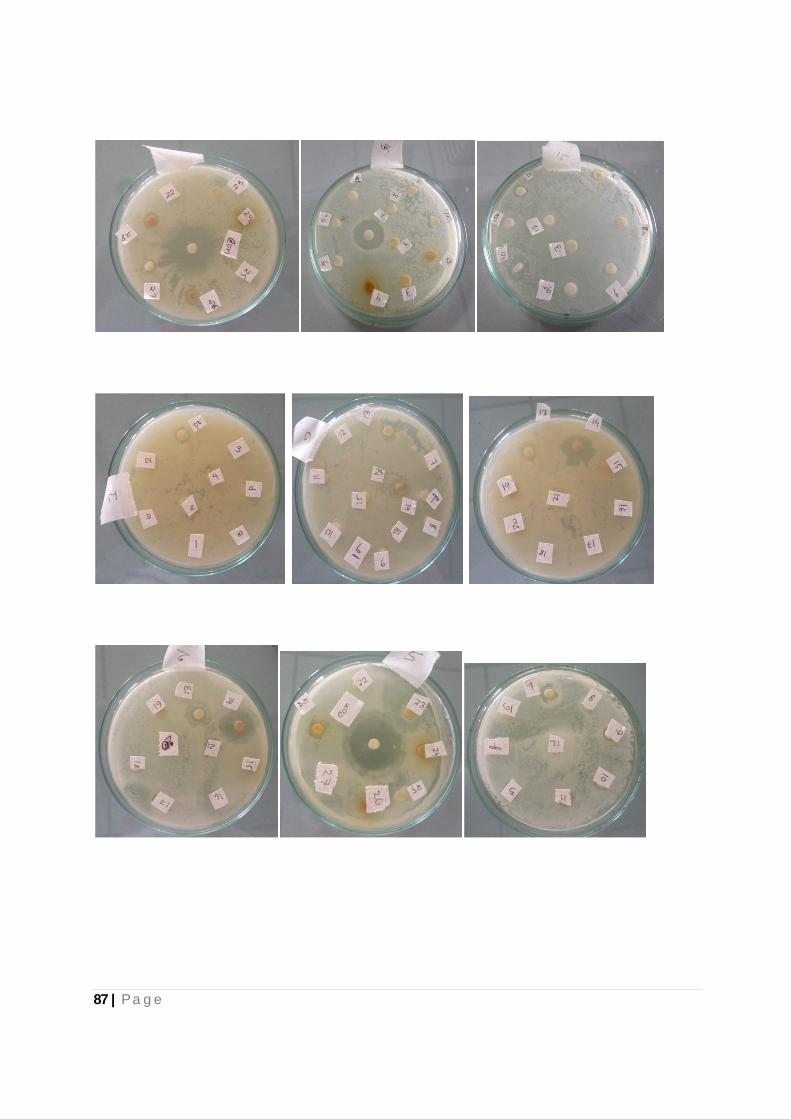
87 | P a g e
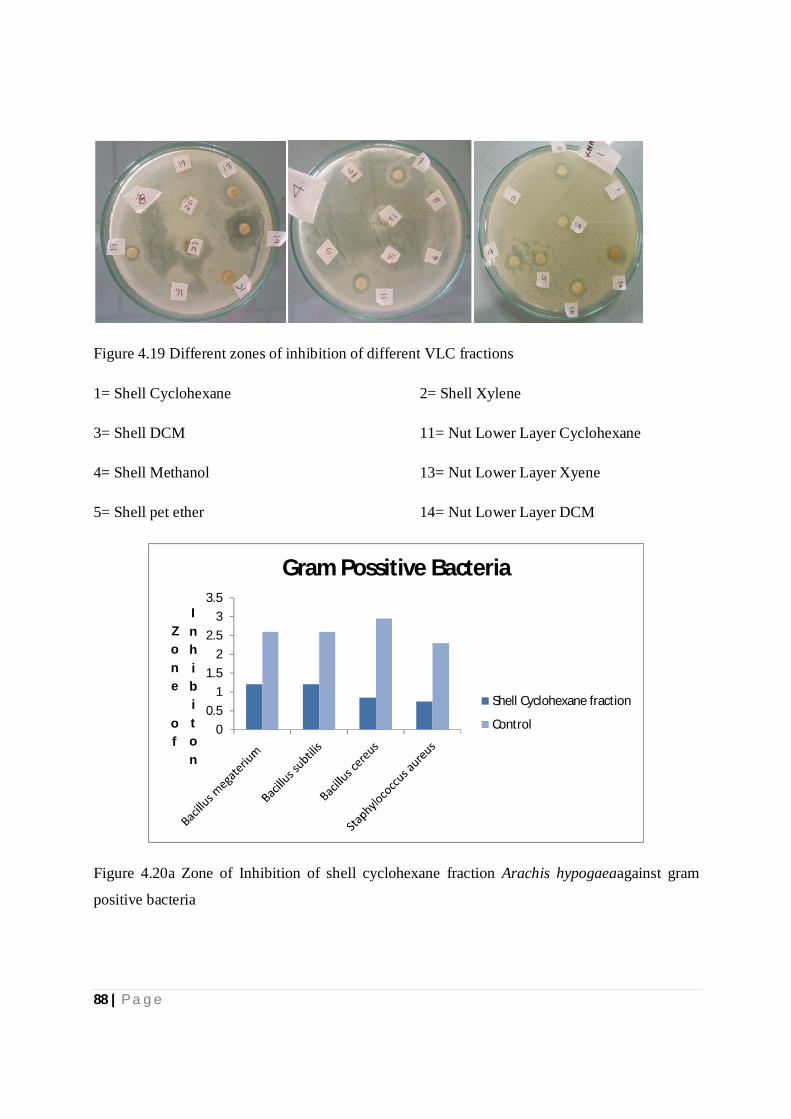
88 | P a g e
Figure 4.19 Different zones of inhibition of different VLC fractions
1= Shell Cyclohexane 2= Shell Xylene
3= Shell DCM
4= Shell Methanol
5= Shell pet ether
11= Nut Lower Layer Cyclohexane
13= Nut Lower Layer Xyene
14= Nut Lower Layer DCM
Figure 4.20a Zone of Inhibition of shell cyclohexane fraction Arachis hypogaeaagainst gram
positive bacteria
00.5
11.5
22.5
33.5
Zone of
Inhibiton
Gram Possitive Bacteria
Shell Cyclohexane fraction
Control
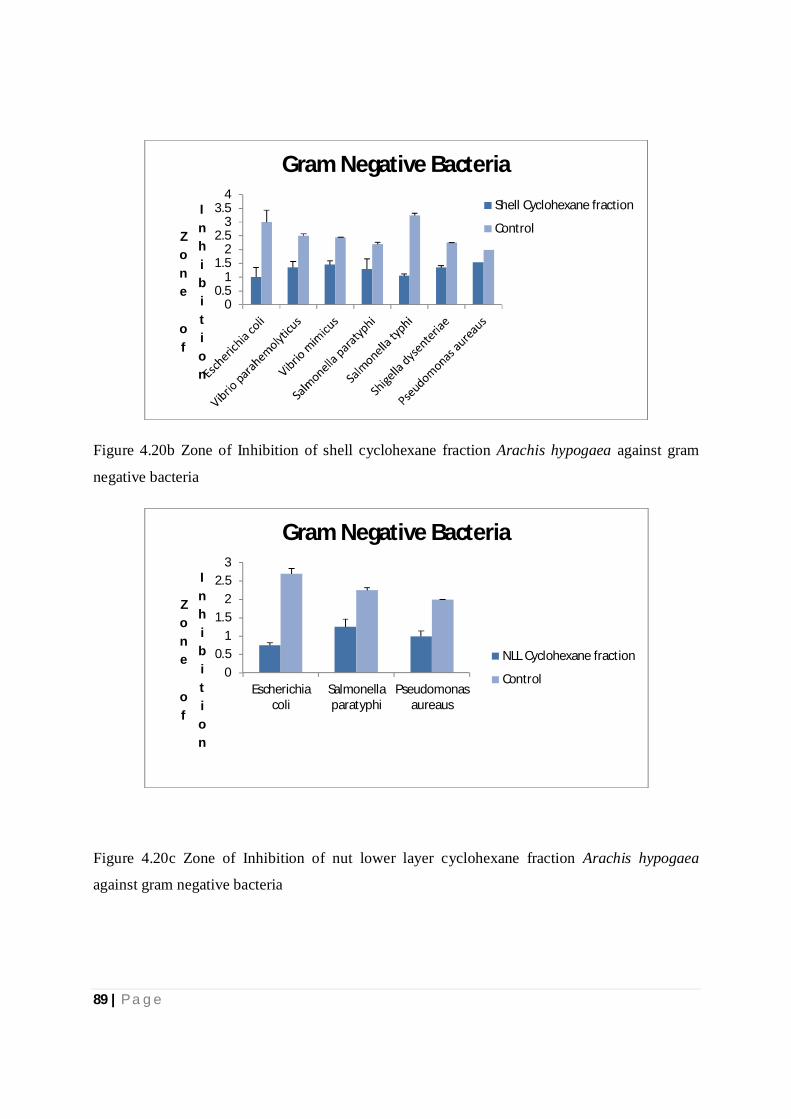
89 | P a g e
Figure 4.20b Zone of Inhibition of shell cyclohexane fraction Arachis hypogaea against gram
negative bacteria
Figure 4.20c Zone of Inhibition of nut lower layer cyclohexane fraction Arachis hypogaea
against gram negative bacteria
00.5
11.5
22.5
33.5
4
Zone of
Inhibition
Gram Negative Bacteria
Shell Cyclohexane fraction
Control
00.5
11.5
22.5
3
Escherichiacoli
Salmonellaparatyphi
Pseudomonasaureaus
Zone of
Inhibition
Gram Negative Bacteria
NLL Cyclohexane fraction
Control

90 | P a g e
Minimum Inhibitory Concentration:
Figure 4.21d Minimum Inhibitory concentration of nut lower layer cyclohexane primary VLC
fraction of Arachis hypogaea against Salmonella paratyphii
0 0 0
0.2 0.3
0.6 0.7
1.25
-0.2
0
0.2
0.4
0.6
0.8
1
1.2
1.4
0 20 40 60
Zone of
inhibition Concentration(µg/ml)
Nut Lower Layer Cyclohexane
Salmonella paratyphii
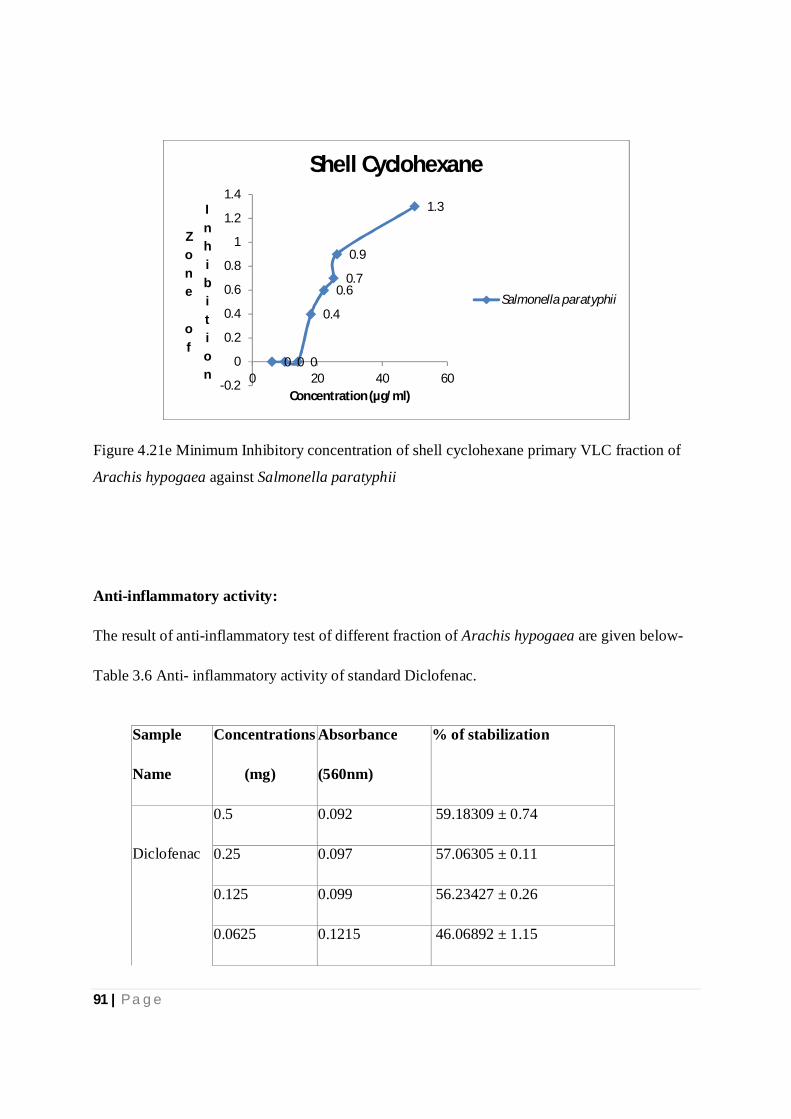
91 | P a g e
Figure 4.21e Minimum Inhibitory concentration of shell cyclohexane primary VLC fraction of
Arachis hypogaea against Salmonella paratyphii
Anti-inflammatory activity:
The result of anti-inflammatory test of different fraction of Arachis hypogaea are given below-
Table 3.6 Anti- inflammatory activity of standard Diclofenac.
0 0 0
0.4
0.6 0.7
0.9
1.3
-0.2
0
0.2
0.4
0.6
0.8
1
1.2
1.4
0 20 40 60
Zone of
Inhibition Concentration (µg/ml)
Shell Cyclohexane
Salmonella paratyphii
Sample
Name
Concentrations
(mg)
Absorbance
(560nm)
% of stabilization
Diclofenac
0.5 0.092 59.18309 ± 0.74
0.25 0.097 57.06305 ± 0.11
0.125 0.099 56.23427 ± 0.26
0.0625 0.1215 46.06892 ± 1.15
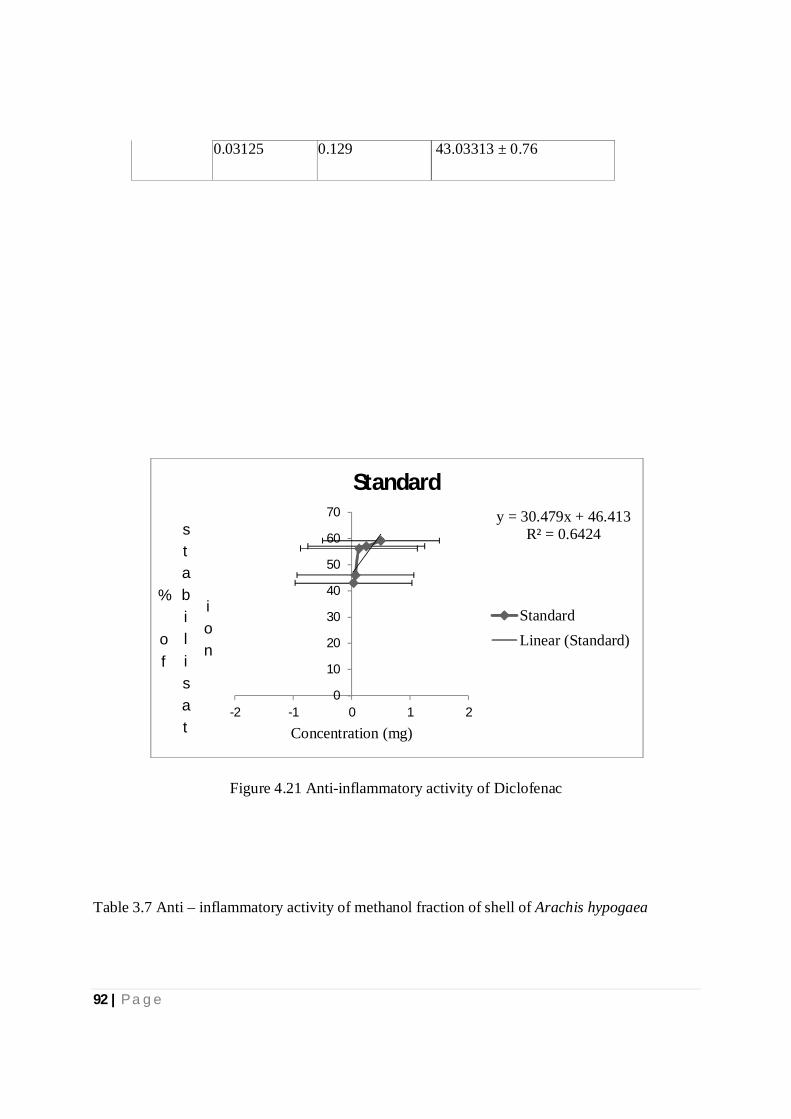
92 | P a g e
Figure 4.21 Anti-inflammatory activity of Diclofenac
Table 3.7 Anti – inflammatory activity of methanol fraction of shell of Arachis hypogaea
y = 30.479x + 46.413 R² = 0.6424
0
10
20
30
40
50
60
70
-2 -1 0 1 2
% of
stabilisat
ion
Concentration (mg)
Standard
StandardLinear (Standard)
0.03125 0.129 43.03313 ± 0.76
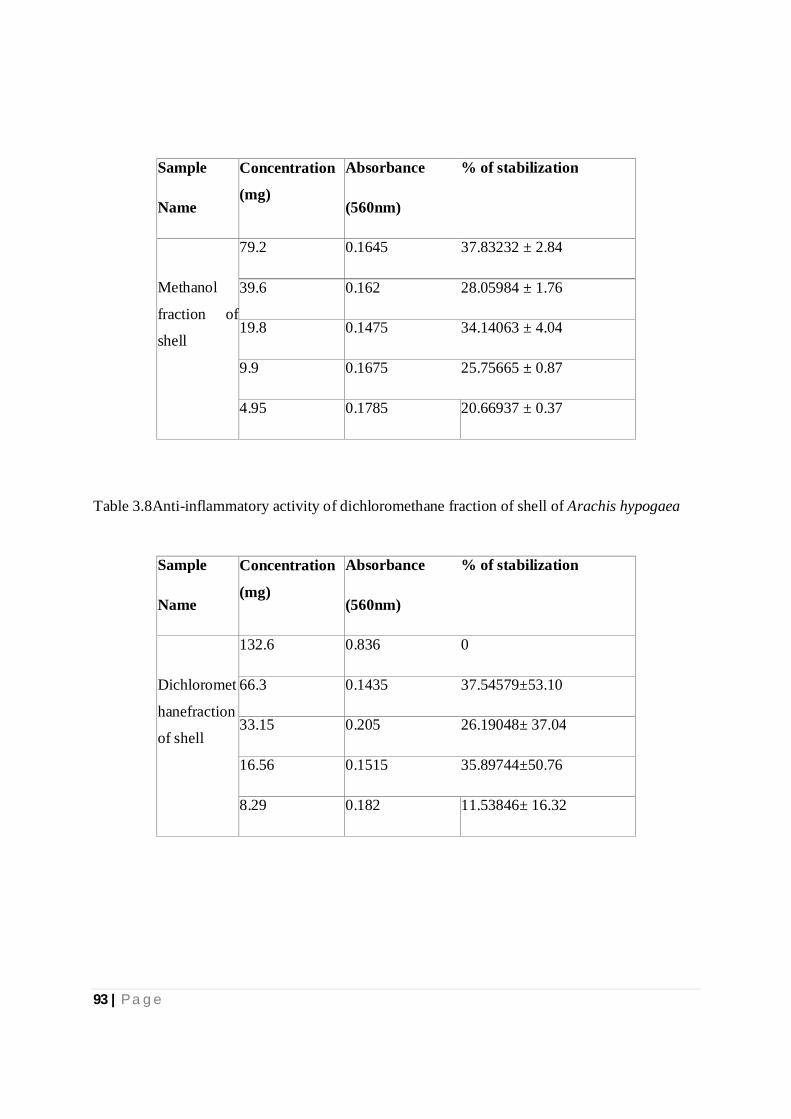
93 | P a g e
Table 3.8Anti-inflammatory activity of dichloromethane fraction of shell of Arachis hypogaea
Sample
Name
Concentration
(mg)
Absorbance
(560nm)
% of stabilization
Methanol
fraction of
shell
79.2 0.1645 37.83232 ± 2.84
39.6 0.162 28.05984 ± 1.76
19.8 0.1475 34.14063 ± 4.04
9.9 0.1675 25.75665 ± 0.87
4.95 0.1785 20.66937 ± 0.37
Sample
Name
Concentration
(mg)
Absorbance
(560nm)
% of stabilization
Dichloromet
hanefraction
of shell
132.6 0.836 0
66.3 0.1435 37.54579±53.10
33.15 0.205 26.19048± 37.04
16.56 0.1515 35.89744±50.76
8.29 0.182 11.53846± 16.32
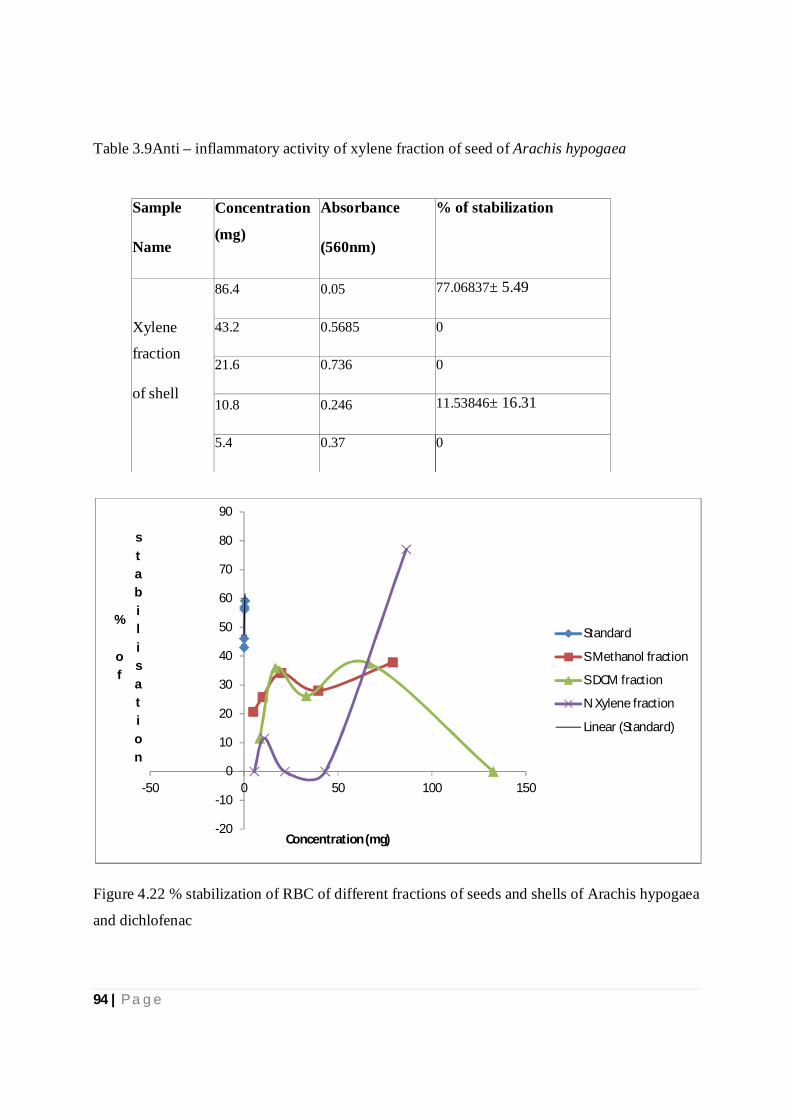
94 | P a g e
Table 3.9Anti – inflammatory activity of xylene fraction of seed of Arachis hypogaea
Figure 4.22 % stabilization of RBC of different fractions of seeds and shells of Arachis hypogaea
and dichlofenac
-20
-10
0
10
20
30
40
50
60
70
80
90
-50 0 50 100 150
% of
stabilisation
Concentration (mg)
Standard
S Methanol fraction
S DCM fraction
N Xylene fraction
Linear (Standard)
Sample
Name
Concentration
(mg)
Absorbance
(560nm)
% of stabilization
Xylene
fraction
of shell
86.4 0.05 77.06837± 5.49
43.2 0.5685 0
21.6 0.736 0
10.8 0.246 11.53846± 16.31
5.4 0.37 0

95 | P a g e
Hemagglutination Inhibition Assay:
Table 3.10 results of hemagglutination test of different fractions of seeds and shells of Arachis
hypogaea are given below-
Concentration
(μl)
50 25 12.5 6.25 3.12 1.56 0.78 0.39 0.19 0.09 0.04
Sample name Cell receptor binding
Shell
Cyclohexane
- - - - - - - - - - -
Shell Xylene - - - - - - - - - - -
Shell DCM - - - - - - - - - - -
Shell
Methanol
- - - - - - - - - - -
Nut lower
layer pet
ether
- - - - - - - - - - -
Nut lower
layer
Cyclohexane
- - - - - - - - - - -
Nut lower
layer DCM
- - - - - - - - - - -
Nut lower
layer Xylene
+ - - - - - - - - - -
Here,
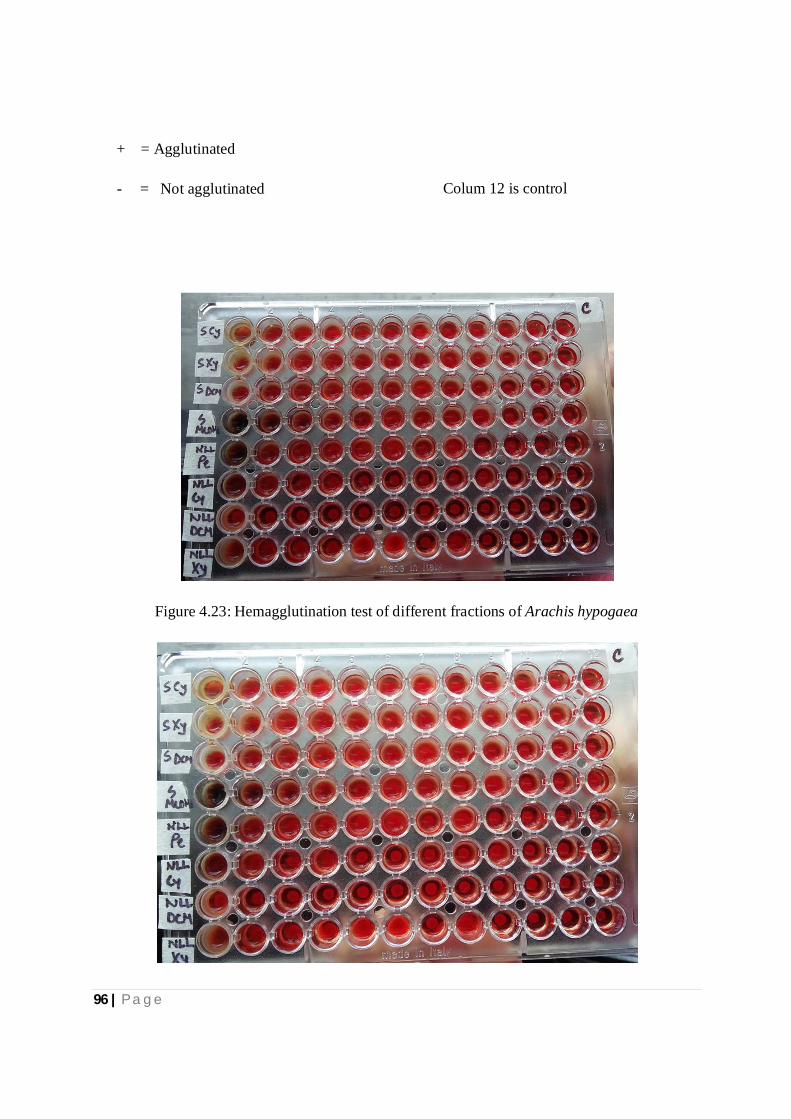
96 | P a g e
+ = Agglutinated
- = Not agglutinated
Colum 12 is control
Figure 4.23: Hemagglutination test of different fractions of Arachis hypogaea
97 | P a g e
Figure 4.23 Hemagglutination test of different fractions of Arachis hypogaea
UNIT SIX: DISCUSSION
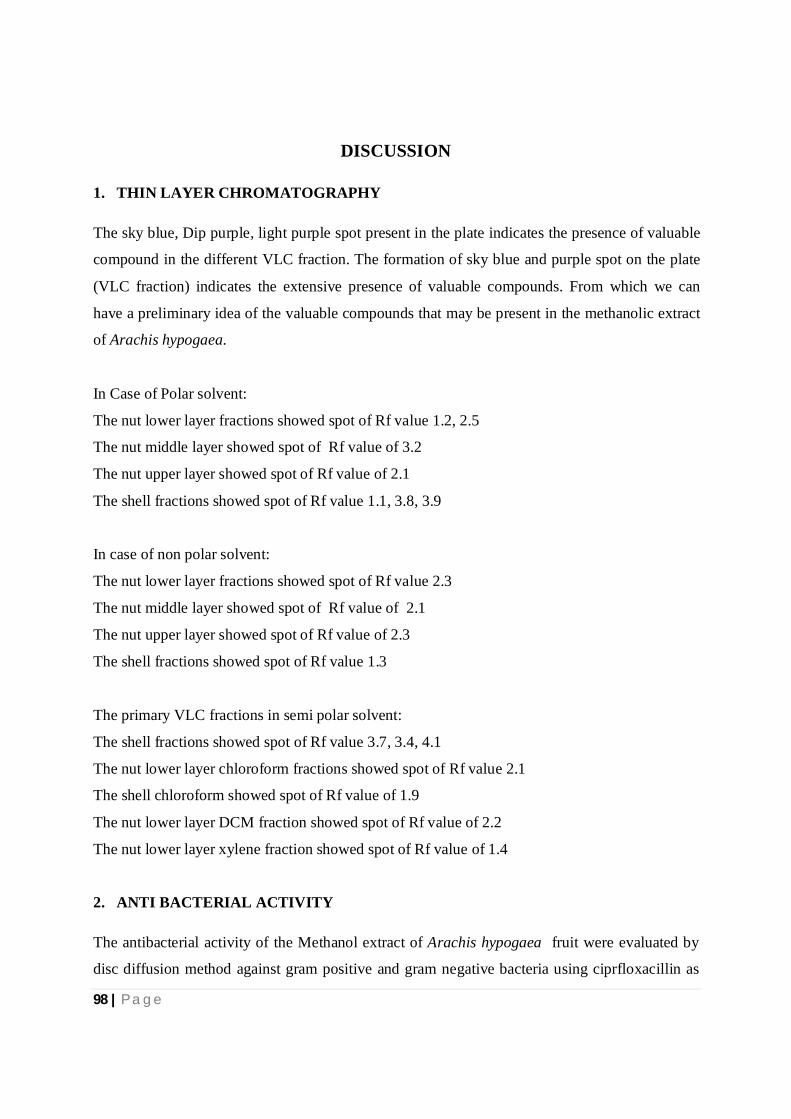
98 | P a g e
DISCUSSION
1. THIN LAYER CHROMATOGRAPHY
The sky blue, Dip purple, light purple spot present in the plate indicates the presence of valuable
compound in the different VLC fraction. The formation of sky blue and purple spot on the plate
(VLC fraction) indicates the extensive presence of valuable compounds. From which we can
have a preliminary idea of the valuable compounds that may be present in the methanolic extract
of Arachis hypogaea.
In Case of Polar solvent:
The nut lower layer fractions showed spot of Rf value 1.2, 2.5
The nut middle layer showed spot of Rf value of 3.2
The nut upper layer showed spot of Rf value of 2.1
The shell fractions showed spot of Rf value 1.1, 3.8, 3.9
In case of non polar solvent:
The nut lower layer fractions showed spot of Rf value 2.3
The nut middle layer showed spot of Rf value of 2.1
The nut upper layer showed spot of Rf value of 2.3
The shell fractions showed spot of Rf value 1.3
The primary VLC fractions in semi polar solvent:
The shell fractions showed spot of Rf value 3.7, 3.4, 4.1
The nut lower layer chloroform fractions showed spot of Rf value 2.1
The shell chloroform showed spot of Rf value of 1.9
The nut lower layer DCM fraction showed spot of Rf value of 2.2
The nut lower layer xylene fraction showed spot of Rf value of 1.4
2. ANTI BACTERIAL ACTIVITY
The antibacterial activity of the Methanol extract of Arachis hypogaea fruit were evaluated by
disc diffusion method against gram positive and gram negative bacteria using ciprfloxacillin as
99 | P a g e
standard. Different VLC fraction of Methanolic extract of Arachis hypogaea (pet ether,
cyclohexane, xylene, DCM, chloroform and methanol) shows varying degrees of antibacterial
activities with zone of inhibition ranging from 7-1.2 mm respectively, while the highest
antibacterial activity was seen against with, Bacillus cereus ,Vibrio mimicus ,Salmonella typhi
and E coli .
3. DPPH TEST
To evaluate the antioxidant activities of different fraction of methanolic extract of the Arachis
hypogae. DPPH Free Radical Scavenging Assay was used. DPPH reaction has been widely used
to test the ability of compounds to act as free-radical scavengers or hydrogen donors and to
evaluate the antioxidant activity of foods and plant extracts. DPPH is a stable free radical that
can accept an electron of hydrogen radical to become diamagnetic molecule. The reduction in
DPPH radical was determined by the decrease of its absorbance at 517 nm (in methanol) induced
by antioxidants (Ziying et.al. 2007).
Both nut lower layer and shell fractions of primary VLC fractions showed considerable anti
oxidant properties ranging from 86%-45% in varying degrees of the fraction. It should be noted
that the nut lower layer fractions showed a higher and better activity compared to the shell
fractions but both showed noteworthy activity. The shell fractions showed activity between 62%-
45% and the nut lower layer fractions showed activity ranging from 86%-44%
4. THIN LAYER CHROMATOGRAPHY OF LECTIN EXTRACT
The sky blue, Dip purple, light purple spot present in the plate indicates the presence of valuable
protine compound in the Lectin extract. In the plate of protein the Rf value of 1st spot = 0.7,2nd
spot = 0.9.3rd spot = 0.97 ,4th spot =0.5 and 5th spot=0.2 for shell lectin. In the nut lectin fraction
the Rf value of 1st spot = 0.3 ,2nd spot = 0.7.3rd spot = 0.8 ,4th spot =0.9.In the plate of
carbohydrate test the blue spot present, which Rf value of 1st spot =0.9 and 2nd spot =0.6 for
shell lectin and Rf value of 1st spot =0.6, 2nd spot =0.7, 3rd spot=0.8 .The formation of sky blue,
blue and purple spot on the plate indicates the extensive presence of valuable compounds. From
100 | P a g e
which we can have a preliminary idea of the valuable protein and Carbohydrate compounds that
may be present in the lectin extract of Arachis hypogaea.
5. IN VITRO ANTI-DIABETIC TEST
In the Glucose uptake in Yeast cells method the mechanism of glucose transport across the yeast
cell membrane has been receiving attention as in vitro screening method for hypoglycaemic
effect of various compounds / medicinal plants. Recent studies on the transport of non
metabolizable sugars and certain metabolizable glycosides suggest that sugar transport across the
yeast cell membrane is mediated by stereospecific membrane carriers. It is reported that in yeast
cells (Saccharomyces cerevisiae) glucose transport is extremely complex and it is generally
agreed that glucose is transported in yeast is by a facilitated diffusion process. Facilitated carriers
are specific carriers that transport solutes down the concentration gradient. This means that
effective transport is only attained if there is removal of intracellular glucose.
In our result, the nut lower layer fractions showed activity between 85%-54% at highest
concentration used. The shell samples showed activity between 78%-55% at the highest
concentrations used. As it can be seen that both show note worthy activity but if comparison is to
be made the nut lower layer obviously exhibit higher activity compared to the standard
6. HEMAGGLUTION INHIBITION INDUCED BY OF ARACHIS HYPOGAEA
PRIMARY VLC FRACTIONS
Many viruses attach to molecules present on the surface of RBCs. Hemagglutination inhibition
assay was performed to investigate the receptor binding affinity of the compounds present in the
pet ether, cyclohexane, xylene, dichloromethane, and chloroform and methanol VLC fractions of
Arachis hypogaea on human erythrocytes. The test was performed with erythrocytes of group
O+ and the samples were given at an amount of 4mg/ml with further serial dilution. The different
fractions of nut lower layer showed no signs of hemaglutination activity.

101 | P a g e
UNIT SEVEN: CONCLUSION
102 | P a g e
CONCLUSION
This review had shown that rind of Arachis hypogaea possesses numerous bioactivities from
natural source which is of better advantage than conventional therapies. The shell and nut lower
layer fractions possess greater antioxidant and anti diabetic activity. Its antibacterial property is
limited to the shell fractions with poor receptor binding activity
It is surprising to discover that a waste part of the peanut could prove to contain such bioactive
molecules that may prove to be useful. Till now the shell was considered a waste part of the nut.
Recent studies have revealed its used and an adsorbent or in the waste water treatment.
This thesis report has changed my view about the wonders of nature that lies within each
component of a plant.

103 | P a g e
UNIT EIGHT: REFERENCE
104 | P a g e
REFERNCE
Asibuo, J.Y. Akromah, Richard , Kantanka S., Osei, Dapaah A. ,Kofi H. , Dapaah D., Seth,
Agyeman, Adelaide (2008) Chemical composition of groundnut, Arachis hypogaea (L) African
Journal of Biotechnology, 7(13), 2203-2208 [online] Available at:
http://www.academicjournals.org/AJB [Accessed on 13th November 2015]
Anup Sadi (2012) A detailed study of Medicinal plants, Medicinal plants of Bangladesh [online]
Available at: http://anupsadi.blogspot.com/2012/12/medicinal-plants-of-bangladesh_24.html
[Accessed on 29th September 2015]
Asolkar, L.V.; Kakkar, K.K.; Chakre, O.J. (1992). Second Supplement to Glossary of Indian
Medicinal Plants with Active Principles. Part I (A-K) (1965-1981), CSIR, New Delhi, India.
[online] Available at: http://www.mpbd.info/plants/arachis-hypogea.php [Accessed on 29th
September 2015]
Batal A. l, Dale N., Cafe M. (2005) Nutrient Composition of Peanut Meal Department of Animal
Science, School of Veterinary University of Goia´s, Goiaˆnia, Brazil 74001-970 [online]
Available at: http://japr.oxfordjournals.org/content/14/2/254.full.pdf [Accessed on 13th
November 2015]
Botanical-online (2015) Peanut Properties [online] Available at: http://www.botani cal-
online.com/english/peanutproperties.htm# [accessed on 13th November 2015]
Cannell RJP. (1998). How to approach the isolation of a natural product, in Natural Products
Isolation. 1st ed. (Cannell, R. J. P., ed.), Humana Press, New Jersey, pp. 1-51.
ENCYCLOPEDIA BRITANICA (2015) Fabaceae [online] Available at:
http://global.britannica.com /plant/Fabaceae [Accessed on 3rd November 2015]
105 | P a g e
Ghani A. (1998) Present State-Of-The Art Of Traditional Medicine Practice In Bangladesh
Jahangirnagar University [online] Available at: http://www.itmrc.org/publication/ch_5.htm
[Accessed on 1st Nivember 2015]
Hemagglutination Assay (HA) and Hemagglutination Inhibition Assay (HI): AI and NDV.
(2006)[online] p.3. Available at: http://www.cfsph.iastate.edu/HPAI/resources/SOPs/HA_HI.pdf
[Accessed 6 Nov. 2015].
Hou Y., Hou Y., Yanyan L., Qin G., Li J. (2010). Extraction and purification of a lectin from red
kidney bean and preliminary immune function studies of the lectin and four Chinese herbal
polysaccharides. .J Biomed Biotechnol; 9:217-342.
Ingale S., Srivastava S.K, (2011) Nutritional study of new variety of groundnut (Arachis
hypogaea L.) JL-24 seeds, African Journal of Food Science 5(8), pp. 490 – 498 [online]
Available at: http://www.acade mic journals.org/journal/AJFS/article-full-text-pdf/594849A9689
[Accessed on 3rd November 2015]
Iman A.,Farag A.,Ahmed A., Zahran (2014) Groundnut (Arachis hypogaea L.) growth and yield
responses to seed irradiation and mineral fertilization, IOSR Journal of Agriculture and
Veterinary Science, 7(5-3),63-70 [online] Available at: http://iosrjournals.org/iosr-
javs/papers/vol7-issue5/Version-3/J07536370.pdf [Accesseed on 13th November 2015]
Jaishankar, M. , Mathew, B. B. , Shah, M. S. , T.P., K. M. , & K.R., S. G. (2014) Biosorption of
Few Heavy Metal Ions Using Agricultural Wastes. Journal of Environment Pollution and
Human Health 2(1), 1-6 [online] Available at: http://pubs.sciepub.co m/jephh/2/1/1/# [Accessed
on 20th November 2015]
Kar, B., Kumar, R., Karmakar, I., Dolai, N., Bala, A., Mazumder, U. and Haldar, P.
(2012).Antioxidant and in vitro anti-inflammatory activities of Mimusopselengi leaves. Asian
Pacific Journal of Tropical Biomedicine, 1:5978.
Lewis, J. D. (2012). 15.3b Natural Product Screening- Anti-oxidant screen of extract Crude
Extract, 2nd ed. [ebook] p.1. Available at: https://courses.cns.utexas.edu/.../15.3b-Natural-
Product-Screening-Anti-oxidant Properties [Accessed on 20th Jul. 2015].
106 | P a g e
Lewis W.E., Harris G.K. , Timothy H.s., Brittany L.W. , Lisa L.D. (2013) Antioxidant and Anti-
Inflammatory Effects of Peanut Skin Extracts, Food and Nutrition Sciences 4:22-32 [online]
Available at: https://www.google.com.bd/url?sa=t&rct=j&q=&esrc=s&source=web&cd=1&cad
=rja&uact=8&ved=0ahUKEwjnJiA77rJAhXQno4KHcjCCM0QFggfMAA&url=http%3A%2F%
2Fwww.scirp.org%2Fjournal%2FPaperDownload.aspx%3FpaperID%3D35240&usg=AFQjCNG
YFlmd53D6Yfm_a5cIXoz1x0ZXuA&sig2=dOGieB43_MvAZFRwm6bfCA&bvm=bv.1081940
40,d.c2E [Accessed on 1st December 2015]
Mandloi S.,Radadia B.B., Visavadia M., Vaghela A. (2014) A Review Of Chemical
Characteristics (acid Value And Iodine Value) Of Peanut Oil, Weekly Science Research Journal
1(30) [online] Available at: http://www.weeklyscience.org/UploadedArticle/69.pdf [Accessed on
1st December 2015]
MedicinalPlants (no date) Arachis Ahpogaea L [online] Available at: http://www.mpbd.info/p
lants/arachis-hypogea.php [Accessed on 29th September 2015]
Mishra, A., Kavrekar, V. and S.Nair, S. (2013).Evaluation of In Vitro Anti diabetic Activity of
Selected Plant Extracts, .International Journal of Pharmaceutical Science Invention, 12(4),
pp.12-19.
Newman DJ and Cragg GM. (2007). Natural products as sources of new drugs over the last 25
years. J Nat Prod. 70: 461-477.
Orgchem.colorado.edu, (2015). Thin Layer Chromatography (TLC). [online] Available at:
http://orgchem.colorado.edu/Technique/Procedures/TLC/TLC.html [Accessed 20 Jul. 2015].
Rahman DMA. (2007) Conservation of Medicinal Plants in Bangladesh. Forestry and Wood
Technology Discipline, Khulna University,Khulna.
Rahman, A.H.M. Mahbubur (2013) Ethno-botanical Survey of Traditional Medicine Practice for
the Treatment of Cough, Diabetes, Diarrhea, Dysentery and Fever of Santals at Abdullahpur
Village under Akkelpur Upazilla of Joypurhat District, Bangladesh, Biomedicine and
107 | P a g e
Biotechnology 1(2): 27-30 [online] Available at: http://pubs.sciepub.com/bb/1/2/6/# [Accessed
on 1st November 2015]
Ross E. (2010) Review Health Benefits of Nut Consumption, Nutrients [online] Available at:
www.mdpi.com/journal/nutrients [Accessed on 1st December 2015]
Sadi A. (2012) Prankakoli, Medicinal Plants of Bangladesh [online] Available at:
http://anupsadi.blogspot.com/2012/12/medicinal-plants-of-bangladesh_24.html [Accessed on 3rd
November 2015]
Sim. W. E., Lai. Y. S, Chang. P. Y, (2012), Antioxidant capacity, nutritional and phytochemical
content of peanut (Arachis hypogaea L.) shells and roots, African Journal of Biotechnology
11(53) [online] available at: http://www.academicjournals.org/article/article138081327
8_Sim%20et%20al.pdf [Accessed on 29th September 2015]
SobolevV.S., Khan I.S., Tabanca N.,Wedge D.E..,Manly S.P.,Cutle J.S., Coy M.R., Becnel J.J,
Neff S.A., Gloer J.B. (2011) Biological Activity of Peanut (Arachis hypogaea) Phytoalexins and
Selected Natural and Synthetic Stilbenoids, Journal Of Agricultural And Food Chemistry,
59:1673-1682 [online] Available at: http://www.afpmb.org/sites/default/files/pubs/dwfp/publicat
ions/FY11/2011%20Peanut-JAFC.pdf [Accessed on 1st December 2015]
USDA PLANTS (2015) Arachis hypogea L. [online] Available at: http://www.itis.gov/servlet/Si
ngleRpt/SingleRpt?search_topic=TSN&search_value=26463 [Accessed on 1st November 2015]
USDA (2015) National Nutrient Database for Standard Reference Release 2 United States
Department of Agricultural Research Service [online] Available at: http://ndb.nal.usda.gov/ndb/
foods/show/4808?fg=&man=&lfacet=&count=&max=&sort=&qlookup=&offset=&format=Full
&new=&measureby= [Accessed on 10th November 2015]
Pankaj, k. (2015).Methods for Rapid Virus Identification and Quantification.Labome [online]
Available at: http://www.labome.com/method/Methods-for-Rapid-Virus-Identification-and-
Quantification.html [Accessed 6 Nov. 2015].
108 | P a g e
Saha R.K., Acharya S., JamiruddinM. ,RoyP. , IslamS.M.,Shovon S.S.H. .(2014). Antimicrobial
effects of a crude plant lectin isolated from the stem of Tinospora tomentosa. The Journal of
Phytopharmacology; 3 (1), 44-51.