The genus Bridelia: A phytochemical and ethnopharmacological review
Upload
khangminh22Category
view
1download
0
Version approved during the meeting of Deans held during 29-30 Nov 2013
Impact of radiation processing on some
phytochemical constituents of selected Indian vegetables and their products
By
JYOTI TRIPATHI
CHEM01200904006
Bhabha Atomic Research Centre, Mumbai
A thesis submitted to the
Board of Studies in Chemical Sciences
In partial fulfillment of requirements
for the Degree of
DOCTOR OF PHILOSOPHY
of
HOMI BHABHA NATIONAL INSTITUTE
February, 2015

Version approved during the meeting of Deans held during 29-30 Nov 2013
STATEMENT BY AUTHOR
This dissertation has been submitted in partial fulfillment of requirements for an
advanced degree at Homi Bhabha National Institute (HBNI) and is deposited in the
Library to be made available to borrowers under rules of the HBNI.
Brief quotations from this dissertation are allowable without special permission,
provided that accurate acknowledgement of source is made. Requests for permission
for extended quotation from or reproduction of this manuscript in whole or in part
may be granted by the Competent Authority of HBNI when in his or her judgment the
proposed use of the material is in the interests of scholarship. In all other instances,
however, permission must be obtained from the author.
Jyoti Tripathi

Version approved during the meeting of Deans held during 29-30 Nov 2013
DECLARATION
I, hereby declare that the investigation presented in the thesis has been carried out by
me. The work is original and has not been submitted earlier as a whole or in part for a
degree / diploma at this or any other Institution / University.
Jyoti Tripathi

Version approved during the meeting of Deans held during 29-30 Nov 2013
Dedicated to “The Almighty”

Version approved during the meeting of Deans held during 29-30 Nov 2013
ACKNOWLEDGEMENTS
My heartiest gratitude for the Almighty, who made me to see this day! This
dissertation is the result of efforts from several people. First and foremost, I would
like to express my sincere gratitude to my thesis advisor Dr. P. S. Variyar for his
continuous support to my work, patience, encouragement, and immense knowledge.
Without his supervision and constant support this project would not have been
possible. It is also my great pleasure to thanks Dr. A. K. Sharma (former Head, FTD)
and Dr. S. P. Kale, Head, FTD, for their encouragement and support.
I would like to express my gratitude to the members of my doctoral committee, Dr. S.
Chattopadhyay, Dr. K. I. Priyadarsini and Dr. S. Banerjee for their generous support
and constructive suggestions. I also owe a great debt of gratitude to my collaborators
Dr. S. Jamdar, Dr. S. K. Ghosh, Dr. A. K. Bauri, and Dr. T. R. Ganapathi for their
help and fruitful discussions during the course of the work.
My heartiest gratitude and thanks are due to my colleagues and friends in FFACS Dr.
S. Chatterjee, Sumit Gupta, Jasraj, Vanshika, Prashant, Rupali, Vivekanand, Snehal,
Aparajita, Chaturbhuj and Sarver for their companionship, invaluable help and
motivation throughout the work, which kept me going.
I would like to thank my parents and parents-in-law, for their unconditional love,
support, faith, encouragement and confidence in me. They have been my driving force
and inspiration in all pursuits of life. I would also like to thank my sisters-in-law and
brothers for constant encouragement and support. I run short of words in expressing
my gratitude towards my beloved life partner Rahul, who acted as an anchor in all the
waves of hardships. Finally, I would take this opportunity to thank all my teachers,
who made me what I am today.
Jyoti

i
CONTENTS
CONTENTS Page No.
SYNOPSIS ix-xx
LIST OF FIGURES xxi-xxv
LIST OF TABLES xxvi-xxix
Table of Contents
Chapter 1. Introduction…………………………………………………...........1-67
1. Importance of vegetables in the diet 2
1.2. Minimal processing of vegetables 5
1.2.1. Microbial spoilage 7
1.2.2. Appearance and color 8
1.2.3. Texture 10
1.2.4 Flavor (taste and aroma) 12
1.2.4.1. Taste 12
1.2.4.2. Aroma constituents 13
1.2.5. Nutritional value 17
1.2.5.1. Carotenoids 17
1.2.5.2. Phenolics 19
1.2.5.2.1. Flavonoids 19
1.2.5.2.2. Phenolic acids 22

ii
1.2.5.3. Glucosinolates 23
1.2.5.4. Triterpenoids 25
1.3. Quality measurement of fresh-cut produce - Sensory and
instrumental measurements
27
1.3.1. Sensory methods of quality measurement 27
1.3.2. Instrumental methods of quality measurement 29
1.3.2.1. Color 30
1.3.2.2. Texture 32
1.3.2.3. Flavor- Aroma and Taste 33
1.3.3 Analysis of bioactive phytochemicals 40
1.4 Different methods for preservation of fresh-cut produce 41
1.4.1 Chemical preservatives 42
1.4.2. Physical methods of preservation 43
1.4.2.1. Radiation Processing 44
1.4.2.2. Advantages of Radiation Processing 47
1.4.2.3. Effect of gamma irradiation on shelf-life of RTC vegetables 48
1.4.2.4. Microbial status of irradiated RTC vegetables 49
1.4.2.5. Effect of radiation processing on phytochemicals 50
1.5. Vegetables selected for the present work 52
1.5.1. Ash gourd (Benincasa hispida) 52
1.5.2. Drumstick (Moringa oleifera) 56
1.5.3. Pumpkin (Cucurbita pepo) 61

iii
1.6. Scope of the work - Aims and objectives 65
Chapter 2. Materials and methods…………………………………………69-108
2.1. Materials 70
2.1.1. Plant material 70
2.1.2. Chemicals and materials 70
2.2. Methodology 71
2.2.1. Development of ready-to-cook (RTC) vegetables using
radiation processing
71
2.2.1.1. Preparation of RTC vegetables 71
2.2.1.2. Radiation processing and storage 72
2.2.1.3. Optimization of quality parameters 72
2.2.2. Characterization of the developed products at optimized
parameters
76
2.2.2.1. Nutritional quality 76
2.2.2.2. Aroma quality 78
2.2.2.2.1. Isolation and identification of free aroma compounds 78
2.2.2.2.2. Isolation and identification of bound aroma precursors 82
2.2.2.2.3. Chemometric analysis of the aroma data 86
2.2.2.2.4. Identification of aroma impact compounds 86
2.2.2.3. Headspace gas composition inside packages 89
2.2.2.4. Gamma irradiation induced browning inhibition 89
2.2.2.4.1. Isolation and identification of phenolic compounds 89

iv
2.2.2.4.2. Effect of radiation processing on enzymes involved in
browning
90
2.2.2.4.3. Scanning Electron Microscopic (SEM) analysis 93
2.2.2.4.4. Electrolytic leaching 93
2.2.2.4.5. Statistical analysis 93
2.2.3. Isolation, identification and studying the effect of radiation
processing on bioactive phytochemicals
94
(A) Ash gourd
2.2.3.1. Compounds with plant growth promoting activities 94
2.2.3.1.1. Preparation of ash gourd extracts 94
2.2.3.1.2. Activity Guided Fractionation 95
2.2.3.1.3. Structure Identification 97
2.2.3.1.3.1. Spectral Studies 97
2.2.3.1.3.2. Chemical synthesis of acetoin glucoside 98
2.2.3.1.4. Growth promotion assay of purified acetoin glucoside 99
2.2.3.1.5. Protein Extraction and Two-Dimensional Gel Electrophoresis 99
2.2.3.1.6. Mass Spectrometric analysis and Database Searching 100
2.2.3.1.7. Statistical Analysis 100
2.2.3.2. Compounds with ACE inhibition activity 100
2.2.3.2.1. Preparation of ash gourd extracts 100
2.2.3.2.2. Preparation of enzyme extract 101
2.2.3.2.3. ACE inhibition assay 101

v
2.2.3.2.4. Activity guided fractionation and identification of active
principles
102
(B) Pumpkin 103
2.2.3.3. Isolation and identification of phenolic constituents 103
2.2.3.4. Isolation and identification of carotenoids 103
2.2.3.5. Isolation and identification of triterpenes 104
(C) Drumstick
2.2.3.6. Isolation, identification and quantification of phenolic
constituents
106
2.2.3.7. Isolation and identification of glucosinolates 106
Chapter 3. Results and discussion……………………………………….109-274
3.1. Development of radiation processed shelf stable RTC
vegetables
110
3.1.1. Optimization of radiation dose and storage period with
mathematical modeling
110
3.1.1.1. Microbial quality 120
3.1.1.2. Color 125
3.1.1.3. Texture 128
3.1.1.4. Sensory acceptability 131
3.1.1.5. Optimization and verification of results 133
3.2. Characterization of the developed RTC products 137
3.2.1. Sensory quality evaluation by Quantitative Descriptive 138

vi
Analysis (QDA)
3.2.2. Nutritional quality 141
3.2.2.1. DPPH Radical scavenging activity 142
3.2.2.2. Total phenolic and flavonoid content 144
3.2.2.3. Vitamin C content 147
3.2.3. Headspace gaseous composition 150
3.2.4. Aroma quality - chemical analysis of free and bound aroma
compounds and identification of key odorants
153
3.2.4.1. Ash gourd 155
3.2.4.1.1. Free aroma analysis 155
3.2.4.1.2. Bound aroma analysis 160
3.2.4.1.3. Identification of key odorants 166
3.2.4.2. Drumstick 171
3.2.4.2.1. Free aroma analysis 171
3.2.4.2.2. Bound aroma analysis 176
3.2.4.2.3. Identification of key odorants 182
3.2.4.3. Pumpkin 188
3.2.4.3.1. Free aroma analysis 188
3.2.4.3.2. Bound aroma analysis 195
3.2.4.3.3. Identification of key odorants 201
3.2.5. Effect of radiation processing on free and bound aroma
profiles of the selected vegetables
204

vii
3.2.6. Gamma irradiation induced browning inhibition 218
3.2.6.1. Evaluation of parameters responsible for browning 219
3.2.6.1.1. Electrolytic leaching 219
3.2.6.1.2. Changes in micro-structure 221
3.2.6.1.3. Evaluation of enzyme activities 222
3.2.6.1.4. Analysis of phenolic constituents 225
3.2.6.1.5. Correlations between various factors contributing in browning
inhibition
227
3.2.6.1.6. Role of α-resorcylic acid in inhibition of ash gourd PPO -
Kinetics studies
228
3.3. Isolation, identification of bioactive constituents and
determining their changes during radiation treatment
232
3.3.1. Ash gourd 232
3.3.1.1. Plant growth promoting activity 233
3.3.1.1.1. Isolation and identification of Plant Growth Regulating
Compound
233
3.3.1.1.2. Growth Promotion Studies 235
3.3.1.1.3. Identification of differentially expressed protein in acetoin
glucoside treated tobacco leaf discs
239
3.3.1.2. Angiotensin converting enzyme (ACE) inhibition activity 242
3.3.1.2.1. Activity guided fractionation 243
3.3.1.2.2. Isolation and identification of active principles 244

viii
3.3.2. Cucurbitacins in pumpkin 248
3.3.2.1. TLC analysis 249
3.3.2.2. Identification of cucurbitacins 252
3.3.3. Glucosinolates in drumstick 256
3.3.3.1. Isolation and identification of glucosinolates and
isothiocyanates
257
3.3.4. Isolation, identification and quantification of phenolic
constituents and carotenoids
263
3.3.4.1. Ash gourd 265
3.3.4.2. Drumstick 266
3.3.4.3. Pumpkin 267
3.3.4.3.1. Identification and quantification of phenolic constituents 267
3.3.4.3.2. Identification and quantification of carotenoids 269
3.4. Conclusions 271
Chapter 4. Summary…………………………………………………………..275-279
References……………………………………………………………………...280-315
List of Publications 316-318

ix
SYNOPSIS
Vegetables are vital components of a healthy diet and provide essential nutrients and
bioactive phytochemicals. There are evidences that diets rich in vegetables can decrease
the levels of chronic diseases including cancer [1, 2]. Vegetables possess high
antioxidant properties that are imparted by bioactive compounds. These compounds
present in them protect bio-molecules from oxidative damage, thus playing a major
health protective role.
In recent years there has been an increase in demand for convenience foods such as
ready-to-cook (RTC) vegetables by consumers. Low shelf life of majority of these
products, however, restricts their marketability. Apart from microbial safety,
maintenance of fresh-like characteristics is the main criteria determining consumer
acceptability of the product. Various post-harvest processing techniques are currently
available that can kill pathogens while retaining fresh attributes of the produce.
Radiation processing is a promising technology for improving the shelf life of fresh-cut
produce. Treatment of food products by ionizing radiation is a physical process
involving direct exposure to electromagnetic γ-rays, X-rays or electron beam for
improvement in food safety and shelf life. It is a non-thermal technology that effectively
eliminates food-borne pathogens in various foods, including fresh vegetables without
compromising the nutritional properties or sensory qualities of food [3] Gamma
radiation being ionizing in nature causes radiolysis of water thereby producing reactive
hydroxyl radical. These radicals are extremely reactive and attack and damage cellular
components, especially DNA. Due to damage to genetic material there is inhibition in

x
microbial growth, thus inactivating microorganisms [4]. Unlike typically processed
foods, fresh-cut products consist of living tissues and post harvest processing treatments
including irradiation can act as stress bringing about change in post harvest physiology
of the product. The critical factors affecting consumer acceptability include microbial
and sensory quality (color, texture, flavor /aroma). Apart from the sensory attributes, the
bioactive constituents such as phenolic constituents, carotenoids etc. are mainly
responsible for the beneficial effects of vegetables. Existing literature suggests an
increased extractability and bioavailability of bioactive constituents as a result of
radiation processing [5]. An enhanced breakdown of bound precursors including aroma
and phenolic glycosides has also been reported. It can therefore be inferred that radiation
processing can enhance aroma by hydrolyzing aroma glycosides, increase total phenolics
and thus antioxidant capacity, while bringing about microbial decontamination of food
products. Ash gourd (Benincasa hispida), drumstick (Moringa oleifera) and pumpkin
(Cucurbita pepo) are traditional Indian vegetables used in Indian cuisine. These
vegetables have recently been marketed as RTC products due to the convenience they
offer. No reports exist so far on the impact of radiation processing on the above
vegetables or their RTC products. The present thesis aims at developing radiation
processed RTC products of the above vegetables with improved shelf-life and
understanding changes in bioactive compounds and their precursors during such a
treatment.
Chapter 1 of the thesis introduces the subject of food irradiation with special emphasis
on irradiation of minimally processed fresh-cut vegetables and describes the scientific

xi
literature related to the present work. Based on the review of available literature, it was
found that radiation processing leads to microbial decontamination thereby improving
the shelf-life of fresh-cut fruits and vegetables. It can also lead to increased contents of
various bioactive principles, mainly responsible for the beneficial effects of vegetables.
However, very few reports have dealt with the impact of radiation processing on the
postharvest quality of vegetables of Indian origin. The chapter provides general
information on vegetables with special reference to ash gourd, drumstick and pumpkin,
the three most widely used Indian vegetables. The current information on the chemical
aspects of these vegetables and general methods of isolation and identification of
chemical constituents, in particular, the bioactive constituents are detailed. Commonly
used methods for isolation and identification of aroma constituents of vegetables and
their quantification using instrumental methods such as GC/MS, HPLC are also
discussed.
Chapter 2 of the thesis describes the materials and experimental methods. The vegetable
samples of ash gourd, drumstick and pumpkin were obtained from local growers in and
around Mumbai, India. Irradiation was carried out using a food package irradiator (GC
5000, Board of Radiation and Isotope Technology, India) at BARC, Mumbai.
Gamma irradiation was used for shelf-life extension of RTC vegetables. Sensory quality
was assessed by a sensory panel through hedonic testing. Color was evaluated by
colorimeter and texture through texture analyzer according to the standard protocols.
Nutritional parameters like vitamin content, total phenolic content and antioxidant
properties were studied according to standard AOAC protocols. Activities of different

xii
enzymes were assayed as per reported spectrophotometric methods. The non-volatile
constituents that included phenolic acids, carotenoids and triterpenes were studied by
TLC and HPLC analysis.
Likens-Nikersons simultaneous distillation extraction (SDE) apparatus and solid phase
microextraction (SPME) techniques were used for isolation of free aroma volatiles.
Aroma glycosides were extracted using XAD and solid phase extraction (SPE) using C-
18 reverse phase cartridges. The total ion current obtained from SPME (for free aroma)
and SPE (for bound aroma) was further processed using chemometrics (PCA) for
analyzing the effect of radiation treatment on aroma constituents.
Chapter 3 deals with the results and discussion. It has been divided into following
subsections.
3.1. Development of radiation processed shelf-stable RTC products: Preliminary
screening of vegetables was done based on the feasibility of gamma irradiation for shelf-
life improvement. Effect of radiation processing (0.5-2.0 kGy) on the shelf life of five
RTC vegetables, namely ash gourd (Benincasa hispida), pumpkin (Cucurbita pepo),
bottle gourd (Lagenaria siceraria), lady finger (Abelmoschus esculentus) and drumstick
(Moringa oleifera) were studied when stored at 10 °C. In the case of ready-to-cook
(RTC) ash gourd, pumpkin and drumstick, radiation processed samples were acceptable
up to storage duration of 10-25 d depending on the vegetable and radiation dose
delivered. Cut bottle gourd pieces developed browning/ blackening after a few minutes
of cutting making them unacceptable. In case of ladies finger, the treated and untreated
samples were acceptable only up to a storage period of 1-2 d, beyond which increased

xiii
sliminess and off odor in the radiation treated samples restricted their acceptance. Ash
gourd, drumstick and pumpkin were therefore selected for the development of radiation
processed shelf-stable products. The data obtained for microbial analysis, color, texture
and sensory acceptability (hedonic analysis) were separately fitted in cubic polynomial
equations for each vegetable. Optimum radiation dose and storage period for each
product was determined by solving the model equations using criteria (total mesophilic
counts < 5 log CFU/g; overall sensory acceptability > 5 with minimum change in color
and texture). For ash gourd, optimum solution was a shelf life of 12 d at a radiation dose
of 2 kGy, while for drumstick and pumpkin, the optimum parameters were a shelf life of
12 and 21 d respectively at a radiation dose of 1 kGy.
3.2. Characterization of the developed products: The radiation processed products
were characterized for various physical and chemical parameters important for consumer
acceptability. Sensory analysis by quantitative descriptive analysis (QDA) indicated that
radiation processed products possessed excellent sensory quality at the end of intended
storage period. An appreciable increase in DPPH radical scavenging activity was
observed as a result of radiation treatment in all the three vegetables which was linearly
correlated with increase in total phenolic and flavonoid contents.
Vegetables impart characteristic flavor (aroma and taste) to the cuisine. In the green
form, aroma of majority of the vegetables is indistinguishable from each other. Cooking
results in liberation of their characteristic aroma from their precursors. Very few reports
however exist on the nature of these precursors in vegetables, particularly of Indian
origin. The free and glycosidically bound aroma compounds of ash gourd, drumstick and
xiv
pumpkin were studied. Despite of the presence of several volatile aroma compounds in a
food matrix, not all of them are responsible for the characteristic odor of a food product.
Therefore there is a great interest in determining the contribution of each constituent
towards the overall flavor of a product. Key odorants of each vegetable were therefore
characterized. GC-O analysis of the aroma extracts was successfully employed for the
identification of key odorants in the vegetables studied. Acetoin, octanal and nonanal in
ash gourd; benzothiazole, decanal and 2E-decenal in drumstick and a combination of 6Z-
nonenal and 2E, 6Z-nonadienal in case of pumpkin were identified as the key odorants
responsible for the characteristic aroma. Further, the effect of radiation processing and
storage on aroma composition was examined. The GC/MS data obtained for free and
bound aroma was subjected to Principal Component Analysis (PCA) for each vegetable
separately. PCA is an unsupervised technique which is used for dimensionality reduction
of multivariate data sets and allows visualization of complicated data for easy
interpretation [6]. To know the nature of the constituents responsible for the differences
among control and radiation processed samples of different days, factor loading data was
analyzed. Contents of alcohols increased in response to radiation processing and storage
in ash gourd and pumpkin which could be attributed to the radiolytic breakdown of their
corresponding glycosidic precursors. Contents of major carbonyl compounds decreased
with radiation processing and storage in ash gourd, while a significant increase in the
content of hexanal and trans-2-hexenal was observed in radiation processed drumstick.
The increase in aldehyde contents could be attributed to radiation induced lipid
radiolysis resulting in release of linolenic acid and its subsequent conversion to

xv
aldehydes via lipoxygenase (LOX) pathway. On the other hand, conversion of aldehydes
to corresponding branched chain alcohols and subsequently to esters could be the reason
for decreased contents of aldehydes in ash gourd.
A considerable difference in the effect of radiation processing on the content of
glycosidic precursors was observed among the three vegetables studied. Two types of
radiation effects were observed. Decrease in the content of these precursors was noted in
ash gourd and pumpkin, while the contents increased in irradiated drumstick. Both
radiation induced increased extractability and degradation was observed. It can be
concluded that both these changes can occur simultaneously and independent of each
other. Despite the changes in the content of some of the aroma compounds during
storage and radiation processing as noted instrumentally and statistically, they were not
sufficient to be observed by the sensory panel. Hence the radiation processed product
developed, had good sensory acceptability at the end of storage period.
Gamma-radiation (2 kGy) induced inhibition of browning in RTC ash gourd stored
(10°C) up to 12 d was further investigated. In the control samples, phenylalanine
ammonia lyase (PAL) activity increased during storage that could be linearly correlated
with enhanced quinone formation and browning. Radiation treatment resulted in a
significant increase in the content of alpha resorcylic acid, a known PPO inhibitor. The
decreased PPO activity was thus correlated with the increased content of this acid in
irradiated samples. The kinetic parameters of α-resorcylic acid inhibition were
determined using Linweaver-Burk plots. The nature of inhibition was found to be mixed
and reversible type. No significant change was observed in peroxidase activity. So

xvi
browning inhibition in radiation processed (2 kGy) RTC ash gourd during storage could
be a synergistic effect of decreased quinone formation and enzyme (PPO and PAL)
activities.
3.3. Isolation, identification of bioactive phytochemicals and determining their
changes during radiation processing
3.3.1. Ash gourd
3.3.1.1. Plant growth promoting activity: The ash gourd waste (peel and seeds) has
been traditionally used as a green manure for increasing the soil nutrients while shelled
seeds are reported to have anabolic properties that promote tissue growth. The vegetable
extract was therefore screened for the bioactive principles responsible for the plant
growth promoting activity. Ash gourd juice was fractionated with solvents of different
polarities (ether, ethyl acetate and n-butanol) and the butanol fraction was analyzed by
TLC and HPLC. The major compound in this fraction was purified by preparative TLC
and identified as acetoin glucoside based on NMR and mass spectral studies as well as
by chemical synthesis. In vitro treatment by soaking tobacco leaf discs in MS liquid
medium containing different concentrations of this compound in the range of 0.044-0.88
mg resulted in a significant increase in the diameter of leaf discs. At an optimum
concentration of 0.176 mg, the diameter of leaf discs increased to 1.13 cm compared to
0.6 cm in control. Two dimensional gel electrophoresis of the proteins isolated from the
untreated and acetoin glucoside treated tobacco leaf discs revealed the expression of a
new protein in the treated samples. This was identified as a Ras related nuclear GTPase
or Ran protein, a very important regulatory protein, by peptide mass finger printing. The

xvii
study demonstrated for the first time the role of acetoin glucoside as the compound
responsible for the tissue growth regulating properties of the vegetable. The content of
acetoin glucoside, the active principle, remained unaffected in radiation-treated ash
gourd. Thus the plant growth activity was maintained in the irradiated samples.
3.3.1.2. Angiotensin converting enzyme (ACE) inhibition activity: The juice of ash
gourd is recommended to patients suffering from heart ailments and high blood pressure.
The ash gourd juice was fractionated with solvents of different polarity (ether, ethyl
acetate and water) and each of them was screened for ACE inhibition activity by an
enzymatic assay using hippuryl-histidine-leucyl as substrate. The aq extract obtained
from non-irradiated control and irradiated ash gourd at a concentration of 50 mg/mL
exhibited 47 % and 41 % ACE inhibition respectively. This extract was purified by RP-
HPLC and further by gel filtration. The molecular weight of the active fraction as
determined by GPC was 323 Da. The purified fraction showed a UV absorbance at 220
and 254 nm. Mass spectral analysis showed the presence of amino acids viz. alanine
(M+, 89) and valine (M+, 117) in this fraction. This confirms the presence of a small
peptide comprising of these amino acids as the active principle. However, the compound
requires further characterization which is under progress. The ACE inhibition activity of
the ash gourd however remained unaffected due to irradiation.
3.3.2. Triterpenes in pumpkin: Cucurbita glycosides from pumpkin were isolated by
extracting with methanol and further purified by preparative TLC. The isolated
compounds were subjected to HPLC, where the peak at retention time 4.27 was
tentatively identified as cucurbitacin E glucoside. The total extract was enzymatically

xviii
hydrolyzed as well as acetylated and then subjected to GC/MS analysis. The mass
fragmentation of the identified peaks was compared with that of cucurbitacins reported
in literature. Based on this data, two major compounds were identified as Cucurbitacin C
and E. Thus based on the HPLC analysis of total extract and GC/MS analysis of
enzymatically hydrolyzed and acetylated extract the major triterpenes identified were
glycosides of Cucurbitacin C and E. Estimation of the active principles in control and
irradiated pumpkin by densitometer indicated a significant (p < 0.05) decrease in their
contents during storage. Increase in activity of hydrolytic enzymes such as glycosidase
and pectinase during storage in fruits and vegetables has been reported [5]. This could
account for the decrease in contents of these compounds during storage. However, the
contents of identified active principles were unaffected due to radiation processing.
3.3.3. Glucosinolates in drumstick: Effect of radiation treatment (1 kGy) on bioactive
glucosinolates in drumstick was investigated. Food processing methods result in their
hydrolysis and various breakdown products are formed which are generally identified
using GC/MS. Among breakdown products, isothiocyanates (ITCs) have the highest
biological activity. They have been reported to possess broad-spectrum antimicrobial
activity against bacterial, fungal pathogens and insects [7, 8] and possess potent
anticarcinogenic activity. Major isothiocyanates identified in drumstick were isopropyl
isothiocyanate (4.38 ng/g), 2-butyl isothiocyanate (1.99 ng/g) and isobutyl
isothiocyanate (2.35 ng/g). The content of all the three isothiocyanates increased in
response to radiation processing (1 kGy) with a 2-3 times higher content in radiation-
treated samples at the end of storage as compared to the respective non-irradiated

xix
samples. The observation suggests an improved nutraceutical value of the vegetable by
radiation processing.
3.3.4. Isolation, identification and quantification of phenolic constituents and
carotenoids: The phenolic constituents of all the three vegetables were extracted with
methanol and subjected to HPLC-DAD analysis. Syringic, chlorogenic and α-resorcylic
acid were identified as major phenolic constituents in ash gourd; protocatechuic, p-
hydroxybenzoic, vanillic acid and quercetin in drumstick while pumpkin was
characterized with the presence of gallic, caffeic, o-coumaric acid and kaempferol.
Detailed analysis revealed that radiation processing resulted in increased extraction of
phenolic constituents in ash gourd, while no significant effect of radiation processing
was observed on the phenolic constituents of drumstick and pumpkin.
Pumpkin is a good source of carotenoid pigments. Apart from imparting color, they act
as antioxidants and enhancers of the immune response. The carotenoids of pumpkin
were extracted in hexane and analyzed by HPLC-DAD. The major carotenoids identified
were lutein and β-carotene. The contents of both the constituents remained unaffected in
response to the radiation treatment. To the best of our knowledge, this study
demonstrates for the first time the effect of radiation processing on shelf life
improvement and on the phytochemical constituents of RTC ash gourd, drumstick and
pumpkin.
Finally the achievements of these studies will be highlighted in the conclusion section
that will follow chapter 3.

xx
References
1. Steinmetz, K. A. & Potter, J. D. (1991). ‘Vegetables, fruits and cancer. I:
Epidemiology’, Cancer Causes Control, 325–57.
2. Steinmetz, K. A. & Potter, J. D. (1991). ‘Vegetables, fruits and cancer. II:
Mechanisms’, Cancer Causes Control, 427–42.
3. Niemira, B. A. & Fan, X. (2006). Low-dose irradiation of fresh-cut produce: safety,
sensory, and shelf life. In: Food irradiation research and technology. Editors: Sommers,
H. S. and Fan, X. Blackwell Publishing, U.S.A. pp.169– 184.
4. Arvanitoyannis, I. S., Stratakos, A. C., & Tsarouhas, P. (2009). Irradiation
applications in vegetables and fruits: a review. Critical reviews in food science and
nutrition, 49(5), 427-462.
5. Alothman, M., Bhat, R., & Karim, A. A. (2009). Effects of radiation processing on
phytochemicals and antioxidants in plant produce. Trends in food science & technology,
20(5), 201-212.
6. Eriksson, L., Johansson, E., Kettaneh-Wold, N., & Wold, S. (2001). Multi-and
megavariate data analysis: principles and applications. Umetrics.
7. Lin, C. M., Kim, J., Du, W. X., & Wei, C. I. (2000). Bactericidal activity of
isothiocyanate against pathogens on fresh produce. Journal of Food Protection, 63(1),
25-30.
8. Wittstock, U., Kliebenstein, D. J., Lambrix, V., Reichelt, M., & Gershenzon, J.
(2003). Chapter five glucosinolate hydrolysis and its impact on generalist and specialist
insect herbivores. Recent advances in phytochemistry, 37, 101-125.

xxi
LIST OF FIGURES
Figure Title Page No.
Figure 1. Reactions depicting mechanism of PPO action in browning development 10
Figure 2. Representative aroma compounds of vegetables 15
Figure 3. Structure of glycosidic portion of aroma glycosides 16
Figure 4. Some representative carotenoids found in vegetables 18
Figure 5. General structure of glucosinolates and their enzymatic degradation
products
25
Figure 6. Chemical structure of cucurbitane 26
Figure 7. Diagram depicting three dimensional L, a and b color space 31
Figure 8. Glucosinolates reported in drumstick (Moringa Oleifera 60
Figure 9. A schematic representation of the different methodologies adopted for
the isolation and analysis of free aroma volatiles
79
Figure 10. A schematic representation of the different procedures followed for
isolation and analysis of bound aroma precursors
83
Figure 11. Scheme of chemical synthesis of acetoin-3-O-β-D- glucoside 98
Figure 12. Variation of (a) Total plate counts and (b) yeast and mold counts with
radiation dose (0 – 2.5 kGy) and storage time (0 – 15 d) in RTC ash
gourd
121
Figure 13. Variation of (a) Total plate counts (b) yeast and mold counts with
radiation dose (0 – 2.5 kGy) and storage time (0 – 15 d) in RTC
drumstick
121
Figure 14. Variation of (a) Total plate counts and (b) yeast and mold counts with
radiation dose ( 0 – 2.5 kGy) and storage time (0 – 28 d) in RTC
pumpkin
122
Figure 15. Effect of radiation treatment and storage on (a) L values of RTC ash
gourd; (b) a values of RTC drumstick; (c) L values of RTC pumpkin
126

xxii
Figure 16. Effect of radiation treatment and storage on firmness of (a) Ash gourd;
(b) Drumstick; (c) Pumpkin
129
Figure 17. Effect of radiation treatment and storage on the overall sensory
acceptability of (a) Ash gourd; (b) Drumstick; (c) Pumpkin
131
Figure 18. Control and radiation processed (at optimum dose) RTC products for ash
gourd, drumstick and pumpkin at the end of intended storage period
137
Figure 19. Quantitative descriptive analysis of fresh control and radiation-processed
ash gourd samples at day zero and twelve of storage
139
Figure 20. Quantitative descriptive analysis of fresh control and radiation-processed
drumstick samples at day zero and twelve of storage
140
Figure 21. Quantitative descriptive analysis of fresh control and radiation-processed
pumpkin samples at day zero and 21 of storage
141
Figure 22. Variation in DPPH radical scavenging capacity of control and radiation
processed RTC vegetables with storage. (A) Ash gourd, (B) Drumstick,
(C) Pumpkin
143
Figure 23. Variation in total phenolic and flavonoid content in ash gourd (A & D);
drumstick (B & E) and pumpkin (C & F) due to radiation processing and
storage
145
Figure 24. Effect of radiation processing and storage on ascorbic acid content of (A)
Ash gourd; (B) Drumstick; and (C) Pumpkin
148
Figure 25. Headspace composition in control and radiation processed RTC (A) Ash
gourd (B) Drumstick and (C) Pumpkin packages during storage
151
Figure 26. GC/MS profiles of volatile aroma of ash gourd obtained using SDE,
HVD and SPME methods
156
Figure 27. GC/MS profile of free aglycones released from bound aroma precursors
of ash gourd obtained from XAD and SPE
161
Figure 28. Odor Detection frequency chromatogram of Ash gourd SDE volatiles 169
Figure 29. Chemical structures and mass spectra for most potent odorants of ash
gourd
170

xxiii
Figure 30. GC/MS chromatogram of cryotrapped fraction(4.5-5.5 min) isolated
corresponding to ash gourd aroma
170
Figure 31. GC/MS profiles of volatile aroma compounds of drumstick obtained
using SDE and SPME methods
171
Figure 32. XAD and SPE chromatograms of drumstick 177
Figure 33. Odor detection frequency chromatogram of drumstick SDE volatiles 184
Figure 34. TLC aromagram of drumstick SDE isolate 186
Figure 35. Chemical structures and mass spectra of most potent odorants of
drumstick
188
Figure 36. GC/MS profiles of SDE and SPME isolates of pumpkin 189
Figure 37. GC/MS profile of hydrolyzed aroma glycosides of pumpkin obtained
from XAD and SPE isolates
196
Figure 38. Odor detection frequency chromatogram of pumpkin aroma isolate 202
Figure 39. Chemical structures and mass spectra for most potent odorants of
pumpkin
203
Figure 40. PCA of free aroma of ash gourd (C0, C5, C8, C12 – control samples of
day 0, 5, 8 and 12; I0, I5, I8, I12 – irradiated (2 kGy) samples of day 0, 5,
8 and 12)
206
Figure 41. PCA of bound aroma of ash gourd (C0, C5, C8, C12 – control samples of
day 0, 5, 8 and 12; I0, I5, I8, I12 – irradiated (2 kGy) samples of day 0, 5,
8 and 12)
207
Figure 42. PCA of free aroma of drumstick (C0, C5, C8, C12 – control samples of
day 0, 5, 8 and 12; I0, I5, I8, I12 – irradiated (1 kGy) samples of day 0, 5,
8 and 12)
211
Figure 43. PCA of bound aroma of drumstick (C0, C5, C8, C12 – control samples
of day 0, 5, 8 and 12; I0, I5, I8, I12 – irradiated (1 kGy) samples of day
0, 5, 8 and 12)
212

xxiv
Figure 44. PCA of free aroma of pumpkin (C0, C7, C14, C21 – control samples of
day 0, 7, 14 and 21; I0, I7, I14, I21 – irradiated (1 kGy) samples of day 0,
7, 14 and 21)
216
Figure 45. PCA of bound aroma of pumpkin (C0, C7, C14, C21 – control samples
of day 0, 7, 14 and 21; I0, I7, I14, I21 – irradiated (1 kGy) samples of
day 0, 7, 14 and 21)
217
Figure 46. Effect of radiation treatment (2 kGy) and storage on (A) Conductivity
(B) Absrbance at 250, 280 and 320 nm (C) Browning index (absorbance
at 420 nm) of RTC ash gourd
220
Figure 47. Scanning electron micrographs of RTC ash gourd (A) Non-irradiated
control 0 d, (B) Radiation treated (2 kGy, 12 d) and c) Non-irradiated
control 12 d.
222
Figure 48. Effect of radiation processing (2 kGy) and storage on (A) PAL activity
and (B) PPO activity
225
Figure 49. (A) Effect of resorcylic acid (0, 50, 125 and 250 mM) on the browning
reaction rate of catechol. (B) Lineweaver-Burk plot of resorcylic acid
inhibition on the catechol-ash gourd PPO system
229
Figure 50. Plots for determining various kinetic parameters. (A) Plot of 1/Vmax vs
[I]; (B) Plot of Km/Vmax vs [I]; (C) Plot of V0/(V0-Vi) vs 1/[I]; (D)
Inhibitory effect of different concentrations of α-resorcylic acid on the
oxidation of catechol by ash gourd PPO
230
Figure 51. IR and NMR spectra of acetoin-3-O-β-D glucoside 235
Figure 52. A) Effect of varying concentration (0.178 – 4.4 µg/mL) of total aqueous
extract (Aq extract) of ash gourd, acetoin glucoside and acetoin on
tobacco leaf disc diameter on day 14 B) Effect of the various treatments
at the optimum concentration (0.44 µg/mL) on the diameter of leaf discs
during different time intervals
236

xxv
Figure 53. A) Increased leaf disc diameter for acetoin glucoside (0.44 µg/mL)
treatment on day 14. B) Germination in pearl millet seeds after treatment
with acetoin and its glucoside
238
Figure 54. Two dimensional gel from protein preparations of control and acetoin
glucoside treated tobacco leaves; Xt- protein over expressed in treated
sample, Xc – corresponding protein in control sample
239
Figure 55. Mass spectrum obtained by MALDI-ToF analysis of the protein (Xt)
over-expressed in response to acetoin glucoside treatment
240
Figure 56. RP-HPLC profile of ash gourd aq extract 244
Figure 57. Chromatogram obtained from GPC 246
Figure 58. Mass spectra of the identified alanine and valine 248
Figure 59. TLC separation of methanolic extracts obtained from control and
irradiated ash gourd stored for various storage periods
251
Figure 60. TLC profiles of unhydrolyzed (spot 1) and hydrolyzed (spot 2) extracts
with different solvent systems
252
Figure 61. HPLC chromatograms obtained at 254 and 237 nm for identification of
cucurbitacins
253
Figure 62. GC/MS profile obtained for hydrolyzate of the total extract 254
Figure 63. Chemical structure of the cucurbitacins identified 255
Figure 64. HPLC chromatograms obtained for drumstick aqueous extract and after
hydrolysis with myrosinase and sulfatase enzyme
258
Figure 65. GC/MS profile of hydrolyzed aqueous extract of drumstick 260
Figure 66. Chemical structure and mass spectra of isopropyl, 2-butyl and isobutyl
ITC
260
Figure 67. Structures of glucosinolates previously reported in Moringa species 261
Figure 68. HPLC chromatograms obtained from ash gourd, drumstick and pumpkin
at 280 nm
264
Figure 69. HPLC chromatograms obtained for control and radiation processed
pumpkin (0d and 21 d) carotenoids (450 nm)
270

xxvi
LIST OF TABLES
Table Title Page No.
Table 1. Richest vegetable sources of specific compounds 3
Table 2. Sensory descriptors reported for simple phenols 20
Table 3. The subgroups of flavonoids 21
Table 4. Phenolic acids isolated from vegetables 22
Table 5. Glucosinolates in different food sources 24
Table 6. Sensory scales used in the evaluation of food quality 29
Table 7. Instrumental methods for determination of vegetables quality 30
Table 8. Various applications of food irradiation 45
Table 9. Food items approved for radiation processing in India under PFA
rules
47
Table 10. Proximate composition of immature and mature ash gourd fruit 53
Table 11. Vitamins and minerals profile of mature ash gourd fruit 54
Table 12. Some common medicinal and pharmacological properties of
different parts of ash gourd
55
Table 13. Proximate composition and minerals and vitamins in drumstick
pods
58
Table 14. Medicinal and pharmacological activities of different parts of
drumstick tree
59
Table 15. Proximate and minerals and vitamins content in pumpkin pulp 63

xxvii
Table 16. Medicinal and pharmacological activities of pumpkin 64
Table 17. Experimental design for RTC ash gourd 112
Table 18. Experimental design for RTC drumstick 113
Table 19. Experimental design for RTC pumpkin 115
Table 20. Significance statistics, p values and signal to noise ratio (S/N) of
predicted models for ash gourd
116
Table 21. Significance statistics, p values and signal to noise ratio (S/N) of
predicted models for drumstick
117
Table 22. Significance statistics, p values and signal to noise ratio (S/N) of
predicted models for pumpkin
117
Table 23. Coefficients of the fitted polynomial representing the relationship
between the response and the process variable and R2 values for
RTC ash gourd
118
Table 24. Coefficients of the fitted polynomial representing the relationship
between the response and the process variable and R2 values for
RTC drumstick
118
Table 25. Coefficients of the fitted polynomial representing the relationship
between the response and the process variable and R2 values for
RTC pumpkin
119
Table 26. Criteria for various factors and responses for process optimization
and corresponding optimized solutions obtained
134

xxviii
Table 27. Quantitative distribution of volatile oil components identified in
isolates obtained from SDE, HVD and SPME
156
Table 28. Quantitative distribution of free volatile components obtained from
glycosidic precursors extracted by XAD and SPE
162
Table 29. ODP analysis of ash gourd SDE oil 167
Table 30. Quantitative distribution of volatile oil components identified in
SDE and SPME
172
Table 31. Quantitative distribution of free volatile components obtained from
glycosidic precursors extracted by XAD and SPE
177
Table 32. ODP analysis of drumstick SDE oil 183
Table 33. Bands isolated from TLC aromagram of drumstick oil with their
odor and major compounds identified
187
Table 34. Quantitative distribution of volatile oil components identified in
SDE and SPME
189
Table 35. Quantitative distribution of volatile oil components identified in
XAD and SPE isolates
196
Table 36. ODP analysis of pumpkin aroma (SDE) 201
Table 37. Effect of radiation processing and storage on POD activity of ash
gourd
225
Table 38. Quantitative distribution of different phenolic constituents in ash
gourd
227
Table 39. Correlation coefficients calculated between various factors 228

xxix
contributing in browning of RTC ash gourd
Table 40. The peaks collected from HPLC for preliminary screening of the
fractions possessing ACE inhibition activity
245
Table 41. Fractions collected from re-chromatography of region 2-4 min
obtained from preliminary HPLC analysis
245
Table 42. Fractions collected from GPC 246
Table 43. Peak area distribution of TLC spots as measured by TLC-
densitometry
251
Table 44. Rf values, UV absorption and the mass fragments of Cu C and Cu
E
255
Table 45. Major compounds detected in the collected peaks as identified by
GC/MS
259
Table 46. Quantitative distribution of major isothiocyanates in control and
radiation processed RTC drumstick at different storage periods
262
Table 47. Quantitative distribution of identified phenolic constituents in
drumstick
267
Table 48. Quantitative distribution of identified phenolic constituents and
carotenoids in pumpkin
268

CHAPTER 1
INTRODUCTION

2
1.1. Importance of vegetables in the diet
Vegetables form an important part of our daily diet. They provide nutrients vital for
health and maintenance of our body. Most vegetables are low in fat and calories with
none having cholesterol. They are important sources of both macro nutrients such as
fiber, carbohydrates, and micro-nutrients like potassium, folate (folic acid), vitamin A,
and vitamin C. Many of the colored vegetables, in particular, dark-green leafy,
cruciferous and deep-yellow-orange vegetables, are rich in vitamin C, carotenoids, folates
and a range of bioactive phytonutrients. A balance of the micro- and macro-constituents,
however, is more likely to be responsible for their health benefits than any single
compound. Several biologically active phytochemicals have been identified in food
plants. Table 1 lists vegetables that are rich source of specific compounds. However, apart
from a few exceptions, these compounds are also present in varying amounts in most
other fruits and vegetables.
In 1990, The World Health Organization (WHO) recommended a goal of at least 400 g of
vegetables and fruits daily (in addition to potatoes) including at least 30 g of legumes,
nuts and seeds [1]. This report, together with other reports from expert bodies, has been
translated into a recommendation for the consumption of at least five portions of fruits
and vegetables per day. The World Cancer Research Fund and American Institute for
Cancer Research have recommended that diets should be based primarily on foods of
plant origin, provided that such diets are nutritionally adequate and varied [2].

3
Table 1. Richest vegetable sources of specific compounds
There are evidences that diets rich in vegetables can decrease the levels of chronic
diseases. Extensive reports on the preventive effects of vegetables and fruits against
cancer are available in literature [3, 4]. In addition, new scientific evidence is emerging
supporting a protective role for vegetables in prevention of cardio-vascular diseases
(CVD), cataract formation, age-related macular degeneration, chronic obstructive
pulmonary disease, digestive disorders, and possibly hypertension. There may be several
biologically plausible reasons why the consumption of vegetables might slow, or prevent,
4
the onset of chronic diseases. Some of the phytochemical constituents present have
capacity to modify antioxidant pathways, detoxification enzymes, the immune system,
cholesterol and steroid hormone concentrations and blood pressure by acting as
antioxidant, antiviral and antibacterial agents.
Antioxidant effects of vegetables have been of recent interest. Dietary antioxidants have
been demonstrated to play a major health protective role. The huge literature data
currently available have shown that fresh fruits and vegetables possess high antioxidant
properties that are beneficial to human health [5, 6]. The oxidative damage to bio-
molecules is held responsible for CVD, cancer initiation, cataract formation,
inflammatory disease and several neurological disorders. The antioxidants are recognized
as bioactive compounds that protect bio-molecules from oxidative damage. Several trace
elements, such as manganese, copper, zinc, iron and selenium, are essential constituents
of the antioxidant metallo-enzymes: superoxide dismutase, glutathione peroxidase and
catalase. Vitamins C, E and the carotenoids & polyphenols, have received most attention
with respect to their antioxidant capability. They can interrupt free radical initiated chain
reactions of oxidation, or scavenge free radicals before they damage cellular components.
The in vivo antioxidant effects of different groups of compounds, have been studied, but
their metabolism is complex and effects in in vivo may be different both in extent and
mode of action from those observed in vitro model systems. Indeed, the health-promoting
effects of many phytochemicals are attributed mainly to their antioxidant activity,
although there could also be other modes. In a nutshell, vegetables are an important part

5
of our diet, which provide many beneficial nutrients, and protect against several chronic
diseases, apart from adding a specific flavor to the cuisine.
1.2. Minimal processing of vegetables
In the past few years, worldwide demand for convenience foods such as minimally
processed fresh cut fruits and vegetables has increased considerably. Fresh-cut products
are highly popular in Europe and in recent years have gained acceptance in Asia as well.
Changing lifestyles and eating habits as well as preference for fresh, healthy and natural
is a strong marketing drive for such products. Processed Ready-to-eat (RTE) fresh fruits
or ready-to-cook (RTC) vegetables provide convenience without greatly changing their
fresh like properties and human health benefits, with a minimal time of preparation before
consumption [7].
According to “The International Fresh-Cut Produce Association”, fresh-cut produce has
been defined as trimmed, peeled, washed, and cut into 100% usable product that is
subsequently bagged or prepackaged to offer consumers high nutrition,
convenience, and value while still maintaining freshness [8].
The USDA and FDA defined “fresh” and “minimally- processed” fruits and vegetables
as: fresh-cut (pre-cut) products which have been freshly-cut, washed, packaged and
maintained with refrigeration. Fresh-cut products are in a raw state and even
though processed (physically altered from the original form), they remain in a fresh
state, ready to eat or cook, without thermal processing, or treatments with additives
or preservatives [8].

6
Commercial production of RTC vegetables include washing, sorting according to size,
peeling, cutting, packaging and finally storage at refrigerated temperatures. However,
these products have a very short shelf life. For most fresh-cut produce, shelf-life is best
defined as the period within which the product retains acceptable quality for sale to the
consumer. It is therefore necessary to identify what ‘acceptable quality’ means before it
can be decided at what point the product no longer satisfies those expectations. From the
quality standpoint, it is desirable to preserve the characteristics of fresh-cut vegetables at
their peak. The most appealing attributes of these products include their fresh-like
appearance, taste and flavor, in addition to convenience without the use of preservatives
[9]. Fresh-cut processing increases respiration rates and causes major tissue disruption as
enzymes and substrates, normally sequestered within the vacuole, become mixed with
other cytoplasmic and nucleic substrates and enzymes. Processing also increases wound-
induced ethylene, water activity, and surface area per unit volume, which may accelerate
water loss and enhance microbial growth since sugars also become readily available [10].
These physiological changes may be accompanied by flavor loss, cut surface
discoloration, color loss, decay, increased rate of vitamin loss, rapid softening, shrinkage,
and a shorter storage life. Increased water activity and mixing of intracellular and
intercellular enzymes and substrates may also contribute to flavor and texture loss during
and after processing. Therefore, proper temperature management during product
preparation and refrigeration throughout distribution and marketing are essential for
maintenance of quality.

7
The critical factors for deciding the shelf-life of a fresh-cut produce can be classified into
the following categories: microbial spoilage, appearance and color, texture, flavor (taste
and aroma) and nutritional value.
1.2.1. Microbial spoilage
During processing of minimally processed vegetables such as peeling, cutting and
shredding, the surface of the produce is exposed to contamination with bacteria, yeasts
and moulds. Besides, the plant cellular fluids released during processing favor the growth
of micro-organisms by providing a nutritive medium for growth. Processing also
increases water activity and surface area per unit volume which may accelerate water loss
and enhance microbial growth [10]. Most of the minimally processed vegetables have low
acid range pH (5.8–6.0), high humidity and a large surface area which can provide ideal
conditions for the growth of microorganisms [11]. Thus, fresh cut vegetables have high
levels of microorganisms and several outbreaks of food-borne illnesses have been found
to be associated with these products [12]. In general, total counts of microbial populations
on minimally processed vegetables after processing range from 3.0 to 6.0 log cfu/g [13].
A number of micro-organisms have been found in fresh-cut products including
mesophilic microflora, lactic acid bacteria, coliforms, fecal coliforms, yeasts, and
pectinolytic microflora [13]. Some of these micro-organisms produce pectinolytic
enzymes which degrade the cell structure and as such provide more nutrients for
microbiological activity.
Physiological ageing of commodities could also increase microbial counts [14]. Moulds
are less important in minimally processed vegetables due to the intrinsic properties such
8
as slightly acid to neutral pH favoring bacteria and yeasts which generally overgrow
moulds [15]. Microorganisms impact the economic value of fresh-cut products by
decreasing product shelf-life, through spoilage, and by posing a risk to public health by
causing foodborne disease [13].
Mechanical wounding of vegetables enhances a diverse array of enzymatic pathways,
associated in many cases with generation of volatiles [16]. Increased concentration of
ethanol, acetaldehyde and some aliphatic alcohols such as 2-methyl-1-butanol, 3-methyl-
1-butanol, propanol has been reported to be produced by micro-organisms during storage
in various fresh-cut produce [17]. However, research on changes in volatile and non-
volatile compounds in minimally processed vegetables during storage in relation to
microbiological activity is scarce.
1.2.2. Appearance and color
Appearance is determined by physical factors including the size, the shape, the
wholeness, the presence of defects (blemishes, bruises, spots etc.), finish or gloss, and
consistency. Fruit or vegetable gloss are related to the ability of a surface to reflect light
and freshly harvested products are often more glossy [18]. Fresh-cut vegetable products
must appear to be fresh, generally indicated by the brightness of color and the absence of
visual defects or drip.
Color is derived from natural pigments present in fruits and vegetables. The primary
pigments include fat soluble chlorophylls (green) and carotenoids (yellow, orange and
red) and the water soluble anthocyanins (red, blue), flavonoids (yellow), and betalins
(red). Bright colors of fresh produce attract the buyers. However, color that is not
9
appropriate for the item, indicative of loss of freshness or lack of ripeness, can decrease
the consumer acceptance for the product. For example, white blush in cut carrots is a
quality defect [19]. Yellowing in green vegetables due to loss of chlorophyll is
unacceptable [20]. Wilting, browning, dull colors, and drip are all indicators of loss of
freshness in fresh-cut vegetables [21].
Browning is a serious quality defect in fresh-cut produce. Enzymatic and non-enzymatic
reactions may result in the formation of brown, gray, and black colored pigments. The
enzymes involved in browning reactions include phenylalanine ammonia lyase (PAL), a
key enzyme in the phenolic biosynthesis and polyphenol oxidase (PPO) as well as
peroxidase (POD), which catalyse the oxidation of polyphenolic compounds. In intact
plant cells, phenolic compounds in cell vacuoles are spatially apart from the oxidizing
enzymes present in the cytoplasm. Once tissues are damaged by processing such as
peeling and cutting, the mixing of the enzymes and phenolic compounds as well as the
easy oxygen diffusion to the inner tissues result in a browning reaction. Further, as a
result of minimal processing, phenolic content increases via wound-induced enhancement
in PAL (PAL; EC 4.3.1.5) expression. Oxidation of the phenols thus formed to quinones
catalyzed by PPO (PPO; EC 1.10.3.1) and peroxidase (POD; EC 1.11.1.7) and subsequent
polymerization of the quinones to relatively insoluble brown polymers (melanins) results
in unacceptable product [22]. It also leads to off flavors and losses in nutritional quality.
For example, russet (brown) spotting and brown stain [23] are undesirable visual defects
in lettuce. The main reactions as catalyzed by PPO are shown below (Figure 1). It has
been proposed that increase in PAL activity could be used as a predictive index of shelf

10
life [24]. An increased PAL activity has also been correlated with a decrease in shelf-life
and overall visual quality of minimally processed lettuce [24]. Increased enzymatic
activities have been reported in fresh-cut potato strips [25], broccoli florets (Brassica
oleracea var. italica; [26], and lettuce leaf segments [27]. Such visual defects decrease the
consumer acceptability and therefore marketability of the fresh-cut produce.
Figure 1. Reactions depicting mechanism of PPO action in browning development.
1.2.3. Texture
According to Bourne [28], the textural properties of a food are the “group of physical
characteristics that arise from the structural elements of the food, sensed by the feeling of
touch, are related to the deformation, disintegration and flow of the food under a force,
and measured objectively by functions of mass, time, and distance”. Textural parameters
of fruits and vegetables are perceived with the sense of touch, either when the product is
picked up by hand or chewed. Consumers have clear expectations regarding the texture of
fresh-cut vegetables. Salad vegetables like lettuce, carrot, celery, and radish should be
crisp. Undesirable textural attributes are the opposite of the desirable ones. For example,
wilted lettuce, limp carrots or celery, and flaccid radish are unacceptable.

11
Texture is derived from turgor pressure, and the composition of individual cell walls. Cell
walls are composed of cellulose, hemicelluloses, pectic substances, proteins, and also
lignins in the case of vegetables. In processed fruits and vegetables, changes in texture are
strongly related to transformations in cell wall polymers due to enzymatic and non-
enzymatic reactions. Cellulose and hemicellulose show minimal changes in structure and
composition in most plant based foods [29]. Most of the changes observed in plant based
foods are ascribed to transformations in pectin structure and composition. These changes
are strongly influenced by the processing steps and conditions. Apart from mechanical
injury imposed by processing operations, microbial growth also bring textural changes in
minimally processed vegetables during storage [13]. The rapid texture breakdown
observed in cut vegetables during storage is often the result of higher aerobic
psychotrophic counts. Different micro-organisms produce pectinolytic enzymes including
pectate lyase, polygalacturonase and pectin methyl esterases resulting in textural changes.
The most commonly isolated pectinolytic bacterial species are Erwinia and
Pseudomonas. Pectinolytic yeasts and moulds include Trichosporon sp and Mucor sp,
respectively [13].
While generally flavor is being cited as the most important quality attribute, textural
defects and the interaction of flavor and texture are more likely to cause rejection of a
fresh product [30]. Consumer and taste panel responses indicate that individuals are
actually more sensitive to small differences in texture than flavor [8], making texture a
crucial parameter for acceptability.

12
1.2.4. Flavor (taste and aroma)
An overall flavor of food results from the combined effect of its various constituents on
the human olfactory organs. Taste sensation is perceived once the food product is taken in
the mouth, while smell (olfaction) can be sensed by the odor of an object at a distance.
1.2.4.1. Taste
Taste can be classified into five basic categories - sweetness, sourness, saltiness,
bitterness and umami. In Asian countries within the sphere of mainly Chinese and Indian
cultural influence, pungency (piquancy or hotness) had traditionally been considered a
sixth basic taste. Sweetness, usually regarded as a pleasurable sensation, is produced by
the presence of sugars, some proteins, and a few other substances. It is often connected to
aldehydes and ketones, which contain a carbonyl group. Sourness in the taste is detected
by the acidity content of the food product. The sourness of substances is rated relative to
dilute hydrochloric acid, which has a sourness index of 1. Citric acid, malic acid and
oxalic acid are the acidic compounds attributing sourness to fruits and vegetables. Many
of the fruits are naturally sour in taste such as lemon, grape, orange, and tamarind.
Saltiness is a taste produced primarily by the presence of sodium ions. The saltiness of
substances is rated relative to sodium chloride (NaCl), which has an index of 1 [31].
Bitterness is an undesirable taste found in some fresh-cut vegetables such as salad greens
[32] and vegetables of cruciferae family. When Cruciferae cells are ruptured,
glucosinolates undergo enzymatic hydrolysis with the endogenous myrosinase enzymes,
releasing thiocyanates, isothiocyanates [33], sulphate, and glucose [34]. These breakdown
products cause bitter taste. Umami is an appetitive taste and is described as a savory [36]

13
or meaty [36]. It can be tasted in cheese and soy sauce, and while also found in many
other fermented and aged foods, this taste is also present in tomatoes, grains, and
beans[36]. The amino acid, glutamic acid is responsible for umami taste [37] but some
nucleotides (inosinic acid and guanylic acid [37] can act as complements, enhancing the
taste. Processing and packaging precautions must be taken to ensure that off-odors and
off-flavors do not jeopardize the marketability of the fresh-cut vegetables.
1.2.4.2. Aroma constituents
Although taste sensations are very important, it is the presence of trace amounts of
(usually) many volatile compounds which are crucial in determining the flavor quality of
a food product.
The aroma of vegetables is generally released during processing such as cutting and
cooking. It is generated due to the presence of a large number of organic volatile
compounds which are present in extremely small concentrations. Two largest groups that
contribute to natural odors are the aliphatics derived mainly from fatty acids and
terpenoids synthesized by the maevalonate or the methylerythritol pathway. Among the
aliphatic compounds derived from fatty acids with carbon chains between two to
seventeen, the C6 compounds such as (Z)-3-hexenyl acetate, hexenol, hexenal and
hexanol belong to a well known group of green-leaf volatiles (GLVs) found in several
fruits and vegetables. Terpenes constitute the largest family of natural plant products
including fruits and vegetables. They are made up of homologous series of repetitive five
carbon isoprene units in their structure. These include the monoterpenes (C10, 2 isoprene
units), sesquiterpenes (C15, 3 isoprene units), diterpenes (C20, 4 isoprene units),

14
triterpenes (C30, 6 isoprene units), tetraterpenes (C40, 8 isoprene units) and polyterpenes
([C5]n, where n may be 9-30,000). Among these, the monoterpenes and sesquiterpenes
are the major constituents of several essential oils derived from plants and plant products.
Terpenes can be further sub divided into terpene hydrocarbons and oxygenated terpenes
depending on the nature of their functional groups. Some of the monoterpene
hydrocarbons such as myrcene, α-pinene and sabinene are widely distributed in fruits and
vegetables and have pleasant and characteristic odor. Oxygenated terpenes commonly
exist as alcohols, aldehydes, ketones and esters.
Other odorant chemical classes include the benzenoids and phenylpropanoids derived via
the phenylpropanoid pathway, lactones derived from hydroxyl fatty acids and C-5
branched chain compounds derived from branched-chain fatty acids. Among the nitrogen
containing compounds, amines, oximes and indoles are the most common. Sulfur
containing compounds such as hydrogen sulfide, methanethiol, dimethyl sulfide and
isothiocyanates are derived from amino acid metabolism. Figure 2 represents some
representative examples of aroma compounds existing in the nature.
In vegetables, the volatiles representing their characteristic flavor are generally esters,
aldehydes, alcohols, terpenes or their derivatives. Sometimes, a single compound alone
can approximate the flavor of a product and thus is termed as “impact compound”.
However, in other cases a combination of several constituents that, together, interact with
the receptors from the nasal mucosa creates a sensory impression in the brain typical of
the product [38].

15
Figure 2. Representative aroma compounds of vegetables
Besides the volatile constituents that contribute to odor, there exists a class of non-volatile
glycosidically bound odor precursors that are widely distributed in the plant kingdom
[39]. Although odorless, they are able to release free aroma by enzymatic hydrolysis
during processing such as cutting and cooking and hence are considered to be potential
aroma compounds that play a crucial role in the overall food quality. Some of the bound
volatile compounds have unique odor properties that provide the characteristic flavor to a
food product. The aglycone bound to the glycoside moiety may include both terpenoid
and non-terpenoid structures. Mono and sesquiterpenoids, aliphatic alcohols, alkyl
phenols and norisoprenoids are the most prominent. Generally the sugar which is directly
bound to the aglycone is β-D-glucose. This glucose moiety may or may not be further
substituted with additional sugar units. The second sugar unit is reported to be either α-L-

16
arabinofuranose, α-L-rhamnopyranose, β-D-xylopyranose, β-D-apiofuranose, or β-D -
glucose (Figure 3). Most of the hydrolases employed for release of volatile aglycones are
exo-glycosidases. Initial step in the cleavage of disaccharidic conjugate therefore require
the action of α-L-arabinosidase, α-rhamnosidase, β-D-xylosidase, or β-D-apiosidase, for
the cleavage of the intermediate sugar linkage. A second hydrolytic step further liberates
the aglycone moiety by β-glucosidase activity [40]. Only in the case of gentiobiosides (β-
D-glucopyranosyl-(1-6)- β-D-glucopyranosides), where the disaccharidic sugar consists
of two glucose units, β-D-glucosidase activity is able to liberate the aglycone in a two-
step mechanism [41].
Figure 3. Structrue of glycosidic portion of aroma glycosides
The intact fresh vegetables are nearly odorless and are indistinguishable from each other.
However, processing such as cutting and cooking, results in liberation of characteristic

17
aroma from their precursors. Very few reports however exist on the nature of free as well
as bound aroma compounds in vegetables, especially in Indian vegetables. Further,
reports on the effect of various processing on aroma of vegetables and their products are
lacking. Therefore, it is of interest to study the volatile profile of vegetables and to
identify the role of these compounds in providing characteristic aroma to these products.
1.2.5. Nutritional value
The beneficial effects of vegetables have been attributed to non-essential food
constituents, which are known as phytochemicals or bioactive compounds. These
phytochemicals are considered to be biologically active secondary metabolites that in
many cases provide color and flavor, and are commonly referred to as phytoprotectants or
nutraceuticals [42]. Plant derived phytochemicals have been shown to be associated with
many health-promoting effects such as protection against inflammation, cardiovascular
diseases, diabetes, asthma and cancer [43]. Fresh vegetables are good sources of dietary
fiber, minerals, vitamins, and other beneficial phytochemicals. The major classes of
phytochemicals important in vegetables include carotenoids, phenolics, and
glucosinolates.
1.2.5.1. Carotenoids
Fruits and vegetables contain different amounts and types of carotenoid [44]. Chemically
carotenoids are polyisoprenoid compounds and can be classified into two main groups:
(a) carotenes composed only of carbon and hydrogen atoms and (b) oxygenated
derivatives, xanthophylls, that contain at least one oxygen function such as hydroxy, keto,
epoxy, methoxy or carboxylic acid groups. Their structural characteristic is a conjugated

18
double bond system which influences their chemical, biochemical and physical
properties. This class of natural pigments occurs widely in nature. They are responsible
for the attractive colors of many flowers, fruits and vegetables [44]. This attribute is of
great importance in foods, since color is often a criterion of quality and is typically
modified by food processing [45]. Carotenoid content in fruits and vegetables depends on
several factors such as genetic variety, maturity, postharvest storage, processing and
preparation.
The physiological role of these compounds has resulted in a great interest in their
biological function [46]. In addition to the provitamin A activity of some carotenoids,
they also have other functions, such as antioxidants and enhancers of the immune
response. Furthermore, some of them are involved in the cell communication.
Xanthophylls have also been shown to be effective as free radical scavengers [47]. Figure
4 shows some representative examples of the carotenoids found in fruits and vegetables.
Figure 4. Some representative carotenoids found in vegetables.

19
1.2.5.2. Phenolics
Phenolic compounds refer to the main classes of secondary metabolites in plants.
Chemically, phenols are cyclic benzene compounds possessing one or more hydroxyl
groups associated directly with the ring structure. Phenolic compounds are important in
deciding overall quality since they contribute to organoleptic characteristics such as
colour, astringency, bitterness, and aroma. Table 2 shows the organoleptic notes
associated with certain phenolic compounds. Phenolics are produced in plants as
secondary metabolites via the shikimic acid pathway [48]. Phenylalanine ammonialyase
(PAL) is the key enzyme catalyzing the biosynthesis of phenolics from the aromatic
amino acid, phenylalanine [48]. They can be classified based on the number and
arrangement of the carbon atoms as flavonoids (flavonols, flavones, flavan-3-ols,
anthocyanidins, flavanones, isoflavones and others) and nonflavonoids (phenolic acids,
hydroxycinnamates, stilbenes and others). They are commonly found conjugated to
sugars and organic acids.
1.2.5.2.1. Flavonoids
Flavonoids are polyphenolic compounds comprising fifteen carbons with two aromatic
rings connected by a three-carbon bridge (C6-C3-C6). They are the most abundant
phenolic compounds found throughout the plant kingdom. The individual flavonoid
subgroups are shown in Table 3. Flavonols are the most widespread of the flavonoids.
Kampferol, quercetin, isorhamnetin, myricetin and their O-glycosides are some of the
flavonols reported in vegetables. In fresh vegetables, generally flavonols exist only as
glycosidic precursors or acylated by various hydroxycinnamic acids [49]. Within the

20
flavonoids, anthocyanins are the most important group of water-soluble colored plant
pigments, possessing antioxidant activity and other useful biological properties. They are
generally found in the form of glycosides, with aglycones being rarely found. They are
involved in protecting the plants against excessive light and also have an important role in
attracting pollinating insects. The stability, color intensity and potential biological activity
of anthocyanins is determined by their chemical structure.
Table 2. Sensory descriptors reported for simple phenols

21
Table 3. The subgroups of flavonoids (Table adapted from Karakaya, S. (2004) [50])

22
1.2.5.2.2. Phenolic acids
Phenolic acids are aromatic secondary plant metabolites, widely spread throughout the
plant kingdom. Hydroxycinnamic acids such as ferulic, sinapic, caffeic, and p-coumaric,
are among the most widely distributed in plants. Table 4 shows the phenolic acids
isolated from various vegetables [51]. They occur in most tissues in a variety of
conjugated forms. Esters and amides are the most frequently reported types of conjugates,
while glycosides rarely occur. The most abundant member of dietary hydroxycinnamates
are ferulic and caffeic acids [52]. Most vegetables contain caffeic, ferulic, sinapic or
coumaric acid conjugated with quinic acid and/or esterified with sugars [53].
Table 4. Phenolic acids isolated from vegetables.

23
Phenolic acids have been known to possess sensory properties described as being
astringent and bitter that are not considered very desirable in some products.
1.2.5.3. Glucosinolates
Glucosinolates (GSLs) constitute a well defined group of specialized plant metabolites.
They are predominantly found in crucifers. Several other plant families in the same plant
order as the Brasicaceae, the Capparales (e.g., the Capparidaceae, Moringaceae,
Resedaceae, Stegnospermaceae, and Tovariaceae) have been found to possess
glucosinolates. Table 5 represents glucosinolates identified in various food products.
A large body of epidemiological evidence indicates that the chemoprotective effects of
Brassica vegetables against initiation of tumors caused by chemical carcinogens may be
due to glucosinolates and their degradation products [54]. There is a considerable interest
in recent years in optimizing GSL content and composition for plant protection and
human health. GSLs are also responsible for the bitter acidic flavors of Brassicacea
species. Their hydrolytic by-products such as isothiocyanates, nitriles, and thiocyanates
are responsible for the hot and pungent taste.
Structurally glucosinolates are anions composed of thiohydroxymates carrying an S-
linked β-glucopyranosyl residue and an O-linked sulfate residue, and with an amino acid
derived, variable side chain (Figure 5). Based on the nature of side chain, they are broadly
classified as alkyl, aromatic, benzoate, indole, multiple glycosylated and sulfur containing
side chains. The enzyme myrosinase (β-thioglucosidase glucohydrolase; EC 3.2.3.1)-
activated in damaged plant tissue and also present in the microflora of the human
digestive tract converts these glucosinolates to a number of compounds including

24
thiocyanates, nitriles and isothiocyanates (Figure 5). These hydrolysis products, many of
which possessing biological activity, vary depending on the plant species, side-chain
substitution, cell pH, and cell iron concentration (55, 56].
Table 5. Glucosinolates in different food sources.

25
Figure 5. General structure of glucosinolates and their enzymatic degradation products.
(Adapted from Rask et al., 2000 [57]).
In contrast to intact GLS, hydrolysis products are responsible for the characteristic aroma
of Brassicaceae plants and have been of interest for their diverse biological activities,
ranging from antimicrobial, antioxidant and anticancer activities [58]. Many of these have
biocidal activity against a wide variety of organisms such as insects, plants, fungi,
bacteria and human health effects [59]. For example, sulforaphane [1-isothiocyanato-4-
(methylsulfinyl)butane], a degradation product of the glucosinolate glucoraphanin [4-
(methylsulfinyl)butyl glucosinolate], is a potent inducer of phase II detoxication enzymes,
that are strongly correlated with the prevention of certain types of cancer [60].
1.2.5.4. Triterpenoids
Triterpenes or triterpenoids are terpenes consisting of six isoprene units and having
molecular formula C30H48. Triterpenoids are biosynthesized in plants by the cyclization of
squalene, a triterpene hydrocarbon and precursor of all steroids [61]. They are used for

26
anti-inflammatory, analgesic, antipyretic, hepatoprotective, cardio tonic, sedative and
tonic effects [61]. They also demonstrate antitumor efficacy in preclinical animal models
of cancer [61]. They can further be sub classified into diverse groups including
cucurbitanes, cycloartanes, dammaranes, euphanes, friedelanes, holostanes, hopanes,
isomalabaricanes, lanostanes, limonoids, lupanes, oleananes, protostanes, sqalenes,
tirucallanes, ursanes and miscellaneous compounds [61]. Among them, cucurbitacins are
well-known for their cytotoxic behavior and broad range of bioactivities such as
antitumor, anti inflammatory, antimicrobial, antihelminthic, and cardiovascular properties
[62]. Cucurbitacins are oxygen containing compounds possessing double bonds and
derived from cucurbitanes (C30H54) that have a triterpene hydrocarbon skeleton (Figure
6). They usually occur as β-2-monoglycosides, the sugar moiety being D-glucose or L-
rhamnose. They possess the biogenetically unusual 10acucurbit-5-ene-[19(10-19b)-abeo-
10a-lanostane] skeleton [63], which has mainly been reported in the Cucurbitaceae but is
also known to occur in other plant families [63].
Figure 6. Chemical structure of cucurbitane (C30H54).

27
1.3. Quality measurement of fresh-cut produce - Sensory and instrumental
measurements
The quality of fresh-cut produce can be measured by sensory and instrumental methods.
In general, sensory methods are more useful in developing new products and determining
product standards while instrumental methods are superior in measuring quality on a
routine basis [21].
1.3.1. Sensory methods of quality measurement
Sensory methods are very important for quality measurement of fresh-cut produce. Since
human perception is involved in sensory testing, quality attributes are clearly defined in
terms that are relevant to consumer acceptability. The sensory panels need to be
extensively trained as highly variable results can be produced if training is inadequate.
Trained sensory panels can be used to identify small differences in the samples processed
with different treatments (Difference tests) or for descriptive analysis of a product.
Descriptive analysis involves the development of a lexicon [64] which is the list of terms
used as descriptors with their precise definitions. Lexicons can be extensive with up to 50
descriptors or with as few as 5 descriptors. Selection of a lexicon is followed by training
of the panel to acclimatize them with the descriptors in order to ensure that the results are
accurate and precise.
After completion of the training, the evaluation of the samples is conducted in partitioned
booths using one of the several evaluation methods such as Spectrum [64] and
Quantitative Descriptive Analysis (QDA; [65]). The primary differences between the two

28
techniques are that Spectrum uses standards for the descriptors and involves more
extensive training than QDA. A more limited approach to descriptive analysis is the use
of an experienced panel. Experienced panelists have had some training on similar
descriptors in the past, but the panel is usually provided with a limited number of
descriptors for evaluation. The panel is convened with a few training sessions primarily to
ensure that the panelists are familiar with the terminology. Usually two to five judges
evaluate the samples independently of each other to prevent bias.
However, to determine the preference (which samples are preferred over others) of a food
product, large numbers of na¨ıve panelists are generally used [66]. The preference tests
give an idea about what consumers like and what they do not like.
The most frequently used evaluation scale is the 9-point hedonic scale [64]. Some more
useful scales include the 5-point willingness to purchase [67] and the 3-point acceptability
scale [68]. Table 6 represents the sensory scales generally employed in the food industry
for deciding the acceptability of a product.
However, the use of a single sensory technique provides limited information. Integration
of two or more techniques can be a powerful tool in the quality evaluation of fresh-cut
produce [69].
To summarize the main points, sensory analysis helps to determine which attributes are
important to the consumer. Difference tests can determine if individual units are
noticeably different, and sensory descriptive analysis can identify the attributes that cause
the differences. When carefully coordinated, the sensory tests can be very effective in
developing new products and establishing quality standards.

29
Table 6. Sensory scales used in the evaluation of food quality
1.3.2. Instrumental methods of quality measurement
Apart from sensory analysis which is a crucial step in product development, a wide range
of instrumental techniques for quality assessment of fresh-cut produce in terms of color,
appearance, flavor, texture, and nutritional quality are available. These techniques, also
termed as objective methods, are advantageous in a way that they tend to provide accurate
and precise results. The results of instrumental tests can generally be related directly to
chemical and physical properties allowing the investigator to gain a mechanistic
understanding of observed differences. Instruments tend to be more sensitive to small
differences between samples and may be able to detect trends in quality loss before they
can be detected by humans [70]. Large amounts of data can be generated by using
instruments without any fatigue or loss of sensitivity/ alertness towards analysis. This

30
attribute makes them excellent monitors in Quality Control operations. Instrumental
methods of measuring color, texture, aroma, and flavor in fruits and vegetables as
described by Kader [71] are listed in Table 7.
Table 7. Instrumental methods for determination of vegetables quality
1.3.2.1. Color
Color may be determined using nondestructive methods based on visual or physical
measurements. These methods are based on evaluation of either the light reflected from
the surface of a product or transmitted through it. There are three components necessary
for the perception of color - 1) a source of light, 2) an object that modifies light by
reflection or transmission and 3) the eye/brain combination of an observer. Easy and fast

31
methods such as use of simple color charts and dictionaries are routinely used in the field,
packing house, fresh-cut processor facility or retail store. They have the advantage of
requiring no specialized equipment, but may be standardized through the use of color
charts or discs. However, human differences in perception might give erroneous results.
Inadequate or poor quality of the available light may also affect accuracy [18]. On the
other hand, instrumental methods are less variable and can be used to measure small
differences; however, they may be slower than the sensory measurements.
Each pigment in vegetables corresponds to a primary hue—red, blue, and green [72].
The Commission Internationale de l’Eclairage (CIE) or International Commission on
Illumination is the international body that governs the measurement of color. Color space
may be divided into a three-dimensional (L, a and b) rectangular area (Figure 7) such that
L (lightness) axis that goes vertically from 0 (perfect black) to 100 (perfect white) in
reflectance or perfect clear in transmission [73]. The “a” axis (red to green) considers the
positive values as red and negative values as green; 0 being neutral. The “b” axis (blue to
yellow) expresses positive values as yellow and negative values as blue; 0 being neutral.
Figure 7. Diagram depicting three dimensional L, a and b color space

32
Color may be determined instrumentally using either colorimeters or spectrophotometers.
Colorimeters give measurements that can be correlated with human eye-brain perception,
and give tristimulus (L, a and b) values directly [73]. Colorimeters are typically quite
rugged and desirable for routine quality control measurements. Spectrophotometers
provide wavelength-by-wavelength spectral analysis of the reflecting and/or transmitting
properties of objects, and are more commonly used in research and development
laboratories [73].
Pigments of vegetables may also be analyzed quantitatively by extraction with specific
solvents, filtration, and the use of various methods based on spectrophotometry.
Separation using reversed phase high performance liquid chromatography (HPLC) may
be useful prior to measurement of absorption of light in the UV/visible wavelength
spectrum. Colorimetric methods are based on the Lambert-Beer law which describes the
relationship between the concentration of a substance and its color intensity:
E = ε’lc
The extinction coefficient E is proportional to ε’, the molar extinction coefficient of the
substance, l, the length of the light path in centimeters, and c, the concentration in g l−1
.
1.3.2.2. Texture
Most methods used for the evaluation of the textural properties of vegetables comprise a
wide range of simple and rapid tests, including puncture, compression, extrusion, shear,
and others. The puncture test, which is a force measuring method that has the dimensions
mass, length, and time, is the most frequently used method for textural evaluation. It

33
consists of measuring the force and/or deformation required to push a probe or a punch
into a food material to a depth that causes irreversible damage or failure. Puncture probes
of a specific diameter may be easily fitted to laboratory-scale instruments such as the
Maturometer, the Instron, and the Texture Technologies TAXT2 machine for more
controlled measurements [74].
1.3.2.3. Flavor- Aroma and Taste
Flavor may be evaluated with either instrumental or sensory methods, however, sensory
methods are the most critical to this particular attribute. Therefore, flavor may be the most
challenging quality attribute to both measure and correlate to consumer acceptability.
1.3.2.3.1. Analysis of aroma compounds
There are several challenges in the analysis of aroma compounds. It involves their
isolation from a given product, further separation, quantification and then correlating their
odor to the chemical structure. Odor molecules can be found in any class of chemical
compounds and thus can have widely varying structure and polarity. Further, these
compounds are labile and susceptible to chemical changes. For example, terpenes can
undergo photooxidation/ rearrangements in the presence of light or unsaturated
compounds can undergo polymerization in the presence of air. Such changes are of
concern during sample preparation as they generate artifacts. The problem is further
compounded by their occurrence in minute quantities (ppb-ppt) requiring sensitive and
sophisticated instruments for their detection and analysis. Contribution of an odorant to
the total aroma of a food product is additionally dependent on its threshold, which results

34
in even a compound present in minute amount having a greater contribution to the odor
than constituents present in very large concentration. Two terms namely "odor impact
compounds" and "contributory odor compounds" have thus been used to define top odor
notes. The former refers to those compounds that actually contribute to the typical odor of
a product while the latter modify the typical odor to a pleasant and acceptable note.
1.3.2.3.2. Isolation of aroma principles
Aroma isolation from a given matrix involves crushing, homogenizing, blending or
extracting the matrix with minimum loss in these constituents. Fresh materials contain
active enzymes in their tissues that can alter the aroma profile once cellular disruption has
occurred. The complex nature of the food matrix containing proteins, fats or
carbohydrates makes the process of aroma isolation complicated. Solvent extraction
using organic solvents at room or sub ambient temperatures is one of the most common
and conventional method for extraction of aroma compounds. The nature of the solvent
used, polar or non-polar, depends on the type of compounds to be isolated and identified.
Drawbacks of this method, however, are the co-extraction of non-volatile constituents
posing problems in recovery of volatile odors and the solvent impurities interfering in the
analysis, and falsely identified as a sample constituent, particularly when large amounts
of solvent are used. Supercritical fluids are now being used particularly in supercritical
fluid extraction, thus avoiding the problem posed by the use of organic solvents. SFE uses
variety of fluids (typically, CO2 possibly modified with very low amounts of organic
solvents as modifiers), high pressures (2000-4000 psi) and elevated temperatures (50-

35
150°C). The method produces clean extracts with no additional concentration for gas
chromatographic (GC) analysis.
Steam distillation techniques such as simultaneous distillation extraction (SDE) are
widely used for the isolation of aroma from vegetables. However, isolation of odor
molecules using SDE can bring about drastic changes in odor quality such as formation of
cooked odors. High vacuum low temperature distillation, solid phase micro-extraction,
microwave-assisted extraction, pressurized fluid extraction and head space techniques are
generally employed for extracting the fresh aroma of the vegetables to avoid artifact
formation due to thermal treatment in steam distillation techniques.
High vacuum distillation is a mild technique operated at or below the ambient
temperature wherein the potential loss of very low boiling volatiles is minimized. Artifact
formation observed in many other distillation techniques is eliminated. The method
provides for true odor of a given product. However, only low yield of aroma concentrates
are obtained compared to steam distillation technique and thus is generally used for the
isolation of labile compounds or when the aroma impact components have to be identified
or confirmed.
Microwave-assisted extraction involves extraction using microwave transparent solvents.
Contents of the cells broken by internal heating at microscopic level by microwave
energy come into contact with surrounding cool solvents avoiding thermal degradation of
labile odors. However, concentration of the isolate prior to GC analysis is required.
Headspace analysis is another very useful technique for rapid identification of volatile
aroma in headspace above a food sample. Two methods generally employed are the static

36
and dynamic headspace techniques. Static headspace involves enrichment of volatiles in a
closed chamber and is generally used when low volatile emitting samples are to be
investigated. The method has the disadvantage of long sampling times. In order to reduce
sampling time and to obtain better yields in static headspace, solid phase microextraction
(SPME) is currently employed for collection and further identification by GC. The
method is fast, effective, simple and is based on adsorption-desorption technique using an
inert fiber coated with different types of adsorbents varying in polarity and thickness and
used depending on the application demanded. Non-polar volatile compounds are
effectively extracted with non-polar fiber coatings such as polydimethylsiloxane (PDMS)
while polar volatiles can be extracted with PDMS/divinylbenzene or PDMS/Carboxene
polar fibers. The fibers equilibrated with headspace volatiles are directly transferred to the
GC injection port where the compounds are desorbed thermally. This eliminates solvent-
mediated desorption, thereby reducing the risk of solvent contamination. Some of the
limitations of SPME include (i) no repeated injections are possible, and (ii) the low
amount of material adsorbed on SPME fibers makes the method amenable only to GC
analysis but not for structure elucidation of unknown compounds. Consistent sampling
time, temperature and sample volume are crucial to obtain comparable results.
In dynamic headspace, a continuous air stream is passed over the headspace, and the
odorous compounds carried along with air are trapped on to porous polymeric traps such
as Tenax (2,6- diphenyl-p-phenylene oxide) and Porapack (ethylvinylbenzene-
divinylbenzene) or carbon-based adsorbents such as activated charcoal, carbon molecular
sieves and graphitized carbon black. The volatiles can be directly desorbed from the

37
adsorbent into the GC in case of porous polymers while in case of carbon-based
adsorbents the volatiles are generally eluted with small volumes (30-40 µl) of organic
solvents. Although, Tenax has a lower capacity than Porapack, it has higher thermal
stability and thus is particularly suited for thermal desorption of volatile compounds in
GC analysis. A combination of tenax and charcoal with high adsorbing capacity have
been employed for trapping full range of odorants varying widely in their polarities.
Dynamic headspace permits collection of large amount of volatile aiding in identification
of unknown structures.
1.3.2.3.3. Separation and detection of aroma compounds
As discussed earlier, a volatile odor extract is generally made up of an aroma bouquet
containing anywhere from a few to several different constituents present in varying
amounts. The individual components have to be separated from the mixture to facilitate
their identification. The most commonly used method of separation is the
chromatographic technique based on adsorption / partition of constituents between two
phases. Among the chromatographic techniques, gas liquid chromatography (GLC) is the
most efficient technique for the separation, identification and quantification of volatile
organic compounds. The separations are affected by both sample preparation and
isolation procedure. The nature of the stationary phase in the column has a distinct impact
on separation efficiency. Commonly used stationary phases are the non polar dimethyl
polysiloxanes (DB-l, DB-5, CPSil 5, SE-30 and OV-1) and the more polar polyethylene
glycol polymers (CarbowaxTM
20 M, DB-Wax and HP 20M). For different stationary

38
phases, retention index data such as kovats index system have been developed to facilitate
compound characterization and identification. Detection of peaks can be carried out using
two types of detector. First type include the flame ionization detector (FID) and the
thermal conductivity detector (TCD) that provide the retention times while the second
type include the mass spectrometer (MS) and the Fourier transform infrared (FT-IR)
spectrometers that aid in obtaining structural information. FID is a highly sensitive
detector (0.05 – 0.5 ng per compound) and is based on detection of ions formed when
organic compounds are burnt in a flame, while TCD, a less sensitive detector, operates by
differential thermal conductivity of gaseous mixture. MS with a sensitivity of 0.1 - 1 ng
per compound, relies on generation of positively charged molecules/and molecule
fragments from compounds separated on the GC column. Several comprehensive mass
spectral libraries (WILEY, NIST MS data base) have been established and are currently
used in EI-MS searches for tentative compound identification. Unambiguous
identification can, however, be achieved by comparison of mass spectrum with that of
authentic standards analyzed on the same column and determination of kovats indices on
at least two columns with different polarities. Multi dimensional GC, wherein
constituents of volatile isolates are separated by sequentially passing through two
successive columns, is used for separation of complex isolates such as essential oils.
Only a small fraction of the large number of volatiles in a given aroma isolate actually
contributes to the odor. The distinction between odor active compounds and the whole
range of volatiles present in an isolate from a food is thus an important task in odor
analysis. Sniffing the gas chromatographic effluents of an isolate in order to associate

39
odor activity with eluting compounds is an interesting approach. Principal analytical
technique used in this regard is the gas chromatography-olfactometry (GC-O) technique
that aids in assessing the aroma potential of a compound. GC-MS-O provides a means of
identification of compounds. First formal approach to determine contribution of a volatile
compound to the overall odor is based on its odor activity values (OAV) which is defined
as the ratio of concentration of the volatile compound to its odor threshold. The so-called
odor impact compounds can be distinguished from other volatiles by their high OAV.
Among the GC-O techniques, the dilution sniffing methods namely Aroma Extraction
Dilution Analysis (AEDA) and the Combined Hedonic Aroma Response measurements
(CHARM) are routinely used for identification of odor active constituents. Both methods
involve sequential dilution of samples. In AEDA, the most widely used method, each
dilution is sniffed after injection on to the GC until no significant odor is detected. The
result is then expressed as a flavor dilution (FD) factor which is the ratio of concentration
of the odorant in the initial extract to its concentration in the most dilute extract in which
an odor was detected. However, the method requires evaluation by a trained panel. The
methods thus lack reproducibility due to variability within and between sensory panelists.
A more recent method based on frequency of detection of a given odor, rather than
perceived intensity termed as Olfactory Global Analysis, eliminates the drawback of
dilution techniques. The repeatability of the method has been demonstrated to be
satisfactory despite the use of untrained sensory panel. The method is also twice as fast as
other GC-O techniques. A group of assessors is, however, a prerequisite for a reliable

40
GC-O analysis and thus the results can be systematically affected due to decreasing
alertness of the assessor.
1.3.2.3.4. Isolation and identification of bound aroma glycosides
The glycosidic aroma precursors are isolated from plant extracts (aqeuous or aqueous
methanol) by selective retention on C-18 reversed phase adsorbent [75] or amberlite
XAD-2 resin [76], followed by the desorption of the retained glycosides using EtOAc or
MeOH. The eluate so obtained is generally subjected to acidic or enzymatic hydrolysis
and the liberated aglycones are analyzed by GC/MS for identification. However, to
characterize intact glyco-conjugates, sophisticated steps of chromatographic separations
need to be followed. For preliminary separations, LC techniques are generally suited,
such as preparative HPLC and size exclusion chromatography. The isolates are then
subjected to repeated purification steps before identification. Purified compounds are
identified based on spectroscopic techniques such as NMR, IR, MS, or chiroptical
methods or analysis of hydrolysis products by GC/MS.
1.3.3. Analysis of bioactive phytochemicals
The phytochemicals may be extracted depending on their water or lipid solubility and are
typically analyzed using HPLC. Major anti-oxidant phytochemicals such as polyphenolic
compounds like phenolic acids, flavonols, flavones or the flavonoids, are extracted in
methanolic or ethanolic extract of the tissue, which after preliminary cleanup are
subjected to HPLC or LC/MS analysis for separation and identification of the compounds
[77]. In the case of colored phytochemicals like anthocyanins, it is possible to estimate
its content by measuring the intensity of color or a/b value with a colorimeter, but such a
41
physical method is not available for most nutrients. Glucosinolates generally require hot
aqueous alcohols such as methanol: water (70:30) for their isolation from plant materials
in order to prevent their hydrolysis by myrosinase [88]. A prior separation into groups
normally precedes their identification and quantification by HPLC-MSn. Presence of
sulfate groups facilitates binding of these compounds to an anion exchange column and
thus allows separation of either the intact GSLs or “desulfo” derivatives after enzymatic
desulfation [78]. Direct analysis of volatile isothiocyanates and nitriles produced from
GSLs by GC/MS can also provide proof of the presence of corresponding GSL in intact
plant. On the other hand, lipophilic bioactive components such as carotenoids are
generally extracted using non-polar solvents such as petroleum ether, hexane, THF,
methanol, ethanol, or combinations of various solvents in different proportions. The
identification is usually carried out by Diode Array Detector (DAD) or MS. Most of the
vitamins are analyzed using standard AOAC methods.
1.4. Different methods for preservation of fresh-cut produce
A wide range of preservation techniques are available in food industry. Disinfectants
presently employed in commercial processing lines, such as chlorine has limited effect
(approx. 1 log reduction) on microbial populations and cannot be relied to eliminate
pathogenic microorganisms like L. monocytogenes. These disinfectants cannot prevent
damage due to elevated respiration and transpiration rates of minimally processed
products. In addition it is believed that they may form carcinogenic derivatives in water
(e.g. chloramines and trihalomethanes) [79]. Therefore, there is a need for research on

42
alternative treatments suitable for use on fresh-cut products. New protocols for
maintaining quality while inhibiting undesired microbial growth for both the production
facilities and distribution chains, are thus needed.
Newer methods available for preservation of RTC products can be classified in two
categories- chemical and physical. Chemical methods involve use of chlorine dioxide,
organic acids, hydrogen peroxide, calcium based solutions, ozone, electrolyzed water and
natural preservatives. Under physical methods of food preservation, high pressure
processing, pulsed white light, ultra violet light, pulsed electric field, oscillating magnetic
fields and ionizing radiation are the recent techniques which are being used widely.
1.4.1. Chemical preservatives
Among the chemical methods, chlorine dioxide with a better oxidation capacity than
chlorine, hydrogen peroxide, a strong oxidizing agent and ozonated water has been used
for reducing microbial populations and shelf life extension of fresh produce. Efficacy of
ClO2 in the inactivation of Listeria monocytogenes and Salmonella typhimurium [80], and
H2O2 solution in reducing microbial populations on fresh-cut bell peppers, cucumber,
zucchini, cantaloupe, and honeydew melon, without alteration in sensory characteristics
[81] have been reported. Although, antimicrobial activity of ozone is widely known, there
is little information available about its efficacy against food borne pathogens. Higher
corrosiveness of ozone, its negative effects on easily oxidizable compounds such as
vitamin C and carotenoids; and initial capital cost for its generation are the main
disadvantages in its use compared to other chemical preservatives.

43
Calcium is extensively used to extend the shelf life of fruits and vegetables. It helps
maintain the vegetable cell wall integrity by interacting with pectin to form calcium
pectate. Different salts of calcium used in food industry include calcium chloride, calcium
lactate and calcium propionate. Antibacterial properties have been reported for calcium
propionate during the treatment of honeydew melon, due to its ability to uncouple
microbial transport processes [82].
Acidic electrolyzed water (pH 2.1-4.5) has a strong bactericidal effect against pathogens
and spoilage microorganisms. It is more effective than chlorine due to its high oxidation-
reduction potential (ORP). A higher effectiveness of electrolyzed water in reducing viable
aerobes than ozone on whole lettuce has been demonstrated [83]. No adverse effects were
noted on the w.r.t. surface color, pH or general appearance of fresh-cut vegetables.
The reluctance of consumers towards the use of chemical preservatives in recent years
has resulted in the use of natural antimicrobials as preservatives. Organic acids such as
lactic, citric, acetic and tartaric acids are used as strong antimicrobial agents against
psychrophilic and mesophilic microorganisms in fresh-cut fruits and vegetables. The
antimicrobial action of organic acids is due to pH reduction in the environment,
disruption of membrane transport and/or permeability, anion accumulation, or a reduction
in internal cellular pH by the dissociation of hydrogen ions from the acid.
1.4.2. Physical methods of preservation
Several physical methods are currently employed for preservation of minimally processed
plant produce. Modified atmosphere packaging (MAP) for example aims at producing
low O2 and high CO2 in the atmosphere surrounding fresh cut produce. These conditions

44
reduce respiration rate thus delaying senescence and extending shelf life. In passive MAP
the package is sealed under normal atmospheric conditions and desired composition is
obtained due to produce respiration and film gas permeability. In active MAP the package
is flushed with a gas mixture of preset composition and once closed, no further control of
the gas composition is exercised. However, expensive equipment and materials (gases
and packaging) are required for MAP generation.
Ultraviolet (UV) light is another physical treatment widely employed in industry. UV
irradiation causes up to 4 log cycle reduction in bacterial, yeast and viral counts by
inducing DNA damage. Major advantage of this technique is the availability of relatively
inexpensive and easy to use equipment. Among the other technologies, treating products
with millisecond pulses (1–20 flashes/sec) of broad spectrum white light, about 20,000
times more intense than sunlight holds promise. Pulsed white light inactivates
microorganisms by combination of photochemical and photothermal effects, requires
very short treatment times and has a high throughput. The above methods, however,
have lower efficiencies due to their lower penetration and are thus mostly used for
surface sterilization.
1.4.2.1. Radiation Processing
Radiation processing is a promising technology for improving the shelf life of fresh-cut
produce. Treatment of food products by ionizing radiation is a physical process
involving direct exposure to electromagnetic γ-rays, X-rays or electron beam for
improvement in food safety and shelf life. It is a non thermal technology that effectively

45
eliminates food-borne pathogens in various foods including fresh vegetables without
compromising the nutritional properties or sensory qualities of food [84].
Gamma irradiation can be employed for inhibition of sprouting, delay in ripening, killing
of insect pests, parasites, pathogenic and spoilage microorganisms (Table 8). Radiation
by its direct effect on macromolecules and indirect effect through radiolysis of water
bring about alteration in the structure of essential bio-molecules present in insects,
parasites, and microorganisms, thus reducing their chances of survival.
In 1980, Joint Expert Committee of Food and Agriculture Organization / International
Atomic Energy Agency / World Health Organization on Food Irradiation concluded “The
irradiation treatment of any food commodity up to an overall average dose of 10 kGy
presents no radiological, microbiological or toxicological hazard.” As a result,
toxicological testing of foods so treated is no longer required. Food irradiation is now
legally accepted in many countries. In 1997, one more expert group constituted by WHO,
reaffirmed the safety of food irradiated at doses above 10 kGy. Consequently, in 2003
Codex Alimentarius Commission revised its Codex General Standard for Irradiated Foods
to set standards for irradiation of foods worldwide. Agreements on Sanitary and
Phytosanitary (SPS) Practices and Technical Barriers to Trade (TBT) under the World
Trade Organization (WTO) have provided for adoption of irradiation as an SPS measure
in international trade under the principle of equivalence. Thus, irradiation can be applied
to overcome quarantine barriers, and to hygienize products for international trade.
The range of dose commonly employed in various food irradiation applications to achieve
different objectives can be classified into three groups: low dose (< 1 kGy), medium dose

46
(1-10 kGy) and high dose (> 10 kGy) applications. Table 9 lists the food items approved
for food irradiation under FSSAI Indian rules.
Table 8. Various applications of food irradiation (Table adapted from FSSAI
(www.fssai.gov.in))

47
Table 9. Food items approved for radiation processing in India under FSSAI rules
1.4.2.2. Advantages of Radiation Processing
• It is an effective alternative to chemical fumigants that endanger human health and
environment.

48
• At recommended doses it maintains fresh-like character, sensory qualities, texture,
nutritive value and appearance of food.
• Does not produce any toxic residues in food.
• Unlike chemical fumigants irradiation can be carried out in pre-packaged foods and
hence no risk of post-irradiation contamination.
• Being highly penetrating and effective, large volumes of foodstuffs can be treated very
efficiently.
• Radiation processing is an eco-friendly treatment and does not pollute environment.
1.4.2.3. Effect of gamma irradiation on shelf-life of RTC vegetables
Shelf life of a fresh produce is determined by its microbial status as well as by its sensory
attributes such as color, texture and flavor (aroma and taste). Gamma irradiation has been
reported to cause minimal modification in these quality attributes of fresh-cut produce.
However, the levels of modification in the quality attributes might vary depending on the
raw material used and radiation dose delivered [85]. Studies conducted on irradiated RTC
vegetables have demonstrated no significant changes in the appearance, color, texture,
taste and overall acceptability after seven days of irradiation (1 kGy) as compared to the
control, when stored at low temperatures (4 - 10 °C) [86]. In contrast, adverse effects of
radiation treatment were observed on color, taste, flavor and texture by the sensory panel,
in pre-cut irradiated tomatoes (lycopersicon syn. L. esculentum), cantaloupe melon
(Cucumis melo), and watermelon (Citrulus lanatus) [87]. 88, Bibi et al. [88] also reported

49
a decreased firmness and lower appearance scores for irradiated tomatoes (L. esculentum)
as compared to controls during storage.
An improvement in the quality of fresh-cut produce by radiation processing has also been
reported by several researchers. Radiation treated products such as conventional chicory
had a better general acceptability when irradiated at doses 1.2 and 2 kGy [89]. The overall
acceptability of carrots was found to be higher up to a radiation dose of 2 kGy as
compared to corresponding controls [90]. The better quality retention in general, has been
attributed to the decreased physiological and microbial decay in the radiation processed
samples. Slight increase in sweetness was observed in radiation-processed carrot (Daucus
carota) at a dose of 2 kGy. Thus, radiation processing may be employed for improving
the shelf life of fresh-cut produce with minimum or no alteration in the sensory quality.
1.4.2.4. Microbial status of irradiated RTC vegetables
One of the main uses of radiation processing is to control the microbial spoilage of food
products. Ionizing radiation causes radiolysis of water producing reactive hydroxyl
radical. Hydroxyl radicals are extremely reactive and attack and damage cellular
components, especially DNA. Damage to genetic material results in inhibition of
microbial growth. Significant reduction in the microbial load consequent to radiation
processing has been widely reported in literature. Irradiation of broccoli and mung bean
sprouts at 1.0 kGy resulted in reduction of approximately 4.88 and 4.57 log CFU/g,
respectively, of a five-strain cocktail of L. monocytogenes. The effects of low-dose
irradiation on the microbiota of pre-cut tomato (lycopersicon syn. L. esculentum) were
investigated by Mohacsi-Farkas et al. [87]. Doses of 1–3 kGy were able to reduce

50
considerably the microbiological contamination in tomato. The low dose irradiation
reduced the viable cell count of Listeria monocytogenes by 2 log-cycles. A dose of 1 kGy
reduced the viable cell number by more than 5 log-cycles. These results indicate that
radiation processing has been successfully employed for microbial decontamination of the
fresh-cut fruits and vegetables. The technology therefore could result in improved shelf-
life of the fresh-cut produce.
1.4.2.5. Effect of radiation processing on phytochemicals
Levels of phytochemicals in plants vary depending on various conditions. Exposure to
radiation sources, wounding, storage at low temperatures, and/or exposure to extreme
temperatures [91] can lead to changes in the nature/content of bioactive phytochemicals.
In terms of radiation exposure, the changes depend on the applied dose (usually low and
medium doses have insignificant effects on phytochemicals), the sensitivity of the
phytochemicals towards irradiation, and the effect of irradiation on precursors that might
be responsible for the production and/or the accumulation of phytochemicals in the plant.
Radiation processing has been shown to either increase or decrease the antioxidant
content of plant produce, depending on the dose delivered, time of exposure and the
nature of raw material to be irradiated.
The enhanced antioxidant capacity of a plant after irradiation is mainly attributed either to
increased enzyme activity (e.g., phenylalanine ammonia-lyase and peroxidase activity) or
to the increased extractability from the tissues [85, 91]. It has been also proposed that
gamma radiation is capable of breaking the chemical bonds of polyphenols, resulting in

51
the release of low molecular weight water soluble phenols, leading to an increase of
antioxidant rich phenolics [92].
A positive correlation between phenolics and antioxidants has been observed in several
cases. The increased antioxidant capacity has been correlated with tissue browning
resulting from an action of polyphenol oxidase (PPO) [93]. Fan et al [94] while working
on lettuce, reported that the free radicals generated during irradiation might act as stress
signals and may trigger stress responses in lettuce, resulting in an increased antioxidant
synthesis. Fan et al. [95] studied the effect of radiation treatment (0, 0.5, 1 and 2 kGy) and
storage (up to 8 d) at 7-8 °C on phenolics content, antioxidant capacity and tissue
browning of romaine lettuce, iceberg lettuce and endive. Their results revealed an
enhancement in the phenolic content and antioxidant capacity of all vegetables at 4 and 8
d after irradiation. The increase in the total antioxidant capacity was attributed to
increased phenolic synthesis.
Reduction in contents of antioxidants has also been reported by various researchers. In
general, the decrease in antioxidants has been attributed to radiation-induced degradation
or the formation of free radicals [96]. Breitfellner et al [97] have reported that gamma-
irradiation (1 to10 kGy) of strawberries lead to the degradation of phenolic acids like
cinnamic, p-coumaric, gallic, and hydroxybenzoic acids.
In recent years there has been an increased demand for RTC vegetables among Indian
consumers. However, very less work has been carried out on the possibility of using
gamma radiation processing to extend the shelf-life of minimally processed Indian
vegetables. It was therefore of interest to determine the feasibility of using radiation

52
processing for extending the shelf life of some commonly used RTC Indian vegetables
and understand changes in major bioactive principles in these products.
1.5. Vegetables selected for the present work
Three popular Indian vegetables namely ash gourd (Benincasa hispida), pumpkin
(Cucurbita pepo) and drumstick (Moringa oleifera) were selected for the present study.
Besides their nutritive value, these vegetables have also been used traditionally for their
pharmacological and medicinal value.
1.5.1. Ash gourd (Benincasa hispida)
Ash gourd (Benincasa hispida), a member of the family Cucurbitaceae and native of
Asia, is one of the most important vegetables grown primarily for its fruits and usually
recognized for its nutritional and medicinal properties. It is also known as winter melon,
ash gourd, ash pumpkin, white gourd, white pumpkin, gourdmelon, tallow gourd, wax
gourd and Chinese watermelon [98]. The average production of the fruit of this green
vegetable is around 18.5 t/ha [99]. India is the second largest producer of this vegetable
after China [100]. The plant is monocious vine type bearing large green fruits that are
either allowed to spread on the ground or trained to climb a support. It takes from 6 to 9
weeks for the yellow flowers to develop after seed germination and the fruit matures after
a period of 2-3 months.
The fruit has been claimed to be a high quality vegetable, based on the Index of
Nutritional Quality (INQ) data [101]. It is a good source for natural sugars, amino acids,
organic acids, minerals and vitamins. Table 10 depicts the proximate composition of

53
immature and mature fruit. Moisture contents are quite high in the fruit accounting for 96
% of the edible portion of the mature fruit. Table 11 summarizes various vitamins and
minerals content reported in mature ash gourd fruit. It contains an appreciable amount of
vitamin C ranging from 1.35 – 68.00 mg/100 g while the content of thiamin is lowest
(0.02 – 0.04 mg/100 g). Potassium (K) and calcium (Ca) are the major minerals present in
ash gourd with concentrations ranging from 77 – 131 mg/100 g and 5 – 23 mg/100 g
respectively. Both these minerals play a crucial role in maintaining the electrolytic
balance of the body fluid.
Table 10. Proximate composition of immature and mature ash gourd fruit (g/100g of
edible portion) (Zaini et al., 2010 [100])
The vegetable finds use as a medicine in the traditional Asian system of medicine system
such as the Ayurveda. It is an important ingredient of “Kusmanda lehyam” (Ayurvedic
medicine) [102]. It a rich source of various functionally important bioactives such as
triterpenes, phenolics, sterols, and glycosides. It has been widely used for the treatment of
epilepsy and other nervous disorders [103]. The juice and extract of the fruit is known to
possess significant anti-ulcer, anti-depressant and diuretic activities, and provide

54
protection against histamine-induced bronchospasm [101]. Common medicinal and
pharmacological properties of the vegetable are listed in table 12.
Table 11. Vitamins and minerals profile of mature ash gourd fruit (100 Zaini et al., 2010)
Owing to its popularity, many studies on ash gourd have been reported. Some volatile
compounds have been identified in the ash gourd with aliphatic alcohols and carbonyl
compounds as the major class [104]. Volatile compounds of the beverages prepared from
this vegetable were analyzed by Sikorski [105] and Wu et al. [106]. Pyrazines were found
to be major compounds detected in beverages which were presumably formed by the
Maillard reaction during extraction of juices.

55
Table 12. Some common medicinal and pharmacological properties of different parts of
ash gourd (100 adapted from Zaini et al., 2010 [100])
The vegetable is sold in the whole as well as in the sliced form. The intact vegetable can
be stored for several days. However, the large size of the vegetable creates problem for its
storage in supermarket and retail outlets, thus requiring some degree of preparation. Once
cut, its quality deteriorates within a day or two. The high moisture content and presence
of macronutrients such as sugars make it vulnerable to spoilage by microorganisms
limiting its marketability. Recently, researchers have examined shelf life extension of cut

56
ash gourd using a combination of chemical pretreatment and partial dehydration [107].
However, after the treatment, the product was not fresh. It was therefore of interest to
determine the feasibility of using gamma irradiation for improving the shelf life of ready-
to-cook ash gourd and assessing the effect of such a processing technique on its various
physico-chemical properties.
1.5.2. Drumstick (Moringa oleifera)
Moringa oleifera is the most widely cultivated species of a monogeneric family, the
Moringaceae, and is native to the sub-Himalayan tracts of India, Pakistan, Bangladesh
and Afghanistan. It is also called as the horseradish, drumstick, benzolive, kelor,
marango, mlonge, moonga, mulangay, saijan, sajna or Ben oil tree. It is a slender
softwood tree that branches freely, and can be extremely fast growing. Although it can
reach heights in excess of 10 m (33 ft), it is generally considered a small- to medium-size
tree. The fruits are tri-lobed capsules, and are frequently referred to as “pods.”
Commercial production of immature pods for processing is a large industry in India with
about 1.2 million MT (metric tons) produced annually on 38,000 ha.
It is an important food commodity which has received enormous attention as the ‘natural
nutrition of the tropics’. Moringa trees have been used to combat malnutrition, especially
among infants and nursing mothers. Almost every part of the plant - the leaves, fruit,
flowers and pods are used as a highly nutritive vegetable in many countries including
India, Pakistan, Philippines, Hawaii and many parts of Africa [108]. The proximate
composition of drumstick pods is shown in Table 13. The high concentrations of ascorbic
57
acid, oestrogenic compounds and β-sitosterol, iron, calcium, phosphorus, copper,
vitamins A, B and C, α-tocopherol, riboflavin, nicotinic acid, folic acid, pyridoxine, β-
carotene, protein, and in particular essential amino acids such as methionine, cystine,
tryptophan and lysine present in drumstick leaves and pods make it a virtually ideal
dietary supplement [109].
Apart from nutritional values, it has numerous medicinal uses, which have long been
recognized in the Ayurvedic and Unani systems of medicine [110]. The various medicinal
and pharmacological activities of different parts of the plant are summarized in Table 14.
Almost all parts of this plant : root, stem, bark, gum, leaf, fruit (pods), flowers, seed and
seed oil have been used for various ailments in the indigenous medicine of South Asia,
including the treatment of inflammation and infectious diseases along with
cardiovascular, gastrointestinal, hematological and hepatorenal disorders [111, 112].The
medicinal properties of the plant have been attributed to the presence of bioactive
phytochemicals including phenolic compounds, and a unique group of compounds called
glucosinolates and isothiocyanates [113, 58]. They have been reported to possess
hypotensive, anticancer, and antibacterial activity. The compounds responsible for these
properties include 4-(4'-O-acetyl-a-L-rhamnopyranosyloxy)benzyl isothiocyanate [1], 4-
(α-L-rhamnopyranosyloxy)benzyl isothiocyanate [2], niazimicin [3], pterygospermin [4],
benzyl isothiocyanate [5], and 4-(α-L-rhamnopyranosyloxy)benzyl glucosinolate [6]
(Figure 8). While these compounds are relatively unique to the Moringa family, it is also
rich in a number of vitamins and minerals as well as other more commonly recognized
phytochemicals such as the carotenoids (including β-carotene or pro-vitamin A).

58
Table 13. Proximate composition and minerals and vitamins (content per 100 g of edible
portion) in drumstick pods

59
Table 14. Medicinal and pharmacological activities of different parts of drumstick tree
It has been estimated that about one-fourth of all Moringa oleifera produce harvested is
spoiled before consumption. Therefore, there are increasing interests to preserve the
vegetable due to its medicinal and therapeutic properties [114]. Studies have been
attempted to preserve the shelf-life of leaves and pods of this vegetable using various
preservation techniques [115]. Treatments with germicide, salt and turmeric were
employed in various combinations and it was followed with dehydration by sun drying,
oven drying or wind drying. Microbiological and physico-chemical analyses were
performed on the samples for a storage period of 4 months. The employed preservation

60
techniques involving dehydration were found to effectively extend the shelf life of
Moringa oleifera without alteration in the nutritional value. However, no reports exist on
the preservation or shelf-life extension of fresh-cut drumstick pods. It was therefore of
interest to study the effect of gamma irradiation on the shelf-life and quality attributes of
the fresh-cut drumstick.
Figure 8. Glucosinolates reported in drumstick (Moringa Oleifera). 4-(4'-O-acetyl-a-L-
rhamnopyranosyloxy)benzyl isothiocyanate [1], 4-(α-L-rhamnopyranosyloxy)benzyl
isothiocyanate [2], niazimicin [3], pterygospermin [4], benzyl isothiocyanate [5], and 4-
(α-L-rhamnopyranosyloxy)benzyl glucosinolate [6]

61
1.5.3. Pumpkin (Cucurbita pepo)
Pumpkin (Cucurbita pepo) belongs to the Cucurbitaceae family which includes melons,
squashes, cucumbers and gourds. It is defined botanically as a fruit although commonly
regarded as a vegetable by the consumer. The pumpkin varies greatly in shape, ranging
from oblate to oblong, with smooth, slightly ribbed skin and deep yellow to orange
coloration. It is widely grown and consumed in many countries around the world [116]
including India. The biggest international producers of pumpkins include the United
States, Canada, Mexico, India, and China. According to estimations by the Food and
Agriculture Organization of the United Nations (FAO), world production of pumpkins in
2007 was over 20 million tons, especially in China, India, Russia, United States, and
Egypt [117].
In recent years, pumpkin has received considerable attention because of the nutritional
and health protective value. The vegetable significantly contributes to nutrition as it is a
rich source of minerals. It also contains a high content of carotenoids in its flesh,
including β-carotene, lutein, and violaxantine. It also possesses several phytoconstituents
belonging to the class of alkaloids, flavonoids, and fatty acids such as palmitic, oleic and
linoleic acids [118]. In addition, many cultivars of pumpkin are characterized by a high
content of vitamin C [118]. It possesses low calorific value (15–25 kcal in 100 g) and due
to the presence of numerous, easily digestible nutrients it has become an important
component of slimming diets. It regulates metabolism, lowers glucose level in blood, and
possesses detoxicating as well as dehydrating properties. Other uses attributed to pumpkin
species include defense against cancer [119] and diabetes and for internal as well as

62
external management of worms and parasites. Tables 15 and 16 represent the proximate
composition and medicinal properties of the pumpkin.
Due to the large size of the vegetable it is difficult to store thus restricting marketability.
Although, the intact vegetable can be stored for several days; once cut, it is highly
perishable and deteriorates within 1-2 days. The high moisture content and presence of
macronutrients such as sugars make it vulnerable to spoilage by microorganisms limiting
its marketability. Recently, the shelf-life of cut pumpkin under modified atmospheric
packaging (30% CO2/ 70% N2; 100% CO2 and vacuum) and stored at refrigeration
temperature was examined [120]. 100% CO2 was inferred to be the best by these workers
for a storage period of 5 days, with total microbial counts of 7.7 x 10³ CFU g-1 and yeast
and mould counts of approx 10 CFU g-1 after 5 days. However, to the best of our
knowledge, efficacy of radiation processing in enhancing the shelf-life and quality of
fresh-cut pumpkin has not been investigated so far.

63
Table 15. Proximate and minerals and vitamins content in pumpkin pulp (per 100 g of
edible portion)
(Table adapted from USDA Nutrient Database )

64
Table 16. Medicinal and pharmacological activities of pumpkin

65
1.6. Scope of the work - Aims and objectives
Importance of convenience foods has increased considerably in recent times. These
include fresh-cut ready-to-eat (RTE) fruits and ready-to-cook (RTC) vegetables.
However, they have very limited marketing due to short shelf life. Gamma irradiation has
been demonstrated as a promising tool for improving the shelf-life of such fresh-cut
produce. Radiation processing is reported to act as an abiotic stress for the living tissues
such as fresh-cut fruits and vegetables, thereby resulting in changes in the post harvest
physiology of the product. Consumers and food safety advocates are therefore worried
about the nutritional and chemical quality of such radiation treated produce.
One of the main mechanisms by which plants protect themselves against adverse
environmental abiotic and biotic stress is production of reactive oxygen species (ROS).
However, emerging data show that ROS production in certain situation can also
contribute to the improved physiology and increased fitness of plants. The effect of
different postharvest abiotic stresses (i.e., wounding, UV-light, hyperoxia, and the
exogenous application of certain compounds or hormones) on the accumulation of
phenolic compounds in fruits and vegetables has been evaluated in several studies.
Nevertheless, little is known on the physiological basis for the accumulation of
phytochemicals/antioxidants as a result of radiation processing in vegetables of Indian
origin. Increasing the scientific knowledge in this area is critical to envisage strategies
that permit the effective use of crops as bio-factories of nutraceuticals.
Vegetables during processing such as cutting and cooking give rise to characteristic
aroma to the cuisine. Presence of glycosidic precursors of volatile aroma compounds has

66
been well established in the plant kingdom. These precursors are known to undergo
hydrolytic or enzymatic breakdown during processing, resulting in the release of volatile
aroma compounds, and hence enhanced aroma quality. The same hypothesis may be
extended to explain the released aroma during processing in vegetables, however, it needs
to be further explored. Few reports exist on the nature of aroma compounds present in
most of the vegetables, especially of Indian origin. Radiation processing is also reported
to result in breakdown of aroma glycoconjugates resulting in liberation of free aroma and
thus an enhancement in overall flavor quality. No studies exist on the effect of irradiation
on flavor precursors in majority of the vegetables. As aroma quality plays a critical role in
deciding the consumer acceptance of a food product. The effect of radiation processing on
the aroma constituents of fresh-cut produce thus needs to be investigated.
There is an increasing interest in the bioactive components of native plants and
identifying their role as functional foods. This has resulted in a shift towards identifying
native plant foods possessing novel organic molecules with unique bioactivities. In this
context use of Indian vegetables as medicinal ingredients in Ayurveda has been in
practice since early times. Despite being a treasure house of active constituents, very few
studies exist on the nature of the constituents present in majority of the Indian vegetables.
Although, several reports exist in the literature regarding chemical composition, aroma
and medicinal attributes of the above mentioned vegetables, extensive work is required to
study the effect of gamma irradiation on various phyto-chemical aspects of these
vegetables in order to understand the sensory and nutritional status of the radiation
processed product.

67
Therefore, the major objectives of the thesis are as follows:
To study the effect of gamma irradiation on the shelf life of ready-to-cook (RTC)
products of selected Indian vegetables namely ash gourd (Benincasa hispida),
pumpkin (Cucurbita pepo) and drumstick (Moringa oleifera).
Physico-chemical characterization of the developed shelf stable radiation processed
RTC products.
Isolation and identification of aroma compounds, key odorants in the above mentioned
vegetables and to study the effect of radiation processing and storage on the aroma
profiles.
To study the effect of radiation processing on some bioactive principles from the
selected vegetables.

68
CHAPTER 2
MATERIALS AND METHODS

69
2. 1. Materials
2.1.1 Plant material
Vegetables - ash gourd (Benincasa hispida), bottle gourd (Lagenaria siceraria),
pumpkin (Cucurbita pepo), lady finger (Abelmoschus esculentus) and drumstick
(Moringa oleifera) were procured from a local grower around Mumbai, India. The
vegetables were brought to the laboratory within 12 h after harvesting and immediately
stored at refrigerated temperatures (10 ± 1 °C) before processing.
2.1.2. Chemicals and materials
Amberlite XAD-2 resin was procured from Sigma-Aldrich, USA. Reverse phase (C18)
solid phase extraction cartridges with 6 mL volume and 0.5 g active phase were
procured from Supelco, USA. Solid phase micro extraction (SPME) fibres made up of
Poly dimethoxy siloxane-divinylbenzene-carboxen (PDMS/DVB/CAR) with film
thickness of 0.65 μM and 1 cm length, were bought from Supleco, USA.
Methanol and dichloromethane was procured from Merck India Pvt. Ltd. Diethyl ether,
n-hexane and n-butanol was purchased from S.D. Fine Chemicals, India. All solvents
used were of analytical grade and were redistilled before use. HPLC grade solvents such
as acetonitrile, methanol, glacial acetic acid and o-phosphoric acid were procured from
Merck Ltd., Germany.
PCA, PDA, Murashige & Skoog Medium, (With Vitamins; without CaCl2, Sucrose,
IAA, Kinetin and Agar) and DPPH was purchased from HiMedia Laboratories, India.
Folins-ciocalteu reagent was purchased from Merck, India. Boric acid and disodium
hydrogen-o-phosphate were from Qualigens Fine Chemicals and sodium dihydrogen-o-

70
phosphate was procured from Thomas Baker Ltd. Potassium ferricyanide (K3[Fe(CN)6])
and sodium bicarbonate (NaHCO3) were from BDH Laboratory Chemicals and Chemco
Fine Chemicals, respectively. Hydrogen peroxide and m-phosphoric acid were procured
from S.D. Fine Chemicals Ltd.
Various standard compounds used i.e. acetoin, acetobromo-D-glucose, phenolic acids,
carotenoids, enzyme preparations – pectinase (≥ 5 U/mg protein), myrosinase (≥ 100
U/g) and sulfatase (≥ 10000 U/g) were bought from Sigma Aldrich, USA.
2.2. Methodology
2.2.1. Development of ready-to-cook (RTC) vegetables using radiation processing
2.2.1.1. Preparation of RTC vegetables
Whole ash gourd, bottle gourd, pumpkin, lady finger and drumsticks were washed in
running tap water to remove adhered dust. After washing, ash gourd, bottle gourd and
pumpkin were hand peeled and cut into small pieces of dimensions 2.5 cm × 2.5 cm ×
0.7 cm with a sharp sterile knife. The lady fingers and drumstick pods were transversely
cut in to pieces of length 1.5 and 4.0 cm, respectively. The cut pieces of each vegetable
were separately randomized before packaging, and were packed (100 g) into polystyrene
trays (inner dimensions: 9 cm × 9 cm × 2.5 cm). The trays were then over-wrapped all
around with cling film (Flexo film wraps ltd., Aurangabad, Maharashtra, India) and
sealed to avoid any leakage. Film used in the present study had thickness of 8–10 µm
and permeability to oxygen and carbon dioxide as 1.7 and 10.3 cm3m
−2 s
−1 Pa
−1
respectively (data as provided by supplier).

71
2.2.1.2. Radiation processing and storage
Packaged cut vegetables were subjected to various radiation doses (0.5, 1.0, 1.5, 2.0 and
2.5 kGy) in a cobalt-60 irradiator (GC-5000, BRIT, Mumbai, India) having a dose rate
of 1.64 Gy/s. Irradiator was calibrated by Fricke dosimeter before start of experiment
and had a dose uniformity ratio of 1.2. Irradiated samples were stored in the dark at 10 ±
1 °C. In preliminary studies on RTC products carried out in our laboratory, the optimal
storage temperature was found to be 10 °C. Storage at a lower temperature (4 °C)
induced chilling injury resulting in low aroma scores whereas at a higher temperature of
15 °C, physiological as well as microbial spoilage was very rapid resulting in shorter
shelf life. Non-irradiated samples of respective vegetables stored at 10 ± 1 °C were used
as controls during the entire storage period. Three replicates were prepared for each
dose and storage day. The samples were examined at different time intervals during
storage. During initial investigations, it was observed that cut bottle gourd developed
browning immediately after cutting. In radiation processed cut lady finger, the sticky
mucilaginous secretions increased with radiation dose, thus making irradiated lady
finger unacceptable by the sensory panel. The treatment of anti-browning reagents in
case of bottle gourd and some chemical treatments in case of lady finger prior to
irradiation could help in their shelf-life improvement. It was therefore inferred that
radiation processed bottle gourd and lady finger were not amenable for development of
RTC products and hence they were not studied further.

72
2.2.1.3. Optimization of quality parameters
Experimental design and subsequent analysis of results were performed by a software
Design Expert 8.0 (State-ease Inc., U.S.A.). Control and radiation-treated samples were
analysed on day 0, 5, 8, 12 and 15 after packaging for ash gourd and drumstick, whereas
for pumpkin, the analyses were conducted on days 0, 7, 14, 21 and 28 after packaging.
A full factorial experimental design was employed with gamma radiation dose and
storage time as variable factors to be optimized [121]. Experiments were planned at
different radiation doses (0, 0.5, 1.0, 1.5, 2.0 and 2.5 kGy). Three replicates were
prepared for each dose and storage day. Parameters studied for analyzing product
quality were microbial load, color, texture and sensory acceptability.
Models for individual responses were generated by fitting experimental data into third
order polynomial equations and then removing insignificant terms by backward
regression method as reported earlier [122]. In this approach, model terms with highest
values of partial probability (p-value) are removed first and the process is stopped when
the p-value of next term out satisfies the specified alpha out criterion. Value of alpha out
was kept 0.1 which leads to an overall model with terms significant at 0.05 levels. The
models were analyzed by analysis of variance (ANOVA) and the coefficient of
determination (R2) was used to quantify the predictive capability of the model. Fitted
polynomial equations were then plotted in order to visualize the interrelationship of
response and experimental levels of each factor. Optimal conditions were then derived
using numerical optimization process. Criteria for desired microbial and sensory

73
qualities were provided and model equations solved to obtain optimum processing
conditions.
2.2.1.3.1. Microbial quality
Standard methods were used to enumerate total microbial load present in the RTC
vegetables at each sampling time and treatment for the intended duration of storage [123].
Enumeration of total aerobic mesophilic bacteria was carried out by pour-plate method on
plate count agar (Himedia, Mumbai, India). Incubation was done at 37 °C for 24 h. Total
yeast and mould count was performed by pour-plate method on potato dextrose agar
(Himedia, Mumbai, India) supplemented with 0.01 g L-1
tartaric acid to lower pH of the
medium to 3.5. Plates were incubated at 37 °C for 48 h. Microbial counts were expressed
as log10 CFU g-1
. Each analysis was performed in triplicate.
2.2.1.3.2. Sensory quality
Cut pieces of each vegetable were cooked separately in boiling water for 5 min and
presented to the assessors in white trays for sensory assessment in different sessions.
Hedonic testing was carried out for each vegetable by 15 panelists of trained sensory
panel using a 9-point scale with 1, dislike extremely or not characteristic of the product
and 9, like extremely or very characteristic of the product [123]. Parameters evaluated
were colour, aroma, texture, taste, aftertaste and overall acceptability. Irradiated and
stored samples were compared with fresh-cut control samples of the respective vegetables
on each day of study to analyze all the parameters.

74
Color and firmness were also assessed instrumentally for all the samples prepared.
Surface colour values were evaluated using a colorimeter (CM- 3600d Konica Minolta
sensing Inc., Japan) by measuring the three Commission Internationale de l’Eclairage
(CIE) coordinates, L (lightness), a (−green, +red), and b (−blue, +yellow). The instrument
was calibrated using a white tile supplied along with the equipment. Six pieces of each
vegetable were selected randomly from every packaged tray for color measurement and
results represent their average. Firmness was measured using a texture analyzer
(TA.XTPLUS, Stable Microsystems Ltd., Surrey, England) with a 980 N load cell,
equipped with a cone probe (P/45C s/s batch No. 3889) for ash gourd and pumpkin, while
a needle probe (P/2N s/s batch No. 10451) was employed for piercing test through the
drumstick samples. The test was designed with a trigger force of 0.147 N and test speed
of 0.5 mm/s. The peak force required to penetrate samples was referred as a measure of
firmness of the sample. Data were collected for six replicates from each tray and results
were expressed as their average.
At optimized processing conditions, sensory evaluation was also performed by
quantitative descriptive analysis (QDA) [124] along with hedonic analysis. A trained
panel consisting of 10 members, 6 males and 4 females assessed the samples using
unstructured 150-mm scale. The sensory attributes for each of the vegetable studied were
finalized during prior training sessions conducted. The sensory attributes assessed for
pumpkin were color (yellow), aroma (pumpkin-like, irradiated and musty), and taste
(pumpkin like and irradiated); for ash gourd the attributes were color (green), texture,
aroma (ash gourd-like, buttery irradiated and musty), and taste (ash gourd like and

75
irradiated); and that for drumstick were color (green, brown), texture, aroma (drumstick-
like, green, irradiated and musty), and taste (sweet, drumstick like and irradiated).
Assessments were repeated twice and sensory data were collected by measuring distance
(mm) from the origin. Non-irradiated ash gourd samples exhibited visible browning after
a storage period of 5 d, while browning was inhibited in the radiation processed samples
throughout the intended storage.
2.2.2. Characterization of the developed products at optimized parameters
2.2.2.1. Nutritional quality
2.2.2.1.1. Preparation of methanolic extract
Each vegetable (10 g) was separately homogenized and extracted twice with 20 mL
distilled methanol in an omnimixer (Sorvall, U.S.A). The extract was centrifuged at 3000
x g for 30 min and the supernatant thus collected was made to a final volume of 50 mL by
adding methanol. Aliquots were used for determining antioxidant status in terms of total
phenolics and DPPH radical scavenging potential.
2.2.2.1.2. Radical scavenging activity
DPPH radical scavenging assay was used to evaluate total antioxidant activity of the RTC
vegetables according to the procedure of Wen et al. [125]. The final reaction mixture used
for the study was 3 mL (25 µL methanolic extract + 1 mLof DPPH solution (200 µM in
methanol) + 1975 µL methanol). After incubation under dark conditions for 30 min,
absorbance was measured at 516 nm. Total antioxidant activity was expressed as the

76
Gallic acid equivalent mass per mass of the vegetable studied (mg kg−1
). [GAE (mg kg−1
)
= (((% Inhibition – 3.866)/15.67) X 10 X 40)/10); R2 = 0.97]
2.2.2.1.3. Total phenolic content
Total phenolic content was evaluated in accordance with the Folin–Ciocalteu procedure
[126]. Part of the methanolic extract obtained as above (Section 2.2.8.1) was treated with
polyvinyl polypyrrolidone (10 gL-1
, PVPP, Sigma–Aldrich, USA) to remove phenolic
compounds from extract. PVPP was purified as per the procedure detailed earlier [127].
The mixture was then incubated overnight in an orbital shaker at 25 °C at 2.5 oscillations
per s. PVPP was then removed by centrifugation at 21,000 × g for 10 min at 4 °C. The
supernatant was collected and the sediment (PVPP–polyphenol complex) was discarded.
The absorption of the supernatant and original extract was measured at 725 nm using
UV–visible spectrometer (Helios α, Thermofisher Scientific, USA) in accordance with
the Folin–Ciocalteu procedure. The content of total phenolics in the vegetable was
determined by the difference between phenolic content obtained before and after PVPP
treatment and then expressed as the Gallic acid equivalent mass per mass of the fresh
vegetable as mg kg−1
. [GAE (mg kg−1
) = ((O.D + 0.017)/0.048); R2 = 0.99]
2.2.2.1.4. Ascorbic acid content
Total vitamin C content of the processed vegetables was estimated in accordance with
standard AOAC official microfluorometric method [128]. Cut vegetables (20 g) were
extracted separately with 20 mL of freshly prepared extracting solution containing
metaphosphoric acid (0.3 mol L−1
) and acetic acid (1.4 mol L−1
). Homogenate was then
centrifuged at 16,000 × g for 15 min at 4 °C and the supernatant was treated with

77
activated charcoal (20 g L−1
) with vigorous shaking to convert ascorbic acid into
dehydroascorbic acid. The mixture was again centrifuged at 21,000 × g for 10 min at 4 °C
to remove charcoal. Aliquots of this supernatant (500 µL) were added to a solution
containing equal volumes of boric acid and sodium acetate (3% boric acid in 3.67 mol L−1
sodium acetate solution). The solution was allowed to stand for 15 min and the total
volume was then adjusted to 10 mL using milli Q water. This was designated as blank
solution. To prepare the sample solution, another aliquot of 500 µL was mixed with an
equal volume of sodium acetate solution (3.67 mol L−1
) and the total volume was adjusted
to 10 mL using milli Q water. A 0.4 mL aliquot of both (sample and blank) solutions was
separately treated with 1 mL of o-phenylenediamine solution (0.02 %) (Sigma Chemical
Co. Ltd., St. Louis, USA), vortexed and incubated for 35 min at ambient temperature (25
± 2 °C). Ascorbic acid reacts with o-phenylenediamine to form a fluorescent conjugate.
Total conjugate formed was measured (EXλ 350 nm; EMλ 430 nm, Bandwidth 5 nm)
using CS-5000 fluorimeter (Shimadzu Corporation, Japan). The same process was
followed for standard ascorbic acid solutions of known concentration (0.1–0.0015 %) to
obtain a standard curve. Linear regression was then used to determine the concentration
of ascorbic acid in each sample. The content of vitamin C per mass of ash gourd was
expressed in mg kg−1
. All analyses were carried with three independent samples each
analyzed in triplicate.
2.2.2.2. Aroma quality
2.2.2.2.1. Isolation and identification of free aroma compounds
2.2.2.2.1.1. Isolation of free aroma

78
Optimization of procedures for isolation of free aroma was carried out for the selected
vegetables (ash gourd, pumpkin and drumstick). Free aroma volatiles were isolated using
three different techniques – simultaneous distillation extraction (SDE), high vacuum
distillation (HVD) and solid phase microextraction (SPME). Extraction using SDE and
HVD was essentially performed as per procedure described earlier [129, 130] while
procedure followed for SPME extraction was as per Sagratini et al. [131]. A flow diagram
depicting different methodologies followed for extraction of free aroma volatiles is
demonstrated in Figure 9.
Figure 9. A schematic representation of the different methodologies adopted for the
isolation and analysis of free aroma volatiles.

79
A brief decription of the main methodologies adopted for aroma isolation is provided
below.
A) Simultaneous Distillation Extraction (SDE): Ash gourd, pumpkin and drumstick,
200 g each was cut into small pieces and separately subjected to SDE [132] for 2 h using
peroxide free diethyl ether (AR Grade, S.D. Fine-Chem. Ltd., Mumbai, India) as
extracting solvent. The solvent was then removed by passing a slow stream of nitrogen
to obtain the volatile oil.
B) Solid Phase Microextraction (SPME): To each cut vegetable sample (50 g) was
added 10g NaCl and 10 mL distilled water and then homogenized (B400, Buchi,
Switzerland) while maintaining chilled conditions. The homogenate obtained was
filtered through double layered washed & dried muslin cloth. The extract obtained was
centrifuged at 12,000 rpm at 20 °C for 15 min. To the sample, 2-octanol (1.25 μg) was
further added as internal standard. Samples were equilibrated for 30 min at 30 °C with
continuous stirring and headspace was subsequently extracted by preconditioned
PDMS/DVB/CAR fibres (Supleco, USA) for 20 min at 30 °C. After extraction, fibres
were desorbed (270 °C) in the injection port of the GC/MS equipment. Quantification
was performed by comparing peak areas of compounds with that of internal standard
and results obtained as μg kg-1
.
C) High vacuum distillation (HVD): High vacuum distillation was carried out
according to the procedure reported in literature [129, 130]. Cut ash gourd (200 g) was
frozen in liquid nitrogen before use. The sample was placed in a glass tube (5 cm i.d., 25
cm length) and then connected to a distillation unit maintained under vacuum (1 x 10⁻³

80
torr). The distillate collected in a receiving tube (3 cm i.d., 20 cm length) was
maintained at low temperature using liquid nitrogen. The isolate (50 ml) was extracted
with diethyl ether (3 x 5 ml). Solvent was removed by a slow stream of nitrogen to
obtain oil that was subjected to GC/MS analysis.
2.2.2.2.1.2. GC–MS analysis of free aroma compounds
The aroma concentrates obtained from SDE, HVD and SPME were subjected to GC–
MS analysis on a Shimadzu GC–MS instrument (Shimadzu Corporation, Kyoto, Japan)
equipped with a GC-17A gas chromatograph and provided with a DB-5 (J&W
Scientific, California, USA) capillary column ((5 %-phenyl)-methylpolysiloxane,
length, 30 m; i.d., 0.25 mm and film thickness, 0.25 µm). The operating conditions
were: column temperature programmed from 60 to 200 °C at the rate of 4 °C/min, held
at initial temperature and at 200 °C for 5 min. and further to 280 °C at the rate of 10
°C/min, held at final temperature for 20 min; Injector and interface temperatures, 210
and 280 °C, respectively; carrier gas helium (flow rate, 0.9 ml/min); ionization voltage,
70 eV; electron multiplier voltage, 1 kV. Peaks were tentatively identified by comparing
their mass fragmentation pattern with that of standard compounds wherever available,
from standard spectra available in the spectral library (Wiley/NIST Libraries) of the
instrument as well as by comparing RI (retention index) values of the compounds with
literature data. The content of the identified compounds in the essential oil obtained
from SDE and HVD methods were estimated from a standard curve (R2 = 0.99) of
concentration versus peak area prepared using different concentrations of standard

81
acetoin (0.01–20 µg/µl) for all the three vegetables studied. The contents of various
aroma compounds identified were expressed as µg/kg of the fresh weight of the
vegetable.
2.2.2.2.2. Isolation and identification of bound aroma precursors
Optimization of procedures for isolation of bound aroma precursors was carried out for
all the three selected vegetables. Aroma glycosides were isolated using XAD column
and solid phase extraction (SPE) using C18 cartridges. Extraction using XAD column
was essentially performed as per procedure described earlier by Arul et al. [133] while
procedure followed for SPE extraction was as per Solis et al. [134]. A flow chart
depicting different methodologies followed for extraction of bound flavour precursors is
demonstrated in Figure 10.
The methodologies adopted for extraction of bound aroma glycosides are briefly
described below:
2.2.2.2.2.1. Preparation of extracts
For isolation of bound aroma glycosides, vegetable extracts were prepared using two
different approaches as described below:
A) Cut vegetables (50 g) were homogenized with 200 mL of methanol using a high
speed mixer (Omnimixer, Sorvall, USA) for three min at a speed corresponding to the
position of the knob at position four. The resultant slurry was filtered through a Buchner
funnel under suction. Residue obtained was then further extracted twice using same
solvent. Extracts from all three extractions were pooled and evaporated to dryness under
vacuum (40 mbar, 40 °C) using a rotary evaporator (Buchi, Switzerland). Dried residue
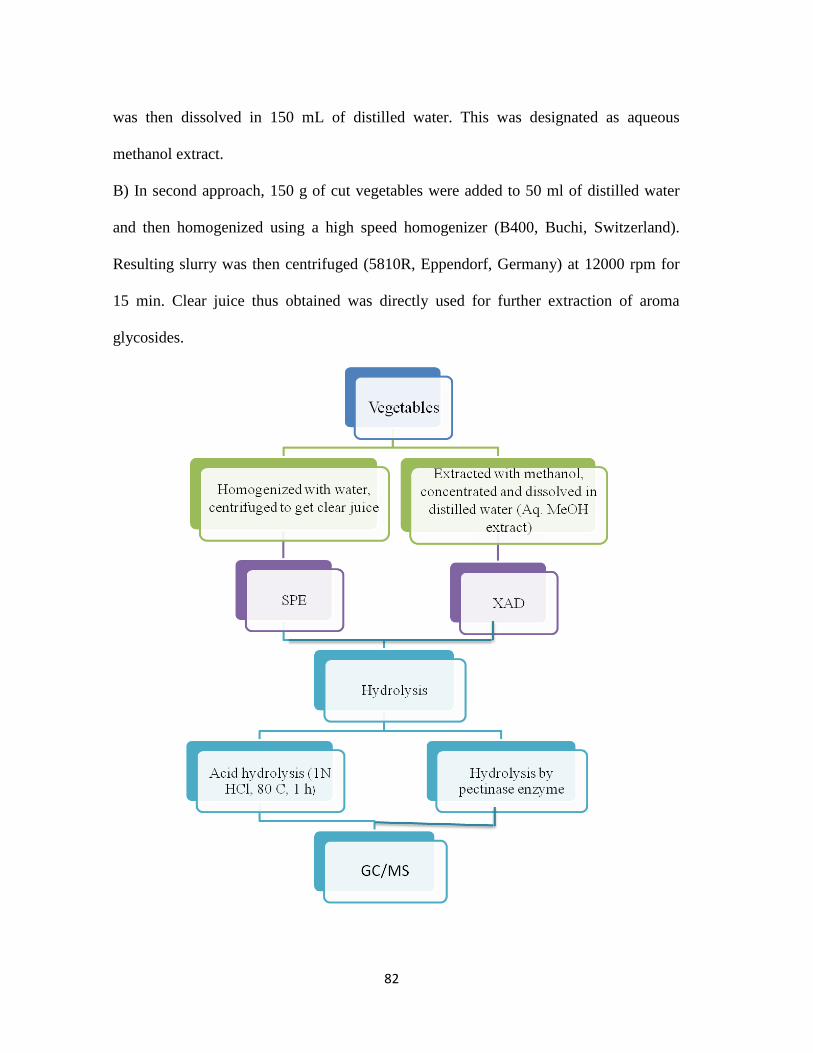
82
was then dissolved in 150 mL of distilled water. This was designated as aqueous
methanol extract.
B) In second approach, 150 g of cut vegetables were added to 50 ml of distilled water
and then homogenized using a high speed homogenizer (B400, Buchi, Switzerland).
Resulting slurry was then centrifuged (5810R, Eppendorf, Germany) at 12000 rpm for
15 min. Clear juice thus obtained was directly used for further extraction of aroma
glycosides.

83
Figure 10. A schematic representation of the different procedures followed for isolation
and analysis of bound aroma precursors.
2.2.2.2.2.2. Isolation of aroma glycosides
Bound aroma glycosides from the vegetables were extracted using two different
extraction methods which are briefly described below:
A) XAD: Aqueous methanol extract of each of the vegetable was subjected separately
to XAD column for isolation of aroma glycosides. XAD resin was packed in glass
column of 2.5 cm I.D. up to a length of 18 cm using methanol. Column was then washed
using 200 mL of methanol followed by 200 mL of diethyl ether. The column was finally
equilibrated with 200 mL of distilled water. Vegetable extracts (200 mL) were
separately loaded on XAD columns with a flow rate of 1.5 mL min-1
. Post loading,
column was washed with 200 mL deionized water and diethyl ether to remove polar and
mid-polar impurities. Subsequently, elution with 200 mL methanol yielded the bound
aroma precursors or aroma glycosides. Methanol fraction was further evaporated to
dryness using rotary evaporator and the residue obtained was finally dissolved in 10 mL
of distilled water for further analysis.
B) Solid Phase Extraction (SPE): SPE cartridges were washed with 10 mL methanol
and then further equilibrated by eluting with 10 mL of distilled water. Vegetable juice
(15 mL) was then loaded on the cartridge while maintaining a flow rate of 1 mL min-1
.
Cartridge was subsequently, washed again with 10 mL of distilled water followed by 10

84
mL of diethyl ether and the bound flavor precursors were then eluted with 10 mL of
methanol.
2.2.2.2.2.3. Identification and quantification of bound aroma
The extracts obtained using XAD and SPE extraction were either acid hydrolyzed using
1 N HCl or subjected to enzymatic hydrolysis using pectinase (Figure 10). Detailed
procedure followed for hydrolysis is as follows:
A) Acid hydrolysis: Extract containing aroma glycosides (10 mL) obtained from XAD
as described in section 2.2.2.2.2.2 was made to 1 N with concentrated HCl. This
solution was then heated at 80 °C for 1 h in a stoppered conical flask. The hydrolysate
was extracted with diethyl ether (3 x 20 ml) and the organic layer containing free
aglycones was repeatedly washed with distilled water till free of acid. The organic layer
was dried over sodium sulphate and then concentrated to less than 1 mL volume using
Kuderna-Danish concentrator (Supelco, USA). Extract was finally concentrated to a
volume of 100 μL using a gentle stream of nitrogen and then injected (1 μL) into
GC/MS equipment for identification of free forms.
B) Pectinase hydrolysis: Methanol fraction obtained from SPE containing aroma
glycosides obtained as described in section 2.2.2.2.2.2 was concentrated to dryness
using rotary evaporator and the residue was dissolved in 15 mL of citrate phosphate
buffer (0.1 M, pH 5). Pectinase preparation (500 μL) was added into this solution and
the samples were kept for incubation at 37 °C for 48 h. Sample hydrolyzed with
pectinase was taken into a 40 mL SPME vial, 4.5 g of NaCl added and then equilibrated
at 30 °C for 45 min. The free aroma compounds were extracted with a preconditioned

85
(270 °C, 10 min) SPME fibre (PDMS/DVB/CAR). Extraction was carried out by
exposing SPME fiber in sample headspace for 20 min at 30 °C. Post extraction, fiber
was desorbed in split/splitless port of GC/MS kept at 270 °C and the analysis was
carried out in splitless mode. Before SPME extraction, 2-octanol (1.25 μg) was added as
internal standard. Each analysis was carried out in triplicate for quantification.
Samples were analyzed on a GC/MS (QP5050A, Shimadzu, Japan) instrument equipped
with RTX-5 column (5% diphenyl-dimethyl-polysiloxane, 0.25 μm I.D., 30 m length,
Restek corporation, USA). The conditions for analysis were similar as described in
section 2.10.1.2. Data was acquired in scan mode from m/z 40 to 350. Peaks were
identified by comparing their mass fragmentation pattern and Kovat’s indices with that
of standard compounds as well as from the data available in the spectral (Wiley/NIST)
libraries of the instrument. Quantification was performed by comparing peak areas of
compounds with that of internal standard and results obtained as μg kg-1
.
2.2.2.2.3. Chemometric analysis of the aroma data
Data obtained for free as well as bound aroma (TIC v/s retention time) was exported in
ascii format to Microsoft Excel using the inbuilt software of GC/MS. The
corresponding ascii data were then separately subjected to PCA for analyzing changes
as a result of radiation treatment and storage. Score plots were drawn and results were
visually analyzed. Data obtained for principal components was further analyzed using
ANOVA and means comparison was performed using Duncan’s multiple range test. All
the statistical analysis was carried out using XLSTAT 2012 software (Addinsoft Inc.
U.S.A.).

86
2.2.2.2.4. Identification of aroma impact compounds
2.2.2.2.4.1. GC-O analysis
The aroma concentrates of the three vegetables obtained from SDE and in SPME mode
were subjected to GC-O analysis on a Shimadzu GC-MS instrument (Shimadzu
Corporation, Kyoto, Japan) equipped with a GC-17A gas chromatograph, provided with
a DB-5 (J&W Scientific, California, USA) ((5%-Phenyl)-methylpolysiloxane, length, 30
m; id., 0.25 mm and film thickness, 0.25 mm) and an olfactory detection port (ODP-2,
Gerstel, Germany). A fixed splitter (1:1) was used at the end of capillary column. One
part of the column flow was directed to mass detector in gas chromatograph system,
while the other part was directed to an olfactory detection port (ODP). Humidified air
was introduced into the sniff port up-stream at 100 mL/min near the point where the
capillary column first entered the sniffing port. The air carried the capillary column
effluent into a glass funnel where sensory analysis was done. The transfer line to the
GC-O sniffing port was held at 280 °C. Helium was introduced as make up gas in the
transfer line to the sniffing port at 8 mL/min. Simultaneous sniffing at the exit port of
ODP and corresponding response in the mass detector allowed identification of the
compound responsible for the perceived aroma based on its mass fragmentation. The
operating conditions were similar to that provided in section 2.10.1.2. Peaks
corresponding to various aroma notes sniffed by the assessors were identified by
comparing their mass fragmentation pattern with that of standard spectra available in the
spectral library (Wiley/NIST Libraries) of the instrument as well as based on their

87
retention indices on the DB-5 column previously reported, odor quality and mass
spectral data with those of standard compounds wherever available.
2.2.2.2.4.2. Global Olfactometric analysis and determination of odor activity values
(OAV)
Analysis was carried according to the conditions reported by Guen et al. [135]. A panel
of 9 judges (4 females and 5 males, aged 25-50 years) trained in odor recognition and
experienced in GC-O was selected. The testing room was at 24 ± 1 °C and 50 ± 5% RH;
the illumination was a combination of natural and non-natural (fluorescent) light.
Panelists assigned odor properties to each note detected. The number of times a note
was perceived by sensory panel was defined as its detection frequency. Detection of
odor by fewer than 4 panelists was considered as noise [136]. Sniffing was divided into
two parts each of 15 min. Panelists were divided in two batches consisting of four and
five people. Panelists involved in first 15 min were asked to sniff another half of the
sniffing in next round. The second batch sniffed the remaining 15 min of the first round.
In the second round of analysis, first batch of panelists analyzed the aroma notes eluting
from 15 to 30 min while the second batch analyzed the aroma compounds eluting during
0-15 min. Thus, each person participated in the sniffing of both parts but during two
distinct sessions to avoid tiredness. A final aromagram of detection frequency (DF)
versus RI was obtained after summing up all the nine individual aromagrams.
To evaluate the contribution of a chemical compound to the overall aroma of a
vegetable the odor activity value (OAV) was determined. OAV is a measure of
importance of a specific compound to the odor of a sample. It was calculated as the ratio

88
between the concentration of an individual compound and the perception threshold as
reported in literature [137].
2.2.2.3. Headspace gas composition inside packages
Oxygen concentration in package headspace was measured using a gas chromatograph
(GC 2010, Shimadzu Corporation, Japan). The GC was equipped with split/splitless
injector, a molecular sieve column (length 30 m, 0.35 I.D., RT-Msieve 5A, Restek
Corporation, USA) and a TCD detector. Injection port temperature was 35 °C. Initial
column temperature was kept 30 °C for 5 min and then raised at rate of 0.167 °C/s to
100 °C. The column was further held at 100 °C for 5 min with the TCD current and
temperature maintained at 90 mA and 110 °C, respectively. Sampling was done by
inserting a hypodermic needle into the bag through an adhesive septum, previously
stuck to the bag. A 0.1 mL of headspace sample was extracted and injected into a split
ratio of 5. Only O2 and N2 could be evaluated on the column used in the study. Based on
observed O2 and N2 concentrations in the package headspace, actual concentrations of
O2 and CO2 (% O2 and % CO2) were calculated using following equations:
% O2 = (Observed % O2) × 78.084 (1)
(Observed%N2)
% CO2 = 100 – (Observed % O2) × 78.084 + 78.084 (2)
(Observed % N2)
(The atmospheric composition of N2 was taken as 78.084%).
Analysis was done in triplicates using three independent sample trays on each day.
2.2.2.4. Gamma irradiation induced browning inhibition
2.2.2.4.1. Isolation and identification of phenolic compounds

89
Isolation of phenolic compounds: Ash gourd (20 g) from each tray was extracted twice
with 20 ml methanol. The extract was then centrifuged at 12000 rpm for 20 min and the
supernatant collected. It was filtered through 0.22 µm membrane filters (Millipore) prior
to analysis by HPLC.
HPLC analysis: Phenolic constituents were evaluated by a reversed-phase high-
performance liquid chromatography (RP-HPLC, Jasco, Tokyo, Japan), equipped with a
degasser, a quaternary pump delivery system, and a diode array detector. Sample (20
µL) as obtained above was loaded on to a C-18 column (250 mm × 4.6 mm length, 5 μm
particle size) and eluted with mobile phase (flow rate 1 mL/min) consisting of solvent
A- 1.5% o-phosphoric acid in Milli Q water and solvent B- acetonitrile: acetic acid:
phosphoric acid: water (20:24:1.5:54.5). The gradient program used was as follows: 0
min- 80% A; 30 min- 33% A; 33min- 10% A; 40 min – 0% A. The column was
conditioned with acetonitrile for 10 min after every run. The peaks were identified by
comparing retention times and UV-Vis spectra in the 200-500 nm range with those of
the corresponding authentic standards. Quantification of identified compounds was
performed using calibration curves of the corresponding standard compounds at the
specific absorption maximum. Co-chromatography with added authentic standards was
also performed for further confirmation of the identified phenolic constituents.
2.2.2.4.2. Effect of radiation processing on enzymes involved in browning
Phenyl alanine lyase (PAL): PAL activity was measured according to the protocol
reported by Degl’Innocenti et al with some modifications [138]. Enzyme extracts were
obtained by blending 1:1 (w/w) cut ash gourd pieces with borate buffer (50 mM, pH 8.5)

90
containing 10 mM 2-mercaptoethanol and 0.5 g of PVPP under chilling conditions. The
homogenate was filtered through 4 layers of cheesecloth and centrifuged at 21,000 x g at
4 °C for 20 min. The supernatant was used for subsequent assay. The reaction mixture
consisting of 1 mL of 50 mM L-phenylalanine, 0.5 mL of the supernatant and 1.5 mL of
borate buffer was incubated at 40 °C for 1 h. The absorbance was measured at 290 nm
before and after incubation. Difference between the two gave the amount of product
(cinnamic acid) formed. One unit of PAL activity equals the amount of PAL that
produced 1 μmol of trans-cinnamic acid in 1 h and was expressed as μmol g-1
FW h-1
.
Peroxidase (POD): The enzyme extract was by blending 1:1 (w/w) cut ash gourd pieces
with 0.05 M phosphate buffer at pH 7.0 under chilling conditions. Blending was
performed in the presence of 10 % (w/w) polyvinylpyrrolidone (Sigma, St. Louis, MO,
USA) to bind polyphenols. The extract was then centrifuged at 4 °C at 21,000 x g for 10
min. The supernatant was collected and used for peroxidase (POD) activity. Assay was
carried according to the procedure reported by Degl’Innocenti et al (2005) with some
modifications 138. The chlorogenic acid peroxidase assay contained 750 μL of 50 mM
potassium phosphate buffer, pH 6.5; 100 μL of 80 mM chlorogenic acid; 50 μL of
extract, and 100 μL of 35 mM H2O2. The caffeic acid peroxidase assay contained 750
μL of McIlvaine buffer (114 mM Na2HPO4 and 43 mM citric acid), pH 5.5; 100 μL of
80 mM caffeic acid, 50 μL of extract; and 100 μL of 35 mM H2O2. In all cases, POD
assays were initiated by the addition of H2O2 (100 μL, 35 mM). Absorbance was
measured at 410 nm for chlorogenic acid and 470 nm for caffeic acid peroxidase
activity. The activities of PODs were expressed as Aλ min-1
g-1
fresh weight.

91
Polyphenol oxidase (PPO): Enzyme extraction procedure followed was same as that
for POD assay as mentioned above. PPO activity was assayed spectrophotometrically
(Model UV 4-100, Unicam, Cambridge, UK) at 25 °C according to methodology of
Mishra et al. [139] based on the absorption at 420 nm of the brown polymers formed
when catechol is oxidized in the presence of PPO. The reaction mixture consisted of 600
µL buffer, 200 µL enzyme extract and 200 µL substrate. The increase in absorbance at
420 nm was monitored at 1 min intervals for 10 min and the average change in
absorbance per minute was calculated from the linear region of absorbance. One unit of
enzyme activity was defined as the amount of enzyme which caused a change of 0.01 in
absorbance/min. The PPO activity was expressed as U g-1
fresh weight.
PPO inhibition – Kinetic studies: The inhibitory activity of alpha resorcylic acid for
ash gourd PPO was investigated. Various concentrations of catechol (25 - 250 mM) and
alpha resorcylic acid (50 - 250 mM) were prepared in phosphate buffer (pH 7). Catechol
solutions (150 µL) and alpha resorcylic acid (100 µL) were mixed together in a cuvette
containing 550 µL of the buffer. The reaction was initiated by addition of 200 µL of
PPO preparation. The readings were taken in the similar manner as described above
(section 2.11.1.1.4.1(C)). The degree of inhibition was expressed as percentage
inhibition (I = 100(A* - A)/A, where A and A* were enzyme activities with or without
inhibitor, respectively). Kinetic parameters of alpha resorcylic acid inhibition were
determined using double-reciprocal plots (Lineweaver-Burk) of enzyme activity vs
catechol concentration. I50 value of alpha resorcylic acid was determined from the plot

92
between enzyme activity vs inhibitor concentration, where I50 value is the mM
concentration of the inhibitor required to inhibit enzyme activity by 50 %.
2.2.2.4.3. Scanning Electron Microscopic (SEM) analysis
Control and irradiated ash gourd pieces on day 12 of storage were subjected to SEM
analysis using a facility (SEM Model Quanta 200 SEM, FEI Company, Oregon, USA)
available from Icon Analytical Equipments Pvt. Ltd., Mumbai, India. The sample was
fixed on a carbon tape and observed at different magnifications using a low vacuum
mode at 65 Pa and 20 kV.
2.2.2.4.4. Electrolytic leaching
The electrolytic leaching was measured using the procedure as reported earlier. 10 g of
cut ash gourd was taken in a beaker containing 50 ml of deionized water and stirred on a
magnetic stirrer for 2 minutes. It was then filtered through Whatman filter paper and
conductance of the filtrate was measured using a hand-held conductivity meter (HI
9812, Hanna Instruments, Italy). Spectrophotometer readings of the filtrate were also
taken at 280, 320 and 420 nm for assessment of nature and content of compounds
leaching out and hence attributing to the browning.
2.2.2.4.5. Statistical analysis
Statistical significance was assessed by two-way analysis of variance to determine the
effect of radiation processing and storage time. Multiple means comparison was done by
Duncan’s test (p<0.05). For each measurement, three replicates of 3 independent
samples were tested.

93
2.2.3. Isolation, identification and studying the effect of radiation processing on
bioactive phytochemicals
(A) Ash gourd
2.2.3.1. Compounds with plant growth promoting activities
2.2.3.1.1. Preparation of ash gourd extracts
Ash gourd (5 kg) was cut in small pieces and soaked in aqueous methanol (1:4 v/v)
overnight. The supernatant was removed by filtration through a sintered funnel under
vacuum and the remaining ash gourd was crushed in an omni mixer for 2 min at a speed
corresponding to position of the knob at 3. The slurry was filtered as above and the
residue was further re-extracted twice with aqueous methanol. The filtrates were pooled
and concentrated under vacuum on a rotary evaporator (35 °C) to obtain an aqueous
solution.
The aqueous solution so obtained (500 ml) was filtered and then extracted with n-
hexane (3 x 250 ml) in a separating funnel. The organic layers were pooled, washed
with water (2 x 250 ml) and then evaporated to dryness under vacuum in a flash
evaporator. The residue was made to 1% solution in DMSO. The remaining aqueous
solution was consecutively extracted with ethyl acetate (3 x 250 ml) and n-butanol (3x
250 ml) as above. The organic layers in each case as well as the remaining aqueous
solution were separately evaporated to dryness as above and made to 1% solution in
ethanol. These fractions were tested for their growth promoting activity.

94
2.2.3.1.2. Activity Guided Fractionation
2.2.3.1.2.1. Growth promotion activity: Growth promotion activity was examined
using tobacco plant because of its extensive and well characterized genetic background.
Tobacco leaves were cut into circular discs of diameter 0.5 cm with the help of a sterile
metallic cork borer. Discs obtained from the middle regions (between midrib and edge)
of tobacco leaves were treated by soaking them overnight in MS liquid medium
containing different concentrations of all the above extracts (0.178 – 4.4 µg/ml). Leaf
discs soaked overnight in liquid media were used as control. The flasks were kept
overnight on an orbital shaker at 100 rpm and maintained at 25 °C. The treated leaf discs
were transferred to petri plates having half strength MS media containing 0.2 % agar, 3
% sucrose and 0.04% calcium chloride, adjusted to pH 5.7. The plates were then sealed
with parafilm and kept in growth chambers under a 16 h photoperiod at 25 ± 1 °C for 21
d. The diameter of the incubated leaf discs were measured on day 3, 7, 14 and 21.
Except for the total aqueous extract and the butanol extract, no increase in leaf disc
diameter was observed with other fractions. The total aqueous extract as well as the
butanol extract exhibited similar activity with an increase in diameter of tobacco leaf
discs up to 1.1 cm on day 14. The leaves were found to undergo senescence beyond the
period of 14 days.
2.2.3.1.2.2. TLC analysis
The butanol fraction was subjected to thin layer chromatography. Analytical TLC was
carried out on ammonium sulphate impregnated silica gel G plate (10 cm x 25 cm x 0.25
mm thickness) using toluene:ethanol:formic acid (60:35:5, v/v/v) as the developing

95
solvent system. The separated spots were visualized by heating the plate in an oven at
120 °C for 20 min. The butanol extract was subsequently purified by preparative thin
layer chromatography. Preparative TLC was carried out on silica gel plates (20 cm x 20
cm x 0.5 mm thickness) using the same solvent system as above. Five distinctly
resolved bands were scrapped and eluted with methanol. The eluate was evaporated to
dryness to make 1% solution (w/v).
2.2.3.1.2.3. Estimation by densitometry
Density of the individual spots/ bands was determined on a dual wavelength flying spot
scanning densitometer Shimadzu CS-9301PC (Shimadzu, Kyoto, Japan). The density of
the spots was determined in the reflectance mode at a wavelength of 528 nm. Acetoin
glucoside was used as external standard. Aliquots of suitably diluted sample were
spotted on the plate in increasing concentration ranging from 0.05 to 6 mg/ml. The
amount of different bands was estimated from a standard curve (R2 = 0.99) of spot
density versus concentration and expressed as mg kg-1
of ash gourd.
2.2.3.1.2.4. Determination of active principles
The bands at Rf values 0.38, 0.44, 0.52, 0.59 and 0.77 were scrapped from the plate and
eluted separately with distilled ethanol. Each solution was filtered, concentrated and
made to 1% solution in ethanol. These fractions were tested for their growth promoting
activity in order to identify the most active fraction. The growth promoting activity
mainly resided in the band at Rf 0.44 which showed an increase in diameter of leaf discs
up to 1.13 cm as compared to control (0.58 cm) on day 14. However, no increase in leaf
disc diameter was observed when treated with the other four bands. Identification of the

96
active compound present in the TLC band at Rf 0.44 was further carried out as
described below.
2.2.3.1.3. Structure identification
The preliminary identification of the compound present in the TLC band at Rf 0.44 was
performed by GC/MS after acidic hydrolysis with the procedure as discussed earlier
(section 2.10.2.3). The compound was tentatively identified as acetoin glucoside. The
remaining aqueous solution from the individual bands was neutralized with 1 N KOH,
dried under vacuum and the residue was dissolved in methanol. This methanol solution
was subjected to TLC in order to identify the sugar residue. The sugar residue obtained
from the hydrolyzate from the individual bands was further converted to its acetyl
derivative using pyridine : acetic anhydride (1:1) (overnight, room temperature). The
acetylated derivative was concentrated by slow stream of nitrogen and then
subsequently analyzed by GC/MS.
Identity of the active compound present in this band was substantiated by other spectral
techniques such as IR, NMR and further by chemical synthesis.
2.2.3.1.3.1. Spectral Studies
IR spectrum was recorded with a JASCO FTIR 4100 spectrophotometer (Jasco
Corporation, Tokyo, Japan). νmax (KBr): 3520, 2980, 1665, 1452, 1385, 1180, 1114
and 910 cm-1
.
The NMR spectra were recorded with a Bruker AC-200 MHz FT NMR spectrometer
(Bruker, Fallanden, Switzerland). The usual abbreviations employed are: s = singlet, d =
doublet, q = quartet, J = coupling constant (in Hz), δ = chemical shift in ppm. The

97
proton designations as per chemical structure depicted in Fig. 10. 1H NMR (CDCl3, 200
MHz): δ ppm, 4.5-5.2 (sugar protons, H2’, H3’, H4’, H5’ & H6’), 4.22 (1H, q, H3, J =
5.4), 4.2 (1H, d, J = 5.8, H1’), 2.01 (3H, s, H1), 1.30 (3H, d, J = 5.4, H4).
2.2.3.1.3.2. Chemical synthesis of acetoin glucoside
Further confirmation of the structure was carried out by chemical synthesis according to
the scheme depicted in Figure 11. In a 3- necked round bottom reaction flask,
continuously flushed with argon, a mixture of sodium hydride in dry THF was added.
Acetoin (88 mg) was then introduced into the flask in a controlled manner by using
pressure equalizer. The reaction mixture was refluxed for 1h until the added acetoin was
converted to its corresponding sodium derivative and effervescence of hydrogen had
stopped. Acetobromo-D-glucose (397 mg) in THF was then added drop wise with the
help of pressure equalizer with continuous stirring at room temperature for the
formation of glycosidic bond between glucose and sodium derivative of acetoin. The
reaction product was purified by column chromatography using binary solvent
combination (15% ethyl acetate in petroleum ether) followed by preparative TLC using
ethyl acetate: petroleum ether (15:85, v/v) as developing solvent. The final purified
product was then characterized by spectral analysis as above.
Figure 11. Scheme of chemical synthesis of acetoin-3-O-β-D- glucoside.
OOAc
OAc
AcO
BrOH
O + (iii). Stirring at rt for over night and worked up
(i). NaH in freshly dry THF (ii). Refluxed for 1h
AcO
O
OOAc
OAc
AcO
O
AcO
1
23
1'2'
3'
4'5'
6'1
23
1'2'
3'
4'5'
6'
4
4 Acetoin Acetobromo-D-glucose Acetoin-3-O- β-D-glucoside

98
2.2.3.1.4. Growth promotion assay of purified acetoin glucoside
Tobacco leaf discs were treated with synthetic acetoin glucoside and that isolated from
ash gourd, as well as standard acetoin procured from Sigma Aldrich, at concentrations
ranging from 0.178 – 4.4 µg/ml. Leaf discs were cultured in similar growth conditions
as mentioned above. The growth of the leaf discs was monitored at different time
intervals (3, 7, 14 and 21 days). The growth observed was identical in both natural and
synthetic acetoin glucoside. Therefore glucoside obtained from the natural source was
used in subsequent studies. Three independent sets of experiments were performed and
the data presented as a mean ± standard deviation.
2.2.3.1.5. Protein extraction and two-dimensional gel electrophoresis
Proteins were extracted using 0.1 M phosphate buffer supplemented with 0.1% Triton-X
100, 20 mM EDTA, 0.1 M NaCl, 5 mg/ml sodium ascorbate and 2 mM PMSF. Control
and treated in vitro grown plant tissues (1 g fresh weight) were ground with liquid
nitrogen using sterilized mortar and pestle. The powder was suspended in 1 ml of the
above buffer. After incubating for 2 h at 4˚C, the samples were centrifuged at 12,000 g
at 4˚C for 30 min. The centrifugation was repeated with the supernatant. The final
supernatant was collected and equal amount of protein (90 µg) was used for iso-electric
focusing (IEF). 2-D gel electrophoresis and IEF was done using an 11 cm strip as
reported earlier [140] with the following focusing conditions- 250 V, 15 min (rapid, salt
removal step); 8000 V, 2h (linear); 8000 V, 20-30,000V-h (rapid) and finally 500
V, hold. 2-D separation was done on a 12% PAGE gel and was silver stained.

99
2.2.3.1.6. Mass Spectrometric analysis and database searching
Spots were excised manually from gels and digested with trypsin. The digestion
protocol used was as per the procedure reported earlier [141] with minor modifications.
Gel plugs were initially destained with 20 mM ammonium bicarbonate. Trypsin (250
ng), at a concentration 25 ng/μl, was then added and the digestion proceeded at 37°C for
16 hrs. Peptides were extracted from gel plugs by adding 0.1% TFA containing 50%
ACN/Water. Peptide fragments from digested proteins were then crystallized with
saturated α-cyano-4-hydroxycinnamic acid (HCCA) matrix solution. The MS analysis
was performed in 4800 MALDI-TOF/TOF (Applied Biosystems, Foster City; CA) mass
spectrometer in the m/z range 600-4500 Da. Peptide mass fingerprinting (PMF) search
was performed using Swissprot database, using the MASCOT search engine (Matrix
Science Ltd., London; http:/www.matrixscience.com).
2.2.3.1.7. Statistical Analysis
Experimental data of growth promotion studies were analyzed statistically by two-way
ANOVA using DSAASTAT (Version 1.1) [142] to determine the effect of various
treatments at different concentrations during the observed growth period. Multiple
means comparison was done by Duncan's multiple range test (p≤0.05).
2.2.3.2. Compounds with ACE inhibition activity
2.2.3.2.1. Preparation of ash gourd extracts
The preparation of ash gourd extract and its subsequent partitioning with n-hexane, ethyl
acetate and n-butanol was performed as explained in section 2.2.3.1.1. The organic

100
layers in each case as well as the remaining aqueous solution were separately evaporated
to dryness and made to an aqueous solution (100 mg/ml). These fractions were tested for
ACE inhibition activity.
2.2.3.2.2. Preparation of enzyme extract
Angiotensin converting enzyme (ACE) was extracted from pig (Sus scrofa) lung tissue.
10 g pig (Sus scrofa) lung tissue was minced using scissors on an ice bath and made to a
volume of 100 mL with 10 mM sodium phosphate buffer (pH 8.3). The mixture was
homogenized in chilled conditions. The homogenate was centrifuged at 21000 x g, for
20 min at 4 °C. The supernatant obtained was used as enzyme extract and stored at -20
°C till the analysis.
2.2.3.2.3. ACE inhibition assay
The ACE inhibition activity was measured using the procedure reported by Cushman
and Cheung [143] with slight modifications. 50 µL of enzyme preparation was mixed
with 50 µL of inhibitor (ash gourd extract) and pre-incubated at room temperature for 10
min. The mixture was designated as “test”. A mixture of 50 μL distilled water + 50 μL
enzyme was taken as control. 250 µL of N-Hippuryl-His-Leu tetrahydrate (HHL) as
substrate (prepared in HEPES buffer) was added to the pre-incubated test and control
mixture and incubated at 37 °C for 1 h. After 1 h, the reaction was stopped by adding
200 μL of 1 N HCL in each tube. 1 mL of ethyl acetate was then added and mixed
thoroughly by vortexing for 90 s. They were then centrifuged at 21000 x g for 10 min.
700 μL aliquot from supernatant of each tube was collected in separate tubes and
evaporated to dryness in a boiling water bath. After complete drying, 1 mL distilled

101
water was added in each tube and OD of aqueous solutions so obtained was read at 228
nm using UV spectrophotometer (Helios α). The assay was performed in triplicate for
both sample and control tubes. The % inhibition activity was calculated as: [(ODC -
ODT)/ ODC]*100. The ACE inhibition activity mainly resided in the aqueous extract
obtained after hexane, ethyl acetate and butanol fractionation. This aqueous extract was
therefore further fractionated for determining the active principles.
2.2.3.2.4. Activity guided fractionation and identification of active principles
HPLC and GPC: The aqueous extract after fractionation with organic solvents as
above was injected in RP-HPLC equipped with a hypercarb C18 column (150 mm x 4.6
mm length, 5 µm particle). The solvent system employed for elution consisted of a
gradient of 0.1 % TFA and acetonitrile at a flow rate of 1 mL/min. The peaks were
monitored at 220 nm. The major peaks observed were collected in separate tubes and
lyophilized. The dry residue was then reconstituted in appropriate volume of distilled
water and checked for ACE inhibition activity. The activity mainly resided in a peak at
retention time 2.9 min. This peak was further fractionated using gel permeation
chromatography with a SuperdexTM
peptide 10/300 GL column. Out of several collected
peaks from the column, the activity was present mainly in a peak at retention time of 30
min. This peak was repeatedly purified using GPC and subjected to TLC and GC/MS
analysis.
TLC analysis: The aqueous extract obtained after partitioning with organic solvents and
the purified peak obtained from GPC as above was spotted on an analytical TLC plate
using toluene: ethanol: formic acid (6: 3.5: 0.5) as the developing solvent. After

102
development, the plate was dried at room temperature and then sprayed with 0.5 %
ninhydrin solution in acetone for visualization.
GC/MS: The purified peak was subjected to mass spectroscopy by using direct probe
facility available with the GC/MS (Schimadzu GC-17A). The active principles were
thus tentatively identified by analyzing the mass spectral data obtained.
(B) Pumpkin
2.2.3.3. Isolation and identification of phenolic constituents
The methodologies adopted for isolation and identification of major phenolic
compounds in pumpkin were similar to that as described in section 2.2.3.1.
2.2.3.4. Isolation and identification of carotenoids
2.2.3.4.1. Isolation of carotenoids
Ten grams of pumpkin from each tray was extracted twice with 10 mL hexane
containing 10 mg of butylated hydroxytoluene (BHT). The extract was then centrifuged
(16000 x g, 20 min, 4 °C) and the supernatant was collected. It was then passed through
the anhydrous sodium sulphate. The extract so obtained was evaporated to dryness
under vacuum (T < 30 °C) and the residue was made to 0.05% in a solvent mixture
consisting of acetonitrile: tetrahydro furan (THF): methanol: 1% aq. ammonium acetate
solution: BHT (55:35:5:5:0.05, v/v/v/v/w) as reported by Seo et al. [144]. Finally the
solutions were filtered through 0.22 µm membrane filters (Millipore) prior to injection
(20 µl) into the HPLC.

103
2.2.3.4.2. HPLC analysis
Carotenoids were evaluated by reversed-phase high-performance liquid chromatography
(RP-HPLC, Jasco, Tokyo, Japan), equipped with a degasser, a quaternary pump delivery
system, and a diode array detector. Separations were conducted using C-18 column (250
mm × 4.6 mm length, 5 μm particle size) with a solvent flow rate of 1 ml/min. The
solvent system used for carotenoid analysis consisted of solvent A- acetonitrile: THF:
methanol: 1% aqueous ammonium acetate solution: BHT (85:5:5:5:0.05, v/v/v/v/w) and
solvent B- acetonitrile: THF: methanol: 1% aq ammonium acetate solution: BHT
(55:35:5:5:0.05, v/v/v/v/w) [144]. The gradient employed was as follows: 0-10 min, 5%
B; 10-29 min increasing linearly to 95% B; 29-35.9 min, maintaining 95% B; decreasing
to 60 % B at 36 min; maintaining 60% B from 36-44.9 min. Carotenoids were
monitored at 452 nm. The peaks were identified by comparing retention times and UV-
Vis spectra in the 200-500 nm range with those of the corresponding authentic
standards. Quantification of identified compounds was performed using calibration
curves of the corresponding standard compounds at the specific absorption maximum.
Co-chromatography with added authentic standards was also performed for further
confirmation of the identified carotenoids.
2.2.3.5. Isolation and identification of triterpenes
2.2.3.5.1. Isolation of triterpenes
Pumpkin sample (10 g) from each tray was extracted twice with 20 mL methanol using
a high speed omni mixer. The homogenate obtained was filtered through double layered
washed and dried muslin cloth. The extract obtained was centrifuged (12,000 rpm, 20

104
°C, 15 min) and solution thus obtained was evaporated to dryness under vacuum (40
mbar, 40 °C) using a rotary evaporator (Buchi, Switzerland). The dried residue was
made to 1% solution in methanol.
2.2.3.5.2. Identification of bioactive triterpenes
TLC analysis: The methanol extracts obtained as above were spotted on an analytical
TLC (silica G, 0.25 mm) plate using toluene: ethanol: formic acid (5:4:1) as the
developing solvent system. The developed plates were dried at room temperature and
stained with iodine vapors. The spots so obtained were scanned on a Flying Spot
Scanning Densitometer (CS9301PC, Shimadzu, Japan) and the area of each spot was
then estimated. After the iodine vapors faded away, the plate was sprayed with
Liebermann-Burchard reagent (5 mL acetic anhydride + 5 mL conc. H2SO4 + 50 mL
ethanol), and visualized by heating the plate in oven at 120 °C for 20 min. The methanol
extract was concentrated to dryness using rotary evaporator and hydrolyzed by pectinase
enzyme (section 2.2.2.2.2.3.) The hydrolyzate along with the original methanol extract
was again subjected to analytical TLC with different solvent systems (1- ethyl acetate :
benzene (75:25) ; 2- chloroform : acetone (90:10)) to determine the nature of the
compounds. Tentative identification of the resolved bands was performed by matching
their Rf values available in literature.
HPLC analysis: The methanol extract as obtained above was subjected to reverse-phase
high-performance liquid chromatography (RP-HPLC, Jasco, Tokyo, Japan), equipped
with a degasser, a quaternary pump delivery system, and a diode array detector.
Separations were conducted using C-18 column (250 mm × 4.6 mm length, 5 μm

105
particle size) with a solvent flow rate of 1 ml/min. An isocratic solvent system
consisting of methanol: water (2:1) was used for elution. The peaks were monitored at
237 and 254 nm by a photo diode array detector operating in a wavelength range of 220-
400 nm. Tentative identification of the peaks was performed on the basis of their
retention times available in the literature.
GC/MS analysis: In order to further ascertain the identities of the active principles, the
hydrolyzate of the total extract, as obtained above was analyzed by GC/MS.
Identification was carried out by analyzing the mass spectral data thus obtained.
(C) Drumstick
2.2.3.6. Isolation, identification and quantification of phenolic constituents
The methodologies adopted for isolation and identification of major phenolic
compounds in drumstick were similar to that as described in section 2.2.3.1.
2.2.3.7. Isolation and identification of glucosinolates
50 g of cut drumstick from each tray was taken in 85 ml of boiling water and subjected
to microwave treatment for 3 min to inactivate the inherent myrosinase enzyme present
in the vegetable. The mixture was then homogenized using a high speed homogenizer
(B400, Buchi, Switzerland) and the slurry was filtered through double layered washed &
dried muslin cloth. The extract obtained was centrifuged at 21000 x g at 20 °C for 15
min and subjected to HPLC and GC/MS analysis as briefly described below.

106
HPLC analysis: The aqueous glucosinolate extract was subjected to HPLC (Jasco
HPLC system, Japan). Samples were eluted from a reverse phase C18 column (250 mm
x 4.6 mm, 10 μ; HYPERSIL, Chromato-pack, Mumbai, India) using 0.1 % TFA in
water as solvent A and 0.1 % TFA in methanol as solvent B. The solvent gradient
employed was: At t = 0 - 5 min, A= 100%; t = 15-17 min, A = 83%; t=22 min, A = 75
%; t=30 min, A= 65%; t=35 min, A=50%, t=50 min, A=1%; t=55-60 min, A=100%, at a
flow rate of 1.0 mL/min. Wavelength was set at 227 nm.
Glucosinolates were desulfated using 10 mL crude aqueous extract (10% solution) to
which 500 μl of 0.02 M sulfatase enzyme in aq. NaOAc-AcOH (pH 5) was added and
incubated overnight [145]. The resultant mixture was subjected to HPLC analysis as
above for further confirmation of glucosinolates.
GC/MS analysis: 15 ml of the crude aq extract was evaporated to dryness in rotavapor
and then reconstituted in 15 mL of 0.1 M phosphate buffer (pH 7.0). It was then added
with 2 mg of myrosinase (Sigma) and incubated at 37 °C for 3 h. After completion of
hydrolysis, samples were equilibrated for 45 min at 30 °C with continuous shaking and
headspace was subsequently extracted by preconditioned PDMS/DVB/CAR fibres
(Supleco, USA) for 20 min at 30 °C. After extraction, fibres were desorbed (270 °C) in
injection port of GC/MS. 2-octanol (1.25 μg) was used as internal standard for
quantification. Peak areas of compounds were estimated by comparing with those of
internal standard and results reported as μg kg-1
.

107
CHAPTER 3
RESULTS AND DISCUSSION

108
3.1. Development of radiation processed shelf stable RTC vegetables
Five popular Indian vegetables - ash gourd (Benincasa hispida), pumpkin (Cucurbita
pepo), bottle gourd (Lagenaria siceraria), lady finger (Abelmoschus esculentus) and
drumstick (Moringa oleifera) were selected for the preliminary studies. Besides their
nutritive value, these vegetables have also been used traditionally for their
pharmacological and medicinal value. All the five vegetables were processed as described
in materials and methods (section 2.2.1.) and stored at 10 °C. The samples were
monitored at suitable intervals visually as well as by the sensory panel for appearance,
color, texture and aroma. In the case of ready-to-cook (RTC) ash gourd, pumpkin and
drumstick, radiation processed samples were acceptable up to a storage duration of 10-25
d depending on the vegetable and radiation dose delivered. In case of bottle gourd, the cut
vegetable (control as well as radiation processed) developed browning / blackening after a
few minutes of cutting, making them unacceptable. In case of ladies finger, the treated
and untreated samples were acceptable only up to a storage period of 1-2 d, beyond which
increased sliminess and off odor in the radiation treated samples restricting their
acceptance by the sensory panel. Preliminary investigations thus showed that radiation
processing was not amenable for the shelf life extension of RTC bottle gourd and lady
finger. Hence ash gourd, pumpkin and drumstick were selected for the further studies.
3.1.1. Optimization of radiation dose and storage period with mathematical
modeling
The shelf-life of fresh-cut fruits and vegetables depends on various factors such as
processing conditions, treatment, storage temperature, packaging conditions, microbial

109
and physiological spoilage, that affect visual appearance, firmness and consumer
acceptance. Understanding the response of a food system to qualitative or quantitative
experimental variables is a complex task. Efficiency of mathematical modeling to
optimize the processing conditions based on various experimental designs has been
widely demonstrated [146]. Such mathematical equations can be utilized in the food
industry for deciding the process parameters required for obtaining the desired shelf-life
of fresh-cut produce, thus reducing severity of treatments.
In the present case, full factorial experimental design approach was employed for
optimization of radiation dose and storage time for obtaining RTC products of the
selected vegetables with acceptable microbial and sensory quality. A total of 90
experiments were performed for each vegetable at six radiation doses (0 – 2.5 kGy, at an
interval of 0.5 kGy) and five storage days (0, 5, 8, 12 and 15 for ash gourd and drumstick;
0, 7, 14, 21 and 28 for pumpkin). The samples at each combination of dose and storage
day were analyzed in triplicates for microbial quality (Total plate count (TPC) and Yeast
& mold count (Y&MC)), color, texture and sensory acceptability as per procedure
explained in materials and methods (section 2.2.1.). The experimental design and data
obtained for ash gourd, drumstick and pumpkin is presented in Tables 17, 18 and 19,
respectively.
The data obtained for each quality parameter (TPC, Y&MC, color, texture and overall
acceptability) was individually fitted in cubic polynomial equations and models were
generated. These polynomial equations were used to explain the complex interactions
among radiation dose, storage duration and quality attributes of the RTC products.

110
Statistical parameters of the models generated for ash gourd, drumstick and pumpkin are
represented in Tables 20, 21 and 22, respectively. Statistical analysis by ANOVA showed
that the mathematical models generated for each product were significant (p < 0.05),
while lack of fit was insignificant (p > 0.05). Further, the signal to noise ratio (S/N) for all
models were above 4 indicating sufficient data to navigate designed space. Coefficients
for predicted regression models and coefficient of determination (R2) are shown in Tables
23, 24 and 25 for ash gourd, drumstick and pumpkin respectively. Good fitting of models
is also indicated by high values of R2.
Table 17. Experimental design for RTC ash gourd
Std Run Factor 1 A:Dose (kGy)
Factor 2 B: Storage duration (d)
TPC (Log CFU/g)
Y & MC (Log CFU/g)
L value
Firmness (N)
Overall acceptability
1 1 0(-1) 0(-1) 3.87 2.09 68.41 3.475 7.7 2 2 0(-1) 0(-1) 3.79 2.16 68.31 3.584 7.6 3 3 0(-1) 0(-1) 3.92 2.05 69.65 3.506 7.8 4 4 0.5(-0.6) 0(-1) 3.4 1.37 68.43 3.096 7.5 5 5 0.5(-0.6) 0(-1) 3.27 1.25 67.88 2.994 7.7 6 6 0.5(-0.6) 0(-1) 3.22 1.22 67.54 2.905 7.3 7 7 1(-0.2) 0(-1) 2.62 1 66.6 3.094 7.5 8 8 1(-0.2) 0(-1) 2.65 1 65.21 2.996 7.6 9 9 1(-0.2) 0(-1) 2.54 1 64.96 3.154 7.4 10 10 1.5(0.2) 0(-1) 2.63 1 68.54 2.844 7.3 11 11 1.5(0.2) 0(-1) 2.54 1 66.58 2.965 7.5 12 12 1.5(0.2) 0(-1) 2.54 1 67.45 2.881 7.1 13 13 2(0.6) 0(-1) 2 0.65 65.99 2.359 6.8 14 14 2(0.6) 0(-1) 1.85 0.7 64.69 2.296 7.1 15 15 2(0.6) 0(-1) 1.75 0.8 66.21 2.408 6.5 16 16 2.5(1) 0(-1) 1.06 0.5 66.65 2.5 5.2 17 17 2.5(1) 0(-1) 0.96 0.5 63.32 2.25 5.6 18 18 2.5(1) 0(-1) 1.11 0.5 67.12 2.21 4.8 19 19 0(-1) 5(-0.33) 8.71 2.07 63.52 2.475 1.9 20 20 0(-1) 5(-0.33) 8.54 1.95 62.54 2.562 2.1 21 21 0(-1) 5(-0.33) 8.13 2.06 61.38 2.333 1.7 22 22 0.5(-0.6) 5(-0.33) 6.38 2.04 64.71 2.839 3.1 23 23 0.5(-0.6) 5(-0.33) 6.58 2.15 64.17 2.882 3.3 24 24 0.5(-0.6) 5(-0.33) 5.85 1.95 63.22 2.915 2.9 25 25 1(-0.2) 5(-0.33) 5.97 2.15 67.96 2.889 5.4 26 26 1(-0.2) 5(-0.33) 5.56 1.96 67.55 2.914 5.6 27 27 1(-0.2) 5(-0.33) 5.03 2.2 66.95 2.814 5.2 28 28 1.5(0.2) 5(-0.33) 4.05 1.85 67.2 2.787 4.3 29 29 1.5(0.2) 5(-0.33) 3.95 1.75 67.55 2.669 4.4 30 30 1.5(0.2) 5(-0.33) 4.15 1.88 66.19 2.751 4.2 31 31 2(0.6) 5(-0.33) 2.16 1 61.73 2.354 7.1 32 32 2(0.6) 5(-0.33) 2.05 1 62.52 2.145 7.2 33 33 2(0.6) 5(-0.33) 2.2 1 63.51 2.262 7 34 34 2.5(1) 5(-0.33) 2.38 1 62.82 2.063 5.6 35 35 2.5(1) 5(-0.33) 2.35 1 63.98 1.996 6.2 36 36 2.5(1) 5(-0.33) 2.3 1 64.21 2.145 5 37 37 0(-1) 8(0.067) 9.62 3.78 52.32 1.075 2 38 38 0(-1) 8(0.067) 9.52 3.75 50.14 1.339 2.4 39 39 0(-1) 8(0.067) 9.45 3.69 51.22 1.041 1.6 40 40 0.5(-0.6) 8(0.067) 7.6 3.16 65.22 1.543 1.5 41 41 0.5(-0.6) 8(0.067) 7.54 2.95 63.85 1.496 1.7 42 42 0.5(-0.6) 8(0.067) 7.25 2.96 62.15 1.518 1.3 43 43 1(-0.2) 8(0.067) 6.81 2.75 64.86 1.261 2 44 44 1(-0.2) 8(0.067) 6.52 2.59 62.33 1.295 2.3

111
45 45 1(-0.2) 8(0.067) 6.1 2.65 60.54 1.195 1.7 46 46 1.5(0.2) 8(0.067) 5.01 2.38 64.6 2.139 3.5 47 47 1.5(0.2) 8(0.067) 4.65 2.34 63.29 1.965 3.8 48 48 1.5(0.2) 8(0.067) 4.85 2.15 62.66 2.354 3.2 49 49 2(0.6) 8(0.067) 3.62 1 58.13 2.565 7.1 50 50 2(0.6) 8(0.067) 3.56 1 55.82 2.592 7.2 51 51 2(0.6) 8(0.067) 3.45 1 57.46 2.663 7 52 52 2.5(1) 8(0.067) 3.01 1 54.86 2.507 5.5 53 53 2.5(1) 8(0.067) 2.95 1 52.61 2.658 5 54 54 2.5(1) 8(0.067) 2.78 1 55.83 2.214 6 55 55 0(-1) 12(0.6) 11.48 5.17 48.65 0.475 1.2 56 56 0(-1) 12(0.6) 11.25 5.05 45.18 0.337 1.3 57 57 0(-1) 12(0.6) 10.96 4.95 41.21 0.321 1.1 58 58 0.5(-0.6) 12(0.6) 8.55 4.41 51.99 0.909 1.5 59 59 0.5(-0.6) 12(0.6) 8.21 4.35 52.09 0.958 1.9 60 60 0.5(-0.6) 12(0.6) 8.65 4.25 50.64 0.861 1.1 61 61 1(-0.2) 12(0.6) 8.03 2.5 55.72 1.355 1.2 62 62 1(-0.2) 12(0.6) 7.95 2.35 54.68 1.339 1.3 63 63 1(-0.2) 12(0.6) 7.85 2.25 52.16 1.254 1.1 64 64 1.5(0.2) 12(0.6) 6.13 2.32 63.47 1.936 1.4 65 65 1.5(0.2) 12(0.6) 5.96 2.25 61.95 1.99 1.6 66 66 1.5(0.2) 12(0.6) 6.11 2.06 59.76 1.854 1.2 67 67 2(0.6) 12(0.6) 3.98 2.34 62.75 2.066 6.8 68 68 2(0.6) 12(0.6) 3.58 2.15 60.22 2.054 7 69 69 2(0.6) 12(0.6) 3.75 2.5 59.17 1.965 6 70 70 2.5(1) 12(0.6) 3.25 2.02 58.73 1.549 4.2 71 71 2.5(1) 12(0.6) 3.05 1.99 55.43 1.543 4.4 72 72 2.5(1) 12(0.6) 2.99 1.85 56.33 1.354 4.5 73 73 0(-1) 15(1) 12.52 6.12 42.65 0.325 1 74 74 0(-1) 15(1) 11.96 6.06 39.18 0.187 1 75 75 0(-1) 15(1) 11.24 5.98 35.21 0.171 1 76 76 0.5(-0.6) 15(1) 9.68 4.99 45.99 0.759 1 77 77 0.5(-0.6) 15(1) 9.25 5.21 46.09 0.808 1 78 78 0.5(-0.6) 15(1) 8.96 5.11 44.64 0.711 1 79 79 1(-0.2) 15(1) 8.96 3.25 49.72 1.205 1 80 80 1(-0.2) 15(1) 9.02 3.16 48.68 1.189 1 81 81 1(-0.2) 15(1) 9.62 3.1 46.16 1.104 1 82 82 1.5(0.2) 15(1) 6.99 2.86 57.47 1.786 1 83 83 1.5(0.2) 15(1) 6.26 2.72 55.95 1.84 1 84 84 1.5(0.2) 15(1) 7.06 2.92 53.76 1.704 1 85 85 2(0.6) 15(1) 4.56 2.66 56.75 1.916 4 86 86 2(0.6) 15(1) 5 2.59 54.22 1.904 3 87 87 2(0.6) 15(1) 4.69 2.34 53.17 1.815 4 88 88 2.5(1) 15(1) 4.03 2.35 52.73 1.399 4 89 89 2.5(1) 15(1) 4.27 2.15 49.43 1.393 2 90 90 2.5(1) 15(1) 3.99 2.22 50.33 1.204 5
Table 18. Experimental design for RTC drumstick
Std Run Factor 1 A:Dose(kGy)
Factor 2 B: Storage period (d)
TPC (Log
CFU/g)
YMC (Log
CFU/g) a
value Firmness
(N) Overall
acceptability
1 1 0(-1) 0(-1) 5.613 2.864 -4.5 7.46 8 2 2 0(-1) 0(-1) 5.426 2.694 -4.5 7.23 7.5 3 3 0(-1) 0(-1) 5.501 2.774 -4.5 7.3 7.5 4 4 0.5(-0.6) 0(-1) 2.954 1.589 -4.5 6.88 7 5 5 0.5(-0.6) 0(-1) 3.614 2.109 -4.5 6.81 7.5 6 6 0.5(-0.6) 0(-1) 2.931 1.842 -4.5 6.69 7 7 7 1(-0.2) 0(-1) 2.662 1.265 -4.5 7.38 7 8 8 1(-0.2) 0(-1) 2.601 1.291 -4.5 7.14 7.5 9 9 1(-0.2) 0(-1) 2.706 0.956 -4.5 7.22 7
10 10 1.5(0.2) 0(-1) 2.109 0.782 -4.5 6.62 6 11 11 1.5(0.2) 0(-1) 2.236 0.891 -4.5 6.35 6.5 12 12 1.5(0.2) 0(-1) 2.365 1 -4.5 6.42 6.5 13 13 2(0.6) 0(-1) 0.756 0.295 -4.5 6.32 6 14 14 2(0.6) 0(-1) 0.702 0.383 -4.5 6.25 5.9 15 15 2(0.6) 0(-1) 0.824 0.364 -4.5 6.14 6 16 16 2.5(1) 0(-1) 0.262 0.195 -4.5 5.88 5.5 17 17 2.5(1) 0(-1) 0.278 0.236 -4.5 5.87 5.5 18 18 2.5(1) 0(-1) 0.283 0.264 -4.5 5.88 5.9 19 19 0(-1) 5(-0.33) 6.281 2.953 -3 6.61 5 20 20 0(-1) 5(-0.33) 6.255 2.576 -3 6.84 4.5 21 21 0(-1) 5(-0.33) 6.093 2.994 -3 6.67 5

112
22 22 0.5(-0.6) 5(-0.33) 4.125 2.105 -3 6.54 5.5 23 23 0.5(-0.6) 5(-0.33) 4.198 1.963 -3 6.59 5 24 24 0.5(-0.6) 5(-0.33) 4.396 2.201 -3 6.76 5 25 25 1(-0.2) 5(-0.33) 3.836 2.054 -4.5 7.25 7 26 26 1(-0.2) 5(-0.33) 3.725 2.114 -4.5 6.92 6.5 27 27 1(-0.2) 5(-0.33) 3.694 1.462 -4.5 7.14 6.5 28 28 1.5(0.2) 5(-0.33) 3.274 1.102 -4.5 6.57 5 29 29 1.5(0.2) 5(-0.33) 3.214 0.901 -4.5 6.4 5.5 30 30 1.5(0.2) 5(-0.33) 3.193 0.707 -4.5 6.37 5 31 31 2(0.6) 5(-0.33) 0.892 0.521 -4.5 5.81 4.5 32 32 2(0.6) 5(-0.33) 0.9 0.613 -4.5 6.06 5 33 33 2(0.6) 5(-0.33) 0.91 0.563 -4.5 5.86 4 34 34 2.5(1) 5(-0.33) 0.569 0.451 -4.5 4.79 4 35 35 2.5(1) 5(-0.33) 0.6321 0.396 -4.5 4.77 4 36 36 2.5(1) 5(-0.33) 0.612 0.391 -4.5 4.81 4 37 37 0(-1) 8(0.067) 7.894 3.348 -2.5 5.52 3 38 38 0(-1) 8(0.067) 7.921 2.865 -2.5 5.32 3 39 39 0(-1) 8(0.067) 7.723 3.287 -2.5 5.41 3 40 40 0.5(-0.6) 8(0.067) 6.653 2.371 -2.5 6.64 4 41 41 0.5(-0.6) 8(0.067) 6.98 2.141 -2.5 6.34 4 42 42 0.5(-0.6) 8(0.067) 6.708 2.196 -2.5 6.59 4 43 43 1(-0.2) 8(0.067) 4.115 2.235 -4.5 7.06 6 44 44 1(-0.2) 8(0.067) 4.257 1.856 -4.5 6.87 6 45 45 1(-0.2) 8(0.067) 4.253 2.176 -4.5 7.09 6 46 46 1.5(0.2) 8(0.067) 3.627 1.784 -4.5 5.08 4 47 47 1.5(0.2) 8(0.067) 3.748 1.654 -4.5 4.77 4 48 48 1.5(0.2) 8(0.067) 3.269 1.765 -4.5 4.87 4 49 49 2(0.6) 8(0.067) 2.664 1.851 -4 3.59 3 50 50 2(0.6) 8(0.067) 2.851 1.844 -4 3.15 3 51 51 2(0.6) 8(0.067) 2.317 1.904 -4 3.17 3 52 52 2.5(1) 8(0.067) 1.564 2.589 -4 3.1 2 53 53 2.5(1) 8(0.067) 1.628 2.612 -4 3.11 2 54 54 2.5(1) 8(0.067) 1.596 2.575 -4 3.17 2 55 55 0(-1) 12(0.6) 8.902 3.512 -2 4.05 1 56 56 0(-1) 12(0.6) 8.602 3.201 -2 3.76 1 57 57 0(-1) 12(0.6) 9.214 2.896 -2 3.82 1 58 58 0.5(-0.6) 12(0.6) 8.458 2.965 -2 3.53 2 59 59 0.5(-0.6) 12(0.6) 8.217 2.331 -2 3.46 2 60 60 0.5(-0.6) 12(0.6) 8.394 2.813 -2 3.52 2 61 61 1(-0.2) 12(0.6) 4.189 2.514 -4 6.47 6 62 62 1(-0.2) 12(0.6) 4.324 2.019 -4 6.35 6.5 63 63 1(-0.2) 12(0.6) 5.014 2.369 -4 6.47 6 64 64 1.5(0.2) 12(0.6) 4.791 1.419 -4 3.17 3 65 65 1.5(0.2) 12(0.6) 4.932 1.126 -4 3.14 3 66 66 1.5(0.2) 12(0.6) 5.147 1.154 -4 3.1 3 67 67 2(0.6) 12(0.6) 2.982 2.204 -3.5 2.06 2 68 68 2(0.6) 12(0.6) 3.014 2.132 -3.5 2.03 2 69 69 2(0.6) 12(0.6) 3.141 2.195 -3.5 1.93 2 70 70 2.5(1) 12(0.6) 2.284 2.965 -3.5 1.86 2 71 71 2.5(1) 12(0.6) 2.096 2.925 -3.5 1.92 2 72 72 2.5(1) 12(0.6) 2.165 2.801 -3.5 1.87 2 73 73 0(-1) 15(1) 9.302 3.925 -1.5 1.77 1 74 74 0(-1) 15(1) 9.225 3.881 -1.5 1.81 1 75 75 0(-1) 15(1) 9.314 3.636 -1.5 1.85 1 76 76 0.5(-0.6) 15(1) 8.958 3.065 -1.5 2.87 1 77 77 0.5(-0.6) 15(1) 8.77 3.231 -1.5 2.74 1 78 78 0.5(-0.6) 15(1) 8.914 3.113 -1.5 2.77 1 79 79 1(-0.2) 15(1) 6.489 2.835 -3.5 6.32 1 80 80 1(-0.2) 15(1) 6.546 2.908 -3.5 6.26 1 81 81 1(-0.2) 15(1) 6.714 2.891 -3.5 6.21 1 82 82 1.5(0.2) 15(1) 5.791 2.619 -3 3.1 1 83 83 1.5(0.2) 15(1) 5.632 2.351 -3 2.94 1 84 84 1.5(0.2) 15(1) 5.947 2.524 -3 2.89 1 85 85 2(0.6) 15(1) 3.812 2.913 -3 1.79 1 86 86 2(0.6) 15(1) 3.951 2.826 -3 1.84 1 87 87 2(0.6) 15(1) 3.824 2.915 -3 1.91 1 88 88 2.5(1) 15(1) 3.834 3.25 -3.1 1.7 1 89 89 2.5(1) 15(1) 3.287 3.225 -3.1 1.67 1 90 90 2.5(1) 15(1) 3.294 3.281 -3.1 1.64 1

113
Table 19. Experimental design for RTC pumpkin
Std Run
Factor 1
A:Dose
(kGy)
Factor 2 B:
Storage
duration (d)
TPC
(Log
CFU/g)
Y & MC
(Log
CFU/g)
Lvalue Firmness
(N)
Overall
acceptability
1 1 0(-1) 0(-1) 5.03 2.69 75.25 1.719 8 2 2 0(-1) 0(-1) 5.52 3.12 74.96 1.655 8.5 3 3 0(-1) 0(-1) 4.97 2.25 75.24 1.769 8.5 4 4 0.5(-0.6) 0(-1) 3.01 1.74 72.38 1.404 8.5 5 5 0.5(-0.6) 0(-1) 3.25 1.77 72.73 1.541 8 6 6 0.5(-0.6) 0(-1) 3.1 1.55 73.06 1.455 8 7 7 1(-0.2) 0(-1) 2.51 1.72 73.91 1.23 7.5 8 8 1(-0.2) 0(-1) 2.17 1.96 74.98 1.121 7 9 9 1(-0.2) 0(-1) 2.97 1.45 73.28 1.23 7.5
10 10 1.5(0.2) 0(-1) 2.21 1.41 75.25 0.907 6.5 11 11 1.5(0.2) 0(-1) 1.54 1.42 74.82 1.064 6.2 12 12 1.5(0.2) 0(-1) 1.82 1.28 73.86 1.025 6 13 13 2(0.6) 0(-1) 1.09 1.03 75.88 0.842 6.5 14 14 2(0.6) 0(-1) 1.52 1.01 75.03 0.768 6 15 15 2(0.6) 0(-1) 1.12 0.92 74.96 0.754 6 16 16 2.5(1) 0(-1) 0.64 0.39 75.26 0.678 5.2 17 17 2.5(1) 0(-1) 0.42 0.34 75.22 0.634 5.5 18 18 2.5(1) 0(-1) 0.63 0.52 74.021 0.724 5 19 19 0(-1) 5(-0.33) 5.35 4.05 79.23 1.766 7.5 20 20 0(-1) 5(-0.33) 4.95 4.59 78.33 1.806 7.2 21 21 0(-1) 5(-0.33) 5.59 3.56 77.8 1.769 7 22 22 0.5(-0.6) 5(-0.33) 3.25 2.62 78.66 1.216 6 23 23 0.5(-0.6) 5(-0.33) 3 2.25 79.61 0.995 6.2 24 24 0.5(-0.6) 5(-0.33) 3.32 3.26 78.98 1.332 6 25 25 1(-0.2) 5(-0.33) 2.78 2.68 80.52 1.125 7 26 26 1(-0.2) 5(-0.33) 2.25 2.35 80.72 1.245 7.5 27 27 1(-0.2) 5(-0.33) 2.99 2.85 81.42 1.235 7 28 28 1.5(0.2) 5(-0.33) 1.83 2.02 82.39 1.038 6.2 29 29 1.5(0.2) 5(-0.33) 2.13 1.88 75.35 0.9321 6 30 30 1.5(0.2) 5(-0.33) 2 0.94 77.93 0.802 6.2 31 31 2(0.6) 5(-0.33) 2.02 1.18 80.97 0.822 5 32 32 2(0.6) 5(-0.33) 1.63 0.96 70.82 0.967 5.2 33 33 2(0.6) 5(-0.33) 2.02 1.96 84.15 0.863 5 34 34 2.5(1) 5(-0.33) 0.93 0.86 72.33 0.654 5.5 35 35 2.5(1) 5(-0.33) 1.91 0.93 77.88 0.797 5 36 36 2.5(1) 5(-0.33) 1.13 1 79.38 0.779 5 37 37 0(-1) 8(0.067) 6.57 4.53 85.87 1.8104 1 38 38 0(-1) 8(0.067) 6.25 4.22 85.31 1.782 1.5 39 39 0(-1) 8(0.067) 7.01 4 86.13 1.955 1 40 40 0.5(-0.6) 8(0.067) 4.07 3.07 86.53 1.425 4 41 41 0.5(-0.6) 8(0.067) 4.56 3.32 84.77 1.04 3.5 42 42 0.5(-0.6) 8(0.067) 3.54 3.74 86.52 1.338 4 43 43 1(-0.2) 8(0.067) 3.63 2.76 84.66 1.128 7 44 44 1(-0.2) 8(0.067) 3.1 2.71 85.45 1.229 6.5 45 45 1(-0.2) 8(0.067) 3.66 2.77 84.57 1.312 7 46 46 1.5(0.2) 8(0.067) 3.06 2.49 81.4 0.729 5 47 47 1.5(0.2) 8(0.067) 2.93 2.82 78.691 1.034 5.2 48 48 1.5(0.2) 8(0.067) 2.68 2.23 89.653 0.934 5 49 49 2(0.6) 8(0.067) 2.37 3 85.965 0.836 4 50 50 2(0.6) 8(0.067) 2.13 1.21 85.319 0.921 3.5 51 51 2(0.6) 8(0.067) 1.96 1.93 76.342 0.768 4 52 52 2.5(1) 8(0.067) 2.15 1.51 74.923 0.759 4 53 53 2.5(1) 8(0.067) 2.01 1.43 79.642 0.734 3 54 54 2.5(1) 8(0.067) 1.83 1.52 85.819 0.603 4 55 55 0(-1) 12(0.6) 6.8 4.61 89.25 1.981 1 56 56 0(-1) 12(0.6) 7.31 4.22 88.39 1.89 1 57 57 0(-1) 12(0.6) 7.01 5.01 95.48 1.947 1 58 58 0.5(-0.6) 12(0.6) 6.51 3.16 89.54 1.245 3 59 59 0.5(-0.6) 12(0.6) 6.96 3.95 83.57 1.321 2.5 60 60 0.5(-0.6) 12(0.6) 6.21 2.96 84.21 1.129 3 61 61 1(-0.2) 12(0.6) 3.93 3.08 85.98 1.108 7 62 62 1(-0.2) 12(0.6) 4.13 3.37 86.21 1.02 6.5 63 63 1(-0.2) 12(0.6) 3.85 3 86.94 0.97 7 64 64 1.5(0.2) 12(0.6) 3.01 2.76 88.642 0.967 4 65 65 1.5(0.2) 12(0.6) 3.48 2.9 87.06 0.797 3 66 66 1.5(0.2) 12(0.6) 2.97 2.96 83.921 0.803 4

114
67 67 2(0.6) 12(0.6) 2.66 2.39 87.406 0.778 3 68 68 2(0.6) 12(0.6) 2.72 2.42 79.693 0.876 2.5 69 69 2(0.6) 12(0.6) 2.53 2.26 89.335 0.783 3 70 70 2.5(1) 12(0.6) 2.2 1.5 82.721 0.669 3 71 71 2.5(1) 12(0.6) 2.19 1.48 78.745 0.686 2.5 72 72 2.5(1) 12(0.6) 2.31 1.63 89.241 0.608 3 73 73 0(-1) 15(1) 9.85 6.4 96.21 2.1 1 74 74 0(-1) 15(1) 9.53 5.99 93.25 2.321 1 75 75 0(-1) 15(1) 9.07 6.21 90.28 2.206 1 76 76 0.5(-0.6) 15(1) 8.56 4.96 92.54 1.1235 1 77 77 0.5(-0.6) 15(1) 7.97 5.21 84.57 1.021 1 78 78 0.5(-0.6) 15(1) 7.87 5.17 85.21 0.987 1 79 79 1(-0.2) 15(1) 4.87 4.12 86.98 0.963 2 80 80 1(-0.2) 15(1) 5.96 3.99 87.21 0.859 2 81 81 1(-0.2) 15(1) 5.57 4.37 87.94 0.821 2 82 82 1.5(0.2) 15(1) 3.97 3.27 89.642 0.765 3 83 83 1.5(0.2) 15(1) 3.67 4.33 88.06 0.652 2.5 84 84 1.5(0.2) 15(1) 4.13 4.22 84.921 0.506 3 85 85 2(0.6) 15(1) 3.13 3.96 88.406 0.521 2 86 86 2(0.6) 15(1) 2.97 3.36 80.693 0.536 1.5 87 87 2(0.6) 15(1) 3.66 3.02 90.335 0.468 2 88 88 2.5(1) 15(1) 2.32 2.57 83.721 0.521 2 89 89 2.5(1) 15(1) 2.85 2.21 79.745 0.511 1 90 90 2.5(1) 15(1) 1.97 2.2 90.241 0.421 2
Table 20. Significance statistics, p values and signal to noise ratio (S/N) of predicted
models for ash gourd
Model Lack of fit S/N
Response Sum of
squares
df p-value Sum of
squares
df p-value
TPC 742.38 7 0.0001 14.62 20 0.2501 65.713
Y&MC 155.62 9 0.0001 9.23 20 0.0621 49.464
Color (L) 4988.54 7 0.0001 440.88 22 0.07801 39.457
Firmness 55.79 8 0.0001 5.35 21 0.0001 40.374
Overall
acceptability
469.62 9 0.0001 58.09 20 0.3243 23.791

115
Table 21. Significance statistics, p values and signal to noise ratio (S/N) of predicted
models for drumstick
Model Lack of fit S/N
Response Sum of
squares
df p-value Sum of
squares
df p-value
TPC 505.63 5 0.0001 13.89 24 0.3558 72.85
Y&MC 270.24 6 0.0001 18.18 23 0.0515 45.34
Color (a) 72.65 7 0.0001 12.66 22 0.0831 29.03
Firmness 524.69 6 0.0001 53.85 23 0.073 34.22
Overall
acceptability
675.48 8 0.0001 32.99 21 0.0511 42.44
Table 22. Significance statistics, p values and signal to noise ratio (S/N) of predicted
models for pumpkin
Model Lack of fit S/N
Response Sum of
squares
df p-value Sum of
squares
df p-value
TPC 135.7176 8 0.0001 2.826047 15 0.1647 50.440
Y&MC 80.52517 6 0.0001 2.212739 17 0.4606 36.465
Color (L) 1652.848 3 0.001 97.26419 20 0.9714 22.343
Firmness 7.21269 6 0.0001 0.229633 17 0.1097 34.694
Overall
acceptability
222.4349 7 0.0001 47.0651216 16 27.306

116
Table 23. Coefficients of the fitted polynomial representing the relationship between the
response and the process variable and R2 values for RTC ash gourd
Coefficients TPC
(log cfu/g)
Y & MC
(log cfu/g)
Color (L) Firmness (N) Overall
acceptability
Intercept 5.43a 1.97
a 63.30
a 2.21
a 3.75
a
A-Dose -3.56a -1.13
a 1.12
a 0.66
a 4.09
a
B-Storage time 2.08a 1.20
a -7.04
a -1.30
a -3.10
a
AB -1.29a -0.67
a 4.63
a 0.71
a 1.20
a
A2
0.38a 0.39
a -5.48
a -0.38
a 0.055
a
B2 -0.51
a 0.22
a -2.64
a 0.00079 0.70
a
A2B 0.10
a 0.58
a -4.15
a -0.35
a 1.33
a
AB2 0.83
a -0.18
a 1.91
a -0.35
a -2.34
a
A3
0.099 a 0.019
a 0.01 -0.35
a -1.90
a
B3 0.43
a -0.19
a -0.01 0.64
a -0.53
a
R2 0.97 0.93 0.89 0.90 0.87
a Significant terms at p ≤ 0.05
Table 24. Coefficients of the fitted polynomial representing the relationship between the
response and the process variable and R2 values for RTC drumstick
Coefficients TPC
(log cfu/g)
Y & MC
(log cfu/g)
Color (a) Firmness (N) Overall
acceptability
Intercept -0.39a -0.51
a -4.07
a 1.46
a 0.91
a
A-Dose -0.68a -0.56
a -1.12
a -1.61
a -1.45
a
B-Storage time 0.57a 0.57
a 0.59
a -1.27
a -0.49

117
AB 0.018 1.15a -0.38
a -0.056 2.97
a
A2
-0.100 0.62a 0.72
a -1.58
a -1.90
a
B2 0.12 0.019
a 0.18
a -0.74
a 1.49
a
A2B 2.49
a 1.83
a 0.45
a -2.96
a -2.19
a
AB2 -1.72
a -1.25
a 0.48
a -0.96
a -2.13
a
A3
-1.24a -0.34 0.27 0.64
a 2.66
a
B3 0.22 0.26 0.14 0.073
a -1.24
a
R2 0.92 0.86 0.86 0.79 0.89
a Significant terms at p ≤ 0.05
Table 25. Coefficients of the fitted polynomial representing the relationship between the
response and the process variable and R2 values for RTC pumpkin
Coefficients Logit(TPC) Y&MC
(log cfu/g)
Color (L) Firmness
(N)
Overall acceptability
(Hedonic)
Intercept 0.037187a 3.15638
a 82.04992
a 0.275679
a 5.737103
a
A-Dose -0.87613a -0.73809
a -0.80918
a -0.2271
a 1.074074
a
B-Storage time 0.984792a 0.857211
a 8.792812
a -0.00235 -3.42333
a
AB -0.43095a -0.04779 -0.8359
a -0.04877
a 1.412679
a
A2
0.313907a 0.223595
a 0.484688 0.051385
a -0.8006
a
B2 0.578462
a -0.43183
a -1.39156 0.018442 0.3375
A2B 0.120244
a -0.00117 0.048437 0.014139
a -0.30804
a
AB2 -0.29278
a 0.100796
a 0.352516 -0.02633
a -0.225
A3
-0.04786a -0.04214
a -0.12251 -0.008
a 0.113426
a
B3 -0.10923 -0.02724 -1.78247 -0.02758 1.3125
a
R2 0.937315 0.905814 0.730179 0.918311 0.825361
a Significant terms at p ≤ 0.05

118
3.1.1.1. Microbial quality
Microbial contamination can be a major source of spoilage of fresh-cut produce.
Microbial spoilage has been used by quality assurance departments in the fresh-cut
industry as an objective indicator of quality failure of fresh-cut vegetable commodities
[147]. Contamination sources of fresh-cut produce include raw materials and contact with
processing equipment. The micro-organisms that exist on the surfaces of raw, whole
produce appear to be the major source of microbial contamination and consequent
spoilage of fresh-cut fruits and vegetables.
Fresh-cut vegetables have high levels of microorganisms and several outbreaks of food-
borne illnesses have been found to be associated with these products (Fan et al., 2008
from intro). In general, total bacterial counts of fresh-cut products just after processing
were reported to range from 3 to 6 log CFU g-1
[13]. There are no standard prescribed
limits for acceptable microbial load in case of fresh fruits and vegetables. The upper limit
for total microbial load of fresh-cut vegetables during the entire intended storage duration
as set by European Standards is < 7 log CFU g-1 [148]. However, according to guidelines
of the Centre for Food Safety, Hong Kong, the total microbial load of < 5 log CFU g-1
has been considered satisfactory for fresh-cut mixed salads [149]. Therefore, in the
present study, a total microbial load of 5 log CFU g-1 was taken as the upper limit for
microbial acceptability of RTC vegetables.
A significant (p ≤ 0.05) increase in mesophilic bacterial (TPC) and yeast and mold counts
(Y&MC) during storage was observed in non-irradiated control samples of all the three
vegetables. Gamma irradiation significantly reduced microbial load and it decreased

119
linearly with radiation dose. The effect of radiation treatment and storage duration on
TPC and Y&MC in ash gourd, drumstick and pumpkin is depicted in Figures 12, 13 and
14, respectively.
Figure 12. Variation of (a) Total plate counts (media: plate count agar, 37 °C, 24 h) and
(b) yeast and mold counts (media: potato dextrose agar, 37 °C, 48 h) with radiation dose
(0 – 2.5 kGy) and storage time (0 – 15 d) in RTC ash gourd.
Figure 13. Variation of (a) Total plate counts (media: plate count agar, 37 °C, 24 h) and
(b) yeast and mold counts (media: potato dextrose agar, 37 °C, 48 h) with radiation dose
(0 – 2.5 kGy) and storage time (0 – 15 d) in RTC drumstick.

120
Figure 14. Variation of (a) Total plate counts (media: plate count agar, 37 °C, 24 h) and
(b) yeast and mold counts (media: potato dextrose agar, 37 °C, 48 h) with radiation dose
(0 – 2.5 kGy) and storage time (0 – 28 d) in RTC pumpkin.
Ash gourd: Control samples of RTC ash gourd on zero day of storage had TPC and
Y&MC load of 3.86 and 2.09 log CFU/g, respectively. The mesophilic counts reduced by
2-3 log cycles compared to the control immediately after radiation treatment depending
on the dose delivered (Figure 12 a). In control and samples irradiated at 0.5 and 1 kGy,
counts reached higher than 7 log CFU/g, on day eight, beyond the acceptable limit
prescribed (5 log CFU/g) for fresh cut vegetables [148, 149]. In samples exposed to a
radiation dose of 1.5 kGy the mesophilic counts showed values greater than 5 log CFUg-1
on day 12 of storage period, reducing the microbial quality of the product. Samples
irradiated at 2 kGy or above exhibited no microbial spoilage until 12 d of storage. At the
end of storage period (15 d), the counts exceeded the acceptable limit in control and
samples irradiated below 2 kGy. However, a radiation dose of 2 kGy and above was
suitable to keep the mesophillic counts well below the acceptable limit.
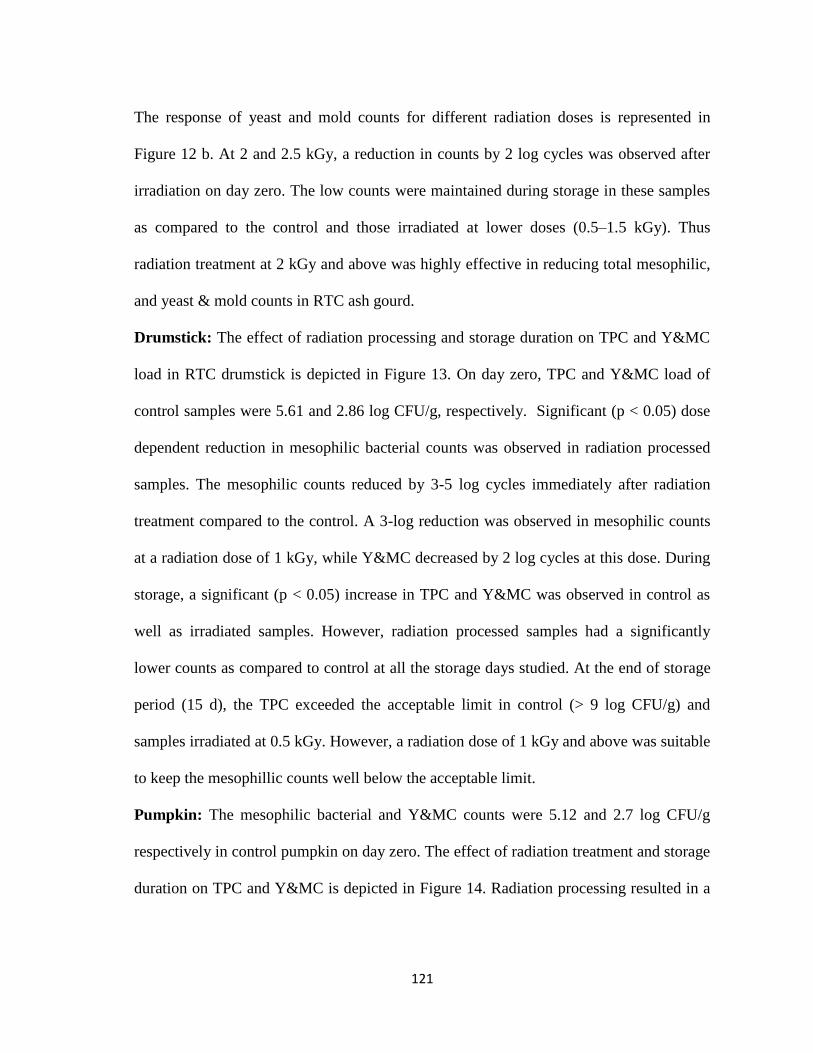
121
The response of yeast and mold counts for different radiation doses is represented in
Figure 12 b. At 2 and 2.5 kGy, a reduction in counts by 2 log cycles was observed after
irradiation on day zero. The low counts were maintained during storage in these samples
as compared to the control and those irradiated at lower doses (0.5–1.5 kGy). Thus
radiation treatment at 2 kGy and above was highly effective in reducing total mesophilic,
and yeast & mold counts in RTC ash gourd.
Drumstick: The effect of radiation processing and storage duration on TPC and Y&MC
load in RTC drumstick is depicted in Figure 13. On day zero, TPC and Y&MC load of
control samples were 5.61 and 2.86 log CFU/g, respectively. Significant (p < 0.05) dose
dependent reduction in mesophilic bacterial counts was observed in radiation processed
samples. The mesophilic counts reduced by 3-5 log cycles immediately after radiation
treatment compared to the control. A 3-log reduction was observed in mesophilic counts
at a radiation dose of 1 kGy, while Y&MC decreased by 2 log cycles at this dose. During
storage, a significant (p < 0.05) increase in TPC and Y&MC was observed in control as
well as irradiated samples. However, radiation processed samples had a significantly
lower counts as compared to control at all the storage days studied. At the end of storage
period (15 d), the TPC exceeded the acceptable limit in control (> 9 log CFU/g) and
samples irradiated at 0.5 kGy. However, a radiation dose of 1 kGy and above was suitable
to keep the mesophillic counts well below the acceptable limit.
Pumpkin: The mesophilic bacterial and Y&MC counts were 5.12 and 2.7 log CFU/g
respectively in control pumpkin on day zero. The effect of radiation treatment and storage
duration on TPC and Y&MC is depicted in Figure 14. Radiation processing resulted in a

122
significant (p < 0.05) dose-dependent reduction in the microbial counts. A 4-log reduction
was observed in mesophilic bacterial counts at a radiation dose of 2 kGy, while Y&MC
decreased by 2 log cycles at equivalent radiation dose. During storage, a significant
increase in both TPC and Y&MC was observed (p < 0.05) in control as well as radiation-
treated samples. However, radiation processed samples at all doses had significantly (p <
0.05) lower microbial counts as compared to control throughout the storage period. At the
end of storage period (28 d) TPC was > 9 log CFU/g for control samples while TPC for
radiation-treated (2 kGy) samples was < 4 log CFU/g.
When ionizing radiation strikes bacteria and other microbes, its high energy breaks
chemical bonds in molecules that are vital for cell growth and integrity. As a result, the
microbes die, or no longer multiply to cause spoilage [150]. Radiation induced reduction
of microbial load by 5-log cycle in french beans at a dose of 2 kGy [122], and a 2 log
cycle reduction in radiation-treated celery (1.5 kGy) was observed [151]. Reductions of
approximately 5.25 and 4.14 log CFU/g of a five-strain cocktail of L. monocytogenes
were reported for cabbage and tomato, respectively, at a radiation dose of 1 kGy [88,152]
reported that the initial bacterial load in control carrot samples (Daucus carota) was 6.3 ×
102 CFU/g in control samples which increased to 6.5 × 10
5 CFU/g after 14 days of
storage. A dose of 1 kGy reduced the bioload down to 12.0 CFU/g, with few colonies
after 14 d storage. The samples receiving 2 kGy or higher doses were found to be
completely free of bacteria during 14 days of refrigerated storage. Thus, the results
obtained in the present study are in accordance with already published literature data.

123
It is proposed that elimination of spoilage bacteria can bring about enhanced growth of
some pathogenic bacteria. Reports however document 4–5 log cycle reduction of L.
monocytogenes in radiation processed sprouts [153] and watercress [154]. Thus
pathogenic microbes were not monitored in the present study.
3.1.1.2. Color
The three Commission Internationale de l’Eclairage (CIE) co-ordinates “L*”, “a*” and
“b*” values were measured for all the three vegetables. “L*” value represents luminosity
of the sample and varies from 0 (black) to 100 (white). Increase in luminosity can be
correlated with the development of whiteness in the samples, while a decrease of
luminosity can be an indication of browning appearance. In case of ash gourd and
pumpkin, significant (p ≤ 0.05) effect of radiation treatment and storage was observed in
“L*” values, however, no significant (p ≤ 0.05) change in “a*” and “b*” values was
noticed. On the other hand, for processed drumstick samples, significant changes were
noticed in “a*” values (+ red, - green) while “L*” and “b*” values were not affected.
Therefore “L*” values for ash gourd and pumpkin, and “a*” values for RTC drumstick
were analyzed with respect to radiation treatment and storage. Figure 15 depicts the effect
of radiation treatment and storage on the color attributes of ash gourd, drumstick and
pumpkin.
Ash gourd: The effect of radiation processing and storage duration on L* values is
depicted in figure 15 (a). L* values continuously decreased with storage time in the
control samples. Beyond 5 d, the control samples exhibited appreciable lowering in L*
values and visual browning that increased during further storage. L* values also

124
decreased for samples irradiated at lower doses (0.5–1.5 kGy) after 8 d. It is interesting to
note that the luminosity (L*) of the cut ash gourd irradiated at 2 and 2.5 kGy remained
unchanged during storage and the visual quality was acceptable at the end of storage
period (12 d).
Figure 15. Effect of radiation treatment and storage on (a) L values of RTC ash gourd; (b)
a values of RTC drumstick; (c) L values of RTC pumpkin.
Radiation induced inhibition in surface browning has been documented by [155] in fresh-
cut vegetables. Decrease in surface browning of lettuce with increasing radiation dose
was also reported by Fan et al [94, 156]. A negative correlation between browning
intensity and lightness (L* value) has been documented [157]. Polyphenoloxidase (PPO)
is a key enzyme responsible for browning in fruits and vegetables, which catalyzes

125
oxidation of phenolic compounds, resulting in formation of colored melanins. Radiation
treatment might alter the reactions catalyzed by these enzymes, thus limiting the
development of brown pigments.
Drumstick: On day zero, no significant (p ≤ 0.05) effect of radiation processing was
observed on the “a*” values of cut drumstick samples. A positive value of ‘a*’ indicates
increased perception of redness, while negative values indicate greenness. During
storage, “a*” (-ive) values decreased with increasing storage period in control samples
(Figure 15 b), indicating a reduction in the greenness. Reduction of greenness might be
due to degradation of pigments during storage. Higher “a*” values (-ive) were obtained
for radiation treated samples as compared to control samples during the entire storage
duration indicating better retention of greenness throughout the intended storage period.
Pumpkin: The effect of radiation treatments and storage on L values of RTC pumpkin is
depicted in Figure 15 (c). Radiation processing had no significant (p < 0.05) effect on L*
values. A significant (p < 0.05) increase in L* values was however observed for both
control and radiation-treated samples with increasing storage duration (0 to 28 d).
Moreover, during storage the change in L* values for radiation processed samples was
significantly lower as compared to control. The L* value on day zero was 75.0 ± 3.23
which increased to 96.0 ± 5.48 and 83.0 ± 4.16 on day 28 for control and irradiated (2
kGy) samples, respectively. An increase in L* values signifies a decreased colour
intensity of control pumpkin samples. A similar trend was reported earlier in Citrus
clementina [158] and french beans [122].
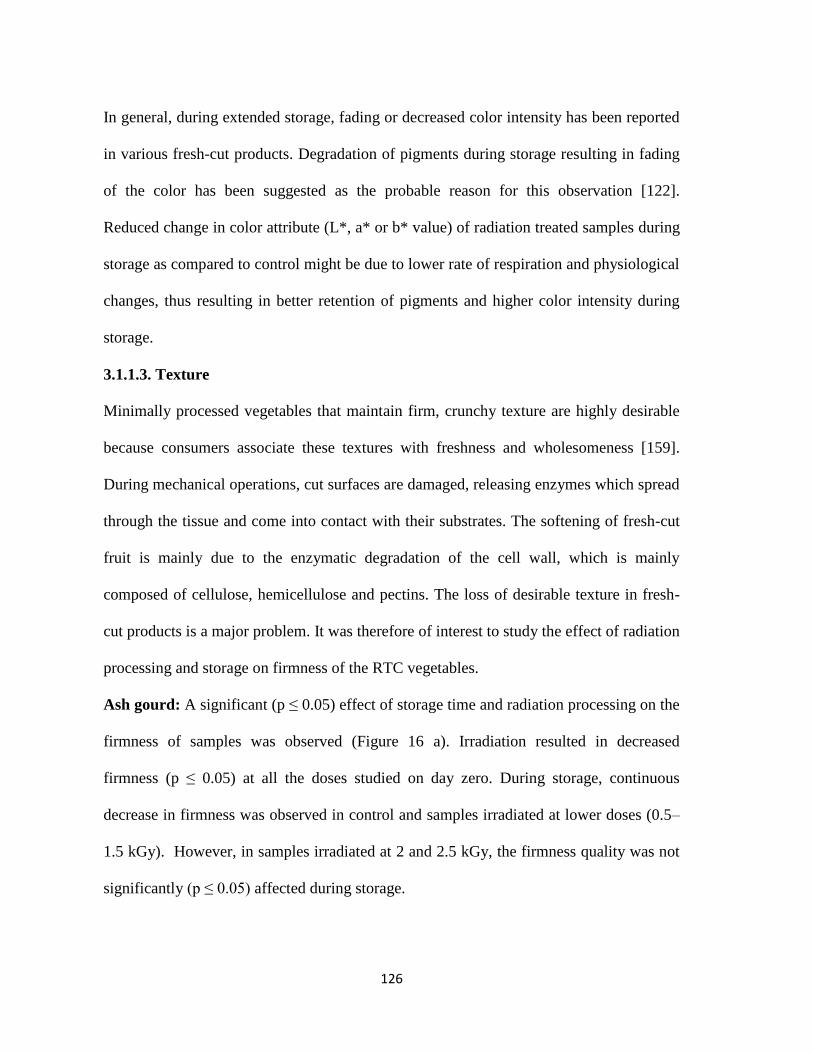
126
In general, during extended storage, fading or decreased color intensity has been reported
in various fresh-cut products. Degradation of pigments during storage resulting in fading
of the color has been suggested as the probable reason for this observation [122].
Reduced change in color attribute (L*, a* or b* value) of radiation treated samples during
storage as compared to control might be due to lower rate of respiration and physiological
changes, thus resulting in better retention of pigments and higher color intensity during
storage.
3.1.1.3. Texture
Minimally processed vegetables that maintain firm, crunchy texture are highly desirable
because consumers associate these textures with freshness and wholesomeness [159].
During mechanical operations, cut surfaces are damaged, releasing enzymes which spread
through the tissue and come into contact with their substrates. The softening of fresh-cut
fruit is mainly due to the enzymatic degradation of the cell wall, which is mainly
composed of cellulose, hemicellulose and pectins. The loss of desirable texture in fresh-
cut products is a major problem. It was therefore of interest to study the effect of radiation
processing and storage on firmness of the RTC vegetables.
Ash gourd: A significant (p ≤ 0.05) effect of storage time and radiation processing on the
firmness of samples was observed (Figure 16 a). Irradiation resulted in decreased
firmness (p ≤ 0.05) at all the doses studied on day zero. During storage, continuous
decrease in firmness was observed in control and samples irradiated at lower doses (0.5–
1.5 kGy). However, in samples irradiated at 2 and 2.5 kGy, the firmness quality was not
significantly (p ≤ 0.05) affected during storage.

127
Figure 16. Effect of radiation treatment and storage on firmness of (a) Ash gourd; (b)
Drumstick; (c) Pumpkin.
Drumstick: Effect of radiation processing and storage duration on the firmness of cut
drumstick is depicted in Figure 16 (b). A dose dependent decrease in firmness was
observed in radiation processed samples on day zero. In non-irradiated and samples
irradiated at 0.5 kGy, firmness decreased continuously during the storage. At 1 kGy, the
firmness was not significantly affected as a result of storage. At doses > 1.0 kGy,
significant softening was observed immediately after irradiation which increased further
during storage.
Pumpkin: A radiation dose-dependent reduction in firmness of RTC pumpkin cubes was
observed on day zero with a 50 % reduction at 2.0 kGy (Figure 16 c). Interestingly, an

128
increase in firmness of control samples was observed during storage (1.5 ± 0.2 N at 0 d to
2.1 ± 0.2 N at 28 d). However, no significant increase in firmness during storage was
noticed in radiation-treated samples. This could possibly be due to the lower respiration
rate in radiation treated samples resulting in decreased water loss and subsequently better
maintenance of texture. The firmness of the developed radiation-treated product was
therefore maintained during the entire intended storage while control samples exhibited
increased firmness after seven days of storage.
Radiation processing is known to induce softening immediately after treatment. Such
observations have been previously attributed to radiation-induced hydrolysis of pectin and
other cell wall components such as cellulose and hemicellulose [160]. No significant
changes in texture during storage have been reported in various radiation-treated fresh-cut
produce such as celery, green leaf lettuce, iceberg lettuce, parsley and red leaf lettuce by
Fan & Sokorai, 2008 [12]. The better retention of texture of radiation processed samples
during storage could possibly be due to lower rate of respiration in plant produce which
results in decreased water loss and subsequently better firmness [161].
On the other hand, increased firmness in fresh-cut tissues during storage has also been
reported earlier in some cases such as ready-to-use carrots, where a significant increase in
firmness was observed during storage [162]. Lignification was cited as the probable
reason by these researchers. Due to removal of outer epidermal layer to form peeled
ready-to-use product, physiological changes occur in the vegetable to initiate the
production of a new protective layer of lignin, giving a stiff aspect to the fresh-cut
vegetable and requiring greater force to break the plant tissue. Also water loss in fresh-cut

129
produce is known to result in drying of the outer layers and hence requiring more force to
pierce into the tissue [162].
3.1.1.4. Sensory acceptability
Consumer integrates all sensory inputs - appearance, texture, off-flavours and odours -
into a final judgement of the acceptability of that fruit or vegetable. In order to get an
appropriate implementation of a treatment for preservation or improvement in shelf life,
sensory evaluations need to be carried out to ensure that the perceived quality of a
determined product is not negatively affected. The sensory analysis was therefore
conducted to study the effect of radiation treatment and storage on consumer
acceptability.
Figure 17. Effect of radiation treatment and storage on the overall sensory acceptability of
(a) Ash gourd; (b) Drumstick; (c) Pumpkin.

130
Ash gourd: The results of the hedonic test for the overall acceptability of the product are
depicted in Figure 17 a. No significant difference (p ≤ 0.05) in hedonic scores of control
and irradiated samples up to a dose of 1.5 kGy was noted after irradiation on day zero.
Samples irradiated at 2 kGy and above exhibited softening in texture, resulting in lower
scores, however it was statistically insignificant. The sensory quality of control samples
was found to deteriorate within 5 d of storage. Between radiation doses 0.5–1.5 kGy, the
acceptability of the samples decreased with storage. However, at 2 and 2.5 kGy, it
remained unchanged during entire storage period. Interestingly, the acceptability of
samples at 2 kGy was higher than that of 2.5 kGy at all stages of storage. This could be
due to better retention of texture in samples irradiated at 2 kGy as compared to that of 2.5
kGy. These samples (2 kGy) also scored better in aroma and taste attributes making them
more acceptable compared to the other samples. Hedonic analysis thus indicated that
radiation processed samples at a dose of 2 kGy had the highest scores throughout the
storage period.
Drumstick: Figure 17 b shows the results of hedonic testing for overall acceptability of
control and radiation processed drumstick samples. The overall acceptability of the
samples was unaffected up to a radiation dose of 1.0 kGy, while it decreased at doses >
1.0 kGy on day zero. The hedonic scores obtained for control and samples subjected to
radiation doses of 0.5 and 1.0 kGy were 8.0 ± 0.3, 7.5 ± 0.5 and 7.0 ± 0.5 respectively,
while that for irradiated at 1.5, 2.0 and 2.5 kGy lied between 5 and 6. This might be
attributed to decreased firmness of the samples at higher doses. The acceptability of
control and samples irradiated at 0.5 kGy decreased drastically from day 5 onwards. This

131
may be attributed to reduced aroma and texture scores obtained. The samples irradiated
at 1 kGy exhibited excellent sensory quality during storage period up to 12 d with a
sensory score of 7 ± 0.5 for overall acceptability; however, the sensory score decreased to
< 4 on day 15.
Pumpkin: The hedonic scores plotted against radiation doses and storage duration is
shown in Figure 17 c. On day zero, the effect of radiation dose up to 1 kGy on the
hedonic scores was insignificant (p < 0.05). The values obtained were, respectively, 8.0 ±
0.7, 7.5 ± 0.5 and 7.0 ± 0.25 for control and samples subjected to radiation doses of 0.5
and 1.0 kGy. Sensory scores for samples irradiated at higher doses (beyond 1 kGy) were
significantly lower as compared to control on day zero. Scores for these samples were
between 4.5 and 5.5. This might be attributed to decreased firmness perceived by sensory
panel at these doses. Decrease in firmness is also evident from the instrumental data for
firmness (Figure 16 c). The acceptability of control and irradiated samples (0.5 kGy)
decreased drastically from day 14 onwards. This could be explained on the basis of
reduced aroma notes perceived by sensory panel and harder texture of the samples
towards the end of storage resulting in lower scores. The samples irradiated at 1 kGy
exhibited excellent sensory quality during storage period up to 21 d with a sensory score
of 6 ± 0.5 for overall acceptability; however, the sensory score decreased to < 3 on day
28. Significantly higher aroma scores for radiation processed carrots, cilantro, green
onions, parsley and red lettuce after 14 days of storage have been reported earlier [12].

132
3.1.1.5. Optimization and verification of results
The processing factors were optimized for achieving maximum shelf-life of the RTC
products with acceptable sensory and microbial quality. Apart from this, the optimized
levels of the variables and the importance of the responses were also taken into account.
Criteria set for optimization and solutions obtained for the individual vegetable product
are depicted in Table 26. The criteria decided aimed at maximizing shelf life of product
with mesophillic load of < 5 log CFU/g, minimum change in color & texture and an
overall acceptability score of greater than 5.
Table 26. Criteria for various factors and responses for process optimization and
corresponding optimized solutions obtained
Name Criteria 1 Criteria 2 Solution A Solution B
Ash gourd
A:Dose (kGy) minimize minimize 2.34 1.95
B:Storage time (d) maximize (8-15) maximize (5-12) 14 12
TPC (Log CFU/g) minimize (<5) is in range (<6) 3.95a; (3.76 ± 0.58)
b 3.92a; (3.86 ± 0.41)
b
Y&M (Log CFU/g) minimize minimize 2.35a; (2.28 ± 0.21)
b 1.60a; (1.52 ± 0.22)
b
Color (L) In range (39.0-
68.0)
In range (45- 68) 53.15a; (57.56 ±
2.54)b
62.09a; (61.29 ± 4.67)
b
Firmness (N) maximize(1.6-3.5) in range (1.0-3.5) 1.75a; (1.84 ± 0.50)
b 2.32a; (2.15 ± 0.35)
b
Overall
acceptability
(Hedonic)
In range (5-7) ≥ 5 5.52a; (5.65 ± 0.25)
b 5.38a; (5.21 ± 0.25)
b
Drumstick
A:Dose (kGy) minimize minimize 1.5 0.98
B:Storage time (d) maximize (5-12) maximize (5-15) 7 12
TPC (Log CFU/g) Minimize (<5) In range (<6) 3.33a; (3.52 ± 0.52)b 4.99a;(5.10 ± 0.45)
b
Y&M (Log CFU
/g) minimize minimize 1.33a; (1.62 ± 0.42)
b 2.28a; (2.12 ± 0.54)
b
Color (a) In range (-4.5- -1.5) In range (-4.5- -
1.5) -4.32a; (-4.45 ± 0.98)
b -3.25a; (-3.14 ± 0.41)
b
Firmness (N) In range (4.41-7.45) maximize(0.6-1.0) 4.26a; (4.59 ± 1.55)b
3.65a; (3.88 ± 1.25)b
Overall
acceptability
(Hedonic)
≥ 5 ≥ 5 5.36a; (5.3 ± 0.4)b
6.00a; (5.5 ± 0.6)b

133
Pumpkin
A:Dose (kGy) minimize minimize 1.2 1.0
B:Storage time (d) maximize (18-21) maximize (14-21) 21 21
TPC (Log CFU/g) minimize (< 5) is in range (< 6) 3.79a;(4.12 ± 0.45)
b 4.35
a; (4.92 ± 0.52)
b
Y&M (Log CFU
/g)
minimize minimize 2.91a; (3.12 ± 0.54)
b 3.02
a; (3.62 ± 0.42)
b
Color (L) minimize minimize 87.11a; (82.14 ±
5.41)b
87.65a; (90.14 ± 4.98)
b
Firmness (N) is in range
(0.6-1.0)
Maximize
(>0.8 <1.7)
0.96a; (0.89 ± 0.12)
b 1.04
a; (0.99 ± 0.21)
b
Overall
acceptability
(Hedonic)
In range (5-8) ≥ 5 5.26a; (5.5 ± 0.6)
b 5.18
a; (5.3 ± 0.4)
b
aPredicted values for solutions.
bActual values.
Two solutions were obtained for each vegetable depending on the criteria decided.
Solution A and B were obtained for criteria 1 and 2 respectively. For ash gourd Solution
A suggested a radiation dose of 2.34 kGy for a shelf life of 14 d while a shelf life of 12 d
was suggested at 2 kGy dose in solution B. For RTC drumstick, solutions A and B
suggested a radiation dose of 1.5 and 1.0 kGy for a shelf life of 7 and 12 d respectively. In
case of pumpkin, Solution A and B suggested a radiation dose of 1.2 and 1 kGy,
respectively, with a storage period of 21 d.
Models generated were validated using both the solutions obtained for each vegetable
separately. For the validation experiments, fresh samples of ash gourd, drumstick and
pumpkin were cut, packaged and irradiated at doses suggested in solutions obtained (2.3
and 2.0 kGy for ash gourd; 1.5 and 1.0 kGy for drumstick; 1.2 and 1.0 kGy for pumpkin).
They were subsequently analyzed for microbial quality (TPC and Y&MC), color, texture
and sensory acceptability during the intended storage period as obtained in solutions A
and B. A good agreement of actual and predicted values indicated the suitability of the
models (Table 26).

134
Both the solutions obtained for the three vegetables demonstrated a microbial load < 5 log
CFU/g and acceptable sensory quality (overall acceptability above 5). The solutions
corresponding to the lower radiation doses with acceptable microbial and sensory quality
were selected for each vegetable. Thus an optimum dose of 2 kGy and shelf life of 12 d
for ash gourd, and a dose of 1 kGy with a shelf life of 12 and 21 d for drumstick and
pumpkin respectively, was chosen. The products processed at these radiation doses were
further analyzed for the nutritional quality in terms of radical scavenging activity, total
phenolic and flavonoid content, vitamin C content, head space gaseous composition and
quantitative descriptive sensory analysis (QDA). Bioactive constituents were also
analyzed for the developed products at the optimized dose.

135
3.2. Characterization of the developed RTC products
Figure 18 presents the control and radiation processed products of RTC ash gourd,
drumstick and pumpkin.
Figure 18. Control and radiation processed (at optimum dose) RTC products for ash
gourd, drumstick and pumpkin at the end of intended storage period.
For ash gourd, optimum solution obtained was a shelf life of 12 d at a radiation dose of 2
kGy, while for drumstick and pumpkin the optimum parameters were a shelf life of 12
and 21 d respectively at a radiation dose of 1 kGy. The RTC products developed for the
selected vegetables were further characterized for sensory quality by quantitative
descriptive analysis (QDA), nutritional quality in terms of radical scavenging activity,
total phenolic and flavonoid content, vitamin C content, head space gaseous composition
inside the packages and aroma quality at the optimized conditions.

136
3.2.1. Sensory quality evaluation by Quantitative Descriptive Analysis (QDA)
The fresh control samples as well as those treated with optimum radiation dose and stored
for intended duration were evaluated for sensory attributes by QDA. Independent training
sessions were carried out to familiarize the sensory panel for assessing the product quality
and generate attributes for descriptive analysis.
Ash gourd: The sensory attributes evaluated for RTC ash gourd were texture, color,
aroma (ash gourd, irradiated, buttery and musty) and taste (ash gourd, irradiated). The
control samples at the end of storage (12 d) were not evaluated as they were spoiled. The
data obtained are represented by a spider diagram (Figure 19). The texture of the
processed product was not significantly affected after radiation processing on day zero;
however, softening was observed on the twelfth day of storage, which is in agreement
with the scores obtained on the hedonic scale. At the end of storage period (12 d), the
radiation processed product had slightly lower scores for attributes like buttery and ash
gourd aroma. No difference in taste was observed between processed products and fresh
control samples. QDA results thus indicate that radiation processed (2 kGy) ash gourd
had acceptable aroma, taste and textural properties during an extended storage period of
12 d.

137
Figure 19. Quantitative descriptive analysis of fresh control and radiation-processed ash
gourd samples at day zero and twelve of storage.
Drumstick: The data obtained from QDA of RTC drumstick samples is represented as a
spider graph in Figure 20. The sensory attributes studied were texture, color (green,
brown), aroma (drumstick, green, irradiated, and musty) and taste (drumstick, sweet and
irradiated). Control samples on day 12 were not evaluated for taste as they exhibited
visible fungal growth. On day zero no significant effect of irradiation was observed on the
attributes studied. At the end of intended storage period (12 d), the irradiated samples
exhibited slightly lower but statistically insignificant scores for texture and color.
However, no significant effect of storage was seen in the other attributes of radiation
processed samples as compared to fresh-cut drumstick samples of day zero. The results

138
indicated that radiation treated (1 kGy) samples had acceptable sensorial properties
during an extended storage period of 12 d.
Figure 20. Quantitative descriptive analysis of fresh control and radiation-processed
drumstick samples at day zero and twelve of storage.
Pumpkin: The sensory scores as obtained by QDA of pumpkin are shown pictorially by a
spider graph in Figure 21. Control samples on day 21 were not evaluated for taste as they
were spoiled. After 21 d of storage, the irradiated (1 kGy) product had marginally lower
scores for texture and color. This is also evident from the instrumental data for color and
texture. However, no significant difference in taste and aroma were noted between
radiation-treated products at day 21 and fresh control samples. No irradiated off flavor or
taste was perceived by the assessors. Similar results have been reported in various

139
radiation-treated minimally processed vegetables [86]. QDA results thus established that
radiation processed (1 kGy) pumpkin had acceptable aroma, taste and textural properties
during an extended storage period of 21 d.
Figure 21. Quantitative descriptive analysis of fresh control and radiation-processed
pumpkin samples at day zero and 21 of storage.
3.2.2. Nutritional quality
The fresh-cut products are claimed to be convenient and healthy alternatives to fulfill the
dietary needs for fresh food. However, the changes that happen during harvesting,
handling and processing can affect antioxidant status. Lindley (1998) [163] and Klein
(1987) [164] reviewed the nutritional consequences of minimal processing on fruit and
vegetables and concluded that conditions that maintain desirable sensory characteristics

140
will also preserve nutrients. Levels of ascorbic acid, carotenoids or polyphenols can
reflect the variations in antioxidant capacity of fruit and vegetables [164]. The antioxidant
potential in the form DPPH radical scavenging activity, and the principal components
which could contribute towards the antioxidant potential such as phenolic, flavonoid and
vitamin C contents were therefore analyzed in response to radiation treatment during
storage.
3.2.2.1. DPPH Radical scavenging activity
Ash gourd: Total antioxidant activity of ash gourd was found to be 169.9 ± 11.3 mg kg−1
of fresh weight. In control samples, the radical scavenging activity decreased on day 5
and then remained unchanged on subsequent storage. The activity increased significantly
(p ≤ 0.05) in response to radiation treatment compared to the corresponding control at all
stages of storage (Figure 22 A). A lowering in antioxidant activity was, however, noted
on storage of samples beyond 8 d in the irradiated samples.
Drumstick: The radical scavenging activity of drumstick was found to be 125.56 ± 8.6
mg kg−1
of fresh weight. Radiation treatment increased the antioxidant potential compared
to control samples. This increase was, however, not statistically significant (p ≤ 0.05). An
appreciable decrease in the activity was observed during storage in control as well as
irradiated samples (Figure 22 B). A decrease of 39 % and 43 % in activity was observed
in control and radiation processed samples on day 5. Beyond 5 d, activity decreased
continuously in control samples, while it remained unaffected in radiation processed
samples. The radiation treated samples (1 kGy) were therefore better than the

141
corresponding control in terms of DPPH scavenging activity at the end of storage period
(12 d).
Figure 22: Variation in DPPH radical scavenging capacity of control and radiation
processed RTC vegetables with storage. (A) Ash gourd, (B) Drumstick, (C) Pumpkin
Pumpkin: An appreciable radical scavenging activity in pumpkin has been reported
earlier [165]. In the present study, the antioxidant capacity in pumpkin was found to be 72
mg/kg of pumpkin. No statistically significant (p < 0.05) change was observed in

142
antioxidant activity due to radiation processing (1 kGy) at zero day (Figure 22 C). During
storage, the antioxidant activity was unchanged in control samples up to 7 days, while a
20% decrease was observed on day 21. On the other hand, irradiated samples had no
significant (p<0.05) change in the activity during the intended storage period of 21 d.
Various studies are available in literature reporting changes in the antioxidant potential of
fresh-cut vegetables as a result of processing. A decrease in the antioxidant activity after
processing is reported for fresh-cut spinach [166] and mandarin [167], while, wounding is
known to increase the antioxidant activity of Iceberg and Romaine lettuce [168]. It is
known that irradiation generates free radicals that may act as stress signals and trigger
stress responses in vegetables, resulting in increased antioxidant synthesis [94]. It has
been also proposed that gamma radiation is capable of breaking the chemical bonds of
polyphenols, resulting in the release of low molecular weight soluble phenols, leading to
an increase in antioxidant rich phenolics [92]. These could possibly be some of the
reasons for observed increase in radical scavenging activity in irradiated ash gourd and
drumstick. However, during storage, the activity declined which might be due to
degradation of antioxidants as a result of oxidation on prolonged storage.
3.2.2.2. Total phenolic and flavonoid content
Phenolic compounds including flavonoids are important bioactive compounds that have
the ability to reduce free radical formation and to scavenge free radicals. They act in
plants as antioxidants, antimicrobials, photoreceptors, visual attractors, feeding repellents,
and light screener [43]. The total phenolic and flavonoid content as estimated in ash
gourd, drumstick and pumpkin is shown graphically in Figure 23.

143
Figure 23: Variation in total phenolic and flavonoid content in ash gourd (A & D);
drumstick (B & E) and pumpkin (C & F) due to radiation processing and storage.
Ash gourd: Total phenolic content was found to be 102.08 ± 3.44 mg kg−1
of ash gourd
in the present study. Changes in total phenolic and flavonoid content with radiation
processing and storage are depicted in Figure 23 A & D respectively. Radiation treatment
resulted in a significant (p ≤ 0.05) increase in the phenolic and flavonoid content on day
zero, and it remained unaffected during the entire storage period. In control samples, the
total phenolic content decreased significantly (p ≤ 0.05) during an initial storage period of
5 d, while a marginal but statistically insignificant increase was observed in the flavonoid

144
content on day 5. The phenolic as well as flavonoid contents remained unchanged during
the remaining storage period. Total phenolic and flavonoid contents in radiation treated
samples were found to be significantly higher (p < 0.05) than the corresponding controls
on all storage days studied. Thus the nutritional quality of the developed radiation
processed product was better at the end of storage period (12 d).
Drumstick: A significant effect of radiation processing was observed on the total
phenolic content of RTC drumstick (Figure 23 B). The phenolic content in the radiation
processed samples (24 ± 2.35 mg/kg) was twice that of that of the control (11.24 ± 0.69
mg/kg) on day zero, which remained unchanged during storage duration. Irradiated
samples exhibited significantly (p < 0.05) higher phenolic content than corresponding
controls on all days of storage.
At day zero, radiation processing caused a marginal increase in flavonoid content,
however, the increase was not statistically significant (Figure 23 E). A decrease in the
content was observed during storage in control as well as radiation processed samples.
The contents in control and irradiated samples were comparable at the end of storage
period (12 d).
Pumpkin: In contrast to the ash gourd and drumstick, a significant (p < 0.05) decrease in
the total phenolic and flavonoid content was observed in response to radiation treatment
(Figure 23 C & F). Gamma radiation and UV-C induced decrease in antioxidant
compounds such as phenolics and flavonoids has been reported previously in various food
commodities [169, 170]. During storage, the contents decreased in control samples,
however it was unchanged in the radiation processed samples. A decrease in the flavonoid

145
content during storage in orange and grapefruit juices has been reported earlier [171]. The
decrease was explained by degradation or oxidation of sensitive phenolic constituents
during extended storage.
Radiation induced increase in the flavonoid content was reported earlier in mushrooms
[172] and bitter gourd at radiation doses ranging from 0.25 – 1.0 kGy. Accumulation of
phenolic compounds and flavonoids in response to radiation as a defense mechanism in
plants has been reported. The increase has been attributed to the phenylalanine ammonia
lyase activity which is one of the key enzymes in the synthesis of phenolic compounds in
plant tissues [173]. Increase in phenolic compounds in irradiated plant produce has also
been attributed to depolymerization and dissolution of cell wall polysaccharides which
facilitated higher extractability [85]. The results obtained in the present study are in
agreement with those reported by other authors for minimally processed vegetables [173,
174]. The trends obtained for the variation in phenolic contents in response to radiation
treatment and storage were similar to that obtained for DPPH radical scavenging activity.
It indicates that phenolic compounds present in ash gourd, drumstick and pumpkin play
an important role towards their radical scavenging potential.
3.2.2.3. Vitamin C content
Vitamin C is one of the most sensitive vitamins, being degraded quickly on exposure to
heat, light, oxygen, processing and storage. It works as an antioxidant by protecting the
body against oxidative stress and also as a cofactor in several vital enzymatic reactions
[175]. It was therefore of interest to monitor the effect of radiation processing and storage
on the content of vitamin C in the developed RTC products.

146
Figure 24. Effect of radiation processing and storage on ascorbic acid content of (A) Ash
gourd; (B) Drumstick; and (C) Pumpkin
Ash gourd: The amount of vitamin C in the present study was found to be 250 mg/kg of
ash gourd. The amount estimated is in agreement with the previous reports available [135,
100]. Vitamin C content of RTC ash gourd remained unaffected in response to radiation
treatment. No significant change (p ≤ 0.5) in the vitamin C content was observed during
storage in both the control (255–222 mg/kg) and radiation processed ash gourd (242–219
mg/kg) in the present study (Figure 24 A). Pandey et al. have, however, reported a

147
decreasing trend in the total vitamin C content in intact ash gourd during storage [176].
This different observation could be due to the methodology adopted wherein the total
ascorbate content was measured in its reduced form in the present study.
Drumstick: The content of vitamin C in fresh control drumstick samples (145.50 ± 9.17
mg/kg) was found to be in agreement with that reported in literature (141 mg/kg of edible
portion) [112]. A 13 % decrease in the content of vitamin C was observed immediately
after radiation treatment (1 kGy) (Figure 24 B). Storage resulted in a marginal decrease in
the vitamin C content of control as well as irradiated samples, however, this decrease was
not statistically significant (p < 0.05).
Pumpkin: Fresh control samples of pumpkin had vitamin C content of 600 mg/kg. A 27
% decline in vitamin C content was observed immediately after radiation processing (1
kGy), which did not change significantly (p < 0.05) during storage (Figure 24 C).
However, in the control pumpkin samples, a 60 % decrease in vitamin C content was
observed on day 21. At the end of the storage period, the vitamin C content of radiation-
treated samples (0.35 mg/kg) was significantly higher (p<0.05) than that of control
samples (0.23 mg/kg), making its nutritional quality better than control samples on day
21.
Losses in vitamin C content during storage have been known in different fruits and
vegetables [177]. Better retention of vitamin C during extended storage in radiation
processed sample has been observed earlier in different vegetables [12]. Thus, results
obtained in the present study are in agreement with the previous reports available in
literature.

148
3.2.3. Headspace gaseous composition
Minimally processed vegetables are living tissues. Damaged plant tissues exhibit an
increase in respiratory rate. It has been reported that tissues with high respiratory rates
have shorter postharvest life [161]. Headspace gas composition inside the packages plays
an important role in controlling the nature and content of microbial growth. The content
of O2 and CO2 was therefore monitored for both the control and radiation processed
samples in all the three RTC vegetable packages at the optimized process parameters.
Ash gourd: Significant (p ≤ 0.05) effects of irradiation and storage time were observed
for both gases (O2 and CO2) in the packages (Figure 25A). In the control samples, a
continuous decrease in O2 and an increase in CO2 were observed during storage.
Irradiated samples had a higher CO2 concentration compared to the control till 3 d of
storage. During storage, the CO2 concentration inside the package decreased gradually,
while a corresponding increase in O2 concentration was observed in the radiation
processed samples until the fifth day. However, from day five onwards it remained
constant for the intended duration of storage. At the end of storage, the gaseous
composition was 13 % O2 and 8.8 % CO2 for control, and 19 % O2 and 2.8 % CO2 for the
irradiated samples.

149
Figure 25. Headspace composition in control and radiation processed RTC (A) Ash gourd
(B) Drumstick and (C) Pumpkin packages during storage.
Drumstick: O2 and CO2 contents inside the packages are depicted in Figure 25 B.
Radiation processing resulted in significant (p < 0.05) decrease in O2 and increase in CO2
content immediately after treatment. The CO2 content of radiation processed samples was
higher than the control till day 7. However, during further storage, the CO2 content

150
decreased in radiation processed samples and then remained constant, achieving
equilibrium with the atmosphere. At the end of storage period (12 d), the gaseous
composition for control and irradiated samples was 18.28 % O2, 3.69 CO2 and 19.5 % O2,
2.39 % CO2 respectively.
Pumpkin: Immediately after radiation treatment, packages of irradiated pumpkin had
significantly (p < 0.05) lower O2 and higher CO2 levels (12.91% O2 and 8.59% CO2) than the
controls (17.88 % O2 and 3.62% CO2) as depicted in figure 25 C. After 7 days of storage O2
and CO2 content in packages subjected to radiation processing were 19 and 2.5 %,
respectively. Thus an increase in oxygen concentration as compared to zero day was
observed, which remained constant for the remaining storage duration.
The continuous decrease in O2 and increase in CO2 observed during storage in control
samples could be due to product respiration. A similar effect was observed in the case of
cantaloupe and honey dew subjected to passive MAP [178]. Radiation induced decrease in
O2 and increase in the content of CO2 was noted in all the three products immediately after
radiation treatment. A similar effect has been demonstrated in broccoli and mushrooms
where increase in metabolic activity was cited as the reason for increased respiration rate
during the first 24 h following irradiation [12, 179]. However, the content of O2 increased
gradually on further storage. Such an observation was also reported in mushrooms subjected
to gamma irradiation were linked to the reduction in metabolic activity during storage [179].
After a certain storage period (5 d for ash gourd, 5 d for drumstick and 7 d for pumpkin), no
significant (p < 0.05) change in the O2 content was observed, indicating attainment of
equilibrium between package headspace and atmosphere. O2 content less than 2% in

151
package headspace can result in anaerobic conditions leading to generation of off flavors and
possible growth of pathogens like Clostridium botulinum [180]. In the present study, the O2
concentrations observed for the processed samples during storage were between 16 to 19 %,
thus maintaining aerobic conditions within the package. Processing and packaging
conditions chosen in the present study were therefore suitable for the RTC products of the
selected vegetables.
3.2.4. Aroma quality - chemical analysis of free and bound aroma compounds and
identification of key odorants
Aroma is an important quality parameter that decides consumer choice and acceptability
of food. It is contributed by volatile compounds that are generally hydrophobic, and
usually occur in trace levels (ppm or ppb). These constituents show considerable variation
in both the nature and concentration in different food stuff. The nature of the food matrix
affects the concentration of volatile composition in the headspace and consequently their
perception by the consumer. In fresh food, flavor results from natural compounds
produced by enzymatic degradation during harvesting and processing [181]. Moreover,
the flavor of cooked food is due to numerous chemical and enzymatic reactions that are
influenced by temperature. Despite the presence of several volatile aroma compounds in a
food matrix, not all of them are responsible for the characteristic odor of a food product.
It is known that only a small portion of the large number of volatiles occurring in a food
matrix contributes to its overall perceived odor [182]. Further, these molecules do not
contribute equally to the aromatic profile of a sample. Sometimes, one substance alone is

152
able to reflect the approximate flavor of a product and, in this case, it is called “impact
compound”. But, in some circumstances, it is the combination of substances that
collectively interacts with the receptors from the nasal mucosa and is interpreted by the
brain to create a sensory impression typical for each product [182]. In general, the sensory
importance of an odor-active compound depends on its concentration in the matrix, and
on the limit of detection by human nose. Therefore, there is a great interest to determine
the contribution of various constituents in aroma isolate towards the overall flavor of a
product.
Intensive research carried out over the past three decades has demonstrated that, besides
the volatile constituents that contribute to odor, several aroma compounds accumulate as
non-volatile and flavorless glyco-conjugates, which make up a reserve of aroma to be
exploited [183]. These glyco-conjugates are shown to contribute finer notes to food.
Although odorless, they are able to release free aroma compounds by enzymatic or
chemical hydrolysis during processing and storage [39]. In the past few years, analysis of
flavor precursors in fruits, vegetables and spices have received increased attention. These
precursors in many cases have been shown to be more abundant than the free form to the
extent of 70-90 %. However, very few reports exist on the nature of the glycosidic
precursors in the vegetables.
Despite the fact that vegetables impart characteristic flavor (aroma, taste and color) to the
cuisine, very few reports exist on the nature of their aroma compounds. In the green form,
aroma of majority of the vegetables is indistinguishable from each other. Cooking results
in liberation of their characteristic aroma from their precursors. The nature of these
153
precursors has been exhaustively investigated in the vegetables of the Cruciferae family,
where in liberation of aroma from glucosinolates has been reported. No report, however,
exists on the nature of these precursors in majority of the vegetables, specifically of the
Indian origin. To the best of our knowledge, only one report exists on the nature of free
aroma compounds in ash gourd and pumpkin, while the drumstick aroma has not been
explored so far [106, 184]. The glycosidic aroma precursors in these vegetables have not
been studied till date. No study exists on the aroma impact compounds that contribute to
the characteristic odor of these vegetables. It was therefore of interest to investigate free
and bound aroma compounds of these vegetables and characterize the key odorants.
3.2.4.1. Ash gourd
3.2.4.1.1. Free aroma analysis: The free aroma of ash gourd was extracted employing
three different techniques – simultaneous distillation extraction (SDE), high vacuum
distillation (HVD) and solid phase micro extraction (SPME). The detailed methodology
adopted has been described in section 2.2.2.1.1. Although a widely used technique, SDE
has the disadvantages that some of the heat labile constituents may undergo degradation,
or the low boiling volatiles may be lost at the temperatures employed [185]. A
characteristic cooked odour is also perceived in many cases. Milder techniques such as
high vacuum distillation (HVD) employing distillation under reduced pressure and SPME
have therefore been attempted to obtain isolate that represent truer aroma [130]. The
aroma volatiles were thus extracted using SDE, HVD and SPME in order to ascertain
generation of artefacts as gas chromatographic (GC) patterns are largely influenced by
extraction procedures [186]. The GC/MS chromatograms obtained for SDE, HVD and

154
SPME are presented in Figure 26. Table 27 provides a quantitative distribution of the
constituents identified in the essential oils isolated by SDE, HVD as well as by SPME.
Figure 26: GC/MS profiles of volatile aroma of ash gourd obtained using SDE, HVD and
SPME methods.
Table 27. Quantitative distribution (µg/kg of ash gourd) of volatile oil components
identified in isolates obtained from SDE, HVD and SPME.
Compound KI HVD (µg/kg) SDE (µg/kg) SPME (µg/kg)
Alcohols
1-Butanol 655 1.46 ± 0.15

155
2-Pentanol 701 0.41 ± 0.05
3-Methyl-1-butanol 735 1.29 ± 0.22
2-Methyl-1-butanol 742 0.31 ± 0.04
2,3-Butandiol 765 0.73 ± 0.19
2,4-Dimethyl-3-pentanol 825 0.1 ± 0.03
1-Hexanol 868 0.098 ±0.04 0.51 ± 0.15
1-Heptanol 965 0.012 ± 0.003 1.72 ± 0.02
2-Ethylhexanol 1021 0.068 ± 0.008 1.25 ± 0.43
Nonanol 1170 0.005 ± 0.003 0.33 ± 0.02
2-Decyn-1-ol 1275 0.15 ± 0.03
Aldehydes and ketones
3-Methylbutanal 640 1.08 ± 1.06
2-Pentanone 675 1.09 ± 0.06
2-Ethylbutanal 742 0.43 ± 0.17
4-Methyl-3-penten-2-one 795 1.03 ± 0.37
Acetoin 812 7.59 ± 1.15 7.62 ± 1.18 12.16 ± 1.72
Hexanal 815 16.42 ± 2.28
2E-Hexenal 854 0.006 ± 0.001 0.37 ± 0.14
Heptanal 902 0.11 ± 0.04
6-Methyl-5-hepten-2-one 985 0.47 ± 0.17
2-Octanone 988 0.011 ± 0.009 0.61 ± 0.19
Octanal 994 0.006 ± 0.003 0.71 ± 0.08

156
Nonanal 1093 0.024 ± 0.006 1.38 ± 0.16
Decanal 1209 0.003 ± 0.001 0.11 ± 0.03
Terpenes
β.-Pinene 970 0.35 ± 0.01
Sabinene 976 0.51 ± 0.09
Indene 1025 0.36 ± 0.04
l-Limonene 1032 0.47 ± 0.17
α-Terpineol 1185 0.003 ± 0.001 0.21 ± 0.04
Nerolidol 1550 0.014 ± 0.009
Others
Methyl Butyrate 735 0.3 ± 0.07
Ethyl acetate 806 0.014 ± 0.006 0.039 ± 0.006 53.94 ± 5.46
n-Butyl acetate 815 0.36 ± 0.11
3-Methyl butyl acetate 875 0.4 ± 0.06
Methyl hexanoate 915 0.22 ± 0.06
3E-Hexenoic acid 1010 0.2 ± 0.04
Verbenyl acetate 1255 0.09 ± 0.01
Data are expressed as mean ± standard deviation (n = 3).
Irrespective of the extraction techniques used, acetoin was found to be the major
constituent identified. It is proposed to originate from a side reaction during the
biogenesis of valine and leucine [187]. Ethyl acetate was the only other constituent
detected in all the three extracts. Unlike SDE and SPME, however, the GLC profile of

157
HVD isolates was characterized by a negligible content of aliphatic C6-C10 alcohols and
aldehydes such as hexanol, heptanol, 2-ethylhexanol, hexanal, heptanal, and octanal. The
C5, C6, and C8 alcohols and carbonyl compounds, responsible for green odour of several
vegetables, are known to be derived from linoleic and linolenic acids [188].
The GC/MS profile of SPME sample was characterized by both, a higher number of
compounds and a significantly higher content of individual constituents as compared to
that obtained from SDE and HVD. A total of 37 volatile compounds were detected in the
headspace-solid phase microextraction (HS-SPME) of ash gourd. Alcohols (10),
carbonyls (13), terpenes (6) and fatty acid esters (7) were the principal chemical classes
identified in HS-SPME. Major compounds detected in SPME, that were not present in the
other two extraction techniques were: 1-butanol (1.46 µg/kg), 2,3-butanediol (0.73
µg/kg), 3-methyl-1-butanol (1.29 µg/kg), 4-methyl-4-penten-2-one (1.03 µg/kg), 3-
methylbutanal (1.08 µg/kg), hexanal (16.42 µg/kg), 6-methyl-5-hepten-2-one (0.47
µg/kg), sabinene (0.51 µg/kg), limonene (0.47 µg/kg) and indene (0.36 µg/kg). The
volatile profile of ash gourd comprises a large proportion of esters of aliphatic acids
(Table 27). Use of SPME resulted in the detection of a large number of low molecular
weight esters, such as methyl butyrate (0.3 µg/kg), n-butyl acetate (0.36 µg/kg), 3-methyl
butyl acetate (0.4 µg/kg), methyl hexanoate (0.22 µg/kg) and trans-verbenyl acetate (0.09
µg/kg). These observations indicated that SPME was more efficient for the extraction of
volatile aroma compounds from ash gourd. Higher extraction of alcohols and esters by
SPME in comparison to SDE has been previously reported in volatile profile of beans

158
[181]. The evaporation step during SDE may increase the loss of the most volatile
compounds [181].
In an earlier study conducted by Wu et al. on volatile compounds of ash gourd, they
identified E-2-hexenal (green fruity, pungent vegetable like odour), n-hexanal (fatty green
grassy) and 3-methyl-1-butanol (fruity, alcoholic) as the major volatile constituents of this
vegetable [106]. These compounds were also found as major aroma volatiles in the
present study. However, other volatile constituents such as n-hexyl formate, 1-octen-3-ol,
undecen-1-ol, 2-hexyl furan, deca-2, 4-dienal, isoamyl alcohol and 2-heptenal earlier
reported by Wu et al. were not detected by us in this study [106]. It is interesting to note
that despite a high content of acetoin detected in the essential oil in our study this
compound was not earlier reported even in trace amounts as a constituent of the ash gourd
volatiles. The variation observed in aroma composition could be due to the difference in
variety and geographical origin of the vegetable studied.
3.2.4.1.2. Bound aroma analysis
The bound aroma glycosides were extracted using two different methods – XAD and
solid phase extraction (SPE) using C18 cartridges (section 2.2.2.2.2.). The use of XAD as
well as SPE is widely reported in literature [189]. The extracts obtained from XAD and
SPE were separately subjected to acid and enzymatic hydrolysis. The released free
aglycones were then subjected to GC/MS analysis. A higher number of peaks were
detected in the GC profile of enzymatically hydrolyzed glycosidic isolate. This could
possibly be due to mild conditions during enzymatic hydrolysis unlike the harsh
conditions that prevail during acid hydrolysis resulting in significant modification of the

159
released aglycones [133]. This is in accordance with the earlier reports on bound aroma
precursors in wine wherein enzymatic hydrolysis are known to represent the true aroma
profile (without further chemical transformations) [190]. Enzymatic hydrolysis as a method
for release of free aglycones from glycosidically bound aroma precursors was thus adapted
for further studies.
Figure 27. GC/MS profile of free aglycones released from bound aroma precursors of ash
gourd obtained from XAD and SPE.
The representative GC/MS chromatograms of the released aglycones obtained after
enzymatic hydrolysis of XAD and SPE isolates are shown in Figure 27. As evident from the
chromatograms, significantly higher number of peaks was observed in the SPE extract. Table
28 provides a quantitative distribution of aglycones liberated from glycosidic precursors
extracted by XAD and SPE. Acetoin was detected as the major aglycone released after
hydrolysis of bound aroma glyco-conjugates isolated by both the methods. Acetoin
accounted for 98% of the bound aroma compounds in XAD extract and 46% in the SPME

160
isolate. The occurrence of acetoin as a major glyco-conjugate further confirms this
compound as an important aroma constituent of ash gourd. Among the other bound aroma
constituents identified in XAD extract, 2-pentanol (minty), 2-ethyl-1-hexanol (floral), 3-
methyl butanol (ripe onion) and vanillin (vanilla like) with low odor thresholds may also
contribute to the overall odor of the vegetable.
Table 28. Quantitative distribution (µg/kg ash gourd) of free volatile components
obtained from glycosidic precursors extracted by XAD and SPE.
Compound KI XAD (µg/kg) SPE (µg/kg)
Alcohols
1-Butanol 655 6.75 ± 0.26
3-Methyl-1-butanol 735 0.17 ± 0.03 23.48 ± 1.58
2-Methyl-1-butanol 742 12.31 ± 0.05
2,3-Butandiol 765 5.86 ± 0.05
1,3-Butanediol 784 0.08 ± 0.02 5.89 ± 0.05
1-Hexanol 868 3.09 ± 0.03
2,4-Hexadien-1-ol 875 0.79 ± 0.02
2-Pentanol 959 0.09 ± 0.02 2.24 ± 0.06
1-Heptanol 965 1.51 ± 0.07
2-Ethylhexanol 1021 1.68 ± 0.03 10.65 ± 0.92
4-Penten-1-ol 1072 Tr
1-Nonanol 1171 1.17 ± 0.17
Trans-2-undecen-1-ol 1368 0.17 ± 0.03

161
Dodecanol 1473 0.16 ± 0.01
Hexadecanol 1879 Tr
Octadeca-9,12-dien-1-ol 2035 0.17 ± 0.012
Cis-9-octadecen-1-ol 2082 0.93 ± 0.12
Aldehydes and ketones
3-Methyl-butanal 640 0.14 ± 0.04
2-Pentanone 675 3.23 ± 0.24
2-Ethylbutanal 742 3.67 ± 0.1
4-Methyl-3-penten-2-one 795 24.99 ± 2.24
Acetoin 812 826 ± 3.456 138.64 ± 10.02
Hexanal 815 12.74 ± 1.18
4-Hydroxy-2-butanone 820 Tr
2-Hexenal 854 2.19 ± 0.13
Heptanal 902 2.66 ± 0.16
Benzaldehyde 961 Tr
6-Methyl-5-hepten-2-one 985 5.63 ± 0.18
2-Octanone 988 4.89 ± 0.77
Octanal 994 1.34 ± 0.35
Nonanal 1093 Tr 2.36 ± 0.41
Decanal 1193 Tr 0.67 ± 0.25
3-Hydroxy-4-methoxy
benzaldehyde
1391 1.01 0.581

162
Dodecanal 1407 0.505 ± 0.062
Terpenes
Myrcene 955 0.8 ± 0.59
β-Pinene 970 2.28 ± 0.49
Sabinene 976 2.34 ± 0.1
Indene 1025 2.98 ± 0.15
l-Limonene 1032 5.8 ± 0.11
Cymene 1113 0.69 ± 0.18
Allo-ocimene 1125 1.11 ± 0.09
α-Terpineol 1185 1.82 ± 0.08
Others
Methyl butyrate 735 1.45 ± 0.05
n-Butyl acetate 815 2.52 ± 0.17
Isobutyl propionate 860 2.28 ± 0.2
3-Methyl butyl acetate 875 2.34 ± 0.1
Methyl hexanoate 920 2.29 ± 0.16
Nonanoic acid 1278 1.61 ± 0.04
Methyl decanoate 1325 1.5 ± 0.08
Decanoic acid 1372 1.59 ± 0.06
Dodecanoic acid 1565 1.86 ± 0.07
Ethyl palmitate 1990 1.69 ± 0.03
Data are expressed as mean ± standard deviation (n = 3); Tr – Detected in traces
163
The XAD extract of ash gourd was characterized by the presence of 10 alcohols and 7
carbonyl compounds (5 aldehydes and 2 ketones). The major alcohols identified were 3-
methyl-1-butanol (0.17 µg/kg), 2-ethyl hexanol (1.68 µg/kg), dodecanol (0.16 µg/kg),
trans-2-undecen-1-ol (0.17 µg/kg), octadeca-9,12-dien-1-ol (0.17 µg/kg) and cis-9-
octedecen-1-ol (0.93 µg/kg). As in free aroma isolate, acetoin (826 µg/kg) was also
identified as the most abundant bound precursor in the XAD isolate. The other aldehydes
detected in comparatively lower amounts include 4-hydroxy-2-butanone, benzaldehyde,
3-hydroxy-4-methoxy benzaldehyde, nonanal, decanal and dodecanal.
SPE isolate on the other hand, was characterized by the presence of total 42 compounds
with 11 alcohols, 13 carbonyl compounds, 8 terpenes and 10 fatty acids or esters. The
major compounds identified could be classified as alcohols: 3-methyl-1-butanol (23.48
µg/kg), 2-methyl-1-butanol (12.31 µg/kg), 2-ethyl hexanol (10.65 µg/kg); carbonyl
compounds: acetoin (138.64 µg/kg), 4-methyl-3-penten-2-one (25 µg/kg), hexanal (12.74
µg/kg) and terpenoids: limonene (5.8 µg/kg), β-pinene (2.28 µg/kg), sabinene (2.34
µg/kg) & indene (2.98 µg/kg). Apart from the compounds which were identified in XAD
extract, alcohols such as butanol, 1-nonanol, 2, 3-butanediol, 2-methyl-1-butanol,
hexanol, heptanol and carbonyl compounds including 4-methyl-3-penten-2-one, 2-
pentanone, 2-hexenal, heptanal, 6-methyl-5-hepten-2-one, 2-octanone were the other
major compounds identified in the SPE extract. Also certain terpenes such as β-pinene,
sabinene, myrcene, cymene, limonene, indene and α-terpineol were identified only in the
SPE extract. The presence of glycosidic precursors of terpenes has been widely reported
in literature [191]. Some higher aldehydes and alcohols such as dodecanal, dodecanol,

164
hexadecanol, octadeca-9,12-dien-1-ol, cis-9-octadecen-1-ol, which were present in XAD
extract were not detected in the SPE extract. However, these high molecular weight
compounds with high boiling points and odor threshold values, may not contribute
significantly to the overall aroma of the vegetable. The above results further confirm SPE
as an efficient technique for extraction of bound aroma glycosides from ash gourd,
confirming earlier reports on the suitability of SPE for extraction of aroma glycosides
from food stuffs [192].
3.2.4.1.3. Identification of key odorants
Aroma active compounds play a major role in imparting characteristic odor of a food.
Among the several compounds that make up the aroma isolate, a single or a very few
compounds in combination are known to contribute to its characteristic odor. The
presence of acetoin in considerable amount, both in free and in bound form suggests its
possible role as an aroma active compound of the vegetable. The study was thus focused
further on the identification of the most potent odorants of ash gourd. GC–O method
based on detection frequency (Global Olfactometry Analysis) of odors was employed as
the method was rapid and required no trained panelist. Eight odor active compounds were
sniffed by at least more than four assessors during olfactometric analysis of volatiles from
SDE and SPME that were injected separately on a DB-5 column. Table 29 presents odor
descriptors perceived by the panel for the aroma constituents in order of elution in this
column. A variety of odor qualities such as cut ash gourd, green, herbaceous, fatty green
were perceived. The nine judges constituting the sensory panel agreed that the odour of
the extract was typical buttery green vegetable like. Two regions at Rt 4.5–5.5 min and

165
17.5–19.0 min corresponding to the cut ash gourd and fatty green, respectively, closely
resembled the odor of the vegetable.
Table 29. ODP analysis of ash gourd SDE oil
Rt (min) Aroma perceived KI Compound
identified
OAV
4.0-4.5 Fruity 806 Ethyl acetate 5.8
4.8 – 5.67 Buttery 812 Acetoin 9522.5
9.5-9.7 Green-fruity/vegetable like 854 2E-Hexenal 352.9
10.00 Green flowery 868 Hexanol 39.2
13.75-14.00 Earthy/ herbaceous 965 Heptanol 4000
16.85-17.15 Fruity 988 2-octanone 220
17.53-17.65 Fatty green 994 Octanal 8571
17.75-17.95 Floral 1021 2-Ethyl hexanol ND
18.5-19.0 Green/fatty/soapy 1093 Nonanal 24000
21.35-21.54 Fatty/green 1170 Nonanol 100
21.90-22.05 Fruity/anise 1185 α-Terpineol 8.57
22.15-22.25 Green/nutty 1193 Decanal 1500
25.52-25.92 Dry wood/hay 1550 Nerolidol ND
ND – not detected
The odor detection frequency chromatogram of the volatile constituents analysed by GC–
O is shown in Figure 28. The DF data showed highest frequencies for acetoin (buttery/cut
ash gourd type), octanal (fatty green), nonanal (green/fatty/soapy) while somewhat lower
frequencies were found for 2-hexenal (green fruity/vegetable like), hexanol (green

166
flowery), heptanol (earthy/herbaceous), 2-octanone (fruity), nonanol (fatty/green) and
decanal (green/nutty). The identities of the eight compounds listed were established based
on their retention index, odour quality, and mass spectral data with those of standard
compounds. Among the odour active regions with highest DF, acetoin with a
characteristic creamy, fatty and buttery aroma, octanal with a fatty green odour and
nonanal with a green, fatty and soapy odour has not been reported earlier as an aroma
compound of this vegetable.
Acetoin is widely reported to occur in apples, asparagus, black currants, banana, litchi,
guava, blackberry, wheat, broccoli, brussel sprouts, cantaloupe, butter and yogurt [191,
193, 194]. It has also been proposed to be a major characteristic compound of lychee
aroma [191]. Alkenals and alkanals are known to contribute fatty-oily, slightly rancid
odours and are reported to be present in several vegetables [135]. Thus acetoin, octanal
and nonanal could be proposed as the most potent odorants of ash gourd. The latter two
compounds namely octanal and nonanal possess very low thresholds and thus were well
perceived during global analysis. Despite a high odour threshold, acetoin was also well
perceived by the sensory panel. This could possibly be due to the high concentration of
this compound in the vegetable. A high OAV value of this compound (Table 29), even
higher than octanal clearly suggests that its contribution to the overall odour of the
vegetable might be significant. Chemical structures and mass spectra for most potent
odorants of ash gourd are represented in Figure 29.

167
Figure 28. Odor Detection frequency chromatogram of Ash gourd SDE volatiles (Refer to
Table 29 for KI)
In order to further ascertain the role of acetoin as the odour active constituent of ash
gourd, the region corresponding to buttery/cut ash gourd odour, as perceived by the panel
was collected from the TCD vent and further subjected to GC/MS analysis. Acetoin was
the only constituent detected in the isolate (Figure 30), further confirming the role of this
compound as the key aroma active compound of the vegetable.
0
1
2
3
4
5
6
7
8
9
806 812 854 868 965 985 994 1021 1093 1170 1185 1193 1550
DF
KI

168
Figure 29. Chemical structures and mass spectra for most potent odorants of ash gourd
Figure 30: GC/MS chromatogram of cryotrapped fraction (4.5-5.5 min) isolated
corresponding to ash gourd aroma.

169
3.2.4.2. Drumstick
3.2.4.2.1. Free aroma analysis
The free aroma of drumstick was extracted employing SDE and SPME (section
2.2.2.2.1). The representative GC chromatograms obtained are shown in Figure 31, while
the quantitative distribution of the constituents identified is presented in Table 30.
Figure 31. GC/MS profiles of volatile aroma compounds of drumstick obtained using
SDE and SPME methods.

170
Table 30. Quantitative distribution (µg/kg of drumstick) of volatile oil components
identified in SDE and SPME.
Compound KI SDE (µg/kg) SPME (µg/kg)
Alcohols
Ethanol < 600 16.1 ± 2.08
1-PENTEN-3-OL 685 9.2 ± 0.13
1-Butanol, 3-methyl 735 2.12 ± 0.13 4.89 ± 1.48
1-Butanol, 2-methyl 742 4.41 ± 1.59
2-Penten-1-ol, (Z) 767 2.71 ± 0.29
2-Hexen-1-ol, (E) 853 3.09 ± 0.22
3-Hexen-1-ol, (Z) 857 0.016 ± 0.03 28.72 ± 3.99
1-Hexanol 868 0.02 ± 0.01 4.89 ± 0.22
1-Heptanol 965 0.63 ± 0.37
1-Octen 3 ol 985 0.18 ± 0.02
1,8-Octanediol 995 0.042 ± 0.01
2-Ethyl hexanol 1021 7.66 ± 1.86
1-Nonanol 1171 0.55 ± 0.35
2-Decen-1-ol 1271 0.78 ± 0.19
1-Decanol 1275 8.94 ± 2.34
Aldehydes and ketones
Acetaldehyde < 600 12.17 ± 3.29
Iso butyraldehyde 615 14.46 ± 3.1

171
Butanal, 3-methyl 640 21.75 ± 1.79
1-Penten-3-one 680 10.98 ± 3.26
Pentanal (CAS) 697 5.83 ± 1.98
2-Pentenal, (E) 745 4.83 ± 0.26
3-Hydroxy-2-butanone 812 9.25 ± 0.21 21.84 ± 2.69
Hexanal 815 63.6 ± 8.38
Trans-2-hexenal 854 136.21 ± 13.53
Heptanal 899 0.88 ± 0.26
4-Heptenal, (Z) 902 0.18 ± 0.03
2-Heptenal 955 0.22 ± 0.01
Benzaldehyde 961 2.42 ± 0.14
2-Octanone 988 2.23 ± 0.52
Benzeneacetaldehyde 1043 2.34 ± 1.08
2-Octenal, (E) 1060 0.004 ± 0.001 0.56 ± 0.06
Nonanal 1093 3.44 ± 0.33
2,6-Nonadienal, (E,Z) 1154 6.08 ± 3
Decanal 1193 14.42 ± 2.15 21.05 ± 4.52
Dodecanal 1407 0.004 ± 0.001 30.99 ± 8.73
2-Decenal 1261 2.06 ± 0.05 6.28 ± 1.55
2,4-Decadienal 1315 2.2 ± 0.33
Nitrogen and sulphur containing compounds
Propanenitrile, 2-methyl 625 12.16 ± 1.73

172
Butanenitrile, 2-methyl 695 3.43 ± 0.86
Propanesulfonylacetonitrile 1250 28.42 ± 8.07
2-hydroxy propane nitrile 725 8.54 ± 0.87
Isopropyl isothiocyanate 835 109.99 ± 17.66
Dimethyl sulfone 920 0.029 ± 0.001
Butane, 2-isothiocyanato 946 5.14 ± 0.15
Isobutyl isothiocyanate 974 14.79 ± 0.49
Benzyl nitrile 1138 0.004 ± 0.001
Benzene isonitrile 1198 1.86 ± 0.22
2-methoxy-3-(isobutyl)-pyrazine 1204 0.005 ± 0.001
Benzothiazole 1215 10.3 ± 1.3 19.25 ± 3.87
Terpenes and others
Ethyl acetate 806 8.95 ± 1.65
Z-4-Hexenyl acetate 1012 0.016 ± 0.002
l-LIMONENE 1031 2.52 ± 1.31
Trans-Linalool oxide 1088 2.1 ± 0.12
Linalool 1098 0.004 ± 0.001 0.59 ± 0.36
α-Terpineol 1185 12.28 ± 0.24
Data are expressed as mean ± standard deviation (n = 3).
As in ash gourd, use of SPME also resulted in isolation of a higher number of aroma
compounds in drumstick. The evaporation step during SDE could possibly have resulted
in the loss of the most volatile compounds [181]. The GLC profile obtained from SPME

173
was dominated by alcohols, carbonyls and esters. A higher extractability of alcohols and
esters by SPME fibre used has been reported earlier in beans by Barra et al. [181]. This
could possibly explain the dominance of above class of compounds in the volatile profile.
The GLC profile obtained from SDE extract was characterized by the presence of 17
volatile compounds of which one terpene, 4 alcohols, 5 carbonyl compounds, 5 nitrogen
or sulfur containing compounds and two esters were identified. The major aroma
compounds present in the SDE isolate were 3-methyl-1-butanol (2.12 µg/kg), 3-hydroxy-
2-butanone (9.25 µg/kg), 2-hydroxy propane nitrile (8.54 µg/kg) and ethyl acetate (8.95
µg/kg).
SPME profile, on the other hand, was characterized by the presence of 48 volatile
compounds. It included 14 alcohols, 22 carbonyl compounds, 8 nitrogen and sulphur
containing compounds and 4 terpenes. The major alcohol and carbonyl compounds
identified were 3-hexen-1-ol (28.72 µg/kg), 2-ethyl hexanol (7.66 µg/kg), decanol (8.94
µg/kg), 3-hydroxy-2-butanone (21.84 µg/kg), 3-methyl butanal (21.75 µg/kg), 1-penten-
3-one (10.98 µg/kg), trans-2-hexenal (136.21 µg/kg) and dodecanal (30.99 µg/kg).
Interestingly, the SPME profile of drumstick was characterized by the presence of
various nitrogen and sulphur containing compounds. It included nitriles: 2-methyl
propane nitrile (12.16 µg/kg), 2-methyl butane nitrile (3.43 µg/kg), propane sulfonyl
acetonitrile (28.42 µg/kg), benzene isonitrile (1.86 µg/kg); isothiocyanates: isopropyl
isothiocyanate (109.99 µg/kg), isobutyl isothiocyanate (14.79 µg/kg); and benzothiazole
(19.25 µg/kg). Nitriles, isonitriles and isothiocyanates are widely reported to be present in
vegetables of order Brasicales and are generated by the hydrolytic breakdown of their

174
precursor glucosinolates. These hydrolysis products are known to be responsible for the
characteristic aroma of various vegetables of this order [58]. 2-hydroxy propane nitrile,
dimethyl sufone and 2-methoxy-3-isobutyl pyrazine which were present in the SDE
isolate, were not detected in the profile obtained from SPME. These could have been
generated as a consequence of heat treatment employed during SDE.
Despite the fact that drumstick fruits have a distinct and pleasant aroma, no studies on the
detailed aroma composition have been reported till date. The volatile aroma compounds
of drumstick leaves and flowers have, however, been exhaustively explored. In a study
conducted by Dev et al., effect of hot air drying on the volatiles of drumstick pods was
studied using z-Nose (an electronic nose) [195]. The effect of different drying methods -
microwave-assisted hot air drying (MAHD) and conventional hot air drying methods at
different temperatures were investigated by these authors. Among the various volatiles
detected, β-sitosterol was the major compound while 2,3-Dihydro-3,5-dihydroxy-6-
methyl-4H-pyran-4-one, n-hexadecanoic acid and 9,12-octadecadienoic acid were the
minor compounds (< 10 ng/g) identified by them using GC/MS. Microwave drying was
shown not to cause any significant variation in the content of these volatiles. However,
detailed composition of aroma volatiles was not studied by these researchers.
3.2.4.2.2. Bound aroma analysis
Figure 32 represents the GC/MS profiles of aglycones released after enzymatic hydrolysis
of the bound aroma glycosides of drumstick. The quantitative distribution of the

175
aglycones identified in XAD and SPE hydrolyzates of drumstick are presented in Table
31.
Figure 32. XAD and SPE chromatograms of drumstick
Table 31. Quantitative distribution (µg/kg drumstick) of free volatile components
obtained from glycosidic precursors extracted by XAD and SPE.
Name KI XAD (µg/kg) SPE (µg/kg)
Alcohols
Ethanol <600 10.88 ± 1.39
2-Butanol 605 36.64 ± 8.05
3-Pentanol 680 1.36 ± 1.07
2-Pentanol 690 0.18 ± 1.56
3-Penten-2-ol 710 1.88 ± 0.05

176
3-Buten-1-ol, 3-methyl- 725 1.02 ± 2.41
1,2-Propanediol 729 1.19 ± 2.02
1-Butanol, 3-methyl 735 12.11 ± 1.3
1-Butanol, 2-methyl 742 4.89 ± 0.14
2-Penten-1-ol, (Z) 767 0.16 ± 0.74
2-Hexanol (CAS) 780 0.77 ± 0.74
4-methyl-1-pentanol 835 0.1 ± 4.07
2-Hexen-1-ol, (E) 853 0.25 ± 6.03
3-Hexen-1-ol, (Z) 857 2.5 ± 0.97 24.35 ± 2.87
1-Hexanol 868 14.58 ± 0.04
1-Heptanol 965 1.3 ± 4.18
1-Octen-3-ol 985 0.48 ± 0.05
1-Hexanol, 2-ethyl- 1021 9.32 ± 0.03
Benzyl alcohol 1035 4.35 ± 1.07 7.34 ± 0.02
2-Octen-1-ol, (Z) 1060 0.19 ± 0.17
2-Methylphenol 1070 0.28 ± 0.13
Z-6-Nonenal 1097 1.02 ± 0.09
Benzene ethanol 1120 5.94 ± 1.05 2.06 ± 0.07
2E,6Z-Nonadien-1-ol 1158 0.5 ± 0.1
1-Nonanol 1171 1.02 ± 0.33
2-Propyl-1-heptanol 1190 3.06 ± 0.17
1-Octyn-3-ol 1225 1.42 ± 0.14

177
1-Decanol 1275 1.07 ± 0.61
Aldehydes and ketones
Acetaldehyde <600 2.74 ± 0.24
Butanal, 3-methyl 640 1.18 ± 0.37
2-Ethylbutanal 742 0.13 ± 0.11
3-Hydroxy-2-butanone 812 14.31 ± 0.01
Hexanal 815 2.22 ± 2.46
2-Hexenal 854 2.09 ± 6.03
Heptanal 902 0.16 ± 4.07
Benzaldehyde 961 1.42 ± 0.04
Benzeneacetaldehyde 971 0.71 ± 1.98
5-Hepten-2-one, 6-methyl- 985 0.67 ± 0.31
2-Octanone 988 1.59 ± 13.12
Nonanal 1093 1.63 ± 4.18
Dodecanal 1407 0.75 ± 0.05
Nitrogen and sulphur containing compounds
Butanenitrile, 2-methyl 695 1.65 ± 0.01
Isopropyl isothiocyanate 835 0.19 ± 0.02
1-Propene, 3-isothiocyanato- 865 0.16 ± 0.13
Terpenes and others
1,3-Butadien-1-ol, acetate 785 0.04 ± 0.1
1-Butanol, 3-methyl-, acetate 875 0.14 ± 0.07

178
Ethyl pentanoate 898 0.19 ± 0.33
Myrcene 955 0.85 ± 1.09
Indene 1025 0.66 ± 0.14
Limonene 1031 0.54 ± 0.17
Trans linalool oxide 1088 11.69 ± 1.25 1.86 ± 0.1
Linalool 1098 1.19 ± 0.61
Myrcenol 1115 0.91 ± 0.12
2-Octen-1-ol acetate 1120 7.7 ± 1.17
Thujanol 1078 2.63 ± 0.56 0.54 ± 0.17
Citronellol 1178 0.4 ± 0.09
α-Terpineol 1185 2.44 ± 0.33
trans-Geraniol 1255 0.16 ± 0.21
Thymol 1285 0.1 ± 0.12
Limonene dioxide 1290 0.87 ± 0.11
Methyl decanoate 1325 0.53 ± 0.31
Eugenol 1355 1.58 ± 6.03
Decanoic acid 1372 0.73 ± 0.02
Tetradecane 1415 0.68 ± 0.09
Pentadecane 1500 0.81 ± 0.05
Stearic acid 2075 1.74 ± 0.12
Data are expressed as mean ± standard deviation (n = 3).

179
While only 10 aroma aglycones were detected in XAD, SPE isolate of drumstick was
characterized by the presence of 62 volatile compounds. The major aglycones identified
in XAD extract were 3-hexen-1-ol (2.5 µg/kg), benzene ethanol (5.94 µg/kg), benzyl
alcohol (4.35 µg/kg), 2-propyl heptanol (3.06 µg/kg), trans linalool oxide (11.69 µg/kg),
and 2-octen-1-ol acetate (7.7 µg/kg). Although the GC/MS profile obtained from
hydrolyzed XAD extract exhibited the presence of hydrocarbons and fatty acids such as
tetradecane, pentadecane, and stearic acid, they were not present in the SPE extract.
However, such compounds might not affect the overall aroma perception of the vegetable.
Alcohols constituted the most abundant chemical class in the SPE isolate, with 34 volatile
compounds. The isolate also contained 12 carbonyl compounds including 9 aldehydes and
3 ketones. The major alcohols and carbonyl compounds identified were 3-methyl-1-
butanol (12.11 µg/kg), 2-methyl-1-butanol (4.89 µg/kg), 3-hexen-1-ol (24.35 µg/kg),
hexanol (14.58 µg/kg), 2-ethyl-1-hexanol (9.32 µg/kg), 3-hydroxy-2-butanone (14.31
µg/kg), 3-methyl butanal (1.18 µg/kg), 2-hexenal (2.09 µg/kg) and 2-octanone (1.59
µg/kg). Most of these volatiles were also present in free form. Apart from these, several
terpenes along with fatty acids and esters were also detected in the bound aroma profile of
RTC drumstick. The major terpenes identified included limonene (0.54 µg/kg), linalool
oxide (1.86 µg/kg), linalool (1.19 µg/kg), α-terpineol (2.44 µg/kg), myrcene (0.85 µg/kg),
limonene dioxide (0.87 µg/kg), myrcenol (0.91 µg/kg) and eugenol (1.58 µg/kg). The
presence of glycosidic precursors of terpenes has been widely reported in literature [191].
However, to the best of our knowledge, no report exists on the nature of glycosidic aroma
precursors of drumstick pods.

180
Interestingly, unlike free aroma volatiles, very few nitrogen containing compounds were
detected in bound aroma profile of drumstick. As the hydrolysis was carried out with
pectinase, glucosinolates might not have been hydrolyzed to release nitriles or
isothiocyanates. However, the myrosinase enzyme present inherently in the vegetable
might have resulted in generation of the few such compounds (2-methyl butane nitrile,
isopropyl isothiocyanate and 1-propen-3-isothiocyanato) during processing.
3.2.4.2.3. Identification of key odorants
Not all volatile compounds are responsible for the characteristic odor of a food product.
Consequently, there is a need to identify those that have a real olfactive impact on
drumstick. GC-O employing a sensory panel was used to determine the typical odor
notes of drumstick as described earlier (section 2.2.2.2.4.1). These odors were then
compared with volatile compounds identified by GC/MS in order to determine key
odorants of drumstick. Volatile aroma isolate was extracted by steam distillation using
simultaneous distillation extraction. The process was repeated several times and the
isolates obtained were pooled, concentrated and injected in GC/MS equipped with
Olfactometry Detection Port (ODP). The aroma volatiles isolated from HS-SPME were
also subjected to Global olfactometric analysis separately. Similar aroma notes were
perceived by the sensory panel in both the extracts. Table 32 represents different aroma
notes perceived by the sensory panel at different retention times. The compounds
responsible for the aroma note perceived was identified using MS at corresponding
retention times.

181
Table 32. ODP analysis of drumstick SDE oil
Rt (min) Aroma perceived KI Compound identified OAV
3.8 – 5.67 Buttery 812 Acetoin 0.03
7.75 Sulphur / rubber ND
8.2 – 8.7 Grassy green 815 hexanal 14.13
9.27 Sulphur / rotten 835 Isopropyl isothiocyanate ND
9.91-10.39 Flowery – green 857 Cis-3-Hexen-1-ol 0.404
10.7-10.9 B-complex / medicinal ND
12.11-12.39 Boiled potato ND
12.71- 13.13 Boiled drumstick/
cooked vegetable
946 Butane-1-isothiocyanato ND
13.45 Roasted peanuts ND
14.02-15.3 Burnt rubber/rubber 974 Isobutyl iso thiocyanate ND
18.23- 18.5 Flowery 1043 Benzene acetaldehyde 0.468
20.6-20.9 Smoky / beany 1093 Nonanal 3.44
22- 22.7 Roasted nuts 1198 Benzene isonitrile
23.5- 24 Boiled beany / boiled
seeds of drumstick
1204 2-Methoxy-3-isobutyl
pyrazine
2.5
24.7- 24.9 Boiled veg / fatty 1209 Decanal 210.5
26.00-26.30 Fresh cut drumstick 1215 Benzothiazole 0.24
27.08 – 27.2 Green drumstick 1261 2- Decenal 20.93
29.42 – 29.7 Fatty green 1291 2,4-decadienal (E,E) 31.42
32 – 32.8 Fruity/ leafy Damascenone ND
ND: Not Detected

182
Various aroma notes such as buttery, sulphury, grassy green, flowery, boiled drumstick,
drumstick seed, fatty/ beany, fresh-cut drumstick, fatty green were perceived by the
panelists. The nine judges constituting the sensory panel agreed that the odor of the
extract was typical drumstick like. A region corresponding to 26.19-29.4 closely
resembled to the odor of fresh-cut drumstick pods. The odor detection frequency
chromatogram of SDE volatile constituents analyzed by GC-O is shown in Figure 33.
Figure 33. Odor detection frequency chromatogram of drumstick SDE volatiles (Refer
table 32 for RI)
The highest detection frequency of 9 was observed for fresh-cut drumstick and green
drumstick aroma. Other odor notes readily perceived by the panel were grassy green,
flowery-green, boiled drumstick, roasted nuts and fatty green having a detection
frequency of 8. Many other odor notes such as sulphury/ rubbery, sulphury-rotten, boiled
potato, flowery, boiled beany, fruity/ leafy were perceived with comparatively lower
detection frequencies (Table 32). The identities of the compounds listed were established
0
1
2
3
4
5
6
7
8
9
10
812 815 835 857 946 974 1043 1093 1198 1204 1209 1215 1261 1291
DF
KI

183
based on their retention indices, odor quality, and mass spectral data with those of
standard compounds as listed in NIST and Wiley aroma compounds libraries. The
compounds identified corresponding to the aroma notes of fresh-cut and green drumstick
were decanal, benzothiazole and 2-decenal. Benzothiazole is reported to occur in various
fruits and vegetables such as potato [196], asparagus, mango and cocoa. It is reported to
possess sulfurous, vegetative, cooked, brown, nutty and coffee-like aroma. Alkanals and
alkenals are reported to contribute green-fatty/oily odors and are reported to be present in
several vegetables [135]. Unlike decanal and 2-decenal which possessed high odor
activity values, the OAV of benzothiazole was quite low, however, it was readily
perceived by the sensory panel.
To further ascertain the contribution of these compounds towards the characteristic aroma
of the vegetable, SDE oil of drumstick was loaded on a preparative TLC with hexane:
ether (80:20) as the developing solvent system. The TLC plate so developed was dried
under a slow stream of nitrogen until free of solvent and then subjected to sensory
analysis. The sensory panel sniffed the aromagram to locate the band corresponding to
drumstick aroma. Fresh-cut drumstick odor was perceived by most of the panel members
at a Rf value of 0.47. TLC plate when developed in iodine vapors resolved in six distinct
bands (Figure 34). However, the band corresponding to the characteristic drumstick
aroma could not be stained with iodine. Each band was separately scrapped and eluted
with double distilled diethyl ether. The ether was filtered and concentrated by a slow
stream of nitrogen. The concentrate so obtained was injected in GC/MS equipped with
ODP for characterization of the odor. The aroma notes were then perceived by the
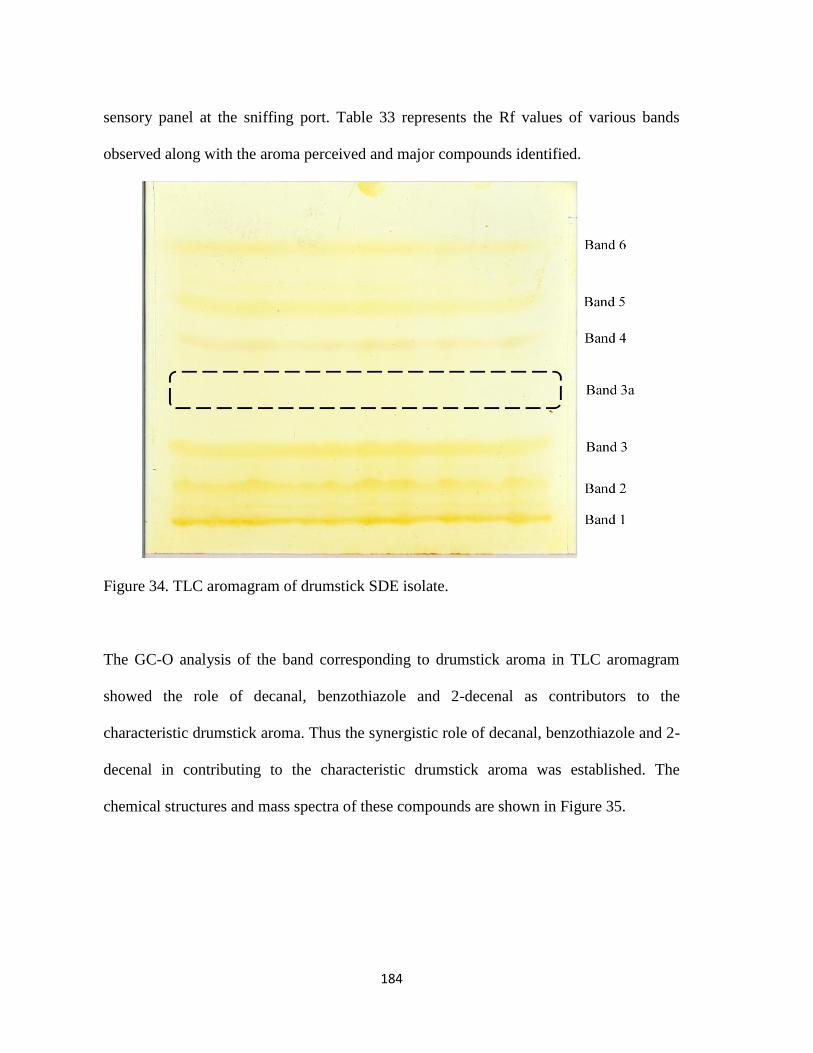
184
sensory panel at the sniffing port. Table 33 represents the Rf values of various bands
observed along with the aroma perceived and major compounds identified.
Figure 34. TLC aromagram of drumstick SDE isolate.
The GC-O analysis of the band corresponding to drumstick aroma in TLC aromagram
showed the role of decanal, benzothiazole and 2-decenal as contributors to the
characteristic drumstick aroma. Thus the synergistic role of decanal, benzothiazole and 2-
decenal in contributing to the characteristic drumstick aroma was established. The
chemical structures and mass spectra of these compounds are shown in Figure 35.

185
Table 33. Bands isolated from TLC aromagram of drumstick oil with their odor and
major compounds identified.
Band Retention Factor
(Aroma perceived)
Major Compounds identified
Band 1
(bottom)
0 (seedy aroma) Diacetyl sulphide, S-(+)-1,2-
Propanediol, acetic anhydride,
palmitic acid
Band 2 0.125 ( fruity odor) 3-Hexen-1-ol, 1-Hexanol, Trans
linalool oxide, alpha-Terpineol
Band 3 0.26 ( Fruity / flowery) Linalool, alpha- terpinolene
Band 3a (region
between band 3
and 4; not visible
in iodine)
0.47 (fresh cut
drumstick aroma)
Decanal, Benzothiazole, 2- decenal,
Band 4 0.59 (Mild drumstick
note + sweet smell)
L-Linalool, nonanal, decanal, E-2-
Tetradecen-1-ol, Sulfurous acid, hexyl
octyl ester, Cis-9-Octadecen-1-ol
Band 5 0.72 ( no odor) Sulfurous acid, 2-ethylhexyl hexyl
ester
Band 6 (top) 0.91 (sulphurous smell) No compounds could be detected

186
Figure 35. Chemical structures and mass spectra of most potent odorants of drumstick
3.2.4.3. Pumpkin
3.2.4.3.1. Free aroma analysis
The GC/MS chromatograms of free aroma of pumpkin as obtained by SDE and SPME are
presented in Figure 36. Table 34 provides a quantitative distribution of the constituents
identified in the isolates obtained from both the techniques.
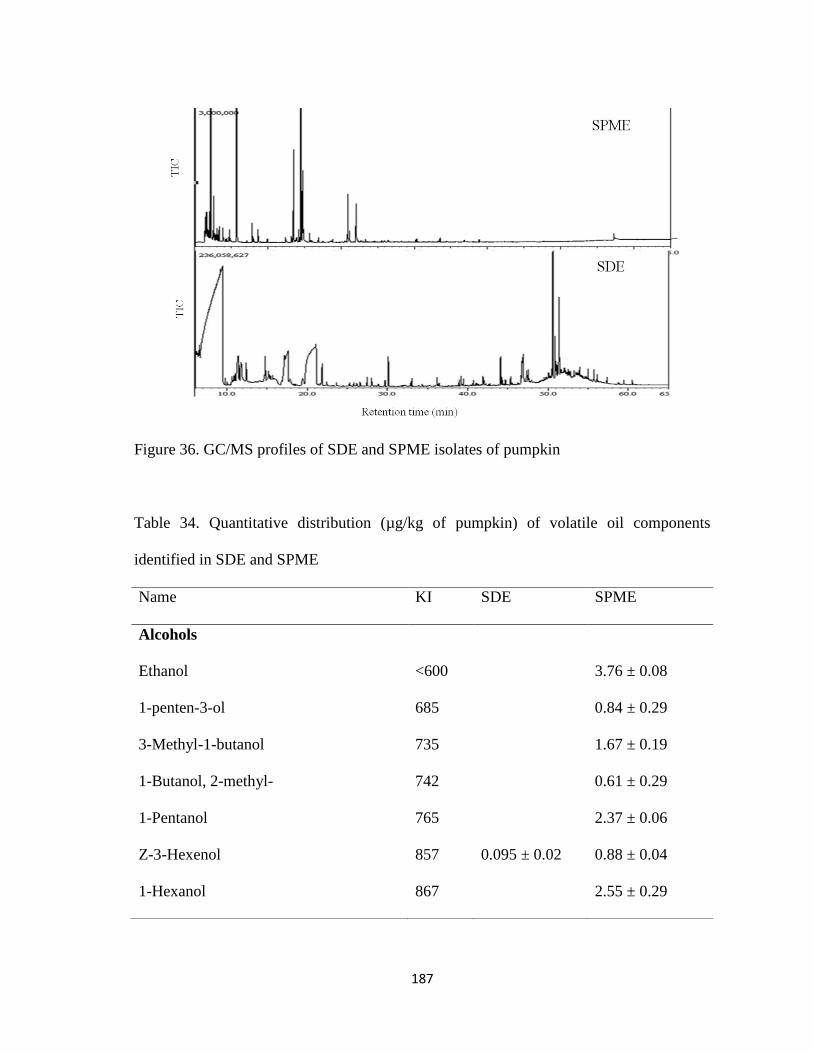
187
Figure 36. GC/MS profiles of SDE and SPME isolates of pumpkin
Table 34. Quantitative distribution (µg/kg of pumpkin) of volatile oil components
identified in SDE and SPME
Name KI SDE SPME
Alcohols
Ethanol <600 3.76 ± 0.08
1-penten-3-ol 685 0.84 ± 0.29
3-Methyl-1-butanol 735 1.67 ± 0.19
1-Butanol, 2-methyl- 742 0.61 ± 0.29
1-Pentanol 765 2.37 ± 0.06
Z-3-Hexenol 857 0.095 ± 0.02 0.88 ± 0.04
1-Hexanol 867 2.55 ± 0.29

188
(5Z)-Octa-1,5-dien-3-ol 983 1.34 ± 0.01
1-Octen-3-ol 985 19.29 ± 1.39
2 ethyl hexanol 1021 2.12 ± 0.03
benzyl alcohol 1035 0.53 ± 0.04
3-Octanol 1065 3.24 ± 0.25
2E,6Z-nonadien-1-ol 1159 1.23 ± 0.09 9.45 ± 1.65
2-Butyl-1-octanol 1250 0.19 ± 0.04
Dodecanol 1473 0.014 ± 0.05
1-Hexadecanol 1855 0.22 ± 0.12
Aldehydes and ketones
Acetaldehyde <600 1.75 ± 0.34
2-Butenal 625 1.01 ± 0.39
3-Methylbutanal 640 3.52 ± 0.12
1-Penten-3-one 680 0.69 ± 0.37
Pentanal 697 2.49 ± 0.49
(E)-3-Penten-2-one 725 0.15 ± 0.02
trans-2-Pentenal 745 0.59 ± 0.04
2-Methyl-3-pentanone 750 0.54 ± 0.01
Butanal, 2-ethyl-3-methyl- 781 0.36 ± 0.09
4-Methyl-3-penten-2-one 795 2.15 ± 0.77
Hexanal 815 44.84 ± 5.62
2E-Hexenal 854 3.46 ± 0.76

189
Heptanal 899 0.71 ± 0.07
2,4-hexadienal 905 0.92 ± 0.14
(Z)-2-Heptenal 955 0.86 ± 0.02
Benzaldehyde 961 0.52 ± 0.13
3-octanone 981 0.41 ± 0.28
6-methyl-5-hepten-2-one 985 0.05 ± 0.01
2-Octanone 988 0.63 ± 0.24
2E,4E-heptadienal 995 1.78 ± 0.26
Acetophenone 1059 3.28 ± 0.58
(E)-2-Octenal 1060 1.26 ± 0.12
(Z)-6-Nonenal 1097 0.92 ± 0.14 2.48 ± 0.07
2E,4Z nonadienal 1154 0.68 ± 0.14
2E, 4E-nona-dienal 1213 0.106 ± 0.02 0.71 ± 0.01
Nonanal 1093 0.83 ± 0.03
Octadecanal 1357 0.13 ± 0.08
Dodecanal 1407 0.22 ± 0.01
Terpenes
Cis-limonene oxide 1085 0.09 ± 0.01
Linalool 1098 0.01 ± 0.004 0.2 ± 0.05
thujone 1117 0.36 ± 0.09
3-Caren-10-al 1125 0.009 ± 0.002
α-terpineol 1185 0.26 ± 0.04

190
Data are expressed as mean ± standard deviation (n = 3).
Twenty one volatile aroma compounds were detected in the SDE isolate of pumpkin. It
consisted of alcohols (4), carbonyl compounds (3), terpenes (5) and nine other
compounds including nitrogen and sulphur containing compounds and fatty acids along
with their ester derivatives. The major aglycones present in the SDE isolate were Z-3-
Geranial 1197 0.39 ± 0.08
Trans-geraniol 1255 0.006 ± 0.001
β-ionone 1455 0.007 ± 0.002
Nerolidol 1550 0.019 ± 0.005
Others
n-Butyl acetate 815 0.07 ± 0.01
2-Methyl pyridine 817 0.05 ± 0.01
Dimethyl sulfoxide 825 1.10 ± 0.05
1-Butanol, 3-methyl-, acetate 875 0.16 ± 0.05
Dimethyl sulfone 920 3.84 ± 0.92
Methyl decanoate 1325 0.009 ± 0.001
Decanoic acid 1372 0.014 ± 0.01
Tetradecanoic acid 1768 0.078 ± 0.01
Hexadecanoic acid 1975 2.17 ± 0.16
9Z-Octadecenoic acid (oleic) 1949 1.025 ± 0.03
Octadecanoic acid 2075 0.578 ± 0.05

191
hexenol (0.095 µg/kg), dodecanol (0.014 µg/kg), 2E, 6Z-nonadien-1-ol (1.23 µg/kg),
hexadecanol (0.22 µg/kg), acetophenone (3.28 µg/kg), 6Z-nonenal (0.92 µg/kg), 2E, 4E-
nonadienal (0.106 µg/kg), dimethyl sulfone (3.84 µg/kg), hexadecanoic acid (2.17 µg/kg)
and 9Z-octadecenoic acid (1.025 µg/kg). Terpenes were detected in trace amounts in the
SDE oil.
SPME isolate on the other hand, was characterized by the presence of 48 volatile
compounds. It included 14 alcohols, 27 carbonyl compounds (20 aldehydes and 7
ketones), 5 terpenes and 2 esters. Aldehydes were the most abundant aroma compounds
in the SPME isolate. Hexanal (44.84 µg/kg) accounted for the highest content followed
by 3-methyl butanal (3.52 µg/kg), 2E-hexenal (3.46 µg/kg) and 6Z-nonenal (2.48 µg/kg).
Hexanal is known to contribute green notes in vegetables. The unsaturated C6 aldehydes
and particularly hexanal, has been postulated to be derived via lipid peroxidation during
processing and sampling [188]. Many of these aldehydes have a low human detection
threshold and are important for the flavour of tomato, cucumber, peppers and other
vegetables [197-199]. Among alcohols, major volatile compounds identified were 2-
methyl-1-propanol (1.52 µg/kg), 3-methyl-1-butanol (1.67 µg/kg), pentanol (2.37 µg/kg),
hexanol (2.55 µg/kg), 1-octen-3-ol (19.29 µg/kg), 2-ethyl hexanol (2.12 µg/kg), 3-octanol
(3.24 µg/kg) and 2E, 6Z-nonadien-1-ol (9.45 µg/kg).
Low boiling alcohols and aldehydes such as 1-penten-3-ol, 3-methyl butanol, pentanol, 3-
methyl butanal, 2-butenal, 1-penten-3-one, pentanal, and hexanal, which were present as
major aroma compounds in SPME isolate, could not be detected in isolate from SDE.
This could be due to the masking of the initial region of chromatogram obtained from

192
SDE isolate by the solvent employed. Further, the evaporation step during concentration
of the SDE isolate by nitrogen might have resulted in the loss of these highly volatile
aroma compounds. The SDE oil was also characterized by the presence of 2-methyl
pyridine, dimethyl sulfone and dimethyl sulfoxide, which were however, not detected in
the SPME isolate. Such compounds could have been derived from sugars and amino acids
via various chemical reactions such as Maillard reaction during SDE as a result of heat
treatment [200]. SPME gave significantly better qualitative and quantitative aroma profile
compared to that obtained from SDE and had a higher content of alcohols and carbonyls.
Higher extraction efficiency of SPME than SDE has been reported in previous studies by
various researchers [181].
The volatiles of fresh, cooked and canned pumpkin were studied earlier by Parliment et
al. [184]. Combined steam distillation/solvent extraction was employed for extracting the
volatiles of cooked and canned pumpkin while for fresh pumpkin, headspace
concentration was used by these workers. The individual aroma compounds were
identified by GC/MS. A total of 30 compounds were identified in the volatile extracts of
freshly cooked and canned pumpkins and one additional compound from the raw
vegetable. The major classes of compounds identified were aliphatic alcohol and carbonyl
compounds (15), furan derivatives (5), and sulphur containing compounds (3). The major
compounds reported to be present in the volatiles from the freshly cooked vegetable were
hexanol, (Z)-3-hexenol, 2-hexenal, hexanal, and 2,3-butanedione (diacetyl). However,
virtually all of the C6 aldehydes and alcohols were lost in the canned product with the
major components being 2-methyl butanal, pyridine, furfural, 2,3-butanedione, and 3-

193
methyl butanal [184]. Other interesting compounds identified in the freshly cooked
material were 3-(methylthio)propanal and a methylformylthiophene, and in the canned
product 2-methyltetrahydrofuran-3-one, 2,5-dimethylpyrazine, and dimethyltrisulfide. 2-
sec-butyl-3-methoxy pyrazine were shown to be present in trace concentrations (<2.5
ng/L juice) in raw pumpkin [184]. In the freshly cooked vegetable, hexanal (4.5 ng/L),
(E)-2-hexenal (17 µg/L), (Z)-3-hexenol (70 µg/L), and 2,3-butanedione (7 µg/L) probably
play important roles in its flavor. However, in the canned material, 2-methylbutanal (1.3
µg/L), 3-methyl butanal (2 µg/L), and dimethyl trisulfide (10 ng/L) were reported to be
the more important components. Apart from few C5-C6 aldehydes and alcohols, the
aroma profile obtained in the present study was found to be different from that earlier
reported. This difference might be due to different variety or geographical origin of the
vegetables studied.
3.2.4.3.2. Bound aroma analysis
No report exists on the nature of bound aroma glycosides of pumpkin till date. The
representative GC/MS chromatograms of the free aglycones obtained from their
precursors are shown in Figure 37. The quantitative distribution of these aglycones in the
two isolates is presented in Table 35.

194
Figure 37. GC/MS profile of hydrolyzed aroma glycosides of pumpkin obtained from
XAD and SPE isolates.
Table 35. Quantitative distribution (µg/kg of pumpkin) of volatile oil components
identified in XAD and SPE isolates.
Name KI XAD SPE
Alcohols
1-Penten-3-ol 685 0.76 ± 0.04
3-Methyl-1-butanol 735 9.67 ± 1.66
1-Butanol, 2-methyl- 742 5.52 ± 1.02
1-Pentanol 765 1.85 ± 0.65
2-Buten-1-ol, 3-methyl- 772 0.09 ± 0.03
Z-3-Hexenol 857 0.23 ± 0.04 1.08 ± 0.31

195
(E)-2-Hexen-1-ol 853 1.08 ± 0.38
1-Hexanol 867 0.131 ± 0.03 13.49 ± 2.18
Heptanol 965 0.34 ± 0.07
1 Octen-3-ol 985 0.195 ± 0.06 7.03 ± 1.31
Phenol 940 0.184 ± 0.05
3-Octanol 1065 0.558 ± 0.08 1.59 ± 0.48
2-Ethylhexanol 1021 0.519 ± 0.12 1.56 ± 0.23
Benzyl alcohol 1035 2.125 ± 0.28 1.02 ± 0.28
2-Octen-1-ol, (Z)- 1060 0.07 ± 0.01
1-Octanol 1065 0.37 ± 0.06
Phenylethyl Alcohol 1120 0.971 ± 0.04 0.64 ± 0.18
trans,cis-2,6-Nonadien-1-ol 1159 0.084 ± 0.01 0.66 ± 0.15
2,6-Dimethyl-octa-2,6-dien-1-ol 1235 0.193 ± 0.03
2-Methoxy-4-vinylphenol 1312 1.26 ± 0.14
Tetradecanol 1654 0.98 ± 0.19
Hexadecanol 1855 2.17 ± 0.33
Aldehydes and ketones
3-Methylbutanal 640 1.33 ± 0.27
1-Penten-3-one 680 0.22 ± 0.16
Hexanal 815 1.44 ± 0.31 1.61 ± 0.53
2-Hexenal 854 0.2 ± 0.08
2-Heptanone 870 0.13 ± 0.01
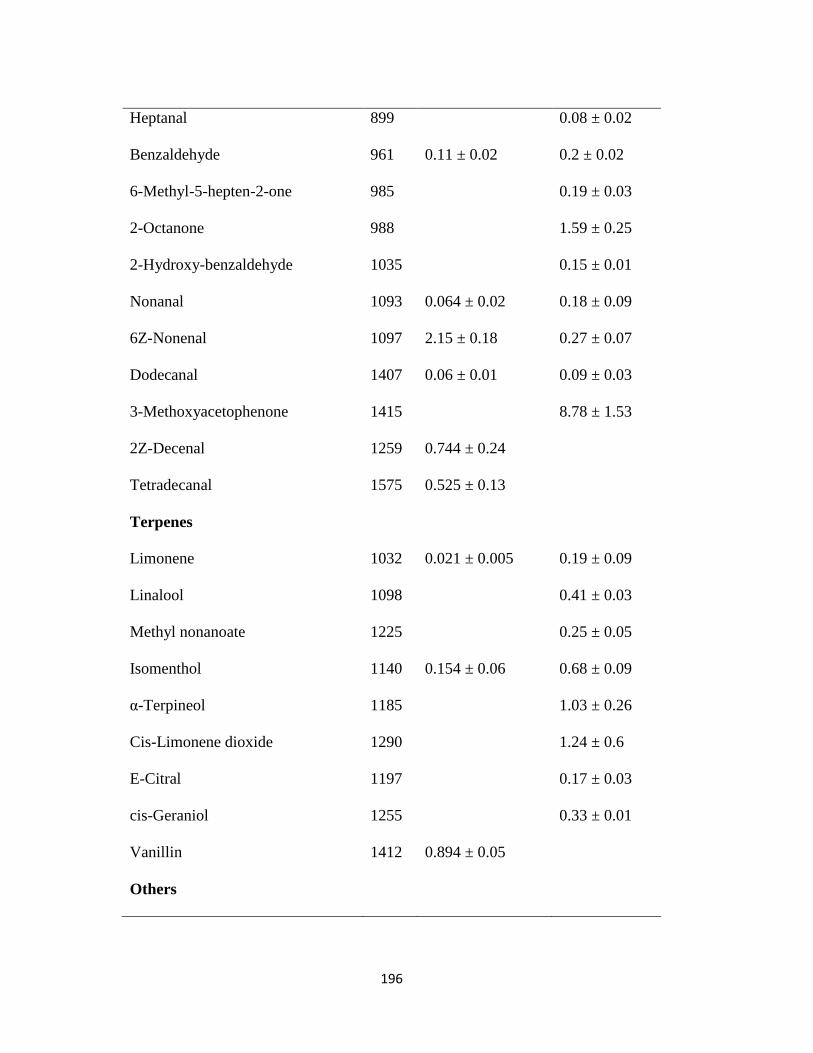
196
Heptanal 899 0.08 ± 0.02
Benzaldehyde 961 0.11 ± 0.02 0.2 ± 0.02
6-Methyl-5-hepten-2-one 985 0.19 ± 0.03
2-Octanone 988 1.59 ± 0.25
2-Hydroxy-benzaldehyde 1035 0.15 ± 0.01
Nonanal 1093 0.064 ± 0.02 0.18 ± 0.09
6Z-Nonenal 1097 2.15 ± 0.18 0.27 ± 0.07
Dodecanal 1407 0.06 ± 0.01 0.09 ± 0.03
3-Methoxyacetophenone 1415 8.78 ± 1.53
2Z-Decenal 1259 0.744 ± 0.24
Tetradecanal 1575 0.525 ± 0.13
Terpenes
Limonene 1032 0.021 ± 0.005 0.19 ± 0.09
Linalool 1098 0.41 ± 0.03
Methyl nonanoate 1225 0.25 ± 0.05
Isomenthol 1140 0.154 ± 0.06 0.68 ± 0.09
α-Terpineol 1185 1.03 ± 0.26
Cis-Limonene dioxide 1290 1.24 ± 0.6
E-Citral 1197 0.17 ± 0.03
cis-Geraniol 1255 0.33 ± 0.01
Vanillin 1412 0.894 ± 0.05
Others

197
Ethyl propionate 703 0.34 ± 0.04
Butyl acetate 815 0.095 ± 0.03
3-Methyl-1-butanol acetate 875 0.133 ± 0.02
Octanoic acid 1165 0.607 ± 0.09
2,3-Dihydro benzofuran 1225 0.844 ± 0.06
Nonanoic acid 1278 1.46 ± 0.15
Decanoic acid 1278 1.10 ± 0.13 0.32 ± 0.04
Menthyl acetate 1304 0.41 ± 0.24
Dodecanoic acid, methyl ester 1325 0.06 ± 0.001 0.54 ± 0.2
Dodecanoic acid 1565 13.96 ± 2.05
2-Octyl furan 1275 2.15 ± 0.24
Tetradecanoic acid, methyl ester 1695 0.15 ± 0.002 0.37 ± 0.05
Hexadecanoic acid, methyl ester 1935 3.04 ± 0.12
Eicosanoic acid, methyl ester 2105 0.28 ± 0.03
Octadecanoic acid 2075 3.89 ± 0.24
9Z-Octadecenoic acid 1949 8.37 ± 1.25
Data are expressed as mean ± standard deviation (n = 3).
A total of 36 compounds were detected in the XAD extract of pumpkin. The major
chemical classes were alcohols (13), carbonyl compounds (7), terpenes (3), fatty acids
and esters (11). Two furan derivatives 2,3-dihydro benzofuran and 2-octyl furan were also
detected in the XAD extract. Although furan derivatives were reported earlier in
pumpkin by Parliment et al. they were not detected in the free form in the present study

198
[184]. This might be due to low concentration of these compounds which is beyond the
detectable limit of GC/MS. The major compounds identified could be classified as
alcohols: benzyl alcohol (2.12 µg/kg), phenyl ethyl alcohol (0.97 µg/kg), 2-methoxy-4-
vinyl phenol (1.26 µg/kg), tetradecanol (0.98 µg/kg), hexadecanol (2.17 µg/kg);
aldehydes: hexanal (1.44 µg/kg), 6Z-nonenal (2.15 µg/kg); fatty acids and esters:
nonanoic acid (1.46 µg/kg), decanoic acid (1.10 µg/kg), dodecanoic acid (13.96 µg/kg),
methyl ester of hexadecanoic acid (3.04 µg/kg), octadecanoic acid (3.89 µg/kg), 9Z-
octadecenoic acid (8.37 µg/kg); and 2-octyl furan (2.15 µg/kg).
The GC profile of the SPE isolate on the other hand, was characterized by the presence of
45 compounds with 17 alcohols, 14 carbonyl compounds, 8 terpenes and 6 fatty acids or
esters. Among alcohols, the major components were 2-methyl-1-propanol (8.55 µg/kg),
3-methyl-1-butanol (9.67 µg/kg), hexanol (13.49 µg/kg), 1-octen-3-ol (7.03 µg/kg), 3-
octanol (1.59 µg/kg) and 2-ethyl hexanol (1.56 µg/kg); while among carbonyl
compounds, 2-methyl butanal (1.33 µg/kg), hexanal (1.61 µg/kg), 2-octanone (1.59
µg/kg) and 3-methoxy acetophenone (8.78 µg/kg) were identified as the major
compounds. Major terpenes include α-terpineol (1.03 µg/kg) and cis-limonene dioxide
(1.24 µg/kg) with others present in comparatively lower amounts. Very few fatty acids
and esters were detected in the SPE isolate in comparison to that in the XAD extract.
Most of the alcohols identified in the glycosidic fraction were also detected in the free
aroma profile of the vegetable. Interestingly, many of the C5-C6 alcohols, carbonyl
compounds and terpenes, which were the major components in the SPE isolate were not
present in XAD isolate. Isolate from XAD was dominated by high boiling alcohols such

199
as tetradecanol, hexadecanol, and fatty acids and esters, which were not present in the
SPE isolate. Owing to their low volatility, these compounds may not play a significant
role in contributing the characteristic aroma.
3.2.4.3.3. Identification of key odorants
Many aroma compounds have been earlier reported in pumpkin. However, no sensory
correlation of the identified compounds with the actual odor of the vegetable was
established. It was therefore of interest to study the key odor compounds contributing
towards the characteristic aroma of the vegetable. GC-O analysis was separately carried
out using both SPME and SDE isolate. The headspace volatiles as extracted using SPME
fibre were desorbed (270 °C) in GC/MS equipped with ODP. The isolates obtained after
repeated simumtaneous distillation extractions were pooled, concentrated and also
subjected to GC-O analysis. Various aroma notes were perceived by a sensory panel of 9
members at the sniffing port. Table 36 represents various aroma notes perceived at
different retention times at the sniffing port along with the identities of the corresponding
compounds, established using MS data and RI values as reported in the literature. Figure
38 shows a plot between detection frequency and RI of the compounds identified
corresponding to the various aroma notes.
Table 36. ODP analysis of pumpkin aroma (SDE)
Rt (min) Aroma perceived Compound
identified
KI OAV
7.12-7.30 Grassy green hexanal 801 10
7.5-8.30 Sweet green ND
10.65-10.82 Fruity-green Heptanal 901 0.24
9.73-10.10 Fruity Hexyl acetate 1007 0.035

200
11.05-11.29 Roasted peanuts/ popcorn Vinyl acetate 1015 ND
16.00-16.2 Husk (rice husk) 2-Ethyl hexanol 1021 7.85E-05
17.34-17.5 Mustard/ sulphury ND
18.00-18.4 Oily green Acetophenone 1059 0.05
21.6-21.76 Cucumber 2E, 6Z- Nonadienol 1159 9450
21.77-22.08 Pumpkin Z-6-Nonenal 1097 124
19.5-19.7 Fatty/oily Octadecanal 1357 ND
Figure 38. Odor detection frequency chromatogram of pumpkin aroma isolate (Refer
Table 36 for KI)
The highest detection frequency of 9 was observed for the odor notes of fresh cucumber
and pumpkin. Other aroma notes readily perceived by the sensory panel were grassy
green, roasted peanuts/popcorn type aroma with a detection frequency of 8. Few other
odors as perceived by the sensory panel with comparatively lower detection frequencies,
included fruity-green, husk, and oily notes. The characteristic pumpkin aroma was
perceived by all the panelists at a retention time 21.77-22.08 min. The corresponding
0
1
2
3
4
5
6
7
8
9
10
801 901 1007 1015 1021 1059 1097 1159 1357
DF
KI

201
compound identified at this Rt was found to be Z-6-nonenal, previously reported as an
important aroma compound of melon. The odor note corresponding to pumpkin aroma
was preceded by cucucmber aroma which was found to be due to the presence of 2E, 6Z-
nonadienol. The aroma of 2E, 6Z- nonadienol has been described as cucumber like while
Z-6-nonenal is known to possess green cucumber and melon like with woody orris type
[201].
Figure 39. Chemical structures and mass spectra for most potent odorants of pumpkin
The unsaturated alcohols and aldehydes such as (E,Z)-2,6-nonadienol and Z-6-nonenal
are formed during oxidation of n-3 polyunsaturated fatty acid [202, 203]. (E,Z)-2,6-
nonadienol has been previously reported in muscadine grape juice with a relatively high
FD factor and in musts obtained from French and Romanian Hybrids of grapes [204,
205]. Higher odor activity values (OAV) of these two compounds (Table 36) further
suggested their significant contribution in the overall aroma of the vegetable. Thus, Z-6-
nonenal and 2E, 6Z- nonadienol could be proposed as the most potent aroma compounds

202
of pumpkin. The chemical structures and mass spectra of these odorants are shown in
Figure 39.
3.2.5. Effect of radiation processing on free and bound aroma profiles of the selected
vegetables
Irradiation is recognized in many countries worldwide as a safe and effective method for
preservation of raw and processed foods. The main benefit of irradiation includes
eliminating microorganisms & insects or parasites capable of causing food spoilage and
toxicity. Fresh-cut vegetables are a growing class of food stuff that has received increased
interest and attention in recent years due to the convenience it provides to the consumer.
One of the most important problems of storage of fresh-cut produce is the maintenance of
taste and aroma that are essential parameters for their quality. Use of gamma irradiation
as a potential preservation technique for improving the shelf life of fresh-cut fruits and
vegetables due to the cold nature of the process holds promise.
Aroma composition plays an important role in the final quality of a food product.
Radiation processing has been reported to result in significant changes in volatile profile
of food products particularly those with high water content such as fresh produce [206].
Information on the impact of irradiation on the volatile composition in fresh produce is
limited. Hydrolysis of aroma precursors and a resultant increase in free aroma volatiles
during radiation processing has been recently reported. Radiation induced hydrolysis of
aroma glycosides has been successfully demonstrated in products such as saffron,
nutmeg, fenugreek and papaya [133, 207, 208, 209]. Reports on the effect of radiation

203
processing on these constituents in Indian vegetables are scanty. To the best of our
knowledge no report exists on the effect of radiation processing on the free and
glycosidically bound aroma constituents of the currently selected vegetables. It was
therefore of interest to study the influence of radiation processing and storage on the
volatile aroma compounds and their precursors in the selected vegetables.
As evident from the GC/MS data obtained for all the three vegetables, SPME and SPE
techniques of extraction for free and bound aroma respectively were found to be better as
higher number of compounds were detected and the profiles were free of interference
from hydrocarbons or fatty acids as was the case with the other techniques employed.
Therefore the aroma profiles obtained by SPME (for free aroma) and SPE (for bound
aroma) for control and radiation processed samples at different storage durations were
further examined. The free and bound aroma compounds of ash gourd, drumstick and
pumpkin are depicted in tables 24-28 and 30-31. Apart from the compounds listed in the
tables, certain minor peaks, which are not identified here, might also undergo changes
during radiation treatment or storage. Therefore, data points at sufficiently small intervals
(every 0.17 min) in each chromatogram were taken into consideration while evaluating
the effect of processing steps. This however resulted in innumerable points which are
difficult to analyze manually. Therefore a data reduction technique, such as principal
component analysis (PCA) was employed, that can reduce the vast data points into a
fewer number. This aided in explaining the inherent variation of original data. It is an
unsupervised technique which is used for dimensionality reduction of multivariate data
sets and allows visualization of complicated data for easy interpretation [210].

204
The GC/MS data obtained for free and bound aroma was therefore separately subjected to
principal component analysis (PCA) for each vegetable. To know the nature of the
constituents responsible for the differences among control and radiation processed
samples at different days, factor loading data obtained from PCA analysis for free as well
as bound aroma was analyzed separately for each vegetable.
3.2.5.1. Ash gourd
Principal component (PC) score plots obtained for free and bound aroma compounds of
ash gourd are represented in Figure 40 and 41, respectively. In case of free aroma, first
two principal components (F1 and F2) cumulatively explained 82.79 % of data variation
while in case of bound aroma, 87.74 % variation was accounted by F1and F2.
Figure 40. PCA of free aroma of ash gourd (C0, C5, C8, C12 – control samples of day 0,
5, 8 and 12; I0, I5, I8, I12 – irradiated (2 kGy) samples of day 0, 5, 8 and 12).

205
Figure 41. PCA of bound aroma of ash gourd (C0, C5, C8, C12 – control samples of day
0, 5, 8 and 12; I0, I5, I8, I12 – irradiated (2 kGy) samples of day 0, 5, 8 and 12).
Analysis of GC spectral data of free aroma by Principal Component Analysis (PCA)
revealed changes in the volatile composition as a result of radiation processing (2 kGy)
and storage. The control samples at day zero were located in upper left quadrant (negative
side of F1 and positive side of F2), while all other samples got segregated from 0 d
control samples, and were grouped together. Careful interpretation of GC/MS data
revealed quantitative changes in the aroma compounds identified which could be
responsible for the segregation in the PC plots.

206
In case of alcohols, an increased content of 3-methyl-butanol, 2-methyl butanol, hexanol
and 2-ethyl hexanol was observed in radiation processed samples on day zero. An
increase of 81, 400, 298 and 66 % was observed in the contents of these alcohols
respectively as a result of radiation treatment (2 kGy). The glycosidic precursors of these
alcohols were also identified in the vegetable. A corresponding decrease in the respective
glyco-conjugates was observed. Thus, the increased content of free alcohols in radiation
processed samples could be the result of radiolytic breakdown of their glycosidic
precursors present in the vegetable. Further, the contents of these alcohols increased
during storage in control as well as radiation processed ash gourd. The increased content
of various alcohols during storage has also been reported earlier in cantaloupe and
watermelon [178]. They correlated increased content of alcohols with senescence of the
product. Aroma notes of 3-methyl-butanol, 2-methyl butanol, hexanol and 2-ethyl
hexanol are reported to be whisky, wine, sweet-green and citrus/ fresh floral respectively.
Aldehydes, known to impart “green” and “grassy” notes decreased as a result of radiation
processing as well as during storage. They are reported to play a relatively important role
in vegetable flavors [145]. A decrease of 45 % in the content of 3-methyl butanal, 66 % in
4-methyl-4-penten-2-one, 57 % in 2-pentanone, 35% in hexanal, 41 % in octanal and 62
% in decanal was observed. The C6-C8 aldehydes are known to be formed via the
lipoxygense pathway from unsaturated fatty acid precursors namely linoleic and linolenic
acids liberated mainly from galactolipids. Decreased content of aldehydes during storage
has also been reported earlier in fresh-cut cantaloupe [178]. Reduction of aldehydes to

207
branched-chain alcohols, and their subsequent conversion to branched-chain acetates was
cited as the probable reason by these workers.
Among esters, no significant effect of radiation processing was observed except for ethyl
acetate. Ethyl acetate is known to possess fruity odor note, and is widely reported in
various fruits and vegetables [191]. Radiation treatment (1 kGy) resulted in 73 % decline
in the content of ethyl acetate on day zero as compared to the non-irradiated fresh control
samples. Decreased production of esters with increasing radiation dose (0.44 – 1.32 kGy)
was also reported earlier in apples stored at 20 °C [211].
A significant decrease in the contents of bound aroma precursors of terpenes was also
observed in irradiated samples during storage, indicating breakdown of their glycosidic
precursors due to radiation processing and during storage. A maximum decrease of 84 %
was observed for glycosidic precursor of sabinene, followed by β-pinene (83 %), indene
(79 %), limonene (41 %), and cymene (49 %) with a minimum decrease of 21 % in the
case of myrcene. Radiation induced breakdown of terpene glycosides has been widely
reported [133, 207-209]. Thus, the decrease in content could be due to radiation induced
hydrolysis of glycosidic precursors of these compounds. However, the degradation or
oxidation of free terpenes during extended storage could be the reason for the
insignificant change observed in their contents in free aroma. Generally terpenes
influence the aroma perception of a plant produce significantly. No major changes in the
terpene compounds during storage and radiation processing indicates that aroma quality
of the vegetable was not altered during the intended storage period (12 d).

208
A decrease in content of aroma glycosides due to radiation processing has been reported
earlier in several food products such as coffee, nutmeg, fenugreek, and papaya [133, 207-
209]. In case of nutmeg, glycosidic precursors of p-cymene-7-ol, eugenol,
methoxyeugenol and α-terpineol were reported [133]. A radiation dose dependent
decrease in content of all glycosides was reported by these authors. In case of fenugreek,
radiation dose dependent decrease in content of phenol glycoside was reported [208]. In
coffee beans a decreased content of glycosidic precursors of isoeugenol and 4-
vinylguaiacol as a result of radiation processing was reported [212]. Thus, our results are
in accordance with already published literature data.
Among the key odorants, the content of acetoin increased in radiation treated ash gourd
on day zero (C- 12.16 µg/kg; I- 20.39 µg/kg). A decrease by 41 % in the content of
octanal was observed, while no significant effect of irradiation was noted in the nonanal
content. Although changes were produced by radiation treatment, none were sufficient to
be observed in a sensory test. Thus the overall sensory acceptability of the developed
product was unaltered with reference to aroma quality.
3.2.5.2. Drumstick
The PC plots for free and bound aroma of drumstick are presented in Figures 42 and 43,
respectively. The first two principal components (F1 and F2) explained 30.99 and 22.59
% variation in the data for free aroma and 55.32 and 15.10 % variation in the data for
bound aroma.

209
Figure 42. PCA of free aroma of drumstick (C0, C5, C8, C12 – control samples of day 0,
5, 8 and 12; I0, I5, I8, I12 – irradiated (1 kGy) samples of day 0, 5, 8 and 12).
PC plot for free aroma of drumstick shows that fresh control samples (C0) were
segregated from all the other samples (Figure 42). However, no clear segregation was
observed between the control and radiation processed samples at different storage days,
indicating no major changes in the free aroma composition of drumstick. In case of
bound aroma, only irradiated samples on day zero were grouped separately, while no
variation was observed among other stored samples (Figure 43).

210
Figure 43. PCA of bound aroma of drumstick (C0, C5, C8, C12 – control samples of day
0, 5, 8 and 12; I0, I5, I8, I12 – irradiated (1 kGy) samples of day 0, 5, 8 and 12)
Careful interpretation of GC/MS data for free aroma compounds revealed some
quantitative differences among the compounds identified. Among the aldehydes, a two
fold increase in the content of hexanal and 58% increase in the content of trans-2-hexenal
were observed as a result of radiation processing. Hexanal is characterized by green,
grassy odor note, while trans-hex-2-enal possesses fresh green and leafy aroma. They are
reported to play a relatively important role in vegetable flavors [145]. Increased content
of these aldehydes due to radiation processing was previously reported in various

211
vegetables. UV irradiation of tomato fruits and leaves was shown to increase the
production of n-hexanal as a result of enhanced lipooxygenase and hydroxyperoxidase
lyase activity [213, 214] also reported an increased trans-hex-2-enal content in soybeans
due to gamma irradiation at a dose above 10 kGy with as high as 5 times increase at 100
kGy. Fan and Sokorai, on the other hand observed an increase in trans-hex-2-enal content
of cilantro during post-harvest storage with no significant effect on the content of this
compound on irradiation [215]. An increase in the content of trans-2-hexenal was also
observed in irradiated cabbage [145]. Thus, increase in trans-2-hexenal might be
attributed to radiation induced lipid radiolysis resulting in release of linolenic acid and the
subsequent conversion of this fatty acid to this compound via lipooxygenase (LOX)
pathway to the aroma compound.
In case of terpenes, α-terpineol exhibited a two fold increase in response to radiation
treatment (1 kGy). α-Terpineol is a degradation product of limonene and linalool and rate
of formation from linalool is faster than from limonene [216]. A corresponding decrease
in content of linalool was also noted after radiation treatment on day zero (control: 2.02
µg/kg; irradiated: 1.13 µg/kg). Although the contents of linalool, limonene and α-
terpineol decreased during storage, the content of α-terpineol was higher in irradiated
samples than the corresponding controls at the end of intended storage period for 12 d
(control: 0.19 µg/kg; irradiated: 0.36 µg/kg).
Various nitrogen and sulphur containing compounds were also detected in the aroma
profile of drumstick. The major compounds were 2-methyl propane nitrile, 2-methyl
butane nitrile, isopropyl isothiocyanate, 2- butyl isothiocyanate, isobutyl isothiocyanate

212
and 2-methyl benzonitrile. Many sulphur and nitrogen containing compounds such as
glucosinolates have been reported earlier in drumstick [113]. These glucosinolates
undergo hydrolysis in the presence of inherently present myrosinase enzyme in the
vegetable during storage or processing, giving rise to nitriles, isonitriles, thiocyanates and
isothiocyanates. An increase of 16 %, 79 % and 78 % in the content of isopropyl
isothiocyanate, 2-butyl isothiocyanate and isobutyl isothiocyanate was observed as a
result of radiation processing on day zero. Processing is often associated with increased
enzymatic activities, which could have resulted in the increased contents of these
components. However, no significant variation in the contents of other compounds was
noted in response to irradiation and storage. Although storage caused a decrease in the
contents of most of the compounds identified, the contents were significantly higher in
radiation processed samples as compared to control samples until the intended storage
period of 12 d.
Despite the changes in the contents of various aroma compounds as a result of radiation
processing and storage, no significant variation was observed in the contents of key
odorants of drumstick. Also, no change in aroma quality was perceived by the sensory
panel in irradiated drumstick samples.
Among bound aroma, appreciably more number of alcohols were identified which were,
however, not detected in the free aroma. It indicates that most of the alcohols are present
in the glycosidic form in drumstick. The major alcohols responsible for the segregation of
irradiated samples of day zero (I0) from others in bound aroma were 3-methyl butanol, 2-
penten-1-ol, 2-hexanol, 3-hexen-1-ol, hexanol, benzyl alcohol, and α-terpineol. The

213
content of these compounds in fresh control samples were 12.11 µg/kg, 1.16 µg/kg, 10.77
µg/kg, 24.35 µg/kg, 14.58 µg/kg, 7.34 µg/kg, and 2.44 µg/kg which increased to 38.86
µg/kg, 2.48 µg/kg, 18.92 µg/kg, 35.09 µg/kg, 94.18 µg/kg, 53.94 µg/kg, and 6.24 µg/kg
respectively in radiation processed samples. This significant increase could be due to
higher extractability of the aroma glycosides in radiation processed drumstick. Such
observations have been reported earlier in various food products [217]. Thus the results
obtained in present study are in agreement with the already published literature.
The contents of free terpenes released from their glycosidic precursors also increased
significantly in response to irradiation. An increase of 82, 300, 90, 82, 33, 131, 68 and 45
% was observed in the contents of citronellol (citrus with green fatty terpene nuances),
limonene (citrus), indene (fresh citrus grapefruit), linalool (sweet floral), α-terpineol (pine
floral), trans geraniol (floral), myrcene (spicy), and limonene dioxide (citrus)
respectively. Greater extractability of the aroma precursors in radiation treated samples
might have resulted in the higher amounts obtained. Terpenes generally have substantial
influence on the aroma of a product. The increased contents of these aglycones in
response to radiation treatment thus suggest improved aroma quality of the product.
3.2.5.3. Pumpkin
Score plots of both the aroma profiles are depicted in Figures 44 and 45, respectively. The
first two principal components (F1 and F2) explained 65.4 and 13.9 % variation in the
data of free aroma, while 96.4 and 3.1 % variation in the bound aroma was explained by
F1 and F2, respectively.

214
Figure 44. PCA of free aroma of pumpkin (C0, C7, C14, C21 – control samples of day 0,
7, 14 and 21; I0, I7, I14, I21 – irradiated (1 kGy) samples of day 0, 7, 14 and 21).
Score plot of free aroma clearly indicates that there are no major changes in aroma profile
due to radiation processing or storage, except for the control samples stored for 21 d,
which segregated from the rest of samples. The contents of certain compounds such as
acetaldehyde (pungent), 2-methyl-1-propanol (musty), 3-methyl-1-butanol (whisky,
malt), 2-methyl butanol (wine, onion), ethanol (sweet) and 3-octanone (musty,
mushroom) were found to be higher in control RTC pumpkin after 21 days of storage as
compared to other samples. Most of these compounds are reported to be produced by
micro-organisms during extended storage due to spoilage [15]. In a study conducted by
[17], by inoculating mixed-lettuce agar with spoilage bacteria and yeast, various volatile
organic compounds such as ethanol, ethyl acetate, 2-methyl-1-propanol, 2-methyl-1-

215
butanol, 3-methyl-1-butanol, 2,3-butanedione, 3-methyl-1-pentanol, 1-butanol and 1-
hexanol were identified in the head space as spoilage markers. Thus the role of these
compounds in contributing to the observed variation in volatile profile of pumpkin
samples could be explained.
Figure 45. PCA of bound aroma of pumpkin (C0, C7, C14, C21 – control samples of day
0, 7, 14 and 21; I0, I7, I14, I21 – irradiated (1 kGy) samples of day 0, 7, 14 and 21)
Among key odorants, the contents of 6Z-nonenal (C- 2.48 µg/kg; I-4.39 µg/kg) and 2E,
6Z-nonadienol (C-0.27 µg/kg; I-0.52 µg/kg) increased in radiation treated samples.
However, their contents were comparable to that of fresh control samples at the end of

216
storage period. Thus sensory panel could not distinguish between the aroma quality of
fresh control and irradiated samples stored for a period of 21 d.
Score plots (Figure 45) for bound aroma indicated that the radiation processed (1 kGy)
samples at zero day were different from rest of the samples. By careful interpretation of
GC/MS data, this variation was found to be mainly due to the decreased contents of
glycosidic precursors of pentanol (C-18.5 µg/kg; I-10.5 µg/kg), Z-3-hexenol (C-7.08
µg/kg; I- 3.63 µg/kg) and hexanol (C-23.49 µg/kg; I-12.06 µg/kg) on day zero. A
corresponding increase in the aglycone content was observed in free aroma profile. This
could be attributed to radiation induced hydrolysis of aroma glycosides, resulting in
increased aglycone content and decreased content of corresponding glycosides. Radiation
induced hydrolysis of glycosides has been widely reported in food products resulting in
enhanced aroma quality [218]. Thus an overall enhanced aroma quality was observed in
radiation processed RTC pumpkin.
3.2.6. Gamma irradiation induced browning inhibition
Studies so far have demonstrated the feasibility of using gamma irradiation for extending
shelf life of RTC ash gourd. Irradiated RTC ash gourd had a superior visual appeal
compared to the control samples as a consequence of surface browning inhibition (Figure
18). Development of browning in the control samples was also evident with a
significantly (p < 0.05) lower ‘L’ value (Figure 15 (a)). Among the physiological factors
limiting post harvest storage of fresh plant produce, enzymatic browning plays a major
role in reducing sensory quality and nutritional value of these products. Gamma

217
irradiation induced browning inhibition in cut vegetables has been previously reported by
some workers but reports on the mechanism of its inhibition in cut vegetables are scanty.
Browning in cut fruits and vegetables mainly involves metabolism of phenolic
compounds into their oxidized products [219]. In intact plants, phenolic compounds in
cell vacuoles are spatially apart from the oxidizing enzymes present in the cytoplasm.
Once tissues are damaged by cutting, grinding or pulping, the rapid mixing of the
enzymes and phenolic compounds as well as the easy oxygen diffusion to the inner
tissues results in a browning reaction. In response to tissue injury, phenylalanine
ammonia lyase (PAL) produces phenols which are then oxidized by polyphenol oxidase
(PPO) and peroxidase (POD) to o-quinones that further polymerize to brown pigments.
3.2.6.1. Evaluation of parameters responsible for browning
Control and radiation treated ash gourd samples were processed as detailed in section
2.2.1. Various parameters responsible for enzymatic browning such as electrolytic
leaching, changes in micro-structure, enzyme activities (PPO, PAL and POD), phenolic
composition and o-quinones were monitored at different storage intervals.
3.2.6.1.1. Electrolytic leaching
Electrolytic leaching signifies the electrolytes leaching out on the surface of cut
vegetables due to wounding while processing. The tissues also undergo softening due to
hydrolysis of cell wall components (pectin, cellulose and hemicelluloses) during stress
(including radiation treatment) and extended storage resulting in increased electrolytic

218
leaching. The extent of leaching was measured in terms of conductivity and
spectrophotometric absorbances at various wavelengths.
Figure 46. Effect of radiation treatment (2 kGy) and storage on (A) Conductivity (B)
Absrbance at 250, 280 and 320 nm (C) Browning index (absorbance at 420 nm) of RTC
ash gourd
a) Conductivity: The variation in conductivity of the vegetable extracts with radiation
processing during storage is shown in Figure 46 A. A significant increase in values of
conductivity was observed in radiation-treated samples on day zero. During storage, the
conductivity of control samples increased substantially, while it was unchanged in

219
irradiated samples. This infers increased content of electrolytes leaching out on the
surface of control RTC ash gourd.
b) Absorbance: The absorbance measured at different wavelengths (250, 280 and 320
nm) in control and irradiated samples during storage are shown in Figure 46 B. A
significantly higher values of absorbance were obtained in control samples as compared
to irradiated during storage. It indicates greater extent of compounds leaching out of the
matrix. On the other hand, no change in the absorbance of irradiated samples during
storage indicates better integrity of the tissue structure during extended storage. The
browning index (absorbance at 420 nm) also increased significantly in control samples on
day 8 and beyond (Figure 46 C). The aborbance at 280 nm can be taken as a measure of
the phenolic constituents leaching out on the surface. Thus, increased absorbances at 280
and 420 nm indicate more leaching out of the phenolics on the surface of the vegetable,
which undergo aerial oxidation in the presence of PPO or POD enzymes, and
subsequently form brown pigments at the surface of the control samples. Increase in
browning intensity has also been reported earlier in minimally processed lettuce during
storage of 5 d [220]. Significantly lower leaching of electrolytes in case of irradiated ash
gourd could have resulted in better retention of the visual quality during the intended
storage period (12 d).
3.6.1.2. Changes in microstructure
Scanning electron microscopic (SEM) studies demonstrate significant variation in the
microstructure of control and radiation treated (2 kGy) samples at the end of storage
period (12 d) (Figure 47 A-C). In control samples, after a storage period of 12 d, the

220
surface microstructure was clearly changed, as indicated by collapsed and damaged
tissues ((Figure 47 C). On the other hand, the tissues of radiation processed samples were
observed to be undamaged (Figure 47 B). Thus SEM studies further support the findings
as observed by electrolytic leaching experiments.
Figure 47. Scanning electron micrographs of RTC ash gourd (A) Non-irradiated control 0
d, (B) Radiation treated (2 kGy, 12 d) and c) Non-irradiated control 12 d. Figures are with
500 x magnification.
3.2.6.1.3. Evaluation of enzyme activities
Alteration in phenolic metabolism is generally known to affect browning in cut
vegetables. PAL is the first enzyme in the phenylpropanoid pathway involved in synthesis

221
of phenolic compounds. Apart from PAL, PPO & POD are the other key enzymes
involved in browning development of fresh-cut produce. Figure 48 represents the
variation in activities of PAL and PPO with radiation processing and storage. No
significant change in the PAL activity was observed as a result of radiation processing on
day zero (Figure 48 A). During storage, the PAL activity increased continuously in
control samples. Several studies on cut lettuce have shown a wound induced
enhancement in PAL activity. Degl Innoceti [138], for instance, noted a significant
increase in PAL activity within 5 h, whereas Hisaminato et al [221] found maximum
increase after 3 days of storage. Murata et al [27] also found a significant increase in the
activity of this enzyme in lettuce after 3 days of storage that further increased on storage
up to day 6. Thus, the effect of wounding on PAL activity was found to vary with the
variety of lettuce. Stress induced enhancement in PAL activity has been extensively
reported in different plant tissues. Various stresses such as nutrient deficiencies, viral,
fungi, and insect attack are known to increase either PAL synthesis or activity in different
plants [219]. Wound induced enhancement in PAL activity has also been previously
reported in minimally processed potatoes [222] and cabbage [145]. In the present case,
microbial and physiological spoilage of ash gourd during storage might have induced a
stress which resulted in an increase in PAL activity. On the other hand, in radiation
processed samples, PAL activity remained unchanged during storage. Induction of PAL is
a defence mechanism of the living plant tissues from external stress. Therefore during
storage, as the radiation processed samples were protected from spoilage, the metabolic
activity of PAL enzyme remained subsided. Higher phenolic biosynthesis as reflected by

222
increased absorbance at 280 and 320 nm in the control samples also support the pattern of
PAL activity observed.
PPO: PPO is a downstream enzyme in the phenylpropanoid pathway acting on phenols to
form o-quinone. Radiation induced decrease in PPO activity was observed immediately
after treatment (Figure 48 B). Although a gradual increase in the activity was observed
during storage in both the samples, the activity of the radiation treated samples was
significantly lower (p < 0.05) than corresponding control samples throughout the intended
storage period (12 d). Similar observations have been reported earlier in edible mushroom
(Pleurotus nebrodensis), where a significant (p < 0.05) radiation induced decrease in PPO
activity was observed at a dose of 1.2 kGy [223]. They also observed an increase in the
PPO activity in control as well as radiation processed samples during storage, although
the activity in controls was higher than the irradiated samples. Duan et al. also reported
lowering in PPO activity due to a probable change in the conformation of active sites on
exposure to radiation and a consequent inhibition of browning in Agaricus bisporus
[224]. The results obtained in the present study are thus in accordance with the existing
reports.
POD: POD is another enzyme ubiquitously present in plants, that in the presence of
hydrogen peroxide converts a number of phenolics to form o-quinone. However, its role
in enzymatic browning remains questionable mainly because of the low H2O2 content in
vegetable tissues [219]. Free radicals including H2O2 are generated due to water
radiolysis on irradiation. Thus analysis of POD activity is of significance in the present
study. POD activity was assayed in the presence of natural hydrogen donors (chlorogenic

223
and caffeic acid). POD activities did not vary substantially during storage for both the
substrates (Table 37), thus ruling out its role in browning in RTC ash gourd.
Figure 48. Effect of radiation processing (2 kGy) and storage on (A) PAL activity and (B)
PPO activity
Table 37. Effect of radiation processing (2 kGy) and storage on POD activity of ash gourd
Day Control Irradiated (2 kGy)
POD1 POD2 POD1 POD2
0 7.25 ± 1.25a 5.65 ± 1.05
b 5.55 ± 0.55
a 4.85 ± 1.05
b
5 7.00 ± 0.95a 5.3 ± 1.25
b 6.25 ± 0.90
a 4.9 ± 0.99
b
8 6.05 ± 0.80a 4.95 ± 0.95
b 5.75 ± 1.10
a 5.2 ± 0.75
b
12 5.75 ± 0.70a 4.35 ± 0.55
b 5.1 ± 0.85
a 5.05 ± 0.55
b
Data are expressed as mean ± standard deviation (n = 9). Mean values in the same column
bearing same superscript shows no significant difference (p ≤ 0.05). POD activity is
represented in Δ A min-1
g-1
FW; POD1 = chlorogenic acid peroxidase activity and POD2
= caffeic acid peroxidase activity.
224
3.2.6.1.4. Analysis of phenolic constituents
Phenolic compounds are the primary substrate for the enzymes involved in browning, and
also their nature and content plays crucial role in browning development of fresh-cut
produce. The nature of phenolic constituents and their quantitative distribution during
radiation processing and storage was therefore analyzed in RTC ash gourd. The major
phenolic constituents identified in ash gourd included phenolic acids (α-resorcylic, p-
hydroxy benzoic, chlorogenic, syringic, p-coumaric acid) along with catechin and
naringenin (Table 38). As development of browning started on day 8, phenolic contents
were compared only from day 8 onwards. The contents of p-hydroxy benzoic,
chlorogenic, caffeic, and p-coumaric acid were significantly higher (p < 0.05) in control
samples as compared to the corresponding irradiated products on day 8 and 12 (Table 38).
The increased content can be attributed to higher PAL activity as observed in control
samples during storage (Figure 48 A). These acids are highly prone to oxidation and give
rise to brown/black polymers during aerial oxidation in the presence of PPO or POD.
Thus, their higher content in the control samples could explain the browning of these
samples towards the end of the intended storage period.
No significant effect of radiation processing was observed on the contents of most of the
phenolic constituents in ash gourd, except chlorogenic and caffeic acid, which exhibited
significant decrease (p ≤ 0.05) (Table 38). Interestingly, a radiation induced enhancement
by 87 % in the content of α-resorcylic acid was observed on day zero. An enhanced
synthesis of phenolic acids such as benzoic and cinnamic acids as a result of increased
PAL activity under stress in plants has been established earlier [225]. The content of
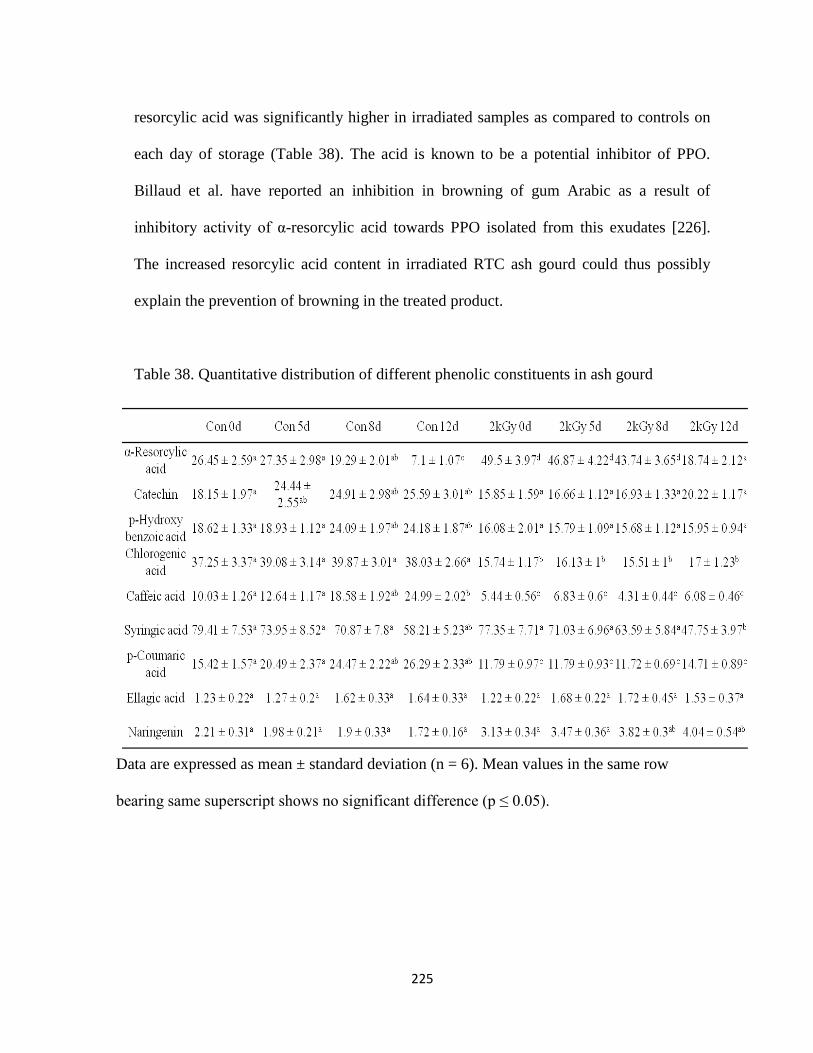
225
resorcylic acid was significantly higher in irradiated samples as compared to controls on
each day of storage (Table 38). The acid is known to be a potential inhibitor of PPO.
Billaud et al. have reported an inhibition in browning of gum Arabic as a result of
inhibitory activity of α-resorcylic acid towards PPO isolated from this exudates [226].
The increased resorcylic acid content in irradiated RTC ash gourd could thus possibly
explain the prevention of browning in the treated product.
Table 38. Quantitative distribution of different phenolic constituents in ash gourd
Data are expressed as mean ± standard deviation (n = 6). Mean values in the same row
bearing same superscript shows no significant difference (p ≤ 0.05).

226
3.2.6.1.5. Correlations between various factors contributing in browning inhibition
Correlation coefficients were calculated between various attributes involved in browning
phenomenon (Table 39). A high correlation between browning index (BI) and enzyme
activities (PAL and PPO) was noted in the control samples, indicating their significant
roles in browning. A positive correlation between browning and PPO activity has also
been reported earlier in peaches [227]. A moderate to high correlations were also obtained
between BI and contents of various phenolic acids (caffeic, chlorogenic and p-coumaric
acid). Thus an enhanced content of these acids could result in browning during storage.
Further, a negative correlation between BI and α-resorcylic acid content and between the
PPO activity and α-resorcylic acid provides evidence for the decreased PPO activity in
irradiated samples as a consequence of the increased content of this phenolic acid.
Therefore, its role in PPO inhibition and subsequently in browning inhibition during
storage was further investigated.

227
Table 39. Correlation coefficients calculated between various factors contributing in
browning of RTC ash gourd
3.2.6.1.6. Role of α-resorcylic acid in inhibition of ash gourd PPO - Kinetics studies
A resorcylic acid concentration dependent decrease in browning was observed when
catechol was used as substrate (Figure 49 A). This observation demonstrated the role of
α-resorcylic acid in browning inhibition. The nature of inhibition and kinetic parameters
of enzyme inhibition were therefore further investigated.
The type of inhibition was deduced from Lineweaver-Burk (LB) double-reciprocal plot
(Figure 49 B). The linear plots obtained between 1/S and 1/V at different concentrations
of resorcylic acid were found to intersect on the left of the vertical axis and above the
horizontal axis. A decrease in Vm and an increase in Km was thus noted with increasing
concentrations of resorcylic acid. Thus inhibitory mode of resorcylic acid was found to be
of mixed type as both- slope as well intercept of the LB plot changed with different

228
concentrations of the inhibitor. This type of inhibition indicates that resorcylic acid
affected the affinity of the enzyme for catechol but did not bind at the active site of the
enzyme.
Figure 49. (A) Effect of resorcylic acid (0, 50, 125 and 250 mM) on the browning
reaction rate of catechol. (B) Lineweaver-Burk plot of resorcylic acid inhibition on the
catechol-ash gourd PPO system
The Ki (rate constant for reaction between enzyme (E) & substrate (S)) and Kis (rate
constant for reaction between enzyme-sbustrate complex (ES) & inhibitor (I)) values
were determined from the graphs between 1/Vmax vs [I] and Km/Vmax vs [I]
respectively (Figure 50 A & B). The value of Ki << Kis , implied a competitive
inhibition, with higher affinity of inhibitor for free enzyme rather than ES complex. In
inhibition studies of α-resorcylic acid on PPO from gum Arabic, a quasi-noncompetitive
inhibition with Ki value around 5 times lower than Kis value was noted [228]. Inhibitory
effect by various phenolic acids on PPO from various sources have been reported [228,
229]. PPO from different sources has been shown shown to be inhibited by phenolic

229
compounds via different mechanisms. To the best of our knowledge, this is the first report
on inhibition of ash gourd PPO by α-resorcylic acid.
Figure 50. Plots for determining various kinetic parameters. (A) Plot of 1/Vmax vs [I];
(B) Plot of Km/Vmax vs [I]; (C) Plot of V0/(V0-Vi) vs 1/[I] (where V0 is the initial
velocity without inhibitor and Vi is the initial velocity in the presence of inhibitor); (D)
Inhibitory effect of different concentrations of α-resorcylic acid on the oxidation of
catechol by ash gourd PPO.
The reversible nature of inhibition of ash gourd PPO by α-resorcylic acid using catechol
as substrate was demonstrated from a plot of V0/(Vo-Vi) vs 1/[I] (Figure 50 C; V0 –

230
velocity of reaction in absence of inhibitor; Vi – velocity of reaction in presence of
inhibitor). An intercept value > 1 on Y-axis implied reversible nature of inhibition. The
IC50 value was determined by a calibration graph between percent inhibition and [I]
(Figure 50 D). At a concentration of 25 mM, α-resorcylic acid exhibited 50 % inhibition
in the ash gourd PPO activity.
Thus the role of α-resorcylic acid in PPO inhibition was demonstrated. The nature of
inhibition was found to be mixed type, competitive and reversible, with IC50 value of 25
mM. Hence, radiation induced enhancement in the content of resorcylic acid could
contribute towards PPO inhibition, and thus preventing browning in radiation processed
RTC ash gourd.
3.3. Isolation, identification of bioactive constituents and determining their changes
during radiation treatment
There is an increasing interest in identifying bioactive components in native plant foods
and determining their role in contributing to the functional and nutraceutical properties of
these foods. This has resulted in concerted efforts towards identifying such foods
possessing novel bioactive organic molecules. Indian vegetables have traditionally been
used as medicinal ingredients in Ayurveda due to their unique bioactivities. Despite being
a treasure house of active constituents, very few studies exist on the nature of the
constituents present in majority of the Indian vegetables.

231
3.3.1. Ash gourd
Ash gourd (Benincasa hispida) is known for its medicinal values and healing power and
has been widely used as a vegetable as well as a traditional medicine in the orient. As a
rich source of functionally important bioactives and therapeutics such as triterpenes,
phenolics, sterols and glycosides, the fruit has been widely used for the treatment of
epilepsy, ulcer, and other nervous disorders in the traditional medicinal systems of Asia.
The juice of the vegetable is recommended to patients suffering from heart ailments and
high blood pressure. Ash gourd waste (peel and seeds) has been traditionally used as a
green manure for increasing the soil nutrients while shelled seeds are reported to have
anabolic properties that promote tissue growth. The vegetable extract was therefore
screened for the bioactive principles responsible for some of the above activities.
3.3.1.1. Plant growth promoting activity
Restriction on the application of chemicals to enhance plant growth due to their negative
effects has resulted in increased interest in the isolation of novel natural plant growth
promoters. This has led to the identification of several newer plant growth regulators such
as jasmonates, brassinosteroids, salicylic acid, plant peptide hormones, polyamines, nitric
oxide, strigolactones and karrikins that influence various physiological processes such as
rooting, flowering, senescence, organogenesis or growth. In recent years, airborne
volatiles identified as acetoin and 2,3-butanediol from growth promoting strains of
Bacillus subtilis and Bacillus amyloliquefaciens have also been shown to stimulate
growth of Arabidopsis thaliana [230-232]. Microbial and plant derived compounds with

232
bio-regulatory activity thus represent a large pool of chemicals that show promise for
development of novel agrochemical compounds. Acetoin was found to be a major aroma
compound existing both in the free as well as in the bound form of the vegetable. As this
compound has been earlier shown to have growth promoting activity, it was of interest to
understand its role in the known growth promoting activity of the vegetable.
3.3.1.1.1. Isolation and identification of plant growth regulating compound
The total aqueous extract of ash gourd was fractionated into non-polar, medium polar and
polar fractions by using n-hexane, ethyl acetate and n-butanol, respectively. Except n-
butanol extract, all other fractions including the remaining aqueous residue had no growth
promoting activity. The butanol fraction was therefore used for subsequent isolation of
the active principles. Presence of activity in the n-butanol fraction suggested a polar
nature of the active compound(s). When subjected to TLC, the butanol fraction resolved
in five distinct bands (Rf values of 0.38, 0.44, 0.52, 0.59 and 0.77), while no clear
separation could be observed in the total aqueous extract. The component(s) present in the
major band at Rf 0.44 alone exhibited growth promoting activity. Acid hydrolysis of the
methanol eluate of this band and subsequent GC/MS analysis of the ether extract of the
hydrolyzate resulted in the identification of acetoin as its sole constituent. Analysis of the
acetylated derivative of the hydrolyzate remaining after diethyl ether extraction indicated
the presence of glucose thus suggesting the major active constituent to be acetoin
glucoside. The structure of the compound (TLC band, Rf 0.44) was further confirmed by
IR and NMR spectral analysis (Figure 51). The absorption band at 1665 cm-1
in IR
spectrum indicated the presence of carbonyl group in the molecule. The NMR signals at δ

233
2.01 and 4.22 confirmed the presence of keto methyl and oxy methine group while a
doublet at δ 1.30 was assigned for the terminal methyl group in the acetoin moiety. A
broad signal in the range of δ 4.5-5.2 corresponding to sugar protons confirmed the
presence of carbohydrate moiety in the molecule. The IR absorption band at 910 cm-1
and
NMR peak at δ 4.2 (anomeric proton) suggested β- nature of the glycosidic linkage. The
β-linkage of the glucosidic bond was further confirmed based on the ability of
commercially available β-glucosidase enzyme to hydrolyze purified natural acetoin
glucoside. The chemical structure of the acetoin glucoside was further substantiated by its
chemical synthesis. Thus the structure of the molecule was identified as acetoin-β-
glucopyranoside.
3.3.1.1.2. Growth promotion studies
The effect of in vitro treatment of total aqueous extract of ash gourd, acetoin glucoside
(TLC isolated band) and standard acetoin at different concentrations (0.178 – 4.4 µg/mL)
on the diameter of tobacco leaf discs on day 14 is presented in Figure 52A. A significant
increase (p ≤ 0.05) in the leaf disc diameter was observed in all the treatments compared
to the control. Highest growth promotion activity was noted with acetoin glucoside
followed by acetoin and aqueous extract. An increase in diameter was observed up to a
concentration of 0.44 µg/mL in all the treatments. Beyond this concentration the
diameter was higher than the control, but lower than that observed at concentrations of
0.44 µg/mL in all the cases. Thus, an optimum concentration of 0.44 µg/mL was inferred.
A toxic effect on the leaves could possibly explain the retardation in growth of the leaf

234
discs beyond this concentration. At a concentration of 4.4 µg/mL, complete inhibition in
growth was observed for all the treatments.
Figure 51. IR and NMR spectra of acetoin-3-O-β-D glucoside
A
B

235
Figure 52. A) Effect of varying concentration (0.178 – 4.4 µg/mL) of total aqueous
extract (Aq extract) of ash gourd, acetoin glucoside and acetoin on tobacco leaf disc
diameter on day 14 (Different letters indicate significant differences) B) Effect of the
various treatments at the optimum concentration (0.44 µg/mL) on the diameter of leaf
discs during different time intervals (Different letters indicate significant differences).

236
Figure 52B shows the effect of various treatments at the optimum concentration
(0.44 µg/mL) on the diameter of leaf discs during different time intervals. A significant
increase (p ≤ 0.05) in diameter by 44 % (0.9 cm), 56 % (1.13cm) and 50 % (1.0 cm) was
noted in leaf discs treated with acetoin, acetoin glucoside and total aqueous extract
respectively on 14 d. In contrast, diameter of control leaf discs remained almost constant
during the entire time period studied. Beyond 14th
day, the leaf discs underwent decay and
hence the experiments were not continued further. Acetoin glucoside was found to induce
maximum growth response. This could possibly be due to the ready uptake of the
glucoside in comparison to its aglycone by the leaf discs. Figure 53A depicts the
enhancement in leaf disc diameter by acetoin glucoside at the optimum concentration of
0.44µg/mL on day 14. In a study on the growth promoting activity of volatile compounds
produced by bacterial strains GB03 and IN937a, Ryu et al [231] found that concentration
of acetoin released by these bacteria over a period of 24 h were 12 ± 5 µg and 8.8 ± 2.2
µg respectively, while concentration of 2, 3-butanediol was reported to be 3.9 ± 0.7 and
1.9 ± 0.5 µg, respectively. Induction of growth at lower concentrations in the present
study could be due to the greater uptake of these compounds by the leaf discs during
soaking unlike earlier studies on PGPRs, where restricted diffusion of volatiles into the
leaf from the atmosphere reduces this effect. The present study thus demonstrates that
acetoin and its glucoside possesses growth promoting activity.

237
Figure 53. A) Increased leaf disc diameter for acetoin glucoside (0.44 µg/mL) treatment
on day 14. B) Germination in pearl millet seeds after treatment with acetoin and its
glucoside
In order to further confirm the plant growth promoting activity of acetoin and its
glucoside, pearl millet seeds were soaked in acetoin and acetoin glucoside (0.44 µg/mL
each) overnight and then sowed in pots (5 seeds per pot) containing autoclaved soil and
cocopet (1:1). Seeds soaked overnight in sterile distilled water were used as control. The
treatment by acetoin glucoside enhanced leaf length (33.5 ± 3.3 cm) and shoot length (5.5
±1.5 cm) when the seeds were allowed to germinate and grow for a period of 15 days
(Figure 53B). In contrast, the control and acetoin treated samples had similar leaf and
shoot length (25.5 ± 2.6 cm and 2.8 ± 0.8 cm respectively). High water solubility of
acetoin glucoside unlike acetoin could explain the observed enhancement in plant growth
when treated with the former. It is likely that once absorbed into the seed, the glycoside
could be hydrolyzed to acetoin that then promotes germination and growth. This however
needs further confirmation.

238
3.3.1.1.3. Identification of differentially expressed protein in acetoin glucoside
treated tobacco leaf discs
Figure 54. Two dimensional gel from protein preparations of control and acetoin
glucoside treated tobacco leaves; Xt- protein over expressed in treated sample, Xc –
corresponding protein in control sample.

239
Figure 55. Mass spectrum obtained by MALDI-ToF analysis of the protein (Xt) over-
expressed in response to acetoin glucoside treatment.
Figure 54 depicts the 2-D gel electrophoresis images of control and acetoin glucoside
treated tobacco leaves. In the present study we report the identification and bioinformatic
characterization of a protein (Xt) expressed in response to acetoin glucoside treatment.
Analysis of this protein by MALDI-TOF provided information on the peptide molecular
mass. The mass spectrum of this protein is shown in Figure 55. Searching the MASCOT
database yielded the best hit as nuclear GTP binding protein RanB1 in tobacco (Nicotiana
tabacum; Swiss Prot accession No. P41919). The best fit peptide masses in tobacco Ran
B1 are shown in Figure 55. Ran is a small nuclear protein (25 kD) with multiple

240
regulatory roles [233]. Evolutionarily conserved Ran belongs to Ras superfamily and has
been demonstrated to be a very important nuclear transport regulator [234]. Ran toggles
between GTP and GDP bound forms. A GTP bound form is activated for its GTPase
function by RanGAP protein while a new GTP molecule replaces the bound GDP by the
action of RanGEF [235]. There are local concentration variation of these two Ran
modifying proteins within the cell causing concentration gradient of RanGTP and
RanGDP [236]. This concentration gradient is believed to be important for the regulatory
functions of Ran in nuclear transport. It also plays a very important role in DNA
replication and cell cycle progression [237]. It regulates the spindle assembly before
chromosome separation, and also the nuclear envelop formation after mitotic
chromosome separation is completed. Overexpressed Ran1 in transgenic Arabidopsis and
wheat showed increase in cell number [238]. Transgenic arabidopsis showed distinct
phenotype such as increased tiller number, weak apical dominance, excess rosette leaves,
and wider siliques. Therefore, from studies carried out by these researchers, it is evident
that Ran is an important protein for cell division and tissue growth. As observed in our
experiments, acetoin and its glucoside from ashgourd increased the biomass production.
We find the presence of RanB1 among the upregulated proteins quite significant.
However it is unclear whether acetoin and/or its metabolic derivative(s) directly work on
Ran up-regulation or other regulatory proteins are also involved. Ran and its regulatory
functions are at the cross roads of many biochemical pathways. Observation of Ran up-
regulation in response to ashgourd derived acetoin glucoside treatment sheds a new light
on the mechanism of acetoin mediated growth enhancement. Currently our efforts are

241
concentrated on identifying the other overexpressed proteins in response to treatment of
plant tissue with acetoin glucoside. This will provide a greater insight into the mechanism
of acetoin action. The treatment of plants with highly active but cheap chemicals such as
acetoin and acetoin glucoside could have potential use in increasing crop yield.
3.3.1.2. Angiotensin converting enzyme (ACE) inhibition activity
Ash gourd has been used in traditional Indian and Chinese medicine to treat inflammation
and high blood pressure. Its juice is recommended to patients suffering from heart
ailments and high blood pressure. Inhibition of Angiotensin I Converting Enzyme (ACE,
kinase II, EC 3.4.15.1) is currently considered to be a useful therapeutic approach in the
treatment of high blood pressure. It is of great importance for controlling blood pressure
by virtue of the rennin-angiotensin system. This enzyme cleaves the C-terminal of
histidyl-leucine of the inactive decapeptide angiotensin I to form the octapeptide
angiotensin II, a potent vaso-constrictor [239]. Although synthetic ACE inhibitors such
as captopril are remarkably effective, they cause adverse side effects. Therefore, research
to find safer and naturally occurring ACE inhibitors is desirable for the prevention and
remedy of hypertension. ACE inhibitory peptides have been isolated from various foods
as well as from enzymatic digestion of food proteins such as buckwheat, chickpea, and
mushroom [240-242]. The ash gourd juice was therefore screened for ACE inhibition
activity.

242
3.3.1.2.1. Activity guided fractionation
The ash gourd juice was fractionated with solvents of different polarity (hexane, ethyl
acetate and water) and the individual fraction was screened for ACE inhibitory activity by
an enzymatic assay using hippuryl-histidine-leucyl (HHL) as substrate (section 2.2.3.2).
The activity was mainly observed in the aq. extract left after partitioning with hexane and
ethyl acetate, while organic layers were devoid of ACE inhibitory activity. The aq extract
obtained from non-irradiated control and irradiated ash gourd at a concentration of 50
mg/mL exhibited 47.28 % and 40.50 % ACE inhibition, respectively. Thus, change in the
activity as a result of radiation treatment was insignificant. An ACE inhibition by 64 %
was reported earlier by ash gourd pulp extract at a concentration of 10 mg/mL [243].
They demonstrated that the inhibition of ACE activity by ash gourd fruit may be due to its
high phenolic contents. However, no compounds were identified by these researchers
responsible for this inhibition. The lower inhibition activity observed in the present study
could be due to the difference in variety and geographical origin of the vegetable studied.
The potency of an ACE inhibitor is usually expressed as IC50, which is equivalent to the
concentration of the compound inhibiting 50 % of ACE activity [244]. The IC50 value
was thus determined by regression analysis of ACE inhibition (%) versus different
concentrations of the extract. IC50 values for control and radiation processed ash gourd
extracts were found to be 3.77 and 4.4 mg/mL, respectively. The aq. extract was further
subjected to chromatographic separations for isolation and identification of the active
principles.

243
3.3.1.2.2. Isolation and identification of active principles
The aqueous extract obtained after partitioning with organic solvents from non-irradiated
control ash gourd was fractionated by HPLC using C18 column. Figure 56 shows HPLC
chromatogram of the total aq extract of ash gourd. For preliminary screening, different
regions of the HPLC chromatogram were collected and assayed for ACE inhibitory
activity. As evident from table 40, maximum activity (86 %) was exhibited by fraction 1
(F1, 2 – 4 min), followed by F2 (41 %), F3 (36 %) and F4 (20 %). All others fractions
collected were devoid of ACE inhibitory activity. The eluate collected corresponding to
F1 was therefore subjected to re-chromatography. After re-chromatography, four major
peaks (F1-1, F1-2, F1-3 and F1-4; Table 41) were collected separately to identify the
active compound. The activity mainly resided in the compounds eluting between 2.75-
3.00 min (F1-2). A positive reaction of this fraction with ninhydrin (development of
pink/purple color) indicated its peptide nature.
Figure 56. RP-HPLC profile of ash gourd aq extract

244
Table 40. The peaks collected from HPLC for preliminary screening of the fractions
possessing ACE inhibition activity.

245
Table 41. Fractions collected from re-chromatography of region 2-4 min obtained from
preliminary HPLC analysis.
The active fraction (F1-2) collected from repeated HPLC injections was pooled,
evaporated, and made up in aqueous solution (10 %). The aq solution so obtained, was
subsequently subjected to gel permeation chromatography (GPC), which gave rise to
three major peaks (Figure 57). Each of these peaks were collected and tested for their
ACE inhibitory activity. The activity mainly resided in fraction F1-2b (47 %) at a
retention time of 38.9 min (Table 42).
Figure 57. Chromatogram obtained from GPC of fraction 2

246
Table 42. Fractions collected from GPC of F1-2
For determining the molecular weight of active fraction (F1-2b), standards of known
molecular weight such as Leucine enkephaline (555.6 Da), Glu-Val-Phe (393.4 Da) and
Asp-Phe (280.28 Da) were injected in GPC. The molecular weight of the active fraction
(323 Da) was then calculated from the calibration curve plotted between molecular
weight and V/V0 (V - elution volume of the compound; V0 - void volume of the column).
The mass data indicated that peptide could be comprised of 2-4 amino acids. The purified
fraction showed a UV absorbance at 220 and 254 nm. Absorption at 254 nm indicates
presence of an aromatic amino acid in the active peptide. The active fraction (F1-2b) was
subjected to mass spectral analysis using direct probe facility available in GC/MS
(Shimadzu Corporation, Kyoto, Japan). Mass spectral data showed the presence of amino
acids viz. alanine (M+, 89) and valine (M
+, 117) in this fraction. The mass spectra of these
compounds are shown in Figure 58. However, the third possible amino acid present in the
peptide could not be determined in mass spectral studies. Many earlier studies on ACE
inhibitory peptides including from mushroom and broccoli have reported their nature to
be tripeptide [242, 245]. Cheung et al., reported the results of a series of inhibitory
peptides against ACE, indicating that aromatic amino acids at the C-terminal and
branched chain aliphatic amino acids at the N-terminal were suitable for a peptide binding

247
to ACE as a competitive inhibitor [246]. However, other reports have demonstrated that
inhibitory peptides possess an aliphatic amino acid residue at their C-terminal. The results
obtained in the present study, thus are consistent with the earlier reports. The
confirmation of the exact sequence of the amino acids in the active peptide, however,
needs further investigation.
Figure 58. Mass spectra of the identified amino acids viz. alanine and valine in the active
fraction
Thus, the consumption of ash gourd may provide significant protection against high blood
pressure, and inflammation regulated by rennin-angiotensin system. This study provides
evidence for pharmacological use of ash gourd in treatment of high blood pressure in
traditional Indian medicine. To the best of our knowledge, this is the first report on effect
of radiation processing on the ACE inhibitory activity of ash gourd. Therefore, radiation
processing could be employed for improvement in the shelf life of RTC ash gourd
without any substantial change in its ACE inhibition activity.

248
3.3.2. Cucurbitacins in pumpkin
Pumpkin belongs to Cucurbitaceae family and is known to possess several
pharmacological properties such as antidiabetic, antihypertensive, antitumor, immune
modulation, antibacterial, anti hypercholesterolemia, intestinal antiparasitia, and anti-
inflammation [247]. The ethanolic extract of the vegetable (Cucurbita pepo cv dayangua)
has been reported to show dose-dependent inhibitory effect on the growth of tumor cells.
This anti-tumor activity, has been attributed to the presence of various cucurbitane and
hexanorcucurbitane glycosides and other types of triterpenoids [248, 249]. Cucurbitane
glycosides such as cucurbitacin L 2-O-β-D-glucopyranoside, cucurbitacin K 2-O-β-D-
glucopyranoside; hexanorcucurbitane glycosides: 2,16-dihydroxy-22,23,24,25,26,27-
hexanorcucurbit-5-en-11,20-dione 2-O-β-D-glucopyranoside and 16-hydroxy-
22,23,24,25,26,27-hexanorcucurbit-5-en-11,20-dione 3-O-α-L-rhamnopyranosyl-(1 -->
2)-β-D-glucopyranoside have been isolated and identified in cucurbita pepo cv dayangua
[250]. Presence of cucurbitane triterpenoids with a purine unit and cucurbitacin C & E
has also been documented in pumpkin [248, 251]. Being associated with various
pharmacological activities and wide occurrence, it was of interest to explore the
occurrence of these bioactive constituents in pumpkin in the present study and determine
the effect of radiation processing thereon.
3.3.2.1. TLC analysis
The 1% methanolic extract (as obtained in section 2.2.3.5.) of control and radiation
processed samples stored for different storage periods (0, 7, 14 and 21 d) were subjected
to TLC analysis. Two major bands at Rf values 0.21 and 0.32 (Figure 59) and a minor

249
band at Rf 0.6 was observed when the plate was stained with iodine vapors. Low Rf
values of the two major bands suggested a polar nature of these compounds. In order to
identify the nature of the compounds in these bands, the plate was sprayed with
Liebermann-Burchard reagent (5ml acetic anhydride + 5ml conc. H2SO4 + 50 mL
ethanol). Development of pink colored spots when the plate was heated at 120˚C,
indicated triterpenoid nature of these compounds (Figure 59A). The total extract was
subjected to enzymatic hydrolysis by pectinase and further subjected to TLC analysis
with the same solvent system as above. Except for a spot at Rf 0.88, no spots
corresponding to bands 1, 2 and 3 could be observed. This indicated a possible glycosidic
nature of the compounds present in these bands. Increased activity of hydrolytic enzymes
such as glycosidase and pectinase during storage in fruits and vegetables has been
reported. Hence, it was of interest to determine the stability of the above compounds
during radiation processing and storage. TLC analysis showed a decrease in area of the
major spots (Rf 0.21 and 0.32) with storage in both control and radiation treated samples
(Table 43). The observed decrease could thus be due to the activity of some of the above
enzymes during storage. However, this decrease was significant only beyond 14th day of
storage. No significant radiation specific effect was observed on the above compounds.

250
Figure 59. TLC separation of methanolic extracts obtained from control and irradiated ash
gourd samples stored for various storage periods (A) sprayed with LB spray (B) stained
with iodine vapors
Table 43. Peak area (sq mm) distribution of TLC spots I and 2 as measured by TLC-
densitometry
Different superscripts in a row indicates significant differences between values at p ≤ 0.05

251
3.3.2.2. Identification of cucurbitacins
The methanol extract and its hydrolyzate was subjected to TLC analysis using two
different solvent systems (section 2.2.3.5.). (Figure 60)
Figure 60. TLC profiles of unhydrolyzed (spot 1) and hydrolyzed (spot 2) extracts with
different solvent systems (a) Ethyl acetate : benzene (75:25) (b) Chloroform : acetone
(90:10); Cu C – cucurbitacin C; Cu E- cucurbitacin E.
Figure 60 depicts the TLC profile of hydrolyzed and unhydrolyzed methanol extract in
two different solvent systems. The spots corresponding to cucurbitacins (Cu) were
identified by comparing their Rf values with that reported in literature. While the spot at

252
Rf value of 0.56 (solvent system 1) and 0.68 (solvent system 2) matched with that of Cu
E, that at Rf 0.37 (solvent system 1) was in agreement with Rf value of standard Cu C
[252, 253]. In order to further confirm their identity, the methanol extract was subjected
to HPLC analysis.
Figure 61 depicts the HPLC separation of the constituents present in the total extract. The
retention time of the two cucurbitacins namely Cu C and Cu E tentatively identified
above was compared with the reported literature value for these compounds. While the
peak at Rt 4.27 min matched with that of Cu E glucoside, no peaks with Rt comparable to
Cu C could be detected in the HPLC profile [254]. In order to further ascertain the
presence of these two compounds, the hydrolyzate of the total extract was subjected to
GC/MS (Figure 62) analysis.
Figure 61. HPLC chromatograms obtained at 254 and 237 nm for identification of
cucurbitacins. (The peak corresponding to Cu E glucoside is marked with arrow).

253
Figure 62. GC/MS profile obtained for hydrolyzate of the total extract.
The mass fragmentation (Table 44) of peak 1 and that of peak 2 (Figure 62) was in good
agreement with that of the mass spectra of standard Cu C and CuE respectively , reported
in literature.
The mass spectrum of peak 1 showed a fragment at m/z = 500 (M+
- 60), corresponding to
C30H44O6. Other fragments at m/z 482 (C29H38O6) and 470 (C28H38O6) also matched with
the fragments reported for Cu C. A very intense and characteristic peak, often the base
peak was found at m/z = 43 (CH3CO). The mass fragments at m/z = 113 (C6H8O2) and
m/z = 96 (C6H8O) further indicated the presence of Cu C in the hydrolyzate (Table 44).
On the other hand, mass fragments of peak 2 in Figure 62 matched with that of Cu E (11
AT). The mass spectrum showed a fragment at m/z = 556 (M+) corresponding to
C32H44O8. A very intense and characteristic peak, often the base peak was found at 96
(C6H8O). The mass peak at m/z = 113 might correspond to the formula C6H9O2.
Thus, the aforementioned spectral data and Rf values on TLC (Table 44) indicated the
presence of Cu C and Cu E in the hydrolyzate of total extract. The results obtained are
summarized as below (Table 44)

254
Table 44. Rf values, maximum UV absorption and the mass fragments of Cu C and Cu E.
Thus, based on the TLC, HPLC and GC/MS analysis of total and enzymatically
hydrolyzed extract, the major triterpenes were partially identified as Cucurbitacin E
glucoside and Cucurbitacin C (Figure 63). Most of the members of Cucurbitaceae have
been reported to contain less than 0.01 % cucurbitacins [255]. Thus, the structure of the
compounds require further verification, which is in progress.
Cucurbitacin E glucoside Cucurbitacin C
Figure 63. Chemical structure of the compounds identified in this study
255
3.3.3. Glucosinolates in drumstick
Drumstick (M. oleifera) is an important food commodity which has received enormous
attention as the ‘natural nutrition of the tropics’. Almost all the parts of this plant, viz-
root, bark, gum, leaf, fruit (pods), flowers, seed and seed oil have been used for various
ailments in the indigenous medicine of South Asia, including the treatment of
inflammation and infectious diseases along with cardiovascular, gastro-intestinal,
hematological and hepatorenal disorders [108, 111, 117]. The medicinal properties of the
plant have been attributed to the presence of bioactive phytochemicals including phenolic
compounds, and a unique group of compounds called glucosinolates (GSLs) and
isothiocyanates (ITCs) (58, 113].
Glucosinolates are very stable water-soluble bioactive compounds. Myrosinase (EC
3.2.3.1), a class of enzymes that catalyses the hydrolysis of GSLs, is physically separated
from each other in intact plant cells. Food processing methods such as physical disruption
of plants by chewing, chopping and freezing results in the interaction of GSLs with
myrosinase resulting in the hydrolysis of the latter and liberation of various breakdown
products (isothiocyanates, nitriles, oxazolidinethiones, thiocyanate and epithionitriles)
(Figure 5 in introduction). Under carefully controlled conditions designed to extract
glucosinolates and isothiocyanates completely, while preventing myrosinase activity,
some fresh plants have been shown to contain almost exclusively glucosinolates [60]. In
contrast to intact GSL, hydrolysis products have been of interest for their diverse
biological activities, ranging from antimicrobial, antioxidant and anticancer actions [58].
Among breakdown products, isothiocyanates (ITCs) are reported to have highest

256
biological activity. They have been reported to possess broad-spectrum antimicrobial
activity against bacterial & fungal pathogens, insects and possess potent anticarcinogenic
activity [256, 257]. Bioavailability of these compounds are influenced by storage and
culinary processing [258]. Therefore, the effect of radiation treatment (1 kGy) on
bioactive glucosinolates and isothiocyanates in drumstick was investigated.
3.3.3.1. Isolation and identification of glucosinolates and isothiocyanates
The glucosinolate extract was subjected to HPLC using the method detailed in section
2.2.3.7. The extract was hydrolyzed using the enzymes sulfatase and myrosinase to locate
the peaks corresponding to glucosinolates. Sulfatase removes the sulfo moiety, whereas
myrosinase hydrolyses the sugar moiety and releases free aglycones from the
glucosinolates. The corresponding HPLC profiles are shown in Figure 64.
As evident from Figure 64, the peaks in the initial region (2 – 6 min) of the HPLC
chromatogram of aq extract exhibited quantitative changes when hydrolyzed by
myrosinase and sulfatase. The compounds corresponding to the major peaks in this
region were thus collected for further analysis (Table 45).

257
Figure 64. HPLC chromatograms obtained for drumstick aqueous extract and after
hydrolysis with myrosinase and sulfatase enzyme.
Due to unavailability of standard glucosinolates, the total aq extract and the peaks thus
collected were further subjected to enzymatic hydrolysis by myrosinase and the released
aglycones then analyzed by GC/MS in order to identify the corresponding glucosinolates.
Table 46 lists the major compounds detected in the peaks collected from HPLC of the aq
extract. Although, many sulphur containing compounds were detected, no isothiocyanates
could be detected in the collected peaks. The acidic conditions of the eluting solvent
system (presence of TFA in solvent system, section 2.2.3.7.) might have resulted in the
degradation of the isolated peaks resulting in production of sulfones and other acid

258
derivatives instead of isothiocyanates or nitriles. Production of different aglycones via
alternative modes of degradation of glucosinolates under different conditions has been
reported [259]. Therefore, HPLC could not be employed in the present study for
investigating the vaiation in the glucosinolate content as a result of radiation processing
and storage.
Table 45. Major compounds detected in the collected peaks as identified by GC/MS.
Peak No. (Rt in HPLC) Major compounds identified
1 (2.84 min) S-acetyl-2-methyl-3-mercapto propionic acid ester,
carbamidoylsulfanylic acetic acid, dipropyl ester of sulfurous acid
2 (3.14 min) Acetoin, ethyl acetate, dimethyl sulfone, 2,4-Dithiahexan-5-one
3 (3.86 min) Dimethyl sulfone, 2,4-Dithiahexan-5-one, thiolacetic acid, 2,3-
butanediol, cyclic sulfate
4 (4.34 min) 1,3-butanediol, dimethyl sulfone, pyrimidine-2,4(1H, 3H)-dione, 5-
amino-6-nitroso
5 (6.09 min) 2,4-Dithiahexan-5-one, methyl thiomethyl thiol acetate
GC/MS analysis of the hydrolyzate of total aq extract resulted in identification of
isopropyl isothiocyanate, isobutyl isothiocyanate and 2-butyl isothiocyanate as the major
ITCs. GC/MS profile of hydrolyzed aq extract of drumstick is depicted in Figure 65.
Figure 66 represents the chemical structure and mass spectral data of the identified ITCs.
It has been proposed that presence of an ITC or a desulfo-GSL is proof of the parent GSL
[78]. Thus, presence of isopropyl glucosinolate, 2-butyl glucosinolate and isobutyl
glucosinolate in drumstick could be inferred.

259
Figure 65: GC/MS profile of hydrolyzed aqueous extract of drumstick
Figure 66. Chemical structure and mass spectra of isopropyl, 2-butyl and isobutyl ITC.
Several researchers have indirectly identified Moringa glucosinolates by analyzing the
free aglycones obtained after myrosinase hydrolysis using GC/MS. These were isopropyl,
isobutyl, 2-methylpropyl, 4-(α-L-rhamnopyranosyloxy)-benzyl and 4’-O-acetyl-4-(α-L-

260
rhamnopyranosyloxy)-benzyl in M. peregrina and isopropyl, 2-methylpropyl, and traces
of isobutyl and 4’-o-acetyl-4-(α-L-rhamnopyranosyloxy)-benzyl in M. pterygosperma,
and 4-(α-L-rhamnopyranosyloxy)-benzyl in M. oleifera and M. stenopetala [113]. Figure
67 shows the structures of glucosinolates previously reported in Moringa species.
Although, isopropyl and isobutyl glucosinolates have been reported earlier in different
species of Moringa, these compounds have not been reported in M. oleifera (drumstick).
Figure 67. Structures of glucosinolates previously reported in Moringa species (adapted
from [113])
In order to study the effect of radiation processing and storage on the glucosinolates in
drumstick, the aq extracts of control and irradiated RTC drumstick at each storage
duration were subjected to hydrolysis by myrosinase. The released isothiocyanates were
then analyzed using GC/MS. Table 46 lists the variation in the contents of major

261
isothiocyanates detected in control and radiation treated drumstick at different storage
intervals.
Table 46. Quantitative distribution of major isothiocyanates (µg/kg) in control and
radiation processed (1 kGy) RTC drumstick at different storage periods.
Data are expressed as mean ± standard deviation (n = 6). Mean values in the same column bearing same
superscript shows no significant difference (p ≤ 0.05).
As evident from Table 46, radiation processing resulted in enhanced content of
isothiocyanates. An enhancement of 16, 79 and 64 % in the content of isopropyl, 2-butyl
and isobutyl isothiocyanate respectively was observed in radiation processed (1 kGy)
samples in comparison to non-irradiated controls on day zero. Storage resulted in a
significant decrease in the content of identified ITCs (Table 46). At the end of storage
period (12 d), a decrease of 56, 67 and 65 % was observed in the contents of isopropyl, 2-
butyl and isobutyl isothiocyanate respectively, in control samples. However, this decrease
was only of 19, 44 and 34 % for the respective ITCs in radiation treated samples at the

262
end of intended storage period (12 d). Similar reports of decreased ITC content during
storage have been reported in Brassica vegetables [259], where in approximately 30–50%
of the total loss of ITCs in shredded vegetables stored at 4-8 °C was reported. Although,
storage resulted in a significant decrease in the contents of all the three ITCs, this
decrease was appreciably higher in the control than the treated samples at the end of
intended storage period (12 d). Since presence of ITCs has been proposed as a proof of
the existence of the corresponding parent GSLs, the changes in ITCs could be correlated
with the variation in their respective GSLs. The study, thus, demonstrates an increased
content of isopropyl, isobutyl and 2-butyl GSLs, thereby improving the nutraceutical
value of the product, as a result of radiation processing. Radiation induced enhancement
in the glucosinolate content and better retention during storage has also been reported
previously in minimally processed cabbage [145. Upregulation of the genes associated
with GSL biosynthesis was cited as the reason for enhanced contents of GSLs in radiation
processed product. To the best of our knowledge, this is the first report showing effect of
radiation processing on the glucosinolate/ isothiocyanate content of M. oleifera.
3.3.4. Isolation, identification and quantification of phenolic constituents and
carotenoids
Dietary antioxidants have been demonstrated to play a significant health protective role.
Beneficial effects of antioxidants present in fruits and vegetables have been widely
reported [43]. These antioxidants such as polyphenolic compounds including flavonoids
eg. flavonols, flavones have gained considerable interest as they are shown to be very
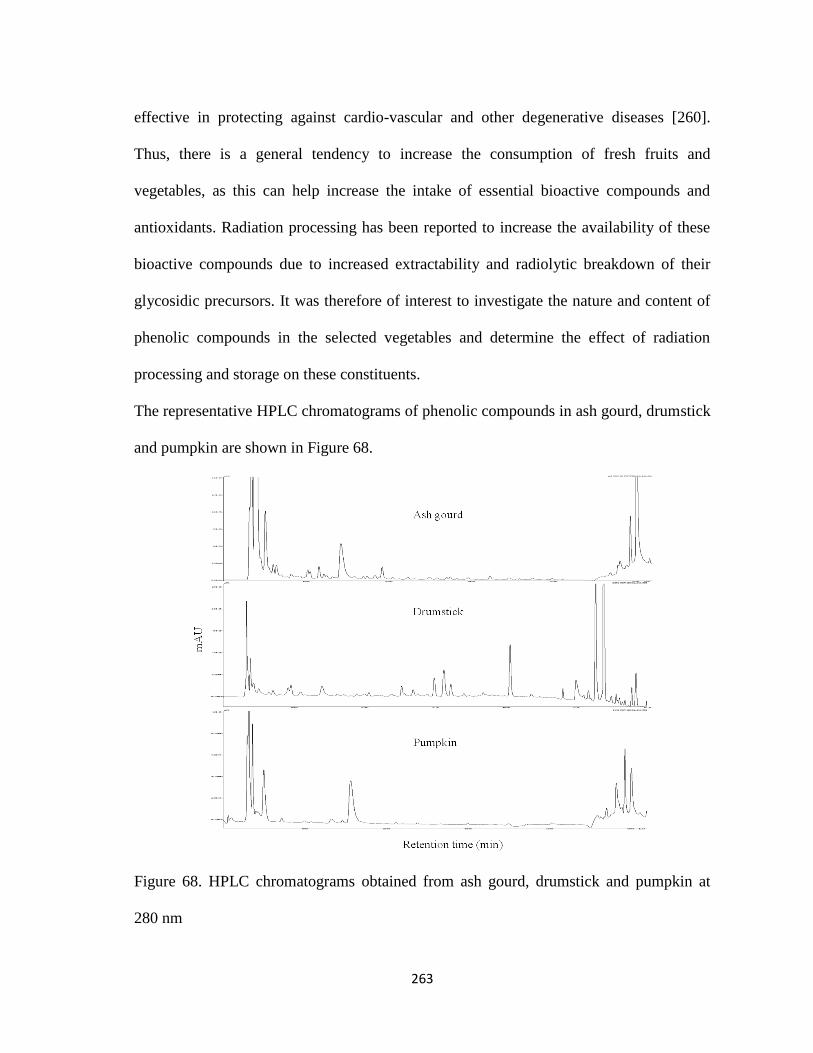
263
effective in protecting against cardio-vascular and other degenerative diseases [260].
Thus, there is a general tendency to increase the consumption of fresh fruits and
vegetables, as this can help increase the intake of essential bioactive compounds and
antioxidants. Radiation processing has been reported to increase the availability of these
bioactive compounds due to increased extractability and radiolytic breakdown of their
glycosidic precursors. It was therefore of interest to investigate the nature and content of
phenolic compounds in the selected vegetables and determine the effect of radiation
processing and storage on these constituents.
The representative HPLC chromatograms of phenolic compounds in ash gourd, drumstick
and pumpkin are shown in Figure 68.
Figure 68. HPLC chromatograms obtained from ash gourd, drumstick and pumpkin at
280 nm

264
3.3.4.1. Ash gourd: The quantitative distribution of phenolic constituents identified in
ash gourd and their changes during radiation processing and storage are represented in
Table 38 (section 3.2.6.1.4.). The representative chromatogram obtained from HPLC is
shown in figure 68. The major phenolic constituents identified in ash gourd included
phenolic acids (α-resorcylic, p-hydroxy benzoic, chlorogenic, syringic, p-coumaric acid)
along with catechin and naringenin (Table 38, section 3.2.6.1.4.). High antioxidant
potential of ash gourd fruit has been reported earlier [261]. Different researchers have
also demonstrated protective effects of ash gourd in the renal failures and injury caused
by mercury chloride [100]. The antioxidant attributes of the fruit were ascribed to the
presence of polyphenolics compounds including iso-vitexin, astilbin, catechin and
naringenin. Besides catechin and naringenein, which were identified previously, the other
phenolic acids identified in the present study have not been reported earlier. Radiation
induced increase in α-resorcylic acid and a decrease in the content of chlorogenic and
caffeic acid was observed. Increased α-resorcylic acid was shown in this study (section
3.2.6.1.4.) to prevent browning of irradiated ash gourd during storage. Radiation induced
decrease in phenolic compounds has been reported in various plant produce [169, 170]. In
general, the decrease in antioxidants and phenolic compounds is attributed to the
formation of radiation-induced degradation products or the formation of free radicals.
However, no significant changes in other phenolic constituents was observed as a result of
radiation processing.

265
3.3.4.2. Drumstick
The major phenolic constituents identified in drumstick are represented in Table 47. It
included phenolic acids - gallic, protocatechuic, caffeic and o-coumaric acid and
flavonoids – catechin, epicatechin, kaempferol and rutin. Earlier reports on drumstick
pods demonstrated the presence of rutin, however, phenolic acids were not reported by
these workers [113]. Most of the work published on drumstick till date has been mainly
focused on its leaves, seeds and flowers. Reports in literature on the nature of phenolic
constituents in drumstick pods demonstrate the presence of mainly flavonoid glycosides
such as quercetin-3-O-rutinoside (rutin), quercetin-3-O-glucoside with traces of
kaempferol 3-O-(6”-malonyl glucoside) and isorhamnetin 3-O-(6”-malonyl glucoside).
Caffeoylquinic acids (5- and 3- isomers) were detected in stem, leaves and flower with
exception of roots, pods and seeds [262]. To the best of our knowledge, the presence of
gallic, protocatechuic, caffeic and o-coumaric acids in drumstick pods is reported here for
the first time. However these acids were reported earlier in drumstick seed flour by Singh
et al. [263]. No significant changes in the contents of phenolic constituents identified in
the present study were observed as a result of radiation processing and storage. Thus,
radiation processing was found to be amenable for improving the shelf life of RTC
drumstick without any significant changes in the bioactive phenolic compounds of the
vegetable.

266
Table 47. Quantitative distribution of identified phenolic constituents (mg/kg) in
drumstick
Values are means ± SD (n = 3); Different letters indicate significant difference at p ≤ 0.05
3.3.4.3. Pumpkin
3.3.4.3.1. Identification and quantification of phenolic constituents
The nature and content of phenolic compounds were studied in control and radiation-
treated samples. Major phenolic compounds identified in the present study include

267
syringic, caffeic, protocatechuic, p-hydroxy benzoic, vanillic and ferulic acid along with a
flavanol, quercetin (Table 48). Similar phenolic composition was earlier reported by
Dragovic-Uzelac et al. [264]. Besides, chlorogenic and p-coumaric acid were also
reported by these workers, which were not detected in the present study. A marginal but
statistically significant (p < 0.05) decrease was noted in the contents of protocatechuic (9
%), caffeic (3 %), ferulic acid (13 %) and quercetin (7 %) due to radiation processing. No
significant (p < 0.05) effect of radiation treatment was, however, observed on the content
of all other phenolic constituents identified (Table 48).
A significant (p < 0.05) reduction in the content of all the phenolic compounds was
observed during storage in control samples. The losses ranged from 6 % for vanillic acid
to a maximum reduction of 31 % in the content of protocatechuic acid on day 21.
Increased physiological and microbial spoilage during storage, resulting in enhanced
degradation of sensitive compounds such as phenolic constituents could possibly explain
the decreased content observed. However, radiation-treated samples had a higher content
of phenolic constituents as compared to non-irradiated controls at the end of storage
period of 21 d (Table 49). Better maintenance of physiological and microbial quality in
the radiation-treated samples could have prevented the leaching out of phenolic
compounds and their exposure to air, resulting in lesser oxidation and thus maintaining
their content during storage.

268
Table 48. Quantitative distribution of identified phenolic constituents and carotenoids
(mg/kg) in pumkin
Values are means ± SD (n = 3); Different letters indicate significant difference at p ≤ 0.05
3.3.4.3.2. Identification and quantification of carotenoids
Carotenoids are the natural plant pigments responsible for the bright yellow-orange
colour of pumpkin. Besides, they are known to possess significant antioxidant activity
and a range of other biological activities [265]. Content of β-carotene and lutein, major
carotenoids identified in the present study are shown in Table 49. The representative
HPLC profile obtained for carotenoids is shown in Figure 69.

269
The content of β-carotene and lutein in fresh control pumpkin samples was 4.75 ± 1.21
mg/kg and 7.76 ± 1.26 mg/kg, respectively. No significant effect of radiation processing
was observed on the content of both the carotenoids immediately after irradiation.
Similar observations have been reported in irradiated carrots and cucumber and sliced
tomatoes [87, 266]. However, a significant (p < 0.05) decrease was observed during
storage in both control and irradiated samples (Table 11). The content of beta carotene
and lutein at the end of storage (21 d) was found to be 3.42 ± 0.65 and 5.81 ± 1.39
respectively in control and 2.40 ± 0.26 and 3.51 ± 0.84 mg kg
-1 respectively in radiation-treated
samples. Similar results have been documented for various radiation-treated Indian potato
cultivars by [267]. wherein they reported 50 % reduction in the total carotenoid content
after 6 months of storage. Thus, from the data obtained in the present study, it could be
concluded that the overall nutritional quality of the radiation-treated (1 kGy) product was
better than the corresponding control at the end of the intended storage (21 d).

270
Figure 69. HPLC chromatograms obtained for control and radiation processed pumpkin
(0 d and 21 d) carotenoids (450 nm).

271
3.4. Conclusions
The experimental design approach was successfully employed for optimization of
radiation dose and storage time for obtaining RTC products of ash gourd, drumstick and
pumpkin with acceptable microbial and sensory quality. Third-order polynomial
equations explained the complex interactions among radiation dose, storage duration and
quality attributes of the RTC products. At an optimum dose of 2 kGy, a shelf life of 12 d
for ash gourd; and at a dose of 1 kGy a shelf life of 12 and 21 d for drumstick and
pumpkin respectively was achieved. Radiation-treated products had better nutritional
attributes as compared to the control at the end of storage period. Analysis of developed
products by QDA demonstrated that the processed products had acceptable aroma, taste
and textural properties. The mathematical approach for obtaining process parameters can
be useful for commercial production as the processing conditions can be suitably
optimized based on quality characteristics required, thus reducing severity of treatments.
The study demonstrated the efficacy of gamma irradiation for extending the shelf-life of
minimally processed vegetables.
Free and bound aroma compounds of the selected vegetables – ash gourd, drumstick and
pumpkin were identified. SPME in case of free aroma and SPE for bound aroma were
found to generate better qualitative and quantitative data in all the three vegetables.
Alcohols, aldehydes, ketones and terpenes were the major classes of compounds
identified. Interference with the solvent in the initial regions of chromatograms and losses
of volatiles during evaporation step in SDE restricted the identification of many lower
boiling aroma compounds in SDE.

272
GC-O analysis of the aroma extracts was successfully employed for the identification of
key odorants in the vegetables studied. Acetoin, octanal and nonanal for ash gourd;
benzothiazole, decanal and 2-dcenal in drumstick and a combination of 6Z-nonenal and
2E, 6Z-nonadienal in case of pumpkin were demonstrated to be the key odorants
responsible for the characteristic aroma of the respective vegetable.
To the best of our knowledge, this is the first report on identification of aroma
constituents in these vegetables. As bound aroma glycosides serve as a reservoir of potent
aroma, the data so generated might be useful in exploiting this pool for
enhancing/modifying the overall aroma quality of the vegetables by using suitable
processing steps. Information about key odorants may be utilized in reconstitution of the
aroma formulations, which can be utilized in the food/ flavor industry.
Radiation processing resulted in significant changes in aroma profile of all the three
vegetables studied. However, the changes varied in each vegetable. Contents of alcohols
increased in response to radiation processing and storage in ash gourd and pumpkin
which could be attributed to the radiolytic breakdown of their corresponding glycosidic
precursors.
The contents of major carbonyl compounds decreased with radiation processing and
storage in ash gourd, while a significant increase in the content of hexanal and trans-2-
hexenal was observed in radiation processed drumstick. The increase in aldehydes content
could be attributed to radiation induced lipid radiolysis resulting in release of linolenic
acid and its subsequent conversion to aldehydes via lipoxygenase (LOX) pathway. On the
other hand, conversion of aldehydes to corresponding branched chain alcohols and

273
subsequently to esters could be the reason for decreased contents of aldehydes in ash
gourd. No significant changes were observed in carbonyl compounds of pumpkin in
response to irradiation.
A considerable difference in the effect of radiation processing on the content of
glycosidic precursors was observed among the three vegetables studied. Two types of
radiation effects were observed. Decrease in glycosidic precursors was seen in ash gourd
and pumpkin, while their contents increased in irradiated drumstick. Both radiation
induced increased extractability and degradation was observed. It can be concluded that
both these changes can occur simultaneously and independent of each other. Despite the
changes in the content of some of the aroma compounds during storage and radiation
processing as noted instrumentally and statistically, they were not sufficient to be
observed by the sensory panel. Hence the radiation processed product developed, had
good sensory acceptability at the end of storage period.
Radiation processing inhibited browning in RTC ash gourd during storage. Enhanced
electrolytic leaching due to softening of tissue structure and enhanced PAL activity were
found to play a major role in increased browning of control samples during extended
storage. Radiation induced increase in the content of α-resorcylic acid resulted in
inhibition of ash gourd PPO that subsequently, prevented browning in radiation processed
samples. The current work demonstrated the feasibility of radiation processing as an
effective post harvest processing method in inhibiting surface browning in RTC ash
gourd. Thus, besides being highly effective method of ensuring food safety, γ-irradiation
provides an improved benefit in terms of maintaining visual quality of the product. To the

274
best of our knowledge, this is the first report on radiation induced browning inhibition in
RTC ash gourd.
At the optimum doses employed for shelf-life extension, (2 kGy for ash gourd; 1 kGy for
drumstick and pumpkin), the bioactive principles were not affected significantly. The
plant growth regulating and ACE inhibition capacity of ash gourd was not altered by
radiation treatment. The contents of major isothiocyanates identified in drumstick
(isopropyl isothiocyanate, isobutyl isothiocyanate and 2-butyl isothiocyanate) was 2-3
times higher in radiation treated drumstick as compared to non-irradiated control at the
end of storage period (12 d), thus resulting in improved nutraceutical value of the
vegetable. An increased content of α-resorcylic acid in irradiated ash gourd resulted in
PPO inhibition and consequently browning development on the cut surfaces of the
vegetable. A marginal decrease in the phenolic contents was observed in radiation-treated
pumpkin, whereas in drumstick, they were unaffected. Thus radiation processing was
found to be amenable for extending the shelf life of RTC products of ash gourd,
drumstick and pumpkin without any adverse effect on the bioactive principles. To the best
of our knowledge, this study demonstrates for the first time the effect of radiation
processing on shelf life improvement and various phyto-chemical aspects of RTC ash
gourd, drumstick and pumpkin.

275
CHAPTER 4
SUMMARY

276
The present study aimed at determining the feasibility of radiation processing for
improving the shelf life of ready-to cook (RTC) vegetables of Indian origin. It was also of
interest to determine the changes, if any, in the quality of the processed products as a
result of radiation processing. The vegetables selected for the study were: ash gourd,
drumstick and pumpkin. The main attributes studied included microbial quality, color,
texture, sensory acceptability and nutritional quality. Changes in bioactive compounds
and their precursors during such a treatment were also investigated.
The highlights of the study are summarized below:
Radiation processing of RTC ash gourd, drumstick and pumpkin, packed in
polystyrene trays and wrapped in cling films was demonstrated to improve their
shelf-life when stored at 10 °C
The full factorial experimental design approach was successfully employed for
optimization of radiation dose and storage time for obtaining RTC products of ash
gourd, drumstick and pumpkin with acceptable microbial and sensory quality.
At an optimum dose of 2 kGy a shelf life of 12 d for ash gourd; and at a dose of 1
kGy a shelf life of 12 and 21 d for drumstick and pumpkin respectively was
achieved.
Application of gamma radiation at optimum doses resulted in development of
RTC products with desired microbial and sensory quality.
Radiation-treated products had better nutritional quality (antioxidant potential,
vitamin C, total phenolic & flavonoid content) as compared to the non-irradiated
controls at the end of intended storage period.

277
The use of radiation processing in combination with cling wrap packaging was
shown to establish aerobic conditions within the package, thus inhibiting the
growth of anaerobic pathogens.
The mathematical approach used for obtaining process parameters was
demonstrated to be useful for commercial production as the processing conditions
can be suitably optimized based on quality characteristics required thereby
reducing severity of treatments.
Gamma irradiation inhibited surface browning in RTC ash gourd during storage.
A decreased quinone formation and enzyme (PAL and PPO) activities and an
increased α-resorcylic acid content, a known PPO inhibitor, as a result of radiation
processing was demonstrated to be responsible for the observed inhibition in
browning.
The nature and contents of free and glycosidically bound aroma compounds was
investigated in all the three vegetables. Acetoin, octanal and nonanal in ash gourd;
benzothiazole, decanal and 2E-decenal in drumstick and a combination of 6Z-
nonenal and 2E, 6Z-nonadienal in case of pumpkin were identified as the key
odorants by employing GC-O technique.
The effect of radiation processing and storage on free and bound aroma
constituents was studied using principal component analysis (PCA).
Radiation induced enhancement in the contents of most of the alcohols was
observed in ash gourd and pumpkin. This could be attributed to the radiolytic
breakdown of their corresponding glycosidic precursors. An increase in the

278
content of hexanal and trans-2-hexenal was also observed in radiation processed
drumstick.
Despite the changes in the content of some of the aroma compounds during
storage and radiation processing as noted instrumentally and statistically, these
changes were not sufficient to bring about alteration in the sensory quality. The
radiation processed products developed, had good sensory acceptability at the end
of storage period.
Acetoin glucoside, a major aroma compound in ash gourd, as a plant growth
regulator was demonstrated. Molecular mechanism of this growth promotion was
shown to be due to the upregulation of RanB1 protein (an important regulatory
protein) in tobacco leaf discs treated with acetoin glucoside.
Angiotensin converting enzyme (ACE) inhibitory activity was demonstrated in
ash gourd juice. The compound responsible for the activity was found to be a
small peptide (323 Da), comprising of alanine and valine. The ACE inhibition
activity of the vegetable juice remained unaffected in response to radiation
treatment.
Radiation processing did not cause any significant changes in the content of
cucurbitacin C & cucurbitacin E glucoside, the major triterpenes of pumpkin.
Presence of isopropyl glucosinolate, 2-butyl glucosinolate and isobutyl
glucosinolate in Moringa oleifera was shown for the first time. Radiation induced
enhancement in the contents of these compounds at the end of storage (12 d) was
demonstrated.

279
No significant effect of radiation treatment was observed on the major phenolic
constituents identified in the selected vegetables.
Radiation processing was found to be amenable for extending the shelf life of
RTC products of ash gourd, drumstick and pumpkin without any adverse effect on
the bioactive principles.
To the best of our knowledge, this study demonstrates for the first time the effect
of radiation processing on shelf life improvement and various phyto-chemical
aspects of RTC ash gourd, drumstick and pumpkin.

280
REFERENCES
1. WHO, J., & Consultation, F. E. (1990). Diet, nutrition and the prevention of chronic
diseases. Geneva: World Health Organization.
2. American Institute for Cancer Research, & World Cancer Research Fund International.
(1997). Food, nutrition and the prevention of cancer: a global perspective. American
Institute for Cancer Research.
3. Steinmetz, K. A., & Potter, J. D. (1996). Vegetables, fruit, and cancer prevention: a
review. Journal of the American Dietetic Association, 96(10), 1027-1039.
4. Block, G., Patterson, B., & Subar, A. (1992). Fruit, vegetables, and cancer prevention: a
review of the epidemiological evidence. Nutrition and cancer, 18(1), 1-29.
5. Craig, W. J. (1997). Phytochemicals: guardians of our health. Journal of the American
Dietetic Association, 97(10), S199-S204.
6. Visioli, F., & Galli, C. (1998). Olive oil phenols and their potential effects on human
health. Journal of Agricultural and Food Chemistry, 46(10), 4292-4296.
7. Raegert, P., Verbeke, W., Devlieghere, F., & Debevere, J. (2004). Consumer perception
of minimally processed vegetables and packaged fruits. Food Quality and Preference,
15(3), 259–270.
8. Jongen, W. (Ed.). (2002). Fruit and vegetable processing: improving quality. Elsevier.
9. Garcia, E., & Barrett, D. M. (2002). Preservative treatments for fresh-cut fruits and
vegetables. CRC Press: Boca Raton, FL. (pp. 267-304).

281
10. King, A. D., & Bolin, H. R. (1989). Physiological and microbiological storage stability of
minimally processed fruits and vegetables. Food Technology, 43(2), 132-135.
11. Willocx, F., Hendrickx, M., & Tobback, P. (1994). The influence of temperature and gas
composition on the evolution of microbial and visual quality of minimally processed
endive. Minimal Processing of Foods and Process Optimization: An Interface, CRC Press
Boca Raton, USA, 475-492.
12. Fan, X., & Sokorai, K. J. B. (2008). Retention of quality and nutritional value of 13
fresh‐cut vegetables treated with low‐dose radiation. Journal of Food Science, 73(7),
S367-S372.
13. Nguyen‐the, C., & Carlin, F. (1994). The microbiology of minimally processed fresh
fruits and vegetables. Critical Reviews in Food Science & Nutrition, 34(4), 371-401.
14. Cliffe-Byrnes, V., & O’Beirne, D. (2005). Effects of chlorine treatment and packaging on
the quality and shelf-life of modified atmosphere (MA) packaged coleslaw mix. Food
Control, 16(8), 707-716.
15. Tournas, V. H. (2005). Moulds and yeasts in fresh and minimally processed vegetables,
and sprouts. International Journal of Food Microbiology, 99(1), 71-77.
16. Toivonen, P. M. (1997). Non-ethylene, non-respiratory volatiles in harvested fruits and
vegetables: their occurrence, biological activity and control. Postharvest Biology and
Technology, 12(2), 109-125.
17. Ragaert, P., Devlieghere, F., Devuyst, E., Dewulf, J., Van Langenhove, H., & Debevere,
J. (2006). Volatile metabolite production of spoilage micro-organisms on a mixed-lettuce

282
agar during storage at 7 °C in air and low oxygen atmosphere. International Journal of
Food Microbiology, 112(2), 162-170.
18. Mitcham, B., Cantwell, M., & Kader, A. (1996). Methods for determining quality of fresh
commodities. Perishables handling newsletter, 85, 1-5.
19. Emmambux, N. M., & Minnaar, A. (2003). The effect of edible coatings and polymeric
packaging films on the quality of minimally processed carrots. Journal of the Science of
Food and Agriculture, 83(10), 1065-1071.
20. Shewfelt, R. L. (2003). Color. Food Science and Technology-New York-Marcel Dekker,
287-296.
21. Shewfelt, R. L. (1993). Measuring quality and maturity. Postharvest handling: a systems
approach, 99-124.
22. Tomás‐Barberán, F. A., & Espin, J. C. (2001). Phenolic compounds and related
enzymes as determinants of quality in fruits and vegetables. Journal of the Science of
Food and Agriculture, 81(9), 853-876.
23. Kader, A. A., & Saltveit, M. E. (2003). Atmosphere modification. Postharvest physiology
and pathology of vegetables, CRC Press: Boca Raton, FL, 229-246.
24. López-Gálvez, G., Saltveit, M., & Cantwell, M. (1996). Wound-induced phenylalanine
ammonia lyase activity: factors affecting its induction and correlation with the quality of
minimally processed lettuces. Postharvest Biology and Technology, 9(2), 223-233.
25. Cantos, E., Tudela, J. A., Gil, M. I., & Espín, J. C. (2002). Phenolic compounds and
related enzymes are not rate-limiting in browning development of fresh-cut potatoes.
Journal of Agricultural and Food Chemistry, 50(10), 3015-3023.

283
26. Gong, Y., & Mattheis, J. P. (2003). Effect of ethylene and 1-methylcyclopropene on
chlorophyll catabolism of broccoli florets. Plant Growth Regulation, 40(1), 33-38.
27. Murata, M., Tanaka, E., Minoura, E., & Homma, S. (2004). Quality of cut lettuce treated
by heat shock: prevention of enzymatic browning, repression of phenylalanine ammonia-
lyase activity, and improvement on sensory evaluation during storage. Bioscience,
Biotechnology, and Biochemistry, 68(3), 501-507.
28. Bourne, M. C. (1982). Food texture and viscosity, 1st edition. Academic press, New York.
29. Siddiqui, M. W., Chakraborty, I., Ayala-Zavala, J. F., & Dhua, R. S. (2011). Advances in
minimal processing of fruits and vegetables: a review. Journal of Scientific & Industrial
Research, 70, 823-834.
30. Harker, F. R., Gunson, F. A., & Jaeger, S. R. (2003). The case for fruit quality: an
interpretive review of consumer attitudes, and preferences for apples. Postharvest Biology
and Technology, 28(3), 333-347.
31. McLaughlin, S., & Margolskee, R. F. (1994). The sense of taste. American Scientist,
538-545.
32. Dinehart, M. E., Hayes, J. E., Bartoshuk, L. M., Lanier, S. L., & Duffy, V. B. (2006).
Bitter taste markers explain variability in vegetable sweetness, bitterness, and intake.
Physiology & Behavior, 87(2), 304-313.
33. Wattenberg, L. W. (1978). Inhibition of chemical carcinogenesis. Journal of the National
Cancer Institute, 60(1), 11-18.

284
34. Ju, H. Y., Chong, C., & Bible, B. B. (1982). Influence of boron nutrition on
glucosinolates and reducing sugars of turnip. Canadian Journal of Plant Science, 62(4),
1037-1042.
35. Why do two great tastes sometimes not taste great together?
http://www.scientificamerican.com/article/two-great-tastes-not-great-together. Dr. Tim
Jacob, Cardiff University. May 22, 2009.
36. Merriam-Webster Inc. (2004). Merriam-Webster's collegiate dictionary. Merriam-
Webster.
37. Chandrashekar, J., Hoon, M. A., Ryba, N. J., & Zuker, C. S. (2006). The receptors and
cells for mammalian taste. Nature, 444(7117), 288-294.
38. Bicas, J. L., Molina, G., Dionísio, A. P., Barros, F. F. C., Wagner, R., Maróstica Jr, M. R.,
& Pastore, G. M. (2011). Volatile constituents of exotic fruits from Brazil. Food Research
International, 44(7), 1843-1855.
39. Sarry, J. E., & Günata, Z. (2004). Plant and microbial glycoside hydrolases: volatile
release from glycosidic aroma precursors. Food Chemistry, 87(4), 509-521.
40. Gunata, Z., Bitteur, S., Brillouet, J. M., Bayonove, C., & Cordonnier, R. (1988).
Sequential enzymic hydrolysis of potentially aromatic glycosides from grape.
Carbohydrate Research, 184, 139-149.
41. Haisman, D. R., & Knight, D. J. (1967). The enzymic hydrolysis of amygdalin.
Biochemical Journal, 103, 528-534.
285
42. Ka1t, W. (2002). Health Functional Phytocheinicals of Fruit. Horticultural Reviews, 27,
269.
43. Alothman, M., Bhat, R., & Karim, A. A. (2009). Effects of radiation processing on
phytochemicals and antioxidants in plant produce. Trends in Food Science &
Technology, 20(5), 201-212.
44. Britton, G. (1983). The biochemistry of natural pigments. Cambridge University Press.
45. Chen, B. H., Peng, H. Y., & Chen, H. E. (1995). Changes of carotenoids, color, and
vitamin A contents during processing of carrot juice. Journal of Agricultural and Food
Chemistry, 43(7), 1912-1918.
46. Van den Berg, H., Faulks, R., Granado, H. F., Hirschberg, J., Olmedilla, B., Sandmann,
G., Southon, S., & Stahl, W. (2000). The potential for the improvement of carotenoid
levels in foods and the likely systemic effects. Journal of the Science of Food and
Agriculture, 80(7), 880-912.
47. Krinsky, N. I. (1998). The Antioxidant and Biological Properties of the Carotenoids.
Annuals of the New York Academy of Sciences, 854(1), 443-447.
48. He, Q., & Luo, Y. (2007). Enzymatic browning and its control in fresh-cut produce.
Stewart Postharvest Review, 3(6), 1-7.
49. Cartea, M. E., Francisco, M., Soengas, P., & Velasco, P. (2010). Phenolic compounds in
Brassica vegetables. Molecules, 16(1), 251-280.
50. Karakaya, S. (2004). Bioavailability of phenolic compounds. Critical Reviews in Food
Science and Nutrition, 44(6), 453-464.

286
51. Maga, J. A., & Katz, I. (1978). Simple phenol and phenolic compounds in food flavor.
Critical Reviews in Food Science & Nutrition, 10(4), 323-372.
52. Shahidi, F., Janitha, P. K., & Wanasundara, P. D. (1992). Phenolic antioxidants. Critical
Reviews in Food Science and Nutrition, 32(1), 67-103.
53. Herrmann, K., & Nagel, C. W. (1989). Occurrence and content of hydroxycinnamic and
hydroxybenzoic acid compounds in foods. Critical Reviews in Food Science & Nutrition,
28(4), 315-347.
54. Cartea, M. E., & Velasco, P. (2008). Glucosinolates in Brassica foods: bioavailability in
food and significance for human health. Phytochemistry Reviews, 7(2), 213-229.
55. Vig, A. P., Rampal, G., Thind, T. S., & Arora, S. (2009). Bio-protective effects of
glucosinolates–A review. LWT-Food Science and Technology, 42(10), 1561-1572.
56. Cole, R. A. (1976). Isothiocyanates, nitriles and thiocyanates as products of autolysis of
glucosinolates in Cruciferae. Phytochemistry, 15(5), 759-762.
57. Rask, L., Andreasson, E., Ekbom, B., Eriksson, S., Pontoppidan, B., Meijer, J., 2000.
Myrosinase: gene family evolution and herbivore defense in Brassicaceae. Plant
Molecular Biology, 42, 93-113.
58. Fahey, J. W., Zalcmann, A. T., & Talalay, P. (2001). The chemical diversity and
distribution of glucosinolates and isothiocyanates among plants. Phytochemistry, 56(1),
5-51.
59. Vaughn, S. F. (1999). Glucosinolates as natural pesticides. Biologically Active Natural
Products: Agrochemicals, CRC Press: Boca Raton, FL, 81-94.

287
60. Fahey, J. W., Zhang, Y., & Talalay, P. (1997). Broccoli sprouts: an exceptionally rich
source of inducers of enzymes that protect against chemical carcinogens. Proceedings of
the National Academy of Sciences, 94(19), 10367-10372.
61. Gry, J., Søborg, I., & Andersson, H. C. (2006). Cucurbitacins in plant food. Nordic
Council of Ministers, Kopenhagen, pp. 15-62.
62. Agil, A., Miró, M., Jimenez, J., Aneiros, J., Caracuel, M. D., García-Granados, A., &
Navarro, M. C. (1999). Isolation of ani-hepatotoxic principle form the juice of Ecballium
elaterium. Planta Medica, 65(7), 673-675.
63. Lavie, D., & Glotter, E. (1971). The cucurbitanes, a group of tetracyclic triterpenes. In
Fortschritte der Chemie Organischer Naturstoffe/Progress in the Chemistry of Organic Natural
Products 29 (pp. 307-362). Springer Vienna.
64. Meilgaard, M. C., Civille, G. V., & Carr, B. T. (1999). Sensory evaluation techniques,
CRC press.
65. Stone, H., & Sidell, J. L. (2012). Sensory evaluation practices. Academic press.
66. Dethmers, A. E., Civille, G. V., Eggert, J. M., Erhardt, J. P., Hootman, R., Jehle, K., &
Whitlock, S. (1981). Sensory evaluation guide for testing food and beverage products.
Food Technology, 35(11), 50-59.
67. Moskowitz, H. R., Beckley, J. H., & Resurreccion, A. V. (2012). Sensory and consumer
research in food product design and development. John Wiley & Sons.
68. Dubost, N. J., Shewfelt, R. L., & Eitenmiller, R. R. (2003). Consumer acceptability,
sensory and instrumental analysis of peanut soy spreads. Journal of Food Quality, 26(1),
27-42.

288
69. Shewfelt, R. L., & Bruckner, B. (Eds.). (2000). Fruit and vegetable quality: an integrated
view. CRC Press.
70. Brosnan, T., & Sun, D. W. (2004). Improving quality inspection of food products by
computer vision––a review. Journal of Food Engineering, 61(1), 3-16.
71. Kader, A. A. (Ed.). (2002). Postharvest technology of horticultural crops (Vol. 3311).
UCANR Publications.
72. Gross, J. (1987). Pigments in fruits. London: Academic Press.
73. HunterLab (1996). Hunter lab color scale. Applications note. Insight on Color, 8:94 pp.
74. Barrett, D. M., Garcia, E., & Wayne, J. E. (1998). Textural modification of processing
tomatoes. Critical Reviews in Food Science and Nutrition, 38(3), 173-258.
75. Gunata, Y., Biron, C., Sapis, J., & Bayonove, C. (1989). Vitis: Viticulture and enology
abstracts, Volumes 28-29, 2, 191.
76. Lecas, M., Gunata, Z. Y., Sapis, J. C., & Bayonove, C. L. (1991). Purification and partial
characterization of β-glucosidase from grape. Phytochemistry, 30(2), 451-454.
77. Barrett, D. M., Beaulieu, J. C., & Shewfelt, R. (2010). Color, flavor, texture, and
nutritional quality of fresh-cut fruits and vegetables: desirable levels, instrumental and
sensory measurement, and the effects of processing. Critical Reviews in Food Science
and Nutrition, 50(5), 369-389.
78. Clarke, D. B. (2010). Glucosinolates, structures and analysis in food. Analytical Methods,
2(4), 310-325.
79. Weissinger, W. R., Chantarapanont, W., & Beuchat, L. R. (2000). Survival and growth of
Salmonella baildon in shredded lettuce and diced tomatoes, and effectiveness of

289
chlorinated water as a sanitizer. International Journal of Food Microbiology, 62(1), 123-
131.
80. Lee, S. Y., Costello, M., & Kang, D. H. (2004). Efficacy of chlorine dioxide gas as a
sanitizer of lettuce leaves. Journal of Food Protection, 67(7), 1371-1376.
81. Park, C. M., & Beuchat, L. R. (1999). Evaluation of sanitizers for killing Escherichia coli
O157: H7, Salmonella, and naturally occurring microorganisms on cantaloupes,
honeydew melons, and asparagus. Dairy, food and environmental sanitation: a publication
of the International Association of Milk, Food and Environmental Sanitarians.
82. Saftner, R. A., Bai, J., Abbott, J. A., & Lee, Y. S. (2003). Sanitary dips with calcium
propionate, calcium chloride, or a calcium amino acid chelate maintain quality and shelf
stability of fresh-cut honeydew chunks. Postharvest Biology and Technology, 29(3), 257-
269.
83. Koseki, S., Yoshida, K., Isobe, S., & Itoh, K. (2001). Decontamination of lettuce using
acidic electrolyzed water. Journal of Food Protection, 64(5), 652-658.
84. Niemira, B. A., & Fan, X. (2006). Low-dose irradiation of fresh and fresh-cut produce:
safety, sensory and shelf life. Food Irradiation Research and Technology, 32(5), 45-52.
85. Bhat, R., Sridhar, K. R., & Bhushan, B. (2007). Free radicals in velvet bean seeds
(Mucuna pruriens L. DC.) and their status after gamma-irradiation and conventional
processing. LWT-Food Science and Technology, 40(9), 1570-1577.
86. Arvanitoyannis, I. S., Stratakos, A. C., & Tsarouhas, P. (2009). Irradiation applications in
vegetables and fruits: a review. Critical Reviews in Food Science and Nutrition, 49(5),
427-462.
290
87. Mohacsi-Farkas, C. S., Farkas, J., Andrassy, E., Polyak-Feher, K., Brückner, A., Kisko,
G., & Agoston, R. (2006). Improving the microbiological safety of some fresh pre-cut and
pre-packaged chilled produce by low-dose gamma irradiation. In: Use of irradiation to
ensure the hygienic quality of fresh, pre-cut fruits and vegetables and other minimally
processed food of plant origin, 130.
88. Bibi, N., Khattak, M. K., A. Badshah and Chaudry, M. A. (2006). Radiation treatment of
minimally processed fruits and vegetables for ensuring hygienic quality. In: Use of
Irradiation to Ensure the Hygienic Quality of Fresh, Pre-Cut Fruits and Vegetables and
Other Minimally Processed Food of Plant Origin. Proceedings of a final research
coordination meeting organized by the Joint FAO/IAEA Programme of Nuclear
Techniques in Food and Agriculture and held in Islamabad, Pakistan, 22–30 July 2005.
December 2006, pp. 205–224.
89. Horak, C. I., Adeil Pietranera, M., Malvicini, M., Narvaiz, P., Gonzalez, M. and
Kairiyama, E. 2006.Improvement of hygienic quality of fresh, pre-cut, ready-to-eat
vegetables using gamma irradiation. In: Use of Irradiation to Ensure the Hygienic Quality
of Fresh, Pre-Cut Fruits and Vegetables and Other Minimally Processed Food of Plant
Origin. Proceedings of a final research coordination meeting organized by the Joint
FAO/IAEA Programme of Nuclear Techniques in Food and Agriculture and held in
Islamabad, Pakistan, 22–30 July 2005. December 2006, pp. 23–40.
90. Shurong, L., Meixu, G. and Chuanyao, W. (2006). Use of irradiation to ensure hygienic
quality of fresh pre-cut and blanched vegetables and tofu. In: Use of Irradiation to Ensure
the Hygienic Quality of Fresh, Pre-Cut Fruits and Vegetables and Other Minimally

291
Processed Food of Plant Origin. Proceedings of a final research coordination meeting
organized by the Joint FAO/IAEA Programme of Nuclear Techniques in Food and
Agriculture and held in Islamabad, Pakistan, 22–30 July 2005. December 2006, pp. 87–
105.
91. Tomás‐Barberán, F. A., & Espin, J. C. (2001). Phenolic compounds and related
enzymes as determinants of quality in fruits and vegetables. Journal of the Science of
Food and Agriculture, 81(9), 853-876.
92. Adamo, M., Capitani, D., Mannina, L., Cristinzio, M., Ragni, P., Tata, A., & Coppola, R.
(2004). Truffles decontamination treatment by ionizing radiation. Radiation Physics and
Chemistry, 71(1), 167-170.
93. Harrison, K., & Were, L. M. (2007). Effect of gamma irradiation on total phenolic
content yield and antioxidant capacity of almond skin extracts. Food Chemistry, 102(3),
932-937.
94. Fan, X., Toivonen, P. M., Rajkowski, K. T., & Sokorai, K. J. (2003a). Warm water
treatment in combination with modified atmosphere packaging reduces undesirable
effects of irradiation on the quality of fresh-cut iceberg lettuce. Journal of Agricultural
and Food Chemistry, 51(5), 1231-1236.
95. Fan, X. (2005). Antioxidant capacity of fresh‐cut vegetables exposed to ionizing
radiation. Journal of the Science of Food and Agriculture, 85(6), 995-1000.
96. Sajilata, M. G., & Singhal, R. S. (2006). Effect of irradiation and storage on the
antioxidative activity of cashew nuts. Radiation Physics and Chemistry, 75(2), 297-300.

292
97. Breitfellner, F., Solar, S., & Sontag, G. (2003). Radiation induced chemical changes of
phenolic compounds in strawberries. Radiation Physics and Chemistry, 67(3), 497-499.
98. Marr, K. L., Xia, Y. M., & Bhattarai, N. K. (2007). Allozymic, morphological,
phenological, linguistic, plant use, and nutritional data of Benincasa Hispida
(Cucurbitaceae). Economic botany, 61(1), 44-59.
99. Mazumder, S., Morvan, C., Thakur, S., & Ray, B. (2004). Cell wall polysaccharides from
chalkumra (Benincasa hispida) fruit. Part I. Isolation and characterization of pectins.
Journal of agricultural and food chemistry, 52(11), 3556-3562.
100. Zaini, N. A. M., Anwar, F., Hamid, A. A., & Saari, N. (2011). Kundur [Benincasa
hispida (Thunb.) Cogn.]: A potential source for valuable nutrients and functional foods.
Food Research International, 44(7), 2368-2376.
101. Dong, M. Y., Lumz, Y. Q., Feng, W. M., Xu, J. X., & Xu, W. M. (1995). Study of
Benincasa hispida contents effective for protection of kidney. Jiangsu Journal of
Agricultural Sciences, 1(3), 46-55.
102. Kumar, A., & Vimalavathini, R. (2004). Possible anorectic effect of methanol extract of
Benincasa hispida (Thunb). Cogn, fruit. Indian Journal of Pharmacology, 36(6), 348.
103. Aslokar, L., Kakkar, K. K., & Chakre, O. J. (1992). Supplement to Glossary of Indian
Medicinal Plants with Active Principles. Directorate CSIR, New Delhi, India, 291-293.
104. Maarse, H. (1991). Volatile compounds in food and beverages New York: CRC Press,
pp. 256−257.
105. Sikorski, Z. E. (2006). Chemical and functional properties of food components New
York: CRC Press, pp. 306.

293
106. Wu, C. M., Liou, S. E., Chang, Y. H., & Chiang, W. (1987). Volatile compounds of the
wax gourd (Benincasa hispida, Cong.) and a wax gourd beverage. Journal of Food
Science, 52, 132−134.
107. Sreenivas, K. M., Singhal, R. S., & Lele, S. S. (2011). Chemical pretreatments and
partial dehydration of ash gourd (Benincasa hispida) pieces for preservation of its quality
attributes. LWT-Food Science and Technology, 44(10), 2281-2284.
108. Anwar, F., Latif, S., Ashraf, M., & Gilani, A. H. (2007). Moringa oleifera: a food plant
with multiple medicinal uses. Phytotherapy research, 21(1), 17-25.
109. Makkar, H. P. S., & Becker, K. (1996). Nutrional value and antinutritional components
of whole and ethanol extracted Moringa oleifera leaves. Animal feed science and
technology, 63(1), 211-228.
110. Mughal, M. H., Ali, G., Srivastava, P. S., & Iqbal, M. (1999). Improvement of drumstick
(Moringa pterygosperma Gaertn.)-a unique source of food and medicine through tissue
culture. Hamdard Medicines, 42(1), 37-42.
111. Sastri, B. N. (1962). The wealth of India, vol. 6. Council of Scientific and Industrial
Research, New Delhi, 207.
112. Siddhuraju, P., & Becker, K. (2003). Antioxidant properties of various solvent extracts
of total phenolic constituents from three different agroclimatic origins of drumstick tree
(Moringa oleifera Lam.) leaves. Journal of Agricultural and Food Chemistry, 51(8),
2144-2155.
113. Bennett, R. N., Mellon, F. A., Foidl, N., Pratt, J. H., Dupont, M. S., Perkins, L., &
Kroon, P. A. (2003). Profiling glucosinolates and phenolics in vegetative and
294
reproductive tissues of the multi-purpose trees Moringa oleifera L.(horseradish tree) and
Moringa stenopetala L. Journal of Agricultural and Food Chemistry, 51(12), 3546-3553.
114. Shanker, K., Gupta, M. M., Srivastava, S. K., Bawankule, D. U., Pal, A., & Khanuja, S.
P. (2007). Determination of bioactive nitrile glycoside (s) in drumstick (Moringa oleifera)
by reverse phase HPLC. Food Chemistry, 105(1), 376-382.
115. Prabhu, A., Rajan, A. P., & Santhalia, S. (2011). Comparative analysis of preservation
techniques on Moringa oleifera. International Journal of Agricultural and Food Science,
1(2), 12-22.
116. Jun, H. I., Lee, C. H., Song, G. S., & Kim, Y. S. (2006). Characterization of the pectic
polysaccharides from pumpkin peel. LWT-Food Science and Technology, 39(5), 554-
561.
117. FAOSTAT (2008). FAOSTAT Agricultural data. Available from:
<http://faostat.fao.orgLastAcess03.08.10>
118. Yadav, M., Jain, S., Tomar, R., Prasad, G. B. K. S., & Yadav, H. (2010). Medicinal and
biological potential of pumpkin: an updated review. Nutrition Research Reviews, 23(02),
184-190.
119. Huang, X. E., Hirose, K., Wakai, K., Matsuo, K., Ito, H., Xiang, J., & Tajima, K. (2004).
Comparison of lifestyle risk factors by family history for gastric, breast, lung and
colorectal cancer. Asian Pacific Journal of Cancer Prevention, 5(4), 419-427.
120. Stefanov, S., Hristov, H., Stoeva, D., Denkova, Z., & Nikolova, R. (2012). Process of
storing packaged pumpkin in modified atmosphere. Food and Environment Safety-
Journal of Faculty of Food Engineering, 11(1), 54-59.

295
121. Perretti, G., Troilo, A., Bravi, E., Marconi, O., Galgano, F., & Fantozzi, P. (2013).
Production of a lycopene-enriched fraction from tomato pomace using supercritical
carbon dioxide. The Journal of Supercritical Fluids, 82, 177-182.
122. Gupta, S., Chatterjee, S., Vaishnav, J., Kumar, V., Variyar, P. S., & Sharma, A. (2012).
Hurdle technology for shelf stable minimally processed French beans (Phaseolus
vulgaris): A response surface methodology approach. LWT-Food Science and
Technology, 48(2), 182-189.
123. López-Rubira, V., Conesa, A., Allende, A., & Artés, F. (2005). Shelf life and overall
quality of minimally processed pomegranate arils modified atmosphere packaged and
treated with UV-C. Postharvest Biology and Technology, 37(2), 174-185.
124. Murray, J. M., Delahunty, C. M., & Baxter, I. A. (2001). Descriptive sensory analysis:
past, present and future. Food Research International, 34(6), 461-471.
125. Wen, T. N., Prasad, K. N., Yang, B., & Ismail, A. (2010). Bioactive substance contents
and antioxidant capacity of raw and blanched vegetables. Innovative Food Science &
Emerging Technologies, 11(3), 464-469.
126. Singleton, V. L., & Rossi, J. A. (1965). Colorimetry of total phenolics with
phosphomolybdic-phosphotungstic acid reagents. American Journal of Enology and
Viticulture, 16(3), 144-158.
127. Doner, L. W., Becard, G., & Irwin, P. L. (1993). Binding of flavonoids by
polyvinylpolypyrrolidone. Journal of Agricultural and Food Chemistry, 41(5), 753-757.
128. Helrich, K. C. (1990). Official methods of Analysis of the AOAC. Volume 2 (No. Ed.
15). Association of Official Analytical Chemists Inc.

296
129. Bandyopadhyay, C., & Gholap, A. S. (1973). Changes in fatty acids in ripening mango
pulp (var Alphonso). Journal of Agricultural and Food Chemistry, 21(3), 496-497.
130. Gholap, A. S., & Bandyopadhyay, C. (1977). Characterisation of green aroma of raw
mango (Mangifera indica L.). Journal of the Science of Food and Agriculture, 28(10),
885-888.
131. Sagratini, G., Maggi, F., Caprioli, G., Cristalli, G., Ricciutelli, M., Torregiani, E., &
Vittori, S. (2012). Comparative study of aroma profile and phenolic content of
Montepulciano monovarietal red wines from the Marches and Abruzzo regions of Italy
using HS-SPME–GC–MS and HPLC–MS. Food Chemistry, 132(3), 1592-1599.
132. Nickerson, G. B., & Likens, S. T. (1966). Gas chromatography evidence for the
occurrence of hop oil components in beer. Journal of Chromatography A, 21, 1-5.
133. Ananthakumar, A., Variyar, P. S., & Sharma, A. (2006). Estimation of aroma glycosides
of nutmeg and their changes during radiation processing. Journal of Chromatography A,
1108(2), 252-257.
134. Solís-Solís, H. M., Calderón-Santoyo, M., Schorr-Galindo, S., Luna-Solano, G.,
Ragazzo- Sánchez, J. A. Characterization of aroma potential of apricot varieties using
different extraction techniques. Food Chemistry, 105 (2), 2007, 829-837
135. Le Guen, S., Prost, C., & Demaimay, M. (2000). Critical comparison of three
olfactometric methods for the identification of the most potent odorants in cooked
mussels (Mytilus edulis). Journal of Agricultural and Food Chemistry, 48(4), 1307-1314.

297
136. Van Ruth, S. M., & Roozen, J. P. (1994). Gas chromatography/sniffing port analysis and
sensory evaluation of commercially dried bell peppers (Capsicum annuum) after
rehydration. Food chemistry, 51(2), 165-170.
137. Francis, I.L. & Newton, J.L. (2005). Determining wine aroma from compositional data.
Australian Journal of Grape and Wine Research. 11(2), 114–126.
138. Degl'Innocenti, E., Guidi, L., Pardossi, A., & Tognoni, F. (2005). Biochemical study of
leaf browning in minimally processed leaves of lettuce (Lactuca sativa L. var. Acephala).
Journal of Agricultural and Food Chemistry, 53(26), 9980-9984.
139. Mishra, B. B., Gautam, S., & Sharma, A. (2012). Browning of fresh-cut eggplant: Impact
of cutting and storage. Postharvest Biology and Technology, 67, 44-51.
140. Yiou, P., Shaoli, A., Kebin, L., Tao, W., Kui, F., Hua, Z., & Jinghui, X. (2013).
Evaluation of extraction procedures for 2‐DE analysis of aphid proteins. Journal of
Separation Science, 36(3), 532-539.
141. Fulda, S., Huang, F., Nilsson, F., Hagemann, M., & Norling, B. (2000). Proteomics of
Synechocystis sp. strain PCC 6803. European Journal of Biochemistry, 267(19), 5900-
5907.
142. Onofri, A. (2007, June). Routine statistical analyses of field experiments by using an
Excel extension. In Proceedings 6th National Conference Italian Biometric Society:" La
statistica nelle scienze della vita e dell’ambiente", Pisa (pp. 20-22).
143. Cushman, D. W., & Cheung, H. S. (1971). Spectrophotometric assay and properties of
the angiotensin-converting enzyme of rabbit lung. Biochemical Pharmacology, 20(7),
1637-1648.

298
144. Seo, J. S., Burri, B. J., Quan, Z., & Neidlinger, T. R. (2005). Extraction and
chromatography of carotenoids from pumpkin. Journal of Chromatography A, 1073(1),
371-375.
145. Banerjee, A., Variyar, P. S., Chatterjee, S., & Sharma, A. (2014). Effect of post harvest
radiation processing and storage on the volatile oil composition and glucosinolate profile
of cabbage. Food Chemistry, 151, 22-30.
146. Iborra-Bernad, C., Philippon, D., García-Segovia, P., & Martínez-Monzó, J. (2013).
Optimizing the texture and color of sous-vide and cook-vide green bean pods. LWT-Food
Science and Technology, 51(2), 507-513.
147. Barth, M., Hankinson, T. R., Zhuang, H., & Breidt, F. (2010). Microbiological spoilage
of fruits and vegetables. In Compendium of the Microbiological Spoilage of Foods and
Beverages (pp. 135-183). Springer New York.
148. Oms-Oliu, G., Aguiló-Aguayo, I., Martín-Belloso, O., & Soliva-Fortuny, R. (2010).
Effects of pulsed light treatments on quality and antioxidant properties of fresh-cut
mushrooms (Agaricus bisporus). Postharvest Biology and Technology, 56(3), 216-222.
149. Gilbert, R. J., De Louvois, J., Donovan, T., Little, C., Nye, K., Ribeiro, C. D., & Bolton,
F. J. (2000). Guidelines for the microbiological quality of some ready-to-eat foods
sampled at the point of sale. PHLS Advisory Committee for Food and Dairy Products.
Communicable disease and public health/PHLS, (3), 163-7
150. Diehl, J. F. (1999). Safety of irradiated foods. CRC Press.

299
151. Prakash, A., Inthajak, P., Huibregtse, H., Caporaso, F., & Foley, D. M. (2000a). Effects
of low‐dose gamma irradiation and conventional treatments on shelf life and quality
characteristics of diced celery. Journal of Food Science, 65(6), 1070-1075.
152. Bari, M. L., Nakauma, M., Todoriki S., Juneja V. K., Isshiki, K. and Kawamoto, S.
(2005). Effectiveness of irradiation treatments in inactivating Listeria monocytogenes on
fresh vegetables at refrigeration temperature. Journal of Food Protection, 68(2), 318–323.
153. Saroj, S. D., Shashidhar, R., Pandey, M., Dhokane, V., Hajare, S., Sharma, A., &
Bandekar, J. R. (2006). Effectiveness of radiation processing in elimination of Salmonella
Typhimurium and Listeria monocytogenes from sprouts. Journal of Food Protection,
69(8), 1858-1864.
154. Landgraf, M., Goularte, L., Martins, C., Nunes, T., Aragonalegro, L., Destro, M., &
Hutzler, B. (2006). In: Use of irradiation to improve the microbiological safety of
minimally processed fruits and vegetables. Use of Irradiation to Ensure the Hygienic
Quality of Fresh, Pre-Cut Fruits and Vegetables and Other Minimally Processed Food of
Plant Origin, 41.
155. Ke, D., & Saltveit, M. E. (1989). Wound‐induced ethylene production, phenolic
metabolism and susceptibility to russet spotting in iceberg lettuce. Physiologia Plantarum,
76(3), 412-418.
156. Fan, X., Niemira, B. A., & Sokorai, K. J. B. (2003b). Sensorial, nutritional and
microbiological quality of fresh cilantro leaves as influenced by ionizing radiation and
storage. Food Research International, 36(7), 713-719.

300
157. Sapers, G. M., Douglas, F. W., Bilyk, A., HSU, A. F., Dower, H. W., Garzarella, L., &
Kozempel, M. (1989). Enzymatic browning in Atlantic potatoes and related cultivars.
Journal of Food Science, 54(2), 362-365.
158. Mahrouz, M., Lacroix, M., D'Aprano, G., Oufedjikh, H., Boubekri, C., & Gagnon, M.
(2002). Effect of γ-irradiation combined with washing and waxing treatment on
physicochemical properties, vitamin C, and organoleptic quality of Citrus clementina
Hort. Ex. Tanaka. Journal of Agricultural and Food Chemistry, 50(25), 7271-7276.
159. Bourne, M. (2002). Food texture and viscosity: concept and measurement. Academic
press.
160. Prakash, A., Guner, A. R., Caporaso, F., & Foley, D. M. (2000b). Effects of low‐dose
gamma irradiation on the shelf life and quality characteristics of cut Romaine Lettuce
packaged under modified atmosphere. Journal of Food Science, 65(3), 549-553.
161. Rico, D., Martin-Diana, A. B., Barat, J. M., & Barry-Ryan, C. (2007). Extending and
measuring the quality of fresh-cut fruit and vegetables: a review. Trends in Food Science
& Technology, 18(7), 373-386.
162. Lafortune, R., Caillet, S., & Lacroix, M. (2005). Combined effects of coating, modified
atmosphere packaging, and gamma irradiation on quality maintenance of ready-to-use
carrots (Daucus carota). Journal of Food Protection, 68(2), 353-359.
163. Lindley, M. G. (1998). The impact of food processing on antioxidants in vegetable oils,
fruits and vegetables. Trends in food science & technology, 9(8), 336-340.
164. Klein, B. P. (1987). Nutritional consequences of minimal processing of fruits and
vegetables. Journal of Food Quality, 10(3), 179-193.

301
165. Azizah, A. H., Wee, K. C., Azizah, O., & Azizah, M. (2009). Effect of boiling and stir
frying on total phenolics, carotenoids and radical scavenging activity of pumpkin
(Cucurbita moschato). International Food Research Journal, 16(1), 45-51.
166. Gil, M. I., Ferreres, F., & Tomás-Barberán, F. A. (1999). Effect of postharvest storage
and processing on the antioxidant constituents (flavonoids and vitamin C) of fresh-cut
spinach. Journal of Agricultural and Food Chemistry, 47(6), 2213-2217.
167. Piga, A., Agabbio, M., Gambella, F., & Nicoli, M. C. (2002). Retention of antioxidant
activity in minimally processed mandarin and satsuma fruits. LWT-Food Science and
Technology, 35(4), 344-347.
168. Kang, H. M., & Saltveit, M. E. (2002). Antioxidant capacity of lettuce leaf tissue
increases after wounding. Journal of Agricultural and Food Chemistry, 50(26), 7536-
7541.
169. De Toledo, T. C. F., Canniatti-Brazaca, S. G., Arthur, V., & Piedade, S. M. S. (2007).
Effects of gamma radiation on total phenolics, trypsin and tannin inhibitors in soybean
grains. Radiation Physics and Chemistry, 76(10), 1653-1656.
170. Costa, L., Vicente, A. R., Civello, P. M., Chaves, A. R., & Martínez, G. A. (2006). UV-
C treatment delays postharvest senescence in broccoli florets. Postharvest Biology and
Technology, 39(2), 204-210.
171. Del Caro, A., Piga, A., Vacca, V., & Agabbio, M. (2004). Changes of flavonoids,
vitamin C and antioxidant capacity in minimally processed citrus segments and juices
during storage. Food Chemistry, 84(1), 99-105

302
172. Kortei, N. K., Odamtten, G. T., Obodai, M., Appiah, V., Akuamoa, F., Adu-Bobi, A. K.,
& Acquah, S. A. (2014). Evaluating the effect of gamma radiation on the total phenolic
content, flavonoids, and antioxidant activity of dried Pleurotus ostreatus ((Jacq. ex. Fr)
Kummer) Stored in Packaging Materials. Advances in Pharmaceutics, 1-8.
173. Peiser, G., López-Gálvez, G., Cantwell, M., & Saltveit, M. E. (1998). Phenylalanine
ammonia lyase inhibitors control browning of cut lettuce. Postharvest Biology and
Technology, 14(2), 171-177.
174. Rolle, R. S., & Chism, G. W. (1987). Physiological consequences of minimally
processed fruits and vegetables. Journal of Food Quality, 10(3), 157-177.
175. Hajare, S. N., Saxena, S., Kumar, S., Wadhawan, S., More, V., Mishra, B. B., & Sharma,
A. (2010). Quality profile of litchi (Litchi chinensis) cultivars from India and effect of
radiation processing. Radiation Physics and Chemistry, 79(9), 994-1004.
176. Pandey, S., Jha, A., & Rai, M. (2008, March). Screening of advance breeding
lines/cultivars for shelf-life and biochemical changes during storage of ash gourd
(Benincasa hispida). In International Symposium on Underutilized Plants for Food
Security, Nutrition, Income and Sustainable Development 806 (pp. 249-256).
177. Lee, S. K., & Kader, A. A. (2000). Preharvest and postharvest factors influencing
vitamin C content of horticultural crops. Postharvest Biology and Technology, 20(3),
207-220.
178. Amaro, A. L., Beaulieu, J. C., Grimm, C. C., Stein, R. E., & Almeida, D. P. (2012).
Effect of oxygen on aroma volatiles and quality of fresh-cut cantaloupe and honeydew
melons. Food Chemistry, 130(1), 49-57.

303
179. Benoit, M. A., D'Aprano, G., & Lacroix, M. (2000). Effect of γ-irradiation on
phenylalanine ammonia-lyase activity, total phenolic content, and respiration of
mushrooms (Agaricus bisporus). Journal of Agricultural and Food Chemistry, 48(12),
6312-6316.
180. Sanchez-Mata, M. C., Camara, M., & Dıez-Marques, C. (2003). Extending shelf-life and
nutritive value of green beans (Phaseolus vulgaris L.), by controlled atmosphere storage:
macronutrients. Food Chemistry, 80(3), 309-315.
181. Barra, A., Baldovini, N., Loiseau, A. M., Albino, L., Lesecq, C., & Cuvelier, L. L.
(2007). Chemical analysis of French beans (Phaseolus vulgaris L.) by headspace solid
phase microextraction (HS-SPME) and simultaneous distillation/extraction (SDE). Food
Chemistry, 101(3), 1279-1284.
182. Bicas, J. L., Molina, G., Dionísio, A. P., Barros, F. F. C., Wagner, R., Maróstica, M. R.,
& Pastore, G. M. (2011). Volatile constituents of exotic fruits from Brazil. Food Research
International, 44(7), 1843-1855.
183. Winterhalter, P., & Skouroumounis, G. K. (1997). Glycoconjugated aroma compounds:
occurrence, role and biotechnological transformation. In Biotechnology of aroma
compounds (pp. 73-105). Springer Berlin Heidelberg
184. Parliment, T. H., Kolor, M. G., Rizzo, D. J., & Herzing-Giordano, D. (1981). Volatile
constituents of pumpkins [Food composition, carbon compounds]. In ACS symposium
series-American Chemical Society (USA)
185. Bandyopadhyay, C., & Variyar, P. S. (1988). On the volatiles of pepper plant (Piper
nigrum L.). PAFAI Journal, 10(1), 25-27.

304
186. Van Ruth, S. M., Roozen, J. P., Cozijnsen, J. L., & Posthumus, M. A. (1995). Volatile
compounds of rehydrated French beans, bell peppers and leeks. Part II. Gas
chromatography/sniffing port analysis and sensory evaluation. Food Chemistry, 54(1), 1-
7.
187. Idstein, H., & Schreier, P. (1985). Volatile constituents from guava (Psidium guajava,
L.) fruit. Journal of Agricultural and Food Chemistry, 33(1), 138-143.
188. Lumen, B. O., Stone, E. J., Kazeniac, S. J., & Forsythe, R. H. (1978). Formation of
volatile flavor compounds in green beans from linoleic and linolenic acids. Journal of
Food Science, 43(3), 698-702.
189. Dziadas, M., Nowacka, M., Jesionowski, T., & Jeleń, H. H. (2011). Comparison of silica
gel modified with three different functional groups with C-18 and styrene–divinylbenzene
adsorbents for the analysis of selected volatile flavor compounds. Analytica Chimica
Acta, 699(1), 66-72.
190. Loscos, N., Hernández-Orte, P., Cacho, J., & Ferreira, V. (2009). Comparison of the
suitability of different hydrolytic strategies to predict aroma potential of different grape
varieties. Journal of Agricultural and Food Chemistry, 57(6), 2468-2480.
191. Chyau, C. C., Ko, P. T., Chang, C. H., & Mau, J. L. (2003). Free and glycosidically
bound aroma compounds in lychee (Litchi chinensis Sonn.). Food chemistry, 80(3), 387-
392.
192. Rodríguez-Bencomo, J. J., Cabrera-Valido, H. M., Pérez-Trujillo, J. P., & Cacho, J.
(2011). Bound aroma compounds of Gual and Listán blanco grape varieties and their
influence in the elaborated wines. Food Chemistry, 127(3), 1153-1162.

305
193. Acree, T. E., Barnard, J., & Cunningham, D. G. (1984). A procedure for the sensory
analysis of gas chromatographic effluents. Food Chemistry, 14(4), 273-286.
194. Ott, A., Fay, L. B., & Chaintreau, A. (1997). Determination and origin of the aroma
impact compounds of yogurt flavor. Journal of Agricultural and Food Chemistry, 45(3),
850-858.
195. Dev, S. R. S., Geetha, P., Orsat, V., Gariépy, Y., & Raghavan, G. S. V. (2011). Effects
of microwave-assisted hot air drying and conventional hot air drying on the drying
kinetics, color, rehydration, and volatiles of Moringa oleifera. Drying Technology,
29(12), 1452-1458
196. Dresow, J. F., & Böhm, H. (2009). The influence of volatile compounds of the flavour of
raw, boiled and baked potatoes: Impact of agricultural measures on the volatile
components. Landbauforschung vTI Agriculture and Forestry Research, 4(59), 309-338.
197. Baldwin, E. A. (2002). Fruit flavor, volatile metabolism and consumer perceptions. Fruit
Quality and its Biological Basis. CRC Press, Boca Raton, FL, 89-106.
198. Beaulieu, J. C., & Baldwin, E. A. (2002). Flavor and Aroma of Fresh-cut Fruits and
Vegetables. Fresh-Cut Fruits and Vegetables: Science, Technology, and Market, 391.
199. Cañoles, M. A., Beaudry, R. M., Li, C., & Howe, G. (2006). Deficiency of linolenic acid
in Lefad7 mutant tomato changes the volatile profile and sensory perception of disrupted
leaf and fruit tissue. Journal of the American Society for Horticultural Science, 131(2),
284-289.

306
200. Tressl, R., & Rewicki, D. (1999). Heat generated flavours and precursors. In R.
Teranishi, E. L. Wick, & I. Horstein (Eds.), Flavour Chemistry: 30 years of progress (pp.
305–325). New York: Kluwer Academic/Plenum Publishers.
201. Luebke, W. (2012). (Z)-6-nonen-1-al 2277-19-2.
http://www.thegoodscentscompany.com/data/rw1031552.
202. Maarse, H. (1991). Volatile compounds in foods and beverages (Vol. 44). CRC Press
203. Grosch, W. (1987). Reactions of hydroperoxidessProducts of low molecular weight. In
Autoxidation of Unsaturated Fatty Lipids; Chan, H. W., Ed.; Academic Press: London,
U.K., 1987.
204. Baek, H. H., Cadwallader, K. R., Marroquin, E., & Silva, J. L. (1997). Identification of
predominant aroma compounds in muscadine grape juice. Journal of food science, 62(2),
249-252.
205. Serot, T., Prost, C., Visan, L., & Burcea, M. (2001). Identification of the main odor-
active compounds in musts from French and Romanian hybrids by three olfactometric
methods. Journal of Agricultural and Food Chemistry, 49(4), 1909-1914.
206. Yang, G. C., Mossoba, M. M., Merin, U., & Rosenthal, I. (1987). An epr study of free
radicals generated by gamma‐ radiation of dried spices and spray‐ dried fruit powders.
Journal of Food Quality, 10(4), 287-294.
207. Zareena, A. V., Variyar, P. S., Gholap, A. S., & Bongirwar, D. R. (2001). Chemical
investigation of gamma-irradiated saffron (Crocus sativus L.). Journal of Agricultural and
Food Chemistry, 49(2), 687-691.

307
208. Chatterjee, S., Adhikari, S., Gupta, S., Variyar, P. S., & Sharma, A. (2009). Estimation
of aroma precursors in radiation processed fenugreek. Food Chemistry, 115(3), 1102-
1107. 163
209. Chatterjee, S., Variyar, P. S., & Sharma, A. (2012). Post-irradiation identification of
papaya (Carica papaya L.) fruit. Radiation Physics and Chemistry, 81(3), 352-353.
210. Eriksson, L., Johansson, E., Kettaneh-Wold, N., Wold, S., 2001. Multi- and megavariate
data analysis, Principles and applications. Umetrics Academy, Sweden.
211. Fan, X., & Mattheis, J. P. (2001). 1-Methylcyclopropene and storage temperature
influence responses of ‘Gala’apple fruit to gamma irradiation. Postharvest Biology and
Technology, 23(2), 143-151.
212. Variyar, P. S., Ahmad, R., Bhat, R., Niyas, Z., & Sharma, A. (2003). Flavoring
components of raw monsooned arabica coffee and their changes during radiation
processing. Journal of Agricultural and Food Chemistry, 51(27), 7945-7950.
213. Hatanaka, A. (1996). The fresh green odor emitted by plants. Food Reviews
International, 12(3), 303-350.
214. Byun, M. W., Kang, I. J., Kwon, J. H., Hayashi, Y., & Mori, T. (1995). Physicochemical
properties of soybean oil extracted from γ-irradiated soybeans. Radiation Physics and
Chemistry, 46(4), 659-662. 91.
215. Fan, X., & Sokorai, K. J. (2002). Changes in volatile compounds of γ-irradiated fresh
cilantro leaves during cold storage. Journal of Agricultural and Food Chemistry, 50(26),
7622-7626.

308
216. Fan, X., & Gates, R. A. (2001). Degradation of monoterpenes in orange juice by gamma
radiation. Journal of Agricultural and Food Chemistry, 49(5), 2422-2426
217. Variyar, P. S. (1998). Effect of gamma‐ irradiation on the phenolic acids of some Indian
spices. International Journal of Food Science & Technology, 33(6), 533-537.
218. Kumar, K. K., AnanthaKumar, A. A., Ahmad, R., Adhikari, S., Variyar, P. S., &
Sharma, A. (2010). Effect of gamma-radiation on major aroma compounds and vanillin
glucoside of cured vanilla beans (Vanilla planifolia). Food Chemistry, 122(3), 841-845.
219. He, Q., & Luo, Y. (2007). Enzymatic browning and its control in fresh-cut produce.
Stewart Postharvest Review, 3(6), 1-7.
220. Couture, R., Cantwell, M. I., Ke, D., & Saltveit, M. E. (1993). Physiological attributes
related to quality attributes and storage life of minimally processed lettuce. HortScience,
28(7), 723-725.
221. Hisaminato, H., Murata, M., & Homma, S. (2001). Relationship between the enzymatic
browning and phenylalanine ammonia-lyase activity of cut lettuce, and the prevention of
browning by inhibitors of polyphenol biosynthesis. Bioscience, Biotechnology, and
Biochemistry, 65(5), 1016-1021.
222. Martínez, S., Olmos, I., Carballo, J., & Franco, I. (2010). Quality parameters of Brassica
spp. grown in northwest Spain. International Journal of Food Science & Technology,
45(4), 776-783.
223. Xiong, Q. L., Xing, Z. T., Feng, Z., Tan, Q., & Bian, Y. B. (2009). Effect of 60 Co γ-
irradiation on postharvest quality and selected enzyme activities of Pleurotus
nebrodensis. LWT-Food Science and Technology, 42(1), 157-161.

309
224. Duan, Z., Xing, Z., Shao, Y., & Zhao, X. (2010). Effect of electron beam irradiation on
postharvest quality and selected enzyme activities of the white button mushroom,
Agaricus bisporus. Journal of Agricultural and Food Chemistry, 58(17), 9617-9621.
225. Harbaum-Piaydaa, B., Waltera, B., Bengtssonb, G.B., Hubbermanna, E.M., Bilger, W.,
& Schwarza, K. (2010). Influence of pre-harvest UV-B irradiation and normal or
controlled atmosphere storage on flavonoid and hydroxycinnamic acid contents of pak
choi (Brassica campestris L. ssp. chinensis var. communis). Postharvest Biology and
Technology, 56(3), 202–208.
226. Billaud, C., Lecornu, D., & Nicolas, J. (1996). Substrates and carboxylic acid inhibitors
of a partially purified polyphenol oxidase from gum Arabic. Journal of agricultural and
food chemistry, 44(7), 1668-1675.
227. Lee, C. Y., Kagan, V., Jaworski, A. W., & Brown, S. K. (1990). Enzymic browning in
relation to phenolic compounds and polyphenoloxidase activity among various peach
cultivars. Journal of Agricultural and Food Chemistry, 38(1), 99-101
228. Janovitz-Klapp, A. H., Richard, F. C., Goupy, P. M., & Nicolas, J. J. (1990). Inhibition
studies on apple polyphenol oxidase. Journal of Agricultural and Food Chemistry, 38(4),
926-931.
229. Kermasha, S., Goetghebeur, M., Monfette, A., Metche, M., & Rovel, B. (1993). Studies
on inhibition of mushroom polyphenol oxidase using chlorogenic acid as substrate.
Journal of Agricultural and Food Chemistry, 41(4), 526-531.

310
230. Farag, M. A., Ryu, C. M., Sumner, L. W., & Paré, P. W. (2006). GC–MS SPME
profiling of rhizobacterial volatiles reveals prospective inducers of growth promotion and
induced systemic resistance in plants. Phytochemistry, 67(20), 2262-2268;
231. Ryu, C. M., Farag, M. A., Hu, C. H., Reddy, M. S., Wei, H. X., Paré, P. W., & Kloepper,
J. W. (2003). Bacterial volatiles promote growth in Arabidopsis. Proceedings of the
National Academy of Sciences, 100(8), 4927-4932;
232. Ping, L., & Boland, W. (2004). Signals from the underground: bacterial volatiles
promote growth in Arabidopsis. Trends in plant science, 9(6), 263-266.
233. Takai, Y., Sasaki, T., & Matozaki, T. (2001). Small GTP-binding proteins. Physiological
reviews, 81(1), 153-208.
234. Schwartz, S. L., Cao, C., Pylypenko, O., Rak, A., & Wandinger-Ness, A. (2007). Rab
GTPases at a glance. Journal of Cell Science, 120(22), 3905-3910
235. Bischoff, F. R., Klebe, C., Kretschmer, J., Wittinghofer, A., & Ponstingl, H. (1994).
RanGAP1 induces GTPase activity of nuclear Ras-related Ran. Proceedings of the
National Academy of Sciences, 91(7), 2587-2591.
236. Lee, Y., Roux, S. J., & Kim, S. H. (2007). Biochemical characterization of a family of
proteins that stabilizes a plant Ran protein in its GTP-bound conformation. Plant
Physiology and Biochemistry, 45(6), 515-520
237. Sazer, S., & Dasso, M. (2000). The ran decathlon: multiple roles of Ran. Journal of Cell
Science, 113(7), 1111-1118.

311
238. Wang, X., Xu, Y., Han, Y., Bao, S., Du, J., Yuan, M., Xu, Z. & Chong, K. (2006).
Overexpression of RAN1 in rice and Arabidopsis alters primordial meristem, mitotic
progress, and sensitivity to auxin. Plant Physiology, 140(1), 91-101
239. Gohlke, P., Linz, W., Schölkens, B. A., Kuwer, I., Bartenbach, S., Schnell, A., & Unger,
T. (1994). Angiotensin-converting enzyme inhibition improves cardiac function. Role of
bradykinin. Hypertension, 23(4), 411-418
240. Li, C. H., Matsui, T., Matsumoto, K., Yamasaki, R., & Kawasaki, T. (2002). Latent
production of angiotensin I‐converting enzyme inhibitors from buckwheat protein.
Journal of Peptide Science, 8(6), 267-274.
241. Pedroche, J., Yust, M. M., Girón‐Calle, J., Alaiz, M., Millán, F., & Vioque, J. (2002).
Utilisation of chickpea protein isolates for production of peptides with angiotensin
I‐converting enzyme (ACE)‐inhibitory activity. Journal of the Science of Food and
Agriculture, 82(9), 960-965
242. Lee, D. H., Kim, J. H., Park, J. S., Choi, Y. J., & Lee, J. S. (2004). Isolation and
characterization of a novel angiotensin I-converting enzyme inhibitory peptide derived
from the edible mushroom Tricholoma giganteum. Peptides, 25(4), 621-627.
243. Huang, H. Y., Huang, J. J., Tso, T. K., Tsai, Y. C., & Chang, C. K. (2004). Antioxidant
and angiotension‐converting enzyme inhibition capacities of various parts of Benincasa
hispida (wax gourd). Food/Nahrung, 48(3), 230-233.
244. Murray, B. A., & FitzGerald, R. J. (2007). Angiotensin converting enzyme inhibitory
peptides derived from food proteins: biochemistry, bioactivity and production. Current
Pharmaceutical Design, 13(8), 773-791.

312
245. Lee, J. E., Bae, I. Y., Lee, H. G., & Yang, C. B. (2006). Tyr-Pro-Lys, an angiotensin I-
converting enzyme inhibitory peptide derived from broccoli (Brassica oleracea Italica).
Food chemistry, 99(1), 143-148.
246. Cheung, H. S., Wang, F. L., Ondetti, M. A., Sabo, E. F., & Cushman, D. W. (1980).
Binding of peptide substrates and inhibitors of angiotensin-converting enzyme.
Importance of the COOH-terminal dipeptide sequence. Journal of Biological Chemistry,
255(2), 401-407.
247. Caili, F. U., Huan, S., & Quanhong, L. I. (2006). A review on pharmacological activities
and utilization technologies of pumpkin. Plant Foods for Human Nutrition, 61(2), 70-77.
248. Wang, D. C., Xiang, H., Li, D., Gao, H. Y., Cai, H., Wu, L. J., & Deng, X. M. (2008).
Purine-containing cucurbitane triterpenoids from Cucurbita pepo cv dayangua.
Phytochemistry, 69(6), 1434-1438.
249. Shan, G. E. (2006). 1, Wang Da-cheng, Xiang Hua, Zhu Wan-ju, Deng Xu-ming, Wu Li-
jun; Triterpenes from the fruits of Cucurbita pepo cv. Dayangua [J]. Journal of Shenyang
Pharmaceutical University.
250. Wang, D. C., Pan, H. Y., Deng, X. M., Xiang, H., Gao, H. Y., Cai, H., & Wu, L. J.
(2007). Cucurbitane and hexanocucurbitane glycosides from thr fruits of Cucurbita pepo
cv dayangua. Journal of Asian Natural Products Research, 9(6), 525-529.
251. Sharma, G. C., & Hall, C. V. (1973). Identifying cucurbitacin in cotyledons of Cucurbita
pepo L. cv. black zucchini. Hortscience, 8, 136-137.

313
252. Kamel, A. M., & EL-Gengaihi, S. E. (2008). Secondary and primary plant metabolites as
chemical markers for resistance of Bitter Candytuft (Iberis amara) Plant against Insect
Attack. Notulae Botanicae Horti Agrobotanici Cluj-Napoca, 36(2), 80-87
253. Rice, C. A., Rymal, K. S., Chambliss, O. L., & Johnson, F. A. (1981). Chromatographic
and mass spectral analysis of cucurbitacins of three Cucumis sativus cultivars. Journal of
Agricultural and Food Chemistry, 29(1), 194-196.
254. Matsuo, K., DeMilo, A. B., Schroder, R. F., & Martin, P. A. (1999). Rapid high-
performance liquid chromatography method to quantitate elaterinide in juice and
reconstituted residues from a bitter mutant of Hawkesbury watermelon. Journal of
Agricultural and Food Chemistry, 47(7), 2755-2759.
255. Rehm, S., & Wessels, J. H. (1957). Bitter principles of the cucurbitaceae. VIII.—
cucurbitacins in seedlings—occurrence, biochemistry and genetical aspects. Journal of
the Science of Food and Agriculture, 8(12), 687-691.
256. Lin, C. M., Kim, J., Du, W. X., & Wei, C. I. (2000). Bactericidal activity of isothiocyanate
against pathogens on fresh produce. Journal of Food Protection, 63(1), 25-30.
257. Wittstock, U., Kliebenstein, D. J., Lambrix, V., Reichelt, M., & Gershenzon, J. (2003).
Chapter five glucosinolate hydrolysis and its impact on generalist and specialist insect
herbivores. Recent Advances in Phytochemistry, 37, 101-125.
258. Song, L., & Thornalley, P. J. (2007). Effect of storage, processing and cooking on glucosinolate
content of Brassica vegetables. Food and Chemical Toxicology, 45(2), 216-224.
259. Vaughn, S. F., & Berhow, M. A. (2005). Glucosinolate hydrolysis products from various
plant sources: pH effects, isolation, and purification. Industrial Crops and Products, 21(2),
193-202.

314
260. Neto, C. C., Amoroso, J. W., & Liberty, A. M. (2008). Anticancer activities of cranberry
phytochemicals: an update. Molecular Nutrition & Food Research, 52(S1), S18-S27.
261. Raghu, K. L., Ramesh, C. K., Srinivasa, T. R., & Jamuna, K. S. (2010). DPPH
scavenging and reducing power properties in common vegetables. Research Journal of
Pharmaceutical, Biological and Chemical Sciences, 1(4), 399-406.
262. Amaglo, N. K., Bennett, R. N., Curto, R. B. L., Rosa, E. A., Turco, V. L., Giuffrida, A.,
& Timpo, G. M. (2010). Profiling selected phytochemicals and nutrients in different
tissues of the multipurpose tree Moringa oleifera L., grown in Ghana. Food Chemistry,
122(4), 1047-1054.
263. Singh, R. G., Negi, P. S., & Radha, C. (2013). Phenolic composition, antioxidant and
antimicrobial activities of free and bound phenolic extracts of Moringa oleifera seed
flour. Journal of Functional Foods, 5(4), 1883-1891.
264. Dragovic-Uzelac, V., Delonga, K., Levaj, B., Djakovic, S., & Pospisil, J. (2005).
Phenolic profiles of raw apricots, pumpkins, and their purees in the evaluation of apricot
nectar and jam authenticity. Journal of Agricultural and Food Chemistry, 53(12), 4836-
4842.
265. Southon, S., & Faulks, R. (2002). Health benefits of increased fruit and vegetable
consumption. Fruit and vegetable processing: Improving quality, 9-21.
266. Bandekar, J. R., Dhokane, V. S., Shashidhar, R., Hajare, S., Saroj, S., & Sharma, A.
(2006). Use of irradiation to ensure hygienic quality of fresh, pre-cut fruits and vegetables
and other minimally processed foods of plant origin. Use of Irradiation to Ensure the

315
Hygienic Quality of Fresh, Pre-Cut Fruits and Vegetables and Other Minimally Processed
Food of Plant Origin, 170.
267. Janave, M. T., & Thomas, P. (1979). Influence of post-harvest storage temperature and
gamma irradiation on potato carotenoids. Potato Research, 22(4), 365-369.

316
List of Publications arising from the thesis
Journal
a. Published:
1. Sharma, J., Chatterjee, S., Kumar, V., Variyar, P. S., & Sharma, A. (2010). Analysis
of free and glycosidically bound compounds of ash gourd (Benincasa hispida):
Identification of key odorants. Food Chemistry, 122(4), 1327-1332.
2. Tripathi, J., Chatterjee, S., Vaishnav, J., Variyar, P. S., & Sharma, A. (2013). Gamma
irradiation increases storability and shelf life of minimally processed ready-to-cook
(RTC) ash gourd (Benincasa hispida) cubes. Postharvest Biology and Technology, 76,
17-25.
3. Tripathi, J., Gupta, S., Mishra, P. K., Variyar, P. S., & Sharma, A. (2014).
Optimization of radiation dose and quality parameters for development of ready-to-cook
(RTC) pumpkin cubes using a statistical approach. Innovative Food Science & Emerging
Technologies, 26, 248-256.
b. Manuscript under preparation
1. Tripathi, J., Adiani, V., Ghosh, S. B., Ganapathi, T. R., Bauri, A.K., Chatterjee, S.,
Kulkarni, V.M., Variyar, P. S., & Sharma, A. Identification of GTP binding nuclear
protein Ran as an upregulation target in acetoin glucoside mediated plant growth
enhancement
2. Tripathi, J., & Variyar, P. S. Optimization of radiation dose and quality parameters for
development of ready-to-cook (RTC) drumstick using a statistical approach.

317
3. Tripathi, J. & Variyar, P. S. Mechanism of browning inhibition in radiation processed
ready-to-cook ash gourd.
4. Tripathi, J., & Variyar, P. S. Analysis of free and glycosidically bound compounds of
drumstick (Moringa oleifera) and pumpkin (Cucurbita pepo): Identification of key
odorants.
Conferences
1. Sharma, J., Vivekanand Kumar, Chatterjee,S., Variyar,P. S. and Sharma, A.
Identification of aroma impact compounds of ash gourd: Proceedings of the 13th
ISMAS-WS on Mass Spectrometry,(2008),184-190,ISBN:978-81-904442-1-7.
2. Sharma, J., Chatterjee, S., Gupta, S., Kumar, V., Variyar, P. S. and Sharm, A.
Development of shelf stable radiation processed ready-To-Cook (RTC) Indian
vegetables. Peaceful Uses of Atomic Energy, 29th Sep-1st Oct. 2009 held at Vigyan
bhawan, New Delhi.
3. Tripathi, J., Variyar, P. S. and Sharma, A. Mechanism of browning inhibition in
radiation processed ready-to-cook ash gourd. Poster presented at DAE-BRNS Life
Science Symposium (LSS) 2012, "Trends in Plant, Agriculture and Food Science"
(TIPAFS) at multipurpose hall, Training School Hostel, Anushakti Nagar, Mumbai, Dec,
17-19 2012.
4. Tripathi, J., Gupta, S., Variyar, P. S. and Sharma, A. Improving shelf life of gamma
radiation processed Ready-to-cook (RTC) pumpkin cubes: A multivariate statistical

318
approach. Poster presented at IFCON-2013, 18-21 December, 2013 held at CSIR-
CFTRI, Mysore.
5. Tripathi, J., Gupta, S., Variyar, P. S. and Sharma, A. Improving shelf life of gamma
radiation processed Ready-to-cook (RTC) drumstick: A multivariate statistical approach.
Poster presented at LSS-2015, 3-5 Feb, 2015 held at NUB, Anushakti Nagar, Mumbai.
Others
1. Sharma, J., Chatterjee, S., Gupta, S., Kumar, V., Variyar, P. S. and Sharma, A.
Development of shelf-stable radiation processed Ready-to-cook (RTC) Indian
vegetables. Thematic volume evolved from the proceedings of International Conference
on Peaceful uses of atomic energy-2009, Sep 29- Oct 1, 2009, Vigyan Bhavan, New
Delhi, (2011), 154-158.
2. Tripathi, J., Gupta, S., Kumar, V., Chatterjee, S., Variyar, P. S and Sharma, A.
Processing food for Convenience: Challenges and Potentials. BARC Newsletter, (2011),
322, 55-60.
Jyoti Tripathi
Copyright © 2022 FDOKUMEN