Plant profile, Phytochemical and Pharmacological properties ...
Upload
khangminh22Category
view
0download
0
NUTRITIONAL & PHYTOCHEMICAL
COMPOSITION, FUNCTIONAL PROPERTIES OF
ROSELLE (Hibiscus sabdariffa) AND SENSORY
EVALUATION OF SOME BEVERAGES MADE FROM
ROSELLE CALYCES
ABRAHAM WAHID LUVONGA
MASTER OF SCIENCE
(Food Science and Technology)
JOMO KENYATTA UNIVERSITY OF
AGRICULTURE AND TECHNOLOGY
2012
Nutritional & Phytochemical Composition, Functional Properties
of Roselle (Hibiscus Sabdariffa) and Sensory Evaluation of Some
Beverages made from Roselle Calyces
Abraham Wahid Luvonga
A thesis Submitted in partial fulfillment for the degree of Master of
Science in Food Science and Technology in the Jomo Kenyatta
University of Agriculture and Technology
2012

ii
DECLARATION
This thesis is my original work and has not been presented for a degree in any other
university.
Signature……………………………… Date………………………….
Abraham Wahid Luvonga
This thesis has been submitted for examination with our approval as University
supervisors:
Signature……………………………….. Date………………………….
Prof. Simon Muhoho Njoroge
JKUAT, Kenya.
Signature………………………………...... Date………………………….
Prof Anselimo Ouma Makokha
JKUAT, Kenya.

iii
DEDICATION
This thesis is dedicated to my family with love.

iv
ACKNOWLEDGEMENT
With heartfelt gratitude, I wish to acknowledge my supervisors Prof. S.N. Muhoho
and Prof. A. O. Makokha, for their guidance, advice, critical comments, suggestions
and the encouragement they provided throughout the period of my studies. I also
wish to recognize the invaluable input of Dr. Calvin Onyango of Kenya Industrial
Research and Development Institute.
I also appreciate all the help provided by the technical staff in the Department of
Food Science and Technology and the Department of Horticulture, Faculty of
Agriculture at the Jomo Kenyatta University of Agriculture and Technology
(JKUAT); including that of Mr. Paul Karanja, David Votha and George Mathenge.
I am indebted to my research project sponsors, Kenya Industrial Research and
Development Institute (KIRDI), and to JKUAT for their support.
I also thank my family, friends and colleagues for their time, moral and material
support.
Last but not least my sincere heartfelt gratitude and thanks goes to the Almighty God
for making this work a success.
v
TABLE OF CONTENTS
DECLARATION .................................................................................................. II
DEDICATION ..................................................................................................... III
ACKNOWLEDGEMENT ................................................................................... IV
TABLE OF CONTENTS ....................................................................................... V
LIST OF TABLES ................................................................................................. X
LIST OF FIGURES ............................................................................................. XI
LIST OF APPENDICES ..................................................................................... XII
ABBREVIATIONS AND ACRONYMS....................................................... XIII
ABSTRACT ........................................................................................................ XV
CHAPTER ONE: INTRODUCTION ....................................................................1
1.1 BACKGROUND ..................................................................................................1
1.2 PROBLEM STATEMENT ......................................................................................3
1.3 JUSTIFICATION .................................................................................................4
1.4 OBJECTIVES .....................................................................................................5
1.4.1 Main objective ..........................................................................................5
1.4.2 Specific objectives ....................................................................................5
1.5 HYPOTHESES ....................................................................................................6
1.6 RESEARCH QUESTIONS ......................................................................................6

vi
CHAPTER TWO: LITERATURE REVIEW ......................................................7
2.1 DESCRIPTION OF ROSELLE .................................................................................7
2.2 ORIGIN AND DISTRIBUTION OF ROSELLE ............................................................8
2.3 AGRONOMIC PRACTICES AND PRODUCTION OF ROSELLE .....................................8
2.3.1 Environmental conditions for roselle growth.............................................8
2.3.2 Planting of roselle .....................................................................................8
2.3.3 Natural Enemies of roselle ...................................................................... 10
2.3.4 Growth characteristics of roselle ............................................................. 11
2.3.5 Harvesting of roselle ............................................................................... 11
2.3.6 Drying of roselle ..................................................................................... 12
2.3.7 Yield of roselle ....................................................................................... 13
2.4 UTILIZATION AND ECONOMIC IMPORTANCE OF ROSELLE .................................. 14
2.4.1 Calyces ................................................................................................... 14
2.4.2 Leaves and roots ..................................................................................... 15
2.4.3 Stem ....................................................................................................... 15
2.4.4 Seeds ...................................................................................................... 15
2.5 FUNCTIONAL PROPERTIES AND PHYTOCHEMICALS ........................................... 16
2.5.1 Functional foods ..................................................................................... 16
2.5.2 Functional foods from plant sources ....................................................... 16
2.5.3 Phytochemicals....................................................................................... 18
2.5.3.1 Flavonoids ....................................................................................... 20
2.5.3.2 Tannins ............................................................................................ 22
2.5.3.3 Anthocyanins ................................................................................... 22
vii
CHAPTER THREE: MATERIALS AND METHODS....................................... 24
3.1 PROJECT SITE ................................................................................................. 24
3.2 STUDY DESIGN ............................................................................................... 24
3.3. MATERIALS ACQUISITION .............................................................................. 24
3.4. ANALYTICAL METHODS ................................................................................ 24
3.4.1. Proximate Composition and determination of dry matter ....................... 25
3.4.1.1. Moisture content ............................................................................. 25
3.4.1.2 Determination of crude protein ........................................................ 25
3.4.1.3 Fat content ....................................................................................... 26
3.4.1.4 Determination of crude ash .............................................................. 27
3.4.1.5 Crude fibre....................................................................................... 27
3.4.1.6 Mineral determination ...................................................................... 29
3.4.2 Determination of changes in physico-chemical attributes of roselle
beverages ........................................................................................................ 30
3.4.2.1 Colour ............................................................................................. 30
3.4.2.2 pH ................................................................................................... 31
3.4.2.3 Total titratable acidity ...................................................................... 31
3.4.2.3 Major organic acids of roselle .......................................................... 32
3.4.2.4 Determination of the seven water soluble vitamins of roselle ........... 32
3.4.3 Phytochemicals in roselle ....................................................................... 35
3.4.3.1 Tannins ............................................................................................ 35
3.4.3.2 Total polyphenol content ................................................................. 37
3.4.3.3 Flavonoids ....................................................................................... 37
viii
3.4.4 Antioxidant activity ................................................................................ 38
3.5 NEW PRODUCT DEVELOPMENT FROM ROSELLE................................................. 39
3.5.1 Processing of roselle drink ...................................................................... 39
3.5.2 Processing of roselle beverages blended with selected juices. ................. 41
3.6 SHELF LIFE STABILITY OF ROSELLE BEVERAGES .............................................. 43
3.6.1 Total plate count ..................................................................................... 43
3.6.2 Yeast and mould count ........................................................................... 44
3.7 SENSORY EVALUATION OF ROSELLE BEVERAGES ............................................. 44
3.8 DATA MANAGEMENT AND ANALYSIS ............................................................... 45
CHAPTER FOUR: RESULTS AND DISCUSSION ........................................... 46
4.1 PROXIMATE COMPOSITION OF ROSELLE ........................................................... 46
4.2 MINERAL CONTENT OF ROSELLE ..................................................................... 47
4.3 WATER SOLUBLE VITAMIN IN ROSELLE CALYCES ............................................. 48
4.4 LEVELS OF THE MAJOR ORGANIC ACIDS IN ROSELLE CALYCES .......................... 49
4.5 LEVELS OF PHYTOCHEMICALS IN ROSELLE CALYCES ........................................ 50
4.5.1 Quality Changes in Acidity and Antioxidant Activity ............................. 50
4.5.2 Quality changes in the phytochemicals with functional properties ........... 51
4.5.3 Antioxidant activity and radical scavenging capacity of roselle extract ... 52
4.6 INDICES FOR POLYMERIC COLOR CHANGES OF ROSELLE BEVERAGES. ................ 55
4.7 QUALITY OF ROSELLE BEVERAGES ................................................................. 58
4.7.2 Sensory Evaluation ................................................................................. 58
4.7.2 Microbial load ........................................................................................ 61
4.7.3 Nutrition composition of the Roselle beverages ...................................... 64
ix
4.7.4 Consumer acceptability tests ................................................................... 65
CHAPTER FIVE: CONCLUSIONS AND RECOMMENDATIONS ................ 67
5.1 CONCLUSIONS ................................................................................................ 67
5.2 RECOMMENDATIONS ...................................................................................... 68
REFERENCES ..................................................................................................... 69
APPENDICES ....................................................................................................... 81
x
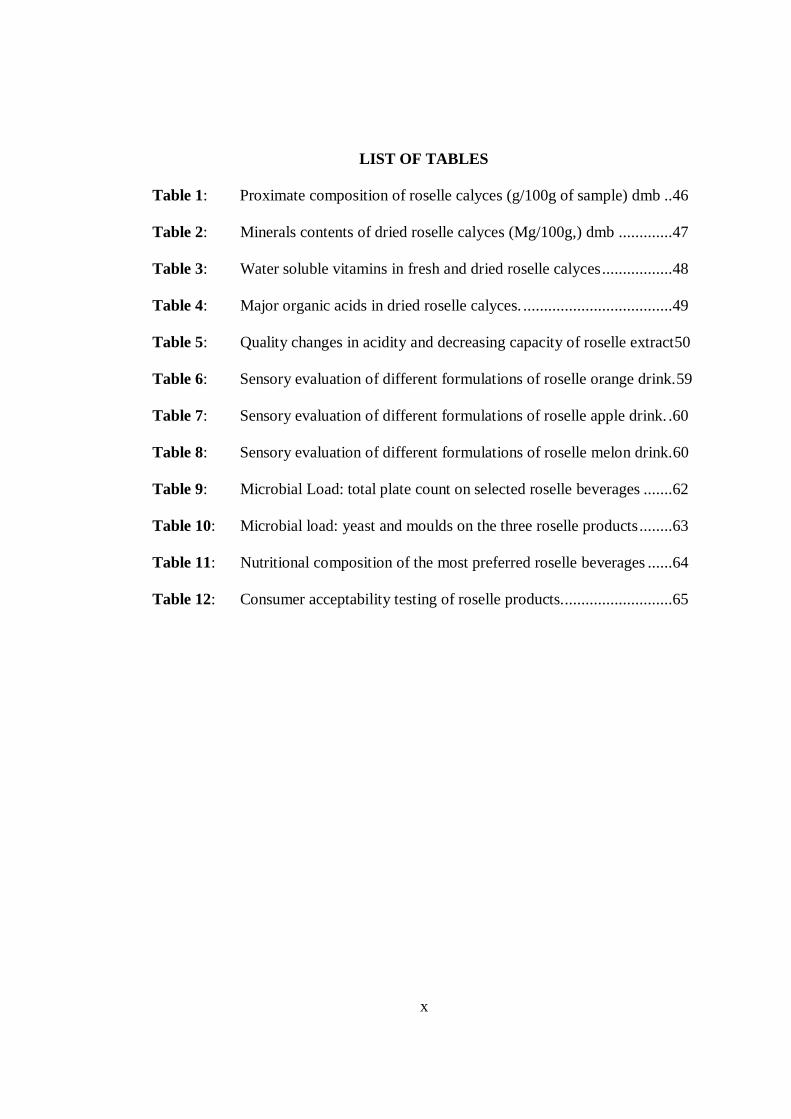
LIST OF TABLES
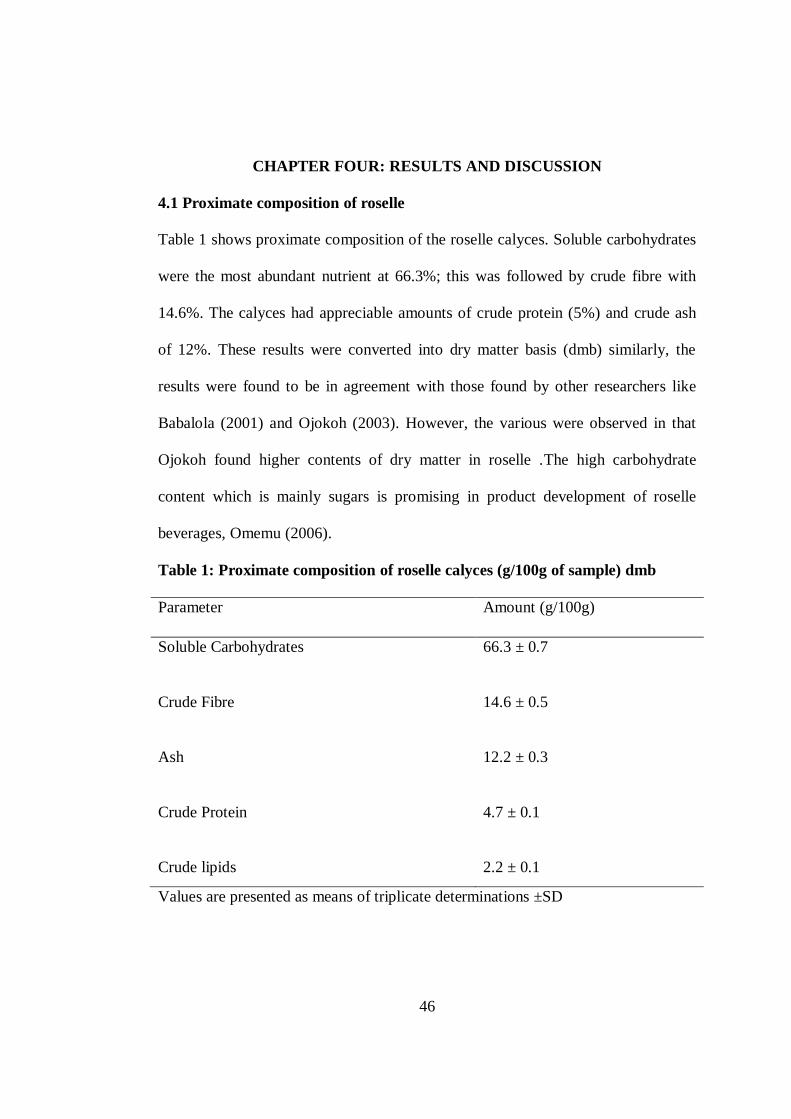
Table 1: Proximate composition of roselle calyces (g/100g of sample) dmb ..46
Table 2: Minerals contents of dried roselle calyces (Mg/100g,) dmb .............47
Table 3: Water soluble vitamins in fresh and dried roselle calyces .................48
Table 4: Major organic acids in dried roselle calyces. ....................................49
Table 5: Quality changes in acidity and decreasing capacity of roselle extract50
Table 6: Sensory evaluation of different formulations of roselle orange drink.59
Table 7: Sensory evaluation of different formulations of roselle apple drink. .60
Table 8: Sensory evaluation of different formulations of roselle melon drink.60
Table 9: Microbial Load: total plate count on selected roselle beverages .......62
Table 10: Microbial load: yeast and moulds on the three roselle products ........63
Table 11: Nutritional composition of the most preferred roselle beverages ......64
Table 12: Consumer acceptability testing of roselle products. ..........................65
xi
LIST OF FIGURES
Figure 1: Mature green roselle plant. ............................................................. 7
Figure 2: Roselle plantation at JKUAT Farm................................................. 9
Figure 3: Some natural enemies that attack roselle calyces in the field .........10
Figure 4: Freshly harvested and dried roselle calyces. ..................................14
Figure 5: The free aglycone and the glycosylated form of quercetin ..............21
Figure 6: Production of pure roselle drink ....................................................40
Figure 7: Flow chart for processing of fruit flavored roselle beverages .........42
Figure 8: Radical reduction of roselle extract as influenced processing .........53
Figure 9: Percentage reduction of roselle extract at different concentrations .54
Figure 10: Hue angle of the roselle drink processed and stored.......................56
Figure 11: Chroma values for the roselle beverages processed and stored.......57
Figure 12: Roselle beverage products ............................................................66
Figure 13: Samples for packaged Roselle products. .......................................92
xii
LIST OF APPENDICES
APPENDIX I: Tri stimulus colour code match table ....................................81
APPENDIX II: Standard curves ....................................................................82
APPENDIX III: Sensory evaluation questionnaire ..........................................90
APPENDIX IV: Product labels and packaging ...............................................92
APPENDIX V: Consumer Product acceptability testing questionnaire ..........93
xiii
ABBREVIATIONS AND ACRONYMS
AA Antioxidant activity
AAS Atomic absorption spectroscopy
ANOVA Analysis of variance
AOAC Association of Official Analytical Chemists
CAC Codex Alimentarius Commission
CE Catechin Equivalence
CFU Colony forming units
CHOs Carbohydrates
Ch* Chroma
CIE LAB Commission Internationale Laboratoire
Conc. Concentration
CRD Complete Randomized Design
DMB Dry matter basis
DWB Dry weight basis
DPPH Diphenyl Picryl Hydrazyl Radical
EC50 Efficient coefficient
FAO Food and Agricultural Organization
FOSHU Foods for Specified Health Use
FST Food Science and Technology
GAE Gallic Acid Equivalent
GC Gas Chromatography
GC MS Gas Chromatography Mass Spectrometry

xiv
GOK Government of Kenya
HPLC High Performance Liquid Chromatography
h* Hue angel
IUFOST International Union of Food Science and Technology;
JKUAT Jomo Kenyatta University of Agriculture and Technology
KEBS Kenya Bureau of Standards
KIRDI Kenya Industrial Research and Development Institute
LSD Least Significant Difference
NFF Novel Functional Food
NLEA Nutritional labeling and education act
NPD New Product Development
RAD Roselle apple drink
RD Roselle drink
RMD Roselle melon drink
ROD Roselle orange drink
TPC Total polyphenol content
USA United States of America
USDA United States Department of Agriculture
UV-Vis Ultra violet visible spectrophotomètre
WHO World Health Organization
WSV Water soluble vitamins
xv
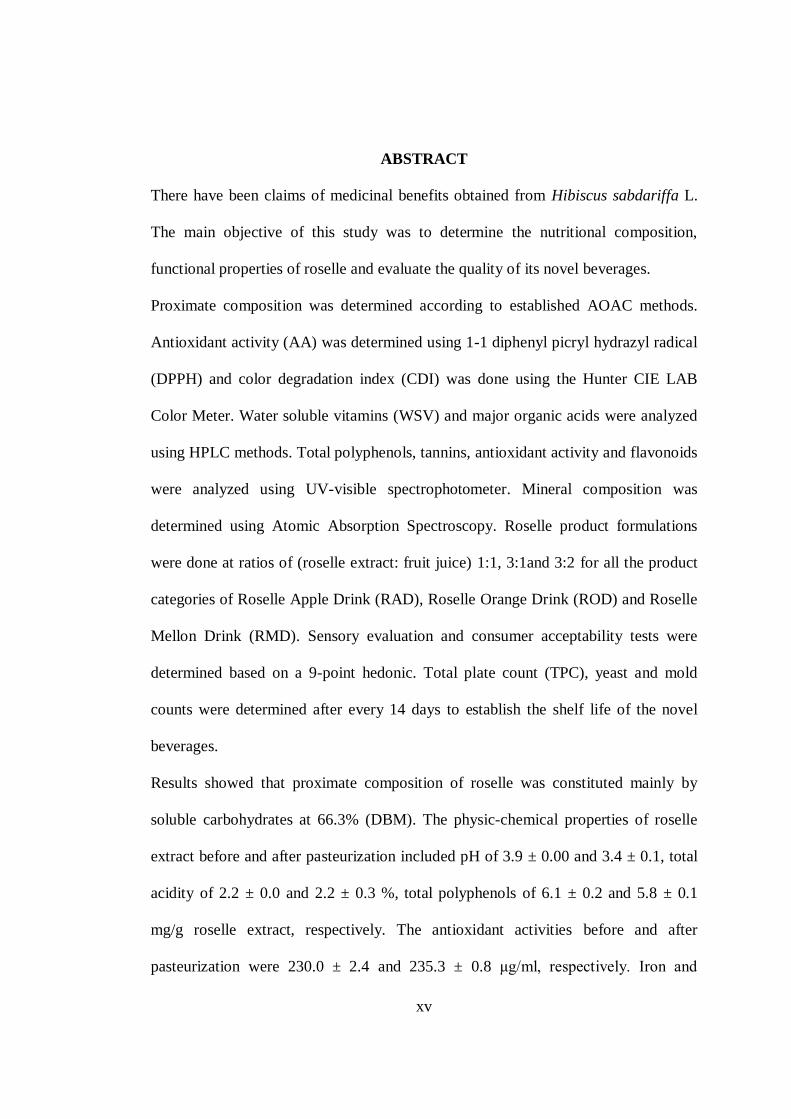
ABSTRACT
There have been claims of medicinal benefits obtained from Hibiscus sabdariffa L.
The main objective of this study was to determine the nutritional composition,
functional properties of roselle and evaluate the quality of its novel beverages.
Proximate composition was determined according to established AOAC methods.
Antioxidant activity (AA) was determined using 1-1 diphenyl picryl hydrazyl radical
(DPPH) and color degradation index (CDI) was done using the Hunter CIE LAB
Color Meter. Water soluble vitamins (WSV) and major organic acids were analyzed
using HPLC methods. Total polyphenols, tannins, antioxidant activity and flavonoids
were analyzed using UV-visible spectrophotometer. Mineral composition was
determined using Atomic Absorption Spectroscopy. Roselle product formulations
were done at ratios of (roselle extract: fruit juice) 1:1, 3:1and 3:2 for all the product
categories of Roselle Apple Drink (RAD), Roselle Orange Drink (ROD) and Roselle
Mellon Drink (RMD). Sensory evaluation and consumer acceptability tests were
determined based on a 9-point hedonic. Total plate count (TPC), yeast and mold
counts were determined after every 14 days to establish the shelf life of the novel
beverages.
Results showed that proximate composition of roselle was constituted mainly by
soluble carbohydrates at 66.3% (DBM). The physic-chemical properties of roselle
extract before and after pasteurization included pH of 3.9 ± 0.00 and 3.4 ± 0.1, total
acidity of 2.2 ± 0.0 and 2.2 ± 0.3 %, total polyphenols of 6.1 ± 0.2 and 5.8 ± 0.1
mg/g roselle extract, respectively. The antioxidant activities before and after
pasteurization were 230.0 ± 2.4 and 235.3 ± 0.8 μg/ml, respectively. Iron and
xvi
calcium contents were 8.6 ± 0.3 and 14.8 ± 0.6 mg/100g respectively. Shelf life
studies showed good stability of products where the microbial load was low and
within the acceptable limits (103g/Kg) for total plate count, yeasts and moulds by
Kenya Bureu of Standards and Codex Alimentarius Commission (CAC) up to 90
days.
The RAD and ROD blended with 50 %, 60%, 75% and 100% roselle were highly
acceptable in all the sensorial properties of taste, appearance, flavor, consistency and
overall acceptability. However, RMD with 75% roselle was the only acceptable with
an average score above 5 on a 9-point Hedonic scale. Those with a score lower than
5 were deemed unacceptable. The most preferred pair of beverages for ROD and
roselle drink were generally acceptable to consumers. This was an indication for a
clear market success scenario in Kenya.

1
CHAPTER ONE: INTRODUCTION
1.1 Background
The tenet "Let food be thy medicine and medicine be thy food," espoused by
Hippocrates nearly 2,500 years ago, is receiving renewed interest. In particular,
there has been an explosion of consumer interest in the health enhancing role of
specific foods or physiologically-active food components, so-called functional
foods (Hasler, 1998). Clearly, all foods are functional, as they provide taste, aroma,
or nutritive value. Within the last decade, however, the term functional as it applies
to food has adopted a different connotation -- that of providing an additional
physiological benefit beyond that of meeting basic nutritional needs. Although a
plethora of biologically active compounds have been identified in this regard
(Kuhn, 1998), this research focused on novel functional foods, and specific
phytochemicals isolated from Hibiscus sabdariffa L.
Hibiscus sabdariffa L. Family Malvaceae is believed to be native of tropical Africa.
It is known by different synonyms and vernacular names such as roselle (Carmden,
and Jordan, 2002) Karkade (Abu-Tarbuoush, 1997) and Mesta (Rao, 1996).
The different parts of roselle include seeds, stems, leaves and calyces. (Purseglove,
1977; Seck, 1997). The roselle calyces (the outer whorl of the flower) groups are
red, dark red or green (Schippers, 2000). The fleshy calyces of roselle have been
used in various countries in Africa and the Caribbean as food or food ingredient in
jellies, syrups, beverages, puddings, cakes, and wines, (Mahadevan et al., 2009;
Clydescale, 1979).
2
In addition to their use in food, various parts of the roselle plant have been used in
traditional medicine for the prevention of disease such as cardiovascular diseases
and hypertension (CTA, 2001). Among other uses, strong fibre is obtained from the
stem (called roselle hemp) which is used for various household purposes including
making sackcloth, twine and cord (Mungole and Charvedi, 2011). The calyces have
been found to be rich in Vitamin C and antioxidant (Clydescale, 1979; Wong et al.,
2002) and also minerals (Babalola, 2001). Roselle plant is highly regarded from the
stand point of nutritional and medicinal values as well as economic value. In terms
of nutritional values, it has been found to be a good source of essential nutrients
(Mohammed and Idris, 1991; Omemu, 2000; Mukhtar, 2007; Wahid, 2008).
This study entailed determination of the nutritional & phytochemicals composition,
functional potential and sensory evaluation of novel beverages from roselle blended
with selected fruits: apples, oranges and water melons.
3
1.2 Problem statement
Hibiscus sabdariffa L. is an important flowering plant in the Malvacea family
(FAO). But surprisingly very little fundamental research, in terms of .cultivation,
agronomy, productivity and various applications, has been carried out. In many
developing countries including Kenya, roselle has not been fully exploited despite
the existing potential for a wider application in the food processing and other
technological applications. There are health and nutritional claims that it has health
benefits such as soothing colds, opening blocked nose, clearing up mucous,
promoting proper kidney function, helping digestion and helping reduce fever.
However, there are limited studies to substantiate these health/nutritional claims.
There is need for scientific information to substantiate the claims and validate its
applicability in functional food processing. There are no studies on quality changes
in the physico-chemical, phytochemicals and nutritional composition at various
processing temperature and time regimes as well as storage at various conditions.
The problem of this study was to avail the fundamental scientific information as
well as proposition of beverage blends with optimized nutrients and functional
properties due to beneficial phytochemicals.
4
1.3 Justification
This study presented an opportunity to provide scientific information to validate the
nutritional and some of the health claims of roselle. The study also provided some
scientific information on nutritional, Phytochemicals and functional properties of
roselle which can serve as an impetus to those who wish to promote the roselle fruit
and beverage industry. The information on the health and nutritional benefits is
important for the consumers in general. The gathered and documented information
will provide an incentive for commercial utilization of roselle in Kenya. The
eventual output is the contribution to the organized body of scientific Knowledge
for benefit of other researchers & innovators.
According to market statistics, the global functional food and nutraceutical market
is growing at a rate that is outpacing the traditional processed food market. Thus
exploring the area of functional foods was interestingly beneficial to a number of
actors including the producers diversifying crop farming with roselle as a
supplemental crop. Consumers are increasingly becoming interested in healthy life-
styles. Therefore, they not only look at the basic nutritional composition of the
food, but also the health benefits of the foods in disease prevention and health
enhancement. This is combined with a more widespread understanding of how diet
affects disease, health-care costs and an ageing population. This trend has produced
a skyrocketing demand for functional foods and natural health product. Studies on
roselle could partly address the problem.
5
1.4 Objectives
1.4.1 Main objective
The main objective of this study was to determine the nutritional & phytochemical
composition, functional properties of roselle and evaluate its applications in
production of beverages.
1.4.2 Specific objectives
The specific objectives were to:
a) Determine the nutritional composition of roselle
b) Determine phytochemicals present in the roselle calyces
c) Formulate beverages using roselle blended with selected fruit juices
d) Determine the changes in the microbial quality and bioactive properties of
roselle extract after processing and during storage.
e) Determine the consumer acceptability of the formulated roselle beverages

6
1.5 Hypotheses
The hypotheses tested were:
1) Phytochemicals that can offer antioxidant activities are present in roselle.
2) Nutritional value of roselle is high
3) Consumer acceptable beverages can be formulated from roselle calyces
4) There are no changes in quality and bioactive properties of roselle extract after
processing and during processing.
1.6 Research questions
The research questions were:
i. What is the nutritional composition of roselle grown in Kenya?
ii. What phytochemicals are present in roselle?
iii. Are there any changes in microbial quality and phytochemicals as a result of
processing and storage conditions of roselle extract?
iv. Can acceptable beverages be developed from roselle calyces?
7
CHAPTER TWO: LITERATURE REVIEW
2.1 Description of roselle
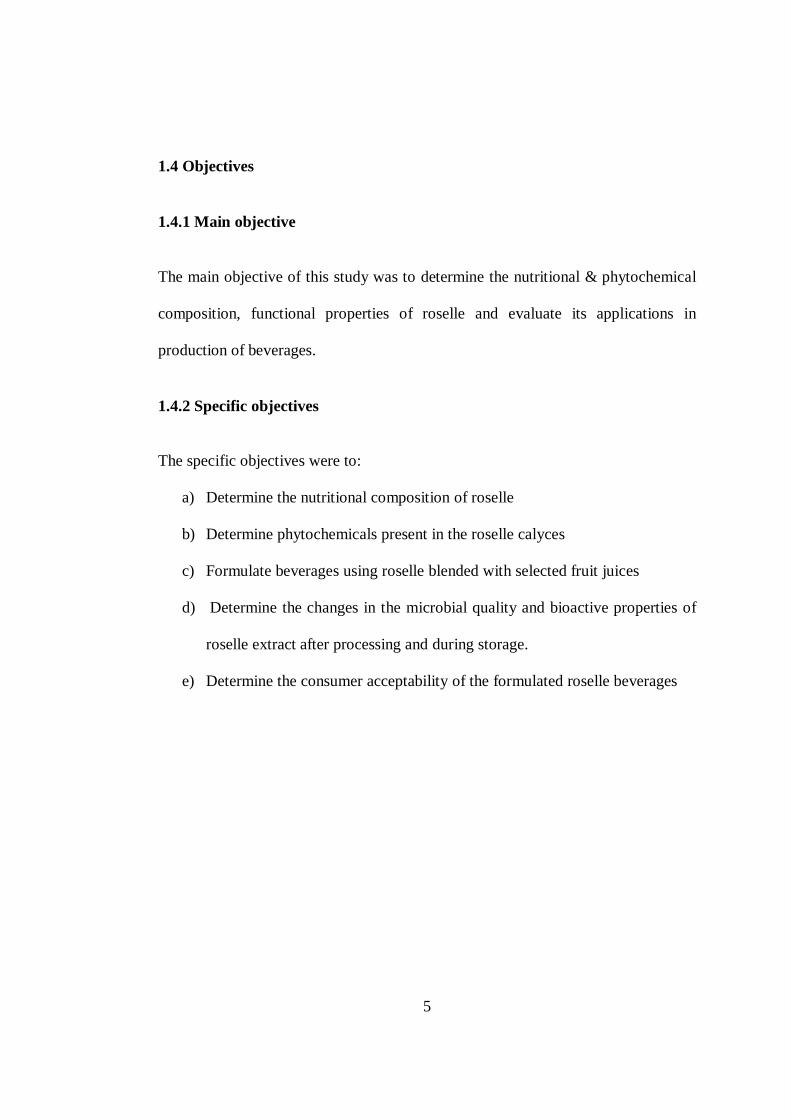
Hibiscus sabdariffa L. is an annual, erect, bushy, herbaceous sub-shrub that may
grow to 8 ft (2.4 m) tall, with smooth or nearly smooth, cylindrical, typically red
stems. The leaves are alternate, 3 to 5 in (7.5-12.5 cm) long, green with reddish
veins and long or short petioles. The capsule turns brown and splits open when
mature and dry. The calyx stems and leaves are acidic and closely resemble the
cranberry (Vaccinium spp.) in flavor. It is extensively cultivated in tropical Africa,
Asia, Australia, and Central America (Schippers, 2000)
Figure 1: Mature green roselle plant.
8
2.2 Origin and distribution of roselle
Roselle is native from India to Malaysia, where it is commonly cultivated, and must
have been carried at an early date to Africa. It has been widely distributed in the
Tropics and Subtropics of both hemispheres, and in many areas of the West Indies
and Central America, it has become naturalized (Brouk, 1975). In Kenya, however,
it is not widely grown.
2.3 Agronomic practices and production of roselle
2.3.1 Environmental conditions for roselle growth
Roselle is quite hardy and grows well in most soils that are well drained. It tolerates
poor soil, and is often grown as a supplemental rather than a primary crop. It
requires 4-8 months with nighttime temperatures not below 21oC. In addition, it
requires 13 hours of sunlight during the first 4-5 months of growth to prevent
premature flowering. Roselle requires a monthly rainfall ranging from 5-10 inches
in the first 3-4 months of growth. Dry periods can be withstood and are desirable in
the last months of growth. Rain or high humidity during the harvest time and drying
can downgrade the quality of the calyces and reduce the yield.
2.3.2 Planting of roselle
Hibiscus sabdariffa is very sensitive to changes in the length of day as reported by
Hacket and Carolene (1982). This photoperiodic quality of blooming, when the
days become shorter, requires the planting time to be set according to the day length
and not according to the rainfall requirements. Hibiscus is a deep-rooted crop so
9
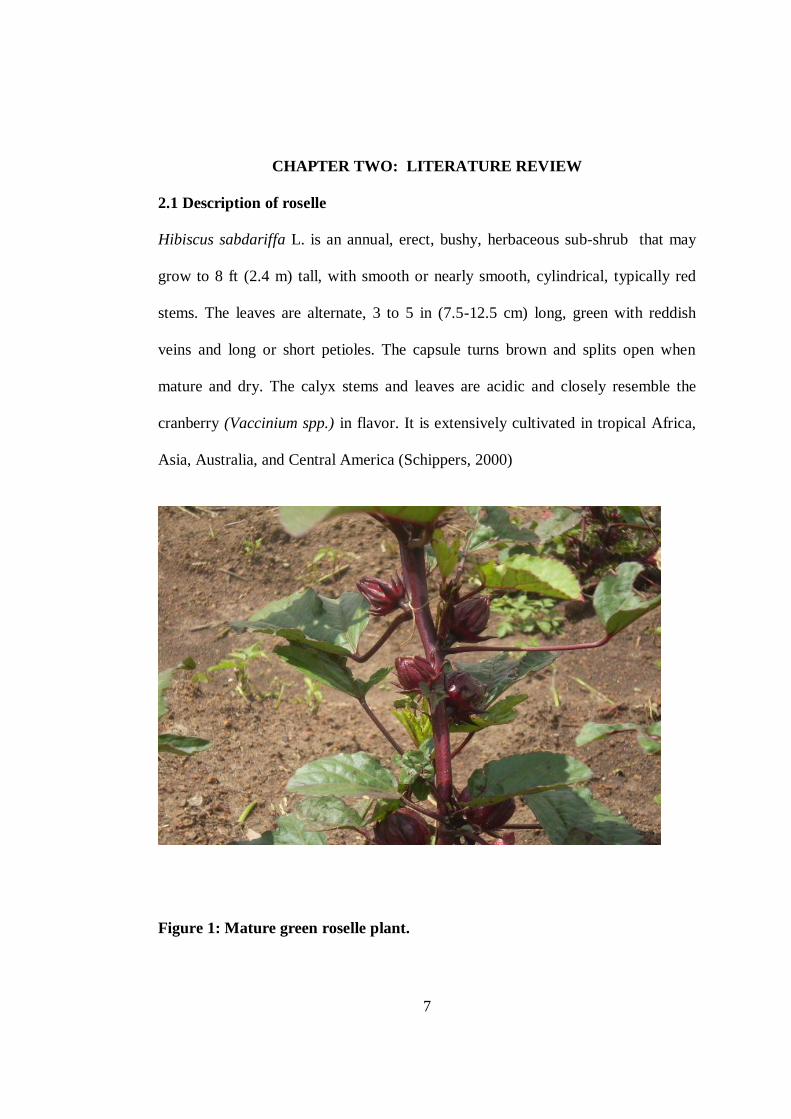
deep plowing is recommended in preparing the seedbed. To produce large calyx,
453-906 kilograms of manure are added per acre. Seeds are planted at a rate of 2.7-
3.6 kilograms or less per acre approximately an inch deep. Seeds are best planted at
the beginning of the rainy season, 2-3 feet between rows and 18-24 inches within
the rows. The reduced planting rate produces larger calyx (Ahmed and Salaheldeen,
2010).
Planting can be done with a modern grain drill and then later requires thinning by
hand; planting by seed can also be done by hand. A good alternative tool would be
a corn planter small enough to accommodate the hibiscus seeds (Ahmed and
Salaheldeen, 2010).
Figure 2: Roselle plantation at JKUAT Farm

10
There are over 100 cultivars or seed varieties of roselle. The major commercial
varieties are those grown in China, Thailand, Mexico and Africa, principally Sudan,
Senegal and Mali (Mahadevan, 2009).
2.3.3 Natural Enemies of roselle
Major diseases of roselle are mostly stem and root rot. Prevention techniques can
include monitoring water in an irrigated field as well as avoiding the planting of
crops that are also prone to these diseases. Damage done to roselle by insects is
minor but it does exist. In the order Coleoptera is the stem borer and flea beetles,
Podagrica spp. In the order Lepoptera, the abutilon moth, the cotton bollworm, and
the cutworm. The order Hemoptera is a minor problem, the mealy bugs and the
leafhopper, and finally in the order Hemiptera the cotton strainer (Elawad, 2001).
Figure 3: Some natural enemies that attack roselle calyces in the field
Plant enemies usually do not compete in a cultivated field. Weeding can increase
yield and calyx size, but may also reduce profit for the farmer. Because of
11
differences in available land and labor prices, Chinese roselle fields are generally
weeded and even hand watered if necessary, for maximum yield, while those in
Thailand are given minimal attention.
2.3.4 Growth characteristics of roselle
Flowering of the hibiscus is induced as the days become shorter and light intensity
reduces. Flowering begins in September or later depending on the country in
question, and continues through October or later when the entire field is in bloom.
Flowers begin to drop at the end of October or later. The seed pods begin ripening
towards the bottom and proceed to the top. In Sudan, growers will sometimes allow
the seed to completely ripen and the leaves to drop prior to harvest (Ahmed and
Salaheldeen, 2010).
2.3.5 Harvesting of roselle
The harvest is timed according to the ripeness of the seed. The wet red fleshy
calyces are harvested after the flower has dropped but before the seed pod has dried
and opened. The more time the capsule remains on the plant after the seeds begin to
ripen, the more susceptible the calyx is to sores, sun cracking, and general
deterioration in quality. All harvesting is done by hand. Special care must be taken
during harvesting operation to avoid contamination by extraneous material. At no
time should the calyx come in contact with the ground or other dirt surfaces. Clean
bags or containers should be used to transport the harvest from the field to the
drying location (Elawad, 2001).
12
In addition to avoiding contamination, the time between harvest and drying should
always be kept at a minimum. Different harvesting methods are in use today. In
Mexico the entire plant is cut down and taken to a nearby location to be stripped of
the calyces. In China only ripe calyces are harvested with clippers leaving the stalks
and immature calyces to ripen in the field. The field is harvested approximately
every ten days until the end of the growing season. The calyx is separated from the
seed pod by hand, or by pushing a sharp edged metal tool through the fleshy tissue
of the calyx separating it from the seed pod (Ahmed and Salaheldeen, 2010).
2.3.6 Drying of roselle
Vanvalkenburg et al., (2002) highlighted that drying of roselle can be accomplished
by different methods. These include drying with adequate ventilation, using woven
nylon mats for example, prevents sun baking, which can reduce quality. A clean
sheet of plastic placed on the ground can also be used with the hibiscus spread
thinly on top. This method is still prone to insect infestation and mold. Spreading
the calyces on screens or frames would improve ventilation further and reduce
drying time. Such frames could also be stacked or hung in a well ventilated
building. Drying the calyces in forced air dryers would be costly and is rarely done.
If heated drying methods are used, care must be taken so that the temperature does
not exceed 43oC.so that the phytochemicals are not degraded (Elawad, 2001).
13
2.3.7 Yield of roselle
Total yield of Roselle calyces is approximately 228kg for each acre under
cultivation, or about one metric ton per hectare. The drying ratio is 10:1.1. That is,
for every 46 kilograms of fresh calyx, 5 kilograms of dry calyx is produced.
Increased levels of weeding increases the number of calyces per plant (Ahmed and
Salaheldeen, 2010). The study showed that weeding three times resulted in high
crop vigor score in number of calyces per plant. Vanvalkenburg et al., (2002) stated
that, weeding increased calyx size in roselle crop. The main problems limiting
production of roselle as pointed out by Elawad, (2001) are: Scarcity and reliability
of rainfall, Limited research and agricultural extension services, Poor cultural
practices, inadequate weed control and harvest problems. High productive
potentials has been reported for Roselle grown under rainfed, through various
agronomic practices such as weeding and spacing (Babatunde and Zechariah,
2001); nitrogenous fertilizer (Babatunde et al., 2002); intercropping, sowing dates,
intra-row spacing and nitrogen fertilizer (Babatunde, 2003). However, Hinrichsen et
al., (1997) highlighted that rainfed agriculture alone is inadequate to feed the
bludgeoning populations in many parts of the world. It is therefore incumbent upon
mankind to resort to both rainfed and irrigation farming for the widest array of food
crops possible. This would augment world food production and put the human race
a step forward towards attaining food security.
14
2.4 Utilization and economic importance of roselle
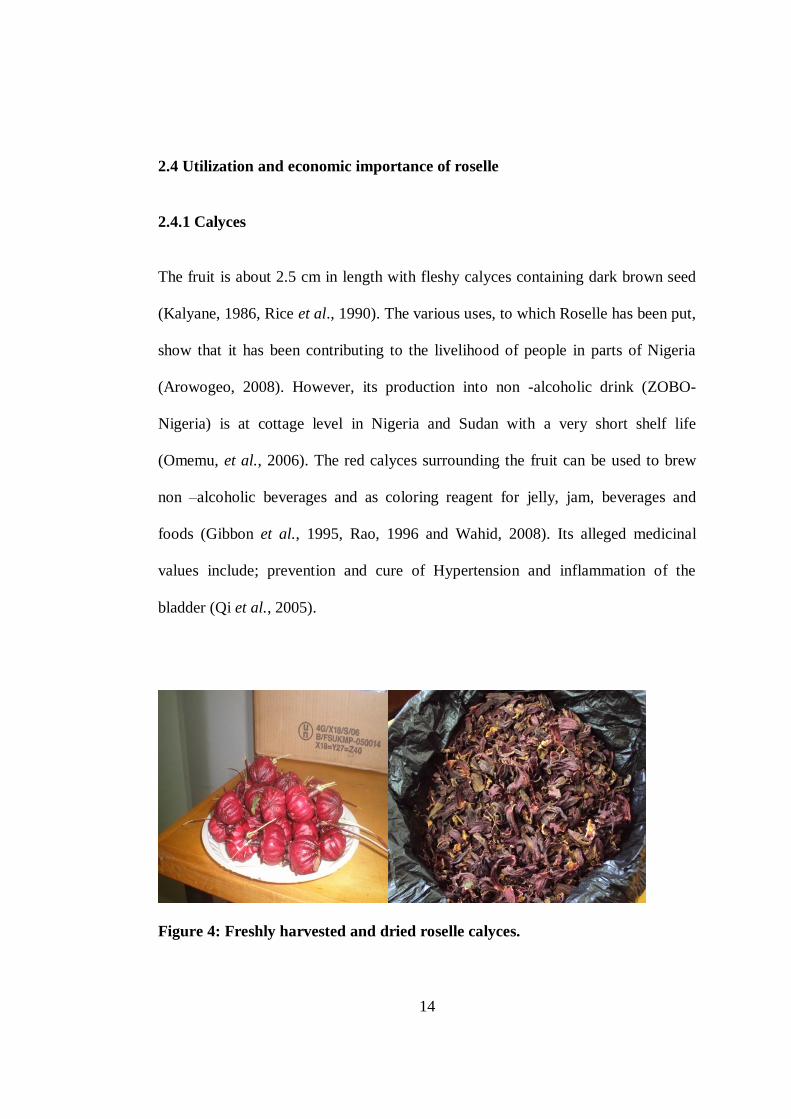
2.4.1 Calyces
The fruit is about 2.5 cm in length with fleshy calyces containing dark brown seed
(Kalyane, 1986, Rice et al., 1990). The various uses, to which Roselle has been put,
show that it has been contributing to the livelihood of people in parts of Nigeria
(Arowogeo, 2008). However, its production into non -alcoholic drink (ZOBO-
Nigeria) is at cottage level in Nigeria and Sudan with a very short shelf life
(Omemu, et al., 2006). The red calyces surrounding the fruit can be used to brew
non –alcoholic beverages and as coloring reagent for jelly, jam, beverages and
foods (Gibbon et al., 1995, Rao, 1996 and Wahid, 2008). Its alleged medicinal
values include; prevention and cure of Hypertension and inflammation of the
bladder (Qi et al., 2005).
Figure 4: Freshly harvested and dried roselle calyces.
15
2.4.2 Leaves and roots
Tender young leaves are eaten as vegetables especially with soup, or salads and as a
seasoning in curries. They have an acidic, rhubarb like flavor (Fasoyiro, 2005 and
Mungole, 2011) Roselle has a tap root system. The roots are deficient of most
nutrients as reported by (Ojokoh, 2000).They are claimed to be aphrodisiac
(Mungole, 2006).
2.4.3 Stem
The stem is utilized in fibre extraction. Rao (1996) reported that the plant is grown
in some regions for fibre and pulp obtained from its stem. Total yield of the dry
retted fibre components from one hectare, 30 Tonnes of Green Roselle plants is
1,410 kg. China and Thailand are the largest producers and control much of the
world supply. Thailand invested heavily in Roselle production and their product is
of high quality Whereas China's product, with less stringent quality control
practices, is less reliable and reputable.
2.4.4 Seeds
The seeds are used as feed meal for fish and domestic animals (Backeit et al., 1994;
Mukhtar, 2007). There have been attempts to make condiments. Mohamodou, et al.,
(2007) reported a study that determined the functional potential of Mbuja, a
traditional condiment produced by fermentation of Hibiscus sabdariffa seeds. The
16
study suggested that Mbuja was a cheap functional food that provides both
antioxidants and probiotics. Mbuja production and consumption could therefore
contribute to the consumer’s health
2.5 Functional properties and Phytochemicals
2.5.1 Functional foods
The term "functional food" first appeared in Nature in 1993 in an article titled
"Japan Explores the Boundary between Food and Medicine" (Swinbanks and
O’Brien, 1993).
Functional food is defined as "any food or food ingredient that may provide a health
benefit beyond the traditional nutrients it contains." Health-conscious baby boomers
have made functional foods the leading trend in the U.S. food industry (Meyer,
1998). Estimates, however, of the magnitude of this market vary significantly, as
there is no consensus on what constitutes a functional food. More significant,
perhaps, is the potential of functional foods to mitigate disease, promote health, and
reduce health care costs.
2.5.2 Functional foods from plant sources
Overwhelming evidence from epidemiological, in vivo, in vitro, and clinical trial
data indicates that a plant-based diet can reduce the risk of chronic diseases,
particularly cancer. In 1992, a review of 200 epidemiological studies showed that
cancer risk in people consuming diets high in fruits and vegetables was only one-
17
half that in those consuming diets low in these items (Block et al., 1992). It is now
clear that there are components in a plant-based diet other than traditional nutrients
that can reduce cancer risk. Steinmetz and Potter (1991) identified more than a
dozen classes of these biologically active plant chemicals, now known as
"phytochemicals."
Health professionals are gradually recognizing the role of phytochemicals in health
enhancement (ADA, 1995; and Kritcheveky, 1997). In USA an act has been
enacted, Nutrition Labeling and Education Act of 1990 (NLEA) that requires
nutrition labeling for most foods and allow disease- or health-related messages on
food labels.
Nowadays in most of the developed and developing countries, hyperlipidemia and
thereby atherosclerosis are the leading cause of cardiovascular morbidity and
mortality. A major risk factor for the development of cardiovascular diseases is the
elevated levels of plasma cholesterol (Wald and Law, 1995). It is crucial to
maintain the normal body functions by reducing the elevated serum to adequate
levels. Since the technology of functional food emerged, more and more functional
foods are being developed from plants and regarded as the adjuvant treatment to
some diseases (Demigne et al., 1998; Cheung, et al., 2002).
Recently there has been an increased interest in research on food components such
as anthocyanins and other phenolic compounds because of their possible linkage to
health benefits including reduction in heart disease and cancer, partly based on their
18
antioxidant activity (Seeram, 2002). With the global functional food and beverage
market estimated at $109 billion by 2010 (Watkins, 2008), diverse sources of
phytochemicals are being explored. Polyphenols in beverages are common because
of their beneficial physiological effects on health (Bravo, 1998; Ina et al., 2002).
Additional research is necessary to substantiate the potential health benefits of those
foods for which the diet-health relationships are not sufficiently scientifically
validated.
2.5.3 Phytochemicals
Phytochemicals—the bioactive non-nutrient plant compounds in fruit, vegetables,
grains, and other plant foods have been linked to reductions in the risk of major
chronic diseases.
A large number of Phytochemicals and bioactive components are reported to be
present in foods of plant origins and have become the focus of study in functional
foods. Shahidi (2004;2008) reported that their synergistic effects are rendered by a
combination of phytochemicals present in source materials, and complementary
nature of phytochemicals from different sources are important factors to consider in
the formulation of functional foods and in the choice of a healthy diet.
It is estimated that more than 5000 Phytochemicals have been identified, but a large
percentage still remain unknown (Shahidi, 1995) and need to be identified before
their health benefits are fully understood. However, more and more convincing
evidence suggests that the benefits of Phytochemicals in fruit and vegetables
may be
19
even greater than is currently understood because oxidative stress induced by free
radicals is involved in the etiology of a wide range of chronic diseases (Ames,
1991).
Cells in humans and other organisms are constantly exposed to a variety of
oxidizing agents, some of which are necessary for life. These agents may be present
in air, food, and water, or they may be produced by metabolic activities within cells.
The key factor is to maintain a balance between oxidants and antioxidants
to sustain
optimal physiologic conditions in the body. Overproduction of oxidants can cause
an imbalance, leading to oxidative stress, especially in chronic bacterial, viral, and
parasitic infections (Liu & Hutchkis, 1995). Oxidative stress can cause oxidative
damage to large biomolecules such as proteins, DNA, and lipids, resulting in an
increased risk for cancer and cardiovascular disease (Ames, 1991; 1993). To
prevent or slow down the oxidative stress induced by free radicals,
sufficient
amounts of antioxidants need to be consumed. Fruit and vegetables contain a wide
variety of antioxidant compounds
(Phytochemicals) such as phenolics and
carotenoids that may help protect cellular systems from oxidative damage and lower
the risk of chronic diseases.
20
2.5.3.1 Flavonoids
There has been considerable interest in the flavonoid content of foods and plants
since the early 1980s when the studies of Steinmetz and Potter (1991) demonstrated
a relationship between a diet rich in fruits and vegetables and a reduced risk for
chronic diseases. Because reduced risk did not correlate with traditional nutrients,
attention has focused on many non-nutrient, potentially bioactive compounds, of
which the flavonoids constitute one family (Steinmetz and Potter, 1991).
Flavonoids are naturally-occurring polyphenolic compounds with a C6-C3-C6
backbone. This group of plant pigments which are found in fruits, vegetables,
grains, bark, roots, stems, flowers, tea, and can be chemically subdivided into six
structural categories: flavones, flavonols, flavanones, flavanonols, flavan-3-ols
(catechins), and anthocyanidins. These compounds (aglycones) are commonly
glycosylated (at one or more sites with a variety of sugars) and may also be
alkoxylated or esterified. As a result, over 5000 different flavonoids have been
identified in plant materials (Harborne, 1992). The methods that have been reported
for the determination of flavonoids are based on the aluminium chloride complex
formation, which is one of the most commonly used analytical procedures applied
to the flavonoid content determination in various plants (Grubesic,2007).
In general, aluminum chloride forms acid stable complexes with the C-4 keto group
and either the C-3 or the C-5 hydroxyl group of flavones and flavonols. In addition,
aluminum chloride forms acid labile complexes with the ortho-dihydroxyl groups in
the A or B ring of flavonoids. The analytical methods were used either to determine
21
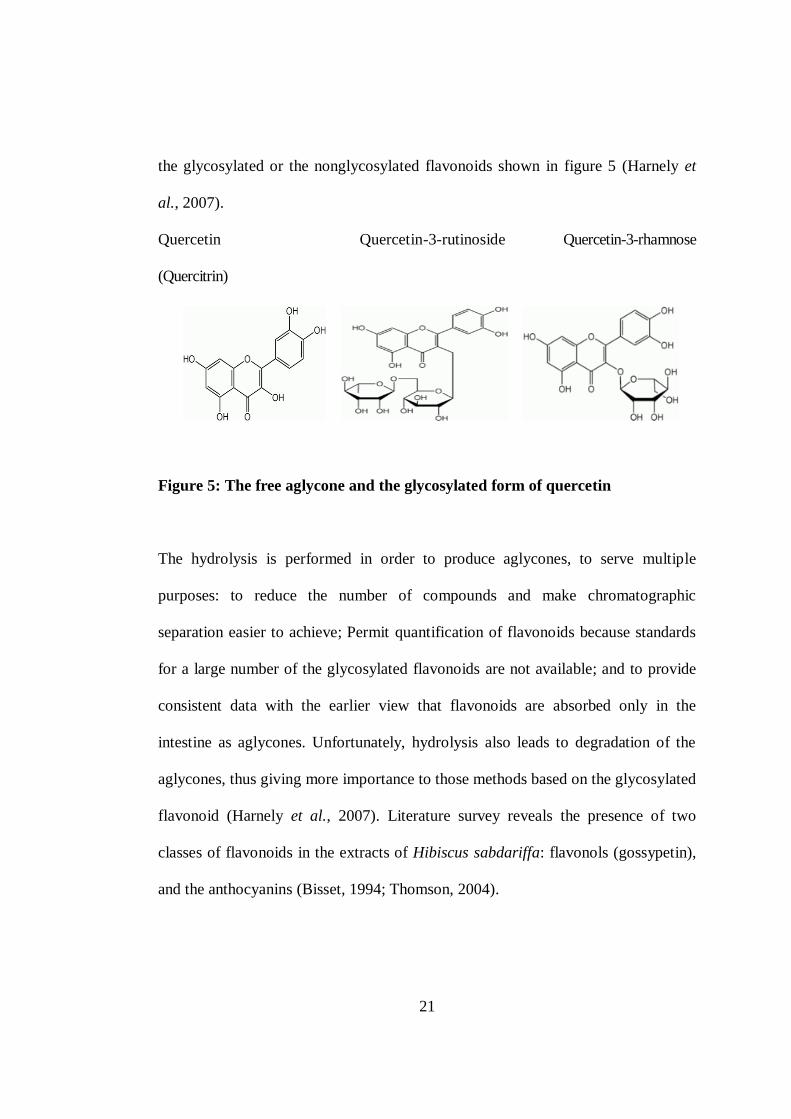
the glycosylated or the nonglycosylated flavonoids shown in figure 5 (Harnely et
al., 2007).
Quercetin Quercetin-3-rutinoside Quercetin-3-rhamnose
(Quercitrin)
Figure 5: The free aglycone and the glycosylated form of quercetin
The hydrolysis is performed in order to produce aglycones, to serve multiple
purposes: to reduce the number of compounds and make chromatographic
separation easier to achieve; Permit quantification of flavonoids because standards
for a large number of the glycosylated flavonoids are not available; and to provide
consistent data with the earlier view that flavonoids are absorbed only in the
intestine as aglycones. Unfortunately, hydrolysis also leads to degradation of the
aglycones, thus giving more importance to those methods based on the glycosylated
flavonoid (Harnely et al., 2007). Literature survey reveals the presence of two
classes of flavonoids in the extracts of Hibiscus sabdariffa: flavonols (gossypetin),
and the anthocyanins (Bisset, 1994; Thomson, 2004).
22
2.5.3.2 Tannins
Tannins are secondary metabolites of plants. They are non-nitrogenous and
phenolic in nature. They have the ability to tan animal skin to convert it to leather
or hide.
Conversion imparts resistance to water, heat, and abrasives. They can be extracted
using water-acetone/alcohol mixture. They also have the ability to precipitate
gelatin & heavy metals. Complex tannins are macro molecules with many sugar
molecules. The three major classes of tannins are the: hydrolysable tannins, non-
hydrolysable tannins (condensed tannins) and the pseudo tannins. Hydrolysable
tannins on heating with hydrochloric or Sulphuric acids yield Gallic or Ellagic
acids. Examples of hydrolysable tannins include: - myrobalon, bahera, which
hazel. Non-hydrolysable tannins on heating with hydrochloric acid yield
phlobaphenes like phloroglucinol.
2.5.3.3 Anthocyanins
Anthocyanins are another group of pigments in plants. The structure of these
anthocyanins differs in the types of anthocyanidins, sugar molecule and numbers,
and types of acylation groups. Due to their bright color and high water solubility,
anthocyanins are considered a potential natural pigment to replace artificial food
colorants (Mazza & Miniati, 1993). Besides the coloring functions, anthocyanins in
foods also possess potent antioxidant capacity and health promoting properties. For
instance, anthocyanins in foods are believed to be able to reduce the risk of
23
cardiovascular diseases for people who consume wine, berry, Roselle and grape.
(IUFOST, 2009)
The mechanism postulated is that anthocyanins act as antioxidants by donating
hydrogen atoms to highly reactive free radicals, breaking the free radical chain
reaction (Rice, et al., 1996). The field of functional foods, however, is in its
infancy. Claims about health benefits of functional foods must be based on sound
scientific criteria (Clydescale, 1997). A number of factors complicate the
establishment of a strong scientific foundation, however. These factors include the
complexity of the food substance, effects on the food, compensatory metabolic
changes that may occur with dietary changes, and, lack of surrogate markers of
disease development.
24
CHAPTER THREE: MATERIALS AND METHODS
3.1 Project site
The research study was based at JKUAT in Food Science & Technology
department.
3.2 Study design
The research study design entailed:
i. Field component: where an identified variety of roselle was planted on
JKUAT farm and somewhere in Kitale.
ii. Laboratory Experimental Analyses: Postharvest operations, Nutrition &
Phytochemical compositional analysis of roselle
iii. New Product development: Whereby various product formulations,
monitoring quality changes after processing, Shelf life stability, sensory
evaluation, and consumer acceptability tests
3.3. Materials Acquisition
Roselle calyces were harvested from the experimental plot in JKUAT farm. Some
more calyces of similar variety for NPD were obtained from Kitale, Kenya.
3.4. Analytical Methods
All chemical reagents were of analytical grade (AR) and all determination done in
triplicate and results reported on dry weight basis (dwb).
25
3.4.1. Proximate Composition and determination of dry matter
3.4.1.1. Moisture content
Moisture was determined according to AOAC methods specification 950.46
Method 925. 10-32.1.03 (AOAC, 1995). Results were reported on dry weight basis.
About 5g of well-ground sample was accurately weighed into a moisture dish and
transferred to an air-oven previously heated to a temperature of 130°C and drying
done for 1 hour to constant weight. The final weight of the sample was taken after
the drying period and cooling in a desiccator. The residue was calculated as percent
total solids and loss in weight as percent moisture by the formula:
Calculations;
% Moisture = Wt of sample before drying – Wt of sample after drying ×100
Wt of sample before drying
3.4.1.2 Determination of crude protein
26
Crude Protein was determined using the Semi-MicroKjeldal method. AOAC
Specification 950.46, Method 20.87-32.1.22. (AOAC, 1995).
About 1g of sample was weighed exactly into a digestion flask together with a
catalyst composed of 5g of K2SO4 and 0.5 g CUSO4 and 15ml of concentrated
H2SO4. The mixture was heated in a fume hood till the digest colour turned blue.
This signified the end of the digestion process. The digest was cooled, transferred to
a 100 ml volumetric flask and topped up to the mark with distilled water. A blank
digestion with the catalysts and acid was also made. Ten (10) ml of diluted digest
was transferred into the distilling flask and washed with about 2 ml distilled water.
15 ml of 40% NaOH was added and this was also washed with about 2 ml distilled
water. Distillation was done to a volume of about 60 ml distillate. The distillate was
titrated using 0.02N-HCl to an orange colour of the mixed indicator which signified
the end point.
Calculations were done using the formula below;
Nitrogen % = (V1 – V2) ×N×f×0.014×100/V×100/S
Where: V1 = Titer for sample (ml); V2 = Titer for blank (ml)
N = Normality of standard HCl solution (0.02)
f = Factor of standard HCl solution
V = Volume of diluted digest taken for distillation (10ml)
S = Weight of sample taken (g)
Protein % = Nitrogen × protein factor.
3.4.1.3 Fat content
27
Fat content was determined using the Soxhlet according to AOAC Method 920.85-
32.1.13 (AOAC, 1995). About 5 g of samples was accurately weighed into
extraction thimbles and the initial weights of the extraction flasks taken. Fat
extraction was done using petroleum spirit in soxhlet extraction apparatus for 8
hours. The extraction solvents were evaporated and the extracted fat dried in an air-
oven at 1000C for about 15 minutes cooled in a dessicator and weighed.
Calculations were done using the formula:
Crude lipid % = Weight of residue × 100
Weight of sample
3.4.1.4 Determination of crude ash
Ash content was determined by incinerating in a muffle furnace Method 923.03-
32.1.05 (AOAC, 1995). Sample weights of between 2-5 g were measured in pre-
conditioned crucibles. The samples were first charred by flame to eliminate
smoking before being incinerated at 550°C in a muffle furnace until a grey-white
ash was obtained. The residues were cooled in desiccators and the weights taken
Calculations were done follows:
% Crude ash = Weight crucible + ash-weight of crucible × 100
Weight of sample
3.4.1.5 Crude fibre

28
Crude fibre was determined according to, AOAC Method 920.86-32.1.15 (AOAC,
1995). Approximately 2g (W) of sample were weighed accurately into a 500 ml
conical flask. About 200 ml of boiling 1.25% H2SO4 was added and boiling done
for 30 minutes under reflux condenser. Filtration was done under slight vacuum
with Pyrex glass filter (crucible type) and the residue washed to completely remove
the acid with boiling water. Approximately 200 ml of boiling 1.25% NaOH was
added to the washed residue and boiling done under reflux for another 30 minutes.
Filtration was done using glass wool filter previously used with the acid. The
residue was rinsed with boiling water followed by 1% HCl and again washed with
boiling water to rinse the acid from the residue. The residue was washed twice with
alcohol and thrice with ether. It was then dried in a Hot-air oven at 105ºC in a
porcelain dish to a constant weight (W1). Incineration was done in a muffle furnace
at 550ºC for 3 hours, the dish was then cooled in a dessicator and the final weight
(W2) taken crude fibre was determined as:.
% Crude fibre = W1. –W2 x 100
.W
Where W1= weight of crucible +dry residue, W2= weight of crucible + ash and W=
weight of sample
29
3.4.1.6 Mineral determination
The ash was cooled after ash determination, 15 ml of 6N HCl was added to each of
them in the crucibles before transferring to 100 ml volumetric flasks. Distilled
water was used to top up to the mark before mineral analysis (AOAC, 1995).
Atomic Absorption Spectroscopy (AAS) was used for Magnesium, Manganase,
Copper, Calcium, Iron and Zinc. Potassium and Sodium where determined using
Flame Emission spectrophotometer was used (Model A A-6200, Shimadzu, Corp.,
Kyoto, Japan).
30
3.4.2 Determination of changes in physico-chemical attributes of roselle
beverages
3.4.2.1 Colour
Tri-stimulus colorimeter was used to take colour measurements (Simple
Spectrophotometer NF 333-Model 99061, Nippon Nenshoku Ind., Tokyo, Japan).
The instrument expresses colour measurement in the CIELAB (L*, a*, b*) form.
The instrument was first calibrated using standard black and white plates (with
transparent papers placed on the standard plates). After calibration colour
measurements were randomly taken in triplicates. The hue angle (h*) which
describes the visual sensation according to an area which appears to be similar to
one or proportions of two of the perceived colours, red yellow, green, and blue was
calculated according to the formula given below.
Hue angle (h*) = tan -1
(‘b*’ / ‘a*’)
Where ‘L*’, ‘a*’, and ‘b*’ are values. Appendix 1 shows the Tristimulus colour
match solid and code table used in colour analysis.

31
3.4.2.2 pH
This was done by the method of Ofori and Hahn (1994). The pH meter was
standardized using buffer solutions of acidic and basic values of 4.01 and 9.08 at
25C (TOA pH Meter HM–7B, Tokyo, Japan). Calibration was done by dipping the
electrode in the acidic buffer solution, adjusting the pH, cleaning the electrode,
dipping it into the basic buffer solution and again adjusting the meter. The electrode
was rinsed with distilled water before taking measurements. The beverages were
homogenized by stirring before measurements of pH were taken to achieve
uniformity. The pH readings were made by dipping the electrode in drink system
and letting it display stability. Measurements were taken from the display screen
when the readings were stable.
3.4.2.3 Total titratable acidity
Total titratable acidity analysis was done using AOAC, 1995 method.
Approximately 10 ml of sample was pipetted into a conical flask and 2 drops of
phenolphthalein indicator added. Titration was done using 0.1N NaOH to a faint
pink colour which persisted for at least one minute compared against a white
background. The titre volume was noted and used for calculations of TTA which
was expressed as percentage Malic acid. Calculations of TTA was done as follows;
% Malic acid = A 0.009 100/V
32
Where: A = ml of 0.1 NaOH required for the titration; and V = ml of sample taken
for the test and 0.009 is a Constant.
3.4.2.3 Major organic acids of roselle
Organic acids were analyzed using HPLC system based on the method of Chen et
al., (2006). Two grams of sample were mashed with 10 ml of 1M HCl. The volume
was made up to 20 ml with 1M HCl. The samples were flushed with nitrogen and
centrifuged at 2000 rpm for 15 minutes. The samples were placed in a water bath at
90 degrees for 30 minutes, and then allowed to cool to room temperature. The
supernatant was collected and filtered through a 0.45μm membrane filter. The
injection volume was 20 μl and column temperature maintained at 40 degrees C.
An isocratic phase of 0.5 % ammonium phosphate, pH adjusted to 2.8 with
phosphoric acid, was used at a flow rate of 0.5ml/min. Detection was done at 214
nm. Means were done based on triplicate determinations. The major organic acids
determined by this method included: Malic acid, Citric acid, Tartaric acid, Oxalic
acid and Acetic acid.
3.4.2.4 Determination of the seven water soluble vitamins of roselle
A reversed-phase HPLC method by Ekinci and Kadakal (2005), modified from Cho
et al., (2000) was used. The sample treatment consisted of SPE with Sep-Pak C18
(500 mg) cartridges that enabled separation of water-soluble vitamins and removed
most of the interfering components. Twenty grams of water were added to 5 g of
the sample. The mixture was homogenized using a homogenizer at medium speed
33
for 1min. The homogenized samples were centrifuged for 10 minutes at 14 103g
(Centrifuge Model H–2000C Shimadzu Corp., Kyoto, Japan). The stationary phase
preparation involved flushing with 10 ml methanol and 10 ml water (pH 4.2) to
activate it. The homogenized and centrifuged samples were then loaded. The
sample was eluted with 5ml acidified water (pH 4.2) then 10 ml methanol at a flow
rate of 1 ml min-1
. The eluent was collected in a bottle and evaporated to dryness.
The residue was dissolved in mobile phase and then filtered through 0.45 m pore
size filters. Approximately 20 l of samples was injected into the HPLC column.
The column elute was monitored with a photodiode-array detector at 234 nm for
thiamine, 265 for vitamin C, 266 for riboflavin, 324 nm for pyridoxine, 282 nm for
folic acid, 204 for panthothenic acid and 261 nm for niacin. Riboflavin was
analyzed separately since the HPLC conditions are different; hence the method is
outlined differently.
The vitamins were analyzed in a HPLC (Model SCL-10A, Shimadzu Corp., Kyoto,
Japan) using a column of inertsil ODS 5µm 4.6 × 250 mm 5LI0101Z with 0.1 mol
/L KH2PO4 (pH 7.0)–methanol, 90:10 mobile phase (filtered through 0.45m
membrane and degassed by sonication), flow rate of 0.5 ml/min, a photodiode-array
detector (Model Waters 2996, Waters Corp., Mailford, USA), oven temperature of
25ºC, and a sample volume of 20 μl.
Identification of compounds was achieved by comparing their retention times and
UV spectra with those of standards stored in a data bank. Five different
concentrations of each standard were used to prepare calibration plots for each
vitamin. This was done by plotting concentration (μg/ml) against peak area (mAU).
34
Their correlation coefficients were greater than 0.997 (Appendix 2). Concentrations
of the water-soluble vitamins were calculated from integrated areas of the sample
and the corresponding standards.
Vitamin content (mg/g) = (y/b) (dilution factor / weight of sample (g) 1000)
Where y=is the y intercept of obtained from the standard curve of the vitamin in
question, and b is the peak area of the injected sample
Riboflavin
Riboflavin was determined using HPLC (AOAC, 1995). Approximately 1 g of
ground sample was mixed with 10 ml of distilled water and homogenized. The pH
was adjusted to 3.0 using acetic acid glacial (1:1 v/v). The sample was vortexed
before centrifugation at 10,000 rpm for 20 minutes and the resulting supernatant
transferred into a 25 ml volumetric flask (Centrifuge Model H–2000C, Shimadzu
Corp., Kyoto, Japan). The sediment was washed with 5 ml of 2% acetic acid
solution, the washings combined and centrifuged. The second supernatant was
added to the first and volume made to the mark using 2% acetic acid solution.
Filtration was done and the sample injected into the HPLC.
The HPLC (Model C–R7A plus chromatopac, Shimadzu Corp., Kyoto, Japan).
Operating conditions included: Column; Inertsil, ODS (C18) 5m 250 4.6 mm,
Mobile phase; Methanol: Water: acetic acid (40:59.5:0.5), Detector; UV-VIS Model
MDS510M-24-F2 Shimadzu Corp., Kyoto, Japan. The Analysis wavelength was
270 nm at 0.02 sensitivity, Flow rate; 0.5-1.0 ml/min, Injection volume: 10 l. The
35
centrifuge micro-filters size was 0.45 m. Riboflavin standard stock solution of
1000 ppm in 2% aqueous acetic acid was prepared and serial dilutions of 100-600
ppm were made. The standards were injected into the HPLC and corresponding
peak areas obtained and used to plot a standard curve (Appendix III) whose
equation was used to calculate the quantity of riboflavin as follows;
Calculations;
Vitamin content (mg/g) = (y/b) (dilution factor / weight of sample (g) 1000)
Where y=is the y intercept of obtained from the standard curve of the riboflavin,
and b is the peak area of the injected sample.
3.4.3 Phytochemicals in roselle
All analytical methods for quantifying the biologically active compounds present in
roselle calyces involved extraction, separation and analysis. (Gordana et al., 2008).
A procedure by Suhad and Viorica (2008) that was simple, rapid and economical
was used in the quantitative analysis of the phytochemicals.
3.4.3.1 Tannins
This was done according to the Vanillin-Hydrochloric Acid method (Burns, 1963;
Price et al., 1978). Approximately 0.25 g of ground samples were weighed into
Erlenmeyer flasks. Ten (10) ml of 4% HCl in methanol was pipetted into each of
the flasks and closed with parafilm. The flasks were gently shaken for 20 minutes in
a shaker (Model KS 250 basic, Germany) and the resulting extracts centrifuged for
10 minutes at 4500 rpm (Model H–2000C, Kokusan Corp., Tokyo, Japan). The
36
supernatant aliquots were transferred to 25 ml volumetric flasks. Second extractions
were done by adding 5 ml of 1% HCl in methanol to the residue from the first
extraction and repeating the extraction process. The aliquots of the first and second
extracts were combined and made up to 25 ml in a volumetric flask. Approximately
1 ml of each extract was pipetted to a corresponding labeled test tube. A set of
catechin standard solutions was prepared ranging from 100 to 1000 ppm using
methanol as the solvent. Approximately 1 ml of each respective standard and
sample extract were pipetted into test tubes and 5 ml of freshly prepared vanillin-
HCl reagent added to each. Sample blanks were prepared by adding 5 ml of 4%
HCl in methanol to 1ml of the aliquots of the extracts pipetted into the test tubes.
The absorbance of the standard solutions, sample extracts and blanks were read in a
UV-VIS spectrophotometer at 500 nm 20 minutes after adding Vanillin-HCl
reagent to the samples and standards (UV mini 1240 model, Shimadzu Corp.,
Kyoto, Japan).
A standard curve was prepared from the readings of the catechin standard solutions
(Appendix ii). The blank absorbance were subtracted from the samples absorbance
and the corrected absorbance substituted into the regression equation (y = 0.0004x,
R=0.9972) in order to calculate the concentration of the sample extracts.
The concentration in µg per ml was converted in to mg catechin per ml. The percent
catechin equivalents (% CE) were calculated as follows:
% CE = (CC × VM) / (VE × Wt) × 100
37
Where: CC = catechin concentration (mg/ml); VM = volume made up (25 ml); VE
= volume of extract (1 ml); and Wt
3.4.3.2 Total polyphenol content
The total polyphenol content (TPC) was determined using the Folin-Ciocalteu
method. Solvent extraction was carried out using 50% methanol and ethanol
solutions at 25oC. A measure of 0.4 g of the ground sample was put in a conical
flask and 40 ml of the solvent was added. The mixture was covered with aluminium
foil and allowed to settle without shaking for 2 hours. The extract was then be
filtered using a 0.45 um microfilter. The filtrate was directly used for analysis using
UV-Vis spectrometer at 760 nm after color development.
3.4.3.3 Flavonoids
The flavonoids were determined as described by Chang et al., (2002).
Sample extracts were evaporated to dryness and re-dissolved in 80 % ethanol to be
ready for the analytical test. 1 mL of a sample (ethanolic solutions or rselle extract)
was mixed with 3 mL 95 % ethanol (V/V), 0.2 mL 10 % aluminum chloride (m/V),
0.2 mL of 1 mol L–1
potassium acetate and 5.6 mL water. A volume of 10 % (m/V)
aluminum chloride was substituted by the same volume of distilled water and used
as a blank.
After incubation at room temperature for 30 minutes, the absorbance of the reaction
mixture was measured at 415 nm.
38
Each extract was hydrolyzed with 4 N HCl (1:1) for 30minutes, then the flavonoids
were extracted with three quantities of ethyl acetate (each of 15 mL), after which
the ethyl acetate layer was evaporated to dryness under reduced pressure, then the
residue was re-dissolved using 80 % ethanol to a volume of 25 mL. This solution
was used for the analytical procedure. Flavonoids in roselle extracts were expressed
as quercetin equivalent. Quercetin (Sigma, Germany) was used to perform the
calibration curve (standard solutions of 6.25, 12.5, 25.0, 50.0, 80.0 and 100.0 µg
mL-1
in 80 % ethanol (V/V).
3.4.4 Antioxidant activity
The radical-scavenging activity was determined using diphenyl picryl hydrazyl
radical (DPPH) according to Ayoola et al. (2006). The following concentrations of
the extracts were prepared, 0.05, 0.1, 0.5, 1.0, 2.0 and 5 mg/ml in methanol in
cuvette placed in the spectrophotometer (Analar grade). Ascorbic acid was used as
the antioxidant standard at concentrations of 0.02, 0.05, 0.1, 0.2, 0.5 and 0.75
mg/ml. One ml of the extract was placed in a test tube, and 3 ml of methanol added
followed by 0.5 ml of 1 mM DPPH in methanol. The mixture was shaken
vigorously and left to stand for 5 minutes. A blank solution was prepared containing
the same amount of methanol and DPPH. The absorbance of the resulting solution
was measured at 517 nm with a spectrophotometer. The radical scavenging activity
was calculated using the following formula:
% inhibition = {[Ab-Aa]/Ab} x 100
39
Where Ab is the absorption of the blank sample and Aa is the absorption of the
extract. All tests were run in triplicate, and analyses of all samples run in duplicate
and averaged.
3.5 New product development from roselle
The roselle beverages was extracted 1:40 of calyces to purified water. Natural
preservative as lemon dash (juice already pasteurized), this also imparted flavour.
The beverages with the characteristic colour and flavour of roselle were sweetened
with natural sugar at 10% as minimum sugar (KEBS, 1996). The beverages were
sieved with size 14 sieves and strained with a piece of white cloth until they were
crystal clear (isotonic) (Fellows, 1997).
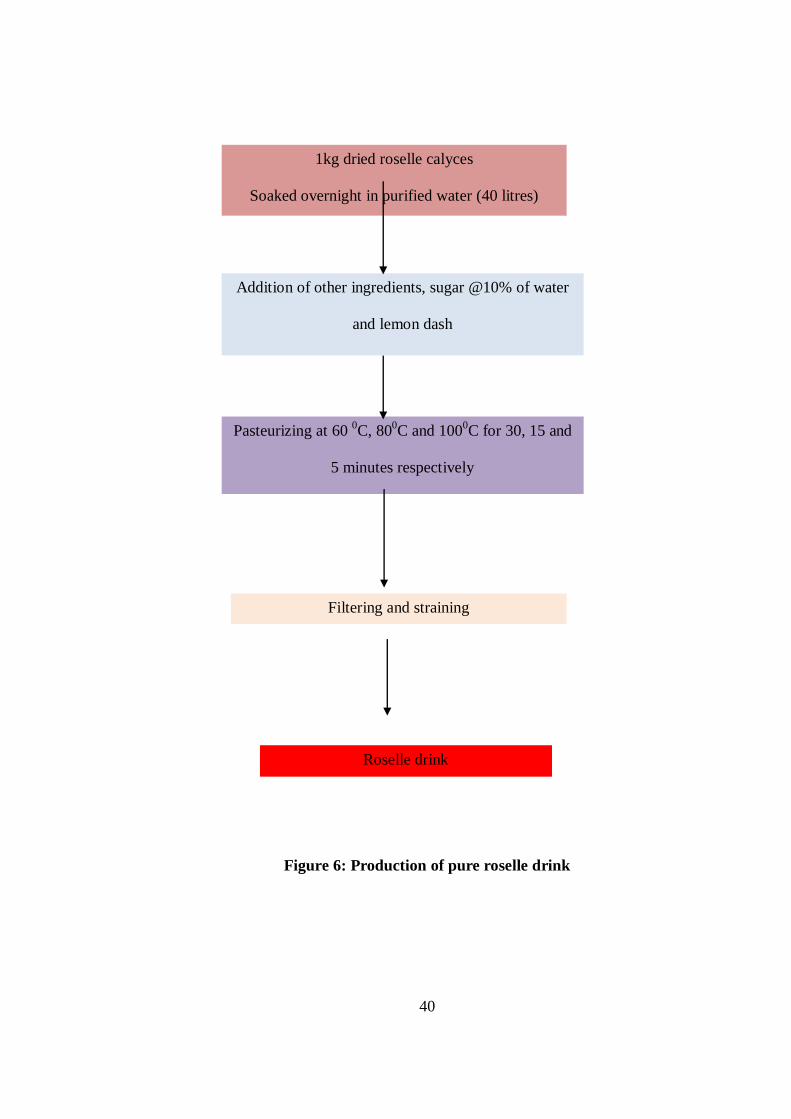
3.5.1 Processing of roselle drink
Roselle calyces were sorted, washed and soaked for 2 hours in water. They were
pasteurized at 1000C, 80
0C and 60
0C for 5, 15 and 30 minutes, respectively in order
to ascertain temperature/ time regime for optimal retention of both the nutrients and
functional properties due to Phytochemicals present. The extract was then filtered
while still hot and packaged at 450C to avoid collapsing of the packaging bottles
and ensure good manufacturing practices GMP are followed. Packaging while still
hot minimized the possible chances of microbial growth Figure 6 is a summary of
the processing of the 100% Roselle drink.
40
Figure 6: Production of pure roselle drink
Pasteurizing at 60 0C, 80
0C and 100
0C for 30, 15 and
5 minutes respectively
Filtering and straining
1kg dried roselle calyces
Soaked overnight in purified water (40 litres)
Roselle drink
Addition of other ingredients, sugar @10% of water
and lemon dash
lemon essence
Straining
41
3.5.2 Processing of roselle beverages blended with selected juices.
Roselle beverages incorporating roselle calyces extract with either apples, oranges
or watermelons formulated. Figure 7 is a summarized production flow chart.
Roselle Apple Drink (RAD):
Forty apples of about 500g were washed with tap water, sliced and using a fruit
blender the juice was squeezed, the residue was mixed with the juice and 10%
water.
Roselle Orange Drink (ROD):
Forty kilograms of oranges were washed with tap water, cut into halves and using a
squeezer juice was extracted by pressing. The juice extract was filtered, measured.
Roselle Watermelon Drink (RMD):
The water melons were subsequently washed in tap water with food grade soap
rinsed and sliced into sizeable pieces. The pulp was extracted and using a fruit
juicer, juice was extracted. The juice was filtered, measured and then mixed with
(50%), (60%) and (75%) of roselle extract respectively. All other ingredients
including Lemon dash (extracted and pasteurized lemon juice) and 10% sugar
(weight of dispersing medium in this case water) (KEBS, 1996) were added to each
formulation.
Pasteurizing of the blended mix was done at 60 0C, 80
0C and 100
0C for 30,15 15
and 5 minutes respectively in order to establish the optimal processing temperature/
time regime for better phytochemical extraction as well as nutrition and functional
property retention.
42
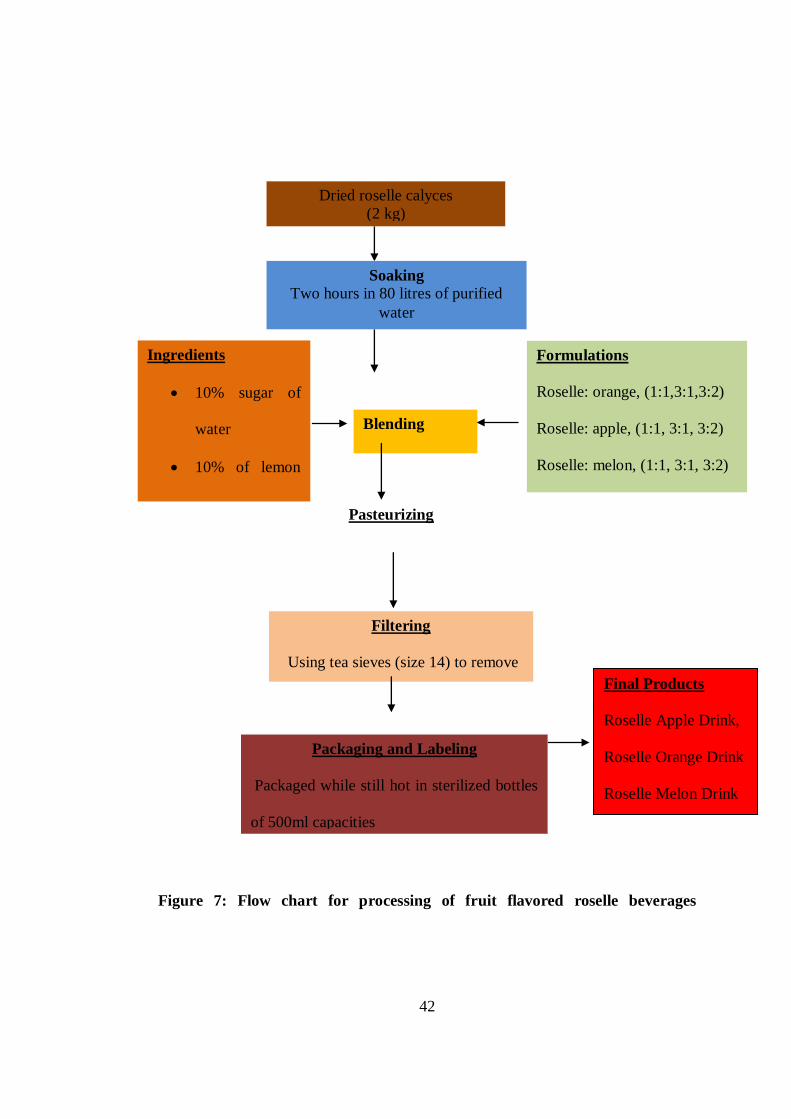
Figure 7: Flow chart for processing of fruit flavored roselle beverages
Blending
Final Products
Roselle Apple Drink,
Roselle Orange Drink
Roselle Melon Drink
Packaging and Labeling
Packaged while still hot in sterilized bottles
of 500ml capacities
Labeling and storage
Filtering
Using tea sieves (size 14) to remove
residues
Pasteurizing
Soaking
Two hours in 80 litres of purified
water
Dried roselle calyces
(2 kg)
Ingredients
10% sugar of
water
10% of lemon
dash to each for
Formulations
Roselle: orange, (1:1,3:1,3:2)
Roselle: apple, (1:1, 3:1, 3:2)
Roselle: melon, (1:1, 3:1, 3:2)
43
3.6 Shelf life Stability of roselle beverages
Shelf life stability was analyzed by determining the microbial load of the beverages.
Also observation was used to monitor the quality changes in the product. Samples
of 500 ml of the beverages were packaged in transparent bottles and stored at 250C
and 80% RH (room temperature conditions of temperature and humidity
respectively). A portion of the sample was taken from the same bottle each time
during the analysis after which the bottle was carefully sealed and kept at the
aforementioned condition. The total plate count (TPC), yeast and mold counts were
determined after every 14 days to determine how long the product would store and
still be suitable for consumption. The general aesthetic appeal (that is the
appearance in terms of colour and luster) of the products was also observed and
colour changes monitored over a period of two months, 60 days.
3.6.1 Total plate count
Total plate count was done according to AOAC, (1995) methods. Initial product
sample homogenates were prepared in sterile diluents in ratios of 1:10. For each
homogenate, 1ml was aseptically diluted through a series of tubes containing 9ml
sterile diluents. Approximately 1ml of diluents of each tube were spread plated on
to Plate Count Agar (PCA) and incubated for 48 hrs at 35ºC. Plates with less than
300 colonies were counted and the number of bacterial colonies expressed as
colony forming units per gram (CFU/g) of the sample using the formula from
International Dairy Federation method (IDF, 1996) as follows;
44
Log C = Σ x/n1+ (0.1n2) x d
Where: C = Count CFU/g; x = Total number of colonies in all plates; n1 = number
of plate from initial dilution where counts were made; n2 = number of plates from
second dilution from where counting was done; and d = initial dilution of counting.
3.6.2 Yeast and mould count
The mould count was carried out using potato dextrose agar (PDA) AOAC (1995).
Initial product sample homogenates were prepared in sterile diluents in ratios of
1:10. 1 ml of each homogenate was then aseptically diluted in series up to a dilution
of 10-3
. The diluents were then pour plated in duplicates. Incubation of the plates
was done at 25ºC for 72 hours. The number of yeast and molds were expressed as
colony forming units per gram (CFU/g) using the formula in TPC determination.
3.7 Sensory evaluation of roselle beverages
The products developed were randomly subjected to sensory evaluation to
determine the most preferred using a semi structured questionnaire (Appendix iii).
This was done by a team of 60 untrained panelists. Each recorded their degrees of
likes and dislikes on the taste, color, consistency, flavor and overall acceptability of
the formulated products using a 9-point hedonic scale (Ihekoronye and Ngoddy,
1985). Where by a score of 9 implied the panelist liked very much, while a score of
1 implied dislike very much. Conversely, a score less than 5 meant the product was
generally not acceptable and therefore reformulation or total disposal of the product
development process. Before each sample testing, the panelists rinsed their mouth
45
with water. The assessment was carried out under natural light at a temperature of
25ºC (room temperature). A copy of the questionnaire used is attached as Appendix
III. The data was analyzed using the two way analysis of variance (ANOVA).
Significant differences in the means were separated by Duncan’s Multiple Range
tests (Steel and Torrie, 1980).
3.8 Data management and analysis
Data was verified, analyzed using Analysis of Variance (ANOVA) with Genstat.
Mean comparisons for treatments were made using Duncan's Multiple Range Tests
(Steel and Torrie, 1980). Significance difference was set at p≤0.05.
46
CHAPTER FOUR: RESULTS AND DISCUSSION
4.1 Proximate composition of roselle
Table 1 shows proximate composition of the roselle calyces. Soluble carbohydrates
were the most abundant nutrient at 66.3%; this was followed by crude fibre with
14.6%. The calyces had appreciable amounts of crude protein (5%) and crude ash
of 12%. These results were converted into dry matter basis (dmb) similarly, the
results were found to be in agreement with those found by other researchers like
Babalola (2001) and Ojokoh (2003). However, the various were observed in that
Ojokoh found higher contents of dry matter in roselle .The high carbohydrate
content which is mainly sugars is promising in product development of roselle
beverages, Omemu (2006).
Table 1: Proximate composition of roselle calyces (g/100g of sample) dmb
Parameter Amount (g/100g)
Soluble Carbohydrates
66.3 ± 0.7
Crude Fibre
14.6 ± 0.5
Ash
12.2 ± 0.3
Crude Protein
4.7 ± 0.1
Crude lipids 2.2 ± 0.1
Values are presented as means of triplicate determinations ±SD
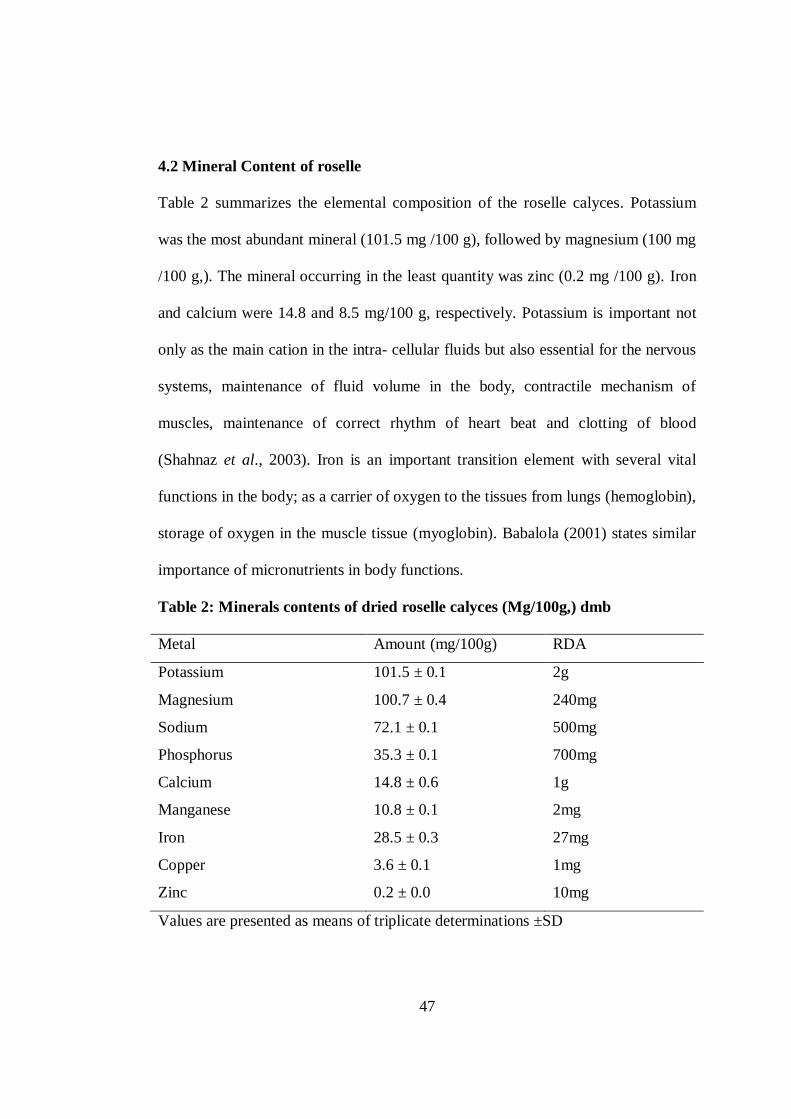
47
4.2 Mineral Content of roselle
Table 2 summarizes the elemental composition of the roselle calyces. Potassium
was the most abundant mineral (101.5 mg /100 g), followed by magnesium (100 mg
/100 g,). The mineral occurring in the least quantity was zinc (0.2 mg /100 g). Iron
and calcium were 14.8 and 8.5 mg/100 g, respectively. Potassium is important not
only as the main cation in the intra- cellular fluids but also essential for the nervous
systems, maintenance of fluid volume in the body, contractile mechanism of
muscles, maintenance of correct rhythm of heart beat and clotting of blood
(Shahnaz et al., 2003). Iron is an important transition element with several vital
functions in the body; as a carrier of oxygen to the tissues from lungs (hemoglobin),
storage of oxygen in the muscle tissue (myoglobin). Babalola (2001) states similar
importance of micronutrients in body functions.
Table 2: Minerals contents of dried roselle calyces (Mg/100g,) dmb
Metal Amount (mg/100g) RDA
Potassium 101.5 ± 0.1 2g
Magnesium 100.7 ± 0.4 240mg
Sodium 72.1 ± 0.1 500mg
Phosphorus 35.3 ± 0.1 700mg
Calcium 14.8 ± 0.6 1g
Manganese 10.8 ± 0.1 2mg
Iron 28.5 ± 0.3 27mg
Copper 3.6 ± 0.1 1mg
Zinc 0.2 ± 0.0 10mg
Values are presented as means of triplicate determinations ±SD
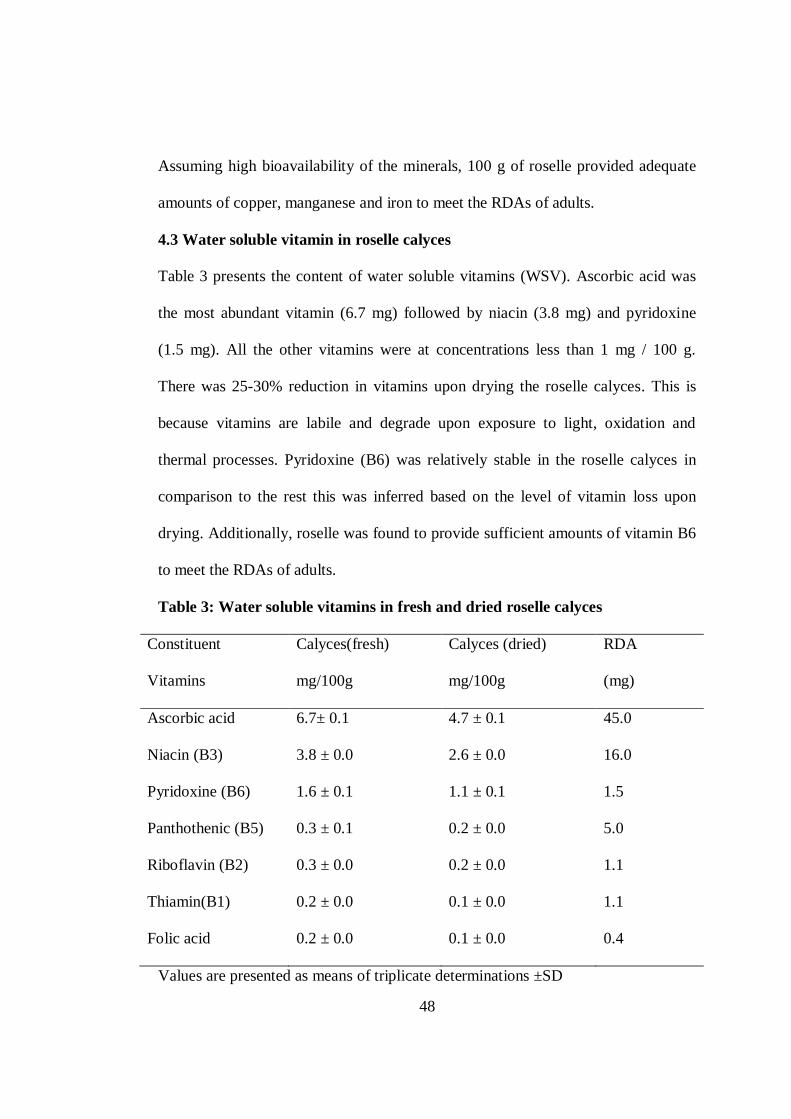
48
Assuming high bioavailability of the minerals, 100 g of roselle provided adequate
amounts of copper, manganese and iron to meet the RDAs of adults.
4.3 Water soluble vitamin in roselle calyces
Table 3 presents the content of water soluble vitamins (WSV). Ascorbic acid was
the most abundant vitamin (6.7 mg) followed by niacin (3.8 mg) and pyridoxine
(1.5 mg). All the other vitamins were at concentrations less than 1 mg / 100 g.
There was 25-30% reduction in vitamins upon drying the roselle calyces. This is
because vitamins are labile and degrade upon exposure to light, oxidation and
thermal processes. Pyridoxine (B6) was relatively stable in the roselle calyces in
comparison to the rest this was inferred based on the level of vitamin loss upon
drying. Additionally, roselle was found to provide sufficient amounts of vitamin B6
to meet the RDAs of adults.
Table 3: Water soluble vitamins in fresh and dried roselle calyces
Constituent
Vitamins
Calyces(fresh)
mg/100g
Calyces (dried)
mg/100g
RDA
(mg)
Ascorbic acid 6.7± 0.1 4.7 ± 0.1 45.0
Niacin (B3) 3.8 ± 0.0 2.6 ± 0.0 16.0
Pyridoxine (B6) 1.6 ± 0.1 1.1 ± 0.1 1.5
Panthothenic (B5) 0.3 ± 0.1 0.2 ± 0.0 5.0
Riboflavin (B2) 0.3 ± 0.0 0.2 ± 0.0 1.1
Thiamin(B1) 0.2 ± 0.0 0.1 ± 0.0 1.1
Folic acid 0.2 ± 0.0 0.1 ± 0.0 0.4
Values are presented as means of triplicate determinations ±SD

49
4.4 Levels of the major organic acids in roselle calyces
Table 4 presents some of the major organic acids that were found in roselle extract.
As a characteristic of the Malvacea family, high amounts of Malic acid content was
found (560 mg/100 g), Oxalic acid, usually found in green leaves, was found in the
calyces in considerable amounts (150 mg/100 g). Other organic acids identified in
roselle included Tartaric acid, Citric acid, and Acetic acid. Unidentified peaks were
also noted and suspected to be some unclassified organic acids like Succnic,
Hibiscicic. Organic acid content of a fruit is an important factor for the
development of its flavor (Gansch, 2009).
Table 4: Major organic acids in dried roselle calyces.
Organic acid Amount (mg/100g)
Malic 560 ± 13
Citric acid 70 ± 2.5
Tartaric acid 46 ± 2.6
Oxalic acid 148 ± 7.2
Acetic acid 115 ± 5.5
Values are presented as means of triplicate determinations ±SD
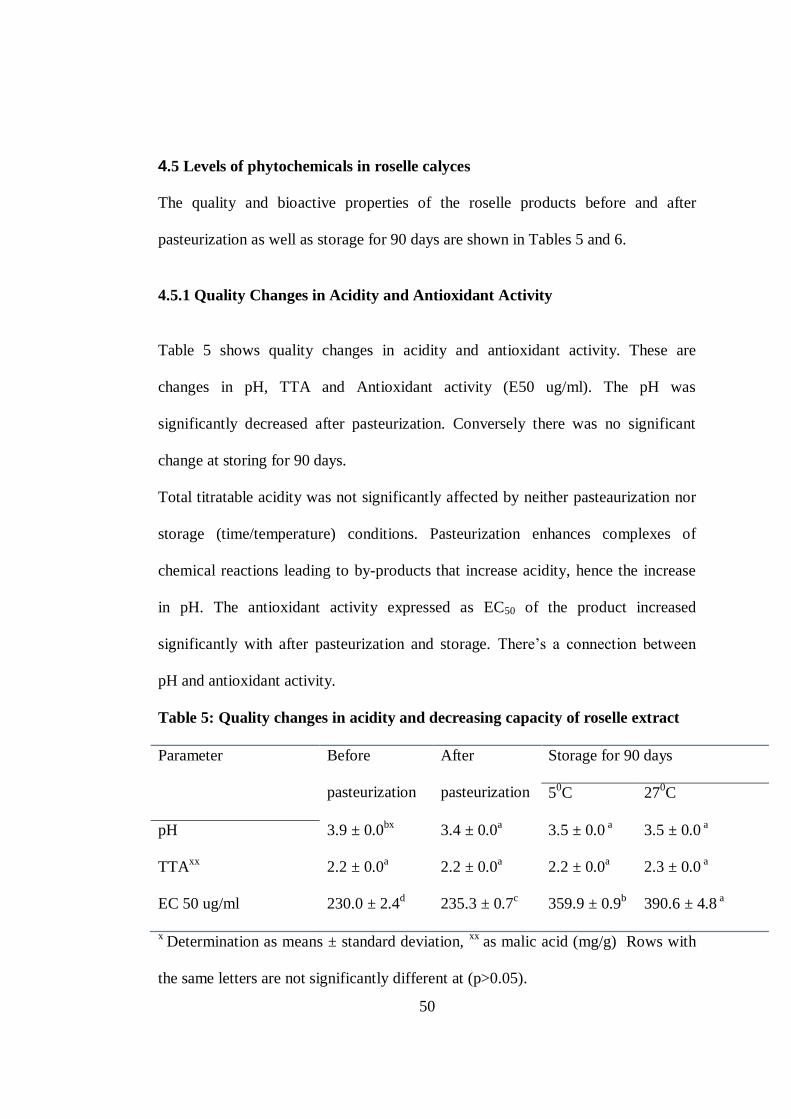
50
4.5 Levels of phytochemicals in roselle calyces
The quality and bioactive properties of the roselle products before and after
pasteurization as well as storage for 90 days are shown in Tables 5 and 6.
4.5.1 Quality Changes in Acidity and Antioxidant Activity
Table 5 shows quality changes in acidity and antioxidant activity. These are
changes in pH, TTA and Antioxidant activity (E50 ug/ml). The pH was
significantly decreased after pasteurization. Conversely there was no significant
change at storing for 90 days.
Total titratable acidity was not significantly affected by neither pasteaurization nor
storage (time/temperature) conditions. Pasteurization enhances complexes of
chemical reactions leading to by-products that increase acidity, hence the increase
in pH. The antioxidant activity expressed as EC50 of the product increased
significantly with after pasteurization and storage. There’s a connection between
pH and antioxidant activity.
Table 5: Quality changes in acidity and decreasing capacity of roselle extract
Parameter Before
pasteurization
After
pasteurization
Storage for 90 days
50C 27
0C
pH 3.9 ± 0.0bx
3.4 ± 0.0a 3.5 ± 0.0
a 3.5 ± 0.0
a
TTAxx
2.2 ± 0.0a 2.2 ± 0.0
a 2.2 ± 0.0
a 2.3 ± 0.0
a
EC 50 ug/ml 230.0 ± 2.4d 235.3 ± 0.7
c 359.9 ± 0.9
b 390.6 ± 4.8
a
x Determination as means ± standard deviation,
xx as malic acid (mg/g) Rows with
the same letters are not significantly different at (p>0.05).
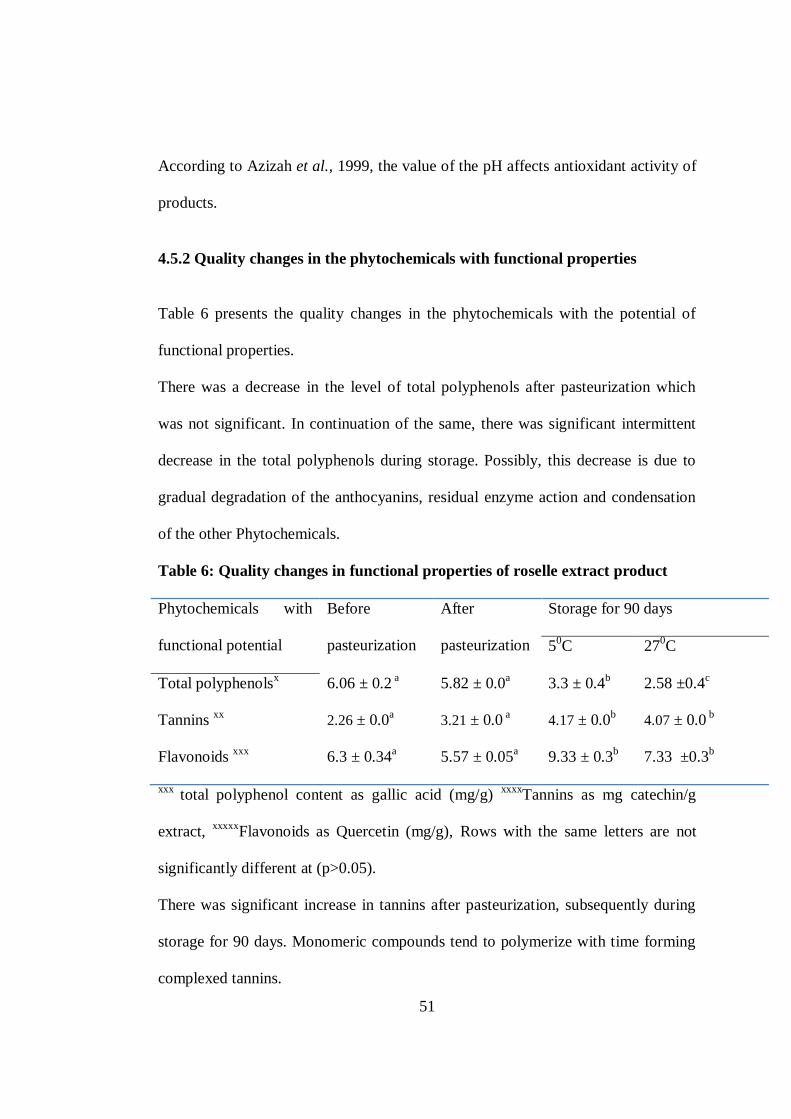
51
According to Azizah et al., 1999, the value of the pH affects antioxidant activity of
products.
4.5.2 Quality changes in the phytochemicals with functional properties
Table 6 presents the quality changes in the phytochemicals with the potential of
functional properties.
There was a decrease in the level of total polyphenols after pasteurization which
was not significant. In continuation of the same, there was significant intermittent
decrease in the total polyphenols during storage. Possibly, this decrease is due to
gradual degradation of the anthocyanins, residual enzyme action and condensation
of the other Phytochemicals.
Table 6: Quality changes in functional properties of roselle extract product
Phytochemicals with
functional potential
Before
pasteurization
After
pasteurization
Storage for 90 days
50C 27
0C
Total polyphenolsx
Tannins xx
6.06 ± 0.2 a
2.26 ± 0.0a
5.82 ± 0.0a
3.21 ± 0.0 a
3.3 ± 0.4b
4.17 ± 0.0b
2.58 ±0.4c
4.07 ± 0.0 b
Flavonoids xxx
6.3 ± 0.34a
5.57 ± 0.05a 9.33 ± 0.3
b 7.33 ±0.3
b
xxx total polyphenol content as gallic acid (mg/g)
xxxxTannins as mg catechin/g
extract, xxxxx
Flavonoids as Quercetin (mg/g), Rows with the same letters are not
significantly different at (p>0.05).
There was significant increase in tannins after pasteurization, subsequently during
storage for 90 days. Monomeric compounds tend to polymerize with time forming
complexed tannins.
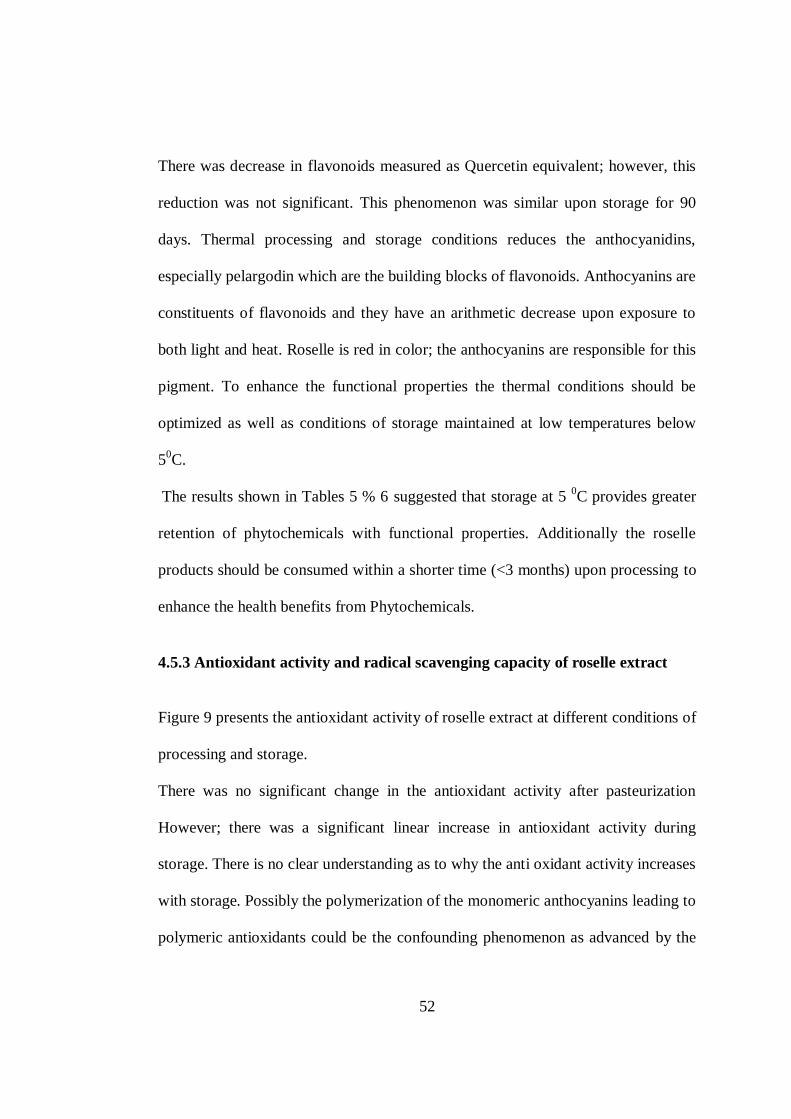
52
There was decrease in flavonoids measured as Quercetin equivalent; however, this
reduction was not significant. This phenomenon was similar upon storage for 90
days. Thermal processing and storage conditions reduces the anthocyanidins,
especially pelargodin which are the building blocks of flavonoids. Anthocyanins are
constituents of flavonoids and they have an arithmetic decrease upon exposure to
both light and heat. Roselle is red in color; the anthocyanins are responsible for this
pigment. To enhance the functional properties the thermal conditions should be
optimized as well as conditions of storage maintained at low temperatures below
50C.
The results shown in Tables 5 % 6 suggested that storage at 5 0C provides greater
retention of phytochemicals with functional properties. Additionally the roselle
products should be consumed within a shorter time (<3 months) upon processing to
enhance the health benefits from Phytochemicals.
4.5.3 Antioxidant activity and radical scavenging capacity of roselle extract
Figure 9 presents the antioxidant activity of roselle extract at different conditions of
processing and storage.
There was no significant change in the antioxidant activity after pasteurization
However; there was a significant linear increase in antioxidant activity during
storage. There is no clear understanding as to why the anti oxidant activity increases
with storage. Possibly the polymerization of the monomeric anthocyanins leading to
polymeric antioxidants could be the confounding phenomenon as advanced by the
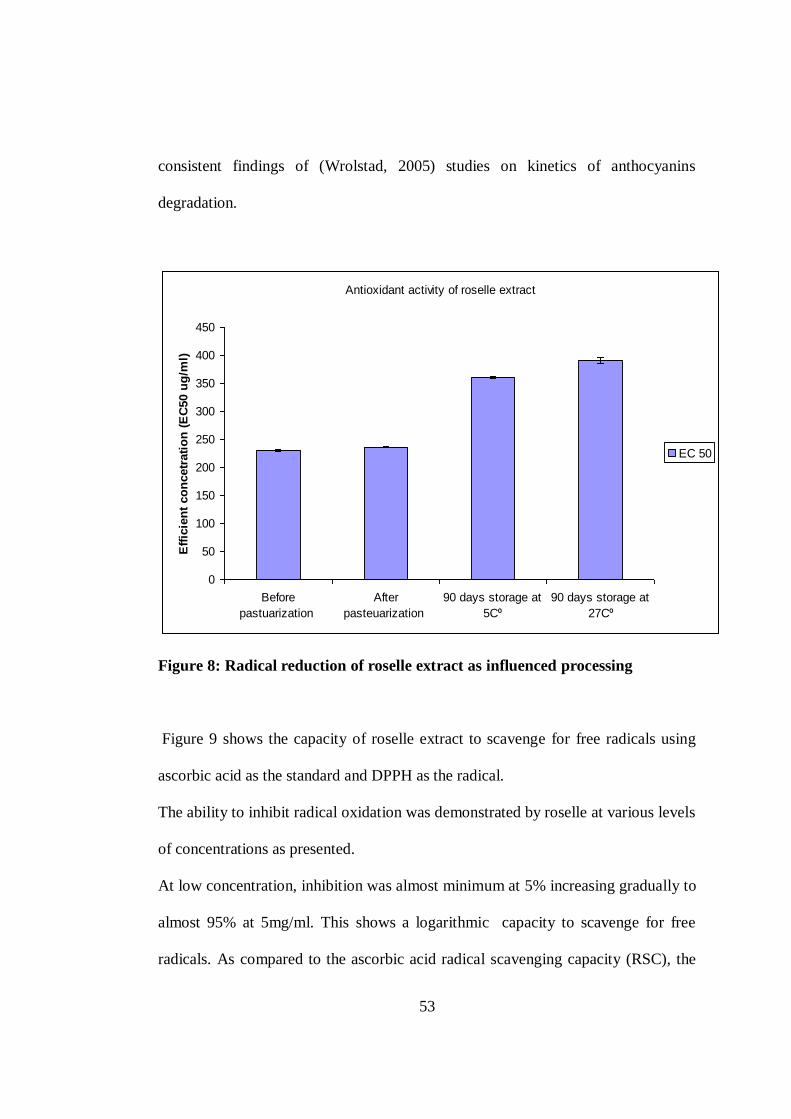
53
consistent findings of (Wrolstad, 2005) studies on kinetics of anthocyanins
degradation.
Antioxidant activity of roselle extract
0
50
100
150
200
250
300
350
400
450
Before
pastuarization
After
pasteuarization
90 days storage at
5C⁰
90 days storage at
27C⁰
Eff
icie
nt
co
ncetr
ati
on
(E
C50 u
g/m
l)
EC 50
Figure 8: Radical reduction of roselle extract as influenced processing
Figure 9 shows the capacity of roselle extract to scavenge for free radicals using
ascorbic acid as the standard and DPPH as the radical.
The ability to inhibit radical oxidation was demonstrated by roselle at various levels
of concentrations as presented.
At low concentration, inhibition was almost minimum at 5% increasing gradually to
almost 95% at 5mg/ml. This shows a logarithmic capacity to scavenge for free
radicals. As compared to the ascorbic acid radical scavenging capacity (RSC), the

54
results suggested the potential of roselle extract to scavenge for free radicals. This
capacity is what constitutes the functional properties important for formulation of
Functional food products.
% Inhibition of Roselle extract
0
20
40
60
80
100
120
1 2 3 4 5
Conc(Mg/ml)
% R
SC
Figure 9: Percentage reduction of roselle extract at different concentrations
Total polyphenol content (TPC) in roselle was measured and related to their DPPH
radical scavenging capacity. As expected, they showed a close relationship (0.95).
The total polyphenol content and DPPH radical scavenging capacity of roselle was
high.
There was direct correlation between Gallic acid concentration and
spectrophotometer absorbance at 760 nm with a gradient of 0.7936 and correlation
coefficient (R2) of 0.9857. The TPC generally increased with increase in
temperature of 600C, 80
0C, 100
0C for 51.7mg/g, 62.5mg/g and 73.58mg/g
respectively. Gansch (2009) tested TPC in Raspberry cultivars and it ranged from
342.0 to 875.3 mg of GAE/100g of fresh weights.
55
The relatively lower levels of total polyphenol in Hibiscus sabdariffa could be
attributed to the type of food matrix; roselle is a flower while raspberry is a fruit.
Fruits are more concentrated in total polyphenols (Ganch,2009)
And in view of the abundant total phenolcs, flavonoids, pleasing aesthetic appeal
and other phytochemicals, roselle can be considered as a functional food/ ingredient
with potential to offer functional properties.
4.6 Indices for polymeric color changes of roselle beverages.
Fig. 11 shows how the color of roselle drink changed in a period of two months as
depicted by the calculated hue (h*) angle. The intensity of the pigment degradation
was depicted by plotting the chroma (c*) calculated as (a*2+b*
2 )
1/2 values against
time as shown in Figure 11
The color changed gradually darkened. This was anticipated because of the
decrease in pH, co-pigmentation, oxidation and certainly the thermal processing of
the products. Several studies have reported a logarithmic course of anthocyanin
destruction with an arithmetic increase in temperature (Drdak and Dancik, 1990).
Color degradation in roselle may have been as a result of anthocyanin degradation.
According to Wrolstad (2005) a coloured sample of different dilution strengths will
have the same color (hue angle) but different chroma (saturation or intensity)
values.
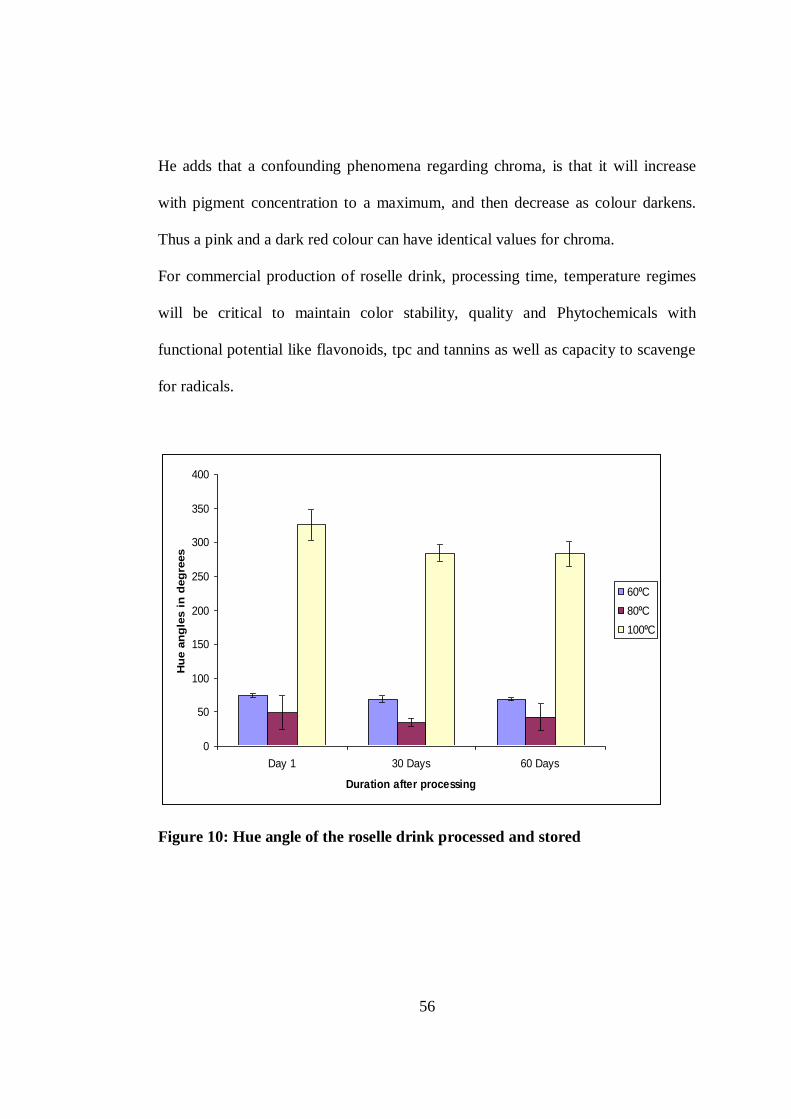
56
He adds that a confounding phenomena regarding chroma, is that it will increase
with pigment concentration to a maximum, and then decrease as colour darkens.
Thus a pink and a dark red colour can have identical values for chroma.
For commercial production of roselle drink, processing time, temperature regimes
will be critical to maintain color stability, quality and Phytochemicals with
functional potential like flavonoids, tpc and tannins as well as capacity to scavenge
for radicals.
0
50
100
150
200
250
300
350
400
Day 1 30 Days 60 Days
Duration after processing
Hu
e a
ng
les i
n d
eg
rees
60⁰C
80⁰C
100⁰C
Figure 10: Hue angle of the roselle drink processed and stored
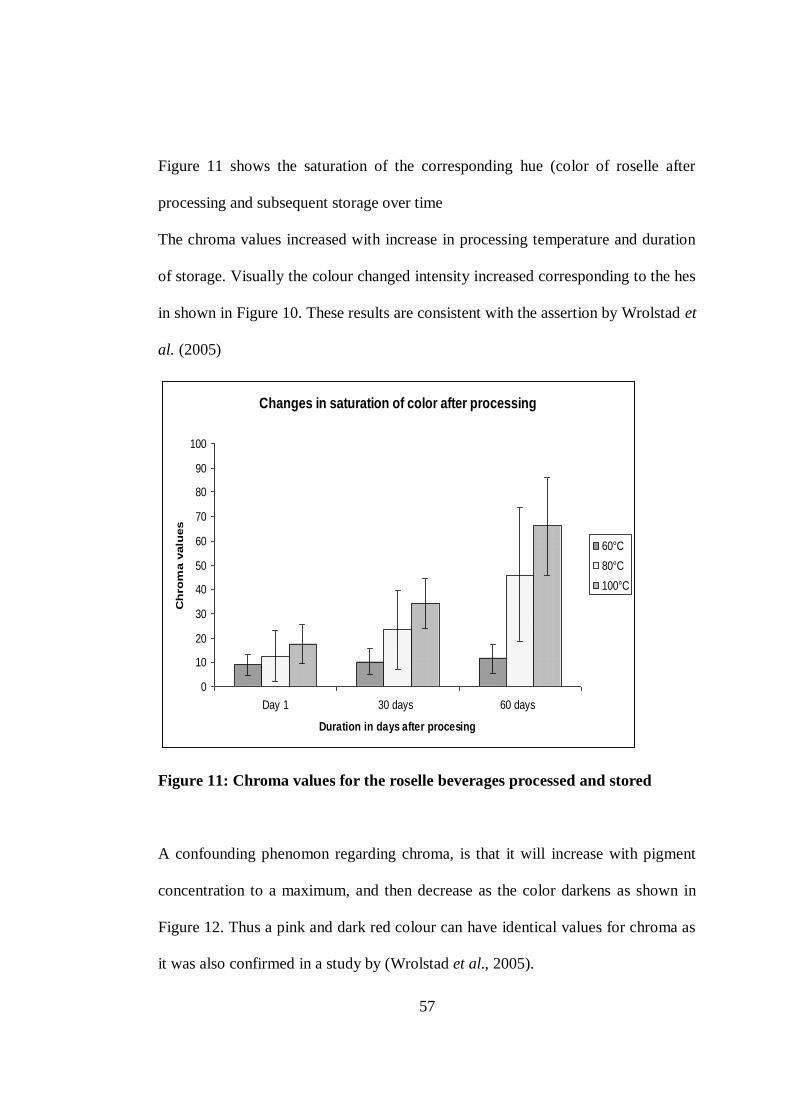
57
Figure 11 shows the saturation of the corresponding hue (color of roselle after
processing and subsequent storage over time
The chroma values increased with increase in processing temperature and duration
of storage. Visually the colour changed intensity increased corresponding to the hes
in shown in Figure 10. These results are consistent with the assertion by Wrolstad et
al. (2005)
Changes in saturation of color after processing
0
10
20
30
40
50
60
70
80
90
100
Day 1 30 days 60 days
Duration in days after procesing
Ch
ro
ma v
alu
es
60°C
80°C
100°C
Figure 11: Chroma values for the roselle beverages processed and stored
A confounding phenomon regarding chroma, is that it will increase with pigment
concentration to a maximum, and then decrease as the color darkens as shown in
Figure 12. Thus a pink and dark red colour can have identical values for chroma as
it was also confirmed in a study by (Wrolstad et al., 2005).
58
4.7 Quality of Roselle Beverages
4.7.2 Sensory Evaluation
The results of sensory analysis of the various formulations for ROD, RAD and
RMD are presented in Tables 8, 9 and 10 respectively.
There was no significant preference in the formulations of ROD in sensory
parameters of taste, aroma consistency, flavour and general acceptability. However,
there was significant preference for appearance/color of the product. In this
category 100% roselle drink was most preferred in terms of colour. This is possibly
well established because the rest of the formulations had 50%, 40% 1nd 25% fruit
suspensions of the orange juice. There was no significant preference in terms of
general acceptability for the formulations of ROD.
In RAD, there was no significant preference for sensorial properties of taste, aroma,
consistency and flavor. In this category 100% roselle drink was most preferred in
terms of colour. This is possibly well established because the rest of the
formulations had 50%, 40% 1nd 25% fruit suspensions of the apple juice. There
was no significant preference in terms of general acceptability for the formulations
of RAD.
RMD scored low ratings for taste, aroma, consistency, and general acceptability.
The preference for all the sensory attributes was not significant for the different
formulations. Similar preference for 100% roselle drink was exhibited in this
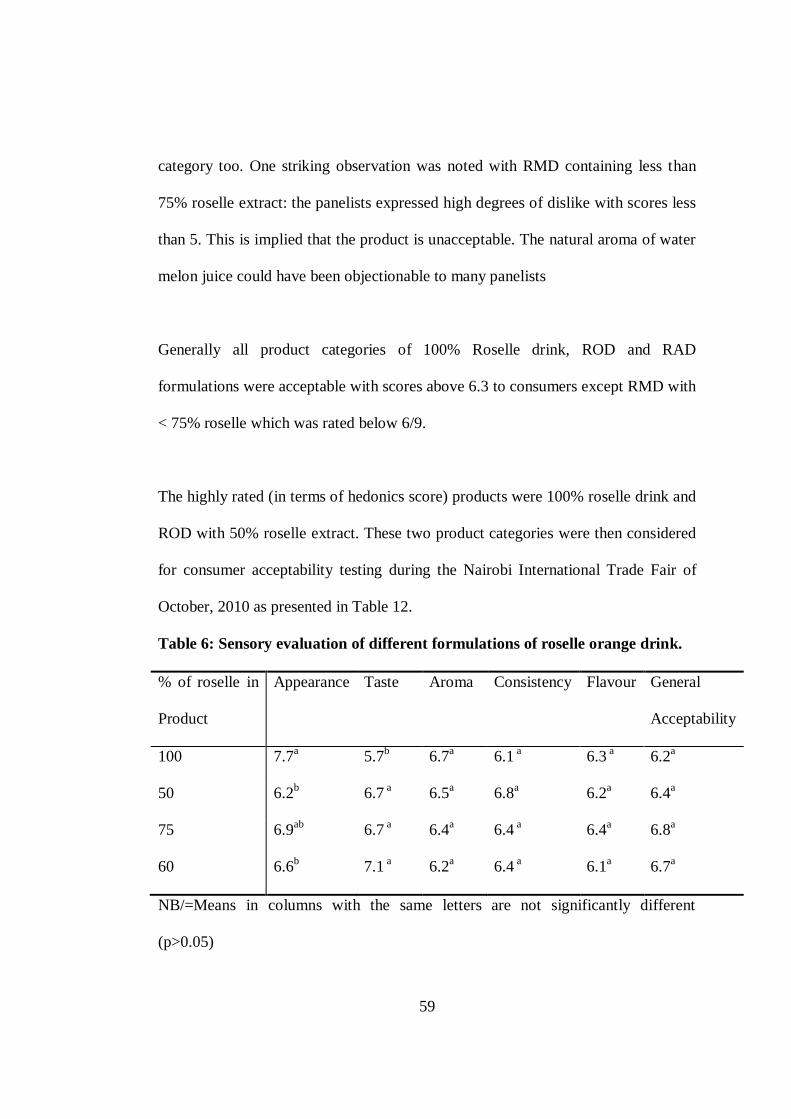
59
category too. One striking observation was noted with RMD containing less than
75% roselle extract: the panelists expressed high degrees of dislike with scores less
than 5. This is implied that the product is unacceptable. The natural aroma of water
melon juice could have been objectionable to many panelists
Generally all product categories of 100% Roselle drink, ROD and RAD
formulations were acceptable with scores above 6.3 to consumers except RMD with
< 75% roselle which was rated below 6/9.
The highly rated (in terms of hedonics score) products were 100% roselle drink and
ROD with 50% roselle extract. These two product categories were then considered
for consumer acceptability testing during the Nairobi International Trade Fair of
October, 2010 as presented in Table 12.
Table 6: Sensory evaluation of different formulations of roselle orange drink.
% of roselle in
Product
Appearance Taste Aroma Consistency Flavour General
Acceptability
100 7.7a 5.7
b 6.7
a 6.1
a 6.3
a 6.2
a
50 6.2b 6.7
a 6.5
a 6.8
a 6.2
a 6.4
a
75 6.9ab
6.7 a 6.4
a 6.4
a 6.4
a 6.8
a
60 6.6b 7.1
a 6.2
a 6.4
a 6.1
a 6.7
a
NB/=Means in columns with the same letters are not significantly different
(p>0.05)
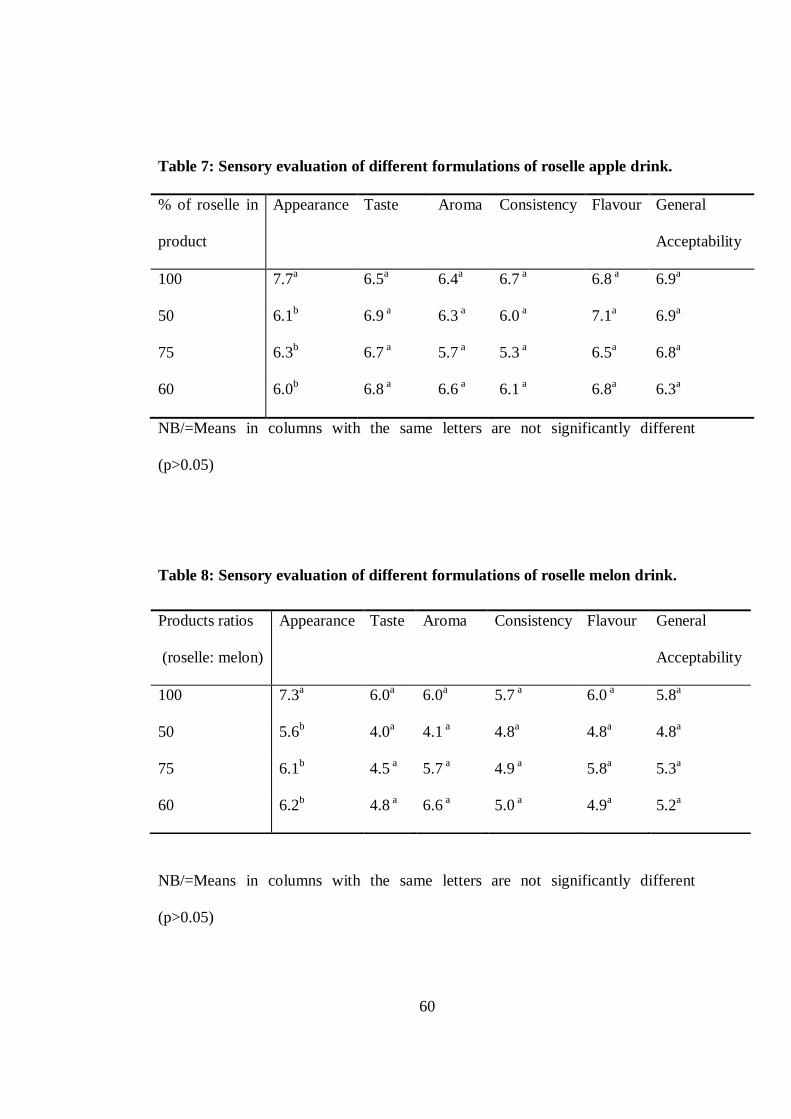
60
Table 7: Sensory evaluation of different formulations of roselle apple drink.
% of roselle in
product
Appearance Taste Aroma Consistency Flavour General
Acceptability
100 7.7a 6.5
a 6.4
a 6.7
a 6.8
a 6.9
a
50 6.1b 6.9
a 6.3
a 6.0
a 7.1
a 6.9
a
75 6.3b 6.7
a 5.7
a 5.3
a 6.5
a 6.8
a
60 6.0b 6.8
a 6.6
a 6.1
a 6.8
a 6.3
a
NB/=Means in columns with the same letters are not significantly different
(p>0.05)
Table 8: Sensory evaluation of different formulations of roselle melon drink.
NB/=Means in columns with the same letters are not significantly different
(p>0.05)
Products ratios
(roselle: melon)
Appearance Taste Aroma Consistency Flavour General
Acceptability
100 7.3a 6.0
a 6.0
a 5.7
a 6.0
a 5.8
a
50 5.6b 4.0
a 4.1
a 4.8
a 4.8
a 4.8
a
75 6.1b 4.5
a 5.7
a 4.9
a 5.8
a 5.3
a
60 6.2b 4.8
a 6.6
a 5.0
a 4.9
a 5.2
a
61
4.7.2 Microbial load
Tables 9 and 10 show the results of microbial analysis of the products during
storage. Total microbial counts were undetectable from week 0 to week 8.
Microbial loads were detected in the roselle drink at week 10 although the levels
were low and within the acceptable limits of microbial standards on fruit flavored
products (ICMSF, 1996).
From week 12-18 there was a steady increase in the total number of
microorganisms. The levels ranged from 0.10 log CFU/ml, 0.24 log CFU/ml for and
0.14 log CFU/ml for RD, ROD and RAD respectively but these values were within
the acceptable limits (103g/Kg) provided for soft beverages and water based
beverages (KEBS, 1996).
The levels remained within the acceptable standard levels. The stability of the
beverages in regard to microbial load could be attributed to the acidity of roselle,
thermal processing and the aseptic packaging of the products.
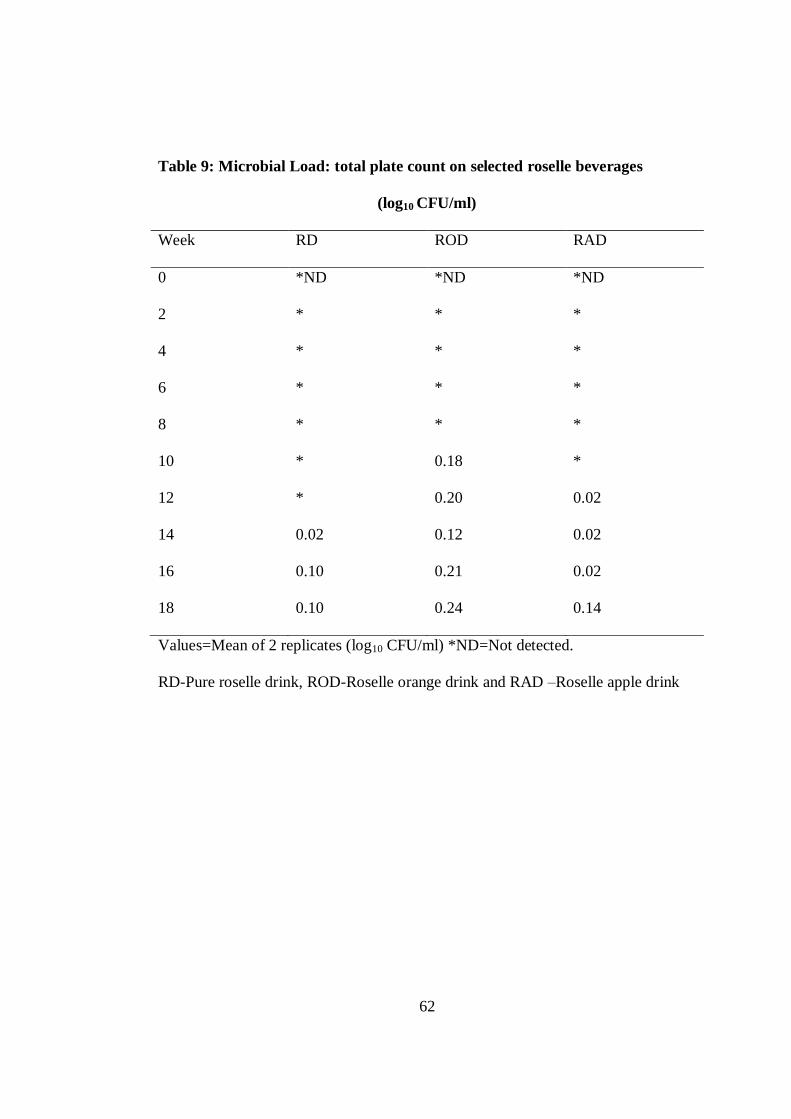
62
Table 9: Microbial Load: total plate count on selected roselle beverages
(log10 CFU/ml)
Week RD ROD RAD
0 *ND *ND *ND
2 * * *
4 * * *
6 * * *
8 * * *
10 * 0.18 *
12 * 0.20 0.02
14 0.02 0.12 0.02
16 0.10 0.21 0.02
18 0.10 0.24 0.14
Values=Mean of 2 replicates (log10 CFU/ml) *ND=Not detected.
RD-Pure roselle drink, ROD-Roselle orange drink and RAD –Roselle apple drink
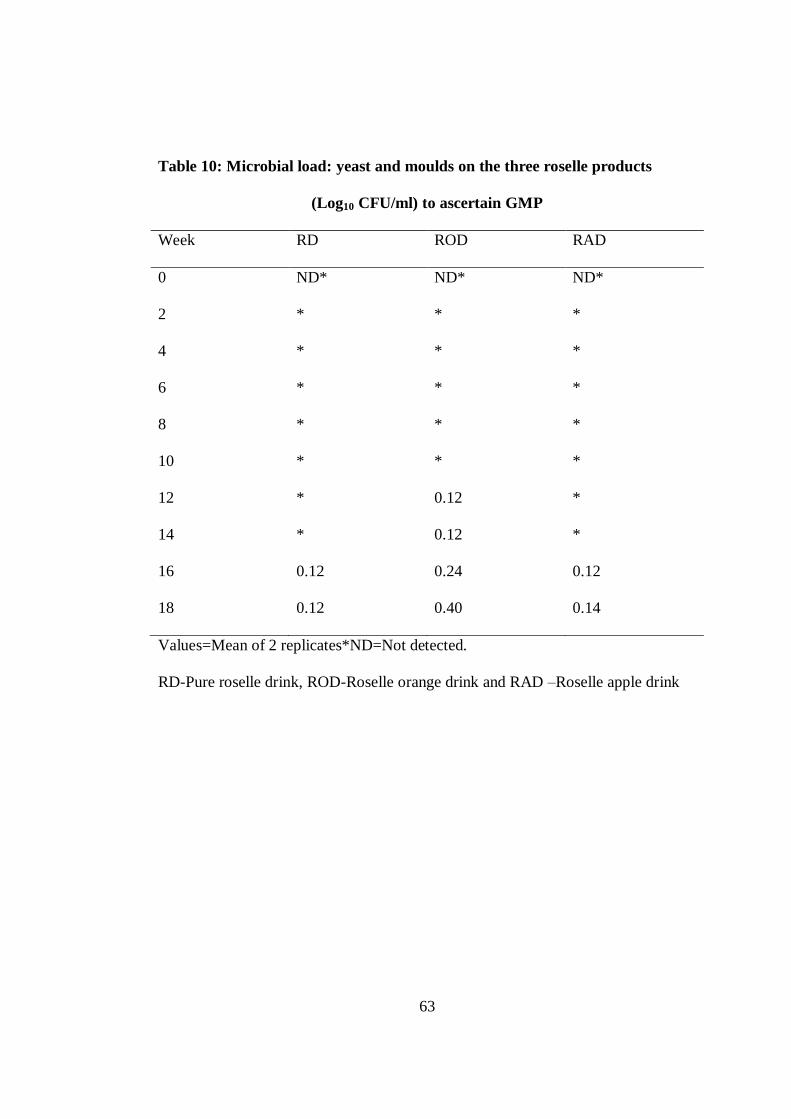
63
Table 10: Microbial load: yeast and moulds on the three roselle products
(Log10 CFU/ml) to ascertain GMP
Week RD ROD RAD
0 ND* ND* ND*
2 * * *
4 * * *
6 * * *
8 * * *
10 * * *
12 * 0.12 *
14 * 0.12 *
16 0.12 0.24 0.12
18 0.12 0.40 0.14
Values=Mean of 2 replicates*ND=Not detected.
RD-Pure roselle drink, ROD-Roselle orange drink and RAD –Roselle apple drink
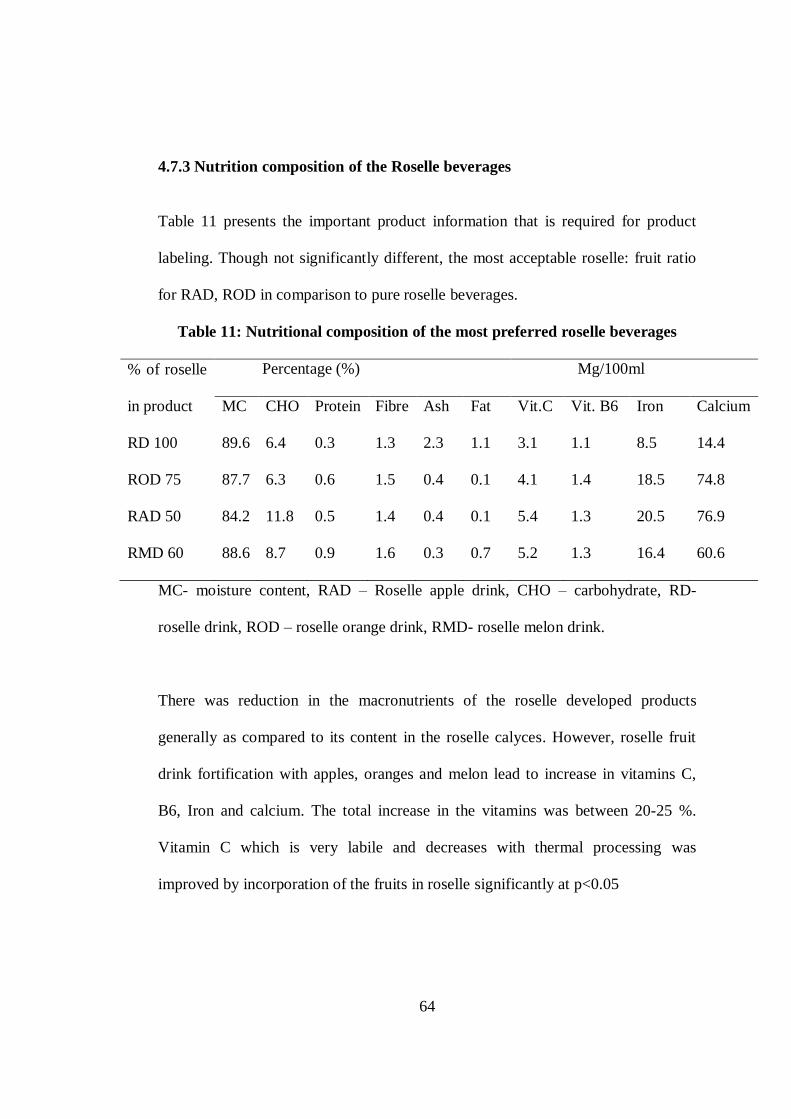
64
4.7.3 Nutrition composition of the Roselle beverages
Table 11 presents the important product information that is required for product
labeling. Though not significantly different, the most acceptable roselle: fruit ratio
for RAD, ROD in comparison to pure roselle beverages.
Table 11: Nutritional composition of the most preferred roselle beverages
% of roselle
in product
Percentage (%) Mg/100ml
MC CHO Protein Fibre Ash Fat Vit.C Vit. B6 Iron Calcium
RD 100 89.6 6.4 0.3 1.3 2.3 1.1 3.1 1.1 8.5 14.4
ROD 75 87.7 6.3 0.6 1.5 0.4 0.1 4.1 1.4 18.5 74.8
RAD 50 84.2 11.8 0.5 1.4 0.4 0.1 5.4 1.3 20.5 76.9
RMD 60 88.6 8.7 0.9 1.6 0.3 0.7 5.2 1.3 16.4 60.6
MC- moisture content, RAD – Roselle apple drink, CHO – carbohydrate, RD-
roselle drink, ROD – roselle orange drink, RMD- roselle melon drink.
There was reduction in the macronutrients of the roselle developed products
generally as compared to its content in the roselle calyces. However, roselle fruit
drink fortification with apples, oranges and melon lead to increase in vitamins C,
B6, Iron and calcium. The total increase in the vitamins was between 20-25 %.
Vitamin C which is very labile and decreases with thermal processing was
improved by incorporation of the fruits in roselle significantly at p<0.05
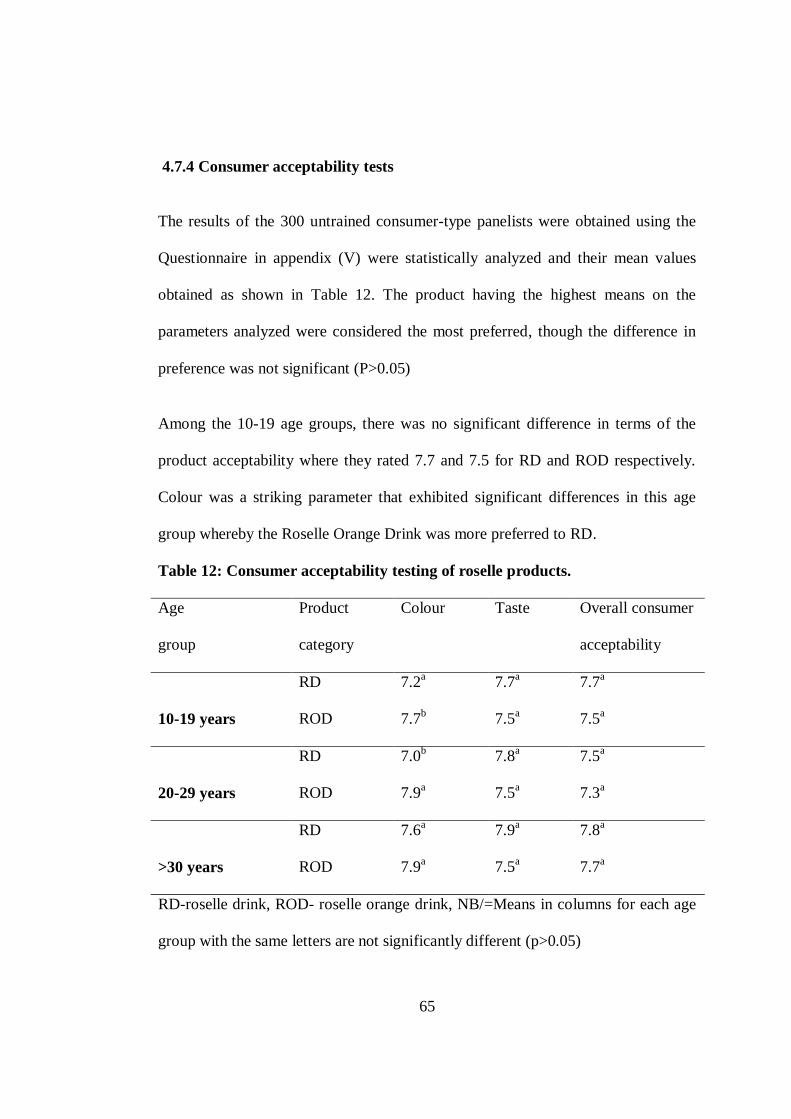
65
4.7.4 Consumer acceptability tests
The results of the 300 untrained consumer-type panelists were obtained using the
Questionnaire in appendix (V) were statistically analyzed and their mean values
obtained as shown in Table 12. The product having the highest means on the
parameters analyzed were considered the most preferred, though the difference in
preference was not significant (P>0.05)
Among the 10-19 age groups, there was no significant difference in terms of the
product acceptability where they rated 7.7 and 7.5 for RD and ROD respectively.
Colour was a striking parameter that exhibited significant differences in this age
group whereby the Roselle Orange Drink was more preferred to RD.
Table 12: Consumer acceptability testing of roselle products.
Age
group
Product
category
Colour Taste Overall consumer
acceptability
10-19 years
RD 7.2a 7.7
a 7.7
a
ROD 7.7b 7.5
a 7.5
a
20-29 years
RD 7.0b 7.8
a 7.5
a
ROD 7.9a 7.5
a 7.3
a
>30 years
RD 7.6a 7.9
a 7.8
a
ROD 7.9a 7.5
a 7.7
a
RD-roselle drink, ROD- roselle orange drink, NB/=Means in columns for each age
group with the same letters are not significantly different (p>0.05)

66
In the age group of 20-29 years, they scored 7.5 and 7.3 in terms of general
acceptability for RD and ROD respectively. The colour of ROD was more preferred
by this age group than that of RD.
Significant differences were noted for the product colour and insignificant for the
taste and general acceptability.
The group aged above 30 years expressed more liking for RD than ROD in overall
acceptability and taste but not in colour. Similar reasons for colour preference could
be true, where a consumer judges a product by appearance. The psychological basis
for this judgment is well established.
Figure 12: Roselle beverage products
The packaging and labeling of the products was subjectively attractive according to
the consumers’ responses where 80% liked very much. The groups as represented
by age category had varying preferences, 10-19 years had more preference for ROD
similarly, and the 20-29 years had synonymous preferences.
67
CHAPTER FIVE: CONCLUSIONS AND RECOMMENDATIONS
5.1 Conclusions
The findings suggested that roselle calyces’ nutritional composition include
proximate composition, major organic acids, vitamins, minerals and some
phytochemicals. It was found that the proximate composition of roselle was
constituted mainly by soluble carbohydrate at 66.3%. The minerals that were K,
Na, Mg, Ca, Fe, Mn, and Cu. The water soluble vitamins were seven including
thiamin, niacin, pyridoxine, folic acid, ascorbic acid and panthothenic acid. The
major organic acids were malic, tartaric, citric and oxalic. The major
Phytochemicals present in significant amounts were total polyphenols, flavonoids
and tannins.
Novel Functional beverages were developed, Roselle Drink, Roselle Orange
Drink, Roselle Apple Drink, and Roselle Melon Drink. Quality changes during
Storage at 50C provided greater retention in phytochemicals as compared to 27
0C.
These Phytochemicals exhibited antioxidant activity, that is, capacity to scavenge
for free radicals and therefore showing the potential of functional properties.
Shelf stability was established and clearly microbial load was within safe limits
(KEBS) after 90 days of storage. Sensory evaluation and tests showed no
significant difference in overall acceptability for the beverages made from roselle
calyces alone, and those mixed with Orange, Apple whereby they all had scores
above 6.3. However for Roselle melon drink (RMD) the average preference score
was below 5, hence they were deemed unacceptable.

68
Consumer acceptability showed that the roselle novel beverages were generally
highly acceptable and this is a pointer of success on market scenario.
In conclusion, the results showed that the Roselle calyces could therefore find
applications in the production of acceptable refreshing soft drink and other tropical
fortified beverages for instance in blends with apple juice, orange juice and water
melon juice . However, with melon juice, the acceptable blend contains down to
75% roselle drink while with two other juices, the roselle proposition can be as
slow as 50%.
5.2 Recommendations
The following are the recommendations
i. Further research in elucidation of the functional properties of roselle and the
beneficial individual Phytochemicals present.
ii. The Ministry of Agriculture (MOA) and JKUAT to collaboratively upscale
the production of roselle using elite cultivars to enhance commercial
utilization in Kenya.
iii. The ministry of Industrialization through KIRDI to support further
development of other convenient products from roselle for application in
other industries e.g. pharmaceutical and textile
iv. Further research studies should be done to ascertain the linkage of
flavonoids to health benefits of roselle
69
REFERENCES
Abu-Tarboush, H.M., and Ahmed, S.A.B. (1997). Studies on karkade
(H.sabdariffa): Protease inhibitors, phytate, in-vitro digestibility and
gossypol content. Food chemistry 56:15-19.
Abu-Tarboush, H. M, Ahmed A.A, Kahtani H.A (1997). Some nutritional and
functional properties of Karkade (Hibiscus sabdariffa) seeds products
cereal. J. Chem. 74: 352-355
ADA. (1995). Position of the American Dietetic Association: Phytochemicals and
functional foods. J. Am. Diet. Assoc. 95: 493-496.
Ahmed, E.N. and Salaheldeen A. (2010). Effect of Weeding Frequencies on Growth
and Yield of Two Roselle (Hibiscus sabdariffa L) Varieties under Rain Fed.
Australian Journal of Basic and Applied Sciences, 4(9): 4250-4255.
Ames, B. N, Gold LS. (1991). Endogenous mutagens and the causes of aging and
cancer. Mutation Research; 250:3–16
Anderson and Jordheim, (2006).The Anthocyanins and flavonoids: Chemistry
biochemistry and applications, CRC press, Boca Raton,,pp 471-530.
Anonymous, (1970). How to grow Kenaf for profit. Research Divsion. Rep Man
Ibadan Nigeria.
AOAC. (1995). Association of Official Analytical Chemists. Official Methods of
Analysis, 16th ed. Washington DC, USA.
Arai, S. (1996). Studies on functional foods in Japan; State of the art.Journal of
Bioscience. Biotechnology. Biochemistry. 60: 9-15.
70
Arowosoge, O.G.E. (2008). Investment potentials of Hibiscus sabdariffa
Linn(var.sabdariffa): a case study of Zobo drink in southwestern Nigeria.
Agricultural journal 3(6): 476-481.
Ayoola, G. A., Sofidiya, T., Odukoya, O. and Coker, H. A. B. (2006).
Phytochemical screening and free radical scavenging activity of some
Nigerian medicinal plants. J Pharmaceutical Science & Pharm Pracicet. 8:
133-136.
Azizah, A.H., Ruslawati N.M., Swee, T. (1999). Extraction and characterization of
antioxidant from cocoa by-products. Food Chemistry. 64, 199-202.
Babalola, S.O., Babalola, A.O. and O.C. Aworh, (2001). Compositional attributes
of the calyces of roselle (Hibiscus sabdariffa L). J. Food Technology. in
Africa, 6: 133-134.
Babatunde, F.E., and. Mofoke, A.L.E ( 2006). Performance of roselle (Hibiscus
sabdariffa L) as influenced by irrigation schedules. Pakistan Journal of
Nutrition 5 (4): 363-367.
Babatunde, F.E. and B. Zechariah, (2001). Effect of spacing and weeding regimes
on the productivity of roselle (Hibiscus sabdariffa. L). Advances in
Horticultural Science. 14: 147-151.
Babatunde, F.E., (2003). Intercrop productivity of roselle in Nigeria. Africa. Crop
Science Journal. 11: 1-6.
Backeit, M.H., Zubeir E.A. and Jubarah, S.K. (1994).The nutritional value of
roselle seed meal in laying hen diets .J. Sc. Food Agriculture 65:199-200.
71
Bisset, N.,Wichtl M. (1994). Herbal Drugs and Phytopharmaceuticals: A Hand
Book for Practice on a scientific basis; CRC Press, Boca raton, Ann Arbor
London, Tokyo; 266-267
Block, G., Patterson, B. and Subar, A. (1992). Fruit, vegetables, and cancer
prevention: A review of the epidemiological evidence. J Nutritional
.Cancer 18: 1-29.
Bravo, L. (1998). Polyphenols dietary sources, metabolism and nutritional
significance.
Brouk, B. (1975). Plant consumed by man. South bank,
Burns, R.E. (1963). Methods of Tannin Analysis for Forage Crop Evaluation.
Georgia. Agricultural Experiment station Technical Bulletin 32: 1-14.
Chang, C.C., Yang M.H., Wen H.M. and Chern, J.C. (2002). Estimation of total
flavonoid content in propolis by two complementary colorimetric methods.
Journal of Food Drug Analysis 10: 178-182.
Chen, H., Weiss, J., Shahidi, F. (2006). Nanotechnology in nutraceuticals and
functional foods. Food Technology 60(3): 30-36, 2006.
Codex Alimentarious Commission (1964). Joint FAO/WHO program on food
standards 2nd
session, Geneva, 28 September -7 October 1964 on Soft
beverages
Choudhury, (1977). Vegetable. National Book Trust. Willey Publishers.
72
Clydesdale, F. M., Main J. H. and Francis F. J. (1979). Roselle (Hibiscus
sabdariffa) anthocyanins as colourants for beverages and gelatins desserts.
J. Food Protection, 42: 204-267
Clydesdale, F.M. (1997). A proposal for the establishment of scientific criteria for
health claims for functional foods. J. Nutrition. Rev. 55 (12): 413-422.
CTA (2001). The fruits we eat. Technical center for agriculture and rural
cooperation. Washington, the Netherlands, pp: 9-20.
Demigne, C., Levrat, M.A. Behr, S.R., Moundras ,C., and Remesy C (1998).
Cholesterol lowering action of guar gum in the rat changes in bile acids and
sterol excretion in heterohapatic cells (Hep.G2): J. molecular cell Biochem,
233:153-158.
Drdark, M. and Daucik, P. (1990). Changesin elderberry ( Sambucus nigra)
pigments during the production of Pigment Concentrates. Acta aliment 19 (1),
3-7.
Ekinci, R. and Kadakal, C. (2005). Determination of seven water–soluble vitamins
in tahara, a traditional Turkish cereal food, by high-performance liquid
chromatography. A CTA chromatographica. No. 15.
Elawad, H.O. (2001) Roselle production in Sudan during the seasons (1970/71-
84/85 and 95/96- 2000/01). Elobied research station. Elobied, Sudan.
FAO/WHO (2002). Human vitamin and mineral requirements. Report of a joint
FAO/WHO expert consultation, Rome.
73
Fasoyiro, S.B., Babalola.and Owosibo.T. (2005). Chemical composition and
sensory quality of fruit flavored roselle (Hibiscus sabdariffa) beverages.
World journal of Agricultural sciences 1(2): 161-164.
Fellow, P. (1997). Traditional foods processing for profit. Intermediate
technologies publications Ltd .London Uk .pp 106-110.
Gansch, H. Chang, Y.L. and Courteny A.W. (2009). Antioxidant capacity and
phenolic phytochemicals in Black raspberries. New York agricultural
experiment station, Cornell University,Geneva,NYK.
Gibbon, D. and Pain, A. (1995). Crops of the drier regions of the tropics. Journal of
Food Science 2:61-63 http://www.amazon.ca/crops-drier regions-tropics.
Giusti, H.N and R.E. Wrolstad (2001). Characterization and measurement of
anthocyanins by UV–Vis spectroscopy. Current protocols in food analytical
chemistry (unit F 1.2), John Wiley & Sons, Inc., New York
Gordana, R., Komes D., Likic, D., and Kovac, M. (2008). Phenolic content and
antioxidant capacity of green and white tea extracts depending on extraction
conditions and solvent used. J. Food Chemistry 110:552-858
Grubesic, R., Vokovic J., Kremer D., Knezevic, S.(2007). Flavonoid content assay:
prevalidation and application on plantago L. Species; Acta. Chim. Slov. 54,
397–406.
Hacket, C. and J., Carolene (1982). Edible Horticultural crops: Acompedium of
information fruits .Vegetable, spice and nut spices. Academic press.
Australian, pp: 17.
74
Hakkinen, M. Heinonen, S. Karenlampi, H. Mykkanen, J. Ruuskanen R., Howard,
B.V. and Harborne, J. B. (1998).Phytochemical methods. A guide to modern
techniques of plant analysis, 3rd
edition. Springer (India) Private Limited,
New Delhi.
Harborne, J. B.; Williams, C. A. -Advances in flavanoid research since (1992).
Phytochemistry 2000; 55, 481-504.
Hasler, C.M. (1998). A new look at an ancient concept. Chemistry Industry 2: 84-
89.
Hinrichsen, D., R. Bryant and Goldstein,S.M. (1997). Winning the food race
population reports. Special Topics. Series M 13. Centre for Communication
Programs. The John Hopkins University of Public Health, U. S. A.
ICMSF. (1996). Sampling for microbiological analysis. Principles and specific
application. pp 127-275.
IDF. (1996). International Dairy Federation. Microbiological Analytical Methods.
Brussels, Belgium. http//www.idfdairynutri.org website visited on 8th
Sept. 2009.
Ihekoronye, A.I and Ngoddy, P.O. (1985). Intergrated Food Science and
Technology for the Tropics. Macmillan Press Ltd, London, England. pp:
172-189.
Ina, K., Sakata, K. Tomita, L. and Isemura, M. (eds) (2002). Ten components and
their function. Kawasaki, Japan.
75
IUFOST (2009). Functional foods. Bulletin of the international Union of Food
Science and Technology; a global scientific organization.
Kalyane, V. L. (1986). Nutritional quality of hibiscus seed protein. Intl. J. Tropical
Agriculture. 4(3):280-282.
KEBS, (1996). Food industry standards committee, KS 406. Kenya standards.
Kosalec, I. (2005). Flavonoid analysis and antimicrobial activity of commercially
available propolis products; Acta. Pharm. 55:423-430
Kritchevsky, D. (1997). Phytochemicals and cardiovascular disease. A statement for
healthcare professionals from the American Heart Association. Circulation
95: 2591-2593.
Krumhout, D., Bosschieter, E.B., and de Lezenne Coulander, C., (1985). The
inverse relation between fish consumption and 20-year mortality from
coronary heart disease. New Eng. J. Medicine. 312:1205-1209.
Kuhn, M.E. (1998). Functional foods overdose? Food Proc. 59(5): 21-48.
Lee, J. H. and S.T. Talcott (2004). Fruit maturity and juice extraction influences
ellagic acid derivatives and other antioxidant polyphenolics in muscadine
grapes, Journal of Agricultural and Food Chemistry. pp. 361–366.
Liu, R.H, Hotchkiss J.H. (1995). Potential genotoxicity of chronically elevated
nitric oxide: a review. Mutation Research; 339:73–89 London, pp: 315-326.
Mahadevan, N.; Shivali and K; pradeep (2009). Hibiscus Sabdariffa L. An
overview of Natural Product Radiance, 8: 77-83.
76
Man, R.T., Lynn, E.G., Cheung, F., Tsang, P.S. and Karmin, O. (2002). Cholestin
inhibits cholesterol sythesis and secretion in hepatic cells. Molecular cell
biochemistry.
Marc, F.A. Davin, L. Deglene-Benbrahim, C., Ferrand, M., Baccaund and Fritsch,
P. (2004). Methodes de’evaluation du potential antioxidant dans lesaliments.
Medical Science 20:458-463, and 233:153-158.
Mazza and Miniati (1993). Athocyanins in fruits, vegetable and grains, CRC press,
Boca Raton, pp 1-87.
Meyer, A. (1998). The 1998 top 100 Research and development survey. Food
Processing 58(8): 32-40.
Mohamadou, B.A., Mbofung and Thouvenot, D. (2007). Functional potential of a
product from Traditional Biotechnology: antioxidant and probiotic potential
of Mbuja, produced by fermentation of Hibiscus sabdariffa seeds in
Cameroon. Journal of food technology 5(2): 164-168.
Mohammed, T. A. and A. A. Idris (1991). Nutritive value of roselle seeds (
Hibiscus sabdariffa ) meal for broiler chicks. Wor. Rev. Anim. Prod., (26):
59-62. http://www.grande.nal.usda.gov/ibids/index.php?mode2=detail&
origin=ibids.reference&therow=67454.
Mukhatar. A.M. (2007). The effect of feeding roselle (Hibiscus.sabadariffa) seed
on broiler chicks’ perfomance. J. Animal Vetinary Science., 2: 21-23.
Mungole, A and Chaturvedi, A. (2011). Hibiscus sabdariffa L. a rich source of
secondary metabolites. International Journal of. pharmaceautical sciences,
review and research. volume 6 (1) :83-87.

77
Ofori, F. and Hahn, S.K. (1994). Tropical Root Crops. A developing economy.
Proceedings of the 9th
symposium of the international Society for Tropical
root Crops, Pg 20–26. Accra, Ghana. Pg31, 249-254.
Ojokoh, A.O., Adetuyi, F.C., Akinyosoye, F.O. and Oyetayo, V.O. (2002).
Fermentation studies on roselle (Hibiscus sabdariffa) calyx neutralized with
Trona. Journal of Food Technology in Africa, 7:75-77.
Ojokoh, A.O. (2006). Roselle (Hibiscus sabdariffa) calyx diet and histopathological
changes in liver of albino rats. Pakistan Journal of Nutrition, 5(2):110-113
Omemu, A.M.M., Oedema, A.O, Afayase and Obadina, A.O. (2006). A survey of
microflora of Hibiscus.sabdarfiffa(roselle) and the resulting Zobo juice.
Africa Journal of Biotechnology 30:254-259.
Price, M.L., Van Scoyoc, S.W. and Butler, L.G. (1978). A critical evaluation of the
vanillin reactions as an assay for tannins in sorghum grain .J. of Agric.
Food Chem. 26:1214-1218.
Purseglove, J.W. (1972). Tropical crops; monocotyledons, Vol. 1. Londres,
Longman Group Limited. pp 334.
Purseglove, J.W. (1977). Tropical Crop. Dicotyledons Vol. 1. Longman Group,
UK, pp: 370- 373.
Qi, Y., Chin, K.L., Malekian, F.M. Berhame and Gager, J. (2005). Biological
characteristics, nutritional and medicinal value of Hibiscus sabdariffa.
78
(Circular paper on urban forestry, Natural resource and environment)
No.604.
Rader, D.J. (2000). A new feature on the cholesterol lowering landscape .Natural
medicines 7(12):1282-1284.
Rao, P. U. (1996). Nutrient composition and biological evaluation of mesta
(Hibiscus sabdariffa) seeds. Plant food for human nutrition, 49: 27-34.
Rice, R.P., Rice, W. and Tindall, H.D. (1990). Fruits and Vegetable Production in
Warm Climates. 1st edition Macmillan Press Limited, London U.K. pp.40-65.
Schippers, R.R. (2000). African Indigenous vegetables: an overview of cultivated
species. National resource institute .publisher Chatham, UK.
Seck, A. (1997). Seed Production and Storage of Indigenous Vegetable: In: African
Indigenous Vegetables (Ruddy Shippers and Leonard and Leonard Budd
Eds.,) Work proceedings, Limber, Cameroon, pp: 16-80.
Seeram, N.P., Schutzki, R., Chandra, A., Nair, M.G. (2002). Characterization,
quantification, and bioactivities in anthocyanins in Cornus species. Journal of
Agricultural and Food Chemistry 50, 2519–2523.
Shahidi, F. Naczk, M. (1995). Food phenolics: an overview. Food phenolics:
sources, chemistry, effects, applications. Lancaster, PA: Technomic
Publishing Company Inc: pp. 1–5.
Shahidi, F. (2004). Functional foods: their role in health promotion and disease
prevention. Journal of. Food Sci. 69:146 http://www3.interscience.wiley.com
(Retrieved Jan 26, 2009).
79
Shahidi, F. (2008). Nutraceuticals and functional foods: Whole versus processed
foods. Trends Food Sci. Technol.doi:10.1016/j.tifs.2008.08.004 (Retrieved
Jan 20, 2009).
Steinmetz, K.A. and Potter, J.D. (1991). Vegetables, fruit and cancer II.
Mechanisms. Cancer Causes Control 2: 427-442.
Steel, R.G.D. and Torrie, J.H. (1980). Principles and Procedures of Statistics 2nd
Edition. Mc Graw-Hill Book Company, New york.
Suhad, S., Humadi, and Viorica I. (2008). Quantitative analysis of bioactive
compound in Hibiscus sabdariffa L.extracts. J. Farmacia, 56:6.
Swinbanks, D. and O'Brien, J. (1993). Japan explores the boundary between food
and medicine. Nature, 364(6434), 180.
http://www.nature.com/nature/journal/v364/n6434/index.html
(Retrieved Jan 25, 2009).
Torronen. (1999). Screening of selected flavonoids and phenolic acids in 19 berries,
Food Research International 32: 345–353
Vanvalkenburg, J. L. and P.N., Bunya (2002). Plant Resource of south East Asia.
Medicinal plants. PROSEA, Foundation, Bogor, Indonesia.
Wahid, L. A. (2008). Manufacture of a healthy beverage and food colorant from
Hibiscus Sabdariffa. B.Sci. Research project Food Science and Technology,
Jomo Kenyatta University of Agriculture and Technology, Kenya.
Wald, N. J., and Law, M.R. (1995). Serum Cholesterol and Ischaemic Heart
Disease, Atherosclerosis, (1189 suppl S1-S5).

80
Waltham, M.S. (1998). Roadmaps to market commercializing functional foods and
nutraceutical. Decision Resources, Inc., pp.5
Watkins, C. (2008). The Market for Functional Foods. Inform; 6; 378-380.
Wong, P. S. Yusof, H. M., Ghazah and Cheman, Y. E. (2002). Physico.chemical
characteristics of roselle (Hibiscus sabdariffa L) Nutrition and Food Science
32: 68-73.
Wrolstad, R. E., Durst, R. W. and Lee, J. (2005). Tracking colour and pigment
changes in anthocyanin products. Trends in food science and technology 16:
423-428.
Zhang, Z., and McLaughlin, J.(2004). Comparison of HPLC methods for
determination of anthocyanins and anthocyanidins in bilberry extracts,
Journal of Agricultural and Food Chemistry pp. 688–691.

81
APPENDICES
Appendix I: Tri stimulus colour code match table
Code Meaning Range Trend
L*(+) Lightness 0-100 Lightness increases from 0-100.
a* (-) Green 0 Downwards Greenness increases with negativity.
a* (+) Red 0 Upwards Redness increases with increase in
numerical value.
b* (-) Blue 0 Downwards Blueness increases with negativity
b* (+) Yellow 0 Upwards Yellowness increases withl value.
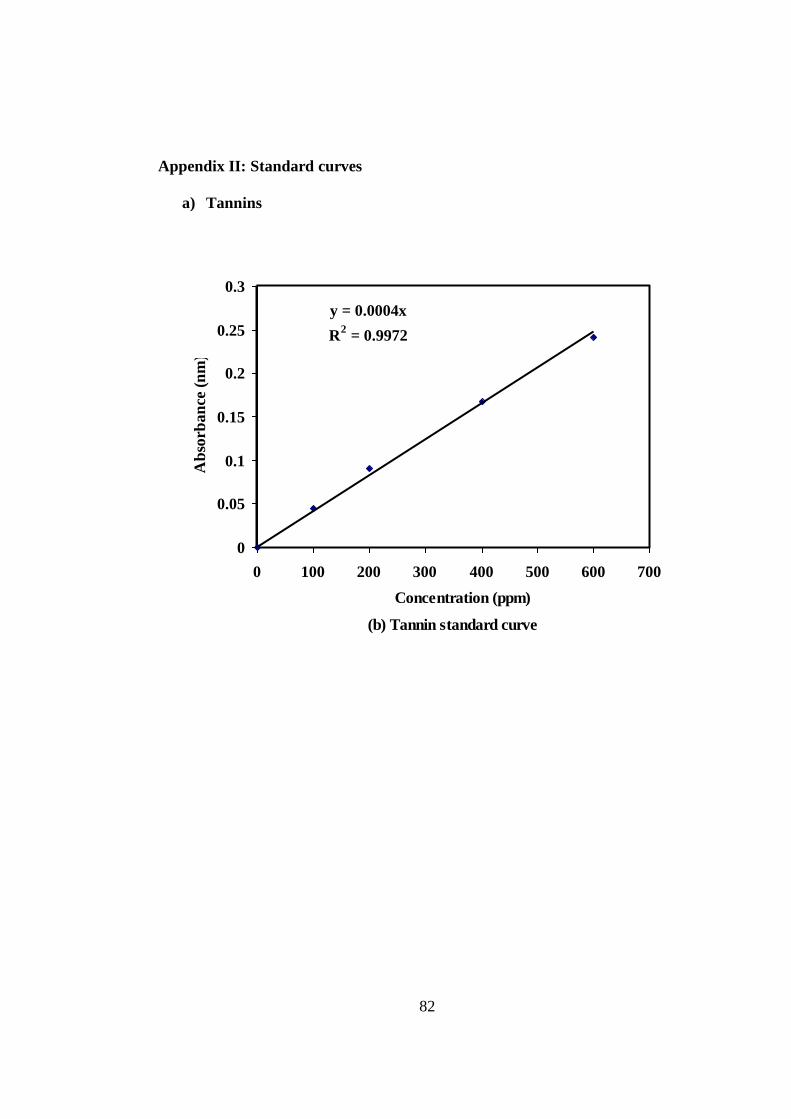
82
Appendix II: Standard curves
a) Tannins
(b) Tannin standard curve
y = 0.0004x
R2 = 0.9972
0
0.05
0.1
0.15
0.2
0.25
0.3
0 100 200 300 400 500 600 700
Concentration (ppm)
Ab
sorb
an
ce (
nm
)
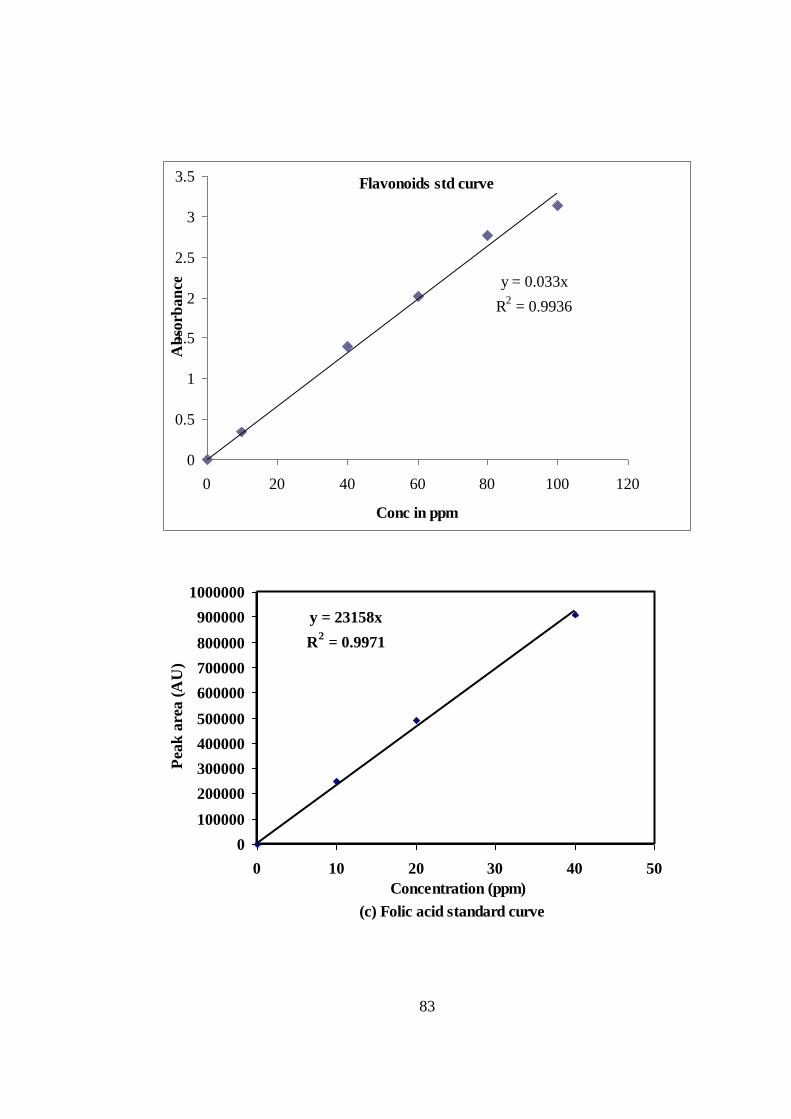
83
Flavonoids std curve
y = 0.033x
R2 = 0.9936
0
0.5
1
1.5
2
2.5
3
3.5
0 20 40 60 80 100 120
Conc in ppm
Ab
sorb
an
ce
(c) Folic acid standard curve
y = 23158x
R2 = 0.9971
0
100000
200000
300000
400000
500000
600000
700000
800000
900000
1000000
0 10 20 30 40 50
Concentration (ppm)
Pea
k a
rea
(A
U)
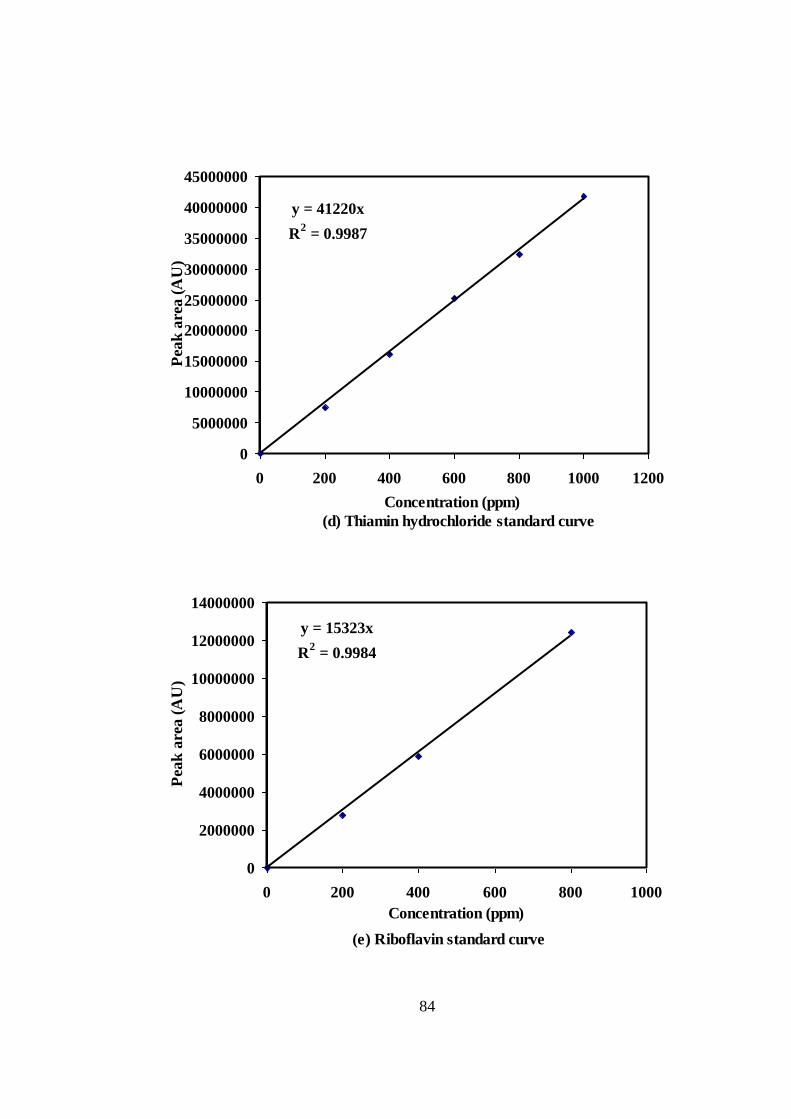
84
(d) Thiamin hydrochloride standard curve
y = 41220x
R2 = 0.9987
0
5000000
10000000
15000000
20000000
25000000
30000000
35000000
40000000
45000000
0 200 400 600 800 1000 1200
Concentration (ppm)
Pea
k a
rea (
AU
)
(e) Riboflavin standard curve
y = 15323x
R2 = 0.9984
0
2000000
4000000
6000000
8000000
10000000
12000000
14000000
0 200 400 600 800 1000
Concentration (ppm)
Pea
k a
rea (
AU
)
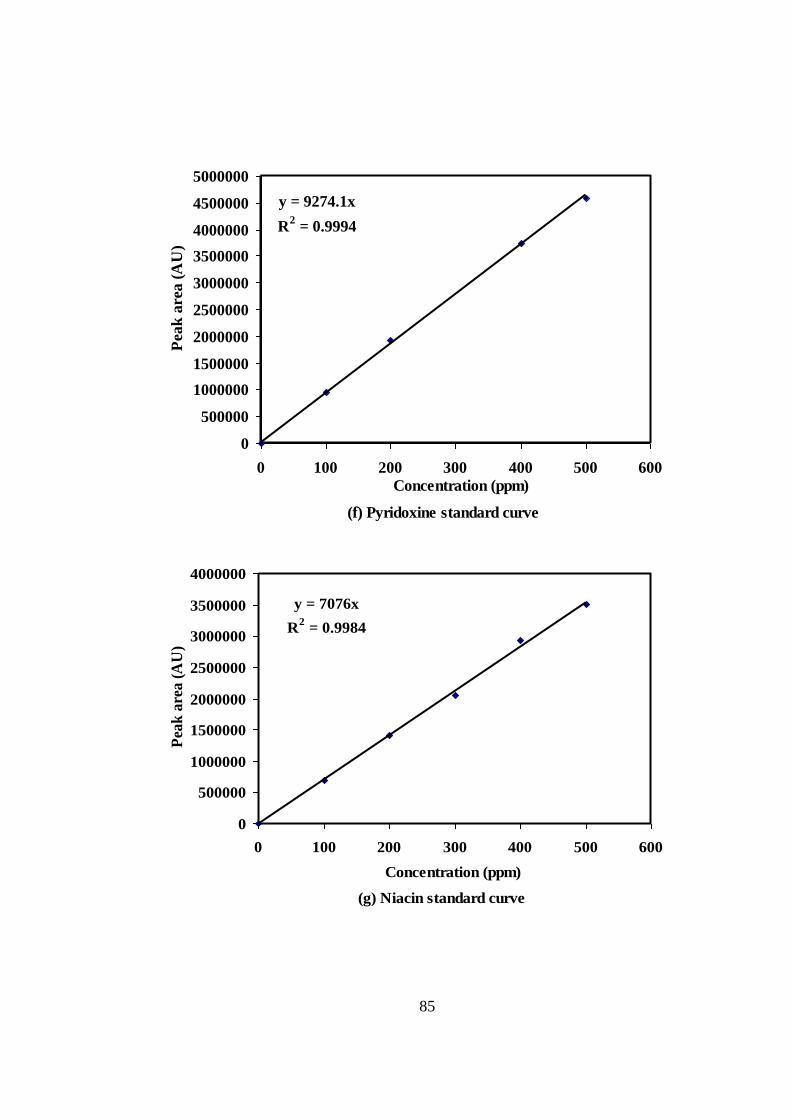
85
(f) Pyridoxine standard curve
y = 9274.1x
R2 = 0.9994
0
500000
1000000
1500000
2000000
2500000
3000000
3500000
4000000
4500000
5000000
0 100 200 300 400 500 600
Concentration (ppm)
Pea
k a
rea
(A
U)
(g) Niacin standard curve
y = 7076x
R2 = 0.9984
0
500000
1000000
1500000
2000000
2500000
3000000
3500000
4000000
0 100 200 300 400 500 600
Concentration (ppm)
Pea
k a
rea
(A
U)
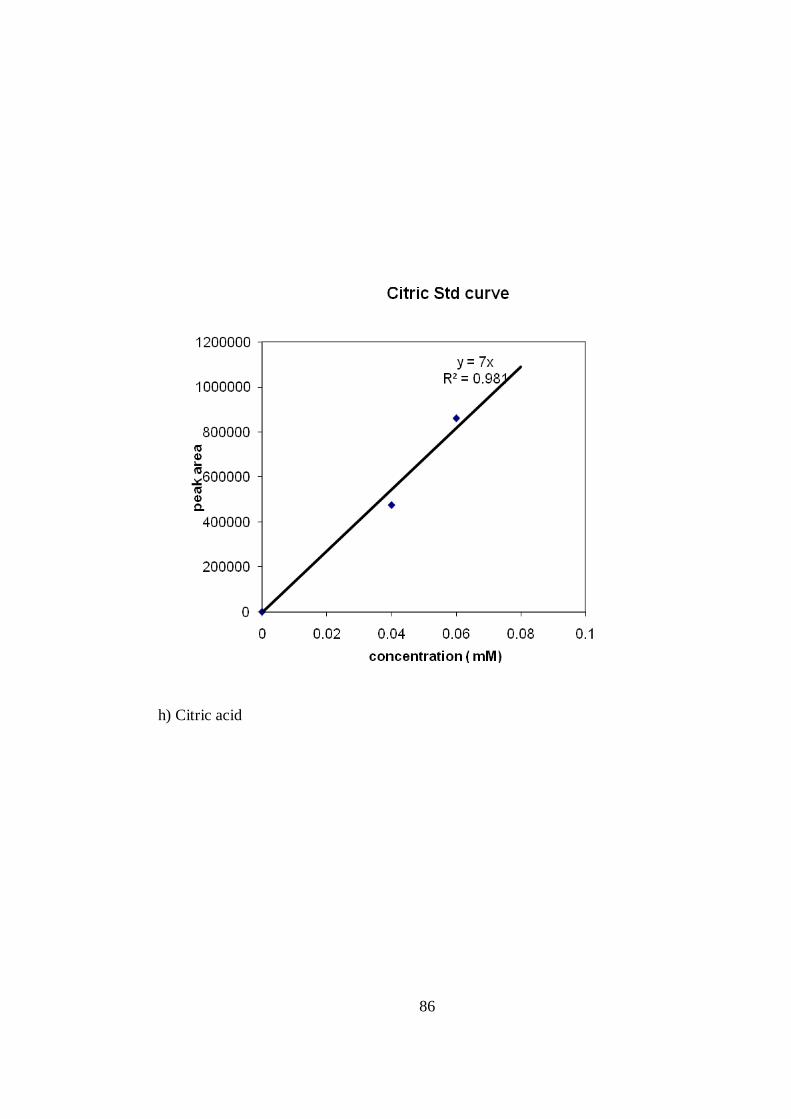
86
h) Citric acid
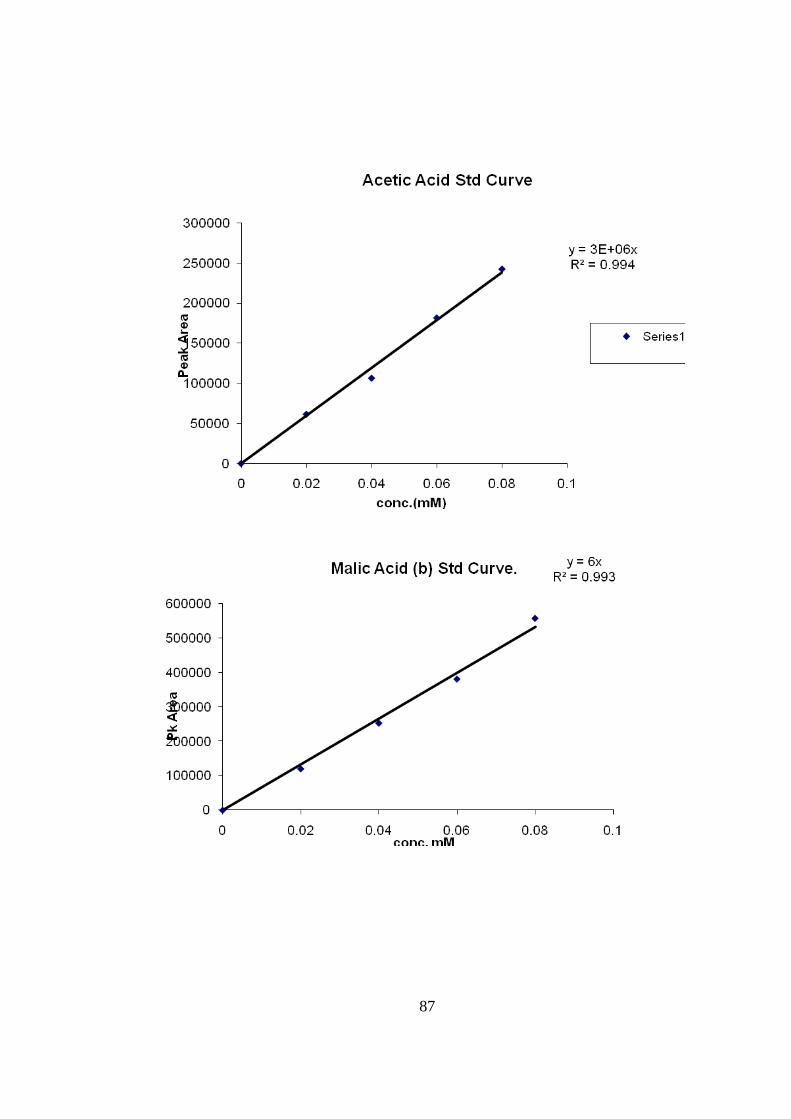
87
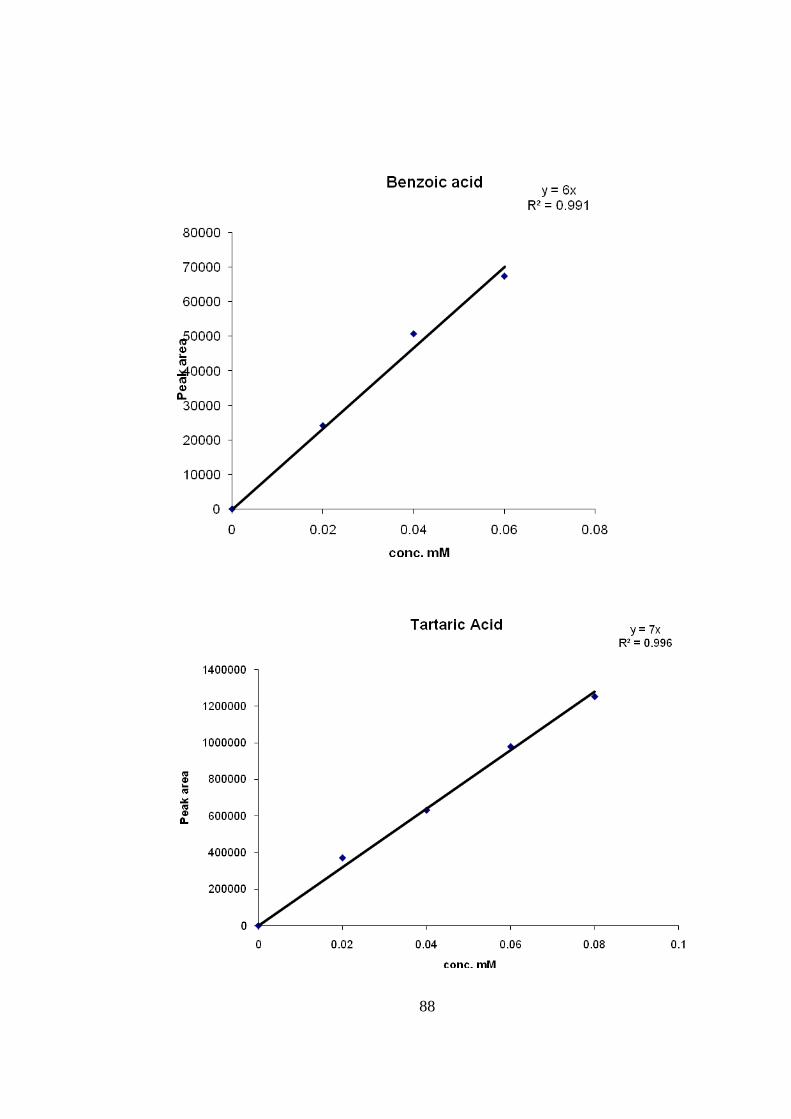
88

89
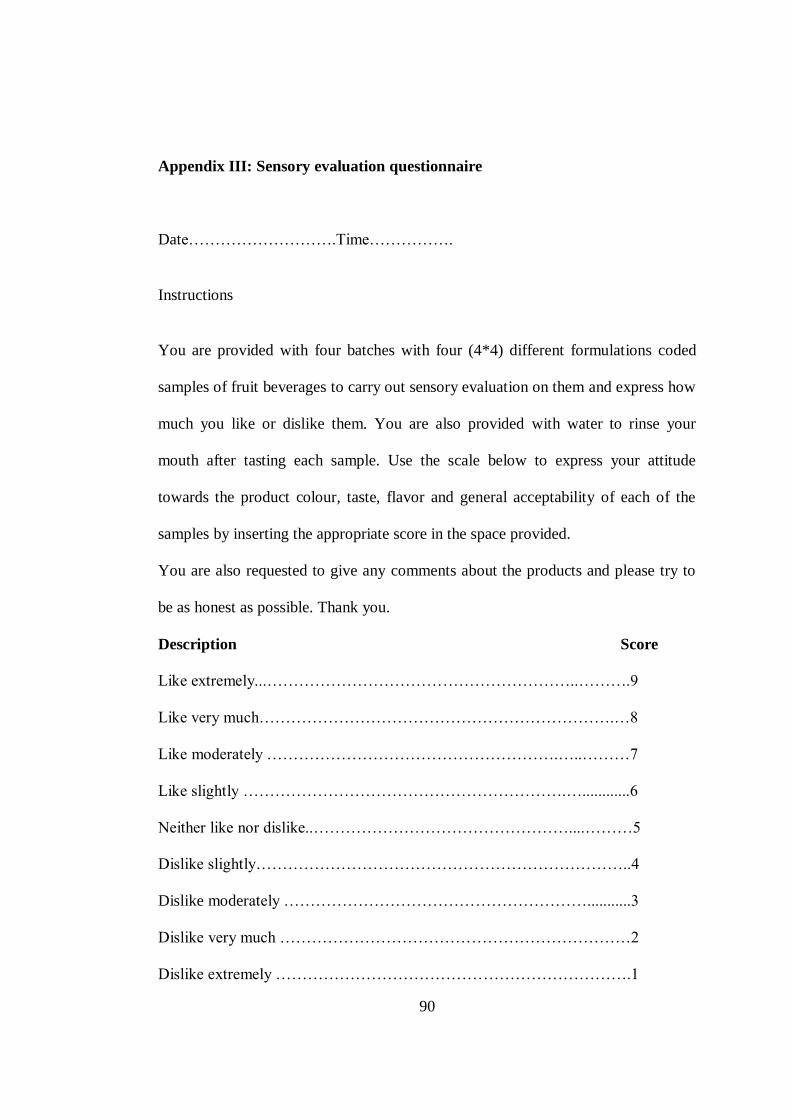
90
Appendix III: Sensory evaluation questionnaire
Date……………………….Time…………….
Instructions
You are provided with four batches with four (4*4) different formulations coded
samples of fruit beverages to carry out sensory evaluation on them and express how
much you like or dislike them. You are also provided with water to rinse your
mouth after tasting each sample. Use the scale below to express your attitude
towards the product colour, taste, flavor and general acceptability of each of the
samples by inserting the appropriate score in the space provided.
You are also requested to give any comments about the products and please try to
be as honest as possible. Thank you.
Description Score
Like extremely...…………………………………………………..……….9
Like very much………………………………………………………….…8
Like moderately ……………………………………………….…..………7
Like slightly …………………………………………………….…............6
Neither like nor dislike..…………………………………………....………5
Dislike slightly……………………………………………………………..4
Dislike moderately …………………………………………………...........3
Dislike very much …………………………………………………………2
Dislike extremely ………………………………………………………….1
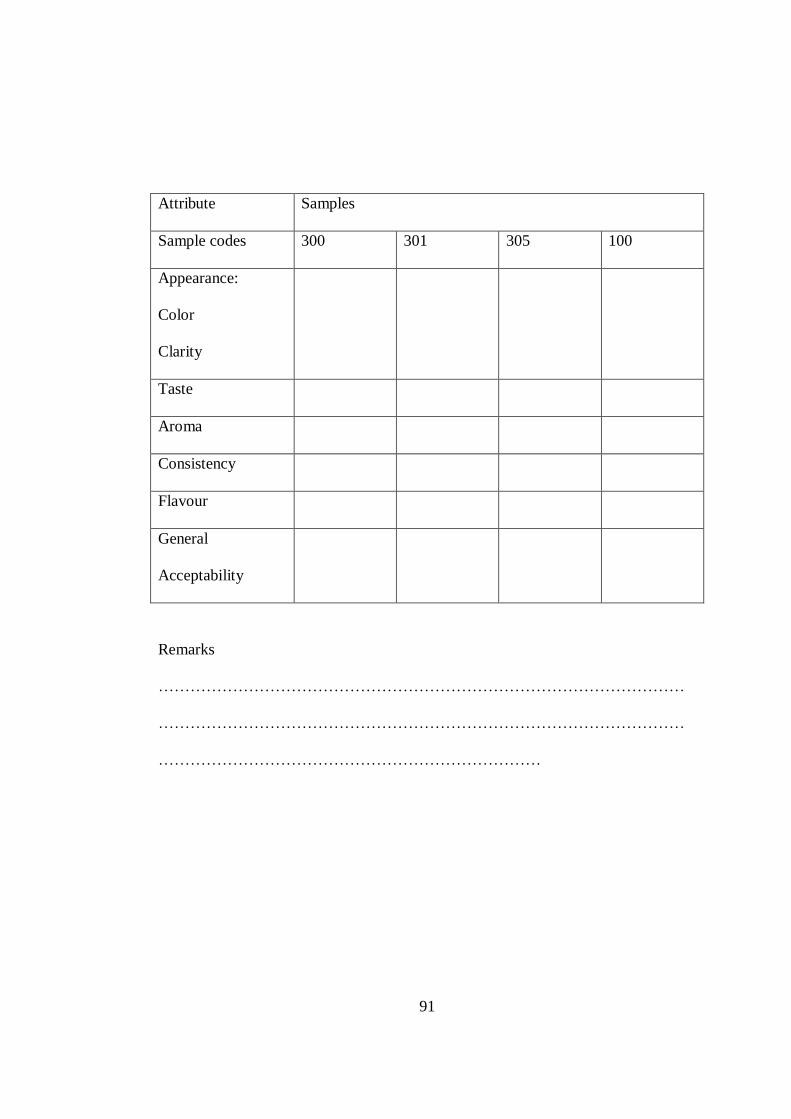
91
Attribute Samples
Sample codes 300 301 305 100
Appearance:
Color
Clarity
Taste
Aroma
Consistency
Flavour
General
Acceptability
Remarks
………………………………………………………………………………………
………………………………………………………………………………………
………………………………………………………………

92
Appendix IV: Product labels and packaging
Figure 13: Samples for packaged Roselle products.
The process of product development was dully followed and sample labels
developed.
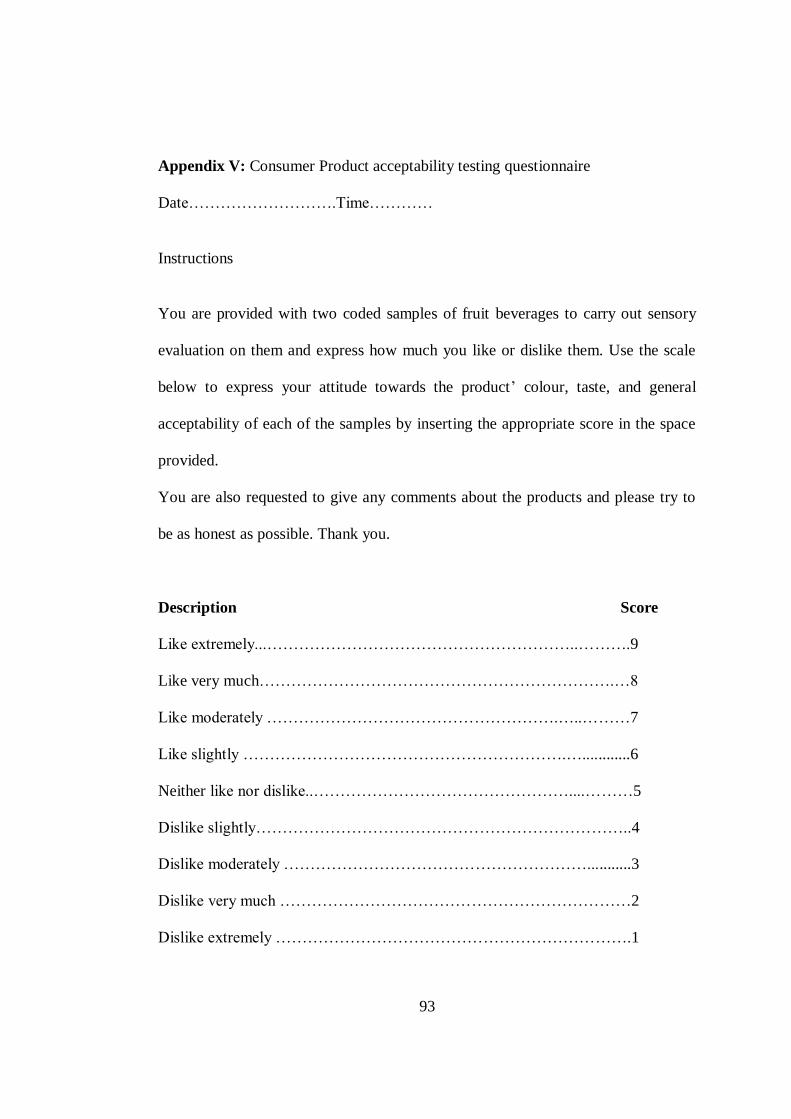
93
Appendix V: Consumer Product acceptability testing questionnaire
Date……………………….Time…………
Instructions
You are provided with two coded samples of fruit beverages to carry out sensory
evaluation on them and express how much you like or dislike them. Use the scale
below to express your attitude towards the product’ colour, taste, and general
acceptability of each of the samples by inserting the appropriate score in the space
provided.
You are also requested to give any comments about the products and please try to
be as honest as possible. Thank you.
Description Score
Like extremely...…………………………………………………..……….9
Like very much………………………………………………………….…8
Like moderately ……………………………………………….…..………7
Like slightly …………………………………………………….…............6
Neither like nor dislike..…………………………………………....………5
Dislike slightly……………………………………………………………..4
Dislike moderately …………………………………………………...........3
Dislike very much …………………………………………………………2
Dislike extremely ………………………………………………………….1
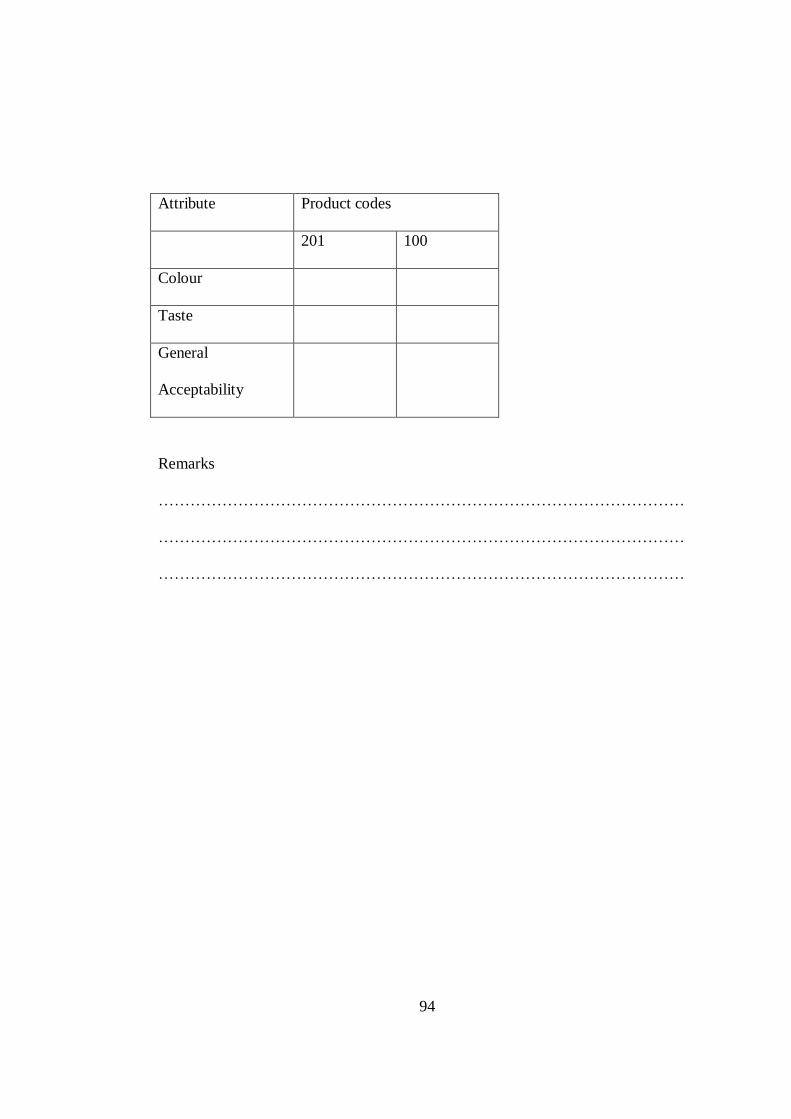
94
Attribute Product codes
201 100
Colour
Taste
General
Acceptability
Remarks
………………………………………………………………………………………
………………………………………………………………………………………
………………………………………………………………………………………
Copyright © 2022 FDOKUMEN