NUTRITIONAL AND BIOCHEMICAL POTENTIAL OF ...
226
NUTRITIONAL AND BIOCHEMICAL POTENTIAL OF FENUGREEK SUPPLEMENTED FLOUR By BAHZAD AFZAL 97-ag-1418 M.Sc. (Hons.) Food Technology A thesis submitted in partial fulfillment of the requirements for the degree of DOCTOR OF PHILOSOPHY IN FOOD TECHNOLOGY NATIONAL INSTITUTE OF FOOD SCIENCE & TECHNOLOGY FACULTY OF FOOD, NUTRITION & HOME SCIENCES UNIVERSITY OF AGRICULTURE, FAISALABAD PAKISTAN 2015
-
Upload
khangminh22 -
Category
Documents
-
view
0 -
download
0
Transcript of NUTRITIONAL AND BIOCHEMICAL POTENTIAL OF ...

NUTRITIONAL AND BIOCHEMICAL POTENTIAL OF
FENUGREEK SUPPLEMENTED FLOUR
By
BAHZAD AFZAL
97-ag-1418
M.Sc. (Hons.) Food Technology
A thesis submitted in partial fulfillment of the requirements for the degree of
DOCTOR OF PHILOSOPHY
IN
FOOD TECHNOLOGY
NATIONAL INSTITUTE OF FOOD SCIENCE & TECHNOLOGY
FACULTY OF FOOD, NUTRITION & HOME SCIENCES
UNIVERSITY OF AGRICULTURE, FAISALABAD
PAKISTAN
2015

i
DECLARATION
I hereby declare that the contents of the thesis, studies on “Nutritional and biochemical
potential of fenugreek supplemented flour” are the product of my own research and no part
has been copied from any published source (expect the references, standard mathematical or
genetic models/equations/formulas/protocols etc.). I, further, declare that this work has not
been submitted for the award of any other diploma/degree. The university may take action if
the information provided found inaccurate at any stage. (In case of any evasion the scholar will
be proceeded against as per HEC plagiarism policy).
Bahzad Afzal
97-ag-1418
ii
The Controller of Examinations,
University of Agriculture,
Faisalabad.
We, the Supervisory Committee, certify that the contents and form of this thesis submitted by
Bahzad Afzal, Reg. # 97-ag-1418 have been found satisfactory, and recommend that it be
processed for evaluation by the External Examiner(s) for the award of degree.
SUPERVISORY COMMITTEE:
Chairman:
(Dr. Imran Pasha)
Member:
(Prof. Dr. Tahir Zahoor)
Member:
(Prof. Dr. Haq Nawaz)
iii
DEDICATED To
Holy Prophet Muhammad
ملسو هيلع هللا ىلص
&
MY PARENTS
for their love, endless support and encouragement
iv
ACKNOWLEDGEMENTS
To esteem the Highness of Almighty Allah, I feel myself inept as my words have lost their expressions, knowledge is lacking and diction is too short to express gratitude in the rightful manner to the blessings and support of Allah Almighty whose help had flourished my ambitions and helped me to attain goals. Quivering hands feel mortified to hunt for words of praise for Holy Prophet Muhammad (P.B.U.H.) for enlightening our lives with the faith in Allah, selecting course of contented conscience, converging all His kindness and mercy upon him. Allah Almighty had been so helpful in His blessings by giving me a prospect to toil under the esteem supervision of Dr. Imran Pasha, Associate Professor, National Institute of Food Science and Technology, University of Agriculture, Faisalabad. I have no words to express my gratitude for his diligent cooperation, scrupulous support and cheering perspective during the entire degree program. I deem it my utmost pleasure in expressing my gratitude with the insightful benedictions to Prof. Dr. Tahir Zahoor, National Institute of Food Science and Technology, University of Agriculture, Faisalabad. His sympathetic attitude, parental guidance, scholarly suggestions and criticism indeed are incalculable wealth for me. Abstemious and stanch appreciation to Prof. Dr. Haq Nawaz, Institute of Animal Feed and Nutrition, University of Agriculture, Faisalabad, for his advices and valued suggestions throughout the research project. I feel much honor to express my deepest sense of gratitude and indebtedness to honorable Prof. Dr. Masood Sadiq Butt, Dean/Director General, National Institute of Food Science & Technology, Faculty of Food. Nutrition & Home Sciences, University of Agriculture, Faisalabad from the core of my heart for his marvelous guidance, encouraging behavior, scholastic and sympathetic attitude, masterly advice and indefatigable assistance at all time during the entire study program. I want to express my great appreciation and sincerest gratitude to all my fellows at the National Institute of Food Science & Technology, UAF for their dexterous, dynamic, untiring help, friendly behavior and moral support during my whole study. I am indeed thankful to all my sweet juniors for their earnest support throughout the course of my studies. Here I would be very selfish if I do not express my sincere and special gratitude for my loving father Muhammad Afzal (Late), my dearest mother who has always wished to see me glittering high on the skies of success. Their endless efforts and best wishes sustained me at all stages of my life & encouraged me for achieving high ideas of life and whose hands always remain raised in prayer for my success. I heartily thankful to my loving Brothers, Sisters, Bhabi and my sweet Fahad, Abdullah & Ayesha for their inspiring encouragement and moral support.
Bahzad Afzal

v
LIST OF CONTENTS
Acknowledgements iv
List of Tables ix
List of Figures xiii
Abstract xiv
1. INTRODUCTION 1
2. REVIEW OF LITERATURE 7
2.1 Functional foods and human health 8
2.2 Plants and their bioactive components 9
2.3 Fenugreek: an introduction 11
2.4 Phytochemistry of fenugreek 13
2.5 Fenugreek and flour rheological properties 14
2.6 Perspectives of product development 16
2.7 Fenugreek and antioxidant potential 19
2.8 Fenugreek and hyperglycemia 23
2.9 Fenugreek and hypercholesterolemia 27
2.10 Potential health risk 31
3. MATERIAL AND METHODS 32
3.1. Procurement of raw material 32
3.2 Preparation of raw material 32
3.3 Analysis of raw material 32
3.3.1. Proximate analysis 32
3.3.1.1 Moisture Content 32
3.3.1.2 Ash Content 32
3.3.1.3 Crude protein 33
3.3.1.4 Crude fat 33
3.3.1.5 Crude fiber 33
3.3.1.6 Nitrogen free extract (NFE) 33
3.3.2 Mineral profile 33
3.4 Rheological properties 33
3.5 Development of composite flour 34
3.6 Analyses of composite flour 34
3.6.1 Proximate analysis 34
3.6.2 Mineral profile 34
3.7 Rheological properties 35
3.8 Polyphenols extraction 35
3.9 Antioxidant assay 35
3.9.1 Total phenolic content 35
3.9.2 Total flavonoids 35
3.10 Antioxidant activity 36
3.10.1 Free radical scavenging activity (DPPH assay) 36
3.10.2 ß-carotene and linoleic acid assay 36
3.10.3 Ferric reducing antioxidant power (FRAP assay) 36
3.11 Preparation of bread 36
vi
3.12 Physicochemical characterization of bread 37
3.13 Antioxidant assay of bread 37
3.14 Antioxidant activity of bread 37
3.15 Sensory evaluation of bread 37
3.16 Selection of best treatments 38
3.17 Efficacy trial 38
3.17.1 Feed & water intakes 39
3.17.2 Serum lipid profile analysis 40
3.17.3 Serum glucose and insulin levels 40
3.17.4 Liver function tests 40
3.17.5 Renal function tests 40
3.17.6 Hematological analysis 40
3.18 Statistical analysis 40
4. RESULTS AND DISCUSSION 41
4.1 Proximate analysis of raw material 41
4.2 Mineral content of raw material 43
4.3 Proximate analysis of supplemented flour 45
4.3.1 Moisture content 45
4.3.2 Ash content 46
4.3.3 Crude protein 49
4.3.4 Crude fat 50
4.3.5 Crude fiber 51
4.3.6 Nitrogen free extract (NFE) 51
4.4 Mineral content of supplemented flour 52
4.4.1 Sodium (Na) 53
4.4.2 Potassium (K) 53
4.4.3 Iron (Fe) 54
4.4.4 Calcium (Ca) 57
4.4.5 Copper (Cu) 58
4.4.6 Zinc (Zn) 59
4.4.7 Manganese (Mn) 59
4.5 Rheological study 60
4.5.1 Farinographic studies 61
4.5.1.1 Water absorption 61
4.5.1.2 Arrival time 62
4.5.1.3 Dough development time (DDT) 63
4.5.1.4 Departure time 64
4.5.1.5 Dough stability 64
4.5.1.6 Mixing tolerance index 65
4.5.2 Mixographic studies 66 4.5.2.1 Mixing time 66
4.5.2.2 Peak height percentage 69
4.6 Antioxidant assay of supplemented flour 72
4.6.1 Total phenolic content (TPC) 72
4.6.2 Total flavonoids 73
4.7 Antioxidant activity 74

vii
4.7.1 Free radical scavenging activity (DPPH Assay) 74
4.7.2 β‐carotene and linoleic acid assay 78
4.7.3 Ferric reducing antioxidant power (FRAP assay) 78
4.8 Preparation of bread 79
4.9 Proximate analysis of bread 80
4.9.1 Moisture content 80
4.9.2 Ash content 81
4.9.3 Crude protein 81
4.9.4 Crude fat 84
4.9.5 Crude fiber 85
4.9.6 Nitrogen free extract (NFE) 86
4.10 Mineral content of bread 87
4.10.1 Sodium (Na) 87
4.10.2 Potassium (K) 88
4.10.3 Iron (Fe) 88
4.10.4 Calcium (Ca) 91
4.10.4 Copper (Cu) 92
4.10.6 Zinc (Zn) 93
4.10.7 Manganese (Mn) 93
4.11 Antioxidant assay of bread 94
4.11.1 Total Phenolic Content (TPC) 95
4.11.2 Total flavonoids 95
4.12 Antioxidant activity of bread 96
4.12.1 Free radical scavenging activity (DPPH Assay) 96
4.12.2 β-carotene and linoleic acid assay 97
4.12.3 Ferric reducing antioxidant power (FRAP assay) 98
4.13 Color of bread 98
4.14 Texture of bread 102
4.14.1 Texture profile of bread supplemented with leaves powder 102
4.14.2 Texture profile of bread supplemented with seeds powder 105
4.15 Sensory evaluation of Bread 110
4.15.1 Volume of bread 110
4.15.2 Aroma of bread 111
4.15.3 Taste of bread 115
4.15.4 Crust color of bread 115
4.15.5 Character of bread crust 119
4.15.6 Texture of bread 119
4.15.7 Crumb color for bread 122
4.15.8 Grain of bread 125
4.15.9 Symmetry of bread form 126
4.15.10 Evenness of bake of bread 126
4.15.11 Overall acceptability of bread 128
4.16 Efficacy study 134
4.16.1. Feed intake 134
4.16.2. Water intake 137
4.16.3. Body weight 139

viii
4.16.4 Serum profile analysis 140
4.16.4.1 Glucose 140
4.16.4.2 Cholesterol 144
4.16.4.3 Insulin 147
4.16.4.4 High density lipoprotein (HDL) 149
4.16.4.5 Low density lipoprotein (LDL) 150
4.16.4.6 Triglycerides 150
4.16.5 Liver functions tests 155
4.16.5.1 Aspartate aminotransferase (AST) 156
4.16.5.2 Alanine transaminase (ALT) 156
4.16.5.3 Alkaline phosphatase (ALP) 156
4.16.6 Renal function tests 161
4.16.6.1 Urea 161
4.16.6.2 Creatinine 161
4.16.7 Hematological analysis 164
4.16.7.1 Red blood cell (RBC) 164
4.16.7.2 White blood cells count (WBCs) 164
4.16.7. Platelets counts (PLC) 164
5. SUMMARY 168
ECONOMIC PERSPECTIVES 175
CONCULUSIONS 176
RECOMMENDATIONS 177
LIMITATIONS AND FUTURE VISTAS 178
LITERATURE CITED 179
APPENDICES 210

ix
LIST OF TABLES
Table # Title Page #
3.1 Treatments used in the study plan 34
3.2 Diet plan used for efficacy trial 39
4.1 Proximate analysis (%) of raw material 44
4.2 Mineral content (mg/100g) of raw material 44
4.3 Mean squares for proximate analysis of different treatments
supplemented with fenugreek leaves powder 47
4.4 Proximate analysis (%) of different treatments supplemented with
fenugreek leaves powder 47
4.5 Mean squares for proximate analysis of different treatments
supplemented with fenugreek seeds powder 48
4.6 Proximate analysis (%) for different treatments supplemented with
fenugreek seeds powder 48
4.7 Mean squares for mineral content of different treatments supplemented
with fenugreek leaves powder 55
4.8 Mineral content (mg/100g) of different treatments supplemented with
fenugreek leaves powder 55
4.9 Mean squares for mineral content of different treatments supplemented
with fenugreek seeds powder 56
4.10 Mineral content (mg/100g) of different treatments supplemented with
fenugreek seeds powder 56
4.11 Mean squares for Farinographic parameters of different treatments
supplemented with fenugreek leaves powder 67
4.12 Farinographic parameters of different treatments supplemented with
fenugreek leaves powder 67
4.13 Mean squares for Farinographic parameters of different treatments
supplemented with fenugreek seeds powder
68
4.14 Farinographic parameters of different treatments supplemented with
fenugreek seeds powder 68
4.15 Mean squares for Mixographic parameters of different treatments
supplemented with fenugreek leaves powder 70
4.16 Mixographic parameters of different treatments supplemented with
fenugreek leaves powder 70
4.17 Mean squares for Mixographic parameters of different treatments
supplemented with fenugreek seeds powder 71
x
4.18 Mixographic parameters of different treatments supplemented with
fenugreek seeds powder 71
4.19 Mean squares for antioxidants in different treatments supplemented with
fenugreek leaves powder 76
4.20 Antioxidant in different treatments supplemented with fenugreek leaves
powder 76
4.21 Mean squares for antioxidants in different treatments supplemented with
fenugreek seeds powder 77
4.22 Antioxidants in different treatments supplemented with fenugreek seeds
powder 77
4.23 Means squares for proximate analysis of bread supplemented with
fenugreek leaves powder 82
4.24 Proximate analysis (%) of bread supplemented with fenugreek leaves
powder 82
4.25 Mean squares for proximate analysis of bread supplemented with
fenugreek seeds powder 83
4.26 Proximate analysis (%) of bread supplemented with fenugreek seeds
powder 83
4.27 Mean squares for mineral content of bread supplemented with fenugreek
leaves powder 89
4.28 Mineral content (mg/100g) of bread supplemented with fenugreek leaves
powder 89
4.29 Mean squares for mineral content of bread supplemented with fenugreek
seeds powder 90
4.30 Mineral content (mg/100g) of bread supplemented with fenugreek seeds
powder 90
4.31 Mean squares for antioxidants in bread supplemented with fenugreek
leaves powder 99
4.32 Antioxidants in bread supplemented with fenugreek leaves powder 99
4.33 Mean squares for antioxidants in bread supplemented with fenugreek
seeds powder 100
4.34 Antioxidants in bread supplemented with fenugreek seeds powder 100
4.35 Mean squares for color of bread supplemented with fenugreek leaves
powder 103
4.36 Mean values for color of bread supplemented with fenugreek leaves
powder 103
4.37 Mean squares for color of bread supplemented with fenugreek seeds
powder 104

xi
4.38 Mean values for color of bread supplemented with fenugreek seeds
powder 104
4.39 Mean squares for bread texture supplemented with fenugreek leaves
powder 106
4.40 Mean value for bread texture supplemented with fenugreek leaves
powder 106
4.41 Mean squares for bread texture supplemented with fenugreek seeds
powder 107
4.42 Mean value for bread texture supplemented with fenugreek seeds powder 107
4.43 Mean squares for sensory parameters of bread supplemented with
fenugreek leaves powder 113
4.44 Mean squares for sensory parameters of bread supplemented with
fenugreek seeds powder 114
4.45 Effect of treatments and storage on volume of bread supplemented with
fenugreek leaves powder 116
4.46 Effect of treatments and storage on volume of bread supplemented with
fenugreek seeds powder 116
4.47 Effect of treatments and storage on aroma of bread supplemented with
fenugreek leaves powder 117
4.48 Effect of treatments and storage on aroma of bread supplemented with
fenugreek seeds powder 117
4.49 Effect of treatments and storage on taste of bread supplemented with
fenugreek leaves powder 120
4.50 Effect of treatments and storage on taste of bread supplemented with
fenugreek seeds powder 120
4.51 Effect of treatments and storage on crust color of bread supplemented
with fenugreek leaves powder 121
4.52 Effect of treatments and storage on crust color of bread supplemented
with fenugreek seeds powder 121
4.53 Effect of treatments and storage on character of bread crust supplemented
with fenugreek leaves powder 123
4.54 Effect of treatments and storage on character of bread crust supplemented
with fenugreek seeds powder 123
4.55 Effect of treatments and storage on texture of bread supplemented with
fenugreek leaves powder 124
4.56 Effect of treatments and storage on texture of bread supplemented with
fenugreek seeds powder 124
4.57 Effect of treatments and storage on crumb color of bread supplemented
with fenugreek leaves powder 127

xii
4.58 Effect of treatments and storage on crumb color of bread supplemented
with fenugreek seeds powder 127
4.59 Effect of treatments and storage on grain of bread supplemented with
fenugreek leaves powder 130
4.60 Effect of treatments and storage on grain of bread supplemented with
fenugreek seeds powder 130
4.61 Effect of treatments and storage on symmetry of bread form
supplemented with fenugreek leaves powder 131
4.62 Effect of treatments and storage on symmetry of bread form
supplemented with fenugreek seeds powder 131
4.63 Effect of treatments and storage on evenness of bake of bread
supplemented with fenugreek leaves powder 132
4.64 Effect of treatments and storage on evenness of bake of bread
supplemented with fenugreek seeds powder 132
4.65 Effect of treatments and storage on overall acceptability of bread
supplemented with fenugreek leaves powder 133
4.66 Effect of treatments and storage on overall acceptability of bread
supplemented with fenugreek seeds powder 133
4.67 Effect of diets and time interval on feed, water intake & body weight of
rats in different studies 135
4.68 Effect of supplemented diets on glucose (mg/dL) 145
4.69 Effect of supplemented diets on cholesterol (mg/dL) 148
4.70 Effect of supplemented diets on Insulin (µU/mL) 151
4.71 Effect of supplemented diets on HDL (mg/dL) 152
4.72 Effect of supplemented diets on LDL (mg/dL) 153
4.73 Effect of supplemented diets on triglycerides (mg/dL) 157
4.74 Effect of supplemented diets on serum AST (IU/L) 159
4.75 Effect of supplemented diets on serum ALT (IU/L) 159
4.76 Effect of supplemented diets on serum ALP (IU/L) 160
4.77 Effect of supplemented diets on Urea (mg/dL) 160
4.78 Effect of supplemented diets on creatinine (mg/dL) 163
4.79 Effect of supplemented diets on red blood cell indices (cells/pL) 163
4.80 Effect of supplemented diets on white blood cell Indices (cells/nL) 165
4.81 Effect of supplemented diets on Platelets count 165

xiii
LIST OF FIGURES
Fig. # Title Page #
4.1 Feed intake of normal rats (study I) 136
4.2 Feed intake of hyperglycemic rats (study II) 136
4.3 Feed intake of hypercholesterolemic rats (study III) 136
4.4 Water intake of normal rats (study I) 138
4.5 Water intake of hyperglycemic rats (study II) 138
4.6 Water intake of hypercholesterolemic rats (study III) 138
4.7 Body weight of normal rats (study I) 141
4.8 Body weight of hyperglycemic rats (study II) 141
4.9 Body weight of hypercholesterolemic rats (study III) 141
4.10 Percent reduction in glucose as compared to control 145
4.11 Percent reduction in cholesterol as compared to control 148
4.12 Percent increase in Insulin as compared to control 151
4.13 Percent increase in HDL as compared to control 152
4.14 Percent decrease in LDL as compared to control 153
4.15 Percent decrease in triglycerides as compared to control 157

xiv
ABSTRACT
Globally, lifestyle related health concerns are amongst the serious challenges to mankind.
These disorders are attributed to sedentary living habits and poor dietary practices. In
this context, diet based regimen is gaining importance to alleviate these issues. Fenugreek
(Trigonella foenum-graecum) is well recognized for imparting flavor to various dietary
edibles. Alongside, it contains fair proportions of nutrients helpful in preventing several
metabolic syndromes. Purposely, the present research was designed to elucidate nutritional
and antioxidant potential of fenugreek leaves and seeds followed by their incorporation
in bread formula. Moreover, hypoglycemic and hypocholesterolemic perspectives were
also explored. Based on the current study outcomes, fenugreek leaves and seeds have
appeared as rich sources of protein, fiber and minerals that offer immense opportunities for the
development of various value added products to ensure improved nutritional value and health.
The leaves and seeds powders were incorporated into wheat flour @ 5, 10 and 15% to made
composite flour. Chemical and mineral analysis of composite flours explicated that
supplementation enhanced protein and mineral content. The leaves and seeds flour showed
potent antioxidant potential attributed to numerous nutraceutics. The improvement in
rheological characteristics of flour like water absorption, dough development time and dough
stability were also observed with the increment in supplementation levels. In product
development phase, higher acceptability was noticed in bread containing fenugreek
leaves powder up to 5% and seeds powder by 10%. The phytochemical analysis of the
resultant bread revealed TPC as 198.00±9.10 & 341.00±16.02 mg GAE/100g and total
flavonoids 2.47±0.08 & 2.68±0.10 mg CE/g, respectively for leaves & seeds powder.
Likewise, antioxidant activity of the prepared bread in terms of DPPH scavenging activity
was up to 37.00±1.59 & 49.00±2.20%, β-carotene & Linoleic acid assay as 31.00±1.42 &
40.00±1.88% and FRAP 201.00±9.24 & 401.00±18.44 µmol Fe2+/g, respectively.
Furthermore, efficacy trials revealed that diets containing 5% leaves powder or 10%
seeds powder were effective in ameliorating hyperglycemia and hypercholesterolemia in
rat models. In this connection, glucose reduction was up to 6.78 & 10.67% in
hyperglycemic rats fed on leaves & seeds powder enriched diets as compared to control.
Furthermore, insulin level decreased significantly in control group whilst, inclining trend
was observed in groups fed on leaves and seeds enriched diets. Accordingly, elevation
by 2.96 & 4.01% in insulin level of groups was observed in groups relying on leaves and
seeds powder accordingly. In hypercholesterolemic rats, elevated level of cholesterol was
markedly reduced as a function of fenugreek leaves and seeds powder i.e. 6.32 & 12.03%,
respectively. Similarly, fenugreek leaves and seeds supplemented diets showed declining
trend in LDL by 4.56-12.25 & 4.52-11.34%, respectively. It is therefore inferred that apart
from flavor and fragrance, fenugreek leaves and seeds have a lot to offer in terms of health
improvement. Conclusively, fenugreek based dietary approach is recommended for boosting
health and suppressing metabolic ailments.

1
Chapter 1
INTRODUCTION
The recent era has witnessed the coinage of lifestyle related malfunctions due to poor dietary
habits, altering lifestyles and elevated consumption of refined and processed foods. The
increased metabolic dysfunctions have identified themselves as a great threat for healthy life.
In this context, the prevention of these maladies has captured a vital status to improve the
healthy living standards. Researchers have proved the preventive and therapeutic effects of
various foods and food ingredients. Likewise, the use of natural remedies for prevention of
lifestyle related disorders has gained paramount importance amongst consumers. Recently
number of researchers has explored the facts of natural foods to curtail metabolic ailments. In
this regard, herbs and spices are in limelight having greater potential in research areas to
develop certain products that improve the health status alongside providing basic nutrition.
Moreover, the use of phytochemicals in routine products is of immense consideration to uplift
the protective role of food products against numerous malfunctions. However, the utilization
of functional ingredients in daily foods is a preventive approach against various disorders (Liu
et al., 2007; Sethi et al., 2008). Similarly, these ingredients are helpful in reducing the risk of
such ailments due to their pharmacological perspectives (Misra and Khurana, 2008).
Fenugreek (Trigonella foenum-graecum) locally known as methi, a member of legume family
originated from Asia and Southeastern Europe but presently it is ubiquitous in Pakistan, India,
Egypt and many other countries of the world (Betty, 2008). Fenugreek has a typical fragrance
and grown everywhere in Pakistan. However, due to large cultivation in Kasur district, it is
also called as Kasuri Methi (Erum et al., 2011). The fresh leaves of fenugreek are being used
as vegetable in the diets which provides β-carotene, fiber, calcium and zinc (Jani et al., 2009).
In addition fenugreek seeds possess little bit sweetish and pleasant bitter taste. It has central
hard yellowish embryo and white semi-transparent endosperm which contains a carbohydrate
and gum like consistency namely galactomannans (Betty, 2008). Fenugreek seeds contains
25.2-30.1% protein, 7.2-9.3% lipids, 20.1-25.3% insoluble fiber, 20.4-30.2% galactomannan
and 5.3-7.3% saponins, volatile oils, free amino acids, mucilaginous fiber and flavonoids (Raju
and Bird, 2006). The fenugreek seeds also comprises alkaloids of pyridine-type, generally

2
trigonelline (0.21-0.35%), choline (0.51%), carpaine and gentianine; flavonoids apigenins,
orientin, quercetin, rutin, free amino acids; such as hydroxyl-isoleucine (0.08%), arginine,
histidine and lysine, some minerals like iron and calcium, glycosides that yield steroids on
hydrolysis i.e. tigogenin, yamogenin and neotigogenin (Mehrafarin et al., 2010).
Globally, fenugreek leaves and seeds powder are being used in food formulations, as a
medicinal herb, as a coffee alternative, insect repellent in grain storages and in fragrance
manufacturing industries (Ahari et al., 2009). In Sudan and Egypt, the seeds are used in making
beverages and in some countries the roasted seeds are used as a coffee substitute, probably
because of the alkaloid trigonelline content, which is a basic constituent of the coffee seeds.
Whilst in Egypt, the seeds of fenugreek are added to bread as a supplement of wheat and maize
(Hidvegi et al., 1984). In India and Pakistan, it is utilized as green leafy vegetable and has rich
nutritional profile i.e. iron, calcium, carotenoids and other water soluble vitamins (Sharma et
al., 1996).
The fenugreek leaves and seeds are widely utilized in cooking and have a maple smell and
flavor which make them a unique spice in foods, beverages and confections. The sprouted
seeds eaten raw in salads along with fresh green leaves or cooked into curries, soups, bread
and many other recipes (Turner and Frey, 2005). The seeds are also being used in number of
dishes, tea, garnishing desserts (Chhibba et al., 2007), pickles & supplements (Srinivasan,
2006; Liu et al., 2012) and specialty products like nans and breads (Sharma et al., 1996).
Indians used methi for preparation of number of products i.e. raita, ladoo, basin methi
particularly in Rajistan (Mathur and Choudhry, 2009). Flour containing fenugreek seeds
powder has good attribute for bakery products and wheat flour have been supplemented with
fenugreek seeds for achieving better results in developing number of food menus (Hooda and
Jood, 2004).
Owing to economic benefits and enhancement in nutritional profile, use of composite flour is
gaining importance day by day in baking science. Many regions of the world use composite
flours in product development. The basic theme behind composite flour is its enriched profile
regarding nutrition and health benefits (Dasappa et al., 2003). Intakes of some legumes and
other similar plants can be boosted up by composite flour technology. The benefit of producing
cereal legume composite foods may be considered as two fold: (1) There is an overall increase

3
in the protein content of composite food compared to when only cereal forms the base, and (2)
combined use of legumes and cereals can provide balanced amino acids, which can be used to
treat malnutrition (Ribotta et al., 2005: Gomez et al., 2008).
In previous investigation the development and evaluation of composite flour for missi
roti/chapatti was carried out to develop nutritious flours from various food commodities like
wheat flour, chickpea, soybean and fenugreek leaves powder. The supplementation of
fenugreek powder increased the nutritional quality of flour particularly in terms of mineral
content (calcium and iron) and fiber. All blended flours were found to have good sensory
quality characteristics of products as control and could be well stored in polyethylene bags or
tin boxes for the period of three months without any deterioration of quality (Kadam et al.,
2012). Fenugreek can be added upto 10% in wheat flour for preparation of biscuits with
appealing characteristics and it also augmented protein quantity & quality, calcium, iron
content and fiber (Hooda and Jood, 2004).
For preparation of baked goods, rheological properties of the dough are of vital importance.
Wheat, the main ingredient in most baked foods, contains viscoelastic gluten, which confers
specific rheological properties to the dough, and this in turn influences the final quality of the
baked product. Therefore, it would be expected that during preparation of composite flours and
dough, partial replacement of wheat with another ingredient resulted with devoid of gluten that
would influence rheological properties of the resultant dough (Abdel‐Kader, 2000). For
preparation of bakery products rheological properties of flour paly important role for end
product quality. So, the supplementation of fenugreek and other legumes in wheat flour
increased the protein content that affects the rheological parameters (Mahmoud, 2013). The
rheological, organoleptic and physiological characteristics of fenugreek-wheat supplemented
mixes have displayed promising outcomes with respect to increase in protein and fat content
(Hooda and Jood, 2005).
Wheat flour supplemented with 8-10% fenugreek seeds powder has been utilized for preparing
baked items like bread, muffins, pizza and cakes with suitable sensory attributes (Srinivasan,
2005). Enclosure of raw, steeped or germinated fenugreek produces good sensory and
physicochemical profile in developed bakery products unless used at 15% level (Hooda and
Jood, 2005). The physical characteristics of composite baked goods influence their sensory
4
quality and acceptability by consumers. Of interest characteristics are crust & crumb color,
loaf volume, loaf height, biscuit width, and spread factor. Generally, with incorporation of a
legume, the composite baked product tends to become darker as a result of Maillard reaction
due to the relatively higher levels of lysine. Composite bread also tend to have lower volume
& height, denser and are more compact in structure due to the reduction in levels of gluten.
With current emphasis on healthy bread with low glycemic index, high protein and increased
dietary fiber, the use of composite flours in baked goods is to be favored. Therefore, given the
inherent nutritional and therapeutic advantages of fenugreek, it could find useful application
in the baking industry. Many studies have reported on the possibility of replacing (although
partially) wheat flour with those obtained from local crops for the purpose of making bread
and other baked products (Mepba et al., 2007; Ade-Omowaye et al., 2008; Olaoye and
Onilude, 2008), however, consumer acceptability of these products is still under study.
Fenugreek, a rich source of phytochemicals is being used as medicinal plant. It contains lysine
& L-tryptophan rich proteins, mucilaginous fiber and other important chemical constituents
like coumarin, saponins, sapogenins, fenugreekine, phytic acid, nicotinic acid, scopoletin &
trigonelline, which are supposed to be for many of its beneficial health effects. Different
components of the seeds have various beneficial functions like associated with treatment or
protection from of chronic diseases such as cardiac complications, hypertension, diabetes,
cancer and other medical complications. Phenolic compounds, for instance, through their
antioxidant activity, are hypothesized to have the ability to reduce the risk of developing certain
cancers by potentially protecting body cells against oxidative damage caused by reactive
oxygen species. On the other hand, many of these phytochemicals together with other seeds
components are regarded as antinutritional factors (Mehrafarin et al., 2010). Therefore, with
regard to these phytochemicals or antinutritional factors, the objective of producing composite
baked goods may either be to retain these factors in order to exert potential health benefits or
to use the processing to eliminate or inactivate them so as to reduce their antinutritional effects.
However, it appears that with regard to composite baked goods, not much research has been
conducted to determine the effect of compositing and processing on levels of these
phytochemicals.

5
During baking, there was a decrease in free phenolics and an increase inbound phenolics,
whereas antioxidant activities remained relatively stable. Hence fenugreek has rich profile of
polyphenolic compounds (Rayyan et al., 2010) possessing numerous favorable activities, like
antioxidant effect (Ravikumar and Anuradha, 1999; Bukhari et al., 2008), cancer precautionary
activity (Raju et al., 2004), anti-diabetic activity and cholesterol lowering effect (Sowmya and
Rajyalakshmi, 1999; Broca et al., 2000; Meghwal and Goswami, 2012). Ample utilization of
fenugreek declines the blood cholesterol level and improves the fat profile of blood in rats
(Kamal-Eldin et al., 2000). This possesses excellent antioxidant capability because free radical
produced in body are easily scavenged by it and hence cancer is prevented (Ozsoy et al., 2009).
These components excellently reduce peroxides in serum and avoid hydrogen peroxide attack
at cell by initiating peroxisomes which also saves breakdown of blood cells (Kaviarasan et al.,
2004).
Diabetes is proliferating attributed to economic and social factors particularly in developing
countries. According to survey by 2030 approx. 300 million people will become victim of this
disease. Presently, Pakistan occupies 6th position which is drastic and can be at 5th until 2030
(Wild et al., 2004). Although drugs are being used for treatment of this disease but they are
more problematic than therapy (Zakir et al., 2008). Fenugreek has both hypoglycemic and
hypocholesterolemic effects. Moreover, fenugreek ingestion found non-toxic effects in both
rat and human studies (Vijayakumar et al., 2005). Consumption of wheat-fenugreek bread
found composite effect for diabetics reduction and it does not disturb the sensory
characteristics but controls insulin sensitivity especially in type II diabetics. Hence its addition
to bread is vital for controlling glycemic index (Losso et al., 2009). Fenugreek also improves
blood lipid profile like LDL and HDL in a way that it lowers LDL and boosts up HDL along
with enhancing the body antioxidant status (Stancu and Sima, 2001). Its beneficial influences
may be owing to sapogenins, which rise biliary cholesterol secretion, in turn reducing serum
cholesterol levels (Stark and Madar, 1993).
From nutritional and health point of view, fenugreek seeds and leaves are good source of
minerals and phytochemicals. Their incorporation in diet through appropriate processing
procedures could bring numerous benefits to the society with special reference to micronutrient
malnutrition prevailing in the country as well as chronic ailments and oxidative stress mediated

6
dysfunctions in response to nutrition transition towards hypercaloric diets that are dominating
over the globe particularly among the young urbanities. Besides, the research is of applied
nature and the provision of fenugreek based designer foods has the ability to enhance the
nutritional and non-nutritive aspects of the already existing leavened bread. Furthermore,
nutrification of exogenous antioxidants in designer foods would not only improve health status
but also enhance endogenous antioxidant capacity such as superoxide dismutase, catalase,
glutathione, etc. These foods not only ensure long-term positive impacts on health status but
also give you mind satisfaction for having a food with holistic nature. All these benefits would
surely boost up your immune defense, not only curtailing free radical mechanism and related
oxidative stress in the body but also giving a positive concept of “eat healthy, live healthy” to
prevent the disease onset at very initial stages by suggesting food modifications and
diversification, rather depending on medication with negative health effects at longer run.
In addition, despite of few researches on its medical value, fenugreek has not been well studied
with respect to nutritional composition, phytochemicals concentration, processing
characteristics and value added products development. Particularly in Pakistan, the historical
and traditional utilization of fenugreek has not been supported and improved by academic
researches regarding its agro-climatic preference, productivity, disease resistance, variety
distribution, storage & handling conditions, chemical & nutritional composition, processing
quality, therapeutic & functional values, product diversification and process technology
developments. Hence, the impact of fenugreek could be substantial for pharmaceutical and
food industry because of its two fold helpful influence on hyperglycemia and
hypercholesterolemia. Therefore, this study was conducted at the expectation that it contributes
its part to pursuit the stated problems and to enhance the awareness and exploitation of the
functional and nutritional values of fenugreek. The objectives of the study were;
1. To evaluate nutritional and biochemical worth of Pakistani fenugreek.
2. To produce functional bakery product with the addition of fenugreek leaves and seeds
powder, separately.
3. To assess nutraceutical potential of composite flour of fenugreek leaves and seeds
powder through model feed trial.

7
Chapter 2
REVIEW OF LITERATURE
Functional foods and legumes have been recognized as health promoters and therapeutics that
playing important role in today busy life (Bouchenak and Lamri-Senhadji, 2013). These
entities are prime source of protein, fibers, mineral like Fe, Zn, Ca, Mg, K & have low Na and
cholesterol. As compared to dietary guidelines, nutrient composition confers ideal properties
to these foods (Trinidad et al., 2010). Mostly found phytochemicals in legume family are like
phytoestrogens, phytohemagglutinins (lectins), enzyme inhibitors, oligosaccharides, phenolic
compounds and saponins that modify metabolism of human after their consumption
(Bouchenak and Lamri-Senhadji, 2013). Legumes have various physiological effects that can
be studied by using any member of this family, thus investigation of legumes that are consumed
less may uncover new sources. Hence, therapeutic effects and disease prevention can be carried
out by using fenugreek. Owing to its medicinal importance, the chemical composition has been
explored which reveal that it is an excellent source of L-tryptophan, mucilaginous fiber, lysine,
nicotinic acid, phytic acid, sapogenins and other constituents (Mullaicharam and GeetaliDeori,
2013). Considering the facts, the current research was intended to explore the nutritional and
nutraceutical role of locally grown fenugreek with special reference against lifestyle related
disorders. The literature regarding different features of the current work has been piled under
the following headings.
2.1 Functional foods and human health
2.2 Plants and their bioactive components
2.3 Fenugreek: an introduction
2.4 Phytochemistry of fenugreek
2.5 Fenugreek and flour rheological properties
2.6 Perspectives of product development
2.7 Fenugreek and antioxidant potential
2.8 Fenugreek and hyperglycemia
2.9 Fenugreek and hypercholesterolemia
2.10 Potential health risk

8
2.1 Functional foods and human health
Food supplies all necessary nutrients to our body and provides energy, supports metabolism
and helps in growth and maintains body’s vigor. Dietary fiber and designer food have been
tailored to achieve health benefits because these reduces the risk of numerous diseases (Kaur
and Das, 2011).
In next decades functional foods will be the major one including fruits, vegetables, fortified
foods and whole grains (Jones and Varady, 2007; Schwager et al., 2008). Dairy products, soya
products, eggs, fats and oils have been developed to maintain health and obtain other benefits
(Watson et al., 2006). Canadian health define that functional foods are similar to that of
traditional foods having defined health benefits (Shahidi, 2009). According to definition,
functional food is part of human diet and is demonstrated to provide health benefits that
decrease the risk of chronic diseases beyond those provided by adequate nutrition. The
functional foods include (i) usual foods with naturally occurring bioactive substances (ii) foods
supplemented with bioactive substances (iii) derived food ingredients introduced in
conventional foods. Functional foods should have novel prospective, rather than a food
product. It should also be mentioned that functional foods are not medicines such as pills but
are consumed as part of normal diet (Grajek et al., 2005).
Functional foods are different than medicinal foods but are used in specific conditions. These
foods are increasing in trend and food sector is rapidly developing new products to promote
health among consumers (Mollet and Lacroix, 2007). Many unique functional foods have been
developed by combining food with herbal medicines. In some countries traditional herbal
products are widely used as medicine in dietary supplements, daily foods and functional foods,
for replenishment and health promotion purposes. The concept is connected with immune
potentiation, the improvement of system circulation, disease prevention and control of aging
(Shi et al., 2010).
Good organoleptic qualities can be conferred to food consumers as they accept functional foods
over the traditional foods in the market (Klahorst, 2006). The development of functional foods
requires a multidimensional approach in order to meet consumer needs under the existing food
regulations. The nutritionists, food chemists, food technologists, biochemists, toxicologists and
clinicians must work together to produce a product that can claim the appropriate health
9
benefits. Epidemiological investigation may provide evidence-based scientific information,
which needs to be studied experimentally for biological responses, using appropriate
biomarkers. Further, these will need to be tested in clinical trials for establishing their health
benefits or risk-reducing effects. Foods such as cereals, pulses, nuts, vegetables, fruits,
beverages and spices have been widely studied. Genetic manipulations to increase the content
of active ingredients may also be useful for enhancing bio-potency (e.g. omega 3 eggs, golden
rice). Technological innovations can improve the product (e.g. soy fermented sauces, pre- and
probiotics) and it is also possible to add bioactive compounds to a traditional food (for instance
guar gum, fenugreek powder or bran). In such situations, it is necessary to keep in mind the
bioavailability of both the active and other physiologically relevant ingredients (Fogliano and
Vitaglione, 2005). Health related properties of functional foods may affect consumer choice &
acceptability and they always think about health benefits while buying such foods (Sanlier and
Seren Karakus, 2010). Promotional and educational technologies are important in creating
consumer awareness and studies on consumption behavior of functional foods indicated that
people awareness about the functionality of such foods increased their demand (Rosemen and
Kurzynske, 2006).
Depending upon consumption pattern and functionality functional foods should be
distinguished from conventional foods (Doyon and Labrecque, 2008). People who are health
conscious will become more inclined towards functional and nutraceutical foods. So, health
concern is a driving force that determines the purchase of such foods (Worsley and Lea, 2008).
In similar way Shahzad and Khattak (2011) performed market analysis of functional foods in
Pakistan and five different points were selected to know about consumer response. The results
of this survey illustrated that male consumers were more attracted towards functional qualities
than females who were fastidious about nutritional values. Wheat based products are important
for introducing nutraceutical components to masses in Pakistan where staple food is wheat
(Jacob and Leelavathi, 2007) and fenugreek i.e. rich in nutritional profile can be added to wheat
flour for conferring health benefits.
2.2 Plants and their bioactive compounds
Initially people consumed food plants for their health benefits but owing to medicinal
performances various components have been extracted to use them as cure for different
10
diseases (Vinatoru, 2001). During Roman and Greek times many drugs were formulated for
treating numerous ailments like Theophrastus, Hippocrates, Dioscorides and Celsus did a lot
of work in this regard (Paulsen, 2010). Romanian pharmacopeia was introduced that indicated
many medicinal herbs and an institute was established in Roman Empire (Vinatoru, 2001).
Bioactive compounds are very important but they were discovered later as a result of scientific
advancement and these compounds are produced as metabolites of secondary stage (Bernhoft,
2010).
The production process of the secondary metabolites depends on stage of life and specific need
of the plant. Like aroma synthesis in floral plants to attract different insects for pollination and
fertilization, production of toxic chemicals or compounds to safe guard against pathogens as
well as hinder the growth of neighboring plants (Dudareva and Pichersky, 2000). Some of
these secondary metabolites consider as role in biological systems that considered as bioactive.
So we can define bioactive compounds in plants as: secondary plant metabolites producing
pharmacological or toxicological effects in human and animals (Bernhoft, 2010). According
to Croteau et al. (2000) the bioactive compounds available in plants have three main categories:
(a) terpenes and terpenoids (b) alkaloids and (c) phenolic compounds. These bioactive
ingredients are diverse in nature like phenolic and carotenoids showing considerable
antioxidative activity (Dahan et al., 2007; Henson et al., 2008; Shahidi, 2009).
General composition of an herb or a spice contains sugar, proteins, essential oil, fiber, vitamins,
minerals and pigments (Viuda-Martos et al., 2007). Biomolecules enclosed in an herb are like
phenolic acids, flavonoids, cumarins and sterols (Uhl, 2000). Phenolic acids are the
predominant one for most of their health augmenting properties, but it depends on type and
quantity of a phenolic component. The exact configuration of phenolic can be determined by
various parameters such as the specific portion of the plant utilized, its vegetative state,
harvesting practices and environmental surroundings etc. (Viuda-Martos et al., 2010). One of
the major renowned compound enclosed in herbs and spices and accountable for most of the
purposeful properties of designer foods are phenolic composites in any of their forms. It could
be in the form of a simple phenols& flavonoids i.e. flavones, flavanols, flavanones and
anthocyanins etc. Many scientific and systematic studies have pointed out the functional
aspects of phenolic compounds and more precisely, flavonoids. Such pharmacological

11
potentials include their antioxidant (Bozin et al., 2008; Lin et al., 2009), antiviral (Tait et al.,
2006), antibacterial (Babajide et al., 2008) and anti-inflammatory (Lin et al., 2008)
capabilities. They also possess promising vigor of cardioprotection (Gamelin et al., 2004),
anticarcinogenic potential (Pergola et al., 2006; Russo et al., 2006) and inhibition of platelet
aggregation (Arct and Pytkowska, 2008). These compounds also cure cardiovascular diseases
and mostly these compounds are present in vegetables, fruits, flaxseeds oil and soy etc. Potent
antioxidants are phenolic and flavonoids which are mostly found in nuts and are affective
against inflammation, oxidation and cancer. Moreover, sulfurous compounds are also present
in onion, fruits and some cherries and their cardio-protective action can be utilized (Kris-
Etherton et al., 2002).
In short, various bioactive compounds emerge to have favorable health effects. Much of the
systematic research requires to be performed before science-based dietary recommendations
to start. Regardless of this, there is an adequate evidence to have a practical perspective. So
various food commodities especially fenugreek has been studied using model feed trial.
2.3 Fenugreek: an introduction
Fenugreek is an annual leguminous herb, have common name as methi in Pakistan is
extensively cultivated in various regions of Asia, Middle East and European countries
including India, Bangladesh, Egypt, Turkey, Morocco, China, Argentina, France and Spain are
major fenugreek producing countries. Fenugreek is also useful leguminous crop for inclusion
into short-duration rotation, for livestock feed, for fixing nitrogen in soil and increasing its
fertility etc. (Amin et al., 2005; Thomas et al., 2011). Fenugreek possess strong spicy flavor &
also well-known for its appetizing appeal and being utilized for dietary preparations (Brar et
al., 2013). Most utilized parts of fenugreek are leaves and seeds i.e. particularly popular in
savory recipes, snacks and also have medicinal importance (Khosla et al., 1995).
Green fenugreek leaves (fresh or dried) are one of the earliest herb (Thomas et al., 2011), being
used as green leafy vegetable in the diets. Fresh leaves considered as good source of nutrients
and for better retention of these nutrients leaves should be stored in refrigerator or oven dried,
blanching time not more than five minutes and cooking should be carried out in pressure cooker
(Yadav et al., 2010). Fenugreek seeds are also useful and most important part of fenugreek
12
plant (Altuntaş et al., 2005). The ground powder of seeds is being used in different products
like vegetable dishes, pickles, spice powder and as condiments (Jani et al., 2009).
Knowing the chemical constituents of a plant is important in order to determine specific health
effects. During a study of observing different varieties of fenugreek genotypes, it was
discovered that it can vary in chemical constituents (fiber, saponins, amino acids, protein and
fatty acid contents), morphology, growth habit and seeds production ability (Acharya et al.,
2006). The valuable properties of fenugreek are credited to its ingredients diversity i.e. amino
acids, nitrogen compounds, steroids, polyphenolic substances and volatile constituents etc.
(Mehrafarin et al., 2010). The fresh leaves of fenugreek comprises 2.37% ash, 85.14%
moisture, 4.32% protein, 0.66% fat, 1.59% crude fiber, 91.05% carbohydrate and minerals
(mg/100g), 618.41 calcium, 111.13 Iron, 3.44 zinc and 1.77 manganese (Mahmoud et al.,
2012).
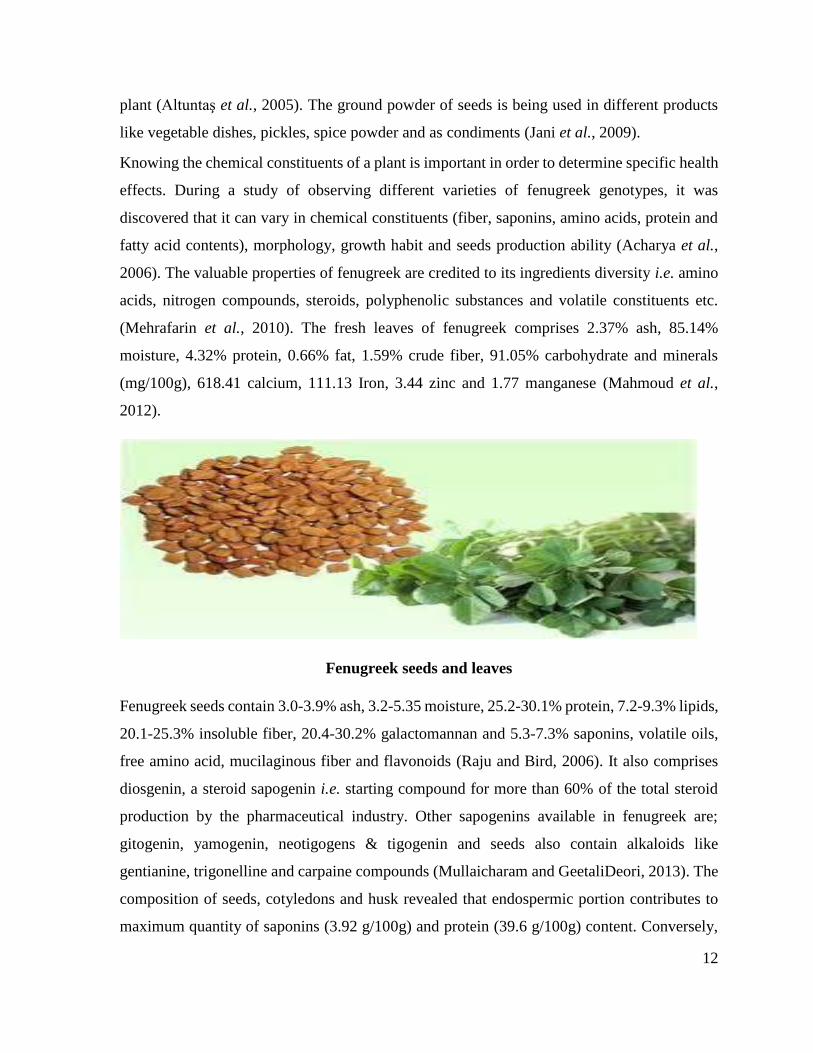
Fenugreek seeds and leaves
Fenugreek seeds contain 3.0-3.9% ash, 3.2-5.35 moisture, 25.2-30.1% protein, 7.2-9.3% lipids,
20.1-25.3% insoluble fiber, 20.4-30.2% galactomannan and 5.3-7.3% saponins, volatile oils,
free amino acid, mucilaginous fiber and flavonoids (Raju and Bird, 2006). It also comprises
diosgenin, a steroid sapogenin i.e. starting compound for more than 60% of the total steroid
production by the pharmaceutical industry. Other sapogenins available in fenugreek are;
gitogenin, yamogenin, neotigogens & tigogenin and seeds also contain alkaloids like
gentianine, trigonelline and carpaine compounds (Mullaicharam and GeetaliDeori, 2013). The
composition of seeds, cotyledons and husk revealed that endospermic portion contributes to
maximum quantity of saponins (3.92 g/100g) and protein (39.6 g/100g) content. Conversely,

13
husk had rich profile of polyphenols 103.8 mg GAE/g and total dietary fiber 77.4g/100g,
including insoluble fiber 31.87 g/100g and soluble dietary fiber 45.18 g/100g (Naidu et al.,
2011). The fatty acid profile of fenugreek seeds showed mainly linolenic, linoleic, palmitic
and oleic acids. It has 44.64% total carbohydrates with 14.90% of galactose and mannans
moieties that is a soluble fiber (Schryver, 2002).
2.4 Phytochemistry of fenugreek
Phytochemistry has been gaining importance from last few decades and herbal products are
becoming important part of life. Plant based functional foods are gaining popularity across the
world due to an array of evidences for their safer therapeutic applications. The health claims
associated with the consumption of plants are due to their rich phytochemistry (Tapsell et al.,
2006). Phytochemicals like dietary fibers, antioxidant, Ω-3-fatty acids, vitamins, plant sterols
and flavonoids are helpful in maintaining the health of an individual thus reducing the risk of
various maladies (Ramaa et al., 2006).
Fenugreek; renowned from ancient times as folk medicine to manage various diseases and is
one of the oldest medicinal plant. In different parts of Asia, the young tender plants used as
"pot herbs" and dried seeds as spice & herbal medicine. In other parts of the world its leaves
are being used for their cooling properties and seeds for their tonic, carminative and
aphrodisiac effects as well as stimulating effect in digestive process. From the older times of
Greek and Latin history, it is consider as effective against diabetes and hypercholesterolemia.
It also reported as curative agent against ulcer, possess anti-bacterial, anti-fertility, anti-
helminthic and anti-nociceptive effects due to presence of saponin and galactomannan
(Chauhan et al., 2011). Different types of phenolic compounds present in fenugreek seeds that
leads to its beneficial health effects (Rayyan et al., 2010). Phytochemical analysis of fenugreek
seeds depicted that it contains different type of saponins, alkaloids, flavonoids and
carbohydrates (Chauhan et al., 2011), saponins found 4 to 8% and alkaloids 1% approximately
(Ambasta and Ramchandran, 1986).
The seeds to fenugreek separated into endosperm and husk by Naidu et al. (2011) who
determine their proximate composition and found protein content (43.8 g/100) & saponin
(4.63 g/100 g) in endosperm. Total polyphenolic contents found higher (103.8 mg/g GAE) in

14
husk with total dietary fiber (77.1 g/100 g), insoluble dietary fiber (31.9 g/100 g) and soluble
dietary fiber (45.2 g/100g), respectively. Three flavonoids (apigenin-7-O-rutinoside,
kaempferol 3-O-glycoside and naringenin) identified in fenugreek ethyl acetate extract by
using LC-MS/MS apparatus. The concentration of naringenin was found to be highest i.e. 7.23
mg/g of dry extract (Belguith-Hadriche et al., 2010). The study of neutraceutical properties of
trigonelline i.e. major alkaloid in fenugreek was carried out to evaluate its effect against
diseases like central nervous system and diabetes. Trigonelline has hypoglycemic,
hypolipidemic, neuroprotective, antimigraine, memory-improving, sedative, anti-tumor,
antibacterial and antiviral activities and it also has ability to reduce platelet aggregation and
diabetic auditory neuropathy. It play its role by affecting β-cell regeneration, insulin secretion,
altered the activities of glucose metabolism related enzymes, reactive oxygen species, axonal
extension, and neuron excitability (Zhou et al., 2012).
There are number of steroidal sapogenins available in fenugreek seeds with diosgenin found
in the oily embryo. In stem found alkaloids like trigocoumarin, trigonelline, trimethylcoumarin
and nicotinic acid. The leaves of fenugreek contain seven saponins, known as graecunins and
these compounds are glycosides of diosgenin. The seeds contain 0.1% to 0.9% diosgenin and
can be commercially extracted. It also contains saponin fenugrin B. and different coumarin
compounds as well as a number of alkaloids like gentianine, trigonelline and carpaine. Three
minor steroidal sapogenins present in seedsi.e. sarsapogenin, smilagenin & yuccagenin and on
compressing it also yield as much as 8% of a fixed, foul-smelling oil (Snehlata and Payal,
2012). Fenugreek oil has many beneficial roles and different genotypes of fenugreek that are
rich source of saponins and fixed oil are important for pharmaceutical industries. Arivalagan
et al. (2013) analyzed different genotypes of fenugreek for steroidal saponin and fixed oil
content. They found sponin and fixed oil content varied from 0.92 to 1.68g and 3.25 to 6.88g
with corresponding mean value of 1.34 g and 5.19 g/100 g, respectively. The steroidal saponin
and diosgenin can be useful therapeutics in nutrition world.
2.5 Fenugreek and flour rheological properties
Rheological instrumentation and evaluations have turned out to be indispensable means in
analytical laboratories for characterization of constituent materials and final products, to
monitor process conditions and predict product performance and consumer acceptance. The
15
division of science which is related to the pour and twist of substances is known as rheology.
Information about the rheological and mechanical characteristics of different food systems has
significance in the design of flow processes for the control of quality, in forecasting storage
stability and designing texture (Herh et al., 2000).
Rheological characterization of flour dough is compulsory for triumphant manufacture of
bakery items as it has influence on mechanical handling and quality characteristics of the
finished products (Amjid et al., 2013). The appropriateness of wheat flour for baking various
products as breads, cakes, biscuits and chapatties depends primarily on particular rheological
dough properties like water absorption, dough stability, strength, extensibility, elasticity etc.
Dough rheology characterization is an imperative factor in the assessment of bread wheat
quality that indicates dough handling properties and the tendency of the dough to contract
(Pedersen et al., 2004). Different methods including farinograph, amlyograph, mixograph and
extensograph are used for characterization of the rheological properties of flour.
The pragmatic rheological quantifications are recurrently performed using farinogarphic tools
(Razmi-Rad et al., 2007). The results obtained from the graph used as factors in preparation of
product to predict the amount of water to be added for the formulation of dough, to check the
influence of constituents on assimilation characters, to appraise flour mixing requirements and
to test out flour consistency (Meintjes, 2004). The mixograph provides an indication of the
mixing requirements of flour (Manu and Rao, 2008). Soft wheat flours are evaluated through
physical dough testing instruments on the grounds of supposition that the rheological
characteristics of soft wheat flour are contrary to firm wheat flours (Meintjes, 2004). The
mixographic results from experiment are convenient in finding out the gluten potency and
distinctiveness of flour for bead making therefore wheat breeders use results from mixograph
in order to evaluate early generation lines for gluten strength of dough (Pedersen et al., 2004).
Water absorption of flour determined by the mixograph frequently acts as bake amalgamation
in bread baking analysis. The technological experiments have demonstrated remarkable
changes in quality considerations such as the mixograph peak time and mixograph tolerance
index. The quality values of these two parameters ranged from awfully underprivileged to
superfluous strapping, for bread making, the loaf volume and the bread value point also
displayed an ample array of worth (Grausgruber et al., 2000).
16
The supplementation of different vegetables protein in wheat flour increased dough water
absorption due to high water absorbing capacity of these proteins and their ability to compete
with other constituents of dough for water absorption. According to different other researchers,
the high farinograph water absorption values is due to high water absorption capacity of protein
available in flour (El-Soukkary, 2001; Doxastakis et al., 2002). The amount of water addition
during bakery product development is very important for distribution materials in dough, their
hydration and development of gluten protein network (Amjid et al., 2013).
Replacement of whole wheat flour with dehydrated leaves (dill-DDL, fenugreek leaves DFL)
at 0, 5, 7.5 and 10% increased the water absorption (68.5 to 70.2%), dough development time
(3.5 to 5.9 min) and mixing tolerance index values (78 to 98 BU) (Sudha et al., 2013). When
increased the supplementation level of fenugreek in wheat flour, dough water absorption
increased from 65.10% (control) to 68.5% in the composite flour with 5% fenugreek powder.
When supplementation level increased to 10%, water absorption of dough decreased by
66.37% but remained higher than control and further decreased up to 61.2% when
supplementation level reached 20% (Hooda and Jood, 2003). Different levels of fenugreek
seeds flour increased most of the rheological properties. The water absorption observed 52%
in control that increased up to 62-70% when supplementation of fenugreek powder increased
in wheat flour (Sulieman et al., 2000). The rheological properties of supplemented flour with
different grain blends (chick pea, soya bean, barley and fenugreek seeds powder) was studied.
The increasing percentage of multigrain resulted in increased water absorption & decreased
dough stability, extensibility, extensograph resistance to extension, amylograph peak viscosity
and overall quality score of NIP from 38 to 53 for the maximum score of 60 (Indrani et al.,
2011).
2.6 Perspectives of product development
The emergence of new value added foods with the addition of various functional ingredients
are gaining popularity nowadays due to increasing consumer awareness about healthy diets.
As a result competition among such food producers increasing day by day to develop new
products that can meet consumer demand (Annunziata and Vecchio, 2013). Nowadays,
supplemented flours are being prepared by blending root, tuber and legume flours with cereals
at a predetermined ratio. These are then used to prepare various food products, including

17
fermented flat breads, biscuits, and tortillas. An important motivation for the production of
supplemented based foods is to improve nutritional quality. Cereal legume composite foods
serve as a good example of this. Legumes are protein rich relative to cereals and are also
generally better sources of required amino acids, particularly lysine. In comparison, cereals,
although lysine-deficient, are relatively better sources of sulfur-containing amino acids such
as methionine. The benefit of producing cereal legume composite foods may be considered as
twofold: (1) There is an overall increase in the protein content of the composite food compared
to when only the cereal forms the base, and (2) legumes contributed lysine and methionine by
cereals result in balanced amino acids. The combination of flours affects nutritional quality as
well as functional, sensory, and phytochemical characteristics of the final products. Various
factors play a role, including preprocessing steps followed in the preparation of the flours, the
ratio of cereal to legume flours used, as well as the procedures used during the preparation of
the end product. In this part of study discusses the potential effects of compositing flours and
subsequent baking on quality parameters such as nutritional, phytochemicals and sensory
properties.
Fenugreek is known since older times, having nourishing value and being used in different
food products throughout the world (Meghwal and Goswami, 2012). Armenians use the
fenugreek seeds with garlic paste and chili pepper in a spice called chemen, Yemenite Jews
use them in a seasoning called zhug, and in the United States, seeds are used in bean soups,
chutneys, spice blends, icing and meat seasoning (Uhl, 2000). In Greece, the seeds are boiled
and eaten with honey, and in Africa they are soaked and used as legume. The dry seeds are
also roasted and used as a coffee substitute (Pruthi, 2001). It also used as seasoning in foods
and the vegetative parts are used as a green leafy vegetable (Youssef et al., 2009). Nowadays,
it has been extensively used in the food industry because of its high protein content, dietary
fiber stabilizing and emulsifying properties (Meghwal and Goswami, 2012). Enclosure of
soaked, germinated and raw flour of fenugreek in wheat flour amplified the amount of protein
(10.46, 10.37 and 10.09%), lysine (2.16, 2.21 and 2.26 g/100 g protein), total calcium (58.2,
56.1, 57.8 mg/100 g), total Fe (7.40, 7.26 and 7.36 mg/100 g) and dietary fiber (12.68, 11.28
and 10.22%) with 10% substitution (Ibrahium and Hegazy, 2009). The addition of fenugreek
powder in wheat flour improved protein (16.30%) and fat (2.9%) content of blended flours but
18
decreased gluten content. The overall acceptability scores of biscuits, bread, macroni and
noodles were found acceptable by addition of powder upto 10, 15, and 20% levels in wheat
flour (Hooda and Jood, 2003).
In this context flour added with 8-10% dietary fiber from fenugreek has been utilized in baked
products such as pizza, biscuits, muffins, bread and cakes (Roberts, 2011). It has appreciable
amount of protein, fiber, fat & minerals and highly nutritional biscuits can be made by its
supplementation in wheat flour (Hussein et al., 2011). The incorporation of fenugreek powder
in wheat flour increased the protein, lysine, dietary fiber, total calcium and total iron content.
The biscuits prepared from this flour with acceptable sensory attributes with shelf life upto one
month in polypropylene bags (Hooda and Jood, 2005).
The parathas prepared with optimum levels of leaves, i.e. either 25% of normal dill/fenugreek
leaves or 7.5% of dehydrated dill/fenugreek leaves were evaluated for proximate composition
compounds. The ash content of parathas incorporated with either of the leaves was higher than
the control paratha. The increase in ash content of parathas mainly due to high mineral content
found in fenugreek leaves powder (Sudha et al., 2013). The incorporation of fenugreek powder
in wheat flour increased the water absorption of wheat flour without effecting the loaf volume
up to the 3% level of substitution, and gave a satisfactory loaf volume up to the 7.5% level.
Bread prepared with addition of fenugreek powder contained more protein, dietary fiber and
lysine than the control. Bread containing up to 3% fenugreek was considered as good as the
control in terms of acceptability and inclusion of fenugreek flour up to 7.5% gave a product of
acceptable quality as judged by sensory evaluation studies (Chauhan and Sharma, 2000).
The blending of fenugreek powder in wheat flour from 5 to 20% level increased protein, fat,
lysine, fiber and minerals content of bread. The bread prepared with 15% supplementation
exhibited acceptable baking and sensory attributes with protein (13.06%), dietary fiber
(14.73%), total lysine (2.89 g/100g protein) and appreciably amount of mineral. The wheat
flour bread contained iron (7.78 mg/100g), calcium (58.70 mg/100g) and zinc (3.51 mg/100
g), while in supplemented bread mineral content found increased i.e. iron (7.97 mg/100g),
calcium (59.76 mg/100g) and Zinc (3.84 gm/100g). However, at this incorporation level
observed acceptable loaf volume with mean values 470.50 ml, loaf weight 153.75 g and other
sensory quality attributes like crumb color score 5.66, appearance 6.17, texture 6.25, flavor

19
5.60, taste 5.00 and overall acceptability 5.73 (Hooda and Jood, 2005). The replacement of
fenugreek gum with wheat flour @ 0, 5 and 10% (w/w) was carried out to measure the bread
production features of the flour. Bread comprising fenugreek gum @ 5 and 10% presented
texture (468 g) and volumes (905 cc) similar to control treatment of bread (Roberts et al.,
2012).
Appreciable variations in chemical components existed among the different fenugreek-wheat
supplemented flour samples when compared with wheat flour. The moisture, ash, protein and
crude fiber content increased in the supplemented flours compared to the control wheat flour.
The protein content increased from 15-30% and mean weight & volume of the bread also
increased with increased level of supplementation with fenugreek flour (Sulieman et al., 2000).
The bread formulations were prepared with fenugreek-wheat blended flour to record their
nutritional, consumer acceptability and blood glucose lowering property. The bread containing
fenugreek had higher protein (21.57%) & fat content (2.02%) and there was no momentous
difference for color, texture, firmness and flavor between control and supplemented bread
(Losso et al., 2009).
2.7 Fenugreek and antioxidant potential
Antioxidants has play important role in body such as protective role against free radicals that
naturally produced or associated with diseased like diabetes mellitus, acute respiratory distress
syndrome, cardiovascular diseases, inflammatory diseases and cancer (Guerrero et al., 2007;
Toppo et al., 2009). Fruits and vegetables are rice source of various nutrients like dietary fiber
and natural product content such as phenolic compounds (antioxidant agent) that correlated
with their beneficial health effects (Al-Musayeib et al., 2011). Oxidative damage occurred in
body at cellular or subcellular level may be the major cause of various diseased like
carcinogenesis, coronary vascular disease, diabetes, inflammatory disease and aging. Reactive
oxygen species are very harmful to body cells at both membrane and genetic levels. These
increased lipid peroxidation in cellular membranes, generating lipid peroxides that cause
extensive damage to membranes and membrane mediated chromosomal damage. Fenugreek
has rich source of nutrients and it can reduce the increasing lipid peroxidation and alterations
in the content of circulating antioxidant molecules, such as β-carotene, glutathione and α-
tocopherol, in alloxan-diabetic rats (Ravikumar and Anuradha, 1999).
20
Fenugreek is categorized as high in phenolic content among vegetables group using ethanol as
solvent and observed very high antioxidant activity (Kaur and Kapoor, 2002). The total
polyphenol content of extracts obtained from extraction of dried fenugreek leaves with
methanol, ethanol, and isopropanol solvents was 48, 44, 28 mg/100 g Gallic acid equivalents,
respectively (Naidu et al., 2012). The total phenolic content of fenugreek observed in methanol
and ethanol extracts were reported as 575±0.002 and 685±0.002 (mg GAE/100g), respectively
(Bukhari et al., 2008). In an earlier study conducted by Naidu et al. (2011) who has observed
total phenolic content 85.8 mg/g in fenugreek seeds extract that could be responsible for its
antioxidant activity. Fenugreek extract had polyphenols (9.47±0.10 mg GAE/g dry seeds) that
plays a role as antioxidant principle. Caffeic acid (164.550 μg), gallic acid (170.335μg), ellagic
acid (184.879 μg) and quercetin (215.814 μg)/g on dry weight fenugreek seeds basis were
identified by HPLC analysis (Dua et al., 2013). The estimated phenolic content found 22±1.5
μg/mg GAE in extracted fenugreek sample (Kumar et al., 2013). Different fenugreek samples
were observed for total phenolic and found 139.2 mg GAE/100g followed by 130.0 mg
GAE/100g and 127.8 mg GAE/100g (Ali et al., 2015). The study conducted by Premanath et
al. (2011) observed 4.9 mg/g polyphenols in ethanol extract of fenugreek leaves powder. In
another research work mean phenolic content found to be 52.8 mg/g GAE in fenugreek leaves
supplemented chicken patties (Devatkal et al., 2012). The maximum content of 48 mg/g GA
equivalent of total phenolic in fenugreek leaves extract determined by Naidu et al. (2011) and
also reported that antioxidant activity is may be related with polyphenolic content present in
fenugreek.
Different flavonoids like tricin, vitexin, quercetin, naringenin and tricin-7-O-b-
Dglucopyranoside identified in fenugreek (Shang et al., 1998). The ethanol extract of
fenugreek leaves powder found flavonoids 0.47 mg/g reported by Premanath et al. (2011).
Significant antioxidant activity was observed in fenugreek seeds extract due to presence of
different flavonoids (Dixit et al., 2005). Methanol, ethanol, hexane, ethyl acetate and acetone
were used for extraction and observed flavonoid content in the range of 607±3.6, 653±4.3,
208±4.2, 251±3.3 and 416±2.7 QE µg/g of fenugreek (Bukhari et al., 2008). Flavonoid content
observed in fenugreek by Kumar et al. (2013) who found total flavonoids 16.6±1.2 (μg
QE/mg). Ishtiaque et al. (2013) observed flavonoid content 5.80 mg QE/g in fenugreek seeds
and supplementation in wheat flour resulted in increased flavonoid content. The study of

21
antioxidant properties of fenugreek seeds exhibited that significant antioxidant activity in seeds
may be due to presence of polyphenols and flavonoids (Dixit et al., 2005).
The extracts of fenugreek leaves exhibited antioxidant activity in DPPH assay ranged from 41
to 47%. Extracts from dried fenugreek leaves depicted free radical scavenging activity ranging
from 18 to 56% and the activity increased with increasing concentration of various solvents
used, methanol extract of fenugreek leaves exhibited 42% activity followed by ethanol and
isopropanol extracts. Further, extract of fenugreek leaves obtained with aqueous methanol,
exhibited higher free radical scavenging activity (56%). So antioxidant activities of the extract
mainly dependent on the composition of phenolic compounds available in fenugreek leaves
(Naidu et al., 2012).
The determination of fenugreek seedsantioxidant activity was carried out to estimate its ability
to scavenge DPPH and observed result i.e.89.91 ±3.09 (% inhibition per DPPH) (Belguith-
Hadriche et al., 2010). Hydro-alcoholic extract of fenugreek seeds were subjected for in vitro
antioxidant activity by different methods viz, 1-diphenylpicryl-hydrazyl radical (DPPH),
hydroxyl, and ABTS radical cation assay. The extract exhibited potent DPPH and ABTS
radical scavenging activity with IC50 values of 350μg/ml, and 962.5μg/ml, respectively. The
seeds of fenugreek showed significant total antioxidant capacity with IC50 value of 192 μg/ml
and hydroxyl radical with IC50 value of 587.5μg/ml, respectively. Based on the results it can
be concluded that hydro-alcoholic extract of fenugreek may have potential antioxidant effects
against several oxidants (Priya et al., 2011). The study carried out by Saeed et al. (2013) who
observed Kasuri fenugreek (methanol + water extract) have DPPH radical scavenging activity
(19.01%), followed by Kasuri fenugreek water extract (16.49%). The DPPH radical
scavenging activity Lahori fenugreek methanol + water extract and water extract were 18.36
and 14.59%, respectively at same concentration i.e. 1 mg/ml. The determination of DPPH
assay of fenugreek leaves and seeds depicted that free radical scavenging activity of seeds was
better than that of leaves as seen by a lower E.C.50 value obtained for seeds as compared to a
higher E.C.50 value for the leaves. However, the seeds were found to have a better antioxidant
potential than the leaves in vivo (Jha and Srivastava, 2012).
The antioxidant activity of fenugreek leaves and seeds may be due to presence of β-carotene.
In a study, antioxidant activity of fenugreek different fractions were measured by bleaching of
22
β-carotene. Different fenugreek fractions like fenugreek husk, endosperm and seeds extracts
exhibited 73%, 6% and 22% activity when compared with the corresponding values of 95%
for BHA (Naidu et al., 2011). The ethanol extract of fenugreek inhibited β‐carotene oxidation
suggesting that the antioxidant activity could be related to the high levels of phenolic
compounds. The antioxidant activity of 70% ethanol extract of fenugreek by β‐carotene
bleaching method was carried out. Fenugreek extract was employed in the range of 25-400
mg/mL and by adding more quantity of the extract, absorbance was decreased and the reason
behind was inhibition of bleaching of the color β‐carotene. The extract depicted inhibition at
concentration of 0.202 mg/mL (Subhashini et al., 2011).
Higher content of β‐carotene (22.5mg/100g) observed in low humidity air dried fenugreek
leaves compared to radiofrequency dryer dried sample (6.2 mg/100g; 76.2 mg/100g) and hot
air dried fenugreek leaves (6.0 mg/100g; 148.1 mg/100g) (Naidu et al., 2012). The
supplementation of fenugreek seeds in the diet of rats prevented enzymatic leakage, alter lipid
peroxidation and enhanced antioxidant potential (Thirunavukkarasu et al., 2003). So both
fenugreek leaves and seeds can be a good source of bioactive compounds like the addition of
fenugreek leaves powder in rats diet @ of 1g/kg of body weight decreased lipid peroxidation
and improved significant system (Annida and Prince, 2004). No bioactive components were
detected in paratha prepared with wheat flour. However, β-carotene content found slightly
higher when 25% of normal fenugreek leaves were incorporated in wheat flour (Sudha et al.,
2013).
A study was carried out by Khole et al. (2014) to separate and characterize bioactive molecules
from germinated fenugreek seeds. Ethyl acetate, water and n-butanol were used for extraction
purpose and the results for FRAP assay were obtained as 1.27±0.02, 131.027±11.05 and
0.14±0.007 (mM AEAC), respectively. In a meta-analysis, fenugreek seeds were evaluated for
FRAP assay. For this purpose, fenugreek seeds powder extracted systematically, at ambient
temperature selecting solvents of varying polarity such as methanol, dichloromethane, hexane
and water. The results of the study gave a range for various solvents in the range of
0.135±0.055 to 77.352±0.627 TE mg/g (Kenny et al., 2013).

23
2.8 Fenugreek and Hyperglycemia
Despite the heterogeneity, hyperglycemia is the most common metabolic disorder in diabetic
patients (Steppan et al., 2001). At the molecular level, loss of pancreatic β-cells plays
significant role in the development of insulin deficiency and progression of diabetes mellitus
(Lapshina et al., 2006; Lee et al., 2004). Drug therapies often lose their effectiveness and
consensus is being sought to explore the new natural compounds for the treatment of diabetes
and its complications (Wolff, 1993; Lapshina et al., 2006). Diet diversification is important in
the module of diet-based therapies and slight modification in the daily diet possibly prevents
the onset of diabetes mellitus (Butt et al., 2007). For this purpose, in different parts of the world
utilization of different natural compounds is gaining wide popularity. These natural
compounds act as micronutrients and in the existing era, extensive research work has being
carried out to explicate their therapeutic mechanisms (van Dam et al., 2002; Hu et al., 2007;
Steyn et al., 2008).
The use of natural products for treatment of various diseases has been proved since thousands
year back and these are playing primary role in health care of poor and developing countries
of the world (King et al., 1998). Fenugreek is being commonly used in India and other parts
of the world as a condiment, rich source of dietary fiber that can play important role against
diabetes. The seeds contain 44.4% dietary fiber (13.3% soluble and 32% insoluble), with gum
composed of mannose and galactose that are related to reduce cholesterolemia and glycaemia.
Its hypoglycemic result has been particularly accepted in animals and humans (Roberts, 2011).
The earlier research work of Xue et al.(2007) and Mowl et al.(2009) proved that there was
decrease in glucose level when diet supplemented with fenugreek leaves. The anti-diabetic also
proved in rats when group of animals provided with fenugreek seeds rich diet (Annida and
Prince, 2004). The enrichment of diet with fenugreek seeds fraction to diabetic and non-
diabetic rats decrease the glucose level. The decreased absorption of glucose, intestinal
disaccharidase activity and increased gastrointestinal motility observed with the addition of
seeds fraction. The antidiabetic action of fenugreek is facilitated by slowing down digestion &
absorption of carbohydrate and improvement of peripheral insulin action (Hannan et al., 2007).
The findings of Madar and Shomer (1990) & Sauvaire et al. (1998) exhibited that anti-
hyperglycemic effects of fenugreek are attributed, at least partly, by reducing intestinal glucose

24
absorption. The findings also indicated that the seeds fraction increased sucrose content of the
stomach in non-diabetic and type 2 diabetic rats at 30-60 min supports the thought that
fenugreek also reduces gastric emptying (Nahar et al., 2000).
Literature suggested that the application of fenugreek can control blood sugar level in both
type 1 and type 2 diabetics. It possess free amino acid, 4-hydroxyisoleucine occurred only in
fenugreek, which acquire hypoglycemic properties through increased secretion of insulin
under diabetic situations and enhanced sensitivity to insulin (Haeri et al., 2012). Through in
vitro experiment it was found that the amino acid 4-hydroxyisoleucine available in fenugreek
seeds increased glucose-induced insulin release in experimental rats and human pancreatic islet
cells, it was experienced that 4-hydroxyisoleucine extracted from fenugreek seeds has insulin
tropic activity (Yadav et al., 2010; Akbari et al., 2012).
The amino acid was found to attack pancreatic beta cells while the levels of glucagon and
somatostatin were not affected. In human experimentation, through fenugreek addition, there
was reduction in the area under the plasma glucose curve and increment in the number of
insulin receptors (Smith, 2003). In a study it was concluded that inclusion of fenugreek powder
in diet showed reduction in sugar level in urine and blood with associated betterment in glucose
tolerance and diabetic complications in type II diabetic patients (Mitra and Bhattacharya,
2006). In Pakistan a study has been conducted to evaluate hypoglycemic activity of fenugreek
and concluded that it’s hypoglycemic activity by retarding glucose uptake and increasing its
usage (Zia et al., 2001).
The mean fasting blood glucose in diabetic untreated rats group (control positive) after
induction of 21 days of diabetes was 280±8.33 mg/dl while in the normal healthy group the
value was 76±2.59 mg/dl. When comparison of values between positive control group and the
group which was treated with fenugreek extract was carried out, it was observed that treated
group exhibited lower mean fasting blood glucose i.e. 141.83±9.04 mg/dl. In similar way mean
values of serum insulin observed in control positive group was 4.17±0.17 μU/ml and in normal
healthy group it was 10.53±0.66 μU/ml. The comparison of positive control group and
fenugreek extract treated group illustrated significantly higher mean serum insulin 7.27±0.6
μU/ml in treated group (El-Soud et al., 2007).

25
The addition of fenugreek @ 5% in diet of experimental diabetic rats significantly reduced
fasting blood glucose by 33% (360 to 244.0 mg/dl) as compared to diabetic control exhibiting
its hypoglycemic influence during diabetes (Shetty and Salimath, 2009). A bread incorporating
fenugreek was tested for its consumer taste acceptability and effect on blood glucose level. The
trial was carried out on eight diet controlled diabetic patients that were served two slices (56
g) added with 5% fenugreek. The bread supplemented with fenugreek was indistinguishable
from the whole wheat bread and its maintained fenugreek’s functional property of reducing
insulin resistance (Losso et al., 2009). Previously, Shakib and Gabrial (2010) evaluated
postprandial blood glucose level in healthy subjects and determine their glycemic index values
after feeding with bread supplemented with barely, fenugreek or ginger. The all supplemented
bread reduced postprandial blood glucose responses than did the control (wheat flour bread),
suggesting that soluble dietary fiber available in these supplemented products had an impact
on glucose tolerance with glycemic indices ranging from 38 (fenugreek) to 52 (Barley wheat
bread). Fenugreek supplemented bread having crude fiber 6.25 g/100g so it can be replaced
with white wheat flour bread since it provides easily digestible and healthy carbohydrate based
diet that can help to maintain postprandial blood glucose level within normal range.
According to another research it was found that fenugreek antidiabetic effect is due to presence
of high percentage of soluble fiber, galactomannan, which acts to decline the gastric emptying
time and in this way cause delay in the glucose absorption from the small intestine (Akbari et
al., 2012). As suggested through animal trails that fenugreek is effective against diabetes by
aiding insulin secretion, because typically these patients are unable to produce insulin or less
than normal required. Through several animal experiments, the mechanism was deduced and
it showed that galactomannan gum blocks the intestinal absorption of glucose. Water soluble
fibers enhance the viscosity of food inside the intestine and inhibit glucose absorption (Smith,
2003).
The scientific study of Khalil(2004) was focused on clarifying the role of fenugreek seeds
aqueous extract in its therapeutic dose on beta cells number, blood glucose and plasma insulin
levels in diabetic rats. For this purpose rats were divided into groups, control, diabetic and
diabetic rats fed with fenugreek seeds aqueous extract (0.1 mg/kg body weight). During
induction of diabetes, insulin level was reduced (12.5±0.5 to 7.5±0.8 μU/dL). By feeding
26
fenugreek extract based diet, inslin level was elevated to higher value in diabetic group (10±1
μU/dL). Another study was conducted to evaluate the comparative effect of various fenugreek
extracts and antidiabetic drug. The findings of the study suggested that fenugreek extract
produce compatible hypoglycemic activity to the antidiabetic drug. Oral administration of
fenugreek extract at various dose level (0.1, 0.25, 0.5 g/kg body weight) for 14 days notably
reduced serum glucose, triglyceride, total cholesterol, AST, uric acid, creatinine and ALT
levels, whereas it enhanced serum insulin in diabetic rats (Eidi et al., 2007).
A study was carried out by Gad et al.(2006) who assessed the effect of administration of
fenugreek extracts for 21 days on the blood glucose and serum insulin of diabetic rats. During
period of diabetic induction, serum insulin level was reduced from 1.106±0.269 to 0.216±0.005
μg/L. when fenugreek based diet was fed to the diabetic models, serum insulin level rose to
0.326±0.077 μg/L. In similar way Rajarajeswari et al. (2012) investigated the antidiabetic
activity of fenugreek in alloxan induced diabetic rats. The effect observed was compared with
a known antidiabetic agent glibenclamide. In active pancreatic damage induced by alloxan
(i.p.75mg/kg b.w.), fenugreek seeds aqueous extract (1300 mg/kg b.w.) and ethanol extract
(1g/kg b.w) administration significantly reduced the elevated blood glucose and increased
serum insulin level.
The treatment of normal and alloxan-diabetic rabbits for one month was carried out with
isolated trigonelline from fenugreek, standard trigonelline, and ethanol fenugreek extract that
considerably lower blood glucose. At the end of experiment blood glucose was reduced
27.05%, 27.53% & 32.61% and isolated trigonelline depicted a momentous hypoglycemic
effect in normal and diabetic animals but more effective in diabetic group. It reduces 22.34%
blood glucose in non-diabetic and 27.53% in the diabetic animals (Al-Khateeb et al., 2012).
When supplementation of experimental rats was carried out with fenugreek leaves powder in
streptozotocin (STZ) induced diabetic rats with moderate hyperglycemia that resulted in
decreased blood glucose and increased plasma insulin level. One of the mechanistic approach
is that STZ incompletely destructs pancreatic β-cells even though the rats became permanently
diabetic. The β–cells of islets of Langerhans get stimulated and glucose level increased when
experimental rat’s diet supplemented with fenugreek leaves powder that increased plasma
insulin level. The process of glycolysis increased and gluconeogenesis decreased leads to
27
control glucose level when supplementation of leaves increased in the diet. This is possible as
it controls the activities of the key enzymes of glycolysis (Devi et al., 2012). The increase in
insulin level resulted in glucose decreased that exhibited reverse correlation. Blood glucose
level significantly increased and decrease in insulin level observed in positive control group
when compared to the rest groups. The addition of fenugreek extract in rats diet depicted
significant effect against blood glucose and insulin level. The level of glucose decreased from
258.41mg/dl (positive control) to 167.57 mg/dl and insulin level improved 5.81 IU/ml to 7.89
IU/ml (El-Dakak et al., 2013).
2.9 Fenugreek and hypercholesterolemia
Hypercholesterolemia is very serious medical and social problem, greatly correlated with
cardiovascular diseases, hence leading to higher mortality rate (Moosa et al., 2006). Through
various research works it has suggested that cholesterol reducing effect of fenugreek correlated
to the presence of flavonoids like naringenin. The addition of germinated fenugreek seeds
powder was carried out in diet resulted in reduction of LDL and total cholesterol level of
hypercholesterolemic adults. The hypocholesterolemic effect of fenugreek occurred through
various mechanisms like increased in excretion of fecal bile acids and neutral sterols with
reduction in level of cholesterol stores in liver. Its addition in diet stimulates the production of
bile in liver and the process of cholesterol conversion into bile salts or high fiber available
potentially reduces absorptive mucosal surface glucose diffusion rate, cholesterol and drug
absorption. The soluble fiber also increases the viscosity of the digest & unstirred layer
thickness in small intestine or inhibit the uptake of cholesterol and bile acids. For fermentation
in large bowel by microorganisms, soluble fiber is consider as an excellent source. The
resultant product of fermentation are volatile fatty acids that enter into the blood stream and
appear to decrease the synthesis of hepatic cholesterol. The seeds of the fenugreek contains
trigonelline and diosgenin in the form glycosides that can combine with cholesterol to make
complexes in the intestine and reduced its absorption. Another reason for reducing glucose
effect could be based on amino acid pattern present in fenugreek proteins (Sowmya and
Rajyalakshmi, 1999).
A study was carried out by Al‐Habori and Raman (1998) reported that the crude saponins
extract was the most effective in reducing hypercholesterolemia. The lipid profile is extracted

28
in bile and then reabsorbed from the intestine. Therefore, it can be suggested that saponins may
bind bile salts which are necessary for absorption of these substances or bind directly in the
intestine and prevent reabsorption (Madar and Shomer, 1990). This may be due to the fact that
saponins form insoluble complex with lipid profile (Rao and Gurfinkel, 2000). Saponins and
crude fiber extracted from fenugreek seeds significantly resulted in reduction of cholesterol
and triglyceride (El-Hussary, 1993). In a study of Narender et al. (2006)who reported that
amino acid, 4-hydroxy isoleucine isolated from fenugreek seeds significantly decreased total
cholesterol (22%), plasma triglyceride (33%) and free fatty acids (14%), accompanied by an
increase in High Density Lipoprotein (HDL) by 39% in the dyslipidemic hamster model. There
was a significant decreased in total lipid, triglyceride and LDL concentration on long term
application of fenugreek seeds in all the supplemented groups. However, long term
administration of fenugreek seeds resulted with significant increase on HDL. Low density
lipoprotein and high density lipoprotein worked as antagonist, decreased in LDL and increased
HDL which represents protection against atherosclerosis and coronary heart disease (Oraby et
al., 2008).
Hypocholestrolemic potential of fenugreek is thought to be attributed due to certain steroidal
saponins such as, diosgenin, tigogenin, yamogenin and neotigogenin etc. These
phytochemicals perform their action by inhibition of cholesterol synthesis and absorption.
Clinical studies on hypocholetrolemic potential of fenugreek revealed a statistically
remarkable reduction in human serum total cholesterol, triglycerides and LDL cholesterol
(Smith, 2003). Another hypothesis attributed the hypocholesterolemic potential of fenugreek
to the fiber-rich gum portion of the seeds. Gum slow down the rate of hepatic synthesis of
cholesterol and also influences intestine walls to secrete various enzymes and hormones which
ultimately affect the biosynthesis of cholesterol in liver (Yadav et al., 2010).
The higher content of high density lipoproteins (HDL) are very important in body due to
relation with reduced risk of heart diseases (Young et al., 2004). The high level of HDL
expedites cholesterol transport from serum to liver, where it catabolized and finally excreted
from the body. The ratio of LDL and HDL is consider as important risk factor of atherosclerosis
and this ratio can be decreased with supplementation of fenugreek seeds powder and ethyl
acetate extract in diet. The low level of serum HDL and high level of LDL are correlated with

29
increased atherosclerosis risk (Korhonen et al., 1996). The increasing level of HDL and
decreasing LDL level in experimental rats depicted the antiatherogenic property of the ethyl
acetate extract of fenugreek. The possible mechanism of hypocholesterolemic property may
be due to dietary cholesterol absorption inhibition in intestine or its production by the liver
(Bursill and Roach, 2006) or stimulation of the biliary secretion of cholesterol and excretion
through feces (Krzeminski et al., 2003).
The supplementation of ethanolic extract of fenugreek seeds was carried out with two separate
doses @ 30 or 50g in diets of hypercholesterolemic rats. The seeds contains saponins have
hypocholesterolemic property that interact with bile salts in the digestive tract (Stark and
Madar, 1993). The addition of fenugreek extract in diet of diabetic rats lowered significantly
serum triglycerides and cholesterol level. The findings also supported by the research work of
other scientist who have reported that fenugreek added diet feeding to diabetic rats resulted in
reducing total cholesterol (Khosla et al., 1995). A study was carried out with healthy
individuals fed with 2.5g fenugreek twice in day for three months resulted in no change in
blood lipids and blood sugar level (fasting and postprandial). However, when same dose was
given to coronary artery disease patients and non-insulin dependent patients for same period,
it significantly reduced blood lipid (total cholesterol and triglycerides) without affecting the
HDL-cholesterol (Bordia et al., 1997).
Similarly, Prasanna (2000) proved hypolipidemic role of fenugreek by given it dose of 25 and
50g twice in a day before meal to hypercholesterolemic patients. The hypolipidemic role of
fenugreek soluble dietary fiber fraction could be the result of retardation of carbohydrate and
fat absorption due to the presence of bioactive fiber in the agent (Hannan et al., 2003). The
study of Pipelzadeh et al. (2003) confirmed that serum total cholesterol decreased by feeding
rats with fenugreek diets. Treatment with 100 mg/kg fenugreek seeds powder reduced total
cholesterol 162.9 to 120 mg/dl while dose of 500 mg/kg also significantly reduced the total
cholesterol level and other serum lipids. The results concerned LDL-cholesterol and
triglycerides decreased by feeding rats with fenugreek diets and increased the serum HDL
cholesterol as compared with non-treated control group. In another study found
supplementation of fenugreek leaves in diet decreased triglycerides in diabetic rats (Annida
and Prince, 2004).

30
The fenugreek dose of 25g orally two times in a day for period of three and six weeks to
hypercholesterolemic individuals produces significant reduction of serum total cholesterol
(Moosa et al., 2006). In an experiment mean serum total cholesterol values in normal healthy
group was found 98.5±2.1 mg/dl that observed significantly increased in positive control group
(140.33±3.2 mg/dl). When fenugreek extract was added in diet, it significantly reduced the
serum total cholesterol to 107.83±2.2 mg/dl (El-Soud et al., 2007). Fenugreek extract was
added in diet of rats and observed lower blood glucose, glycated haemoglobin, total
cholesterol, triglycerides and higher HDL compared with diabetic rats (Xue et al., 2007).
The results of Elmnan et al.(2012) showed that fenugreek seeds had a significant decrease on
plasma total, triglyceride and LDL. However, a numerical increase was observed in HDL
(35.17 to 36.56) with increasing levels of fenugreek seeds. Long term administration fenugreek
seeds had a significant decrease on plasma total lipid (377.46 to 313.44), triglyceride (118.34
to 76.72), LDL (82.33 to 62.33) and a significant increase was obtained on HDL in the last
week. Studies have reported that diabetic state of an individual resulted by reduced insulin
secretion that could be responsible for serum high triglycerides level, as the insulin stimulated
the synthesis of adipose tissue by agency of lipoprotein lipase. The quantity and quality of
protein in the diets also have a direct influence on the levels of cholesterol like plant protein
found to decrease cholesterol level. The fenugreek is rich source of plant protein (26%), so
hypocholesterolemic potential can also be attributed to this component. Another
phytochemical, diosgenin decreased the elevated level of cholesterol, LDL and increased HDL
of serum in cholesterol fed rats. Diosgenin also inhibited cholesterol absorption and suppressed
its uptake in serum and liver as well as its accumulation in the liver (Akbari et al., 2012).
Ethyl acetate extract of fenugreek seeds was investigated by Belguith-Hadriche et al. (2013)
who observed reduced level of total cholesterol, low density lipoprotein (LDL), triglycerides
and increased level of high density lipoprotein (HDL) when compared with those rats that have
cholesterol-rich diet. In similar study El-Dakak et al. (2013) observed decreased serum
glucose, total cholesterol, triacylglycerol, urea, uric acid, creatinine, AST, ALT and ALP
levels, whereas increased serum insulin level with administration of aqueous extract of
Lepidium sativum L., lupin and fenugreek or their mixture in streptozotocin-induced diabetic
rats. Serum total cholesterol level increased in STZ-diabetic rats and daily administration of

31
fenugreek for 30 days succeeded to reduce cholesterol 48.22% when compared with diabetic
control rats (Marzouk et al., 2013).
2.10 Potential health risk
Food safety is an important issue and is crucial nowadays because people are very much
conscious for their health. Therefore, one should be aware of the fact that how much, in what
way, at what time, and in which condition, fenugreek should be used. Although fenugreek has
traditionally been considered safe and well tolerated, some side effects have been associated
with its use. Caution in using fenugreek is warranted in patients known to be allergic to it
because of possible cross reactivity (Patil et al., 1997). Fenugreek possesses estrogen content
that could stimulate the uterus hence avoided during pregnancy. Fenugreek is an insulin
substitute but it may interfere with insulin therapy taken by diabetics. Furthermore, there are
some chances that high mucilage presence in fenugreek could coat the stomach and reduce the
absorption of set medications thereby fenugreek consumption need to reduce in some cases
(Mullaicharam and GeetaliDeori, 2013).
Further studies are still required to explicit bystander effects of fenugreek on the overall health
of humans. However, based on the available data, it appears that fenugreek has wide variety of
health-promoting activities. It is important to increase awareness of the public, researchers,
doctors and nutritionists as to the unique properties of this vegetable that are most beneficial
for maintaining good health and preventing disease.

32
Chapter 3
MATERIAL AND METHODS
3.1 Procurement of raw material
The present research work was carried out at National Institute of Food Science and
Technology (NIFSAT), University of Agriculture, Faisalabad, Pakistan. For the purpose,
wheat variety Lasani 2011 and fenugreek (Qasoori methi) fresh leaves and seeds were procured
from Ayub Agricultural Research Institute (AARI), Faisalabad.
3.2 Preparation of raw material
The wheat was cleaned by sieving followed by tempering. Afterwards, milling was carried out
by using Quadrumate Senior mill to obtain straight grade flour. Likewise, fenugreek leaves
and seeds were cleaned by screening and washing, followed by drying and grinding separately
to get fine powder. The resultant powder were stored in air tight containers prior to analysis
(Kadam et al., 2012).
3.3 Analysis of raw material
3.3.1. Proximate analysis
Proximate composition of wheat flour, fenugreek leaves and seeds powder was estimated by
determining moisture, ash, crude protein, crude fat, crude fiber and nitrogen free extract (NFE)
according to the prescribed methods given in AACC (2000).
3.3.1.1 Moisture Content
Moisture content of wheat flour, fenugreek leaves and seeds were determined by drying the
samples in Air Forced Draft Oven (Memmert Germany) at 105±5oC till constant weight by
following the procedure described in AACC (2000) Method No. 14-15A.
3.3.1.2 Ash Content
The ash content was estimated by using Muffle Furnace (MF-1/02, PCSIR, Pakistan). After
charring, incineration of the samples was carried out at 550oC till greyish white residues
(AACC, 2000; Method No. 08-01).

33
3.3.1.3 Crude protein
Crude protein content were determined using Kjeltech Apparatus (Model: D-40599, Behr
Labor Technik, Gmbh-Germany) following the procedure given in AACC (2000) Method No.
46-30.
3.3.1.4 Crude fat
Soxhlet system (Model: H-2 1045 Extraction Unit, Hoganas, Sweden) was used to estimate
the crude fat content in raw material using hexane as solvent by following the guidelines given
in AACC (2000) Method No. 30-25.
3.3.1.5 Crude fiber
The raw material were extracted for fat and hence the fat free samples were utilized for
determination of crude fiber. For the purpose, the samples were treated with 1.25% H2SO4 for
20 minutes followed by washing and digestion with 1.25% NaOH solution using Fiber tech
apparatus (Labconco Cooperation, Kansas, USA) as per directions illustrated in Method 32-10
(AACC, 2000).
3.3.1.6 Nitrogen free extract (NFE)
NFE was calculated following the expression described below:
NFE (%) = 100 – (moisture + ash + crude protein + crude fat + crude fiber)
3.3.2 Mineral profile
Mineral like Na and K of wheat, fenugreek leaves and seeds powders were determined by using
Flame Photometer (Sherwood Scientific Ltd., Cambridge, Model 410) whilst Fe, Ca, Cu, Zn
and Mn were analyzed using Atomic Absorption Spectrophotometer (Varian AA240,
Australia) following the procedures described in AACC (2000).
3.4 Rheological properties
The rheological properties of wheat flour including water absorption, dough development
time, dough stability, mixing tolerance & softening of dough were explored using Farinograph-

34
E (Brabender D-4100; Germany) while mixing properties of dough like mixing time and peak
height percentage were assessed using Mixograph (National NSI-33R) following the methods
(54-21 & 22-10) described in AACC (2000).
3.5 Development of composite flour
Composite flours containing various levels of wheat flour, fenugreek leaves and seeds powder
were developed as per treatment plan illustrated in Table 3.1.
Table 3.1 Treatments used in the study plan
Treatment
Composite flour
Wheat (%) Fenugreek leaves
powder (%)
Fenugreek seeds
powder (%)
T0 100 - -
T1 95 5 -
T2 90 10 -
T3 85 15 -
T4 95 - 5
T5 90 - 10
T6 85 - 15
3.6 Analyses of composite flour
3.6.1. Proximate Analysis
The proximate composition (moisture, ash, crude protein, crude fat, crude fiber and nitrogen
free extract) of composite flour was ascertained according to the prescribed methods of AACC
(2000).
3.6.2 Mineral profile
Amongst the minerals in composite flour, Na and K contents were determined using Flame
Photometer whilst Fe, Ca, Cu, Zn and Mn were analyzed using Atomic Absorption
Spectrophotometer (Varian AA240, Australia) as per guidelines described by AAAC (2000).
35
3.7 Rheological properties
The prepared composite flours were subjected to evaluation of rheological properties like water
absorption, dough development time, dough stability, mixing tolerance index, softening of
dough and mixing properties of composite flours following the respective procedures detailed
in AACC (2000).
3.8. Polyphenols extraction
The polyphenols from fenugreek leaves &seeds and composite flour were extracted by
following the protocol of Rusak et al.(2008), using ethanol at constant temperature of 60°C for
48 hours. Resultant extracts were filtered using vacuum filtration assembly and solvents
were recovered by Rotary Evaporator (EYELA, N-N series, Japan) at a temperature of
40°C. The yield of respective sample was calculated and resultant extracts were stored at
4°C until used, afterwards the extracts were subjected to different assays as described below;
3.9 Antioxidant assay
3.9.1 Total phenolic content
Total phenolics of resultant extracts were estimated spectrophotometricaly by following Folin-
Ciocalteau method (Singleton et al., 1999). The extract (I mL) was mixed with 0.5 mL of Folin-
Ciocalteau reagent along with 7.5 mL of distilled water and allowed to stand for 20 min.
Following resting period, 1.5 mL of sodium bicarbonate solution (7%) was added to the
mixture. Then stay for 20 min by placing sample tubes in water bath (40oC), take 0.5 ml from
this solution and add 2 mL of distilled water. After that absorbance was measured at 755 nm
using a UV/vis Spectrophotometer (CECIL, CE7200) against control. Total polyphenols were
calculated and expressed as Gallic acid equivalent (mg Gallic acid/100 g).
3.9.2 Total flavonoids
Total flavonoids were determined by following the procedure of Zhishen et al.(1999). Take
two mL of aqueous extract in a 10 mL volumetric flask, then add 5 mL of distilled water
followed by 0.3 mL of 5% NaNO2 and after 5 min 0.6 mL of 10% AlCl3 was added. After
another 5 min stay 2 mL of 1 M NaOH was added and volume was made upto 10ml with
distilled water. Take one ml from this solution after mixing this solution, add 9 ml distilled

36
water and measured absorbance by using spectrophotometer at 510 nm. Total flavonoids were
expressed as Catechin equivalents per dry matter.
3.10 Antioxidant activity
3.10.1 Free radical scavenging activity (DPPH assay)
The DPPH radical scavenging activity of all extracts was measured according to the procedure
described by Oktay et al.(2003). Purposely, 1 mL of DPPH was added to each extract (4 mL)
and incubated at room temperature for 30 min. The absorbance was noted at 520 nm using
Spectrophotometer. Percent inhibition was calculated using the following formula;
Reduction of absorbance =AB − AA
AB× 100
AB = absorbance of blank sample (t = 0 min)
AA = absorbance of tested extract solution (t = 30 min)
3.10.2 ß-carotene and linoleic acid assay
Total antioxidant activity of the extracts was monitored by using assay based on coupled
oxidation of β-carotene and linoleic acid (Adegoke et al., 1998). Briefly, 2 mg of -carotene
was dissolved in 20 mL chloroform along with 40 mg linoleic acid and 400 mg Tween 20.
After removing chloroform, 3 mL of the prepared emulsion was added in 0.10 mL sample
and placed in a water bath for 120 min. Oxidation of ß-carotene was determined
spectrophotometricaly at 470 nm.
3.10.3 Ferric reducing antioxidant power (FRAP assay)
The ferric reducing ability of all the extracts was measured according to the procedures of
Benzie and Strain(1996). Purposely, extract (0.5 mL) was mixed with phosphate buffer (1.25
mL, 0.2 M, pH 6.6) and potassium ferricyanide (1.25 mL, 1 %). After incubation, 10 % TCA
(1.25 mL) along with 0.1 % ferric chloride were added in the mixture and then left at room
temperature for 10 min. Sample absorbance was measured with spectrophotometer at 700 nm.
3.11 Preparation of bread
For the purpose, respective flour, sugar, oil, yeast and water were used to make the bread
(AACC, 2000; Method No. 10-09). After preparation, the bread were cooled and packed in air
tight polythene packages before further analyses.

37
3.12 Physicochemical characterization of bread
Proximate composition (moisture, ash, crude fat, crude fiber, crude protein and nitrogen free
extract) of bread were determined (AACC, 2000). Color and texture of the product were
ascertained by using colorimeter and texture analyzer, respectively, adopting the procedures
described by Amir et al.(2013). The product color, L* (lightness), a* (–a greenness; +a
redness), and b* (–b blueness; +b yellowness) were measured using CIE-Lab Color Meter
(CIELAB Color Tech-PCM, USA). The data thus obtained was used to calculate Chroma (C*)
and hue angle according to method illustrated by Rodriguez-Garcia et al. (2012).
For texture analysis, the triple beam snap (three-point break) technique of Texture Analyzer
(TA-HDi, Stable Microsystems, UK) was used for measuring the texture of prepared bread. A
crosshead speed of 10 mm/min with a load cell of 50 kg was used. The force required to break
individual product was noted and average value was calculated according to protocol described
by Lara et al. (2011) and Rodriguez‐García et al.(2012).
3.13 Antioxidant assay of bread
Antioxidant assays like total phenolic content & flavonoids were performed for the developed
product by using procedures described by Singleton et al. (1999)and Zhishen et al. (1999),
respectively.
3.14 Antioxidant activity of bread
Free radical scavenging ability (Oktay et al., 2003), ß-carotene and linoleic acid assay
(Adegoke et al., 1998) and FRAP assay (Benzie and Strain, 1996) were also determined for
prepared bread.
3.15 Sensory evaluation of bread
The assessment of bread was carried out for sensory characteristics i.e. volume, color of crust,
symmetry of form, evenness of bake, character of crust and internal characteristics like grain,
color of crumb, aroma, taste and texture by panel of six judges (Lawless and Heymann, 1999).
The bread was examined for sensory evaluation using nine point hedonic scale system ranged
Chroma (C*) = [a*2 + b*2]1/2
Hue angle (h) = tan-1 (b*/a*)

38
from extremely liking to disliking (9 = like extremely; 1 = dislike extremely) following the
guidelines of Meilgaard et al. (2007). The detail is given in Appendix-I. Panelists were
provided separate booths equipped with white fluorescent light. To remove any biased from
the experiment, samples were presented them randomly and requested to assign scores for
selected characteristics.
3.16 Selection of best treatments
On the basis of antioxidant assay, rheological characteristics and overall acceptability of
prepared bread, two best treatments one each from leaves and seeds powder were selected for
efficacy study.
3.17 Efficacy trial
The selected best treatments were subjected to in vivo trials using rodent experimental model.
For the purpose, Sprague Dawley rats procured from National Institute of Health (NIH)
Islamabad were housed in the Animal Room of National Institute of Food Science and
Technology, University of Agriculture, Faisalabad. The rats were acclimatized by feeding on
basal diet for a period of one week. The environmental conditions were maintained throughout
the trial like temperature (23±2ºC) and relative humidity (55±5%) along with 12 hour light-
dark period. For efficacy trials, the study was carried out in three categories involving normal,
hyperglycemic and hypercholesterolemic. At the start of the study, some randomly selected
rats from each group were sacrificed to get baseline values. In each study, three groups were
formed having five rats in each group. During eight week trial, control and selected composite
flour diets (Appendix II) were given to all three groups to evaluate their restorative potential.
Feed & water intakes as well as body weight were measured throughout the experimental
period. At the end of the study, the overnight fasted rats were sacrificed & blood and sera were
collected to trail selected parameters including serum lipid profile, glucose and insulin levels.
For serum collection, blood samples were subjected to centrifugation using centrifuge machine
@ 4000 rpm for 6 min. The respective sera samples were examined for various biochemical
assays by using Microlab 300, Merck, Germany.
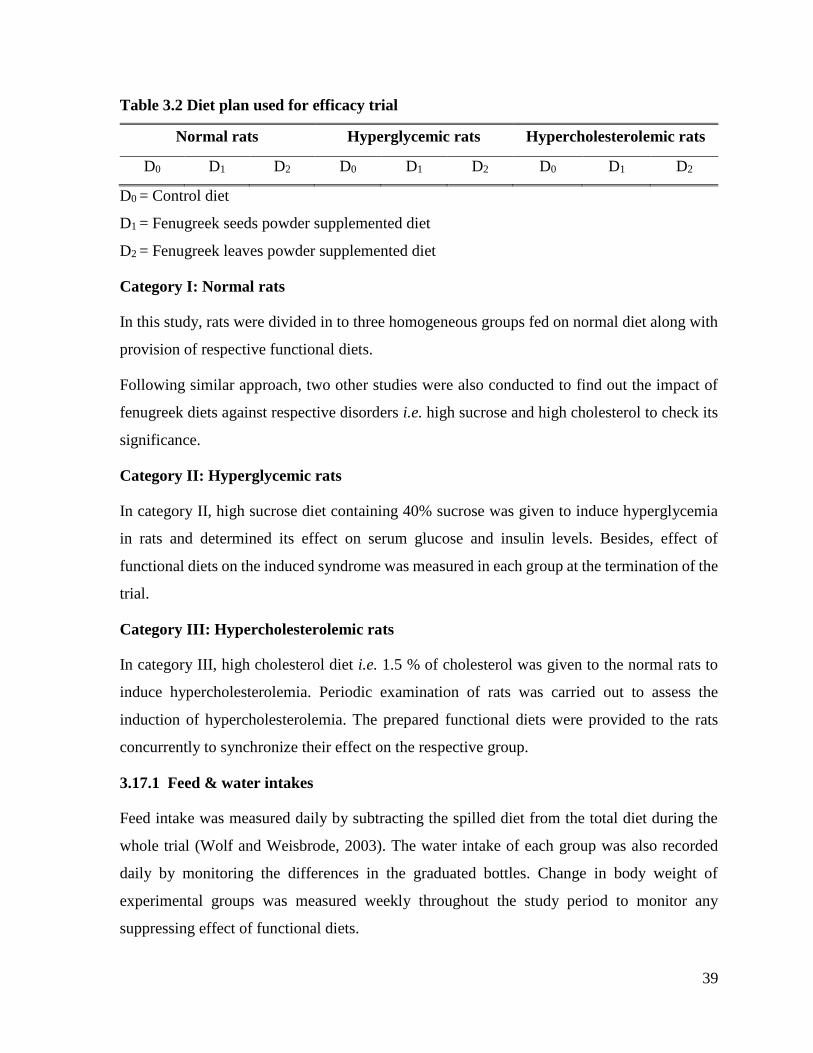
39
Table 3.2 Diet plan used for efficacy trial
Normal rats Hyperglycemic rats Hypercholesterolemic rats
D0 D1 D2 D0 D1 D2 D0 D1 D2
D0 = Control diet
D1 = Fenugreek seeds powder supplemented diet
D2 = Fenugreek leaves powder supplemented diet
Category I: Normal rats
In this study, rats were divided in to three homogeneous groups fed on normal diet along with
provision of respective functional diets.
Following similar approach, two other studies were also conducted to find out the impact of
fenugreek diets against respective disorders i.e. high sucrose and high cholesterol to check its
significance.
Category II: Hyperglycemic rats
In category II, high sucrose diet containing 40% sucrose was given to induce hyperglycemia
in rats and determined its effect on serum glucose and insulin levels. Besides, effect of
functional diets on the induced syndrome was measured in each group at the termination of the
trial.
Category III: Hypercholesterolemic rats
In category III, high cholesterol diet i.e. 1.5 % of cholesterol was given to the normal rats to
induce hypercholesterolemia. Periodic examination of rats was carried out to assess the
induction of hypercholesterolemia. The prepared functional diets were provided to the rats
concurrently to synchronize their effect on the respective group.
3.17.1 Feed & water intakes
Feed intake was measured daily by subtracting the spilled diet from the total diet during the
whole trial (Wolf and Weisbrode, 2003). The water intake of each group was also recorded
daily by monitoring the differences in the graduated bottles. Change in body weight of
experimental groups was measured weekly throughout the study period to monitor any
suppressing effect of functional diets.
40
3.17.2 Serum lipid profile analysis
Serum lipid profile of rats including cholesterol, high density lipoproteins (HDL), low density
lipoproteins (LDL) and triglycerides were determined. Serum cholesterol level was measured
by using CHOD-PAP method following the protocol of Rifai et al. (1999). High density
lipoprotein (HDL) was assessed by HDL Cholesterol Precipitant method (Alshatwi et al.,
2010). Whilst, triglycerides in sera samples were measured by liquid triglycerides (GPO-PAP)
method as outlined by Allain et al. (1974).
3.17.3 Serum glucose and insulin levels
From each study, collected sera were evaluated for glucose concentration by GOD-PAP
method as described by Ribes et al. (1986), whereas insulin level was assessed by following
the method of Temple et al.(1992).
3.17.4 Liver function tests
Liver function tests including aspartate aminotransferase (AST), alanine aminotransferase
(ALT) and alkaline phosphatase (ALP) were assessed. Levels of AST and ALT were measured
by the dinitrophenylhydrazene (DNPH) method using Sigma Kits 59-50 and 58-50,
respectively and ALP by Alkaline Phosphates–DGKC method (Basuny et al., 2009).
3.17.5 Renal function tests
The serum samples were also analyzed for urea by GLDH-method and creatinine by Jaffe-
method using commercial kits (Jacobs et al., 1996; Thomas et al., 1998) to assess the renal
functionality of different groups.
3.17.6 Hematological analysis
Red blood cell (RBC) and white blood cell (WBC) indices and Platelets count were assessed
by following the respective methods described by Fischbach (1996).
3.18 Statistical analysis
The collected data from the current study was subjected to statistical analysis by applying
completely randomized design (CRD) using Cohort version 6.1 (Costat-2003) according to
guidelines of Steel et al. (1997).

41
Chapter 4
RESULTS AND DISCUSSION
The prime objective of this study was to investigate and endorse the nutritional as well as
nutraceutical profile of fenugreek leaves & seeds powder by making wheat-fenugreek
supplemented flours; afterwards evaluated their suitability for production of bread. The
nutraceutical potential was examined against hyperglycemia and hypercholesterolemia as it
was hypothesized that these are effective against such disorders. Accordingly, fenugreek leaves
and seeds powder were tested in experimental modeling rats and applying statistical design.
After conducting comprehensive analytical experiments, the results of this detailed study were
segregated in three main sections to allow systematic representation of data, namely;
nutritional profile, antioxidant properties & product development and efficacy studies.
4.1. Proximate analysis of raw material
Proximate composition is a key factor for assessing the quality of raw material. Wheat flour
was evaluated for proximate composition by analyzing various parameters; including
13.5±0.25, 0.41±0.06, 10.5±0.13, 1.13±0.04 and 0.31±0.04% of moisture, ash, crude protein,
crude fat, crude fiber, respectively, while nitrogen free extract (NFE) was found to be
74.15±2.42%. Fenugreek leaves powder (dry weight basis) was subjected to different quality
assessment and revealed moisture, ash, crude protein, crude fat, crude fiber and NFE as
9.38±0.47, 6.37±0.32, 4.30±0.22, 0.88±0.07, 1.98±0.10 and 77.09±3.85%, respectively.
Proximate composition of the fenugreek seeds has been illustrated as moisture (10.65±0.53%),
ash (4.14±0.21%), crude protein (22.86±1.14%), crude fat (6.98±0.35%), crude fiber
(7.90±0.43%) and NFE (47.47±2.37%) (Table 4.1).
Findings of present research regarding proximate analysis are in harmony with the results of
studies conducted earlier, however some variations observed in the present study may due to
environmental factors like growing conditions, soil and genetic makeup. Khan et al. (2009)
used different spring wheat varieties grown in Pakistan for proximate analysis and found
12.92±0.22 to 13.42±0.88% moisture, 10.23±0.54 to 11.60±0.53% crude protein and ash
content 0.41±0.04 to 0.55±0.03%. Moisture content in different wheat varieties flour ranged
from 11.78 to 12.09%, crude protein 11.71 to 12.05%, crude fat 1.29 to 1.40%, crude fiber
42
0.41 to 0.44%, whereas ash content in the range of 0.48 to 0.57% (Mueen-ud-Din et al., 2009).
In an earlier study it was revealed that hard wheat flour depicted 10.84% protein, 1.68% fat,
0.5% fiber and 1.84% ash content whereas soft wheat flour had 9.61% protein, 1.15% fat, 0.4%
fiber and 1.06 % ash content (Kasaye and Jha, 2015).
The study of Mahmoud et al. (2012) narrated that fenugreek leaves contained (on dry weight
basis) 14.14% dry matter, 4.32% protein, 0.66% fat, 91.06% carbohydrate and 387.46 kcal/g
energy. The dehydrated fenugreek leaves had moisture content 9.38% i.e. evident since
dehydration removes all the moisture content present in samples (Sudha et al., 2013) and an
important contribution for the texture of the leaves is the moisture content (George, 2003). The
ash content of methi leaves and kasuri methi were found to be 13.36% and 9.84%, respectively,
and the respective moisture content were 6.07% and 5.22% which have an influence on the
shelf stability of the samples. Likewise, fat content were estimated to be 5.82% and 4.12% for
methi leaves and kasuri methi. Crude fiber was obtained in appreciable amounts in both
samples and the respective values were found to be 2.6% and 2.4%, respectively (Pasricha and
Gupta, 2014). The seeds of fenugreek have moisture content i.e. (8.30%), ash (2.92%), crude
protein (24.60%), crude fat (6.11%), crude fiber (7.72%) and nitrogen free extract (50.35%)
(Mahfouz et al., 2012). In another study moisture content were found to be 7.49% and other
components such as crude protein (25.40%), crude fat (7.90%), ash (3.38%) and crude fiber
(50.00%) were observed in fenugreek seeds whereas soluble and insoluble dietary fiber were
found to be 21.7 and 26.8%, respectively (Meghwal and Goswami, 2012). The proximate
analysis showed that fenugreek seeds contains 6.57% moisture, 4.03% total ash, 26.78%
proteins, 6.35% lipids, 6.75% crude fiber and 49.52% carbohydrates (Aljawofi, 2014).
Similarly, Saeed et al. (2013) determined the chemical analysis of fenugreek seeds and found
7.50 ± 0.7% moisture, 3.10 ± 0.3% ash, 6.47 ± 0.5% fat, 7.60± 0.7% fiber and 22.50 ± 1.5%
protein, while in another study by Rasool et al. (2013) who observed 12% moisture content,
26% protein, 8% crude fat and 3% ash content in fenugreek seeds. Findings of the present
study are also correlated with the research investigation of Kasaye and Jha (2015) who found
that fenugreek flour had crude protein (29.89%), crude fat (7.91%) crude fiber (11.34%),
carbohydrates (51.55%) and ash content (2.94%) on dry weight basis.

43
4.2 Mineral content of raw material
Mineral profile of current study has been depicted in Table 4.2. It was found that wheat flour
contains sodium, potassium, iron, calcium, copper, zinc and manganese as 3.12±0.15,
130.00±5.50, 3.50±0.12, 22.00±0.96, 0.13±0.02, 0.19±0.03 and 0.70±0.08 mg/100g,
respectively. The mineral composition of fenugreek leaves powder indicated 58.71±2.93
sodium, 481.91±24.09 potassium, 6.72±0.33 iron, 589.00±29.45 calcium, 0.15±0.02 copper,
0.90±0.09 zinc and 0.75±0.08 mg/100g manganese. The mineral profile of fenugreek seeds
powder illustrated that it contains potassium in the highest quantity of 296.41±14.82 mg/100g
followed by calcium (160.00±8.02 mg/100g), sodium (23.69±2.18 mg/100g), iron (19.60±1.98
mg/100g), zinc (2.10±0.19 mg/100g), manganese (1.20±0.06 mg/100g) and copper (0.75±0.08
mg/100g).
In the present research, mineral content remained in the ranges described in literature. Mineral
content of different cereal and legumes are influenced by genetic as well as non-genetic factors
like soil, climatic conditions and use of fertilizers etc. (Wiesler et al., 2003). The determination
of mineral content of different fenugreek genotypes grown in various locations was carried out
and observed variations among different varieties (Pathak and Agrawal, 2014). Different
Pakistani spring wheat varieties contain 2.23±0.06 to 2.90±0.13 iron, 22.94±0.61 to
26.15±1.71 calcium, 0.15±0.01 to 0.25±0.00 copper and zinc 0.90±0.06 to 2.10±0.10 mg/100g
(Khan et al., 2009). The fresh leaves of fenugreek comprise of 618.41 calcium, 111.13 iron,
3.44 zinc and 1.77 mg/100g manganese (Mahmoud et al., 2012). In another research potassium
was found in highest quantity of 517.23±13.01 followed by phosphorus 293.4±6.1, calcium
229.6±9.7, magnesium 157.01±5.26, sodium 73.5±1.2, iron 21.8±0.52, zinc 1.9±0.7,
manganese 1.3±0.2 and copper 0.8±0.1 mg/100g in fenugreek seeds (Tanveer, 2014).
Likewise, mineral profile of fenugreek seeds depicted that it contains K, Mg, Ca, Zn, Mn, Cu
and Fe in the range of 603.0±15.0, 42.0±5.0, 75.0±9.0, 2.4±0.2, 0.9±0.1, 0.9±0.1 and 25.8±1.2
mg/100g (Al-Jasass and Al-Jasser, 2012) i.e. in harmony with current study findings. In
another study fenugreek seeds has been observed as good source of mineral i.e. iron 11.51,
calcium 168.88, zinc 4.43 and magnesium 153.10 mg/100g (Kasaye and Jha, 2015).
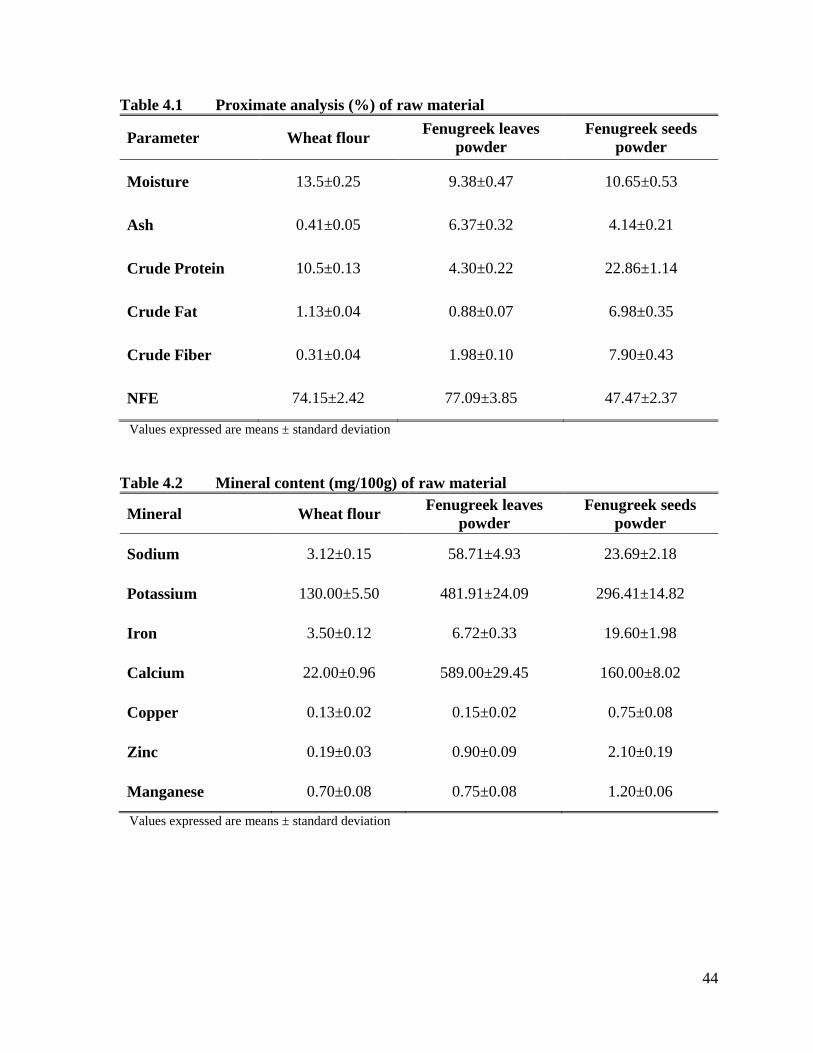
44
Table 4.1 Proximate analysis (%) of raw material
Parameter Wheat flour Fenugreek leaves
powder
Fenugreek seeds
powder
Moisture 13.5±0.25 9.38±0.47 10.65±0.53
Ash 0.41±0.05 6.37±0.32 4.14±0.21
Crude Protein 10.5±0.13 4.30±0.22 22.86±1.14
Crude Fat 1.13±0.04 0.88±0.07 6.98±0.35
Crude Fiber 0.31±0.04 1.98±0.10 7.90±0.43
NFE 74.15±2.42 77.09±3.85 47.47±2.37
Values expressed are means ± standard deviation
Table 4.2 Mineral content (mg/100g) of raw material
Mineral Wheat flour Fenugreek leaves
powder
Fenugreek seeds
powder
Sodium 3.12±0.15 58.71±4.93 23.69±2.18
Potassium 130.00±5.50 481.91±24.09 296.41±14.82
Iron 3.50±0.12 6.72±0.33 19.60±1.98
Calcium 22.00±0.96 589.00±29.45 160.00±8.02
Copper 0.13±0.02 0.15±0.02 0.75±0.08
Zinc 0.19±0.03 0.90±0.09 2.10±0.19
Manganese 0.70±0.08 0.75±0.08 1.20±0.06
Values expressed are means ± standard deviation
45
4.3 Proximate analysis of supplemented flour
The determination of food composition is a fundamental to theoretical and applied
investigations in food science, and is often the basis of establishing the nutritional value
and overall acceptance from consumer stand point. Different supplemented (treatments)
flour prepared by the addition of fenugreek leaves and seeds powder were analyzed for
different chemical characteristics and the results are described here-in-after.
4.3.1 Moisture content
Mean squares for moisture content showed that different treatments significantly affected with
the addition of fenugreek leaves powder (Table 4.3). The mean moisture content (Table 4.4)
in different treatments ranged from 12.88±0.20 to 13.51±0.17%. The highest value was
observed in T0 (13.51±0.17%) followed by T1 (13.29±0.15%), T2 (13.09±0.09%) and T3
(12.88±0.20%). The present outcome shows that the moisture content among different
treatments have declining trend with increasing the supplementation of fenugreek leaves
powder.
The statistical results regarding moisture content in different treatments (Table 4.5) exhibited
that it was significantly affected with supplementation of fenugreek seeds powder. Mean
values for moisture content has been given in Table 4.6. The maximum moisture content was
observed in T0 (13.51±0.17%) followed by T4 (13.33±0.06%), T5 (13.21±0.07%) and T6
(13.08±0.12%). The findings of current study revealed that the moisture content of wheat flour
decreased with the addition of fenugreek seeds powder.
Moisture content of the products play a significant role in storage stability and shelf life. At
low moisture content the quality of the baked products is less deteriorated due to low
respiration and microbial activities. For better keeping quality of flour, moisture content is key
factor like flour with high moisture content deteriorates rapidly as compared to flour obtained
from dry and sound grains (Pomeranz, 1988). The result of present study revealed that moisture
content decreased with increasing the supplementation level because drying process reduced
the moisture content of fenugreek leaves and seeds powder. Variation in the moisture content
also may be attributed due to differences in climatic conditions persisted during harvest and
storage (Randhawa et al., 2002). Findings of current study is comparable with findings of
Tharise et al. (2014) who found significant differences in the moisture content of different
46
composite flour and significantly lower when compared with control (wheat flour). The
moisture content of composite flour in current study varied from 12.88 to 13.51% compared
to reported values of 11 to 15% depending upon hygroscopic nature and storage conditions of
flour. The level of moisture content observed in composite flour was within the recommended
moisture levels of 14% for safe storage. To avoid chemical changes and microbial activities in
food products moisture content should be below 14% during storage (Shahzadi et al., 2005).
4.3.2 Ash content
Mean squares (Table 4.3) for ash content in different treatments indicated that ash content
varied significantly with supplementation of fenugreek leaves powder. Mean values (Table
4.4) for ash content in different treatments ranged from 0.41±0.05 to 1.30±0.15%. The values
of ash content in different treatments reported as T0; 0.41±0.05%, T1; 0.71±0.09%, T2;
1.01±0.12% and T3; 1.30±0.15%. Maximum ash content were found in T3 while minimum in
T0 that depicted ash content increased with increasing the supplementation of fenugreek leaves
powder.
Mean squares (Table 4.5) for ash content revealed highly significant difference among
treatments with supplementation of fenugreek seeds powder. Mean values of ash content falls
in the range of 0.41±0.03 to 0.97±0.10% (Table 4.6). The highest value for ash was exhibited
in T6 (0.97±0.10%) followed by T5 (0.78±0.06%), T4 (0.60±0.05%) and T0 (0.41±0.03%). The
findings of research work illustrated that the ash content in wheat flour tend to be increase with
increasing the supplementation level of fenugreek seeds powder.
The ash content of flour represents the inorganic residues left after the organic matter present
in flour brunt and it is an important parameter in the milling industry (Wei, 2002). The higher
ash content of different treatments reported in the current study attributed due to higher ash
content of fenugreek leaves and seeds powder as compared to wheat flour. The ash content
increased from 0.85 to 2.5% when wheat flour make composite with chickpea flour observed
by Hefnawy et al. (2012). Similar findings were observed by Tharise et al. (2014) who reported
ash content of composite flours ranged from 0.75 to 1.12% i.e. significantly higher than found
in wheat flour.

47
Table 4.3 Mean squares for proximate analysis of different treatments supplemented
with fenugreek leaves powder
SOV df Moisture Ash Crude
Protein
Crude
Fat
Crude
Fiber NFE
Treatment 3 0.21705** 0.44305** 0.48847** 0.00071NS 0.03450** 0.11561*
Error 8 0.00512 0.00077 0.00333 0.00048 0.00033 0.01848
Total 11
**= Highly significant
* = Significant
NS= Non Significant
Table 4.4 Proximate analysis (%) of different treatments supplemented with
fenugreek leaves powder
Trt. Moisture Ash Crude Protein Crude Fat Crude Fiber NFE
T0 13.51±0.17a 0.41±0.05d 10.50±0.06a 1.13±0.03a 0.31±0.02d 74.15±0.19d
T1 13.29±0.15ab 0.71±0.09c 10.18±0.05b 1.12±0.02ab 0.39±0.02c 74.31±0.10c
T2 13.09±0.09ab 1.01±0.12b 9.85±0.04c 1.11±0.07ab 0.48±0.01b 74.48±0.12b
T3 12.88±0.20b 1.30±0.15a 9.57±0.06d 1.09±0.08b 0.56±0.02a 74.60±0.14a
Values expressed are means ± standard deviation
T0 Wheat Flour (Control)
T1 5% fenugreek leaves powder supplemented wheat flour
T2 10% fenugreek leaves powder supplemented wheat flour
T3 15% fenugreek leaves powder supplemented wheat flour

48
Table 4.5 Mean squares for proximate analysis of different treatments supplemented
with fenugreek seeds powder
SOV df Moisture Ash Crude
Protein
Crude
Fat
Crude
Fiber NFE
Treatment 3 0.09611** 0.17558** 1.88099** 0.43514** 0.72207** 8.97403**
Error 8 0.00418 0.00046 0.00380 0.00045 0.00108 0.00787
Total 11
**= Highly significant
* = Significant
Table 4.6 Proximate analysis (%) of different treatments supplemented with
fenugreek seeds powder
Trt. Moisture Ash Crude
Protein Crude Fat Crude Fiber NFE
T0 13.51±0.10a 0.41±0.03c 10.50±0.16b 1.13±0.03b 0.31±0.02d 74.15±0.19a
T4 13.33±0.06a 0.60±0.05d 11.13±0.15ab 1.42±0.08ab 0.68±0.04c 72.82±0.09ab
T5 13.21±0.07b 0.78±0.06b 11.74±0.18ab 1.72±0.10ab 1.07±0.11b 71.48±0.10bc
T6 13.08±0.12b 0.97±0.10a 12.35±0.26a 2.01±0.15a 1.45±0.09a 70.15±0.10c
Values expressed are means ± standard deviation
T0 Wheat Flour (Control)
T4 5% fenugreek seeds powder supplemented wheat flour
T5 10% fenugreek seeds powder supplemented wheat flour
T6 15% fenugreek seeds powder supplemented wheat flour
49
4.3.3 Crude protein
The analysis of variance (Table 4.3) for crude protein with supplementation of fenugreek
leaves powder shows highly significant difference among treatments. Mean values for crude
protein content (Table 4.4) for different treatments are; T0 (10.50±0.06%), T1 (10.18±0.05%),
T2 (9.85±0.04%) and T3 (9.57±0.06), while maximum amount of crude protein observed in T0
(control). From the present results it is confirmed that crude protein content in wheat flour was
declined by increasing the level of fenugreek leaves powder.
Mean squares (Table 4.5) for crude protein content in different treatments depicted that protein
content significantly differ with supplementation of fenugreek seeds powder. Mean values
(Table 4.6) regarding protein content in different treatments varied from 10.50±0.16 to
12.35±0.26%. The highest protein content were observed in T6 (12.35±0.26%) followed by T5
(11.74±0.18%), T4 (11.13±0.15%) and T0 (10.50±0.16%). The results of present research
described that crude protein content in wheat flour has increasing trend with increasing the
supplementation level of fenugreek seeds powder.
Protein content of flour is an important quality parameter and quality of protein is
dependent on the genetic makeup of the crop that relates to dough strength, elasticity and
extensibility (Khan et al., 2009). Protein deficiency is a major health problem of developing
countries like Pakistan because the diet is based on mainly cereals. The supplementation of
other sources like protein rich vegetables in regular diet has being getting popular to combat
this deficiency problem. The supplementation of high protein source like fenugreek with wheat
flour increased protein quality by making balanced amino acid profile (Ibrahium and Hegazy,
2009). In current study protein content of treatments supplemented with fenugreek leaves
powder found decreasing trend with increasing the supplementation level. The reason of low
protein content of such treatments is due to low protein content in fenugreek leaves powder.
Similar findings of low protein (4.32%) was observed by Mahmoud et al. (2012) in fenugreek
leaves powder. On the other hand treatments supplemented with fenugreek seeds powder found
higher protein content with increasing supplementation level. The higher protein content
observed in treatments because of high protein content available in fenugreek seeds. Raju and
Bird (2006) also observed high protein content (25.2-30.1%) in fenugreek seeds powder. The
quality of proteins mainly genetically controlled but quantity varies with climatic condition

50
and soil during growing stages (Bushuk, 1997). Supplementation of wheat flour with fenugreek
seeds powder @ 5 to 20% levels showed high protein content in the range of 13.5-16.3% i.e.
due to high protein content of fenugreek seeds (Hooda and Jood, 2004). The results are also in
line with Hussein et al. (2011) who found fenugreek seeds powder as better protein source and
increasing trend found by its supplementation in corn flour.
4.3.4 Crude fat
Mean squares of crude fat content for different treatments indicated that the values has non-
significant change with supplementation of fenugreek leaves powder (Table 4.3). The mean
crude fat (Table 4.4) values ranged from 1.09±0.08 to 1.13±0.03% and in different treatments
found as T0 (1.13±0.03%), T1 (1.12±0.02%), T2 (1.11±0.07%) and T3 (1.09±0.08%). Maximum
level of crude fat content were present in T0 (control) and minimum level in T3 that indicated
a decreasing trend with the addition of fenugreek leaves powder for this trait.
The statistical analysis (Table 4.5) for crude fat in different treatments depicted that fat content
increased in different treatment with supplementation of fenugreek seeds powder. The mean
values (Table 4.6) ranged from 1.13±0.032 to 2.01±0.15% with maximum fat content observed
in T6 (2.01±0.15%) followed by T5 (1.72±0.10%), T4 (1.42±0.08%) while minimum in T0
(1.13±0.03%). The increasing trend was observed by increasing levels of fenugreek seeds
powder for this trait.
Fats are available in smaller quantity in cereals but have significant role in product quality and
texture due to their ability to make complex with proteins and starch (Sramkova et al., 2009).
The highest fat content (2.01%) were recorded for maximum fenugreek seeds powder level in
composite flour while lowest (1.09%) in treatment having highest (15%) of fenugreek leaves
powder. The initial fat content of the raw material effected the fat content of the respective
composite flour. The present findings of wheat-fenugreek seeds supplemented flour are in
harmony with results of Hooda and Jood (2004) who observed increased fat content of wheat
flour with supplementation of fenugreek. The increasing trend of fat content was also
experienced by Hussein et al. (2011) with increasing fenugreek supplementation in corn flour.

51
4.3.5 Crude fiber
Mean squares (Table 4.3) for crude fiber content of different treatments indicated that the
variation in the fiber content was highly significant with supplementation of fenugreek leaves
powder. Mean values regarding crude fiber content has been represented in Table 4.4 which
exhibited that results ranged from 0.31±0.02% to 0.56±0.02% for this trait. The findings of the
present study revealed that crude fiber content in wheat flour significantly increased with
incorporation of fenugreek leaves powder.
The analysis of variance (Table 4.5) for crude fiber content in different treatments revealed
that differences are significant with supplementation of fenugreek seeds powder. Mean values
of fiber content given in Table 4.6 ranged from 0.31±0.02 to 1.45±0.09%. The maximum crude
fiber content observed in T6 (1.45±0.09%) followed by T5 (1.07±0.11%), T4 (0.68±0.04%) and
T0 (0.31±0.02%), respectively. It is obvious from current study that there was increasing trend
of fiber in wheat flour with addition of fenugreek seeds powder.
Fenugreek leaves and seeds powder has high fiber content as compared to wheat flour that
resulted in higher fiber content in different supplemented treatments. Fenugreek leaves has
crude fiber content 1.59% (Mahmoud et al., 2012) and seeds flour 6.88-9.42% (Hooda and
Jood, 2004), that supported current study findings of increased fiber content in different
treatments supplemented with fenugreek powder at different percentages when compared with
control. Similar findings were observed by Okoye and Mazi (2011) & Pasha et al. (2013) who
observed higher crude fiber content in kidney bean and pumpkin composite flours as compared
to wheat flour.
4.3.6 Nitrogen free extract (NFE)
The present outcomes depicted that NFE in wheat flour was significantly increased with the
addition of fenugreek leaves powder. The mean squares (Table 4.3) for NFE in different
treatments supplemented with fenugreek leaves powder portrayed that the difference in NFE
was significant for this trait. Mean values for NFE have been unveiled in Table 4.4 indicated
that it ranged from 74.15±0.19 to 74.60±0.012%. The values of NFE in different treatments
were found to be T0; 74.15±0.19, T1; 74.31±0.10, T2; 74.48±0.12 and T3 74.60±0.14%.

52
Mean squares for NFE given in Table 4.5 portrayed that supplementation of fenugreek seeds
powder significantly effected different treatments. The mean values (Table 4.6) of NFE in
different treatments varied from 74.15±0.19 to 70.15±0.10% that shows a decreasing trend of
this trait with increasing supplementation level of fenugreek seeds powder. The highest value
was observed in T0 (74.15±0.19%) followed by T4 (72.82±0.09%), T5 (71.48±0.10%) and T6
(70.15±0.10%).
Appreciable variations in chemical components existed among different fenugreek-wheat
supplemented flour samples as compared to control (wheat flour). The moisture, crude protein
and fat observed with decreasing trend in fenugreek leaves supplemented flours while ash,
crude fiber and NFE found increased. The flour supplemented with fenugreek seeds powder
have more ash, protein, fat, fiber content while moisture and NFE with decreasing trend when
compared with control.
4.4 Mineral content of supplemented flour
Malnutrition of micronutrients now effected more than 40% population of world and rapidly
increasing in the developing countries like Pakistan. Now a days, deficiencies like iodine and
iron are the major concern to nutritionist and healthcare bodies with other mineral deficiencies,
including calcium, zinc, magnesium and selenium. The impact of malnutrition in these nations
is clearly visible in societal areas like rapidly increasing rate of morbidity and mortality,
reduces mental abilities and educational attainment of children, lower labor productivity,
deteriorates community development efforts and affect the quality of life. Keeping in view
current scenario of malnutrition, consumers are adopting behavior and preference of foods that
not only provide basic or traditional nutrients as well as compounds beneficial for health. So,
the current food systems of world should be designed and changed in such a ways that ensure
continuous and balanced nutrition supplies with affordability (Sramkova et al., 2009).
The current estimation of micronutrients illustrated variation among different treatments under
study. Momentous differences observed in sodium, potassium, iron, calcium and zinc whereas
copper and manganese content found non-momentous among different treatments
supplemented with fenugreek leaves powder. The results for fenugreek seeds powder
supplementation exhibited significant difference among treatments for under studied mineral.
Wheat flour contained calcium; 22.00±1.10 mg/100g, iron; 3.50±0.10 mg/100g, potassium;
53
130.00±6.50 mg/100g and zinc; 0.19±0.03 mg/100g (Table 4.2), i.e. comparatively less than
fenugreek leaves and seeds powders. Therefore, supplementation of wheat flour with
fenugreek powder has significant effect with respect to mineral content.
4.4.1 Sodium (Na)
The statistical results (Table 4.7) for sodium content depicted that different treatment differed
significantly among each other with supplementation of fenugreek leaves powder. Means for
sodium content ranged from 3.12±0.15 (T0) to 11.46±0.15 mg/100g (T3) as shown in Table
4.8. Momentous increase was observed in sodium content with increasing percentage of
fenugreek leaves powder in wheat flour.
Mean squares given in Table 4.9 indicated significant difference among treatments for sodium
content with the addition of fenugreek seeds powder. Means for different treatments (Table
4.10) exhibited that maximum sodium content were observed in T6 (11.98±0.59 mg/100g)
followed by T5 (9.03±0.45 mg/100g), T4 (6.07±0.29 mg/100g) whereas, control (T0) found
minimum value (3.12±0.15 mg/100g). The Na content revealed increasing trend by increasing
the fenugreek seeds powder in wheat flour.
Sodium is essential for normal tissue activity and major cation i.e. accounts for 90% of all
cations available in plasma. It has fundamental importance in maintaining the osmotic pressure
of intercellular fluid. The individual physiological properties of Na include its effect on the
swelling capacity of protein colloids, maintenance of the normal activity of the cardiac muscle,
participation in the processes of nerve excitation and transmission of the nerve impulse
(McDonald et al., 2002). In the present study we found increasing trend of sodium content
with increasing the supplementation of fenugreek leaves and seeds powder in wheat flour.
Fenugreek leaves and seeds has higher sodium content than wheat flour as observed by
Srinivasan (2006) i.e. 76mg/100g and 19mg/100g, respectively. Likewise, Tanveer (2014) &
Pasricha and Gupta (2014) also observed the higher sodium content of fenugreek than wheat
flour that are in agreement with our findings.
4.4.2 Potassium (K)
Mean squares (Table 4.7) for potassium content in different treatments revealed that the
potassium (K) content significantly differed with the addition of fenugreek leaves powder in

54
wheat flour. Mean values (Table 4.8) elaborated that K content ranged from 130.00±6.50 to
182.79±9.14 mg/100g. The maximum K content were observed in T3 (182.79±9.14 mg/100g)
followed by T2 (165.19±8.26 mg/100g), T1 (147.60±7.38 mg/100g) whilst the lowest value
was exhibited in T0 (130.00±6.50 mg/100g).
Statistical analysis depicted in Table 4.9 indicated that potassium content of different
treatments affected significantly with the addition of fenugreek seeds powder. Means for
potassium content (Table 4.10) showed the highest value (192.76±9.63 mg/100g) for T6 trailed
by T5 (171.84±8.59 mg/100g) and T4 (150.92±7.55 mg/100g). The minimum content were
observed in T0 (130.00±6.50 mg/100g) that revealed potassium content increased with
increasing the percentage of fenugreek seeds powder in wheat flour.
Potassium is located intra-cellular in body, participates in maintaining the acid base balance,
osmotic pressure and also in the metabolic processes taking place in the cells (McDonald et
al., 2002). Potassium ions, in conjunction with Na participate in producing the resting potential
and active potential in nerve and muscle formations. It is required in the reactions involving
phosphorylation of creatinine required for the proper activity of muscles (Murray et al., 2003).
Fenugreek is a rich source of potassium as reported earlier by Al-Jasass and Al-Jasser (2012)
& Tanveer (2014) who found supplementation with wheat flour increased the potassium
content of treatments as observed in the current study. In an earlier study conducted by Pasricha
and Gupta (2014) who also observed high potassium content of Kasuri methi (fenugreek) seeds
and leaves.
4.4.3 Iron (Fe)
It is obvious from the statistical analysis (Table 4.7) that treatments have non-significant
difference among each other for iron with the addition of fenugreek leaves powder. It was
observed that Fe content ranged from 3.50±0.10 to 3.98±0.14 mg/100g among different
treatments (Table 4.8). This parameter gradually increased but non-significant variation exist
with the addition of fenugreek leaves powder.
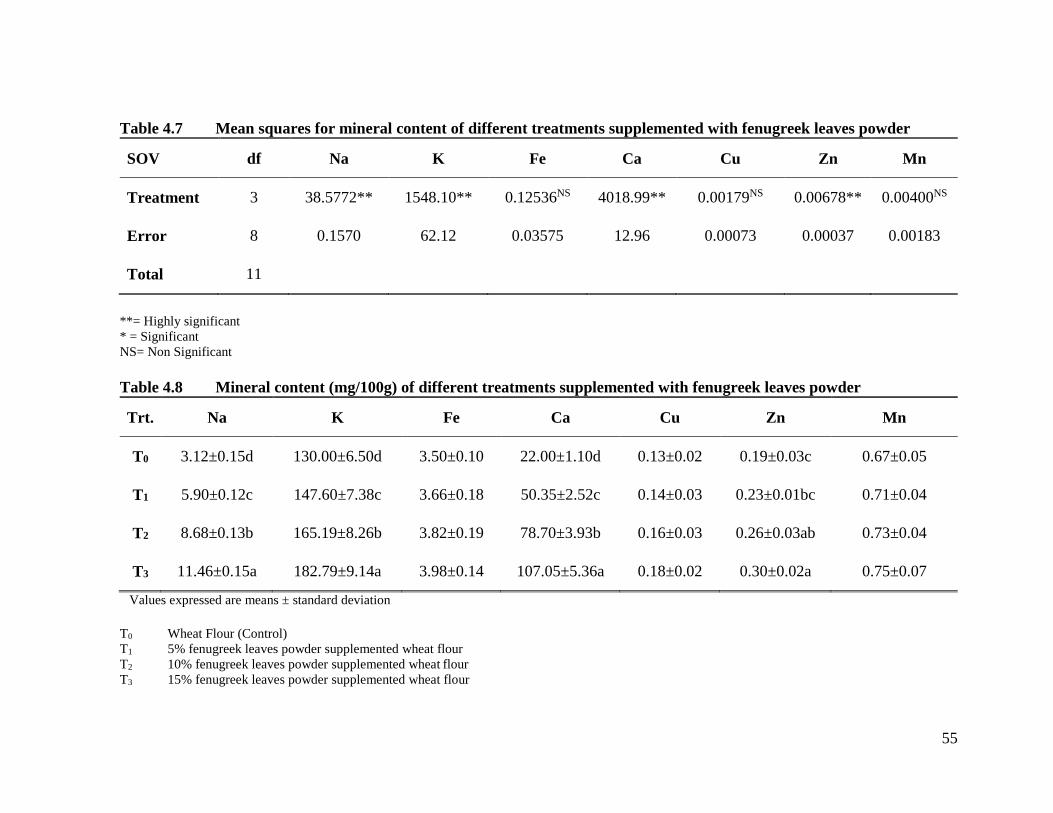
55
Table 4.7 Mean squares for mineral content of different treatments supplemented with fenugreek leaves powder
SOV df Na K Fe Ca Cu Zn Mn
Treatment 3 38.5772** 1548.10** 0.12536NS 4018.99** 0.00179NS 0.00678** 0.00400NS
Error 8 0.1570 62.12 0.03575 12.96 0.00073 0.00037 0.00183
Total 11
**= Highly significant
* = Significant
NS= Non Significant
Table 4.8 Mineral content (mg/100g) of different treatments supplemented with fenugreek leaves powder
Trt. Na K Fe Ca Cu Zn Mn
T0 3.12±0.15d 130.00±6.50d 3.50±0.10 22.00±1.10d 0.13±0.02 0.19±0.03c 0.67±0.05
T1 5.90±0.12c 147.60±7.38c 3.66±0.18 50.35±2.52c 0.14±0.03 0.23±0.01bc 0.71±0.04
T2 8.68±0.13b 165.19±8.26b 3.82±0.19 78.70±3.93b 0.16±0.03 0.26±0.03ab 0.73±0.04
T3 11.46±0.15a 182.79±9.14a 3.98±0.14 107.05±5.36a 0.18±0.02 0.30±0.02a 0.75±0.07
Values expressed are means ± standard deviation
T0 Wheat Flour (Control)
T1 5% fenugreek leaves powder supplemented wheat flour
T2 10% fenugreek leaves powder supplemented wheat flour
T3 15% fenugreek leaves powder supplemented wheat flour

56
Table 4.9 Mean squares for mineral content of different treatments supplemented with fenugreek seeds powder
SOV df Na K Fe Ca Cu Zn Mn
Treatment 3 43.6306** 2188.02** 3.22943** 238.142** 0.00523** 0.04807** 0.00703*
Error 8 0.1680 66.47 0.05825 2.765 0.00053 0.00091 0.00137
Total 11
**= Highly significant
* = Significant
Table 4.10 Mineral content (mg/100g) of different treatments supplemented with fenugreek seeds powder
Trt. Na K Fe Ca Cu Zn Mn
T0 3.12±0.15d 130.00±6.50c 3.50±0.17d 22.00±1.10d 0.13±0.02c 0.19±0.02c 0.67±0.08b
T4 6.07±0.29c 150.92±7.55bc 4.31±0.22c 28.90±1.44c 0.16±0.02bc 0.29±0.02b 0.73±0.02ab
T5 9.03±0.45b 171.84±8.59ab 5.11±0.26b 35.80±1.79b 0.19±0.03ab 0.38±0.04b 0.75±0.03ab
T6 11.98±0.59a 192.76±9.63a 5.92±0.29a 42.71±2.13a 0.22±0.05a 0.48±0.05a 0.78±0.06a
Values expressed are means ± standard deviation
T0 Wheat Flour (Control)
T4 5% fenugreek seeds powder supplemented wheat flour
T5 10% fenugreek seeds powder supplemented wheat flour
T6 15% fenugreek seeds powder supplemented wheat flour

57
Mean squares (Table 4.9) showed that iron content of different treatments significantly affected
with the addition of fenugreek seeds powder. Mean values (Table 4.10) showed that maximum
content 5.92±0.29 mg/100g was observed in T6 followed by 5.11±0.26 in T5, 4.31±0.22 in T4
and minimum 3.50±0.17 mg/100g in T0. Addition of fenugreek powder significantly increased
the iron content of different treatments.
Iron compounds are present in all cells of the body and fulfill oxidative functions and other
biochemical reactions. Although the major portion of total body Fe is in hemoglobin,
myoglobin and storage but a small portion is also found in a number of enzymes (Soetan et al.,
2010). The iron deficiency commonly prevailed in females and to combat this problem like
iron supplemented capsules are not much effective because of absorption factor. Fresh
fenugreek leaves are rich source of iron (111 mg/100) reported by Mahmoud et al. (2012) as
well as fenugreek seeds i.e. 25.8 mg/100g (Al-Jasass and Al-Jasser, 2012). Therefore,
fenugreek and its supplemented products can be substantial source for iron deficiency problem
due to its better bioavailability. Similarly, Hooda and Jood (2004) found higher iron content
(9.4 to 9.6 mg/100g) of wheat flour when supplemented with up to 20% fenugreek powder
which is in agreement with the results of the current study. The high iron content was also
observed in kasuri methi (fenugreek) seeds (0.318 mg/g) and methi leaves (0.293 mg/g) by
Pasricha and Gupta (2014).
4.4.4 Calcium (Ca)
The analysis of variance (Table 4.7) for Ca content in different treatments illustrated significant
difference with the addition of leaves powder in wheat flour. Mean values regarding Ca content
(Table 4.8) ranged from 22.00±1.10 to 107.05±5.36 mg/100g and the maximum value was
observed in T3 (107.05±5.36 mg/100g) followed by T2 (78.70±3.93 mg/100g), T1 (50.35±2.52
mg/100g) and T0 (22.00±1.10 mg/100g). The results exhibited that Ca content in different
treatments increased with increasing supplementation of fenugreek leaves powder.
Mean squares indicated that Ca content varied significantly with the addition of fenugreek
seeds powder in different treatments (Table 4.9). Mean values for Ca content (Table 4.10)
indicated that it increased with the addition of fenugreek seeds powder as highest found in T6
(42.71±2.13) mg/100g, while lowest 22.00±1.10 mg/100g in T0.

58
Calcium is active in ionic form in tissues and body and principal agent in the formation of
skeletal bones. It also involves in muscle contraction, nerve sensitization, blood clotting and
lactation (Pravina et al., 2013) and deficiency may cause different diseases like osteoporosis
(Soetan et al., 2010). In present investigation we found increasing trend of calcium content of
supplemented flours with increasing the supplementation level of fenugreek i.e. due to high
calcium content. The calcium content of fenugreek leaves reported by Mahmoud et al. (2012)
i.e. 618.41 mg/100 and in seeds 168.88 mg/100g by Kasaye and Jha (2015). Likewise, Hooda
and Jood (2004) found calcium content in the range of 62.2-63.4 mg/100g by supplementation
of wheat flour with 5-20% of fenugreek seeds powder. The high calcium content of kasuri
methi seeds (11.364 mg/g) and methi leaves (10.988 mg/g) reported by Pasricha and Gupta
(2014), that in harmony with current findings.
4.4.5 Copper (Cu)
Mean squares showed non-substantial effect of treatments on copper with the addition of
fenugreek leaves powder (Table 4.7). In current study, Cu content ranged from 0.13±0.02 to
0.18±0.02 mg/100g with highest value was explicated in T3 (0.18±0.02 mg/100g) followed by
T2 (0.16±0.03 mg/100g) and T1 (0.14±0.03 mg/100g) whilst the lowest was exhibited in T0
(0.13±0.02 mg/100g) (Table 4.8).
The analysis of variance (Table 4.9) for copper content of different treatments elucidated that
there was significant effect of fenugreek seeds powder supplementation in wheat flour. Mean
values (Table 4.10) for copper content observed in the range of 0.13±0.02 to 0.22±0.05
mg/100g that revealed copper content increased with the addition of fenugreek seeds powder.
Copper is an essential part of many proteins, required for blood formation, catalyzes the
incorporation of Fe into the structure of the heme and assists maturation of the erythrocytes. It
also a constituent of many enzymes or essential for their activity (Soetan et al., 2010). The
high copper content of treatments found in current study resulted due to high content of
respective mineral in fenugreek as reported earlier by Pasricha and Gupta (2014). The results
regarding copper content of current investigation are corroborated with the work of Al-Jasass
and Al-Jasser (2012) & Tanveer (2014) who reported high values for this attribute when
compared with wheat. Thus, higher content of copper in fenugreek resulted in higher content
of supplemented flours as observed in current research work.

59
4.4.6 Zinc (Zn)
Mean squares (Table 4.7) for zinc content in different treatments described that zinc content
significantly affected with the addition of fenugreek leaves powder. Mean values (Table 4.8)
regarding zinc content has been given in Table 4.8 varied from 0.19±0.03 to 0.30±0.02
mg/100g. The highest zinc content were observed in T3 (0.30±0.02 mg/100g) followed by T2
(0.26±0.03 mg/100g), T1 (0.23±0.01 mg/100g) and T0 (0.19±0.03 mg/100g). The findings of
present study indicated that zinc content increased in treatments with increasing the fenugreek
leaves powder.
The analysis of variance for zinc content of different treatments has been presented in Table
4.9. It is apparent from data that zinc content has significantly affected with the addition of
fenugreek seeds powder. Zinc content ranged from 0.19±0.02 to 0.48±0.05 mg/100g among
different treatments (Table 4.10) and results revealed that zinc content increased with
increasing level of fenugreek seeds powder.
Zinc is an important micronutrient that can affect growth, development, reproductive function,
bone and blood formation, metabolism of nucleic acids, proteins and carbohydrates. It is
present in plasma in two forms, either firmly bound or weakly bound. Zinc globulin complexes
has role in enzymatic functions and it can act in conjunction with enzymes, of which it is an
essential component or activator (Soetan et al., 2010). The results of current investigation are
in harmony with findings of Hooda and Jood (2004) who found zinc content in the range of
4.8-5.0 mg/100g by supplementation of wheat flour with 5-20% of fenugreek seeds powder.
The zinc content found in kasuri methi seeds (0.032 mg/g) and methi leaves (0.0496 mg/g),
reported by Pasricha and Gupta (2014).
4.4.7 Manganese (Mn)
Statistical results regarding manganese (Mn) content in different treatments showed non-
significant difference with supplementation of fenugreek leaves powder (Table 4.7). Mean
values (Table 4.8) depicted that Mn content ranged from 0.67±0.05 to 0.75±0.07 mg/100g with
highest Mn content found in treatment that have 15% fenugreek leaves powder (T3).
Mean squares (Table 4.9) showed that Mn content of different treatments significantly affected
with the addition of fenugreek seeds powder. It was observed that Mn content (Table 4.10)

60
varied from 0.67±0.08 to 0.78±0.06 mg/100g and the highest content observed in T6
(0.78±0.06 mg/100g) followed by T5 (0.75±0.03 mg/100g), T4 (0.73±0.02a mg/100g) and T0
(0.67±0.08 mg/100g). It is obvious from current findings that increasing fenugreek seeds
powder resulted in increased Mn content in different treatments.
Manganese is actively participates in redox process, tissues respiration, bone formation &
affects growth, reproduction, blood formation and the function of endocrine organs. It also
function biochemically either as a cofactor that activating a large number of enzymes or as an
integral part of certain metallo-enzymes. About one third of the body required manganese
provided through cereal based products & remaining major through vegetables and beverages
(Davidsson et al., 1988; Finley et al., 1994), excess of this mineral can restrict iron absorption
(Rossander-Hulten et al., 1991; Finley, 1999). The current investigation found higher
manganese content of fenugreek-wheat supplemented flour i.e. due to higher content found in
fenugreek, also observed earlier 1.71 mg/100g by Mahmoud et al. (2012); 0.9 mg/100g (Al-
Jasass and Al-Jasser, 2012) and 1.3 mg/100g by Tanveer (2014). Similarly, Pasricha and Gupta
(2014) observed manganese content of kasuri methi seeds (0.027 mg/g) and methi leaves
(0.0364 mg/g). Thus, supplementation of fenugreek increased manganese content of wheat
flour as described in current study.
4.5 Rheological study
Rheology deals with the study of flow behavior of fluids and provide information regarding
rheological and mechanical characteristics of different food systems that has significance in
the design of flow processes for quality control, in forecasting storage stability and designing
textural parameters (Herh et al., 2000). Dough rheology characterization is an imperative factor
in the assessment of bread wheat quality & indicates dough handling properties and the
tendency of the dough to contract (Pedersen et al., 2004). Different methods including
farinograph, amlyograph, mixograph and extensograph are being used for characterization of
the rheological properties of flour (Mani et al., 1992). In current investigation incorporation
effect of different percentages of fenugreek leaves and seeds powder in straight grade flour has
been assessed through farinograph and mixograph to evaluate the rheology of dough.

61
4.5.1 Farinographic studies
For the preparation of baked goods, knowledge about rheological properties of the dough is
considered as prime importance. Wheat, the main ingredient in most baked foods, contains
viscoelastic gluten, which confers specific rheological properties to the dough, and this in turn
influences the final quality of the baked product. Therefore, it would be expected that during
preparation of composite flour and dough, partial replacement of wheat with another
component that may be devoid of gluten would influence rheological properties of the resultant
dough. Various rheological parameters are of interest in this regard, including water
absorption, dough strength, dough development time and mixing tolerance. Generally, the
major effect on dough rheological properties arises from dilution of the gluten content on
partially replacing the wheat component. As would be expected, the rheological properties of
the resultant composite dough are dependent on the relative hydrophobicity or hydrophilicity
of food components such as proteins endogenous to the composite flours. Whereas
incorporation of legumes in composite flour tends to bring about changes in rheological
properties like increase in the water absorption and dough development time (Preedy et al.,
2011).
4.5.1.1 Water absorption
Mean squares depicting the fenugreek leaves powder supplementation effect on water
absorption of dough prepared from different treatments has been given in Table 4.11. The
results showed significant difference among treatments with incorporation of fenugreek leaves
powder. The mean values given in Table 4.12 varied from 60.60±0.60 to 63.10±0.93%.
Maximum water absorption was found in T3 (63.10±0.93%) followed by T2 (62.90±1.05%),
T1 (61.39±1.01%) and T0 (60.60±0.60%). The results exhibited that water absorption increased
with increasing supplementation level of fenugreek leaves powder.
Mean squares (Table 4.13) elucidated significant difference among treatments with
supplementation of fenugreek seeds powder. The mean values (Table 4.14) for this trait
explained that water absorption varied from 60.60±0.60 to 62.17±1.14%. Maximum water
(62.17±1.14) was absorbed in flour have 5% fenugreek seeds powder and absorption increased
at certain level (10%) then decreased but remained higher than control.

62
Water absorption is expressed as a percentage and it is one of the most important parameter
commonly used and widely accepted in farinograph measurements. It is also considered as one
of the most important physical factor affecting the farinograms. Higher water absorption during
dough formation reflects the quality of the finished baked products. The findings of the present
investigation are corroborated with the results of Sudha et al. (2013) who replaced wheat flour
with dehydrated fenugreek leaves at 0, 5, 7.5 and 10 %, resulted in water absorption increased
from 68.5 to 70.2 % of dough. When supplementation level of fenugreek in wheat flour was
increased, dough water absorption also increased from 65.10% (control) to 68.5% in the
composite flour with 5% fenugreek powder. When supplementation level increased to 10%,
water absorption of dough decreased by 66.37% but remained higher than control and further
decreased up to 61.2% when supplementation level reached 20%. This is might be due to the
fenugreek interfering with gluten formation that makes the dough cohesive, less elastic and
offered less resistance of farinograph mixing blades (Hooda and Jood, 2003).
Different levels of fenugreek seeds flour increased most of the rheological properties. The
water absorption observed 52% in control that increased up to 62-70% when supplementation
of fenugreek powder increased in wheat flour (Sulieman et al., 2000). Likewise, farinograph
water absorption increased by the addition of Mungbean powder in wheat (Pasha et al., 2011),
the incorporation of legume flour in wheat flour increased water absorption capacity and this
might be due the presence of high protein and fiber (Hefnawy et al., 2012). Enhanced protein
content results due to an increase in pentosans, especially ribose and deoxyribose, which has a
higher water holding capability (Shahzadi et al., 2005). Generally, fiber provides better
properties of water absorption and this is mainly due to more number of OH groups present in
fiber structure that through hydrogen bonding allows a stronger interaction of water (Rosell et
al., 2001). The present findings are also in corroboration with the values reported earlier by
Indrani et al. (2011), Metwal et al. (2011) and Kasaye and Jha (2015) who reported dough
water absorption increased 55.8 to 63.9% with blending up to 10 percent while found decreased
water absorption 61.8% when blending increased up to 15% for fenugreek.
4.5.1.2 Arrival time
The mean squares (Table 4.11) for arrival time exhibited significant effect by the addition of
fenugreek leaves powder in wheat flour. The mean values (Table 4.12) demonstrated that

63
control treatment showed maximum arrival time i.e. 3.56±0.17 min, while the addition of
different levels of fenugreek leaves powder in wheat flour gradually decreased the arrival time.
Mean squares for arrival time (Table 4.13) showed substantial effect among treatments with
the addition of fenugreek seeds powder. The mean values range from 2.58±0.10 to 3.56±0.17
min and the results depicted that control treatment have maximum arrival time that decreased
with increasing the supplementation level of fenugreek seeds powder (Table 4.14).
Arrival time of wheat-fenugreek supplemented flour decreased when compared with wheat
flour (Sulieman et al., 2000). The findings of current study are also in accordance with Saleh
et al. (2012) who made different blends of wheat flour with soybean and chickpea flour and
found arrival time decreased from 1.5 (control) to 0.5 min with soybean supplementation.
4.5.1.3 Dough development time (DDT)
Mean squares for dough development time (DDT) depicted highly significant effect with
supplementation of different levels of fenugreek leaves powder in wheat flour (Table 4.11).
Means regarding DDT (Table 4.12) with addition of fenugreek leaves powder has been
revealed that maximum time was taken by the flour have 15% addition of fenugreek leaves
powder (T3) as 7.50±0.16 min while minimum time 6.17±0.15 min taken by T0.
The statistical analysis (Table 4.13) for DDT of different treatments exhibited that it was
significantly affected with the addition of fenugreek seeds powder. The dough development
time varied from 6.17±0.15 to 8.40±0.10 min in flour have different levels of fenugreek seeds
powder (Table 4.14). The mean values depicted that dough development time increased with
increased supplementation level of fenugreek seeds powder in wheat flour.
Results of dough development time resemble the values observed by Sudha et al. (2013) who
replaced wheat flour with dehydrated fenugreek leaves at 0, 5, 7.5 and 10 % level resulted in
dough development time (DDT) increased from 3.5 to 5.9 min. The incorporation of debittered
and defatted fenugreek seeds powder in wheat flour resulted in increased DDT and this increase
might be the reason of delayed gluten network development because of the fiber content of
fenugreek (Metwal et al., 2011). In general, the relations between non-wheat based protein,
gluten and fiber leads to delay hydration and gluten development that could be the reason of
increased dough development time (Dhinda et al., 2012). The DDT increased from 1.5 min
(control) to 3.5, 7.0 and 9.0 min for 10%, 20% and 30% supplementation levels of fenugreek

64
(Chauhan and Sharma, 2000). Findings of the present study are also correlated with the study
of Hooda and Jood (2003) & Hefnawy et al. (2012) who found increased DDT with addition
of fenugreek in wheat flour. Similarly, Kasaye and Jha (2015) also observed increased dough
development time from 4.2 to 7.5 min with increased supplementation of fenugreek in wheat
flour.
4.5.1.4 Departure time
Analysis of variance reported significant effect by the incorporation of fenugreek leaves in
different treatments for departure time (Table 4.11). The mean values ranged from 15.27±1.02
to 15.65±1.06 min that shows gradually increasing trend with increasing the percentage of
fenugreek leaves powder (Table 4.12). The maximum time taken by T3 (15.65±1.06 min)
followed by T2 (15.48±1.01 min), T1 (15.42±1.09 min) while minimum in T0 (15.27±1.02
min).
Mean squares (Table 4.13) for departure time illustrated that there was significant difference
among different treatments with supplementation of fenugreek seeds powder. The mean values
(Table 4.14) representing increasing trend in departure time as maximum time (16.37±1.01
min) was taken by the dough prepared from flour have 15% fenugreek seeds powder (T6). Thus
the outcomes of the parameter reveals that flour with more quantity of seeds powder will take
longer to leave the 500BU line.
Findings of the current study in harmony with outcomes of Sulieman et al. (2000) who
observed different levels of fenugreek seeds flour increased most of the rheological properties
like water absorption, mixing time, dough stability, departure time and resistance to extension.
The findings of Kasaye and Jha (2015) also have same trend of increasing departure time when
supplementation of fenugreek powder increased in wheat flour.
4.5.1.5 Dough stability
Data available in Table 4.11 revealed that the incorporation of fenugreek leaves powder in
wheat flour has a significant impact on stability time of dough. Mean values (Table 4.12) for
treatments have different levels of fenugreek leaves powder fall in range of 11.71±0.21 to
12.81±0.23 min correspondingly with maximum time taken by flour having 15% addition of
fenugreek leaves powder (T3).
65
The statistical analysis for dough stability given in Table 4.13 shows similar increasing trend
for seeds powder supplementation like fenugreek leaves powder. Flour have 15% fenugreek
seeds powder (T6) had maximum dough stability i.e. 13.78±0.11 min (Table 4.14) followed by
T5 (13.30±0.10 min), T4 (12.61±0.12 min) and T0 (11.71±0.21 min). The current observation
concluded that supplementation of fenugreek powder in wheat flour increased dough stability
when increased supplementation of both fenugreek leaves and seeds powder.
When supplementation of wheat flour was carried out with fenugreek powder, dough stability
increased with increasing the level of supplementation (Hooda and Jood, 2003) that
strengthened the results of present exploration. In another study when fenugreek powder was
incorporated in wheat flour @ 1.5 to 9%, the stability of dough increased up to 4 to 5% due to
slow hydration properties of fenugreek (Chauhan and Sharma, 2000). It is evident that addition
of fenugreek powder in wheat flour increased dough stability (Sulieman et al., 2000; Metwal
et al., 2011). The results of Kasaye and Jha (2015) are also in accordance with the current
findings, who observed increased dough stability from 5.9 to 10.5 min with blending of
fenugreek in wheat flour.
4.5.1.6 Mixing tolerance index
Mean squares for the mixing tolerance index (MTI) exhibited highly significant effect among
treatments with supplementation of fenugreek leaves powder (Table 4.11). The mean values
for MTI of different wheat flour with fenugreek leaves powder at varying level has been
depicted in Table 4.12. Maximum value was observed as 26.00±2.00 BU in control (T0)
treatment while minimum value (18.45±1.12 BU) was found in flour have 15% of fenugreek
leaves powder (T3) added to it.
The statistical analysis (Table 4.13) exhibited that MTI substantially affected with the addition
of fenugreek seeds powder in different treatments. The mean values of MTI for the flour having
different levels of fenugreek seeds powder were in range of 16.46±1.01 to 26.00±2.00 BU
(Table 4.14). There was decline in the MTI value by the incorporation of fenugreek seeds and
leaves powder to wheat flour.
The results of current investigation in accordance with findings of Sulieman et al. (2000) who
observed mixing tolerance index decreased with supplementation of fenugreek powder in
wheat flour. The possible reason is that dough become more stable with supplementation of

66
fenugreek that offered some resistance to weakening of dough when mixing carried out.
Similar outcomes of fiber substitutions in dough were observed by other research workers
(Haridas and Rao, 1991; Chauhan and Sharma, 2000). The study conducted by Hooda and Jood
(2003) also strengthen our results who observed mixing tolerance index decreased from 65 BU
to 25 BU with increasing level of fenugreek substitution in wheat flour.
4.5.2 Mixographic studies
Mixograph measures the dough physical properties and used by wheat breeders to check the
quality of the wheat flour. It is really a useful tool for quality evaluation of wheat where sample
size is limited because this method requires small size of sample. This helps the breeders to
call out the undesirable material in early generations in order to save time, labor and investment
in the subsequent generation. Mixograph determine attributes like water absorption, over
mixing tolerance and viscoelastic strength of dough (Atwell, 2003). These attributes mostly
are functions of flour protein quality and quantity as well as other ingredients present in dough
like shortening (Bello et al., 1991). The ratio of water and flour used during current
mixographic studies was based on initially determine moisture and protein content of flour.
Mixing of water and flour was carried out in mixograph bowl. The mixing time and peak height
attributes observed through mixogram curve used to conclude strength of the dough.
4.5.2.1 Mixing time
Mean squares for the mixing time demonstrated significant effect by incorporating different
levels of fenugreek leaves powder in wheat flour (Table 4.15). The mean values (Table 4.16)
depicted that addition of fenugreek leaves powder in wheat flour lowered its mixing time from
5.73±0.05 min to 4.70±0.20 min. Maximum mixing time was found in wheat flour without any
fenugreek acting as control (T0) while minimum value was observed in flour have 15%
fenugreek leaves powder (T3).
Mean squares (Table 4.17) illustrated that supplementation of fenugreek seeds powder in
different treatments significantly affect mixing time. The mean values for different levels of
fenugreek seeds powder has shown that mixing time reduced from 5.73±0.05 min to 4.80±0.10
min (Table 4.18). There was a decreasing trend for this trait with increasing the percentage of
fenugreek seeds powder in different treatments.

67
Table 4.11 Mean squares for Farinographic parameters of different treatments supplemented with fenugreek leaves
powder
SOV df Water
absorption Arrival time
Dough
development
time
Dough
stability
Mixing
tolerance
index
Departure
time
Treatments 3 10.1927** 0.30414** 0.95436** 0.66681** 39.7193** 0.07264*
Error 8 0.0126 0.00048 0.00105 0.01013 2.0003 0.00019
Total 11
**= Highly Significant
*= Significant
Table 4.12 Farinographic parameters of different treatments supplemented with fenugreek leaves powder
Treatments
Water
absorption
(%)
Arrival time
(min)
Dough
development
time (min)
Dough stability
(min)
Mixing
tolerance
index(BU)
Departure time
(min)
T0 60.60±0.60d 3.56±0.17a 6.17±0.15d 11.71±0.21d 26.00±2.00a 15.27±1.02d
T1 61.39±1.01c 3.26±0.06b 6.80±0.14c 12.61±0.16c 24.00±2.01a 15.42±1.09c
T2 62.90±1.05b 2.98±0.11c 7.11±0.12b 12.50±0.20b 19.33±1.21b 15.48±1.01b
T3 63.10±0.93a 2.84±0.13d 7.50±0.16a 12.81±0.23a 18.45±1.12b 15.65±1.06a
Values expressed are means ± standard deviation
T0 Wheat Flour (Control)
T1 5% fenugreek leaves powder supplemented wheat flour
T2 10% fenugreek leaves powder supplemented wheat flour
T3 15% fenugreek leaves powder supplemented wheat flour

68
Table 4.13 Mean squares for Farinographic parameters of different treatments supplemented with fenugreek seeds
powder
SOV df Water
absorption Arrival time
Dough
development
time
Dough
stability
Mixing
tolerance
index
Departure
time
Treatments 3 1.72460** 0.56627** 3.01639** 2.42460** 57.7019** 0.74968*
Error 8 0.01022 0.00028 0.00667 0.00265 1.0002 0.00025
Total 11
**= Highly Significant
*= Significant
Table 4.14 Farinographic parameters of different treatments supplemented with fenugreek seeds powder
Treatments
Water
absorption
(%)
Arrival
time
(min)
Dough
development time
(min)
Dough
stability
(min)
Mixing
tolerance
index(BU)
Departure
time
(min)
T0 60.60±0.60c 3.56±0.17a 6.17±0.15d 11.71±0.21d 26.00±2.00a 15.27±1.02d
T4 62.17±1.14a 2.88±0.16b 7.80±0.10c 12.61±0.12c 18.19±1.02b 15.49±1.02c
T5 61.52±1.01b 2.72±0.11c 8.13±0.15b 13.30±0.10b 17.38±1.10b 16.02±0.91b
T6 60.63±1.32c 2.58±0.10d 8.40±0.10a 13.78±0.11a 16.46±1.01b 16.37±1.01a
Values expressed are means ± standard deviation
T0 Wheat Flour (Control)
T4 5% fenugreek seeds powder supplemented wheat flour
T5 10% fenugreek seeds powder supplemented wheat flour
T6 15% fenugreek seeds powder supplemented wheat flour

69
Mixing time is an important criteria affected by quality of the flour. Similar to present data
mixing time decreased as level of legume (Matri) flour increased in wheat flour (Lodhi and
Huma, 2003). The results of current research are also comparable with the earlier findings of
Pasha et al. (2013) who observed mixing time decreased from 3.67 to 2.77 min as level of
pumpkin flour supplementation increased in wheat flour.
4.5.2.2 Peak height percentage
Analysis of variance regarding the peak height for different treatments with varying percentage
of fenugreek leaves powder has been given in Table 4.15. The mean values (Table 4.16) ranged
from 53.00±3.00 to 58.00±2.01% in wheat flour have different levels of fenugreek leaves
powder (Table 4.16). The incorporation of fenugreek leaves powder lowered the peak height
as measured by the mixograph and a decreasing trend was observed while maximum peak
height found in control sample.
Mean squares depicted non-momentous difference among different treatments have fenugreek
seeds powder (Table 4.17). The addition of fenugreek seeds powder in wheat flour resulted in
decreasing trend at T4 (55.00±1.01 %) then gradually increased but remained lower than
control (T0) up to 15% supplementation level (Table 4.18).
Peak height gives some indication of the strength and absorption of the flour. However, the
mixogram is not as sensitive to absorption as the farinograph, so the peak height percentage
gives only an indication of the value. Results of mixographic value resemble the values
determined by Lodhi and Huma (2003) & Pasha et al. (2013) who observed mixograph peak
height decreased from 59.30 to 55.50 BU as level of supplementation with matri and pumpkin
flour increased in wheat flour. Mixograph peak height for wheat flour was 45.4% and found
50 to 70% lower in flour supplemented with freeze and oven dried, pre-cooked fiber (Gajula
et al., 2009).

70
Table 4.15 Mean squares for Mixographic parameters of different treatments
supplemented with fenugreek leaves powder
SOV df Mixing time Peak height
Treatments 3 0.63019* 14.7500*
Error 8 0.01090 3.7500
Total 11
**=Highly Significant
*= Significant
Table 4.16 Mixographic parameters of different treatments supplemented with
fenugreek leaves powder
Treatments Mixing time (min) Peak height (%)
T0 5.73±0.05a 58.00±2.01a
T1 5.30±0.01b 56.00±1.03ab
T2 4.89±0.06c 54.00±1.02b
T3 4.70±0.20c 53.00±3.00c
Values expressed are means ± standard deviation
T0 Wheat Flour (Control)
T1 5% fenugreek leaves powder supplemented wheat flour
T2 10% fenugreek leaves powder supplemented wheat flour
T3 15% fenugreek leaves powder supplemented wheat flour

71
Table 4.17 Mean squares for Mixographic parameters of different treatments
supplemented with fenugreek seeds powder
SOV df Mixing time Peak height
Treatments 3 0.45409** 5.41667NS
Error 8 0.00347 2.33333
Total 11
**=Highly Significant
NS= Non-significant
Table 4.18 Mixographic parameters of different treatments supplemented with
fenugreek seeds powder
Treatments Mixing time (min) Peak height (%)
T0 5.73±0.05a 58.00±2.01
T4 5.39±0.01ab 55.00±1.01
T5 5.21±0.02b 55.67±0.57
T6 4.80±0.10c 57.00±2.04
Values expressed are means ± standard deviation
T0 Wheat Flour (Control)
T4 5% fenugreek seeds powder supplemented wheat flour
T5 10% fenugreek seeds powder supplemented wheat flour
T6 15% fenugreek seeds powder supplemented wheat flour

72
4.6 Antioxidant assay of supplemented flour
Reactive oxygen species (ROS) produced in our body through different ways, either from inner
body mechanisms, exposure to environmental pollutants, UV radiations, toxic chemicals and
cigarette smoke or stress generating current life style, results in weakened body defense system
(Valko et al., 2006). Under normal circumstances, our healthy natural defense system can
neutralize these ROS but over production creates problem for our body. Antioxidants are the
compounds that can scavenge the ROS like free radicals with the help of their redox properties
(Middleton et al., 2000). The continuous availability of antioxidants through various dietary
supplements can safeguard our body against harmful effects of free radicals and can increase
the antioxidant capacity. Fenugreek has antioxidant potential and found to be effective
antioxidant in vivo and vitro to deal with oxidation stresses (Mariod et al., 2009). In the current
study we have investigated the antioxidant potential of fenugreek leaves and seeds powder
supplemented wheat flour.
4.6.1 Total phenolic content (TPC)
Statistical results (Table 4.19) showed that highly significant difference was observed for total
phenolic content (TPC) among different treatments with the addition of fenugreek leaves
powder. It is obvious from the results given in Table 4.20 that total phenolic content in different
treatments ranged from 117.00±5.26 (T0) to 390.00±19.11 mg GAE/100g (T3). Increasing
trend was observed for TPC with increased percentage of fenugreek leaves powder.
Mean squares (Table 4.21) depicted that highly significant variations were observed for TPC
between treatments by adding fenugreek seeds powder. The mean values given in Table 4.22
revealed that TPC in different treatments as 117.00±5.26 (T0), 305.00±14.03 (T4),
410.00±19.27 (T5) and 450.00±22.05 mg GAE/100g (T6). The results showed that total
phenolic content increased with increasing the percentage of fenugreek seeds powder in wheat
flour.
In current study wheat-fenugreek supplemented flour extracts depicted momentous antioxidant
properties, depending upon the percentage of fenugreek in wheat flour. Wheat flour has low
phenolic content as compared to fenugreek, as observed in an earlier study total phenolic
content of refined wheat flour found in the ranged of 1.16 to 1.55 mg FAE/g. The organic
73
solvent extracts of hard and soft whole wheat flour were used to determine TPC and found
values as 0.353 and 0.478 mg FAE/g, in the same way 0.137 and 0.161 mg FAE/g values
observed in hard and soft wheat flours (Liyana-Pathirana and Shahidi, 2006). In another
research work, TPC was determined in different wheat varieties flour and observed values in
the range of 1.46 to 2.26 mg GAE/g (Liu et al., 2010). Fenugreek seeds contain different
phenolic content like quercetin and naringenin that could be effective against free radicals. The
hunting activities of these phenolic compounds are credited to active hydrogen (H) donating
capability of the hydroxyl (OH) substitutions (Bors et al., 1996).
The research work of Kaur and Kapoor (2002) categorized fenugreek among high phenolic
content vegetables group using ethanol as extracting solvent and observed very high
antioxidant activity. The total polyphenol content of extracts obtained from extraction of dried
fenugreek greens with methanol, ethanol, and isopropanol solvents was 48, 44, 28 mg
GAE/100g, respectively (Naidu et al., 2012). Similar finding were observed by Bukhari et al.
(2008) who did an experiment to find total phenolic content of fenugreek methanol and ethanol
extracts and reported results as 575±0.002 and 685±0.002 mg GAE/100g, respectively. In
another study conducted by Naidu et al. (2011) who has observed total phenolic content
(85.8 mg/g) in fenugreek seeds extract that could be responsible for its antioxidant activity.
Fenugreek extract had polyphenols (9.47 mg GAE/g) that plays a role as antioxidant (Dua et
al., 2013). The results were also in harmony with another research work of Kumar et al. (2013)
who determined phenolic content and found 22±1.5 μg/mg GAE in extracted fenugreek
sample. The study of different fenugreek samples was carried out to observed total phenolic
content and found 139.2 mg GAE/100g followed by 130.0 mg GAE/100g and 127.8 mg
GAE/100g, respectively (Ali et al., 2015).
4.6.2 Total flavonoids
Mean squares regarding the effect of fenugreek leaves powder supplementation in different
treatments on total flavonoids content has been given in Table 4.19. The results explicated that
fenugreek addition has a significant effect on different treatments. The mean flavonoids values
given in Table 4.20 depicted that highest content (2.97±0.14 mg CE/g) were reported in T3
trailed by T2 (2.80±0.07 mg CE/g), T1 (2.60±0.15 mg CE/g) and T0 (2.38±0.08 mg CE/g).

74
Analysis of variance for total flavonoids (Table 4.21) explicated momentous difference in
values as a function of fenugreek seeds powder. Means for total flavonoids (Table 4.22) for
different treatments; T0 (2.38±0.08 mg CE/g), T4 (2.57±0.10 mg CE/g), T5 (2.79±0.09 mg
CE/g) and T6 (3.01±0.14 mg CE/g), showing increasing trend with increased percentage of
fenugreek seeds powder.
Flavonoids are diverse group of polyphenolic components with exceptional strength to act as
free radical scavenger, anti-inflammatory and antibacterial agent. Different flavonoids like
tricin, vitexin, quercetin, naringenin and tricin-7-O-b-Dglucopyranoside were identified in
fenugreek (Shang et al., 1998). Significant antioxidant activity was observed in fenugreek
seeds extract due to presence of different flavonoids (Dixit et al., 2005). Methanol, ethanol,
hexane, ethyl acetate and acetone were used for extraction and observed flavonoid content in
the range of 607±3.6, 653±4.3, 208±4.2, 251±3.3 and 416±2.7 QE µg/g of fenugreek (Bukhari
et al., 2008). To verify its worth, a study was designed to determine flavonoid content present
in fenugreek by Kumar et al. (2013) who observed total flavonoids 16.6±1.2 μg QE/mg.
Likewise, Ishtiaque et al. (2013) also found flavonoid content 5.80 mg QE/g in fenugreek seeds
and supplementation in wheat flour resulted in an increased flavonoid content.
4.7 Antioxidant activity
4.7.1 Free radical scavenging activity (DPPH Assay)
Mean squares regarding DPPH scavenging activity of different treatments has been presented
in Table 4.19. A significant difference was observed as a function of fenugreek leaves powder
supplementation in wheat flour. Mean values given in Table 4.20 indicated that this attribute
increased with increase in supplementation level i.e. T3 (47.00±2.30%) followed by T2
(45.00±2.11%), T1 (41.00±1.88%) and T0 (35.00±1.57%).
From mean squares of DPPH scavenging activity (Table 4.21), a highly significant relation
was observed for the effect of fenugreek seeds powder supplementation. Means for different
treatments (Table 4.22) found in the range from 35.00±1.57% (T0) to 58.00±2.84% (T6).
Results showed that the highest value was recorded in 15% supplementation while the lowest
for control that exhibited increasing trend for this trait with increased level of fenugreek seeds
powder.

75
The DPPH values of different wheat flour were found in the range of 6.48 to 8.57 μmol TE/g
(Liu et al., 2010). Different factors like genetic, environmental conditions, processing and
extraction solvent & procedure affect antioxidant level in wheat flour (Mpofu et al., 2007). In
current study ethanol extracts has showed significant and concentration dependent DPPH
scavenging activity indicating the antioxidant potential of fenugreek as reported earlier by
Bukhari et al. (2008). They observed DPPH scavenging activity of ethanol and methanol
extracts of fenugreek seeds are correlated to the total polyphenol content of the extracts. High
polyphenol content in the fenugreek extract seems to be the major free radical scavenger in
current investigation. Extracts from dried fenugreek leaves depicted free radical scavenging
activity ranging from 18 to 56% and the activity increased with the increasing concentration
of the various solvents used, methanol extract of fenugreek leaves exhibited 42% activity
followed by ethanol and isopropanol extracts. Further, extract of fenugreek leaves obtained
with aqueous methanol, exhibited higher (56%) free radical scavenging activity. So antioxidant
activities of the extract mainly dependent on the composition of phenolic compounds available
in fenugreek leaves (Naidu et al., 2012).
The data acquired from present study is in harmony with results of Belguith-Hadriche et al.
(2010) who determined fenugreek seeds antioxidant activity by estimating its ability to
scavenge DPPH and observed result i.e. 89.91±3.09%. In another study conducted by Saeed et
al. (2013) who observed Kasuri fenugreek (methanol + water extract) have DPPH radical
scavenging activity (19.01%), followed by Kasuri fenugreek water extract (16.49%). The
DPPH radical scavenging activity of Lahori fenugreek methanol + water extract and water
extract were 18.36 and 14.59%, respectively at same concentration i.e. 1 mg/ml. The
determination of DPPH assay of fenugreek leaves and seeds depicted that free radical
scavenging activity of seeds was better than that of leaves as seen by a lower E.C.50 value
obtained for seeds as compared to a higher E.C.50 value for the leaves. However, the seeds
were found to have a better antioxidant potential than the leaves in vivo (Jha and Srivastava,
2012).

76
Table 4.19 Mean squares for antioxidants in different treatments supplemented with
fenugreek leaves powder
SOV df TPC Flavonoids DPPH
β-carotene &
Linoleic acid
assay
FRAP
Treatment 3 41408.3** 0.19410** 83.9767** 20.0000* 20494.8**
Error 8 179.7 0.01373 3.9517 2.8683 224.5
Total 11
**= Highly significant
* = Significant
Table 4.20 Antioxidants in different treatments supplemented with fenugreek leaves
powder
Trt.
TPC
(mg GAE/
100g)
Flavonoids
(mg CE/g)
DPPH
(%)
β-carotene &
Linoleic assay
(%)
FRAP
(µmol Fe2+/g)
T0 117.00±5.26d 2.38±0.08c 35.00±1.57c 33.00±1.48b 222.00±9.99c
T1 226.00±10.39c 2.60±0.15bc 41.00±1.88b 35.00±1.61ab 257.00±11.82c
T2 314.00±14.75b 2.80±0.07ab 45.00±2.11ab 37.00±1.73ab 351.00±16.49b
T3 390.00±19.11a 2.97±0.14a 47.00±2.30a 39.00±1.91a 401.00±19.94a
Values expressed are means ± standard deviation
T0 Wheat Flour (Control)
T1 5% fenugreek leaves powder supplemented wheat flour
T2 10% fenugreek leaves powder supplemented wheat flour
T3 15% fenugreek leaves powder supplemented wheat flour

77
Table 4.21 Mean squares for antioxidants in different treatments supplemented with
fenugreek seeds powder
SOV df TPC Flavonoids DPPH
β-carotene &
Linoleic acid
assay
FRAP
Treatment 3 66431.6** 0.19410** 292.658** 168.000** 46531.2**
Error 8 270.5 0.01373 5.452 4.209 388.8
Total 11
**= Highly significant
* = Significant
Table 4.22 Antioxidants in different treatments supplemented with fenugreek seeds
powder
Trt
TPC
(mg GAE/
100g)
Flavonoids
(mg CE/g)
DPPH
(%)
β-carotene &
Linoleic acid
assay (%)
FRAP
(µmol Fe2+/g)
T0 117.00±5.26c 2.38±0.08c 35.00±1.57c 33.00±1.48c 222.00±9.99c
T4 305.00±14.03b 2.57±0.10bc 49.00±2.25b 43.00±1.97b 421.00±19.36b
T5 410.00±19.27a 2.79±0.09ab 53.00±2.49ab 45.00±2.11b 465.00±21.85ab
T6 450.00±22.05a 3.01±0.14a 58.00±2.84a 51.00±2.49a 501.00±24.54a
Values expressed are means ± standard deviation
T0 Wheat Flour (Control)
T4 5% fenugreek seeds powder supplemented wheat flour
T5 10% fenugreek seeds powder supplemented wheat flour
T6 15% fenugreek seeds powder supplemented wheat flour
78
4.7.2 β‐carotene and linoleic acid assay
Mean squares for this trait (Table 4.19) showed significant effect of fenugreek leaves powder
addition in different treatments. The mean values (Table 4.20) illustrated that maximum value
(39.00±1.91%) was recorded in T3 followed by T2 (37.00±1.73%), T1 (35.00±1.61%) while
lowest in T0 (33.00±1.48%). The findings of the current research illustrated that this trait
increased with increasing percentage of fenugreek leaves powder.
The analysis of variance for β‐carotene (Table 4.21) revealed significant effect of fenugreek
seeds powder supplementation in wheat flour. The mean values (Table 4.22) illustrated that
values ranged from 33.00±1.48% (T0) to 51.00±2.49% (T6). It is obvious from results that this
assay increased with increasing the supplementation level of fenugreek seeds powder.
The discoloration of β‐carotene has been broadly used to determine different plants extract
antioxidant potential because it is very susceptible to free radical mediated oxidation of linoleic
acid. The formation of linoleic acid free radical occurred with the abstraction of a hydrogen
atom from one of its diallylic methylene groups that attacks the highly unsatured β‐carotene
molecules. As β‐carotene molecules by process of oxidation loses their double bonds resulted
in loss of yellow color of compound. Likewise, antioxidant activity of fenugreek fractions as
measured by the bleaching of β-carotene used different fenugreek fractions like fenugreek
husk, endosperm and seeds extracts that exhibited 73%, 6% and 22% activity when compared
with the corresponding values of 95% for BHA (Naidu et al., 2011). Current study results are
in agreement with explorations of Subhashini et al. (2011) who determine the antioxidant
activity of 70% ethanol extract of fenugreek by β‐carotene bleaching method. The ethanol
extract of fenugreek inhibited β‐carotene oxidation suggesting that the antioxidant activity
could be related to the high levels of phenolic compounds. The extract was employed in the
range of 25-400 mg/mL and by adding more quantity of the extract, absorbance was decreased
and the reason behind was inhibition of bleaching of the color β‐carotene. Fenugreek extract
depicted inhibition at concentration of 0.202 mg/mL.
4.7.3 Ferric reducing antioxidant power (FRAP assay)
Data regarding mean squares for FRAP assay (Table 4.19) indicated a significant effect of
fenugreek leaves powder supplementation in different treatments. Means for the given

79
parameter (Table 4.20) illustrated that T3 exhibited maximum reducing power (401.00±19.94
µmol Fe2+/g) followed by T2 (351.00±16.49 µmol Fe2+/g), T1 (257.00±11.82 µmol Fe2+/g) and
T0 (222.00±9.99 µmol Fe2+/g). The observation of present study revealed that reducing powder
of treatments increased with increased percentage of fenugreek leaves powder.
Analysis of variance for FRAP (Table 4.21) explicated momentous difference in values as a
function of fenugreek seeds powder addition in wheat flour. The mean values for FRAP (Table
4.22) ranged from 222.00±9.99 (T0) to 501.00±24.54 µmol Fe2+/g (T6) that indicates increasing
trend with increasing percentage of fenugreek seeds powder.
Reducing power is correlated with antioxidant activity and may be consider as significant
reflection of the antioxidant activity (Arabshahi-Delouee and Urooj, 2007). The results of the
present investigation for reducing power demonstrated the electron donor characteristic of
fenugreek, thus by neutralizing free radicals to form stable products. A study was carried out
by Khole et al. (2014) to separate and characterize bioactive molecules from germinated
fenugreek seeds. Ethyl acetate, water and n-butanol were used for extraction purpose and the
results for FRAP assay were obtained as 1.27±0.02, 131.027±11.05 and 0.14±0.007 mM
AEAC, respectively. Results of current investigation are comparable with earlier findings in
which meta-analysis was carried out and fenugreek seeds evaluated for FRAP assay. For this
purpose, fenugreek seeds powder extracted systematically, at ambient temperature selecting
solvents of varying polarity such as methanol, dichloromethane, hexane and water. The results
of the study gave a range for various solvents such as 0.135±0.05 to 77.352±0.62 TE mg/g
(Kenny et al., 2013). Thus, the high reducing power of fenugreek than wheat flour support the
findings of current investigation that increasing the percentage of fenugreek in wheat flour
increased reducing power.
4.8 Preparation of bread
In developing countries like Pakistan, demand of baked products like bread has being
increasing from the last few decades and to couple with need of ever-growing urban
population, the composite flour/bread technology could be very useful. The ingredients used
in composite flours depend on the availability of raw materials in the country concerned.
Pakistan is endowed with an enormous biodiversity of plant resources, which could be
exploited for this purpose. Unfortunately, many of these abundant resources remain largely

80
under-utilized like many indigenous crops that required low-input to cultivate but these can be
play their role through agricultural diversification and as a unique opportunity to fulfill food
requirements of increasing population as well as nutritional insecurity. With the current
emphasis on healthy bread with a low glycemic index, high protein and increased dietary fiber,
the use of composite flour in baked goods is to be favored. Therefore, given the inherent
nutritional and therapeutic advantages of these crops, they could find useful application in the
baking industry. Many studies have reported on the possibility of partially replacing wheat
flour with those obtained from local crops for the purpose of making bread and other baked
products (Mepba et al., 2007; Ade-Omowaye et al., 2008; Olaoye and Onilude, 2008), however
consumer acceptability of these products is still under study.
4.9 Proximate analysis of bread
4.9.1 Moisture content
The analysis of variance (Table 4.23) of moisture content exhibited significant difference with
the addition of fenugreek leaves powder in bread. The mean moisture content ranged from
34.46±1.09 to 34.68±1.21% (Table 4.24) with highest moisture content were observed in T3
(34.68±1.21%) while lowest in T0 (34.46±1.09%). The results for moisture described
increasing trend with the addition of fenugreek leaves powder.
Mean squares (Table 4.25) for moisture content of bread supplemented with fenugreek seeds
powder indicated that it was significantly affected by the incorporation levels. The mean
moisture content of bread varied from 34.46±1.06 to 34.63±10.17% (Table 4.26). The results
depicted increasing trend for moisture with increased supplementation T0 (34.46±1.09%), T4
(34.49±1.06%), T5 (34.56±1.35%) and T6 (34.63±1.17%), respectively.
The moisture content of bread prepared from different fenugreek leaves and seeds powder
supplemented flour has increased with increasing the supplementation level. In an earlier study
the moisture content of the composite bread increased with soybean flour substitution by a
range of 32.0 to 37.00% due to increased fiber and protein content. In a similar way increased
moisture content observed that associated with increase in fiber content (Akhtar et al., 2008;
Elleuch et al., 2011; Haruna et al., 2011). The results of present study also in harmony with
earlier study in which bread was prepared and chemical analysis revealed that moisture content

81
increased from 30.09 to 35.54% when supplementation of fenugreek increased from 5 to 15%
in wheat flour i.e. due to high crude fiber content of fenugreek (Kasaye and Jha, 2015).
4.9.2 Ash content
The statistical analysis (Table 4.23) for ash content showed significant difference among
different treatments with the addition of fenugreek leaves powder. The mean values (Table
4.24) depicted that lowest ash content were observed in T0 (1.24±0.02%), while highest in T3
(2.24±0.08). The results has revealed that the incorporation of fenugreek in bread resulted in
increased ash content i.e. @5% (1.74±0.03%) @10% (1.98±0.06%) and @15% (2.24±0.08%).
The analysis of variance (Table 4.25) for ash content of bread significantly differed with
supplementation of fenugreek seeds in different treatments. The mean values for ash content
in bread found in a wide range as T0 (1.24±0.02%), T4 (1.39±0.07%), T5 (1.55±0.05%) and T6
(1.72±0.06%) that shows increasing trend with addition of fenugreek seeds powder (Table
4.26).
In current study high ash content observed in supplemented bread i.e. mainly due to high
mineral content found in fenugreek leaves and seeds powder. The results are in harmony with
findings of Sudha et al. (2013) who prepared parathas with optimum levels of fenugreek
leaves, i.e. either 25% of normal dill/fenugreek leaves or 7.5% of dehydrated dill/fenugreek
leaves and evaluated their proximate composition. The ash content of parathas incorporated
with leaves were higher than the control paratha. The result for ash content also in accordance
with findings of Kasaye and Jha (2015) who reported ash content of bread increased from 1.85
to 2.97% when fenugreek blending increased up to 15% in wheat flour.
4.9.3 Crude protein
Mean squares in Table 4.23 indicated that crude protein content significantly affected by the
addition of fenugreek leaves powder. Means for the effect of fenugreek leaves powder (Table
4.24) depicted that the highest crude protein (11.12±0.55%) were recorded in T0 followed by
T1 (10.85±1.08%) while the lowest in T3 (10.29±1.07%). There was a decreasing trend for
protein content with the addition of fenugreek leaves powder.

82
Table 4.23 Mean squares for proximate analysis of bread supplemented with fenugreek leaves powder
SOV df Moisture Ash Crude Protein Crude Fat Crude Fiber NFE
Treatment 3 0.02523* 0.32094** 0.38463** 0.00228NS 0.01588** 0.01796NS
Error 8 0.00502 0.00042 0.00625 0.00033 0.00033 0.02133
Total 11
** = Highly significant
* = Significant
NS= Non-significant
Table 4.24 Proximate analysis (%) of bread supplemented with fenugreek leaves powder
Treatment Moisture Ash Crude Protein Crude Fat Crude Fiber NFE
T0 34.46±1.09a 1.24±0.02d 11.12±0.55a 5.97±0.15 1.27±0.01d 45.49±1.42
T1 34.54±0.91b 1.74±0.03c 10.85±1.08b 5.94±0.23 1.33±0.01c 45.53±1.17
T2 34.61±1.75ab 1.98±0.06b 10.57±0.90c 5.93±0.16 1.38±0.02b 45.60±1.19
T3 34.68±1.21ab 2.24±0.08a 10.29±1.07d 5.90±0.10 1.44±0.02a 45.67±1.88
Values expressed are means ± standard deviation
T0 Wheat Flour (Control)
T1 5% fenugreek leaves powder supplemented wheat flour
T2 10% fenugreek leaves powder supplemented wheat flour
T3 15% fenugreek leaves powder supplemented wheat flour

83
Table 4.25 Mean squares for proximate analysis of bread supplemented with fenugreek seeds powder
SOV df Moisture Ash Crude
Protein Crude Fat Crude Fiber NFE
Treatment 3 0.01994* 0.05873** 1.57943* 0.39865* 0.57634** 7.25433**
Error 8 0.00418 0.00051 0.28559 0.08222 0.00813 0.44778
Total 11
**= Highly significant
* = Significant
Table 4.26 Proximate analysis (%) of bread supplemented with fenugreek seeds powder
Treatment Moisture Ash Crude Protein Crude Fat Crude Fiber NFE
T0 34.46±1.09a 1.24±0.02d 11.12±0.55c 5.97±0.15c 1.27±0.01d 45.49±1.42a
T4 34.49±1.06b 1.39±0.07c 11.74±0.99b 6.25±0.23b 1.65±0.08c 44.35±2.08b
T5 34.56±1.35bc 1.55±0.05b 12.32±1.20ab 6.54±0.44ab 1.99±0.11b 43.04±2.13c
T6 34.63±1.17c 1.72±0.06a 12.79±1.06a 6.81±0.34a 2.29±0.11a 41.90±1.84d
Values expressed are means ± standard deviation
T0 Wheat Flour (Control)
T4 5% fenugreek seeds powder supplemented wheat flour
T5 10% fenugreek seeds powder supplemented wheat flour
T6 15% fenugreek seeds powder supplemented wheat flour

84
The analysis of variance (Table 4.25) for crude protein content of bread made with fenugreek
seeds powder indicated that it was affected by variation in the levels of substitution. Mean
values for crude protein content (Table 4.26) revealed increasing trend as T0 (11.12±0.55%),
T4 (11.74±0.99%), T5 (12.32±1.20%) and T6 (12.79±1.06%).
When Indian parathas prepared either with 25% of normal dill/fenugreek leaves or 7.5% of
dehydrated dill/fenugreek leaves found protein content in range of 8.3 to 9.5% that are lower
than control. These findings are in accordance with our study that with increased
supplementation level of fenugreek leaves resulted in decreased protein content of bread i.e.
due to low protein content in fenugreek leaves as compared to wheat. On the other hand legume
seeds such as fenugreek is valuable source of protein and can be consider as supplement with
wheat flour for bread production (Kasaye and Jha, 2015). The high protein content determined
in bread prepared with different wheat-fenugreek blended flour and improvement in protein
content is due to high content available in fenugreek seeds. The findings of Hooda and Jood
(2003) & Eissa et al. (2007) also confirmed current study results who prepared biscuits with
different supplementation level of fenugreek seeds powder in wheat flour resulted in higher
protein content in supplemented biscuits when compared with control. Similar findings
observed by Chauhan and Sharma (2000) who determine protein content of bread and observed
increased protein content in bread prepared with flour supplemented with fenugreek seeds
powder. When bread was prepared with 5 to 20% supplementation of fenugreek seeds powder,
increased protein content observed when compared with control (Hooda and Jood, 2005). High
protein content (13.66%) observed in 15% blended wheat-fenugreek bread as compared to
control bread (Kasaye and Jha, 2015).
4.9.4 Crude fat
The analysis of variance (Table 4.23) for crude fat content of bread supplemented with
fenugreek leaves powder represented that there was non-significant difference among different
treatments. The mean crude fat content (Table 4.24) in bread prepared with different levels of
substitution was observed as T1 (5.94±0.23%), T2 (5.93±0.16%) and T3 (5.90±0.10%). The
highest fat content was observed in T0 (5.97±0.15%) having no supplementation and lowest in
T3 (5.90±0.10%) with 15% supplementation level. These results indicated that the replacement
of wheat flour with fenugreek leaves powder in bread resulted a gradual decrease in fat content.
85
The statistical analysis (Table 4.25) for crude fat content of bread supplemented with fenugreek
seeds powder referred that it was affected significantly with level of supplementation. Mean
crude fat content (Table 4.26) in T0 (control) was found to be 5.97±0.15%, whereas, the
incorporation of seeds powder in the bread resulted a progressive increase in fat content i.e. T4
(6.25±0.23%), T5 (6.54±0.44%) and T6 (6.81±0.34%).
The results of current study illustrated that fat content decreased with increasing the fenugreek
leaves powder in wheat flour i.e. due to low fat content of fenugreek leaves. In an earlier study
parathas (Indian bread) with optimum levels of leaves, i.e. either 25 % of normal dill/fenugreek
leaves or 7.5% of dehydrated dill/fenugreek leaves were prepared and observed fat content
8.9–9.2 % that are lower than control one (Sudha et al., 2013). However, fenugreek seeds has
higher fat content than wheat flour resulted in higher fat content in seeds powder supplemented
bread. Similar results were reported by Ibrahium and Hegazy (2009) that incorporation of
fenugreek flour in biscuits formula increased fat content. In similar way Mahmoud (2013)
determined chemical composition of non-fortified and fortified bread with two levels (5 and
10%) of fenugreek seeds and found higher fat content in fortified bread as compared to control.
The current study results are also comparable with findings of Kasaye and Jha (2015) who
observed high fat content in wheat-fenugreek blended flour bread i.e. 2.11% as compared to
wheat flour bread.
4.9.5 Crude fiber
Mean squares in Table 4.23 for crude fiber content of bread supplemented with fenugreek
leaves powder showed that it was significantly different among treatments. The mean crude
fiber content available in Table 4.24 revealed that incorporation of fenugreek leaves powder
in bread resulted an increase in fiber content i.e. @ 5% (1.33±0.01%), @ 10% (1.38±0.02%)
and @ 15% (1.44±0.02%), while lowest found in control (1.27±0.01%).
The analysis of variance (Table 4.25) for crude fiber content of bread supplemented with
fenugreek seeds powder indicated that there was a significant difference among treatments.
The mean fiber content (Table 4.26) were observed in the range of 1.27±0.01% (T0) to
2.29±0.11% (T6). The bread have different levels of seeds powder resulted an increase in fiber
content i.e. T4 (1.65±0.08%), T5 (1.99±0.11%) and T6 (2.29±0.11%). These results indicated
that fenugreek can be used as a good source of fiber in bread.
86
The crude fiber content of the supplemented bread increased with progressive inclusion of
fenugreek powder in wheat flour. The health benefits of high fiber diets is getting popular in
now a days busy life and people are becoming more conscious for healthy diets like whole
grain bread. Supplementation has been consider as important toll to improve fiber availability
and fiber fortified baked products are available for consumers since years (Eastwood and
Kritchevsky, 2005). The fiber content of Indian parathas found higher enriched either with
25% of normal dill/fenugreek leaves or 7.5% of dehydrated dill/fenugreek leaves when
compared to the control paratha (Sudha et al., 2013). Similar findings were observed when
bread was prepared with 5 to 20% supplementation of fenugreek powder in wheat flour
resulted in higher fiber content (Hooda and Jood, 2005). Likewise, bread prepared from wheat-
fenugreek blended flour found increased fiber content from 0.65 to 3.08% as supplementation
of fenugreek powder increased (Kasaye and Jha, 2015) that supports the findings of current
study.
4.9.6 Nitrogen free extract (NFE)
Mean squares (Table 4.23) for NFE in bread prepared with fenugreek leaves powder stated
that the difference in NFE was non-significant. Mean values has been given Table 4.24
revealed that NFE content in bread supplemented with different levels of fenugreek leaves
powder ranged from 45.49±1.42 to 45.67±1.88%. The highest value observed in T3
(45.67±1.88%) followed by T2 (45.60±1.19%) and T1 (45.53±1.17%) while lowest value was
observed in T0 (45.49±1.42%).
The analysis of variance (Table 4.25) for NFE in bread prepared with fenugreek seeds powder
specified that the differences in NFE were highly significant. Mean values for NFE have been
illustrated in Table 4.26 revealed a decreasing trend as T0 (45.49±1.42%), T4 (44.35±2.08%),
T5 (43.04±2.13%) and T6 (41.90±1.845%).
The chemical composition of non-fortified and fortified bread with two levels (5 and 10%) of
fenugreek seeds was determined. It was observed that fortified bread with fenugreek seeds
powder found increased total protein, fat, ash and fiber content, while moisture content and
carbohydrates decreased than that of the non-fortified bread (Mahmoud, 2013). The moisture,
ash, protein, fat and fiber content increased with increasing supplementation level of wheat-
fenugreek blended bread while carbohydrates decreased. Bread prepared from wheat flour has

87
NFE 65.59% as compared to bread prepared with supplementation of fenugreek in wheat flour.
NFE content decreased from 65.59 to 55.72% when supplementation increased up to 15% in
wheat flour (Kasaye and Jha, 2015). So, the results of the current study are in line with earlier
research work of different scientist who also observed with increasing fenugreek seeds powder
supplementation increased the nutritional profile of bread.
4.10 Mineral content of bread
4.10.1 Sodium (Na)
Mean squares (Table 4.27) for sodium content in bread supplemented with fenugreek leaves
powder showed significant difference among different treatments. The mean values for sodium
content ranged from 4.10±0.15 (T0) to 12.28±0.57 mg/100gm (T3) as given in Table 4.28. The
results showed that sodium content increased with increasing the percentage of fenugreek
leaves powder.
Analysis of variance (Table 4.29) for sodium content in bread indicated significant effect with
the addition of fenugreek seeds powder in different treatments. Means for different treatments
(Table 4.30) explained that maximum sodium was (12.83±0.59 mg/100g) found in T6 followed
by T5 (10.05±0.45 mg/100g), T4 (7.02±0.30 mg/100g) whereas, control (T0) showed minimum
value (4.10±0.15 mg/100g). The Na content exhibited increasing trend by increasing the
fenugreek seeds powder in prepared bread.
The high sodium content of bread prepared from different wheat-fenugreek composite flour
resulted due to high sodium content present in fenugreek. Salt plays an important functional
roles during bread making process like it not only rises the dough osmotic pressure as well as
partially neutralizes electrostatic repulsion between gluten proteins. The combined role of
these function have significant effect on quality of the bread. Due to gluten protein
strengthening effect, gas bubbles expand to their maximum size without rupture. Bread
prepared without addition of salt resulted with large bubbles, attached with collapsed bubbles
due to their poor gluten strength, leads to poor loaf volume. The mixing time of dough and
mixing tolerance index increased through salt and gluten proteins interaction as well as it also
improves sensory characteristics of bread (Heidolph et al., 2011).

88
4.10.2 Potassium (K)
Statistical analysis depicted in (Table 4.27) for potassium content (K) in different treatments
revealed that in prepared bread potassium (K) content significantly differed with the addition
of fenugreek leaves powder. Mean values (Table 4.28) illustrated that K content ranged from
124.00±6.20 (T0) to 177.18±8.86 mg/100g (T3). The highest K content during analysis were
observed in T3 (177.18±8.86 mg/100g) followed by T2 (159.46±7.97 mg/100g), T1
(141.73±7.09 mg/100g) whilst the lowest value was exhibited in T0 (124.00±6.20 mg/100g).
Mean squares given in Table 4.29 indicated that potassium content (K) of bread prepared from
different treatments affected significantly with the addition of fenugreek seeds powder. Means
for potassium content (Table 4.30) exhibited highest value (187.30±9.36 mg/100g) for T6
trailed by T5 (166.20±8.31 mg/100g) and T4 (145.10±7.25 mg/100g). The minimum content
was observed in T0 (124.00±6.20 mg/100g) that revealed that potassium content increased with
increased supplementation of fenugreek seeds powder in bread.
In the present research work, we found higher potassium content in bread prepared from
different treatments due to high potassium content in fenugreek. It is a good source of
potassium as reported by Naidu et al. (2012) who determined 4.7 mg/100g of fenugreek leaves.
Bread prepared with white flour with the addition of three different percentage of sodium
chloride and equal mixture of sodium chloride with potassium chloride (NaCl/KCl). The
0.75% level of sodium chloride and 1.0% level of KCl/NaCl were not significantly differ in
flavor when compared with control bread and made acceptable by panel of judges (Wyatt and
Ronan, 1982). Potassium plays an important role in controlling blood pressure. So keeping this
in view a study was conducted in which two bread were prepared, one with 30% replacement
of sodium with potassium salts and second with soy flour replaced 10% of the wheat flour.
The sensory results were acceptable and found alike control bread (Braschi et al., 2009).
4.10.3 Iron (Fe)
It is obvious from the statistical analysis (Table 4.27) that iron (Fe) in prepared bread have non-
momentous difference among each other with the addition of fenugreek leaves powder. It was
observed that the Fe content ranged from 3.44±0.17 (T0) to 3.86±0.19 mg/100gm (T3) among
different treatments (Table 4.28). Although, addition of fenugreek leaves powder gradually
increased the iron content but non-significant among different treatments.
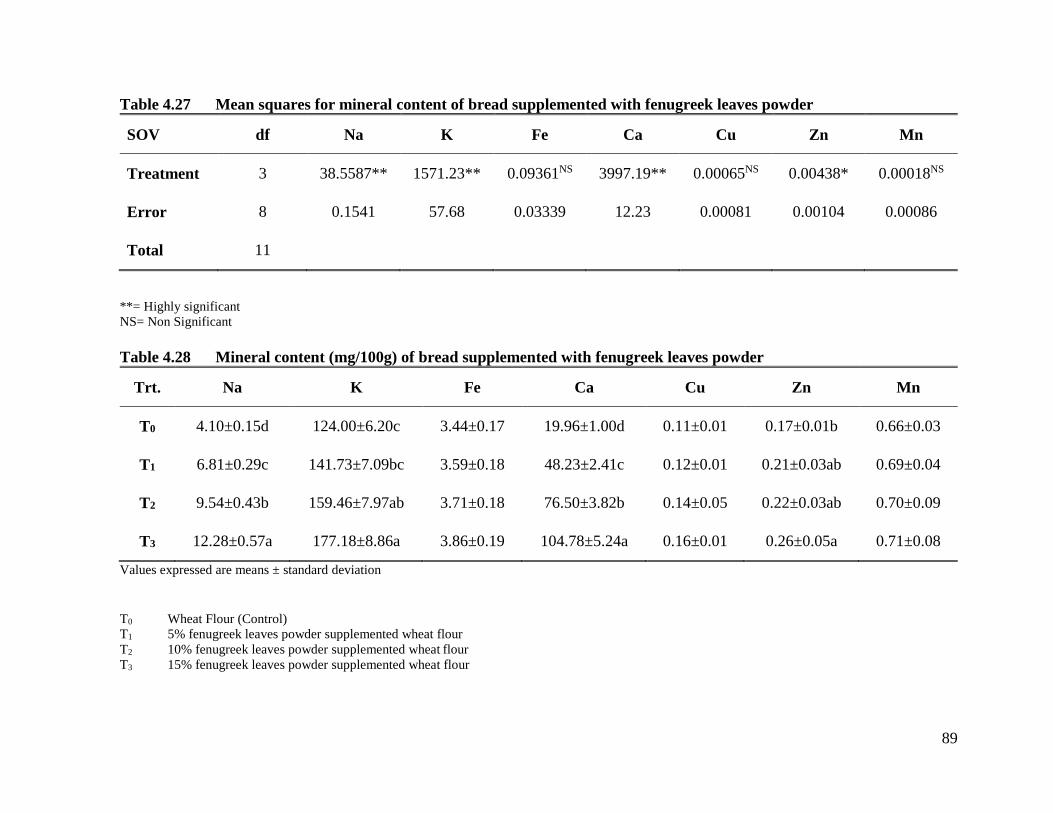
89
Table 4.27 Mean squares for mineral content of bread supplemented with fenugreek leaves powder
SOV df Na K Fe Ca Cu Zn Mn
Treatment 3 38.5587** 1571.23** 0.09361NS 3997.19** 0.00065NS 0.00438* 0.00018NS
Error 8 0.1541 57.68 0.03339 12.23 0.00081 0.00104 0.00086
Total 11
**= Highly significant
NS= Non Significant
Table 4.28 Mineral content (mg/100g) of bread supplemented with fenugreek leaves powder
Trt. Na K Fe Ca Cu Zn Mn
T0 4.10±0.15d 124.00±6.20c 3.44±0.17 19.96±1.00d 0.11±0.01 0.17±0.01b 0.66±0.03
T1 6.81±0.29c 141.73±7.09bc 3.59±0.18 48.23±2.41c 0.12±0.01 0.21±0.03ab 0.69±0.04
T2 9.54±0.43b 159.46±7.97ab 3.71±0.18 76.50±3.82b 0.14±0.05 0.22±0.03ab 0.70±0.09
T3 12.28±0.57a 177.18±8.86a 3.86±0.19 104.78±5.24a 0.16±0.01 0.26±0.05a 0.71±0.08
Values expressed are means ± standard deviation
T0 Wheat Flour (Control)
T1 5% fenugreek leaves powder supplemented wheat flour
T2 10% fenugreek leaves powder supplemented wheat flour
T3 15% fenugreek leaves powder supplemented wheat flour

90
Table 4.29 Mean squares for mineral content of bread supplemented with fenugreek seeds powder
SOV df Na K Fe Ca Cu Zn Mn
Treatment 3 43.7094** 2226.19** 3.11267** 233.518** 0.00419** 0.04627** 0.00210NS
Error 8 0.01680 61.96 0.05490 2.427 0.00033 0.00100 0.00131
Total 11
**= Highly significant
NS= Non Significant
Table 4.30 Mineral content (mg/100g) of bread supplemented with fenugreek seeds powder
Values expressed are means ± standard deviation
T0 Wheat Flour (Control)
T4 5% fenugreek seeds powder supplemented wheat flour
T5 10% fenugreek seeds powder supplemented wheat flour
T6 15% fenugreek seeds powder supplemented wheat flour
Trt. Na K Fe Ca Cu Zn Mn
T0 4.10±0.15d 124.00±6.20c 3.44±0.17d 19.96±1.00d 0.11±0.01c 0.17±0.01c 0.66±0.03
T4 7.02±0.30c 145.10±7.25c 4.23±0.21c 26.79±1.34c 0.14±0.01bc 0.28±0.04b 0.71±0.05
T5 10.05±0.45b 166.20±8.31b 5.01±0.25b 33.62±1.68b 0.17±0.02ab 0.36±0.03b 0.73±0.07
T6 12.83±0.59a 187.30±9.36a 5.81±0.29a 40.46±2.02a 0.19±0.02a 0.46±0.02a 0.74±0.09

91
Mean squares (Table 4.29) showed that iron content of bread prepared from different
treatments significantly affected by the addition of fenugreek seeds powder. Mean values
(Table 4.30) showed that maximum value (5.81±0.29 mg/100g) was recorded in T6 followed
by (5.01±0.25) in T5, (4.23±0.21) in T4 and minimum (3.44±0.17 mg/100g) in T0 (control).
This parameter gradually increased with increasing the supplementation of fenugreek seeds
powder.
The concentration of iron increased in bread when supplemented with 5-15% of fenugreek
powder when compared with control bread (Fretzdorff and Brummer, 1992). The
supplementation of fenugreek leaves powder (100g/meal) in standard cereal meal, significantly
increased the iron content (3.24 mg to 9.12 mg). This could be credited to the high iron content
of fenugreek leaves (Jonnalagadda and Seshadri, 1994). The results of current study also
confirmed by Hooda and Jood (2005), who determined low iron content in control biscuits and
it significantly increased with supplementation of fenugreek powder in wheat flour due to high
iron content of fenugreek powder. The addition of fenugreek seeds powder increased iron
content in biscuits as compared to wheat flour biscuits (Ibrahium and Hegazy, 2009). Similar
higher iron content (11.95mg/100g) of biscuits observed by Mahmoud et al. (2012). In another
study the iron content found in range of 7.79 to 8.03 mg/100g of bread when prepared with
wheat-fenugreek blended flour as compared to wheat flour (Kasaye and Jha, 2015).
4.10.4 Calcium (Ca)
Mean squares (Table 4.27) for calcium (Ca) content in bread prepared from different
treatments indicated that these content differed significantly with supplementation of
fenugreek leaves powder. Mean values illustrated that Ca content in bread ranged from
19.96±1.00 to 104.78±5.24 mg/100g. The maximum value was observed in T3 i.e. 104.78±5.24
mg/100g followed by T2 (76.50±3.82 mg/100g), T1 (48.23±2.41 mg/100g) and T0 (19.96±1.00
mg/100g) (Table 4.28).
Analysis of variance indicated that calcium content varied significantly with the addition of
fenugreek seeds powder in bread prepared from different treatments (Table 4.29). Mean
calcium content (Table 4.30) in bread indicated that it increased with the addition of fenugreek
seeds powder with highest value found in T6 i.e. 40.46±2.02 mg/100g and lowest 19.96±1.00
mg/100g in T0.

92
The calcium content of bread increased by fenugreek addition in wheat flour @ 5 to 15% as
compared to wheat flour bread (Fretzdorff and Brummer, 1992). The value of calcium content
was 58.70 mg/100g in control bread and it increased to 59.76 mg/100g when supplementation
of fenugreek powder was carried out in wheat flour (Hooda and Jood, 2005). The earlier
findings also strengthen the results of present investigation that mineral content of bread
increased when prepared with wheat-fenugreek blended flour as compared to wheat flour. The
calcium content determined in bread varied from 64.13 to 78.04 mg/100g when supplemented
with various percentage of fenugreek powder. In the same way when biscuit prepared with
wheat-fenugreek blended flour and analyzed for mineral profile found highest calcium
(70.71±0.39 mg/100g) when wheat supplemented with 15% fenugreek flour while the lowest
(56.82±0.30 mg/100g) for control (Kasaye and Jha, 2015).
4.10.5 Copper (Cu)
The analysis of variance (Table 4.27) for copper content in different treatment bread showed
non-momentous difference among each other with the addition of fenugreek leaves powder.
The mean Cu values (Table 4.28) ranged from 0.11±0.01 to 0.16±0.01 mg/100g with highest
Cu content was explicated in T3 (0.16±0.01 mg/100g) followed by T2 (0.14±0.05 mg/100g),
T1 (0.12±0.01 mg/100g) whilst the lowest was exhibited in T0 (0.11±0.01 mg/100g).
Mean squares (Table 4.29) for copper content in bread prepared from different treatments
explained that there was significant effect of fenugreek seeds powder supplementation. Mean
values related to copper content have been depicted in Table 4.30. The copper content ranged
from 0.11±0.01 to 0.19±0.02 mg/100g that exhibited copper content increased with the
addition of fenugreek seeds powder.
The mineral content of wheat flour increased with supplementation of fenugreek powder.
Likewise, biscuits prepared with supplemented flour exhibited higher copper content that
might be credited to higher mineral content of fenugreek powder (Hooda and Jood, 2005). It
was observed in the current study that supplementation of fenugreek powder to wheat flour
significantly increased copper content of bread that also in harmony with the findings of
Kasaye and Jha (2015).

93
4.10.6 Zinc (Zn)
The statistical analysis for zinc content in different treatments has been presented in Table 4.27
which indicated that the zinc content differed significantly with the addition of fenugreek
leaves powder. Mean values of zinc content varied from 0.17±0.01 to 0.26±0.05 mg/100g. The
highest zinc content was observed in T3 (0.26±0.05 mg/100g) followed by T2 (0.22±0.03
mg/100g), T1 (0.21±0.03 mg/100g) and T0 (0.17±0.01 mg/100g) (Table 4.28).
Mean squares for zinc content of different treatment bread has been given in Table 4.29. It is
obvious from the results that zinc content significantly affected by the addition of fenugreek
seeds powder. Zinc content ranged from 0.17±0.01 to 0.46±0.02 mg/100g among different
treatments (Table 4.30) that revealed that zinc content of bread increased with increasing
supplementation level of fenugreek powder.
It was apparent that the supplementation of fenugreek powders to wheat flour significantly
increased zinc content in bread and current exploration is supported by Hooda and Jood (2005)
who observed zinc content of bread increased when wheat flour supplemented with fenugreek
powder and result found in the range of 3.51 mg/100g to 3.84 gm/100g. In another study similar
increased of Fe, Zn and Ca content were observed in fenugreek supplemented biscuits
(Ibrahium and Hegazy, 2009). The zinc content of bread increased from 2.15±0.00 to
2.44±0.07 mg/100g when prepared with wheat-fenugreek blended flour as compared to wheat
flour. In the same study when biscuit prepared with wheat-fenugreek blended flours and
analyzed for mineral profile found zinc content in the range of 1.65±0.00 to 2.01±0.05 mg/100g
(Kasaye and Jha, 2015).
4.10.7 Manganese (Mn)
Statistical results given in Table 4.27 illustrated that manganese content in different treatments
showed non-significant results with supplementation of fenugreek leaves powder. Mean values
(Table 4.28) exhibited that Mn content ranged from 0.66±0.03 to 0.71±0.08 mg/100g with
highest Mn content found in treatment having 15% fenugreek leaves powder (T3).
Mean squares (Table 4.29) showed that Mn content of different treatment bread significantly
affected by the supplementation of fenugreek seeds powder. The mean values for Mn content
varied from 0.66±0.03 to 0.74±0.09 mg/100g and the highest content observed in T6

94
(0.74±0.09 mg/100g) followed by T5 (0.73±0.07 mg/100g), T4 (0.71±0.05 mg/100g) and T0
(0.66±0.03 mg/100g). The result exhibited that Mn content gradually increased with increasing
the percentage of fenugreek seeds powder.
The higher Mn content in fenugreek-wheat supplemented bread were observed when compared
with the control bread. The results are in harmony with observations of Mahmoud et al. (2012)
who determined higher mineral content like Mn in the range of 0.34 to 0.48 mg/100g with 10%
supplementation in biscuits as compared to control. Fenugreek has higher mineral content as
compared to wheat flour and our results are also in agreement with outcomes of Singh et al.
(2013) who found manganese content in range of 1.79 to 1.35 mg/100g, with an average of
1.53mg/100g in fenugreek seeds.
4.11 Antioxidant assay of bread
Phytochemicals are non-nutritive plant chemicals that are associated with protective or disease
preventing role against different chronic diseases. On the other hand, many of these
phytochemicals together with other seeds components are regarded as anti-nutritional factors.
Therefore, with regard to these phytochemicals or anti-nutritional factors, the objective of
producing composite baked goods may either be to retain them in order to exert potential health
benefits or to use the processing to eliminate or inactivate them so as to reduce their anti-
nutritional effects. However, it appears that with regard to composite baked goods, not much
research has been conducted to determine the effect of the compositing and processing on
levels of these phytochemicals (Anton et al., 2008).
The phenols content of bread prepared with wheat flour in current study were lower as
compared to respective supplemented flour. The baking process degraded or damaged the
active compounds responsible for antioxidant activity of flour and during other process like
dough mixing and kneading losses are also observed for antioxidants. In bread antioxidant
activity can be modified by active oxidative enzymes available in different ingredients used
during production or oxidized by ambient oxygen (Holtekjolen et al., 2008; Leenhardt et al.,
2006).

95
4.11.1 Total Phenolic Content (TPC)
The mean squares in (Table 4.31) found momentous effect on TPC with supplementation of
fenugreek leaves powder among different treatments. Means (Table 4.32) related to TPC
showed momentous variations among treatments i.e. T0, T1, T2 & T3; 99.00±4.45, 198.00±9.10,
213.00±10.01 and 315.00±15.43 mg GAE/100g, respectively. The results showed that there is
significant increase in TPC value with increasing the supplementation of fenugreek leaves
powder.
The bread supplemented with fenugreek seeds powder exhibited a significant difference in
TPC among different treatments (Table 4.33). Means from Table 4.34 indicated highest TPC
(413.00±19.82 mg GAE/100g) in T6 followed by T5 (341.00±16.02 mg GAE/100g) and T4
(238.00±10.94 mg GAE/100g). The increasing trend was observed for this trait with increasing
the supplementation of fenugreek seeds.
According to findings of current investigation TPCs found lower in wheat flour bread when
compared with fenugreek-wheat supplemented bread. The study conducted by Premanath et
al. (2011) observed 4.9 mg/g polyphenols in ethanol extract of fenugreek leaves powder. In
another research work mean phenolic content found to be 52.8 mg/g GAE in fenugreek leaves
supplemented chicken patties (Devatkal et al., 2012). The maximum content of 48 mg/g GA
equivalent of total phenolic in fenugreek leaves extract determined by Naidu et al. (2011) and
also reported the antioxidant activity may be related with polyphenol content present in
fenugreek. However, low total phenolic content i.e. 0.52 and 1.01 mg FAE/g determined in
refined and whole wheat flour bread (Preedy et al., 2011) that in agreement with current study
findings. The total phenolic content found in bread prepared with refined and whole wheat
flour as 0.87 and 1.58 mg FAE/g, respectively (Yu and Nanguet, 2013). During baking
decreased of 67% and 72% of total phenolic content observed in refined and whole wheat flour
bread due to loss of heat liable phenolic acid like vitamin C (Han and Koh, 2011).
4.11.2 Total flavonoids
Analysis of variance for total flavonoids (Table 4.31) explicated momentous difference in
values as a function of fenugreek leaves powder supplementation among different treatments.
Means for total flavonoids (Table 4.32) for different treatments; T0 (2.13±0.09 mg CE/g), T1
96
(2.47±0.08 mg CE/g), T2 (2.65±0.11 mg CE/g) and T3 (2.84±0.13 mg CE/g), showing
maximum results for treatment with 15% supplementation.
Mean squares for total flavonoids (Table 4.33) showed significant effect among treatments
with supplementation of fenugreek seeds powder. As examined from mean values (Table 4.34),
maximum flavonoids value (2.91±0.12 mg CE/g) was recorded in 15% fenugreek seeds
powder supplemented treatment (T6) while minimum (2.13±0.19 mg CE/g) in T0.
The shielding impact of fenugreek against chronic diseases has been accredited to the
antioxidant potential of its flavonoid content like alkaloids, flavonoids and saponins (Kumar
et al., 2013). The ethanol extract of fenugreek leaves powder found flavonoids 0.47 mg/g as
reported by Premanath et al. (2011). The study of antioxidant properties of fenugreek seeds
exhibited that significant antioxidant activity in seeds may be due to presence of polyphenols
and flavonoids (Dixit et al., 2005). The content of total flavonoids in wheat-fenugreek
supplemented bread were found higher when compared with control bread because fenugreek
powder is a better source of flavonoid compounds than wheat flour. However, wheat-fenugreek
flour bread having flavonoids content lower than supplemented flour. The possible reason of
loss during processing conditions like baking, there might be loss of flavonoid compounds due
to thermal process that leads to reduce antioxidant activities (Dietrych-Szostak and Oleszek,
1999). Therefore, it is recommended that to keep such losses minimum conditions of product
processing should be optimized keeping in view nature of the product.
4.12 Antioxidant activity of bread
4.12.1 Free radical scavenging activity (DPPH Assay)
Mean squares regarding DPPH scavenging activity of different treatments has been presented
in Table 4.31. A significant difference was observed as a function of fenugreek leaves powder
addition in different treatments. Means shown in Table 4.32 indicated that free radical
scavenging activities of different treatments ranged from 31.00±1.27 to 43.00±1.97%. In
addition, the highest scavenging activity was found in T3 (43.00±1.97%) that revealed that
activity increased with increasing the supplementation level.
Analysis of variance for DPPH scavenging activity (Table 4.33) explicated momentous
difference in values as a function of fenugreek seeds powder among different treatments.
Means for DPPH scavenging activity (Table 4.34) for the different treatments; T0

97
(31.00±1.24%), T4 (45.00±1.93%), T5 (49.00±2.20%) and T6 (51.00±2.39%), showing
increasing trend with increased percentage of fenugreek seeds powder.
The antioxidant strength of bread prepared from different treatments was estimated by using
the free radical scavenging (DPPH) activity. The DPPH value for bread prepared from wheat
flour found lower than fenugreek-wheat supplemented bread. The bread prepared from refined
and whole wheat flour having DPPH values in the range of 2.83 to 3.90 μmol TE/g and 2.79
to 4.05 μmol TE/g (Yu and Nanguet, 2013). However, average DPPH value was observed
64.2% in fenugreek leaves supplemented chicken patties due to higher activity of fenugreek
(Devatkal et al., 2012). During the process of bread production the scavenging activity found
decreased i.e. in harmony with the early investigation in which average scavenging ability
observed decreasing trend of 30 to 32%, respectively. The loss of this activity may be due to
loss of phenolic compounds, because high temperature required during baking leads to
destruction of these compounds (Han and Koh, 2011).
4.12.2 β-carotene and linoleic acid assay
Mean squares in Table 4.31 indicated β-carotene values were significantly affected by
fenugreek leaves powder supplementation in bread. Means for this trait (Table 4.32) exposed
that the highest β-carotene values 35.00±1.68% was recorded in T3 followed by T2
(33.00±1.45%) and T1 (31.00±1.42%) while the lowest 29.00±1.18% in T0.
Mean squares presented in Table 4.33 indicated significant effect of fenugreek seeds powder
addition in different treatments. Means for the effect of β-carotene values (Table 4.34)
illustrated that maximum value for this trait was found in T6 (43.00±2.10%), while minimum
in T0 (29.00±1.30%). The results of present study exhibited that β-carotene values increased
with increasing the supplementation of fenugreek in prepared bread.
In a previous study, higher content of ß-carotene (22.5mg/100 g) observed in low humidity air
dried fenugreek leaves compared to radiofrequency dryer dried sample (6.2 mg/100 g; 76.2
mg/100 g) and hot air dried fenugreek leaves (6.0 mg/100 g; 148.1 mg/100 g) (Naidu et al.,
2012). The supplementation of fenugreek seeds in the diet of rats prevented enzymatic leakage,
alter lipid peroxidation and enhanced antioxidant potential (Thirunavukkarasu et al., 2003). So
fenugreek leaves and seeds can be a potential source of bioactive compounds and addition of
fenugreek leaves powder in rats diet @ of 1g/kg of body weight lowered lipid peroxidation

98
and improved significant system (Annida and Prince, 2004). No bioactive components were
detected in paratha prepared with wheat flour. However, β-carotene content found slightly
higher when 25% of normal fenugreek leaves were incorporated in wheat flour (Sudha et al.,
2013).
4.12.3 Ferric reducing antioxidant power (FRAP assay)
Data regarding mean squares for FRAP assay (Table 4.31) indicated a significant effect of
fenugreek leaves powder supplementation. Means for the given parameter (Table 4.32)
illustrated that T6 exhibited maximum reducing power (356.00±17.08 µmol Fe2+/g) followed
by T2 (254.00±11.93 µmol Fe2+/g) and T1 (201.00±9.24 µmol Fe2+/g) while minimum in T0
(167.00±7.51 µmol Fe2+/g), that indicated increasing trend with increasing supplementation
level.
Mean squares for FRAP assay showed significant effect of fenugreek seeds powder addition
in bread prepared from different treatments (Table 4.33). As indicated from mean values (Table
4.34), highest reducing power (450.00±21.60 µmol Fe2+/g) was recorded in 15% seeds powder
supplementation while lowest (167.00±7.01 µmol Fe2+/g) in wheat flour (T0).
The findings of the present study revealed that reducing power increased with increasing the
fenugreek supplementation in bread. Fenugreek has more reducing power when compared with
wheat flour as discuss earlier. In a meta-analysis, fenugreek seeds were evaluated for FRAP
assay. For this purpose, fenugreek seeds powder extracted systematically, at ambient
temperature selecting solvents of varying polarity such as methanol, dichloromethane, hexane
and water. The results of the study gave a range for various solvents in the range of
0.135±0.055 to 77.352±0.627 TE mg/g (Kenny et al., 2013).
4.13 Color of bread
Color tonality includes L*, a*and b*, Chroma and Hue angle values. Usually, L* value
indicates lightness of the tested substance, while b* gives indication of yellowness whereas a*
indicates greenness and redness of the final product. Chroma inform about color intensity,
while tan inverse of a/b is called as hue angle. Mean squares regarding attributes of color
tonality indicated that supplementation of fenugreek leaves and seeds powder significantly
affected these traits (Table 4.35, 4.37).

99
Table 4.31 Mean squares for antioxidants in bread supplemented with fenugreek
leaves powder
Source df TPC Flavonoids DPPH
β-carotene &
Linoleic acid
assay
FRAP
Treatment 3 23442.4** 0.27722** 74.9957** 20.0000** 20420.5**
Error 8 110.3 0.01167 2.7506 2.0945 144.2
Total 11
**= Highly significant
Table 4.32 Antioxidants in bread supplemented with fenugreek leaves powder
Trt.
TPC
(mg GAE/
100g)
Flavonoids
(mg CE/g )
DPPH
(%)
β-carotene &
Linoleic acid
assay (%)
FRAP
(µmol Fe2+/g)
T0 99.00±4.45c 2.13±0.09c 31.00±1.27c 29.00±1.18c 167.00±7.51d
T1 198.00±9.10b 2.47±0.08b 37.00±1.59b 31.00±1.42bc 201.00±9.24c
T2 213.00±10.01b 2.65±0.11ab 39.00±1.71ab 33.00±1.45ab 254.00±11.93b
T3 315.00±15.43a 2.84±0.13a 43.00±1.97a 35.00±1.68a 356.00±17.08a
Values expressed are means ± standard deviation
T0 Wheat Flour (Control)
T1 5% fenugreek leaves powder supplemented wheat flour
T2 10% fenugreek leaves powder supplemented wheat flour
T3 15% fenugreek leaves powder supplemented wheat flour

100
Table 4.33 Mean squares for antioxidants in bread supplemented with fenugreek
seeds powder
SOV df TPC Flavonoids DPPH
β-carotene &
Linoleic acid
assay
FRAP
Treatment 3 55723.6** 0.32412** 244.040** 108.750** 48330.0**
Error 8 197.4 0.01112 3.976 3.143 290.7
Total 11
**= Highly significant
Table 4.34 Antioxidants in bread supplemented with fenugreek seeds powder
Trt.
TPC
(mg GAE/
100g)
Flavonoids
(mg CE/g )
DPPH
(%)
β-carotene &
Linoleic acid
assay (%)
FRAP
(µmol Fe2+/g)
T0 99.00±4.45d 2.13±0.19c 31.00±1.24c 29.00±1.30c 167.00±7.01c
T4 238.00±10.94c 2.50±0.10b 45.00±1.93b 37.00±1.70b 398.00±17.51b
T5 341.00±16.02b 2.68±0.10ab 49.00±2.20ab 40.00±1.88ab 401.00±18.44b
T6 413.00±19.82a 2.91±0.12a 51.00±2.39a 43.00±2.10a 450.00±21.60a
Values expressed are means ± standard deviation
T0 Wheat Flour (Control)
T4 5% fenugreek seeds powder supplemented wheat flour
T5 10% fenugreek seeds powder supplemented wheat flour
T6 15% fenugreek seeds powder supplemented wheat flour

101
Means regarding L* values of bread containing fenugreek leaves powder are presented in
Table (4.36). Progressive increase in leaves powder gave lower L* values; maximum
(87.96±0.13) was recorded in T0 (control), while minimum value of 43.01±0.08 was observed
in T3 (15% fenugreek leaves powder). Likewise, fenugreek seeds powder addition decreased
L* from 87.96±0.13 to 60.16±0.05 (Table 4.38).
Increasing the supplementation of fenugreek leaves powder resulted a marked decrease in a*
(Table 4.36) from 2.92±0.11 in T0 (control) to -3.00±0.03 in T3 (15% fenugreek leaves
powder). The bread with varying level of fenugreek seeds powder (Table 4.38) resulted in
progressive increase in a* from 2.92±0.11 in T0 (control) to 5.10±0.03 in T6 (15% fenugreek
seeds powder).
It is evident from results (Table 4.38) that b* values decreased as a function of fenugreek leaves
powder i.e. 22.26±0.04 in T0 (control) to 22.02±0.02 in T3 (15% fenugreek leaves powder). In
contrary, progressive increase in fenugreek seeds powder concentrations gave momentous
increase; minimum value of 22.26±0.04 was recorded in T0 (control), while maximum
(27.41±0.04) was recorded in T6 (Table 4.38).
Means depicting the effect of treatments on Chroma (Table 4.36) exhibited that maximum value
(27.88±0.03) was recorded in T3 (15% fenugreek leaves powder), while minimum value
(22.45±0.05) was observed in T0 (control). Likewise, treatments containing fenugreek seeds
powder indicated that additional concentrations gave progressive increase in Chroma values.
Maximum value of 26.00±0.08 was recorded in T6 (15% fenugreek seeds powder), while
minimum value of 22.45±0.05 was observed in T0 (Table 4.38).
It is depicted from Table (4.36) that increasing the concentration of fenugreek leaves powder
resulted in obvious decrease of Hue angle; maximum Hue angle (82.52±0.06) was observed in
T0 (control), while minimum value of -82.25±0.07 in T3 (15% fenugreek leaves powder). The
addition of fenugreek seeds powder decrease Hue angle from 82.52±0.02 in T0 (control) to
79.47±0.08 in treatment having 15% fenugreek seeds powder (Table 4.38).
From consumers point of view color is very important sensory attribute that act as first appeal
to make choice of a product. However, development of color also indicate the completion of
product production process like golden brown color development at the end of baking process.

102
The end product color of products like bakery products depends of physical-chemical
properties of the raw materials and working conditions applied during baking (Zanoni et al.,
1995). In the present study color changes with the addition of fenugreek leaves and seeds
powder were found to be significant. The increase in color tonality was certainly due to
presence of coloring pigments (Cheikh-Rouhou et al., 2008). Color tonality in paratha was
studied by Sudha et al. (2013) who observed with increasing levels of dried fenugreek leaves
in parathas from 5 to 15%, the lightness value decreased, and the parathas had increasing green
color, which is due to the high green coloration of normal fenugreek leaves. Findings of
Hussein et al. (2011) also supported the current findings who observed color of final product
is dependent upon the raw materials used that ultimately affect tonality values. L values of all
legume supplemented flour found declining trend with compared with control. In another study
the color of fenugreek-wheat supplemented biscuits getting darker, redder (a-values) and with
higher browning index (BI) as compared to control samples. Also the results of a-values
observed higher in fenugreek-wheat flour biscuit as compared to control. Similar results were
also reported when germinated fenugreek powder added in wheat flour for product
development (Eissa et al., 2007).
In another study of Srivastava (2012) who observed L-value decrease from 68.00 to 57.30 with
15% supplementation of fenugreek seeds husk in muffins. On the other hand (+b) value
increased from 17.63 to 23.00 for said product. The study of Jyotsna et al. (2011) also
strengthen our results who experienced higher “b” values in vermicelli prepared with
fenugreek-wheat supplemented flour that could be due to the presence of carotene content in
fenugreek seeds.
4.14 Texture of bread
4.14.1 Texture profile of bread supplemented with leaves powder
It is evident from mean squares in Table 4.39 regarding texture of bread supplemented with
leaves powder that non-significant variations were observed for the effect of treatments on all
textural parameters like hardness, gumminess, cohesiveness, elasticity, chewiness and
springiness. The mean values of textural parameters like hardness, gumminess, cohesiveness,
springiness, chewiness and elasticity are presented in Table 4.40.

103
Table 4.35 Mean squares for color of bread supplemented with fenugreek leaves
powder
SOV Df L* value a* value b* value Chroma Hue angle
Treatment 3 1329.61** 24.0764** 9.69105** 21.9979** 20669.7**
Error 8 0.10 0.0035 0.00259 0.0023 0.01987
Total 11
**= Highly significant
Table 4.36 Mean values for color of bread supplemented with fenugreek leaves
powder
Trt. L* value a* value b* value Chroma Hue angle
T0 87.96±0.13a 2.92±0.11a 22.26±0.04c 22.45±0.05c 82.52±0.02a
T1 49.61±0.61b -2.01±0.02b 25.92±0.08a 23.40±0.04c -85.56±0.04c
T2 45.99±0.08c -2.99±0.01c 22.99±0.03b 26.02±0.04b -82.59±0.09b
T3 43.01±0.08d -3.00±0.03c 22.02±0.02d 27.88±0.03a -82.25±0.07b
Values expressed are means ± standard deviation
T0 Wheat Flour (Control)
T1 5% fenugreek leaves powder supplemented wheat flour
T2 10% fenugreek leaves powder supplemented wheat flour
T3 15% fenugreek leaves powder supplemented wheat flour

104
Table 4.37 Mean squares for color of bread supplemented with fenugreek seeds
powder
SOV df L* value a* value b* value Chroma Hue angle
Treatment 3 454.732** 2.73505** 20.4063** 9.07592** 6.52997**
Error 8 0.006 0.00428 0.0020 0.00300 0.02433
Total 11
**= Highly significant
Table 4.38 Mean values for color of bread supplemented with fenugreek seeds powder
Trt. L* value a* value b* value Chroma Hue angle
T0 87.96±0.13a 2.92±0.11d 22.26±0.04c 22.45±0.05d 82.52±0.02a
T4 68.00±0.03b 4.01±0.04c 22.08±0.04d 22.71±0.02c 79.70±0.11b
T5 64.40±0.05c 4.72±0.03b 25.59±0.04b 23.18±0.03b 79.56±0.06b
T6 60.16±0.05d 5.10±0.03a 27.41±0.04a 26.00±0.08a 79.47±0.08b
Values expressed are means ± standard deviation
T0 Wheat Flour (Control)
T4 5% fenugreek seeds powder supplemented wheat flour
T5 10% fenugreek seeds powder supplemented wheat flour
T6 15% fenugreek seeds powder supplemented wheat flour

105
It is evident from results that hardness of the bread increased non-significantly among
treatments from T0 to T3 with increasing the supplementation of fenugreek leaves powder. The
highest value of hardness was observed in T3 (3.63±0.05) while lowest was found in T0
(3.51±0.03). While treatments T1 and T2 having values 3.56±0.04 and 3.59±0.06, respectively.
As for as cohesiveness is concerned the mean Table 4.40 exhibited that cohesiveness of the
bread supplemented with leaves powder increased non-significantly in different treatments.
The highest value of cohesiveness was found in T3 (0.95±0.02) followed by T2 (0.93±0.05), T1
(0.92±0.03) and T0 (0.91±0.04).
Mean values for gumminess of bread supplemented with fenugreek leaves powder given in
Table 4.40 showed non-significant increasing trend. Highest value of gumminess was observed
in T3 (3.24±0.03) while lowest in T0 (3.19±0.03) that shows gumminess increased with
increasing percentage of fenugreek leaves powder in bread.
Springiness of fenugreek leaves powder supplemented bread increased down the treatments
from T0 to T3 as presented in Table 4.40. The mean value ranged between 0.98±0.03 (T0) to
1.05±0.01 (T3) and results exhibited that springiness increased non-significantly with the
addition fenugreek leaves powder.
Mean values for chewiness of bread supplemented with fenugreek leaves powder are available
in Table 4.40. It is obvious from the results that chewiness increased non-significantly among
treatments by the incorporation of fenugreek leaves powder. The lowest value for chewiness
was found in T0 (3.13±0.03) while highest in T3 (3.18±0.02). However, T1 and T2 showed
values 3.15±0.01 and 3.17±0.01, respectively.
The mean values regarding bread elasticity given in Table 4.40 indicated that the bread from
15% fenugreek leaves powder (T3) addition got the highest values (92.19±1.12) and elasticity
decreased as the supplementation level decreased. The mean value ranged from 89.79±1.00
(T0) to 92.19±1.12 (T3) described non-significant difference for elasticity among different
bread.
4.14.2 Texture profile of bread supplemented with seeds powder
The mean squares for the texture profile of bread supplemented with seeds powder have been
given in Table 4.41. The data exhibited non-significant behavior in treatment for all parameters
like hardness, cohesiveness, elasticity, gumminess, chewiness and springiness of bread.
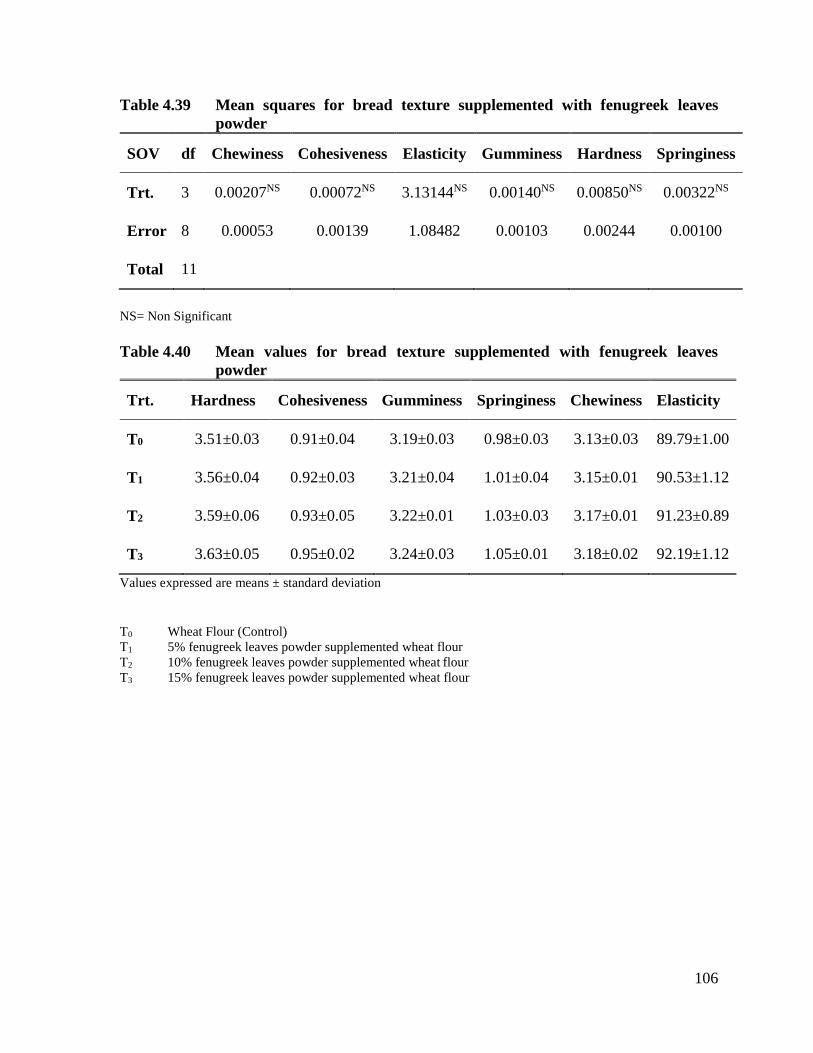
106
Table 4.39 Mean squares for bread texture supplemented with fenugreek leaves
powder
SOV df Chewiness Cohesiveness Elasticity Gumminess Hardness Springiness
Trt. 3 0.00207NS 0.00072NS 3.13144NS 0.00140NS 0.00850NS 0.00322NS
Error 8 0.00053 0.00139 1.08482 0.00103 0.00244 0.00100
Total 11
NS= Non Significant
Table 4.40 Mean values for bread texture supplemented with fenugreek leaves
powder
Trt. Hardness Cohesiveness Gumminess Springiness Chewiness Elasticity
T0 3.51±0.03 0.91±0.04 3.19±0.03 0.98±0.03 3.13±0.03 89.79±1.00
T1 3.56±0.04 0.92±0.03 3.21±0.04 1.01±0.04 3.15±0.01 90.53±1.12
T2 3.59±0.06 0.93±0.05 3.22±0.01 1.03±0.03 3.17±0.01 91.23±0.89
T3 3.63±0.05 0.95±0.02 3.24±0.03 1.05±0.01 3.18±0.02 92.19±1.12
Values expressed are means ± standard deviation
T0 Wheat Flour (Control)
T1 5% fenugreek leaves powder supplemented wheat flour
T2 10% fenugreek leaves powder supplemented wheat flour
T3 15% fenugreek leaves powder supplemented wheat flour

107
Table 4.41 Mean squares for bread texture supplemented with fenugreek seeds
powder
SOV df Chewiness Cohesiveness Elasticity Gumminess Hardness Springiness
Trt. 3 0.00643NS 0.00083NS 8.41461NS 0.00122NS 0.00260NS 0.00126NS
Error 8 0.00133 0.00101 3.13486 0.00093 0.00212 0.00169
Total 11
NS= Non Significant
Table 4.42 Mean values for bread texture supplemented with fenugreek seeds powder
Trt. Hardness Cohesiveness Gumminess Springiness Chewiness Elasticity
T0 3.51±0.03 0.91±0.04 3.19±0.03 0.98±0.03 3.13±0.03 89.79±1.00
T4 3.53±0.04 0.92±0.02 3.21±0.02 0.98±0.03 3.15±0.04 90.25±1.11
T5 3.55±0.05 0.93±0.03 3.23±0.03 1.00±0.03 3.19±0.03 91.41±2.52
T6 3.58±0.05 0.95±0.02 3.24±0.03 1.02±0.05 3.23±0.03 93.54±1.98
Values expressed are means ± standard deviation
T0 Wheat Flour (Control)
T4 5% fenugreek seeds powder supplemented wheat flour
T5 10% fenugreek seeds powder supplemented wheat flour
T6 15% fenugreek seeds powder supplemented wheat flour
108
It is depicted that all textural parameters didn’t vary by the addition of seeds powder up to 15%
level. Mean values concerning bread hardness given in Table 4.42 exhibited that maximum
hardness was observed in T6 (3.58±0.05) followed by T5 (3.55±0.05), T4 (3.53±0.04) and T0
(3.51±0.03). It is also apparent from the findings that prepared bread possessed non-significant
differences for this trait.
The mean values for cohesiveness of bread portrayed in Table 4.42 illustrated that bread from
15% fenugreek seeds powder supplementation got the highest values for cohesiveness
(0.95±0.02). As we decrease the percentage of supplementation the value decreased, so
minimum cohesiveness value found in T0 (0.91±0.04). Dough cohesiveness is the property of
being cohesive and sticky holding particles in a homogeneous body together. If cohesiveness
is more, stickier the dough will be and hardness tendency will be more if cohesiveness
decreased.
Data regarding the means for gumminess of bread prepared with supplementation of fenugreek
seeds powder has been given in Table 4.42. The values ranged between 3.19±0.03 (T0) to
3.24±0.02 (T6) exhibited that gumminess of bread increased non-significantly with the addition
of fenugreek seeds powder.
The mean values (Table 4.42) for springiness of bread described increasing trend with various
levels of supplementation with fenugreek seeds powder. The maximum springiness was
observed in T6 (1.02±0.05) followed by T5 (1.00±0.03), T4 (0.98±0.03) whereas minimum was
observed in T0 (0.98±0.03).
Mean values of chewiness of bread prepared with supplementation of fenugreek seeds powder
given in Table 4.42. Results presented a non-significant increasing trend with increasing
percentage of supplementation, so maximum value was found in T6 (3.23±0.03). The values
found by the other treatments are T5 (3.19±0.03), T4 (3.15±0.04) and T0 (3.13±0.03).
The values regarding the means of elasticity of bread has been presented in Table 4.42 which
depicts that this trait of bread increased with increasing the percentage of fenugreek seeds
powder. The minimum value of elasticity has been observed against T0 and highest against T6
which was 89.79±1.00 and 93.54±1.98, respectively.
The gluten content of wheat flour play an important role for quality of baked products. It also
influence flour water absorption, viscosity, cohesion, elasticity, tolerance to kneading,
109
extensibility, ability to gas retention, resistance to deformation and dough strengthening
properties (Lazaridou et al., 2007; Wieser, 2007). In a study, texture of methi paratha before
and after radiation processing was determined using a texture analyzer. Parameters like
hardness and puncture force were determined. The shear force as measured using texture
analyzer significantly decreased from 829g for control to 520 and 497g force on addition of
increasing levels of dried fenugreek leaves. Lowering in shear force showed improvement in
the paratha quality, this indicates that addition of leaves in dehydrated form made the paratha
slightly harder (Indrani et al., 2011). The reduction in shear force may be due to the presence
of dietary fiber coming from leaves, thereby diluting the gluten protein which makes the
product more extensible and chewy. Addition of leaves in dehydrated form also had acceptable
quality (Sudha et al., 2013). Wheat flour was supplemented with legume flour (pigeon pea and
chick pea) @ 10 to 20% to prepared flat bread and then observe nutritive value, textural
attributes, and sensory acceptability of the product. The bread was found with low moisture
content and hard texture when compared with control bread (Sharma et al., 1995).
The harder texture was found in bread when prepared with supplementation of cassava flour as
compared to wheat flour bread. The findings are also in harmony with studies of Abdelghafor et
al. (2011) and Phattanakulkaewmorie et al. (2011) who observed with supplementation of
sorghum flour in bread resulted in harder texture. The hard texture of bread depend on moisture,
moisture migration and redistribution of moisture (Osella et al., 2005) and gluten-starch
interactions (Every et al., 1998). After baking of bread when it gets cool, starch retrogrades and
gel within inter granular spaces, provide rigidity that leads to bread hardness (Zobel and Kulp,
1996). Contrast finding was observed by Anton et al. (2008) who reported firmness and
cohesiveness of wheat bean composite tortillas decreased with increased substitution with bean
flour.
There was no statistically significant difference in color, firmness, texture and flavor intensity
between the fenugreek and wheat bread (Losso et al., 2009). Similarly, Shakib and Gabrial
(2010) evaluated different bread formulations containing wheat, barley and fenugreek. Two
type of fenugreek flour replacements was done i.e. 5% and 2.5% in basic bread recipe and
tested for their overall acceptability by a panel of 20 judges. Sensory evaluation of fenugreek
bread with 5% and 2.5% formulations showed good acceptability level for color (2.0±0.26 and
110
2.5±0.23), breakability (2.7±0.15 and 3.0±0.18), taste (2.4± 0.32 and 2.6±0.1) and chewability
(2.2±0.12 and 2.4±0.21).
4.15 Sensory Evaluation of bread
Bread can be defined as a fermented confectionary product prepared with mixture of
ingredients like wheat flour, sugar, water, salt and yeast passes through a production process
involving mixing, kneading, proofing, shaping and baking (Dewettinck et al., 2008). Bread is
an excellent source of numerous vitamins and minerals especially phosphorus and copper but
still it consider as nutritionally poor because wheat protein i.e. main ingredient is deficient in
some essential amino acids (Wrigley et al., 1988). Composite flour not only improve the
nutritional status of bread but also comply the need of vegetarian consumers who want to fulfill
their protein requirement from plant sources (Chen, 2009).
The sensory attributes of the product plays very important role in acceptability of the product
by consumers. The sensory evaluation of bread under study was carried out by experienced
panelist who provide valuable feedback from consumer point of view. The supplementation of
fenugreek leaves and seeds powder in different treatments resulted in change of sensory
characteristics of the bread.
4.15.1 Volume of bread
The analysis of variance showed that the fenugreek leaves powder supplementation had
significant effect on the volume of bread. The interaction of treatments and storage time did
not significantly influence the volume of the bread as compared to control (Table 4.43). The
mean score for bread volume prepared from different treatments varied from 6.19±0.46 (T3) to
7.13±0.21 (T0) that shows it was negatively related to the quantity of leaves powder added
which is depicted by the higher value (7.13±0.21) for volume of control and progressively
decreasing volume in the treatments. The time of storage also negatively influenced the volume
of the bread reduced and all treatments showed slightly reduction in the volume during storage
(Table 4.45).
It was statistically depicted that the addition of fenugreek seeds powder in bread and storage
time had significant effect on the volume of bread. The score for volume ranged from
6.55±0.07 to 7.13±0.10 for treatment and 6.49±0.07 to 7.22±0.07 for storage time as shown in

111
Table 4.46. The interaction of treatment and storage time also had significant effect on the
volume of bread which shows that the combination of these factors has to be taken into account
while considering volume of the bread prepared from addition of fenugreek seeds powder
(Table 4.44).
Bread volume has equal importance as that of crust color and softness because large volume
of bread looks bigger and attracts the consumers. The volume of bread can be achieved as
desired but its shrinkage always proved to be a problem and its retention greatly depends upon
bread texture quality. Fine cells of equal size during fermentation and proofing found to have
good texture, which ultimately affects the softness and volume. Studies has proved that volume
of bread is affected with the quality and quantity of flour protein as well as other factors like
time for proofing, baking time and baking temperature. Thus, protein has played major role in
quality of bread, so supplementation of wheat flour with legume flour certainly affects the end
product characteristics due to dilution in gluten protein (Sliwinski et al., 2004).
The supplementation of legume flours like chickpea and lentil affect the qualitative parameters
of baked products like bread volume. The other bakery product like pastries volume decreased
mainly due to decrease in the amount of gluten caused by the addition of materials from which
it is not possible to isolate gluten. By lowering the amount of gluten, the ability to keep ferment
gas during the rising of dough is also lowered and consequently it influences the lower volume
and lower porosity of pastries (Bojnanska et al., 2010). The results of another study also in
harmony with our findings that volume of the bread decreased as the level of legume flour
increased due to the dilution of the gluten structure by added protein (Hefnawy et al., 2012).
Significant difference regarding bread volume was also observed in fenugreek-wheat flour
supplemented bread. This might be due to physiochemical properties of the fenugreek protein
which present in the seeds (Rasool et al., 2013).
4.15.2 Aroma of bread
Aroma of bread prepared with fenugreek leaves powder supplemented flour was significantly
affected by both the quantity of leaves powder (treatment) and storage time (Table 4.43). The
mean values (Table 4.47) for aroma of bread among different treatments ranged between
6.10±0.10 to 6.96±0.06 and during storage period found in the range of 6.31±0.09 to
112
6.95±0.12. The values revealed that aroma was negatively influenced by increasing percentage
of the fenugreek leaves powder as well as the storage time. The combination of fenugreek
leaves powder addition and storage time did not bring about significant change in aroma of
bread.
The analysis of variance showed that the addition of fenugreek seeds powder and storage time
exhibited highly significant influence on the aroma of bread (Table 4.44). The mean score for
aroma of bread prepared by addition of fenugreek seeds powder was noted from 6.67±0.14 to
6.96±0.12 which shows the increase in amount of fenugreek seeds powder added is inversely
proportional to the aroma of bread. During storage of bread mean scores varied from 6.53±0.15
to 7.12±0.17 that shows decreasing trend with the passage of time (Table 4.48).
The combination of treatment and storage had no significant influence on the aroma of bread
and depicts that the treatment and storage independently influenced the aroma and their
combined effect was not noticeable (Table 4.44).
Aroma is an important sensory characteristic that plays an important role in creating consumer
appeal for a product. In an earlier study aroma of bread was non-significantly differed with
fenugreek seeds powder supplementation when compared with control bread. When fenugreek
was added in wheat flour it modified the sensory attributes like taste and mouth feel of the
product. There was a decreasing trend for odor and taste, probably due to fenugreek flavor
(Hooda and Jood, 2004).
The desirable aroma of fenugreek seeds came from polysaccharides (galactomannan), volatile
oils and alkaloids, such as choline and trigonelline, that is why the addition of 1% of fenugreek
seeds was more desirable to add in such cases (Rasool et al., 2013). Our findings are in support
of Kasaye and Jha (2015) who observed aroma of bread found score 4.46 with supplementation
of 15% fenugreek flour while 7.80 in control. The aroma of fenugreek flour supplemented
bread samples scored maximum 7.87 in 5:95 (bread with 5% fenugreek flour) followed by
10:90 (7.53) and lowest (5.00) being for 15:85 blend and 7.76 in the control bread.
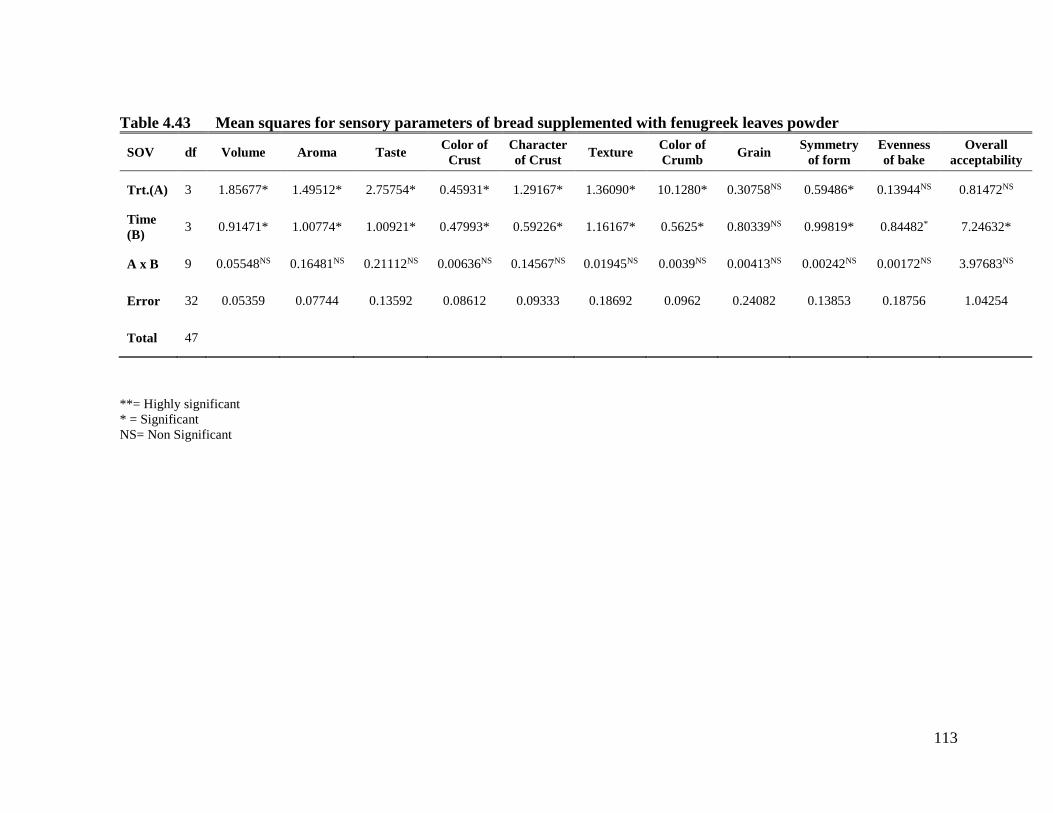
113
Table 4.43 Mean squares for sensory parameters of bread supplemented with fenugreek leaves powder
SOV df Volume Aroma Taste Color of
Crust
Character
of Crust Texture
Color of
Crumb Grain
Symmetry
of form
Evenness
of bake
Overall
acceptability
Trt.(A) 3 1.85677* 1.49512* 2.75754* 0.45931* 1.29167* 1.36090* 10.1280* 0.30758NS 0.59486* 0.13944NS 0.81472NS
Time
(B) 3 0.91471* 1.00774* 1.00921* 0.47993* 0.59226* 1.16167* 0.5625* 0.80339NS 0.99819* 0.84482* 7.24632*
A x B 9 0.05548NS 0.16481NS 0.21112NS 0.00636NS 0.14567NS 0.01945NS 0.0039NS 0.00413NS 0.00242NS 0.00172NS 3.97683NS
Error 32 0.05359 0.07744 0.13592 0.08612 0.09333 0.18692 0.0962 0.24082 0.13853 0.18756 1.04254
Total 47
**= Highly significant
* = Significant
NS= Non Significant

114
Table 4.44 Mean squares for sensory parameters of bread supplemented with fenugreek seeds powder
SOV df Volume Aroma Taste Color of
Crust
Character
of Crust Texture
Color of
Crumb Grain
Symmetry
of form
Evenness
of bake
Overall
acceptability
Trt.(A) 3 0.79018* 0.19015 * 0.89237* 0.15695* 0.55982NS 0.45301* 1.02104* 0.09807NS 0.41142* 0.02221NS 2.20278NS
Time
(B) 3 1.21454* 0.86651* 1.30672* 0.49088* 0.85042* 0.86358* 0.81557* 0.91824NS 1.09509* 0.88959* 7.24632*
A x B 9 0.17625NS 0.00183NS 0.00389NS 0.00535NS 0.17721NS 0.00676NS 0.00132NS 0.00111NS 0.00251NS 0.00084NS 3.99425NS
Error 32 0.05084 0.03918 0.12012 0.02296 0.31712 0.02570 0.09586 0.20247 0.14734 0.12775 1.04264
Total 47
**= Highly significant
NS= Non Significant
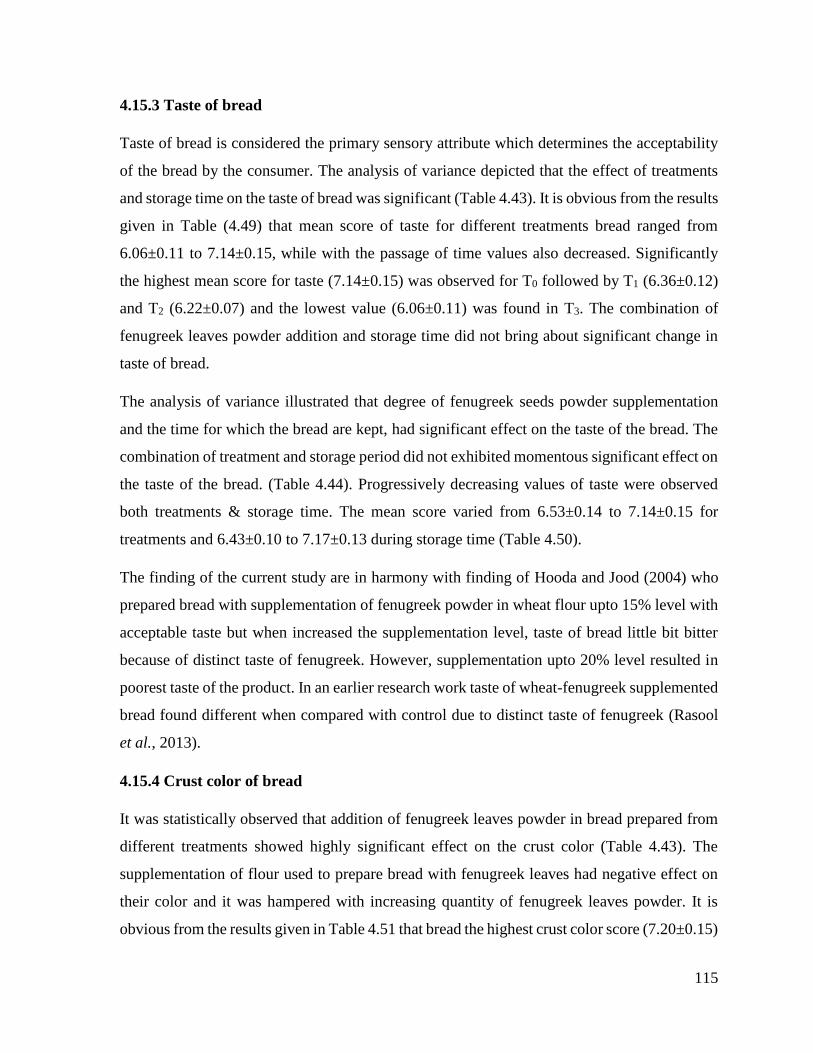
115
4.15.3 Taste of bread
Taste of bread is considered the primary sensory attribute which determines the acceptability
of the bread by the consumer. The analysis of variance depicted that the effect of treatments
and storage time on the taste of bread was significant (Table 4.43). It is obvious from the results
given in Table (4.49) that mean score of taste for different treatments bread ranged from
6.06±0.11 to 7.14±0.15, while with the passage of time values also decreased. Significantly
the highest mean score for taste (7.14±0.15) was observed for T0 followed by T1 (6.36±0.12)
and T2 (6.22±0.07) and the lowest value (6.06±0.11) was found in T3. The combination of
fenugreek leaves powder addition and storage time did not bring about significant change in
taste of bread.
The analysis of variance illustrated that degree of fenugreek seeds powder supplementation
and the time for which the bread are kept, had significant effect on the taste of the bread. The
combination of treatment and storage period did not exhibited momentous significant effect on
the taste of the bread. (Table 4.44). Progressively decreasing values of taste were observed
both treatments & storage time. The mean score varied from 6.53±0.14 to 7.14±0.15 for
treatments and 6.43±0.10 to 7.17±0.13 during storage time (Table 4.50).
The finding of the current study are in harmony with finding of Hooda and Jood (2004) who
prepared bread with supplementation of fenugreek powder in wheat flour upto 15% level with
acceptable taste but when increased the supplementation level, taste of bread little bit bitter
because of distinct taste of fenugreek. However, supplementation upto 20% level resulted in
poorest taste of the product. In an earlier research work taste of wheat-fenugreek supplemented
bread found different when compared with control due to distinct taste of fenugreek (Rasool
et al., 2013).
4.15.4 Crust color of bread
It was statistically observed that addition of fenugreek leaves powder in bread prepared from
different treatments showed highly significant effect on the crust color (Table 4.43). The
supplementation of flour used to prepare bread with fenugreek leaves had negative effect on
their color and it was hampered with increasing quantity of fenugreek leaves powder. It is
obvious from the results given in Table 4.51 that bread the highest crust color score (7.20±0.15)

116
Table 4.45 Effect of treatments and storage on volume of bread supplemented with
fenugreek leaves powder
Treatments
Time (Hours)
0 24 48 72 Mean
T0 7.39±0.04 7.21±0.13 7.02±0.16 6.90±0.12 7.13±0.21a
T1 7.06±o.22 6.92±0.27 6.72±0.24 6.55±0.32 6.81±0.22b
T2 6.99±0.20 6.81±0.30 6.61±0.28 6.47±0.31 6.72±0.22b
T3 6.85±0.13 6.13±0.22 5.94±0.32 5.82±0.24 6.19±0.46c
Mean 7.07±0.23a 6.77±0.46ab 6.57±0.45bc 6.44±0.44c
Values expressed are means ± standard deviation
Table 4.46 Effect of treatments and storage on volume of bread supplemented with
fenugreek seeds powder
Treatments
Time (Hours)
0 24 48 72 Mean
T0 7.39±0.06 7.21±0.13 7.02±0.11 6.90±0.08 7.13±0.10a
T4 7.29±0.04 7.14±0.08 6.95±0.05 6.78±0.12 7.04±0.08a
T5 7.19±0.12 7.06±0.10 6.86±0.07 6.68±0.10 6.95±0.09a
T6 7.02±0.09 6.86±0.14 6.74±0.09 5.57±0.04 6.55±0.07b
Mean 7.22±0.07a 7.07±0.12ab 6.89±0.08bc 6.49±0.07c
Values expressed are means ± standard deviation
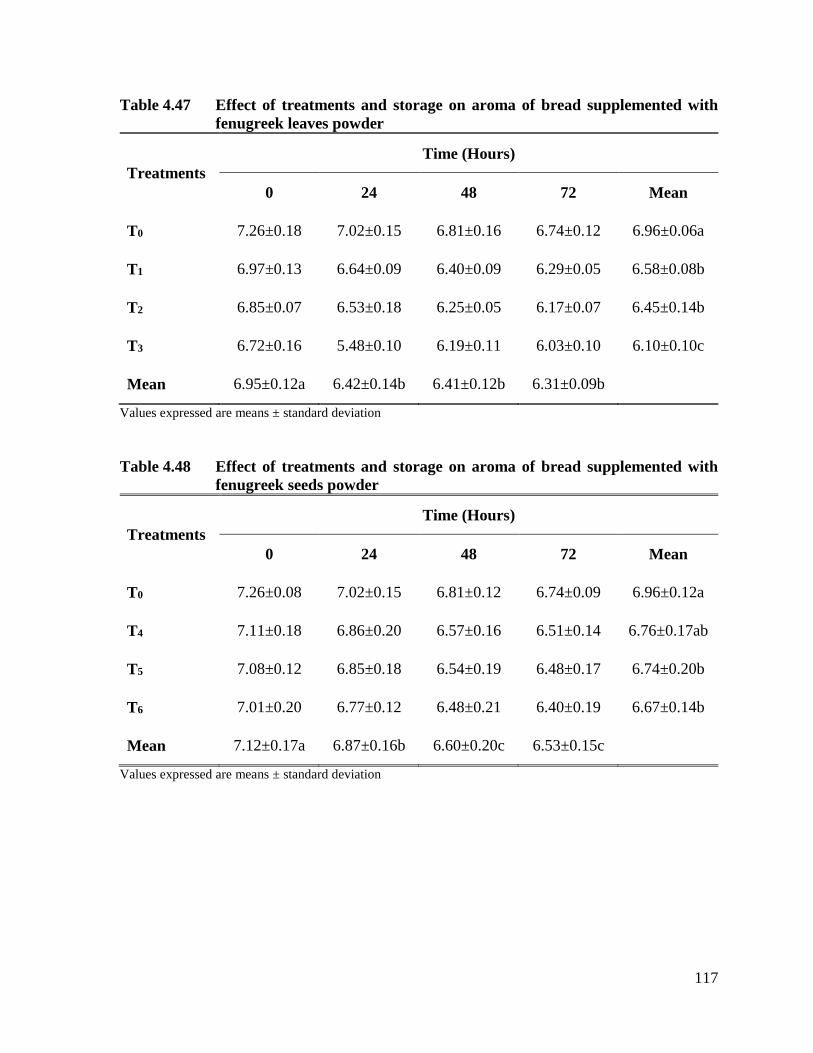
117
Table 4.47 Effect of treatments and storage on aroma of bread supplemented with
fenugreek leaves powder
Treatments
Time (Hours)
0 24 48 72 Mean
T0 7.26±0.18 7.02±0.15 6.81±0.16 6.74±0.12 6.96±0.06a
T1 6.97±0.13 6.64±0.09 6.40±0.09 6.29±0.05 6.58±0.08b
T2 6.85±0.07 6.53±0.18 6.25±0.05 6.17±0.07 6.45±0.14b
T3 6.72±0.16 5.48±0.10 6.19±0.11 6.03±0.10 6.10±0.10c
Mean 6.95±0.12a 6.42±0.14b 6.41±0.12b 6.31±0.09b
Values expressed are means ± standard deviation
Table 4.48 Effect of treatments and storage on aroma of bread supplemented with
fenugreek seeds powder
Treatments
Time (Hours)
0 24 48 72 Mean
T0 7.26±0.08 7.02±0.15 6.81±0.12 6.74±0.09 6.96±0.12a
T4 7.11±0.18 6.86±0.20 6.57±0.16 6.51±0.14 6.76±0.17ab
T5 7.08±0.12 6.85±0.18 6.54±0.19 6.48±0.17 6.74±0.20b
T6 7.01±0.20 6.77±0.12 6.48±0.21 6.40±0.19 6.67±0.14b
Mean 7.12±0.17a 6.87±0.16b 6.60±0.20c 6.53±0.15c
Values expressed are means ± standard deviation

118
was observed for T0 followed by T1 (6.10±0.17), T2 (5.28±0.20) and T3 (4.91±0.19). It is also
evident from results that the crust color score varied from 5.68±0.96 to 6.10±1.07 during
storage period. This attribute was also negatively associated with increasing duration of storage
and all treatments showed significant deterioration in the color of the bread crust. The
interaction of treatments and storage time did not significantly influence the crust control of
the bread as compared to control.
Color of bread is instrumental in determining the quality of bread. Mean squares depicted that
supplementation of fenugreek seeds powder and storage time had significant effect on the crust
color of bread (Table 4.44). The mean score for crust color of bread showed decreasing trends
with increasing quantity of fenugreek seeds powder & storage time and had values between
6.78±0.13 to 7.20±0.10 & 6.81±0.15 to 7.27±0.09 (Table 4.52). The interaction of the two
variables showed non-significant results and depicted no strong linkage between coexistence
of treatment and storage time with the crust color of bread (Table 4.44).
Color is an important criterion from consumer point of view for acceptability of the baked
product. Moreover, the color development occurs during later stage of baking and its indication
for completion of the baking process. Color of the baked product depends on physicochemical
properties of the dough (pH, water content, amino acid content and reducing sugars) and
processing conditions applied during baking process (relative humidity, temperature, air speed,
modes of heat transfer (Zanoni et al., 1995). When supplementation of fenugreek flour
increased in wheat flour, the color of bread crust changed to dull brown in seeds flour
supplemented bread and greenish in leaves supplemented flour. Similar findings were observed
when supplementation of wheat flour upto 15% with fenugreek powder was carried out
resulted in dark brown curst color (Chauhan and Sharma, 2000). In another study the crust
color scores for bread prepared with addition of raw, soaked and germinated fenugreek flour
were 5.66, 5.50 & 5.37 and 7.15 score found by control bread. The darker color was observed
in bread supplemented with germinated fenugreek flour and lighter color in raw and soaked
fenugreek flours supplemented bread (Hooda and Jood, 2004). It can be concluded that the
increased in protein content due to fenugreek seeds flour supplementation and green color of
fenugreek leaves probably the reason of dark crust color.

119
4.15.5 Character of bread crust
Analysis of variance depicted that the effects of both fenugreek leaves powder addition and
storage on character of crust of bread were highly significant. The interaction of treatment and
storage did not significantly impact the character of crust (Table 4.43). The mean score for this
trait in different treatments ranged from 6.71±0.13 to 7.43±0.14 (Table 4.53). Significantly the
highest score (7.43±0.14) was observed for control (T0) followed by T1 (6.85±0.10), T2
(6.78±0.07) and T3 (6.71±0.13). It is also evident from results that the score for character of
crust varied from 6.63±0.10 to 7.15±0.07 during storage period that exhibit decreasing trend
with increasing the supplementation level of fenugreek leaves powder.
It was statistically observed that the addition of fenugreek seeds powder and interaction of
these variables did not have significant effect on the character of crust (Table 4.44), while time
period as significant effect on this trait. It had uniform value with non-significant difference
among each other (Table 4.54).
4.15.6 Texture of bread
It was observed from the statistical analysis that the effect of fenugreek leaves powder
supplementation and storage time was significant. The crust texture of bread was decreased
momentously with increasing the supplementation level of fenugreek leaves powder as well as
the storage time. The interaction of treatment and time didn’t has considerable effect on the
texture as depicted by (Table 4.43). The maximum mean score of 6.97±0.12 was noticed in
(T0) while in other treatments it was 6.39±0.12 (T1), 6.31±0.07 (T2) and 6.22±0.13 (T3). The
mean score for texture was 6.16±0.14 to 6.85±0.08 during storage study of the prepared bread
(Table 4.55).
The analysis of variance showed that the addition of fenugreek seeds powder and storage time
exhibited significant influence on the texture of bread (Table 4.44). The mean score for texture
of breads prepared by addition of fenugreek seeds powder was noted from 6.51±0.13 to
6.97±0.12 which shows the increase in amount of fenugreek seeds powder added is inversely
proportional to the texture score of bread. During storage study of bread the score with
decreasing trend from 7.05±0.11 to 6.44±0.12 (Table 4.56). The combination of treatment and
storage had no significant influence on the texture of bread and depicts that the treatment and

120
Table 4.49 Effect of treatments and storage on taste of bread supplemented with
fenugreek leaves powder
Treatments
Time (Hours)
0 24 48 72 Mean
T0 7.62±0.06 7.23±0.13 6.90±0.21 6.80±0.18 7.14±0.15a
T1 6.72±0.10 6.46±0.16 6.19±0.15 6.05±0.10 6.36±0.12b
T2 6.60±0.08 6.31±0.09 6.07±0.13 5.92±0.06 6.22±0.07bc
T3 6.15±0.12 5.92±0.07 6.65±0.16 5.50±0.14 6.06±0.11c
Mean 6.77±0.09a 6.48±0.12b 6.45±0.17b 6.07±0.12c
Values expressed are means ± standard deviation
Table 4.50 Effect of treatments and storage on taste of bread supplemented with
fenugreek seeds powder
Treatments
Time (Hours)
0 24 48 72 Mean
T0 7.62±0.06 7.23±0.15 6.90±0.15 6.80±0.13 7.14±0.15a
T4 7.12±0.12 6.82±0.13 6.52±0.08 6.38±0.07 6.71±0.10b
T5 7.02±0.08 6.67±0.10 6.40±0.05 6.30±0.16 6.60±0.15b
T6 6.91±0.15 6.62±0.16 6.36±0.13 6.24±0.11 6.53±0.14b
Mean 7.17±0.13a 6.84±0.14ab 6.54±0.12bc 6.43±0.10c
Values expressed are means ± standard deviation

121
Table 4.51 Effect of treatments and storage on crust color of bread supplemented with
fenugreek leaves powder
Treatments
Time (Hours)
0 24 48 72 Mean
T0 7.52±0.03 7.28±0.16 7.06±0.14 6.92±0.20 7.20±0.15a
T1 6.32±0.20 6.12±0.16 6.05±0.23 5.91±0.15 6.10±0.17ab
T2 5.47±0.16 5.29±0.23 5.24±0.21 5.11±0.24 5.28±0.20b
T3 5.09±0.20 4.93±0.21 4.88±0.19 4.76±0.20 4.91±0.19b
Mean 6.10±1.07a 5.90±1.04ab 5.81±0.98ab 5.68±0.96b
Values expressed are means ± standard deviation
Table 4.52 Effect of treatments and storage on crust color of bread supplemented with
fenugreek seeds powder
Treatments
Time (Hours)
0 24 48 72 Mean
T0 7.52±0.03 7.28±0.16 7.06±0.14 6.92±0.12 7.20±0.10a
T4 7.32±0.10 7.13±0.09 6.96±0.09 6.88±0.15 7.07±0.12ab
T5 7.23±0.12 7.07±0.13 7.00±0.07 6.83±0.17 7.03±0.15b
T6 7.01±0.15 6.81±0.15 6.66±0.12 6.62±0.14 6.78±0.13b
Mean 7.27±0.09a 7.07±0.12ab 6.92±0.10ab 6.81±0.15b
Values expressed are means ± standard deviation

122
storage independently influenced the texture and their combined effect was not noticeable
(Table 4.44).
The baking conditions (temperature and time variables); the state of the bread components,
such as fibers, starch, protein (gluten) weather damaged or undamaged and the amount of
absorbed water during dough mixing, all contribute to the final texture of the bread (Serrem et
al., 2011). The bread characteristics like texture, crust color, thickness, and crumb color were
affected with fenugreek flour. However, there was no significant differences between control
sample and the sample supplemented with 5% fenugreek flour as regard to the sensory
attributes (Sulieman et al., 2000). There was decreasing trend observed in bread crust color
with supplementation of wheat flour with fenugreek powder. The color score of 4.87 was
observed with 20% supplementation of raw fenugreek powder while score of 4.71 and 4.60
was noticed with 20% supplementation level of soaked and germinated fenugreek seeds
powder (Hooda and Jood, 2004).
The replacement of fenugreek gum with wheat flour @ 0, 5 and 10% (w/w) was carried out to
measure the bread production features of the flour. Bread comprising fenugreek gum @ 5 and
10% presented texture and volume similar to control treatment of bread (Roberts et al., 2012).
Texture and overall acceptability of bread samples made from blends of fenugreek-wheat @
5:95 and 10:90 are within acceptable limits. No significant differences were noticed with
respect to control bread samples (Kasaye and Jha, 2015).
4.15.7 Crumb color for bread
Crumb color is one of the most important characters determining the consumer acceptability
of the bread. The scientific evaluation determined that addition of fenugreek leaves powder
and storage time both had significant effect on crumb color of bread (Table 4.43). The
combination of fenugreek leaves powder addition and storage time did not bring about
significant change in crumb color of bread. It is apparent from the results that bread prepared
from 100% wheat flour had highest score (7.09±0.09) followed by bread prepared from 95%
wheat flour (WF) and 5% fenugreek leaves powder (6.08±0.06). The lowest score (5.07±0.09)
given by panelist to bread prepared with supplementation of 15% fenugreek leaves powder
(Table 4.57). During storage study the score for this trait ranged from 5.66±0.05 to 6.14±0.06
and color becomes darker with increasing the supplementation of fenugreek leaves powder.

123
Table 4.53 Effect of treatments and storage on character of bread crust supplemented
with fenugreek leaves powder
Treatments
Time (Hours)
0 24 48 72 Mean
T0 7.52±0.06 7.34±0/18 7.98±0.17 6.87±0.11 7.43±0.14a
T1 7.12±0.07 6.92±0.08 6.74±0.12 6.62±0.15 6.85±0.10b
T2 7.00±0.06 6.85±0.10 6.69±0.08 6.57±0.07 6.78±0.07b
T3 6.96±0.09 6.81±0.14 6.63±0.16 6.45±0.14 6.71±0.13b
Mean 7.15±0.07a 6.98±0.13a 7.01±0.12a 6.63±0.10b
Values expressed are means ± standard deviation
Table 4.54 Effect of treatments and storage on character of bread crust supplemented
with fenugreek seeds powder
Treatments
Time (Hours)
0 24 48 72 Mean
T0 7.52±0.06 7.34±0.10 7.98±0.05 6.87±0.08 7.43±0.07
T4 7.41±0.12 7.07±0.17 6.86±0.09 6.73±0.12 7.02±0.10
T5 7.42±0.14 7.08±0.13 6.85±0.07 6.75±0.10 7.03±0.12
T6 7.30±0.13 7.02±0.12 6.79±0.10 6.70±0.08 6.95±0.11
Mean 7.41±0.11a 7.13±0.11ab 7.12±0.09b 6.76±0.09b
Values expressed are means ± standard deviation
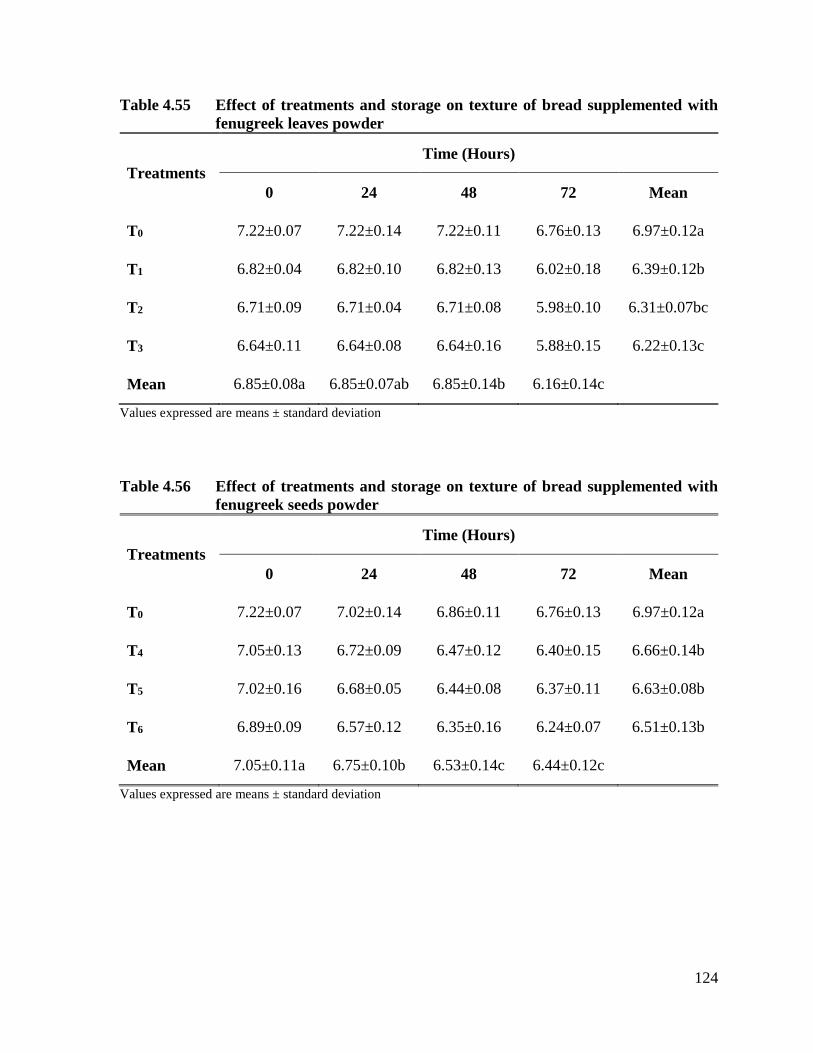
124
Table 4.55 Effect of treatments and storage on texture of bread supplemented with
fenugreek leaves powder
Treatments
Time (Hours)
0 24 48 72 Mean
T0 7.22±0.07 7.22±0.14 7.22±0.11 6.76±0.13 6.97±0.12a
T1 6.82±0.04 6.82±0.10 6.82±0.13 6.02±0.18 6.39±0.12b
T2 6.71±0.09 6.71±0.04 6.71±0.08 5.98±0.10 6.31±0.07bc
T3 6.64±0.11 6.64±0.08 6.64±0.16 5.88±0.15 6.22±0.13c
Mean 6.85±0.08a 6.85±0.07ab 6.85±0.14b 6.16±0.14c
Values expressed are means ± standard deviation
Table 4.56 Effect of treatments and storage on texture of bread supplemented with
fenugreek seeds powder
Treatments
Time (Hours)
0 24 48 72 Mean
T0 7.22±0.07 7.02±0.14 6.86±0.11 6.76±0.13 6.97±0.12a
T4 7.05±0.13 6.72±0.09 6.47±0.12 6.40±0.15 6.66±0.14b
T5 7.02±0.16 6.68±0.05 6.44±0.08 6.37±0.11 6.63±0.08b
T6 6.89±0.09 6.57±0.12 6.35±0.16 6.24±0.07 6.51±0.13b
Mean 7.05±0.11a 6.75±0.10b 6.53±0.14c 6.44±0.12c
Values expressed are means ± standard deviation

125
The sensory evaluation of the bread showed that the degree of fenugreek seeds powder
supplementation and the time for which the bread are kept, had significant effect on the crumb
color of bread (Table 4.44). Progressively decreasing score for this trait were observed for both
treatments and storage time. The highest mean score was observed in T0 (7.09±0.07) followed
by T4 (6.84±0.13), T5 (6.74±0.16) and T6 (6.39±0.14). The mean score during storage ranged
between 6.50±0.13 to 7.09±0.12 represents decreasing trend with the passage of time (Table
4.58). The combination of treatment and storage period did not show significant effect on the
taste of the bread (Table 4.44).
Findings of Gouveia et al. (2007) supported the current findings as they suggested that color
of final product is dependent upon the raw materials used that ultimately affect tonality values.
The results of current study are also in agreement with findings of Sulieman et al. (2000) who
observed decreasing trend for crumb color score with increasing fenugreek flour
supplementation in wheat flour. The decrease in color score was also reported when
supplementation of wheat flour was carried out with different levels of fenugreek powder
(Chauhan and Sharma, 2000). The crumb color of fenugreek flour supplemented bread, scored
maximum points (7.97) for 5:95 followed by 10:90 (7.77) and lowest (5.04) being for 15: 85
blend as against 8.13 for the control sample (Kasaye and Jha, 2015).
4.15.8 Grain of Bread
It was statistically depicted that the effect of fenugreek leaves powder addition and interaction
of treatment & time on grain of bread was not significant, while time period had noticeable
effect on this trait of bread (Table 4.43). It is obvious from the results given in Table 4.59 that
bread crumb grain score in different treatments ranged from 6.94±0.06 to 7.32±0.08.
Significantly the highest crumb grain score (7.32±0.08) was observed for T0 followed by T1
(7.09±0.06), T2 (7.04±0.09) and the lowest (6.94±0.06) was found in T3. During storage period
of bread the mean score for crumb grain decreased from 7.41±0.07 to 6.81±0.08 with the
passage of time (Table 4.59).
Statistical analysis of the data from sensory evaluation depicted that supplementation of
fenugreek seeds powder, storage time and the interaction of these variables did not have
significant effect on the grain of bread (Table 4.44) and it had uniform value with non-
significant difference among each other (Table 4.60).

126
4.15.9 Symmetry of bread form
Statistical analysis showed that addition of fenugreek leaves powder among different
treatments and storage time significantly influence bread symmetry. The symmetry of bread
form was negatively affected with increase in the storage time as compared to control (Table
4.43). It is obvious from the results given in Table 4.61 that bread symmetry score in different
treatments ranged from 6.69±0.27 to 7.23±0.26. Significantly the highest bread symmetry
(7.23±0.26) was observed for treatment T0 followed by T1 (6.92±0.31), T2 (6.91±0.29) while
the lowest in T3 (6.69±0.27). It is also evident from results that the bread symmetry score varied
from 6.65±0.23 to 7.28±0.22 with the passage of time that shows decreasing trend in score
among different treatments.
The analysis of variance depicted that the symmetry of form of bread was significantly affected
by the addition of fenugreek seeds powder and time period (Table 4.44). The mean score (Table
4.62) for this trait ranged between 6.78±0.12 to 7.23±0.10 with supplementation of treatments
while with passage to time mean score decreased from 7.38±0.12 to 6.72±0.11. The combined
effect of seeds powder addition and storage time also did not have any significant influence on
the symmetry of the bread (Table 4.44).
The symmetry of form of bread is an important sensory characteristic from consumer point of
view. The finding of current study score in accordance with earlier findings that revealed
highest symmetry, bread texture, crumb color aroma and taste were obtained by using 1%
fenugreek in wheat flour. This may be due to the effect of the emulsion agent which present in
fenugreek seeds which lead to produce a desirable and uniform air bubbles in the dough and
final product (Rasool et al., 2013).
4.15.10 Evenness of bake of bread
Evenness of bake of bread is a critical factor from consumer point of view for acceptability
and its shelf life. It was statistically observed that the evenness of bake of bread supplemented
with fenugreek leaves powder was not significantly affected by supplementation but the effect
of storage time was significant. The interaction of treatment and storage time did not
significantly influence the evenness of bake (Table 4.43). The mean score for evenness of bake
portrait that highest score (7.06±0.10) was observed in T0 while the lowest in T3 (6.80±0.09).

127
Table 4.57 Effect of treatments and storage on crumb color of bread supplemented
with fenugreek leaves powder
Treatments
Time (Hours)
0 24 48 72 Mean
T0 7.41±0.08 7.18±0.12 6.96±0.06 6.82±0.11 7.09±0.09a
T1 6.35±0.04 6.17±0.09 5.93±0.09 5.86±0.07 6.08±0.06b
T2 5.51±0.06 5.38±0.13 5.14±0.14 5.08±0.05 5.28±0.07c
T3 5.28±0.10 5.15±0.05 4.94±0.11 4.89±0.04 5.07±0.09c
Mean 6.14±0.06a 5.97±0.08ab 5.74±0.09b 5.66±0.05b
Values expressed are means ± standard deviation
Table 4.58 Effect of treatments and storage on crumb color of bread supplemented
with fenugreek seeds powder
Treatments
Time (Hours)
0 24 48 72 Mean
T0 7.41±0.04 7.18±0.09 6.96±0.06 6.82±0.10 7.09±0.07a
T4 7.18±0.11 6.92±0.14 6.69±0.11 6.56±0.16 6.84±0.13ab
T5 7.08±0.08 6.83±0.18 6.60±0.15 6.45±0.18 6.74±0.16b
T6 6.68±0.15 6.48±0.12 6.23±0.13 6.16±0.14 6.39±0.14c
Mean 7.09±0.12a 6.85±0.13ab 6.62±0.12bc 6.50±0.13c
Values expressed are means ± standard deviation

128
It is also evident from results that mean score for evenness of bake varied from 6.67±0.13 to
7.26±.06 during storage period and got decreasing trend for this trait (Table 4.63).
The statistical analysis showed that supplementation with fenugreek seeds powder had non-
significant while storage time had significant effect on evenness of bake of bread (Table 4.44).
The mean score for evenness of bake of bread represented inverse relationship to increasing
quantity of fenugreek seeds powder and storage time. The highest mean score given by panelist
to treatment T0 (7.06±0.12) followed by T4 (7.01±0.14), T5 (7.02±0.09) and T6 (6.95±0.11).
The mean score observed during storage time ranged between 6.76±0.11 to 7.37±0.09 (Table
4.64). The interaction of the two variables showed non-significant results and depicted no
strong linkage between coexistence of treatment and storage volume with the evenness of bake
of bread (Table 4.44)
4.15.11 Overall acceptability of bread
The data obtained from the sensory evaluation indicates that the difference in the quantity of
fenugreek leaves powder addition was not significant while the storage time had highly
significant effect on it. Non-significant results were also obtained by employing the
combination of treatments and storage time (Table 4.43). It is evident from the mean results
given in Table (4.65) that bread overall acceptability in different treatments varied from
6.17±0.14 (T3) to 7.16±0.13 (T0). The decreasing trend was observed with increasing the
supplementation level of fenugreek leaves powder and same trend was observed 6.90±0.10 to
5.16±0.14 during storage of the bread.
The sensory evaluation illustrated that addition of fenugreek seeds powder into the bread did
not significantly influence the overall acceptability of the bread, whereas the storage time had
highly significant effect on this trait (Table 4.44). Mean score for overall acceptability among
different treatments with decreasing trend ranged between 6.75±0.15 to 7.16±0.13 (Table
4.66). The combined interaction of the treatment and storage time also had non-significant
effect on the overall acceptability of the bread prepared by supplementation with fenugreek
seeds powder (Table 4.44).
The current study sensory scores exhibited that there was decreasing score found for overall
acceptability score of wheat fenugreek supplemented bread when compared with control bread.

129
The overall acceptability score for control bread was 6.01 that decreased with increasing
supplementation level of fenugreek powder. However, bread contains up to 5% level of
fenugreek leaves and 10% seeds powder consider as more acceptable as control in terms of
acceptability. The results of the consumer acceptance studies obtained by Naidu et al. (2012)
who reported that 45% and 25% of the panelists gave ‘‘Like very Much’’ rating to rice
preparations containing dried and fresh fenugreek leaves, respectively, whereas 55% and 50%
have gave the rating ‘‘Like Moderately’’ to dried and fresh fenugreek leaves incorporated rice
preparations, respectively.
A small percentage of the population (25%) have rated the rice preparation with fresh
fenugreek leaves as ‘‘Like Slightly.’’ Since all the ratings come under the ‘‘Like’’ category,
both the samples were considered acceptable and rice prepared with dried fenugreek leaves
showed higher consumer preference. In another investigation overall acceptability score of
wheat-fenugreek supplemented baked products observed acceptable at 5% level of
substitution. Products like biscuits and bread prepared with raw, soaked and germinated
fenugreek supplemented wheat flour found acceptable at 15% (Hooda and Jood, 2004). The
sensory attributes like symmetry, texture, crumb color, aroma, taste and overall acceptably
were within range of consumer acceptance with fenugreek-wheat supplemented bread (Rasool
et al., 2013). In an earlier study appearance, texture and overall acceptability of bread samples
made from fenugreek-wheat blends of 5:95 and 10:90 are within acceptable limits. No
significant differences were noticed with respect to control bread samples (Kasaye and Jha,
2015).
From the present exploration, it is deduced that 5% fenugreek leaves and 10% seeds powder
showed better performance in bread preparation. Moreover, these treatments were also rich in
bioactive molecules hence selected for further use in efficacy studies.

130
Table 4.59 Effect of treatments and storage on grain of bread supplemented with
fenugreek leaves powder
Treatments
Time (Hours)
0 24 48 72 Mean
T0 7.66±0.03 7.44±0.07 7.15±0.13 7.00±0.12 7.32±0.08
T1 7.40±0.05 7.14±0.12 6.98±0.10 6.84±0.05 7.09±0.06
T2 7.35±0.11 7.11±0.10 6.95±0.04 6.75±0.09 7.04±0.09
T3 7.22±0.04 7.04±0.08 6.86±0.07 6.63±0.10 6.94±0.06
Mean 7.41±0.07a 7.18±0.13ab 6.99±0.08ab 6.81±0.08b
Values expressed are means ± standard deviation
Table 4.60 Effect of treatments and storage on grain of bread supplemented with
fenugreek seeds powder
Treatments
Time (Hours)
0 24 48 72 Mean
T0 7.41±0.03 7.18±0.07 6.96±0.05 6.82±0.08 7.09±0.05
T4 6.35±0.06 6.17±0.12 5.93±0.10 5.86±0.12 6.08±0.08
T5 5.51±0.09 5.38±0.14 5.14±0.16 5.08±0.05 5.28±0.12
T6 5.28±0.05 5.15±0.10 4.94±0.15 4.89±0.10 5.07±0.09
Mean 6.14±0.06 5.97±0.11 5.74±0.14 5.66±0.09
Values expressed are means ± standard deviation

131
Table 4.61 Effect of treatments and storage on symmetry of bread form supplemented
with fenugreek leaves powder
Treatments
Time (Hours)
0 24 48 72 Mean
T0 7.55±0.11 7.36±0.10 7.06±0.19 6.97±0.91 7.23±0.26a
T1 7.30±0.18 7.06±0.30 6.72±0.22 6.61±0.53 6.92±0.31ab
T2 7.27±0.32 7.02±0.27 6.72±0.08 6.62±0.43 6.91±0.29ab
T3 7.00±0.14 6.82±0.21 6.55±0.29 6.39±0.35 6.69±0.27b
Mean 7.28±0.22a 7.07±0.20ab 6.76±0.17bc 6.65±0.23c
Values expressed are means ± standard deviation
Table 4.62 Effect of treatments and storage on symmetry of bread form supplemented
with fenugreek seeds powder
Treatments
Time (Hours)
0 24 48 72 Mean
T0 7.55±0.11 7.36±0.14 7.06±0.08 6.97±0.12 7.23±0.10a
T4 7.39±0.05 7.09±0.10 6.79±0.07 6.69±0.13 6.99±0.09ab
T5 7.43±0.14 7.13±0.11 6.83±0.15 6.74±0.10 7.03±0.13ab
T6 7.15±0.16 6.92±0.14 6.58±0.05 6.48±0.09 6.78±0.12b
Mean 7.38±0.12a 7.13±0.12ab 6.81±0.10b 6.72±0.11b
Values expressed are means ± standard deviation

132
Table 4.63 Effect of treatments and storage on evenness of bake of bread
supplemented with fenugreek leaves powder
Treatments
Time (Hours)
0 24 48 72 Mean
T0 7.42±0.04 7.12±0.11 6.88±0.09 6.82±0.18 7.06±0.10
T1 7.28±0.05 7.02±0.17 6.81±0.12 6.68±0.11 6.95±0.12
T2 7.23±0.08 6.99±0.14 6.72±0.10 6.64±0.07 6.89±-.08
T3 7.10±0.06 6.92±0.12 6.64±0.08 6.54±0.14 6.80±0.09
Mean 7.26±.06a 7.02±0.15ab 6.76±0.14b 6.67±0.13b
Values expressed are means ± standard deviation
Table 4.64 Effect of treatments and storage on evenness of bake of bread
supplemented with fenugreek seeds powder
Treatments
Time (Hours)
0 24 48 72 Mean
T0 7.42±0.07 7.12±0.11 6.88±0.09 6.82±0.16 7.06±0.12
T4 7.35±0.12 7.06±0.16 6.86±0.12 6.78±0.13 7.01±0.14
T5 7.39±0.08 7.09±0.13 6.85±0.07 6.75±0.08 7.02±0.09
T6 7.30±0.10 7.04±0.14 6.78±0.11 6.70±0.10 6.95±0.11
Mean 7.37±0.09a 7.08±0.13ab 6.84±0.10b 6.76±0.11b
Values expressed are means ± standard deviation

133
Table 4.65 Effect of treatments and storage on overall acceptability of bread
supplemented with fenugreek leaves powder
Treatments
Time (Hours)
0 24 48 72 Mean
T0 7.46±0.15 7.22±0.17 7.07±0.14 6.89±0.10 7.16±0.13
T1 6.93±0.09 6.70±0.12 6.47±0.06 6.34±0.15 6.61±0.10
T2 6.70±0.14 6.47±0.08 6.25±0.10 6.13±0.12 6.39±0.11b
T3 6.50±0.05 6.25±0.13 6.03±0.08 5.89±0.17 6.17±0.14
Mean 6.90±0.10a 6.66±0.14a 6.45±0.09a 5.16±0.14b
Values expressed are means ± standard deviation
Table 4.66 Effect of treatments and storage on overall acceptability of bread
supplemented with fenugreek seeds powder
Treatments
Time (Hours)
0 24 48 72 Mean
T0 7.46±0.15 7.22±0.17 7.07±0.14 6.89±0.10 7.16±0.13
T4 7.28±0.12 7.02±0.20 6.74±0.18 6.74±0.10 6.93±0.15
T5 7.23±0.18 6.97±0.22 6.74±0.12 6.74±0.15 6.89±0.14
T6 7.08±0.08 6.83±0.18 6.59±0.15 6.59±0.10 6.75±0.15
Mean 7.26±0.13a 7.01±0.16a 6.78±0.17a 6.78±0.13b
Values expressed are means ± standard deviation

134
4.16 Efficacy study
In current research work efficacy study was carried out to explore the functional/nutraceutical
potential of fenugreek leaves and seeds powder against selected metabolic disorders using
experimental Sprague Dawley rats. The trial was conducted on rodents rather than humans due
to organized supervision, control diet & environmental conditions and convenient
management. In the instant investigation, efficacy trial was comprised of three studies (Study
I: normal rats, Study II: hyperglycemic rats, Study III: hypercholestrolemic rats) along with
simultaneous intake of supplemented diets (D0: normal diet, D1: 10% fenugreek seed powder
supplemented, D2: 5% fenugreek leaves powder supplemented). At the initiation of trial, some
rats were scarified to assess the baseline values, whilst, rest of the rats were killed at the
termination (56th day) of the study. Feed and water intakes were measured on daily bases
however, body weight was assessed weekly.
4.16.1. Feed intake
Mean squares (Table 4.67) explicated that the treatments and time intervals affected the feed
intake significantly in all studies. Mean values of normal rats indicated (Fig. 4.1) maximum
feed intake (36.21±2.98 g/rat/day) in D1 (seeds powder) trailed by D0 (control) and D2 (leaves
powder) as 34.80±2.82 and 33.49±2.64 g/rat/day. It was observed that feed intake was
minimum at the initiation of study and it was maximum at the termination of study i.e.
29.39±1.25 to 38.23±1.92 g/rat/day, correspondingly. The feed intake increased gradually with
the passage of time and at 1st week it was recorded as 29.28±0.73, 30.69±1.12 and 28.20±1.17
g/rat/day in D0, D1 and D2 groups that subsequently increased to 38.36±0.96, 40.01±1.39 and
36.25±1.47 g/rat/day, respectively at 8th week.
Similarly, in Study II, D0 showed 33.93±2.65 g/rat/day feed intake, whilst D1 and D2 exhibited
35.04±2.98 and 36.67±2.89 g/rat/day for respective trials. Time factor enhanced the feed
intake, at initiation of study it was 28.61±0.61, 29.39±1.02 & 30.90±1.26 g/rat/day (Fig. 4.2)
in D0, D1 and D2, respectively. However, an increasing trend at 8th week 36.74±1.46,
39.39±1.36 and 39.87±1.63 g/rat/day was observed. Likewise in study III, D0 exhibited
maximum (33.88±2.65 g/rat/day) feed consumption followed by D2 (33.32±2.71 g/rat/day)
whilst minimum (32.26±2.70 g/rat/day) was noticed in D1. During the time span, it was
increased from 27.92±0.761 to 36.52±0.44 g/rat/day at initiation to termination, respectively.

135
Table 4.67 Effect of diets and time intervals on feed, water intake & body weight of
rats in different studies
Studies SOV df Feed
intake
Water
intake
Body
Weight
Study 1
Intervals
(A) 8 118.354** 74.1181** 31473.4**
Diet (B) 2 83.692** 16.3865** 16949.2**
A x B 16 0.455NS 0.3132NS 419.3NS
Error 108 1.585 0.4708 303.9
Study II
Intervals
(A) 8 120.911** 67.7120** 19875.1**
Diet (B) 2 85.586** 27.4034** 16218.5**
A x B 16 0.497NS 0.2258NS 253.7NS
Error 108 1.487 0.3154 140.6
Study III
Intervals
(A) 8 110.367** 66.4694** 18849.0**
Diet (B) 2 30.525** 27.7632** 9684.5**
A x B 16 0.255NS 0.2288NS 273.1NS
Error 108 0.695 0.8094 210.5
** = Highly significant
* = Significant
NS = Non significant

136
Figure 4.1 Feed intake (g) of normal rats (study I)
Figure 4.2 Feed intake (g) of hyperglycemic rats (study II)
Figure 4.3 Feed intake (g) of hypercholesterolemic rats (study III)
D0 : Control diet
D1 : Fenugreek seeds powder @ 10%
D2 : Fenugreek leaves powder @ 5%
15
20
25
30
35
40
45
Week 1 Week 2 Week 3 Week 4 Week 5 Week 6 Week 7 Week 8 Week 9
D0 D1 D2
15
20
25
30
35
40
45
Week 1 Week 2 Week 3 Week 4 Week 5 Week 6 Week 7 Week 8 Week 9
D0 D1 D2
15
20
25
30
35
40
Week 1 Week 2 Week 3 Week 4 Week 5 Week 6 Week 7 Week 8 Week 9
D0 D1 D2

137
Similarly, in groups rely on D0, D1 and D2 (Fig. 4.3) elevation in feed consumption was
observed from 28.56±0.77 to 35.71±0.97, 27.08±0.48 to 36.02±0.64 and 28.13±0.80 to
36.85±1.05 g/rat/day at 1st and 8th week, respectively.
The results of present research are comparable with the findings of Anuradha and Ravikumar
(2001) in which rats were divided in five groups, amongst third group was diabetic and fed on
fenugreek rich diet. In this group feed intake increased from 83.8±2.3 to 98.2±5.2 (g/kg/day).
In another study non-momentous change in food intake was observed in rats groups with
fenugreek supplemented leaves diet (Annida and Prince, 2004). Similarly a team of another
researchers Kumar et al. (2005) investigated antidiabetic property of fenugreek seeds and
suggested that during research feed and drink intakes were calculated in control and diabetic
groups which were treated with fenugreek. In control treated with fenugreek feed intake was
12.8 ±0.2 g/24 hr and in diabetic treated with fenugreek it was 16.00±0.9 g/24 hr. Recently,
Mahmoud (2013) evaluated the effect of high protein diet containing fortified bread with 5 and
10% fenugreek seeds (FS) on the mean values of weight/body weight % of rats suffering from
diabetes. The mean value of feed intake in negative control group provided with normal protein
diet containing 250 g un-fortified bread was 16.67g, while it was 15.50g in the negative control
group fed on high protein diet containing the same type and amount of bread. The results of
present study comparable with findings of Geetha et al. (2011) who divide rats into groups and
fed with various levels of fenugreek based diets and observed feed intake reduce during first
week of the study but after that animals regained their appetite and feed intake increased as
study proceed.
4.16.2. Water intake
Mean squares for water intake in Table 4.67 showed momentous effect of treatments as well
as time intervals (weeks) during the course of study. Means for water intake in all modules
showed increasing trend with time intervals. In study I (Fig. 4.4) water intake at the beginning
was 19.54±0.39, 20.64±0.54 and 18.71±0.41 mL/rat/day, respectively for D0, D1 and D2 that
increased to 26.02±0.66, 27.50±0.91 and 26.40±0.92 mL/rat/day respectively at the end.
In study II (Fig. 4.5) the recorded values for water intake in D0, D1 and D2 were 19.98±0.32,
21.61±0.40 and 20.22±0.48 mL/rat/day, respectively that raised to 26.44±0.62, 28.25±0.78 and
26.54±0.53 mL/rat/day, respectively during the entire trial.
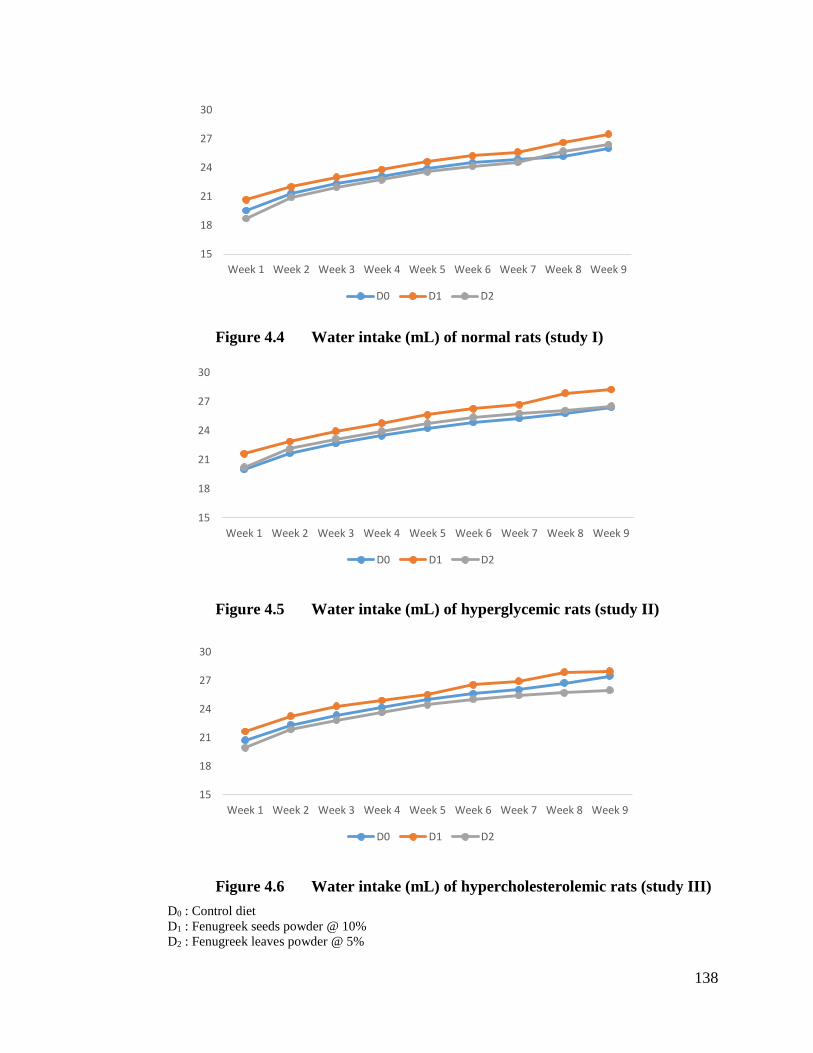
138
Figure 4.4 Water intake (mL) of normal rats (study I)
Figure 4.5 Water intake (mL) of hyperglycemic rats (study II)
Figure 4.6 Water intake (mL) of hypercholesterolemic rats (study III)
D0 : Control diet
D1 : Fenugreek seeds powder @ 10%
D2 : Fenugreek leaves powder @ 5%
15
18
21
24
27
30
Week 1 Week 2 Week 3 Week 4 Week 5 Week 6 Week 7 Week 8 Week 9
D0 D1 D2
15
18
21
24
27
30
Week 1 Week 2 Week 3 Week 4 Week 5 Week 6 Week 7 Week 8 Week 9
D0 D1 D2
15
18
21
24
27
30
Week 1 Week 2 Week 3 Week 4 Week 5 Week 6 Week 7 Week 8 Week 9
D0 D1 D2

139
The mean water intake was 23.82±2.08, 25.33±2.22 & 24.22±2.07 mL/rat/day, respectively
with diets D0, D1 and D2. Similarly water intake for all diet groups was 20.60±0.88 mL/rat/day
at start of trail that increased to 27.08±1.36 mL/rat/day at the end to the trial. Rats fed on high
cholesterol diet (study III) showed highest water intake in D0 (27.47±1.21 mL/rat/day) at 8th
week followed by D1 (27.96±0.57 mL/rat/day) and D2 (25.97±0.76 mL/rat/day). The maximum
mean water intake (Fig. 4.6) was observed in rats fed with D2 (25.24±2.13 mL/rat/day)
followed by D0 (24.60±2.17 mL/rat/day) and D1 (23.87±2.02 mL/rat/day).
There was increasing trend of water intake observed in all groups under study. The thrust of
higher water intake can be a symptom of diabetes. Similar findings were also observed in a
study that reported that control rats drink 20 to 30 mL/rat/day of water, while fenugreek control
and diabetic groups consumed 27.6 and 83.4 mL/24hr, respectively (Kumar et al., 2005).
4.16.3. Body weight
Mean squares (Table 4.67) revealed that the body weight of rats in different studies varied
significantly with treatments and study weeks.
Body weight depicted (Fig. 4.7) that in the beginning (study I) the weight of different rat groups
D0, D1 and D2 were 224.24±13.44, 236.03±13.83 and 232.65±13.38 g/rat, respectively that
subsequently increased to 361.92±17.33 g/rat (D0), 403.31±3.63 g/rat (D1) and 352.88±25.86
g/rat (D2) at the termination. Mean values indicated highest weight gain in D1 followed by D0
and D2. Similarly, in study II (Fig. 4.8), maximum weight gain was observed in D1 from
231.90±13.62 to 344.14±18.70 g/rat, respectively for 1st and 8th week. The remaining groups,
exhibited increase in weight during entire trial from 237.85±3.64 to 331.07±11.99 (D2) and
227.56±4.95 to 313.89±16.34 (D0) g/rat.
In study III, gain in weight was more pronounced in D1 and during 1st week the recorded weight
for D0, D1 and D2 was 229.84±13.261, 222.97±14.611 & 233.24±3.763 g/rat that reached to
304.60±15.589, 332.75±14.515 & 326.76±6.30 g/rat, respectively at the final week (Fig 4.9).
Means for final body weight at the termination of study depicted substantial differences among
the treatments. In study 1, the highest weight was observed in D1 group (329.17±53.818 g/rat)
trailed by D0 (298.28±45.85 g/rat) and D2 (293.37±38.54 g/rat). Likewise in study II, the D1
(291.94±38.903 g/rat) group had more weight trailed by D2 (280.22±36.61 g/rat) and D0
(254.81±34.965 g/rat).
140
The results of current investigaton in harmony with scientific work of Anuradha and
Ravikumar (2001) in which rats were divided in five groups, amongst third and fifth groups
were diabetic fed on fenugreek rich diet and control fed on fenugreek, accordingly. In diabetic
group weight gain was from 167.4±2.1 to 195.3±3.1 g/rat/week, even intake of food was found
similar in groups. Likewise, Elmnan et al. (2012) reported fenugreek seeds found to increase
body weight and this weight gain may be due to the fact that, the seeds is considered as an
appetite stimulating agent (Blumenthal et al., 1998; Broca et al., 2000), thus increased feed
intake and a better use of nutrients available in diet lead to increase in bodyweight. The addition
of fenugreek leaves supplementation in diabetic rats diet depicted non substantial change in
food intake among different groups, while partially increased body weight observed in diabetic
rats that can be credited to its antidiabetic role (Devi et al., 2012). The findings of Petit et al.
(1995) depicted that steroid saponins present in fenugreek seeds stimulate food intake that
leads to increase in weight of rats. In another investigation non-significant increase in mice
body weight was observed when diets supplemented with fenugreek seeds (Choudhary et al.,
2001). Diabetic rats treated with fenugreek observed with weight gain, on the other hand
untreated diabetic rats group exhibited decrease in body weight (Xue et al., 2007). Similar
findings were observed by Abdalatif et al. (2012) who found slightly less weight gain in
diabetic animals when compared with non-diabetic ones. The addition of fenugreek in diet
resulted in gradual increase in diabetic as well as non-diabetic rats (Belguith-Hadriche et al.,
2013).
4.16.4 Serum profile analysis
4.16.4.1 Glucose
The statistical analysis showed that glucose level in different groups of rats was significantly
affected by diets in all studies except for study I (Table 4.68).
In study I mean glucose values in D0, D1 and D2 groups were 83.00±2.21, 79.27±2.92 and
78.18±2.54 mg/dL. In study II, D0 group illustrated highest glucose level 151.00±4.95 mg/dL,
that substantially decreased to 134.89±2.01 and 146.55±2.65 mg/dL in D1 and D2 groups,
respectively (Table 4.68). Likewise, high cholesterol fed rats (study III) had maximum glucose

141
Figure 4.7 Body weight (g) of normal rats (study I)
Figure 4.8 Body weight (g) of hyperglycemic rats (study II)
Figure 4.9 Body weight (g) of hypercholesterolemic rats (study III)
D0 : Control diet
D1 : Fenugreek seeds powder @ 10%
D2 : Fenugreek leaves powder @ 5%
150
200
250
300
350
400
Week 1 Week 2 Week 3 Week 4 Week 5 Week 6 Week 7 Week 8 Week 9
D0 D1 D2
150
200
250
300
350
Week 1 Week 2 Week 3 Week 4 Week 5 Week 6 Week 7 Week 8 Week 9
D0 D1 D2
150
200
250
300
350
400
450
Week 1 Week 2 Week 3 Week 4 Week 5 Week 6 Week 7 Week 8 Week 9
D0 D1 D2

142
level 115.00±3.74 mg/dL in D0 group that reduced significantly in D1 (105.66±2.87 mg/dL)
followed by D2 (111.45±1.95 mg/dL).
Fig 4.10 depicted the percent reduction in glucose content; in study I treatment D1 showed
glucose reduction (4.50%) whereas D2 caused 3.15% reduction. Similarly, in study II, highest
decrease was observed in D1 (10.67%) trailed by D2 (6.78%). Similar diminishing trend was
observed during study III, the highest decline was noticed in D1 (8.12%) followed by D2
(5.45%). It is revealed that functional diet containing seeds powder (D1) performed better
against glucose related abnormalities than diets containing leaves powder (D2).
The earlier research work supported current research findings like Xue et al. (2007) and Mowl
et al. (2009) proved that there was decrease in glucose level when diet or rats supplemented
with fenugreek leaves. The anti-diabetic also proved in rats when group of animals were
provided with fenugreek seeds rich diet (Annida and Prince, 2004). The enrichment of diet
with fenugreek seeds fraction to diabetic and non-diabetic rats decrease the glucose level. The
decreased absorption of glucose, intestinal disaccharidase activity and increased
gastrointestinal motility observed with the addition of seeds fraction. The antidiabetic actions
of fenugreek facilitated by slowing down digestion of carbohydrate & absorption and
improvement of peripheral insulin action (Hannan et al., 2007). The findings of Madar and
Shomer (1990) & Sauvaire et al. (1998) exhibited that anti-hyperglycemic effects of fenugreek
are attributed, at least partly, by reducing intestinal glucose absorption. The findings also
indicated that the seeds fraction increased sucrose content of the stomach in non-diabetic and
type 2 diabetic rats at 30-60 min support the thought that fenugreek also reduces gastric
emptying (Nahar et al., 2000).
The mean fasting blood glucose in diabetic untreated rats group (control positive) after
induction of 21 days of diabetes was 280±8.33 mg/dl while in the normal healthy group the
value was 76±2.59 mg/dl. When comparison of values between positive control group and the
group which was treated with fenugreek extract was carried out, it was observed that treated
group exhibited lower mean fasting blood glucose i.e. 141.83±9.04 mg/dl. In similar way mean
values of serum insulin observed in control positive group was 4.17±0.17 μU/ml and normal
healthy group it was 10.53±0.66 μU/ml. The comparison of positive control group and
fenugreek extract treated group illustrated significantly higher mean serum insulin 7.27±0.6

143
μU/ml in treated group (El-Soud et al., 2007). Fenugreek feeding at 5% significantly reduced
fasting blood glucose in diabetic rats by 33% (360 to 244.0 mg/dl) as compared to diabetic
control indicating its hypoglycemic influence during diabetes (Shetty and Salimath, 2009). A
bread incorporating fenugreek was tested for its taste acceptability and blood glucose lowering
effect. Eight diet controlled diabetic subjects were served two slices (56 g) for bread. The bread
supplemented with fenugreek was indistinguishable from the whole wheat bread and its
maintained fenugreek’s functional property of reducing insulin resistance (Losso et al., 2009).
Previously, Shakib and Gabrial (2010) evaluated postprandial blood glucose level in healthy
subjects and determine their glycemic index values after feeding with bread supplemented with
barely, fenugreek or ginger. The all supplemented bread reduced postprandial blood glucose
responses than did the control (wheat flour bread), suggesting that soluble dietary fiber
available in these supplemented products had an impact on glucose tolerance with glycemic
indices ranging from 38 (55 fenugreek) to 52 (Barley wheat bread). Fenugreek supplemented
bread have crude fiber 6.25 g/100g so it can be replaced with white wheat flour bread since it
provides easily digestible and healthy carbohydrate based diet that can help to maintain
postprandial blood glucose level within normal range.
When supplementation of experimental rats was carried out with fenugreek leaves powder in
streptozotocin (STZ) induced diabetic rats with moderate hyperglycemia that resulted in
decreased blood glucose and increased plasma insulin level. The mechanism of STZ that it
incompletely destruct pancreatic β-cells even though the rats became permanently diabetic.
The β–cells of islets of Langerhans get stimulated and glucose level increased when
experimental rats diet supplemented with fenugreek leaves powder that increased plasma
insulin level. The process of glycolysis increased and gluconeogenesis decreased leads to
control glucose level when supplementation of leaves increased in the diet. This is possible as
it controls the activities of the key enzymes of glycolysis (Devi et al., 2012). The increase in
insulin level resulted in glucose decreased that exhibited reverse correlation. Blood glucose
level significantly increased and decrease in insulin level observed in positive control group
when compared to the rest groups. The addition of fenugreek extract in rats diet depicted
significant effect against blood glucose and insulin level. The level of glucose decreased from
258.41mg/dl (positive control) to 167.57 mg/dl and insulin level improved 5.81 IU/ml to 7.89
IU/ml (El-Dakak et al., 2013). Serum glucose level was significantly elevated in STZ-diabetic

144
rats and the percentage increase was 195.81%. Fenugreek significantly decreased STZ-induced
hyperglycemia and the percentage reduction was 53.66% in comparison with the diabetic
control. Accordingly, there was a significant decrease in serum insulin concentrations in
diabetic rats, compared with normal control (23.13%), and administration of fenugreek
increase the insulin level and the percentage elevation was 14.62% as compared to the diabetic
control (Marzouk et al., 2013).
4.16.4.2 Cholesterol
The statistical analysis (Table 4.69) showed that diets imparted non-significant variations on
cholesterol in study I whereas, significant differences were observed in rest of the studies. In
study I, maximum cholesterol was observed in D0 (80.26±2.48 mg/dL) followed by D2
(79.63±1.08 mg/dL) and D1 (77.88±1.04 mg/dL) groups. Means for cholesterol in study II
indicated maximum value for D0 (100.05±2.19 mg/dL) that momentously reduced to
91.59±1.52 and 95.53±1.07 mg/dL in D1 and D2, respectively. Similarly in study III, high
cholesterol value 146.36±2.72 mg/dL was noticed in D0 followed by D2 137.17±4.82 mg/dL
and D1 127.87±5.68 mg/dL.
It is obvious from Fig 4.11 that D1 (diet containing seeds powder) caused maximum reduction
in cholesterol followed by D2 (diet containing leaves powder). In study I the treatments D1 and
D2 exhibited 2.96 and 2.03 % decline in cholesterol, respectively as compared to control.
Likewise, in study II highest reduction was exhibited by D1 (8.45%) trailed by D2 (4.52%).
Similarly, in study III maximum decrease (12.03%) was noticed in D1 whilst minimum
reduction was observed in D2 (6.32%) as compared to control.
The present results are supported by Moosa et al. (2006) who reported fenugreek dose of 25g
orally two times in a day for period of three and six weeks to hypercholesterolmic individuals
produces significant reduction of serum total cholesterol This study suggests that fenugreek
seeds powder would be considered as effective agent for lipid lowering purposes. The findings
of Pipelzadeh et al. (2003) supported current research results concerned serum total cholesterol
found decreased by adding fenugreek in diets of experimental rats. Treatment with 100 mg/kg
fenugreek seeds powder reduced total cholesterol 162.9 to 120 mg/dl while dose of 500 mg/kg
also significantly reduced the total cholesterol level and other serum lipids.

145
Table 4.68 Effect of supplemented diets on glucose (mg/dL)
Studies
Diets
F value
D0 D1 D2
Study I 83.00±2.21 79.27±2.92 80.01±2.54 3.26NS
Study II 151.00±4.95a 134.89±2.01b 146.55±2.65ab 6.43*
Study III 115.00±3.74a 105.66±2.87c 111.45±1.95b 14.13**
**= Highly significant
*= Significant
NS= Non Significant
D0 : Control diet
D1 : Fenugreek seeds powder @ 10%
D2 : Fenugreek leaves powder @ 5%
Study I : Normal rats
Study II : Hyperglycemic rats
Study III: Hypercholesterolemic rats
Figure 4.10 Percent reduction in glucose as compared to control
-4.50
-10.67
-8.12
-3.15
-6.78
-5.45
-12.00
-10.00
-8.00
-6.00
-4.00
-2.00
0.00
STUDY I STUDY II STUDY III
D1 Fenugreek seed powder supplemented diet
D2 Fenugreek leaves powder supplemented diet

146
In addition Prasanna (2000) proved hypolipidemic role of fenugreek by given it dose of 25 and
50g twice in a day before meal to hypercholesterolemic patients. Similar results were reported
by Belguith-Hadriche et al. (2010) who revealed that administration of fenugreek ethyl acetate
extract to rats fed on cholesterol-rich diet significantly lowered the plasma level of total
cholesterol. The lowering effect correlated to the presence of flavonoids in fenugreek
especially naringenin. Sowmya and Rajyalakshmi (1999) observed that addition of germinated
fenugreek seeds powder in diet resulted in reduction of LDL and total cholesterol levels of
hypercholesterolemic adults. The hypocholesterolemic effect of fenugreek occurred through
various mechanisms like increased in excretion of fecal bile acids and neutral sterols with
reduction in level of cholesterol stores in liver. Its addition in diet stimulates the production of
bile in liver and the process of cholesterol conversion into bile salts or high fiber available
potentially reduces absorptive mucosal surface glucose diffusion rate, cholesterol and drug
absorption. The soluble fiber also increases the viscosity of the digest & unstirred layer
thickness in small intestine or inhibit the uptake of cholesterol and bile acids. For fermentation
in large bowel by microorganisms, soluble fiber is consider as an excellent source. The
resultant product of fermentation are volatile fatty acids that enter into the blood stream and
appear to decrease the synthesis of hepatic cholesterol. The seeds of the fenugreek contains
trigonelline and diosgenin in the form glycosides that can combine with cholesterol to make
complexes in the intestine and reduced its absorption. Another reason for reducing glucose
effect could be based on amino acid pattern present in fenugreek proteins. Likewise, fenugreek
given in a dose of 2.5g twice daily for 3 months to healthy individuals did not affect the blood
lipids and blood sugar (fasting and postprandial). However, administered in the same daily
dose for the same duration to coronary artery disease patients also with non-insulin dependent
diabetes, fenugreek decreased significantly the blood lipid (total cholesterol and triglycerides)
without affecting the HDL-cholesterol (Bordia et al., 1997). The present results are on the line
with Stark and Madar (1993) who reported that feeding hypercholesterolemic rats with two
separate doses (30 or 50g) of ethanol extract from fenugreek seeds contained
hypocholesterolemic components which appear to be saponins that interact with bile salts in
the digestive tract.
The administration of fenugreek extract has significantly decreased serum triacylglycerol and
cholesterol in diabetic rats. The findings also supported by the research work of other scientist
147
who have reported that fenugreek added diet feeding to diabetic rats resulted in reducing total
cholesterol (Khosla et al., 1995). The hypolipidemic role of fenugreek soluble dietary fiber
fraction could be the result of retardation of carbohydrate and fat absorption due to the presence
of bioactive fiber in the agent (Hannan et al., 2003). In an experiment mean serum total
cholesterol value in normal healthy group was found 98.5±2.1 mg/dl that observed
significantly increased in positive control group (140.33±3.2 mg/dl). When fenugreek extract
was added in diet, it significantly reduced the serum total cholesterol to 107.83±2.2 mg/dl (El-
Soud et al., 2007). Ethyl acetate extract of fenugreek seeds was investigated by Belguith-
Hadriche et al. (2013) who observed reduced level of total cholesterol, low density lipoprotein
(LDL), triglycerides and increased level of high density lipoprotein (HDL) when compared
with those of rats that have cholesterol-rich diet. Serum total cholesterol level increased in
STZ-diabetic rats and daily administration of fenugreek for 30 days succeeded to reduce
cholesterol 48.22% when compared with diabetic control rats (Marzouk et al., 2013).
4.16.4.3 Insulin
The statistical analysis (Table 4.70) elucidated that diets imparted non-significant effect on
insulin in study I however, this trait was affected significantly in study II and III. Means for
insulin values in study I were 7.01±0.25, 7.16±0.16 and 7.09±0.20 µU/mL in D0, D1 and D2
groups, respectively. Nonetheless in study II, lowest insulin value was recorded in D0
(4.69±0.05 µU/mL) that significantly uplifted to 4.88±0.04 and 4.83±0.04 µU/mL in D1 and
D2 groups.
Similarly in study III, D0 exhibited lowest insulin level (6.32±0.09 µU/mL) that momentously
increased in D1 and D2 groups as 6.53±0.10 and 6.46±0.05 µU/mL, respectively (Table 4.70).
It is obvious from the Fig. 4.12 (Study I) that diets D1 and D2 resulted in 2.11 and 1.09%
increase in glucose while 4.01 and 2.96% increase in insulin was found with diets D1 and D2
in study II. Likewise in study III, highest elevation 3.25% was noticed in D1 followed by 2.22%
in D2.
The results obtained were in harmony with the findings of previous researchers. The scientific
study of Khalil (2004) focus on clarifying the role of fenugreek seeds aqueous extract in its
therapeutic dose on beta cells number, blood glucose and plasma insulin levels in diabetic rats.

148
Table 4.69 Effect of supplemented diets on cholesterol (mg/dL)
Studies
Diets
F value
D0 D1 D2
Study I 80.26±2.48 77.88±1.04 79.63±1.08 2.71NS
Study II 100.05±2.19a 91.59±1.52b 95.53±1.07c 54.8**
Study III 146.36±2.72a 127.87±5.68c 137.17±4.82b 20.4**
**= Highly significant
NS= Non Significant
D0 : Control diet
D1 : Fenugreek seeds powder @ 10%
D2 : Fenugreek leaves powder @ 5%
Study I : Normal rats
Study II : Hyperglycemic rats
Study III: Hypercholesterolemic rats
Figure 4.11 Percent reduction in cholesterol as compared to control
-2.96
-8.45
-12.03
-2.03
-4.52
-6.32
-14.00
-12.00
-10.00
-8.00
-6.00
-4.00
-2.00
0.00
Study I Study II Study III
D1 Fenugreek seed powder supplemented diet
D2 Fenugreek leaves powder supplemented diet
149
For this purpose rats were divided into four groups, control, diabetic, diabetic rats and control
rats fed with fenugreek seeds aqueous extract (0.1 mg/kg body weight). During induction of
diabetes, insulin level was reduced (12.5±0.5 to 7.5±0.8 μU/dL). By feeding fenugreek extract
based diet, inslin level was elevated to higher value in diabetic group (10±1 μU/dL). Likewise,
Gad et al. (2006) assessed the effect of administration of fenugreek extracts for 21 days on the
blood glucose and serum insulin of diabetic rats. During period of diabetic induction, serum
insulin level was reduced from 1.106±0.269 to 0.216±0.005 μg/L. When fenugreek based diet
was fed to the diabetic models, serum insulin level rose to 0.326±0.077 μg/L.
Mean values of serum insulin observed in control positive group was 4.17±0.17 μU/ml and
normal healthy group it was 10.53±0.66 μU/ml. The comparison of positive control group and
fenugreek extract treated group illustrated significantly higher mean serum insulin 7.27±0.6
μU/ml in treated group (El-Soud et al., 2007). When supplementation of experimental rats was
carried out with fenugreek leaves powder in streptozotocin (STZ) induced diabetic rats with
moderate hyperglycemia that resulted in decreased blood glucose and increased plasma insulin
level. The mechanism of STZ that it incompletely destruct pancreatic β-cells even though the
rats became permanently diabetic. The β–cells of islets of Langerhans get stimulated and
glucose level increased when experimental rats diet supplemented with fenugreek leaves
powder that increased plasma insulin level. The process of glycolysis increased and
gluconeogenesis decreased leads to control glucose level when supplementation of leaves
increased in the diet. This is possible as it controls the activities of the key enzymes of
glycolysis (Devi et al., 2012).
Serum glucose level was significantly elevated in STZ-diabetic rats and the percentage
increase was 195.81%. Fenugreek significantly decreased STZ-induced hyperglycemia and the
percentage reduction was 53.66% in comparison with the diabetic control. Accordingly, there
was a significant decrease in serum insulin concentrations in diabetic rats, compared with
normal control (23.13%), and administration of fenugreek increase the insulin level and the
percentage elevation was 14.62% as compared to the diabetic control (Marzouk et al., 2013).
4.16.4.4 High density lipoprotein (HDL)
It is indicated from the statistical analysis (Table 4.71) that diets imparted non-momentous
differences on HDL level in all three studies.
150
Means for HDL in study I (normal diet) showed the values 37.12±1.13, 37.62±1.02 and
37.49±1.04 mg/dL for D0, D1 and D2 groups, respectively. However, in study II lowest HDL
level (31.26±0.88 mg/dL) was observed in D0 that elevated non-significantly in D1 (32.28±1.05
mg/dL) and D2 (31.87±1.06 mg/dL). Mean HDL concentration for D0 group in study III was
28.96±0.85 mg/dL that increased non-substantially to 30.16±0.84 mg/dL in D1 and 29.54±1.08
mg/dL in D2.
It is evident from the Fig. 4.13 that in study I increase in HDL was 1.01 & 1.36% with diets
D2 and D1, similarly in study II & III, diets D1 and D2 led to non-substantial increase in HDL
as compared to control as 3.25 & 4.13% and 1.96 & 2.02%, correspondingly.
4.16.4.5 Low density lipoprotein (LDL)
The statistical analysis indicated significant effect of diets on LDL in all studies (Table 4.72).
Means of study I indicated maximum LDL value 31.12±1.06 mg/dL in D0 that diminished to
29.05±0.56 and 29.99±0.65 mg/dL in D1 and D2 groups, respectively. Whereas in study II,
LDL value 46.85±0.73 mg/dL in D0 group was significantly decreased to 42.31±0.63 mg/dL
(D1) and 44.71±0.87 mg/dL (D2). Likewise in study III, mean LDL values for D0, D1 and D2
differed momentously i.e. 59.63±1.49, 52.33±0.93 and 54.96±0.74 mg/dL, correspondingly.
Fig. 4.14 depicted percent decrease in LDL values among different groups of rats in various
studies. In study I, substantial decrease by 3.63 and 6.64% in D2 and D1 groups was recorded
as compared to control. Likewise, significant reduction in LDL was observed during Study II
i.e. 4.56% in D2 and 9.68% in D1. Likewise in study III, diet containing fenugreek leaves
powder (D2) reduced the LDL level by 7.83%. Whilst diet comprised of seeds powder (D1)
resulted 12.25% LDL reduction.
4.16.4.6 Triglycerides
The statistical analysis indicated significant effect of diets on triglycerides in study II and III,
whereas non-momentous effect observed in study I (Table 4.73). Means of study I indicated
maximum triglycerides value 79.63±5.32 mg/dL in D2 that decreased to 79.00±5.24 and
76.27±4.93 mg/dL in D1 and D2 groups, respectively. Whereas in study II, triglycerides value
96.00±3.31 mg/dL in D0 group was significantly decreased to 91.66±3.08 mg/dL (D1) and
86.51±3.76 mg/dL (D2). Similarly in study III, mean triglycerides values for D0, D1 and D2
differed momentously i.e. 105.00±5.09, 93.09±3.47 and 98.36±3.96 mg/dL, respectively.

151
Table 4.70 Effect of supplemented diets on Insulin (µU/mL)
Studies
Diets
F value
D0 D1 D2
Study I 7.01±0.25 7.16±0.16 7.09±0.20 0.65NS
Study II 4.69±0.05b 4.88±0.04a 4.83±0.04a 19.1**
Study III 6.32±0.09b 6.53±0.10a 6.46±0.05ab 7.50**
**= Highly significant
NS= Non Significant
D0 : Control diet
D1 : Fenugreek seeds powder @ 10%
D2 : Fenugreek leaves powder @ 5%
Study I : Normal rats
Study II : Hyperglycemic rats
Study III: Hypercholesterolemic rats
Figure 4.12 Percent increase in Insulin as compared to control
2.11
4.01
3.25
1.09
2.96
2.22
0.00
0.50
1.00
1.50
2.00
2.50
3.00
3.50
4.00
4.50
Study I Study II Study III
D1 Fenugreek seed powder supplemented diet
D2 Fenugreek leaves powder supplemented diet

152
Table 4.71 Effect of supplemented diets on HDL (mg/dL)
Studies
Diets
F value
D0 D1 D2
Study I 37.12±1.13 37.62±1.02 37.49±1.04 0.29NS
Study II 31.26±0.88 32.28±1.05 31.87±1.06 1.37NS
Study III 28.96±0.85 30.16±0.84 29.54±1.08 2.05NS
NS= Non Significant
D0 : Control diet
D1 : Fenugreek seeds powder @ 10%
D2 : Fenugreek leaves powder @ 5%
Study I : Normal rats
Study II : Hyperglycemic rats
Study III: Hypercholesterolemic rats
Figure 4.13 Percent increase in HDL as compared to control
1.36
3.25
4.13
1.01
1.96 2.02
0.00
0.50
1.00
1.50
2.00
2.50
3.00
3.50
4.00
4.50
Study I Study II Study III
D1 Fenugreek seed powder supplemented diet
D2 Fenugreek leaves powder supplemented diet
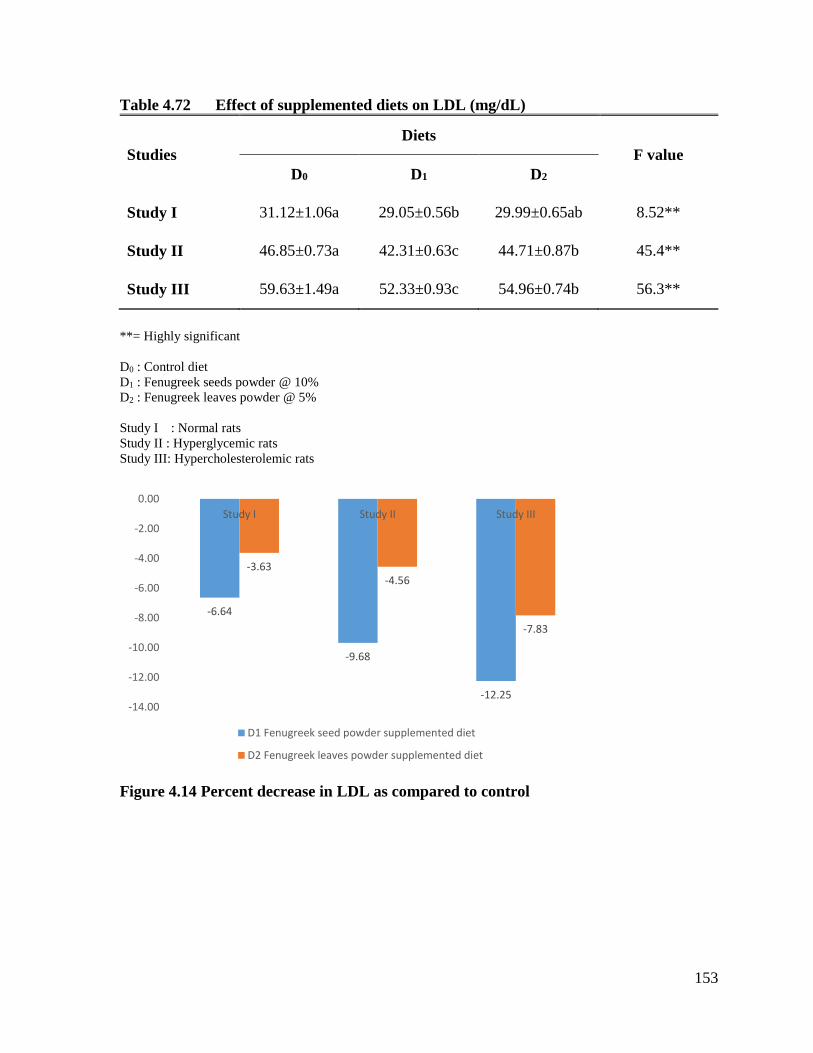
153
Table 4.72 Effect of supplemented diets on LDL (mg/dL)
Studies
Diets
F value
D0 D1 D2
Study I 31.12±1.06a 29.05±0.56b 29.99±0.65ab 8.52**
Study II 46.85±0.73a 42.31±0.63c 44.71±0.87b 45.4**
Study III 59.63±1.49a 52.33±0.93c 54.96±0.74b 56.3**
**= Highly significant
D0 : Control diet
D1 : Fenugreek seeds powder @ 10%
D2 : Fenugreek leaves powder @ 5%
Study I : Normal rats
Study II : Hyperglycemic rats
Study III: Hypercholesterolemic rats
Figure 4.14 Percent decrease in LDL as compared to control
-6.64
-9.68
-12.25
-3.63-4.56
-7.83
-14.00
-12.00
-10.00
-8.00
-6.00
-4.00
-2.00
0.00
Study I Study II Study III
D1 Fenugreek seed powder supplemented diet
D2 Fenugreek leaves powder supplemented diet

154
It is apparent from the Fig.4.15 that in study I the maximum reduction 3.45% was observed in
D1 followed by 0.47% in D2. Similarly in study II, D1 exhibited the highest reduction 9.89%
whereas a decline in D2 4.52% was observed. In study III, diet containing seeds powder
exhibited a reduction of 11.34% while diet containing leaves powder showed a decline of
6.32%.
The findings of Pipelzadeh et al. (2003) supported current study results concerned cholesterol,
LDL & triglycerides observed decreasing trend by feeding experimental rats with fenugreek
supplemented diets and increased serum HDL cholesterol level as compared to non-treated
control group. Similar results were reported by Belguith-Hadriche et al. (2013) who observed
reduced level of low density lipoprotein (LDL), triglycerides and increased level of high
density lipoprotein (HDL) when compared with those of rats that have cholesterol-rich diet.
These lipid effects were correlated to occurrence of flavonoids in fenugreek, especially
naringenin i.e. major flavonoid compound present in fenugreek. The present results are
supported by Moosa et al. (2006) who reported fenugreek dose of 25g orally two times in a
day for period of three & six weeks to hypercholesterolmic individuals produces significant
reduction in triglyceride and LDL cholesterol. In another study found supplementation of
fenugreek leaves in diet decreased triglycerides in diabetic rats (Annida and Prince, 2004). The
higher content of high density lipoproteins (HDL) are very important in body due to relation
with reduced risk of heart diseases (Young et al., 2004). The high level of HDL expedites
cholesterol transport from serum to liver, where it catabolized and finally excreted from the
body. The ratio of LDL and HDL is consider as important risk factor of atherosclerosis and
this ratio can be decreased with supplementation of fenugreek seeds powder and ethyl acetate
extract in diet. The low level of serum HDL and high level of LDL are correlated with increased
atherosclerosis risk (Korhonen et al., 1996). The increasing level of HDL and decreasing LDL
level in experimental rats depicted the antiatherogenic property of the ethyl acetate extract of
fenugreek. The possible mechanism of hypocholesterolaemic property may be due to dietary
cholesterol absorption inhibition in intestine or its production by the liver (Bursill and Roach,
2006) or stimulation of the biliary secretion of cholesterol and excretion through feces
(Krzeminski et al., 2003).

155
The reduction in total lipid, triglyceride, LDL and increase of HDL in this study may be due
to crude fiber and saponins content in fenugreek. Al‐Habori and Raman (1998) reported that
the crude saponins extract was the most effective in reducing hypercholesterolemia. The lipid
profile is extracted in bile and then reabsorbed from the intestine. Therefore, it can be suggested
that saponins may bind bile salts which are necessary for absorption of these substances or
bind directly in the intestine and prevent reabsorption (Madar and Shomer, 1990). This may
be due to the fact that saponins form insoluble complex with lipid profile (Rao et al., 1996).
Saponins and crude fibre extracted from fenugreek seeds significantly resulted in reduction of
cholesterol and triglyceride (El-Hussary, 1993). Fenugreek seeds may reduce triglyceride by
decreasing non Esterified Fatty Acids (NEFA) which are always the major component for this
fraction of lipid profile (Reinila, 1981). The study of Narender et al. (2006) reported that, amino
acid, 4-hydroxy isoleucine isolated from fenugreek seeds significantly decreased total
cholesterol (22%), plasma triglyceride (33%) and free fatty acids (14%), accompanied by an
increase in HDL by 39% in the dyslipidemic hamster model. There was a significant decreased
in total lipid, triglyceride and LDL concentration on long term application of fenugreek seeds
in all the supplemented groups. However, long term administration of fenugreek seeds had a
significant increase on High Density Lipoprotein (HDL). Low density lipoprotein and high
density lipoprotein worked as antagonist, decreased in LDL and increased HDL which
represents protection against atherosclerosis and coronary heart disease (Murray et al., 2003).
Mean serum total cholesterol value in normal healthy group was found 98.5±2.1 mg/dl that
observed significantly increased in positive control group (140.33±3.2 mg/dl). When
fenugreek extract was added in diet, it significantly reduced the serum total cholesterol to
107.83±2.2 mg/dl (El-Soud et al., 2007). Daily administration of fenugreek for 30 days
succeeded to reduce total cholesterol and triglycerides significantly. Concerning triglycerides
it was 53.68% and for cholesterol it was 48.22% when compared with diabetic control rats
(Marzouk et al., 2013).
4.16.5 Liver functions tests
Liver function tests comprised of aspartate transaminase (AST), alanine transaminase (ALT)
and alkaline phosphatase (ALP) were carried out for safety reasons.

156
4.16.5.1 Aspartate aminotransferase (AST)
The statistical analysis given in Table 4.74 indicated that AST level was affected substantially
in all three studies. Mean AST values for D0, D1 and D2 groups in study I were 105.12±3.00,
100.33±2.26 and 101.27±2.44 IU/L, correspondingly. However, in study II, means for AST
indicated maximum value in D0 (134.56±4.31 IU/L) than that of D1 (121.52±3.31 IU/L) and
D2 (128.40±2.15 IU/L). Besides in study III, D0 group showed maximum AST level
(165.32±5.65 IU/L) that reduced substantially in D1 (146.75±5.33 IU/L) and D2 (156.01±4.510
IU/L).
4.16.5.2 Alanine transaminase (ALT)
It is obvious from the statistical analysis that diets substantially affected serum ALT level in
all studies except for study I (Table 4.75). In this case, mean ALT values for D0, D1 and D2
were 41.12±1.60, 38.52±1.40 and 39.41±1.93 IU/L, respectively. Nonetheless in study II, this
trait was higher in D0 (51.23±1.88 IU/L) that significantly lowered in D1 (45.16±1.69 IU/L)
and D2 (48.66±2.04 IU/L) groups. Likewise in study III, the higher ALT value 59.63±1.95
IU/L was in D0 group that significantly decreased to 53.40±0.96 and 56.68±1.60 IU/L in D1
and D2 groups, respectively.
4.16.5.3 Alkaline phosphatase (ALP)
It is deduced from the statistical analysis that ALP level was affected significantly by diets in
all studies (Table 4.76). Means for ALP in study I were 112.36±2.37, 104.91±3.43 and
107.20±2.45 IU/L in D0, D1 and D2 groups, respectively.
Nevertheless in study II, higher ALP value was noticed in D0 (185.12±2.64 IU/L) that
decreased significantly in D1 (165.77±3.46 IU/L) and D2 (175.64±3.48 IU/L) groups. In study
III, high cholesterol diet induced enhancement in the ALP level by 201.32±4.14 IU/L in D0
whereas ALP values were reduced in D1 and D2 groups by 174.65±4.71 and 188.46±4.09 IU/L,
respectively.
Serum enzymes like ALT and AST are used in the evaluation of hepatic disorders. The
increasing activity of these enzymes depicted active liver damage. Inflammatory hepatocellular
disorders result in extremely elevated transaminase levels (Hultcrantz et al., 1986).
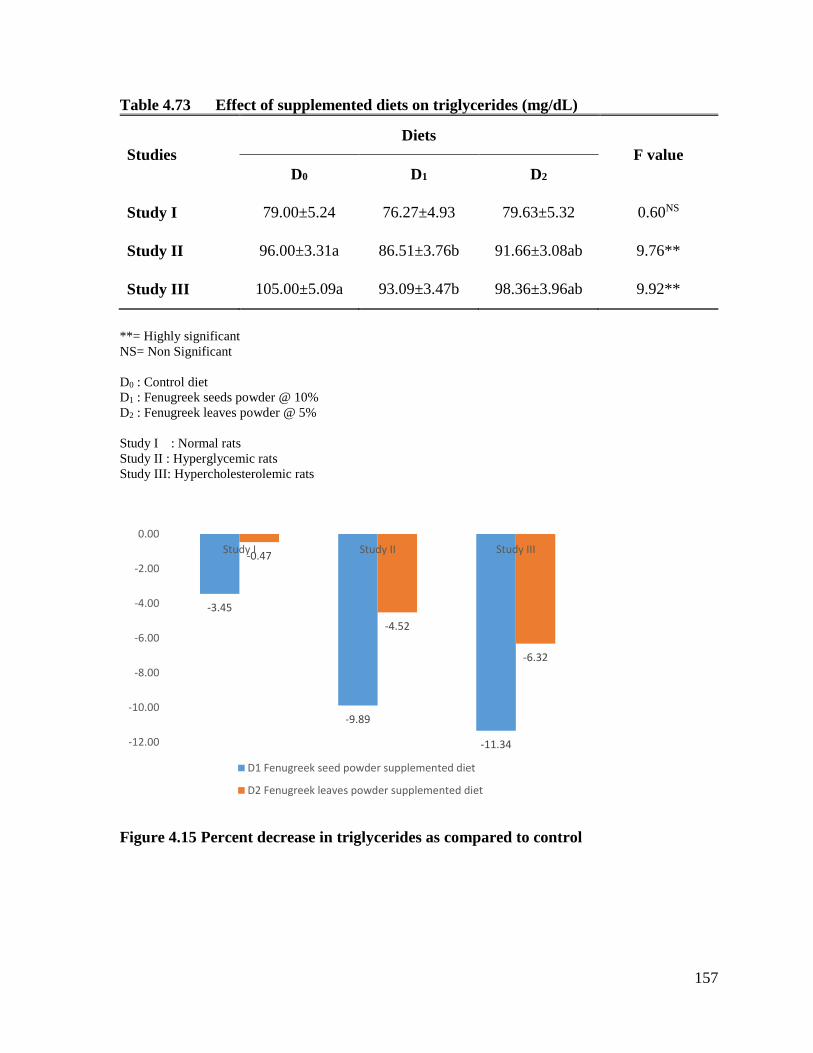
157
Table 4.73 Effect of supplemented diets on triglycerides (mg/dL)
Studies
Diets
F value
D0 D1 D2
Study I 79.00±5.24 76.27±4.93 79.63±5.32 0.60NS
Study II 96.00±3.31a 86.51±3.76b 91.66±3.08ab 9.76**
Study III 105.00±5.09a 93.09±3.47b 98.36±3.96ab 9.92**
**= Highly significant
NS= Non Significant
D0 : Control diet
D1 : Fenugreek seeds powder @ 10%
D2 : Fenugreek leaves powder @ 5%
Study I : Normal rats
Study II : Hyperglycemic rats
Study III: Hypercholesterolemic rats
Figure 4.15 Percent decrease in triglycerides as compared to control
-3.45
-9.89
-11.34
-0.47
-4.52
-6.32
-12.00
-10.00
-8.00
-6.00
-4.00
-2.00
0.00
Study I Study II Study III
D1 Fenugreek seed powder supplemented diet
D2 Fenugreek leaves powder supplemented diet

158
The study of Vozarova et al. (2002) reported that, high ALT value is an indicator of type 2
diabetes risk and proposed a potential role of liver in the pathogenesis of type 2 diabetes. In
similar way Kaviarasan et al. (2007) suggested that polyphenolic compounds present in
fenugreek seeds can be considered cytoprotective during ethanol induced liver damage. The
seeds extract addition in the diet had a positive effect on both lipid profile and qualitative &
quantitative properties of collagen in alcoholic liver disease. In diabetic rats, ALP activity was
found significantly increased by 72.31% to their normal levels. This protective role is due to
presence of bioactive phytochemicals in fenugreek seeds. (El-Dakak et al., 2013).
The increase in activity of ALP is mainly due to the leakage of these enzymes from liver
cytosol into the blood stream (Mansour et al., 2002). On the other hand, addition of fenugreek
extract in the diet of diabetic rats resulted in decreased ALT, ALP & AST activity and leads
towards normal values. The increased in values of serum urea, uric acid and creatinine were
observed in diabetic rats that may be due to disturbance in metabolic activity, reflected in high
activities of lipid peroxidation, xanthine oxidase and increased cholesterol and triacylglycerol
(Anwar and Meki, 2003). The study of Eidi et al. (2007) explained the effect of fenugreek
extract feeding for 14 days on the level of alanine aminotransferase (ALT) and aspartate
aminotransferase (AST) in normal and diabetic rats and found significant decreased in these
parameters. Similar significant changes observed with legumes diets on serum AST, ALT and
AP, compared with rats of the positive group. Serum AST, ALT and AP were the lowest in
rats fed on fenugreek seeds (Mahfouz et al., 2012).
The activities of liver function markers (AST, ALT, ALP) were significantly elevated in STZ-
diabetic rats by 14.33%, 42.73% and 91.96%, respectively when compared with the normal
controls rats. The rats administrated fenugreek for 30 days showed significant reduction in
these marker enzyme activities to almost normal levels. The percentage of decrease, when
compared to diabetic control rats was 38.30% for AST; 42.12% for ALT and 27.12% for ALP
(Marzouk et al., 2013).
A team of researchers Hamza et al. (2012) designed an experiment to explore preventive and
curatine perspective of fenugreek in type 2 diabetis rats fed on a fat rich diet. Fenugreek extract
was fed to the rats @ 2 mg/kg body weight for whole trial period. Rats were divided in three
groups i.e. control, high fat diet and fenugreek extract treated high fat diet group. Control group
159
Table 4.74 Effect of supplemented diets on serum AST (IU/L)
Studies
Diets
F value
D0 D1 D2
Study I 105.12±3.00a 100.33±2.26b 101.27±2.44ab 4.79*
Study II 134.56±4.31a 121.52±3.31c 128.40±2.15b 18.7**
Study III 165.32±5.65a 146.75±5.33c 156.01±4.51b 16.00**
* = Significant
**= Highly significant
Table 4.75 Effect of supplemented diets on serum ALT (IU/L)
Studies
Diets
F value
D0 D1 D2
Study I 41.12±1.60 38.52±1.40 39.41±1.93 3.16NS
Study II 51.23±1.88a 45.16±1.69b 48.66±2.04a 13.2**
Study III 59.63±1.95a 53.40±0.96c 56.68±1.60b 19.8**
**= Highly significant
NS= Non Significant
D0 : Control diet
D1 : Fenugreek seeds powder @ 10%
D2 : Fenugreek leaves powder @ 5%
Study I : Normal rats
Study II : Hyperglycemic rats
Study III: Hypercholesterolemic rats

160
Table 4.76 Effect of supplemented diets on serum ALP (IU/L)
Studies
Diets
F value
D0 D1 D2
Study I 112.36±2.37a 104.91±3.43b 107.20±2.45b 9.31**
Study II 185.12±2.64a 165.77±3.46c 175.64±3.48b 45.1**
Study III 201.32±4.14a 174.65±4.71c 188.46±4.09b 47.5**
**= Highly significant
Table 4.77 Effect of supplemented diets on Urea (mg/dL)
Studies
Diets
F value
D0 D1 D2
Study I 22.10±0.35 21.65±0.66 21.88±0.77 0.64NS
Study II 35.16±0.76a 33.58±0.75b 34.06±0.97ab 4.71*
Study III 29.63±0.63 28.41±1.72 28.67±1.94 0.86NS
*= Significant
NS= Non Significant
D0 : Control diet
D1 : Fenugreek seeds powder @ 10%
D2 : Fenugreek leaves powder @ 5%
Study I : Normal rats
Study II : Hyperglycemic rats
Study III: Hypercholesterolemic rats

161
provided a lower value of triglyceride (29.9±19.7 mg/dL), which was elevated by feeding on
high fat diet in second group (62.8±18.3 mg/dL). In third group a substantial decline in
triglyceride was found due to the presnce of fenugreek seeds extract (17.9±9.7 mg/dL). One of
the peers Kumar et al. (2014) investigated the effect of aqueous extract of fenugreek on serum
lipid levels in high fat diet (HFD)-induced obese rats to varify its potential to ameriolae
dislipidemia. By adding fenugreek seeds extract in different doses, the elevated level of LDL
reduced, restored the level of HDL and showed pronounced effect in reducing triglycerides.
4.16.6 Renal function tests
Renal functioning tests were carried out to determine the effect of fenugreek supplemented
diets against renal malfunctions.
4.16.6.1 Urea
The statistical analysis indicated significant effect of diet on urea in study II, whilst, non-
significant effect was observed for other two diets in study I & III (Table 4.77).
Means of study I indicated maximum serum urea value 22.10±0.35 mg/dL in D0 that
diminished to 21.65±0.66 and 21.88±0.77 mg/dL in D1 and D2 groups, respectively. Whereas
in study II, serum urea value 35.16±0.76 mg/dL in D0 group was significantly decreased to
33.58±0.75 mg/dL (D1) and 34.06±0.97 mg/dL (D2). Likewise in study III, mean serum urea
values for D0, D1 and D2 differed momentously i.e. 29.63±0.63, 28.41±1.72 and 28.67±1.94
mg/dL (Table 4.77).
4.16.6.2 Creatinine
The statistical analysis indicated non-substantial effect of diets on creatinine level in study I &
III whilst significant tendency for this trait was noticed in study II (Table 4.78).
In study I, D0 showed the highest creatinine value 0.81±0.02 mg/dL whereas, D1 and D2 groups
exhibited lower values as 0.78±0.02 and 0.79±0.02 mg/dL, respectively (Table 4.78).
Likewise, in study II, creatinine level in D0 was 1.09±0.03 mg/dL that differed momentously
in D1 and D2 as 1.04±0.01 and 1.06±0.03 mg/dL, respectively. Nevertheless in study III, a non-
significant decline was observed from 0.98±0.03 mg/dL in D0 to 0.94±0.02 mg/dL in D1.

162
The results of current study are in harmony with findings of Eidi et al., (2007) who studied
that effect of oral administration of fenugreek extract for two weeks on level of serum urea,
uric acid and creatinine in normal and diabetic rats. The feeding of extract significantly lower
the values of serum urea, uric acid and creatinine levels. Creatinine is a break down product of
creatinine phosphate and an indicator of kidney functioning. During healthy state, creatinine is
filtered by the kidney but during disease condition its level increased drastically. The elevated
blood creatinine is an indicator for impaired glomerulus filtration that is a first sign of kidney
diseases. Moreover, protein glycation in diabetes may lead to increased release of purine,
muscle wasting and main source of uric acid, as well as increased activity of xanthine oxidase
(Anwar and Meki, 2003).
Similarly, increased values of serum uric acid, urea nitrogen and creatinine in diabetic rats as
compared to non-diabetic. The increased uric acid level in diabetic rats may be due to metabolic
disturbance in diabetes reflected in high activities of xanthine oxidase, lipid peroxidation and
increased triglycerides and cholesterol (Madianov et al., 1999). Treating diabetic groups with
high protein diet containing bread fortified with fenugreek decreased the mean values of serum
uric acid, urea nitrogen and creatinine, as compared to the positive control groups. Suresh et
al. (2012) reported that in Southeast Asia, the water extract of fenugreek seeds is used in the
management of diabetes and is known to improve kidney function during diabetes.
The research work of Meera et al. (2009) reported that significant hepatoprotective effects
were obtained against liver damage by adding ethanol extract of fenugreek leaves in rats diets.
There was non-significant changes in serum creatinine, whereas serum urea was significantly
decreased in rats fed on fenugreek seeds (Mahfouz et al., 2012). The results of current
investigation are also in harmony with study of El-Dakak et al. (2013) who observed decreased
level of the urea, uric acid and creatinine with administration of aqueous extract of
Lepidiumsativum L., lupin and fenugreek or their mixture in streptozotocin-induced diabetic
rats. The positive control showed a significant increase in creatinine, urea, and uric acid
compared to negative control group. However, fenugreek extract treated rat group showed a
significant decrease in serum creatinine, urea, and uric acid compared to positive control group.

163
Table 4.78 Effect of supplemented diets on creatinine (mg/dL)
Studies
Diets
F value
D0 D1 D2
Study I 0.81±0.02 0.78±0.02 0.79±0.02 0.98NS
Study II 1.09±0.03 1.04±0.01 1.06±0.03 5.18*
Study III 0.98±0.03 0.94±0.02 0.95±0.03 2.44NS
* = Significant
NS= Non Significant
Table 4.79 Effect of supplemented diets on red blood cell indices (cells/pL)
Studies
Diets
F value
D0 D1 D2
Study I 7.02±0.28 7.23±0.36 7.11±0.40 0.43NS
Study II 6.01±0.34 6.23±0.48 6.09±0.36 0.36NS
Study III 5.32±0.38 5.54±0.45 5.43±0.54 0.27NS
NS= Non Significant
D0 : Control diet
D1 : Fenugreek seeds powder @ 10%
D2 : Fenugreek leaves powder @ 5%
Study I : Normal rats
Study II : Hyperglycemic rats
Study III: Hypercholesterolemic rats

164
4.16.7 Hematological analysis
4.16.7.1 Red blood cell (RBC)
The statistical analysis in Table 4.79 showed that all the diets non-significantly affected
the RBC content of rats in all the three studies.
In study I the maximum value was observed in the diet D1 as 7.23±0.36 cells/pL followed
by D2 and D0 as 7.11±0.40 & 7.02±0.28 cells/pL, correspondingly. Likewise in study II and
study III the maximum values for RBC was observed in D1 as 6.23±0.48 and 5.54±0.45
cells/pL, respectively while minimum RBC content were observed in control treatment in both
studies as 6.01±0.34 & 5.32±0.38 cells/pL, respectively (Table 4.79).
4.16.7.2 White blood cells count (WBCs)
The statistical analysis indicated that diets imparted non-significant differences on WBCs in
all the three studies (Table 4.80).
In study I the maximum value was observed in the diet D0 as 12.36±0.29 cells/nL
followed by D2 and D1 as 12.24±0.38 & 12.08±0.23 cells/nL, correspondingly. While in
study II maximum WBC content was observed in D0 as 13.29±0.54 cells/nL and minimum was
noticed in D2 12.85±0.49 cells/nL. Furthermore, in study III maximum level was observed in
Do while minimum was observed in D1 as 16.96±0.65 and 16.40±0.51 cells/nL, respectively.
4.16.7.3 Platelets count (PLC)
The statistical analysis given in Table 4.81 illustrated that all the diets non significantly
affected the platelets count of rats in all the three studies.
In study I the maximum value was observed in the diet D1 as 7.28±0.38 followed by D2
and D0 as 7.19±0.34 & 7.12±0.42, correspondingly. While in study II maximum platelets were
observed in D2 as 6.83±0.46 and minimum was noticed in D0 6.63±0.30. Furthermore, in study
III maximum level was observed in D2 while minimum was observed in D0 as 6.31±0.46 and
6.13±0.34, respectively (Table 4.81).

165
Table 4.80 Effect of supplemented diets on white blood cell Indices (cells/nL)
Studies
Diets
F value
D0 D1 D2
Study I 12.36±0.29 12.08±0.23 12.24±0.38 0.32NS
Study II 13.29±0.54 13.09±0.56 12.85±0.49 0.60NS
Study III 16.96±0.65 16.40±0.51 16.72±0.56 1.12NS
NS= Non Significant
Table 4.81 Effect of supplemented diets on Platelets count
Studies
Diets
F value
D0 D1 D2
Study I 7.12±0.42 7.28±0.38 7.19±0.34 0.21NS
Study II 6.63±0.30 6.72±0.39 6.83±0.46 0.35NS
Study III 6.13±0.34 6.23±0.39 6.31±0.46 0.26NS
NS= Non Significant
D0 : Control diet
D1 : Fenugreek seeds powder @ 10%
D2 : Fenugreek leaves powder @ 5%
Study I : Normal rats
Study II : Hyperglycemic rats
Study III: Hypercholesterolemic rats

166
The present result trend was in accordance with the outcomes of Khalil (2004) who explored
blood biochemical profile and its behavior under fenugreek administration in rats. Results
showed a non-momentous effect of fenugreek extract on red blood cells and white blood cells
as it changes in hyperglycemic and fenugreek treated hyperglycemic groups, correspondingly.
The protective effect of fenugreek polyphenolic fraction against oxidative damage to red blood
cells was investigated by Kaviarasan et al. (2004). They devised a trial to investigate and
validate the potency of fenugreek seeds polyphenols to protect RBC against hydrogen peroxide
(H2O2) induced oxidation in normal and diabetic models. In diabetic models, increased
vulnerability to oxidative damage and lipid peroxidation was found when compared with
normal subjects. In the study of Sindhu et al. (2012) effect of fenugreek extract various
hematological aspects was enumerated such as WBC count and RBC count in experimental
animals with induced arthritis. In control arthritic group, red blood cell were in lower range
i.e. 3.52±0.2 (103/mm3). Fenugreek extract was prepared in distilled water and fed @ 75
mg/kg/day through oral administration, that resulted in little rise in RBC content (4.52±0.03
103/mm3). In the same table data showed that the control +ve group was significantly
decreased RBCs 10/µL as compared with the control negative group. All supplemented
diets of anemic rats revealed an enhancement of red blood cells count as compared to
the control (+). The best results were obtained for diets supplemented with fenugreek
leaves and germinated fenugreek (7.6±0.8 and 7.1±0.9 10/µL) as compared with the
control negative group (Mahmoud et al., 2012).
The scientific research of Abdul-Rehman (2012) investigated the effect of fenugreek seeds on
blood characteristics such as WBC, RBC and thrombocytes etc. in experimental animals. The
animals were divided into four groups, control, fenugreek extract fed once a week, twice a
week and daily. Fenugreek seeds showed little improvement in blood picture in comparison
with control represented by the momentous increment in the RBCs (2.31±0.05 to 2.92±0.07
million/mm3 from 1st to 4th group. The findings also revealed non-significant and haphazard
effect of fenugreek seeds on white blood cell content as it 17379.33±272.75, 17358.67±263.05,
17582.00±234.61 and 17500.22±251.93 thousand/mm3 in 1st, 2nd, 3rd and 4th groups,
correspondingly. Fenugreek is an ancient therapeutic herb with documented use for the
prevention of arthritis and inflammation. A study was planned by Suresh et al. (2012) to
investigate the extent of fenugreek extract on blood parameters such as red blood cells and

167
white blood cells in albino rats. The RBC content in arthritic control was found to be
4.178±0.28 million/mm3, that showed a little increment 4.270±0.25 and 4.783±0.46
million/mm3 by feeding on fenugreek extract at different doses 200 and 400 mg/kg. The white
blood cell content in arthritic control was found to be 8,528±71.32 thousand/mm3, that showed
deduction upto 7,873±56.48 and 6,989±58.54 thousand/mm3 when fed on different doses of
fenugreek extract i.e. 200 and 400 mg/kg, correspondingly. The present outcomes were also in
harmony with the research of Abdelgawad et al. (2012) who determined the preventive
potential of fenugreek seeds @ 2 and 4% (w/w feed) on experimental models. The mean
difference in platelets count depicted non-momentous effect of fenugreek seeds on platelet
count in all groups i.e. fed on 2 and 4% diet.

168
Chapter 5
SUMMARY
The research work was carried out to evaluate the acceptability of fenugreek utilization in
baked products. The wheat was cleaned by sieving followed by tempering and milling to get
straight grade flour. Likewise, fenugreek leaves and seeds were cleaned by washing and
screening followed by drying and grinding to get fine powder. The resultant powder was added
in wheat flour with various percentages to get composite flours. The wheat flour, fenugreek
leaves and seeds powder was analyzed for their chemical composition, mineral profile and
wheat flour for rheological properties. The composite flours were also analyzed for their
chemical composition, mineral profile, antioxidant assay and rheological properties. The bread
prepared from composite flours was subjected to chemical analysis, mineral profile, color
tonality, texture analysis, antioxidant assay and sensory quality. On the basis of antioxidant
assay, rheological characteristics and overall acceptability of bread, two best treatments each
from leaves and seeds powder were selected for efficacy study.
Wheat flour was evaluated for chemical composition by analyzing various parameters;
including 13.5, 0.41, 10.5, 1.13 and 0.31% of moisture, ash, crude protein, fat, fiber,
respectively whilst, Nitrogen Free Extract (NFE) was found to be 74.15%. Fenugreek leaves
powder (dry weight basis) was subjected to different quality assessment and revealed moisture,
ash, crude protein, fat, fiber and NFE as 9.38, 6.37, 4.30, 0.88, 1.98 and 77.09%, respectively.
Chemical composition of the fenugreek seeds has been illustrated as moisture (10.65%), ash
(4.14%), crude protein (22.86%), fat (6.98%), fiber (7.90%) and NFE (47.47%). The mineral
profile of wheat flour contains sodium, potassium, iron, calcium, copper, zinc and manganese
was observed as 3.12, 130.00, 3.50, 22.00, 0.13, 0.19 and 0.70 mg/100g, respectively. The
fenugreek leaves powder mineral composition indicated 58.71 mg/100g sodium, 481.91
mg/100g potassium, 6.72 mg/100g iron, 589.00 mg/100g calcium, 0.15 mg/100g copper, 0.90
mg/100g zinc and 0.75 mg/100g manganese, respectively. The mineral profile of fenugreek
seeds powder exhibited that it contains potassium in the highest quantity of 296.41 mg/100g
followed by calcium (160.00 mg/100g), sodium (23.69±2.18 mg/100g), iron (19.60±1.98
mg/100g), zinc (2.10 mg/100g), manganese (1.20 mg/100g) and copper (0.75 mg/100g).
169
Different supplemented (treatments) flour prepared by the addition of fenugreek leaves and
seeds powder were also analyzed for different chemical characteristics. The mean values
ranged between 12.88 to 13.29, 0.71 to 1.30, 10.18 to 9.57, 1.12 to 1.13, 0.39 to 0.56 & 74.31
to 74.60% for moisture, ash, crude protein, crude fat, crude fiber and NFE, respectively in
different leaves powder supplemented treatments. In seeds supplemented treatments moisture
content were observed between (13.08 to 13.33%), ash (0.60 to 0.97%), crude protein (11.13
to 12.35%), fat (1.42 to 2.01%), fiber (0.68 to 1.45%) and NFE (70.15 to 72.82%), accordingly.
Momentous differences were observed in sodium, potassium, iron, calcium and zinc whereas,
copper and manganese content were found non-momentous among different treatments
supplemented with fenugreek leaves powder. The results for fenugreek seeds powder
supplementation exhibited significant difference among treatments for mineral. Mean values
for sodium, potassium, iron, calcium, copper, zinc & manganese content ranged from 5.90 to
11.46, 147.60 to 182.79, 3.66 to 3.98, 50.35 to 107.05, 0.14 to 0.18, 0.23 to 0.30 and 0.71 to
0.75 mg/100g in leaves powder supplemented treatments, whereas treatments with seeds
powder supplementation ranged from 6.07 to 11.98, 150.92 to 192.76, 4.31 to 5.92, 28.90 to
42.71, 0.16 to 0.22, 0.29 to 0.48 and 0.73 to 0.78 mg/100g, respectively.
The rheological characteristics were significantly affected with supplementation of
fenugreek leaves and seeds powder. Dough properties like water absorption increased from
60.60 to 63.10%, dough development time enhanced from 6.17 to 7.50 min, dough stability
also increased 11.71 to 12.81 min while mixing tolerance index decreased from 26.00 to 18.45
BU with leaves powder supplemented treatments. The dough properties of seeds powder
supplemented treatments had water absorption in range from 60.60 to 62.17%, dough
development time 6.17 to 8.40 min, dough stability 11.71 to 13.78 min and mixing tolerance
index 16.46 to 26.00 BU. Mixing time of dough decreased from 5.73 to 4.70 min in leaves
supplemented flours whereas in seeds supplemented flours 5.73 to 4.80 min.
The statistical analysis showed that addition of fenugreek in wheat flour imparted
significant differences on the antioxidant indices of treatments. Regarding leaves
supplemented treatments, highest TPC was found in T3 (390.00 mg GAE/100g) and
minimum in T0 (117.00 mg GAE/100g), in similar way increasing trend was found in total
flavonoids (2.38 to 2.97 mg CE/g) with increasing supplementation level. Likewise,
170
antioxidant activities enhanced with increasing the supplementation level with maximum
DPPH scavenging potential (47.00%), β-carotene assay (39.00%), FRAP (401.00 µmol Fe2+/g)
observed in 15% fenugreek leaves powder (T3). The mean values revealed that TPC in different
treatments were 117.00 (T0), 305.00 (T4), 410.00 (T5) and 450.00 mg GAE/100g (T6) while
total flavonoids 2.38 (T0) to 3.01 mg CE/g (T6), showed ascending order with increasing
fenugreek seeds powder supplementation in wheat flour. From mean squares of DPPH
scavenging activity a highly significant relation was observed for supplementation and mean
ranged from 35.00 (T0) to 58.00% (T6). The mean values for β-carotene assay illustrated that
it varied from 33.00% (T0) to 51.00% (T6), similar increasing trend observed for FRAP values
with maximum found in T6 (501.00 µmol Fe2+/g) and minimum in T0 (222.00 µmol Fe2+/g)
that indicates inclining trend with increasing percentage of fenugreek seeds powder.
In the product development phase, bread was prepared with varying level of fenugreek leaves
and seeds powder. Momentous variations in chemical composition of bread was observed like
moisture (34.46 to 34.68%), ash (1.24 to 2.24%), crude fiber (1.27 to 1.44%) and NFE (45.49
to 45.67%). The increase was observed by increasing leaves supplementation level while crude
protein and crude fat were decreased as supplementation level enhanced attributed to low
protein and fat content of fenugreek leaves. The mean moisture content of bread supplemented
with seeds powder varied from 34.46 to 34.63%, ash content found in a wide range as T0
(1.24%), T4 (1.39%), T5 (1.55%) and T6 (1.72%), crude protein revealed a decreasing trend as
T0 (11.12%), T4 (11.74), T5 (12.32%) and T6 (12.79%). The mean crude fat content in T0
(control) was found to be 5.97% whereas, the incorporation of seeds powder in the bread
resulted a progressive increase in fat content i.e. T4 (6.25%), T5 (6.54%) and T6 (6.81%). The
mean values for fiber content (Table 4.26) were observed in the range of 1.27% (T0) to 2.29%
(T6). Mean values for NFE illustrated decreasing trend as T0 (45.49%), T4 (44.35%), T5
(43.04%) and T6 (41.90%), respectively.
As both fenugreek leaves and seeds were found rich source of minerals hence its incorporation
in bread increased mineral content that leads to beneficial health effects. The mean values for
sodium content ranged from 4.10 to 12.28 and potassium 124.00 to 177.18 mg/100g. It was
observed that the iron content ranged from 3.44 to 3.86 and calcium content in bread ranged
from 19.96 to 104.78 mg/100g among different treatments. The highest copper value observed
in T3 (0.16 mg/100g) followed by T2 (0.14 mg/100g), T1 (0.12 mg/100g) whilst, the lowest
171
was exhibited in T0 (0.11 mg/100g). The zinc content varied from 0.17 to 0.26 mg/100g and
manganese content ranged from 0.66 to 0.71 mg/100g with highest content found in treatment
having 15% fenugreek leaves powder. Mean values for different seeds powder treatments
explained that maximum sodium was (12.83 mg/100g) in T6 followed by T5 (10.05 mg/100g),
T4 (7.02 mg/100g) whereas, control (T0) showed minimum value (4.10 mg/100g). The
potassium and iron content was found in the range of 124.00 to 187.30 mg/100g and 3.44 to
5.81 mg/100g, respectively. Mean values of calcium content increased by adding fenugreek
seeds powder with highest found in T6 (40.46 mg/100g) and lowest (19.96 mg/100g) in T0. The
copper content ranged from 0.11 to 0.19 mg/100g and zinc content varied from 0.17 to 0.46
mg/100g amongst different treatments. The highest manganese content observed in T6 (0.74
mg/100g) followed by T5 (0.73 mg/100g), T4 (0.71 mg/100g) and T0 (0.66 mg/100g).
Moreover, treatments had significant impact on antioxidant potential of the bread. The total
phenolic content showed momentous variations among leaves powder supplemented
treatments i.e. T0, T1, T2 & T3; 99.00, 198.00, 213.00 and 315.00 mg GAE/100g whereas,
means for total flavonoids; T0 (2.13 mg CE/g), T1 (2.47 mg CE/g), T2 (2.65 mg CE/g) and T3
(2.84 mg CE/g). The values of free radical scavenging activities ranged from 31.00 to 43.00%
that revealed enhanced antioxidant activity with increasing the supplementation level. The
highest β-carotene value 35.00% was recorded in T3 followed by T2 (33.00%) and T1 (31.00%)
whilst, the lowest 29.00% in control (T0). The recorded values for FRAP illustrated that T6
exhibited maximum reducing power (356.00 µmol Fe2+/g) followed by T2 (254.00 µmol
Fe2+/g) and T1 (201.00 µmol Fe2+/g) while minimum in T0 (167.00 µmol Fe2+/g). Means from
seeds powder supplemented treatments indicated highest TPC (413.00 mg GAE/100g) in T6
followed by T5 (341.00 mg GAE/100g) and T4 (238.00 mg GAE/100g). As examined from
mean values, total flavonoids varied from 2.13 to 2.91 mg CE/g that showed inclining trend
with increasing supplementation level. Means of DPPH scavenging activity for different
treatments observed as; T0 (31.00%), T4 (45.00%), T5 (49.00%) and T6 (51.00%). The
maximum β-carotene values found in T6 (43.00%) while minimum in T0 (29.00%), the mean
for FRAP values illustrated highest reducing power (450.00 µmol Fe2+/g) @ 15% seeds powder
supplementation while lowest (167.00 µmol Fe2+/g) in wheat flour (T0).
Mean squares regarding color tonality indicated the significant impact of supplementation on
treatments. Increasing concentration of leaves powder decreased color values except for b* and

172
chroma. Likewise, additional increments of seeds powder decreased L* values & hue angle
while increasing trends of a* and b* and chroma. The addition of these powders non-
significantly influenced the textural characteristics i.e. chewiness, cohesiveness, elasticity,
gumminess, hardness and springiness of the bread.
Sensory evaluation of fenugreek leaves and seeds powder based bread explicated significant
effect of treatments and storage time on volume, aroma, taste and texture, while remaining
traits varied non-significantly. It was expounded from the means scores for overall
acceptability that bread containing 5% leaves powder and 10% seeds powder were considered
best with assigned score of 6.17 & 6.75 as compared to 7.16 (control). From the present
exploration, it is deduced that fenugreek leaves powder @ 5% and seeds powder @ 10% rated
better during sensory evaluation. Moreover, these treatments were also rich in bioactive
molecules hence selected for further use in efficacy studies.
Series of efficacy trials were conducted in normal (study I), hyperglycemic (study II) and
hypercholesterolemic (study III) rats modeling. The diets prepared from the selected treatments
i.e. 10% fenugreek seeds powder (D1) and 5% fenugreek leaves powders (D2) along with
control (D0) were fed to the respective groups of rats for a period of eight weeks. Water intake
and feed consumed on daily basis while body weights of individual rats in each group were
recorded weekly to determine the effect of respective diet on these parameters. The increase
of feed intake in different groups of rats explored as; normal rates (29.39 to 38.23 g/rat/day),
hyperglycemic rats (29.63 to 38.66 g/rat/day) and hypercholesterolemic rats (27.92±0.76 to
36.52±0.44 g/rat/day) fed to different groups. There was a progressive increasing trend in water
consumption by increasing fenugreek leaves and seeds powder in diets. Results regarding body
weight concluded that rats fed on 10% fenugreek seeds powder based diet (D1) observed with
maximum weight gain. The mean weight of rats in each group observed as; normal rats (230.97
to 372.64 g/rat), hyperglycemic rats (232.44 to 329.70 g/rat) and hypercholesterolemic rats
(228.68 to 321.37 g/rat) from start of experiment to termination.
It is worth mentioning that fenugreek leaves and seeds powder increased insulin level, reduced
blood glucose, cholesterol, LDL and triglycerides whilst, HDL improved non-significantly. In
study II and III, diets (D0, D1 & D2) showed significant effect on glucose whilst, non-
momentous effect was observed in study I. In study II, glucose reduction was 10.67% (D1)

173
followed by 6.78% (D2), while in study III maximum reduction was observed with D1 (8.12%)
followed by D2 (5.45%) when compared with D0 (control). The effect of diets was observed
momentous on cholesterol level in study II & III while non-momentous in study I.
Experimental diets reduced the elevated level of cholesterol by 2.96% (D1), 2.03% (D2) in
study I, in study II reduction was 8.45% (D1) & 4.52% (D2), while in study III level reduced
to 12.03% (D1) & 6.32% (D2), respectively. Insulin level found decreased in control group as
compared to increasing tendency of fenugreek leaves and seeds powder, however, insulin
secretion was significantly lowered in diabetic as compared to normal rats. There was an
increase of 4.01 and 2.96% for insulin level in groups of rat fed with fenugreek seeds and
leaves powder in study II, in similar way insulin secretion was more in D1 (3.25%), D2 (2.22%)
in study III as compared to control.
Both experimental diets improved the HDL level non-significantly in all studies while
significant reduction was observed in LDL and triglycerides. The addition of fenugreek leaves
(D2) seeds (D1) powder decreased LDL level by 3.63 & 6.64% in study I, 4.56 & 9.68% in
study II whereas, 7.83 & 12.25% recorded in study III when compared with control diet.
However, decrease of triglycerides in different groups of rats concluded that D1 showed
maximum reduction of 9.89 & 11.34% followed by D2 (4.52 & 6.32%) in study I & II with
reference to control.
In study I, II and III, diets depicted significant affect on liver function tests i.e. AST, ALT and
ALP. The AST value of rats reduced by 4.56 & 3.66% (study I), 9.69 & 4.58% (study II) and
11.23 & 5.63% (study III) when fed with experimental diets D1 and D2 as compared to control
diet (D0). Maximum reduction in ALT value was observed with D1 i.e. 6.32, 9.89 & 10.45%
in all studies, while decreased values for ALP in study I when fed with experimental diets was
4.59% (D2) & 4.59% (D1), in study II 5.12% (D2) & 10.45% (D1) and in study III 6.39% (D2)
& 13.25% (D1), respectively when compared with control.
Statistical analysis revealed non-significant effect of diets on red blood cells, white blood cells
and platelets count. In study I, red blood cells increased 1.23 to 3.01% & 1.36 to 3.69% (study
II) and 2.01 to 4.12% (study III) when fed with experimental diets D2 and D1. White blood
cells increased non-significantly from 1.01 to 2.13 (study I), 1.52 to 3.34% (study II) and 1.39
to 3.31% (study III) as a function of experimental diets as compared to control. Likewise in
174
study I, platelets count was increased from 1.01 to 2.22%, study II (1.36 to 2.96%) and study
III (1.63 to 3.01%), respectively. Conclusively, rich phytochemistry of fenugreek leaves and
seeds powder accredited for hypoglycemic and hypocholesterolemic effects.
The present investigation suggests that different chemical, rheological, antioxidant and product
sensory characteristics are variable among different treatments with supplementation of
fenugreek leaves and seeds powder. Feed intake and gain in body weight exhibited increasing
trend and significant reduction in glucose, cholesterol, LDL and triglycerides was observed
due to the addition of fenugreek leaves and seeds powder in wheat flour. The incorporation
of fenugreek do not add much to price, being an agricultural country, Pakistan should focus on
these neglected commodities that would not only solve the problems regarding mono-cropping
system but also ensure optimal health benefits to the society. Their micronutrient and
antioxidant potential prevent the society from escalating health care cost in managing various
diseases. According to World Bank report, cost of micronutrient malnutrition is approx. 5%
Gross National Product (GNP). On the other hand, interventional strategies cost up to 0.3% of
the total GNP. Therefore, interventions are considered cheaper over health care cost (Darnton-
Hill et al., 2005). Moreover, addition of fenugreek leaves and seeds cost only 50 and 200
Pakistani rupees per kilogram, respectively i.e. almost equal or comparable to any other
commodity incorporation. Furthermore, direct supplementation of fenugreek seeds and leaves
powder is much cheaper for low income countries as it saves labor cost and operational capital
regarding extraction & purification or encapsulation apart from hectic procedures.

175
ECONOMIC PERSPECTIVES
Pakistan is facing issues regarding poverty, unemployment, population growth (6th most
populous country), time constraints faced by working women in food preparation & reliance
on monotonous staples, difficulty in losing excess body fat due to closely spaced pregnancies
and lack of information & education to make prudent food choices. In addition, unequal
distribution or over-abundance of food with poor nutritional quality, high cost of nutritious
food relative to unhealthy snacks, education barriers particularly among females, inadequate
supply of safe water & sanitation facilities and street foods prepared under unhygienic
conditions are considered as the markers of societal failure. Under such prevailing
circumstances, it is important to go for some healthy dietary interventions that benefit the
society over long run and in a better way. Hence, it is the time to shift old paradigm of green
revolution; ensuring food security but no focus on nutritional value and human health with new
paradigm of ‘green consumerism’; utilizing plant moieties in functional food development thus
linking agriculture with nutritional & health security. Nowadays, food commodities with
multiple benefits such as fenugreek plant parts not only give food diversification but also
prevent various diseases. Furthermore, due to high poverty rate, dietary shift towards neglected
and diverse indigenous grains is necessitated to ensure ample provision of micronutrients and
phytochemicals to combat micronutrient deficiencies and lifestyle related disorders. In this
context, partial replacement or supplementation of fenugreek seeds and leaves in wheat flour
to form designer foods could be of nutritional and nutraceutical worth, promote underutilized
resources, reduce expensive wheat imports & save foreign exchange, encourage multigrain
concept and promote export of designer products as convenience food.
176
CONCLUSIONS
Fenugreek seeds are rich source of protein and has good antioxidant potential as
compared to fenugreek leaves, later is an excellent source of minerals as well.
Improved rheological properties of wheat-fenugreek composite flour have been
observed for economical and quality baked products.
Fenugreek leaves and seeds powder can be added up to 5 and 10% level in bread
formulation without affecting overall quality.
Hyperglycemia and hypercholesterolemia problems can be managed with the
utilization of fenugreek.
The prepared bread found with nutritionally rice profile, good acceptability and had
therapeutic value, thus be considered for commercialization.
With constant increase in consumer demand of bread and other bakery products in
many developing countries and to couple with ever-growing urban population, the
composite flour/bread technology could be very useful.

177
RECOMMENDATIONS
• Amongst diverse healthy options, use of fenugreek seeds and leaves need to promote
in daily cuisines for a health start owing to its micronutrient enhanced profile as well
as potent antioxidant activity
• Nutritionists should encourage the incorporation of fenugreek based designer products
with special reference to fenugreek seeds to mitigate hyperlipidemia and
hyperglycemia in addition to combat prevailing micronutrient malnutrition especially
calcium, iron and zinc
• To avoid the food extract based consumers controversies, inclusion of whole fenugreek
seeds and leaves could serve as a motivation, lead to tackle health menace in the society
besides guarantee public satisfaction regarding natural means by avoiding the use of
toxic solvent residues in case of extracts
• Besides, the education and adoption of healthy processing procedures such as
fermentation to reduce antinutrients like phytic acid ultimately improving
micronutrient bioavailability, at home scale as well as industrial level could
acknowledge the general public to get optimal benefits using prudent food
technological aspects
• Last but the most important is the use of indigenous crops especially minor grains and
cereals to bring economic stability, attraction amongst the eastern cuisines as well as
provision of platform for allied stakeholders
178
LIMITATIONS AND FUTURE VISTAS
• From clinical nutrition perspectives, it is important to experiment using human subjects
besides working on animals to better relate the outcomes and to improve the antioxidant
dose & modes of processing in accordance to the needs of the consumers
• Additionally, anti-oncogenic, anti-bacterial, anti-helmintic, anti-cholinergic and ulcer
& wound healing facets of fenugreek plant parts need to explore via efficacy trials
• To optimize the antioxidant effective dosage for healthy as well as diseased subjects,
there is a need to adopt novel extraction modes, nutrient sensitive processing
procedures and encapsulation technologies for maximum mass transfer, retention and
targeted delivery of nutraceutics, respectively
• Furthermore, concept of excipient foods is now finding their way into novel researches
where excipient ingredients serve as bioavailability enhancers in combination with
particular nutraceutic in designer foods
• For detailed knowledge, nutrikinetics study of an active moiety could tell us the
complete fate of a particular nutraceutic hence facilitate in targeting a specific body
organ where its retention is somewhat prolonged
• From microbiological aspect, food safety is the highlighted concept nowadays thereby
it is important to have knowledge about the potential of fenugreek antioxidants against
food spoilage agents
• Besides optimizing cooking losses and antioxidant retention, it is also important to
optimize cost and shelf life using different blends by applying response surface
methodology
• Consumer awareness programs regarding diet-health linkages ought to be launched
among the masses to motivate prudent food choices and to highlight the therapeutic
worth of designer breads over conventional edibles for healthy living and variety in
dietary patterns.

179
LITERATURE CITED
AACC. 2000. Approved Methods of the American Association of Cereal Chemist. 9th Ed.
Association of Official Analytical Chemist. Washington DC.
Abdalatif, A.M., M.Y. Ibrahim and A.S. Mahmoud. 2012. Antidiabetic effects of fenugreek
(Trigonella foenum-graecum) seeds in the domestic rabbits (Oryctolagus cuniculus).
Res. J. Med. Plants. 6:449-455.
Abdelgawad, M.R., M.M. Mustafa and M.K. Kottb. 2012. Phytochemical protection against
Diethylnitrosoamine Induced Hepato Carcinogenesis by Trigonella foenum-graecum
in female rats. Arab J. Nuc. Sci. App. 45:523-536.
Abdelghafor, R.F., A.I. Mustafa, A.M. Ibrahim and P.G. Krishnan. 2011. Quality of bread from
composite flour of sorghum and hard white winter wheat. Adv. J. Food Sci. Tech. 3:9-
15.
Abdel‐Kader, Z. 2000. Enrichment of Egyptian ‘Balady’bread. Part 1. Baking studies, physical
and sensory evaluation of enrichment with decorticated cracked broadbeans flour
(Vicia faba L.). Food/Nahrung. 44:418-421.
Abdul-Rehman, S.Y. 2012. Effect of fenugreek seeds on some physiological characters in
broiler breeders males. Mesoptamia J. Agri. 40:1-8.
Acharya, S., A. Srichamroen, S. Basu, B. Ooraikul and T. Basu. 2006. Improvement in the
nutraceutical properties of fenugreek (Trigonella foenum-graecum L.). Songklanakarin
J. Sci. Tech. 28:1-9.
Adegoke, G., M.V. Kumar, A. G. Krishna, M. Varadaraj, K. Sambaiah and B. Lokesh. 1998.
Antioxidants and lipid oxidation in foods: A Critical Appraisal. J. Food Sci. Tech.
35:283-298.
Ade-Omowaye, B., B. Akinwande, I. Bolarinwa and A. Adebiyi. 2008. Evaluation of tiger nut
(Cyperus esculentus)-wheat composite flour and bread. Afr. J. Food Sci. 2:87-91.
Ahari, D.S., A.K. Kashi, M.R. Hassandokht, A. Amri and K. Alizadeh. 2009. Assessment of
drought tolerance in Iranian fenugreek landraces. J. Food Agric. Environ. 7:414-419.

180
Akbari, M., H. Rasouli and T. Bahdor. 2012. Physiological and pharmaceutical effect of
fenugreek: A review. IOSR J. Pharm. 2:49-53.
Akhtar, S., F.M. Anjum, S.U. Rehman, M.A. Sheikh and K. Farzana. 2008. Effect of
fortification on physico-chemical and microbiological stability of whole wheat flour.
Food Chem. 110:113-119.
Al‐Habori, M. and A. Raman. 1998. Antidiabetic and hypocholesterolaemic effects of
fenugreek. Phytother. Res. 12:233-242.
Ali, A., M.I. Waly, N. Bhatt and N.A. Al-Saady. 2015. Proximate and phytochemical
composition and antioxidant properties of indigenous landraces of omani fenugreek
seeds. Afr. J. Tradit. Complement. Altern. Med. 12:149-154.
Al-Jasass, F.M. and M.S. Al-Jasser. 2012. Chemical composition and fatty acid content of
some spices and herbs under Saudi Arabia conditions. The Sci. World J. 2012:1-5.
Aljawofi, Y.M.M. 2014. Study chemical composition, phytochimical, antioxidant and
antimicrobial activity of some medicinal plants used in Yeman. Ph.D Thesis,
University of Abou Bekr Belkaid Yemen.
Al-Khateeb, E., S.A. Hamadi, A.A. Al-Hakeemi, M. Abu-Taha and N. Al-Rawi. 2012.
Hypoglycemic effect of trigonelline isolated from Iraqi fenugreek seeds in normal and
alloxan-diabetic rabbits. Eur. Sci. J. 8:16-24.
Allain, C.C., L.S. Poon, C.S. Chan, W. Richmond and P.C. Fu. 1974. Enzymatic determination
of total serum cholesterol. Clin. Chem. 20:470-475.
Al-Musayeib, N., S. Perveen, I. Fatima, M. Nasir and A. Hussain. 2011. Antioxidant, anti-
glycation and anti-inflammatory activities of phenolic constituents from Cordia
sinensis. Molecules. 16:10214-10226.
Alshatwi, A.A., M.A. Al Obaaid, S.A. Al Sedairy, A.H. Al-Assaf, J.J. Zhang and K.Y. Lei.
2010. Tomato powder is more protective than lycopene supplement against lipid
peroxidation in rats. Nut. Res. 30:66-73.
Altuntaş, E., E. Ozgoz and O.F. Taşer. 2005. Some physical properties of fenugreek
(Trigonella foenum-graceum L.) seeds. J. Food Eng. 71:37-43.
181
Ambasta, S. and K. Ramchandran. 1986. The useful plants of India, Publication and
Information Directorate. CSIR, New Delhi.55-56.
Amin, A., A. Alkaabi, S. Al-Falasi and S.A. Daoud. 2005. Chemopreventive activities of
Trigonella foenum-graecum (Fenugreek) against breast cancer. Cell Biol. Int. 29:687-
694.
Amir, I., H. Hanida and A. Syafiq. 2013. Development and physical analysis of high fiber
bread incorporated with cocoa (Theobroma cacao sp.) pod husk powder. Int. Food Res.
J. 20:1301-1305.
Amjid, M.R., A. Shehzad, S. Hussain, M.A. Shabbir, M.R. Khan and M. Shoaib. 2013. A
comprehensive review on wheat flour dough rheology. Pak. J. Food Sci. 23:105-123.
Annida, B. and S.M. Prince. 2004. Supplementation of fenugreek leaves lower lipid profile in
streptozotocin-induced diabetic rats. J. Med. Food. 7:153-156.
Annunziata, A. and R. Vecchio. 2013. Consumer perception of functional foods: A conjoint
analysis with probiotics. Food Qual. Pref. 28:348-355.
Anton, A.A., K.A. Ross, O.M. Lukow, R.G. Fulcher and S.D. Arntfield. 2008. Influence of
added bean flour (Phaseolus vulgaris L.) on some physical and nutritional properties
of wheat flour tortillas. Food Chem. 109:33-41.
Anuradha, C. and P. Ravikumar. 2001. Restoration on tissue antioxidants by fenugreek seeds
(Trigonella foenum-graecum) in alloxan-diabetic rats. Ind. J. Physiol. Pharm. 45:408-
420.
Anwar, M.M. and A.-R.M. Meki. 2003. Oxidative stress in streptozotocin-induced diabetic
rats: effects of garlic oil and melatonin. Comp. Biochem. Physiol. A Mol. Integr.
Physiol. 135:539-547.
Arabshahi-Delouee, S. and A. Urooj. 2007. Antioxidant properties of various solvent extracts
of mulberry (Morus indica L.) leaves. Food Chem. 102:1233-1240.
Arct, J. and K. Pytkowska. 2008. Flavonoids as components of biologically active
cosmeceuticals. Clinics Dermato. 26:347-357.

182
Arivalagan, M., K. Gangopadhyay and G. Kumar. 2013. Determination of steroidal saponins
and fixed oil content in fenugreek (Trigonella foenum-graecum) genotypes. Ind. J.
Pharma. Sci. 75:110-113.
Atwell, W.A. 2003. Overview of flour testing. Cereal foods world. 48:252-256.
Babajide, O.J., O.O. Babajide, A.O. Daramola and W.T. Mabusela. 2008. Flavonols and an
oxychromonol from Piliostigma reticulatum. Phytochemistry. 69:2245-2250.
Basuny, A.M., A.M. Gaafar and S.M. Arafat. 2009. Tomato lycopene is a natural antioxidant
and can alleviate hypercholesterolemia. Afr. J. Biotech. 8:6627-6633.
Belguith-Hadriche, O., M. Bouaziz, K. Jamoussi, A. El Feki, S. Sayadi and F. Makni-Ayedi.
2010. Lipid-lowering and antioxidant effects of an ethyl acetate extract of fenugreek
seeds in high-cholesterol-fed rats. J. Agric. Food Chem. 58:2116-2122.
Belguith-Hadriche, O., M. Bouaziz, K. Jamoussi, M.S. Simmonds, A. El Feki and F. Makni-
Ayedi. 2013. Comparative study on hypocholesterolemic and antioxidant activities of
various extracts of fenugreek seeds. Food Chem. 138:1448-1453.
Bello, A., S. Serna Saldivar, R. Waniska and L. Rooney. 1991. Methods to prepare and evaluate
wheat tortillas. Cereal foods world. 36:315-322.
Benzie, I.F. and J. Strain. 1996. The ferric reducing ability of plasma (FRAP) as a measure of
“antioxidant power”: the FRAP assay. Anal. Biochem. 239:70-76.
Bernhoft, A. 2010. A brief review on bioactive compounds in plants. In: Bioactive compounds
in plants-benefits and risks for man and animals. Proceeding from a symposium held
at the Norvegian Acaademy of Science and Letters, Oslo 13-14 Nov. 2008. pp 11-17.
Betty, R. 2008. The many healing virtues of fenugreek. Spice India. 1:17-19.
Blumenthal, M. W.R. Busse, A. Goldberg, J. Gruenwald, T. Hall, C.W. Riggins, R.S. Rister.
1998. The Complete German Commission E Monographs⎯Therapeutic Guide to
Herbal Medicines. Austin, TX: American Botanical Council; Boston: Integrative
Medicine Communication.
Bojnanska, T., M. Tokar and R. Gazar. 2010. Pharinographic characteristics of wheat dough
with natural additives. J. Food Phy. 23:9-12.
183
Bordia, A., S. Verma and K. Srivastava. 1997. Effect of ginger (Zingiber officinale Rosc.) and
fenugreek (Trigonella foenum-graecum L.) on blood lipids, blood sugar and platelet
aggregation in patients with coronary artery disease. Prostaglandins Leukot. Essent.
Fatty Acids. 56:379-384.
Bors, W., W. Heller, C. Michel and K. Stettmaier 1996. Handbook of Antioxidants Cadenas,
E. Packer, L., Eds. Marcel Dekker, New York.
Bouchenak, M. and M. Lamri-Senhadji. 2013. Nutritional quality of legumes, and their role in
cardiometabolic risk prevention: A review. J. Med. Food. 16:185-198.
Bozin, B., N. Mimica-Dukic, I. Samojlik, A. Goran and R. Igic. 2008. Phenolics as antioxidants
in garlic (Allium sativum L., Alliaceae). Food Chem. 111:925-929.
Brar, J.K., D.R. Rai, A. Singh and N. Kaur. 2013. Biochemical and physiological changes in
Fenugreek (Trigonella foenum-graecum L.) leaves during storage under modified
atmosphere packaging. J. Food Sci. Tech. 50:696-704.
Braschi, A., L. Gill and D.J. Naismith. 2009. Partial substitution of sodium with potassium in
white bread: feasibility and bioavailability. Int. J. Food Sci. Nutr. 60:507-521.
Broca, C., M. Manteghetti, R. Gross, Y. Baissac, M. Jacob, P. Petit, Y. Sauvaire and G. Ribes.
2000. 4-Hydroxyisoleucine: effects of synthetic and natural analogues on insulin
secretion. Eur. J. Pharmacol. 390:339-345.
Bukhari, S.B., M.I. Bhanger and S. Memon. 2008. Antioxidative Activity of Extracts from
Fenugreek. Pak. J. Anal. Environ. Chem. 9:78-83.
Bursill, C.A. and P.D. Roach. 2006. Modulation of cholesterol metabolism by the green tea
polyphenol (-)-epigallocatechin gallate in cultured human liver (HepG2) cells. J. Agric.
Food Chem. 54:1621-1626.
Bushuk, W. 1997. Wheat breeding for end-product use. Wheat: Prospects for global
improvement. Springer. pp. 203-211.

184
Butt, M.S., M. T. Sultan, F.M. Anjum, M.K. Sharif and S.H. Khan. 2007. Functional foods:
emerging trend in nutritional support programs.In: International Symposium on
Emerging Trends in Food Science & Technology held on 5–8 November, 2007 at
National Institute of Food Science and Technology, University of Agriculture,
Faisalabad, Pakistan.
Chauhan, G. and H. Sharma. 2000. Physico-chemical and rheological quality characteristics of
fenugreek (Trigonella foenum-graecum L.) supplemented wheat flour. J. Food Sci.
Tech. 37:87-90.
Chauhan, G., M. Sharma, H. Kharkwal and A. Varma. 2011. Pharmacognostic, preliminary
phytochemical studies and anticancerous potential of Trigonella foenum-graecum.
Pharma Sci. Monitor. 2:72-81.
Cheikh-Rouhou, S., S. Besbes, G. Lognay, C. Blecker, C. Deroanne and H. Attia. 2008. Sterol
composition of black cumin (Nigella sativa L.) and Aleppo pine (Pinus halepensis
Mill.) seeds oils. J. Food Comp. Anal. 21:162-168.
Chen, M.F. 2009. Attitude toward organic foods among Taiwanese as related to health
consciousness, environmental attitudes, and the mediating effects of a healthy lifestyle.
Br. Food J. 111:165-178.
Chhibba, I., V. Nayyar and J. Kanwar. 2007. Influence of mode and source of applied iron on
fenugreek (Trigonella foenum-graecum L.) in a typic ustochrept in Punjab, India. Int.
J. Agric. Biol. 9:254-256.
Choudhary, D., D. Chandra, S. Choudhary and R. Kale. 2001. Modulation of glyoxalase,
glutathione S-transferase and antioxidant enzymes in the liver, spleen and erythrocytes
of mice by dietary administration of fenugreek seeds. Food Chem. Toxicol. 39:989-
997.
Croteau, R., T.M. Kutchan and N.G. Lewis. 2000. Natural products (secondary metabolites).
Biochem. Mole. Bio. Plants. 24:1250-1319.
Dahan, K., M. Fennal and N.B. Kumar. 2007. Lycopene in the prevention of prostate cancer.
J. Society Integ. Oncol. 6:29-36.

185
Darnton-Hill, I., P. Webb, P.W. Harvey, J.M. Hunt, N. Dalmiya, M. Chopra, M.J. Ball, M.W.
Bloem, B. de Benoist. 2005. Micronutrient deficiencies and gender: social and
economic costs. The Amer. J. Clin. Nutr. 81:1198-1205.
Dasappa, I., S. Ragu, R. Jyotsna and V. Gandham. 2003. U.S. Patent Application 10/397,975.
Accessed on: 12-08-2015. Available at: https://www.google.com/patents/US20040191386.
Davidsson, L., A. Cederblad, E. Hagebo, B. Lonnerdal and B. Sandstrom. 1988. Intrinsic and
extrinsic labeling for studies of manganese absorption in humans. J. Nutr. 118:1517-
1521.
Devatkal, S.K., P.R. Thorat, M. Manjunatha and R.K. Anurag. 2012. Comparative antioxidant
effect of aqueous extracts of curry leaves, fenugreek leaves and butylated
hydroxytoluene in raw chicken patties. J. Food Sci. Tech. 49:781-785.
Devi, R., J. Nandhini, M. Madhavan and S. Kumar. 2012. The effect of fenugreek (Trigonella
foecum-graecum) intake on the oxidative stress in hypercholesterolaemic subjects. Nat.
J. Lab. Med. 2:5-7.
Dewettinck, K., F. Van Bockstaele, B. Kuhne, D. Van De Walle, T. Courtens and X. Gellynck.
2008. Nutritional value of bread: Influence of processing, food interaction and
consumer perception. J. Cereal Sci. 48:243-257.
Dhinda, F., J. Prakash and I. Dasappa. 2012. Effect of ingredients on rheological, nutritional
and quality characteristics of high protein, high fibre and low carbohydrate bread. Food
Bioprocess Tech. 5:2998-3006.
Dietrych-Szostak, D. and W. Oleszek. 1999. Effect of Processing on the Flavonoid Content in
Buckwheat (Fagopyrum esculentum Möench) Grain. J. Agric. Food Chem. 47:4384-
4387.
Dixit, P., S. Ghaskadbi, H. Mohan and T. Devasagayam. 2005. Antioxidant properties of
germinated fenugreek seeds. Phytother. Res. 19:977-983.
Doxastakis, G., I. Zafiriadis, M. Irakli, H. Marlani and C. Tananaki. 2002. Lupin, soya and
triticale addition to wheat flour doughs and their effect on rheological properties. Food
Chem. 77:219-227.

186
Doyon, M. and J. Labrecque. 2008. Functional foods: A conceptual definition. Br. Food J.
110:1133-1149.
Dua, A., S. Vats, V. Singh and R. Mahajan. 2013. Protection of biomolecules against in vitro
oxidative damage by the antioxidants from methanolic extract of Trigonella foenum-
graecum seeds. Int J. Pharm. Sci. Res. 4:3080-3086.
Dudareva, N. and E. Pichersky. 2000. Biochemical and molecular genetic aspects of floral
scents. Plant Physiol. 122:627-634.
Eastwood, M. and D. Kritchevsky. 2005. Dietary fiber: how did we get where we are? Annu.
Rev. Nutr. 25:1-8.
Eidi, A., M. Eidi and M. Sokhteh. 2007. Effect of fenugreek (Trigonella foenum-graecum L)
seeds on serum parameters in normal and streptozotocin-induced diabetic rats. Nutr.
Res. 27:728-733.
Eissa, H.A., A. Hussein and B. Mostafa. 2007. Rheological properties and quality evaluation
on Egyptian balady bread and biscuits supplemented with flours of ungerminated and
germinated legume seeds or mushroom. Pol J. Food Nutr. Sci. 57:487-496.
El-Dakak, A.M.N.H., H.S.M.A. El-Rahman and D.M.M. El-Nahal. 2013. Comparison studies
between aqueous Lepidium sativum L., Lupinus albus and Trigonella foenum-graecum
seeds, and their mixture extracts on streptozotocin-induced diabetic rats. J. Appl. Sci.
Res. 9:2965-2982.
El-Hussary, N. 1993. Effect of fenugreek seeds decoction on blood glucose, cholesterol and
triglycerides level in normal and alloxan diabetic rabbits. Irags J. Vet. Sci. 6:102-105.
Elleuch, M., D. Bedigian, O. Roiseux, S. Besbes, C. Blecker and H. Attia. 2011. Dietary fibre
and fibre-rich by-products of food processing: Characterisation, technological
functionality and commercial applications: A review. Food Chem. 124:411-421.
Elmnan, A., A. Balgees, J.L. Mangara, O. Ayinde, M. Muchie, A. Adenuga, M. Jesudun, F.
Olagunju, M. Adewumi and M. Girma. 2012. Effect of fenugreek (Trigonella foenm-
greacum) seeds dietary levels on lipid profile and body weight gain of rats. Pak. J. Nutr.
11:1004-1008.
187
El-Soud, N.H.A., M. Khalil, J. Hussein, F. Oraby and A.H. Farrag. 2007. Antidiabetic effects
of fenugreek alkaliod extract in streptozotocin induced hyperglycemic rats. J. Appl.
Sci. Res. 3:1073-1083.
El-Soukkary, F. 2001. Evaluation of pumpkin seeds products for bread fortification. Plant
Foods Hum. Nutr. 56:365-384.
Erum, S., R. Anwar and S. Masood. 2011. Evaluation of Kasuri methi Trigonella foenum-
graecum L. var. to establish GI right of Pakistan. Pak. J. Agric. Res. 24:25-30.
Every, D., J.A. Gerrard, M.J. Gilpin, M. Ross and M.P. Newberry. 1998. Staling in starch
bread: the effect of gluten additions on specific loaf volume and firming rate. Starch‐
Starke. 50:443-446.
Finley, J.W. 1999. Manganese absorption and retention by young women is associated with
serum ferritin concentration. Am. J. Clin. Nutr. 70:37-43.
Finley, J.W., P.E. Johnson and L. Johnson. 1994. Sex affects manganese absorption and
retention by humans from a diet adequate in manganese. Am. J. Clin. Nutr. 60:949-
955.
Fischbach, F. 1996. Blood studies. A manual of laboratory and diagnostic tests. Philadelphia:
Lippincott. 23-146.
Fogliano, V. and P. Vitaglione. 2005. Functional foods: planning and development. Mol. Nutr.
Food Res. 49:256-262.
Fretzdorff, B. and J. Brummer. 1992. Reduction of phytic acid during breadmaking of whole-
meal breads. Cereal Chem. 60:266-270.
Gad, M.Z., M.M. El-Sawalhi, M.F. Ismail and N.D. El-Tanbouly. 2006. Biochemical study of
the anti-diabetic action of the Egyptian plants Fenugreek and Balanites. Mol. Cell.
Biochem. 281:173-183.
Gajula, H., S. Liu, S. Alavi, T. Herald, R. Madl, S.R. Bean and M. Tilley. 2009. Pre-cooked
fiber-enriched wheat flour obtained by extrusion: Rheological and functional
properties. Int. J. Food Prop. 12:27-44.
188
Gamelin, L., M. Boisdron-Celle, R. Delva, V. Guerin-Meyer, N. Ifrah, A. Morel and E.
Gamelin. 2004. Prevention of oxaliplatin-related neurotoxicity by calcium and
magnesium infusions a retrospective study of 161 patients receiving oxaliplatin
combined with 5-fluorouracil and leucovorin for advanced colorectal cancer. Clin.
Cancer. Res. 10:4055-4061.
Geetha, M., K. Suneel, A. Krupanidhi, K. Muralikrishna, A. Avin and P. Prashanth. 2011.
Effect of fenugreek on total body and organ weights: A study on mice.
Pharmacologyonline. 3:747-752.
George, P.M. 2003. Encyclopedia of Foods. Volume 1 Humane Press; Washington.
Gomez, M., B. Oliete, C.M. Rosell, V. Pando and E. Fernández. 2008. Studies on cake quality
made of wheat–chickpea flour blends. LWT-Food Sci. Tech. 41:1701-1709.
Gouveia, L., A.P. Batista, A. Miranda, J. Empis and A. Raymundo. 2007. Chlorella vulgaris
biomass used as colouring source in traditional butter cookies. Innov. Food Sci. Emerg.
8:433-436.
Grajek, W., A. Olejnik and A. Sip. 2005. Probiotics, prebiotics and antioxidants as functional
foods. Acta. Biochem. Pol. 52:665-671.
Grausgruber, H., M. Oberforster, M. Werteker, P. Ruckenbauer and J. Vollmann. 2000.
Stability of quality traits in Austrian-grown winter wheats. Field Crops Res. 66:257-
267.
Guerrero, J.A., L. Navarro‐Nuñez, M.L. Lozano, C. Martínez, V. Vicente, J.M. Gibbins and J.
Rivera. 2007. Flavonoids inhibit the platelet TxA2 signalling pathway and antagonize
TxA2 receptors (TP) in platelets and smooth muscle cells. Br. J. Clin. Pharmacol.
64:133-144.
Haeri, M.R., H.K. Limaki, C.J.B. White and K.N. White. 2012. Non-insulin dependent anti-
diabetic activity of (2S, 3R, 4S) 4-hydroxyisoleucine of fenugreek (Trigonella foenum-
graecum) in streptozotocin-induced type I diabetic rats. Phytomedicine. 19:571-574.

189
Hamza, N., B. Berke, C. Cheze, R. L. Garree, A. Umar, A. Agli, R. Lassalle, J. Jove, H. Gin
and N. Moore. 2012. Preventive and curative effect of Trigonella foenum-graecum L.,
seeds in C57BL/6J models of type 2 diabetes induced by high-fat diet. J.
Ethnopharmacol. 142:516-522.
Han, H.M. and B.K. Koh. 2011. Antioxidant activity of hard wheat flour, dough and bread
prepared using various processes with the addition of different phenolic acids. J. Sci.
Food Agric. 91:604-608.
Hannan, J., B. Rokeya, O. Faruque, N. Nahar, M. Mosihuzzaman, A.A. Khan and L. Ali. 2003.
Effect of soluble dietary fibre fraction of Trigonella foenum- graecum on glycemic,
insulinemic, lipidemic and platelet aggregation status of Type 2 diabetic model rats. J.
Ethnopharmacol. 88:73-77.
Hannan, J.M., L. Ali, B. Rokeya, J. Khaleque, M. Akhter, P.R. Flatt and Y.H. Abdel-Wahab.
2007. Soluble dietary fibre fraction of Trigonella foenum-graecum (fenugreek) seeds
improves glucose homeostasis in animal models of type 1 and type 2 diabetes by
delaying carbohydrate digestion and absorption, and enhancing insulin action. Br. J.
Nutr. 97:514-21.
Haridas, R., P and H.M. Rao. 1991. Effect of incorporating wheat bran on the rheological
characteristics and bread making quality of flour. J. Food Sci. Tech. 28:92-97.
Haruna, M., C. Udobi and J. Ndife. 2011. Effect of added brewers dry grain on the physico-
chemical, microbial and sensory quality of wheat bread. Am. J. Food Nutr. 1:39-43.
Hefnawy, T., G. El-Shourbagy and M. Ramadan. 2012. Impact of adding chickpea (Cicer
arietinum L.) flour to wheat flour on the rheological properties of toast bread. Int. Food
Res. J. 19:521-525.
Heidolph, B., D. Ray, S. Roller, P. Koehler, J. Weber, S. Slocum and M. Noort. 2011. Looking
for my lost shaker of salt replacer: Flavor, function, future. Cereal Foods World. 56:5.
Henson, S., O. Masakure and J. Cranfield. 2008. The propensity for consumers to offset health
risks through the use of functional foods and nutraceuticals: The case of lycopene. Food
Qual. Pref. 19:395-406.

190
Herh, P., S. Colo, N. Roye and K. Hedman. 2000. Application Note: Rheology of foods: New
techniques, capabilities and instruments. Reologica Instruments AB, Sweden.
Hidvegi, M., R. Lasztity, F. Bekes, S. Sarkadi and A. El Kady. 1984. Contributions to the
nutritional characterization of fenugreek (Trigonella foenum-graecum L.). Acta
Alimentaria. 13:315-324.
Holtekjolen, A.K., A. Baevre, M. Rodbotten, H. Berg and S.H. Knutsen. 2008. Antioxidant
properties and sensory profiles of breads containing barley flour. Food Chem. 110:414-
421.
Hooda, S. and S. Jood. 2003. Physicochemical, rheological, and organoleptic characteristics of
wheat‐fenugreek supplemented blends. Food/Nahrung. 47:265-268.
Hooda, S. and S. Jood. 2004. Nutritional evaluation of wheat–fenugreek blends for product
making. Plant Foods Hum. Nutr. 59:149-154.
Hooda, S. and S. Jood. 2005. Organoleptic and nutritional evaluation of wheat biscuits
supplemented with untreated and treated fenugreek flour. Food Chem. 90:427-435.
Hu, G., F. Yang, Z. Ma and Q. Zhou. 2007. Development of research and application of rice
bran dietary fibre. China Food Additives. 84:80-85.
Hultcrantz, R., H. Glaumann, G. Lindberg and L. H. S. Nilsson. 1986. Liver Investigation in
149 Asymptomatic Patients with Moderately Elevated Activities of Serum:
Aminotransferases. Scand. J. Gastroenterol. 21:109-113.
Hussein, A., A.S.A. El-Azeem, A.M. Hegazy, A.A. Afifi and G.H. Ragab. 2011.
Physiochemical, sensory and nutritional properties of corn-fenugreek flour composite
biscuits. Aus. J. Basic Appl. Sci. 5:84-95.
Ibrahium, M. and A. Hegazy. 2009. Iron bioavailability of wheat biscuit supplemented by
fenugreek seeds flour. World J. Agr. Sci. 5:769-776.
Indrani, D., P. Swetha, C. Soumya, J. Rajiv and G.V. Rao. 2011. Effect of multigrains on
rheological, microstructural and quality characteristics of north Indian parotta – An
Indian flat bread. LWT-Food Sci. Tech. 44:719-724.

191
Ishtiaque, S., N. Khan, M.A. Siddiqui, R. Siddiqi and S. Naz. 2013. Antioxidant potential of
the extracts, fractions and oils derived from oilseeds. Antioxidants. 2:246-256.
Jacob, J. and K. Leelavathi. 2007. Effect of fat-type on cookie dough and cookie quality. J.
Food Eng. 79:299-305.
Jacobs, D.S., B.L. Kasten, W.R. Demott and W. Wolfson 1996. Laboratory test handbook,
Lexi-Comp Incorporated.
Jani, R., S. Udipi and P. Ghugre. 2009. Mineral content of complementary foods. Ind. J.
Pediatr. 76:37-44.
Jha, S.K. and S.K. Srivastava. 2012. Determination of antioxidant activity of Trigonella
foenum-graecum Linn. in mice. Ann. Phytomed. 1:69-74.
Jones, P.J. and K.A. Varady. 2007. Are functional foods redefining nutritional requirements?
Appl. Physiol. Nutr. Metab. 33:118-123.
Jonnalagadda, S. and S. Seshadri. 1994. In vitro availability of iron from cereal meal with the
addition of protein isolates and fenugreek leaves (Trigonella foenum-graecum). Plant
Foods Hum. Nutr. 45:119-125.
Jyotsna, R., D. Indrani, R. Sai Manohar and G.V. Rao. 2011. Effect of fenugreek (Trigonella
foenum-graecum L.) on the textural characteristics and microstructure of vermicelli
from triticum durum wheat semolina. J. Food Process. Preserv. 35:320-326.
Kadam, M., R. Salve, Z. Mehrajfatema and S. More. 2012. Development and evaluation of
composite flour for missi roti/chapatti. J. Food Process. Tech. 3:1-7.
Kamal-Eldin, A., J. Frank, A. Razdan, S. Tengblad, S. Basu and B. Vessby. 2000. Effects of
dietary phenolic compounds on tocopherol, cholesterol, and fatty acids in rats. Lipids.
35:427-435.
Kasaye, A.T. and Y.K. Jha. 2015. Evaluation of composite blends of fermented fenugreek and
wheat flour to assess its suitability for bread and biscuit. Int. J. Nut. Food Sci. 4:29-35.
Kaur, C. and H.C. Kapoor. 2002. Anti‐oxidant activity and total phenolic content of some
Asian vegetables. Int. J. Food Sci. Tech. 37:153-161.
Kaur, S. and M. Das. 2011. Functional foods: An overview. Food Sci. Biotechnol. 20:861-875.

192
Kaviarasan, S., G. Naik, R. Gangabhagirathi, C. Anuradha and K. Priyadarsini. 2007. In vitro
studies on antiradical and antioxidant activities of fenugreek (Trigonella foenum-
graecum) seeds. Food Chem. 103:31-37.
Kaviarasan, S., K. Vijayalakshmi and C. Anuradha. 2004. Polyphenol-rich extract of fenugreek
seeds protect erythrocytes from oxidative damage. Plant Foods Hum. Nutr. 59:143-
147.
Kenny, O., T. Smyth, C. Hewage and N. Brunton. 2013. Antioxidant properties and
quantitative UPLC-MS analysis of phenolic compounds from extracts of fenugreek
(Trigonella foenum-graecum) seeds and bitter melon (Momordica charantia) fruit.
Food Chem. 141:4295-4302.
Khalil, E.A. 2004. Biochemical and histopathological studies on the influence of aqueous
extract of fenugreek seeds (Trigonella foenum-graecum) on alloxan diabetic male rats.
Egypt. J. Hosp. Med. 15:83-94.
Khan, M.R., F.M. Anjum, T. Zahoor and H. Nawaz. 2009. Biochemical and Technological
characterization of Pakistani spring wheats. Pak. J. Agri. Sci. 46:271-279.
Khole, S., S. Chatterjee, P. Variyar, A. Sharma, T. Devasagayam and S. Ghaskadbi. 2014.
Bioactive constituents of germinated fenugreek seeds with strong antioxidant potential.
J. Funct. Foods. 6:270-279.
Khosla, P., D. Gupta and R. Nagpal. 1995. Effect of Trigonella foenum-graecum (Fenugreek)
on blood glucose in normal and diabetic rats. Ind. J. Physiol. Pharmacol. 39:173-173.
King, H., R.E. Aubert and W.H. Herman. 1998. Global burden of diabetes, 1995–2025:
prevalence, numerical estimates, and projections. Diabetes care. 21:1414-1431.
Klahorst, S. 2006. Flavour and innovation meet. World of Food Ingredients.26-30.
Korhonen, T., M.J. Savolainen, M.J. Koistinen, M. Ikaheimo, M.K. Linnaluoto, K. Kervinen
and Y.A. Kesaniemi. 1996. Association of lipoprotein cholesterol and triglycerides
with the severity of coronary artery disease in men and women. Atherosclerosis.
127:213-220.

193
Kris-Etherton, P.M., K.D. Hecker, A. Bonanome, S.M. Coval, A.E. Binkoski, K.F. Hilpert,
A.E. Griel and T.D. Etherton. 2002. Bioactive compounds in foods: their role in the
prevention of cardiovascular disease and cancer. Am. J. Med. 113:71-88.
Krzeminski, R., S. Gorinstein, H. Leontowicz, M. Leontowicz, M. Gralak, J. Czerwinski, A.
Lojek, M. Ciz, O. Martin-Belloso and N. Gligelmo-Miguel. 2003. Effect of different
olive oils on bile excretion in rats fed cholesterol-containing and cholesterol-free diets.
J. Agric. Food Chem. 51:5774-5779.
Kumar, G.P., T. Anand, D. Singsit, F. Khanum and K. Anilakumar. 2013. Evaluation of
antioxidant and anti-fatigue properties of Trigonella foenum-graecum L. in rats
subjected to weight loaded forced swim test. Pharmacogn. J. 5:66-71.
Kumar, G.S., A.K. Shetty, K. Sambaiah and P.V. Salimath. 2005. Antidiabetic property of
fenugreek seeds mucilage and spent turmeric in streptozotocin-induced diabetic rats.
Nutr. Res. 25:1021-1028.
Kumar, P., U. Bhandri and S. Jamadagni. 2014. Fenugreek seeds extract inhibit fat
acccumulation and ameliorates dyslipidemia in high fat diet-induced obese rats.
Biomed. Res. Int. 2014.
Lapshina, E., E.J. Sudnikovich, J.Z. Maksimchik, S. Zabrodskaya, L. Zavodnik, V. Kubyshin,
M. Nocun, P. Kazmierczak, M. Dobaczewski and C. Watala. 2006. Antioxidative
enzyme and glutathione S-transferase activities in diabetic rats exposed to long-term
ASA treatment. Life Sci. 79:1804-1811.
Lara, E., P. Cortés, V. Briones and M. Perez. 2011. Structural and physical modifications of
corn biscuits during baking process. LWT-Food Sci. Tech. 44:622-630.
Lawless, H.T. and H. Heymann 1999. Acceptance and preference testing. Sensory Evaluation
of Food. Springer.
Lazaridou, A., D. Duta, M. Papageorgiou, N. Belc and C. Biliaderis. 2007. Effects of
hydrocolloids on dough rheology and bread quality parameters in gluten-free
formulations. J. Food Eng. 79:1033-1047.
Lee, J., N. Koo and D. Min. 2004. Reactive oxygen species, aging, and antioxidative
nutraceuticals. Compr. Rev. Food Sci. Food Safety. 3:21-33.

194
Leenhardt, F., B. Lyan, E. Rock, A. Boussard, J. Potus, E. Chanliaud and C. Remesy. 2006.
Genetic variability of carotenoid concentration, and lipoxygenase and peroxidase
activities among cultivated wheat species and bread wheat varieties. Eur. J. Agron.
25:170-176.
Lin, J.Y., C.Y. Li and I.F. Hwang. 2008. Characterisation of the pigment components in red
cabbage (Brassica oleracea L. var.) juice and their anti-inflammatory effects on LPS-
stimulated murine splenocytes. Food Chem. 109:771-781.
Lin, L.Y., H.M. Liu, Y.W. Yu, S.D. Lin and J.L. Mau. 2009. Quality and antioxidant property
of buckwheat enhanced wheat bread. Food Chem. 112:987-991.
Liu, Q., Y. Qiu and T. Beta. 2010. Comparison of antioxidant activities of different colored
wheat grains and analysis of phenolic compounds. J. Agric. Food Chem. 58:9235-9241.
Liu, X., M. Dong, X. Chen, M. Jiang, X. Lv and G. Yan. 2007. Antioxidant activity and
phenolics of an endophytic Xylaria sp. from Ginkgo biloba. Food Chem. 105:548-554.
Liu, Y., R. Kakani and M.G. Nair. 2012. Compounds in functional food fenugreek spice exhibit
anti-inflammatory and antioxidant activities. Food Chem. 131:1187-1192.
Liyana-Pathirana, C.M. and F. Shahidi. 2006. Importance of insoluble-bound phenolics to
antioxidant properties of wheat. J. Agric. Food Chem. 54:1256-1264.
Lodhi, S.A. and N. Huma. 2003. Effect of supplementation of detoxified matri flour with wheat
flour on the quality of pan bread. Pak. J. Sci. Ind. Res. 46:207-210.
Losso, J.N., D.L. Holliday, J.W. Finley, R.J. Martin, J.C. Rood, Y. Yu and F.L. Greenway.
2009. Fenugreek bread: a treatment for diabetes mellitus. J. Med. Food. 12:1046-1049.
Madar, Z. and I. Shomer. 1990. Polysaccharide composition of a gel fraction derived from
fenugreek and its effect on starch digestion and bile acid absorption in rats. J. Agric.
Food Chem. 38:1535-1539.
Madianov, I., M. Balabolkin, D. Markov and T. Markova. 1999. Main causes of hyperuricemia
in diabetes mellitus. Terapevticheskii Arkhiv. 72:55-58.
Mahfouz, S.A., S.M. Elaby and H.Z. Hassouna. 2012. Effects of some legumes on
hypercholesterolemia in rats. J. Am. Sci. 8:1453-1460.

195
Mahmoud, M.Y. 2013. Effect of high protein diet containing fortified bread with fenugreek
and nigella sativa seeds on rats suffering from diabetes. Pak. J. Nutr. 12:736-747.
Mahmoud, N.Y., R.H. Salem and A.A. Mater. 2012. Nutritional and biological assessment of
wheat biscuits supplemented by fenugreek plant to improve diet of anemic rats. Acad.
J. Nutr. 1:1-9.
Mani, K., A.C. Eliasson, L. Lindahl and C. Tragardh. 1992. Rheological properties and
breadmaking quality of wheat flour doughs made with different dough mixers. Cereal
Chem. 69:222-225.
Mansour, H.A., A.S.A. Newairy, M. Yousef and S. Sheweita. 2002. Biochemical study on the
effects of some Egyptian herbs in alloxan-induced diabetic rats. Toxicology. 170:221-
228.
Manu, B. and U.P. Rao. 2008. Influence of size distribution of proteins, thiol and disulfide
content in whole wheat flour on rheological and chapati texture of Indian wheat
varieties. Food Chem. 110:88-95.
Mariod, A.A., R.M. Ibrahim, M. Ismail and N. Ismail. 2009. Antioxidant activity and phenolic
content of phenolic rich fractions obtained from black cumin (Nigella sativa)
seedscake. Food Chem. 116:306-312.
Marzouk, M., A. Soliman and T. Omar. 2013. Hypoglycemic and antioxidative effects of
fenugreek and termis seeds powder in streptozotocin-diabetic rats. Eur. Rev. Med.
Pharmacol. Sci. 17:559-565.
Mathur, P. and M. Choudhry. 2009. Consumption pattern of fenugreek seeds i n Rajasthani
families. J. Hum. Ecol. 25:9-12.
Mcdonald, P. R.A. Edwards, J.F.D. Greenhalgh and C.A. Morgan. 2002. Animal Nutrition, 6th
Ed. Pearson Eduction Ltd. Harlow, UK.
Meera, R., P. Devi, B. Kameswari, B. Madhumitha and N. Merlin. 2009. Antioxidant and
hepatoprotective activities of Ocimum basilicum Linn. and Trigonella foenum-graecum
Linn. against H2O2 and CCL4 induced hepatotoxicity in goat liver. Indian J. Exp. Biol.
47:584-590.
196
Meghwal, M. and T. Goswami. 2012. A review on the functional properties, nutritional
content, medicinal utilization and potential application of fenugreek. J. Food Process.
Tech. 3:1-10.
Mehrafarin, A., A. Qaderi, S. Rezazadeh, H. Naghdi-Badi, G. Noormohammadi and E. Zand.
2010. Bioengineering of important secondary metabolites and metabolic pathways in
fenugreek (Trigonella foenum-graecum L.). J. Med. Plants. 9:1-18.
Meilgaard, M., G. Civille and B. Carr. 2007. Overall difference tests: does a sensory difference
exist between samples. Sensory Evaluation Techniques. 4:63-104.
Meintjes, G.D. 2004. The use of HPLC for quality prediction of South African wheat cultivars.
University of the Free State Bloemfontein.
Mepba, H.D., L. Eboh and S. Nwaojigwa. 2007. Chemical composition, functional and baking
properties of wheat-plantain composite flours. Afri. J. Food Nutri. Devt. . 7:1-22.
Metwal, N., R. Jyotsna, T. Jeyarani and G.V. Rao. 2011. Influence of debittered, defatted
fenugreek seeds powder and flaxseeds powder on the rheological characteristics of
dough and quality of cookies. Int. J. Food Sci. Nutr. 62:336-44.
Middleton, E., C. Kandaswami and T.C. Theoharides. 2000. The effects of plant flavonoids on
mammalian cells: implications for inflammation, heart disease, and cancer. Pharmacol.
Rev. 52:673-751.
Misra, A. and L. Khurana. 2008. Obesity and the metabolic syndrome in developing countries.
J. Clin. Endocrinol. Metab. 93:9-30.
Mitra, A. and D. Bhattacharya. 2006. Dose-dependent effects of fenugreek composite in
diabetes with dislipidaemia. Internet J. Food Safety. 8:49-55.
Mollet, B. and C. Lacroix. 2007. Where biology and technology meet for better nutrition and
health. Curr. Opin. Biotechnol. 18:154-155.
Moosa, A.S.M., M.U. Rashid, A. Asadi, N. Ara, M.M. Uddin and A. Ferdaus. 2006.
Hypolipidemic effects of fenugreek seeds powder. Bangladesh J. Pharmacol. 1:64-67.

197
Mowl, A., M. Alauddin, M. Rahman and K. Ahmed. 2009. Antihyperglycemic effect of
Trigonella foenum-graecum (fenugreek) seeds extract in alloxan-induced diabetic rats
and its use in diabetes mellitus: a brief qualitative phytochemical and acute toxicity test
on the extract. Afr. J. Tradit. Complement. Altern. Med. 6:255-261.
Mpofu, A., T. Beta and H.D. Sapirstein. 2007. Effects of genotype, environment and genotype
× environment interaction on the antioxidant properties of wheat. Wheat antioxidants.
pp. 24-41.
Mueen-Ud-Din, G., F.M.Anjum. S.U. Rehman and H. Nawaz. 2009. Studies on organic acids
and minerals content of sourdough naans made from different extraction rate wheat
flours and starter cultures. Pak. J. Nutr. 8:877-881.
Mullaicharam, A. and U.M.R. Geetalideori. 2013. Medicinal values of fenugreek-A Review.
Res. J. Pharm. Biol. Chem. Sci. 4:1304-1313.
Murray, R., D. Granner, P. Mayes and W. Victor. 2003. Rodwell. Harper’s Illustrated
Biochemistry. 26th Ed. McGraw-Hill.
Nahar, N., B. Rokeya, L. Ali and Z. Hassan. 2000. Effects of three medicinal plants on blood
glucose levels of non-diabetic and diabetic model rats. Diabetes Res. 35:41-49.
Naidu, M.M., B. Shyamala, J.P. Naik, G. Sulochanamma and P. Srinivas. 2011. Chemical
composition and antioxidant activity of the husk and endosperm of fenugreek seeds.
LWT-Food Sci. Tech. 44:451-456.
Naidu, M.M., H. Khanum, G. Sulochanamma, H.B. Sowbhagya, U.H. Hebbar, M. Prakash and
P. Srinivas. 2012. Effect of Drying Methods on the Quality Characteristics of
Fenugreek (Trigonella foenum-graecum) Greens. Drying Tech. 30:808-816.
Narender, T., A. Puri, T. Khaliq, R. Saxena, G. Bhatia and R. Chandra. 2006. 4-
Hydroxyisoleucine an unusual amino acid as antidyslipidemic and antihyperglycemic
agent. Bioorganic & medicinal chemistry letters. 16:293-296.
Okoye, J.I. and E.A. Mazi. 2011. Proximate composition and functional properties of kidney
bean- wheat flour blends. J. Environ. Sci. Tech. 1:113-118.
198
Oktay, M., I. Gulcin and O.I. Kufrevioglu. 2003. Determination of in vitro antioxidant activity
of fennel (Foeniculum vulgare) seeds extracts. LWT-Food Sci. Tech. 36:263-271.
Olaoye, O. and A. Onilude. 2008. Microbiological, proximate analysis and sensory evaluation
of baked product from blends of wheat-breadfruit flours. Afr. J. Food Agric. Nutr. Dev.
8:192-203.
Oraby, F., A.H. Farrag, M. Khalil, J. Hussein and N. Abou El-Soud. 2008. Hypoglycemic
effect of selected herbal extracts on streptozotocin induced diabetic rats. J. Appl. Sci.
Res. 4:2001-2012.
Osella, C.A., H.D. Sanchez, C.R. Carrara, M.A. De La Torre and M.P. Buera. 2005. Water
redistribution and structural changes of starch during storage of a gluten‐free bread.
Starch‐Starke. 57:208-216.
Ozsoy, N., E. Candoken and N. Akev. 2009. Implications for degenerative disorders:
Antioxidative activity, total phenols, flavonoids, ascorbic acid, β-carotene and β-
tocopherol in Aloe vera. Oxid. Med. Cell. Longev. 2:99-106.
Pasha, I., Q.a.B. Khan, M.S. Butt and M. Saeed. 2013. Rheological and functional properties
of pumpkin wheat composite flour. Pak. J. Food Sci. 23:100-104.
Pasha, I., S. Rashid, F.M. Anjum, M.T. Sultan, M.M.N. Qayyum and F. Saeed. 2011. Quality
evaluation of wheat-mung bean flour blends and their utilization in baked products.
Pak. J. Nutr. 10:388-392.
Pasricha, V. and R.K. Gupta. 2014. Nutraceutical potential of Methi (Trigonella foenum-
graecum L.) and Kasuri methi (Trigonella corniculata L.). J. Pharmacogn. Phytochem.
3:47-57.
Pathak, N. and S. Agrawal. 2014. Atomic absorption spectrophotometer analysis for
determination of variation in mineral content in fenugreek genotypes cultivated at three
different locations. Int. J. Pharm. Sci. Invent. 3:40-45.
Patil, S.P., P.V. Niphadkar and M.M. Bapat. 1997. Allergy to fenugreek (Trigonella foenum-
graecum). Ann. Allergy Asthma Immunol. 78:297-300.

199
Paulsen, B. 2010. Highlights through the history of plant medicine. In: Bioactive compounds
in plants-benefits and risks for man and animals. Proceedings from a symposium held
at the Norwegian Academy of Science and Letters, Oslo 13-14 Nov. 2008. pp 18-29.
Pedersen, L., K. Kaack, M.N. Bergsøe and J. Adler-Nissen. 2004. Rheological properties of
biscuit dough from different cultivars, and relationship to baking characteristics. J.
Cereal Sci. 39:37-46.
Pergola, C., A. Rossi, P. Dugo, S. Cuzzocrea and L. Sautebin. 2006. Inhibition of nitric oxide
biosynthesis by anthocyanin fraction of blackberry extract. Nitric oxide. 15:30-39.
Petit, P.R., Y.D. Sauvaire, D.M. Hillaire-Buys, O.M. Leconte, Y.G. Baissac, G.R. Ponsin and
G.R. Ribes. 1995. Steroid saponins from fenugreek seeds: extraction, purification, and
pharmacological investigation on feeding behavior and plasma cholesterol. Steroids.
60:674-680.
Phattanakulkaewmorie, N., T. Paseephol and A. Moongngarm. 2011. Chemical compositions
and physico-chemical properties of malted sorghum flour and characteristics of gluten
free bread. World Acad. Sci. Eng. Tech. 57:454-460.
Pipelzadeh, M., A. Dezfulian, M. Koochek and M. Moradi. 2003. Comparison between
fenugreek and lovastatin in restoration of endothelial function in an experimental old
rat model. Acta. Medica. Iranica. 41:84-90.
Pomeranz, Y. 1988. Wheat: chemistry and technology, American Association of Cereal
Chemists.
Prasanna, M. 2000. Hypolipidemic effect of fenugreek: A clinical study. Ind. J. Pharmacol.
32:34-36.
Pravina, P., D. Sayaji and M. Avinash. 2013. Calcium and its role in human body. Int. J. Re.
Pharm. Biomed. Sci. 4:659-668.
Preedy, V.R., R.R. Watson and V.B. Patel 2011. Flour and breads and their fortification in
health and disease prevention, Academic press.

200
Premanath, R., J. Sudisha, N. Lakshmi Devi and S. Aradhya. 2011. Antibacterial and
antioxidant activities of Fenugreek (Trigonella foenum-graecum L.) leaves. Res. J.
Med. Plants. 5:695-705.
Priya, V., R. Jananie and K. Vijayalakshmi. 2011. Studies on anti-oxidant activity of
Trigonella foenum-graecum seeds using in vitro models. Int. J. Pharmaceut. Sci. Res.
2:2704-08.
Pruthi, J.S. 2001. Minor spices and condiments: crop management and post-harvest
technology. Indian Council of Agricultural Research, New Dehli, India.
Rajarajeswari, A., P. Vijayalakshmi and A.M. Sadiq. 2012. Influence of Trigonella foenum-
graecum (Fenugreek) in alloxan induced diabetic rats. The Bioscan. 7:395-400.
Raju, J. and R. Bird. 2006. Alleviation of hepatic steatosis accompanied by modulation of
plasma and liver TNF-α levels by Trigonella foenum-graecum (fenugreek) seeds in
Zucker obese (fa/fa) rats. Int. J. Obesity. 30:1298-1307.
Raju, J., J.M. Patlolla, M.V. Swamy and C.V. Rao. 2004. Diosgenin, a steroid saponin of
Trigonella foenum-graecum (Fenugreek), inhibits azoxymethane-induced aberrant
crypt foci formation in F344 rats and induces apoptosis in HT-29 human colon cancer
cells. Cancer Epidemiol Biomarkers Prev. 13:1392-1398.
Ramaa, C., A. Shirode, A. Mundada and V. Kadam. 2006. Nutraceuticals-an emerging era in
the treatment and prevention of cardiovascular diseases. Curr. Pharm. Biotechnol. 7:15-
23.
Randhawa, M.A., F.M. Anjum and M.S. Butt. 2002. Physico-chemical and milling properties
of new spring wheats grown in Punjab and Sind for the production of pizza. Int. J. Agri.
Biol. 4:482-484.
Rao, P.U., B. Sesikeran, P.S. Rao, A.N. Naidu, V.V. Rao and E. Ramachandran. 1996. Short
term nutritional and safety evaluation of fenugreek. Nutr. Res. 16:1495-1505.
Rao, Α. and D. Gurfinkel. 2000. The bioactivity of saponins: triterpenoid and steroidal
glycosides. Drug Metabol. Drug Interact. 17:211-235.

201
Rasool, A.A., D.A. Abdulkhaleq and D.A. Sabir. 2013. Effects of using different percentages
of fenugreek flour to improve the sensory, rheological properties and keeping quality
in maize dough to produces gluten-free breads. J. Agri. Sci. Tech. 3:380-384.
Ravikumar, P. and C. Anuradha. 1999. Effect of fenugreek seeds on blood lipid peroxidation
and antioxidants in diabetic rats. Phytother. Res. 13:197-201.
Rayyan, S., T. Fossen and O.M. Andersen. 2010. Flavone C-glycosides from seeds of
fenugreek, Trigonella foenum-graecum L. J. Agric. Food Chem. 58:7211-7217.
Razmi-Rad, E., B. Ghanbarzadeh, S. Mousavi, Z. Emam-Djomeh and J. Khazaei. 2007.
Prediction of rheological properties of Iranian bread dough from chemical composition
of wheat flour by using artificial neural networks. J. Food Eng. 81:728-734.
Reinila, A. 1981. Long term effects of untreated diabetes on the arterial wall in rat. Diabtologia.
20:205-212.
Ribes, G., Y. Sauvaire, C. Da Costa, J. Baccou and M. Loubatieres-Mariani. 1986. Antidiabetic
effects of subtractions from fenugreek seeds in diabetic dogs. Exp. Biol. Med. 182:159-
166.
Ribotta, P.D., S.A. Arnulphi, A.E. Leon and M.C. Anon. 2005. Effect of soybean addition on
the rheological properties and breadmaking quality of wheat flour. J. Sci. Food Agric.
85:1889-1896.
Rifai, N., P.S. Bachorik and J.J. Albers. 1999. Lipids, lipoproteins and apolipoproteins. Tietz
textbook of clinical chemistry. 3rd Ed. Philadelphia: WB Saunders Company. pp. 809-
861.
Roberts, K.T. 2011. The potential of fenugreek (Trigonella foenum-graecum) as a functional
food and nutraceutical and its effects on glycemia and lipidemia. J. Med. Food.
14:1485-9.
Roberts, K.T., S.W. Cui, Y.H. Chang, P.K.W. Ng and T. Graham. 2012. The influence of
fenugreek gum and extrusion modified fenugreek gum on bread. Food Hydrocolloids.
26:350-358.
202
Rodriguez‐Garcia, J., A. Puig, A. Salvador and I. Hernando. 2012. Optimization of a sponge
cake formulation with inulin as fat replacer: structure, physicochemical, and sensory
properties. J. Food Sci. 77:189-197.
Rosell, C., J. Rojas and C.B. De Barber. 2001. Influence of hydrocolloids on dough rheology
and bread quality. Food Hydrocolloids. 15:75-81.
Rosemen, M. and J. Kurzynske. 2006. Food safety perceptions and behaviors of Kentucky
consumer. J. Food Protection. 69:1412-1421.
Rossander-Hulten, L., M. Brune, B. Sandstrom, B. Lonnerdal and L. Hallberg. 1991.
Competitive inhibition of iron absorption by manganese and zinc in humans. Am. J.
Clin. Nutr. 54:152-156.
Rusak, G., D. Komes, S. Likic, D. Horzic and M. Kovac. 2008. Phenolic content and
antioxidative capacity of green and white tea extracts depending on extraction
conditions and the solvent used. Food Chem. 110:852-858.
Russo, A., V. Cardile, L. Lombardo, L. Vanella and R. Acquaviva. 2006. Genistin inhibits UV
light-induced plasmid DNA damage and cell growth in human melanoma cells. J. Nutr.
Biochem. 17:103-108.
Saeed, M.K., H. Zulfiqar, I. Ahmad, L. Liaqat, Q. Syed and A. Gulzar. 2013. Nutritional value
and antioxidant activity of Fenugreek (Trigonella foenum-graecum) from two regions
of Pakistan. Pak. J. Food Sci. 23:144-147.
Saleh, A.M., Alaa El-Din. Salama, S.H. Bedeir and E.I. Abd-Elazim. 2012. Effect of partial
substitution of wheat flour with either defatted soybean or chickpea flours at different
ratios on rheological and physical properties of dough and quality characteristics of
biscuits. J. Appl. Sci. Res. 8:5806-5817.
Sanlier, N. and S. Seren Karakus. 2010. Evaluation of food purchasing behaviour of consumers
from supermarkets. Br. Food J. 112:140-150.
Sauvaire, Y., P. Petit, C. Broca, M. Manteghetti, Y. Baissac, J. Fernandez-Alvarez, R. Gross,
M. Roye, A. Leconte and R. Gomis. 1998. 4-Hydroxyisoleucine: A novel amino acid
potentiator of insulin secretion. Diabetes. 47:206-210.
203
Schryver, T. 2002. Fenugreek. Total Health. 24:42-44.
Schwager, J., M.H. Mohajeri, A. Fowler and P. Weber. 2008. Challenges in discovering
bioactives for the food industry. Curr. Opin. Biotechnol. 19:66-72.
Serrem, C.A., H.L. De Kock and J. Taylor. 2011. Nutritional quality, sensory quality and
consumer acceptability of sorghum and bread wheat biscuits fortified with defatted soy
flour. Int. J. Food Sci. Tech. 46:74-83.
Sethi, G., K.S. Ahn and B.B. Aggarwal. 2008. Targeting nuclear factor-κB activation pathway
by thymoquinone: role in suppression of antiapoptotic gene products and enhancement
of apoptosis. Mol. Cancer Res. 6:1059-1070.
Shahidi, F. 2009. Nutraceuticals and functional foods: whole versus processed foods. Trends
Food Sci. Technol. 20:376-387.
Shahzad, F. and J.K. Khattak. 2011. Perception of functional foods among adult consumers in
Pakistan. Interdisciplinary Rev. Econ. Mgt. 1:16-24.
Shahzadi, N., M.S. Butt and K. Sharif. 2005. Rheological and baking performance of
composite flours. Int. J. Agri. Biol. 7:100-104.
Shakib, M. and S.G. Gabrial. 2010. Post-prandial responses to different bread products based
on wheat, barley and fenugreek or ginger or both in healthy volunteers and their effect
on the glycemic index of such products. J. Am. Sci. 6:89-96.
Shang, M., S. Cai, J. Han, J. Li, Y. Zhao, J. Zheng, T. Namba, S. Kadota, Y. Tezuka and W.
Fan. 1998. Studies on flavonoids from Fenugreek (Trigonella foenum-graecum L.
J. Chinese Materia. Medica. 23:614-6, 639.
Sharma, R., A. Sarkar, D. Hazara, B. Mishra, J. Singh, S. Sharma, B. Maheshwari and P.
Maheshwari. 1996. Use of Fenuqreek seeds powder in the management of non-insulin
dependent diabetes mellitus. Nutr. Res. 16:1331-1339.
Sharma, S., K. Sekhon and H. Nagi. 1995. Legume supplemented flat bread: Nutritive value,
textural and organoleptic changes during storage. J. Food Process. Preserv. 19:207-222.

204
Shetty, A.K. and P.V. Salimath. 2009. Reno-protective effects of fenugreek (Trigonella
foenum-greacum) during experimental diabetes. E. Spen. Eur. E J. Clin. Nutr. Metab.
4:137-142.
Shi, J., C.T. Ho and F. Shahidi 2010. Functional foods of the east, CRC Press.
Sindhu, G., M. Ratheesh, G. Shyni, B. Nambisan and A. Helen. 2012. Anti-inflammatory and
antioxidative effects of mucilage of Trigonella foenum-graecum (Fenugreek) on
adjuvant induced arthritic rats. Int. Immunopharmacol. 12:205-211.
Singh, K.P., B. Nair, P. Chand and A. Naidu. 2013. Contribution of fenugreek (Trigonella
foenum-graecum L.) seeds towards the nutritional characterization. J. Med. Plant Res.
7:3052-3058.
Singleton, V.L., R. Orthofer and R.M. Lamuela-Raventos. 1999. Analysis of total phenols and
other oxidation substrates and antioxidants by means of folin-ciocalteu reagent.
Methods Enzymol. 299:152-178.
Sliwinski, E., P. Kolster, A. Prins and T. Van Vliet. 2004. On the relationship between gluten
protein composition of wheat flours and large-deformation properties of their doughs.
J. Cereal Sci. 39:247-264.
Smith, M. 2003. Therapeutic applications of fenugreek. Alternative Medicine Review. 8:20-
27.
Snehlata, H.S. and D.R. Payal. 2012. Fenugreek (Trigonella foenum-graecum L.): An
overview. Int. J. Curr. Pharm. Rev. Res. 2:169-187.
Soetan, K., C. Olaiya and O. Oyewole. 2010. The importance of mineral elements for humans,
domestic animals and plants: A review. Afr. J. Food Sci. 4:200-222.
Sowmya, P. and P. Rajyalakshmi. 1999. Hypocholesterolemic effect of germinated fenugreek
seeds in human subjects. Plant Foods Hum. Nutr. 53:359-365.
Sramkova, Z., E. Gregova and E. Sturdik. 2009. Chemical composition and nutritional quality
of wheat grain. Acta. Chimica. Slovaca. 2:115-138.
Srinivasan, K. 2005. Role of spices beyond food flavoring: Nutraceuticals with multiple health
effects. Food Rev. Int. 21:167-188.

205
Srinivasan, K. 2006. Fenugreek (Trigonella foenum-graecum): A review of health beneficial
physiological effects. Food Rev. Int. 22:203-224.
Srivastava, D. 2012. Effect of fenugreek seeds husk on the rheology and quality characteristics
of muffins. Food Nutr. Sci. 03:1473-1479.
Stancu, C. and A. Sima. 2001. Statins: mechanism of action and effects. J. Cell. Mol. Med.
5:378-387.
Stark, A. and Z. Madar. 1993. The effect of an ethanol extract derived from fenugreek
(Trigonella foenum-graecum) on bile acid absorption and cholesterol levels in rats. Br.
J. Nutr. 69:277-287.
Steel, R.G.D., J.H. Torrie and D. Dickey. 1997. Principles and procedures of statistics: a
biometrical approach, 3rd ed. McGraw Hill Book Co., Inc., New York.
Steppan, C.M., S.T. Bailey, S. Bhat, E.J. Brown, R.R. Banerjee, C.M. Wright, H.R. Patel, R.S.
Ahima and M.A. Lazar. 2001. The hormone resistin links obesity to diabetes. Nature.
409:307-312.
Steyn, N.P., P. Wolmarans, J.H. Nel and L.T. Bourne. 2008. National fortification of staple
foods can make a significant contribution to micronutrient intake of South African
adults. Public Health Nutr. 11:307-313.
Subhashini, N., A. Thangathirupathi and N. Lavanya. 2011. Antioxidant activity of Trigonella
foenum-graecum using various in vitro and ex vivo models. Int. J. Pharm. Pharm. Sci.
3:96-102.
Sudha, M., S.W. Eipson, H. Khanum, M.M. Naidu and G.V. Rao. 2013. Effect of
normal/dehydrated greens on the rheological, microstructural, nutritional and quality
characteristics of paratha-an Indian flat bread. J. Food Sci. Tech. 52:840-848.
Sulieman, A., A. Ali and E. Elkhalifa. 2000. Quality aspects of bread supplemented with
fenugreek. Sud. J. Agri. Res. 3:65-68.
Suresh, P., C.N. Kavitha, S.M. Babu, V.P. Reddy and A.K. Latha. 2012. Effect of ethanol
extract of Trigonella foenum-graecum (fenugreek) seeds on freund's adjuvant-induced
arthritis in albino rats. Inflammation. 35:1314-1321.

206
Tait, S., A.L. Salvati, N. Desideri and L. Fiore. 2006. Antiviral activity of substituted
homoisoflavonoids on enteroviruses. Antiviral Res. 72:252-255.
Tanveer, M. 2014. Multifarious therapeutic perspectives of fenugreek to mitigate various
metabolic disorders. M.Sc (Hons.) Food Technology Thesis, University of Agriculture,
Faisalabad, Pakistan.
Tapsell, L.C., I. Hemphill, L. Cobiac, D.R. Sullivan, M. Fenech, C.S. Patch, S. Roodenrys,
J.B. Keogh, P.M. Clifton and P.G. Williams. 2006. Health benefits of herbs and spices:
the past, the present, the future. Med. J. Aust. 185:4-24.
Temple, R., P. Clark and C. Hales. 1992. Measurement of insulin secretion in type 2 diabetes:
problems and pitfalls. Diabetic Medicine. 9:503-512.
Tharise, N., E. Julianti and M. Nurminah. 2014. Evaluation of physico-chemical and functional
properties of composite flour from cassava, rice, potato, soybean and xanthan gum as
alternative of wheat flour. Int. Food Res. J. 21:1641-1649.
Thirunavukkarasu, V., C. Anuradha and P. Viswanathan. 2003. Protective effect of fenugreek
(Trigonella foenum-graecum) seeds in experimental ethanol toxicity. Phytother. Res.
17:737-743.
Thomas, J.E., M. Bandara, E.L. Lee, D. Driedger and S. Acharya. 2011. Biochemical
monitoring in fenugreek to develop functional food and medicinal plant variants. New
Biotech. 28:110-117.
Thomas, L., J.T. Whicher and S.E. Andert 1998. Clinical laboratory diagnostics: use and
assessment of clinical laboratory results, TH-books.
Toppo, F.A., R. Akhand and A. Pathak. 2009. Pharmacological actions and potential uses of
Trigonella foenum-graecum: A review. Asian J. Pharm. Clin. Res. 2:29-38.
Trinidad, T.P., A.C. Mallillin, A.S. Loyola, R.S. Sagum and R.R. Encabo. 2010. The potential
health benefits of legumes as a good source of dietary fibre. Br. J. Nutr. 103:569-574.
Turner, J. and R. Frey. 2005. Fenugreek [Online]. Available:
http://www.encyclopedia.com/doc/1G2-3435100306.html [Accessed 10 July 2015].

207
Uhl, S. 2000. Spices: tools for alternative or complementary medicine. Food Technol. 54:61-
68.
Valko, M., C. Rhodes, J. Moncol, M. Izakovic and M. Mazur. 2006. Free radicals, metals and
antioxidants in oxidative stress-induced cancer. Chem.-Biol. Interact. 160:1-40.
Van Dam, R.M., W.C. Willett, E.B. Rimm, M.J. Stampfer and F.B. Hu. 2002. Dietary fat and
meat intake in relation to risk of type 2 diabetes in men. Diabetes Care. 25:417-424.
Vijayakumar, M.V., S. Singh, R.R. Chhipa and M.K. Bhat. 2005. The hypoglycaemic activity
of fenugreek seeds extract is mediated through the stimulation of an insulin signalling
pathway. Br. J. Pharmacol. 146:41-48.
Vinatoru, M. 2001. An overview of the ultrasonically assisted extraction of bioactive principles
from herbs. Ultrasonics Sonochemistry. 8:303-313.
Viuda-Martos, M., Y. Ruiz-Navajas, J. Fernandez-Lopez and J. Perez-Alvarez. 2010. Spices
as functional foods. Crit. Rev. Food Sci. Nutr. 51:13-28.
Viuda-Martos, M., Y. Ruíz-Navajas, J. Fernández-López and J.A. Pérez-Álvarez. 2007.
Chemical composition of the essential oils obtained from some spices widely used in
Mediterranean region. Acta Chimica Slovenica. 54:921-926.
Vozarova, B., N. Stefan, R.S. Lindsay, A. Saremi, R.E. Pratley, C. Bogardus and P.A.
Tataranni. 2002. High alanine aminotransferase is associated with decreased hepatic
insulin sensitivity and predicts the development of type 2 diabetes. Diabetes. 51:1889-
1895.
Watson, E., A. Carvalho, R. Green, S. Britton and S. Scott. 2006. Functional ingredients. Food
Manuf. 81.
Wei, Y.M. 2002. Cereal and Food Quality, 1st Ed. Shanxi People Press, Shanxi.
Wieser, H. 2007. Chemistry of gluten proteins. Food Microbiol. 24:115-119.
Wiesler, F., J. Gerendas and B. Sattelmacher. 2003. Influence of mineral fertilizers on
nutritional quality of staple food crops. Impacts of Agriculture on Human Health and
Nutrition. 1. Encyclopedia of Life Support Systems (EOLSS).
http://www.eolss.net/sample-chapters/c10/E5-21-03.pdf

208
Wild, S., G. Roglic, A. Green, R. Sicree and H. King. 2004. Global prevalence of diabetes
estimates for the year 2000 and projections for 2030. Diabetes Care. 27:1047-1053.
Wolf, B. and S. Weisbrode. 2003. Safety evaluation of an extract from Salacia oblonga. Food
Chem. Toxicol. 41:867-874.
Wolff, S. 1993. Diabetes mellitus and free radicals Free radicals, transition metals and
oxidative stress in the aetiology of diabetes mellitus and complications. Br. Med. Bull.
49:642-652.
Worsley, A. and E. Lea. 2008. Consumer concerns about food and health: Examination of
general and specific relationships with personal values and demographics. Br. Food J.
110:1106-1118.
Wrigley, C.W., J.A. Bietz. 1988. In: Wheat Chemistry and Technology, Y. Pomeranz, Ed. St.
Paul, MN: American Association of Cereal Chemist. pp. 159-275.
Wyatt, C. and K. Ronan. 1982. Evaluation of potassium chloride as a salt substitute in bread.
J. Food Sci. 47:672-673.
Xue, W.L., X.S. Li, J. Zhang, Y.H. Liu, Z.L. Wang and R.J. Zhang. 2007. Effect of Trigonella
foenum-graecum (fenugreek) extract on blood glucose, blood lipid and
hemorheological properties in streptozotocin-induced diabetic rats. Asia Pac. J. Clin.
Nutr. 16:422-426.
Yadav, M., A. Lavania, R. Tomar, G. Prasad, S. Jain and H. Yadav. 2010. Complementary and
comparative study on hypoglycemic and antihyperglycemic activity of various extracts
of Eugenia jambolana seeds, Momordica charantia fruits, Gymnema sylvestre, and
Trigonella foenum-graecum seeds in rats. Appl. Biochem. Biotechnol. 160:2388-2400.
Young, C.E., R.H. Karas and J.T. Kuvin. 2004. High-density lipoprotein cholesterol and
coronary heart disease. Cardiol. Rev. 12:107-119.
Youssef, M., Q. Wang, S. Cui and S. Barbut. 2009. Purification and partial physicochemical
characteristics of protein free fenugreek gums. Food Hydrocolloids. 23:2049-2053.
Yu, L. and A.L. Nanguet. 2013. Comparison of antioxidant properties of refined and whole
wheat flour and bread. Antioxidants. 2:370-383.
209
Zakir, S., M. Sarwar, J. Allen, M. Butt, U. Arshad and A. Javaid. 2008. Impact of sweet potato
cultivars on blood glucose level in diabetic and healthy participants. Int. J. Agri. Biol.
10:316-320.
Zanoni, B., C. Peri and D. Bruno. 1995. Modelling of browning kinetics of bread crust during
baking. LWT-Food Sci. Tech. 28:604-609.
Zhishen, J., T. Mengcheng and W. Jianming. 1999. The determination of flavonoid contents
in mulberry and their scavenging effects on superoxide radicals. Food Chem. 64:555-
559.
Zhou, J., L. Chan and S. Zhou. 2012. Trigonelline: a plant alkaloid with therapeutic potential
for diabetes and central nervous system disease. Curr. Med. Chem. 19:3523-3531.
Zia, T., S.N. Hasnain and S. Hasan. 2001. Evaluation of the oral hypoglycaemic effect of
Trigonella foenum-graecum L. (methi) in normal mice. J. Ethnopharmacol. 75:191-
195.
Zobel, H.F. and K. Kulp 1996. In: “Baked Goods Freshness, staling mechanism, E. Ronald
and H. F. Hebeda (ed.), Marcel Dekker, New York.

210
APPENDIX I
Sensory Evaluation of Bread
Name of Judge ______________________
External Characteristics Treatments
Parameters T0 T1 T2 T3 T4 T5 T6
Volume
Color of Crust
Form Symmetry
Evenness of bake
Crust Character
Internal Characteristics Treatments
Parameters T0 T1 T2 T3 T4 T5 T6
Grain
Color of crumb
Aroma
Taste
Texture
Signature: ___________________ Date: ___________________
INSTRUCTIONS
Chew a sample and score for bread using the following 9-point Hedonic Scale:
Extremely poor 1 Very poor 2
Poor 3
Below fair above poor 4
Fair 5
Below good above fair 6
Good 7
Very good 8
Excellent 9

211
APPENDIX II
Experimental Diets
Ingredients (%) D0 D1 D2
Wheat Flour 82 72 77
Corn Oil 10 10 10
Vitamin Mixture 3 3 3
Mineral Mixture 1 1 1
Casein 4 4 4
Fenugreek seeds powder - 10 -
Fenugreek leaves powder - - 5
Sucrose* 40 - -
Cholic acid** 1.5 - -
* Added in diet for first week of trial to induced hyperglycemia in respective group
** Added in diet for first week of trial to induced hypercholesterolemia in respective group