the persistence of proximate cause: how legal doctrine thrives ...
Upload
khangminh22Category
view
1download
0
foods
Article
Proximate Analysis and Nutritional Evaluation ofTwenty Canadian Lentils by Principal Componentand Cluster Analyses
D. Dan Ramdath *, Zhan-Hui Lu , Padma L. Maharaj, Jordan Winberg, Yolanda Brummerand Aileen Hawke
Guelph Research and Development Center, Agriculture and Agri-Food Canada, Guelph, ON N1G 5C9, Canada;[email protected] (Z.-H.L.); [email protected] (P.L.M.); [email protected] (J.W.);[email protected] (Y.B.); [email protected] (A.H.)* Correspondence: [email protected]; Tel.: +1-226-2178082
Received: 17 December 2019; Accepted: 1 February 2020; Published: 11 February 2020�����������������
Abstract: Proximate composition and starch nutritional properties of twenty cooked lentils wereassessed to identify unique varieties that could be used in value added foods. Significant variationsexist among the lentil varieties (p < 0.05) with respect to their energy, fat, protein, carbohydrate,and dietary fiber content, and these are related to lentil type and seed size. Dazil and Greenstar wereunique for their high resistant starch content (RS) and lower area under the starch hydrolysis curve(SHAUC) while Proclaim was opposite. SHAUC was positively correlated (p < 0.001) with rapidlydigestible starch (RDS) content (r = 0.626) but negatively correlated with RS content (r = −0.635).Principal component analysis showed that the first three principal components accounted for62.8% of the total variance and the contribution of SHAUC was 33.2%. These results confirm thatin vitro SHAUC and a combination of RDS and RS may be predictive of the digestibility profile ofcooked lentils.
Keywords: lentil; starch digestibility; hydrolysis curve; resistant starch; dietary fiber
1. Introduction
Pulses such as lentils (Lens culinaris) are nutrient-dense foods that are included in dietaryrecommendations and several clinical practice guidelines [1]. On average, dry lentil seeds (per 100 g)contain 65 g total carbohydrate, 20 g protein, 4 g fiber, and 0.6 g fat, being rich in several essentialminerals [2]. Lentils are an excellent source of amino acids that can complement cereal proteins andare low in antinutritional factors [3]. Although Canada is the world’s leader in lentil production andexport, this pulse has limited consumption and only recently started to gain popularity in the NorthAmerican diet [4]. One of the reasons is the lack of properly developed food forms, which requiresin-depth understanding of the chemical and nutritional properties of lentils [5].
Lentils contain a high amount of glycemic or “available” carbohydrates, which are classified intothree main fractions of nutritional importance: rapidly digestible starch (RDS), slowly digestible starch(SDS), and resistant starch (RS) [6]. RDS is digested in the small intestine and leads to a rapid rise inblood glucose levels following ingestion. SDS, as an intermediate starch fraction between RDS and RS,is digested slowly throughout the entire small intestine to provide sustained and prolonged glucoserelease with a low initial glycemia. SDS is likely associated with positive health effects includingglycemic control, reduced postprandial circulated free fatty acids, and reduced oxidative stress [7].RS has the ability to modulate postprandial blood-glucose levels; it evades enzymatic hydrolysisin the small intestine, passing into the colon where it is fermented to produce butyrate-rich short
Foods 2020, 9, 175; doi:10.3390/foods9020175 www.mdpi.com/journal/foods
Foods 2020, 9, 175 2 of 16
chain fatty acids for energy [8]. In comparison with traditional fibers, RS provides better appearance,texture, and mouthfeel, thus offering better sensory properties and consumer acceptability of the finalproducts [9]. Although starch fractions have been characterized for a few lentil varieties, it wouldbe useful to have this information for a larger number of available varieties in order to better guidechoices for optimal formulation of lentil based foods.
Foods with low GI typically contain high levels of SDS and RS and have been recommended for thetreatment and prevention of diabetes, heart disease, and related conditions [10]; as such, lentil-basedfoods could make an important contribution. It is reasonable to assume that there will be variationsin starch digestion profiles, and thus glycemic responses, among samples from different lentil typesand varieties. This information can be obtained using in vitro digestion methods and provides anopportunity to assess the relationship between starch hydrolysis rate and predictive in vivo bloodglucose responses using well-accepted in vitro protocols [11].
This study was undertaken to define the chemical composition, dietary fiber fractions and starchnutritional properties of current and emerging Canadian lentil varieties, and to identify unique lentilvarieties and key factors affecting starch digestion in cooked lentils. Furthermore, dietary fiber fractionsincluding galacto-oligosaccharides (GOS) were also investigated to advance the understanding of theirinfluence on starch digestion. Finally, principal component analysis and cluster analysis were used toassess independent variables that contribute to lentil starch digestion.
2. Materials and Methods
2.1. Materials and Reagents
Twenty lentil varieties of red and green types and with varying seed sizes were obtained fromthe Saskatoon Crop Development Centre (CDC) in March 2014, and all the analyses were completedin 2015. The names and market classifications of each variety are listed in Table 1. Potato amylose(A0512), waxy corn starch (S9679), porcine pancreatin (P7545), pepsin (P7125) and invertase (I4504)were purchased from Sigma-Aldrich (St. Louis, MO, USA). Amyloglucosidase (EC 3.2.1.3, 3260 U/mL),total starch kits (K-TSTA), resistant starch kits (K-RSTAR), glucose oxidase-peroxidase kits (K-GLUC),and integrated total dietary fiber kits (K-INTDF) were purchased from Megazyme International IrelandLtd. (Bray, Ireland). All other chemicals used were of analytical grade. Purified water was used andprepared using a NANOpure® Infinity Ultrapure Water System (Barnstead, Dubuque, IA, USA).
2.2. Sample Preparation
Whole lentil seeds (150 g) were rinsed and cooked in a rice cooker (Model RC3406C Type 1, Black& Decker) with distilled water (1:3 seed:water ratio) as previously outlined [11]. The cooking time wasin a range from 35 to 70 min depending on the variety. Tests for doneness began at 10 min after boiling.The time required to attain a soft product was determined based on a tactile evaluation method. Lentilswere considered cooked when four out of five seeds had little to no resistance to squeezing betweenthumb and forefinger. Cooked lentils were cooled to room temperature, then freeze-dried at −40 ◦C(0.1 mBar; FreeZone 12, Labconco, Kansas, MO, USA) and subsequently ground (IKA M20 Universalmill; IKA® Works, Inc., Wilmington, NC, USA) to pass through a 250 µm sieve. The ground sampleswere stored in sealed plastic bags at room temperature prior to analysis.
2.3. Chemical Analysis
Freshly cooked lentils were sent to a commercial service provider (University of Arkansas,Fayetteville, AR, USA) for proximate analysis, where standard AOAC (Association of Official AnalyticalChemists) methods for total fat (AOAC 922.06), ash (AOAC 923.03), energy (bomb calorimetry) andprotein (AOAC 992.15) were used. Total dietary fiber was analyzed in house (AOAC 991.43) using acommercial kit (K-TDFR-100A; Megazyme International Ireland Ltd. Bray, Ireland) with modificationsto allow for the analysis of GOS. The filtrate for soluble dietary fiber (SDF) analysis was reduced in
Foods 2020, 9, 175 3 of 16
volume using a rotary evaporator (Büchi Rotavapor R-215) and diluted with deionized water in orderto determine the content of nondigestible GOS by HPLC with an anion-exchange column and a pulsedamperometric detection unit (HPAEC-PAD) (Dionex, Sunnyvale, CA, USA) [12]. Raffinose, stachyose,and verbascose content were quantified by comparing with appropriate standards. Carbohydrates(CHO, %) were calculated as the difference (CHO% = [100 −moisture% – protein% – fat% – ash%]).Total starch content was determined in duplicate using AACC (American Association of CerealChemists) method 76-13.01 (AACC, 1999) with DMSO pretreatment as outlined by the kit manufacturer(Megazyme International Ireland Ltd., Bray, Ireland). Apparent amylose content was measured usingan iodine colorimetric protocol [13].
Table 1. Proximate analysis of freeze-dried cooked lentil powders (dry weight basis).
Color/Class/Variety Energy, kJ Ash, % Fat, % Protein, % Carbohydrate, %
Red lentils
Extra smallRoxy 1885 ± 6 a 3.13 ± 0.01 f 1.49 ± 0.04 a 30.4 ± 0.2 bcd 65.0 ± 0.2 ijk
Impala 1846 ± 1 i 3.43 ± 0.01 d 0.85 ± 0.06 h 31.2 ± 0.1 ab 64.5 ± 0.1 jk
Rosie 1872 ± 5 abcdef 3.58 ± 0.01 c 0.50 ± 0.03 j 30.5 ± 0.6 abc 65.4 ± 0.6 hijSmall
Cherie 1875 ± 3 abcde 3.12 ± 0.02 f 1.25 ± 0.05 bc 29.4 ± 0.5 defgh 66.2 ± 0.5 fghDazil 1877 ± 3 abcd 3.27 ± 0.01 e 1.25 ± 0.05 bc 29.3 ± 0.4 defgh 66.2 ± 0.4 fghImpulse 1854 ± 6 hi 3.03 ± 0.04 g 1.33 ± 0.00 b 28.9 ± 0.3 efgh 66.7 ± 0.4 defgProclaim 1862 ± 1 efgh 3.17 ± 0.01 f 1.25 ± 0.04 bc 26.5 ± 0.3 i 69.1 ± 0.3 aImax 1865 ± 3 defgh 3.26 ± 0.02 e 1.16 ± 0.03 cd 29.3 ± 0.4 defgh 66.3 ± 0.4 fghImvincible 1881 ± 2 ab 3.01 ± 0.02 g 0.93 ± 0.03 fgh 29.6 ± 0.4 cdefgh 66.4 ± 0.4 efghRedberry 1879 ± 3 abc 2.89 ± 0.01 h 0.93 ± 0.03 fgh 30.5 ± 0.2 abc 65.7 ± 0.2 ghiScarlet 1877 ± 2 abcd 3.40 ± 0.02 d 1.13 ± 0.02 de 30.0 ± 0.5 cde 65.5 ± 0.5 hij
Green lentilsSmall
Kermit 1869 ± 4 bcdef 3.16 ± 0.03 f 1.03 ± 0.05 ef 31.6 ± 0.2 a 64.2 ± 0.2 kAsterix 1867 ± 5 cdefg 3.02 ± 0.01 g 1.30 ± 0.05 b 29.9 ± 0.3 cdef 65.8 ± 0.4 ghiViceroy 1880 ± 6 abc 3.00 ± 0.01 g 0.50 ± 0.02 j 28.9 ± 0.3 fgh 67.6 ± 0.3 cd
MediumImigreen 1861 ± 2 fgh 2.74 ± 0.03 i 0.62 ± 0.05 i 28.8 ± 0.2 gh 67.8 ± 0.2 bcImpress 1877 ± 6 abcd 2.97 ± 0.03 g 0.88 ± 0.02 gh 29.1 ± 0.4 efgh 67.1 ± 0.4 cdef
LargeGreenland 1877 ± 7 abcd 3.64 ± 0.03 b 0.91 ± 0.02 gh 28.5 ± 0.5 h 66.9 ± 0.5 cdefGreenstar 1878 ± 4 abcd 3.74 ± 0.01 a 0.97 ± 0.02 fg 29.7 ± 0.5 cdefg 65.6 ± 0.5 ghijImpower 1856 ± 4 ghi 2.70 ± 0.01 i 1.10 ± 0.03 de 27.4 ± 0.3 i 68.8 ± 0.4 abImprove 1843 ± 5 i 2.84 ± 0.03 h 0.98 ± 0.01 fg 28.6 ± 0.3 gh 67.6 ± 0.3 cde
Values followed by a different letter in the same column are significantly different (p < 0.05).
2.4. In Vitro Starch Digestion
The method of Englyst et al. [14] with minor modifications was used to characterize the in vitrostarch digestibility of cooked lentil samples. Porcine pancreatic α-amylase (0.45 g) was dispersed inwater (4 mL), and centrifuged at 1500 × g for 12 min. The supernatant (2.7 mL) was transferred to abeaker, and amyloglucosidase (0.3 mL) and invertase (0.2 mL) were added to the solution. This enzymesolution was freshly prepared. For each digestion, 100 mg of cooked lentil sample (see Section 2.2above) was added to 4 mL of 0.5 M sodium acetate buffer (pH 5.2) per test tube. The enzyme solution(1 mL) and 15 glass beads (4 mm diameter) were added and incubated in a shaking water bath (37 ◦C,200 strokes/min). Aliquots (0.1 mL) were taken at 20 and 120 min and mixed with 1 mL of 80%ethanol, after which free glucose content was measured by the glucose oxidase-peroxidase reagent.Percentages of rapidly digestible starch (RDS, % digestible starch at 20 min), slowly digestible starch(SDS, % digestible starch at 120 min – % digestible starch at 20 min), and resistant starch (RS, 100% –% digestible starch at 120 min) were normalized to the total starch content. For comparison, directquantification of RS and nonresistant starch (nonRS) was performed in triplicate using a Megazyme RS
Foods 2020, 9, 175 4 of 16
assay kit (K-RSTAR, Megazyme International Ireland Ltd., Bray, Ireland). Briefly, 100 mg of cooked lentilsample was incubated with pancreatic α-amylase (10 mg/mL) containing amyloglucosidase (3 U/mL)in 4 mL of sodium acetate butter (1.2 M, pH 3.8) at 37 ◦C with continuous shaking (200 strokes/min)for exactly 16 h. After incubation, 4 mL of ethanol (99%) was added to inactivate the enzyme and thesample was centrifuged at 1500 × g for 10 min. Glucose content of the supernatant was measured by aglucose oxidase-peroxidase assay kit (Megazyme International Ireland Ltd., Bray, Ireland). NonRS wasstarch digested within 16 h and RS was starch not hydrolyzed even after 16 h. To differentiate betweenthe RS obtained from Englyst et al.’s method and Megazyme kit, the term “RS-direct” was used for theRS obtained by the direct assay kit.
2.5. Estimated Glycemic Index (eGI)
The digestion kinetics of the lentil samples were tracked by a nonlinear model establishedby Goni et al. [15]. The first-order equation is C = C∞
(1− e−kt
). The area under the in vitro
starch hydrolysis curve (SHAUC, mg min mL−1) was calculated from the integrals of equationSHAUC = C∞
(t f − t0
)−
C∞k
[1− e−k(t f−t0)
]from 0 (t0) to 120 min (tf), where C is the percentage of starch
hydrolyzed at time t (min), C∞ is the equilibrium percentage of starch hydrolyzed after 120 min, and kis the kinetic constant. The hydrolysis index (HI) was calculated as the ratio of the area under thehydrolysis curve (0–120 min) of lentil sample and the area of standard material from white bread.The expected glycemic index (eGI) was calculated using equation (eGI = 8.198 + 0.862 × HI) proposedby Granfeldt et al. [16].
2.6. Statistical Analysis
Samples were tested at least in triplicate. Statistical analyses (t-test and one-way analysis ofvariance (ANOVA)) were performed using SAS (Version 9.3 for Windows, SAS Institute Inc., Cary,NC, USA). When appropriate, the difference amongst means was determined using Tukey’s post hoctest, except that Dunnett’s method was used for multiple comparison of kinetic parameters and eGI ofcooked lentils to those of white bread control. Pearson correlation coefficients and principal componentanalysis (PCA) were performed on centered and standardized data to elucidate the relationshipsamong variables of the chemical and nutritional properties of samples. Cluster analysis (CA) wasconducted using furthest neighbor linkage method and with Euclidean distance being the measureof similarity. Dendrogram and K-means plot were drawn to visualize the clusters of lentil samples.Both PCA and CA were conducted by OriginLab 9 (OriginLab Corporation, Northampton, MA, USA).Statistical significance was set at the 5% level of probability.
3. Results and Discussion
3.1. Proximate Analysis of Cooked Lentils
Results of proximate analyses of the twenty freeze-dried and ground cooked lentils are shownin Table 1. The range of values (100 g dry weight) for the lentil varieties were: 1843 kJ (Improve) to1885 kJ (Roxy) for energy; 2.70% (Impower) to 3.74% (Greenstar) for ash; 0.50% (Viceroy, Rosie) to 1.49%(Roxy) for fat; 26.5% (Proclaim) to 31.6% (Kermit) for protein; and 64.2% (Kermit) to 69.1% (Proclaim)for carbohydrate (Table 1). These values are in a similar range to the previous studies (different lentilvarieties) [17,18] and varied among the lentil types, seed size, and varieties. The energy values wereobtained by bomb calorimetry, and hence the lower energy content of fiber and resistant starch werenot taken into account.
On average, red lentils had higher fat content (p < 0.01) and lower carbohydrate and total starchcontent (p < 0.05) than green-type lentils, regardless of seed size. At the same seed size, fat contentin red type (1.2%) was significantly higher than that of green type (0.9%) (p < 0.05). Within red-typelentils, the extra-small seeds showed higher ash and protein content (p < 0.001) but lower fat (p < 0.05)and lower carbohydrate (p < 0.01) content than the small seed. This observation was also true for
Foods 2020, 9, 175 5 of 16
green-type lentils, i.e., small seeds also had higher protein content and lower carbohydrate content(p < 0.05) (Table 1). The variations of proximate compositions are likely to result in different nutritionalproperties of cooked lentils.
3.2. Dietary Fiber Composition of Cooked Lentils
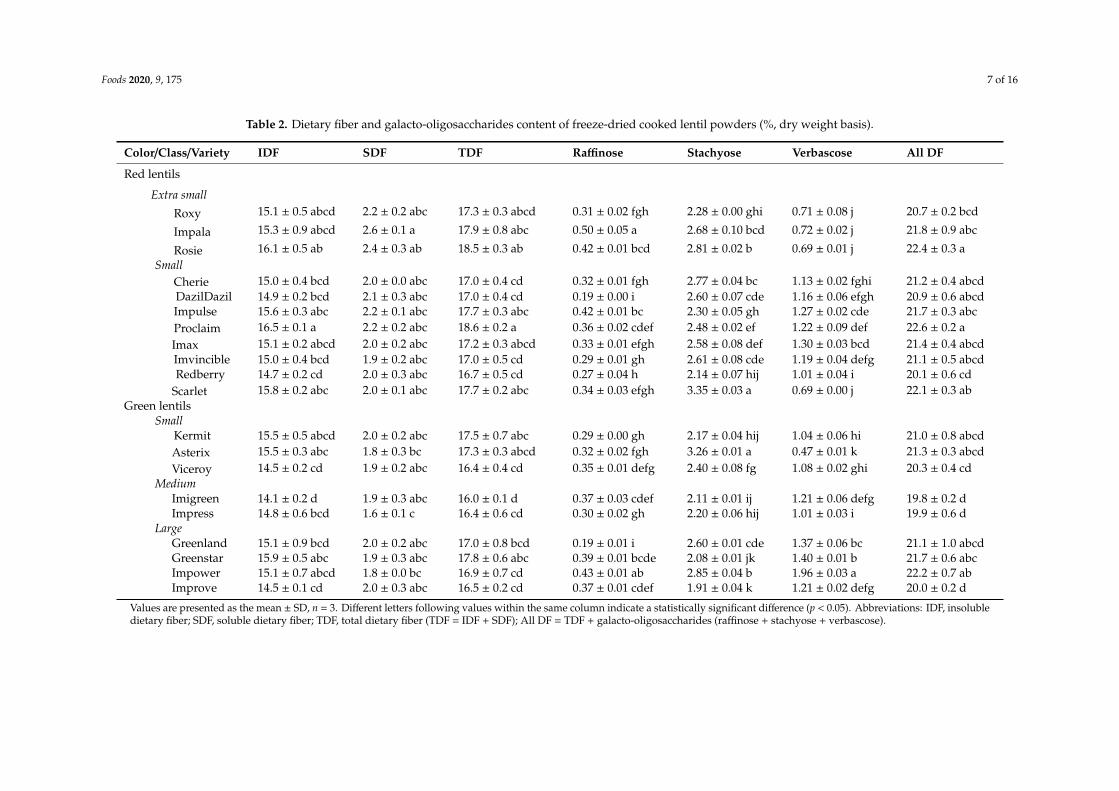
Dietary fiber composition results for the cooked lentils are presented in Table 2, with the followingrange of values: 14.1% (Imigreen) to 16.5% (Proclaim) for insoluble dietary fiber (IDF); 1.6% (Impress)to 2.6% (Impala) for SDF; 16.0% (Imigreen) to 18.6% (Proclaim) for total dietary fiber (TDF); 0.19%(Greenland, Dazil) to 0.50% (Impala) for raffinose; 1.91% (Improve) to 3.35% (Scarlet) for stachyose;and 0.47% (Asterix) to 1.96% (Impower) for verbascose. All DF ranged from 19.8% (Imigreen) to22.6% (Proclaim). These ranges are similar to those obtained for different lentil varieties in otherstudies [17,19,20], with acceptable variations from lentil type, variety, growing year, location andsample preparation methods. In contrast to the proximate analysis results, smaller variations wereseen in dietary fiber compositions among cooked lentil samples. On average, red-type lentils hadhigher dietary fiber fractions (IDF, SDF, TDF, stachyose, and all DF) but lower verbascose than that ofgreen type, regardless of seed size (p < 0.05). At the same seed size, verbascose in red type (1.1%) wassignificantly higher than that of green type (0.9%) (p < 0.05). Within red-type lentils, extra-small seedsshowed higher SDF and raffinose content but lower verbascose content than small seeds (p < 0.01).Within green-type lentils, small and medium size seeds had significantly lower verbascose contentthan large size seed (p < 0.05). Interestingly, verbascose was higher in larger seed-size lentils regardlessof lentil type (Table 2).
3.3. Total Starch, Apparent Amylose Content and In Vitro Starch Digestibility Determined by Indirect andDirect Methods
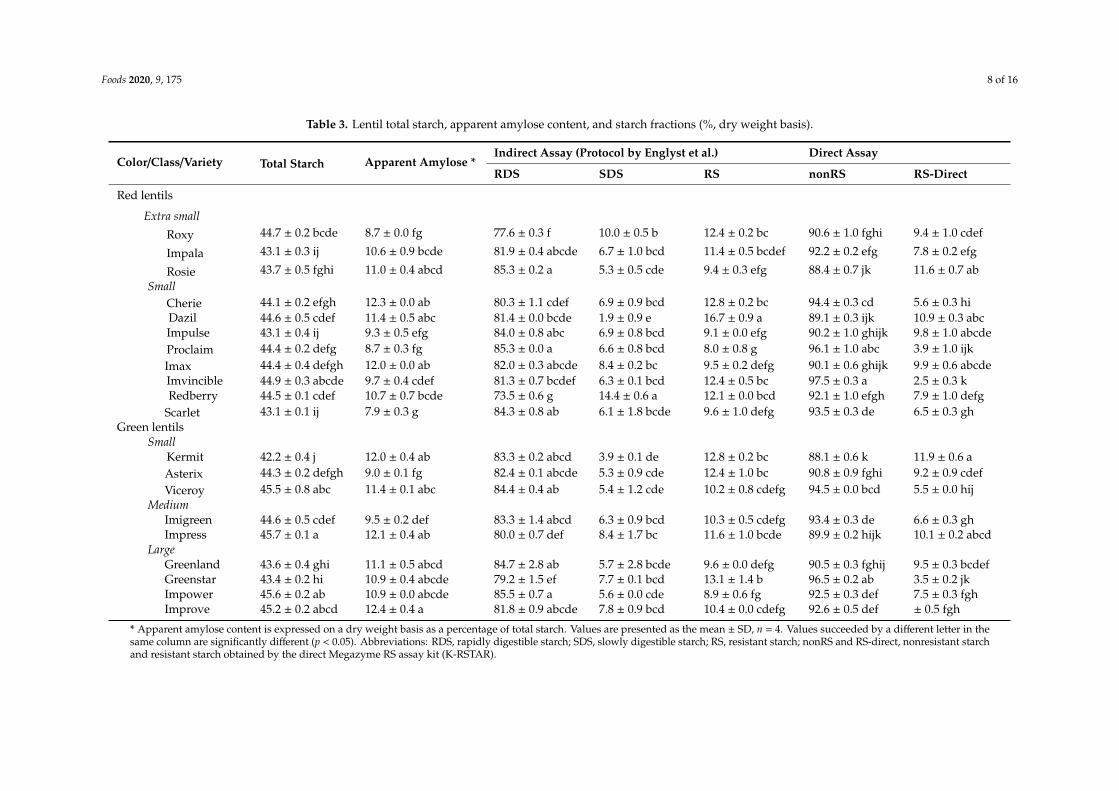
Total starch content, apparent amylose content, and starch nutritional fractions determined by themethod of Englyst et al. [14] (indirect method) and Megazyme RS kit (direct method) are shown inTable 3. The total starch ranged from 42.2% (Kermit) to 45.7% (Impress), which is in accordance withthe typically reported starch content of lentil flours [18,21]. A larger variation was seen with apparentamylose content, which ranged from 7.9% (Scarlet) to 12.4% (Improve). Lu et al. [5] previously reported19–26% of apparent amylose in eight raw Canadian lentil flours. It is likely that cooking resultedin amylose complexing with other lentil constituents (e.g., lipids and phenolic compounds) and/or,less likely, that amylose may have leached out into cooking water, thereby accounting for the loweramylose content. The reduction in amylose content after cooking was also observed in cooked rice [22].
Using the indirect method [14], RDS, SDS, and RS content of the cooked lentils ranged from73.5% (Redberry) to 85.5% (Impower), 1.9% (Dazil) to 14.4% (Redberry), and 8.0% (Proclaim) to 16.7%(Dazil), respectively. The starch fractions measured by Megazyme RS assay kit were in the ranges of88.1% (Kermit) to 97.5% (Imvincible) for nonRS and 2.5% (Imvincible) to 11.9% (Kermit) for RS-direct,respectively. The results of RS amount determined by the method of Englyst et al. [14] are in accordancewith one previous study [5], but higher than values reported by Costa et al. [17] and lower than those byothers [15,23–25]. Moreover, the RS values measured by the direct method were generally lower thanthose measured by the indirect method, especially for Proclaim, Imvincible, and Greenstar (Table 3).These inconsistencies have been attributed to factors such as sample preparation, pretreatment,and incubation conditions (stirring or shaking, pH, temperature, time, and enzyme mixtures) inherentto different methods [26–28] and to the nature of plant materials. Consistent RS values were reportedfor bean flakes, corn flakes, and canned beans by either the Englyst method or Megazyme kit, but largevariations were observed on native potato starch and native and retrograded amylomaize starch [28].
Within a specific method, e.g., the method of Englyst et al. [14], variations in starch digestibilitymay be attributed to individual starch characteristics of different lentil varieties and interactions(e.g., matrix effect, complexing) between starch and other chemical compositions in cooked lentils,such as protein [29], lipids [30], and phenolic compounds [31,32]. Besides starch–phenoliccompound

Foods 2020, 9, 175 6 of 16
complexing, which increases SDS and RS amount, flavonols in lentils were also reported to beresponsible for the inhibitory activities against α-glucosidase [32]. Therefore, its role on various starchfractions of these twenty cooked lentils should not be ignored.
As shown in Table 3, the average RS content was ~11% for either red-type lentils or green-typelentils, with no significant difference. However, Lu et al. [5] reported that, on average, cooked redlentil flour had significantly higher RS content (11.0%) than flour from green lentils (6.8%) (p < 0.05)and attributed the difference to higher total flavonol index of red lentils (452.5 µg g−1 db) than thatof green lentils (449.9 µg g−1 db). Another study showed that there were exceptions with two greenlentils that contained high levels of phenolic compounds [32]. The inconsistency could be attributed tothe extremely low RS content (8%) of Proclaim (red type), and high RS content (13.1%) of Greenstar(green type) in this set of lentil samples. These two samples appear to be outliers among these twentylentils (Table 3). Cooking methods may also account for differences, as lentil seeds were cooked wholein this study, not heated in a test tube as a powder [5].
RS content obtained by Megazyme kit (RS-direct) supports the previous observations [5] andalso showed that, on average, smaller seed-size lentils had higher RS content, regardless of lentiltype (p < 0.05, Table 3). The above results suggest that starch digestibility of cooled lentils was moredependent on variety than type.
3.4. Kinetic Study of Starch Digestion and Estimated Glycemic Index (eGI)
Starch hydrolysis curves were plotted as time vs. percent digestible starch (derived from glucosemeasurements) taken at different sampling times (0, 5, 10, 20, 60, and 120 min) during in vitro digestion(Figure S1). The average percentage of starch hydrolyzed to glucose after 20 min of digestion was 82.3%.This is similar to the finding reported by Wong et al. [33]. Afterwards, an average increase of only6.7% was observed from 20 to 60 min, indicating that the starch hydrolysis was nearing completion.Similarly, Zhou et al. [34] found that the plateau for in vitro hydrolysis of lentil starch occurred afterabout 85% of the starch had been digested. Additionally, there was very little difference in the amountof glucose released between 60 and 120 min of starch hydrolysis, and none of the lentils were fullyhydrolyzed. The latter was also observed with gelatinized red lentil starch, in which 90.4% was fullyhydrolyzed following digestion [35].
The kinetic parameters (C∞, k), SHAUC, HI and eGI for each lentil sample and for the referencefood (white bread) are presented in Table 4. The range of values observed were: 81.6% (Dazil) to90.3% (Proclaim) for C∞; 0.14 min−1 (Redberry) to 0.33 min−1 (Imvincible, Dazil) for k; 9527 (Redberry)to 10,516 (Proclaim) for SHAUC (mg min mL−1); 84% (Redberry) to 92.7% (Proclaim) for HI; and 81(Dazil, Imvincible, Redberry) to 88 (Proclaim) for eGI. The eGI of cooked lentils obtained in this studyis slightly higher than the GI of 74 for canned lentil listed in The International Table of Glycemic Indexand Glycemic Load Values [36]. The difference could be attributed to the extensive sample preparationprocesses [37] including cooking, freeze-drying, and mechanical grinding using a cyclone mill in thisstudy, which would expose starch to digestive enzymes because of much reduced particle size [38],increased available surface area for enzymatic action [39], and potential depolymerization of starchdue to milling.
No significant differences were identified in the starch hydrolysis variables among lentil types orseed size; however, these were all significantly different from white bread control (Dunnett post hoc; p< 0.05). Because of collinearity among eGI, HI, and SHAUC, and the fact that SHAUC is a primaryoutcome of starch digestibility, SHAUC, instead of eGI, was used in multivariate analysis that exploredkey factors affecting lentil starch digestibility, and in identifying unique lentil varieties.
Foods 2020, 9, 175 7 of 16
Table 2. Dietary fiber and galacto-oligosaccharides content of freeze-dried cooked lentil powders (%, dry weight basis).
Color/Class/Variety IDF SDF TDF Raffinose Stachyose Verbascose All DF
Red lentils
Extra smallRoxy 15.1 ± 0.5 abcd 2.2 ± 0.2 abc 17.3 ± 0.3 abcd 0.31 ± 0.02 fgh 2.28 ± 0.00 ghi 0.71 ± 0.08 j 20.7 ± 0.2 bcd
Impala 15.3 ± 0.9 abcd 2.6 ± 0.1 a 17.9 ± 0.8 abc 0.50 ± 0.05 a 2.68 ± 0.10 bcd 0.72 ± 0.02 j 21.8 ± 0.9 abc
Rosie 16.1 ± 0.5 ab 2.4 ± 0.3 ab 18.5 ± 0.3 ab 0.42 ± 0.01 bcd 2.81 ± 0.02 b 0.69 ± 0.01 j 22.4 ± 0.3 aSmall
Cherie 15.0 ± 0.4 bcd 2.0 ± 0.0 abc 17.0 ± 0.4 cd 0.32 ± 0.01 fgh 2.77 ± 0.04 bc 1.13 ± 0.02 fghi 21.2 ± 0.4 abcdDazilDazil 14.9 ± 0.2 bcd 2.1 ± 0.3 abc 17.0 ± 0.4 cd 0.19 ± 0.00 i 2.60 ± 0.07 cde 1.16 ± 0.06 efgh 20.9 ± 0.6 abcdImpulse 15.6 ± 0.3 abc 2.2 ± 0.1 abc 17.7 ± 0.3 abc 0.42 ± 0.01 bc 2.30 ± 0.05 gh 1.27 ± 0.02 cde 21.7 ± 0.3 abcProclaim 16.5 ± 0.1 a 2.2 ± 0.2 abc 18.6 ± 0.2 a 0.36 ± 0.02 cdef 2.48 ± 0.02 ef 1.22 ± 0.09 def 22.6 ± 0.2 aImax 15.1 ± 0.2 abcd 2.0 ± 0.2 abc 17.2 ± 0.3 abcd 0.33 ± 0.01 efgh 2.58 ± 0.08 def 1.30 ± 0.03 bcd 21.4 ± 0.4 abcdImvincible 15.0 ± 0.4 bcd 1.9 ± 0.2 abc 17.0 ± 0.5 cd 0.29 ± 0.01 gh 2.61 ± 0.08 cde 1.19 ± 0.04 defg 21.1 ± 0.5 abcdRedberry 14.7 ± 0.2 cd 2.0 ± 0.3 abc 16.7 ± 0.5 cd 0.27 ± 0.04 h 2.14 ± 0.07 hij 1.01 ± 0.04 i 20.1 ± 0.6 cd
Scarlet 15.8 ± 0.2 abc 2.0 ± 0.1 abc 17.7 ± 0.2 abc 0.34 ± 0.03 efgh 3.35 ± 0.03 a 0.69 ± 0.00 j 22.1 ± 0.3 abGreen lentils
SmallKermit 15.5 ± 0.5 abcd 2.0 ± 0.2 abc 17.5 ± 0.7 abc 0.29 ± 0.00 gh 2.17 ± 0.04 hij 1.04 ± 0.06 hi 21.0 ± 0.8 abcdAsterix 15.5 ± 0.3 abc 1.8 ± 0.3 bc 17.3 ± 0.3 abcd 0.32 ± 0.02 fgh 3.26 ± 0.01 a 0.47 ± 0.01 k 21.3 ± 0.3 abcdViceroy 14.5 ± 0.2 cd 1.9 ± 0.2 abc 16.4 ± 0.4 cd 0.35 ± 0.01 defg 2.40 ± 0.08 fg 1.08 ± 0.02 ghi 20.3 ± 0.4 cd
MediumImigreen 14.1 ± 0.2 d 1.9 ± 0.3 abc 16.0 ± 0.1 d 0.37 ± 0.03 cdef 2.11 ± 0.01 ij 1.21 ± 0.06 defg 19.8 ± 0.2 dImpress 14.8 ± 0.6 bcd 1.6 ± 0.1 c 16.4 ± 0.6 cd 0.30 ± 0.02 gh 2.20 ± 0.06 hij 1.01 ± 0.03 i 19.9 ± 0.6 d
LargeGreenland 15.1 ± 0.9 bcd 2.0 ± 0.2 abc 17.0 ± 0.8 bcd 0.19 ± 0.01 i 2.60 ± 0.01 cde 1.37 ± 0.06 bc 21.1 ± 1.0 abcdGreenstar 15.9 ± 0.5 abc 1.9 ± 0.3 abc 17.8 ± 0.6 abc 0.39 ± 0.01 bcde 2.08 ± 0.01 jk 1.40 ± 0.01 b 21.7 ± 0.6 abcImpower 15.1 ± 0.7 abcd 1.8 ± 0.0 bc 16.9 ± 0.7 cd 0.43 ± 0.01 ab 2.85 ± 0.04 b 1.96 ± 0.03 a 22.2 ± 0.7 abImprove 14.5 ± 0.1 cd 2.0 ± 0.3 abc 16.5 ± 0.2 cd 0.37 ± 0.01 cdef 1.91 ± 0.04 k 1.21 ± 0.02 defg 20.0 ± 0.2 d
Values are presented as the mean ± SD, n = 3. Different letters following values within the same column indicate a statistically significant difference (p < 0.05). Abbreviations: IDF, insolubledietary fiber; SDF, soluble dietary fiber; TDF, total dietary fiber (TDF = IDF + SDF); All DF = TDF + galacto-oligosaccharides (raffinose + stachyose + verbascose).
Foods 2020, 9, 175 8 of 16
Table 3. Lentil total starch, apparent amylose content, and starch fractions (%, dry weight basis).
Color/Class/Variety Total Starch Apparent Amylose *Indirect Assay (Protocol by Englyst et al.) Direct Assay
RDS SDS RS nonRS RS-Direct
Red lentils
Extra smallRoxy 44.7 ± 0.2 bcde 8.7 ± 0.0 fg 77.6 ± 0.3 f 10.0 ± 0.5 b 12.4 ± 0.2 bc 90.6 ± 1.0 fghi 9.4 ± 1.0 cdef
Impala 43.1 ± 0.3 ij 10.6 ± 0.9 bcde 81.9 ± 0.4 abcde 6.7 ± 1.0 bcd 11.4 ± 0.5 bcdef 92.2 ± 0.2 efg 7.8 ± 0.2 efg
Rosie 43.7 ± 0.5 fghi 11.0 ± 0.4 abcd 85.3 ± 0.2 a 5.3 ± 0.5 cde 9.4 ± 0.3 efg 88.4 ± 0.7 jk 11.6 ± 0.7 abSmall
Cherie 44.1 ± 0.2 efgh 12.3 ± 0.0 ab 80.3 ± 1.1 cdef 6.9 ± 0.9 bcd 12.8 ± 0.2 bc 94.4 ± 0.3 cd 5.6 ± 0.3 hiDazil 44.6 ± 0.5 cdef 11.4 ± 0.5 abc 81.4 ± 0.0 bcde 1.9 ± 0.9 e 16.7 ± 0.9 a 89.1 ± 0.3 ijk 10.9 ± 0.3 abcImpulse 43.1 ± 0.4 ij 9.3 ± 0.5 efg 84.0 ± 0.8 abc 6.9 ± 0.8 bcd 9.1 ± 0.0 efg 90.2 ± 1.0 ghijk 9.8 ± 1.0 abcdeProclaim 44.4 ± 0.2 defg 8.7 ± 0.3 fg 85.3 ± 0.0 a 6.6 ± 0.8 bcd 8.0 ± 0.8 g 96.1 ± 1.0 abc 3.9 ± 1.0 ijkImax 44.4 ± 0.4 defgh 12.0 ± 0.0 ab 82.0 ± 0.3 abcde 8.4 ± 0.2 bc 9.5 ± 0.2 defg 90.1 ± 0.6 ghijk 9.9 ± 0.6 abcdeImvincible 44.9 ± 0.3 abcde 9.7 ± 0.4 cdef 81.3 ± 0.7 bcdef 6.3 ± 0.1 bcd 12.4 ± 0.5 bc 97.5 ± 0.3 a 2.5 ± 0.3 kRedberry 44.5 ± 0.1 cdef 10.7 ± 0.7 bcde 73.5 ± 0.6 g 14.4 ± 0.6 a 12.1 ± 0.0 bcd 92.1 ± 1.0 efgh 7.9 ± 1.0 defg
Scarlet 43.1 ± 0.1 ij 7.9 ± 0.3 g 84.3 ± 0.8 ab 6.1 ± 1.8 bcde 9.6 ± 1.0 defg 93.5 ± 0.3 de 6.5 ± 0.3 ghGreen lentils
SmallKermit 42.2 ± 0.4 j 12.0 ± 0.4 ab 83.3 ± 0.2 abcd 3.9 ± 0.1 de 12.8 ± 0.2 bc 88.1 ± 0.6 k 11.9 ± 0.6 aAsterix 44.3 ± 0.2 defgh 9.0 ± 0.1 fg 82.4 ± 0.1 abcde 5.3 ± 0.9 cde 12.4 ± 1.0 bc 90.8 ± 0.9 fghi 9.2 ± 0.9 cdefViceroy 45.5 ± 0.8 abc 11.4 ± 0.1 abc 84.4 ± 0.4 ab 5.4 ± 1.2 cde 10.2 ± 0.8 cdefg 94.5 ± 0.0 bcd 5.5 ± 0.0 hij
MediumImigreen 44.6 ± 0.5 cdef 9.5 ± 0.2 def 83.3 ± 1.4 abcd 6.3 ± 0.9 bcd 10.3 ± 0.5 cdefg 93.4 ± 0.3 de 6.6 ± 0.3 ghImpress 45.7 ± 0.1 a 12.1 ± 0.4 ab 80.0 ± 0.7 def 8.4 ± 1.7 bc 11.6 ± 1.0 bcde 89.9 ± 0.2 hijk 10.1 ± 0.2 abcd
LargeGreenland 43.6 ± 0.4 ghi 11.1 ± 0.5 abcd 84.7 ± 2.8 ab 5.7 ± 2.8 bcde 9.6 ± 0.0 defg 90.5 ± 0.3 fghij 9.5 ± 0.3 bcdefGreenstar 43.4 ± 0.2 hi 10.9 ± 0.4 abcde 79.2 ± 1.5 ef 7.7 ± 0.1 bcd 13.1 ± 1.4 b 96.5 ± 0.2 ab 3.5 ± 0.2 jkImpower 45.6 ± 0.2 ab 10.9 ± 0.0 abcde 85.5 ± 0.7 a 5.6 ± 0.0 cde 8.9 ± 0.6 fg 92.5 ± 0.3 def 7.5 ± 0.3 fghImprove 45.2 ± 0.2 abcd 12.4 ± 0.4 a 81.8 ± 0.9 abcde 7.8 ± 0.9 bcd 10.4 ± 0.0 cdefg 92.6 ± 0.5 def ± 0.5 fgh
* Apparent amylose content is expressed on a dry weight basis as a percentage of total starch. Values are presented as the mean ± SD, n = 4. Values succeeded by a different letter in thesame column are significantly different (p < 0.05). Abbreviations: RDS, rapidly digestible starch; SDS, slowly digestible starch; RS, resistant starch; nonRS and RS-direct, nonresistant starchand resistant starch obtained by the direct Megazyme RS assay kit (K-RSTAR).

Foods 2020, 9, 175 9 of 16
Table 4. Exponential model parameters (C∞, k), area under the curve (SHAUC), hydrolysis index (HI), and estimated glycemic index (eGI) of Canadian lentil varieties.
Color/Class/Variety C∞, % K, min−1 SHAUC, mg min mL−1 HI, % eGI
Control (white bread) 94.6 ± 0.8 2478.33 ± 43.41 11343 ± 94 100.0 ± 0.8 95 ± 1Red lentils
Extra smallRoxy 82.5 ± 3.6 cd 0.19 ± 0.02 gh 9735 ± 145 bcde 85.8 ± 1.3 bcde 82 ± 1 bcde
Impala 86.3 ± 0.5 abcd 0.21 ± 0.01 defg 9919 ± 16 abcde 87.4 ± 0.1 abcde 84 ± 0 abcde
Rosie 88.8 ± 0.5 ab 0.24 ± 0.01 cde 10238 ± 51 abcd 90.3 ± 0.5 abcd 86 ± 0 abcdSmall
Cherie 86.1 ± 1.8 abcd 0.21 ± 0.03 defg 9783 ± 56 bcde 86.2 ± 0.5 bcde 83 ± 0 bcdeDazil 81.6 ± 0.4 d 0.33 ± 0.02 a 9537 ± 37 e 84.1 ± 0.3 e 81 ± 0 eImpulse 89.0 ± 1.2 ab 0.23 ± 0.01 cdef 10347 ± 31 ab 91.2 ± 0.3 ab 87 ± 0 abProclaim 90.3 ± 0.7 a 0.25 ± 0.01 bcd 10516 ± 10 a 92.7 ± 0.1 a 88 ± 0 aImax 86.2 ± 1.5 abcd 0.23 ± 0.01 cdef 9967 ± 151 abcde 87.9 ± 1.3 abcde 84 ± 1 abcdeImvincible 85.7 ± 2.9 abcd 0.33 ± 0.00 a 9626 ± 104 de 84.9 ± 0.9 de 81 ± 1 deRedberry 85.0 ± 2.4 abcd 0.14 ± 0.02 i 9527 ± 199 e 84.0 ± 1.8 e 81 ± 2 e
Scarlet 90.2 ± 1.5 a 0.24 ± 0.01 cdef 10333 ± 89 ab 91.1 ± 0.8 ab 87 ± 1 abGreen lentils
SmallKermit 84.5 ± 0.8 bcd 0.29 ± 0.01 ab 9887 ± 89 bcde 87.2 ± 0.8 bcde 83 ± 1 bcdeAsterix 87.7 ± 1.8 abc 0.29 ± 0.01 ab 10326 ± 183 abc 91.0 ± 1.6 abc 87 ± 1 abcViceroy 84.0 ± 3.6 bcd 0.21 ± 0.03 defg 9798 ± 395 bcde 86.4 ± 3.5 bcde 83 ± 3 bcde
MediumImigreen 86.9 ± 1.1 abcd 0.21 ± 0.01 efg 10005 ± 15 abcde 88.2 ± 0.1 abcde 84 ± 0 abcdeImpress 87.2 ± 1.3 abc 0.15 ± 0.02 hi 9931 ± 133 abcde 87.6 ± 1.2 abcde 84 ± 1 abcde
LargeGreenland 84.6 ± 2.4 bcd 0.27 ± 0.02 bc 9850 ± 260 bcde 86.8 ± 2.3 bcde 83 ± 2 bcdeGreenstar 83.7 ± 2.3 bcd 0.20 ± 0.01 fg 9710 ± 216 cde 85.6 ± 1.9 cde 82 ± 2 cdeImpower 86.5 ± 2.6 abcd 0.26 ± 0.01 bc 10079 ± 174 abcde 88.9 ± 1.5 abcde 85 ± 1 abcdeImprove 86.3 ± 1.4 abcd 0.21 ± 0.01 efg 10037 ± 28 abcde 88.5 ± 0.2 abcde 84 ± 0 abcde
Data are expressed as the mean ± SD, n = 4. Values followed by a different letter in the same column are significantly different (ANOVA followed by Tukey’s test (p < 0.05)); all lentilvarieties showed significant difference to control (white bread) by (ANOVA followed by Dunnett test (p < 0.05)). Abbreviations: C∞, equilibrium percentage of starch hydrolyzed after 120min; k, kinetic constant; SHAUC, area under the curve; HI, hydrolysis index; eGI, estimated glycemic index.
Foods 2020, 9, 175 10 of 16
3.5. Pearson Correlation Between Chemical Components and Nutritional Properties
Pearson correlation coefficients between chemical components and nutritional properties of thecooked lentils are presented in Table 5. RDS was negatively correlated with energy (p = 0.023) andprotein (p = 0.007) and was positively correlated with carbohydrate (p = 0.013) and stachyose (p =
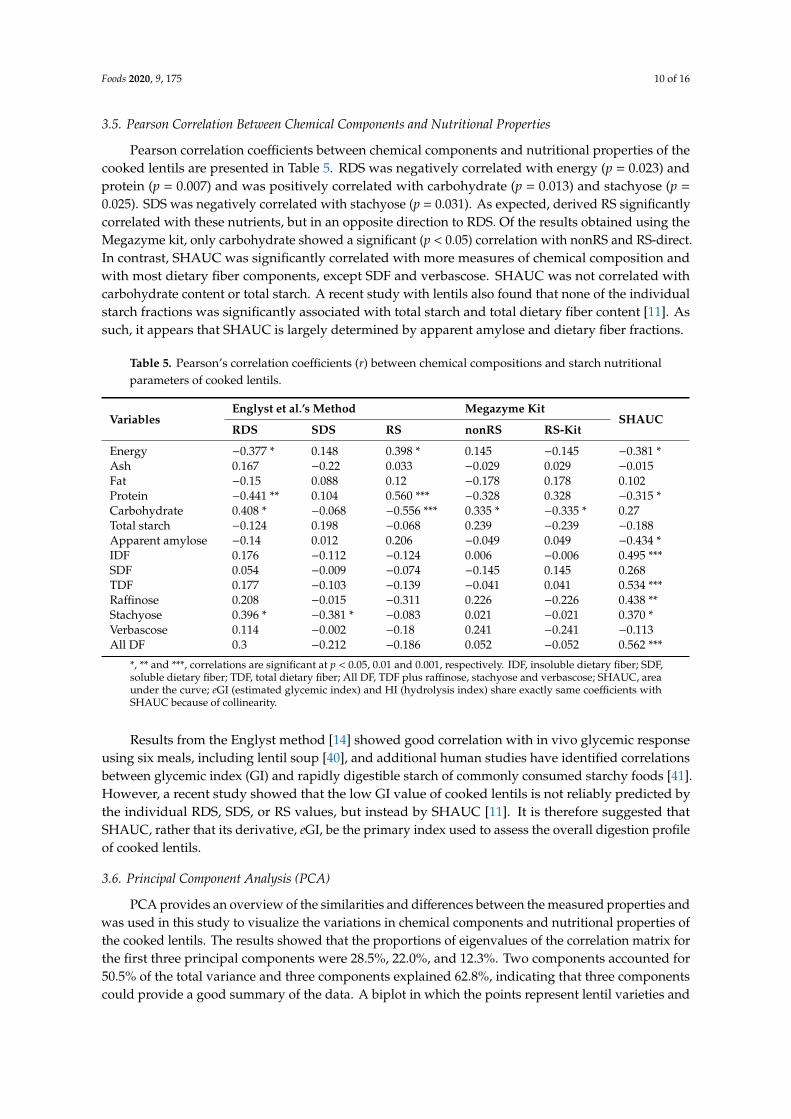
0.025). SDS was negatively correlated with stachyose (p = 0.031). As expected, derived RS significantlycorrelated with these nutrients, but in an opposite direction to RDS. Of the results obtained using theMegazyme kit, only carbohydrate showed a significant (p < 0.05) correlation with nonRS and RS-direct.In contrast, SHAUC was significantly correlated with more measures of chemical composition andwith most dietary fiber components, except SDF and verbascose. SHAUC was not correlated withcarbohydrate content or total starch. A recent study with lentils also found that none of the individualstarch fractions was significantly associated with total starch and total dietary fiber content [11]. Assuch, it appears that SHAUC is largely determined by apparent amylose and dietary fiber fractions.
Table 5. Pearson’s correlation coefficients (r) between chemical compositions and starch nutritionalparameters of cooked lentils.
VariablesEnglyst et al.’s Method Megazyme Kit
SHAUCRDS SDS RS nonRS RS-Kit
Energy −0.377 * 0.148 0.398 * 0.145 −0.145 −0.381 *Ash 0.167 −0.22 0.033 −0.029 0.029 −0.015Fat −0.15 0.088 0.12 −0.178 0.178 0.102Protein −0.441 ** 0.104 0.560 *** −0.328 0.328 −0.315 *Carbohydrate 0.408 * −0.068 −0.556 *** 0.335 * −0.335 * 0.27Total starch −0.124 0.198 −0.068 0.239 −0.239 −0.188Apparent amylose −0.14 0.012 0.206 −0.049 0.049 −0.434 *IDF 0.176 −0.112 −0.124 0.006 −0.006 0.495 ***SDF 0.054 −0.009 −0.074 −0.145 0.145 0.268TDF 0.177 −0.103 −0.139 −0.041 0.041 0.534 ***Raffinose 0.208 −0.015 −0.311 0.226 −0.226 0.438 **Stachyose 0.396 * −0.381 * −0.083 0.021 −0.021 0.370 *Verbascose 0.114 −0.002 −0.18 0.241 −0.241 −0.113All DF 0.3 −0.212 −0.186 0.052 −0.052 0.562 ***
*, ** and ***, correlations are significant at p < 0.05, 0.01 and 0.001, respectively. IDF, insoluble dietary fiber; SDF,soluble dietary fiber; TDF, total dietary fiber; All DF, TDF plus raffinose, stachyose and verbascose; SHAUC, areaunder the curve; eGI (estimated glycemic index) and HI (hydrolysis index) share exactly same coefficients withSHAUC because of collinearity.
Results from the Englyst method [14] showed good correlation with in vivo glycemic responseusing six meals, including lentil soup [40], and additional human studies have identified correlationsbetween glycemic index (GI) and rapidly digestible starch of commonly consumed starchy foods [41].However, a recent study showed that the low GI value of cooked lentils is not reliably predicted bythe individual RDS, SDS, or RS values, but instead by SHAUC [11]. It is therefore suggested thatSHAUC, rather that its derivative, eGI, be the primary index used to assess the overall digestion profileof cooked lentils.
3.6. Principal Component Analysis (PCA)
PCA provides an overview of the similarities and differences between the measured properties andwas used in this study to visualize the variations in chemical components and nutritional properties ofthe cooked lentils. The results showed that the proportions of eigenvalues of the correlation matrix forthe first three principal components were 28.5%, 22.0%, and 12.3%. Two components accounted for50.5% of the total variance and three components explained 62.8%, indicating that three componentscould provide a good summary of the data. A biplot in which the points represent lentil varieties and
Foods 2020, 9, 175 11 of 16
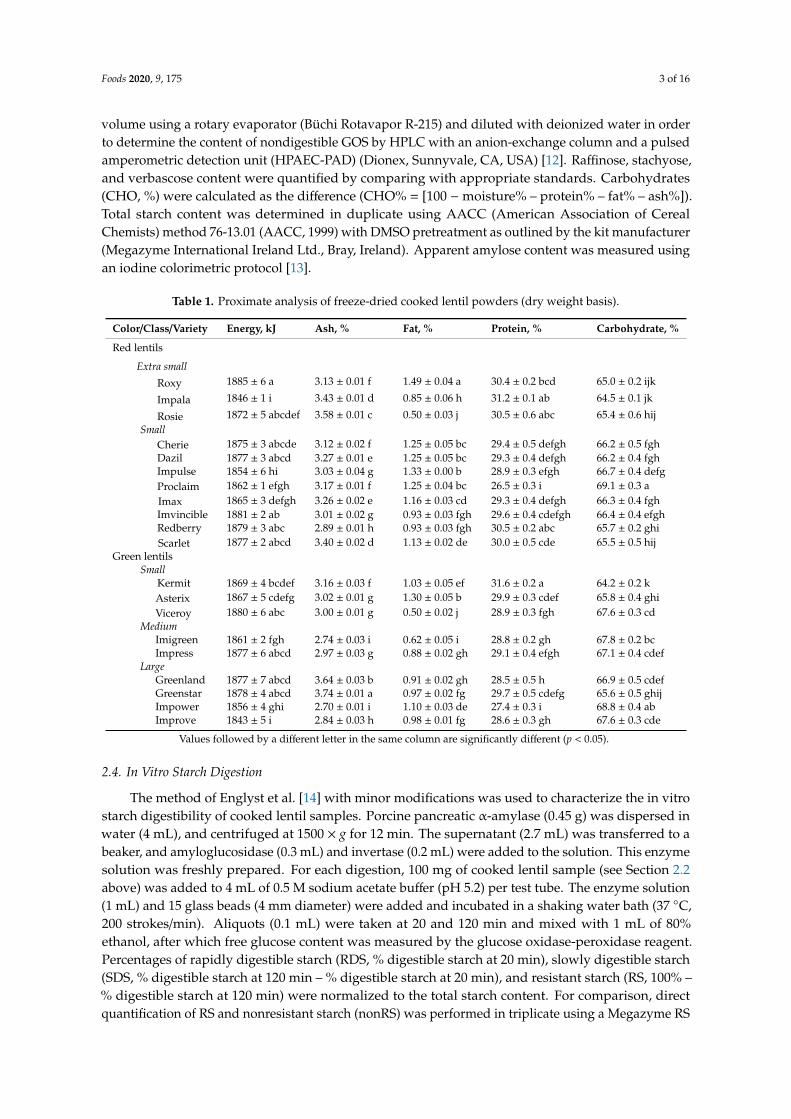
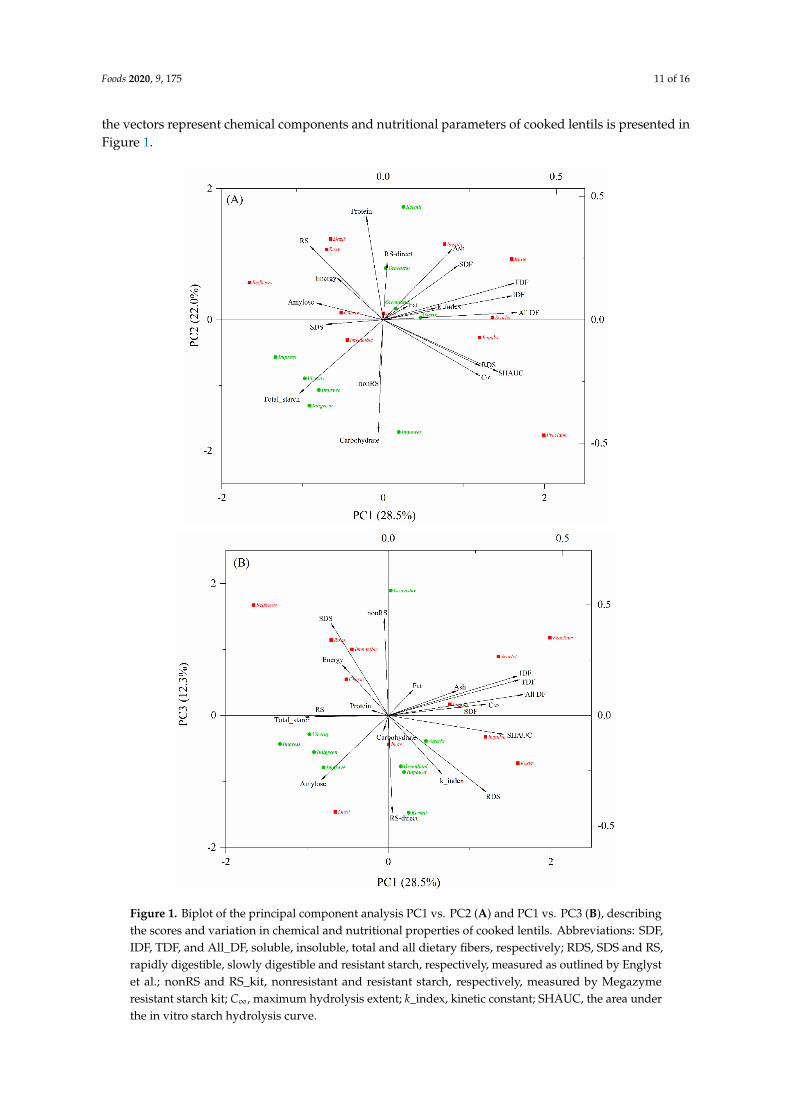
the vectors represent chemical components and nutritional parameters of cooked lentils is presented inFigure 1.Foods 2020, 9, 175 10 of 15
Figure 1. Biplot of the principal component analysis PC1 vs. PC2 (A) and PC1 vs. PC3 (B), describing the scores and variation in chemical and nutritional properties of cooked lentils. Abbreviations: SDF, IDF, TDF, and All_DF, soluble, insoluble, total and all dietary fibers, respectively; RDS, SDS and RS, rapidly digestible, slowly digestible and resistant starch, respectively, measured as outlined by Englyst et al.; nonRS and RS_kit, nonresistant and resistant starch, respectively, measured by Megazyme resistant starch kit; C∞, maximum hydrolysis extent; k_index, kinetic constant; SHAUC, the area under the in vitro starch hydrolysis curve.
Figure 1. Biplot of the principal component analysis PC1 vs. PC2 (A) and PC1 vs. PC3 (B), describingthe scores and variation in chemical and nutritional properties of cooked lentils. Abbreviations: SDF,IDF, TDF, and All_DF, soluble, insoluble, total and all dietary fibers, respectively; RDS, SDS and RS,rapidly digestible, slowly digestible and resistant starch, respectively, measured as outlined by Englystet al.; nonRS and RS_kit, nonresistant and resistant starch, respectively, measured by Megazymeresistant starch kit; C∞, maximum hydrolysis extent; k_index, kinetic constant; SHAUC, the area underthe in vitro starch hydrolysis curve.

Foods 2020, 9, 175 12 of 16
The directions of the vectors indicate that PC1 explains starch digestion fractions determinedby the Englyst method, dietary fibers, and SHAUC; PC2 distinguishes chemical compositions (e.g.,carbohydrate, total starch, and protein, excluding dietary fibers) (Figure 1A); and PC3 appears torepresent nonRS and RS-direct contents measured by Megazyme kit, showing almost no relation toSHAUC (Figure 1B). The pair of variables describing SHAUC, RDS and C∞, were highly correlatedand also highly negatively correlated to RS, suggesting that RDS and RS determined by the indirectmethod [14] are good indicators of SHAUC and are derived within a similar timeframe (i.e., 120 minof digestion), rather than by 16 h of hydrolysis by using a Megazyme kit. Correspondingly, RS wasgrouped with energy, protein, and amylose, showing close correlations among them and a negativecorrelation with SHAUC. As expected, all dietary fiber parameters were highly correlated with eachother and weakly correlated with RDS and RS (Figure 1), which is consistent with a previous study [11].
Lentil varieties that are clustered together in the biplot are those that have similar profiles ofchemical and nutritional properties. Green lentils are mostly located in the middle to left panel of PC1,unique in lower dietary fiber content, while red lentils are located in the middle to upper panel of PC2(except Proclaim), showing lower carbohydrate and total starch (Figure 1A). Within red-type lentils,Roxy, Dazil, and Redberry were closely grouped for their high amount of RS (Figure 1A, Table 3).Cherie and Imvincible are relatively far apart from them, being not only high in RS but also rich inSDS. Rosie, Scarlet, and Impulse were close together and characterized by high dietary fiber content.Proclaim is unique for its extremely high starch digestibility. Within the green-type lentils, Greenstarand Kermit showed similar properties to Dazil and Roxy. Greenland and Asterix are located nearthe center of biplot, which is indicative of intermediate characteristics. Impress, Viceroy, Improve,Imigreen, and Impower are far apart from other green lentil samples, owing to their specific profiles oftotal starch and carbohydrate.
In other studies, Asterix has been reported to be of low GI [11]. Asterix and Greenland have beenreported unique for their high SDS content [5], owing to their high phenolic content and α-glucosidaseinhibitory activity [32]. Although Asterix and Greenland did not stand out from the current sample setof 20 cooked lentils in PCA biplot (Figure 1), their RS content measured by Megazyme kit (RS-direct)was the second highest among the nine green lentils and was higher than 6 out of 11 red lentils (Table 3).
Pearson correlation and PCA were informative and showed that RDS, RS, and SHAUC arereliable indicators to differentiate the chemical compositions and nutritional properties of these twentylentils. However, the biplot did not show clear separations of lentil varieties corresponding to starchdigestibility and/or SHAUC. Therefore, cluster analysis was conducted to group these twenty lentils,specifically focusing on RS and SHAUC.
3.7. Cluster Analysis (CA)
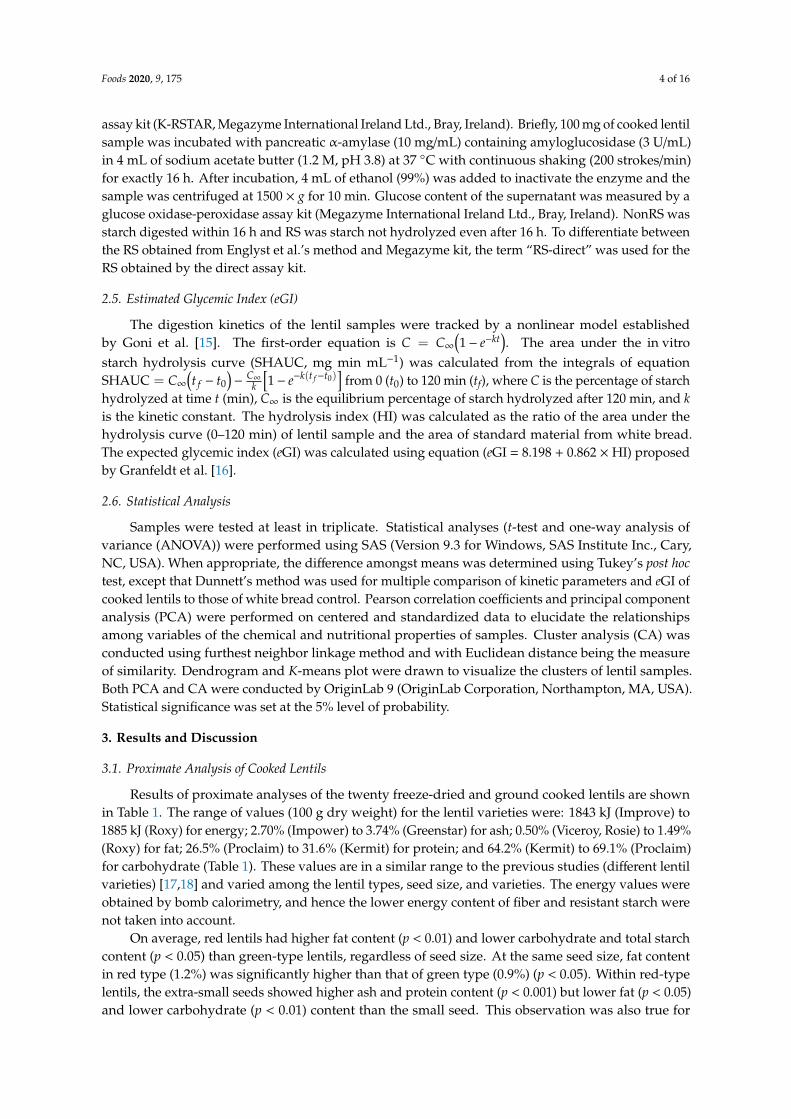
A dendrogram from hierarchical cluster analysis and K-means plot corresponding to the RScontent and SHAUC values of these twenty cooked lentils are shown in Figure 2A,B. The resultssuggest that twenty lentils could be divided into four groups based on the visual segmentation inFigure 2B, mainly by SHAUC:
Group 1, low SHAUC (<9825 mg min mL−1), high RS (10–17%); includes Dazil, Redberry,Imvincible, Greenstar, Cherie, Roxy, and Viceroy;
Group 2, intermediate SHAUC (9825–10,200 mg min mL−1), intermediate RS (9–13%); includesGreenland, Kermit, Impala, Impress, Imax, Improve, Imigreen, and Impower;
Group 3, high SHAUC (10,200–10,400 mg min mL−1), intermediate RS (9–13%); includes Rosie,Asterix, Scarlet, and Impulse; unique in overall higher dietary fiber content;
Group 4, the highest SHAUC (>10,400 mg min mL−1) and low RS (<9%); the variety is Proclaim.Comparing the variety linkage in Figure 2A with variety grouping in Figure 2B, it was found that
the variety linkage and grouping were clearly based more on SHAUC values than RS content. Thereasons could be: (1) that there was a larger magnitude of SHAUC values than that of RS; and (2) thata combination of RDS and RS was more predictive than any individual starch digestible fraction [11].

Foods 2020, 9, 175 13 of 16
Nonetheless, SHAUC was highly correlated to most chemical compositions (Table 5), successfullyclustered the samples (Figure 2), and thus appears to be a primary indicator of nutritional properties ofthe cooked lentils.
Foods 2020, 9, 175 12 of 15
[11]. Nonetheless, SHAUC was highly correlated to most chemical compositions (Table 5), successfully clustered the samples (Figure 2), and thus appears to be a primary indicator of nutritional properties of the cooked lentils.
Figure 2. Cluster analysis of the 20 lentil varieties and four plotted groups corresponding to the area under the in vitro starch hydrolysis curve (SHAUC) and RS value. (A) Dendrogram by Hierarchical cluster analysis; (B) K-means plot corresponding to the SHAUC and RS values. Symbols in Figure 2B, ■, cluster 1; ●, cluster 2; ▲, cluster 3; and ♦, cluster 4. Green lentil names were underlined.
Figure 2. Cluster analysis of the 20 lentil varieties and four plotted groups corresponding to the areaunder the in vitro starch hydrolysis curve (SHAUC) and RS value. (A) Dendrogram by Hierarchicalcluster analysis; (B) K-means plot corresponding to the SHAUC and RS values. Symbols in Figure 2B,�, cluster 1; •, cluster 2; N, cluster 3; and �, cluster 4. Green lentil names were underlined.
Foods 2020, 9, 175 14 of 16
4. Conclusions
The proximate composition, dietary fiber fractions, and starch nutritional properties weresignificantly different among the twenty cooked lentil varieties. The differences were more variety-than type-dependent. Generally, cooked red lentils tend to have lower GI values than green lentils.However, Proclaim was unique for its lowest RS while having the highest eGI. In contrast, Greenstar,which is a green-type lentil, had relatively higher RS, but a lower eGI, than most of the other lentils (p< 0.05). Regardless of lentil type, smaller seed size seems to be associated with higher RS content incooked lentils. Dietary fiber fractions appeared to have little correlation with starch digestible fractionsbut were highly correlated with SHAUC. Based on SHAUC and RS content, twenty lentil varietiescould be classified into four groups by PCA and CA. The consistency between PCA and CA indicatedthat multivariate analyses were feasible in the study of lentil characteristics and useful for selecting theappropriate variety for final use suitability.
Supplementary Materials: The following is available online at http://www.mdpi.com/2304-8158/9/2/175/s1,Figure S1: Hydrolysis curves of cooked lentils.
Author Contributions: D.D.R. conceived and designed the experiments; P.L.M., J.W., Y.B., A.H., Z.-H.L. performedthe experiments; D.D.R., P.L.M., A.H. and Z.-H.L. analyzed the data; P.L.M. wrote the first draft and all authors(D.D.R., Z.-H.L., P.L.M., J.W., Y.B. and A.H.) contributed to writing the final paper. All authors have read andagreed to the published version of the manuscript.
Funding: The study was funded by Agriculture and Agri-Food Canada and Pulse Canada under theAgri-Innovation Program Pulse Science Cluster (AIP CL-03; J-000561).
Acknowledgments: We thank Danusha Kalinga, Renuka Waduge and Jaime Matthews for theirtechnical assistance.
Conflicts of Interest: The authors declare no conflict of interest.
References
1. Diabetes Canada Clinical Practice Guidelines Expert Committee; Sievenpiper, J.L.; Chan, C.B.; Dworatzek, P.D.;Freeze, C.; Williams, S.L. 2018 Clinical practice guidelines—Nutrition therapy. Can. J. Diabetes 2018,42, S64–S79.
2. Yadav, S.S.; Stevenson, P.C.; Rizvi, A.H.; Manohar, M.; Gailing, S.; Mateljan, G. Uses and Consumption. InLentil: An Ancient Crop for Modern Times; Yadav, S.S., McNeil, D., Stevenson, P.C., Eds.; Springer: Dordrecht,The Netherlands, 2007; p. 37.
3. Bhatty, R.S. Composition and quality of lentil (Lens culinaris medik): A review. Can. Inst. Food Sci. Technol. J.1988, 21, 144–160. [CrossRef]
4. Canadian Lentils. Global Uses. Available online: http://www.lentils.org/about-lentils/global-uses/(accessed on 8 August 2019).
5. Lu, Z.H.; Donner, E.; Tsao, R.; Ramdath, D.D.; Liu, Q. Physicochemical and digestion characteristics of flourand starch from eight Canadian red and green lentils. Int. J. Food Sci. Tech. 2018, 53, 735–746. [CrossRef]
6. Englyst, H.N.; Cummings, J.H. Digestion of polysaccharides of potato in the small intestine of man. Am. J.Clin. Nutr. 1987, 45, 423–431. [CrossRef] [PubMed]
7. Zhang, G.; Hamaker, B.R. Slowly digestible starch: Concept, mechanism, and proposed extended glycemicindex. Crit. Rev. Food Sci. Nutr. 2009, 49, 852–867. [CrossRef]
8. Topping, D.L.; Clifton, P.M. Short-chain fatty acids and human colonic function: Roles of resistant starch andnonstarch polysaccharides. Physiol. Rev. 2001, 81, 1031–1064. [CrossRef]
9. Fuentes-Zaragoza, E.; Riquelme-Navarrete, M.J.; Sanchez-Zapata, E.; Perez-Alvarez, J.A. Resistant starch asfunctional ingredient: A review. Food Res. Int. 2010, 43, 931–942. [CrossRef]
10. Venn, B.J.; Green, T.J. Glycemic index and glycemic load: Measurement issues and their effect on diet-diseaserelationships. Eur. J. Clin. Nutr. 2007, 61, S122–S131. [CrossRef]
11. Ramdath, D.D.; Liu, Q.; Donner, E.; Hawke, A.; Kalinga, D.; Winberg, J.; Wolever, T.M.S. Investigating therelationship between lentil carbohydrate fractions and in vivo postprandial blood glucose response by use ofthe natural variation in starch fractions among 20 lentil varieties. Food Funct. 2017, 8, 3783–3791. [CrossRef]
Foods 2020, 9, 175 15 of 16
12. Brummer, Y.; Kaviani, M.; Tosh, S.M. Structural and functional characteristics of dietary fibre in beans, lentils,peas and chickpeas. Food Res. Int. 2015, 67, 117–125. [CrossRef]
13. Williams, P.C.; Kuzina, F.D.; Hlynka, I. A rapid colorimetric procedure for estimating amylose content ofstarches and flours. Cereal Chem. 1970, 47, 411–420.
14. Englyst, H.N.; Kingman, S.M.; Cummings, J.H. Classification and measurement of nutritionally importantstarch fractions. Eur. J. Clin. Nutr. 1992, 46 (Suppl. S2), S33–S50. [PubMed]
15. Goni, I.; Garcia-Alonso, A.; Saura-Calixto, F. A starch hydrolysis procedure to estimate glycemic index. Nutr.Res. 1997, 17, 427–437. [CrossRef]
16. Granfeldt, Y.; Bjorck, I.; Drews, A.; Tovar, J. An in vitro procedure based on chewing to predict metabolicresponse to starch in cereal and legume products. Eur. J. Clin. Nutr. 1992, 46, 649–660. [CrossRef] [PubMed]
17. Costa, G.E.D.A.; Queiroz-Monici, K.D.S.; Reis, S.M.P.M.; Oliveira, A.C.D. Chemical composition, dietary fibreand resistant starch contents of raw and cooked pea, common bean, chickpea and lentil legumes. Food Chem.2006, 94, 327–330. [CrossRef]
18. Wang, N.; Hatcher, D.; Toews, R.; Gawalko, E. Influence of cooking and dehulling on nutritional compositionof several varieties of lentils (Lens culinaris). LWT Food Sci. Technol. 2009, 42, 842–848. [CrossRef]
19. Li, B.W.; Andrews, K.W.; Pehrsson, P.R. Individual sugars, soluble, and insoluble dietary fiber contents of 70high consumption foods. J. Food Compos. Anal. 2002, 15, 715–723. [CrossRef]
20. Tosh, S.M.; Yada, S. Dietary fibres in pulse seeds and fractions: Characterization, functional attributes, andapplications. Food Res. Int. 2010, 43, 450–460. [CrossRef]
21. Wang, N.; Daun, J.K. Effects of variety and crude protein content on nutrients and anti-nutrients in lentils(Lens culinaris). Food Chem. 2006, 95, 493–502. [CrossRef]
22. Jain, A.; Rao, S.M.; Sethi, S.; Ramesh, A.; Tiwari, S.; Mandal, S.K.; Singh, N.; Modi, N.; Bansal, V.;Kalaichelvani, C. Effect of cooking on amylose content of rice. Eur. J. Exp. Biol. 2012, 2, 385–388.
23. Piecyk, M.; Wolosiak, R.; Druzynska, B.; Worobiej, E. Chemical composition and starch digestibility in floursfrom Polish processed legume seeds. Food Chem. 2012, 135, 1057–1064. [CrossRef]
24. Sandhu, K.S.; Lim, S.-T. Digestibility of legume starches as influenced by their physical and structuralproperties. Carbohydr. Polym. 2008, 71, 245–252. [CrossRef]
25. Garcia-Alonso, A.; Goni, I.; Saura-Calixto, F. Resistant starch and potential glycaemic index of raw andcooked legumes (lentils, chickpeas and beans). Zeitschrift fur Lebensmitteluntersuchung und Forschung A 1998,206, 284–287. [CrossRef]
26. Perera, A.; Meda, V.; Tyler, R.T. Resistant starch: A review of analytical protocols for determining resistantstarch and of factors affecting the resistant starch content of foods. Food Res. Int. 2010, 43, 1959–1974.[CrossRef]
27. Goni, I.; GarciaDiz, L.; Manas, E.; SauraCalixto, F. Analysis of resistant starch: A method for foods and foodproducts. Food Chem. 1996, 56, 445–449. [CrossRef]
28. McCleary, B.V.; Monaghan, D.A. Measurement of resistant starch. J. AOAC Int. 2002, 85, 665–675. [CrossRef]29. Annor, G.A.; Marcone, M.; Bertoft, E.; Seetharaman, K. In vitro starch digestibility and expected glycemic
index of Kodo millet (paspalum scrobiculatum) as affected by starch-protein-lipid interactions. Cereal Chem.2013, 90, 211–217. [CrossRef]
30. Dupuis, J.H.; Liu, Q.; Yada, R.Y. Methodologies for increasing the resistant starch content of food starches:A review. Compr. Rev. Food Sci. Food Saf. 2014, 13, 1219–1234. [CrossRef]
31. Barros, F.; Awika, J.M.; Rooney, L.W. Interaction of tannins and other sorghum phenolic compounds withstarch and effects on in vitro starch digestibility. J. Agric. Food Chem. 2012, 60, 11609–11617. [CrossRef]
32. Zhang, B.; Deng, Z.; Ramdath, D.D.; Tang, Y.; Chen, P.X.; Liu, R.; Liu, Q.; Tsao, R. Phenolic profilesof 20 Canadian lentil cultivars and their contribution to antioxidant activity and inhibitory effects onalpha-glucosidase and pancreatic lipase. Food Chem. 2015, 172, 862–872. [CrossRef]
33. Wong, S.; Traianedes, K.; Odea, K. Factors affecting the rate of hydrolysis of starch in legumes. Am. J. Clin.Nutr. 1985, 42, 38–43. [CrossRef] [PubMed]
34. Zhou, Y.; Hoover, R.; Liu, Q. Relationship between alpha-amylase degradation and the structure andphysicochemical properties of legume starches. Carbohydr. Polym. 2004, 57, 299–317. [CrossRef]
35. Faulks, R.M.; Bailey, A.L. Digestion of cooked starches from different food sources by porcine alpha-amylase.Food Chem. 1990, 36, 191–203. [CrossRef]
Foods 2020, 9, 175 16 of 16
36. Foster-Powell, K.; Holt, S.H.; Brand-Miller, J.C. International table of glycemic index and glycemic loadvalues: 2002. Am. J. Clin. Nutr. 2002, 76, 5–56. [CrossRef] [PubMed]
37. Germaine, K.A.; Samman, S.; Fryirs, C.G.; Griffiths, P.J.; Johnson, S.K.; Quail, K.J. Comparison of in vitrostarch digestibility methods for predicting the glycaemic index of grain foods. J. Sci. Food Agric. 2008,88, 652–658. [CrossRef]
38. Al-Rabadi, G.J.S.; Gilbert, R.G.; Gidley, M.J. Effect of particle size on kinetics of starch digestion in milledbarley and sorghum grains by porcine alpha-amylase. J. Cereal Sci. 2009, 50, 198–204. [CrossRef]
39. Blasel, H.M.; Hoffman, P.C.; Shaver, R.D. Degree of starch access: An enzymatic method to determine starchdegradation potential of corn grain and corn silage. Anim. Feed Sci. Technol. 2006, 128, 96–107. [CrossRef]
40. Araya, H.; Contreras, P.; Alvina, M.; Vera, G.; Pak, N. A comparison between an in vitro method to determinecarbohydrate digestion rate and the glycemic response in young men. Eur. J. Clin. Nutr. 2002, 56, 735–739.[CrossRef]
41. Englyst, H.N.; Veenstra, J.; Hudson, G.J. Measurement of rapidly available glucose (RAG) in plant foods:A potential in vitro predictor of the glycaemic response. Br. J. Nutr. 1996, 75, 327–337. [CrossRef]
© 2020 by the authors. Licensee MDPI, Basel, Switzerland. This article is an open accessarticle distributed under the terms and conditions of the Creative Commons Attribution(CC BY) license (http://creativecommons.org/licenses/by/4.0/).
Copyright © 2022 FDOKUMEN