impacts of a nutritional water - ShareOK
121
IMPACTS OF A NUTRITIONAL WATER SUPPLEMENT AND THREONINE TO LYSINE RATIOS ON GROWTH PERFORMANCE OF NURSERY PIGS By AFTON SAWYER Bachelor of Science in Animal Science Oklahoma State University Stillwater, Oklahoma 2016 Submitted to the Faculty of the Graduate College of the Oklahoma State University in partial fulfillment of the requirements for the Degree of MASTER OF SCIENCE July, 2019
-
Upload
khangminh22 -
Category
Documents
-
view
1 -
download
0
Transcript of impacts of a nutritional water - ShareOK
IMPACTS OF A NUTRITIONAL WATER
SUPPLEMENT AND THREONINE TO LYSINE
RATIOS ON GROWTH PERFORMANCE OF
NURSERY PIGS
By
AFTON SAWYER
Bachelor of Science in Animal Science
Oklahoma State University
Stillwater, Oklahoma
2016
Submitted to the Faculty of the Graduate College of the
Oklahoma State University in partial fulfillment of
the requirements for the Degree of
MASTER OF SCIENCE July, 2019

ii
IMPACTS OF A NUTRITIONAL WATER
SUPPLEMENT AND THREONINE TO LYSINE
RATIOS ON GROWTH PERFORMANCE OF
NURSERY PIGS
Thesis Approved:
Dr. Scott Carter
Thesis Adviser
Dr. Adel Pezeshki
Dr. Ranjith Ramanathan

iii
Name: AFTON SAWYER Date of Degree: JULY, 2019 Title of Study: IMPACTS OF A NUTRITIONAL WATER SUPPLEMENT AND
THREONINE TO LYSINE RATIOS ON GROWTH PERFORMANCE OF NURSERY PIGS
Major Field: ANIMAL SCIENCE Abstract: Four experiments were conducted to evaluate the effects of a nutritional water supplement and threonine to lysine ratios on growth performance of nursery pigs. Two experiments were conducted to understand the effects of a nutritional water supplement on growth performance in pigs which contains a blend of organic acids, probiotics, flavorings, and yeast. The first experiment used 140 pigs and treatment levels of the supplement were 0 and 62.5 ml/L water in a stock solution provided on d 0 – 3 through the water post-weaning. The piglets were fed vegetarian diets containing no lactose or plasma. Supplementation tended to increase ADG and ADFI from d 21 – 42. Growth performance and BW tended to improve overall with numerical differences in ADG and ADFI. In the second experiment, 260 piglets were fed a complex nursery diet, but were provided four levels of the nutritional water supplement used in experiment 1. These treatments were titrated within the water for 0 – 7 d post-weaning and consisted of 0, 31.7, 63.4, and 95.1 ml WB/L of water in a stock solution. Supplementation significantly improved ADWI for d 0 – 21, 21 – 42, and for the overall period. There were no differences in ADG. Feed intake decreased for d 21 – 42, and tended to decrease overall. Feed conversion improved for d 21 – 42, and overall. In addition to a nutritional water supplement, two experiments were conducted to determine the effects of threonine to lysine ratios on growth performance of nursery piglets. With increasing threonine to lysine ratios, there was a tendency to quadratically improvement final BW, and numerical improvements for the other phases. Additionally, there was a tendency to improve ADG and ADFI during the first 21 d post-weaning. Average daily gain tended to improve between d 21- 42, and for the overall period (d 0 – 42). Feed intake tended to decrease during d 0 – 21, but significantly increased for d 21 – 42. There were numerical improvements in G:F. Therefore, supplementation of a nutritional water supplement can improve ADWI and G:F. Additionally, increasing threonine in the diet can promote increases in growth performance.
iv
TABLE OF CONTENTS
Chapter Page I. REVIEW OF LITERATURE .....................................................................................1 Introduction ..............................................................................................................1 Post-Weaning Changes ............................................................................................2 Stressors and Effects on Intake ..........................................................................2 Changes in the Stomach .....................................................................................4 Changes in the Intestine .....................................................................................4 Antibiotics ................................................................................................................6 Veterinary Feed Directive ..................................................................................6 Non-Antibiotic Feed Additives ................................................................................7 Direct Fed Microbials (DFM) or Probiotics ......................................................8 Yeast or Derivatives of Yeast ..........................................................................14 Organic Acids ..................................................................................................17 Plant Extracts or Essential Oils ........................................................................20 Amino Acids ..........................................................................................................23 Threonine .........................................................................................................24 Growth Performance .................................................................................26 Immunological and Intestinal Properties ...................................................29 Requirements .............................................................................................31 Dietary Modulations ..............................................................................................32 Diets Containing Animal Protein .....................................................................32 Animal Protein-Free Diets ...............................................................................34 Lactose .............................................................................................................35 Conclusion .............................................................................................................36 Antibiotic Alternatives Table .................................................................................38 II. EVALUATION OF A NUTRITIONAL WATER SUPPLEMENT ON GROWTH
PERFORMANCE OF NURSERY PIGS...............................................................39 Abstract ..................................................................................................................39 Introduction ............................................................................................................40 Materials and Methods ...........................................................................................42 Results ....................................................................................................................44
v
Chapter Page Discussion ..............................................................................................................45 Conclusion .............................................................................................................47 III. EVALUATION OF VARYING LEVELS OF A NUTRITIONAL WATER
SUPPLEMENT ON GROWTH PERFORMANCE OF NURSERY PIGS ..........50 Abstract ..................................................................................................................50 Introduction ............................................................................................................51 Materials and Methods ...........................................................................................53 Results ....................................................................................................................56 Discussion ..............................................................................................................57 Conclusion .............................................................................................................60 IV. EFFECTS OF THREONINE TO LYSINE RATIOS ON GROWTH
PERFORMANCE OF NURSERY PIGS...............................................................65 Abstract ..................................................................................................................65 Introduction ............................................................................................................66 Materials and Methods ...........................................................................................68 Results ....................................................................................................................70 Discussion ..............................................................................................................71 Conclusion .............................................................................................................73 V. SUMMARY ............................................................................................................81 REFERENCES ............................................................................................................85 APPENDICES .............................................................................................................99

vi
LIST OF TABLES
Table Page 1.1 Antibiotic Alternatives ...........................................................................................38 2.1 Water Boost Supplementation on Growth Performance of Nursery Pigs ..............49 3.1 Ingredient Composition of Nursery Diets ..............................................................62 3.2 Analyzed Composition of Nursery Diets ...............................................................63 3.3 Water Boost Supplementation on Growth Performance and Water Intake of Nursery Pigs ...............................................................................................................................64 4.1 Ingredient Composition of Nursery Diets ..............................................................74 4.2 Nutrient Composition of the Nursery Diets in Experiment 2 ................................75 4.3 Analyzed Amino Acid Content of the Nursery Diets for Treatment 60 in Experiment 2 ...................................................................................................................................77 4.4 Analyzed Amino Acid Content of the Nursery Diets for Treatment 62.5 in Experiment 2 ................................................................................................................78 4.5 Analyzed Amino Acid Content of the Nursery Diets for Treatment 65 in Experiment 2....................................................................................................................................79 4.6 Threonine to Lysine Ratios on Growth Performance of Nursery Pigs ..................80
1
CHAPTER I
REVIEW OF LITERATURE
Introduction
Pork is one of the most consistently consumed animal proteins in the world and
the fast generation interval combined with efficient genetic lines and current rearing
practices in environmentally controlled housing make it a relatively consistent, safe, and
affordable product. Nutrition undoubtedly plays a major role within current commercial
strategies and this is due to the cost of inputs in feed ingredients because of the varying
availability of ingredients and allowance of dietary additions.
Currently, on average feeding pigs can be considerably high and approximately
2/3 of the total cost of rearing commercial market hogs is feed alone (Lammers et al.,
2008). Because of this fact, nutritionists are constantly trying to find new ways to
improve growth and performance in synchrony with genetic improvements and
husbandry tactics. One of these tools was the use of antibiotic growth promotors (AGP)
in the feed, but laws enacted within the European Union (EU) have banned their use in
livestock diets and the same practice was adopted in the United States. The weaning
period is a critical period where pigs encounter a myriad of stressors and this was
mitigated by the use of now banned feed-grade antibiotics.
2
In regards to the ban of AGPs, the next step was to look at other possible additions which
may help to deafen the blow of the post-weaning lag period.
One area is the addition of probiotics. This area in particular of nutritional
additives has been gaining popularity in the human nutrition side as their mode of action
and benefits are conferred to consumers both in the form of information and marketing.
In addition to probiotics, organic acids, fermentation extracts, and natural flavorings have
also been looked at in hopes of providing benefits to a host. These can be delivered with
feed as the medium, but there are instances of these products which are to be delivered
within the water to make consumption by the animal easier. Some have even gone as far
as to combine these ingredients in a single solution in order to condense them into a user-
friendly product.
Moreover, another area in the nutrition industry which has been extensively
studied is the addition of amino acids beyond the requirement. This is a relatively easy
manipulation because they are already required in diet to meet the needs of the animals.
However there is some skepticism regarding excess amino acids due to waste excretion
and the cost. Overall, there are a large amount of products and techniques used within the
industry to reduce the instance of post-weaning morbidity, mortality, and improve health
and growth performance of animals in place of AGPs.
1. Post-Weaning Changes
1.1 Stressors and effects on intake
One major time period where growth performance or health can be depressed is
the post-weaning period, and it has been researched for years as being one of the most
3
stressful singular events in the production cycle of a commercial pig. The weaning event
in itself can occur in as little as 14 days after birth but can also be extended to 3-5 weeks
depending on the specific farm’s standard operating procedures (SOPs) and their goals
regarding yearly sow productivity. This process of early weaning is in sharp contrast
compared to the natural separation from the mother. In domestic, free-range pigs full
ceasing of suckling occurred at a greater age and may last anywhere from 10 to 12 weeks
(Jensen and Recén, 1989; Lallès et al., 2007).
Upon the abrupt separation from the sow, piglets experience a large amount of
stressors. These stressors include social stress from mixing of pens and interacting with
new pen mates, establishing hierarchies, experiencing a new environment, transportation
to a new facility, removal from the dam, digestive upset from changes in the physiology
of the small intestine, and dietary changes in moving from a to a solid diet. All of these
factors in combination can contribute to severe diarrhea, post-weaning depression,
reduced voluntary feed intake, morbidity, mortality, and overall poor growth
performance. Le Dividich and Séve (2000) reported regardless of the age at weaning, the
metabolizable energy (ME) intake by the piglet is only at about 60-70% of the ME intake
before weaning. This means pigs are energy deficient in the time following weaning no
matter the age of the piglet at weaning. Additionally, the ME required for maintenance
does not reach a steady intake until after about two weeks after the initial weaning and
mixing (Le Dividich and Séve, 2000). This marked reduction in energy intake
exacerbates the stressors effects on the gastrointestinal system and this particular phase in
production was termed as the post-weaning growth check (Pluske et al., 1997; Le
Dividich and Séve, 2000).
4
1.2 Changes in the stomach
The stomach is one of the first main sites of digestion and is important in the total
gastrointestinal tract (GIT) motility and barrier function due to its inherent properties in
hormone and acid secretion (Lallès et al., 2007). While the changes occurring in the
stomach aren’t as severe and not as well documented as the small intestine, there are
some functional and environmental changes occurring at weaning. Weaning decreases
gastric motility and a reduction in the stomach emptying rate post-weaning occurs
compared to piglets still suckling (Snoeck et al., 2004). Lallès et al., (2007) discussed
pigs suffering from post-weaning anorexia had reduced secretion of the compound
ghrelin. Ghrelin is a hormone secreted from the gastric mucosa and is important because
it is the stimulator of hunger and subsequent feed intake, a hurdle which weaned pigs
already face.
1.3 Changes in the intestine
The intestine, a major portion of the digestive tract, has been documented for
years to play a large role in growth performance and in overall health for both animals
and humans. Complete cellular turnover occurs approximately every 20 days. Some of
the major functions of the small intestine are absorption of nutrients, electrolytes, water
exchange, secretion of mucin, and a physical, albeit selective barrier against antigens and
pathogens (Lallès et al., 2007). Specifically, the small intestine, are proximally to distally
composed of the duodenum, jejunum, and the ileum. These three components of the small
intestine are the primary sites of digestion, absorption, and secondary absorption.
Because the small intestine is the primary sites of these digestive actions, they are

5
equipped with features such as the folds, villi, and microvilli to increase surface area and
the absorptive capabilities. The absorptive cells of the small intestine are called
enterocytes.
Some of the more pronounced changes that occur due to weaning stress are seen
at the villi and their associated crypts. It was reported in previous research that villous
height was reduced by 75% of the initial pre-weaning villous height within the first 24
hours after separation from the sow (Hampson, 1986). With a decreased villi height to
crypt depth ratio, we see hindered growth performance due to the disruption of the small
intestine’s ability to digest and absorb nutrients. With the change in the physiological
components of the small intestine in terms of villous height and crypt depth, swift
enzymatic changes are also occurring as the diet is shifted from a primarily all-milk diet
towards one geared to effectively digest other carbohydrates and plant-specific proteins.
The combination of dietary changes and reduction in performance of the brush border of
the small intestine was found to be associated with lower levels of intake of energy and
protein, (Hall and Byrne, 1989).
In combination with the nutritional functions of the intestine, the gastro-intestinal
tract also contains immunological properties as previously mentioned. The inherent
mucosal immune system is continuously challenged in response to the impacts from the
external and internal sources, and contains various cell types designated to react to these
factors such as cytokines, macrophages, and lymphocytes (Pluske et al., 2018). When
the animal is exposed to this stress at weaning, it can cause the intestinal cells to break
down and become more permeable, leading to an open gateway for bacteria and toxins
6
to bind to tissues underneath begins decreased absorption of nutrients, diarrhea, and
inflammation (Moeser et al., 2006).
Additionally, the gastrointestinal tract of the recently weaned piglet is essentially
a sterile environment, but does contain the bacteria from the surfaces the piglet is
exposed to in its environment (buildings, farrowing crate, the surface of the sow,
herdsman, etc.) which house themselves in the gut of the piglet (Pluske et al., 1997).
Escherichia coli (E. coli) thrive in the gut of pigs and there is a strong correlation of the
presence of enterotoxic E. coli and post-weaning diarrhea among pigs 3-10 days after
weaning (Hampson et al., 1985; Nabuurs et al., 1993a). To reiterate because of its
importance within the industry, the issue of post-weaning diarrhea is first and foremost
an animal welfare concern because the pig is in a non-homeostatic state and tends to
result in increased morbidity or death. Moreover, the post-wean lag or mortality is a
huge economic opportunity to producers everywhere. To try and help combat this,
nutritionists have historically used an inclusion of antibiotics within the feed to help
mitigate this problem.
2. Antibiotics
2.1 Veterinary Feed Directive (VFD)
The Veterinary Feed Directive (VFD) was enacted on January 1st, 2017 and made
immediate changes towards the use of antimicrobial agents in livestock feed and/or
water. This was in part in response to the increasing consumer awareness on the
potential negative outcomes to animals being fed antibiotic growth promoters. In
addition to the potential negative outcomes from antibiotic resistance, increasing trade
pressure from the EU and other countries importing pork from the United States has
7
pushed the passing of the VFD in limiting antibiotic growth promotors alongside the
EU.
According to the American Veterinary Medical Association (AVMA), antibiotic
feeds are still available for use; however, a licensed veterinarian can only write a VFD
after examining the herd, or if there is credible evidence it is necessary for prevention,
treatment, or control of a health issue (AVMA, accessed 2019). Common antibiotics
used were oxytetracycline, tylosin, and sulfas (Step et al., accessed 2019). There is
currently only one antibiotic which can still be used in feed (Carbadox, Pfizer, Exton,
PA). Therefore, because of the increasing scrutiny and unavailability of the use of
antibiotic/antimicrobials for the sole purpose of a growth promoter, the livestock
nutrition industry must find alternatives to encourage efficient growth and well-being of
animals. A partial list of potential feed additives being researched is listed in Table 1 at
the end of this review.
3. Non-antibiotic feed additives
Post-weaned pigs are undoubtedly challenged once separated from the sow and
with the current laws in place in completely removing or limiting antibiotic growth
promoters in feed and/or water or drastically reducing their use, we see increased cases of
disease and poor growth performance (Liu et al., 2018). This stage of morbidity and
decreased feed intake due to the reduction of antibiotics is typically seen more commonly
in the post-wean phase, and may not necessarily effect swine within the grower and
finisher stages as the animal reaches their physiological maturity. This is mainly because
the physiological challenges on the digestive and immune system after weaning has
already passed (Wierup, 2001). Therefore we may not encounter reduced growth
8
performance characteristics in the later stages commercial hog production if antibiotics
are removed because there are far less stressors encountered than there is immediately
post-weaning. Use of these additional nutritional additives can be difficult because there
is currently no required level listed in the NRC (2012) like other nutrients.
3.1 Direct-Fed Microbials (DFM) or Probiotics
Direct-fed microbials (DFMs) or otherwise known as probiotics, are live cultures
added to diets of pigs or other species and when given in adequate amounts can confer a
health benefit to the host (FAO/WHO, 2001; Stein and Kil, 2007). Stein and Kil (2007)
describes the three main categories of organisms which are typically described as
probiotics as containing Bacillus, lactic acid producing bacteria, yeast, or a combination
of these ingredients. Common strains of Bacillus are B. subtilis, B. licheniformis, and B.
pumilus. Bacillus is gram-positive, spore-forming bacteria which is typically seen within
the intestinal tract due to the consumption of contaminated feed, but can also be seen
naturally within the soil, air, and water (Dowarah et al., 2017). Typically, Bacillus
bacteria are not found in the GIT (Markowiak and Śliżewska, 2018). One of the concerns
with the use of probiotics is the ability to remain viable through feed processing, milling,
formulation, and later its storage in a feed. One of the reasons why the Bacillus strains
may have been chosen to be used in feeds is its long storage life and the spores which
form themselves are relatively heat resistant (Simon, 2005).
The idea behind feeding these to animals is their properties on modulation of gut
microflora, immunomodulation, improvement of the intestinal development and
antioxidant status, and reducing weaning stress (Liu et al., 2018). Through modulation of

9
the gut microflora in favor of the animal, there is a hypothesis the addition of probiotics
in the diet may improve health status or growth performance of the animal. This
improvement of health status is because of immunomodulation, while increased growth
performance may be through more effective digestion and absorption of nutrients. This is
due to the ability of Bacillus to produce digestive enzymes like proteases, amylase,
maltase, cellulase, and other carbohydrate digesting enzymes. One of the methods behind
using probiotics is that it is generally recognized as being a safe product to use.
Improvements in growth performance have been reported and the addition of an
in-feed probiotic not only in the weaning period but throughout the life of a commercial
pig has been shown to be beneficial. Alexopoulos et al., (2004) reported lower feed
conversion ratios (FCR) in medium and high dosed probiotic pigs during the growing and
finishing stages compared to pigs fed a control diet. The possible explanation of the
performance of growing and finishing pigs may be due to the GIT microflora balance that
was already in an optimized state and the animals were better able to utilize the nutrients
(Alexopoulos et al., 2004). With the use of a probiotic, there were improvements in ADG
reported 14 d after-weaning, along with improvements in G:F for the entire 42 d period
(Cai et al., 2015). Feed efficiency was improved in weaned pigs fed probiotics against
pigs fed a control diet (Alexopoulos et al., 2004).
Additionally, FCR was improved in pigs fed a marine-derived probiotic (B.
pumilus) versus pigs fed a medicated feed, and ADFI (d 15 – 22 post-weaning), ADG,
and d 22 BW tended to be improved (Prieto et al., 2014). Hu et al., (2014) showed a
significant increase in G:F overall, and higher ADG for pigs fed B. subtilis compared to
piglets fed both negative and positive control diets d 1 – 14 and d 1 – 28 post-weaning.
10
Average daily gains and ADFI were increased post-weaning through d 28 of pigs fed
Bioplus 2B (Easy Bio System Inc., Seoul, Korea), which is a blend of B. subtilis and B.
licheniformis at a dosage of 3.2 x 10⁶ cfu/g in orally challenged pigs against a positive
control (PC) group treated with apramycin (Ahmed et al., 2014). Growth performance
was not affected in a study conducted by Bhandari et al., (2008). In contrast to these
results, growth performance was significantly improved in pigs fed a DFM (Lee et al.,
2014).
As previously mentioned, E. coli can be a cause for concern post-weaning
because of its properties in causing post-weaning diarrhea if it is pathogenic. Prieto et al.,
(2014) found lower counts of E. coli present in the ileum for pigs fed a medicated feed
and B. pumilus enriched feed. Hu et al., (2014) saw a decrease in the presence of E. coli
counts in fecal samples when pigs were supplemented with a B. subtilis based probiotic.
Lowering the amount of ileal E. coli populations has been hypothesized as being one of
the strategies to prevent edema in pigs (Tsukahara et al., 2013). There weren’t any
significant differences in cecal E. coli counts or the amount shed in the feces (Prieto et
al., 2014). This strain of Bacillus was chosen because it was shown to inhibit porcine
pathogenic E. coli in vitro (Prieto et al., 2013). However, not all E. coli bacteria are
considered harmful and may even be beneficial to the host. It is worth noting the E. coli
examined in Prieto et al., (2014), none of the pathogens were considered to be hemolytic
and therefore might not have been pathogenic.
Re-establishing the absorptive capabilities of the intestine is critical after weaning
to improve gut health and reduce post-wean lag. Probiotic administration has been shown
to improve intestinal health. Intestinal histomorphology (villous height) in the duodenum
11
and jejunum was improved in pigs fed a multi-strain Bacillus compared to pigs fed a
control diet (Cai et al., 2015). Villus height in all three segments of the small intestine
was also improved in pigs fed a complex probiotic mixture containing multiple strains
(Choi et al., 2016). Bhandari et al., (2008) found greater villus height in the duodenum of
pigs fed spray-dried porcine plasma compared to the NC and the DFM fed group. In
support, there was also a greater villus height and a greater villus height:crypt depth
(VH:CD) ratio in the duodenum, jejunum, and ileum of pigs fed a fermentation biomass
containing B. subtilis bacteria (Lee et al., 2014).
Many experiments which have been conducted utilize an in-feed delivery of DFM
or combinations may not be beneficial because voluntary feed intake post-weaning is
considerably low. Dybkjaer et al., (2006) found a strong association between time spent
eating and drinking, and drinking behavior can be strongly influenced by external factors.
Also, there was an increased instance of drinking behavior for the first few days after
weaning as the pigs might be trying to achieve satiety in the absence of milk from the
sow (Dybkjaer et al., 2006). Therefore, a DFM supplement may be more beneficial when
it is delivered via water than feed since weaned pigs are actively drinking rather than
eating after weaning.
Besides E. coli, Salmonella is another concerning pathogen in pig production
which can colonize in the body at the opportunity of lowered immunity and energy intake
at weaning and produce instances of post-weaning diarrhea and poor growth
performance. Walsh et al., (2012) challenged pigs with Salmonella Typhimurium after
administering a DFM mixture delivered via water for 14 d to see the effects of DFM and
other additives on growth performance, microbial communities, and immune response.
12
There were no differences between the experimental groups in terms of growth
performance (ADFI, G:F, and BW) between the treatment groups. However, ADG did
improve d 8 to 10 post-challenge between the DFM and the negative control (NC) group
(Walsh et al., 2012). In terms of microbial communities, Walsh et al., (2012) also
reported Salmonella was no longer being shed in the feces of pigs fed the DFM 5 days
post-challenge. Aperce et al., (2010) found B. subtilis and B. licheniformis reduced
Salmonella permeation in swine intestinal epithelial tissue in vitro. Ahmed et al., (2014)
found lower fecal Salmonella counts in a Bacillus-based DFM compared to a negative
control.
Salmonella infection in pigs can be diagnosed by an increase in body temperature,
diarrhea, and the increase of induced secretion of inflammatory cytokines like tumor
necrosis factor alpha (TNF-α), and interleukin eight (IL-8), among others. These
measurable parameters are the sign of an induced immune response in the presence of a
pathogen. In agreement with previous work done on a different strain of probiotic
bacteria (Szabó et al., 2009), Walsh et al., (2012) found no differences in body
temperature between the treatment groups. Increased rectal temperature may be
indicative of a disease state. Experimental groups of swine epithelial tissue subjected to
Salmonella showed an increased secretion of IL-8 when Bacillus wasn’t present in vitro
(Aperce et al., 2010). Other results from Walsh et al., (2012) showed differences of TNF-
α concentration in the ileum of the small intestine 4 days post Salmonella challenge.
Conclusions from this study stated the probiotic supplement may have not have had an
interaction in clearing the pig of the infection since the only differences were found days
after the challenge; but, there also may have been some immunity built as a portion of the
13
pigs were exposed to Salmonella before the challenge even though differences weren’t
considered significant (Walsh et al., 2012).
Aperce et al., (2010) discussed the results from the reduced Salmonella induced
secretion of IL-8 in cells exposed to Bacillus supplementation. This may have been due
to exertion of some competitive behavior of the bacteria in utilizing nutrients of the
media which left the cells at a disadvantage in secreting IL-8 (Aperce et al., 2010). This
example may be one of the portrayed modes of action of probiotics called competitive
exclusion (Baugher and Klaenhammer, 2011). Prieto et al., (2014) observed a higher
number of granulocytes which may be indicative of inflammation. Tumor necrosis factor
alpha and IL-8 were shown to be downregulated in the colon of piglets (Lähteinen et al.,
2015).
Like other nutrition aspects, one source of probiotics may not yield the same
results. With live cultures, there is an inherent property each one possesses and their
effects in vivo or in vitro may differ. There is a large effect of strain-specific properties
and its ability to work in vivo can be influenced by dosage, feed composition, and age or
disease-state of the animals involving weaned pigs (Liu et al., 2018). Results from studies
may be even less elucidated if multi-strain or complex probiotics are used. As previously
mentioned, Walsh et al., (2012) saw no improvements in growth performance except for
ADG when fed B. subtilis and B. licheniformis. Prieto et al., (2014) saw a tendency to
improve villus height within the jejunum compared to a control and in-feed medicated
group. Kremer (2006) reported B. subtilis and B. licheniformis included in pig diets
yielded positive results in growth performance in 30 of 31 studies.

14
It is also important to note supplementation with other compounds like essential
oils or components containing cinnamon, oregano, thyme, and clove can inhibit the
growth of certain bacterial species like Bacillus (Sivropoulou et al., 1996; Özcan et al.,
2006). This overall can present some problems in having consistent results from trials;
therefore more research is needed as alternatives to AGPs become more widely used like
DFMs due to the incredibly complex microbiota population within the digestive tract,
strains within products, and their interactions.
3.1.1 Yeast or derivatives of yeast
In addition to organic acids, some nutritional additives can also include yeast
products. Yeast in itself can be considered a probiotic, and is one of the more common
forms of probiotics (Jiang et al., 2015). Yeast forms are typically whole live yeast cells,
heat-treated yeast, ground yeast, purified cultures, and yeast extracts (Liu et al., 2018).
Particularly, Saccharomyces cerevisiae is a popular strain of live yeast used in baking and
brewing and brewing industry. The natural habitat of Saccharomyces cerevisiae is in
fruits (Simon, 2005). Generally, yeast are fed to livestock, either as live yeast cultures, or
may contain products or derivatives of yeast such as mannanoligosaccharides (MOS),
nucleotides, or ß-glucans (Halas and Nochta, 2012; Shurson, 2018). The recommended
dosage for probiotic supplementation is around 109 colony forming units (CFU) per kg of
feed (Simon, 2005), and may change depending on if it is a water-delivered product.
There has been some research on the proposed modes of action of yeast and
MOS. Live yeast administration has been shown to potentially increase fiber digestion,
inhibit pathogen proliferation, produce antibacterial products, and modulate the immune

15
function by activating a T-helper 1 response (Th-1) as shown by increased amounts of the
cytokine INF-γ (Shen et al., 2009; Shurson, 2018). Mannanoligosaccharides are non-
digestible carbohydrates which make up components of the yeast cell wall as well as ß-
glucans, which are highly insoluble (Halas and Nochta, 2012; Shurson, 2018). The
specific mode of action of yeast may lay in its derivative MOS, which contain mannose
blocks which bind pathogens like E. coli to the surface of the mannose blocks on the
mucosal surface; therefore preventing the adhesion of the pathogen to the intestinal wall
(Pettigrew, 2006; Halas and Nochta, 2012).
Mannanoligosaccharides may also serve as an energy source for the gut microbes
since they are largely insoluble, thereby exhibiting a prebiotic effect (Shurson, 2018).
However it has also been discussed the shift in beneficial bacteria is not consistent in
different studies (Halas and Nochta, 2012). At least in fish, the efficacy of MOS is
dependent on a number of factors including: duration of supplementation, dosage in feed
or water, species of animal the yeast is being fed to, stage in which the animal is in, and
the environment it is being kept in (Song et al., 2014; Torrecillas et al., 2014).
Growth performance was impacted by the edition of yeast. When supplemented to
nursery pigs, the addition of live yeast into the diet tended to improve feed efficiency at
days 15-21 and for the overall period (days 0-21) than pigs fed the basal diets (Jiang et
al., 2015). At 30 days post-weaning, yeast supplemented pigs were significantly heavier
and had greater ADG than control pigs, and there were numerical improvements in feed
efficiency (Bontempo et al., 2006). When fed varying levels of dietary yeast culture,
ADG and ADFI in nursery pigs were maximized at an inclusion rate of 5 g/kg compared
to control diets containing no yeast, but there was no difference against a positive control
16
group treated with an AGP (Shen et al., 2009). In growing pigs, supplementation of a live
yeast increased BW and ADG from days 0 to 15 compared to a control (Lu et al., 2016).
Weaned pigs fed yeast products had heavier BW and ADG was improved against control
pigs (Xu et al., 2018). In agreement with these results, Eicher et al., (2005) reported
greater ADG with yeast cell wall ß-glucan supplemented pigs than control pigs not
fortified with yeast cell wall in the diets.
In the intestine, villus height and villus height to crypt depth ratio were increased
in the duodenum and the jejunum for pigs supplemented with live dietary yeast (Jiang et
al., 2015). There were significant increases in villus height and crypt depth, with a
tendency to reduce to the VH:CD ratio (Bontempo et al., 2006). Additionally, there was a
significant increase in villus height and VH:CD ratio in the jejunum, and there was a
tendency to reduce the crypt depth in the jejunum of weaned pigs supplemented with dry
yeast (Shen et al., 2009). In chickens, supplementation of a MOS-containing yeast
(Saccharomyces cerevisiae) reduced the amount of Salmonella in the intestine of the
research flock by 26% compared to non-supplemented birds (Spring et al., 2000).
When subjected to mycotoxins, pigs fed the mycotoxin positive treatment plus a
yeast fermentation extract had greater ADG and tended to have greater ADFI than pigs
treated with mycotoxin alone (Weaver et al., 2014), further portraying its possible
positive effects during a challenge. Immunoglobin A (IgA), and the cytokines IL-2, and
IL-6 were increased in piglets supplemented with live yeast (Jiang et al., 2015). When
subjected to a LPS challenge, piglets supplemented with the yeast derivative ß-glucan
showed increased amounts of TNF-α in multiple tissues which was attributed to greater
cortisol concentrations (Eicher et al., 2006). In contrast to their results, piglets
17
supplemented with ß-glucan had reduced cortisol concentrations after an LPS challenge
(Mao et al., 2005). Thus, yeast and its derivatives may contain some immunomodulatory
or hormonal properties, and their responses and properties need to be further elucidated.
3.3 Organic Acids
Besides yeast and other probiotics, another feed or water additive which has been
examined is the use of organic acids. Organic acids are different than their inorganic
counterparts because they are widely found as normal parts of plants and animals, and
they are the product of carbohydrate fermentation in the gut by the microbial population
(Lee et al., 2007). Popular organic acids which have been researched include formic acid,
fumaric acid, malic acid, propionic acid, sorbic acid, lactic acid, and citric acid (Lee et
al., 2007; Liu et al., 2018) and can also include acetic acid. Pepsin is the active form of
the enzyme pepsinogen and it is secreted into the lumen of the stomach from the chief
cells in the presence of food and hormonal signals during the gastric phase of digestion.
Pepsinogen is converted to pepsin via hydrochloric acid (HCl) by lowering the overall
gastric pH and is optimally active in the pH rage of 2 and 3.5 (Partanen and Mroz, 1999).
Therefore, acidifiers’ mode of action can be explained by the overall lowering of the
gastric pH and the antimicrobial property of the acid, which may or may not be
independent of the pH (Partanen and Mroz, 1999; Kiarie et al., 2016). It is also suggested
acidifiers may change the microbial population of the GIT, which can alter the
microorganism population or kill harmful bacteria (Pettigrew, 2006). Feeding acids to
pigs may also provide nutrients which are preferred by the intestine which can enhance
integrity and function (de Lange et al., 2010). Supplementation time may vary but data

18
suggests the optimal time for supplementation of organic acids appears to be the first two
to four weeks after weaning (Giesting et al., 1991).
In addition to the lowering pH of the stomach, organic acids have been suggested
to reduce the rate of gastric emptying, therefore increasing the likelihood of prolonged
protein digestion as it is in contact with the gastric protease, pepsin, for a longer period of
time (Mayer, 1994; Partanen and Mroz, 1999). Once leaving the stomach, contents of
feed are metered in to the duodenum of the small intestine through the pyloric sphincter
and into the lumen of the small intestine. There, the nutrients are subjected to additional
proteases from the pancreas and small intestine, as well as other digestive enzymes for
the other macronutrients such as carbohydrates and fats. Harada et al., (1986)
demonstrated the secretion of pancreatic digestive compounds were dependent on pH
which was induced by luminal injection of HCl and lactic acid in anesthetized pigs. In
sheep, pancreatic juice flow, the carbohydratase amylase, and protein outputs were
increased rapidly after the injection of the volatile fatty acids (acetic, propionate, and
butyrate) into the blood stream via jugular vein (Partanen and Mroz, 1999). Organic acids
may then be considered beneficial in aiding in digestion through both lowering pH and
increasing pancreatic secretory responses.
Regarding growth performance there are variable results with the use of organic
acids. In a recent study which utilized a combination of various organic acids and fatty
acids, Li et al., (2018) found no differences in growth performance during the entire
experimental period in pigs fed highly digestible diets. Growth performance as measured
in ADG, ADFI, and G:F ratio were not significantly affected for any of the phases or the
overall period for pigs fed a blend of organic acids (lactic acid and phosphoric acid) and

19
essential oils (Kommera et al., 2006). These results may be variable because of the
presence of the inorganic acids and the essential oils which may present respective
varying modes of action. In contrast, pigs fed a blend of a protected dietary organic acids
(fumaric, citric, and malic acid) with a medium chain fatty acid at an inclusion of 0.2% of
the diet saw an improvement in growth performance (ADG, ADFI, G:F) compared to the
control pigs (Udaphaya et al., 2018). Feeding a protected version of organic acids
produced higher ADG and better G:F than other diets, however, the organic acid was not
fully described and it was a protected version of it (Lee et al., 2018). Lee et al., (2007)
did not report any differences in growth performance when compared organic acid-fed
pigs to controls.
The improvements in growth performance of the pigs fed a protected source of
organic acids may have been due to the presence of medium chain fatty acids or due to
the organic acids as being protected. Like some minerals there are protected forms of
nutrients which are typically coated in a lipid or a fat. This lipid coating helps to protect
the acid in the upper GIT and much of the integrity is maintained until it reaches the
small intestine. These matrixes of organic acids coated with a fat pass through the
stomach into the lumen of the small intestine where they are met with fat digesting
enzymes and the compounds are liberated from each other. It is thought the organic acids
better maintain their integrity until the small intestine and are then able to travel all the
way through the small intestine and into the hindgut of the pig.
For immunological properties, a blend of primarily formic acid based organic acid
reduced the amount of plasma TNF-α, and increased the amount of IgG concentrations
(Kuang et al., 2015). It is worth noting this study also utilized a medium-chain fatty acid.

20
In the intestine and the hindgut, a blend of formic acid and essential oils increased the
apparent fecal digestibility of total carbohydrates (Gerritsen et al., 2010). Lee et al.,
(2007) failed to find differences of intestinal morphology or enzyme activity in pigs
supplemented with organic acids. This result was also supported by Ferrara et al., (2017).
It was reported the apparent ileal digestibility (AID) was improved for a number of amino
acids when an organic acid blend was introduced to pigs (Kuang et al., 2015).
Interestingly, when supplemented with organic acids, pigs had upregulation of mRNA for
the CAT2 transporter which is responsible for the absorption of some of the basic amino
acids (Kuang et al., 2015).
Overall, inclusions of organic acids have been shown to improve growth
performance and health of pigs. However, there may interactions among nutritional
blends. Additionally, the effect of organic acids is largely dependent on the age of the
pig, palatability of the feed or water supplement, source of the organic acid, and
supplemental amount of the organic acid (Lee et al., 2007). Therefore, there is a need for
continued research in this area to further understand the effect on host metabolism.
3.4 Herbal and Plant Extracts or Essential Oils
There is increasing popularity both in humans and animals in the use of plant
extracts, or “essential oils”, due to their potential effects on overall health, curing of
specific ailments, and the effects on animal growth performance and health. Essential oils
are entitled so because it is believed the biologically active component of herbs, spices,
and other plants may exert some antimicrobial properties (Zaika et al., 1983). Some of
the more common extracts are garlic, clove, thymol, cinnamaldehyde, and carvacrol
21
(oregano) (NRC, 2012). Antimicrobial properties are thought to be the main effect of
plant extracts, but it was also believed the antimicrobial property is due to the changes in
lipid solubility at the surface of some bacteria (Dabbah et al., 1970).
Additionally, there are some theories as to essentials oils acting as an antioxidant
(Dundar et al., 2008). The main effect of antioxidant activity is due to the presence of
phenols, but may also contain flavonoids and terpenoids which can protect cells and
tissues against autoxidation (Costa et al., 2013). Flavonoids specifically are found in
oregano and thyme, and terpenoids are found in thyme, oregano, and cloves (Costa et al.,
2013). There may be some beneficial anti- inflammatory properties of essential oils as
well. In a study using the bioactive component of crushed garlic, allicin, it was found the
addition of this plant component suppressed the spontaneous and TNF-α induced
secretion of IL-1ß in vitro in intestinal epithelia cells (Lang et al., 2004). Though the
effects may differ in a live subject this could help mitigate the inflammatory responses
induced by certain stressors, such as is the case post-weaning or when subjected to an
immune challenge.
In a blend of three plant extracts containing cinnamaldehyde, thymol, and anethol,
it was reported by Zhang et al., (2017) the blend of these plant extracts improved amino
acid nutrition by inhibiting the bacterial utilization of a number of amino acids within the
small intestine. Additionally, they also found the addition of cinnamaldehyde, thymol,
and anethol reduced the ammonia excretion by 16, 22, and 42%, respectively (Zhang et
al., 2017). This indicates plant extracts can aid in excretion of noxious gas emissions and
macronutrient digestion.
22
Essential oils and plant extracts may also exhibit a gustatory response in pigs as
well. There have been studies conducted to measure feed intake after the inclusion of
essential oils in feed because of their potent smell. The strong smell of these extracts may
cause a reaction in olfactory nerves and taste buds, which may stimulate feed intake and
subsequent gain (Costa et al., 2013). However, like many other combination feed
additives which were discussed, the results can be inconsistent. Using a blend of
cinnamaldehyde, oregano, and capsicum, Castillo et al., (2006) reported increased
lactobacilli:enterobacteria ratios in the jejunum of weaned pigs due to increases of the
lactobacillus bacteria. These results were similar to Manzanilla et al., (2004) who found
increased populations of lactobacillus. Plant extract treatment tended to increase jejunum
villi height and significantly ileal villi height when subjected to a health challenge (Liu et
al., 2013).
When subjected to an E. coli challenge, piglets provided plant extracts grew
significantly faster during the early stages of the experiment but tapered off as the trial
proceeded (Liu et al., 2013). At certain concentrations, oregano was found to be
inhibitory to the B. subtilis bacteria, and at stronger concentrations was inhibitor to E.
coli (Baydar et al., 2004). This could potentially be useful in the application to control
certain harmful bacterial populations, but may also delete the effects of strains of
beneficial bacteria which are used in probiotics. Antioxidant and antimicrobial effects
were also reported in vitro (Sökmen et al., 2004). These effects in this instance were
researched for the control of foodborne pathogens and spoilage organisms for application
in food science, but may be applicable towards other systems as well like animal feeding.

23
Application of essential oils and their effects are largely dependent on many
factors including the chemical composition, the climate, season, and timing of harvest,
geographic location, and how the oil is distilled from the herb or plant (Baydar et al.,
2004). Therefore continued research is needed to advance the processing and application
of plant extracts which are to be used in animal systems.
4. Amino Acids
Amino acids are important factors of the diet because they are precursors of
protein and a part of many biochemical reactions involved in energy metabolism.
Therefore, to maintain physiological functions they are a required component of the diet.
Typically in mammals (with some exceptions), there are ten essential amino acids (EAA)
or non-dispensable amino acids and 10 to 12 non-essential amino acids. The essential
amino acids are phenylalanine, valine, tryptophan, threonine, isoleucine, methionine,
histidine, arginine, leucine, and lysine. These are termed “essential” because they cannot
be synthesized at all or in great enough quantities to match the physiological
requirements of the animal. Some of the non-essential or conditionally essential amino
acids include alanine, glycine, and cysteine. Each one has its own biological properties
and functions, but some may share common pathways. Generally swine diets are
commonly formulated on a lysine basis due to it being the first-limiting amino acid in
typical corn-soybean meal based diets. With these types of ingredients there may be some
other limiting amino acids as well.
24
4.1 Threonine
Depending on the ingredients in the diet, threonine can be considered as the
second or third limiting amino acid in sorghum or corn, respectively (Cohen and
Tanksley, 1976; Grosbach et al., 1985). Threonine can be described along with lysine and
tryptophan as one of the essential amino acids and is needed for growth and maintenance
(NRC, 2012). Particularly, threonine has been labeled as being the first limiting amino
acid for maintenance (Fuller et al., 1989). The high requirement of threonine for
maintenance is because it has high first-pass utilization, meaning it is used up extensively
the first time through the digestive tract. The degradation of threonine in the liver and
pancreas occurs in three different pathways. These metabolic pathways are initiated by
threonine dehydratase, threonine aldolase, and threonine dehydrogenase in which
threonine dehydrogenase accounts for around 80% of threonine catabolism (Le Floc’h
and Sève, 2005; Wu, 2013). Once threonine is catabolized products can include glycine,
pyruvate, and acetyl CoA which can later be used in energy production.
Specifically, threonine is utilized by the portal drain viscera (PDV) which
includes the intestines, pancreas, spleen, and stomach (Schaart et al., 2005). Le Floc’h
and Sève, (2005) reported liver utilization of threonine was lower than the PDV and has
described it as a limiting step in threonine utilization. This can be due to the use and
sparing of threonine by the peripheral tissues and avoiding catabolism by liver enzymes
(Le Floc’h et al., 1996). It has been shown that the utilization of threonine on the first-
pass for use in the PDV had extracted anywhere from 60-90% of dietary threonine for
pigs fed a milk-based or a protein-free diet (Lien et al., 1997; Stoll et al., 1998). One of
the main functions and the high use of threonine by the body is the incorporation of

25
threonine into the production of mucin because it acts as an integral part of the structural
protein which functions to protect the lining of the GIT (Schaart et al., 2005). Threonine
contents of mucin are around 10 to 13% compared to 5 to 6% in skeletal muscle and
3.8% in whole body protein; crude mucin contains roughly 16 to 20% threonine (Lien et
al., 1997; NRC, 2012; Pluske et al., 2018). Mucosal proteins which are highly rich in
threonine are produced from the Brunner’s glands and goblet cells in the small intestine
and the respiratory tracts (McGilvray et al., 2019). Therefore, an increase in mucin
production by the pig or times of infection of the GIT correlates to an increase in
threonine requirements (Pluske et al., 2018). Overall, one of the proposed theories of the
high threonine requirements for maintenance is due to the production of the mucosal
proteins and subsequent loss of this mucus as it is secreted and excreted throughout the
GIT (Le Floc’h and Sève, 2005). Although it has been suggested there is some recycling
of threonine back into mucosal proteins, the amount is low (Van der Schoor et al., 2002;
Le Floc’h and Sève, 2005). Wang et al., (2010) reported pigs fed with 0.89% TID
threonine, which accounts for 120% of the threonine requirement (NRC, 1998), had
100% higher mRNA levels for mucin in the duodenum and the ileum, and 200% higher
mRNA for mucin in the jejunum compared to pigs fed 0.37% or 1.11% TID threonine.
In addition to mucin production, threonine may also serve as a flavor additive like
the other amino acids. Tinti et al., (2000) provided pigs with 14 amino acids in both their
L- and D- isomers in a solution next to a standard water source to measure the gustatory
response of the individual pig. Out of the 14 amino acids tested, six to seven amino acids
(including threonine) elicited a gustatory preference in pigs in the L- and D- isomer form
26
(Tinti et al., 2000). This may be due to the properties in human studies in which threonine
was considered to have a sweet taste (Haefeli and Glaser, 1990).
4.1.1 Growth Performance
In disease challenged pigs, protein deposition was significantly increased in a
linear fashion as levels of threonine increased for both the challenged and the
unchallenged group (McGilvray et al., 2019). When using a regression equation and
extrapolating the protein deposition at 0 g SID threonine intake, pigs not being
challenged had -11.2 g of protein deposition and challenged pigs had -56.3 g of protein
deposition (McGilvray et al., 2019). Therefore, at 0 g SID threonine intake, both
challenged and unchallenged pigs were affected. However, challenged pigs were more
negatively impacted due to their disease state which may suggest a sparing mechanism as
the system can’t afford to deposit protein. It is worth nothing the increases in threonine
level in this study were 70, 90, and 110% of threonine requirements for maximum protein
deposition for pigs (McGilvray et al., 2019). Rearing conditions can also have an effect
on the threonine requirements. Jayaraman et al., (2015) demonstrated the effect of
cleanliness and disinfection on growth performance in pigs raised in a clean and dirty
room to determine the optimal threonine amount in the diet. The purpose of using
unsanitary rooms was to mimic conditions which may be present in the industry, and to
present the piglet with a possible immune challenge. For pigs raised in clean rooms, the
authors witnessed an increase in G:F, but didn’t record any changes in ADFI and ADG
during week 1 (Jayaraman, 2015). In unclean sanitary conditions, Jayaraman et al.,
(2015) found quadratic improvements in G:F for the overall period and in week 2, and
increases in feed intake during week 3. For growing gilts, ADG, final body protein mass,
27
and body protein deposition was significantly increased linearly with increasing levels of
dietary threonine (60, 70, 80, 90, 100, and 120% of anticipated requirement (de Lange et
al., 2001).
In a study with pigs either susceptible or not susceptible to E. coli infection and
challenged with oral doses of E. coli, 3-7 days post-weaning and before the E. coli
challenge, pigs fed with higher levels of threonine exhibited higher ADFI (8.5 g/kg vs.
9.0 g/kg threonine; Trevisi et al., 2015). Within the same study by Trevisi et al., (2015),
higher amounts of threonine tended to improve G:F 5-6 days post E. coli challenge, and
tended to improve the overall G:F and ADG. There may be some instances where the
increasing consumption of dietary threonine has no effect on growth performance. Defa
et al., (1999) demonstrated an increase of threonine from 5.9 g/kg to 6.8 g/kg increased
ADG of weaned pigs, but plateaued with increasing levels after 6.8 g/kg. In addition, feed
intake declined with additional threonine but feed efficiency improved significantly in a
linear direction with the highest feed efficiency being exhibited at 8.9 g/kg to 9.0 g/kg
lysine (Defa et al., 1999). With these results there might be regional or genetic
differences in pigs since this trial was conducted. Wang et al., (2006) determined based
on body weight gain and feed efficiency, performance was maximized when nursery pigs
were fed a diet containing 5.9 g/kg of true threonine intake.
In a study to further determine the optimal SID threonine levels on growth
performance, de Jong et al., (2018) fed nursery piglets with six ratios of threonine:lysine
(53, 56,59, 62, 65, and 68%). These authors reported linear increases in ADG and G:F in
d 0 to 21 and significant quadratic improvements of G:F from d 21 to 39 and for the
overall period (de Jong et al., 2018). From the results of this study, de Jong et al., (2018)
28
concluded G:F and ADG were optimized at 65% threonine. Bergström et al., (1996)
concluded based on growth and performance a 25 to 50 lb pig requires at least a ratio of
55% SID threonine which corresponds to a threonine:lysine ratio of 63% to 65% on a
total basis. Pigs fed 0.37% total ileal digestible (TID) threonine had poor feed efficiency
and lower weight gain compared to pigs fed 0.74, 0.89, and 1.11% TID threonine diets
(Wang et al., 2010).
In addition to acting as a flavor additive, there has been some work in pigs’
recognition of a deficient diet and subsequent eating behavior and performance. In a
study conducted by Ettle and Roth (2005), piglets in two groups in experiment one were
given the choice between diets containing 57% or 62%, and 57% or 67% threonine in
compared to control diets with set levels of threonine. In weeks one, four, and for the
total period, piglets consumed significantly more feed in the 62% threonine compared to
the 57% group; feed consumption decreased by increasing threonine to 67% and piglets
ate more of feed containing 57% threonine (Ettle and Roth, 2005). In experiment two,
two groups of pigs were given a choice between diets containing 50% or 56% threonine,
and 50% or 62% threonine compared to control diets (Ettle and Roth, 2005). In almost all
of the six weeks, pigs ate more of the 56% and 62% threonine diets on a weekly basis; in
observed spontaneous eating behavior pigs preferred the higher levels of threonine (Ettle
and Roth, 2005).
For growth performance in both experiments, there were improvements in ADG,
final BW, and G:F with increasing levels of threonine (Ettle and Roth, 2005). However,
the preference in observed eating behavior and weekly feed intake in experiment two
may be due to the treatment as these piglets could be deficient for threonine and are

29
trying to eat towards meeting their metabolic requirement for threonine. When a decrease
in dietary threonine is encountered, growth and deposition of body muscle is
compromised at the expense of sparing the integrity of the small intestine and
maintaining mucin production (Schaart et al., 2005; Munasinghe et al., 2017). This can
especially be exacerbated during times of hindered voluntary food intake or decreased
threonine intake; such as the case in weaned pigs.
4.1.3 Immunological and intestinal properties
Rectal body temperature and any fluctuations in it can be indicative of a disease
or non-homeostatic state. In E. coli challenged pigs, rectal body temperature increased
significantly 10 h post-challenge but the increase was not seen in pigs fed greater
amounts of threonine (Trevisi et al., 2015). Additionally, Trevisi et al., (2015) also
recorded an effect of threonine on the production of K88-specific IgA production; in
which ETEC-specific immunoglobin secretion tended to be increased with additional
threonine. IgG production increased linearly in pigs fed additional threonine between
days 14 and 28, with the highest levels of IgG secreted in pigs fed the highest amount of
threonine 8.9 g/kg (Defa et al., 1999). These results are not surprising as threonine
concentrations are found in the greatest amount in human, horse, and bovine g-globulin
(Smith and Greene, 1947). When increased levels of true ileal digestible threonine were
fed, there was a significantly increased concentration of IgG and a tendency to increase
concentrations of serum IgM (Mao et al., 2014). Wang et al., (2006) determined the
optimal level of threonine to be included in the diet to maximize concentrations of IgG of
nursery pigs and that was 6.6 g/d of true ileal digestible threonine.
30
Immune system activation greatly increases amino acid requirements, especially
threonine (Pluske et al., 2018). Low threonine supply (70% of recommendations)
modified ileal gene expression, most notably, increased the expression of genes
associated with immune and defense functions involved in paracellular permeability (Le
Floc’h et al., 2012). When subjected to an E. coli lipopolysaccharide challenge (LPS),
pigs undergoing the challenge utilized greater amounts of threonine which may be due to
the increased need of threonine for mucin production and other immune metabolites
(McGilvray, 2019). When ileitis was induced and inflammation occurred, uptake of
arterial threonine by the PDV was increased 5-fold (Rémond et al., 2009).
Threonine did not enhance the proliferation of villous height or decrease crypt
depth (Trevisi et al., 2015). However, Wang et al., (2010) reported destruction of the villi
in pigs fed both 0.37% and 1.11% TID threonine diets. They also reported epithelial cell
membrane damage in the 0.37% TID threonine, and reduced microvilli number and
shedding in the 1.11% TID threonine fed pigs (Wang et al., 2010). This may suggest a
deficiency or excess of threonine may actually be harmful to the intestinal barrier and
reduce the absorptive capabilities. Wang et al., (2007) also concluded the fractional
synthesis rate (FSR) of small intestinal mucosal proteins and mucins were impacted by
both a deficiency and excess of dietary threonine.
Some work has been done on the other effects of threonine on the intestine.
Motility of the small intestine is an important function to keep contents moving through
the tract. This is mainly due to the presence of pathogenic bacteria which can adhere to
contents and proliferate causing enteric diseases (Pluske et al., 2002). Święch et al.,
(2010) demonstrated threonine may have an effect on contractility of the small intestine,

31
mainly the duodenum and mid-jejunum, which can be an important factor in motility of
the GIT. The intestine is a major site of protein digestion, and deficiencies of threonine
have been shown to disrupt the expression or activity of protein digestion enzymes and
intestinal cystolic aminopeptidases (Wang et al., 2007; Le Floc’h et al., 2012).
4.1.4 Requirements
Research has been conducted in determining the requirements for threonine of
nursery pigs. According to the NRC (2012), threonine to lysine ratio requirements are
around 59% for pigs in the 7 to 25 kg weight category, and may change with age and size
of the animal. This is mainly due to the increasing size of the GIT, subsequently
increasing the maintenance requirement of the animal. On the basis of the results
discussed previously by multiple authors (James et al., 2003; Lenehan et al., 2004; and
Wang et al., 2006), Goodband et al., (2014) suggested the use of an equation relative to
lysine (0.0000130BW2 - 0.0014229BW + 0.6387290) which can account for the early
growth stage and BW change. However, diets deficient in threonine may not be as
detrimental to growth and efficiency opposed to other EAA (Goodband et al., 2014).
Jayaraman et al., (2015) concluded based on growth performance results of their study
that the optimum SID (standardized ileal digestible) threonine to lysine ratio in pigs
reared in clean environments was 65%, and in unclean sanitary conditions was 66.5%
using quadratic broken-line (BLQ) analysis. This is in contrast to the current NRC (2012)
requirements. Furthermore, based on growth performance parameters, increased dietary
threonine may be more optimal to decrease F:G, and increase G:F and ADG post ETEC
challenge regardless of the genetic susceptibility of pigs to E. coli (Trevisi et al., 2015).
The amount of 8.5 g/kg and 9.0 g/kg used in their study equates to 67.5% and 69.2%
32
threonine (respectively) based on the lysine contents of analyzed diets at 12.6g/kg and
13.0 g/kg lysine (respectively). As previously mentioned, Bergström et al., (1996)
concluded based on growth and performance a 25 to 50 lb pig requires at least 55% SID
threonine, which corresponds to a threonine:lysine ratio of 63% to 65% on a total basis.
In finishing pigs, it was suggested by Pedersen et al., (2003) the optimal threonine:lysine
ratio was 0.64 based on nitrogen retention/nitrogen intake.
5. Dietary Modulations
There are a number of feed ingredients nutritionists use to optimize growth and
performance after the weaning period. These ingredients are typically used so they can
help ease the transition from a milk diet to one containing complex carbohydrates. An
incomplete list of these ingredients is outlined in Table 1.
5.1 Diets Containing Animal-Protein
Weaning diets typically contain a large amount of proteins from animal by-
products. Some of these proteins products are fish-meal, and spray-dried animal or
porcine plasma (SDP/SDPP). Spray-dried plasma is an animal by-product harvested from
the blood provided from commercial slaughter facilities. Spray-dried porcine plasma
rather than SDP has been discussed as being better at promoting feed-intake after
weaning possibly due to the presence and specificity of the IgG against swine-related
pathogens (Pierce et al., 2005; Lallès et al., 2009). Spray-dried porcine plasma contains
15-20% immunoglobins (Thomson et al., 1994). It was also discussed SDP may contain
or reduce other compounds such as growth promotors and cytokines (Lallès et al., 2009).
Specifically, SDPP can reduce the expression of certain proinflammatory cytokines like

33
TNF-α, IL-1-ß, and Il-6 (Touchette et al., 2002). This overall may be an important factor
in including SDP in weaned piglet diets because sow’s milk is low in antibodies in late
lactation, and generally the full extent of antibody production in the piglet occurs around
6-7 weeks of age (Halas and Nochta, 2012).
One of these proposed growth promotors which may help with feed intake is the
presence of hunger signals since pigs are typically removed off of feed several hours
before slaughtering (Pettigrew, 2006). Blood plasma products also contain epidermal
growth factor (EGF) which may contribute to cell proliferation and differentiation (van
Dijk et al., 2001). Pigs fed a diet containing 6% SDPP tended to have longer villous
height in the duodenum which can increase the absorptive capabilities of the small
intestine (Zhao et al., 2007).
Pigs fed with diets containing blood plasma were heavier at the conclusion of the
study, and had better growth performance than pigs fed without blood plasma (Bedford et
al., 2012). In support of these results, the inclusion of SDPP to weaned pigs improved
ADG and ADFI in the first 10 days after weaning but did not affect G:F (Zhao et al.,
2007). In the first week post-weaning, pigs fed either a spray-dried blood meal or red
blood cells had higher ADG and ADFI than pigs fed fish meal or synthetic amino acids
(Woodworth et al., 1996). Also, pigs fed SDPP gained weight faster and had higher ADFI
than control pigs not fed SDPP (Pierce et al., 2005).
When fed a complex diet containing fish meal, blood plasma, whey, and lactose,
weaned pigs had significantly higher ADG between days 7-21 and BW at day 21 than
pigs fed simple diets and simple diets containing lactose (Bible et al., 2016). It was also
34
outlined diets containing spray-dried plasma, piglets had a lower instance and less severe
diarrhea (Coffey and Cromwell, 2001; van Dijk et al., 2001). In contrast to the benefits of
SDP inclusion, Dritz et al., (1996) found no effect on growth performance of nursery pigs
when SDP and fish meal were included in complex diets of nursery pigs which were
chronically challenged with LPS.
5.2 Animal-Protein-Free Diets
Animal protein products are generally more easily digestible than plant proteins,
but they are generally more expensive (Sapkota et al., 2007; Bedford et al., 2012). With
recent consumer trends, the concept of animals fed vegetarian diets may also be more
marketable towards the public and the consumer. However, there are some negatives to
feeding pigs with diets not containing animal protein. Soybean meal contains trypsin
inhibitors, which generally make the diet less digestible to the pig and decreases the
effectiveness of protein utilization. Moreover, when piglets were provided a diet which
contained specialty products such as spray-dried plasma, Myers et al., (2014) reported
increases in ADG and G:F than piglets in the control diet which contained no specialty
products and was primarily soybean meal-based. This result can be attributed to the
increased digestibility as there are more simple peptides which are more easily digestible,
and a balanced amino acid profile. (Gilbert et al., 2008; Cho et al., 2010).
In addition to trypsin inhibitors, vegetarian diets may contain large amounts of
bound phosphorous called phytates which are not available for digestion in the body
(Dünglehoef et al., 1994). This requires larger amounts of additional enzymes to help
liberate the phosphorous from its bound form, called phytase. Phosphorous is an integral
35
part of maintaining bones, and approximately 85% of the body’s phosphorous is found in
bones (Liesegang et al., 2001). Liesegang et al., (2001) also reported pigs fed a
vegetarian diet had more bone loss, represented by bone mineral density (BMD) and
content (BMC) compared to diets containing fish meal. Since phosphorous is an integral
part of bone, vegetarian diets can potentially lead to skeletal problems and development.
The phytase activity is also dependent on the pH of the environment, and the use of
organic acids in lowering the pH of the stomach may provide some benefits (Kiarie et al.,
2016). Besides phosphorous content, soy protein concentrates which are typically used
have lower amino acid AID and SID than other vegetarian options like potato starch
(Cotton et al., 2016).
5.3 Lactose
Manipulating the ingredients which are included in weaned pig dies changes the
microbiota and the metabolic activities of the pig. Feed ingredients can also change some
of the management and sanitation strategies of feeding equipment as the addition of whey
and lactose in weaned pig diets impact the flow of feed through the feeders and can stick
in harder to clean areas of equipment. This can later be an issue of feeder management
and sanitation because leftover feed can be harboring sites for bacteria. Generally diets
high in lactose or whey are more expensive even though they are incredibly palatable. In
a liquid feeding system, the addition of lactose during phase one (days 1-21) produced
increases in ADG and feed efficiency, and tended to increase ADFI quadratically with
increasing levels of lactose (Yang et al., 2016).
36
However, there are benefits in the addition of lactose within the diet. Diets with
no lactose may interrupt the pH of the stomach because the acidity of the stomach in
nursing piglets is due to the presence of lactic acid produced from lactic acid-producing
bacteria, Lactobacillus (Kiarie et al., 2016). Because of this, it may serve somewhat as a
prebiotic, encouraging the proliferation of certain bacteria because it is the preferred
substrate (Pettigrew, 2006). In addition to manipulating the pH of the stomach, lactose is
a milk sugar and is readily digestible to the young pig. This is mainly due to the presence
of the carbohydrase lactase present in the duodenum and is one of the main enzymes
present in the greatest amount because piglets are on an all milk diet with the sow.
Therefore the ease of transition is increased when complex weaning diets contain lactose
in them and may reduce the instance of post-wean scouring when switching between
diets to more complex carbohydrates. In addition to transition effects, feeding lactose
may encourage the growth of Lactobacilli bacteria which help to make lactic acid, and
can exert some of the same effects as directly feeding an organic acid (Pettigrew, 2006).
Conclusion
In conclusion there are many products being researched in the industry to help
improve the efficiency of pig production. A large reasoning for this is because of the
enactment of the VFD in 2017 which banned the use of antibiotics as a growth promotor
to help increase the return to producers. The use of antibiotics also helped to decrease the
effects of post-weaning lag which can lead morbidity and mortality. Many of these
products including organic acids, probiotics, and essential oils all have different modes of
action, and some of the effects from these substances have not been elucidated yet.
Moreover, many companies are formulating products with blends of these ingredients
37
which may increase the benefits to the pig in a synergistic fashion. However when using
these blends it is much harder to pinpoint which ingredient itself is causing these effects
on health and growth performance or it is in fact a combination which is responsible.
There may also be some interactions between these substances. Additionally, these
blends are very dependent on the dosage, amount of each ingredient, age and health of
the animal, and the environment in which the pig is raised in. Overall, continued research
is needed to truly understand their benefits on health and growth performance in modern
pig production.
Threonine has been research for years and will continue to do so as we
continuously have changing genotypes of pigs which may exhibit various effects on feed
efficiency. The indispensable amino acid, threonine, is considered the second or third
limiting amino acid depending on feed ingredients, and the first limiting amino acid for
maintenance. It is required so highly for maintenance because it comprises a large portion
of mucin, a mucosal protein, which helps protect the lining of the small intestine from
binding pathogens. Besides mucin production, it is also used for maintenance and protein
deposition like the other amino acids. Recent literature has suggested greater growth
performance for pigs raised with higher levels of threonine than the current requirements.
Overall, continued research is needed in this area as well to maintain overall health and
efficient production of pigs.
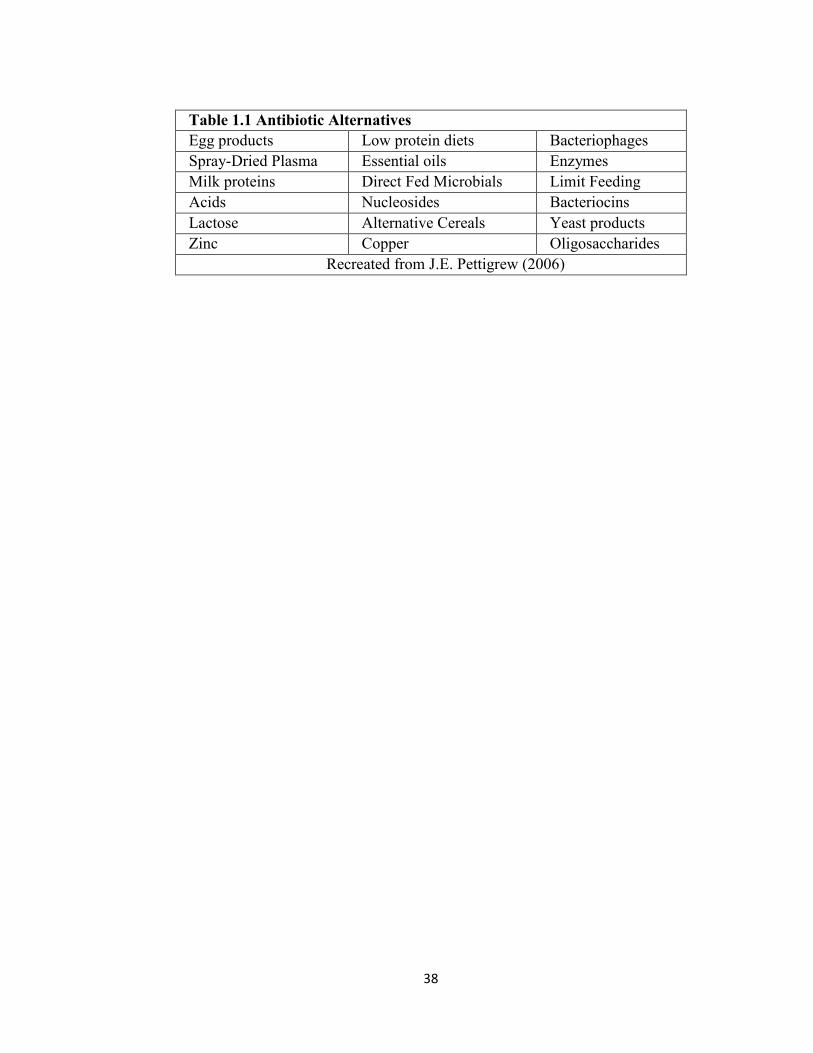
38
Table 1.1 Antibiotic Alternatives Egg products Low protein diets Bacteriophages Spray-Dried Plasma Essential oils Enzymes Milk proteins Direct Fed Microbials Limit Feeding Acids Nucleosides Bacteriocins Lactose Alternative Cereals Yeast products Zinc Copper Oligosaccharides
Recreated from J.E. Pettigrew (2006)
39
CHAPTER II
EVALUATION OF A NUTRITIONAL WATER SUPPLEMENT ON GROWTH
PERFORMANCE OF NURSERY PIGS
A. M. Sawyer*, S. D. Carter*, C. V. Cooper*, P. Aparachita*, M. R. Bible†, and F. B.
Sandberg†
* Oklahoma State University, Stillwater, OK and † Furst-McNess Company, Freeport, IL
Abstract
One-hundred forty weanling pigs (5.26 kg; 20 d of age) were used to determine
the effects of a nutritional water supplement (WB; Furst Water Boost, Furst-McNess
Company, Freeport, IL) on growth performance of nursery pigs. Pigs were randomly
allotted to two water treatments (7 pens/treatment; 10 pigs/pen). The water treatments
were 0 and 62.5 mL WB/L of water (stock solution) supplied by water medicators (1:128
dilution). Pigs were fed simple, corn-soybean meal diets (no plasma or crystalline lactose
utilized) in four dietary phases (Phase 1: d 0-7, Phase 2: d 7-14, Phase 3: d 14-21, and
Phase 4: d 21-42). The water treatments were provided on d 0 through d 3. Pigs and
feeders were weighed weekly to determine ADG, ADFI, and G:F. Water meters were
used to record and calculate water disappearance.
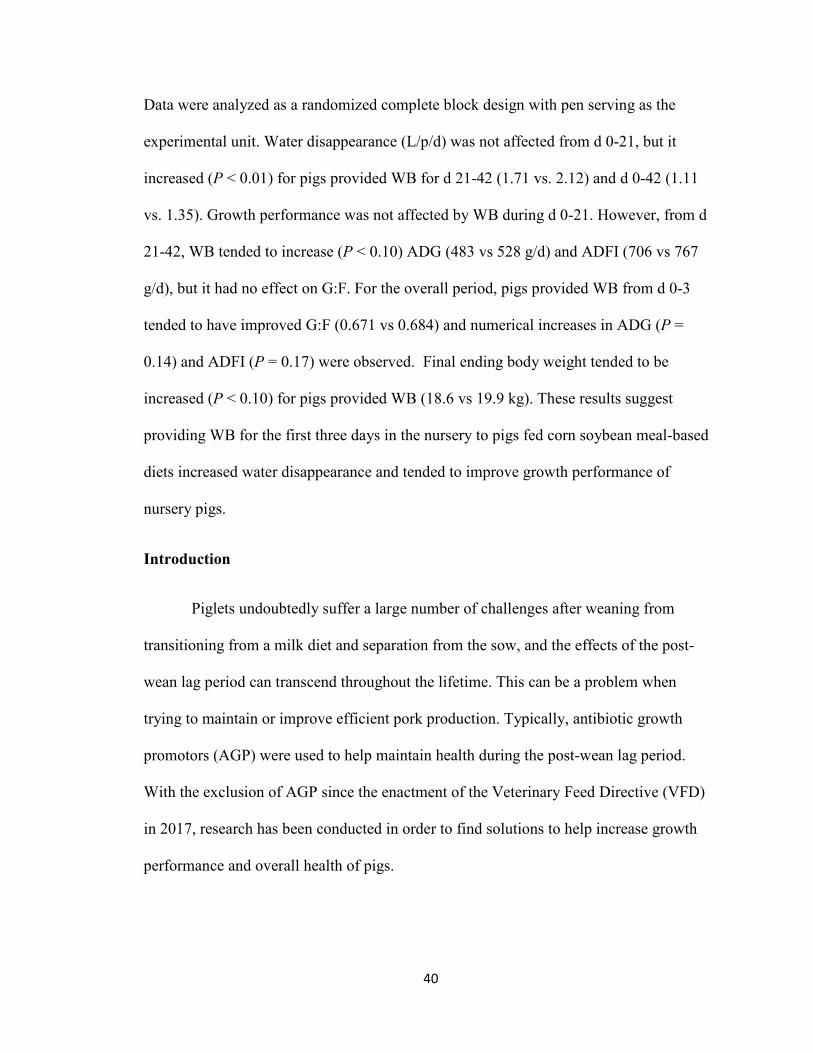
40
Data were analyzed as a randomized complete block design with pen serving as the
experimental unit. Water disappearance (L/p/d) was not affected from d 0-21, but it
increased (P < 0.01) for pigs provided WB for d 21-42 (1.71 vs. 2.12) and d 0-42 (1.11
vs. 1.35). Growth performance was not affected by WB during d 0-21. However, from d
21-42, WB tended to increase (P < 0.10) ADG (483 vs 528 g/d) and ADFI (706 vs 767
g/d), but it had no effect on G:F. For the overall period, pigs provided WB from d 0-3
tended to have improved G:F (0.671 vs 0.684) and numerical increases in ADG (P =
0.14) and ADFI (P = 0.17) were observed. Final ending body weight tended to be
increased (P < 0.10) for pigs provided WB (18.6 vs 19.9 kg). These results suggest
providing WB for the first three days in the nursery to pigs fed corn soybean meal-based
diets increased water disappearance and tended to improve growth performance of
nursery pigs.
Introduction
Piglets undoubtedly suffer a large number of challenges after weaning from
transitioning from a milk diet and separation from the sow, and the effects of the post-
wean lag period can transcend throughout the lifetime. This can be a problem when
trying to maintain or improve efficient pork production. Typically, antibiotic growth
promotors (AGP) were used to help maintain health during the post-wean lag period.
With the exclusion of AGP since the enactment of the Veterinary Feed Directive (VFD)
in 2017, research has been conducted in order to find solutions to help increase growth
performance and overall health of pigs.
41
A large number of products exist on the market to help decrease the effects of
weaning. Some of these products contain probiotics as it has been shown dietary
probiotics have tended to increase final BW, ADG, and ADFI in piglets 22 days post-
weaning (Prieto et al., 2014). It was also reported by Lee et al., (2014), weaned pigs (21
day-old) supplemented with certain strains of probiotics had a greater villous height and
had a greater villous height to crypt depth ratio present in the duodenum, jejunum, and
ileum. These products may also contain yeast fermentation extracts, organic acids, and
flavorings in combination to make it more palatable to the pig and to increase the benefits
in a symbiotic nature. There is also interest in using these products because they are more
“natural” and won’t contribute to heavy mineral deposits within the soils like
pharmacological levels of zinc and copper.
Yeast is also considered a probiotic and it can be administered in a number of
different forms such as whole live yeast cells, heat-treated yeast, ground yeast, purified
cultures, and yeast extracts (Liu et al., 2018). Besides yeast, these combination products
can also contain products or derivatives of yeast such as mannanoligosaccharides,
nucleotides, or ß-glucans (Halas and Nochta, 2012; Shurson, 2018). It was previously
reported piglets fed a yeast product had a reduced incidence of diarrhea and a lower death
rate (Xu et al., 2018). Organic acids or a combination of organic acids have shown
various effects. During a disease challenge, piglets supplemented with organic acids in
feed had a reduced number of S. Typhimurium present in the cecum (Tanaka et al.,
2010).
These nutritional supplements have produced various results in the past because
they vary by type, dosage, environment, processing, and delivery method. If fed in
42
combination, it is harder to elucidate which component of the blend is producing the
results. There also may be an animal effect and can depend on genetics, age of the pig,
diet, environment, and health status. Pigs consume feed seldom after weaning and
transportation stress; therefore water delivery may be beneficial for delivering a
nutritional supplement in supporting gut health.
Producers may also be trying to find ways to decrease the cost of production and
nutrition accounts for a large percentage of producing pigs. The cost of feeding pigs can
be as high as 2/3 of the total cost (Lammers et al., 2008) and inputs containing complex
ingredients like spray-dried plasma, lactose, and fish meal may increase cost of the diets.
Therefore, the objective of this study was to determine the effects of a nutritional
water supplement containing a blend of three strains of probiotic bacteria, organic acids,
a concentrated yeast-based fermentation extract, botanical extracts, and flavors (Furst
Water Boost, Furst-McNess Company, Freeport, IL) on growth performance of nursery
piglets post-weaning while utilizing no antibiotics, lactose, or spray-dried plasma.
Materials and Methods
All methods and procedures for this experiment were reviewed and approved by
the Oklahoma State University International Animal Care and Use Committee (ACUP
approval number AG-16-21). All animal research trials were conducted at the Oklahoma
State Swine Research and Education Center in Stillwater, Oklahoma.
One hundred and forty crossbred piglets (average initial BW = 5.26 kg) were
weaned at 20 days of age and transported to the Oklahoma State University Swine
Research and Education Center in Stillwater, OK. Upon arrival at the research center,
43
pigs were randomly allotted to one of 14 pens consisting of seven replicate pens per
treatment with 10 pigs per pen. The pigs were blocked by initial BW and by litter origin.
After allotment, the pigs were assigned to one of two water treatments which were
provided on days 0 through 3. The water treatments were 0 (Negative control = NC) and
62.5 (WB) ml WB/L of water in a stock solution. Treatments were delivered to the
experimental pens by a water-driven chemical dilution pump (Dosatron, Clearwater, FL)
at a dilution rate of one ounce of stock solution per one gallon of water (1:128). Stock
solution was measured and mixed daily to maintain freshness.
Pigs were fed a common diet throughout the trial which contained no feed-grade
antibiotics. The diets were a simple, corn-soybean meal diet containing no spray-dried
plasma or crystalline lactose in four phases (Phase 1: days 0-7, Phase 2: days 7-14, Phase
3: days 14-21, and Phase 4: days 21-42). Each pen was equipped with an adjustable
stainless steel self-feeder and nipple cup waterer to allow for ad libitum access to feed
and water. The trial lasted for 42 days and the pigs were housed in an environmentally
controlled nursery facility with slatted, plastic flooring and with a starting initial
temperature of 31.1°C. The temperature was reduced weekly for the next five weeks until
it reached 24.4°C.
To determine growth performance, pens and feeders were weighed weekly to
determine BW, average daily gain (ADG), average daily feed intake (ADFI), and gain to
feed ratio (G:F). Piglets were ear-tagged and weighed individually at days 0, 21, and 42
to gauge individual piglet performance. Water meters were utilized in every pen to
measure water disappearance and calculate average daily water intake (ADWI). Water
meter readings were read and recorded daily between the hours of 0600 and 0800 to

44
maintain consistent readings and intake. Health status of the pens were monitored,
recorded, and presented as percent removal, mortality, and number of pigs treated.
Statistical Analysis
All data collected were analyzed in a randomized complete block design using the
MIXED procedure of SAS (SAS Institute, Inc., Cray, NC) with pen serving as the
experimental unit. The variability of data was represented as the standard error of the
mean (SEM). Differences between treatments were considered significant at P ≤ 0.05 and
a tendency at P > 0.05 and P ≤ 0.10.
Results
Water boost supplementation on growth performance is outlined in Table 2.1.
Water Boost supplementation did not affect piglet BW (8.18 vs. 8.62 kg) on day 21;
however, WB supplementation tended to improve (P < 0.10; 18.65 vs. 19.93) final BW
on day 42. There was no effect (P > 0.10) of WB on growth performance (ADG; 126 vs.
139, ADFI; 199 vs. 209 g/d, ADWI; 0.57 vs. 0.65 L/p/d , and G:F; 0.632 vs. 0.666)
during phase 1 (days 0 – 21). Feed efficiency (G:F) was not affected (P > 0.10; 0.683 vs.
0.690) by supplementation during phase 2 (days 21 – 42); however, there was a tendency
(P ≤ 0.10) to improve ADG (482 vs. 528 g/d) and ADFI (706 vs. 766 g/d).
Average daily water intake (1.71 vs. 2.12 L/p/d) was significantly improved (P ≤
0.01) during phase 2 using WB. For the overall period (days 0 – 42), G:F tended (P <
0.10; 0.671 vs. 0.684) to improve and ADWI (1.11 vs. 1.35 L/p/d) was significantly
increased (P ≤ 0.01) with WB.
45
Discussion
In the literature there have been variable results with the use of nutritional feed
and water supplements. Feed supplements have been more common in past research
regarding the use of the nutritional supplements than water. Using Furst Water Boost will
increase the cost of production due to the need of the dilution pumps and the cost of the
product. However, at the conclusion of the trial, WB supplementation tended to produce
a heavier pig. Additionally, there was also a tendency to increase ADG and ADFI during
Phase 2 and overall feed efficiency. From past research, weaned piglets supplemented
with probiotics improved feed efficiency (Alexopoulos et al., 2004). In agreement with
others, this result was also seen by Cai et al., (2015) who also reported improvements in
ADG 14 days post-weaning and improved G:F for piglets supplemented with probiotics.
In contrast to these results, Walsh et al., (2012) found no improvements in growth
performance except for ADG when supplemented with B. subtilis and B. licheniformis.
The variable results may be due to the fact there is a large effect of strain-specific
properties, and its ability to produce positive results in the animal can be influenced by
dosage, feed composition, age, or disease-state (Liu et al., 2018). The increase in ADWI
throughout all periods of this study may be explained by the consumption behavior of
pigs post-weaning. It has been shown previously there was increased drinking behavior
after weaning as the pigs might be trying to achieve fullness in the absence of milk from
the sow (Dybkjaer et al., 2006).
Besides WB being a source of direct-fed microbials, WB is also a source of
organic acids and plant extracts or essential oils. Organic acids have long been researched

46
for their improvements in BW gain and feed efficiency due to their properties in
increasing nutrient digestion. Particularly, organic acids are thought to decrease the
gastric pH of the stomach, making it a favorable environment for the activation of
pepsinogen to pepsin since it is active in lower environmental pH (Partanen and Mroz,
1999). Essential oils are thought to have some antimicrobial and antioxidant properties
(Costa et al., 2013). When a combination of organic acids and essential oils were
supplemented to pigs, it was reported there were no significant differences in ADG,
ADFI, and G:F for any of the phases or the overall trial period (Kommera et al., 2006).
Results are dependent on the blends of ingredients, and Kommera et al., (2006) used
lactic acid and phosphoric acid. Propietary blends such as Furst Water Boost are hard to
elucidate which combination of ingredients produces the best results because many of
them produce different effects in vivo, but other blends of acids in the past (fumaric,
citric, and malic) paired with a medium-chain fatty acid produced positive results in
growth performance (Udaphaya et al., 2018).
There may also be a large effect of the diet. The diets in this study were largely
plant-based, and contained no spray dried plasma or lactose. Even though diets with
animal protein and lactose ingredients are highly palatable and may make the transition to
complex plant carbohydrates easier, the inclusion of these ingredients can be expensive.
Feeding is largely the number one most expensive input in rearing pigs, and can account
for approximately 2/3 of the total cost (Lammers et al., 2008). Therefore, inclusion of
complex ingredients in weaned piglet diets can impact sustainable pork production. But it
was shown by Yang et al., (2016) inclusion of lactose significantly increased ADG and
feed efficiency the first 21 days after weaning. Vegetarian diets are one option in looking
47
to decrease the cost of the diet, but may also contain anti-nutritional factors such as
trypsin inhibitors which may impact protein digestion (Baker, 2000). It has also been
discussed by Partanen and Mroz (1999) diets that contained mostly plant protein sources
had greater effects on growth performance due to a higher acidification of the feed than
diets with no additions of lactose or milk products. However, when given the choice
between acidified and non-acidified diets, pigs would readily consume significantly more
of the non-acidified diet (Henry et al., 1985).
Conclusions
In conclusion, the addition of Furst Water Boost was shown to improve BW,
ADG, ADFI, ADWI, and feed efficiency when supplemented to pigs immediately post-
weaning and when fed simple, corn-soybean meal diets devoid of animal proteins and
lactose. Proprietary blends of products are difficult to elucidate which ingredient is
producing the results. Therefore, additional research is needed in the area of these
combination products and their individual ingredients in order to further understand their
specific effects on health and performance. Additionally, it would also be important to
understand at which level of inclusion would be most beneficial to the pig and if these
same effects are occurring when the weaned piglets are fed complex and palatable diets
in order to ease the transition during weaning. Moreover, piglets may have not have had
sufficient supplementation with this nutritional water supplement as supplementation
lasted only three days post-weaning, and piglets may have not consumed it in sufficient
quantities since they are introduced to new, environmental stressors. Therefore increased
days of supplementation may be more beneficial. Overall, when fed vegetarian diets

48
containing no addition of lactose, Furst Water Boost has the potential to increase growth
performance during the nursery phase when fed no antibiotics.

49
Table 2.1. Water Boost supplementation on growth performance of nursery piglets1
Item Treatments2
SEM P-value NC WB
No. of pigs 70 70 -- -- Replicates 7 7 -- -- BW3, kg
d 0 5.27 5.26 0.081 0.89 d 21 8.18 8.62 0.254 0.27 d 42 18.65a 19.93b 0.454 0.09
ADG4, g/d
d 0-21 126 139 8.62 0.21 d 21-42 482a 528b 16.33 0.09 d 0-42 296 324 12.25 0.14
ADFI5, g/d
d 0-21 199 209 9.98 0.43 d 21-42 706a 766b 22.23 0.10 d 0-42 441 473 15.88 0.18
G:F6
d 0-21 0.632 0.666 0.024 0.22 d 21-42 0.683 0.690 0.008 0.56 d 0-42 0.671a 0.684b 0.006 0.09
ADWI7, L/p/d d 0-21 0.57 0.65 0.03 0.11 d 21-42 1.17a 2.12b 0.09 0.01 d 0-42 1.11a 1.35b 0.05 0.01
1Means for 7 pens/trt 2 NC = Negative Control and WB = 62.5 ml Water Boost supplementation. 3Body Weight 4Average Daily Gain 5Average Daily Feed Intake 6Gain to Feed Ratio 7Average Daily Water Intake a,bValues in a row with different superscripts differ
50
CHAPTER III
EVALUATION OF VARYING LEVELS OF A NUTRITIONAL WATER
SUPPLEMENT ON GROWTH PERFORMANCE OF NURSERY PIGS FED
COMPLEX DIETS WITHOUT ANTIBIOTICS
A.M. Sawyer*, S. D. Carter*, P. Aparachita*, J. A. Harshman*, M. R. Bible†, and F. B.
Sandberg†
*Oklahoma State University, Stillwater, Ok, and †Furst-McNess Company, Freeport, IL
Abstract
Recently we reported administering a nutritional water supplement (d 0-3) via
drinking water (62.5 ml WB/L water) tended to improve final BW, ADG, G:F, and
average daily water disappearance (ADWD) of nursery pigs fed simple corn-soybean
meal diets. To evaluate the effects of additional amounts of this water supplement (WB;
Water Boost, Furst-McNess Company, Freeport, IL), 260 crossbred pigs (5.16 kg BW; 18
d of age) were randomly allotted to four water treatments (7 pens/treatment, 9 to 10
pigs/pen). Water treatments were 0, 31.7, 63.4, and 95.1 ml WB/L water (stock solution)
delivered through water medicators (1:128 dilution).
51
Pigs were fed a complex nursery diet without in-feed antibiotics in four phases (Phase 1:
d 0-7, Phase 2: d 7-14, Phase 3: d 14-21, and Phase 4: d 21-42). Water treatments were
provided on d 0 – 7. Pigs and feeders were weighed weekly to determine ADG, ADFI,
and G:F. Water meters were recorded daily to measure ADWI. Water Boost improved
(linear, P < 0.05) ADWI (L/p/d) for d 0 – 21 (2.66, 3.16, 3.21, and 3.16), d 21 – 42 (7.89,
8.58, 8.61, and 9.21), and for the overall period (5.19, 5.76, 5.77, and 6.06). However,
there was no difference (P > 0.10) in ADG. Supplementation of WB decreased
(quadratic, P < 0.05) ADFI (g/d) for d 21 – 42 (718, 688, 672, and 716), and tended (P <
0.10) to decrease ADFI during the overall period (481, 468, 453, and 484).
Supplementation of WB improved (quadratic, P < 0.05) G:F between d 21 – 42 (0.76,
0.80, 0.81, and 0.78) and for the overall period (0.77, 0.80, 0.81, and 0.79). These data
suggest supplementing WB for the first 7 d post-weaning improved water intake (16.7%)
and G:F (5.2%) for the overall nursery period.
Introduction
Nutritionists are continuously trying to manipulate the diet in order to increase
growth performance and health of pigs. In today’s production systems, piglets are weaned
earlier than what may occur naturally in the wild and this can be due to the goals of the
operation in their female herd in terms of reproductive performance. This challenges the
young pig as they are removed abruptly from the sow, and may be transported to a new
nursery or wean to market facility. In addition to these types of stressors, piglets are
quickly introduced to a solid diet which may disrupt gut function or integrity. This results
in a post-weaning lag period and can result in severe diarrhea, increased morbidity, or
even mortality. With the exclusion of antibiotic growth promotors which has typically
52
been used to help combat the negative effects of the post-weaning lag period, new
solutions have been proposed to mitigate the negative outcomes of the weaning event.
Some of these new solutions are feed and water additives which are becoming an
increasingly popular solution to promote health and growth performance. These feed
additives typically contain organic acids, probiotics, yeast, or a combination with
flavorings to benefit the animal because of their individual and synergistic effects when
added together. In the past, research has shown the addition of organic acids may enhance
growth performance and functions of the gastrointestinal tract through reducing post-
weaning diarrhea and modulating the gut microflora (Gerritsen et al., 2010). Modulation
of the gut microflora can occur through changing of the stomach pH which results in a
less than optimal environment for certain strains of bacteria to live in (Pettigrew, 2006).
This may also be the mode of action of organic acids in which it helps with protein
digestion, since pepsin, the active form of pepsinogen, is usually activated at a lower pH
(Partanen and Mroz, 1999).
Probiotics have also been researched because they can confer a health benefit to
the host (FAO/WHO, 2001). Some of these benefits on the host include modulation of the
gut microbes, improvement of the intestinal development, and immunomodulation (Liu et
al., 2018). The results from using probiotics have been inconsistent as there are main
strains of probiotic bacteria which may be used. One of the popular strains of bacteria is
Bacillus which is found naturally within the soil (Dowarah et al., 2017). In addition to
organic acids and probiotics, yeast may provide some insoluble components by the pig,
but may provide an energy source for the gut microbes (Shurson, 2018), however these
results are largely dependent on a number of factors like duration of dosage, amount of
53
supplementation, combinations with other components, and the state of the animal it is
being fed to (Song et al., 2014). There may also be some benefits in adding essential oils
to the diets or water to not only increase the palatability and likelihood the animals will
ingest it, but also because it has been found some essential oils can control some enteric
diseases in pigs (Stein and Kil, 2007).
Like previously mentioned, the results of these combinations can be inconsistent
because of the inherent properties of each component, their interactions, and their effects
on the host since each animal can provide a different environment.
In a previous study we reported improvements in growth performance of nursery
pigs when supplemented with a nutritional water supplement. Therefore, the objective of
this study was to evaluate the effects of a varying levels of a nutritional water supplement
containing a blend of three strains of probiotic bacteria, organic acids, a concentrated
yeast-based fermentation extract, botanical extracts, and flavors (WB: Furst Water Boost,
Furst-McNess Company, Freeport, IL) on growth performance of nursery piglets post-
weaning while utilizing no antibiotics; but fed complex diets containing animal proteins
and lactose.
Materials and Methods
All methods and procedures for this experiment were reviewed and approved by
the Oklahoma State University International Animal Care and Use Committee (ACUP
approval number AG-16-21). All animal research trials were conducted at the Oklahoma
State Swine Research and Education Center in Stillwater, Oklahoma.
54
In order to elucidate the effects of additional levels of a nutritional water
supplement (WB; Furst Water Boost, Furst-McNess Company, Freeport, IL), 260
crossbred piglets were transported to the Oklahoma State University Swine Research and
Education Center in Stillwater, OK. The pigs were weaned at 18 days of age and had an
initial starting BW of 5.16 kg. Upon arrival to the facility, piglets were allotted to one of
28 experimental pens based on ancestry, starting BW, and sex. There were nine to 10 pigs
per pen: with either 10 barrows, five barrows and five gilts, four barrows and five gilts, or
five barrows and five gilts assigned to each pen. Once divided, piglets were randomly
allotted to one of four experimental water treatments with seven replicate pens per
treatment. Between the four treatments, there were 65 piglets per treatment.
Water treatments were mixed as a stock solution and contained 0 (NC = Negative
Control), 31.7, 63.4 and 95.1 ml WB/Liter of water mixed in a stock solution. The
treatments were provided to the pigs on days 0 through 7 and were delivered to the pens
through water medicators (Dosatron, Clearwater, FL) at a dilution rate of one ounce of
stock solution per 128 ounces (gallon) of water (1:128). The stock solution was mixed
every other day (on days 0, 2, 4, and 6) regardless of the remaining level of the stock
solution in order to maintain freshness of the stock solution.
Piglets were fed a common diet throughout the trial period which consisted of a
complex corn-soybean meal based diet which also contained lactose and animal protein
sources such as fish meal, spray-dried porcine plasma, and blood cells. The complex diets
were provided in four phases (Phase 1: days 0 – 7, Phase 2: days 7 – 14, Phase 3: days 14
– 21, and Phase 4: days 21 – 41). None of the diets throughout the entire period contained

55
antibiotics. An ingredient composition of formulated diets is listed in Table 3.1. An
analyzed composition of the dietary phases is listed in Table 3.2.
The whole trial lasted for 42 days and the piglets were housed in an
environmentally controlled building with mechanical ventilation and plastic, fully slatted
flooring. Piglets had ad libitum access to feed and water in each pen through a stainless
steel adjustable self-feeder and a nipple cup waterer. Feed wastage was noted and
recorded. The environment of the building was managed through a digital system and the
temperature of the unit was maintained at 31.1°C at the arrival of the animals, and
eventually decreased every week for the next five weeks until it reached 24.4°C and upon
completion of the trial.
Growth performance was measured through weighing of pens, feeders, and
number of pigs on a weekly basis (days 0, 7, 14, 21, 28, 35, and 42). Feed disappearance
was calculated based on starting feeder weight, feed fed, and total weight of feeder minus
the initial feeder weight to measure feed left in the feeder. Additionally, pigs were ear-
tagged with an individual identification tag at day 0 and were individually weighed on
days 0, 7, 21, and 42 to track individual pig progress. Growth performance was
determined based on average daily gain (ADG), average daily feed intake (ADFI), and
feed conversion (G:F). Water meters were utilized in every pen to measure average daily
water intake (ADWI). Health status was monitored and recorded throughout. Water meter
readings were read and recorded every morning between the hours of 0700 and 0900 to
maintain consistent daily intake and recording.
56
Statistical Analysis
All data was analyzed in a randomized complete block design using the MIXED
procedure of SAS (SAS Institute, Inc., Cray, NC) with pen serving as the experimental
unit. Orthogonal polynomial contrasts were conducted to determine the linear, quadratic,
and the negative control versus WB supplementation effects for increasing levels of WB
supplementation. Variation of the data was represented as the standard error of the mean
(SEM). Differences between treatments were considered significant at P ≤ 0.05 and a
tendency at P > 0.05 and P ≤ 0.10.
Results
Effects of Furst Water Boost supplementation on growth performance of nursery
pigs is outlined on Table 3.3. During phase 1 (days 0 – 21) ADG, ADF, and G:F were
not affected by WB supplementation (P > 0.10). However, there were numerical
improvements with increasing levels of WB (ADG = 199, 210, 204, and 214 g/d; ADFI =
260, 265, 256, and 270 g/d; G:F = 0.764, 0.792, 0.797, and 0.782). There were numerical
differences in BW (9.36, 9.59, 9.43, and 9.66 kg). Average daily water intake (L/p/d)
increased significantly (linear, P < 0.05: 2.66, 3.16, 3.21, and 3.16) with increasing
amounts of WB; and there was a significant difference (P < 0.01) between the NC and
WB supplementation.
Between days 21 and 42 (phase 2), there were significant decreases in ADFI
(quadratic, P < 0.05; 718, 688, 672, and 716 g/d) as supplementation of WB increased.
There were no effects (P > 0.10) on ADG but there were numerical improvements (551.0,
551, 549, and 565 g/d). Additionally, there were improvements (quadratic, P < 0.05;
57
0.766, 0.801, 0.815, and 0.787) in G:F with increasing WB supplementation; and an
improvement (P < 0.05) in feed efficiency between the NC treatment and WB
supplementation. There were also significant (linear, P < 0.05) differences in ADWI
between the groups (7.89, 8.58, 8.61, and 9.21 L/p/d), and a tendency (P < 0.10) to
increase water intake between the NC and WB supplemented pigs. Finally, were no
significant differences (P > 0.10) for BW for this period but there were numerical
differences between treatments (20.38, 20.62, 20.36, and 20.96 kg).
For the overall period (days 0 – 42), there were numerical improvements in ADG
(370, 376, 371, and 385 g/d). Similar to phase 2, there were no significant differences (P
> 0.10) for ending BW but there were slight numerical improvements for the overall
nursery period (20.38, 20.62, 20.36, and 20.96 kg). Water Boost supplementation had a
tendency to decrease ADFI (quadratic, P < 0.10; 481, 468, 453, and 484 g/d). Piglets
consumed more water (linear, P < 0.05; 5.19, 5.76, 5.77, and 6.06 L/p/d) with increasing
levels of WB, and there was a significant difference (P < 0.05) in water consumption
between the NC and pigs supplemented with WB. Feed efficiency improved with
additional WB supplementation (quadratic, P < 0.05; 0.770, 0.804, 0.818, and 0.793), and
there was a significant difference (P < 0.05) in G:F between the NC and the WB
supplemented pigs.
Discussion
It was previously reported by our lab supplementation of WB for three days
helped to improve ADG, ADFI, ADWI, and feed efficiency for nursery piglets
immediately post-weaning against a negative control. For this experiment,
58
supplementation of WB occurred over a longer period of time and lasted a total of seven
days immediately after post-weaning and allotment to treatments. In this experiment,
piglets were exposed for a longer period of time to WB, and it was previously suggested
supplementation of organic acids was optimal for the first two to four weeks after
weaning (Giesting et al., 1991). Therefore, the increased exposure to seven days could
increase the exposure of the pigs to its potential benefits. Obvious improvements have
been made since then in genetics and efficiency, but it is worth researching further if
continued supplementation of a nutritional water supplement may prove beneficial when
provided to animals for a longer period of time as they become accustomed to the
environment. It is worth noting, however, with continued supplementation into the
growing and finishing periods lower feed efficiency has been reported which may due to
the gastrointestinal microflora balance was already sufficient in a later, more
physiologically matured animal (Alexopoulos et al., 2014).
Nutritional water supplement ingredients may provide some benefits which is
dependent on the amount of inclusion and the interaction of ingredients. As previously
mentioned, Furst Water Boost is a blend containing three strains of probiotic bacteria,
organic acids, a concentrated yeast-based fermentation extract, botanical extracts, and
flavors. The dosage of probiotic bacteria is dependent on a number of factors, but
probiotic supplementation, in particular yeast, is recommended to be around 109 colony
forming units (CFU) per kg of feed (Simon, 2005). This amount may shift depending on
if it is a water-delivered product such as the case with WB. It is also important to note
supplementation with other compounds like essential oils or components containing
cinnamon, oregano, thyme, and clove can inhibit the growth of certain bacterial species
59
which could potentially impact performance (Sivropoulou et al., 1996; Özcan et al.,
2006).
An improvement in feed efficiency with the inclusion of nutritional products has
been reported by previous research. When supplemented with a B. subtilis based
probiotic, there have been reported improvements in feed efficiency compared to
negative control diets during days 1 – 14 and for the overall period (days 1 – 28 post-
weaning) compared to negative control pigs (Hu et al., 2014). This is in slight agreeance
with our results in which we recorded significant improvements in G:F for the overall
period with the presence of WB supplementation. We recorded an increase in G:F, which
is in agreeance to results in which in feed conversion was improved in piglets
supplemented with a marine-derived B. pumilus probiotic as opposed to an antibiotic
medicated feed; and it also tended to improve ADG and ending BW at day 22 (Prieto et
al., 2014).
Feed intake was also significantly decreased quadratically with WB
supplementation during phase two, and tended to decrease quadratically for the overall
period. The effects of WB on feed intake weren’t recorded as severe during the first 21
days of the experiment. During these periods of impacted feed intake, feed consumption
increased with the 95.1 ml dose, which may propose higher doses of nutritional water
supplements may be beneficial in promoting feed intake. This result may be due to a
carry-over effect in the later nursery from supplementing in the early nursery phase and
helping to establish the gut microflora with the high dosage. Ahmed et al., (2014) also
reported increases in ADFI through 28 days post-weaning when supplemented with a
blend of B. subtilis and B. licheniformis.
60
With the increasing doses of WB, in particular the 95.1 ml treatment, there was an
odor detected in the treatment pens from the water bowls. Water intake increased
significantly during phase one which included the timing of supplementation of WB and
during the overall period. It was previously discussed the addition of essential oils may
increase the consumption of feed in pigs. Strong smells of these particular extracts may
cause a gustatory response because of their effects on olfactory nerves and taste buds
(Costa et al., 2013). Since pigs readily consume water after becoming familiar with their
environment to maintain a feeling of satiety (Dybkjaer et al., 2006), water intake may
have increased due to the sensory properties of this product.
Pigs remained relatively in good health throughout the trial and were administered
no deliberate health challenges. However, it may prove beneficial to elucidate the true
health effects of WB supplementation on biological parameters to understand the true
effects of this product on health characteristics. Novel sampling to gauge pig health can
be in the form of fecal scores. While no fecal scores were observed in this trial, an
inclusion of plant extracts containing capsicum oleoresin, garlic, or turmeric oleoresin,
have been observed to decrease the diarrhea score of piglets from days 3 to 5, and days 9
to 11, and for the overall period post-infection of an E. coli challenge (Liu et al., 2013).
Conclusion
In conclusion, WB supplementation was shown to numerically improve overall
BW even though there were no significant differences recorded throughout. There were
no significant differences in feed efficiency or growth performance (ADG, ADFI, G:F)
during the first period, but there were numerical differences with the highest performing

61
group being the pigs in the 63.4 ml treatment. During phase two and for the overall
period, feed intake decreased quadratically with increased WB supplementation.
Moreover, piglets supplemented with the 95.1 ml dose gained the most daily, particularly
in the last two periods. Feed efficiency was affected quadratically for all phases, and was
significant in the second phase and for the overall period. In all of these phases, G:F was
optimized at 63.4 ml WB. Water intake was significantly improved for phase one, two,
and for the overall period with the inclusion of WB overall.
With the compounding effects of these nutritional supplements, it would be
pertinent to understand their overall mechanisms. Thus, more research is needed in this
area to understand the compounding effects of dietary inclusions. This may include
further supplementation of this product and its effects on biological parameters besides
growth characteristics such as blood and fecal samples as it relates to the modern pig and
its feeding strategies. Furthermore, there is a need to understand the best mode of
delivery of these supplements to gauge the most appropriate delivery of them so they are
best delivered to the host to elicit their desired effects.
Overall, WB supplementation produced a 16.7% increase in water intake, and a
5.2% increase in feed efficiency when supplemented during the nursery period, and
further research is warranted to understand the effects of nutritional supplement blends.
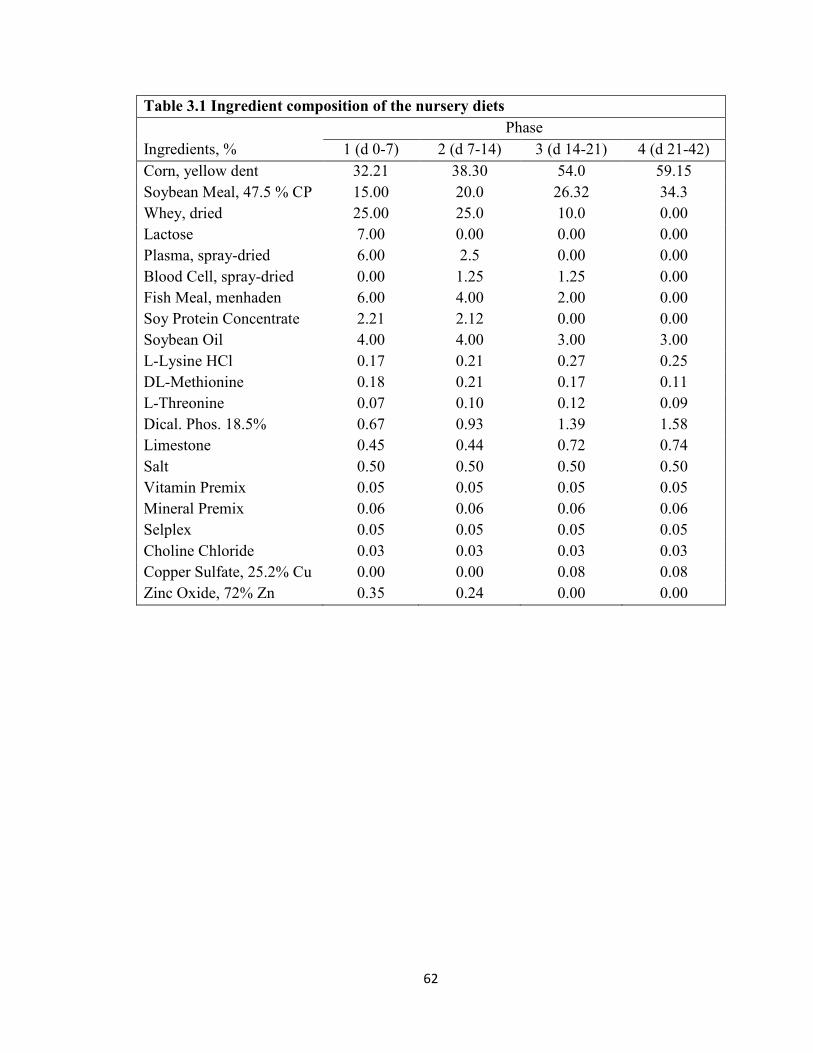
62
Table 3.1 Ingredient composition of the nursery diets
Ingredients, % Phase
1 (d 0-7) 2 (d 7-14) 3 (d 14-21) 4 (d 21-42) Corn, yellow dent 32.21 38.30 54.0 59.15 Soybean Meal, 47.5 % CP 15.00 20.0 26.32 34.3 Whey, dried 25.00 25.0 10.0 0.00 Lactose 7.00 0.00 0.00 0.00 Plasma, spray-dried 6.00 2.5 0.00 0.00 Blood Cell, spray-dried 0.00 1.25 1.25 0.00 Fish Meal, menhaden 6.00 4.00 2.00 0.00 Soy Protein Concentrate 2.21 2.12 0.00 0.00 Soybean Oil 4.00 4.00 3.00 3.00 L-Lysine HCl 0.17 0.21 0.27 0.25 DL-Methionine 0.18 0.21 0.17 0.11 L-Threonine 0.07 0.10 0.12 0.09 Dical. Phos. 18.5% 0.67 0.93 1.39 1.58 Limestone 0.45 0.44 0.72 0.74 Salt 0.50 0.50 0.50 0.50 Vitamin Premix 0.05 0.05 0.05 0.05 Mineral Premix 0.06 0.06 0.06 0.06 Selplex 0.05 0.05 0.05 0.05 Choline Chloride 0.03 0.03 0.03 0.03 Copper Sulfate, 25.2% Cu 0.00 0.00 0.08 0.08 Zinc Oxide, 72% Zn 0.35 0.24 0.00 0.00
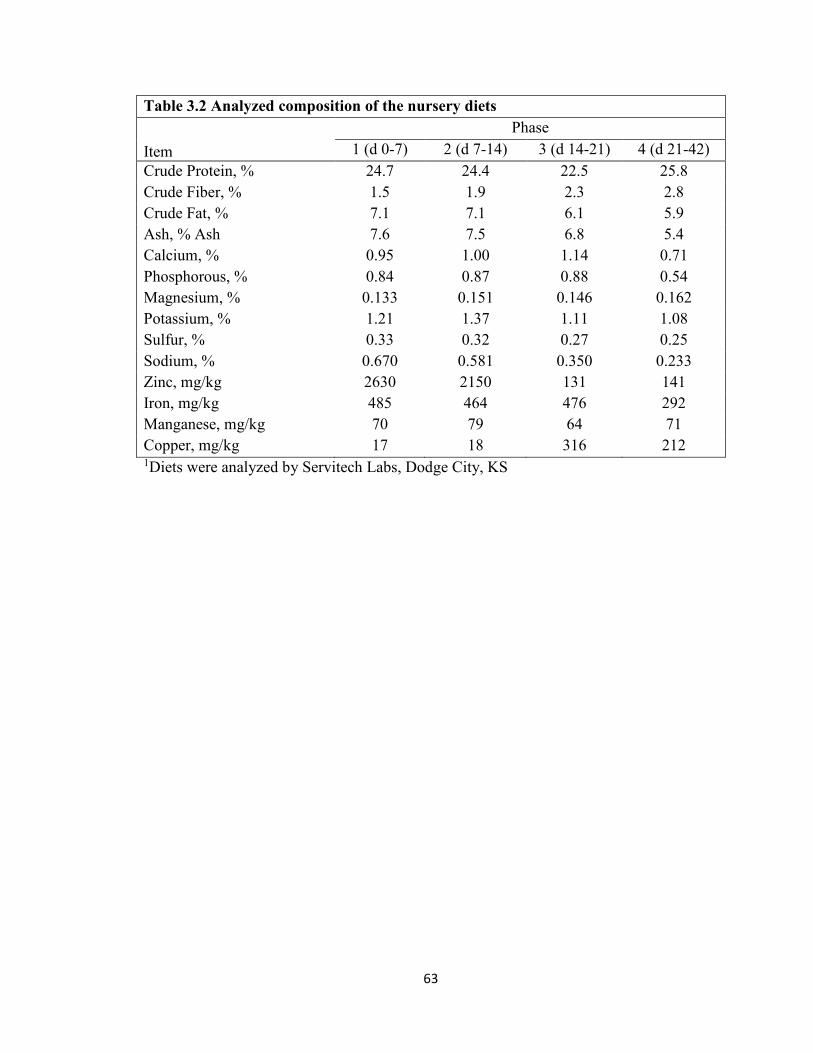
63
Table 3.2 Analyzed composition of the nursery diets
Item
Phase 1 (d 0-7) 2 (d 7-14) 3 (d 14-21) 4 (d 21-42)
Crude Protein, % 24.7 24.4 22.5 25.8 Crude Fiber, % 1.5 1.9 2.3 2.8 Crude Fat, % 7.1 7.1 6.1 5.9 Ash, % Ash 7.6 7.5 6.8 5.4 Calcium, % 0.95 1.00 1.14 0.71 Phosphorous, % 0.84 0.87 0.88 0.54 Magnesium, % 0.133 0.151 0.146 0.162 Potassium, % 1.21 1.37 1.11 1.08 Sulfur, % 0.33 0.32 0.27 0.25 Sodium, % 0.670 0.581 0.350 0.233 Zinc, mg/kg 2630 2150 131 141 Iron, mg/kg 485 464 476 292 Manganese, mg/kg 70 79 64 71 Copper, mg/kg 17 18 316 212 1Diets were analyzed by Servitech Labs, Dodge City, KS
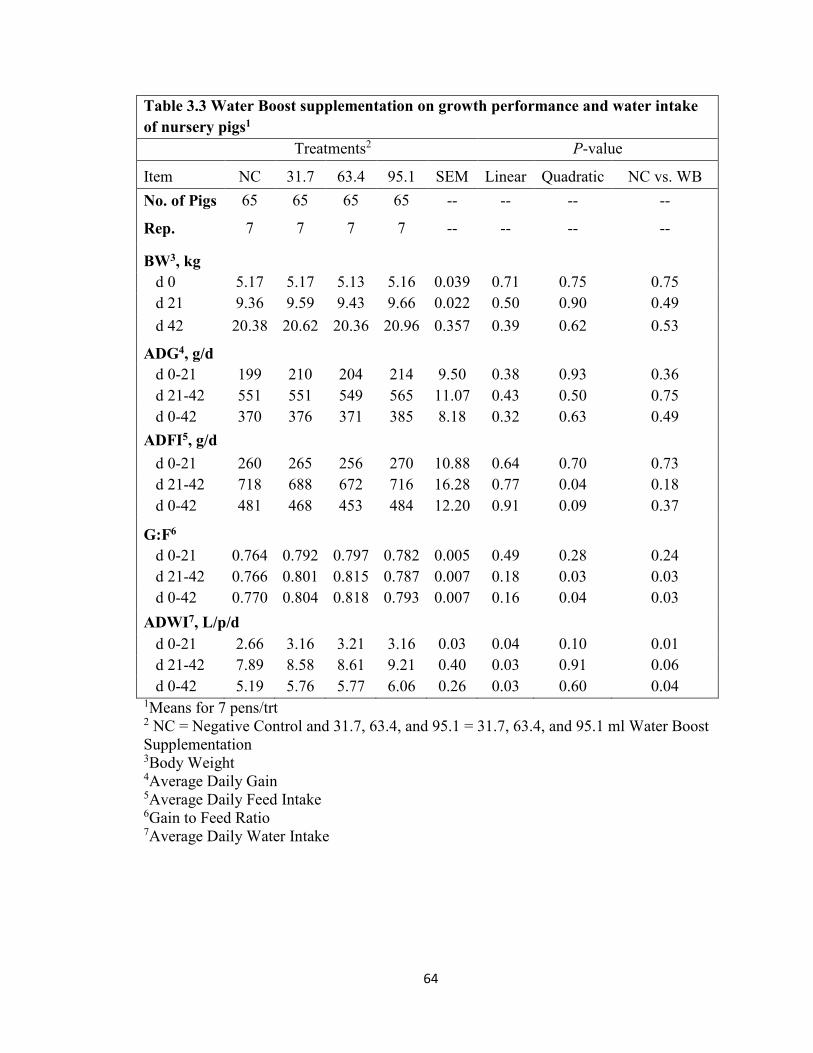
64
Table 3.3 Water Boost supplementation on growth performance and water intake
of nursery pigs1
Treatments2 P-value
Item NC 31.7 63.4 95.1 SEM Linear Quadratic NC vs. WB
No. of Pigs 65 65 65 65 -- -- -- --
Rep. 7 7 7 7 -- -- -- --
BW3, kg
d 0 5.17 5.17 5.13 5.16 0.039 0.71 0.75 0.75 d 21 9.36 9.59 9.43 9.66 0.022 0.50 0.90 0.49
d 42 20.38 20.62 20.36 20.96 0.357 0.39 0.62 0.53
ADG4, g/d d 0-21 199 210 204 214 9.50 0.38 0.93 0.36 d 21-42 551 551 549 565 11.07 0.43 0.50 0.75 d 0-42 370 376 371 385 8.18 0.32 0.63 0.49
ADFI5, g/d
d 0-21 260 265 256 270 10.88 0.64 0.70 0.73 d 21-42 718 688 672 716 16.28 0.77 0.04 0.18 d 0-42 481 468 453 484 12.20 0.91 0.09 0.37
G:F6 d 0-21 0.764 0.792 0.797 0.782 0.005 0.49 0.28 0.24 d 21-42 0.766 0.801 0.815 0.787 0.007 0.18 0.03 0.03 d 0-42 0.770 0.804 0.818 0.793 0.007 0.16 0.04 0.03
ADWI7, L/p/d d 0-21 2.66 3.16 3.21 3.16 0.03 0.04 0.10 0.01 d 21-42 7.89 8.58 8.61 9.21 0.40 0.03 0.91 0.06 d 0-42 5.19 5.76 5.77 6.06 0.26 0.03 0.60 0.04
1Means for 7 pens/trt 2 NC = Negative Control and 31.7, 63.4, and 95.1 = 31.7, 63.4, and 95.1 ml Water Boost Supplementation 3Body Weight 4Average Daily Gain 5Average Daily Feed Intake 6Gain to Feed Ratio 7Average Daily Water Intake
65
CHAPTER IV
EFFECTS OF THREONINE TO LYSINE RATIOS ON GROWTH PERFORMANCE
OF NURSERY PIGS
A. M. Sawyer, S. D. Carter, C. V. Cooper, P. Aparachita, and J. A. Harshman
Oklahoma State University, Stillwater, OK
Abstract
To evaluate the effects of increasing threonine to lysine ratios, two experiments
were conducted to elucidate the effects of increasing threonine to lysine ratios on growth
performance of nursery pigs. Experiment 1 utilized 270 crossbred pigs with a starting
BW of 5.94 kg, and experiment 2 used 270 crossbred pigs with an initial BW of 5.70 kg.
Piglets were randomly allotted to one of 27 pens and to three dietary treatments for a total
of 42 d based on initial BW and litter of origin. Piglets were weaned at an approximate
age of 18 d for both studies. There were 9 replicates per treatment with 10 piglets per pen
for both studies for a total of 540 piglets. Dietary treatments were 60, 62.5, and 65%
threonine:lysine formulated on a SID digestible basis. Pigs and feeders were weighed
weekly to determine growth performance indicated as ADG, ADFI, and G:F. Water
meters were utilized and recorded daily to measure ADWI. With increasing levels of
66
threonine there was no effect on BW between d 0 – 21, or d 21 – 42, however there were
numerical improvements for these phases. During the overall nursery period at d 42, there
was a tendency to quadratically improvement final BW. Throughout all phases of the
experiments, there were no effects (P > 0.10) on G:F. However, there were numerical
improvements in feed efficiency during d 0 – 21. Additionally, there was no effect (P >
0.10) on ADWI throughout the trial period, however there were numerical improvements
during d 21 – 42 (2.48, 2.52, and 2.62 L/p/d) and for the overall period (1.76, 1.79, and
1.82 L/p/d). During d 0 – 21, there was a tendency to quadratically improve ADG, (P <
0.10; 255, 267, and 253 g/d) and ADFI (P < 0.10; 310, 321, and 306). In phase 2 (d 21 –
42), there were numerical improvements in ADG (539, 561, and 557 g/d), and a
significant improvement (linear, P = 0.05) in ADFI (754, 792, and 790 g/d). For the
overall period (d 0 – 42), there was a tendency to quadratically increase ADG (P < 0.10;
398, 414, and 404 g/d) and increase ADFI (P < 0.10; 529, 555, and 544 g/d). These
results suggest increasing levels of threonine can improve growth performance of nursery
pigs.
Introduction
Threonine is an essential amino acid and required in the diets of monogastrics
because of its many physiological properties. It can be considered the second or third
limiting amino acid in the diet depending on the basal ingredients (Cohen and Tanksley,
1976; Grosbach et al., 1985). Besides it being a building block of proteins like the other
amino acids, the reasoning behind it behind one of the true essential amino acids for
growth and maintenance is because threonine comprises a large portion of mucin (Fuller
et al., 1989). Mucin is a mucosal protein, a gel-like substance which coats the epithelial
67
lining of the small intestine and provides a protective barrier for the enterocytes (Schaart
et al., 2005).
Weaning in particular is one of the most stressful periods for a commercial pig,
and this stress can cause the cellular death in the intestine which will reduce its
absorptive capabilities. This cell atrophy can also lead to the intestine being more
permeable which can subject the newly weaned piglet to pathogens and subsequently
cause an immunological response, which ultimately leads to taking the energy needed for
maintenance and growth to fighting an infection response. The post-weaning period is a
perfect time for negative events to occur and converge, and the pig may not fully recover
from this outcome and may never live up to its genetic potential. In order to protect the
small intestine, mucin production may increase during these stressful times. This can
subsequently increase the threonine requirements of the pig during these times of
challenge like the post-weaning period.
Besides being a large portion of mucin, threonine also bears some immunological
properties. When increasing levels of threonine were fed, there were significant increases
in the antibody IgG (Mao et al., 2014). Diets fed which were deficient in threonine
increased the expression of genes which were related to the defense and immunity of
intestinal permeability (Le Floc’h et al., 2012).
Currently, there are some suggestions (de Jong et al., 2018) with the modern pig
there may be an additional need for threonine with the decreased use of antibiotics and
the need to maintain the integrity of gut health and efficient growth and production. With
this proposed need it may not be in line with the current requirements listed in the Swine

68
NRC (2012). The objective of this study was to evaluate the effects of increased dietary
threonine by increasing the threonine:lysine ratios for early-weaned piglets in the nursery
period.
Materials and Methods
All methods and procedures for this experiment were reviewed and approved by
the Oklahoma State University International Animal Care and Use Committee (ACUP
approval number AG-16-21). All animal research trials were conducted at the Oklahoma
State Swine Research and Education Center in Stillwater, Oklahoma.
In order to determine the effect of threonine to lysine ratios on growth
performance of nursery pigs, a total of 540 crossbred piglets were utilized in two
experiments. Upon delivery to the Oklahoma State Swine Research and Education
Center, piglets were assigned to one of 27 experimental pens and were divided based on
initial BW and litter of origin. The initial BW of experiment one was 5.94 kg and the
starting BW of experiment two was 5.70 kg. There were eighteen replicate pens per
treatment and 10 piglets assigned to each pen. Once allotted to experimental pens, piglets
were assigned to one of three dietary treatments. Dietary treatments were 60, 62.5, and
65% threonine to lysine formulated on a SID digestible basis. Dietary ingredient
composition, chemical analysis, and amino acid analysis are listed on Tables 4.1 – 4. 5.
Actual threonine to lysine ratios differed slightly from the formulated values, particularly
in the first and fifth phase of the nursery diets during experiment 2. Diets were
formulated to meet or exceed the nutrient requirements listed in the Swine NRC (2012).
Crystalline threonine was added to the diets during mixing at the expense of corn.

69
Piglets were kept in an environmentally controlled building and were housed in
pens over plastic, fully slatted floors. Animals were given ad libitum access to feed and
water through an adjustable, stainless steel feeder and a nipple cup waterer. These pigs
were not administered any deliberate health challenges and were considered in good
health. Both experiments lasted for 42 days. Growth performance was measured through
weighing of pens, feeders, and recording the number of pigs on a weekly basis which
occurred on day 0, 7, 14, 21, 28, 35, and 42. Feed disappearance was calculated based on
starting feeder weight, feed fed, and total weight of feeder minus the initial feeder weight
to measure feed left in the feeder. Growth performance was determined based on average
daily gain (ADG), average daily feed intake (ADFI), and feed conversion (G:F). Water
meters were utilized in every pen to measure average daily water intake (ADWI). Water
meter readings were read and recorded every morning between the hours of 0700 and
0900.
Statistical Analysis
All data was analyzed in a randomized complete block design using the general
linear model (GLM) procedure of SAS (SAS Institute, Inc., Cray, NC) with pen serving
as the experimental unit. Means were reported as the Least Squares Means (LS Means).
Orthogonal polynomial contrasts were conducted to determine the linear and quadratic
effects for increasing levels of threonine supplementation. Variability of the data is
presented as the Standard Error of the Mean (SEM). Differences between treatments were
considered significant at P ≤ 0.05 and a tendency at P > 0.05 and P ≤ 0.10.

70
Results
The effect of increasing threonine to lysine ratios on growth performance is
presented on Table 4.6. Supplementation of increasing threonine did not affect (P > 0.10)
BW throughout phase one (days 0 – 21) and phase two (days 21 – 42). However, there
were numerical increases in BW at day 21 (11.19, 11.44, and 11.16 kg).
During phase one, there was a tendency to improve ADG (quadratic, P = 0.08;
255, 267, and 253 g/d) and ADFI (quadratic, P = 0.07; 310, 321, and 306 g/d) with the
highest ADG and ADFI reported at the 62.5% threonine treatment. There were no
significant improvements (P > 0.10) in G:F, however there were numerical improvements
for this period with 62.5% threonine being the most efficient (0.817, 0.826, and 0.824).
Additionally, there were no improvements (P > 0.10) for ADWI for this period.
In phase two, there was an improvement (linear, P = 0.05) ADFI (754, 792, and
790g/d) with the highest amount of feed intake reported for the pigs in the 62.5%
treatment. Additionally, there were numerical increases in ADG (P > 0.10) during this
period with the pigs gaining the most in this period when provided the 62.5 % threonine
treatment (539, 561, and 557 g/d). Feed efficiency was also not affected (P > 0.10) and
decreased with additional threonine ratios.
For the overall experimental period, there was a tendency (quadratic, P < 0.10) to
improve ADG (398, 414, and 404 g/d) with the heaviest gaining pigs being in the 62.5%
treatment. There was a tendency to increase BW (quadratic, P = 0.10; 22.59, 23.23, and
22.86 kg) with the heaviest pigs in the 62.5% treatment for the overall nursery period.
Additionally, pigs tended (quadratic, P < 0.10) tended to eat more (529, 555, and 544 g/d)
71
when provided with 62.5% threonine compared to the other two treatments. Moreover,
pigs in the 60% treatment group had numerical improvements between d 0 – 42 for G:F
than the other two treatment groups. During phase one, two, and for the overall period,
there were no differences (P > 0.10) in water consumption between all of the treatments,
however there were numerical improvements during phase two and for the overall period
with additional levels of threonine.
Discussion
Threonine is an important amino acid and is considered one of the non-
dispensable amino acids. Like previously mentioned, it is considered one of the first
limiting amino acids for maintenance because it encompasses a large portion of the
structural protein mucin, which helps protect the lining of the gastrointestinal tract
(Schaart et al., 2005; NRC, 2012). It was reported when pigs were fed a threonine-
deficient diet; it promoted and increased the amount of endogenous amino acid losses
into the hindgut which reduced the amount of threonine available for body protein
deposition (Zhu et al., 2003). Piglets during this experiment were not deliberately
subjected to an immune challenge, but when under a disease challenge and threonine
intake was extrapolated to 0 g SID threonine intake, protein deposition was more
negatively affected than unchallenged pigs (McGilvray et al., 2019).
Our study concluded there was no effect of increasing threonine ratios on BW
immediately post-weaning or during the subsequent phases. This is contrast to Ettle and
Roth (2005) who reported higher final BW with increasing threonine. Additionally, Ettle
and Roth (2005) reported improvements in ADG and G:F with increasing threonine. This
72
result may have been due to the choice-feeding, in which piglets were given the option of
different levels of threonine which may explain some of its properties as a dietary flavor
enhancer. In slight agreeance with Ettle and Roth (2005), we recorded no significant BW
increases during the first two phases of the trial, but there was a tendency to quadratically
increase overall final BW for pigs in the 62.5% threonine treatment.
In addition to previous reports of increased growth performance, de Jong et al.,
(2018) reported substantial linear increases in ADG and G:F d 0 to 21 days post-weaning,
and quadratic improvements in feed efficiency in the later and for the overall period.
They concluded the optimal threonine to lysine ratio as 65% in regards to improvements
in growth performance. This is in slight contrast to our results which showed a tendency
to quadratically improve ADG and ADFI during the first 21 days post-weaning, with the
highest performing group during the first 21 days occurring in the formulated 62.5%
treatment. On a total basis, Bergström et al., (1996) also suggested the optimal threonine
to lysine ratio to be 63 to 65% in regards to growth performance for piglets weighing
11.34 – 22.68 kg which may also be age-dependent as piglets are more mature at this
weight compared to the younger group. Additionally, the results from Bergström et al.,
(1996) may also change in regards to the modern pig. However, even though the ratio of
threonine to lysine was increasing between the treatments, the lowered amounts of
analyzed threonine in the first phase, and in particular the last phase of this study could
have had some effects on performance.
73
Conclusions
The results from this study indicate increasing the ratios of threonine to lysine
during the nursery phase can potentially increase the overall BW of pigs at the end of the
nursery phase. Typically, a heavier pig towards the end of the nursery phase can
extrapolate to increased performance and BW over the entirety of the production cycle
towards market-ready weight. Additionally, increasing the threonine to lysine ratio has
the tendency to improve performance between days 0 to 21, produce numerical
improvements for ADG between days 21 and 42, and has the tendency to improve ADG
for the overall nursery period. Therefore, continued research is needed in navigating the
threonine requirements in regards to the modern pig above the current requirements, and
the effects of additional threonine on the overall health and performance during the
nursery stage.
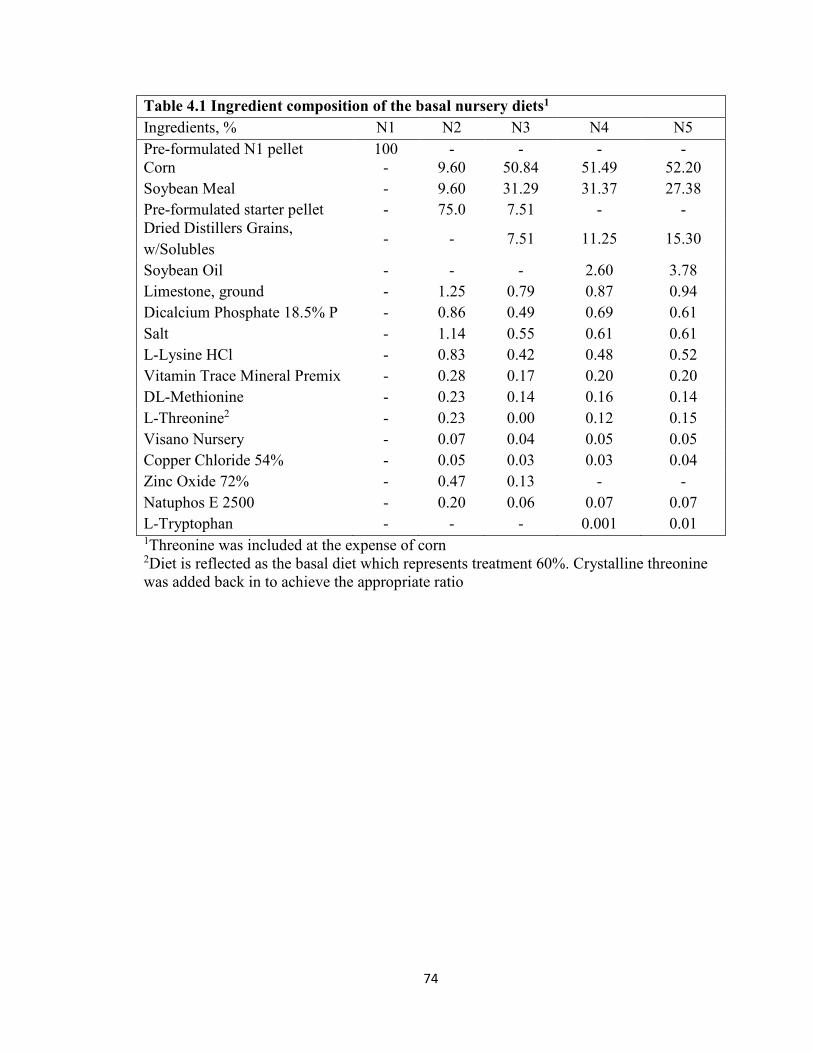
74
Table 4.1 Ingredient composition of the basal nursery diets1
Ingredients, % N1 N2 N3 N4 N5 Pre-formulated N1 pellet 100 - - - - Corn - 9.60 50.84 51.49 52.20 Soybean Meal - 9.60 31.29 31.37 27.38 Pre-formulated starter pellet - 75.0 7.51 - - Dried Distillers Grains, w/Solubles
- - 7.51 11.25 15.30
Soybean Oil - - - 2.60 3.78 Limestone, ground - 1.25 0.79 0.87 0.94 Dicalcium Phosphate 18.5% P - 0.86 0.49 0.69 0.61 Salt - 1.14 0.55 0.61 0.61 L-Lysine HCl - 0.83 0.42 0.48 0.52 Vitamin Trace Mineral Premix - 0.28 0.17 0.20 0.20 DL-Methionine - 0.23 0.14 0.16 0.14 L-Threonine2 - 0.23 0.00 0.12 0.15 Visano Nursery - 0.07 0.04 0.05 0.05 Copper Chloride 54% - 0.05 0.03 0.03 0.04 Zinc Oxide 72% - 0.47 0.13 - - Natuphos E 2500 - 0.20 0.06 0.07 0.07 L-Tryptophan - - - 0.001 0.01 1Threonine was included at the expense of corn 2Diet is reflected as the basal diet which represents treatment 60%. Crystalline threonine was added back in to achieve the appropriate ratio
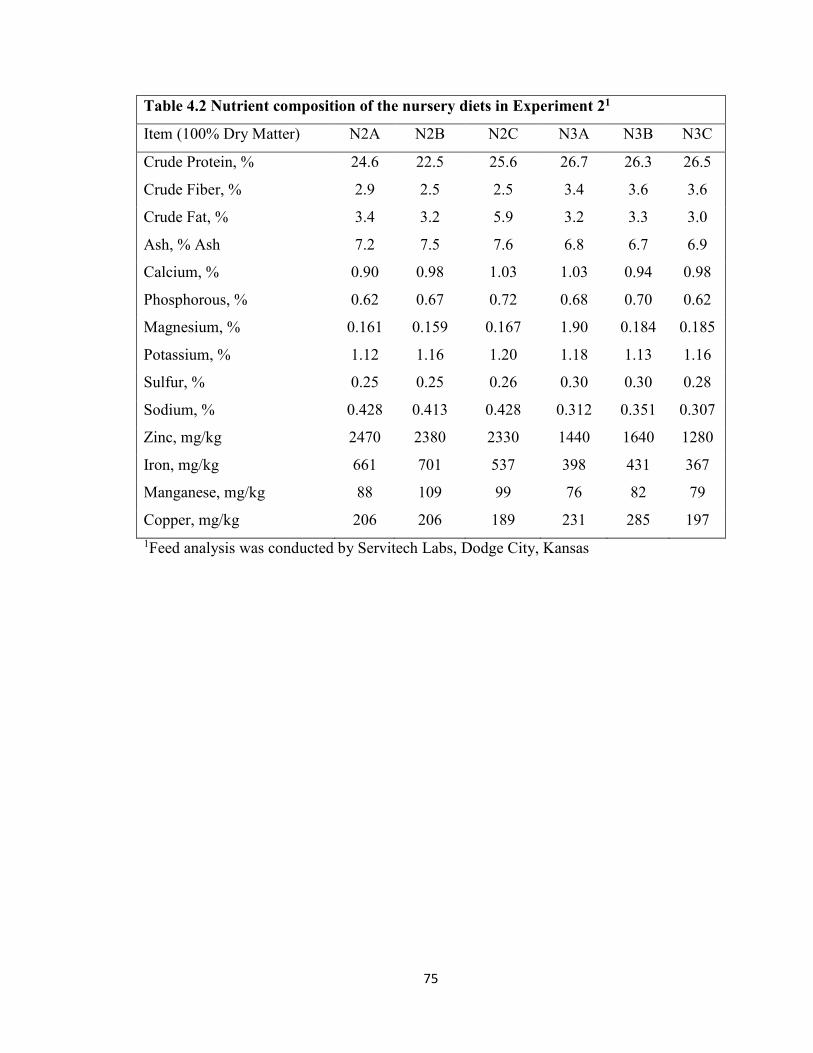
75
Table 4.2 Nutrient composition of the nursery diets in Experiment 21
Item (100% Dry Matter) N2A N2B N2C N3A N3B N3C
Crude Protein, % 24.6 22.5 25.6 26.7 26.3 26.5
Crude Fiber, % 2.9 2.5 2.5 3.4 3.6 3.6
Crude Fat, % 3.4 3.2 5.9 3.2 3.3 3.0
Ash, % Ash 7.2 7.5 7.6 6.8 6.7 6.9
Calcium, % 0.90 0.98 1.03 1.03 0.94 0.98
Phosphorous, % 0.62 0.67 0.72 0.68 0.70 0.62
Magnesium, % 0.161 0.159 0.167 1.90 0.184 0.185
Potassium, % 1.12 1.16 1.20 1.18 1.13 1.16
Sulfur, % 0.25 0.25 0.26 0.30 0.30 0.28
Sodium, % 0.428 0.413 0.428 0.312 0.351 0.307
Zinc, mg/kg 2470 2380 2330 1440 1640 1280
Iron, mg/kg 661 701 537 398 431 367
Manganese, mg/kg 88 109 99 76 82 79
Copper, mg/kg 206 206 189 231 285 197
1Feed analysis was conducted by Servitech Labs, Dodge City, Kansas

76
Table 4.2 Nutrient composition of the nursery diets in
Experiment 2(continued)1
Item (100% Dry Matter) N5A N5B N5C
Crude Protein, % 24.3 24.1 23.6
Crude Fiber, % 2.8 3.4 3.1
Crude Fat, % 7.5 7.8 6.8 Ash, % Ash 5.8 5.8 6.2
Calcium, % 0.91 0.90 0.82
Phosphorous, % 0.64 0.59 0.62
Magnesium, % 0.205 0.190 0.201
Potassium, % 1.00 1.01 1.03
Sulfur, % 0.26 0.26 0.26
Sodium, % 0.348 0.321 0.342
Zinc, mg/kg 156 128 131
Iron, mg/kg 385 338 277
Manganese, mg/kg 68 75 98
Copper, mg/kg 276 261 242 1Feed analysis was conducted by Servitech Labs, Dodge City, Kansas
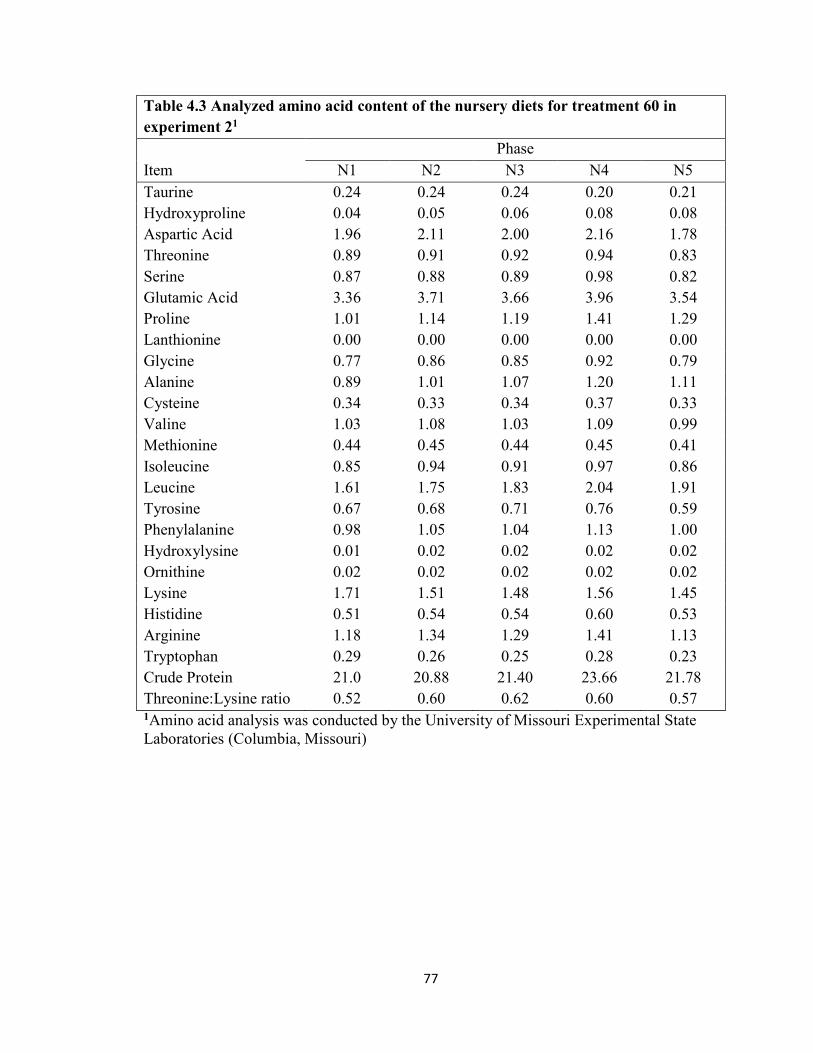
77
Table 4.3 Analyzed amino acid content of the nursery diets for treatment 60 in
experiment 21
Phase Item N1 N2 N3 N4 N5
Taurine 0.24 0.24 0.24 0.20 0.21 Hydroxyproline 0.04 0.05 0.06 0.08 0.08 Aspartic Acid 1.96 2.11 2.00 2.16 1.78 Threonine 0.89 0.91 0.92 0.94 0.83 Serine 0.87 0.88 0.89 0.98 0.82 Glutamic Acid 3.36 3.71 3.66 3.96 3.54 Proline 1.01 1.14 1.19 1.41 1.29 Lanthionine 0.00 0.00 0.00 0.00 0.00 Glycine 0.77 0.86 0.85 0.92 0.79 Alanine 0.89 1.01 1.07 1.20 1.11 Cysteine 0.34 0.33 0.34 0.37 0.33 Valine 1.03 1.08 1.03 1.09 0.99 Methionine 0.44 0.45 0.44 0.45 0.41 Isoleucine 0.85 0.94 0.91 0.97 0.86 Leucine 1.61 1.75 1.83 2.04 1.91 Tyrosine 0.67 0.68 0.71 0.76 0.59 Phenylalanine 0.98 1.05 1.04 1.13 1.00 Hydroxylysine 0.01 0.02 0.02 0.02 0.02 Ornithine 0.02 0.02 0.02 0.02 0.02 Lysine 1.71 1.51 1.48 1.56 1.45 Histidine 0.51 0.54 0.54 0.60 0.53 Arginine 1.18 1.34 1.29 1.41 1.13 Tryptophan 0.29 0.26 0.25 0.28 0.23 Crude Protein 21.0 20.88 21.40 23.66 21.78 Threonine:Lysine ratio 0.52 0.60 0.62 0.60 0.57 1Amino acid analysis was conducted by the University of Missouri Experimental State Laboratories (Columbia, Missouri)
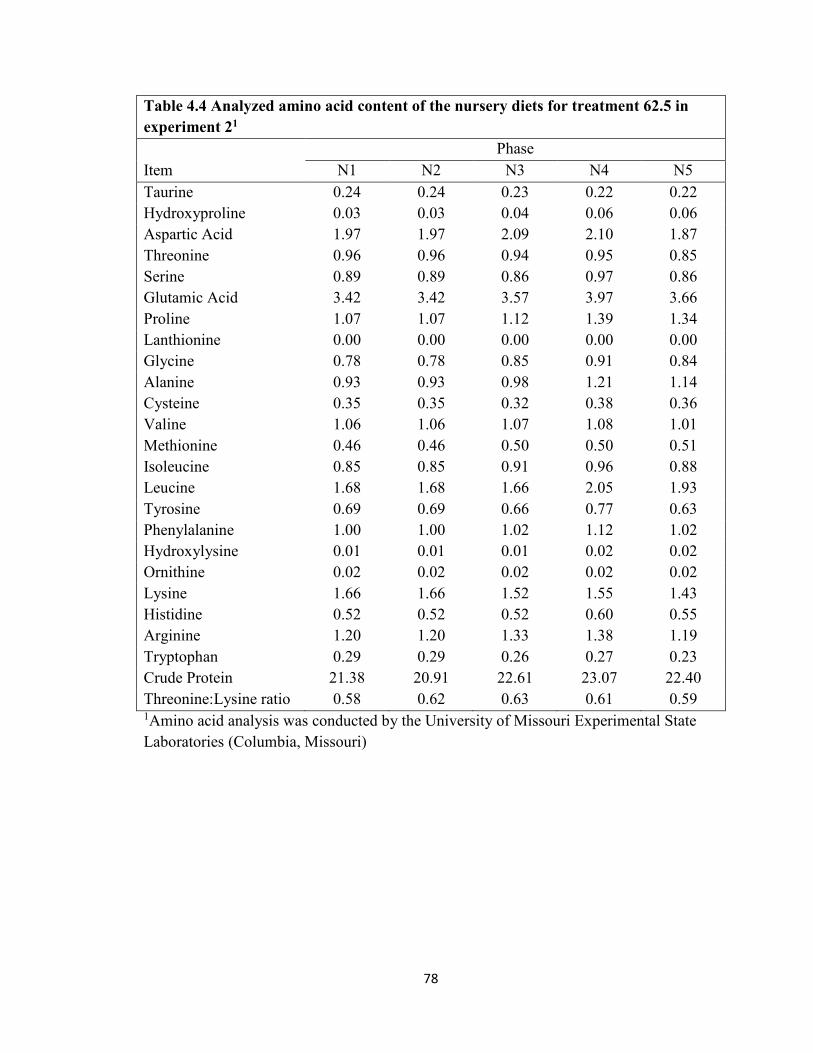
78
Table 4.4 Analyzed amino acid content of the nursery diets for treatment 62.5 in
experiment 21
Phase Item N1 N2 N3 N4 N5
Taurine 0.24 0.24 0.23 0.22 0.22 Hydroxyproline 0.03 0.03 0.04 0.06 0.06 Aspartic Acid 1.97 1.97 2.09 2.10 1.87 Threonine 0.96 0.96 0.94 0.95 0.85 Serine 0.89 0.89 0.86 0.97 0.86 Glutamic Acid 3.42 3.42 3.57 3.97 3.66 Proline 1.07 1.07 1.12 1.39 1.34 Lanthionine 0.00 0.00 0.00 0.00 0.00 Glycine 0.78 0.78 0.85 0.91 0.84 Alanine 0.93 0.93 0.98 1.21 1.14 Cysteine 0.35 0.35 0.32 0.38 0.36 Valine 1.06 1.06 1.07 1.08 1.01 Methionine 0.46 0.46 0.50 0.50 0.51 Isoleucine 0.85 0.85 0.91 0.96 0.88 Leucine 1.68 1.68 1.66 2.05 1.93 Tyrosine 0.69 0.69 0.66 0.77 0.63 Phenylalanine 1.00 1.00 1.02 1.12 1.02 Hydroxylysine 0.01 0.01 0.01 0.02 0.02 Ornithine 0.02 0.02 0.02 0.02 0.02 Lysine 1.66 1.66 1.52 1.55 1.43 Histidine 0.52 0.52 0.52 0.60 0.55 Arginine 1.20 1.20 1.33 1.38 1.19 Tryptophan 0.29 0.29 0.26 0.27 0.23 Crude Protein 21.38 20.91 22.61 23.07 22.40 Threonine:Lysine ratio 0.58 0.62 0.63 0.61 0.59 1Amino acid analysis was conducted by the University of Missouri Experimental State Laboratories (Columbia, Missouri)

79
Table 4.5 Analyzed amino acid content of the nursery diets for treatment 65 in
experiment 21
Phase Item N1 N2 N3 N4 N5
Taurine 0.23 0.24 0.23 0.20 0.21 Hydroxyproline 0.05 0.04 0.06 0.09 0.08
Aspartic Acid 2.08 1.97 2.02 2.15 1.87 Threonine 1.02 0.97 0.97 1.03 0.90 Serine 0.93 0.82 0.88 1.00 0.86 Glutamic Acid 3.56 3.43 3.66 4.04 3.65 Proline 1.12 1.06 1.21 1.37 1.32 Lanthionine 0.00 0.00 0.00 0.00 0.00 Glycine 0.81 0.81 0.86 0.91 0.82 Alanine 0.96 0.93 1.08 1.20 1.14 Cysteine 0.37 0.31 0.36 0.39 0.35 Valine 1.09 1.03 1.06 1.09 1.02 Methionine 0.49 0.49 0.46 0.49 0.40 Isoleucine 0.89 0.87 0.92 0.98 0.89 Leucine 1.74 1.59 1.85 2.07 1.96 Tyrosine 0.72 0.64 0.71 0.79 0.66 Phenylalanine 1.05 0.98 1.05 1.15 1.04 Hydroxylysine 0.01 0.02 0.02 0.02 0.02 Ornithine 0.02 0.02 0.03 0.02 0.02 Lysine 1.65 1.50 1.48 1.57 1.48 Histidine 0.55 0.50 0.55 0.60 0.55 Arginine 1.26 1.27 1.31 1.40 1.22 Tryptophan 0.30 0.24 0.25 0.28 0.22 Crude Protein 21.09 21.40 22.73 23.34 21.58 Threonine:Lysine ratio 0.62 0.65 0.66 0.66 0.61 1Amino acid analysis was conducted by the University of Missouri Experimental State Laboratories (Columbia, Missouri)
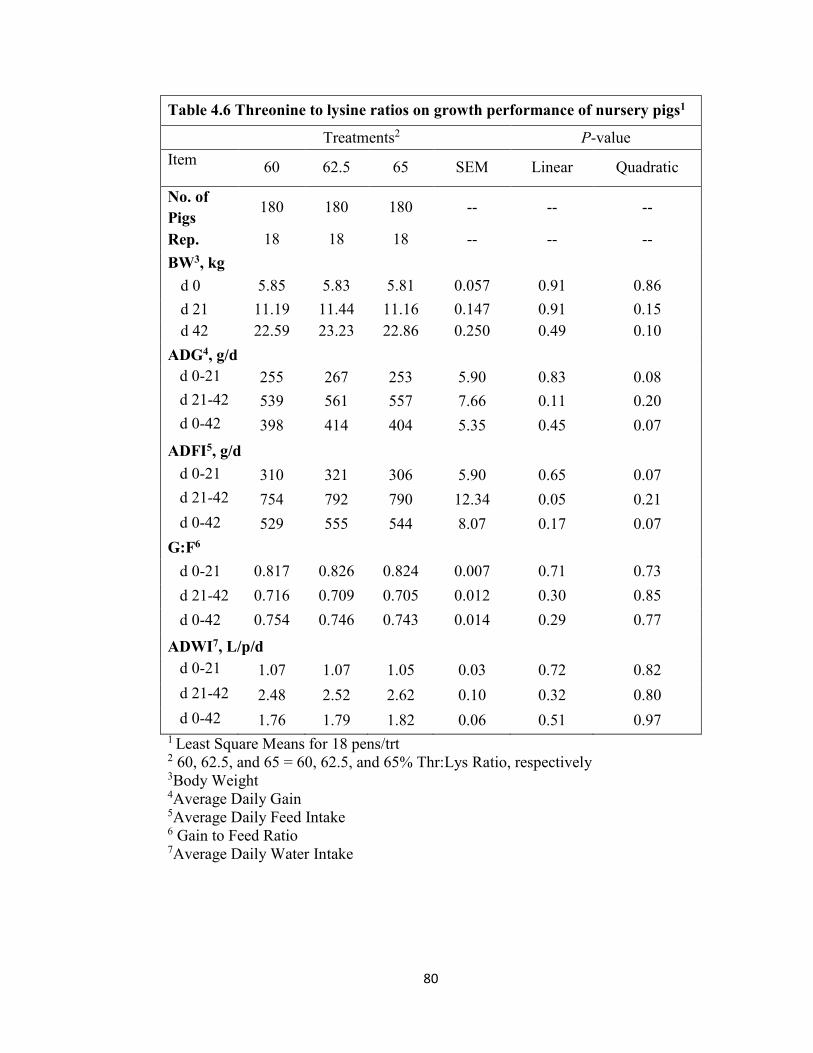
80
Table 4.6 Threonine to lysine ratios on growth performance of nursery pigs1
Treatments2 P-value
Item 60 62.5 65 SEM Linear Quadratic
No. of
Pigs 180 180 180 -- -- --
Rep. 18 18 18 -- -- --
BW3, kg
d 0 5.85 5.83 5.81 0.057 0.91 0.86
d 21 11.19 11.44 11.16 0.147 0.91 0.15 d 42 22.59 23.23 22.86 0.250 0.49 0.10
ADG4, g/d d 0-21 255 267 253 5.90 0.83 0.08
d 21-42 539 561 557 7.66 0.11 0.20
d 0-42 398 414 404 5.35 0.45 0.07
ADFI5, g/d
d 0-21 310 321 306 5.90 0.65 0.07
d 21-42 754 792 790 12.34 0.05 0.21
d 0-42 529 555 544 8.07 0.17 0.07
G:F6
d 0-21 0.817 0.826 0.824 0.007 0.71 0.73
d 21-42 0.716 0.709 0.705 0.012 0.30 0.85
d 0-42 0.754 0.746 0.743 0.014 0.29 0.77
ADWI7, L/p/d d 0-21 1.07 1.07 1.05 0.03 0.72 0.82
d 21-42 2.48 2.52 2.62 0.10 0.32 0.80
d 0-42 1.76 1.79 1.82 0.06 0.51 0.97 1 Least Square Means for 18 pens/trt 2 60, 62.5, and 65 = 60, 62.5, and 65% Thr:Lys Ratio, respectively 3Body Weight 4Average Daily Gain 5Average Daily Feed Intake 6 Gain to Feed Ratio 7Average Daily Water Intake
81
CHAPTER V
SUMMARY
In summary, sustainable pork production is achieved through efficient and healthy
animals in conjunction with increased research on the new technologies available on the
market. A cost-effective way in which we could help combat the issue of post-weaning
lag and disease challenges was through in-feed antibiotic growth promotors. Since the
enactment of the Veterinary Feed Directive in 2017, it has been a challenge to producers
and scientists to uncover new ways to help mitigate the effects of post-weaning lag and
disease on morbidity and mortality of pigs. Besides the new regulations behind the use of
antibiotics as a growth promotor, increasing costs due to specialty feed ingredients are
another area for concern since the cost of feed is one of the highest costs in producing
pigs. All of these considerations are the reasoning behind new and already established
feed or water research, feeding techniques, and the basis for the objective of these
studies.
Furst Water Boost is a blend of organic acids, yeast fermentation extract,
probiotics, plant extracts, natural seasonings, and flavorings. The first experiment using
Furst Water Boost concluded the addition of this natural product may be a viable option
to aid in increasing growth performance when supplemented for three days immediately
82
post-weaning. While these results weren’t all considered significant, numerical increases
in growth performance and body weight can lead to a heavier pig reaching market weight
at a faster rate once leaving the nursery phase.
These piglets in experiment one were fed simple, corn-soybean meal based diets
with no animal protein sources, lactose, or in-feed antibiotics. Piglets may benefit better
using more complex diets containing lactose and animal protein sources since they are
more digestible to the young pig when weaned off of the sow. Moreover, pigs may
benefit with the addition of higher doses of Furst Water Boost and supplemented for a
longer period of time immediately post-weaning since there are natural flavorings in this
product which may attract the piglets to drink. The increase in water intake generally can
drive feed intake. The use of complex nursery diets with varying levels of Furst Water
Boost was the basis for experiment two in continuing to learn more about the benefits on
non-antibiotic alternatives to use in the animal nutrition industry.
When Furst Water Boost was supplemented at varying levels to nursery pigs for
seven days post-weaning produced varying results. While Furst Water Boost did not
affect body weight throughout the trial period, there were significant improvements in
water intake over the course of the entire trial. Growth performance varied. While there
was no effect on growth performance for the first period of the trial which included the
days of supplementation, there were improvements in the late nursery stage and for the
overall period. Based on results from experiment two, supplementation of Furst Water
Boost may be beneficial the first seven days post-weaning and at a level of around 60-65
ml/L. The effect of Furst Water Boost may be due to modulation of the gut microflora,
83
increased digestion and absorption, lowering of the stomach pH to increase enzymatic
digestion of protein, immunomodulation, and competitive inhibition towards pathogens.
Amino acids are an important part of the diet because they are used for a variety
of physiological functions. They are already required in the diet for this reason, so
modifying their inclusions in the diets can be an easy solution. In particular, threonine is
one of the essential amino acids required by pigs. Modulating these levels and its effects
on health characteristics and growth performance have been studied for years and will
continue to be researched due to the changing type of animal, environments, and health
challenges. Furthermore because of the change in animal type throughout the years, the
requirements for weaning pigs may be slightly different.
When supplemented with two additional levels of threonine above the
requirement in two experiments and pooling the results, there were no changes in body
weight for any of the phases of the trial. However there was a tendency to improve feed
intake and average daily gain for phase one and the overall period. Feed intake increased
during phase two, and there were no significant differences in water intake and feed
efficiency in any phase. There were also numerical improvements in feed conversion
during the first 21 days post-weaning. While these results we reported don’t match some
recent results in the industry who reported massive improvements in growth performance,
additional increases in threonine beyond the requirement can improvement some aspects
of growth performance.

84
Overall, the addition of a nutritional water supplement called Furst Water Boost
and additional threonine beyond the current requirements can improve growth
performance of nursery pigs when supplemented post-weaning.

85
REFERENCES
Ahmed, S. T., J. Hoon, H. Mun, and C. Yang. 2014. Evaluation of Lactobacillus and Bacillus-based probiotics as alternatives to antibiotics in enteric microbial challenged weaned pigs. Afr. J. Microbiol. Res. 8:96-104.
Alexopoulos, C., I. E. Georgoulakis, A. Tzivara, C. S. Kyriakis, A. Govaris, and S. C. Kyriakis. 2004. Field evaluation of the effect of a probiotic-containing Bacillus
licheniformis and Bacillus subtilis spores on the health status, performance, and carcass quality of grower and finisher pigs. J. Vet. Med. 51:306-312.
Aperce, C. C., T. E. Burkey, B. KuKanich, B. A. Crozier-Dodson, S. S. Dritz, and J. E. Minton. 2010. Interaction of Bacillus species and Salmonella enterica serovar Typhimurium in immune or inflammatory signaling from swine intestinal epithelial cells. J. Anim. Sci. 88:1649-1656. doi:10.2527/jas.2009-2263.
AVMA. Veterinarian Feed Directive (VFD) Basics. https://www.avma.org/KB/Resources/Pages/VFD123.aspx. (Access 25 March 2019).
Baker, D. H. 2000. Nutritional constraints to the use of soy products by animals. Pages 1 – 12 in Soy Animal Nutrition. J. K. Drackley, ed. Fed. Anim. Sci. Soc., Savoy, IL.
Baugher, J., and T. Klaenhammer. 2011. Invited review: Application of omics tools to understanding probiotic functionality. J. Dairy Sci. 94:4753-4765.
Baydar, H., O. Sağdiç, G. Özkan, and T. Karadoğan. 2004. Antibacterial activity and composition of essential oils from Origanum, Thymbra, and Satureja species with commercial importance in Turkey. Food Control. 15:169-172.
Bedford, A., Z. Li, M. Li, S. Ji, W. Liu, Y. Huai, C. F. M. de Lange, and J. Li. 2012.
Epidermal growth factor-expressing Lactococcus lactis enhances growth performance of early-weaned pigs fed diets devoid of blood plasma. J. Anim. Sci. 90:4-6. doi:10.2527/jas53973.
86
Bergström, J. R., J. A. Loughmiller, R. E. Musser, and W. B. Smith Jr. 1996. Determining the optimal threonine:lysine ratio for the 25 to 50 lb pig. Kansas Agricultural Experiment Station Research Reports. 0(10). doi:10.4148/2378-5977.6516.
Bhandari, S. K., B. Xu, C. M. Nyachoti, D. W. Giesting, and D. O. Krause. 2008. Evaluation of alternatives to antibiotics using an Escherichia coli K88+ model of piglet diarrhea: Effects on gut microbial ecology. J. Anim. Sci. doi:10.2527/jas.2006-822.
Bible, M. R., S. J. England, and F. B. Sandberg. 2016. Effects of Porcine Reproductive Respiratory Syndrome (PRRS) status (stable vs. active) on the performance of weaned pigs when fed either a complex diet, a simple diet or a simple diet with lactose. J. Anim. Sci. 94:121-122. (Abstr). doi:10.2527/msasas2016-257.
Bontempo, V., A. Di Giancamillo, G. Savoini, V. Dell’Orto, and C. Deomeneghini. 2006. Live yeast dietary supplementation acts upon intestinal morpho-functional aspects and growth in weanling piglets. Anim. Feed Sci. Technol. 129:224-236.
Cai, L., S. Indrakumar, E. Kiarie, and I. H. Kim. 2015. Effects of a multi-strain Bacillus species-based direct-fed microbial on growth performance, nutrient digestibility, blood profile, and gut health in nursery pigs fed corn-soybean meal-based diets. J. Anim. Sci. 93:4336-4342. doi:10.2527/jas2015-9056.
Castillo, M., S. M. Martín-Orúe, M. Roca, E. G. Manzanilla, I. Badiola, J. F. Perez, and J. Gasa. 2006. The response of gastrointestinal microbiota to avilamycin, butyrate, and plant extracts in early-weaned pigs. J. Anim. Sci. 84:2725-2734. doi:10.2527/jas.2004-556.
Cho, J. H., M. D. Lindeman, H. J. Monegue, and G. L. Cromwell. 2010. Feeding value of dried porcine solubles for weanling pigs. Prof. Anim. Sci. 26:424-434.
Choi, Y., A. Goel, A. Hosseindoust, S. Lee, K. Kim, S. Jeon, H. Noh, I. Kyong Kwon, and B. Chae. 2016. Effects of dietary supplementation of Ecklonia cava with or without probiotics on the growth performance, nutrient digestibility, immunity and intestinal health in weaning pigs. Ital. J. Anim. Sci. 15:62-68.
Coffey, R. D., and G. L. Cromwell. 2001. Use of spray-dried animal plasma in diets for weanling pigs. Pig News Info. 22:39N.
Cohen, R. S., and T. D. Tanksley. 1976. Limiting amino acids in sorghum for growing and finishing pigs. J. Anim. Sci. 39:694-698.
87
Costa, L. B., F. B. Luciano, V. S. Miyada, and F. D. Gois. 2013. Herbal extracts and organic acids as natural feed additives in pig diets. S. Afri. J. Anim. Sci. 43(2):181-193.
Cotton, B., D. Ragland, J. E. Thomson, and O. Adeola. 2016. Amino acid digestibility of plant protein feed ingredients for growing pigs. J. Anim. Sci. 94:1073-1082. doi:10.2527/jas2015-9662.
Dabbah, R. V., M. Edwards, and W. A. Moats. 1970. Antimicrobial action of some citrus fruit oils on selected food-borne bacteria. Appl. Microbiol. 19:27-31.
de Lange, C. F. M., A. M. Gillis, and G. J. Simpson. 2001. Influence of threonine intake on whole-body protein deposition and threonine utilization in growing pigs fed purified diets. J. Anim. Sci. 79:3087-3095.
de Lange, C. F. M., J. Pluske, J. Gong, and C. M. Nyachoti. 2010. Strategic use of feed ingredients and feed additives to stimulate gut health and development in young pigs. Livest. Sci. 134:124-134. doi:10.1016/j.livsci.2010.06.117.
de Jong, J., C. R. Neill, A. D. Goncalves, U. A. D. Orlando, and M. Culbertson. 2018. Effects of standardized ileal digestible (SID) threonine:lysine ratio on nursery pig performance. J. Anim. Sci. 96:166-167 (Abstr).
Defa, L., X. Changting, Q. Shiyan, Z. Jinhui, E. W. Johnston, and P. A. Thacker. 1999. Effects of dietary threonine on performance, plasma paramters, and immune function of growing pigs. Anim. Feed Sci. and Tech. 78:179-188.
Dowarah, R., A. K. Verma, and N. Agarwal. 2017. The use of Lactobacillus as an alternative of antibiotic growth promoters in pigs: A review. Anim. Nutrition. doi:10.1016/j.aninu.2016.11.002.
Dritz, S. S., K. Q. Owen, R. D. Goodband, J. L. Nelssen, M. D. Tokach, M. M. Chengappa, and F. Blecha. 1996. Influence of a lipopolysaccharide-induced immune challenge and diet complexity on growth performance and acute-phase protein production in segregated early-weaned pigs. J. Anim. Sci. 74:1620-1628.
Dundar, E., E. G. Olgun, S. Isiksoy, M. Kurkcuoglu, K. Husnu Can Baser, and C. Bal. 2008. The effects of intra-rectal and intra-peritoneal application of Orignaum
onites L. essential oil on 2,4,6-trinitrobenzenesulfonic acid-induced colitis in the rat. Experi. Toxicol. Pathol. 59:399-408. doi:10.1016/j.etp.2007.11.009.
Dünglehoef, M., M. Rodehutscord, H. Spiekers, and E. Pfeffer. 1994. Effects of supplemental microbial phytase on availability of phosphorous contained in maize, wheat, and triticale to pigs. Anim. Feed Sci. Technol. 49:1-10.
88
Dybkjaer, L., A. P. Jacobson, F. A. Tᴓgerson, and H. D. Poulsen. 2006. Eating and drinking activity of newly weaned pigs: Effects of individual characteristics, social mixing, and addition of extra zinc to the feed. J. Anim. Sci. 84:702-711.
Eicher, S. D., C. A. McKee, J. A. Carroll, and E. A. Pajor. 2006. Supplemental vitamin C and yeast cell wall ß-glucan as growth enhancers in newborn pigs and as immumodulators after an endotoxin challenge after weaning. J. Anim. Sci. 84:2352-2360. doi:10.2527/jas.2005-770.
Ettle, T., and F. X. Roth. 2005. Dietary Preferences for feeds varying in threonine concentration by the piglet. J. Phys. Beh. doi:10.1016/j.physbeh.2005.04.017.
FAO/WHO. 2002. Joint FAO/WHO working group report on drafting guidelines for the evaluation of probiotics in food. London, Ontario, Canada. April 30 and May 1, 2002.
Ferrara, F., L. Tedin, R. Pieper, W. Meyer, and J. Zentek. 2017. Influence of medium-chain fatty acids and short-chain organic acids on jejunal morphology and intra-epithelial immune cells in weaned piglets. J. Anim. Phys. Nutr. 101:531-540. doi:10.1111/jpn.12490.
Fuller, M. F., R. McWilliam, T. C. Wang, and L. R. Giles. 1989. The optimum dietary amino acid pattern for growing pigs. Br. J. Nut.
Gerritsen, R., A. J. van Dijk, K. Rethy, and P. Bikker. 2010. The effect of blends of organic acids on apparent faecal digestibility in piglets. Livest. Sci. 134:246-248. doi:10.1016/j.livsci.2010.06.154.
Giesting, D.W., M. A. Roos, and R. A. Easter. 1991. Evaluation of the effect of fumaric acid and sodium bicarbonate addition on performance of starter pigs fed diets of different types. J. Anim. Sci. 69:2489-2496.
Gilbert, E. R., E. A. Wong, and K. E. Webb Jr. 2008. Peptide absorption and utilization: Implications for animal nutrition and health. J. Anim. Sci. 86:2135-2155.
Goodband, R. D., M. Tokach, S. Dritz, J. DeRouchey, and J. Woodworth. 2014. Practical starter pig amino acid requirements in relation to immunity, gut health, and growth performance. J. Anim. Sci. Biotech. 5:12.
Grosbach, D. A., A. J. Lewis, and E. R. Peo. 1985. An evaluation of threonine and isoleucine as the third and fourth limiting amino acids in corn for growing pigs. J. Anim. Sci. 60:487-494.
Haefeli, R. J. and D. Glaser. 1990. Taste responses and thresholds obtained with the primary amino acids in humans. Lebensm.-Wiss. u.-Techonol. 23:523-527.
89
Halas, V., and I. Nochta. 2012. Mannan oligosaccharides in nursery pig nutrition and their potentional mod of action. Animals. 2:261-274. doi:10.3390/ani2020261.
Hall, G. A., and T. F. Byrne. 1989. Effects of age and diet on small intestinal structure and function in gnotobiotic piglets. Res. Vet. Sci. 47:387-392.
Hampson, D. J., M. Hinton, and D. E. Kidder. 1985. Coliform numbers in the stomach and small intestine of healthy pigs following weaning at three weeks of age. J. Comp. Pathol. 95:353-362.
Hampson, D. J. 1986. Alterations in piglet small intestine structure at weaning. Res. Vet. Sci. 40:32-40.
Harada, E., M. Niiyama, and B. Syuto. 1986. Comparison of pancreatic exocrine secretion via endogenous secretin by intestinal infusion of hydrochloric acid and monocarboxylic acid in anesthetized piglets. Japanese J. Phys. 36:843-856.
Henry, R. W., D. W. Pickard, and P. E. Hughes. 1985. Citric acid and fumaric acid as food additives for early-weaned piglets. Anim. Prod. 40:505-509.
Hu, Y., Y. Dun, S. Li, S. Zhao, N. Peng, and Y. Liang. 2014. Effects of Bacillus subtilis
KN-42 on growth performance, diarrhea, and faecal bacterial flora of weaned pigs. Asian Astralas. J. Anim. Sci. 27(8):1131-1140. doi:10.5713/ajas.2013.13737.
James, B. W., M. D. Tokach, R. D. Goodband, S. S. Dritz, J. L. Nelssen, and J. L. Ursry. 2003. The optimal true ileal digestible threonine requirements for nursery pigs between 11 to 22 kg. J. Anim. Sci. 81(1):42. Abstr.
Jayaraman, B., J. Htoo, and C. M. Nyachoti. 2015. Effects of dietary threonine:lysine ratios and sanitary conditions on performance, plasma urea nitrogen, plasma-free threonine, and lysine of weaned pigs. J. Anim. Nutr. 283-288. doi:10.1016/j.aninu.2015.09.003.
Jensen, P., and B. Recén. 1989. When to wean – Observations from free-range domestic pigs. Appl. Anim. Behav. Sci. 23;49-60.
Jiang, Z., S. Wei, Z. Wang, C. Zhu, S. Hu, C. Zheng, Z. Chen, Y. Hu, L. Wang, Z. Ma, and X. Yang. 2015. Effects of different forms of yeast saccharomyces cerevisiae on growth performance, intestinal development, and system immunity in early-weaned piglets. J. Anim. Sci. Biotechnol. 6:47-56. doi:10.1186/s40104-015-0046-8.

90
Kiarie, E., M. C. Walsh, and C. M. Nyachoti. 2016. Performance, digestive function, and mucosal responses to selected feed additives for pigs. J. Anim. Sci. 94:169-180. doi:10.2527/jas2015-9835.
Kommera, S. K., R. D. Matteo, F. J. Neher, and S. W. Kim. 2006. Phytobiotics and organic acids as potential alternatives to the use of antibiotics in nursery pig diets. Asian-Aust. J. Anim. Scie. 19(12):1784-1789.
Kremer, B. 2006. DFM products provide consistent outcomes. Feedstuffs. 24:14-15.
Kuang, Y., Y. Wang, Y. Zhang, Y. Song, X. Zhang, Y. Lin, L. Che, S. Xu, D. Wu, B. Xue, and Z. Fang. Effects of dietary combinations of organic acids and medium chain fatty acids as a replacement of zinc oxide on growth, digestibility and immunity of weaned pigs. Anim. Feed Sci. Technol. 208:145-157. doi:10.1016/j.anifeedsci.2015.07.010.
Lähteinen, T., T. Rinttilä, J. M. Koort, R. Kant, K. Levonen, M. Jakava-Viljanen, J. Björkroth, and A. Palva. 2015. Effects of a multispecies lactobacillus formulation as a feeding supplement on the performance and immune function of piglets. Livest. Sci. 180:164-171.
Lallès, J. P., B. Paolo, H. Smidt, and C. R. Stokes. 2007. Weaning-A challenge to gut physiologists. Livestock Sci. 108:82-93. doi:10.1016/j.livsci.2007.01.091
Lammers, P. J., B. J. Kerr, T. E. Weber, K. Bregendahl, S. M. Lonergan, K. J. Prusa, D. U. Ahn, W. C. Stoffregen, W. A. Dozier, and M. S. Honeyman. 2008. Growth performance, carcass characteristics, meat quality, and tissue histology of growing pigs fed crude glycerin-supplemented diets. J. Anim. Sci. 86:2962-2970. doi:10.2527/jas.2008-0972.
Lang, A., M. Lahav, E. Sakhnini, I. Barshack, H. H. Fidder, B. Avidan, E. Bardan, R. Hershkoviz, S. Bar-Meir, and Y. Chowers. 2004. Allicin inhibits spontaneous and TNF-α induced secretion of proinflammatory cytokines and chemokines from intestinal epithelial cells. J. Clin. Nutr. 23:1199-1208. doi:10.1016/j.cl.nu.2004.03.011.
Le Dividich, J., and B. Seve. 2000. Effects of underfeeding during the weaning period on growth, metabolism, and hormonal adjustments in the piglet. Domestic Anim. Endocrinol. 19:63-74.
Le Floc’h, N., C. Obled, and B. Sève. 1996. In vivo threonine oxidation in growing pigs fed on diets with graded levels of threonine. Br. J. Nutr. 75:825-837.

91
Le Floc’h, N., and B. Sève. 2005. Catabolism through the threonine dehydrogenase pathway does not account for the high first-pass extraction rate of dietary threonine by the portal drained viscera in pigs. Br. J. Nutr. 93:447-456. doi:10.1079/BJN20051375.
Le Floc’h, N., F. Gondret, J. J. Matte, and H. Quesnel. 2012. Amino acid recommendations for specific physiological and patho-physiological states in pigs. Proceedings Nutr. Society. 71:425-432. doi:10.1017/S0029665112000560.
Lee, D. N., S. R. Liu, Y. T. Chen, R. C. Wang, S. Y. Lin, and C. F. Weng. 2007. Effects of diets supplemented with organic acids and nucleotides on growth, immune responses and digestive tract development in weaned pigs. J. Anim. Phys. Nutr. 91:508-518. doi:10.1111/j.1439-0396.2007.00684.x.
Lee, S. H., S. L. Ingale, J. S. Kim, K. H. Kim, A. Lokhande, E. K. Kim, I. K. Kwon, Y. H. Kim, and B. J. Chae. 2014. Effects of a dietary supplementation with Bacillus
subtilis LS 1-2 fermentation biomass on growth performance, nutrient digestibility, cecal microbiota, and intestinal morphology of weanling pig. Anim. Feed Sci. and Tech. 188:102-110. doi:10.1016/j.anifeedsci.2013.12.001.
Lee, D. J., Y. Yang, H. I. Jung, D. H. Nguyen, and I. H. Kim. 2018. Effect of dietary protected organic acids on growth performance, fecal microflora in weanling pigs. J. Anim. Sci. 96:43. (Abstr).
Lenehan, N. A., M. D. Tokach, S. S. Dritz, R. D. Goodband, J. L. Nelssen, J. L. Usry, J. M. DeRouchey, and N. Z. Frantz. 2004. The optimal true ileal digestible lysine and threonine requirement for nursery pigs between 10 and 20 kg. J. Anim. Sci. 82(1):293. Abstr.
Li, S., J. Zheng, K. Deng, L. Chen, X. L. Zhao, X. Jiang, Z. Fang, L. Che, S. Xu, B. Feng, J. Li, Y. Lin, Y. Wu, Y. Han, and D. Wu. 2018. Supplementation with organic acids showing different effects on growth performance, gut morphology, and microbiota of weaned pigs fed with highly or less digestible diets. J. Anim. Sci. 96:3302-3318. doi:10.1093/jas/sky197.
Lien, K. A., W. C. Sauer, and M. Fenton. 1997. Mucin output in ileal digesta of pigs fed a protein-free diet. Z Ernahrungswiss. 36:192-190.
Liesegang, A., E. Bürgi, M. L. Sassi, J. Risteli, and M. Wanner. 2001. Influence of a vegetarian diet versus a diet with fishmeal on bone in growing pigs. J. Vet. Med. 49:230-238.
92
Liu, W. C., M. Ye, J. H. Liao, Z. H. Zhao, I. H. Kim, and L. L. 2018. An Application of complex probiotics in swine nutrition – A review. Ann. Anim. Sci. 18(2):335-350. doi:10.2478/aoas-2018-0005.
Liu, Y., C. D. Espinosa, J. J. Abelilla, G. A. Casas, L. V. Lagos, S. A. Lee, W. B. Kwon, J. K. Mathai, D. M. D. L. Navarro, N. W. Jaworski, and H. H. Stein. 2018. Non-antibiotic feed additives in diets for pigs: A review. Anim. Nutri. 4(2):113-125. doi:10.1016/j.aninu.2018.01.007.
Liu, Y., M. Song, T. M. Che, J. A. S. Almeida, J. J. Lee, D. Bravo, C. W. Maddox, and J. E. Pettigrew. 2013. Dietary plant extracts alleviate diarrhea and alter immune responses of weaned pigs experimentally infected with a pathogenic Escherichia
coli. J. Anim. Sci. 91:5294-5306. doi:10.2527/jas2012-6194.
Lu, H., Y. Yan, H. M. O’Neill, C. L. Bradley, M. Bedford, P. Wilcock, C. Nakatsu, O. Adeola, and K. M. Ajuwon. 2016. Effect of xylanase and live yeast supplementation on growth performance and gut microflora diversity of growing pigs. J. Anim. Sci. 94 (Supple. 5). Abstr.
Manzanilla, E. G., J. F. Perez, M. Martin, C. Kamel, F. Baucells, and J. Gasa. 2004. Effect of plant extract and formic acid on the intestinal equilibrium of early-weaned pigs. J. Anim. Sci. 82:3210-3218.
Mao, X. F., X. S. Piao, C. H. Lai, D. F. Li, J. J. Xing, and B. L. Shi. 2005. Effects of ß-glucan obtained from the Chinese herb Astragalus membranaceus and lipopolysaccharide challenge on performance, immunological, adrenal, and somatotropic responses of weanling pigs. J. Anim. Sci. 83(12):2775-2782.
Mao, X., X. Lai, B. Yu, J. Yu, P. Zheng, G. Tian, K. Zhang, and D. Chen. 2014. Effects of dietary threonine supplementation on immune challenge induced by swine Pseudorabies live vaccine in weaned pigs. Arch. Anim. Nutr. 68(1):1-15. doi:10.1080/1745039X.2013.869988.
Markowiak, P., and K. Śliżewska. 2018. The role of probiotics, prebiotics and synbiotics in animal nutrition. Gut pathog. 10(1):1-20.
Mayer, E. A. 1994. The physiology of gastric storage and emptying. Physiology of the
Gastrointestinal Tract. 3rd. ed. 1:929-976. L. R. Johnson, D. H. Alpers, J. Christensen, and E. Jacobsen, editors. New York: Lippencott Rave Press.
McGilvray, W. D., H. Wooten, A. R. Rakhshandeh, A. Petry, and A. Rakhshandeh. 2019. Immune system stimulation increases dietary threonine requirements for protein deposition in growing pigs. J. Anim. Sci. 97:735-744. doi:10.1093/jas/sky468.
93
Moeser, A. J., C. V. Klok, K. A. Ryan, J. G. Wooten, D. Little, V. L. Cook, and A. T. Blikslager. 2006. Stress signaling pathways activated by weaning mediate intestinal dysfunction in the pig. AJP-Gastrointest. Liver Physiol. 292:G173-G181. doi:10.1152/ajpgi.00197.2006.
Munasinghe, L. L., J. L. Robinson, S. V. Harding, J. A. Brunton, and R. F. Bertolo. 2017. Protein synthesis in mucin-producing tissues is conserved when dietary threonine is limiting in piglets. J. Nutr. doi:10.3945/jn.116.236786.
Myers, A. J., R. D. Goodband, M. D. Tokach, S. S. Dritz, J. M. DeRouchey, and J. L. Nelssen. 2014. The effects of porcine intestinal mucosa protein sources on nursery pig growth performance. J. Anim. Sci. 92:783-792. doi:10.2527/jas2013-6551.
Nabuurs, M. J. A., F. G. van Zijderveld, and P. W. De Leeuw. 1993a. Clinical and microbiological field studies in the Netherlands of diarrhoea in pigs at weaning. Res. Vet. Sci. 55:70-77. doi:10.1016/0034-5288(93)90037-G
NRC. 1998. Nutrient requirements of swine. 10th rev. ed. Natl. Acad. Press. Washington, D.C.
NRC. 2012. Nutrient requirements of swine. 11th rev. ed. Natl. Acad. Press. Washington, D.C.
Özcan, M. M., O. Sagdic, and G. Ozkan. 2006. Inhibitory effects of spice essential oils on the growth of Bacillus species. J. Medicinal Food. 9:418-421.
Partanen, K. H., and Z. Mroz. 1999. Organic acids for performance enhancement in pig diets. Nutr. Res. Rev. 12:117-145.
Pedersen, C., J. E. Lindberg, and S. Boisen. 2003. Determination of the optimal dietary threonine:lysine ratio for finishing pigs using three different methods. Livestock Prod. Sci. 82:233-243.
Pettigrew, J. E. 2006. Reduced use of antibiotic growth promoters in diets fed to weanling pigs: dietary tools, part 1. Anim. Biotechnol. 17(2):207-215. doi:10.1080/1049539060095946.
Pierce, J. L., G. L. Cromwell, M. D. Lindemann, L. E. Russell, and E. M. Weaver. 2005. Effects of spray-dried animal plasma and immunoglobins on performance of early weaned pigs. J. Anim. Sci. 83:2876-2885.
Pluske, J. R., D. J. Hampson, and I. H. Williams. 1997. Factors influencing the structure and function of the small intestine in the weaned pig: a review. Livestock Prod. Sci. 51:215-236.

94
Pluske, J. R., D. W. Patrick, and D. J. Hampson. 2002. Nutritional influences on some major enteric bacterial diseases in pigs. Nutr. Reseach Reviews. 15:333-371. doi:10.1079/NRR200242.
Pluske, J. R., J. C. Kim, and J. L. Black. 2018. Manipulating the immune system for pigs to optimize performance. Anim. Prod. Sci. 58:666-680. doi:10.1071/ANI7598.
Prieto, M. L., L. O’Sullivan, S. P. Tan, P. McLoughlin, H. Hughes, et al. 2013. In vitro assessment of a marine Bacillus for use as livestock probiotics. Mar drugs (submitted).
Prieto, M. L., L. O’Sullivan, S. P. Tan, P. McLoughlin, H. Hughes, O. O’Donovan, M. C. Rea, R. M. Kent, J. P. Cassidy, G. E. Gardiner, and P. G. Lawlor. 2014. Evaluation of the efficacy of a marine-derived Bacillus strain for use as an in-feed probiotic for newly weaned pigs. PLos ONE 9(2):e88599. doi:10.1371/journal.pone.0088599.
Sapkota, A. R., L. Y. Lefferts, S. McKenzie, and P. Walker. 2007. What do we feed to food-production animals? A review of animal feed ingredients and their potential impacts on human health. Environ. Health Perspect. 115:663-670.
Schaart, M. W., H. Scheirbeek, R. D. S. R. D. van der Schoor, B. Stoll, D. G. Burrin, P. J. Reeds, and J. B. van Goudoever. 2005. Threonine utilization is high in the intestine of piglets. J. Nutr. 135:765-770.
Shen, Y. B., X. S. Piao, S. W. Kim, L. Wang, P. Liu, I. Yoon, and Y. G. Zhen. 2009. Effects of yeast culture supplementation on growth performance, intestinal health, and immune response of nursery pigs. J. Anim. Sci. 87:2614-2624. doi:10.2527/jas.2008-1512.
Shriver, J. A., S. D. Carter, A. L. Sutton, B. T. Richert, B. W. Senne, and L. A. Pettey. 2003. Effects of adding fiber sources to reduced-crude protein, amino acid-supplemented diets on nitrogen excretion, growth performance, and carcass traits of finishing pigs. J. Anim. Sci. 81:492-502.
Shurson, G. C. 2018. Yeast and yeast derivatives in feed additives and ingredients; sources, characteristics, animal responses, and quantification methods. Anim. Feed Sci. Technol. 235:60-76. doi:10.1016/j.anifeedsci.2017.11.010.
Simon, O. 2005. Micro-organisms as feed additives – probiotics. Advances in pork production. 16:161-168.

95
Sivropoulou, A., E. Papanikolaou, C. Nikolaou, S. Kokkini, T. Lanaras, and M. Arsenakis. 1996. Antimicrobial and cytotoxic activities of Origanum essential oils. J. Ag. Food Chem. 44:1202-1205.
Smith, E. L., and R. D. Greene. 1947. Further studies on the amino acid composition of immune proteins. J. Biol. Chem. 171:355-362.
Snoeck, V., N. Huyghebaert, E. Cox, A. Vermeire, J. Saunders, J. P. Remon, F. Verschooten, and B. M. Goddeeris. 2004. Gastrointestinal transit time of non-disintegrating radio-opaque pellets in suckling and recently weaned piglets. J. Controlled Release. 94:143-153.
Sökmen, J. Serkedjieva, D. Daferera, M. Gulluce, M. Polissiou, B. Tepe, H. Askin Akpulat, F. Sahin, and A. Sokmen. 2004. In vitro antioxidant, antimicrobial, and antiviral activities of the essential oil and various extracts from herbal parts and callus cultures of Origanum acutidens. J. Agric. Food Chem. 52:3309-3312.
Song, S. K., B. R. Beck, D. Kim, J. Park, J. Kim, H. D. Kim, and E. Ringo. 2014. Prebiotics as immunostimulants in aquaculture: a review. Fish Shellfish Immunol. 40:40-48.
Spring, P., C. Wenk, and K. A. Dawson. 2000. The effects of dietary mannanoligosaccharides on cecal parameters and the concentrations of enteric bacteria in the ceca of Salmonella-challenged broiler chicks. Poult. Sci. 79:205-211.
Stein, H. H., and D. Y. Kil. 2006. Reduced use of antibiotic growth promoters in diets fed to weanling pigs: Dietary tools, Part 2. Anim. Biotechnol. 17(2):217-231.
Step, D. L., E. J. Giedt, and B. Whitworth. Accessed 2019. Veterinary Feed Directive. Oklahoma Cooperative Extension Serve. Oklahoma State University. Division of Agricultural Sciences and Natural Resources. Stillwater, OK.
Stoll, B., J. Henry, P. J. Reeds, H. Yu, F. Jahoor, and D. G. Burrin. 1998. Catabolism dominates the first-pass intestinal metabolism of dietary essential amino acids in milk-protein fed piglets. J. Nutr. 128:606-614.
Święch, E., M. Ceregrzyn, M. Taciak, A. Tuśnio, W. Korczyński, and L. Buraczewska. 2010. Effect of graded levels of dietary threonine on motility of the small intestine of young pigs. Livestock Sci. 134:239-242. doi:10.1016/j.livsci.2010.06.152.
Szabó, I., L. H. Wieler, K. Tedin. L. Scharek-Tedin, D. Taras, A. Hensel, B. Appel, and K. Nöckler. 2009. Influence of a probiotic strain of Enterococcus faecium on
96
Salmonella enterica serovar Tephimurium DT104 infection in a porcine animal infection model. Appl. Environ. Microbiol. 75:2621-2628.
Tanaka, T., Y. Imai, N. Kumagae, and S. Sato. 2010. The effect of feeding lactic acid to Salmonella Typhimurium experimentally infected swine. J. Vet. Med. Sci. 72(7):827-831.
Thomson, J. E., E. E. Jones, J. B. Koger, and E. J. Eisen. 1994. Growth responses of mice to different molecular weight fractions of porcine plasma proteins. J. Anim. Sci. 72(Suppl. 1):214. Abstr.
Tinti, J. M., D. Glaser, M. Wanner, and C. Nofre. 2000. Comparison of gustatory responses to amino acids in pigs and humans. Lebensm.-Wiss. u.-Techonol. 33:578-583.
Torrecillas, S., D. Montero, and M. Izquierdo. 2014. Improved health and growth of fish fed mannan oligosaccharides: potential mode of action. Fish and Shellfish Immunol. 36:525-544.
Touchette, K. J., J. A. Carroll, G. L. Alleee, R. L. Matteri, C. J. Dyer, L. A. Beausang, and M. E. Zannelli. 2002. Effect of spray-dried plasma and lipopolysaccharide exposure on weaned pigs I: Effects on the immune axis of weaned pigs. J. Anim. Sci. 80:494–501.
Trevisi, P., E. Corrent, M. Mazzoni, S. Messori, D. Priori, Y. Gherpelli, A. Simongiovanni, and P. Bosi. 2015. Effect of added dietary threonine on growth performance, health, immunity, and gastrointestinal function of weaning pigs with differeing genetic susceptibility to Escherichia coli infection and challenged with E. coli K88ac. J. Anim. Phys. and Anim. Nutr. doi:10.1111/jpn.12216.
Tsukahara, T., T. Tsuruta, N. Nakanishi, C. Hikita, M. Mochizuki, et al. 2013. The prevenetitive effect of Bacillus subtilis strain DB9011 against experimental infection with enterotoxcemic Esherichia coli in weaning pigs. Anim. Sci. 84:316-321.
Upadhaya, S. D., K. Y. Lee, S. Serpunja, T. H. Song, and I. H. Kim. 2018. Growth performance, nutrient digestibility, fecal microbiota and fecal noxious gas emission in weaning pigs fed high and low density diet with and without protected organic acid blends. Anim. Feed Sci. Technol. 239:1-8. doi:10.1016/j.anifeedsci.2017.12.013.
Van der Schoor, S. R. D., P. J. Reeds, B. Stoll, J. F. Henry, J. R. Rosenberger, D. G. Burrin, and J. B. van Goudoever. 2002. The high metabolic cost of a functional gut. Gastroenterology. 123:1931-1940.
97
van Dijk, A. J., H. Everts, M. J. A. Nabuurs, R. J. Margry, and A. C. Benyen. 2001. Growth performance of weanling pigs fed spray-dried animal plasma: A review. Livest. Prod. Sci. 68:263-274.
Walsh, M. C., M. H. Rostagno, G. E. Gardiner, A. L. Sutton, B. T. Richert, and J. S. Radcliffe. 2012. Controlling Salmonella infection in weanling pigs through water delivery of direct-fed microbials or organic acids. Part 1: Effects on growth performance, microbial populations, and immune status. J. Anim. Sci. 90:261-271. doi:10.2527/jas.2010-3598.
Wang, X., S. Y. Qiao, M. Liu, and Y. X. Ma. 2006. Effects of graded levels of true ileal digestible threonine on performance, serum parameters, and immune function of 10-25 kg pigs. Anim. Feed Sci. Technol. 129:264-278. doi:10.1016/j.anifeedsci.2006.01.003.
Wang, X., S. Qiao, Y. Yin, L. Yue, Z. Wang, and G. Wu. 2007. A deficiency or excess of dietary threonine reduces protein synthesis in jejunum and skeletal muscle of young pigs. J. Nutr. 137:1442-1446.
Wang, W., X. Zeng, X. Mao, G. Wu, and S. Qiao. 2010. Optimal dietary true ileal digestible threonine for supporting the mucosal barrier in small intestine of weanling pigs. J. Nutr. 140:981-986. doi:10.3945/jn.109.118497.
Wang, Y., J. Zhou, G. Wang, S. Cai, X. Zeng, and S. Qiao. 2018. Advances in low-protein diets for swine. J. Anim. Sci. Biotechnol. 9:60-75. doi:10.1186/s40104-018-0276-7.
Weaver, A. C., M. T. See, and S. W. Woo. 2014. Protective effect of two yeast based feed additives on pigs chronically exposed to deoxynivalenol and zearalenone. Toxins 6(12):3336-3353. doi:10.3390/toxins6123336.
Wierup, M. The Swedish experience of the 1986 year ban of antimicrobial growth promoters, with special reference to animal health, disease prevention, productivity, and usage of antimicrobials. Microb. Dru. Resist. 7:783-190. doi: 10.1089/10766290152045066
Woodworth, J. C., R. E. Musser, J. A. Loughmiller, M. D. Tokach, R. D. Goodband, and J. L. Nelssen. 1996. Effects of different specialty protein sources on growth performance of starter pigs. Kansas Agricultural Experiment Station Research Reports. 0(10). doi:10.4148/2378-5977.6552
Wu, Guoyao. 2013. Amino acids: biochemistry and nutrition. CRC Press. Boca Raton, Florida.
98
Xu, J., Y. Li, Z. Yang, C. Li, H. Liang, Z. Wu, and W. Pu. 2018. Yeast probiotics shape the gut microbiome and improve the health of early-weaned piglets. Front. Microbiol. 9:2011. doi:10.3389/fmicb.2018.02011.
Yang, X., J. Jim, and S. K. Baidoo. 2016. Dietary effect of lactose on growth performance of nursery pigs on a liquid feeding system. J. Anim. Sci. 94: (Supple. 2):131. Abstr.
Zaika, L. L., J. C. Kissinger, and A. E. Wasserman. 1983. Inhibition of lactic acid bacteria by herbs. J. Food Sci. 48:1455-1459.
Zhang, L., Z. Dhai, W. Zhu, Z. Wu, and G. Wu. 2017. Effects of plant extracts on amino acid metabolism in pig small-intestinal bacteria in vitro. J. Anim. Sci. 95(Suppl. 4):343-343. (Abstr.).
Zhao, J., A. F. Harper, M. J. Estienne, K. E. Webb Jr., A. P. McElroy, and D. M. Denbow. 2007. Growth performance and intestinal morphology responses in early weaned pigs to supplementation of antibiotic-free diets with an organic copper complex and spray-dried plasma protein in sanitary and nonsanitary environments. J. Anim. Sci. 85:1302-1310. doi:10.2527/jas.2006-434.
Zhu, C. L., H. Lapierre, M. Rademacher, and C. F. M. de Lange. 2003. Poetin infusion into the hindgut reduces the utilization of threonine intake for body protein deposition and urea flux in growing pigs. Pages 346-348 in Digestive Physiology in Pigs. Proc. 9th Intl. Symp. Vol. 2. R. O. Ball, ed. Univ. Alberta, Alberta, Canada.
99
APPENDICES
Appendix 1
Experiment 1
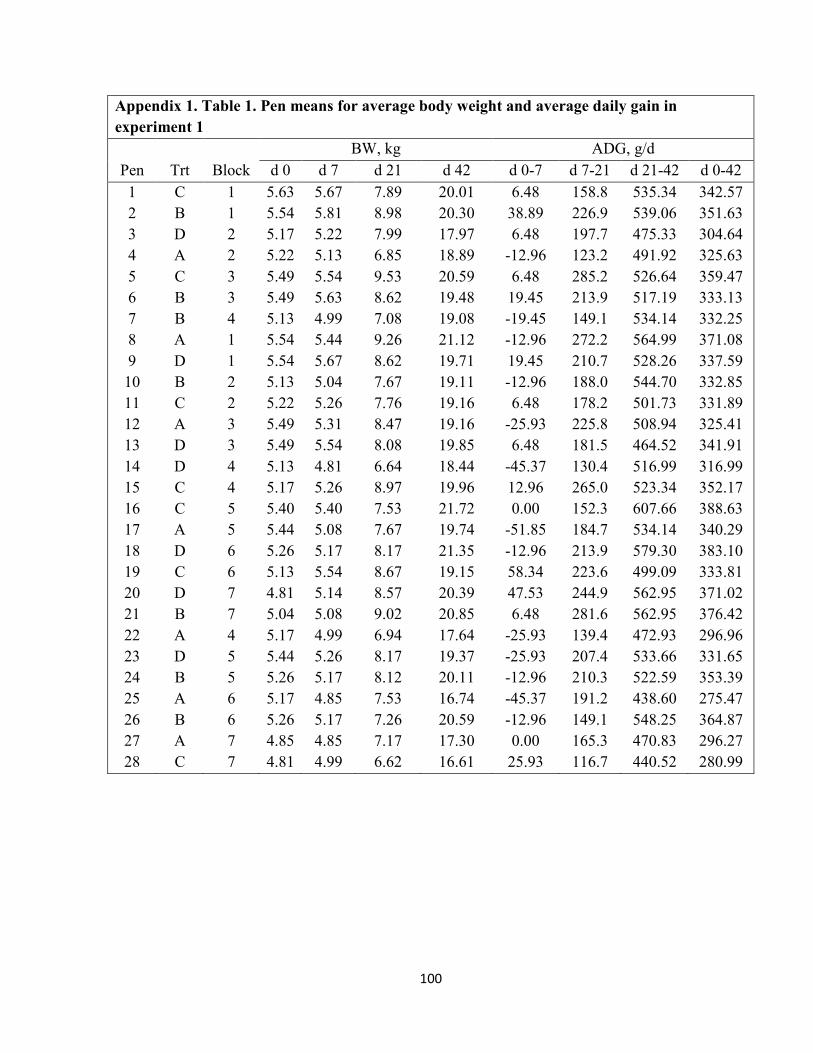
100
Appendix 1. Table 1. Pen means for average body weight and average daily gain in
experiment 1
BW, kg ADG, g/d Pen Trt Block d 0 d 7 d 21 d 42 d 0-7 d 7-21 d 21-42 d 0-42
1 2 3 4 5 6 7 8 9
10 11 12 13 14 15 16 17 18 19 20 21 22 23 24 25 26 27 28
C B D A C B B A D B C A D D C C A D C D B A D B A B A C
1 1 2 2 3 3 4 1 1 2 2 3 3 4 4 5 5 6 6 7 7 4 5 5 6 6 7 7
5.63 5.54 5.17 5.22 5.49 5.49 5.13 5.54 5.54 5.13 5.22 5.49 5.49 5.13 5.17 5.40 5.44 5.26 5.13 4.81 5.04 5.17 5.44 5.26 5.17 5.26 4.85 4.81
5.67 5.81 5.22 5.13 5.54 5.63 4.99 5.44 5.67 5.04 5.26 5.31 5.54 4.81 5.26 5.40 5.08 5.17 5.54 5.14 5.08 4.99 5.26 5.17 4.85 5.17 4.85 4.99
7.89 8.98 7.99 6.85 9.53 8.62 7.08 9.26 8.62 7.67 7.76 8.47 8.08 6.64 8.97 7.53 7.67 8.17 8.67 8.57 9.02 6.94 8.17 8.12 7.53 7.26 7.17 6.62
20.01 20.30 17.97 18.89 20.59 19.48 19.08 21.12 19.71 19.11 19.16 19.16 19.85 18.44 19.96 21.72 19.74 21.35 19.15 20.39 20.85 17.64 19.37 20.11 16.74 20.59 17.30 16.61
6.48 38.89 6.48
-12.96 6.48
19.45 -19.45 -12.96 19.45 -12.96 6.48
-25.93 6.48
-45.37 12.96 0.00
-51.85 -12.96 58.34 47.53 6.48
-25.93 -25.93 -12.96 -45.37 -12.96 0.00
25.93
158.8 226.9 197.7 123.2 285.2 213.9 149.1 272.2 210.7 188.0 178.2 225.8 181.5 130.4 265.0 152.3 184.7 213.9 223.6 244.9 281.6 139.4 207.4 210.3 191.2 149.1 165.3 116.7
535.34 539.06 475.33 491.92 526.64 517.19 534.14 564.99 528.26 544.70 501.73 508.94 464.52 516.99 523.34 607.66 534.14 579.30 499.09 562.95 562.95 472.93 533.66 522.59 438.60 548.25 470.83 440.52
342.57 351.63 304.64 325.63 359.47 333.13 332.25 371.08 337.59 332.85 331.89 325.41 341.91 316.99 352.17 388.63 340.29 383.10 333.81 371.02 376.42 296.96 331.65 353.39 275.47 364.87 296.27 280.99
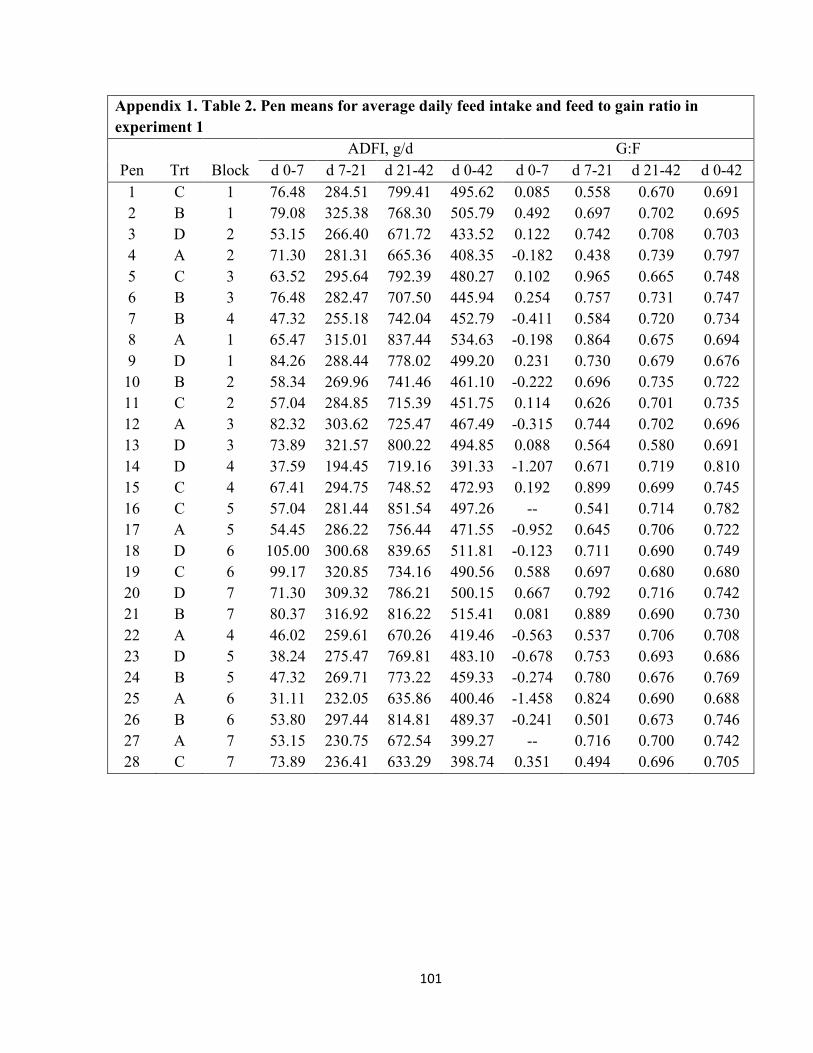
101
Appendix 1. Table 2. Pen means for average daily feed intake and feed to gain ratio in
experiment 1
ADFI, g/d G:F Pen Trt Block d 0-7 d 7-21 d 21-42 d 0-42 d 0-7 d 7-21 d 21-42 d 0-42
1 2 3 4 5 6 7 8 9
10 11 12 13 14 15 16 17 18 19 20 21 22 23 24 25 26 27 28
C B D A C B B A D B C A D D C C A D C D B A D B A B A C
1 1 2 2 3 3 4 1 1 2 2 3 3 4 4 5 5 6 6 7 7 4 5 5 6 6 7 7
76.48 79.08 53.15 71.30 63.52 76.48 47.32 65.47 84.26 58.34 57.04 82.32 73.89 37.59 67.41 57.04 54.45
105.00 99.17 71.30 80.37 46.02 38.24 47.32 31.11 53.80 53.15 73.89
284.51 325.38 266.40 281.31 295.64 282.47 255.18 315.01 288.44 269.96 284.85 303.62 321.57 194.45 294.75 281.44 286.22 300.68 320.85 309.32 316.92 259.61 275.47 269.71 232.05 297.44 230.75 236.41
799.41 768.30 671.72 665.36 792.39 707.50 742.04 837.44 778.02 741.46 715.39 725.47 800.22 719.16 748.52 851.54 756.44 839.65 734.16 786.21 816.22 670.26 769.81 773.22 635.86 814.81 672.54 633.29
495.62 505.79 433.52 408.35 480.27 445.94 452.79 534.63 499.20 461.10 451.75 467.49 494.85 391.33 472.93 497.26 471.55 511.81 490.56 500.15 515.41 419.46 483.10 459.33 400.46 489.37 399.27 398.74
0.085 0.492 0.122 -0.182 0.102 0.254 -0.411 -0.198 0.231 -0.222 0.114 -0.315 0.088 -1.207 0.192
-- -0.952 -0.123 0.588 0.667 0.081 -0.563 -0.678 -0.274 -1.458 -0.241
-- 0.351
0.558 0.697 0.742 0.438 0.965 0.757 0.584 0.864 0.730 0.696 0.626 0.744 0.564 0.671 0.899 0.541 0.645 0.711 0.697 0.792 0.889 0.537 0.753 0.780 0.824 0.501 0.716 0.494
0.670 0.702 0.708 0.739 0.665 0.731 0.720 0.675 0.679 0.735 0.701 0.702 0.580 0.719 0.699 0.714 0.706 0.690 0.680 0.716 0.690 0.706 0.693 0.676 0.690 0.673 0.700 0.696
0.691 0.695 0.703 0.797 0.748 0.747 0.734 0.694 0.676 0.722 0.735 0.696 0.691 0.810 0.745 0.782 0.722 0.749 0.680 0.742 0.730 0.708 0.686 0.769 0.688 0.746 0.742 0.705
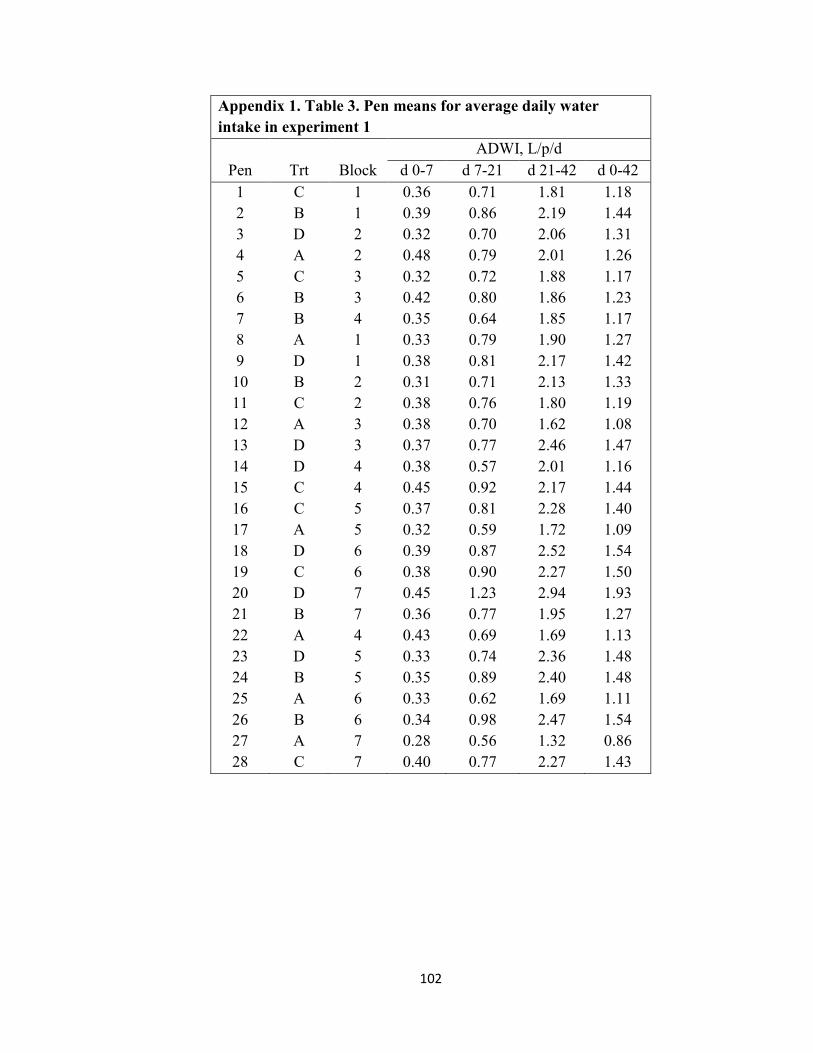
102
Appendix 1. Table 3. Pen means for average daily water
intake in experiment 1
ADWI, L/p/d Pen Trt Block d 0-7 d 7-21 d 21-42 d 0-42
1 2 3 4 5 6 7 8 9
10 11 12 13 14 15 16 17 18 19 20 21 22 23 24 25 26 27 28
C B D A C B B A D B C A D D C C A D C D B A D B A B A C
1 1 2 2 3 3 4 1 1 2 2 3 3 4 4 5 5 6 6 7 7 4 5 5 6 6 7 7
0.36 0.39 0.32 0.48 0.32 0.42 0.35 0.33 0.38 0.31 0.38 0.38 0.37 0.38 0.45 0.37 0.32 0.39 0.38 0.45 0.36 0.43 0.33 0.35 0.33 0.34 0.28 0.40
0.71 0.86 0.70 0.79 0.72 0.80 0.64 0.79 0.81 0.71 0.76 0.70 0.77 0.57 0.92 0.81 0.59 0.87 0.90 1.23 0.77 0.69 0.74 0.89 0.62 0.98 0.56 0.77
1.81 2.19 2.06 2.01 1.88 1.86 1.85 1.90 2.17 2.13 1.80 1.62 2.46 2.01 2.17 2.28 1.72 2.52 2.27 2.94 1.95 1.69 2.36 2.40 1.69 2.47 1.32 2.27
1.18 1.44 1.31 1.26 1.17 1.23 1.17 1.27 1.42 1.33 1.19 1.08 1.47 1.16 1.44 1.40 1.09 1.54 1.50 1.93 1.27 1.13 1.48 1.48 1.11 1.54 0.86 1.43

103
Appendix 2
Experiment 2
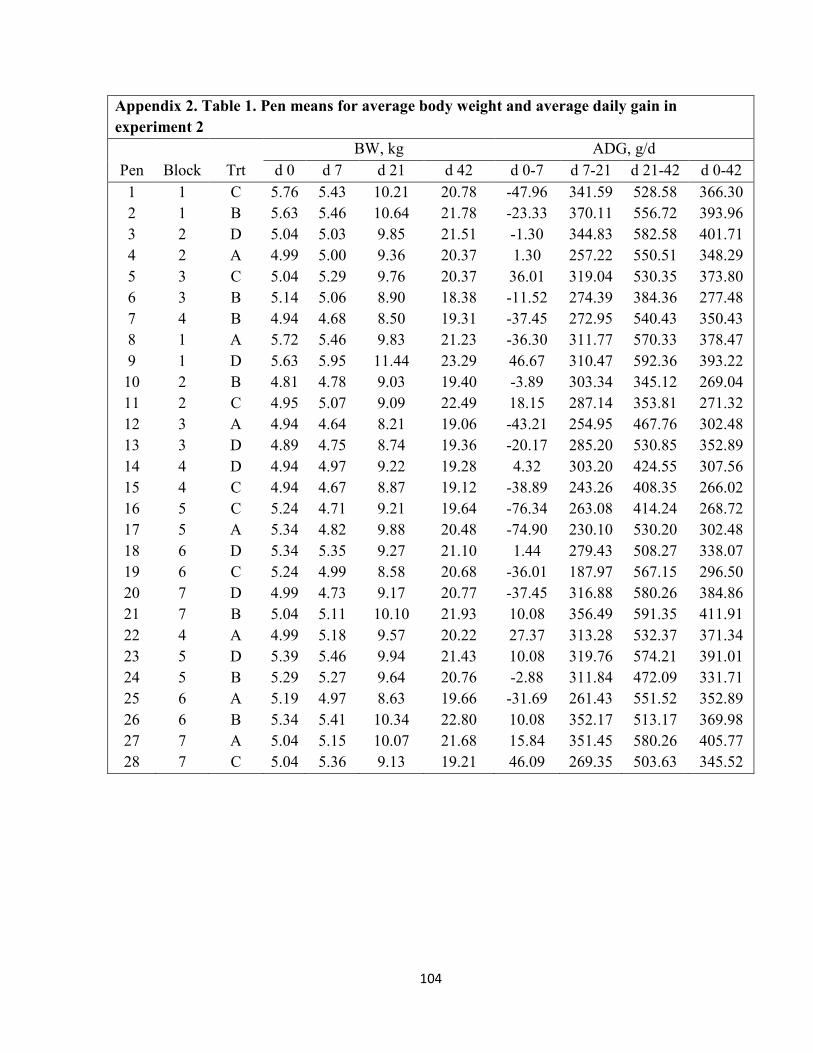
104
Appendix 2. Table 1. Pen means for average body weight and average daily gain in
experiment 2
BW, kg ADG, g/d Pen Block Trt d 0 d 7 d 21 d 42 d 0-7 d 7-21 d 21-42 d 0-42
1 2 3 4 5 6 7 8 9
10 11 12 13 14 15 16 17 18 19 20 21 22 23 24 25 26 27 28
1 1 2 2 3 3 4 1 1 2 2 3 3 4 4 5 5 6 6 7 7 4 5 5 6 6 7 7
C B D A C B B A D B C A D D C C A D C D B A D B A B A C
5.76 5.63 5.04 4.99 5.04 5.14 4.94 5.72 5.63 4.81 4.95 4.94 4.89 4.94 4.94 5.24 5.34 5.34 5.24 4.99 5.04 4.99 5.39 5.29 5.19 5.34 5.04 5.04
5.43 5.46 5.03 5.00 5.29 5.06 4.68 5.46 5.95 4.78 5.07 4.64 4.75 4.97 4.67 4.71 4.82 5.35 4.99 4.73 5.11 5.18 5.46 5.27 4.97 5.41 5.15 5.36
10.21 10.64 9.85 9.36 9.76 8.90 8.50 9.83
11.44 9.03 9.09 8.21 8.74 9.22 8.87 9.21 9.88 9.27 8.58 9.17
10.10 9.57 9.94 9.64 8.63
10.34 10.07 9.13
20.78 21.78 21.51 20.37 20.37 18.38 19.31 21.23 23.29 19.40 22.49 19.06 19.36 19.28 19.12 19.64 20.48 21.10 20.68 20.77 21.93 20.22 21.43 20.76 19.66 22.80 21.68 19.21
-47.96 -23.33 -1.30 1.30
36.01 -11.52 -37.45 -36.30 46.67 -3.89 18.15 -43.21 -20.17 4.32
-38.89 -76.34 -74.90 1.44
-36.01 -37.45 10.08 27.37 10.08 -2.88
-31.69 10.08 15.84 46.09
341.59 370.11 344.83 257.22 319.04 274.39 272.95 311.77 310.47 303.34 287.14 254.95 285.20 303.20 243.26 263.08 230.10 279.43 187.97 316.88 356.49 313.28 319.76 311.84 261.43 352.17 351.45 269.35
528.58 556.72 582.58 550.51 530.35 384.36 540.43 570.33 592.36 345.12 353.81 467.76 530.85 424.55 408.35 414.24 530.20 508.27 567.15 580.26 591.35 532.37 574.21 472.09 551.52 513.17 580.26 503.63
366.30 393.96 401.71 348.29 373.80 277.48 350.43 378.47 393.22 269.04 271.32 302.48 352.89 307.56 266.02 268.72 302.48 338.07 296.50 384.86 411.91 371.34 391.01 331.71 352.89 369.98 405.77 345.52
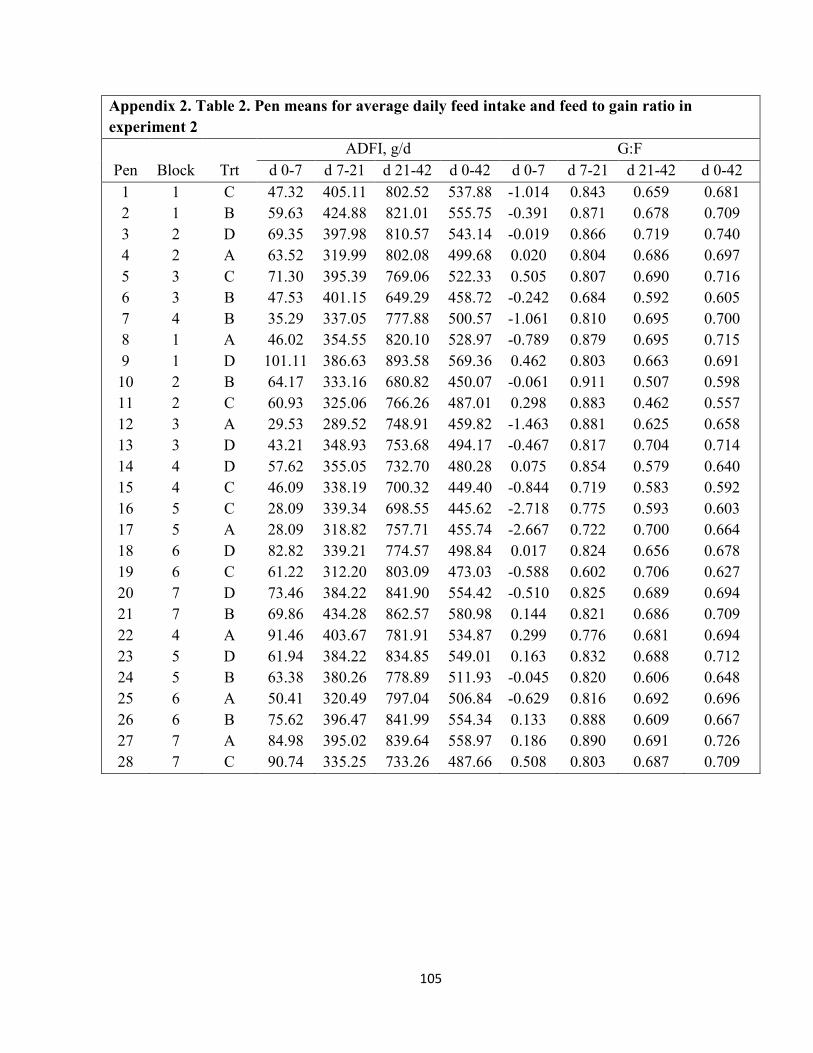
105
Appendix 2. Table 2. Pen means for average daily feed intake and feed to gain ratio in
experiment 2
ADFI, g/d G:F Pen Block Trt d 0-7 d 7-21 d 21-42 d 0-42 d 0-7 d 7-21 d 21-42 d 0-42
1 2 3 4 5 6 7 8 9
10 11 12 13 14 15 16 17 18 19 20 21 22 23 24 25 26 27 28
1 1 2 2 3 3 4 1 1 2 2 3 3 4 4 5 5 6 6 7 7 4 5 5 6 6 7 7
C B D A C B B A D B C A D D C C A D C D B A D B A B A C
47.32 59.63 69.35 63.52 71.30 47.53 35.29 46.02
101.11 64.17 60.93 29.53 43.21 57.62 46.09 28.09 28.09 82.82 61.22 73.46 69.86 91.46 61.94 63.38 50.41 75.62 84.98 90.74
405.11 424.88 397.98 319.99 395.39 401.15 337.05 354.55 386.63 333.16 325.06 289.52 348.93 355.05 338.19 339.34 318.82 339.21 312.20 384.22 434.28 403.67 384.22 380.26 320.49 396.47 395.02 335.25
802.52 821.01 810.57 802.08 769.06 649.29 777.88 820.10 893.58 680.82 766.26 748.91 753.68 732.70 700.32 698.55 757.71 774.57 803.09 841.90 862.57 781.91 834.85 778.89 797.04 841.99 839.64 733.26
537.88 555.75 543.14 499.68 522.33 458.72 500.57 528.97 569.36 450.07 487.01 459.82 494.17 480.28 449.40 445.62 455.74 498.84 473.03 554.42 580.98 534.87 549.01 511.93 506.84 554.34 558.97 487.66
-1.014 -0.391 -0.019 0.020 0.505 -0.242 -1.061 -0.789 0.462 -0.061 0.298 -1.463 -0.467 0.075 -0.844 -2.718 -2.667 0.017 -0.588 -0.510 0.144 0.299 0.163 -0.045 -0.629 0.133 0.186 0.508
0.843 0.871 0.866 0.804 0.807 0.684 0.810 0.879 0.803 0.911 0.883 0.881 0.817 0.854 0.719 0.775 0.722 0.824 0.602 0.825 0.821 0.776 0.832 0.820 0.816 0.888 0.890 0.803
0.659 0.678 0.719 0.686 0.690 0.592 0.695 0.695 0.663 0.507 0.462 0.625 0.704 0.579 0.583 0.593 0.700 0.656 0.706 0.689 0.686 0.681 0.688 0.606 0.692 0.609 0.691 0.687
0.681 0.709 0.740 0.697 0.716 0.605 0.700 0.715 0.691 0.598 0.557 0.658 0.714 0.640 0.592 0.603 0.664 0.678 0.627 0.694 0.709 0.694 0.712 0.648 0.696 0.667 0.726 0.709
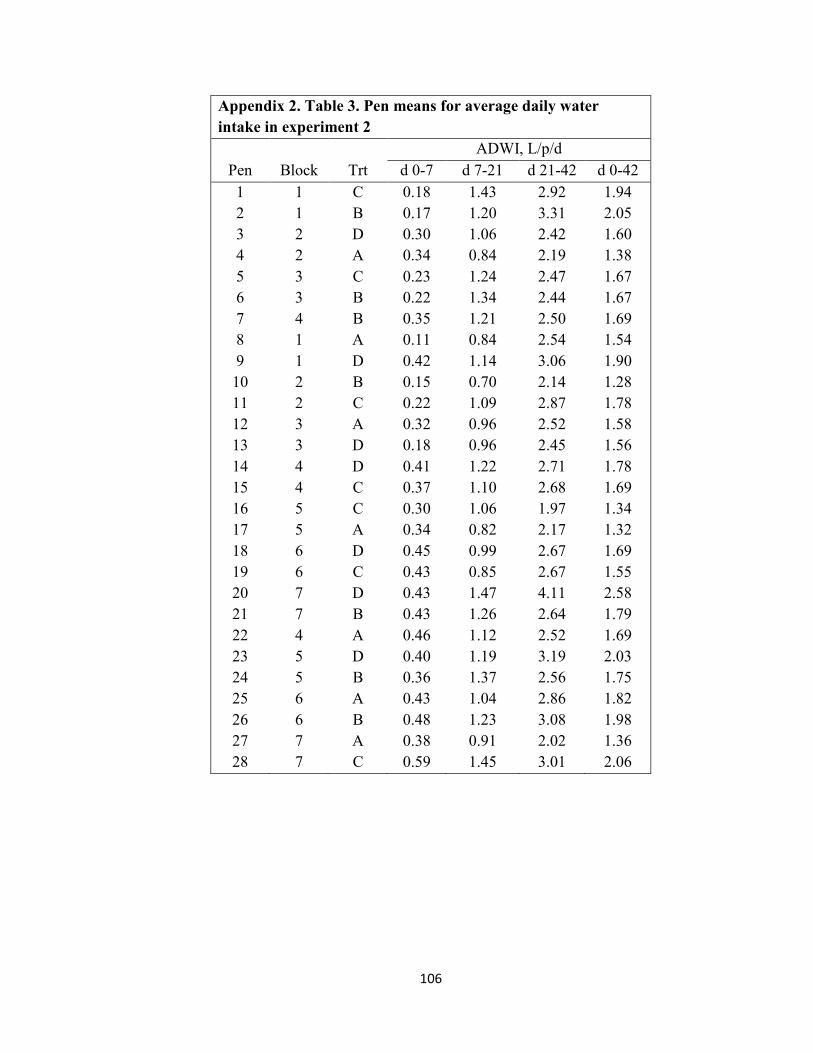
106
Appendix 2. Table 3. Pen means for average daily water
intake in experiment 2
ADWI, L/p/d Pen Block Trt d 0-7 d 7-21 d 21-42 d 0-42
1 2 3 4 5 6 7 8 9
10 11 12 13 14 15 16 17 18 19 20 21 22 23 24 25 26 27 28
1 1 2 2 3 3 4 1 1 2 2 3 3 4 4 5 5 6 6 7 7 4 5 5 6 6 7 7
C B D A C B B A D B C A D D C C A D C D B A D B A B A C
0.18 0.17 0.30 0.34 0.23 0.22 0.35 0.11 0.42 0.15 0.22 0.32 0.18 0.41 0.37 0.30 0.34 0.45 0.43 0.43 0.43 0.46 0.40 0.36 0.43 0.48 0.38 0.59
1.43 1.20 1.06 0.84 1.24 1.34 1.21 0.84 1.14 0.70 1.09 0.96 0.96 1.22 1.10 1.06 0.82 0.99 0.85 1.47 1.26 1.12 1.19 1.37 1.04 1.23 0.91 1.45
2.92 3.31 2.42 2.19 2.47 2.44 2.50 2.54 3.06 2.14 2.87 2.52 2.45 2.71 2.68 1.97 2.17 2.67 2.67 4.11 2.64 2.52 3.19 2.56 2.86 3.08 2.02 3.01
1.94 2.05 1.60 1.38 1.67 1.67 1.69 1.54 1.90 1.28 1.78 1.58 1.56 1.78 1.69 1.34 1.32 1.69 1.55 2.58 1.79 1.69 2.03 1.75 1.82 1.98 1.36 2.06

107
Appendix 3
Experiment 3
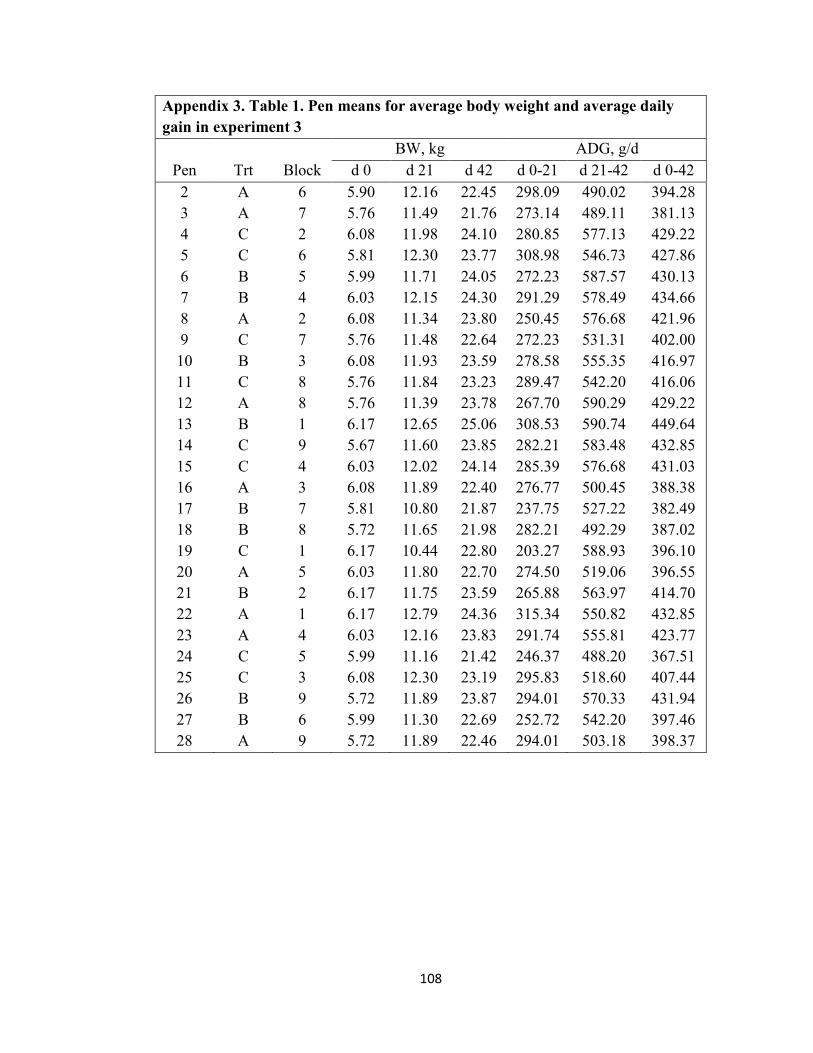
108
Appendix 3. Table 1. Pen means for average body weight and average daily
gain in experiment 3
BW, kg ADG, g/d Pen Trt Block d 0 d 21 d 42 d 0-21 d 21-42 d 0-42
2 3 4 5 6 7 8 9
10 11 12 13 14 15 16 17 18 19 20 21 22 23 24 25 26 27 28
A A C C B B A C B C A B C C A B B C A B A A C C B B A
6 7 2 6 5 4 2 7 3 8 8 1 9 4 3 7 8 1 5 2 1 4 5 3 9 6 9
5.90 5.76 6.08 5.81 5.99 6.03 6.08 5.76 6.08 5.76 5.76 6.17 5.67 6.03 6.08 5.81 5.72 6.17 6.03 6.17 6.17 6.03 5.99 6.08 5.72 5.99 5.72
12.16 11.49 11.98 12.30 11.71 12.15 11.34 11.48 11.93 11.84 11.39 12.65 11.60 12.02 11.89 10.80 11.65 10.44 11.80 11.75 12.79 12.16 11.16 12.30 11.89 11.30 11.89
22.45 21.76 24.10 23.77 24.05 24.30 23.80 22.64 23.59 23.23 23.78 25.06 23.85 24.14 22.40 21.87 21.98 22.80 22.70 23.59 24.36 23.83 21.42 23.19 23.87 22.69 22.46
298.09 273.14 280.85 308.98 272.23 291.29 250.45 272.23 278.58 289.47 267.70 308.53 282.21 285.39 276.77 237.75 282.21 203.27 274.50 265.88 315.34 291.74 246.37 295.83 294.01 252.72 294.01
490.02 489.11 577.13 546.73 587.57 578.49 576.68 531.31 555.35 542.20 590.29 590.74 583.48 576.68 500.45 527.22 492.29 588.93 519.06 563.97 550.82 555.81 488.20 518.60 570.33 542.20 503.18
394.28 381.13 429.22 427.86 430.13 434.66 421.96 402.00 416.97 416.06 429.22 449.64 432.85 431.03 388.38 382.49 387.02 396.10 396.55 414.70 432.85 423.77 367.51 407.44 431.94 397.46 398.37
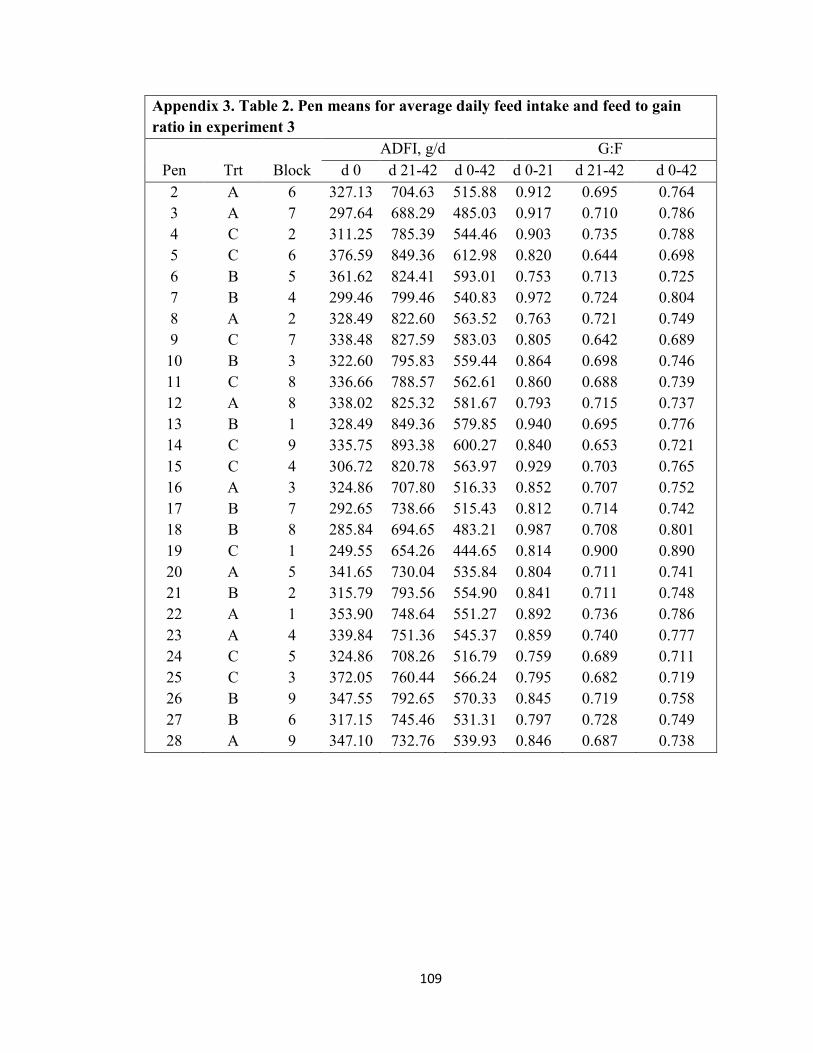
109
Appendix 3. Table 2. Pen means for average daily feed intake and feed to gain
ratio in experiment 3
ADFI, g/d G:F Pen Trt Block d 0 d 21-42 d 0-42 d 0-21 d 21-42 d 0-42
2 3 4 5 6 7 8 9
10 11 12 13 14 15 16 17 18 19 20 21 22 23 24 25 26 27 28
A A C C B B A C B C A B C C A B B C A B A A C C B B A
6 7 2 6 5 4 2 7 3 8 8 1 9 4 3 7 8 1 5 2 1 4 5 3 9 6 9
327.13 297.64 311.25 376.59 361.62 299.46 328.49 338.48 322.60 336.66 338.02 328.49 335.75 306.72 324.86 292.65 285.84 249.55 341.65 315.79 353.90 339.84 324.86 372.05 347.55 317.15 347.10
704.63 688.29 785.39 849.36 824.41 799.46 822.60 827.59 795.83 788.57 825.32 849.36 893.38 820.78 707.80 738.66 694.65 654.26 730.04 793.56 748.64 751.36 708.26 760.44 792.65 745.46 732.76
515.88 485.03 544.46 612.98 593.01 540.83 563.52 583.03 559.44 562.61 581.67 579.85 600.27 563.97 516.33 515.43 483.21 444.65 535.84 554.90 551.27 545.37 516.79 566.24 570.33 531.31 539.93
0.912 0.917 0.903 0.820 0.753 0.972 0.763 0.805 0.864 0.860 0.793 0.940 0.840 0.929 0.852 0.812 0.987 0.814 0.804 0.841 0.892 0.859 0.759 0.795 0.845 0.797 0.846
0.695 0.710 0.735 0.644 0.713 0.724 0.721 0.642 0.698 0.688 0.715 0.695 0.653 0.703 0.707 0.714 0.708 0.900 0.711 0.711 0.736 0.740 0.689 0.682 0.719 0.728 0.687
0.764 0.786 0.788 0.698 0.725 0.804 0.749 0.689 0.746 0.739 0.737 0.776 0.721 0.765 0.752 0.742 0.801 0.890 0.741 0.748 0.786 0.777 0.711 0.719 0.758 0.749 0.738
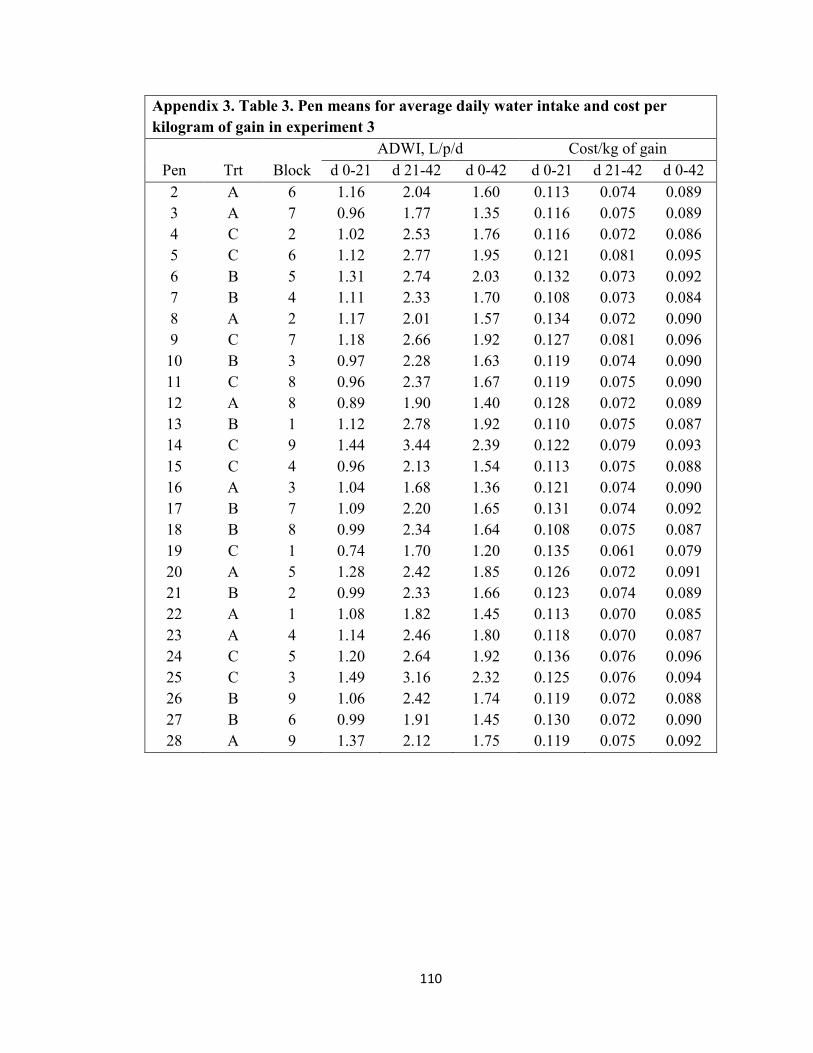
110
Appendix 3. Table 3. Pen means for average daily water intake and cost per
kilogram of gain in experiment 3
ADWI, L/p/d Cost/kg of gain Pen Trt Block d 0-21 d 21-42 d 0-42 d 0-21 d 21-42 d 0-42
2 3 4 5 6 7 8 9
10 11 12 13 14 15 16 17 18 19 20 21 22 23 24 25 26 27 28
A A C C B B A C B C A B C C A B B C A B A A C C B B A
6 7 2 6 5 4 2 7 3 8 8 1 9 4 3 7 8 1 5 2 1 4 5 3 9 6 9
1.16 0.96 1.02 1.12 1.31 1.11 1.17 1.18 0.97 0.96 0.89 1.12 1.44 0.96 1.04 1.09 0.99 0.74 1.28 0.99 1.08 1.14 1.20 1.49 1.06 0.99 1.37
2.04 1.77 2.53 2.77 2.74 2.33 2.01 2.66 2.28 2.37 1.90 2.78 3.44 2.13 1.68 2.20 2.34 1.70 2.42 2.33 1.82 2.46 2.64 3.16 2.42 1.91 2.12
1.60 1.35 1.76 1.95 2.03 1.70 1.57 1.92 1.63 1.67 1.40 1.92 2.39 1.54 1.36 1.65 1.64 1.20 1.85 1.66 1.45 1.80 1.92 2.32 1.74 1.45 1.75
0.113 0.116 0.116 0.121 0.132 0.108 0.134 0.127 0.119 0.119 0.128 0.110 0.122 0.113 0.121 0.131 0.108 0.135 0.126 0.123 0.113 0.118 0.136 0.125 0.119 0.130 0.119
0.074 0.075 0.072 0.081 0.073 0.073 0.072 0.081 0.074 0.075 0.072 0.075 0.079 0.075 0.074 0.074 0.075 0.061 0.072 0.074 0.070 0.070 0.076 0.076 0.072 0.072 0.075
0.089 0.089 0.086 0.095 0.092 0.084 0.090 0.096 0.090 0.090 0.089 0.087 0.093 0.088 0.090 0.092 0.087 0.079 0.091 0.089 0.085 0.087 0.096 0.094 0.088 0.090 0.092

111
Experiment 4
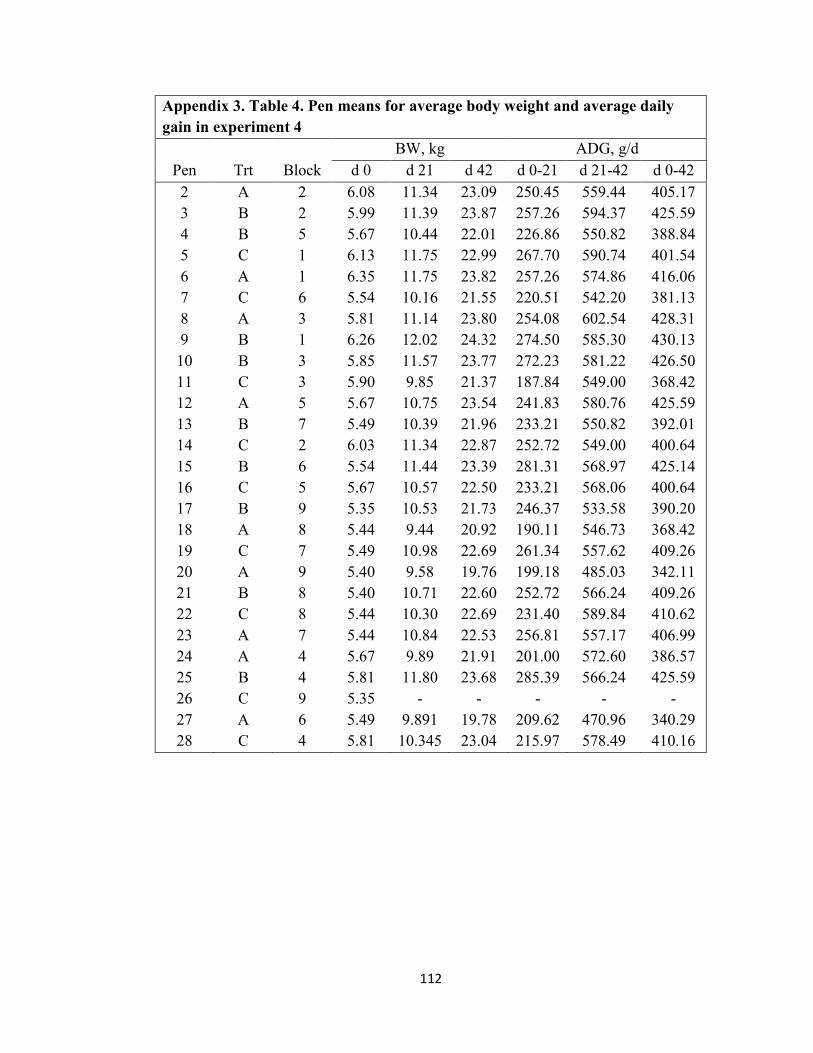
112
Appendix 3. Table 4. Pen means for average body weight and average daily
gain in experiment 4
BW, kg ADG, g/d Pen Trt Block d 0 d 21 d 42 d 0-21 d 21-42 d 0-42
2 3 4 5 6 7 8 9
10 11 12 13 14 15 16 17 18 19 20 21 22 23 24 25 26 27 28
A B B C A C A B B C A B C B C B A C A B C A A B C A C
2 2 5 1 1 6 3 1 3 3 5 7 2 6 5 9 8 7 9 8 8 7 4 4 9 6 4
6.08 5.99 5.67 6.13 6.35 5.54 5.81 6.26 5.85 5.90 5.67 5.49 6.03 5.54 5.67 5.35 5.44 5.49 5.40 5.40 5.44 5.44 5.67 5.81 5.35 5.49 5.81
11.34 11.39 10.44 11.75 11.75 10.16 11.14 12.02 11.57 9.85
10.75 10.39 11.34 11.44 10.57 10.53 9.44
10.98 9.58
10.71 10.30 10.84 9.89
11.80 -
9.891 10.345
23.09 23.87 22.01 22.99 23.82 21.55 23.80 24.32 23.77 21.37 23.54 21.96 22.87 23.39 22.50 21.73 20.92 22.69 19.76 22.60 22.69 22.53 21.91 23.68
- 19.78 23.04
250.45 257.26 226.86 267.70 257.26 220.51 254.08 274.50 272.23 187.84 241.83 233.21 252.72 281.31 233.21 246.37 190.11 261.34 199.18 252.72 231.40 256.81 201.00 285.39
- 209.62 215.97
559.44 594.37 550.82 590.74 574.86 542.20 602.54 585.30 581.22 549.00 580.76 550.82 549.00 568.97 568.06 533.58 546.73 557.62 485.03 566.24 589.84 557.17 572.60 566.24
- 470.96 578.49
405.17 425.59 388.84 401.54 416.06 381.13 428.31 430.13 426.50 368.42 425.59 392.01 400.64 425.14 400.64 390.20 368.42 409.26 342.11 409.26 410.62 406.99 386.57 425.59
- 340.29 410.16
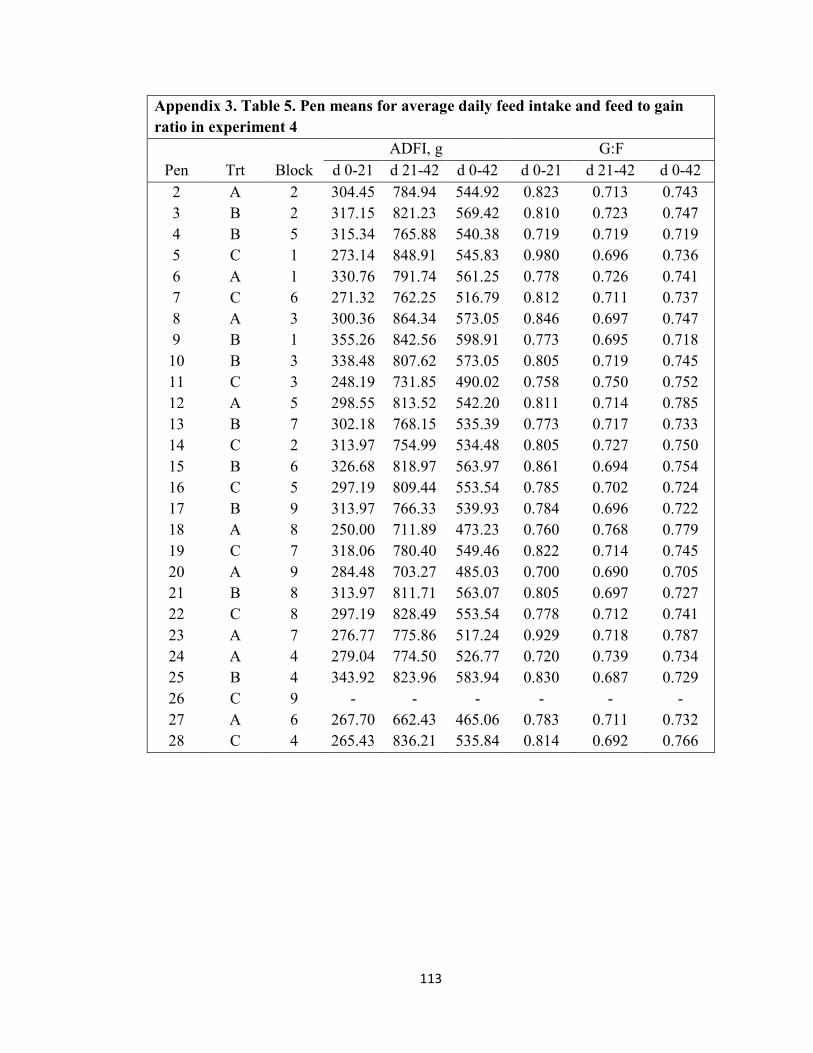
113
Appendix 3. Table 5. Pen means for average daily feed intake and feed to gain
ratio in experiment 4
ADFI, g G:F Pen Trt Block d 0-21 d 21-42 d 0-42 d 0-21 d 21-42 d 0-42
2 3 4 5 6 7 8 9
10 11 12 13 14 15 16 17 18 19 20 21 22 23 24 25 26 27 28
A B B C A C A B B C A B C B C B A C A B C A A B C A C
2 2 5 1 1 6 3 1 3 3 5 7 2 6 5 9 8 7 9 8 8 7 4 4 9 6 4
304.45 317.15 315.34 273.14 330.76 271.32 300.36 355.26 338.48 248.19 298.55 302.18 313.97 326.68 297.19 313.97 250.00 318.06 284.48 313.97 297.19 276.77 279.04 343.92
- 267.70 265.43
784.94 821.23 765.88 848.91 791.74 762.25 864.34 842.56 807.62 731.85 813.52 768.15 754.99 818.97 809.44 766.33 711.89 780.40 703.27 811.71 828.49 775.86 774.50 823.96
- 662.43 836.21
544.92 569.42 540.38 545.83 561.25 516.79 573.05 598.91 573.05 490.02 542.20 535.39 534.48 563.97 553.54 539.93 473.23 549.46 485.03 563.07 553.54 517.24 526.77 583.94
- 465.06 535.84
0.823 0.810 0.719 0.980 0.778 0.812 0.846 0.773 0.805 0.758 0.811 0.773 0.805 0.861 0.785 0.784 0.760 0.822 0.700 0.805 0.778 0.929 0.720 0.830
- 0.783 0.814
0.713 0.723 0.719 0.696 0.726 0.711 0.697 0.695 0.719 0.750 0.714 0.717 0.727 0.694 0.702 0.696 0.768 0.714 0.690 0.697 0.712 0.718 0.739 0.687
- 0.711 0.692
0.743 0.747 0.719 0.736 0.741 0.737 0.747 0.718 0.745 0.752 0.785 0.733 0.750 0.754 0.724 0.722 0.779 0.745 0.705 0.727 0.741 0.787 0.734 0.729
- 0.732 0.766
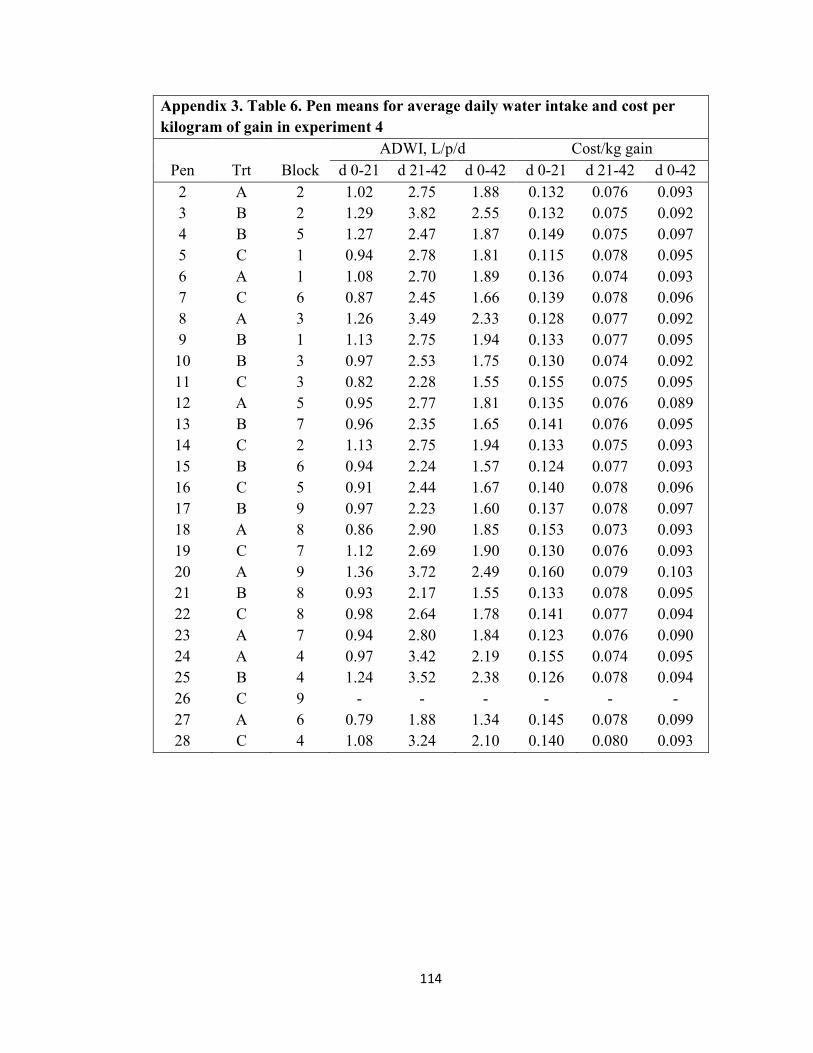
114
Appendix 3. Table 6. Pen means for average daily water intake and cost per
kilogram of gain in experiment 4
ADWI, L/p/d Cost/kg gain Pen Trt Block d 0-21 d 21-42 d 0-42 d 0-21 d 21-42 d 0-42
2 3 4 5 6 7 8 9
10 11 12 13 14 15 16 17 18 19 20 21 22 23 24 25 26 27 28
A B B C A C A B B C A B C B C B A C A B C A A B C A C
2 2 5 1 1 6 3 1 3 3 5 7 2 6 5 9 8 7 9 8 8 7 4 4 9 6 4
1.02 1.29 1.27 0.94 1.08 0.87 1.26 1.13 0.97 0.82 0.95 0.96 1.13 0.94 0.91 0.97 0.86 1.12 1.36 0.93 0.98 0.94 0.97 1.24
- 0.79 1.08
2.75 3.82 2.47 2.78 2.70 2.45 3.49 2.75 2.53 2.28 2.77 2.35 2.75 2.24 2.44 2.23 2.90 2.69 3.72 2.17 2.64 2.80 3.42 3.52
- 1.88 3.24
1.88 2.55 1.87 1.81 1.89 1.66 2.33 1.94 1.75 1.55 1.81 1.65 1.94 1.57 1.67 1.60 1.85 1.90 2.49 1.55 1.78 1.84 2.19 2.38
- 1.34 2.10
0.132 0.132 0.149 0.115 0.136 0.139 0.128 0.133 0.130 0.155 0.135 0.141 0.133 0.124 0.140 0.137 0.153 0.130 0.160 0.133 0.141 0.123 0.155 0.126
- 0.145 0.140
0.076 0.075 0.075 0.078 0.074 0.078 0.077 0.077 0.074 0.075 0.076 0.076 0.075 0.077 0.078 0.078 0.073 0.076 0.079 0.078 0.077 0.076 0.074 0.078
- 0.078 0.080
0.093 0.092 0.097 0.095 0.093 0.096 0.092 0.095 0.092 0.095 0.089 0.095 0.093 0.093 0.096 0.097 0.093 0.093 0.103 0.095 0.094 0.090 0.095 0.094
- 0.099 0.093
VITA
Afton Marie Sawyer
Candidate for the Degree of
Master of Science Thesis: IMPACTS OF A NUTRITIONAL WATER SUPPLEMENT AND
THREONINE TO LYSINE RATIOS ON GROWTH PERFORMANCE OF NURSERY PIGS
Major Field: Animal Science Biographical: Afton Marie Sawyer was born on October 17, 1991 in San Luis Obispo,
CA to Charles Sawyer and Melody Mihesuah
Education: Completed the requirements for the Master of Science in Animal Science at Oklahoma State University, Stillwater, Oklahoma in July, 2019.
Completed the requirements for the Bachelor of Science in Animal at Oklahoma State University, Stillwater, Oklahoma in 2016. Experience: Graduate Research Assistant, Oklahoma State University, Stillwater, Oklahoma,
2017-2019. Slaughter Supervisor, Cargill, Beef Division, Fresno, California, 2017. Operations Associate, Cargill, Beef Division, Fresno, California, 2016 – 2017. Animal Agriculture Intern, Cargill, Live Pork Division, Dalhart, Texas, 2015. Professional Memberships: American Society of Animal Science (ASAS)