Unraveling the sequence-dependent polymorphic behavior of d(CpG) steps in B-DNA
Upload
independentCategory
view
1download
0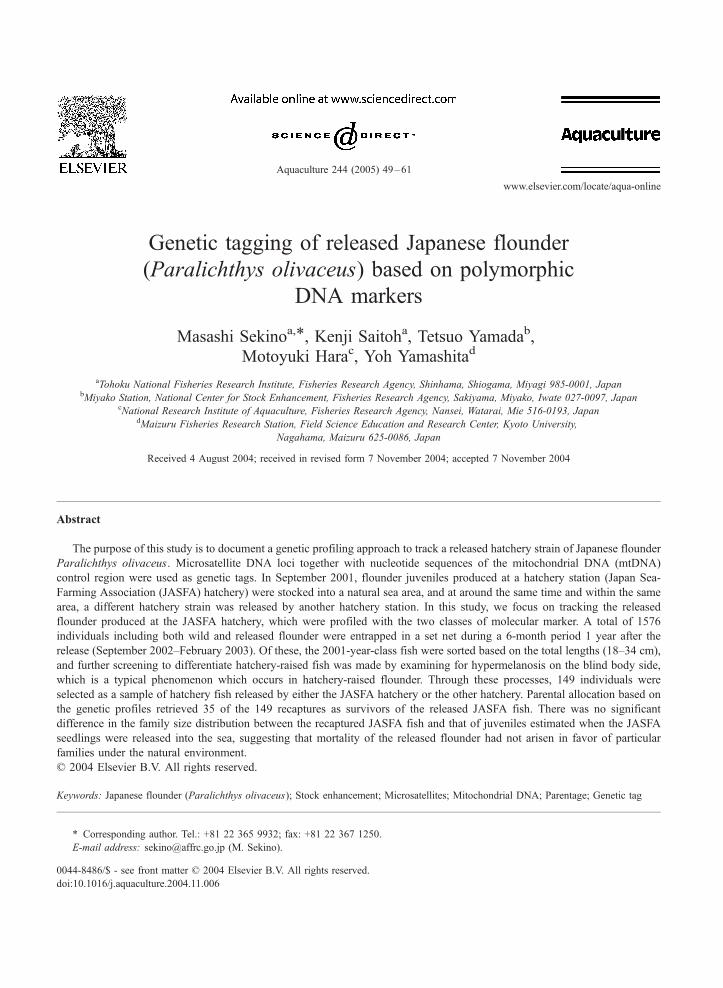
www.elsevier.com/locate/aqua-online
Aquaculture 244
Genetic tagging of released Japanese flounder
(Paralichthys olivaceus) based on polymorphic
DNA markers
Masashi Sekinoa,*, Kenji Saitoha, Tetsuo Yamadab,
Motoyuki Harac, Yoh Yamashitad
aTohoku National Fisheries Research Institute, Fisheries Research Agency, Shinhama, Shiogama, Miyagi 985-0001, JapanbMiyako Station, National Center for Stock Enhancement, Fisheries Research Agency, Sakiyama, Miyako, Iwate 027-0097, Japan
cNational Research Institute of Aquaculture, Fisheries Research Agency, Nansei, Watarai, Mie 516-0193, JapandMaizuru Fisheries Research Station, Field Science Education and Research Center, Kyoto University,
Nagahama, Maizuru 625-0086, Japan
Received 4 August 2004; received in revised form 7 November 2004; accepted 7 November 2004
Abstract
The purpose of this study is to document a genetic profiling approach to track a released hatchery strain of Japanese flounder
Paralichthys olivaceus. Microsatellite DNA loci together with nucleotide sequences of the mitochondrial DNA (mtDNA)
control region were used as genetic tags. In September 2001, flounder juveniles produced at a hatchery station (Japan Sea-
Farming Association (JASFA) hatchery) were stocked into a natural sea area, and at around the same time and within the same
area, a different hatchery strain was released by another hatchery station. In this study, we focus on tracking the released
flounder produced at the JASFA hatchery, which were profiled with the two classes of molecular marker. A total of 1576
individuals including both wild and released flounder were entrapped in a set net during a 6-month period 1 year after the
release (September 2002–February 2003). Of these, the 2001-year-class fish were sorted based on the total lengths (18–34 cm),
and further screening to differentiate hatchery-raised fish was made by examining for hypermelanosis on the blind body side,
which is a typical phenomenon which occurs in hatchery-raised flounder. Through these processes, 149 individuals were
selected as a sample of hatchery fish released by either the JASFA hatchery or the other hatchery. Parental allocation based on
the genetic profiles retrieved 35 of the 149 recaptures as survivors of the released JASFA fish. There was no significant
difference in the family size distribution between the recaptured JASFA fish and that of juveniles estimated when the JASFA
seedlings were released into the sea, suggesting that mortality of the released flounder had not arisen in favor of particular
families under the natural environment.
D 2004 Elsevier B.V. All rights reserved.
Keywords: Japanese flounder (Paralichthys olivaceus); Stock enhancement; Microsatellites; Mitochondrial DNA; Parentage; Genetic tag
* Corresponding author. Tel.: +81 22 365 9932; fax: +81 22 367 1250.
0044-8486/$ - s
doi:10.1016/j.aq
E-mail addr
(2005) 49–61
ee front matter D 2004 Elsevier B.V. All rights reserved.
uaculture.2004.11.006
ess: [email protected] (M. Sekino).

M. Sekino et al. / Aquaculture 244 (2005) 49–6150
1. Introduction
Stocking of hatchery-raised fish into natural
environments has widely been acknowledged as an
intuitive approach to enhance the exploitable
resources, and also this approach offers a possible
way to recover threatened or endangered aquatic
organisms (Allendorf and Ryman, 1987). As stock-
ing practices have intensively been carried out in
many fishery species, a focus of attention from the
viewpoints of biology, ecology, and genetics has
been paid to the extent of stocking impacts upon
indigenous populations in the sense of both positive
and negative effects (FAO, 1993; Schramm and
Piper, 1995). Besides utmost concern is essential
regarding stocking impact in the context of con-
servation biology, a balance between cost and
benefit associated with hatchery practices should
also be investigated in order to further our
comprehensive understanding of stocking effects
(White et al., 1995; Svasand et al., 2000; Musfata
et al., 2003); we consider that a necessary step
towards tackling this challenging subject is to trace
the fate of released fish.
Japanese flounder Paralichthys olivaceus is one of
the species for which stocking practices have
intensively been made throughout Japanese coastal
areas to increase the harvest yield (Furusawa, 1997).
Hatchery-raised flounder commonly exhibit hyper-
melanic phenomenon on the blind body side (Haga et
al., 2004, and references therein), and thereby it is
less-complicated compared with other species to
track released fish since such abnormal pigmentation
serves as an indicator to discriminate released fish
from wild ones (Seikai, 1997; Iwamoto et al., 1998).
Using hypermelanosis alone as a tracer of released
flounder, however, encounters several constraints.
For example, when two or more hatcheries release
seedlings within neighboring sea areas, how can we
assign a recaptured fish to the hatchery of origin?
Such information is crucial for appropriate hatchery
management decisions concerning budget, space, and
labor capacity that are optimal for each hatchery.
Tracking released fish using external tagging method
entails the risk of loss or under-detection of tags, and
this method is not suitable for the application to
juvenile fish with handling vulnerability. Tagging
with chemical compounds such as alizarin complex-
one (ALC; Blom et al., 1994) also has disadvantages
as this method requires much experience to deter-
mine tagged fish accurately, and furthermore, it is not
possible to assign a tagged fish to the source hatchery
if other hatcheries employ this method in a similar
manner.
The genetic profiling approach can be used as
an alternative tagging method to overcome several
constraints involved in the traditional tagging
methods. There have been many studies to establish
pedigrees of aquaculture species in mixed family
tanks through accurate parentage determination,
where microsatellite DNA loci have preferably
been adopted as a genetic tag (Herbinger et al.,
1995; O’Reilly et al., 1998; Herbinger et al., 1999;
Perez-Enriquez and Taniguchi, 1999; Perez-Enri-
quez et al., 1999; Norris et al., 2000; Selvamani et
al., 2001; Boudry et al., 2002; Rodzen et al.,
2004), as well in Japanese flounder (Hara and
Sekino, 2003; Sekino et al., 2003). We expected
that parental allocation based on genetic profiles
would theoretically be applicable to trace released
flounder back to the source hatchery although
several hatcheries practiced stocking of flounder at
around the same time and within the same area.
Another important asset of this approach is that this
method would allow analysis of the family survival
performance of released fish under natural environ-
mental conditions.
This study aims to demonstrate an application of
parental allocation in direct tracking of released
flounder. The recaptured fish we screened originate
from two different hatcheries, but here we focus on
tracking released fish produced at one of the two
hatcheries (see below). We employed four micro-
satellite DNA loci and the nucleotide sequence
variation of mitochondrial DNA (mtDNA) control
region for genetic profiling.
2. Materials and methods
2.1. Samples of recaptured fish
A total of 60,000 Japanese flounder juveniles,
which were produced by using 18 candidate brood-
stock parents (wild captives, 12 females and 6
males) at the Miyako Hatchery Station of the Japan
M. Sekino et al. / Aquaculture 244 (2005) 49–61 51
Sea-Farming Association1 (JASFA), were tagged with
alizarin complexone (ALC) and stocked into Miyako
Bay (1428E, 408N) on 10 September 2001 (Total
length, 53.8–97.2 mm; meanFS.D., 78.0F7.3 mm).
Inspection of hypermelanic phenomenon for ran-
domly collected seedlings to be released (100
individuals) revealed that the abnormal pigmentation
occurred in all the random fish samples. The pedigree
structure of this strain (JASFA strain) was determined
by means of microsatellite profiling (Sekino et al.,
2003): of the 18 broodstock parents (JASFA brood-
stock parents), 6 females achieved reproductive
success and one male monopolized the contribution
to the offspring pool. Around the same time that the
JASFA hatchery stocked the flounder seedlings,
90,000 flounder juveniles derived from a different
hatchery strain were also stocked into the same bay by
another hatchery (Iwate Prefectural Stock Enhance-
ment Center) without external or chemical (ALC)
tagging operations. Unfortunately, neither the histor-
ical records of the hatchery production nor genetic
information of the latter strain is available; for this
reason, this study was confined to track the released
JASFA strain.
One year after the stocking event, a set net was
placed in Miyako Bay from September 2002 to
February 2003 (6 months), during which a total of
1576 individuals including both wild and released
fish were collected. Based on our empirical obser-
vations of the growth rate of Japanese flounder
distributed in Miyako Bay (unpublished data), we
sorted individuals ranging from approximately 18 to
34 cm in total length as 2001-year-class flounder.
Of these, individuals showing hypermelanosis on
their blind body side were further selected as a
sample of recaptured hatchery-raised fish (149 fish),
which was expected to be a mix of fish originating
from the two unrelated hatchery strains, and con-
sequently the 149 recaptures were subjected to
microsatellite and mtDNA sequencing analysis.
Again, we focused on tracking 2001-year-class
(1+) hatchery-raised flounder derived from the
JASFA strain (1+JASFA fish).
1 Present organizational name: Miyako Station, National Center
for Stock Enhancement, Fisheries Research Agency.
2.2. Microsatellite and mitochondrial DNA sequenc-
ing analysis
Caudal fin clip taken from each recaptured fish
were stored in 100% ethanol, each of which was
digested with proteinase K (Takara, Shiga, Japan) in
TNES–urea buffer containing 4 M Urea (Asahida et
al., 1996). Total genomic DNA was extracted using
the standard phenol/chloroform method (Sambrook et
al., 1989). All the 149 recaptures were screened with
four microsatellite DNA loci (Po1, AB046745; Po13,
AB046746; Po42, AB046754; Po91, AB046761;
Sekino and Hara, 2000). Polymerase chain reaction
(PCR) to amplify each microsatellite locus, and allele
detection and designations was performed in the same
manner as described in Sekino et al. (2003).
We sequenced approximately 435 bp segment of
Japanese flounder mtDNA including the tRNAPro
gene (71 bp) and the left domain of control region
for the recaptures together with the 18 JASFA
broodstock parents. Details of the PCR primer pair
to amplify the target region and the PCR profiles are
available in Sekino et al. (2002). After PCR
amplification, leftover dNTPs and primers in the
reaction solution were digested by combinational
use of exonuclease I and shrimp alkaline phospha-
tase (ExoSAP-IT Kit, Amersham Bioscience, Piscat-
away, NJ, USA). Sequencing analysis of PCR
products was conducted using BigDye Terminator
v3.1 Cycle Sequencing Kit (Applied Biosystems,
Foster City, CA, USA) in combination with the ABI
PRISM 3100 Genetic Analyzer (Applied Biosys-
tems). Sequences were determined from both direc-
tions, and sequence alignment was made with the
DNASIS PRO version 2.2 software (Hitachi, Tokyo,
Japan).
2.3. Parentage analysis
All parental allocation procedures described below
were conducted before examination of the ALC-
marked otoliths so as not to result in a biased parentage
analysis.
Based on microsatellite genotypes of all the 149
recaptures and the 18 JASFA broodstock parents,
potential parental couples of each recaptured fish
were explored among the JASFA broodstock parents
by means of the likelihood-based parental allocation

Table 1
Microsatellite genotypes and mitochondrial DNA haplotypes of 18 JASFA broodstock parents and 43 recaptured fish, and results of parental
allocation of recaptured fisha
JASFA broodstock parents
Microsatellite genotypesb MtDNA c
Po1 Po13 Po42 Po91haplotypes
Female parents
F#1 164/208 232/238 172/178 160/222 HF1
F#2 162/186 216/236 172/178 156/182 HF2
F#3 162/162 212/216 182/190 162/198 HF3
F#4 180/206 208/212 172/180 190/194 HF4
F#5 184/188 208/216 172/176 148/148 HF5
F#6 162/178 216/260 172/172 150/194 HF6
F#7 162/184 216/242 180/196 160/176 HF7
F#8 190/204 220/250 190/190 162/164 HF8
F#9 164/196 208/218 176/202 150/178 HF9
F#10 162/162 208/212 176/180 156/156 HF10
F#11 190/194 208/212 186/186 146/184 HF11
F#12 162/188 216/224 178/178 154/158 HF12
Male parents
M#1 162/196 208/214 172/174 148/156 HM1
M#2 162/180 224/234 174/236 156/158 HM2
M#3 198/222 212/228 178/182 160/160 HM3
M#4 164/188 208/210 178/194 160/170 HM4
M#5 162/164 218/232 172/192 150/160 HM5
M#6 162/162 214/216 172/182 162/166 HM6
Recaptured
fish (ID No.)
Microsatellite genotypes MtDNA
haplotypes
Parental
coupledPo1 Po13 Po42 Po91
0178 180/184 216/224 174/196 158/176 HF7 F#7–M#2
0337 162/188 224/224 174/178 154/158 HF12 F#12–m#2
0354 180/206 208/234 174/180 158/194 HF4 F#4–M#2
0371 162/184 216/234 174/196 156/176 HF7 F#7–M#2
0414 164/180 208/234 202/236 150/156 HF9 F#9–M#2
0508 162/162 208/224 174/180 156/158 HF10 F#10–M#2
0609 162/180 224/234 178/236 156/186 HF12 F#12–M#2
0610 164/180 218/234 174/202 150/156 HF9 F#9–M#2
0751 162/180 208/234 174/180 156/158 HF10 F#10–M#2
0752 180/196 208/234 174/176 150/156 HF9 F#9–M#2
0949 162/180 212/234 180/236 156/190 HF4 F#4–M#2
0950 162/196 218/224 174/202 150/158 HF9 F#9–M#2
0952 180/196 218/224 174/176 158/178 HF9 F#9–M#2
0953 162/164 218/234 174/176 150/158 HF9 F#9–M#2
1089 162/196 218/224 202/236 156/178 HF9 F#9–M#2
1091 180/206 212/224 174/180 158/190 HF4 F#4–M#2
1092 162/180 208/224 176/236 156/156 HF10 F#10–M#2
1094 164/180 208/224 176/236 150/158 HF9 F#9–M#2
1119 164/180 208/234 174/176 158/178 HF9 F#9–M#2
1154 162/196 208/224 174/202 150/156 HF9 F#9–M#2
1192 164/180 208/234 174/202 150/156 HF9 F#9–M#2
1203 162/190 208/214 172/186 148/184 HF11 F#11–M#1
1224 162/180 208/224 174/176 156/156 HF10 F#10–M#2
M. Sekino et al. / Aquaculture 244 (2005) 49–6152
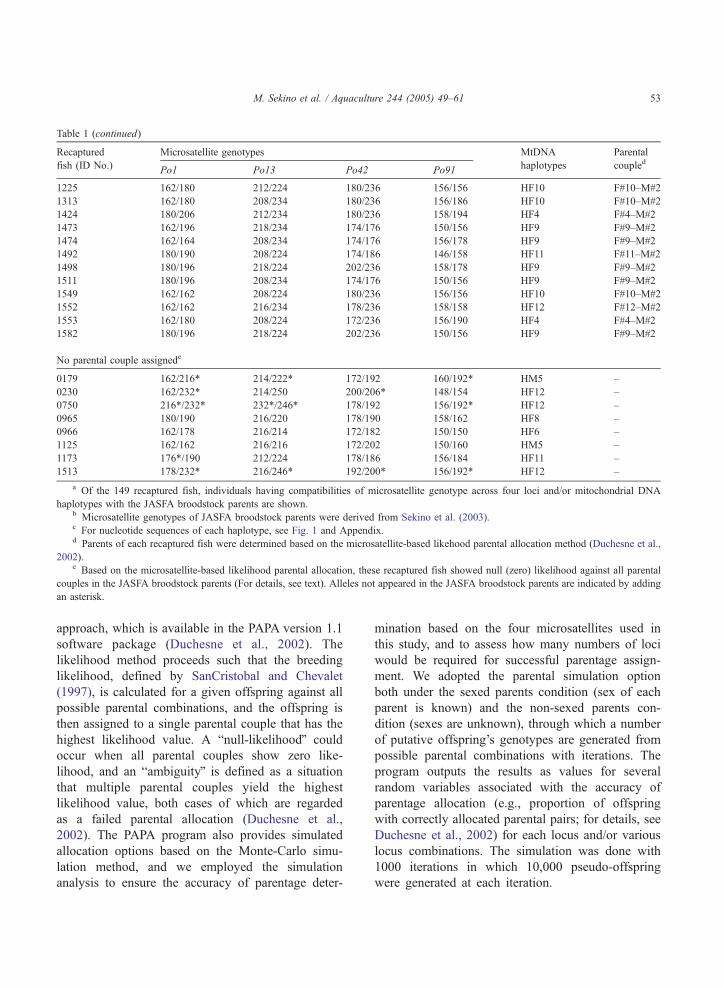
Table 1 (continued)
Recaptured
fish (ID No.)
Microsatellite genotypes MtDNA
haplotypes
Parental
coupledPo1 Po13 Po42 Po91
1225 162/180 212/224 180/236 156/156 HF10 F#10–M#2
1313 162/180 208/234 180/236 156/186 HF10 F#10–M#2
1424 180/206 212/234 180/236 158/194 HF4 F#4–M#2
1473 162/196 218/234 174/176 150/156 HF9 F#9–M#2
1474 162/164 208/234 174/176 156/178 HF9 F#9–M#2
1492 180/190 208/224 174/186 146/158 HF11 F#11–M#2
1498 180/196 218/224 202/236 158/178 HF9 F#9–M#2
1511 180/196 208/234 174/176 150/156 HF9 F#9–M#2
1549 162/162 208/224 180/236 156/156 HF10 F#10–M#2
1552 162/162 216/234 178/236 158/158 HF12 F#12–M#2
1553 162/180 208/224 172/236 156/190 HF4 F#4–M#2
1582 180/196 218/224 202/236 150/156 HF9 F#9–M#2
No parental couple assignede
0179 162/216* 214/222* 172/192 160/192* HM5 –
0230 162/232* 214/250 200/206* 148/154 HF12 –
0750 216*/232* 232*/246* 178/192 156/192* HF12 –
0965 180/190 216/220 178/190 158/162 HF8 –
0966 162/178 216/214 172/182 150/150 HF6 –
1125 162/162 216/216 172/202 150/160 HM5 –
1173 176*/190 212/224 178/186 156/184 HF11 –
1513 178/232* 216/246* 192/200* 156/192* HF12 –
a Of the 149 recaptured fish, individuals having compatibilities of microsatellite genotype across four loci and/or mitochondrial DNA
haplotypes with the JASFA broodstock parents are shown.b Microsatellite genotypes of JASFA broodstock parents were derived from Sekino et al. (2003).c For nucleotide sequences of each haplotype, see Fig. 1 and Appendix.d Parents of each recaptured fish were determined based on the microsatellite-based likehood parental allocation method (Duchesne et al.,
2002).e Based on the microsatellite-based likelihood parental allocation, these recaptured fish showed null (zero) likelihood against all parental
couples in the JASFA broodstock parents (For details, see text). Alleles not appeared in the JASFA broodstock parents are indicated by adding
an asterisk.
M. Sekino et al. / Aquaculture 244 (2005) 49–61 53
approach, which is available in the PAPA version 1.1
software package (Duchesne et al., 2002). The
likelihood method proceeds such that the breeding
likelihood, defined by SanCristobal and Chevalet
(1997), is calculated for a given offspring against all
possible parental combinations, and the offspring is
then assigned to a single parental couple that has the
highest likelihood value. A bnull-likelihoodQ could
occur when all parental couples show zero like-
lihood, and an bambiguityQ is defined as a situation
that multiple parental couples yield the highest
likelihood value, both cases of which are regarded
as a failed parental allocation (Duchesne et al.,
2002). The PAPA program also provides simulated
allocation options based on the Monte-Carlo simu-
lation method, and we employed the simulation
analysis to ensure the accuracy of parentage deter-
mination based on the four microsatellites used in
this study, and to assess how many numbers of loci
would be required for successful parentage assign-
ment. We adopted the parental simulation option
both under the sexed parents condition (sex of each
parent is known) and the non-sexed parents con-
dition (sexes are unknown), through which a number
of putative offspring’s genotypes are generated from
possible parental combinations with iterations. The
program outputs the results as values for several
random variables associated with the accuracy of
parentage allocation (e.g., proportion of offspring
with correctly allocated parental pairs; for details, see
Duchesne et al., 2002) for each locus and/or various
locus combinations. The simulation was done with
1000 iterations in which 10,000 pseudo-offspring
were generated at each iteration.

Table 2
Values for random variables associated with the accuracy of microsatellite-based likelihood parental allocation method estimated based on Monte-Carlo simulationa
Locus
combinations
Sexed conditionb Nonsexed conditionsc
Correct allocation Failed allocationd Correct allocation Failed allocation
Female parent Male parent Parental couple Ambiguity Two parents One parent No parent Ambiguity
1 locus Po1 0.2293 (0.0039) 0.1668 (0.0036) 0.1668 (0.0036) 0.7707 (0.0039) 0.0555 (0.0023) 0.0000 (0.0000) 0.0000 (0.0000) 0.9445 (0.0023)
Po13 0.2084 (0.0043) 0.2084 (0.0043) 0.2084 (0.0043) 0.7916 (0.0043) 0.0703 (0.0026) 0.0196 (0.0014) 0.0294 (0.0017) 0.8807 (0.0032)
Po42 0.1146 (0.0031) 0.1875 (0.0039) 0.1146 (0.0031) 0.8125 (0.0039) 0.1208 (0.0033) 0.1496 (0.0035) 0.1445 (0.0034) 0.5851 (0.0048)
Po91 0.5034 (0.0048) 0.4270 (0.0052) 0.3993 (0.0050) 0.3854 (0.0048) 0.2529 (0.0044) 0.1390 (0.0034) 0.0932 (0.0029) 0.5148 (0.0050)
2 loci Po1, Po13 0.6817 (0.0044) 0.7093 (0.0043) 0.6496 (0.0044) 0.2439 (0.0040) 0.3542 (0.0047) 0.0403 (0.0020) 0.0165 (0.0012) 0.5889 (0.0049)
Po1, Po42 0.7874 (0.0040) 0.7735 (0.0038) 0.7196 (0.0045) 0.1448 (0.0032) 0.5101 (0.0050) 0.0599 (0.0024) 0.0090 (0.0010) 0.4210 (0.0049)
Po1, Po91 0.7753 (0.0037) 0.7944 (0.0036) 0.7753 (0.0037) 0.1943 (0.0036) 0.5653 (0.0049) 0.0545 (0.0022) 0.0059 (0.0008) 0.3744 (0.0048)
Po13, Po42 0.6488 (0.0052) 0.7069 (0.0047) 0.6488 (0.0052) 0.2870 (0.0046) 0.4746 (0.0050) 0.0634 (0.0024) 0.0213 (0.0015) 0.4407 (0.0050)
Po13, Po91 0.9576 (0.0020) 0.9541 (0.0021) 0.9523 (0.0021) 0.0312 (0.0018) 0.7272 (0.0044) 0.0419 (0.0020) 0.0107 (0.0011) 0.2202 (0.0040)
Po42, Po91 0.8498 (0.0039) 0.8464 (0.0044) 0.8064 (0.0047) 0.0989 (0.0034) 0.6536 (0.0046) 0.0942 (0.0030) 0.0480 (0.0021) 0.2042 (0.0041)
3 loci Po1, Po13,
Po42
0.9597 (0.0021) 0.9604 (0.0019) 0.9391 (0.0025) 0.0181 (0.0014) 0.8150 (0.0038) 0.0239 (0.0015) 0.0062 (0.0008) 0.1549 (0.0035)
Po1, Po13,
Po91
0.9878 (0.0011) 0.9878 (0.0011) 0.9878 (0.0011) 0.0104 (0.0010) 0.8535 (0.0036) 0.0122 (0.0011) 0.0014 (0.0004) 0.1329 (0.0035)
Po1, Po42,
Po91
0.9483 (0.0022) 0.9503 (0.0022) 0.9483 (0.0022) 0.0482 (0.0021) 0.8327 (0.0036) 0.0132 (0.0012) 0.0039 (0.0006) 0.1502 (0.0034)
Po13, Po42,
Po91
0.9929 (0.0008) 0.9920 (0.0009) 0.9902 (0.0010) 0.0043 (0.0006) 0.9280 (0.0026) 0.0136 (0.0012) 0.0044 (0.0007) 0.0034 (0.0541)
4 loci Po1, Po13,
Po42, Po91
0.9991 (0.0003) 0.9995 (0.0002) 0.9991 (0.0003) 0.0004 (0.0002) 0.9590 (0.0020) 0.0010 (0.0003) 0.0003 (0.0002) 0.0396 (0.0020)
a Proportion of pseudo-offspring whose female or male parent, or parental couple, were correctly allocated is shown. Standard deviation generated through 1000 Monte-Carlo
iterations is given in each parenthesis. Simulations were made with 1000 iterations, and 10,000 pseudo-offspring were produced at each iteration. Parental genotypes were derived
from the JASFA broodstock parents.b A situation where both microsatellite genotypes of all candidate parents and the sex of each parent are known.c A situation where microsatellite genotypes of all candidate parents are known but the sex of each parent is unknown.d Proportion of offspring whose parental couple was not specified. An bambiguityQ is a situation where two or more parental couples scored the highest (nonzero) likelihood
(Duchesne et al., 2002).
M.Sekin
oet
al./Aquacultu
re244(2005)49–61
54

M. Sekino et al. / Aquaculture 244 (2005) 49–61 55
We investigated the identity of mtDNA haplotype
between each recaptured fish and JASFA broodstock
parent. A mtDNA identity although provides infor-
mation to infer the female parent alone due to the
general maternal transmission of the mtDNA
genome (Avise et al., 1987), we considered that
knowledge of maternal lineages of the recaptures
would strengthen the accuracy of the microsatellite-
based parental allocation. Given the fact that a large
amount of nucleotide variations are harbored in the
Japanese flounder mtDNA control region (Fujii and
Nishida, 1997; Sekino et al., 2002; Sekino, 2004),
we expected that all the JASFA broodstock female
parents would have different haplotypes from each
other.
3. Results
The microsatellite-based likelihood parental allo-
cation revealed that 114 of the 149 recaptures
scored a null-likelihood (zero-likelihood) for all
parental couples retrieved from each sex of the
JASFA broodstock parents, and that the remaining
35 fish did not show any bambiguitiesQ. That is,
each of the 35 fish that had a nonzero likelihood
was assigned unambiguously to just a single
parental couple among the JASFA broodstock
Fig. 1. A reference sequence of Japanese flounder mtDNA including the t
gene refers to Saitoh et al. (2000). (*) Variable sites detected in at least one
was no nucleotide variation in the tRNAPro gene among the 18 broodstoc
parents (Table 1). The results of the simulated
allocation analysis in terms of the values for
random variables associated with the accuracy of
parental allocation are shown in Table 2. Under the
situation that the sexes of all the 18 parents were
known (i.e., under the actual situation), a successful
parentage allocation (99.9%) with negligible prob-
ability of failed allocation was achieved by the use
of all the four loci. Combinations of three loci
could also give rise to a relatively high parentage
resolution as approximately 95–99% offspring were
correctly assigned to a single parental couple. Using
one or two loci, however, resulted in a poor
parentage resolution except for one instance: a
combination of Po13 and Po91 loci produced a
high level of parentage assignment success with a
little probability of allocation failure. As we
expected, parental allocation performance would
overall be depressed if the sexes of the broodstock
parents were unknown, as a 4% probability of
failed allocation was yielded even though all the
four loci were used.
As cited above, the mtDNA control region of
Japanese flounder is known to have an extremely
high level of nucleotide variations. This is seen in
the fact that the 18 JASFA broodstock parents did
not share common mtDNA haplotypes with each
other, although there was no variable site in the
RNAPro gene and the left domain of the control region. Location of
fish of the 18 JASFA broodstock parents (see also Appendix). There
k fish.

M. Sekino et al. / Aquaculture 244 (2005) 49–6156
tRNAPro gene (Fig. 1 and Appendix). A total of 49
haplotypes were detected among the 149 recaptures,
of which 41 fish had mtDNA haplotypes that also
appeared in the JASFA broodstock female parents
(Table 1; two recaptured fish having the same mtDNA
haplotype with one male parent are also shown). The
female parents of 35 recaptures inferred from micro-
satellite profiles were compatible to maternal lineages
traced on the basis of mtDNA identity, apart from an
additional six recaptures each of whose mtDNA
haplotype was identical to that of a particular JASFA
female parent. Given that none of the possible
parental couples in the JASFA broodstock parents
generated any microsatellite genotypes compatible
with those of the six recaptures across the four loci,
we excluded these fish from 1+JASFA fish; re-
amplification and re-typing of microsatellite alleles
enhanced the validity of the exclusions. Finally, we
confirmed that the affiliation of the 35 recaptures
determined based on the genetic profiles were in
agreement with those of the ALC examination.
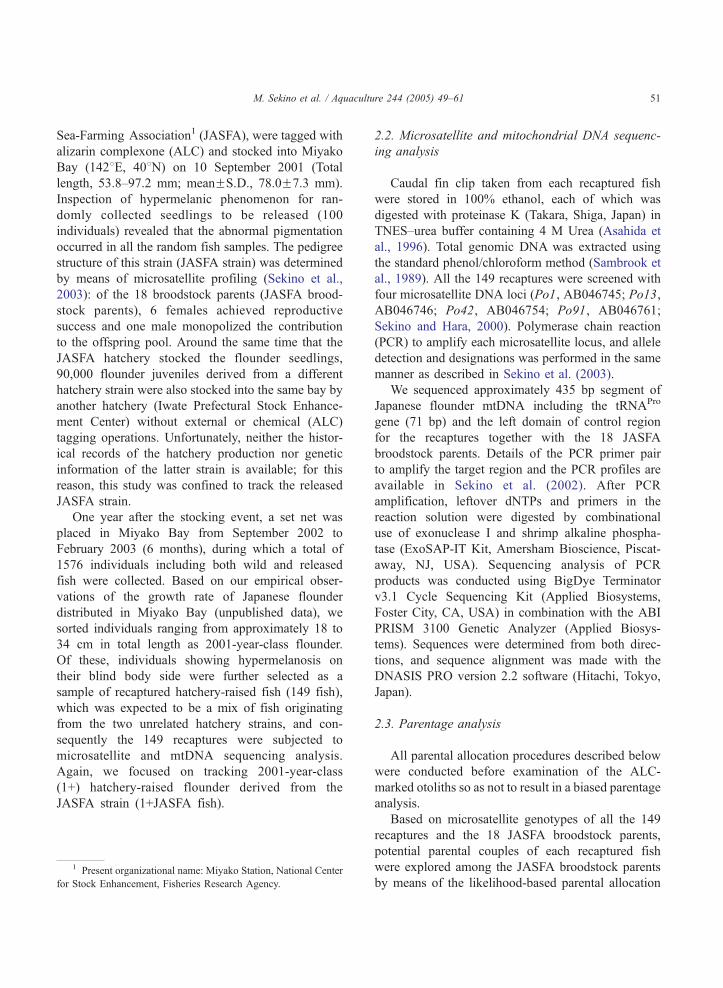
The proportion of each family estimated for the
recaptured 1+JASFA fish (family size) is illustrated
in Fig. 2. When we assumed an expected family size
Fig. 2. Family size distribution estimated for the recaptured 1+ JASF
released (207 individuals) estimated when the fish were released into th
shown (Sekino et al., 2003). There was no significant difference of th
P=0.442).
such as the proportion of each family in the JASFA
strain from which the 1+JASFA fish originate, which
was estimated when the JASFA seedlings were
released into the natural environment (Sekino et al.,
2003), G-test for goodness of fit (Williams, 1976;
Sokal and Rohlf, 1997) revealed that there was no
significant difference between the family size dis-
tribution of the 1+ JASFA fish and the expectation
(Gadj=2.691, P=0.442, df=3, where four families
with the expectations less than 5.0 were combined).
4. Discussion
4.1. Parental allocation based on genetic profiles
The microsatellite profiling approach allocated
35 of the 149 recaptured fish each to a single
parental couple generated from the JASFA brood-
stock parents. The use of four microsatellites
proved to be effective to resolve parentage as the
accuracy of parental allocation was evaluated in the
simulation analysis. A pitfall of the microsatellite-
based parental allocation is that this approach
A fish (35 individuals). Family size of flounder juveniles to be
e sea, from which the recaptured 1+ JASFA fish originate, is also
e family size distribution between the two samples (Gadj=2.691,

M. Sekino et al. / Aquaculture 244 (2005) 49–61 57
however cannot rule out a possibility that a false
parental allocation could arise by apparent genotype
compatibilities, depending largely on the extent of
the allelic variations and/or the relatedness structure
in the population of interest; this may be of a
special concern especially in its application to field
studies. Another obstacle accompanied with this
method refers to as transmission errors of micro-
satellite alleles, which may occur due most likely
to typing errors of alleles, PCR errors (e.g.,
stuttering bands, null alleles, or larger-allele drop
out), or mutations which may emerge in parental
germ lines, as becoming a major issue in popula-
tion genetics studies and forensic investigations
(O’Connell and Wright, 1997; Marshall et al.,
1998; O’Reilly et al., 1998; Norris et al., 2000;
Duchesne et al., 2002), and thereby true parents
would falsely be excluded, or vice versa, with a
certain frequency (Marshall et al., 1998). All the
causes described above would prompt an unsuc-
cessful or false parental allocation; using a number
of loci with high allelic diversity (Bernatchez and
Duchesne, 2000) coupled with application of
parental allocation methods tolerable to a measure
of allele transmission errors (SanCristobal and
Chevalet, 1997; Marshall et al., 1998; Duchesne
et al., 2002) will achieve a high rate of parentage
assignment success. Alternatively, we considered
that a simultaneous use of other classes of genetic
marker, if available, could also allow a credible
parental allocation through tracing paternity or
maternity of given offspring. We adopted the
nucleotide sequences of mtDNA control region,
from which in the case of Japanese flounder a
wealth of information to track maternal lineages
can be drawn. The use of mtDNA haplotype
identity alone might result in an overestimation of
1+JASFA fish (Table 1); nevertheless, the maternal
information provides much evidence to improve the
reliability of the microsatellite-based parental allo-
cation.
The hypermelanosis phenomenon that typically
appears in hatchery-raised flounder enables the
discrimination of released hatchery fish from wild
ones without much laborious work, but again, our
current interest lies in the affiliation of released
flounder to the source hatchery under the situation
that recaptured flounder are from two or more
hatchery strains. With the several advantageous
properties of the DNA-based parental allocation as
mentioned in the introductory section, we consider
that this method is currently the most promising
approach to meet the purposes on the premise that
baseline genetic profiles of seedlings to be released,
and ideally, of the parental generation are available.
Recent advance of computer-oriented statistical
assignment methods based on multilocus genotypes
(multiple single-locus markers; Davies et al., 1999)
has shed a new light on inference of the population
of origin of individual fish (reviewed in Hansen et
al., 2001a) albeit with missing or incomplete
baseline genetic data of source populations (e.g.,
Hansen et al., 2001b,c). The availability of these
methods, however, depends largely on the extent of
genetic differentiation among populations against
which an individual assignment is to be tested
(Cornuet et al., 1999), and some of these methods
assume Hardy-Weinberg equilibrium of marker loci
(e.g., Paetkau et al., 1995; Rannala and Mountain,
1997): hatchery strains would not necessarily be
under the required conditions, where the potential
performance of such statistical assignment methods
would be impoverished. We therefore suggest at this
point that genetic profiling should be incorporated
as a hatchery management option to elevate the
accuracy and efficiency of hatchery fish tracking.
4.2. Family size of recaptured fish
Given the results of the parental allocation
analysis coupled with the ALC information, we can
conclude that the 35 recaptures were survivors of
flounder juveniles produced at the JASFA hatchery
in 2001. The recaptured fish screened in this study
were entrapped in a set net which effectively only
fished a small part of the bay area into which the
flounder juveniles were released. Hence, it is not
evident whether the small number of the recaptured
1+JASFA fish is attributable to a low survival
performance of the released juveniles (60,000 fish)
or a low rate of recapture due to dispersal. It is,
however, very unlikely that the released flounder
juveniles would have survived without an appreci-
able mortality on account of the predation pressure
upon released flounder juveniles (Yamashita et al.,
1994; Furuta, 1996, 1999; Furuta et al., 1998; Saitoh

M. Sekino et al. / Aquaculture 244 (2005) 49–6158
et al., 2003) or due possibly to behavioral deficits
ascribable to the long-term captivity of hatchery-
reared fish under a protected environment (Olla et
al., 1994; D’Anna et al., 2004, and references
therein). On the other hand, given the consistent
family size distribution of the recaptured 1+JASFA
fish and that of JASFA seedlings estimated when the
stocking practice was made (Fig. 2), we have little
evidence that a significant family size depression
would have occurred in particular families of the
released JASFA fish. We consider that the released
flounder, which had grown by the released size
designed by the hatchery, could have experienced
mortality under the natural environment to greater or
lesser extent. However, the consistent family sizes
between the two samples indicate that such mortality
upon the released flounder, if any, would not arise in
favor of particular families. We should take into
account the small number of the recaptures and the
sampling period lasted for 6 months; this leaves
room for a more extensive survey to encourage our
observations in order to answer the question of
family survival performance of released fish under
natural environments, which has a significant impact
on the effective size of released fish through
fluctuations in family size (Gall, 1987). Assessment
of family survival performance not only under
hatchery conditions but also after the release will
provide more insight into better hatchery manage-
ment including release techniques with which the
notion of conservation biology is compatible. The
parental allocation approach based on genetic pro-
files will promise to be of significant use to address
this topic.
Acknowledgements
We wish to thank three anonymous reviewers for
helpful suggestions and comments on earlier draft of
this paper. This research was supported in part by a
grant-in-aid (development of seed production and
releasing techniques for stock enhancement of
marine resources considering the conservation of
ecosystem) from the Ministry of Agriculture, For-
estry and Fisheries, Japan.

Variable sites detected in the mtDNA control region of each JASFA broodstock parenta
Parents Haplotypes Positionb
13 51 63 66 68 81 82 87 105 106 107 112 114 117 124 126 131 132 143 144 146 147 148 149 150 153 162 163 165
Reference T T A T A A G C A C A G C A T T G C A A A C A T A A C C A
F#1 HF1 d d d d d d A d d d d d d d d C d d d d G T G d d d d d d
F#2 HF2 C C G d C d d d d d d A d d d d d d d d d d d C d T d d d
F#3 HF3 d d d d C d d d d T G A d d d d C d d d d d d d d T d d d
F#4 HF4 d d d d d T d d d d d d d d d d d d d d d d d d d d d d d
F#5 HF5 d d d d C d d d d d d A d d d d d d d G d d d d d T d d d
F#6 HF6 d d d C C d d d d d d A d d d d d d d d d d d d d T d d T
F#7 HF7 d d d d d d A d d T d d d d C d d d d d d T G d d d d d d
F#8 HF8 d d d d C d d d – d d A d d d d d d d d d d d d T T d d d
F#9 HF9 d d d d d d d T d d d d d d d d d d d G d T d d d d d d d
F#10 HF10 C C G d C d d d d d d d A d d d d d d d d d d d C T d d d
F#11 HF11 d d d d d d A d d d d d T G d d d d d d d T d d d T d d d
F#12 HF12 d d d d C d d d d d d A d d d d d d d d d d d d d d d d d
M#1 HM1 d d d d d d A d d d d d d G d d d d d d d T G d d d d T d
M#2 HM2 d d d d d d A d d d d d d d d d d T d G d d d d d d d d d
M#3 HM3 d d d d d d d T d d d d d d d d d d d G d T d d d d d d d
M#4 HM4 d d d d d d A d d d d d d d d d d d G d d T G d d d d T d
M#5 HM5 d d d d d d A d d d d d d d d d d d d d G T G d d d d d d
M#6 HM6 d d d d d d A d d d d d T d d d d d d d d T d d d d T d d
Parents Haplotypes Position
167 168 170 179 184 187 188 189 195 207 213 220 227 230 253 255 257 261 268 271 272 273 285 312 325 341 357 364
Reference A A G A A A A A A C A C T C T T T T A C C C G C A T C C
F#1 HF1 d d d d d d d d G d d d d d d C C d - d d d d d d d d d
F#2 HF2 d G d d d G d d d d d d C d d C C d d d d d d T G d T d
F#3 HF3 d d d d d d d d d d d d d d d C d d d d d d d T G d T d
F#4 HF4 d d d G d d d d d d d T d d d d d C - d d T d d d d d d
F#5 HF5 d d d d d G G d d d G d d T d d d d - d d d d T G d T d
F#6 HF6 d d d d C G d d d d d d d d C C d d d d d G d T G d T d
F#7 HF7 d d d d d d d d d d d d d d d d d d - d d d d d d d d d
F#8 HF8 d d d d d d d d d d d d C d d C d d - d d A d d G d T d
F#9 HF9 d d d d d d d d d d d d d d d d d C - d d d d d d d d d
F#10 HF10 d d d G d G d d d d d d d d d C C d d d d d d T G d T d
F#11 HF11 d d d d d d d d d d d d d d d d d d d d d d d d d C d d
F#12 HF12 d d d d d G d G d d G d d T d d d d - d d d d T G d T d
M#1 HM1 d d A d d d d d d d d d d d d C d d - d d d d d d d d T
M#2 HM2 d d d d d G d d d d d d d d d d d C - T T d d d d d d d
M#3 HM3 d d d d d d d d d d d d d d d d d d - d d d d d d d d d
M#4 HM4 d d d d d d d d d d d d d d d d d d - d d d d d d d d d
M#5 HM5 d d d d d d d d G d d d d d d C C d - d d d d d d d d d
M#6 HM6 G d d d d d d d d T d d C d d d d C - d d T A d G d d d
a Identity of each sequence with the reference (Fig. 1) is represented by dots, and dash designates a single nucleotide deletion.b Positions of nucleotide sites correspond to the reference sequence of the control region (Fig. 1).
Appendix A
M.Sekin
oet
al./Aquacultu
re244(2005)49–61
59

M. Sekino et al. / Aquaculture 244 (2005) 49–6160
References
Allendorf, F.W., Ryman, N., 1987. Genetic management of hatchery
stocks. In: Ryman, N., Utter, F. (Eds.), Population Genetics and
Fishery Management. University of Washington Press, Seattle,
WA, pp. 141–159.
Asahida, T., Kobayashi, T., Saitoh, K., Nakayama, I., 1996. Tissue
preservation and total DNA extraction from fish stored at
ambient temperature using buffers containing high concentra-
tion of urea. Fish. Sci. 62, 723–726.
Avise, J.C., Arnold, J., Ball, R.M., Bermingham, E., Lamb, T.,
Neigel, J.E., Reeb, C.A., Saunders, N.C., 1987. Intraspecific
phylogeography: the mitochondrial DNA bridge between
population genetics and systematics. Ann. Rev. Ecolog. Syst.
18, 489–522.
Bernatchez, L., Duchesne, P., 2000. Individual-based genotype
analysis in studies of parentage and population assignment:
how many loci, how many alleles? Can. J. Fish. Aquat. Sci.
57, 1–12.
Blom, G., Nordeide, J.T., Svasand, T., Borge, A., 1994. Application
of two fluorescent chemicals, alizarin complexone and alizarin
red S, to mark otoliths of Atlantic cod, Gadus morhua L. Aquac.
Fish. Manage. 25 (Suppl. 1), 229–243.
Boudry, P., Collet, B., Cornette, F., Hervouet, V., Bonhomme, F.,
2002. High variance in reproductive success of the Pacific
oyster (Crassostrea gigas, Thunberg) revealed by microsatel-
lite-based parentage analysis of multifactorial crosses. Aqua-
culture 204, 283–296.
Cornuet, J.M., Piry, S., Luikart, G., Estoup, A., Solignac, M., 1999.
New methods employing multilocus genotypes to select or
exclude populations as origins of individuals. Genetics 153,
1989–2000.
D’Anna, G., Giacalone, V.M., Badalamenti, F., Pipitone, C., 2004.
Releasing of hatchery-reared juveniles of the white seabream
Diplodus sargus (L., 1758) in the Gulf of Castellammare artificial
reef area (NW Sicily). Aquaculture 233, 251–268.
Davies, N., Villablanca, F.X., Roderick, G.K., 1999. Determining
the source of individuals: multilocus genotyping in nonequili-
brium population genetics. TREE 14, 17–21.
Duchesne, P., Godbout, M.H., Bernatchez, L., 2002. PAPA
(package for the analysis of parental allocation): a computer
program for simulated and real parental allocation. Mol. Ecol.
Notes 2, 191–193.
FAO, 1993. Report of the expert consultation on utilization and
conservation of aquatic genetic resources. FAO Fish. Rep.,
vol. 491. Food and Agriculture Organization of the United
Nations, Rome.
Fujii, T., Nishida, M., 1997. High sequence variability in the
mitochondrial DNA control region of the Japanese flounder
Paralichthys olivaceus. Fish. Sci. 63, 906–910.
Furusawa, T., 1997. Key problems of sea-farming associated with
its perspective. In: Minami, T., Tanaka, M. (Eds.), Biology and
Stock Enhancement of Japanese Flounder. Koseisya-koseikaku,
Tokyo, pp. 117–130 (in Japanese).
Furuta, S., 1996. Predation on juvenile Japanese flounder (Para-
lichthys olivaceus) by diurnal piscivorous fish: field observations
and laboratory experiments. In: Wartanabe, Y., Yamashita, Y.,
Oozeki, Y. (Eds.), Survival Strategies in Early Life Stages of
Marine Resources. A.A. Balkema, Rotterdam, pp. 285–294.
Furuta, S., 1999. Seasonal changes in abundance, length distribu-
tion, feeding condition and predation vulnerability of juvenile
Japanese flounder, Paralichthys olivaceus, and prey mysid in
the Tottori coastal area. Nippon Suisan Gakkaishi 65, 167–174
(in Japanese with English abstract).
Furuta, S., Watanabe, T., Yamada, H., 1998. Predation by fishes on
hatchery-reared Japanese flounder Paralichthys olivaceus juve-
niles released in the coastal area of Tottori Prefecture. Nippon
Suisan Gakkaishi 64, 1–7 (in Japanese with English abstract).
Gall, G.A.E., 1987. Inbreeding. In: Ryman, N., Utter, F. (Eds.),
Population Genetics and Fishery Management. University of
Washington Press, Seattle, WA, pp. 47–87.
Haga, Y., Takeuchi, T., Murayama, Y., Ohta, K., Fukunaga, T.,
2004. Vitamin D3 compounds induce hypermelanosis on the
blind side and vertebral deformity in juvenile Japanese flounder
Paralichthys olivaceus. Fish. Sci. 70, 59–67.
Hansen, M.M., Kenchington, E., Nielsen, E.E., 2001a. Assigning
individual fish to populations using microsatellite DNA
markers. Fish Fish. 2, 93–112.
Hansen, M.M., Nielsen, E.E., Bekkevold, D., Mensberg, K.L.D.,
2001b. Admixture analysis and stocking impact assessment in
brown trout (Salmo trutta), estimated with incomplete baseline
data. Can. J. Fish. Aquat. Sci. 58, 1853–1860.
Hansen, M.M., Ruzzante, D.E., Nielsen, E.E., Mensberg,
K.L.D., 2001c. Brown trout (Salmo trutta) stocking impact
assessment using microsatellite DNA markers. Ecol. Appl.
11, 148–160.
Hara, M., Sekino, M., 2003. Efficient detection of parentage in a
cultured Japanese flounder Paralichthys olivaceus using micro-
satellite DNA marker. Aquaculture 217, 107–114.
Herbinger, C.M., Doyle, R.W., Pitman, E.R., Paquet, D., Mesa,
K.A., Morris, D.B., Wright, J.M., Cook, D., 1995. DNA
fingerprint based analysis of paternal and maternal effects on
offspring growth and survival in communally reared rainbow
trout. Aquaculture 137, 245–256.
Herbinger, C.M., O’Reilly, P.T., Doyle, R.W., Wright, J.M.,
O’Flynn, F., 1999. Early growth performance of Atlantic salmon
full-sib families reared in single family tanks versus in mixed
family tanks. Aquaculture 173, 105–116.
Iwamoto, A., Okouchi, H., Tsuzaki, T., Fukunaga, T., Kitada, S.,
1998. Stocking effectiveness of flounder Paralichthys oliva-
ceus in Miyako Bay evaluated by a fish market census.
Nippon Suisan Gakkaishi 64, 830–840 (in Japanese with
English abstract).
Marshall, T.C., Slate, J., Kruuk, L.E.B., Pemberton, J.M., 1998.
Statistical confidence for likelihood-based paternity inference in
natural populations. Mol. Ecol. 7, 639–655.
Musfata, S., Saad, S., Rahman, R.A., 2003. Species studies in sea
ranching: an overview and economic perspectives. Rev. Fish
Biol. Fish. 13, 165–175.
Norris, A.T., Bradley, D.G., Cunningham, E.P., 2000. Parentage and
relatedness determination in farmed Atlantic salmon (Salmo
salar) using microsatellite markers. Aquaculture 182, 73–83.
O’Connell, M., Wright, J.M., 1997. Microsatellite DNA in fishes.
Rev. Fish Biol. Fish. 7, 331–363.
M. Sekino et al. / Aquaculture 244 (2005) 49–61 61
Olla, B.L., Davis, M.W., Ryer, C.H., 1994. Behavioral deficits in
hatchery-reared fish: potential effects on survival following
release. Aquac. Fish. Manage. 25 (Suppl. 1), 19–34.
O’Reilly, P.T., Herbinger, C.M., Wright, J.M., 1998. Analysis of
parentage determination in Atlantic salmon (Salmo salar) using
microsatellites. Anim. Genet. 29, 363–370.
Paetkau, D., Calvert, W., Stirling, I., Strobeck, C., 1995. Micro-
satellite analysis of population structure in Canadian polar bears.
Mol. Ecol. 4, 347–354.
Perez-Enriquez, R., Taniguchi, N., 1999. Use of microsatellite as
genetic tags for the assessment of a stock enhancement program
of red sea bream. Fish. Sci. 65, 374–379.
Perez-Enriquez, R., Takagi, M., Taniguchi, N., 1999. Genetic
variability and pedigree tracing of a hatchery reared stock of
red sea bream (Pagrus major) used for stock enhancement,
based on microsatellite DNA markers. Aquaculture 173,
413–423.
Rannala, B., Mountain, J.L., 1997. Detecting immigration by
using multilocus genotypes. Proc. Natl. Acad. Sci. U. S. A.
94, 9197–9221.
Rodzen, J.A., Famula, T.R., May, B., 2004. Estimation of parentage
and relatedness in the polyploid white sturgeon (Acipenser
transmontanus) using a dominant marker approach for dupli-
cated microsatellite loci. Aquaculture 232, 165–182.
Saitoh, K., Hayashizaki, K., Yokoyama, Y., Asahida, T., Toyohara,
H., Yamashita, Y., 2000. Complete nucleotide sequence of
Japanese flounder (Paralichthys olivaceus) mitochondrial
genome: structural properties and cue for resolving teleostean
relationships. J. Heredity 91, 271–281.
Saitoh, K., Takagaki, M., Yamashita, Y., 2003. Detection of
Japanese flounder-specific DNA from gut contents of potential
predators in the field. Fish. Sci. 69, 473–477.
Sambrook, J., Fritsch, E.F., Manitaris, T., 1989. Molecular Cloning,
A Laboratory Manual, 2nd ed. Cold Spring Harbor Laboratory
Press, Plainview, NY.
SanCristobal, M., Chevalet, C., 1997. Error tolerant parent
identification from a finite set of individuals. Genet. Res. 70,
53–62.
Schramm Jr., H.L., Piper, R.G., 1995. Uses and Effects of
Cultured Fishes in Aquatic Ecosystems: American Fisheries
Society Symposium, vol. 15. American Fisheries Society,
Bethesda, MD.
Seikai, T., 1997. Mechanism of abnormal pigmentation. In:
Minami, T., Tanaka, M. (Eds.), Biology and Stock
Enhancement of Japanese Flounder. Koseisya-koseikaku,
Tokyo, pp. 63–73 (in Japanese).
Sekino, M., 2004. Studies on genetic management of hatchery
broodstock in relation to the stock enhancement of Japanese
flounder Paralichthys olivaceus. Bull. Fish. Res. Agen. 11,
31–91.
Sekino, M., Hara, M., 2000. Isolation and characterization of
microsatellite DNA loci in Japanese flounder Paralichthys
olivaceus (Pleuronectiformes, Pleuronectoidei, Paralichthy-
dae). Mol. Ecol. 9, 2200–2202.
Sekino, M., Hara, M., Taniguchi, N., 2002. Loss of microsatellite
and mitochondrial DNA variation in hatchery strains of
Japanese flounder Paralichthys olivaceus. Aquaculture 213,
101–122.
Sekino, M., Saitoh, K., Yamada, T., Kumagai, A., Hara, M.,
Yamashita, Y., 2003. Microsatellite-based pedigree tracing in a
Japanese flounder Paralichthys olivaceus hatchery strain:
implications for hatchery management related to stock enhance-
ment program. Aquaculture 221, 255–263.
Selvamani, M.J.P., Degnan, S.M., Degnan, B.M., 2001. Micro-
satellite genotyping of individual abalone larvae: parentage
assignment in aquaculture. Mar. Biotechnol. 3, 478–485.
Sokal, R.R., Rohlf, F.J., 1997. Biometry, 3rd ed. Freeman, San
Francisco, CA.
Svasand, T., Kristiansen, T.S., Pederson, T., Salvanes, A.G.V.,
Engelsen, R., Nvdal, G., Nødtvedt, M., 2000. The enhancement
of cod stocks. Fish Fish. 1, 173–205.
White, R.J., Karr, J.R., Nehlsen, W., 1995. Better roles for fish
stocking in Aquatic resource management. Am. Fish. Soc.
Symp. 15, 527–547.
Williams, D.A., 1976. Improved likelihood ratio tests for complete
contingency tables. Biometrika 63, 33–37.
Yamashita, Y., Nagahora, S., Yamada, H., Kitagawa,D., 1994. Effects
of release size on survival and growth of Japanese flounder
Paralichthys olivaceus in coastal waters off Iwate Prefecture,
northeastern Japan. Mar. Ecol., Prog. Ser. 105, 269–276.
Copyright © 2022 FDOKUMEN