![Water-soluble aminocalix[4]arene receptors with hydrophobic and hydrophilic mouths](https://static.fdokumen.com/doc/165x107/63133b5cc32ab5e46f0c535e/water-soluble-aminocalix4arene-receptors-with-hydrophobic-and-hydrophilic-mouths.jpg)
Water-soluble aminocalix[4]arene receptors with hydrophobic and hydrophilic mouths
Upload
independentCategory
view
1download
0
Journal ofMaterials Chemistry A
PAPER
Publ
ishe
d on
06
Aug
ust 2
014.
Dow
nloa
ded
by A
ustr
alia
n N
atio
nal U
nive
rsity
on
26/0
1/20
15 2
2:12
:17.
View Article OnlineView Journal | View Issue
Hierarchical amo
aNanotechnology Research Laboratory, Res
National University, Canberra 0200, AustrabLaboratory of Advanced Biomaterials, Res
National University, Canberra 0200, Austra
† Electronic supplementary information10.1039/c4ta03278k
Cite this: J. Mater. Chem. A, 2014, 2,15575
Received 27th June 2014Accepted 6th August 2014
DOI: 10.1039/c4ta03278k
www.rsc.org/MaterialsA
This journal is © The Royal Society of C
rphous nanofibers for transparentinherently super-hydrophilic coatings†
William S. Y. Wong,a Noushin Nasiri,a Alexandra L. Rodriguez,b David R. Nisbetb
and Antonio Tricoli*a
Ultra-high specific surface area, hierarchical TiO2 nanofibers were synthesized by electrospinning and
directly self-assembled into highly porous films for application as transparent super-hydrophilic coatings.
The evolution of the coating key structural properties such as fiber morphology and composition was
mapped from the as-prepared sol–gel up to a calcination temperature of 500 �C. Main fiber
restructuring processes such as formation of amorphous Ti–O bonds, crystallization, polymer
decomposition and the organic removal were correlated to the resulting optical and wetting
performance. Conditions for low-temperature synthesis of hierarchical coatings made of amorphous,
mesoporous TiO2 nanofibers with very high specific surface area were determined. The wetting
properties of these amorphous and crystalline TiO2 nanofiber films were investigated with respect to the
achievement of inherently super-hydrophilic surfaces not requiring UV-activation. The surface stability of
these amorphous TiO2 nanofibers was assessed against current state-of-the-art crystalline super-
hydrophilic TiO2 preserving excellent anti-fogging performance upon an extended period of time (72 h)
in darkness.
Introduction
Since their rst synthetic fabrication over a decade ago, super-hydrophilic surfaces have attracted substantial scienticinterest1 as they achieve a water sheeting effect within a veryshort timeframe (ca. 0.5 s).2–4 The resulting implications withrespect to the condensation, evaporation and transport of (non-and atmospheric) water have led to their consideration fornumerous commercial applications, including anti-fogging,5,6
self-cleaning,7 anti-fouling,8 bio-implants,9 micro-lenses,10 lab-on-a-chip,11 microuidics,6,12 fog-harvesting,13 and heat transferenhancement.14
Several lab-scale methods have been successfully establishedfor the synthesis of super-hydrophilic coatings includingplasma, electrochemical treatment,6 reactive ion etching,5
micropatterning8,13 and ame spray pyrolysis.15 However, theirwetting mechanism is still intensely debated. The completespreading of a water droplet on a surface (perfect wetting) isexpected on materials having high water affinity such as thatgenerated by high surface concentrations of hydroxyl (–OH)groups.16,17 As a result, ideal super-hydrophilicity leads to a
earch School of Engineering, Australian
lia. E-mail: [email protected]
earch School of Engineering, Australian
lia
(ESI) available: TGA, DTG. See DOI:
hemistry 2014
contact angle (q) nearing 0 and is achieved, according toYoung's equation, for:
gs $ g1 + gsl (1)
where gs is the solid surface free energy, gl is the liquid surfacefree energy (surface tension), gsl is the solid/liquid interfacialfree energy. Given that this is the case for many materials (withthe notable exception of organic polymers),18 super-hydrophi-licity should be fairly common. However, spontaneous super-hydrophilic surfaces are rarely observed. This is usuallyattributed to the presence of a layer of volatile organics/gasmolecules rapidly adsorbing onto the surfaces of these mate-rials.19,20 To overcome these limitations, morphological modi-cations such as surface texturing have been utilized toenhance chemically-driven water spreading over that ofperfectly at surfaces.21
Titanium dioxide (TiO2) is a widely utilized photocatalyticand ultraviolet (UV)-augmented material with high H2O affinitythat has been investigated for its photoactive,22,23 self-clean-ing,23,24 optical25 and chemical sensing26 properties. Tradition-ally, the super-hydrophilicity of TiO2 lms has been found tocorrelate closely to UV exposure.1,27,28 For instance, UV-inducedsuper-hydrophilicity has been investigated using thin sol–gel-made polycrystalline TiO2 lms annealed at 500 �C. These lmsrequired surface activation, becoming super-hydrophilic whenexposed to UV irradiation and hydrophobic when kept in thedark.1 Similar behaviors have been observed for amorphous
J. Mater. Chem. A, 2014, 2, 15575–15581 | 15575
Journal of Materials Chemistry A Paper
Publ
ishe
d on
06
Aug
ust 2
014.
Dow
nloa
ded
by A
ustr
alia
n N
atio
nal U
nive
rsity
on
26/0
1/20
15 2
2:12
:17.
View Article Online
TiO2 lms.27,28 This is a main limitation of TiO2 that is known tolose super-hydrophilicity within a fewminutes20 to one day19,29,30
upon last exposure to UV-light.Doping of sol–gel-made TiO2
3,29 and mesoporous surfaceenhancement31 have been used to promote UV-independentsuper-hydrophilicity. Highly rough TiO2 lms deposited bymetal–organic vapor deposition were found to prevent theoxidation of Ti3+ during periods of darkness and were able tomaintain super-hydrophilicity for extended periods (2–3 days)post UV-activation.32 Amongst other TiO2 synthesis methods,electrospinning is a scalable, atmospheric process that offersseveral structural advantages. Electrospun coatings are contin-uously self-assembled during ber synthesis, leading to a veryporous multi-layer structure having considerably higher exi-bility than PVD/CVD-made lms32,33 and mechanical stabilitythan aerosol-deposited nanoparticle layers.15,34 Electrospinningof polyvinyl pyrrolidone–titanium(IV) isopropoxide (PVP–TTIP)sol–gel mixtures has led to some of the thinnest TiO2 bers sofar reported.35,36 However, the optimization of electrospun TiO2
nanober composition and morphology for fabrication of UV-independent, super-hydrophilic coatings has not yet beenreported.
Here, the synthesis of amorphous TiO2 nanobers for thefabrication of transparent and inherently super-hydrophiliccoatings has been investigated. The evolution of the key berstructural properties was mapped as a function of calcinationtemperature in terms of morphology, bulk and surfacecompositions leading to a well-characterized set of amorphousand crystalline TiO2 nanober coatings. Structural-functionalcorrelations of these materials have been established withrespect to their wetting and optical properties. A novel hierar-chical amorphous TiO2 nanober morphology with excellentanti-fogging performance was identied and compared to state-of-the-art anatase crystalline coatings.
ExperimentalMaterials and fabrication
Nanobers were obtained by electrospinning of an ethanol-based sol–gel (0.06 g mL�1 PVP and 0.0936 g mL�1 Ti(OiPr)4),with acetic acid as a hydrolysis promoter.35 A PVP solution wasrst prepared by dissolving 0.6 g of PVP (Sigma Aldrich, Mw ¼1 300 000) in 5 mL of ethanol (Sigma Aldrich, 200 proof). A sol–gel solution was then prepared using 2 mL of ethanol, 2 mL ofacetic acid (glacial, Chem-Supply) and 1 mL of Ti(OiPr)4 (SigmaAldrich). Solutions were stirred for 10 minutes before intro-ducing the sol–gel mixture into the PVP solution. A clearyellowish solution was obtained, which was electrospun aer 1hour of mixing. An applied voltage of 25 kV was used with aworking distance and ow rate of 20 cm and 0.8 mL h�1,respectively, providing homogenous coverage of nanobers onthe glass substrates. Surface coverage was conrmed by opticalmicroscopy. A deposition time of 1 minute was used to obtainclear, transparent coatings. Once collected on glass slides, thecoatings were stored at room temperature for 5–6 hours to allowfor the completion of hydrolysis. Samples were then calcined for1 hour (3 �C min�1) between 100 �C and 500 �C (Ts).
15576 | J. Mater. Chem. A, 2014, 2, 15575–15581
Characterization
Calcined coatings were then kept in the dark at roomtemperature for 3 days before proceeding to the wettingstudies. The dynamic water contact angle (CA) was measuredby placing a drop of deionized water (5–6 mL) on the samplesurface using a KSV CAM200 contact angle goniometer (Fin-land) with a heliopan ES43 camera (Japan). The CA wascomputed by a commercially available (CAM2008) program.Samples were analyzed using a Zeiss UltraPlus analyticalscanning electron microscope (FESEM) at 3 kV and a HitachiH7100FA 125 kV transmission electron microscope (TEM).Prior to examination, SEM specimens were platinum sputter-coated for 2 min at 20 mA. Average ber diameters (dEM) weredetermined by counting with ImageJ 20 bers in each SEMimage. TEM specimens were suspended and dispersed inethanol (Sigma Aldrich, 200 proof) before they were depositedon 200-mesh nickel–copper grids (Formvar) and dried at roomtemperature. UV-vis analysis was conducted using a microplatereader (Tecan 200 PRO, Switzerland) from 300–800 nm with 10scans per cycle. The crystal phases, size (dXRD) and surfacecompositions were analyzed by X-ray diffraction (XRD, D2Phaser, Bruker, U.S.A) and Fourier transform infrared spec-troscopy (FTIR-ATR, Bruker-Alpha, U.S.A). Amorphous samplesin XRD (< 400 �C) were normalized using the rst crystallineanatase 101 peak achieved at 400 �C. The Brunauer–Emmett–Teller specic surface area (BET, SSA), pore volume anddistribution of the as-prepared coatings were measured by N2
adsorption using a porosity analyzer (Micromeritics, TriStar II,U.S.A). All samples were degassed at 300 �C for 5 hours prior toanalysis. Evaluation of the antifogging performance was con-ducted on selected calcined coatings (300 �C, 350 �C, 500 �C)by exposure to a vapor stream 40 cm above boiling water for 5–10 s, as previously reported.15 Thermogravimetric (TGA) anddifferential thermogravimetry (DTG) analysis were conductedfrom 100–800 �C (3 �C min�1 ramp) and isothermally at 350 �Cfor 1 h under atmospheric conditions (Perkin Elmer, STA 8000,U.S.A).
Results and discussionSynthesis and characterization of hierarchical nanobers
The as-prepared nanobers had a exible structure with notableformation of hoop and spiral shapes (Fig. 1a) upon evaporationof the solvent utilized for TEM preparation. Their appearancewas aky, revealing a porous morphology and a very roughsurface. Upon low temperature (Ts ¼ 250–350 �C) calcination,the bers' diameters shrunk rapidly (Fig. 1b and c) leading toincreased rigidity and relatively smooth surface morphologies.Increasing the calcination temperature to 500 �C had minimalimpact on the ber size but increased surface roughness,resulting in a granular appearance with a grain size of ca. 20 nm(Fig. 1d, inset). This is in line with previous reports on high-temperature calcined TiO2 bers,25 attributing this morphologyto crystal nucleation.
The SEM analysis (Fig. 2) of the coatings supported theseobservations with the average ber count diameter decreasing
This journal is © The Royal Society of Chemistry 2014

Fig. 1 TEM images of (a) as-prepared and calcined at (b) 250 �C, (c)350 �C and (d) 500 �C TiO2 nanofibers.
Paper Journal of Materials Chemistry A
Publ
ishe
d on
06
Aug
ust 2
014.
Dow
nloa
ded
by A
ustr
alia
n N
atio
nal U
nive
rsity
on
26/0
1/20
15 2
2:12
:17.
View Article Online
from 412 nm� 104 nm of the as-prepared (Fig. 2a) to 80.8 nm�44.5 nm of the 500 �C calcined samples (Fig. 2f). The largestreduction in ber diameters from 210 to 128 nm was observedwith increasing temperature from 300 to 350 �C. Detailedanalysis from 350 to 500 �C revealed that roughening andrestructuring of the ber surface occurs for Ts $ 400 �C. Thiswas in-line with the granular morphology observed by TEM(Fig. 1d, inset) and is attributed to the nucleation of TiO2 crys-tals on the nanober surfaces (Fig. 2d).
Although the visible TEM and SEM ber diameter decreasedmonotonously with increasing calcination temperature, theavailable surface for water adsorption was maximal below 500�C. Fig. 4a shows the specic surface area (SSA) of the bers(Fig. 4a, triangles) as a function of the calcination temperature.
Fig. 2 SEM images of (a) as-prepared and calcined fibers at (b) 300 �C,(c) 350 �C, (d) 400 �C, (e) 450 �C and (f) 500 �C.
This journal is © The Royal Society of Chemistry 2014
The SSA increased drastically from ca. 65 to 106 m2 g�1 withincreasing Ts from 300 to 350 �C. This is only partially justiedby the ber diameter reduction observed by SEM and TEM(Fig. 2b and c). This surface restructuring is attributed to thedesorption of (PVP) polymer residuals.
The XRD spectra of the calcined samples (Fig. 3) providedfurther understanding of the observed surface restructuring(Fig. 1 and 2). Up to a calcination temperature of 350 �C, theTiO2 nanobers were amorphous with no visible diffractionpeaks (Fig. 3). At Ts of 400 �C, anatase crystals with an averagesize of 8.8 nm were nucleated. Further increasing Ts (450 �C)increased the crystal size to 12.0 nm preserving the pure anatasestructure. At 500 �C, the formation of a small amount (8.2 wt%)of rutile was observed and the anatase dXRD reached 17.4 nm.This is in line with the TEMmorphology observed at 500 �C andsuggests that the multi-granular texture of the bers is causedby the formation of large anatase crystals.
Increasing the calcination temperature step-wise to 500 �Cresulted in a 50% SSA reduction. This was characterized by aninitial SSA drop to 42 � 5 m2 g�1 at 450 �C and thereaer itsleveling-off up to 500 �C. Considering that the ber diameter ofthe 350 �C calcined samples was slightly larger than that of the500 �C ones, the higher SSA of amorphous TiO2 nanobersindicates the formation of a mesoporous surface morphology.This is further supported by the large pore volume and small(4.7 nm) average pore size measured upon partial removal of theorganic scaffold at 350 �C (Table 1).
At a higher magnication (Fig. 1c, inset) the smooth-appearing bers calcined at 350 �C had a more discrete struc-ture, suggesting the presence of nano-scale pores. The high SSAachieved here by these amorphous nanostructures (Ts ¼ 350 �C)is comparable to the highest reported for TiO2 nanobers26,37,38
and is, to the best of our knowledge, also the highest everachieved with the PVP–TTIP system. The hierarchicalmorphology of these amorphous ber coatings combines the
Fig. 3 XRD spectra of the calcined fibers and corresponding anataseand rutile phase peaks. The average crystal size was 8.8, 12.0 and 17.4nm for the 400, 450 and 500 �C samples.
J. Mater. Chem. A, 2014, 2, 15575–15581 | 15577
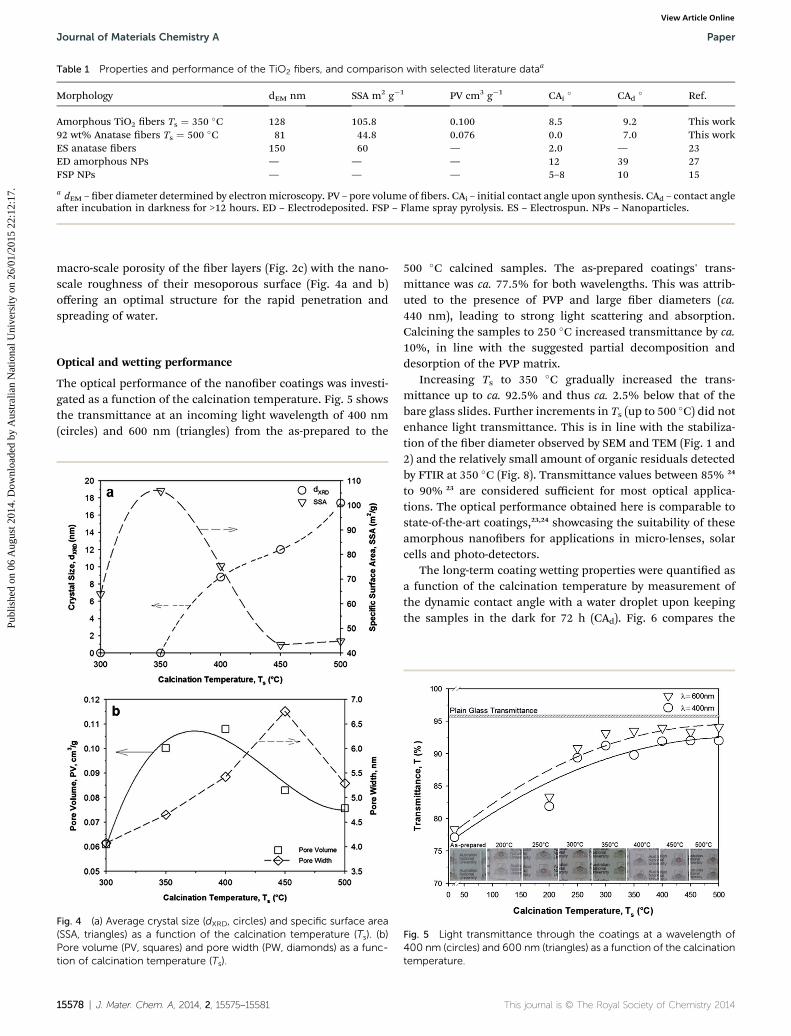
Table 1 Properties and performance of the TiO2 fibers, and comparison with selected literature dataa
Morphology dEM nm SSA m2 g�1 PV cm3 g�1 CAi � CAd � Ref.
Amorphous TiO2 bers Ts ¼ 350 �C 128 105.8 0.100 8.5 9.2 This work92 wt% Anatase bers Ts ¼ 500 �C 81 44.8 0.076 0.0 7.0 This workES anatase bers 150 60 — 2.0 — 23ED amorphous NPs — — — 12 39 27FSP NPs — — — 5–8 10 15
a dEM – ber diameter determined by electronmicroscopy. PV – pore volume of bers. CAi – initial contact angle upon synthesis. CAd – contact angleaer incubation in darkness for >12 hours. ED – Electrodeposited. FSP – Flame spray pyrolysis. ES – Electrospun. NPs – Nanoparticles.
Journal of Materials Chemistry A Paper
Publ
ishe
d on
06
Aug
ust 2
014.
Dow
nloa
ded
by A
ustr
alia
n N
atio
nal U
nive
rsity
on
26/0
1/20
15 2
2:12
:17.
View Article Online
macro-scale porosity of the ber layers (Fig. 2c) with the nano-scale roughness of their mesoporous surface (Fig. 4a and b)offering an optimal structure for the rapid penetration andspreading of water.
Optical and wetting performance
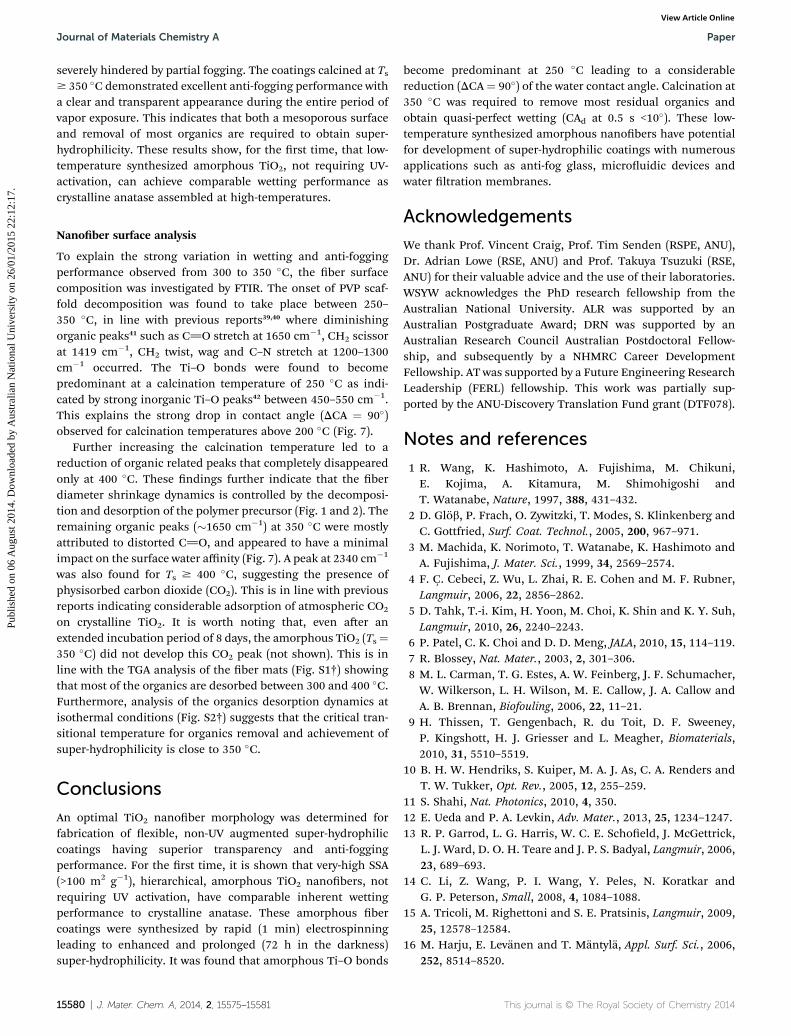
The optical performance of the nanober coatings was investi-gated as a function of the calcination temperature. Fig. 5 showsthe transmittance at an incoming light wavelength of 400 nm(circles) and 600 nm (triangles) from the as-prepared to the
Fig. 4 (a) Average crystal size (dXRD, circles) and specific surface area(SSA, triangles) as a function of the calcination temperature (Ts). (b)Pore volume (PV, squares) and pore width (PW, diamonds) as a func-tion of calcination temperature (Ts).
15578 | J. Mater. Chem. A, 2014, 2, 15575–15581
500 �C calcined samples. The as-prepared coatings' trans-mittance was ca. 77.5% for both wavelengths. This was attrib-uted to the presence of PVP and large ber diameters (ca.440 nm), leading to strong light scattering and absorption.Calcining the samples to 250 �C increased transmittance by ca.10%, in line with the suggested partial decomposition anddesorption of the PVP matrix.
Increasing Ts to 350 �C gradually increased the trans-mittance up to ca. 92.5% and thus ca. 2.5% below that of thebare glass slides. Further increments in Ts (up to 500 �C) did notenhance light transmittance. This is in line with the stabiliza-tion of the ber diameter observed by SEM and TEM (Fig. 1 and2) and the relatively small amount of organic residuals detectedby FTIR at 350 �C (Fig. 8). Transmittance values between 85% 24
to 90% 23 are considered sufficient for most optical applica-tions. The optical performance obtained here is comparable tostate-of-the-art coatings,23,24 showcasing the suitability of theseamorphous nanobers for applications in micro-lenses, solarcells and photo-detectors.
The long-term coating wetting properties were quantied asa function of the calcination temperature by measurement ofthe dynamic contact angle with a water droplet upon keepingthe samples in the dark for 72 h (CAd). Fig. 6 compares the
Fig. 5 Light transmittance through the coatings at a wavelength of400 nm (circles) and 600 nm (triangles) as a function of the calcinationtemperature.
This journal is © The Royal Society of Chemistry 2014

Fig. 6 Dynamic water contact angle of bare (circles) and TiO2 nano-fibers coated glasses calcined at (triangles) 350 �C and (squares)500 �C after 72 hours in the darkness.
Fig. 7 Dynamic water contact angle and (insets) optical images ofwater droplets as a function of the calcination temperature. Opticalimages (top right insets) of bare and coated glass in a water vaporstream.
Fig. 8 FTIR spectra (a) of electrospun TiO2 nanofibers as a function ofthe calcination temperature (Ts). Magnifications of the FTIR spectrafrom (b) from 2300 cm�1 to 2400 cm�1 depicting atmospheric CO2
adsorption, and (c) from 1100 cm�1 to 1900 cm�1 depicting the loss oforganics between 250–400 �C.
Paper Journal of Materials Chemistry A
Publ
ishe
d on
06
Aug
ust 2
014.
Dow
nloa
ded
by A
ustr
alia
n N
atio
nal U
nive
rsity
on
26/0
1/20
15 2
2:12
:17.
View Article Online
dynamic water contact angle for the 350 �C (triangles) and500 �C (square) calcined coatings with bare glass (circles).
Upon a contact time of 0.5 s, the CAd of the bare glassconverged toward ca. 25�. In contrast, the glass with the 350 �Cand 500 �C coatings reached a CAd of ca. 8.1 � 1� (tc ¼ 0.5 s).Although the latter had a slightly lower CAd (Table 1), theseeffects were minimal, and the actual performance was almostindistinguishable with both coatings satisfying super-hydro-philic requirements. This is attributed to the larger SSA andpore volume of the amorphous bers (Table 1) compensatingfor the higher H2O affinity of the anatase surface. It is worthnoticing that the initial contact angle at 0.5 s (CAi) of the 500 �Csamples (Table 1) was 0� indicating a partial deactivation of theanatase surface upon 72 h in darkness. In contrast, for theamorphous bers the initial (8.5�) and post-light deprivation
This journal is © The Royal Society of Chemistry 2014
(9.2�) contact angles (Table 1) were nearly identical suggestinginherent super-hydrophilicity.
Fig. 7 shows the initial dynamic water contact angle at 0.5 sas a function of the calcination temperature. The as-preparedcoatings (Fig. 7) were hydrophobic with a CA of 115�. The CAd
decreased sharply with increasing calcination temperature withan asymptotic behavior. The largest CA drop occurred from100 to 250 �C (CAd_250 �C ¼ 25�). Further increasing Ts to 350 �Cled to a CAd of below 10� and thus to the attainment of super-hydrophilicity (CAd_350 �C ¼ 9.2�). Small reductions (z1�) in CAwere obtained for Ts $ 400 �C. To assess the durability of thelms, subsequent multi-drop tests were conducted on the 350�C and 500 �C calcined lms. No variation of the water contactangle and macroscopic lm structure was observed up to 6hours wetting-drying cycles.
The coating anti-fogging performance was assessed byplacing the bare and coated glass slides in a water vapor stream.Uncoated glass fogged within a few seconds due to thecondensation of water droplets (Fig. 7, insets). The coatingcalcined at 300 �C demonstrated reduced fogging and improvedtransmittance. However, the background visibility was still
J. Mater. Chem. A, 2014, 2, 15575–15581 | 15579
Journal of Materials Chemistry A Paper
Publ
ishe
d on
06
Aug
ust 2
014.
Dow
nloa
ded
by A
ustr
alia
n N
atio
nal U
nive
rsity
on
26/0
1/20
15 2
2:12
:17.
View Article Online
severely hindered by partial fogging. The coatings calcined at Ts$ 350 �C demonstrated excellent anti-fogging performance witha clear and transparent appearance during the entire period ofvapor exposure. This indicates that both a mesoporous surfaceand removal of most organics are required to obtain super-hydrophilicity. These results show, for the rst time, that low-temperature synthesized amorphous TiO2, not requiring UV-activation, can achieve comparable wetting performance ascrystalline anatase assembled at high-temperatures.
Nanober surface analysis
To explain the strong variation in wetting and anti-foggingperformance observed from 300 to 350 �C, the ber surfacecomposition was investigated by FTIR. The onset of PVP scaf-fold decomposition was found to take place between 250–350 �C, in line with previous reports39,40 where diminishingorganic peaks41 such as C]O stretch at 1650 cm�1, CH2 scissorat 1419 cm�1, CH2 twist, wag and C–N stretch at 1200–1300cm�1 occurred. The Ti–O bonds were found to becomepredominant at a calcination temperature of 250 �C as indi-cated by strong inorganic Ti–O peaks42 between 450–550 cm�1.This explains the strong drop in contact angle (DCA ¼ 90�)observed for calcination temperatures above 200 �C (Fig. 7).
Further increasing the calcination temperature led to areduction of organic related peaks that completely disappearedonly at 400 �C. These ndings further indicate that the berdiameter shrinkage dynamics is controlled by the decomposi-tion and desorption of the polymer precursor (Fig. 1 and 2). Theremaining organic peaks (�1650 cm�1) at 350 �C were mostlyattributed to distorted C]O, and appeared to have a minimalimpact on the surface water affinity (Fig. 7). A peak at 2340 cm�1
was also found for Ts $ 400 �C, suggesting the presence ofphysisorbed carbon dioxide (CO2). This is in line with previousreports indicating considerable adsorption of atmospheric CO2
on crystalline TiO2. It is worth noting that, even aer anextended incubation period of 8 days, the amorphous TiO2 (Ts¼350 �C) did not develop this CO2 peak (not shown). This is inline with the TGA analysis of the ber mats (Fig. S1†) showingthat most of the organics are desorbed between 300 and 400 �C.Furthermore, analysis of the organics desorption dynamics atisothermal conditions (Fig. S2†) suggests that the critical tran-sitional temperature for organics removal and achievement ofsuper-hydrophilicity is close to 350 �C.
Conclusions
An optimal TiO2 nanober morphology was determined forfabrication of exible, non-UV augmented super-hydrophiliccoatings having superior transparency and anti-foggingperformance. For the rst time, it is shown that very-high SSA(>100 m2 g�1), hierarchical, amorphous TiO2 nanobers, notrequiring UV activation, have comparable inherent wettingperformance to crystalline anatase. These amorphous bercoatings were synthesized by rapid (1 min) electrospinningleading to enhanced and prolonged (72 h in the darkness)super-hydrophilicity. It was found that amorphous Ti–O bonds
15580 | J. Mater. Chem. A, 2014, 2, 15575–15581
become predominant at 250 �C leading to a considerablereduction (DCA¼ 90�) of the water contact angle. Calcination at350 �C was required to remove most residual organics andobtain quasi-perfect wetting (CAd at 0.5 s <10�). These low-temperature synthesized amorphous nanobers have potentialfor development of super-hydrophilic coatings with numerousapplications such as anti-fog glass, microuidic devices andwater ltration membranes.
Acknowledgements
We thank Prof. Vincent Craig, Prof. Tim Senden (RSPE, ANU),Dr. Adrian Lowe (RSE, ANU) and Prof. Takuya Tsuzuki (RSE,ANU) for their valuable advice and the use of their laboratories.WSYW acknowledges the PhD research fellowship from theAustralian National University. ALR was supported by anAustralian Postgraduate Award; DRN was supported by anAustralian Research Council Australian Postdoctoral Fellow-ship, and subsequently by a NHMRC Career DevelopmentFellowship. AT was supported by a Future Engineering ResearchLeadership (FERL) fellowship. This work was partially sup-ported by the ANU-Discovery Translation Fund grant (DTF078).
Notes and references
1 R. Wang, K. Hashimoto, A. Fujishima, M. Chikuni,E. Kojima, A. Kitamura, M. Shimohigoshi andT. Watanabe, Nature, 1997, 388, 431–432.
2 D. Glob, P. Frach, O. Zywitzki, T. Modes, S. Klinkenberg andC. Gottfried, Surf. Coat. Technol., 2005, 200, 967–971.
3 M. Machida, K. Norimoto, T. Watanabe, K. Hashimoto andA. Fujishima, J. Mater. Sci., 1999, 34, 2569–2574.
4 F. Ç. Cebeci, Z. Wu, L. Zhai, R. E. Cohen and M. F. Rubner,Langmuir, 2006, 22, 2856–2862.
5 D. Tahk, T.-i. Kim, H. Yoon, M. Choi, K. Shin and K. Y. Suh,Langmuir, 2010, 26, 2240–2243.
6 P. Patel, C. K. Choi and D. D. Meng, JALA, 2010, 15, 114–119.7 R. Blossey, Nat. Mater., 2003, 2, 301–306.8 M. L. Carman, T. G. Estes, A. W. Feinberg, J. F. Schumacher,W. Wilkerson, L. H. Wilson, M. E. Callow, J. A. Callow andA. B. Brennan, Biofouling, 2006, 22, 11–21.
9 H. Thissen, T. Gengenbach, R. du Toit, D. F. Sweeney,P. Kingshott, H. J. Griesser and L. Meagher, Biomaterials,2010, 31, 5510–5519.
10 B. H. W. Hendriks, S. Kuiper, M. A. J. As, C. A. Renders andT. W. Tukker, Opt. Rev., 2005, 12, 255–259.
11 S. Shahi, Nat. Photonics, 2010, 4, 350.12 E. Ueda and P. A. Levkin, Adv. Mater., 2013, 25, 1234–1247.13 R. P. Garrod, L. G. Harris, W. C. E. Schoeld, J. McGettrick,
L. J. Ward, D. O. H. Teare and J. P. S. Badyal, Langmuir, 2006,23, 689–693.
14 C. Li, Z. Wang, P. I. Wang, Y. Peles, N. Koratkar andG. P. Peterson, Small, 2008, 4, 1084–1088.
15 A. Tricoli, M. Righettoni and S. E. Pratsinis, Langmuir, 2009,25, 12578–12584.
16 M. Harju, E. Levanen and T. Mantyla, Appl. Surf. Sci., 2006,252, 8514–8520.
This journal is © The Royal Society of Chemistry 2014
Paper Journal of Materials Chemistry A
Publ
ishe
d on
06
Aug
ust 2
014.
Dow
nloa
ded
by A
ustr
alia
n N
atio
nal U
nive
rsity
on
26/0
1/20
15 2
2:12
:17.
View Article Online
17 M. M. Gentleman and J. A. Ruud, Langmuir, 2009, 26, 1408–1411.
18 S. Wu, Polymer Interface and Adhesion, Taylor & Francis, 1982.19 A. Mills and M. Crow, Int. J. Photoenergy, 2008, 2008, 1–6.20 A. Kanta, R. Sedev and J. Ralston, Langmuir, 2005, 21, 2400–
2407.21 J. Drelich and E. Chibowski, Langmuir, 2010, 26, 18621–
18623.22 Q. Li, D. Sun and H. Kim, Mater. Res. Bull., 2011, 46, 2094–
2099.23 V. A. Ganesh, A. S. Nair, H. K. Raut, T. M. Walsh and
S. Ramakrishna, RSC Adv., 2012, 2, 2067.24 F. Li, Q. Li and H. Kim, Appl. Surf. Sci., 2013, 276, 390–396.25 A. Kumar, R. Jose, K. Fujihara, J. Wang and S. Ramakrishna,
Chem. Mater., 2007, 19, 6536–6542.26 I.-D. Kim, A. Rothschild, B. H. Lee, D. Y. Kim, S. M. Jo and
H. L. Tuller, Nano Lett., 2006, 6, 2009–2013.27 S. Karuppuchamy and J. M. Jeong, Mater. Chem. Phys., 2005,
93, 251–254.28 Y. Gao, Y. Masuda and K. Koumoto, Langmuir, 2004, 20,
3188–3194.29 K. Guan, Surf. Coat. Technol., 2005, 191, 155–160.30 A. Eshaghi and A. Eshaghi, Bull. Mater. Sci., 2012, 35, 137–
142.
This journal is © The Royal Society of Chemistry 2014
31 A. S. Zuruzi, Y. H. Yeo, A. J. Monkowski, C. S. Ding andN. C. MacDonald, Nanotechnology, 2013, 24, 245304.
32 H. Y. Lee, Y. H. Park and K. H. Ko, Langmuir, 2000, 16, 7289–7293.
33 J.-M. Wu, H. C. Shih and W.-T. Wu, Chem. Phys. Lett., 2005,413, 490–494.
34 A. Tricoli, M. Graf, F. Mayer, S. Kuuhne, A. Hierlemann andS. E. Pratsinis, Adv. Mater., 2008, 20, 3005–3010.
35 D. Li and Y. Xia, Nano Lett., 2003, 3, 555–560.36 S. H. Hwang, C. Kim, H. Song, S. Son and J. Jang, ACS Appl.
Mater. Interfaces, 2012, 4, 5287–5292.37 W. Zhang, R. Zhu, L. Ke, X. Liu, B. Liu and S. Ramakrishna,
Small, 2010, 6, 2176–2182.38 P. S. Kumar, S. A. S. Nizar, J. Sundaramurthy, P. Ragupathy,
V. Thavasi, S. G. Mhaisalkar and S. Ramakrishna, J. Mater.Chem., 2011, 21, 9784.
39 D. Dollimore and G. R. Heal, Carbon, 1967, 5, 65–72.40 M. I. Lorıa-Bastarrachea, W. Herrera-Kao, J. V. Cauich-
Rodrıguez, J. M. Cervantes-Uc, H. Vazquez-Torres andA. Avila-Ortega, J. Therm. Anal. Calorim., 2010, 104, 737–742.
41 Y. Borodko, S. E. Habas, M. Koebel, P. Yang, H. Frei andG. A. Somorjai, J. Phys. Chem. B, 2006, 110, 23052–23059.
42 N. B. Colthup, L. H. Daly and S. E. Wiberley, Introduction toinfrared and Raman spectroscopy, Academic Press, 1990.
J. Mater. Chem. A, 2014, 2, 15575–15581 | 15581
Copyright © 2022 FDOKUMEN