Water–disaccharides interactions in saturated solution and the crystallisation conditions
Upload
khangminh22Category
view
0download
0
This is a repository copy of Crystallisation of copper sulphate pentahydrate from aqueous solution in absence and presence of sodium chloride.
White Rose Research Online URL for this paper:http://eprints.whiterose.ac.uk/151850/
Version: Supplemental Material
Article:
Justel, FJ, Camacho, DM, Taboada, ME et al. (1 more author) (2019) Crystallisation of copper sulphate pentahydrate from aqueous solution in absence and presence of sodium chloride. Journal of Crystal Growth, 525. 125204. ISSN 0022-0248
https://doi.org/10.1016/j.jcrysgro.2019.125204
© 2019, Elsevier. This manuscript version is made available under the CC-BY-NC-ND 4.0 license http://creativecommons.org/licenses/by-nc-nd/4.0/.
[email protected]://eprints.whiterose.ac.uk/
Reuse
This article is distributed under the terms of the Creative Commons Attribution-NonCommercial-NoDerivs (CC BY-NC-ND) licence. This licence only allows you to download this work and share it with others as long as you credit the authors, but you can’t change the article in any way or use it commercially. More information and the full terms of the licence here: https://creativecommons.org/licenses/
Takedown
If you consider content in White Rose Research Online to be in breach of UK law, please notify us by emailing [email protected] including the URL of the record and the reason for the withdrawal request.

1
SUPPLEMENTARY INFORMATION FOR DEPOSITION
CRYSTALLISATION OF COPPER SULPHATE PENTAHYDRATE FROM
AQUEOUS SOLUTION IN ABSENCE AND PRESENCE OF SODIUM CHLORIDE
F.J. Justel1*, D.M. Camacho2, M.E. Taboada1, and K. J. Roberts2
1Department of Chemical Engineering and Mineral Processing, University of Antofagasta,
Antofagasta, Chile
2School of Chemical and Process Engineering, University of Leeds, Leeds, LS2 9JT, United
Kingdom
Keywords: A1. Copper sulphate, A2. Sodium Chloride, B1. Crystal Growth Kinetics
Mechanism, C1. Industrial Crystallisation
*Corresponding author
To be submitted to the Journal of Crystal Growth

2
Abstract
Additional and more detailed materials are provided including:
S1. Crystallisation and dissolution temperatures of the CuSO4 + H2O and CuSO4 + NaCl
+ H2O systems at different cooling rates.
S2. Solid-state characterisation using thermal analysis (TGA/DSC) and chemical
analysis.
S3. Solubilities and activity coefficients for CuSO4 solutions in both H2O and brine as a
function of solute concentration and at five different temperatures.
S4. Sequence of in-situ images of copper sulphate pentahydrate single crystals growing
in both H2O and brine at different supersaturations.
S5. Modelled fits to the experimental growth rate data using the Power law, B&S and
BCF growth models for both the {1-10} and {1-1-1} faces for copper sulphate
pentahydrate as grown in H2O and brine.

3
S1. Crystallisation and dissolution temperatures of the CuSO4 + H2O and CuSO4 +
NaCl + H2O systems at different cooling rates
Figure S1, show the results of Tcryst and Tdiss as a function of cooling rate for 29.52 wt %
copper sulphate solutions in two different media: H2O and 2.4 wt % NaCl in H2O.
Figure S1. Plot of the crystallisation (-) and dissolution (---) temperatures for 29.52 wt % CuSO4 solutions in different media: (ズ) H2O and (ミ) 2.4 wt % NaCl, as a function of solution cooling rate.
The MSZW is a characteristic property of the crystallisations systems which describes the
amount of necessary undercooling to achieve the initiation of spontaneous nucleation.
Accordingly, Figure S1 shows not un-expectantly [30-32], that for both systems the observed
metastable zone width is wider as the cooling rate increases, while for solutions with 2.4 wt
% NaCl, the metastable zone width is significantly narrower than in H2O media, which is
attributed to the influence of the higher salt concentration of the solutions, in terms of
0
10
20
30
40
50
60
70
80
90
0.0 0.5 1.0 1.5 2.0 2.5
Tem
pera
ture
(°C)
Cooling rate (°C/min)

4
promoting the on-set of nucleation. These results suggest that the limit of the metastability is
influenced by both the copper sulphate solubility and the NaCl content.
Similar results were observed by Hernández et al. [11] and Justel et al. [12], where the
solubility of copper sulphate pentahydrate in acidic seawater was observed to be slightly
lower than its solubility in freshwater, reflecting the presence of different salts in the
seawater, mainly sodium chloride.
S2. Solid-state characterisation using thermal analysis (TGA/DSC) and chemical
analysis
S2.1 Experimental procedure
Copper sulphate crystals as obtained from aqueous solutions and brine at a cooling rate of
1°C/min were filtered, dried, and analysed by thermogravimetric analysis (TGA) and
Differential Scanning Calorimetry (DSC) to determine their composition, melting points, and
to validate if the crystals grown in different media correspond to copper sulphate
pentahydrate.
Thermal assays were conducted with a Mettler Toledo Thermogravimeter TGA/DSC1,
STARe System. The crucibles used in the TGA/DSC instrument are made of platinum and
were hermetically sealed. The test was conducted in a flowing inert nitrogen atmosphere (50
ml/min) and at a heating rate of 10 °C/min. The equipment was calibrated with indium with
a sample mass of 10 mg. The temperature used in the experiment ranged from 25 to 300 °C.

5
In addition to this, chemical analysis of copper sulphate crystals obtained in brine at 1 °C/min
was performed to determine the chemical composition of the sample and the concentration
range of variation corresponding to the main impurities. Cu2+ and SO42- concentrations were
determined by oxidation-reduction volumetric and gravimetric method with drying of
residue, respectively, and Na+ and Cl- were determined by Atomic and Molecular absorption
spectrophotometry, respectively.
S2.2. Results
Figure S2 was performed to validate if the crystals obtained from brine corresponded to
copper sulphate pentahydrate, as well as to compare the temperatures at which the most loss
of water of crystallisation occurs for crystals obtained in different media.
a) b)
Figure S2. a) TGA and b) DSC curves for copper sulphate pentahydrate crystals obtained at 1 °C/min in H2O and brine.
Figure S2.a shows that when copper sulphate pentahydrate is heated (from 25 to 300 °C), it
loses its water of crystallisation in two steps at different temperatures, obtaining a total
dehydration of 36.07 and 35.79% for crystals obtained in H2O and brine, respectively, where
the water loss is 28.61 and 28.68%, respectively, in the first step, corresponding to the loss
5
6
7
8
9
10
11
12
0 50 100 150 200 250 300 350
Wei
ght
(mg)
Temperature (°C)
TGA - CuSO4 + NaClTGA - CuSO4 + H2O
H2O_Step 1: 28.61 %NaCl_Step 1: 28.68 %
H2O_Step 2: 7.46%NaCl_Step 2: 7.11%
-50
-40
-30
-20
-10
0
10
0 50 100 150 200 250 300 350
Hea
t Flo
w (
mW
)
Temperature (°C)
DSC-CuSO4 + NaCl
DSC-CuSO4 + H2O
H2O_Melting point = 96.83°CNaCl_Melting point = 95.89°C

6
of four water molecules, and 7.46 and 7.11%, respectively, in the second step, corresponding
to the loss of one water molecule. These results allowed us to validate the composition of
crystals obtained in both media, confirming that they correspond to copper sulphate
pentahydrate.
Differential scanning calorimetry (DSC) analysis from Figure S2.b shows that the
temperature at which the most loss of water of crystallisation occurs is at 96.83 and 95.89
°C, for the crystals grown in H2O and brine, respectively. This similarity allows us to
corroborate that crystals of copper sulphate pentahydrate obtained in H2O at high cooling
rates with a needle-like shape, do not correspond to a different polymorph or hydrated state
of copper sulphate.
Additionally, the purity of the crystals obtained at 1 °C/min in brine is given in Table S1.
Table S1. Chemical Analysis of CuSO4·5H2O crystals obtained at 1 °C/min in brine.
Sample % Cu2+ % SO42- % Na+ % Cl-
CuSO4·5H2O 25.41 39.50 0.0819 0.1228
It was demonstrated that 2.4 wt % of sodium chloride is not influencing the crystal structure
of copper sulphate pentahydrate, where a purity of 99.8 wt % of CuSO4·5H2O, and a NaCl
percentage of 0.2 wt % were obtained. Allowing us to conclude that the change in the shape
of crystals at high cooling rates, and the size increment when sodium chloride is present in
the solution, is not due to the incorporation of NaCl in the crystal structure.

7
S3. Solubilities and activity coefficients for CuSO4 solutions in both H2O and brine
as a function of solute concentration and at five different temperature
Little information is available in the literature regarding the effect of seawater as a
recrystallisation solvent upon the resultant physical chemical processes of the crystals.
Hernández et al. [11] provided experimental data of solubilities and physical properties
(density, refractive index, ionic conductivity, and viscosity) of CuSO4 in seawater at various
temperatures and at pH 2. Justel et al. [12], studied the influence of seawater on the solid-
liquid equilibrium and physical properties (density and viscosity) in copper sulphate
solutions at four different temperatures and ten different sulphuric acid concentrations. Then,
Justel et al. [13] determined solubilities and the water activities of copper sulphate in seawater
at different temperatures. These authors then used this information to represent the solid-
liquid equilibrium of copper sulphate-sulphuric acid-seawater system by means of a
methodology that uses the Pitzer and the Born model [15, 16] to quantify the relative impact
of copper sulphate and sulphuric acid effect, respectively on the phase diagram. Additionally,
the amounts of copper sulphate precipitated as a function of the sulphuric acid concentration
were predicted. In these studies, the sodium chloride concentration present in seawater was
2.4 wt %, and the experimental data were correlated obtaining relevant information for the
design of copper sulphate pentahydrate plants, using seawater as a solvent and the addition
of sulphuric acid as the crystallisation initiator.
8
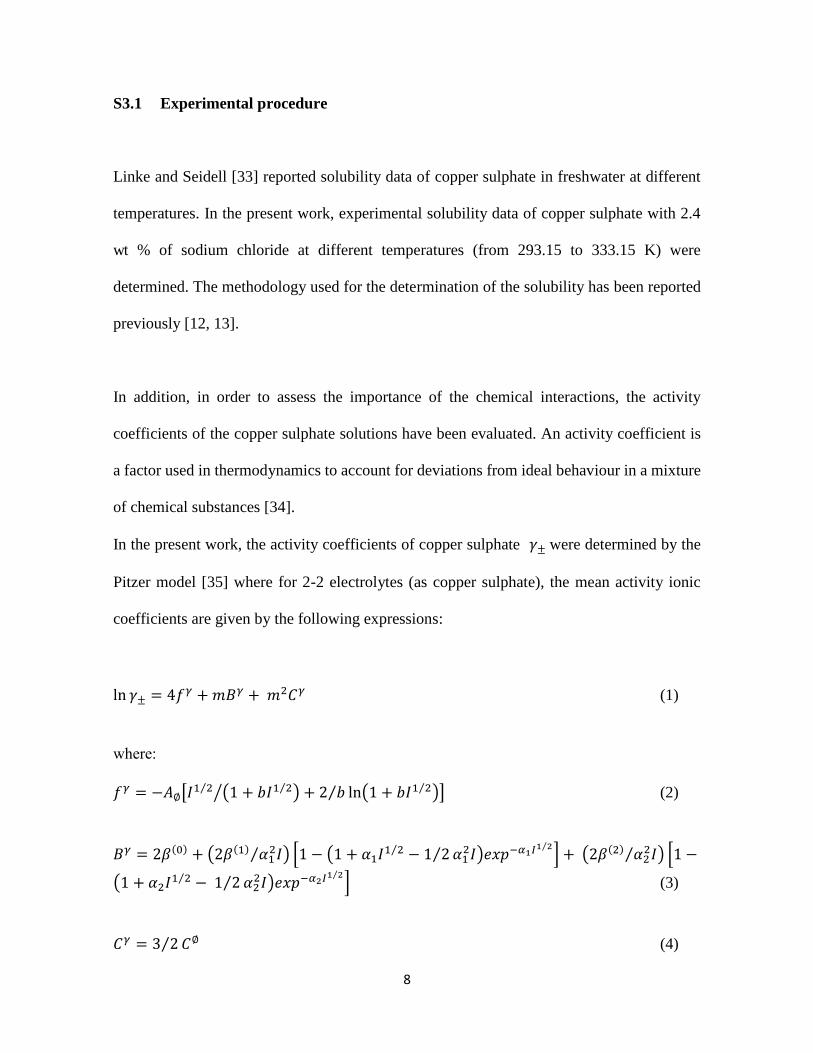
S3.1 Experimental procedure
Linke and Seidell [33] reported solubility data of copper sulphate in freshwater at different
temperatures. In the present work, experimental solubility data of copper sulphate with 2.4
wt % of sodium chloride at different temperatures (from 293.15 to 333.15 K) were
determined. The methodology used for the determination of the solubility has been reported
previously [12, 13].
In addition, in order to assess the importance of the chemical interactions, the activity
coefficients of the copper sulphate solutions have been evaluated. An activity coefficient is
a factor used in thermodynamics to account for deviations from ideal behaviour in a mixture
of chemical substances [34].
In the present work, the activity coefficients of copper sulphate 紘罰 were determined by the
Pitzer model [35] where for 2-2 electrolytes (as copper sulphate), the mean activity ionic
coefficients are given by the following expressions:
ln 紘罰 噺 ね血廷 髪 兼稽廷 髪 兼態系廷 (1)
where: 血廷 噺 伐畦叶範荊怠 態エ 盤な 髪 決荊怠 態エ 匪斑 髪 に 決エ ln盤な 髪 決荊怠 態エ 匪飯 (2) 稽廷 噺 に紅岫待岻 髪 盤に紅岫怠岻 糠怠態荊エ 匪 峙な 伐 盤な 髪 糠怠荊怠 態エ 伐 な にエ 糠怠態荊匪結捲喧貸底迭彫迭 鉄エ 峩 髪 盤に紅岫態岻 糠態態荊エ 匪 峙な 伐盤な 髪 糠態荊怠 態エ 伐 な にエ 糠態態荊匪結捲喧貸底鉄彫迭 鉄エ 峩 (3)
系廷 噺 ぬ にエ 系叶 (4)

9
In these equations, 畦笛 corresponds to the Debye-Hückel term [36], and m and I correspond
to the molality and ionic strength, respectively. The symbols 紅岫待岻, 紅岫怠岻, 紅岫態岻, and 系叶 are
copper sulphate specific parameters, and the parameters 糠怠 , 糠態, and b are constants with
values of 1.4, 12, and 1.2 Kg1/2·mol-1/2, respectively, for copper sulphate [35].
In the present work, the values of the 紅岫待岻, 紅岫怠岻, 紅岫態岻, and 系叶 for CuSO4 solutions in H2O
and brine from 293.15 to 333.15 K have been taken from the work of Justel et al. [13, 14]; in
the case of the brine solutions, parameter values for copper sulphate in seawater were
considered [13]. All the parameters used are shown in the data summarised in Table S2.
Table S2. Binary Pitzer parameters for copper sulphate solutions in H2O and seawater media. CuSO4 + H2O system [14] CuSO4 + Seawater system [13]
T(K) 紅岫待岻 紅岫怠岻 紅岫態岻 系叶 紅岫待岻 紅岫怠岻 紅岫態岻 系叶 293.15 0.231 2.511 -48.347 0.009 0.571 2.978 0 -0.070 303.15 0.237 2.543 -48.313 0.000 0.579 2.988 0 -0.074 313.15 0.243 2.575 -48.281 -0.008 0.587 2.998 0 -0.079 323.15 0.248 2.605 -48.250 -0.015 0.595 3.008 0 -0.083 333.15 0.254 2.634 -48.219 -0.023 0.602 3.017 0 -0.087
S3.2 Results
Table S3 shows the solubility data for copper sulphate in freshwater at different temperatures
reported by Linke and Seidell [33] together with the experimental solubility and density data
for the same in brine at five different temperatures (from 293.15 to 333.15 K) determined in
the present work.
Table S3. Experimental solubility and density data of copper sulphate in brine at different temperatures. *, refers to the solubility values of copper sulphate in freshwater from literature [33].
T (K) と (g/cm3) SD (%) CuSO4
(mol/Kg H2O) SD (%)
* CuSO4 (mol/kg H2O) [33]
293.15 1.21183 0.00004 1.2826 0.0042 1.2833
303.15 1.23393 0.00001 1.5139 0.0072 1.5196
313.15 1.26730 0.00001 1.7728 0.0081 1.7909
323.15 1.30610 0.00004 2.0988 0.0104 2.1074
333.15 1.34663 0.00005 2.4690 0.0107 2.4729

10
The data clearly show that for both systems the solubility increases with temperature and that
the solubility of copper sulphate in brine was slightly lower than in pure aqueous solutions
in good agreement with previous work [11, 12].
Additionally, Figures S3.a and S3.b show the activity coefficients (け) for CuSO4 solutions in
H2O and brine, respectively, in the temperature range from 293.15 to 333.15 K at copper
sulphate concentrations up to the saturation (values from Table S3).
a) b)
Figure S3. Activity coefficients of CuSO4 in a) H2O and b) brine solutions at different salt concentrations: ミ, 293.15 K; メ, 303.15 K; ズ, 313.15 K; ×, 323.15 K; , 333.15 K. All the curves (from 293.15 to 333.15 K) for both systems, show a similar profile of variation
of the activity coefficient (け) with both the concentration and temperature, where it was found
that け decreased with increasing concentration, and decreased with increasing temperature.
Bockris and Reddy [37], and Morales [38] have both pointed out that ion-ion interactions in
ionic solutions, give rise to a decrease in the activity coefficients with increasing ionic
concentration. On the other hand, an increase in the activity coefficients shows a prevalence
of ion-solvent interactions, since at high concentrations the short-range interactions increase
in the system. This means that as the concentration of the electrolyte increases, the amount
of the effective solvent decreases, and the amount of water molecules capable of dissolving
the added ions decreases [38]. The data shows that for both systems CuSO4 at low molalities
0
0.02
0.04
0.06
0.08
0.1
0.12
0.14
0.16
0 0.5 1 1.5 2 2.5 3
Act
ivity
coe
ffici
ent (け)
CuSO4 (mol/Kg H2O)
0
0.02
0.04
0.06
0.08
0.1
0.12
0.14
0.16
0 0.5 1 1.5 2 2.5 3
Act
ivity
coe
ffici
ent (け)
CuSO4 (mol/Kg H2O)

11
shows a predominance of ion-solvent interactions over ion-ion interactions. However, as the
concentration increases, an increase of the ion-ion interactions was observed.
Examination of the activity coefficients reveals higher activities as a function of temperature
values (from 293.15 to 333.15 K), in pure aqueous media compared to brine. This indicates
that the ion-solvent interactions within the aqueous solutions are stronger than those within
the brine. These results agree with those from Table S3, where it was shown that the solubility
of copper sulphate in aqueous media was higher than in brine, which is due to the stronger
interactions with the solvent.
Additionally, Figure S4 shows a comparison of the activity coefficients for CuSO4 solutions
in H2O and brine, in the temperature range from 293.15 to 333.15 K at copper sulphate
concentrations up to the saturation. These values were determined using the Pitzer binary
parameters in H2O and seawater, respectively, obtained from the works of Justel et al. [13,
14].

12
Figure S4. Activity coefficients comparison between CuSO4 solutions in (ミ) H2O and (ヰ) brine as a function of the concentration at five different temperatures (293.15, 303.15, 313.15, 323.15, and 333.15 K).
0
0.02
0.04
0.06
0.08
0.1
0.12
0.14
0.16
0 0.5 1 1.5 2 2.5 3
け
CuSO4 (mol/kg H2O)
293.15 K NaCl293.15 K H2O
0
0.02
0.04
0.06
0.08
0.1
0.12
0.14
0.16
0 0.5 1 1.5 2 2.5 3
け
CuSO4 (mol/kg H2O)
303.15 K NaCl
303.15 K H2O
0
0.02
0.04
0.06
0.08
0.1
0.12
0.14
0.16
0 0.5 1 1.5 2 2.5 3
け
CuSO4 (mol/kg H2O)
313.15 K NaCl
313.15 K H2O
0
0.02
0.04
0.06
0.08
0.1
0.12
0.14
0.16
0 0.5 1 1.5 2 2.5 3け
CuSO4 (mol/kg H2O)
323.15 K Nacl
323.15 K H2O
0
0.02
0.04
0.06
0.08
0.1
0.12
0.14
0.16
0 0.5 1 1.5 2 2.5 3
け
CuSO4 (mol/kg H2O)
333.15 K NaCl
333.15 K H2O

13
S4. Sequence of in-situ images of copper sulphate pentahydrate single crystals
growing in both H2O and brine at different supersaturations
a) Copper sulphate pentahydrate crystals grown in H2O.
Figure S5. Series of optical micrographs of copper sulphate crystals grown in H2O in the supersaturation range from j = 0.682 to j = 0.787 at the 0.5 ml scale size showing the growth of the crystals and their morphology as a function of elapsed time and supersaturation. Black line in the picture represents the scale bar of 100 µm.
20 sec
20 sec
20 sec
20 sec
20 sec
40 sec 60 sec 80 sec
40 sec 60 sec 80 sec
80 sec
40 sec
60 sec
60 sec
60 sec 40 sec
80 sec
80 sec 40 sec
T= 23°C ı = 0.682
T= 22°C ı = 0.708
T= 20°C ı = 0.760
T= 21°C ı = 0.733
T= 19°C ı = 0.787

14
b) Copper sulphate pentahydrate crystals grown in 2.4 wt % NaCl media.
Figure S6. Series of optical micrographs of copper sulphate crystals grown in brine in the supersaturation range from j = 0.348 to j = 0.458 at the 0.5 ml scale size showing the growth of the crystals and their morphology as a function of elapsed time and supersaturation. Black line in the picture represents the scale bar of 100 µm.
20 sec
20 sec
20 sec
20 sec
40 sec 60 sec 80 sec 20 sec
40 sec
40 sec
40 sec
40 sec
60 sec
60 sec
60 sec
60 sec
80 sec
80 sec
80 sec
80 sec
T= 39°C ı = 0.348
T= 37°C ı = 0.383
T= 36°C ı = 0.402
T= 35°C ı = 0.420
T= 33°C ı = 0.458

15
S5. Modelled fits to the experimental growth rate data using the Power law, B&S
and BCF growth models for both the {1-10} and {1-1-1} faces for copper sulphate
pentahydrate as grown in H2O and brine
Figures S7.a and S7.b show the best fits of the growth models for both the {1-10} and {1-1-
1} faces for copper sulphate pentahydrate in H2O and brine, respectively. Additionally, all
relevant parameters obtained through this analysis are presented in Table S4. For comparative
assessment, all fitting lines were drawn and the corresponding modelled parameters were
also given.
a)
b)
Figure S7. 罫岫購岻 experimental data of copper sulphate pentahydrate grown in a) H2O and b) brine fitted to the Power law, B&S and BCF models. Left (ヰ) refers to the {1-10} and right (ミ) to the {1-1-1} faces respectively.
0
0.2
0.4
0.6
0.8
1
1.2
1.4
1.6
1.8
2
0 0.1 0.2 0.3 0.4 0.5 0.6 0.7 0.8 0.9 1
G (
µm
/s)
j
B&S
Power Law
BCF 0
0.2
0.4
0.6
0.8
1
1.2
1.4
1.6
1.8
2
0 0.1 0.2 0.3 0.4 0.5 0.6 0.7 0.8 0.9 1
G (
µm
/s)
j
B&SPower LawBCF
0
0.2
0.4
0.6
0.8
1
1.2
1.4
1.6
1.8
2
0 0.1 0.2 0.3 0.4 0.5 0.6 0.7 0.8 0.9 1
G (
µm
/s)
j
expB&SPower LawBCF
0
0.2
0.4
0.6
0.8
1
1.2
1.4
1.6
1.8
2
0 0.1 0.2 0.3 0.4 0.5 0.6 0.7 0.8 0.9 1
G (
µm
/s)
j
expB&SPower LawBCF
購頂追沈痛
購頂追沈痛
購頂追沈痛

16
Table S4. Crystal growth kinetics parameters obtained from the fit of the Power Law, B&S and BCF models to the experimental 罫岫購岻 data.
CuSO4 + H2O CuSO4 + NaCl + H2O
Range j studied 0.682 to 0.787 0.348 to 0.458
Fitting model
Range of ッ系 噺 岫系 伐 系勅岻 studied 760.8 to 819.1 500.1 to 600.9
Power law Equation
(2)
Faces {1-10} {1-1-1} {1-10} {1-1-1} な倦暢脹┉ 6.40E+11 3.31E+11 4.74E+10 4.75E+10 倦暢脹 岾兼嫌 峇 1.75E-11 3.38E-11 1.83E-10 1.82E-10 倦弔 岾兼嫌 峇 1.33E+00 2.29E+01 3.66E-12 7.48E-12 な倦弔岫購 伐 購頂追沈痛岻追貸怠 6.34E-01 4.92E-02 2.72E+11 1.41E+11 購頂追沈痛 0.003 0.480 0.245 0.219 堅 0.45 1.09 0.9983 1.0331 迎態 90% 99% 99% 96%
B&S Equation
(3)
な倦暢脹┉ 3.81E+11 3.80E+11 1.88E+11 1.89E+11 倦暢脹 岾兼嫌 峇 2.93E-11 2.94E-11 4.60E-11 4.59E-11 倦弔 岾兼嫌 峇 8.47E-01 1.39E+00 5.60E-12 6.24E-12 な倦弔岫購 伐 購頂追沈痛岻貸怠【滞exp 岾 畦怠購 伐 購頂追沈痛峇 8.91E-01 1.10E-04 1.58E+11 3.78E+06 購頂追沈痛 0.004 0.480 0.245 0.219 畦怠 0.1671 2.1737 0.0002 5.4302 迎態 90% 99% 99% 96%
BCF Equation
(4)
な倦暢脹┉ 3.70E+11 3.75E+11 1.86E+11 1.87E+11 倦暢脹 岾兼嫌 峇 3.03E-11 2.98E-11 4.65E-11 4.63E-11 倦弔 岾兼嫌 峇 6.21E+01 7.68E+02 2.27E-10 2.70E-09 な倦弔岫購 伐 購頂追沈痛岻建欠券月 磐 畦態岫購 伐 購頂追沈痛岻卑 9.11E-01 5.13E-03 1.32E+11 7.19E+08 購頂追沈痛 0.000 0.480 0.245 0.219 畦態 0.020 9.507 0.034 47.660 迎態 77% 99% 99.5% 96% Rate
limiting step
Diffusion of growth units
within the bulk of the solution
Diffusion of growth units within the bulk of the
solution

17
References
The reference numbering in the supplementary information coincides with the references in
the paper.
Copyright © 2022 FDOKUMEN