Modelling of phosphate inhibition of copper corrosion in aqueous chloride and sulphate media
11
Modelling of phosphate inhibition of copper corrosion in aqueous chloride and sulphate media Ne ´bil Souissi a,b, * , Ezzeddine Triki b a De ´partement de Chimie, Faculte ´ des Sciences de Bizerte, 7021 Zarzouna – Bizerte, Tunisia b Unite ´ de Recherche ‘‘Corrosion & Protection des Me ´talliques’’, E ´ cole Nationale d’Inge ´nieurs de Tunis, BP 32, 1002 Le Belve ´de ` re Tunis, Tunisia Received 16 February 2007; accepted 22 June 2007 Available online 26 July 2007 Abstract Mathematical models were built to predict sodium phosphate inhibition of copper corrosion in aqueous chloride and sulphate media. SEM-EDXS and AFM were used to characterize material surfaces without and with inorganic salt addition. Inhibitor efficiency was compared with that exhibited by benzotriazole. Ó 2007 Elsevier Ltd. All rights reserved. Keywords: A. Copper; B. Weight loss; C. Neutral inhibition; C. Passive films 1. Introduction Copper, due to its natural characteristics, constitutes the appropriate materials for many industrial applications. In spite of a relatively high standard electrode potential of this metal, corrosion process takes place in a significant rate. The search for new copper corrosion inhibitors has been a subject of long-term and active efforts [1–13]. While they have led to a development of successful inhibiting systems for a variety of environments, some problems still remain unsolved. One of them is connected with the necessity to introduce low-toxic inhibitors as some of the most effective ones currently used are toxic substances. Thus, much of the recent researches have therefore focused on formulating new and more environmentally acceptable preservation solutions [14–19]. Phosphorous compounds are commonly used to inhibit materials corrosion in aqueous electrolytes [20–32]. Their use is relatively risk free due to their low toxicity. Edwards et al. [33] tested two inorganic phosphates, sodium ortho- phosphate (NaHPO 4 ) and sodium hexametaphosphate (a polyphosphate with Na (n+2) P n O (3n+1) n 6 structure), to inhibit soluble copper corrosion by-product release. Results achieved indicated that orthophosphate is more effective than polyphosphates. In previous work [34], we tested Na 3 PO 4 as inhibitor against the corrosive action of sulphates and chlorides on a copper-based alloy. This paper presents the results of an investigation car- ried out seeking a modelling of the experimental conditions to be used for copper inhibition by sodium phosphate when submitted to aqueous aggressive media. Generally, the modelling of operational conditions is established by a systematic alteration of a single variable whilst maintaining the others constant. It ensues that such a univariate modelling generates a large number of experi- ments to achieve the highest possible protection of copper and neglects the independence and interdependence of each experimental parameter. Thus, the only reasonable way to achieve the modelling is to use a chemiometric approach. In recent work, we used full factorial designs to study the corrosion and preservation of copper corrosion in aqueous media using two inorganic phosphates [35]. 0010-938X/$ - see front matter Ó 2007 Elsevier Ltd. All rights reserved. doi:10.1016/j.corsci.2007.06.022 * Corresponding author. Address: De ´partement de Chimie, Faculte ´ des Sciences de Bizerte, 7021 Zarzouna – Bizerte, Tunisia. Tel.: +216 7259 07 17; fax: +216 7259 05 66. E-mail address: [email protected] (N. Souissi). www.elsevier.com/locate/corsci Available online at www.sciencedirect.com Corrosion Science 50 (2008) 231–241
-
Upload
independent -
Category
Documents
-
view
1 -
download
0
Transcript of Modelling of phosphate inhibition of copper corrosion in aqueous chloride and sulphate media
Available online at www.sciencedirect.com
www.elsevier.com/locate/corsci
Corrosion Science 50 (2008) 231–241
Modelling of phosphate inhibition of copper corrosionin aqueous chloride and sulphate media
Nebil Souissi a,b,*, Ezzeddine Triki b
a Departement de Chimie, Faculte des Sciences de Bizerte, 7021 Zarzouna – Bizerte, Tunisiab Unite de Recherche ‘‘Corrosion & Protection des Metalliques’’, Ecole Nationale d’Ingenieurs de Tunis, BP 32, 1002 Le Belvedere Tunis, Tunisia
Received 16 February 2007; accepted 22 June 2007Available online 26 July 2007
Abstract
Mathematical models were built to predict sodium phosphate inhibition of copper corrosion in aqueous chloride and sulphate media.SEM-EDXS and AFM were used to characterize material surfaces without and with inorganic salt addition. Inhibitor efficiency wascompared with that exhibited by benzotriazole.� 2007 Elsevier Ltd. All rights reserved.
Keywords: A. Copper; B. Weight loss; C. Neutral inhibition; C. Passive films
1. Introduction
Copper, due to its natural characteristics, constitutes theappropriate materials for many industrial applications. Inspite of a relatively high standard electrode potential of thismetal, corrosion process takes place in a significant rate.
The search for new copper corrosion inhibitors has beena subject of long-term and active efforts [1–13]. While theyhave led to a development of successful inhibiting systemsfor a variety of environments, some problems still remainunsolved. One of them is connected with the necessity tointroduce low-toxic inhibitors as some of the most effectiveones currently used are toxic substances. Thus, much of therecent researches have therefore focused on formulatingnew and more environmentally acceptable preservationsolutions [14–19].
Phosphorous compounds are commonly used to inhibitmaterials corrosion in aqueous electrolytes [20–32]. Their
0010-938X/$ - see front matter � 2007 Elsevier Ltd. All rights reserved.
doi:10.1016/j.corsci.2007.06.022
* Corresponding author. Address: Departement de Chimie, Faculte desSciences de Bizerte, 7021 Zarzouna – Bizerte, Tunisia. Tel.: +216 7259 0717; fax: +216 7259 05 66.
E-mail address: [email protected] (N. Souissi).
use is relatively risk free due to their low toxicity. Edwardset al. [33] tested two inorganic phosphates, sodium ortho-phosphate (NaHPO4) and sodium hexametaphosphate (apolyphosphate with Na(n+2)PnO(3n+1) n � 6 structure), toinhibit soluble copper corrosion by-product release.Results achieved indicated that orthophosphate is moreeffective than polyphosphates. In previous work [34], wetested Na3PO4 as inhibitor against the corrosive action ofsulphates and chlorides on a copper-based alloy.
This paper presents the results of an investigation car-ried out seeking a modelling of the experimental conditionsto be used for copper inhibition by sodium phosphate whensubmitted to aqueous aggressive media.
Generally, the modelling of operational conditions isestablished by a systematic alteration of a single variablewhilst maintaining the others constant. It ensues that sucha univariate modelling generates a large number of experi-ments to achieve the highest possible protection of copperand neglects the independence and interdependence of eachexperimental parameter. Thus, the only reasonable way toachieve the modelling is to use a chemiometric approach.
In recent work, we used full factorial designs to studythe corrosion and preservation of copper corrosion inaqueous media using two inorganic phosphates [35].
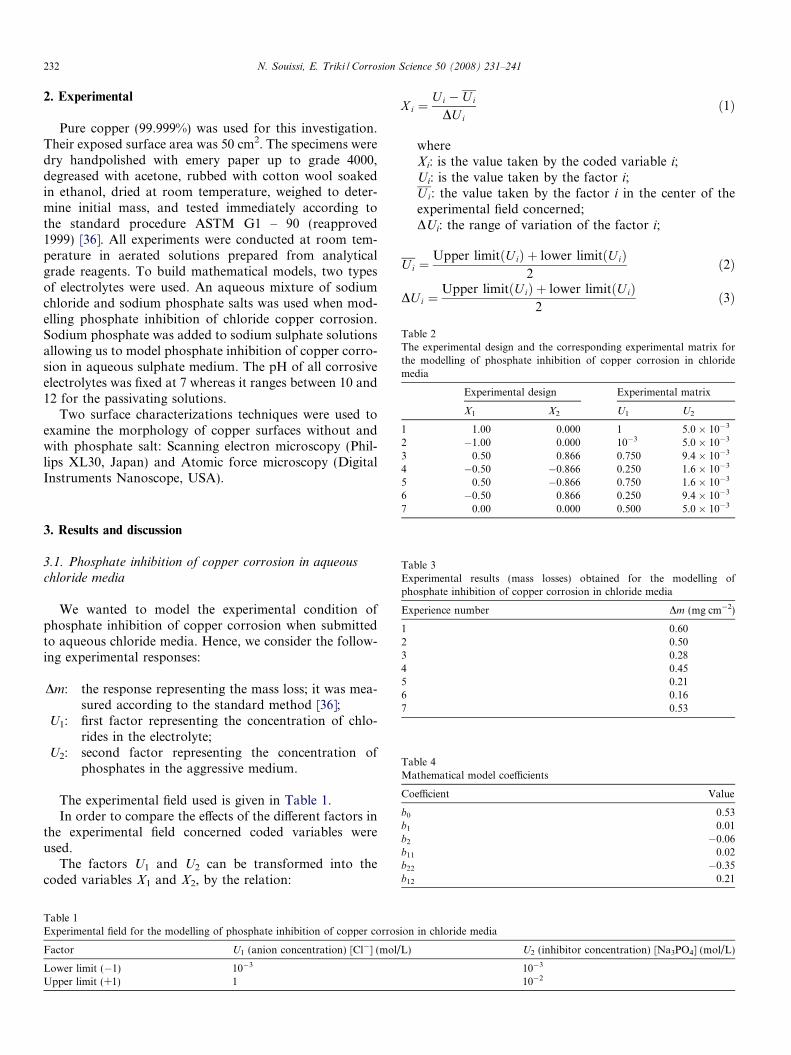
Table 2The experimental design and the corresponding experimental matrix forthe modelling of phosphate inhibition of copper corrosion in chloridemedia
Experimental design Experimental matrix
X1 X2 U1 U2
1 1.00 0.000 1 5.0 � 10�3
2 �1.00 0.000 10�3 5.0 � 10�3
3 0.50 0.866 0.750 9.4 � 10�3
4 �0.50 �0.866 0.250 1.6 � 10�3
5 0.50 �0.866 0.750 1.6 � 10�3
232 N. Souissi, E. Triki / Corrosion Science 50 (2008) 231–241
2. Experimental
Pure copper (99.999%) was used for this investigation.Their exposed surface area was 50 cm2. The specimens weredry handpolished with emery paper up to grade 4000,degreased with acetone, rubbed with cotton wool soakedin ethanol, dried at room temperature, weighed to deter-mine initial mass, and tested immediately according tothe standard procedure ASTM G1 – 90 (reapproved1999) [36]. All experiments were conducted at room tem-perature in aerated solutions prepared from analyticalgrade reagents. To build mathematical models, two typesof electrolytes were used. An aqueous mixture of sodiumchloride and sodium phosphate salts was used when mod-elling phosphate inhibition of chloride copper corrosion.Sodium phosphate was added to sodium sulphate solutionsallowing us to model phosphate inhibition of copper corro-sion in aqueous sulphate medium. The pH of all corrosiveelectrolytes was fixed at 7 whereas it ranges between 10 and12 for the passivating solutions.
Two surface characterizations techniques were used toexamine the morphology of copper surfaces without andwith phosphate salt: Scanning electron microscopy (Phil-lips XL30, Japan) and Atomic force microscopy (DigitalInstruments Nanoscope, USA).
Table 4Mathematical model coefficients
Coefficient Value
b0 0.53b1 0.01b2 �0.06b11 0.02b22 �0.35b12 0.21
Table 3Experimental results (mass losses) obtained for the modelling ofphosphate inhibition of copper corrosion in chloride media
Experience number Dm (mg cm�2)
1 0.602 0.503 0.284 0.455 0.216 0.167 0.53
6 �0.50 0.866 0.250 9.4 � 10�3
7 0.00 0.000 0.500 5.0 � 10�3
3. Results and discussion
3.1. Phosphate inhibition of copper corrosion in aqueouschloride media
We wanted to model the experimental condition ofphosphate inhibition of copper corrosion when submittedto aqueous chloride media. Hence, we consider the follow-ing experimental responses:
Dm: the response representing the mass loss; it was mea-sured according to the standard method [36];
U1: first factor representing the concentration of chlo-rides in the electrolyte;
U2: second factor representing the concentration ofphosphates in the aggressive medium.
The experimental field used is given in Table 1.In order to compare the effects of the different factors in
the experimental field concerned coded variables wereused.
The factors U1 and U2 can be transformed into thecoded variables X1 and X2, by the relation:
Table 1Experimental field for the modelling of phosphate inhibition of copper corros
Factor U1 (anion concentration) [Cl�] (mol/
Lower limit (�1) 10�3
Upper limit (+1) 1
X i ¼Ui � U i
DU ið1Þ
whereXi: is the value taken by the coded variable i;Ui: is the value taken by the factor i;U i: the value taken by the factor i in the center of theexperimental field concerned;DUi: the range of variation of the factor i;
Ui ¼Upper limitðUiÞ þ lower limitðU iÞ
2ð2Þ
DU i ¼Upper limitðU iÞ þ lower limitðUiÞ
2ð3Þ
ion in chloride media
L) U2 (inhibitor concentration) [Na3PO4] (mol/L)
10�3
10�2
0.4
1.7
2.1
34.3
61.5
0 10 20 30 40 50 60 70 80 90 100
U2U2
U12
U2
U1
U1U1
Eff
ect
perc
enta
ge
Factors
Fig. 1. Pareto chart for the modelling of phosphate inhibition of copper corrosion in chloride media.
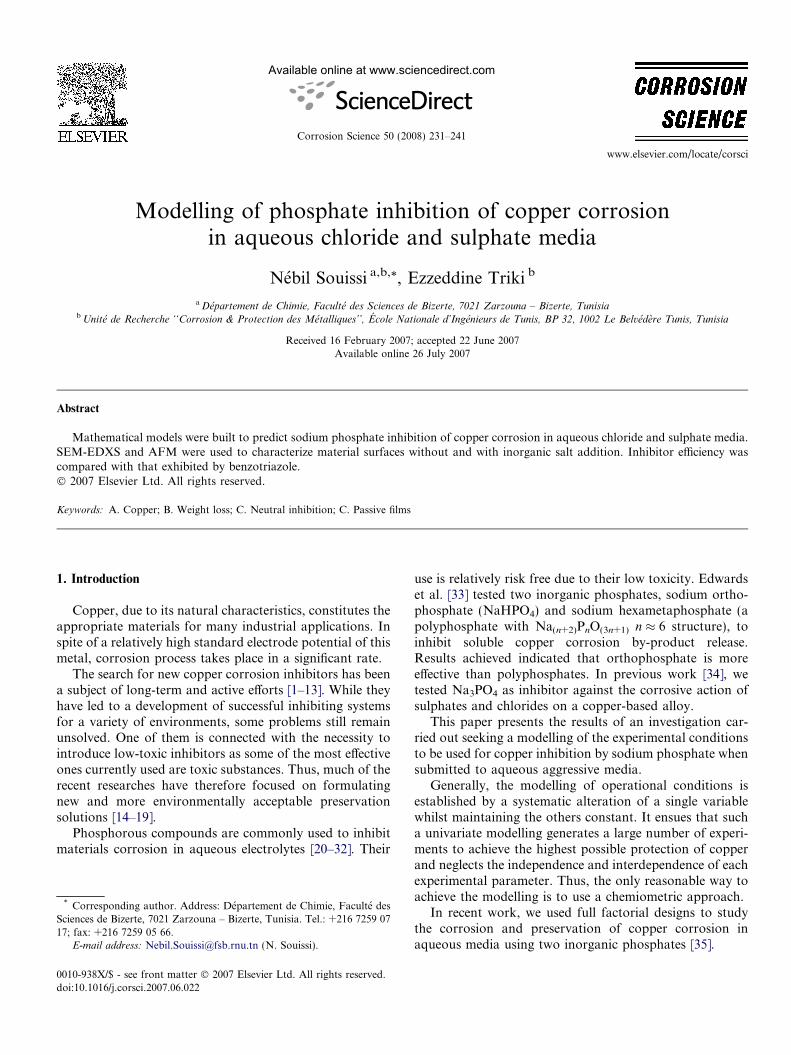
Fig. 2. Isoresponse curves for the modelling of phosphate inhibition of copper corrosion in chloride media.
0.20
0.30
12.2
26.8
60.4
U1U2
U1
U1U1
U2U2
U2
Fac
tors
Effect percentage
0 10 20 30 40 50 60 70 80 90 100
Fig. 3. Pareto chart for the modelling of phosphate inhibition of copper corrosion in sulphate media.
N. Souissi, E. Triki / Corrosion Science 50 (2008) 231–241 233

Table 5Experimental field for the modelling of phosphate inhibition of copper corrosion in sulphate media
Factor U1 (anion concentration) SO2�4
� �ðmol=LÞ U2 (inhibitor concentration) [Na3PO4] (mol/L)
Lower limit (�1) 10�3 10�3
Upper limit (+1) 1 10�2
Table 6The experimental design and the corresponding experimental matrix forthe modelling of phosphate inhibition of copper corrosion in sulphatemedia
Experimental design Experimental matrix
X1 X2 U1 U2
1 1.00 0.000 1 5.0 � 10�3
2 �1.00 0.000 10�3 5.0 � 10�3
3 0.50 0.866 0.750 9.4 � 10�3
4 �0.50 �0.866 0.250 1.6 � 10�3
5 0.50 �0.866 0.750 1.6 � 10�3
6 �0.50 0.866 0.250 9.4 � 10�3
7 0.00 0.000 0.500 5.0 � 10�3
Table 7Experimental results (mass losses) obtained for the modelling ofphosphate inhibition of copper corrosion in sulphate media
Experience number Dm (mg cm�2)
1 0.542 0.413 0.444 0.235 0.146 0.527 0.40
Table 8Mathematical model coefficients
Coefficient Value
b00 0.40b01 0.01b02 0.17b011 0.07b022 �0.11b012 0.01
Fig. 4. Isoresponse curves for the modelling of phospha
234 N. Souissi, E. Triki / Corrosion Science 50 (2008) 231–241
A mathematical approach was used where the experi-mental responses Dm were represented by the followingequation:
m ¼ b0 þ b1X 1 þ b2X 2 þ b12X 1X 2 þ b11X 21 þ b22X 2
2
where
bi represents the estimation of the main effects of the fac-tor i;bij represents the estimation of the interaction betweenthe factors i and j;bii represents the estimation of the interaction betweenthe factors i and i.
Calculation of coefficients is carried out through theleast squares method by using:
B ¼ ðX 0X Þ�1X 0Y ð4Þ
where
B is the vector of the estimates of the coefficients;X is the model matrix;(X0X) is the information matrix;(X0X)�1 is the dispersion matrix;Y is the vector of experimental results.
The Doehlert design [37–46] allowed sequential responsesurface methodology to be performed. The Doehlert designrequires k2 + k + 1 experiments, where k is the number ofvariables. For two variables, the Doehlert is an hexagonand each experiment corresponds to a vertex of such a geo-metrical structure. In this way one factor is studied at threelevels and the other at five levels.
te inhibition of copper corrosion in sulphate media.

N. Souissi, E. Triki / Corrosion Science 50 (2008) 231–241 235
After preliminary exploration, two variables were con-sidered in this investigation: [Cl�] and [Na3PO4]. Thus,the experimental design consists of seven experiments andit is organized as reported in Table 2.
The experimental results are summarized in Table 3.The responses were analyzed by regression analysis
according to the proposed model. The estimated modelparameters are listed in Table 4.
To explain Dm changes and to evaluate the weight of thedifferent coefficients of the models Pareto analysis [47] was
Fig. 5. SEM-EDXS characterization of copper surface immersed
performed. Plots of the contribution of each term are dis-played in Fig. 1.
These plots indicate that for Dm, the coefficients b11 andb1 could explain about 95% of the experimental responsevariation, the main effect is second order interactionbetween U1U1 (P11 = 61.5%).
Fig. 2 shows a typical response surface profile, drawnversus the factors, [Cl�] and [Na3PO4], using the NEM-ROD software program [48].
for 1 h in 0.65 mol L�1 chloride (a) and sulphate (b) media.

236 N. Souissi, E. Triki / Corrosion Science 50 (2008) 231–241
From the analysis of the isoresponse curves, at the cho-sen experimental field delimited by circle in Fig. 3, we con-cluded that it is possible to decrease the mass loss in severecorrosive electrolytes ([Cl�] > 0.5 mol L�1). In fact, whencopper was submitted to [Cl�] = 0.65 mol L�1 and[Na3PO4] = 1.25 mmol L�1 electrolyte the mass loss mea-sured was 0.42 mg cm�2. Dm predicted by the mathemati-cal model was 0.40 mg cm�2.
3.2. Phosphate inhibition of copper corrosion in aqueous
sulphate media
We wanted to model the experimental conditions forphosphate inhibition of copper corrosion in sulphatemedia. Then, the effect of sulphate and phosphate concen-
Fig. 6. AFM characterization of copper surface immersed for 1
trations ( SO2�4
� �and [Na3PO4]) on the material mass loss
were investigated. The experimental field is reported inTable 5.
The mathematical model used to describe the experi-mental response %IE was
Dm0 ¼ b00 þ b01X 01 þ b02X 02 þ b012X 01X 02 þ b011X 021 þ b022X 022
A Doehlert design was used to evaluate the influence of thetwo parameters. Then, the experimental design consists ofseven experiments (Table 6).
The experimental results are reported in Table 7.Then, we used the least squares method (Eq. (4)) in
order to calculate the model coefficients (Table 8).Pareto analysis was performed to measure the weight of
each factor (Fig. 3).
h in 0.65 mol L�1 chloride (a) and sulphate (b) electrolytes.
N. Souissi, E. Triki / Corrosion Science 50 (2008) 231–241 237
The graph indicates that the coefficients b02, b022 and b01could explain about 99% of inhibition efficiency variation,the main effect is the inhibitor nature P 02 ¼ 60:4%
� �.
Fig. 4 shows a typical response surface profile, drawnversus the factors, ½SO2�
4 � and [Na3PO4].We observed that it is possible to decrease the mass loss
when decreasing phosphate concentration. Furthermore,in severe corrosive electrolyte ([Cl�] = 0.65 mol L�1 and[Na3PO4] = 1.25 mmol L�1) material electrolyte the massloss measured was 0.31 mg cm�2 whereas the predictedvalue using the mathematical model was 0.32 mg cm�2.
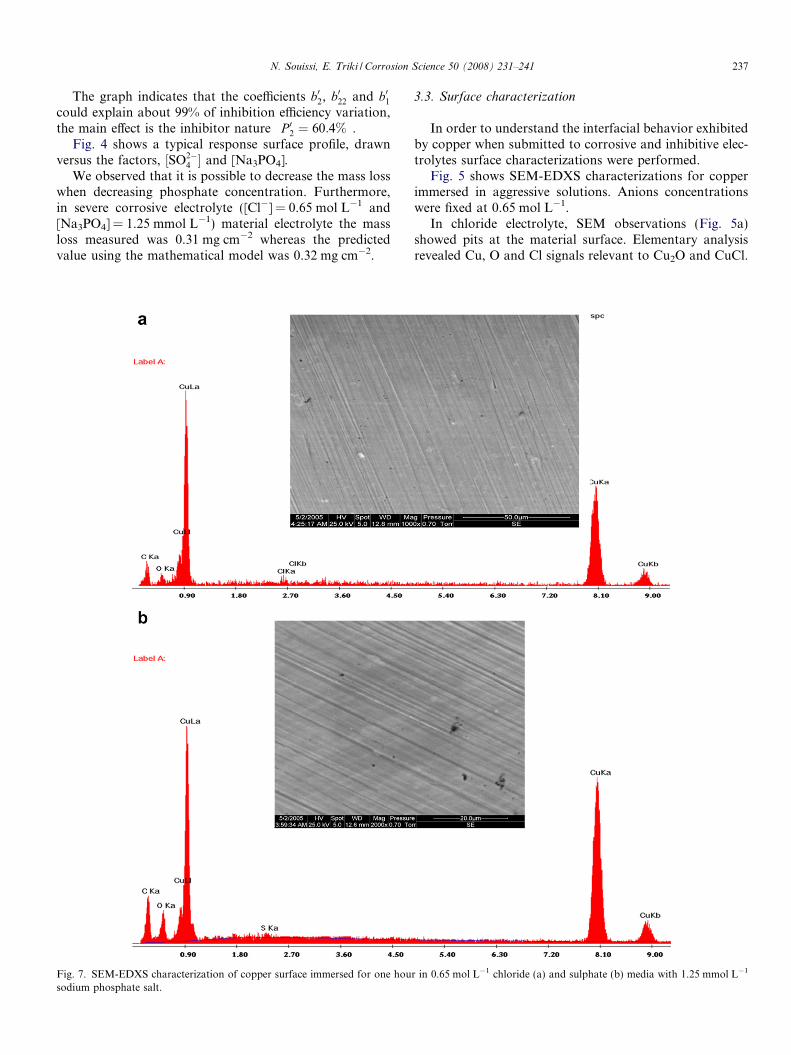
Fig. 7. SEM-EDXS characterization of copper surface immersed for one housodium phosphate salt.
3.3. Surface characterization
In order to understand the interfacial behavior exhibitedby copper when submitted to corrosive and inhibitive elec-trolytes surface characterizations were performed.
Fig. 5 shows SEM-EDXS characterizations for copperimmersed in aggressive solutions. Anions concentrationswere fixed at 0.65 mol L�1.
In chloride electrolyte, SEM observations (Fig. 5a)showed pits at the material surface. Elementary analysisrevealed Cu, O and Cl signals relevant to Cu2O and CuCl.
r in 0.65 mol L�1 chloride (a) and sulphate (b) media with 1.25 mmol L�1
238 N. Souissi, E. Triki / Corrosion Science 50 (2008) 231–241
For the sulphate electrolyte we observed a higher den-sity of pits at the material surface (Fig. 5b). Such result isin agreement with previous works were sulphate solutionwas considered more corrosive than the chloride one [35].EDXS analysis indicated the presence of Cu, O and S atthe copper surface.
AFM characterizations were also performed on thesame samples (Fig. 6).
The results achieved indicated that material surfacedamage is enhanced when it is exposed to sulphateelectrolyte.
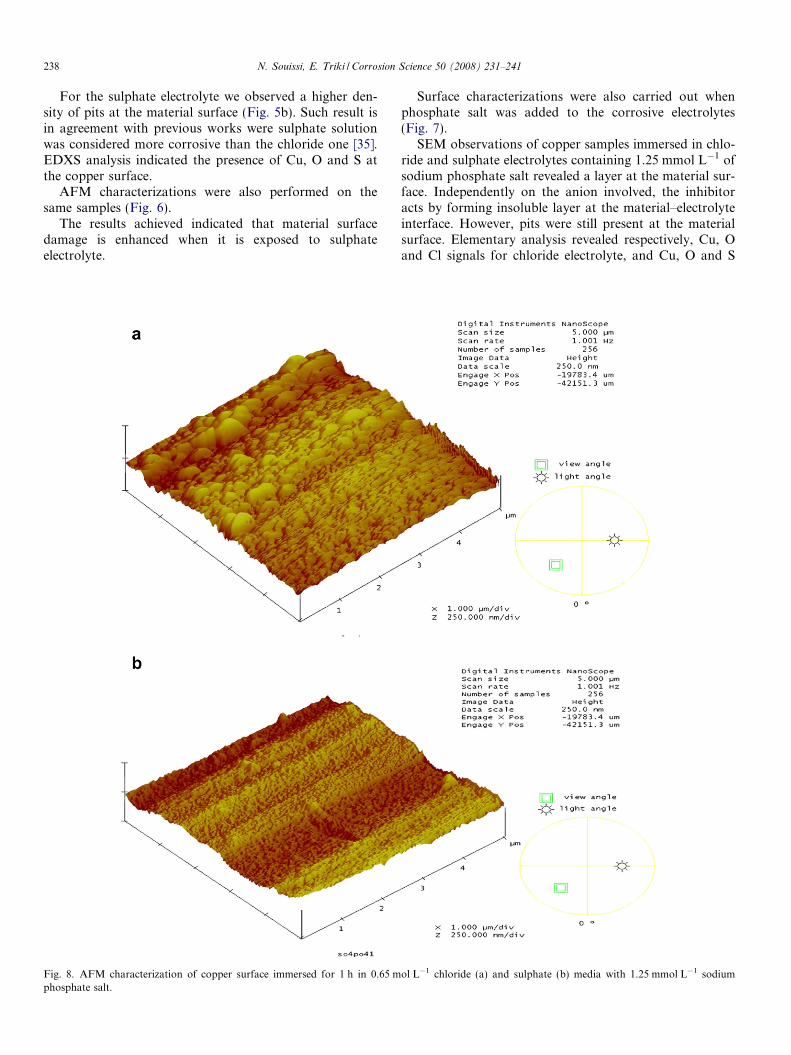
Fig. 8. AFM characterization of copper surface immersed for 1 h in 0.65 mphosphate salt.
Surface characterizations were also carried out whenphosphate salt was added to the corrosive electrolytes(Fig. 7).
SEM observations of copper samples immersed in chlo-ride and sulphate electrolytes containing 1.25 mmol L�1 ofsodium phosphate salt revealed a layer at the material sur-face. Independently on the anion involved, the inhibitoracts by forming insoluble layer at the material–electrolyteinterface. However, pits were still present at the materialsurface. Elementary analysis revealed respectively, Cu, Oand Cl signals for chloride electrolyte, and Cu, O and S
ol L�1 chloride (a) and sulphate (b) media with 1.25 mmol L�1 sodium
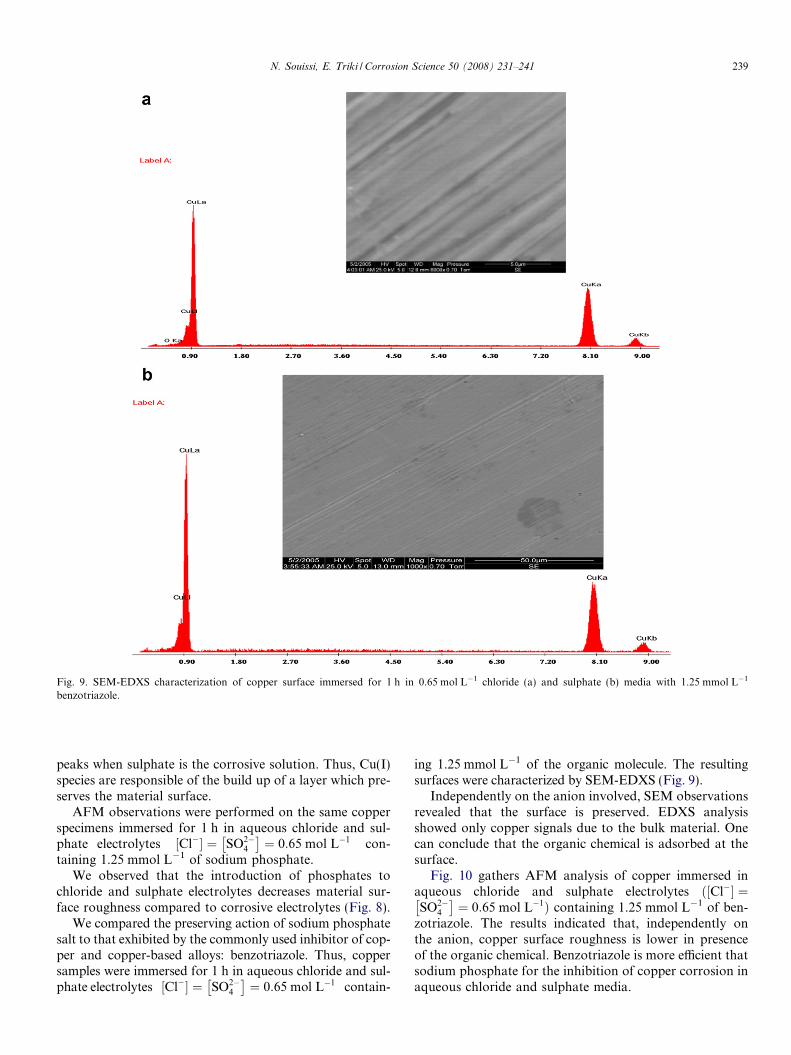
Fig. 9. SEM-EDXS characterization of copper surface immersed for 1 h in 0.65 mol L�1 chloride (a) and sulphate (b) media with 1.25 mmol L�1
benzotriazole.
N. Souissi, E. Triki / Corrosion Science 50 (2008) 231–241 239
peaks when sulphate is the corrosive solution. Thus, Cu(I)species are responsible of the build up of a layer which pre-serves the material surface.
AFM observations were performed on the same copperspecimens immersed for 1 h in aqueous chloride and sul-phate electrolytes ½Cl�� ¼ SO2�
4
� �¼ 0:65 mol L�1
� �con-
taining 1.25 mmol L�1 of sodium phosphate.We observed that the introduction of phosphates to
chloride and sulphate electrolytes decreases material sur-face roughness compared to corrosive electrolytes (Fig. 8).
We compared the preserving action of sodium phosphatesalt to that exhibited by the commonly used inhibitor of cop-per and copper-based alloys: benzotriazole. Thus, coppersamples were immersed for 1 h in aqueous chloride and sul-phate electrolytes ½Cl�� ¼ SO2�
4
� �¼ 0:65 mol L�1
� �contain-
ing 1.25 mmol L�1 of the organic molecule. The resultingsurfaces were characterized by SEM-EDXS (Fig. 9).
Independently on the anion involved, SEM observationsrevealed that the surface is preserved. EDXS analysisshowed only copper signals due to the bulk material. Onecan conclude that the organic chemical is adsorbed at thesurface.
Fig. 10 gathers AFM analysis of copper immersed inaqueous chloride and sulphate electrolytes ½Cl�� ¼ðSO2�
4
� �¼ 0:65 mol L�1Þ containing 1.25 mmol L�1 of ben-
zotriazole. The results indicated that, independently onthe anion, copper surface roughness is lower in presenceof the organic chemical. Benzotriazole is more efficient thatsodium phosphate for the inhibition of copper corrosion inaqueous chloride and sulphate media.
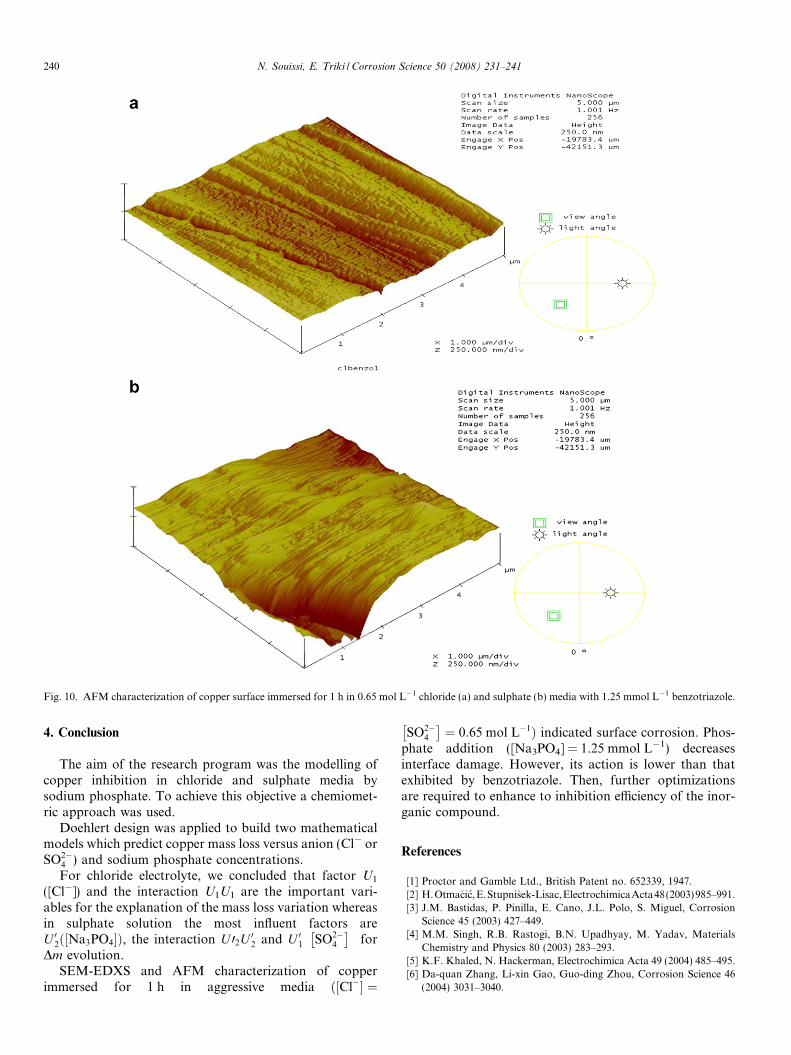
Fig. 10. AFM characterization of copper surface immersed for 1 h in 0.65 mol L�1 chloride (a) and sulphate (b) media with 1.25 mmol L�1 benzotriazole.
240 N. Souissi, E. Triki / Corrosion Science 50 (2008) 231–241
4. Conclusion
The aim of the research program was the modelling ofcopper inhibition in chloride and sulphate media bysodium phosphate. To achieve this objective a chemiomet-ric approach was used.
Doehlert design was applied to build two mathematicalmodels which predict copper mass loss versus anion (Cl� orSO2�
4 ) and sodium phosphate concentrations.For chloride electrolyte, we concluded that factor U1
([Cl�]) and the interaction U1U1 are the important vari-ables for the explanation of the mass loss variation whereasin sulphate solution the most influent factors areU 02ð½Na3PO4�Þ, the interaction U 02U 02 and U 01 SO2�
4
� �� �for
Dm evolution.SEM-EDXS and AFM characterization of copper
immersed for 1 h in aggressive media ½Cl�� ¼ð
SO2�4
� �¼ 0:65 mol L�1Þ indicated surface corrosion. Phos-
phate addition ([Na3PO4] = 1.25 mmol L�1) decreasesinterface damage. However, its action is lower than thatexhibited by benzotriazole. Then, further optimizationsare required to enhance to inhibition efficiency of the inor-ganic compound.
References
[1] Proctor and Gamble Ltd., British Patent no. 652339, 1947.[2] H.Otmacic,E.Stupnisek-Lisac,ElectrochimicaActa48(2003)985–991.[3] J.M. Bastidas, P. Pinilla, E. Cano, J.L. Polo, S. Miguel, Corrosion
Science 45 (2003) 427–449.[4] M.M. Singh, R.B. Rastogi, B.N. Upadhyay, M. Yadav, Materials
Chemistry and Physics 80 (2003) 283–293.[5] K.F. Khaled, N. Hackerman, Electrochimica Acta 49 (2004) 485–495.[6] Da-quan Zhang, Li-xin Gao, Guo-ding Zhou, Corrosion Science 46
(2004) 3031–3040.
N. Souissi, E. Triki / Corrosion Science 50 (2008) 231–241 241
[7] S.A. Abd El-Maksoud, Journal of Electroanalytical Chemistry 565(2004) 321–328.
[8] J.B. Matos, L.P. Pereira, S.M.L. Agostinho, O.E. Barcia, G.G.O.Cordeiro, E. D’Elia, Journal of Electroanalytical Chemistry 570(2004) 91–94.
[9] R. Fuchs-Godec, V. Dolecek, Colloids and Surfaces A: Physico-chemical and Engineering Aspects 244 (2004) 73–76.
[10] A. Igual Munoz, J. Garcıa Anton, J.L. Guinon, V. Perez Herranz,Electrochimica Acta 50 (2004) 957–966.
[11] S. Ramesh, S. Rajeswari, Corrosion Science 47 (2005) 151–169.[12] E. Szo}cs, Gy. Vastag, A. Shaban, E. Kalma, Corrosion Science 47
(2005) 893–908.[13] M. Ehteshamzade, T. Shahrabi, M.G. Hosseini, Applied Surface
Science 252 (2006) 2949–2959.[14] E. Rocca, G. Bertrand, C. Rapin, J.C. Labrune, J. Electroanal. Chem.
503 (2001) 133–140.[15] E. Stupnisek-Lisac, A. Gazivoda, M. Madzarac, Electrochim. Acta 47
(2002) 4189–4194.[16] S.A. Abd El-Maksoud, Electrochimica Acta 49 (2004) 4205–4212.[17] J. Mabrour, M. Akssira, M. Azzi, M. Zertoubi, N. Saib, A.
Messaoudi, A. Albizane, S. Tahiri, Corrosion Science 46 (2004)1833–1847.
[18] L. Valek, S. Martinez, Materials Letters 61 (2007) 148–151.[19] T. Fallavena, M. Antonow, R. Simo}es Gonc�alves, Applied Surface
Science 253 (2006) 566–571.[20] M.M. Benjamin, S.H. Reiber, J.F. Ferguson, E.A. Vanderwerff,
M.W. Millw, Corrosion of Copper Pipes in Chemistry of CorrosionInhibitors in Potable Water, AWWAR, Denver, CO, 1990, p. 210.
[21] E. Kalman, F.H. Karman, I. Cserny, J. Telegdi, D. Varga, Electro-chimica Acta (39) (1994) 1179.
[22] Y. Gonzalez, M.C. Lafont, N. Pebere, G. Chatainier, J. Roy, T.Bouissou, Corrosion Science (37) (1995) 1823.
[23] D. Dodrill, M. Edwards, Journal American Water Works Association89 (7) (1995) 74.
[24] M.R. Schock, D.A. Lytle, J.A. Clement, The NACE, Corrosion 95(610) (1995) 29.
[25] X.H. To, N. Pebere, F. Dabosi, N. Pelaprat, B. Boutevin, J.P. Parisi,Galvano-Organo-Traitement de surface, (654) 760 (1995) et dans leProcceding du 9eme Forum des impedances electrochimiques, Ed. C.Gabrielli, Paris (1995) 115.
[26] B. Muller, I. Foster, Corrosion Science 38 (1996) 1103.
[27] X.H. To, N. Pebere, N. Pelaprat, B. Boutevin, Y. Hervaud, CorrosionScience (39) (1997) 1925.
[28] T.A. Truc, N. Pebere, T.T.X. Hang, Y. Hervaud, B. Boutevin,Corrosion Science 44 (2002) 2055.
[29] H. Amar, J. Benzakour, A. Derja, D. Villemin, B. Moreau, Journal ofElectroanalytical Chemistry 558 (2003) 131–139.
[30] M.R. Laamari, A. Derja, J. Benzakour, M. Berraho, Journal ofElectroanalytical Chemistry 569 (2004) 1–6.
[31] S. Ramesh, S. Rajeswari, S. Maruthamuthu, Applied Surface Science229 (2004) 214–225.
[32] S.A.M. Refaey, Applied Surface Science 240 (2005) 396–404.
[33] M. Edwards, L. Hidmi, D. Gladwell, Corrosion Science 44 (2002)1057.
[34] N. Souissi, L. Bousselmi, S. Khosrof, E. Triki, Materials andCorrosion 54 (4) (2003) 318.
[35] N. Souissi, E. Triki, Journal of Materials Science 42 (2007) 3259–3265.
[36] Standard procedure ASTM G1 – 90 (reapproved 1999).[37] D.H. Doehlert, Applied Statistics 19 (1970) 231.[38] S. Furlanetto, S. Pinzauti, E. La Porta, A. Chiarugi, P. Mura, S.
Orlandini, Journal of Pharmaceutical and Biomedical Analysis 17(1998) 1015–1028.
[39] A.G. Gonzalez, D. Gonzalez-Arjona, Talanta 49 (1999) 433.[40] M. Nechar, M.F. Molina, J.M. Bosque-Sendra, Analytica Chimica
Acta 382 (1999) 117.[41] L. Paugam, R. Menard, J-P. Larue, D. Thouvenot, Journal of
Chromatography A 864 (1999) 155.[42] C. Aguilar, A. Penalver, E. Pocurull, J. Ferre, F. Borrull, R.M.
Marce, Journal of Chromatography A 844 (1999) 425.[43] P. Araujo, Trends in Analytical Chemistry 19 (2000) 524.[44] S.L.C. Ferreira, A.S. Queiroz, M.S. Fernandes, H.C. dos Santos,
Spectrochimica Acta Part B 57 (2002) 1939.[45] R.J. Cassella, O.D. de Sant’Ana, R.E. Santelli, Spectrochimica Acta
Part B 57 (2002) 1967.[46] F. Hellal, M. Dachraoui, Talanta 63 (2004) 1089.[47] P.D. Haaland, Experimental Design in Biotechnology, Marcel
Dekker, New York, 1989.[48] D. Mathieu, J. Nony, R. Phan-Tan-Luu, New Efficient Methodology
for Research using Optimal Design (NEMROD) Software-L.P.R.A.I,Marseille, 1998.