Superiority of Mesoporous Silica-Based Amorphous ... - MDPI
15
Citation: Zhang, H.; Li, M.; Li, J.; Agrawal, A.; Hui, H.-W.; Liu, D. Superiority of Mesoporous Silica-Based Amorphous Formulations over Spray-Dried Solid Dispersions. Pharmaceutics 2022, 14, 428. https://doi.org/10.3390/ pharmaceutics14020428 Academic Editor: Anne Marie Healy Received: 1 February 2022 Accepted: 13 February 2022 Published: 16 February 2022 Publisher’s Note: MDPI stays neutral with regard to jurisdictional claims in published maps and institutional affil- iations. Copyright: © 2022 by the authors. Licensee MDPI, Basel, Switzerland. This article is an open access article distributed under the terms and conditions of the Creative Commons Attribution (CC BY) license (https:// creativecommons.org/licenses/by/ 4.0/). pharmaceutics Article Superiority of Mesoporous Silica-Based Amorphous Formulations over Spray-Dried Solid Dispersions Hongwei Zhang , Minglu Li, Jianmin Li, Anjali Agrawal, Ho-Wah Hui and Demin Liu * Bristol Myers Squibb, 86 Morris Ave, Summit, NJ 07901, USA; [email protected] (H.Z.); [email protected] (M.L.); [email protected] (J.L.); [email protected] (A.A.); [email protected] (H.-W.H.) * Correspondence: [email protected]; Tel.: +1-908-897-6284 Abstract: The aim of this study was to compare the performance of two amorphous formulation strategies: mesoporous silica via solvent impregnation, and solid dispersions by spray drying. Poorly soluble fenofibrate was chosen as the model drug compound. A total of 30% Fenofibrate- loaded mesoporous silica and spray-dried solid dispersions (SDD) were prepared for head-to-head comparisons, including accelerated stability, manufacturability, and in vitro biorelevant dissolution. In the accelerated stability study under 40 ◦ C/75% RH in open dish, mesoporous silica was able to maintain amorphous fenofibrate for up to 3 months based on solid-state characterizations by PXRD and DSC. This result was superior compared to SDD, as recrystallization was observed within 2 weeks. Under the same drug load, fenofibrate-loaded mesoporous silica showed much better flowability than fenofibrate-loaded SDD, which is beneficial for powder handling of the intermediate product during the downstream process. The in vitro 2-stage dissolution results indicated a well-controlled release of fenofibrate from mesoporous silica in the biorelevant media, rather than a burst release followed by fast precipitation due to the recrystallization in the early simulated gastric phase for SDD. The present study demonstrates that mesoporous silica is a promising formulation platform alternative to prevailing spray-dried solid dispersions for oral drug product development. Keywords: mesoporous silica; fenofibrate; spray-dried solid dispersions; stability; manufacturability; in vitro 2-stage dissolution 1. Introduction Poor aqueous solubility is a common challenge for most of the biopharmaceutics classification system’s (BCS) class II or IV drug candidates in the oral route development pipelines. The amorphization of drug molecules is a prevalent strategy to increase solubility and enhance the dissolution rate in the gastrointestinal (GI) tract, subsequently resulting in improved bioavailability [1]. Commonly used techniques for amorphization in the pharmaceutical industry include spray drying [2] and hot melt extrusion [3], however, these conventional techniques may fail in the commercial stage due to multiple limitations, such as economic considerations, being environmentally unfriendly, potential phase separation during long term storage [4], and the difficulty in maintaining amorphous form of drug molecules with low glass transition temperature [5]. In the recent decades, loading drug molecules into the mesoporous silica (MS) has been considered as a novel promising alternative to the traditional methods of amorphous formulation development [6]. Credited to their unique characteristics of nanoscale meso- pores with high pore volumes and high surface areas, MS materials can effectively entrap drug molecules in the mesopores and suppress the recrystallization by virtue of finite-size effects [7]. As a result, amorphous drugs entrapped in the mesopores can enhance dis- solution rate and generate drug supersaturation in aqueous media, leading to a superior bioavailability over the crystalline form [8]. Therefore, MS materials have attracted ex- tensive interest as efficient carriers to deliver poorly aqueous soluble drug molecules. In Pharmaceutics 2022, 14, 428. https://doi.org/10.3390/pharmaceutics14020428 https://www.mdpi.com/journal/pharmaceutics
-
Upload
khangminh22 -
Category
Documents
-
view
0 -
download
0
Transcript of Superiority of Mesoporous Silica-Based Amorphous ... - MDPI
�����������������
Citation: Zhang, H.; Li, M.; Li, J.;
Agrawal, A.; Hui, H.-W.; Liu, D.
Superiority of Mesoporous
Silica-Based Amorphous
Formulations over Spray-Dried Solid
Dispersions. Pharmaceutics 2022, 14,
428. https://doi.org/10.3390/
pharmaceutics14020428
Academic Editor: Anne Marie Healy
Received: 1 February 2022
Accepted: 13 February 2022
Published: 16 February 2022
Publisher’s Note: MDPI stays neutral
with regard to jurisdictional claims in
published maps and institutional affil-
iations.
Copyright: © 2022 by the authors.
Licensee MDPI, Basel, Switzerland.
This article is an open access article
distributed under the terms and
conditions of the Creative Commons
Attribution (CC BY) license (https://
creativecommons.org/licenses/by/
4.0/).
pharmaceutics
Article
Superiority of Mesoporous Silica-Based AmorphousFormulations over Spray-Dried Solid DispersionsHongwei Zhang , Minglu Li, Jianmin Li, Anjali Agrawal, Ho-Wah Hui and Demin Liu *
Bristol Myers Squibb, 86 Morris Ave, Summit, NJ 07901, USA; [email protected] (H.Z.);[email protected] (M.L.); [email protected] (J.L.); [email protected] (A.A.);[email protected] (H.-W.H.)* Correspondence: [email protected]; Tel.: +1-908-897-6284
Abstract: The aim of this study was to compare the performance of two amorphous formulationstrategies: mesoporous silica via solvent impregnation, and solid dispersions by spray drying.Poorly soluble fenofibrate was chosen as the model drug compound. A total of 30% Fenofibrate-loaded mesoporous silica and spray-dried solid dispersions (SDD) were prepared for head-to-headcomparisons, including accelerated stability, manufacturability, and in vitro biorelevant dissolution.In the accelerated stability study under 40 ◦C/75% RH in open dish, mesoporous silica was able tomaintain amorphous fenofibrate for up to 3 months based on solid-state characterizations by PXRDand DSC. This result was superior compared to SDD, as recrystallization was observed within 2 weeks.Under the same drug load, fenofibrate-loaded mesoporous silica showed much better flowabilitythan fenofibrate-loaded SDD, which is beneficial for powder handling of the intermediate productduring the downstream process. The in vitro 2-stage dissolution results indicated a well-controlledrelease of fenofibrate from mesoporous silica in the biorelevant media, rather than a burst releasefollowed by fast precipitation due to the recrystallization in the early simulated gastric phase forSDD. The present study demonstrates that mesoporous silica is a promising formulation platformalternative to prevailing spray-dried solid dispersions for oral drug product development.
Keywords: mesoporous silica; fenofibrate; spray-dried solid dispersions; stability; manufacturability;in vitro 2-stage dissolution
1. Introduction
Poor aqueous solubility is a common challenge for most of the biopharmaceuticsclassification system’s (BCS) class II or IV drug candidates in the oral route developmentpipelines. The amorphization of drug molecules is a prevalent strategy to increase solubilityand enhance the dissolution rate in the gastrointestinal (GI) tract, subsequently resultingin improved bioavailability [1]. Commonly used techniques for amorphization in thepharmaceutical industry include spray drying [2] and hot melt extrusion [3], however, theseconventional techniques may fail in the commercial stage due to multiple limitations, suchas economic considerations, being environmentally unfriendly, potential phase separationduring long term storage [4], and the difficulty in maintaining amorphous form of drugmolecules with low glass transition temperature [5].
In the recent decades, loading drug molecules into the mesoporous silica (MS) hasbeen considered as a novel promising alternative to the traditional methods of amorphousformulation development [6]. Credited to their unique characteristics of nanoscale meso-pores with high pore volumes and high surface areas, MS materials can effectively entrapdrug molecules in the mesopores and suppress the recrystallization by virtue of finite-sizeeffects [7]. As a result, amorphous drugs entrapped in the mesopores can enhance dis-solution rate and generate drug supersaturation in aqueous media, leading to a superiorbioavailability over the crystalline form [8]. Therefore, MS materials have attracted ex-tensive interest as efficient carriers to deliver poorly aqueous soluble drug molecules. In
Pharmaceutics 2022, 14, 428. https://doi.org/10.3390/pharmaceutics14020428 https://www.mdpi.com/journal/pharmaceutics

Pharmaceutics 2022, 14, 428 2 of 15
addition, controlled drug release can be achieved from mesoporous carriers by adjustingkey characters of MS materials, such as pore diameter [9], pore volume [10], pore geome-try [11], and pore surface functionality [10]. Various feasible loading methods have beenexplored including solvent impregnation [12], co-spray drying [13], physical mixing [14],microwave irradiation [15], liquid CO2 [16], and supercritical CO2 [17].
Despite extensive studies in recent years on the structural modification of MS materials,emerging drug-loading methods, and potential applications in drug delivery, there seemsto be a lack of a decision as to which processing method can possibly move forward tothe commercial stage in comparison with the conventional technology of solid dispersionmanufacturing by spray drying or melt extrusion. It has been noted that besides physicalmixing, there are many other loading processes that can maintain the homogeneity andamorphous status of drug-loaded MS, among them, solvent impregnation is easier tohandle and more economic than the other methods. Additionally, it has also been provedto achieve the greatest increase in drug loading [18].
The objective of the current study is to explore the advantages of a mesoporoussilica-based amorphous formulation platform over conventional spray-dried amorphousdispersions. In the present study, commercial mesoporous silica material (Parteck® SLC)was used as the carrier, and the Class II drug fenofibrate (abbreviation as Feno, log p = 5.24,aqueous solubility = 0.8 µg/mL) was chosen as the model compound, with poor aqueoussolubility and a low melting point [19], to manufacture fenofibrate-loaded mesoporoussilica (abbreviation as Feno-MS) via solvent impregnation. Based on a preliminary screeningstudy and past literature [5] the two best-performing polymeric excipients were selectedbased on stability results (PVP K90 and HPMC E15) to produce two fenofibrate-loaded soliddispersions (abbreviation as Feno-SDD-PVP and Feno-SDD-HPMC), respectively. To ourbest knowledge, this is the first study where a head-to-head comparison of the performanceof an MS-based formulation and the conventional SDD has been performed, includingaccelerated stability, manufacturability, and in vitro 2-stage biorelevant dissolution.
2. Materials and Methods2.1. Materials
Fenofibrate was purchased from Acros Organics (Morris Plains, NJ, USA). The meso-porous silica (Parteck® SLC, disordered pore size at 6 nm) was purchased from MilliporeSigma (St. Louis, MO, USA). The polymers polyvinylpyrrolidone K-90 (PVP K90) andhypromellose E15 (HPMC E15) were purchased from BASF (Florham Park, NJ, USA) andAshland (Cherry Hill, NJ, USA), respectively. Avicel PH101 (lot# P118832588) was pur-chased from DuPont (Wilmington, DE, USA). Milli-Q water was obtained from BristolMyers Squibb (Summit, NJ, USA). All organic solvents (HPLC grade), such as methanol andacetone, were purchased from Sigma-Aldrich (St. Louis, MO, USA). Simulated intestinalfluid (SIF) powder was purchased from Biorelevant.com Ltd. (London, UK).
2.2. Methods2.2.1. Preparation of Fenofibrate-Loaded Mesoporous Silica
Fenofibrate-loaded mesoporous silica was prepared based on the solvent impregnationmethod. The initial load of fenofibrate was 10%, 20%, and 30% (abbreviation as 10%-Feno-MS, 20%-Feno-MS and 30%-Feno-MS), respectively. In our preliminary study, the stirringspeed of the paddle (IKA NANOSTAR 7.5 digital overhead stirrer, Wilmington, NC, USA)and the loading speed of 50 mg/mL fenofibrate in acetone were optimized at 30% drugload as an upper limit in the study range. Polarized light microscopy (Polarized LightMicroscopy (PLM)) was performed after each trial and the preliminary results are concludedin the Supplementary Material, Figure S1. A stock solution of 50 mg/mL fenofibrate inacetone was added dropwise into the mesoporous silica (Parteck® SLC) at the speed of2 mL/min using an automatic Masterflex single-syringe infusion pump (Cole-Parmer Inc.,Vernon Hills, IL, USA), with paddle stirring at 100 rpm and oil heating at 50 ◦C. The totalsolids weight of fenofibrate and mesoporous silica was 50 g. Then, the samples were

Pharmaceutics 2022, 14, 428 3 of 15
vacuum-dried at 40 ◦C for 24 h to remove residual acetone, and all dried samples werestored in 20 mL glass vials with caps sealed at 4 ◦C.
2.2.2. Preparation of Fenofibrate-Loaded Solid Dispersions by Spray Drying
Fenofibrate-loaded spray-dried dispersions (abbreviation as Feno-SDD) were preparedusing a Buchi mini spray dryer (B-290, New Castle, DE, USA). Two polymers, PVP K90and HPMC E15, were chosen as the polymeric stabilizers, and the initial load of fenofibratewas 30% (abbreviation as 30%-Feno-SDD-PVP and 30%-Feno-SDD-HPMC, respectively).Typically, 3% w/v of drug–polymeric excipient was dissolved in methanol, which wasthen spray-dried under nitrogen atmosphere to prevent any potential explosions and drugdegradation. Inlet and outlet air temperatures were 100 ◦C and 50 ◦C, respectively. Thefeed pump rate was 10.0 mL/min, and the aspiration rate was 100%. The spray-dried solidswere collected and then vacuum-dried at 40 ◦C for 24 h to remove residual solvent, and theyield of Feno-SDD was 60%. All vacuum-dried SDD samples were stored in 20 mL glassvials with caps sealed at 4 ◦C.
2.2.3. Accelerated Stability Evaluation
The physical and chemical stability of both Feno-MS and Feno-SDD-PVP were investi-gated under an accelerated condition of 40 ◦C/75% RH (relative humidity) in open dish.The samples were pulled out bi-weekly for solid characterizations to check for any physicalrecrystallization for up to 3 months (3 M). Equivalent to 4 mg of fenofibrate, approximately40.0 mg of 10%-Feno-MS, 20.0 mg of 20%-Feno-MS, and 13.3 mg of 10%-Feno-MS sampleswere pulled out from the top, middle, and bottom locations of all Feno-MS samples inthe 20 mL glass vials, respectively, for assay and chemical purity tests via a Waters Ac-quity UPLC system (Waters, Milford, MA, USA). All pulled-out samples were diluted bymethanol to 200 µg/mL for UPLC analysis. The system operation, data collection, andprocessing were performed using the Waters Empower platform. The analytical columnwas 50 mm × 2.1 mm Acquity UPLC BEH C18, 1.7 µm particle size (Waters, Milford,MA, USA). A gradient method was set up with modification [20]. The two mobile phaseswere acetonitrile (ACN) and acetate buffer (pH 4.70; 0.01 M), with gradient elution ofthe ACN phase described as follows: 50% (initial), 70% (1.0 min), 85% (1.4 min), 85%(2.0 min), 50% (2.2 min), and 50% (3.0 min). The injection volume was 1 µL and the flowrate was 0.5 mL/min at ambient temperature with the detection wavelength as 247 nm.The standard stock solution of fenofibrate was accurately prepared at a concentration of400.0 µg/mL, which was termed as standard 100%. Calibration curves were establishedover the range of 4.0–400.0 µg/mL, with a regression coefficient greater than 0.999. Thenominal retention time of fenofibrate was around 2.0 min.
2.2.4. Solid State CharacterizationsPowder X-ray Diffraction (PXRD)
A Bruker D8 Advance Diffractometer (Bruker, Billerica, MA, USA) was used to performPXRD analysis using a Si zero-background holder. A Cu K-α X-ray tube was set at 40 kVand 40 mA, with the wavelength of Kα1 as 1.5406 Å and the scan speed rate at 0.062◦
(◦2TH)/s from 3◦ to 40◦ (◦2TH). All samples were tested under ambient conditions.
Polarized Light Microscopy (PLM)
An Eclipse LV100N POL polarized light microscope (Nikon Instruments Inc., Melville,NY, USA) was used to detect any birefringent specimens due to fenofibrate crystallizationunder the polarized light condition. Each PLM image was captured under the auto-exposure background mode at room temperature by 100 times magnification.
Thermal Analysis
Differential scanning calorimetry (DSC) thermograms were obtained using a DSCQ2000 mode (TA instruments, New Castle, DE, USA). Calibration was first carried out

Pharmaceutics 2022, 14, 428 4 of 15
for checking enthalpy and heating rate using indium and lead. About 3–5 mg of eachsample was heated in a crimped aluminum pan at a heating rate of 5 ◦C/min from 25 ◦Cto 250 ◦C, with pure nitrogen as a purge gas at 50 mL/min. Thermogravimetric analysis(TGA) thermograms were obtained using a TGA Q5000 mode (TA instruments, NewCastle, DE, USA). About 5 mg of each sample in an open platinum plate was heated from25 ◦C to 250 ◦C at 10 ◦C/min. All DSC and TGA data were analyzed using TA UniversalAnalysis software.
2.2.5. Scanning Electron Microscopy (SEM)
SEM images of pure crystalline fenofibrate and Feno-MS samples with different drugloads (10–30%) were captured using a Phemon XL Desktop Scanning Electron Microscope(NanoScience Instrument, Phoenix, AZ, USA). Each sample was coated with Au on siliconchips to improve electrical conductivity. The accelerating voltage of the field emission gunwas 10 kV and the scale bar was 30 µm.
2.2.6. Particle Size Distribution (PSD)
A laser scattering particle size distribution analyzer (Partica LA-960, Horiba, NJ, USA)was used to measure the particle size distribution of both Feno-MS and Feno-SDD-PVP.About 100 mg of each sample was fed in as dry powder dispersion. Each measurementwas conducted in triplicate.
2.2.7. Manufacturability Assessment
The manufacturability of both Feno-MS and Feno-SDD-PVP powders was assessedusing the FT4 powder rheometer (Freeman Technology, Tewkesbury, UK) for the followingtests: conditioned bulk density (CBD), tapped density (TD), compressibility, and shearcell test. Furthermore, BET surface area of each sample was tested according to USP 43<846>. The compactibility and compressibility were compared for the binary mixture ofmicrocrystalline cellulose (Avicel PH101) and 30%-Feno-MS, 30%-Feno-SDD-PVP, or pureMS (30:70, w/w).
Conditioned Bulk Density (CBD) and Tapped Density (TD)
Before each test cycle, the sample was conditioned by the standard conditioningprocess which involves gentle displacement of the powder to loosen and slightly aerate thepowder. This process can remove any pre-compaction or excess air. Then, each sample wassplit to ensure a precise volume of powder by rotating the upper part of the vessel awayfrom the lower part. The powder remaining in the lower vessel was weighed by the FT4 in-built balance to measure the conditioned bulk density. For tapped density, each conditionedsample was consolidated by the tapping mode followed by the splitting process above, andthe TD was measured by weighing the remaining powder in the lower vessel.
Compressibility Test
In the compressibility test cycle, the change in powder bulk density was measuredas a function of applied normal consolidation stress ranging from 0.5 kPa to 15 kPa. Thecompressibility (CPS%) was calculated as shown by the equation:
CPS% = 100 × (Vc − Vp)/Vp
where Vc and Vp are the bulk volume before and after the consolidation step, respectively.
Shear Test by FT4 Rheometer
The shear test can provide followability information to understand how easily apowder sample previously at rest can flow under normal stress. Four steps, includingconditioning, consolidation, pre-shearing, and shearing were included in the test cycle. Inthe conditioning step, each sample with a uniform and reproducible packing state wasestablished by a helical blade moving downwards and upwards three times at a tip speed

Pharmaceutics 2022, 14, 428 5 of 15
of 60 mm/s. During consolidation, a vented piston applied the initial consolidation stressto the sample powder, which was then sheared to achieve a steady state. The shear stressand normal stress were indicated as a pre-shear point. After the pre-shearing procedure,the sample was further sheared to obtain a yield point by lowering the normal stress. Inthe present study the paired pre-shear/shear procedure was repeated 5 times at normalstress of 6 kPa to obtain a yield locus. A Mohr-circle analysis was plotted to extrapolate theflow function coefficient (ffc).
BET Surface Area
The BET surface area of all samples was assessed using a fully automated surface areaand porosity analyzer (Micromeritics TriStar II Plus, Norcross, GA, USA). The standard testprocedure was followed by USP 43 <846> for each sample. In general, about 0.5–1 g of thesample was weighed in the sample tube. It was then closed with the cap and degassed at40 ◦C for 12 h. When degassing was complete, the sample was reweighed and transferredto the analysis port using nitrogen for BET surface area analysis.
Compactibility and Compressibility Assessment
Compression profiling was performed on three binary samples by weight ratio aslisted in Table 1. To prepare the binary mixture, each component was weighed out andadded to a 100 mL amber glass bottle. Mixing was performed using a TURBULA ShakerMixer T2F (WAB-GROUP, Muttenz, Switzerland) for 10 min at 32 rpm. A binary mixture of5 g was obtained for each of the three samples following this procedure. True density wasmeasured using a Helium Pycnometer (AcuPyc II, 1340 Pycnometer; Purge Fill Pressure:19.5 psi; Number of Cycles: 10; Cycle Fill Pressure: 19.5 psi). A 10 mL sample chamber wasused, with 2–3 g of sample used for each measurement.
Table 1. Materials used in compression profiling.
Material Lot of Three Binary Samples Amount (g)
Feno-SDD/Avicel PH101 Binary Mixture
30%-Feno-SDD-PVP N/A 1.5
Avicel PH101 P118832588 3.5
Feno-MS/Avicel PH101 Binary Mixture
30%-Feno-MS N/A 1.5
Avicel PH101 P118832588 3.5
MS/Avicel PH101 Binary Mixture
Mesoporous Silica N/A 1.5
Avicel PH101 P118832588 3.5
The compact of approximately 200 mg each was obtained using 9 mm diameter roundflat tooling by Instron Universal Testing System 5969 (INSTRON, Norwood, MA, USA).The compression force ranged from 1.5 kN to 25 kN. Weight, thickness, and hardness foreach compact was measured. The compression profiles, including compactibility (tensilestrength vs. porosity) and compressibility (solid fraction vs. compression pressure), of thethree binary mixture samples were generated. The compression pressure (MPa), tensilestrength (N/mm2), solid fraction, and porosity were calculated based on the equationsshown below.
Compression Pressure (MPa) = (1000 × Compression Force (kN))/Diameter2 (mm2)
Tensile Strength(
Nmm2
)= (2 × Hardness (kilopond)× 9.086)/(3.14 × Diameter (mm)× Thickness (mm)
Solid Fraction =((Weight (mg)/100)/Volume
(cm3))/(True Density (g/mL))
Porosity = 1 − Solid Fraction
Pharmaceutics 2022, 14, 428 6 of 15
2.2.8. Solubility Testing
The solubility of crystalline fenofibrate in simulated gastric fluid (SGF, pH 2.0) andfasted-state simulated intestinal fluid (FaSSIF, pH 6.5) was measured at 37 ◦C after equilib-rium for 24 h. The excessive amount of crystalline fenofibrate was dispersed in relevantmedia under stirring at 50 rpm for 24 h, and the concentration of crystalline fenofibrate sus-pension was determined using the Pion MicroFLUX dissolution instrument (Pion, Billerica,MA, USA).
2.2.9. In Vitro 2-Stage Biorelevant Dissolution
The in vitro 2-stage dissolution profiles of the 30%-Feno-MS and 30%-Feno-SDD-PVPwere obtained using a Pion MicroFLUX dissolution instrument (Pion, Billerica, MA, USA).Initially, a certain amount of 30%-Feno-MS (or 30%-Feno-SDD-PVP) was added into 7 mLSGF solution under a non-sink condition at 37 ◦C and stirring speed of 50 rpm. After20 min, 14 mL FaSSIF solution was added to the vessel, and the theoretical concentrationunder a sink condition was 20 µg/mL when the total volume in the vessel was 21 mL.The preparation procedures of SGF and FeSSIF were described as the following [21]. Thestandard calibration curve for SGF and FaSSIF were built with regression coefficients bothabove 0.99, within the concentration range of 0–25 µg/mL and 0–20 µg/mL, respectively.The concentration of fenofibrate was monitored and recorded at the wavenumber of 294 nmfor FaSSIF and 278 nm for SGF per 5 min for up to 4 h. The release data were processed usinga second derivative to minimize the interferences of all curves from every measurementtime point.
3. Results and Discussion3.1. Feno-Loaded Mesoporous Silica at Different Drug Loads
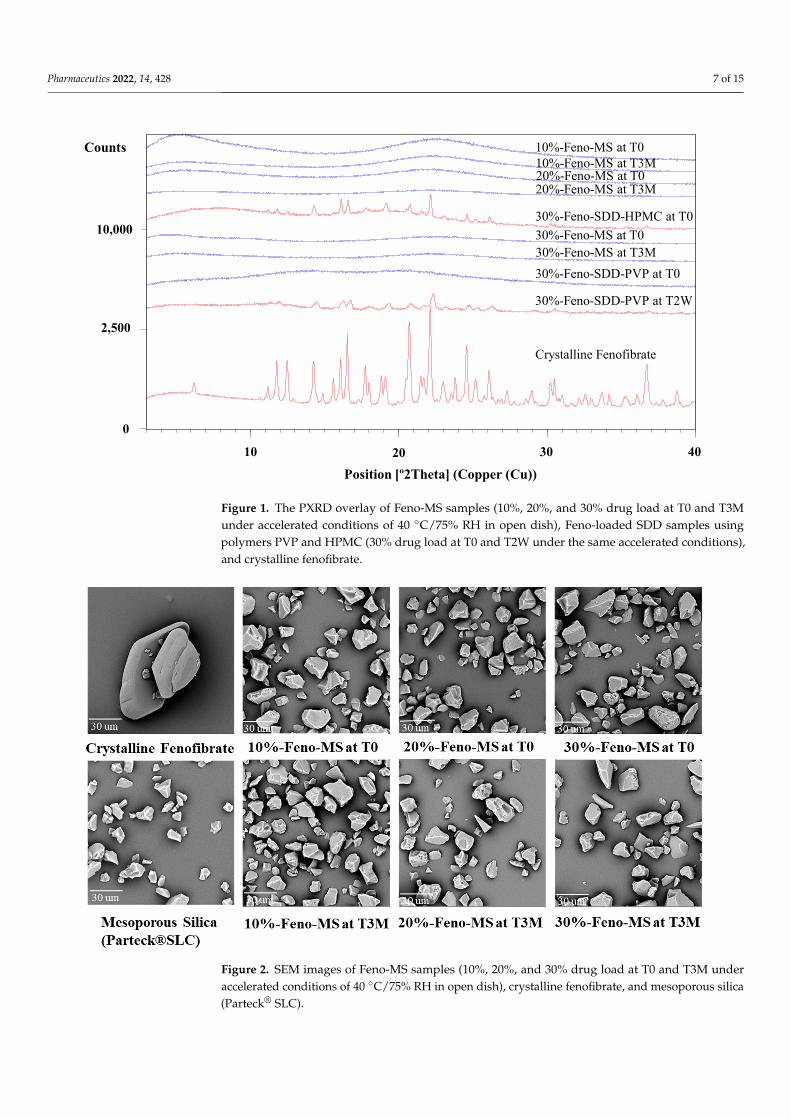
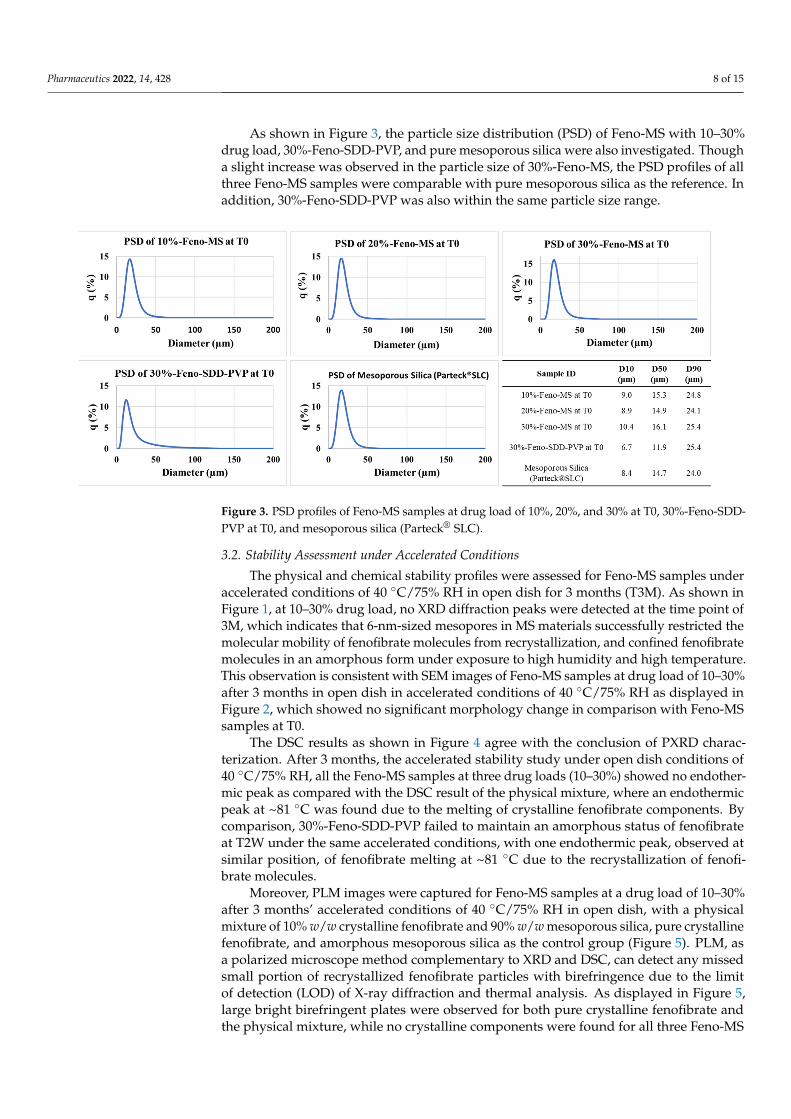
The method of solvent impregnation was chosen to manufacture Feno-loaded MSsamples considering its ease of handling and energy-conserving characteristics. Threelevels of fenofibrate drug load (10%, 20%, and 30%) were studied, and their physicalcharacteristics and amorphous status were evaluated. As shown Figure 1, all Feno-MSsamples with a drug load of 10–30% at time point T0 showed an amorphous halo withoutany XRD peaks observed in comparison to the XRD diffractogram of crystalline fenofibrate.Moreover, as displayed in Figure 2, neither a significant change in morphology nor obviousfenofibrate on the external surface of MS materials was found when the drug load wasincreased from 10% to 30% at T0, with SEM images of pure mesoporous silica as thereference. Both results indicated that it was completely possible to encapsulate fenofibratein an amorphous form in mesoporous silica when drug load was increased up to 30%during the manufacturing process of solvent impregnation. In preliminary experiments,Feno-MS samples at 40% drug load were also prepared, and it was possible to obtainamorphous fenofibrate without any significant diffraction peaks except one small potentialpeak around 16.7◦ (2θ) through PXRD (Supplementary Material, Figure S2). However,all attempts failed to obtain amorphous samples of Feno-loaded SDD at 40% drug loadby spray drying. Furthermore, 30%-Feno-SDD-HPMC was not amorphous at T0, and30%-Feno-SDD-PVP failed to maintain the amorphous status of fenofibrate at the timepoint of 2 weeks (T2W) under 40 ◦C/75% RH (Figure 1). Thus, only freshly prepared 30%-Feno-SDD-PVP was used for the head-to-head manufacturability and 2-stage dissolutioncomparison study with 30%-Feno-MS at T0.
Pharmaceutics 2022, 14, 428 7 of 15
Pharmaceutics 2022, 14, x FOR PEER REVIEW 7 of 16
SDD-PVP was used for the head-to-head manufacturability and 2-stage dissolution com-parison study with 30%-Feno-MS at T0.
Figure 1. The PXRD overlay of Feno-MS samples (10%, 20%, and 30% drug load at T0 and T3M under accelerated conditions of 40 °C/75% RH in open dish), Feno-loaded SDD samples using pol-ymers PVP and HPMC (30% drug load at T0 and T2W under the same accelerated conditions), and crystalline fenofibrate.
Figure 2. SEM images of Feno-MS samples (10%, 20%, and 30% drug load at T0 and T3M under accelerated conditions of 40 °C/75% RH in open dish), crystalline fenofibrate, and mesoporous silica (Parteck®SLC).
0
2500
10000
10 20 30 40
10%-Feno-MS at T010%-Feno-MS at T3M20%-Feno-MS at T020%-Feno-MS at T3M
30%-Feno-SDD-HPMC at T0
30%-Feno-SDD-PVP at T0
30%-Feno-MS at T030%-Feno-MS at T3M
30%-Feno-SDD-PVP at T2W
Crystalline Fenofibrate
Position [º2Theta] (Copper (Cu))
Counts
10,000
2,500
0
10 20 30 40
Figure 1. The PXRD overlay of Feno-MS samples (10%, 20%, and 30% drug load at T0 and T3Munder accelerated conditions of 40 ◦C/75% RH in open dish), Feno-loaded SDD samples usingpolymers PVP and HPMC (30% drug load at T0 and T2W under the same accelerated conditions),and crystalline fenofibrate.
Pharmaceutics 2022, 14, x FOR PEER REVIEW 7 of 16
SDD-PVP was used for the head-to-head manufacturability and 2-stage dissolution com-parison study with 30%-Feno-MS at T0.
Figure 1. The PXRD overlay of Feno-MS samples (10%, 20%, and 30% drug load at T0 and T3M under accelerated conditions of 40 °C/75% RH in open dish), Feno-loaded SDD samples using pol-ymers PVP and HPMC (30% drug load at T0 and T2W under the same accelerated conditions), and crystalline fenofibrate.
Figure 2. SEM images of Feno-MS samples (10%, 20%, and 30% drug load at T0 and T3M under accelerated conditions of 40 °C/75% RH in open dish), crystalline fenofibrate, and mesoporous silica (Parteck®SLC).
0
2500
10000
10 20 30 40
10%-Feno-MS at T010%-Feno-MS at T3M20%-Feno-MS at T020%-Feno-MS at T3M
30%-Feno-SDD-HPMC at T0
30%-Feno-SDD-PVP at T0
30%-Feno-MS at T030%-Feno-MS at T3M
30%-Feno-SDD-PVP at T2W
Crystalline Fenofibrate
Position [º2Theta] (Copper (Cu))
Counts
10,000
2,500
0
10 20 30 40
Figure 2. SEM images of Feno-MS samples (10%, 20%, and 30% drug load at T0 and T3M underaccelerated conditions of 40 ◦C/75% RH in open dish), crystalline fenofibrate, and mesoporous silica(Parteck® SLC).
Pharmaceutics 2022, 14, 428 8 of 15
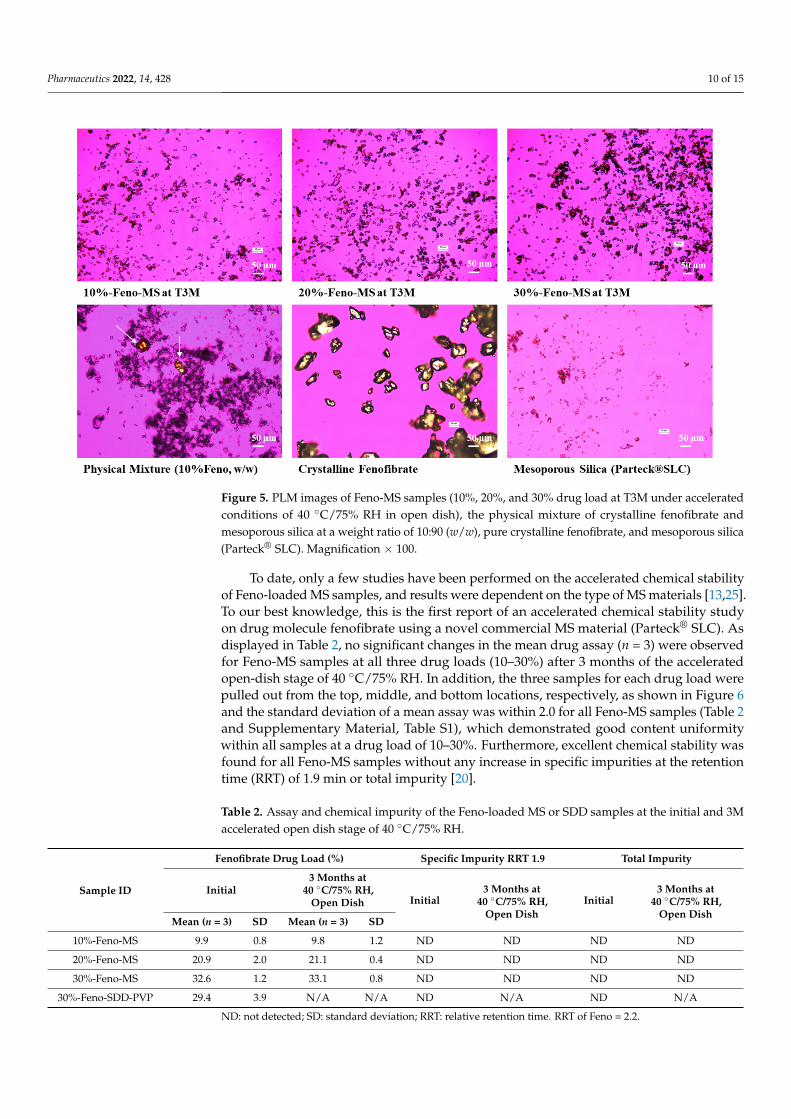
As shown in Figure 3, the particle size distribution (PSD) of Feno-MS with 10–30%drug load, 30%-Feno-SDD-PVP, and pure mesoporous silica were also investigated. Thougha slight increase was observed in the particle size of 30%-Feno-MS, the PSD profiles of allthree Feno-MS samples were comparable with pure mesoporous silica as the reference. Inaddition, 30%-Feno-SDD-PVP was also within the same particle size range.
Pharmaceutics 2022, 14, x FOR PEER REVIEW 8 of 16
As shown in Figure 3, the particle size distribution (PSD) of Feno-MS with 10–30% drug load, 30%-Feno-SDD-PVP, and pure mesoporous silica were also investigated. Though a slight increase was observed in the particle size of 30%-Feno-MS, the PSD pro-files of all three Feno-MS samples were comparable with pure mesoporous silica as the reference. In addition, 30%-Feno-SDD-PVP was also within the same particle size range.
Figure 3. PSD profiles of Feno-MS samples at drug load of 10%, 20%, and 30% at T0, 30%-Feno-SDD-PVP at T0, and mesoporous silica (Parteck®SLC).
3.2. Stability Assessment under Accelerated Conditions The physical and chemical stability profiles were assessed for Feno-MS samples un-
der accelerated conditions of 40 °C/75% RH in open dish for 3 months (T3M). As shown in Figure 1, at 10–30% drug load, no XRD diffraction peaks were detected at the time point of 3M, which indicates that 6-nm-sized mesopores in MS materials successfully restricted the molecular mobility of fenofibrate molecules from recrystallization, and confined fen-ofibrate molecules in an amorphous form under exposure to high humidity and high tem-perature. This observation is consistent with SEM images of Feno-MS samples at drug load of 10–30% after 3 months in open dish in accelerated conditions of 40 °C/75% RH as displayed in Figure 2, which showed no significant morphology change in comparison with Feno-MS samples at T0.
The DSC results as shown in Figure 4 agree with the conclusion of PXRD characteri-zation. After 3 months, the accelerated stability study under open dish conditions of 40 °C/75% RH, all the Feno-MS samples at three drug loads (10–30%) showed no endother-mic peak as compared with the DSC result of the physical mixture, where an endothermic peak at ~81 °C was found due to the melting of crystalline fenofibrate components. By comparison, 30%-Feno-SDD-PVP failed to maintain an amorphous status of fenofibrate at T2W under the same accelerated conditions, with one endothermic peak, observed at sim-ilar position, of fenofibrate melting at ~81 °C due to the recrystallization of fenofibrate molecules.
Figure 3. PSD profiles of Feno-MS samples at drug load of 10%, 20%, and 30% at T0, 30%-Feno-SDD-PVP at T0, and mesoporous silica (Parteck® SLC).
3.2. Stability Assessment under Accelerated Conditions
The physical and chemical stability profiles were assessed for Feno-MS samples underaccelerated conditions of 40 ◦C/75% RH in open dish for 3 months (T3M). As shown inFigure 1, at 10–30% drug load, no XRD diffraction peaks were detected at the time point of3M, which indicates that 6-nm-sized mesopores in MS materials successfully restricted themolecular mobility of fenofibrate molecules from recrystallization, and confined fenofibratemolecules in an amorphous form under exposure to high humidity and high temperature.This observation is consistent with SEM images of Feno-MS samples at drug load of 10–30%after 3 months in open dish in accelerated conditions of 40 ◦C/75% RH as displayed inFigure 2, which showed no significant morphology change in comparison with Feno-MSsamples at T0.
The DSC results as shown in Figure 4 agree with the conclusion of PXRD charac-terization. After 3 months, the accelerated stability study under open dish conditions of40 ◦C/75% RH, all the Feno-MS samples at three drug loads (10–30%) showed no endother-mic peak as compared with the DSC result of the physical mixture, where an endothermicpeak at ~81 ◦C was found due to the melting of crystalline fenofibrate components. Bycomparison, 30%-Feno-SDD-PVP failed to maintain an amorphous status of fenofibrateat T2W under the same accelerated conditions, with one endothermic peak, observed atsimilar position, of fenofibrate melting at ~81 ◦C due to the recrystallization of fenofi-brate molecules.
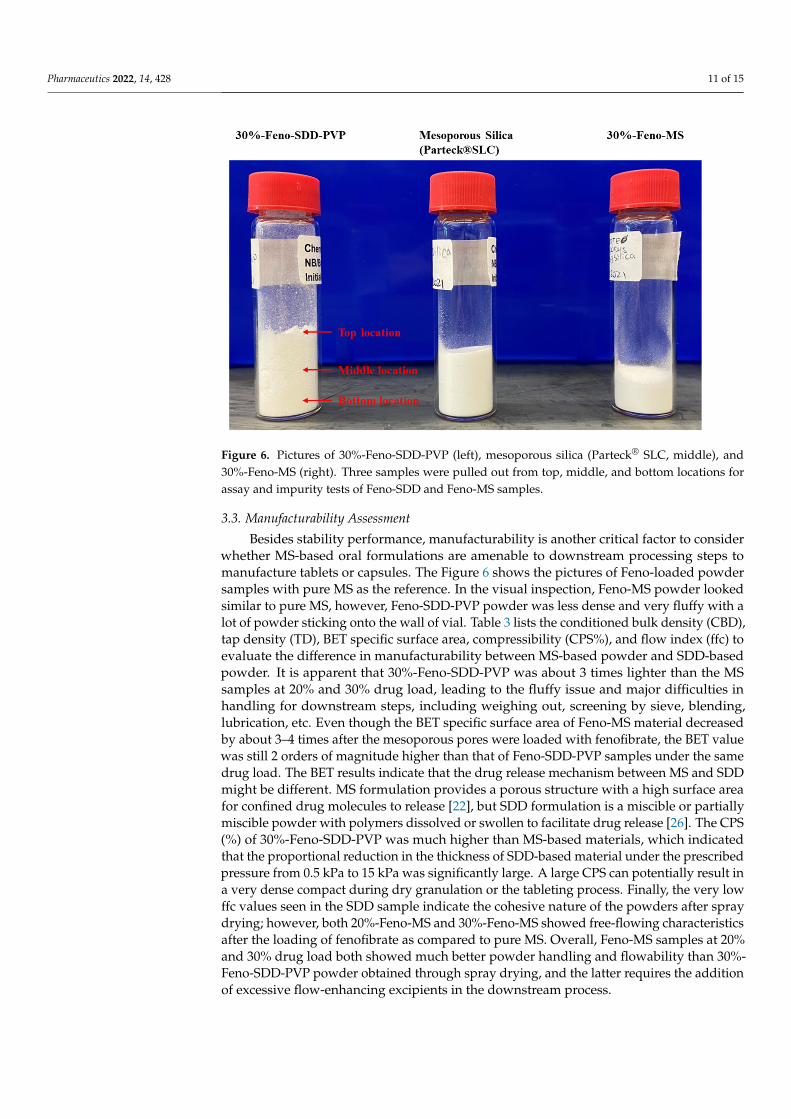
Moreover, PLM images were captured for Feno-MS samples at a drug load of 10–30%after 3 months’ accelerated conditions of 40 ◦C/75% RH in open dish, with a physicalmixture of 10% w/w crystalline fenofibrate and 90% w/w mesoporous silica, pure crystallinefenofibrate, and amorphous mesoporous silica as the control group (Figure 5). PLM, asa polarized microscope method complementary to XRD and DSC, can detect any missedsmall portion of recrystallized fenofibrate particles with birefringence due to the limitof detection (LOD) of X-ray diffraction and thermal analysis. As displayed in Figure 5,large bright birefringent plates were observed for both pure crystalline fenofibrate andthe physical mixture, while no crystalline components were found for all three Feno-MS

Pharmaceutics 2022, 14, 428 9 of 15
samples after 3 months of the accelerated stage. The findings of PLM agree with XRDand DSC results that a good control was achieved for Feno-MS samples in preventingrecrystallization of fenofibrate against the accelerated scenario, and it also helps rule outthe dilemma that recrystallized particles of a small size or at low content might escapedetection due to methodological limitations.
Pharmaceutics 2022, 14, x FOR PEER REVIEW 9 of 16
Figure 4. The DSC overlay of Feno-MS samples (10–30% drug load at T0 and T3M under accelerated conditions of 40 °C/75% RH in open dish), Feno-SDD-PVP samples (30% drug load at T0 and T2W under the same accelerated conditions), pure mesoporous silica (Parteck®SLC), and the physical mixture of crystalline fenofibrate and mesoporous silica at a weight ratio of 3:7 (w/w).
Moreover, PLM images were captured for Feno-MS samples at a drug load of 10–30% after 3 months’ accelerated conditions of 40 °C/75% RH in open dish, with a physical mixture of 10% w/w crystalline fenofibrate and 90% w/w mesoporous silica, pure crystal-line fenofibrate, and amorphous mesoporous silica as the control group (Figure 5). PLM, as a polarized microscope method complementary to XRD and DSC, can detect any missed small portion of recrystallized fenofibrate particles with birefringence due to the limit of detection (LOD) of X-ray diffraction and thermal analysis. As displayed in Figure 5, large bright birefringent plates were observed for both pure crystalline fenofibrate and the physical mixture, while no crystalline components were found for all three Feno-MS samples after 3 months of the accelerated stage. The findings of PLM agree with XRD and DSC results that a good control was achieved for Feno-MS samples in preventing recrys-tallization of fenofibrate against the accelerated scenario, and it also helps rule out the dilemma that recrystallized particles of a small size or at low content might escape detec-tion due to methodological limitations.
Figure 4. The DSC overlay of Feno-MS samples (10–30% drug load at T0 and T3M under acceleratedconditions of 40 ◦C/75% RH in open dish), Feno-SDD-PVP samples (30% drug load at T0 and T2Wunder the same accelerated conditions), pure mesoporous silica (Parteck® SLC), and the physicalmixture of crystalline fenofibrate and mesoporous silica at a weight ratio of 3:7 (w/w).
So far, multiple research groups have reported the long-term physical stability ofMS-based formulations [22]. Superior stability of MS materials over the SDD is creditedto the nano size of high volume mesopores, where drug molecules are constrained ina submicrometric space without extra room for the recrystallization [23]. Additionally,potential interaction between drug molecules and silanol groups of MS materials inside themesopores could contribute to stabilization of the amorphous state as well [24]. Differentfrom the specific structure of MS, SDD is a binary mixture of drug and polymer throughspray drying. As evidenced in the Supplementary Material, Figure S3, weight loss of30%-Feno-SDD-PVP samples before 100 ◦C increased from 1.4% to 8.7% after a short-term accelerated open dish stage of 40 ◦C/75% RH; however, no significant change inweight loss was found for 30%-Feno-MS samples after 3M under the same experimentalconditions and drug load by TGA. A lower water uptake of Feno-loaded MS was possiblyattributed to the hydrophobic nature of fenofibrate onto the mesopores of silica materials. Incomparison, the failure of Feno-loaded SDD in the stabilization of amorphous fenofibrateunder the accelerated conditions is possibly due to the moisture absorption of solublepolymer PVPK90 and subsequent phase separation, resulting in drug crystallization beinga practical stability challenge for SDD under long-term storage conditions, especially athigh temperatures and high humidity [4].
Pharmaceutics 2022, 14, 428 10 of 15Pharmaceutics 2022, 14, x FOR PEER REVIEW 10 of 16
Figure 5. PLM images of Feno-MS samples (10%, 20%, and 30% drug load at T3M under accelerated conditions of 40 °C/75% RH in open dish), the physical mixture of crystalline fenofibrate and meso-porous silica at a weight ratio of 10:90 (w/w), pure crystalline fenofibrate, and mesoporous silica (Parteck®SLC). Magnification × 100.
So far, multiple research groups have reported the long-term physical stability of MS-based formulations [22]. Superior stability of MS materials over the SDD is credited to the nano size of high volume mesopores, where drug molecules are constrained in a submi-crometric space without extra room for the recrystallization [23]. Additionally, potential interaction between drug molecules and silanol groups of MS materials inside the meso-pores could contribute to stabilization of the amorphous state as well [24]. Different from the specific structure of MS, SDD is a binary mixture of drug and polymer through spray drying. As evidenced in the Supplementary Material, Figure S3, weight loss of 30%-Feno-SDD-PVP samples before 100 °C increased from 1.4% to 8.7% after a short-term acceler-ated open dish stage of 40 °C/75% RH; however, no significant change in weight loss was found for 30%-Feno-MS samples after 3M under the same experimental conditions and drug load by TGA. A lower water uptake of Feno-loaded MS was possibly attributed to the hydrophobic nature of fenofibrate onto the mesopores of silica materials. In compari-son, the failure of Feno-loaded SDD in the stabilization of amorphous fenofibrate under the accelerated conditions is possibly due to the moisture absorption of soluble polymer PVPK90 and subsequent phase separation, resulting in drug crystallization being a prac-tical stability challenge for SDD under long-term storage conditions, especially at high temperatures and high humidity [4].
To date, only a few studies have been performed on the accelerated chemical stability of Feno-loaded MS samples, and results were dependent on the type of MS materials [13,25]. To our best knowledge, this is the first report of an accelerated chemical stability study on drug molecule fenofibrate using a novel commercial MS material (Parteck® SLC). As displayed in Table 2, no significant changes in the mean drug assay (n = 3) were ob-served for Feno-MS samples at all three drug loads (10–30%) after 3 months of the accel-erated open-dish stage of 40 °C/75% RH. In addition, the three samples for each drug load were pulled out from the top, middle, and bottom locations, respectively, as shown in Figure 6 and the standard deviation of a mean assay was within 2.0 for all Feno-MS sam-ples (Table 2 and Supplementary Material, Table S1), which demonstrated good content
Figure 5. PLM images of Feno-MS samples (10%, 20%, and 30% drug load at T3M under acceleratedconditions of 40 ◦C/75% RH in open dish), the physical mixture of crystalline fenofibrate andmesoporous silica at a weight ratio of 10:90 (w/w), pure crystalline fenofibrate, and mesoporous silica(Parteck® SLC). Magnification × 100.
To date, only a few studies have been performed on the accelerated chemical stabilityof Feno-loaded MS samples, and results were dependent on the type of MS materials [13,25].To our best knowledge, this is the first report of an accelerated chemical stability studyon drug molecule fenofibrate using a novel commercial MS material (Parteck® SLC). Asdisplayed in Table 2, no significant changes in the mean drug assay (n = 3) were observedfor Feno-MS samples at all three drug loads (10–30%) after 3 months of the acceleratedopen-dish stage of 40 ◦C/75% RH. In addition, the three samples for each drug load werepulled out from the top, middle, and bottom locations, respectively, as shown in Figure 6and the standard deviation of a mean assay was within 2.0 for all Feno-MS samples (Table 2and Supplementary Material, Table S1), which demonstrated good content uniformitywithin all samples at a drug load of 10–30%. Furthermore, excellent chemical stability wasfound for all Feno-MS samples without any increase in specific impurities at the retentiontime (RRT) of 1.9 min or total impurity [20].
Table 2. Assay and chemical impurity of the Feno-loaded MS or SDD samples at the initial and 3Maccelerated open dish stage of 40 ◦C/75% RH.
Sample ID
Fenofibrate Drug Load (%) Specific Impurity RRT 1.9 Total Impurity
Initial3 Months at
40 ◦C/75% RH,Open Dish Initial
3 Months at40 ◦C/75% RH,
Open DishInitial
3 Months at40 ◦C/75% RH,
Open DishMean (n = 3) SD Mean (n = 3) SD
10%-Feno-MS 9.9 0.8 9.8 1.2 ND ND ND ND
20%-Feno-MS 20.9 2.0 21.1 0.4 ND ND ND ND
30%-Feno-MS 32.6 1.2 33.1 0.8 ND ND ND ND
30%-Feno-SDD-PVP 29.4 3.9 N/A N/A ND N/A ND N/A
ND: not detected; SD: standard deviation; RRT: relative retention time. RRT of Feno = 2.2.
Pharmaceutics 2022, 14, 428 11 of 15
Pharmaceutics 2022, 14, x FOR PEER REVIEW 11 of 16
uniformity within all samples at a drug load of 10–30%. Furthermore, excellent chemical stability was found for all Feno-MS samples without any increase in specific impurities at the retention time (RRT) of 1.9 min or total impurity [20].
Table 2. Assay and chemical impurity of the Feno-loaded MS or SDD samples at the initial and 3M accelerated open dish stage of 40 °C/75% RH.
Sample ID
Fenofibrate Drug Load (%) Specific Impurity RRT 1.9 Total Impurity
Initial 3 Months at
40 °C/75% RH, Open Dish Initial
3 Months at 40 °C/75% RH,
Open Dish Initial
3 Months at 40 °C/75% RH,
Open Dish Mean (n = 3) SD Mean (n = 3) SD
10%-Feno-MS 9.9 0.8 9.8 1.2 ND ND ND ND 20%-Feno-MS 20.9 2.0 21.1 0.4 ND ND ND ND 30%-Feno-MS 32.6 1.2 33.1 0.8 ND ND ND ND
30%-Feno-SDD-PVP 29.4 3.9 N/A N/A ND N/A ND N/A ND: not detected; SD: standard deviation; RRT: relative retention time. RRT of Feno = 2.2.
Figure 6. Pictures of 30%-Feno-SDD-PVP (left), mesoporous silica (Parteck®SLC, middle), and 30%-Feno-MS (right). Three samples were pulled out from top, middle, and bottom locations for assay and impurity tests of Feno-SDD and Feno-MS samples.
3.3. Manufacturability Assessment Besides stability performance, manufacturability is another critical factor to consider
whether MS-based oral formulations are amenable to downstream processing steps to manufacture tablets or capsules. The Figure 6 shows the pictures of Feno-loaded powder samples with pure MS as the reference. In the visual inspection, Feno-MS powder looked similar to pure MS, however, Feno-SDD-PVP powder was less dense and very fluffy with a lot of powder sticking onto the wall of vial. Table 3 lists the conditioned bulk density (CBD), tap density (TD), BET specific surface area, compressibility (CPS%), and flow index (ffc) to evaluate the difference in manufacturability between MS-based powder and SDD-based powder. It is apparent that 30%-Feno-SDD-PVP was about 3 times lighter than the MS samples at 20% and 30% drug load, leading to the fluffy issue and major difficulties in handling for downstream steps, including weighing out, screening by sieve, blending, lubrication, etc. Even though the BET specific surface area of Feno-MS material decreased by about 3–4 times after the mesoporous pores were loaded with fenofibrate, the BET
Figure 6. Pictures of 30%-Feno-SDD-PVP (left), mesoporous silica (Parteck® SLC, middle), and30%-Feno-MS (right). Three samples were pulled out from top, middle, and bottom locations forassay and impurity tests of Feno-SDD and Feno-MS samples.
3.3. Manufacturability Assessment
Besides stability performance, manufacturability is another critical factor to considerwhether MS-based oral formulations are amenable to downstream processing steps tomanufacture tablets or capsules. The Figure 6 shows the pictures of Feno-loaded powdersamples with pure MS as the reference. In the visual inspection, Feno-MS powder lookedsimilar to pure MS, however, Feno-SDD-PVP powder was less dense and very fluffy with alot of powder sticking onto the wall of vial. Table 3 lists the conditioned bulk density (CBD),tap density (TD), BET specific surface area, compressibility (CPS%), and flow index (ffc) toevaluate the difference in manufacturability between MS-based powder and SDD-basedpowder. It is apparent that 30%-Feno-SDD-PVP was about 3 times lighter than the MSsamples at 20% and 30% drug load, leading to the fluffy issue and major difficulties inhandling for downstream steps, including weighing out, screening by sieve, blending,lubrication, etc. Even though the BET specific surface area of Feno-MS material decreasedby about 3–4 times after the mesoporous pores were loaded with fenofibrate, the BET valuewas still 2 orders of magnitude higher than that of Feno-SDD-PVP samples under the samedrug load. The BET results indicate that the drug release mechanism between MS and SDDmight be different. MS formulation provides a porous structure with a high surface areafor confined drug molecules to release [22], but SDD formulation is a miscible or partiallymiscible powder with polymers dissolved or swollen to facilitate drug release [26]. The CPS(%) of 30%-Feno-SDD-PVP was much higher than MS-based materials, which indicatedthat the proportional reduction in the thickness of SDD-based material under the prescribedpressure from 0.5 kPa to 15 kPa was significantly large. A large CPS can potentially result ina very dense compact during dry granulation or the tableting process. Finally, the very lowffc values seen in the SDD sample indicate the cohesive nature of the powders after spraydrying; however, both 20%-Feno-MS and 30%-Feno-MS showed free-flowing characteristicsafter the loading of fenofibrate as compared to pure MS. Overall, Feno-MS samples at 20%and 30% drug load both showed much better powder handling and flowability than 30%-Feno-SDD-PVP powder obtained through spray drying, and the latter requires the additionof excessive flow-enhancing excipients in the downstream process.
Pharmaceutics 2022, 14, 428 12 of 15
Table 3. Bulk density, tap density, BET, compressibility, and flowability of Feno-loaded MS, Feno-loaded SDD, and mesoporous silica (Parteck® SLC).
Sample ID CBD (g/mL) TD (g/mL) BET (m2/g) CPS (%) ffc (Flow Remark [27])
20%-Feno-MS 0.53 0.65 N/A 15.12 23.18 (free flowing)
30%-Feno-MS 0.60 0.74 120.72 15.51 27.16 (free flowing)
30%-Feno-SDD-PVP 0.18 0.24 1.35 39.43 4.66 (cohesive)
Pure MS 0.42 0.48 432.24 19.57 12.27 (easy flowing)
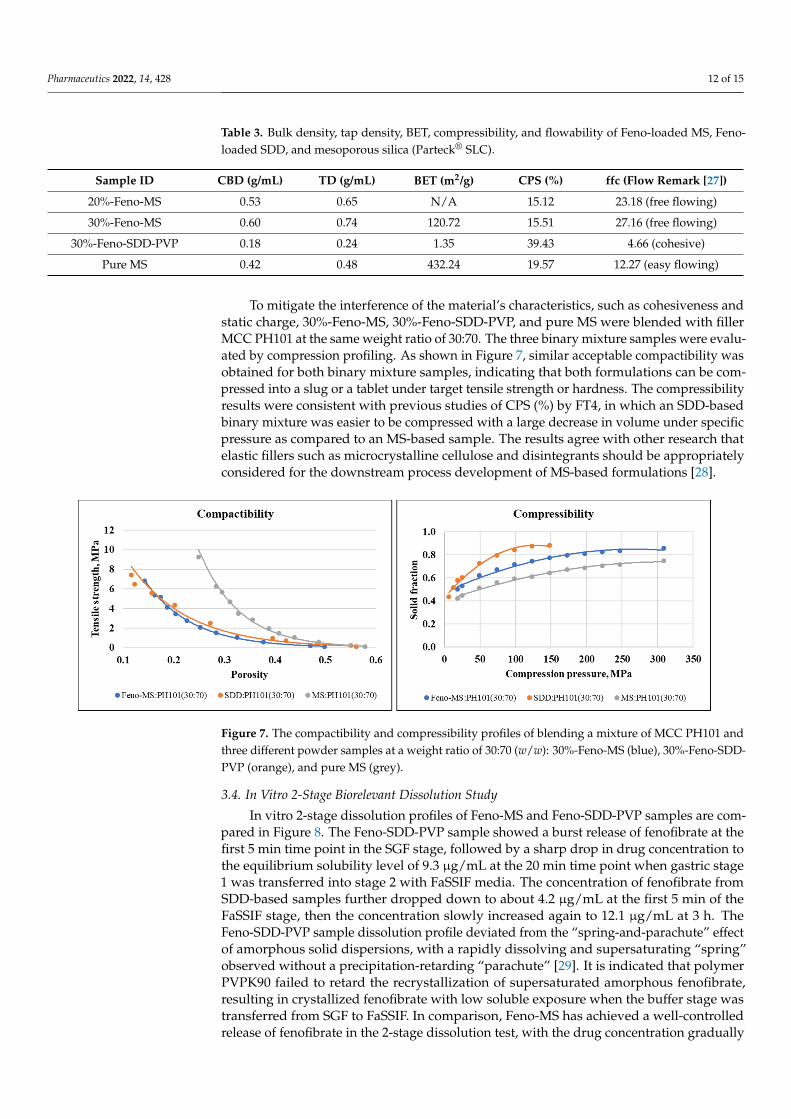
To mitigate the interference of the material’s characteristics, such as cohesiveness andstatic charge, 30%-Feno-MS, 30%-Feno-SDD-PVP, and pure MS were blended with fillerMCC PH101 at the same weight ratio of 30:70. The three binary mixture samples were evalu-ated by compression profiling. As shown in Figure 7, similar acceptable compactibility wasobtained for both binary mixture samples, indicating that both formulations can be com-pressed into a slug or a tablet under target tensile strength or hardness. The compressibilityresults were consistent with previous studies of CPS (%) by FT4, in which an SDD-basedbinary mixture was easier to be compressed with a large decrease in volume under specificpressure as compared to an MS-based sample. The results agree with other research thatelastic fillers such as microcrystalline cellulose and disintegrants should be appropriatelyconsidered for the downstream process development of MS-based formulations [28].
Pharmaceutics 2022, 14, x FOR PEER REVIEW 12 of 16
value was still 2 orders of magnitude higher than that of Feno-SDD-PVP samples under the same drug load. The BET results indicate that the drug release mechanism between MS and SDD might be different. MS formulation provides a porous structure with a high surface area for confined drug molecules to release [22], but SDD formulation is a miscible or partially miscible powder with polymers dissolved or swollen to facilitate drug release [26]. The CPS (%) of 30%-Feno-SDD-PVP was much higher than MS-based materials, which indicated that the proportional reduction in the thickness of SDD-based material under the prescribed pressure from 0.5 kPa to 15 kPa was significantly large. A large CPS can potentially result in a very dense compact during dry granulation or the tableting process. Finally, the very low ffc values seen in the SDD sample indicate the cohesive nature of the powders after spray drying; however, both 20%-Feno-MS and 30%-Feno-MS showed free-flowing characteristics after the loading of fenofibrate as compared to pure MS. Overall, Feno-MS samples at 20% and 30% drug load both showed much better pow-der handling and flowability than 30%-Feno-SDD-PVP powder obtained through spray drying, and the latter requires the addition of excessive flow-enhancing excipients in the downstream process.
Table 3. Bulk density, tap density, BET, compressibility, and flowability of Feno-loaded MS, Feno-loaded SDD, and mesoporous silica (Parteck®SLC).
Sample ID CBD (g/mL) TD (g/mL) BET (m2/g) CPS (%) ffc (Flow Remark [27]) 20%-Feno-MS 0.53 0.65 N/A 15.12 23.18 (free flowing) 30%-Feno-MS 0.60 0.74 120.72 15.51 27.16 (free flowing)
30%-Feno-SDD-PVP 0.18 0.24 1.35 39.43 4.66 (cohesive) Pure MS 0.42 0.48 432.24 19.57 12.27 (easy flowing)
To mitigate the interference of the material’s characteristics, such as cohesiveness and static charge, 30%-Feno-MS, 30%-Feno-SDD-PVP, and pure MS were blended with filler MCC PH101 at the same weight ratio of 30:70. The three binary mixture samples were evaluated by compression profiling. As shown in Figure 7, similar acceptable compacti-bility was obtained for both binary mixture samples, indicating that both formulations can be compressed into a slug or a tablet under target tensile strength or hardness. The compressibility results were consistent with previous studies of CPS (%) by FT4, in which an SDD-based binary mixture was easier to be compressed with a large decrease in vol-ume under specific pressure as compared to an MS-based sample. The results agree with other research that elastic fillers such as microcrystalline cellulose and disintegrants should be appropriately considered for the downstream process development of MS-based formulations [28].
Figure 7. The compactibility and compressibility profiles of blending a mixture of MCC PH101 and three different powder samples at a weight ratio of 30:70 (w/w): 30%-Feno-MS (blue), 30%-Feno-SDD-PVP (orange), and pure MS (grey).
Figure 7. The compactibility and compressibility profiles of blending a mixture of MCC PH101 andthree different powder samples at a weight ratio of 30:70 (w/w): 30%-Feno-MS (blue), 30%-Feno-SDD-PVP (orange), and pure MS (grey).
3.4. In Vitro 2-Stage Biorelevant Dissolution Study
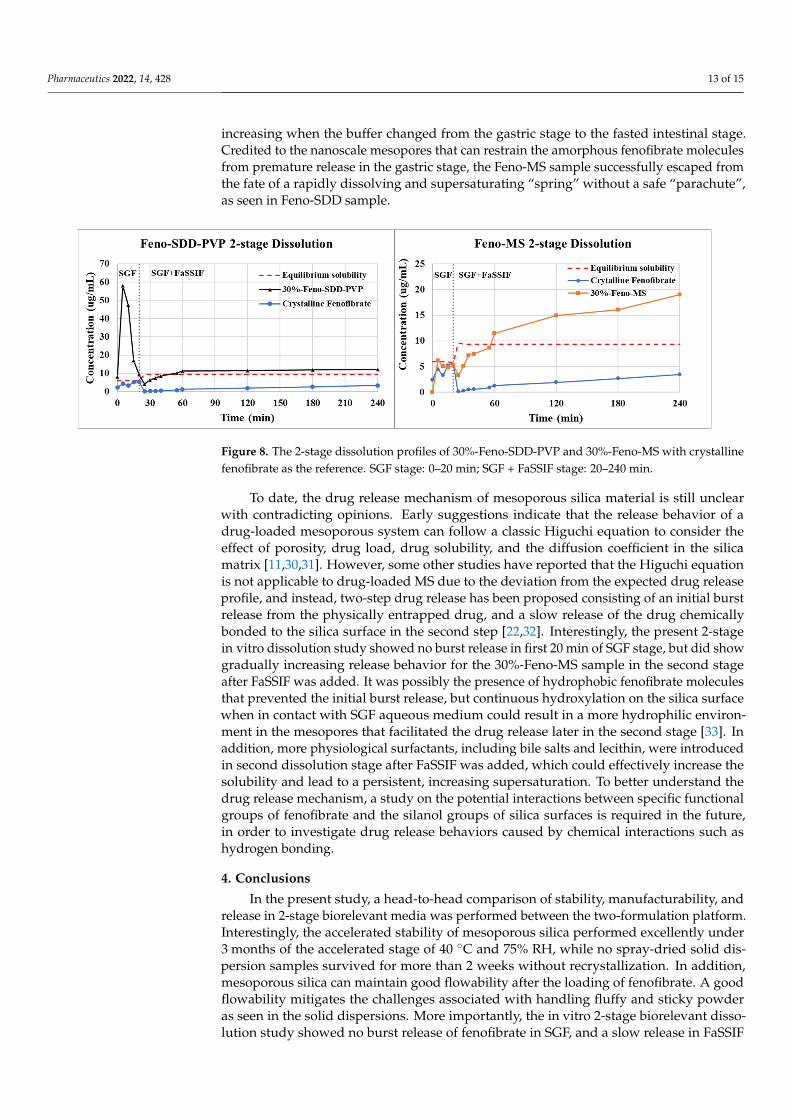
In vitro 2-stage dissolution profiles of Feno-MS and Feno-SDD-PVP samples are com-pared in Figure 8. The Feno-SDD-PVP sample showed a burst release of fenofibrate at thefirst 5 min time point in the SGF stage, followed by a sharp drop in drug concentration tothe equilibrium solubility level of 9.3 µg/mL at the 20 min time point when gastric stage1 was transferred into stage 2 with FaSSIF media. The concentration of fenofibrate fromSDD-based samples further dropped down to about 4.2 µg/mL at the first 5 min of theFaSSIF stage, then the concentration slowly increased again to 12.1 µg/mL at 3 h. TheFeno-SDD-PVP sample dissolution profile deviated from the “spring-and-parachute” effectof amorphous solid dispersions, with a rapidly dissolving and supersaturating “spring”observed without a precipitation-retarding “parachute” [29]. It is indicated that polymerPVPK90 failed to retard the recrystallization of supersaturated amorphous fenofibrate,resulting in crystallized fenofibrate with low soluble exposure when the buffer stage wastransferred from SGF to FaSSIF. In comparison, Feno-MS has achieved a well-controlledrelease of fenofibrate in the 2-stage dissolution test, with the drug concentration gradually
Pharmaceutics 2022, 14, 428 13 of 15
increasing when the buffer changed from the gastric stage to the fasted intestinal stage.Credited to the nanoscale mesopores that can restrain the amorphous fenofibrate moleculesfrom premature release in the gastric stage, the Feno-MS sample successfully escaped fromthe fate of a rapidly dissolving and supersaturating “spring” without a safe “parachute”,as seen in Feno-SDD sample.
Pharmaceutics 2022, 14, x FOR PEER REVIEW 13 of 16
3.4. In Vitro 2-Stage Biorelevant Dissolution Study In vitro 2-stage dissolution profiles of Feno-MS and Feno-SDD-PVP samples are com-
pared in Figure 8. The Feno-SDD-PVP sample showed a burst release of fenofibrate at the first 5 min time point in the SGF stage, followed by a sharp drop in drug concentration to the equilibrium solubility level of 9.3 µg/mL at the 20 min time point when gastric stage 1 was transferred into stage 2 with FaSSIF media. The concentration of fenofibrate from SDD-based samples further dropped down to about 4.2 µg/mL at the first 5 min of the FaSSIF stage, then the concentration slowly increased again to 12.1 µg/mL at 3 h. The Feno-SDD-PVP sample dissolution profile deviated from the “spring-and-parachute” effect of amorphous solid dispersions, with a rapidly dissolving and supersaturating “spring” ob-served without a precipitation-retarding “parachute” [29]. It is indicated that polymer PVPK90 failed to retard the recrystallization of supersaturated amorphous fenofibrate, resulting in crystallized fenofibrate with low soluble exposure when the buffer stage was transferred from SGF to FaSSIF. In comparison, Feno-MS has achieved a well-controlled release of fenofibrate in the 2-stage dissolution test, with the drug concentration gradually increasing when the buffer changed from the gastric stage to the fasted intestinal stage. Credited to the nanoscale mesopores that can restrain the amorphous fenofibrate mole-cules from premature release in the gastric stage, the Feno-MS sample successfully es-caped from the fate of a rapidly dissolving and supersaturating “spring” without a safe “parachute”, as seen in Feno-SDD sample.
Figure 8. The 2-stage dissolution profiles of 30%-Feno-SDD-PVP and 30%-Feno-MS with crystalline fenofibrate as the reference. SGF stage: 0–20 min; SGF + FaSSIF stage: 20–240 min.
To date, the drug release mechanism of mesoporous silica material is still unclear with contradicting opinions. Early suggestions indicate that the release behavior of a drug-loaded mesoporous system can follow a classic Higuchi equation to consider the effect of porosity, drug load, drug solubility, and the diffusion coefficient in the silica ma-trix [11,30,31]. However, some other studies have reported that the Higuchi equation is not applicable to drug-loaded MS due to the deviation from the expected drug release profile, and instead, two-step drug release has been proposed consisting of an initial burst release from the physically entrapped drug, and a slow release of the drug chemically bonded to the silica surface in the second step [22,32]. Interestingly, the present 2-stage in vitro dissolution study showed no burst release in first 20 min of SGF stage, but did show gradually increasing release behavior for the 30%-Feno-MS sample in the second stage after FaSSIF was added. It was possibly the presence of hydrophobic fenofibrate mole-cules that prevented the initial burst release, but continuous hydroxylation on the silica surface when in contact with SGF aqueous medium could result in a more hydrophilic environment in the mesopores that facilitated the drug release later in the second stage [33]. In addition, more physiological surfactants, including bile salts and lecithin, were introduced in second dissolution stage after FaSSIF was added, which could effectively
Figure 8. The 2-stage dissolution profiles of 30%-Feno-SDD-PVP and 30%-Feno-MS with crystallinefenofibrate as the reference. SGF stage: 0–20 min; SGF + FaSSIF stage: 20–240 min.
To date, the drug release mechanism of mesoporous silica material is still unclearwith contradicting opinions. Early suggestions indicate that the release behavior of adrug-loaded mesoporous system can follow a classic Higuchi equation to consider theeffect of porosity, drug load, drug solubility, and the diffusion coefficient in the silicamatrix [11,30,31]. However, some other studies have reported that the Higuchi equationis not applicable to drug-loaded MS due to the deviation from the expected drug releaseprofile, and instead, two-step drug release has been proposed consisting of an initial burstrelease from the physically entrapped drug, and a slow release of the drug chemicallybonded to the silica surface in the second step [22,32]. Interestingly, the present 2-stagein vitro dissolution study showed no burst release in first 20 min of SGF stage, but did showgradually increasing release behavior for the 30%-Feno-MS sample in the second stageafter FaSSIF was added. It was possibly the presence of hydrophobic fenofibrate moleculesthat prevented the initial burst release, but continuous hydroxylation on the silica surfacewhen in contact with SGF aqueous medium could result in a more hydrophilic environ-ment in the mesopores that facilitated the drug release later in the second stage [33]. Inaddition, more physiological surfactants, including bile salts and lecithin, were introducedin second dissolution stage after FaSSIF was added, which could effectively increase thesolubility and lead to a persistent, increasing supersaturation. To better understand thedrug release mechanism, a study on the potential interactions between specific functionalgroups of fenofibrate and the silanol groups of silica surfaces is required in the future,in order to investigate drug release behaviors caused by chemical interactions such ashydrogen bonding.
4. Conclusions
In the present study, a head-to-head comparison of stability, manufacturability, andrelease in 2-stage biorelevant media was performed between the two-formulation platform.Interestingly, the accelerated stability of mesoporous silica performed excellently under3 months of the accelerated stage of 40 ◦C and 75% RH, while no spray-dried solid dis-persion samples survived for more than 2 weeks without recrystallization. In addition,mesoporous silica can maintain good flowability after the loading of fenofibrate. A goodflowability mitigates the challenges associated with handling fluffy and sticky powderas seen in the solid dispersions. More importantly, the in vitro 2-stage biorelevant disso-lution study showed no burst release of fenofibrate in SGF, and a slow release in FaSSIF

Pharmaceutics 2022, 14, 428 14 of 15
for Feno-loaded mesoporous silica as compared to spray-dried solid dispersions, whichindicated a well-controlled release capability based on the platform of mesoporous silica.In conclusion, this study supports the use of mesoporous silica as an alternative approachfor oral amorphous formulation development, with its superior stability, manufacturability,and in vitro release performance compared to conventional spray-dried solid dispersion.
Supplementary Materials: The following are available online at https://www.mdpi.com/article/10.3390/pharmaceutics14020428/s1, Table S1: Mean assay and standard deviation of the Feno-loadedMS or SDD samples from top, middle and bottom location at initial and 3M accelerated open-dish stage of 40 ◦C/75% RH. Figure S1: PLM images of Feno-MS samples (30% drug load) frompreliminary trial experiments. Trial 1: 50 rpm of paddle stirring speed and 2 mL/min of loading speedfor 50 mg/mL of fenofibrate in acetone. Trial 2: 100 rpm of paddle stirring speed and 4 mL/min ofloading speed for 50 mg/mL of fenofibrate in acetone. Magnification × 100. Figure S2: PXRD patternof Feno-MS sample at 40% drug load. Figure S3: TGA of 30%-Feno MS sample at T0 and T3M afteropen dish stage of 40 ◦C/75% RH (left); TGA of 30%-Feno-SDD-PVP sample at T0 and T2W afteropen dish stage of 40 ◦C/75% RH (right).
Author Contributions: Conceptualization, H.Z. and D.L.; Data curation, H.Z., M.L. and J.L.; Formalanalysis, H.Z.; Investigation, H.Z., M.L., J.L. and D.L.; Methodology, H.Z. and D.L.; Project adminis-tration, H.Z., A.A., H.-W.H. and D.L.; Supervision, A.A., H.-W.H. and D.L. All authors have read andagreed to the published version of the manuscript.
Funding: This research received no external funding.
Institutional Review Board Statement: Not applicable.
Informed Consent Statement: Not applicable.
Data Availability Statement: Not applicable.
Acknowledgments: This work was supported by Bristol Myers Squibb.
Conflicts of Interest: The authors declare no conflict of interest.
References1. Brough, C.; Williams Iii, R. Amorphous solid dispersions and nano-crystal technologies for poorly water-soluble drug delivery.
Int. J. Pharm. 2013, 453, 157–166. [CrossRef] [PubMed]2. Zhang, H.; Liu, X.; Ma, X. The preparation of felodipine/zein amorphous solid dispersions and in vitro evaluation using a
dynamic gastrointestinal system. Pharm. Dev. Technol. 2020, 25, 1226–1237. [CrossRef] [PubMed]3. Kalivoda, A.; Fischbach, M.; Kleinebudde, P. Application of mixtures of polymeric carriers for dissolution enhancement of
fenofibrate using hot-melt extrusion. Int. J. Pharm. 2012, 429, 58–68. [CrossRef]4. Qian, F.; Huang, J.; Hussain, M.A. Drug–polymer solubility and miscibility: Stability consideration and practical challenges in
amorphous solid dispersion development. J. Pharm. Sci. 2010, 99, 2941–2947. [CrossRef] [PubMed]5. Hugo, M.; Kunath, K.; Dressman, J. Selection of excipient, solvent and packaging to optimize the performance of spray-dried
formulations: Case example fenofibrate. Drug Dev. Ind. Pharm. 2013, 39, 402–412. [CrossRef] [PubMed]6. Bukara, K.; Schueller, L.; Rosier, J.; Martens, M.A.; Daems, T.; Verheyden, L.; Eelen, S.; Van Speybroeck, M.; Libanati, C.; Martens,
J.A. Ordered mesoporous silica to enhance the bioavailability of poorly water-soluble drugs: Proof of concept in man. Eur. J.Pharm. Biopharm. 2016, 108, 220–225. [CrossRef]
7. Alcoutlabi, M.; McKenna, G.B. Effects of confinement on material behaviour at the nanometre size scale. J. Phys. Condens. Matter2005, 17, R461. [CrossRef]
8. Bukara, K.; Schueller, L.; Rosier, J.; Daems, T.; Verheyden, L.; Eelen, S.; Martens, J.A.; Van den Mooter, G.; Bugarski, B.; Kiekens, F.In vivo performance of fenofibrate formulated with ordered mesoporous silica versus 2-marketed formulations: A comparativebioavailability study in beagle dogs. J. Pharm. Sci. 2016, 105, 2381–2385. [CrossRef]
9. Van Speybroeck, M.; Mellaerts, R.; Mols, R.; Do Thi, T.; Martens, J.A.; Van Humbeeck, J.; Annaert, P.; Van den Mooter, G.;Augustijns, P. Enhanced absorption of the poorly soluble drug fenofibrate by tuning its release rate from ordered mesoporoussilica. Eur. J. Pharm. Sci. 2010, 41, 623–630. [CrossRef]
10. Vallet-Regí, M.; Balas, F.; Arcos, D. Mesoporous materials for drug delivery. Angew. Chem. Int. Ed. 2007, 46, 7548–7558. [CrossRef]11. Izquierdo-Barba, I.; Martinez, Á.; Doadrio, A.L.; Pérez-Pariente, J.; Vallet-Regí, M. Release evaluation of drugs from ordered
three-dimensional silica structures. Eur. J. Pharm. Sci. 2005, 26, 365–373. [CrossRef]

Pharmaceutics 2022, 14, 428 15 of 15
12. Van Speybroeck, M.; Barillaro, V.; Do Thi, T.; Mellaerts, R.; Martens, J.; Van Humbeeck, J.; Vermant, J.; Annaert, P.; Van DenMooter, G.; Augustijns, P. Ordered mesoporous silica material SBA-15: A broad-spectrum formulation platform for poorly solubledrugs. J. Pharm. Sci. 2009, 98, 2648–2658. [CrossRef]
13. Hong, S.; Shen, S.; Tan, D.C.T.; Ng, W.K.; Liu, X.; Chia, L.S.; Irwan, A.W.; Tan, R.; Nowak, S.A.; Marsh, K. High drug load, stable,manufacturable and bioavailable fenofibrate formulations in mesoporous silica: A comparison of spray drying versus solventimpregnation methods. Drug Deliv. 2016, 23, 316–327. [CrossRef]
14. Qian, K.K.; Bogner, R.H. Spontaneous crystalline-to-amorphous phase transformation of organic or medicinal compounds in thepresence of porous media, part 1: Thermodynamics of spontaneous amorphization. J. Pharm. Sci. 2011, 100, 2801–2815. [CrossRef][PubMed]
15. Waters, L.J.; Hussain, T.; Parkes, G.; Hanrahan, J.P.; Tobin, J.M. Inclusion of fenofibrate in a series of mesoporous silicas usingmicrowave irradiation. Eur. J. Pharm. Biopharm. 2013, 85, 936–941. [CrossRef] [PubMed]
16. Raza, A.; Sime, F.B.; Cabot, P.J.; Roberts, J.A.; Falconer, J.R.; Kumeria, T.; Popat, A. Liquid CO2 Formulated Mesoporous SilicaNanoparticles for pH-Responsive Oral Delivery of Meropenem. ACS Biomater. Sci. Eng. 2021, 7, 1836–1853. [CrossRef]
17. Bouledjouidja, A.; Masmoudi, Y.; Van Speybroeck, M.; Schueller, L.; Badens, E. Impregnation of Fenofibrate on mesoporous silicausing supercritical carbon dioxide. Int. J. Pharm. 2016, 499, 1–9. [CrossRef] [PubMed]
18. Ahern, R.J.; Hanrahan, J.P.; Tobin, J.M.; Ryan, K.B.; Crean, A.M. Comparison of fenofibrate–mesoporous silica drug-loadingprocesses for enhanced drug delivery. Eur. J. Pharm. Sci. 2013, 50, 400–409. [CrossRef]
19. Jamzad, S.; Fassihi, R. Role of surfactant and pH on dissolution properties of fenofibrate and glipizide—a technical note. AapsPharmscitech 2006, 7, E17–E22. [CrossRef]
20. Kadav, A.; Vora, D. Stability indicating UPLC method for simultaneous determination of atorvastatin, fenofibrate and theirdegradation products in tablets. J. Pharm. Biomed. Anal. 2008, 48, 120–126. [CrossRef]
21. Klein, S. The Use of Biorelevant Dissolution Media to Forecast the In Vivo Performance of a Drug. AAPS J. 2010, 12, 397–406.[CrossRef] [PubMed]
22. McCarthy, C.A.; Ahern, R.J.; Dontireddy, R.; Ryan, K.B.; Crean, A.M. Mesoporous silica formulation strategies for drug dissolutionenhancement: A review. Expert Opin. Drug Deliv. 2016, 13, 93–108. [CrossRef] [PubMed]
23. Maleki, A.; Kettiger, H.; Schoubben, A.; Rosenholm, J.M.; Ambrogi, V.; Hamidi, M. Mesoporous silica materials: From physico-chemical properties to enhanced dissolution of poorly water-soluble drugs. J. Control. Release 2017, 262, 329–347. [CrossRef][PubMed]
24. Ambrogi, V.; Perioli, L.; Pagano, C.; Latterini, L.; Marmottini, F.; Ricci, M.; Rossi, C. MCM-41 for furosemide dissolutionimprovement. Microporous Mesoporous Mater. 2012, 147, 343–349. [CrossRef]
25. Limnell, T.; Heikkilä, T.; Santos, H.A.; Sistonen, S.; Hellstén, S.; Laaksonen, T.; Peltonen, L.; Kumar, N.; Murzin, D.Y.; Louhi-Kultanen, M. Physicochemical stability of high indomethacin payload ordered mesoporous silica MCM-41 and SBA-15 micropar-ticles. Int. J. Pharm. 2011, 416, 242–251. [CrossRef]
26. Schittny, A.; Huwyler, J.; Puchkov, M. Mechanisms of increased bioavailability through amorphous solid dispersions: A review.Drug Deliv. 2020, 27, 110–127. [CrossRef]
27. Fitzpatrick, J.; Barringer, S.; Iqbal, T. Flow property measurement of food powders and sensitivity of Jenike’s hopper designmethodology to the measured values. J. Food Eng. 2004, 61, 399–405. [CrossRef]
28. Vialpando, M.; Aerts, A.; Persoons, J.; Martens, J.; Van Den Mooter, G. Evaluation of ordered mesoporous silica as a carrier forpoorly soluble drugs: Influence of pressure on the structure and drug release. J. Pharm. Sci. 2011, 100, 3411–3420. [CrossRef]
29. Sun, D.D.; Lee, P.I. Evolution of supersaturation of amorphous pharmaceuticals: The effect of rate of supersaturation generation.Mol. Pharm. 2013, 10, 4330–4346. [CrossRef]
30. Horcajada, P.; Ramila, A.; Perez-Pariente, J.; Vallet-Regı, M. Influence of pore size of MCM-41 matrices on drug delivery rate.Microporous Mesoporous Mater. 2004, 68, 105–109. [CrossRef]
31. Vialpando, M.; Martens, J.A.; Van den Mooter, G. Potential of ordered mesoporous silica for oral delivery of poorly soluble drugs.Ther. Deliv. 2011, 2, 1079–1091. [CrossRef] [PubMed]
32. Andersson, J.; Rosenholm, J.; Areva, S.; Lindén, M. Influences of material characteristics on ibuprofen drug loading and releaseprofiles from ordered micro-and mesoporous silica matrices. Chem. Mater. 2004, 16, 4160–4167. [CrossRef]
33. Mellaerts, R.; Houthoofd, K.; Elen, K.; Chen, H.; Van Speybroeck, M.; Van Humbeeck, J.; Augustijns, P.; Mullens, J.; Van denMooter, G.; Martens, J.A. Aging behavior of pharmaceutical formulations of itraconazole on SBA-15 ordered mesoporous silicacarrier material. Microporous Mesoporous Mater. 2010, 130, 154–161. [CrossRef]