Amorphous carbon films prepared by the ``dip'' technique: Deposition and film characterization
9
Amorphous carbon films prepared by the ‘‘dip’’ technique: Deposition and film characterization S. C. Ray, G. Fanchini, a) and A. Tagliaferro Dipartimento di Fisica and Unita ` INFM, Politecnico di Torino, Torino, Italy B. Bose and D. Dasgupta Physics Department, North-Bengal University, Siliguri, India ~Received 18 December 2002; accepted 9 April 2003! Several nondestructive characterization techniques ~optical and photothermal deflection spectroscopy in the visible photon energy range, Raman spectroscopy, profilometry, photoluminescence, electron-spin-resonance characterization of the paramagnetic centers, etc.! are used to study the properties of the a-C:H:OH films deposited by the ‘‘dip’’ technique. With such a preparation method, the substrates are dipped in viscous mixtures of liquid carbon compounds. The subsequent baking in an oven at different temperatures ~300–500 °C! allows the formation on a substrate of submicrometric thin solid films. The as-prepared material exhibits several characteristics that are comparable to that of floppy, polymer-like amorphous carbons. Transitions on many film properties ~thicknesses, optical gaps, photoluminescence intensities, spin densities, g factors, relaxation times, etc.! were found between 300 and 350 and between 450 and 500 °C. © 2003 American Institute of Physics. @DOI: 10.1063/1.1578527# I. INTRODUCTION Hydrogenated amorphous carbon ~a-C:H! films have at- tracted interest for several applications, such as chemically inert, low-friction and hydrophobic coatings, 1 resist masks for lithography, 2 and protections for optical devices against wear. 3 a-C:H is renewed for the possibility to alter the opti- cal, electronic, and mechanical properties by tuning the con- tent of fourfold ( sp 3 ) and threefold ( sp 2 ) carbon sites and the shape and/or size of the olefinic/aromatic chains/rings in which the sp 2 sites tend to cluster. 4,5 A large number of different methods, including reactive sputtering of graphite in hydrogenated atmospheres, 6,7 plasma-enhanced ~PE! chemical vapor deposition ~CVD!, 8,9 electron–cyclotron- resonance CVD 10 etc., are used for the preparation of a-C:H films. However, all these techniques require pre-evacuated deposition chambers and vacuum systems. In this article, it will be shown how a-C:H films with hydroxyl ~OH! inclu- sions can be grown cheaply and easily at room pressures using a ‘‘dip’’ coating technique. 11 Earlier, the same setup was used for the preparation of oxide and sulphide thin films. 11,12 A similar technique was also recently used to pre- pare boron nitride films. 13 Preliminary characterization of the carbon films prepared by the dip technique will be presented. In addition, a few reports concerning the growth and characterization of oxygenated amorphous carbons prepared at room temperature by plasma techniques are available in the literature. 14–16 Their properties were shown to weakly depend on the gaseous precursors, 14,15 but, mainly, on the carbon to oxygen atomic ratio in the precursor gas or gas mixture. Hence, a comparison of our films with oxygenated amorphous carbon films will be attempted as well. II. EXPERIMENTAL DETAILS A. Sample preparation The samples were prepared onto Pyrex-glass substrates ~substrate size up to 7.532.5 cm!. Initially, the substrate is kept dipped into the starting solution ~in such a way that the holder remains just outside the liquid level! and then with- drawn vertically at a controlled speed, under atmospheric conditions. During such an operation, the substrate moves freely in its holder at the end of a thread passing through a pulley driven by a geared-motor arrangement. Ethanolic so- lutions of sucrose @ C 6 H 6 ~OH! 6 # were used. In order to obtain the starting solution used in the present work, a saturated solution of sucrose ~18 g! with water ~12 ml! as a solvent was initially prepared. Afterwards, this solution is mixed with further amounts of ethanol ~60 ml! to yield a solution with the proper viscosity for the deposition by dipping. After withdrawal, the substrate, with the liquid film adhering to it, is baked for 5 min in open air inside a vertical tubular oven: sucrose hydrolyzed and reacted on the heated substrate form- ing a thin solid film. Results reported in this article were obtained by single dipping with speed of withdrawal of 7 mm/s using the prepared solution mentioned above and bak- ing temperatures from 300 to 500 °C ~at steps of 50 °C!. Examples of films prepared by this technique are shown in Fig. 1. Usually, both sides of the substrate are coated, but it is also possible to coat one side only by masking the other side, or by fixing two substrates back to back. Films of different thicknesses can be prepared by changing the lifting speed as well as increasing the number of dips ~i.e., performing sev- eral dip-withdrawal cycles!. Preliminary experiments show that the thickness may also be increased by increasing the sucrose concentration in the starting solutions ~as usually a! Electronic mail: [email protected] JOURNAL OF APPLIED PHYSICS VOLUME 94, NUMBER 2 15 JULY 2003 870 0021-8979/2003/94(2)/870/9/$20.00 © 2003 American Institute of Physics Downloaded 20 Jul 2003 to 203.75.105.192. Redistribution subject to AIP license or copyright, see http://ojps.aip.org/japo/japcr.jsp
-
Upload
globsynbschool -
Category
Documents
-
view
2 -
download
0
Transcript of Amorphous carbon films prepared by the ``dip'' technique: Deposition and film characterization
JOURNAL OF APPLIED PHYSICS VOLUME 94, NUMBER 2 15 JULY 2003
Amorphous carbon films prepared by the ‘‘dip’’ technique: Depositionand film characterization
S. C. Ray, G. Fanchini,a) and A. TagliaferroDipartimento di Fisica and Unita` INFM, Politecnico di Torino, Torino, Italy
B. Bose and D. DasguptaPhysics Department, North-Bengal University, Siliguri, India
~Received 18 December 2002; accepted 9 April 2003!
Several nondestructive characterization techniques~optical and photothermal deflectionspectroscopy in the visible photon energy range, Raman spectroscopy, profilometry,photoluminescence, electron-spin-resonance characterization of the paramagnetic centers, etc.! areused to study the properties of thea-C:H:OH films deposited by the ‘‘dip’’ technique. With such apreparation method, the substrates are dipped in viscous mixtures of liquid carbon compounds. Thesubsequent baking in an oven at different temperatures~300–500 °C! allows the formation on asubstrate of submicrometric thin solid films. The as-prepared material exhibits severalcharacteristics that are comparable to that of floppy, polymer-like amorphous carbons. Transitionson many film properties~thicknesses, optical gaps, photoluminescence intensities, spin densities,gfactors, relaxation times, etc.! were found between 300 and 350 and between 450 and 500 °C.© 2003 American Institute of Physics.@DOI: 10.1063/1.1578527#
a
sti-o
s
it
tee,
urphireetendaely
gate
rates
ricvesh aso-
ted
d
erit,n:orm-re7
bak-
in
it iside,ntd as
the
I. INTRODUCTION
Hydrogenated amorphous carbon~a-C:H! films have at-tracted interest for several applications, such as chemicinert, low-friction and hydrophobic coatings,1 resist masksfor lithography,2 and protections for optical devices againwear.3 a-C:H is renewed for the possibility to alter the opcal, electronic, and mechanical properties by tuning the ctent of fourfold (sp3) and threefold (sp2) carbon sites andthe shape and/or size of the olefinic/aromatic chains/ringwhich the sp2 sites tend to cluster.4,5 A large number ofdifferent methods, including reactive sputtering of graphin hydrogenated atmospheres,6,7 plasma-enhanced~PE!chemical vapor deposition~CVD!,8,9 electron–cyclotron-resonance CVD10 etc., are used for the preparation ofa-C:Hfilms. However, all these techniques require pre-evacuadeposition chambers and vacuum systems. In this articlwill be shown howa-C:H films with hydroxyl ~OH! inclu-sions can be grown cheaply and easily at room pressusing a ‘‘dip’’ coating technique.11 Earlier, the same setuwas used for the preparation of oxide and sulphide tfilms.11,12A similar technique was also recently used to ppare boron nitride films.13 Preliminary characterization of thcarbon films prepared by the dip technique will be presen
In addition, a few reports concerning the growth acharacterization of oxygenated amorphous carbons prepat room temperature by plasma techniques are availablthe literature.14–16 Their properties were shown to weakdepend on the gaseous precursors,14,15 but, mainly, on thecarbon to oxygen atomic ratio in the precursor gas ormixture. Hence, a comparison of our films with oxygenaamorphous carbon films will be attempted as well.
a!Electronic mail: [email protected]
8700021-8979/2003/94(2)/870/9/$20.00
Downloaded 20 Jul 2003 to 203.75.105.192. Redistribution subject to A
lly
t
n-
in
e
dit
es
n-
d.
redin
sd
II. EXPERIMENTAL DETAILS
A. Sample preparation
The samples were prepared onto Pyrex-glass subst~substrate size up to 7.532.5 cm!. Initially, the substrate iskept dipped into the starting solution~in such a way that theholder remains just outside the liquid level! and then with-drawn vertically at a controlled speed, under atmospheconditions. During such an operation, the substrate mofreely in its holder at the end of a thread passing througpulley driven by a geared-motor arrangement. Ethanoliclutions of sucrose@C6H6~OH!6# were used. In order to obtainthe starting solution used in the present work, a saturasolution of sucrose~18 g! with water ~12 ml! as a solventwas initially prepared. Afterwards, this solution is mixewith further amounts of ethanol~60 ml! to yield a solutionwith the proper viscosity for the deposition by dipping. Aftwithdrawal, the substrate, with the liquid film adhering tois baked for 5 min in open air inside a vertical tubular ovesucrose hydrolyzed and reacted on the heated substrate fing a thin solid film. Results reported in this article weobtained by single dipping with speed of withdrawal ofmm/s using the prepared solution mentioned above anding temperatures from 300 to 500 °C~at steps of 50 °C!.Examples of films prepared by this technique are shownFig. 1.
Usually, both sides of the substrate are coated, butalso possible to coat one side only by masking the other sor by fixing two substrates back to back. Films of differethicknesses can be prepared by changing the lifting speewell as increasing the number of dips~i.e., performing sev-eral dip-withdrawal cycles!. Preliminary experiments showthat the thickness may also be increased by increasingsucrose concentration in the starting solutions~as usually
© 2003 American Institute of Physics
IP license or copyright, see http://ojps.aip.org/japo/japcr.jsp
es
l
eop
ep
ou
heph-i
oecurs
r-pegWth
f6-
-a
d
mplesty-
r
be-uch
on
ge-ges.are
uidure
rmoneon-
lmith
ow-
k-ick-the
aling
0 °C
ionequth
ab
se
871J. Appl. Phys., Vol. 94, No. 2, 15 July 2003 Ray et al.
obtained, with the dip technique, when the precursor conctration is increased12!. However, too concentrated solution~i.e., ethanol contents below 60 ml! may have detrimentaeffects on the film homogeneity~see Fig. 1, lower film!.
B. Sample characterization
The optical absorption edges of the samples were invtigated by means of photothermal deflection spectrosc~PDS!,17 using carbon tetrachloride (CCl4) as the deflectorfluid and a red-light laser as a deflection probTransmittance–reflectance measurements were alsoformed in the 350–1500 nm wavelength range, usingPerkin-Elmer Lambda spectrophotometer. The calibrationthe PDS spectra is attained both by means of PDS measments under signal saturation conditions17 and by compari-son of the absorption coefficient provided by treflectance–transmittance measurements in the higherton energy range~E.2.5 eV!. Raman and photoluminescence~PL! spectra were performed using a Renishaw mcrospectrometer, excited by a 2.41 eV Ar1 laser energy. Thelaser power and the beam spot area were 5 mW and 3mm2,respectively. Special care was taken in order to rule out psible sample annealing during measurements. The PL spwere normalized by means of the PDS and optical measments in order to obtain the PL efficiencies of the filmElectron-spin-resonance~ESR! measurements were peformed at room temperature using a Bruker ESP300E strometer equipped with a rectangular resonator operatin9.65 GHz frequencies. Microwave powers of 0.1–100 mwere used in order to analyze the saturation behavior ofsignal and estimate the spin-lattice (t1) and spin–spin (t2)relaxation times in the films.18 The spin densities and thegfactors were obtained by comparison with the spectrum oreference water solution at known dilution of 2,2,6,tetramethylpiperidine-1-oxyl~TEMPO! radicals. The refer-ence solution (131013 spins! was injected in a quartz capillary tube. Measurements on the reference solution and esample, simultaneously placed in the cavity, were recorde
FIG. 1. Two dip coated samples prepared with different starting solutand baked at the same temperature~400 °C!. The glass substrates werdipped for 6 cm and the uncoated areas are that kept out of the lisolution. The upper film is obtained with the starting solution used inpresent study~sucrose: 18 g, water: 12 ml, ethanol: 60 ml! and, except forthe 2-mm-large border regions and the few spots that are visually noticeits thickness is 0.70mm ~610%!. The lower film~sucrose: 18 g, water: 12ml, ethanol: 30 ml! is prepared with a solution which was denser in sucroIt is thicker but less homogeneous.
Downloaded 20 Jul 2003 to 203.75.105.192. Redistribution subject to A
n-
s-y
.er-af
re-
o-
-
s-trae-.
c-at
e
a
chin
order to calibrate the measurements recorded on the saalone. The film thicknesses were measured by a Tenkorlus profilometer.
Additional Fourier-transform-infrared~FTIR! transmis-sion measurements~Perkin-Elmer FTIR 2000 spectromete!were also performed on deposits grown on silicon~1,0,0!substrates under similar conditions. However, as detailedlow, care should be exercised in a direct comparison of smeasurements with properties of the samples depositedPyrex glass, even if baked at the same temperature.
III. RESULTS AND DISCUSSION
A. Film thicknesses
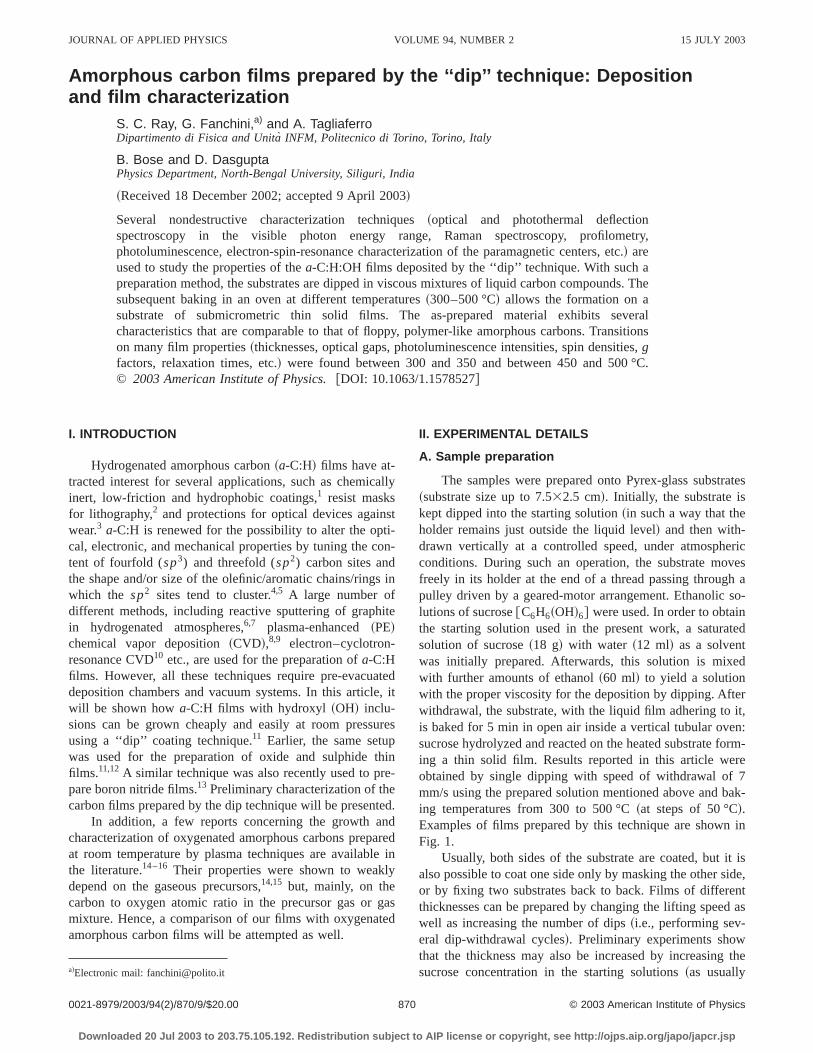
At a visual analysis, the films present a large homoneous central region, with a thickness increase at the edActually, profilometry measurements show that the edgesmuch thicker than the center of the films. Indeed, the liqlayer adhering to the substrate during the dipping procedis mostly uniform, except for a region;2–5 mm wide nearthe bottom and the side of the substrate. This nonunifoportion of the substrate is usually known as the trouble zand it is dependent on the lifting speed as well as the ccentration of the starting solution.12 If the lifting speed isvery small~;1 mm/s! or the solution is properly dilute, thenthe length of the trouble zone is quite negligible~,2–3 mm!.With the proper condition used in the present work, the fithickness was found to be uniform over a central region wsize of few centimeters~Fig. 1!. This central uniform regioncan be increased if the substrate size is large enough. Hever, the micro-Raman~and microluminescence! analysisdoes not show relevant microstructural changes~not morethan 10% of the Raman parameters! along the films and evenin the trouble zones. The variation of the average film thicnesses with baking temperature is shown in Fig. 2. The thness reduction with temperature may be compared tosame phenomenon observed, as a function of postannetemperature, ona-C:H films grown at room temperature:19 itwas reported that the films annealed postdeposition at 40reduce their initial thickness to approximately 40%.
s
ide
le,
.
FIG. 2. Film thicknesses as a function of the baking temperature.
IP license or copyright, see http://ojps.aip.org/japo/japcr.jsp
t-
nn
,n
wo
r-
-th
ofll
ram-not
e-
i-
e-
ov-
nt:
sedpy
in-ally
ur
e
-areinly
872 J. Appl. Phys., Vol. 94, No. 2, 15 July 2003 Ray et al.
B. Optical absorption
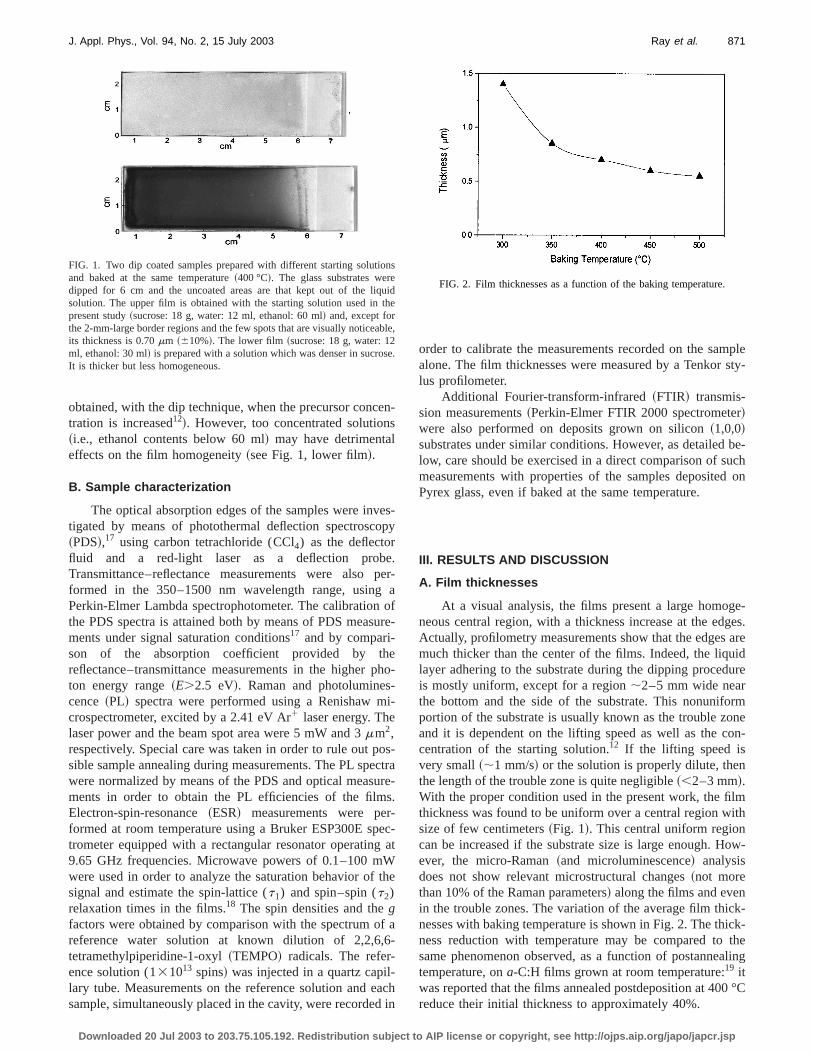
The optical absorption coefficientsa are reported in Fig.3 as a function of the photon energyE. As it occurs for mostamorphous carbon films published in the literature,7,20–25noabrupt change in slope is observed in correspondence tooptical Tauc gapETauc. This is due to the fact that the densities of~mainly localized! p andp* states@density of states~DOS!# lying 0–3 eV below and above the nonbonding eergy level (EF) is formed by two asymmetric Gaussiashapes7,24 and not formed~as in the Tauc assumptions! byextended states providing parabolic band tails. Assumingorder to reduce the fitting arbitrariness, such Gaussian bato be symmetric with respect toEF , the absorption coeffi-cient can be written7 as
a5Np
EerfS E
2spDexpF2S E22Ep
2spD 2G , ~1!
where 2Ep is the peak-to-peak energy distance of the tGaussians andsp is their full width at half maximum. Ex-tendedp andp* states are usually exhibited only by amophous carbons with asp2 fraction of 0.8 or above,5 andpercolatinga-C:H films with extendedp states were oftenobtained by high-temperature deposition26 or annealing ofsp3 richer films, due to thesp2 enrichment occurring at increasing temperatures. Actually, in our case, only in
FIG. 3. Optical absorption coefficients and Tauc plots from PDS measments. The lines correspond to the fits by means of the Tauc model~upperrow! and the Gaussian model~lower row!. The Gaussian fit appears to bmore confident for the films at lower baking temperatures~left column!while spectra on the right column produce more linear Tauc-like plots.
Downloaded 20 Jul 2003 to 203.75.105.192. Redistribution subject to A
he
-
inds
e
sample baked at the highest temperature~500 °C! is the Taucfunction @a(E)3E#1/2 ~Fig. 3! linear, as predicted by theTauc assumptions.
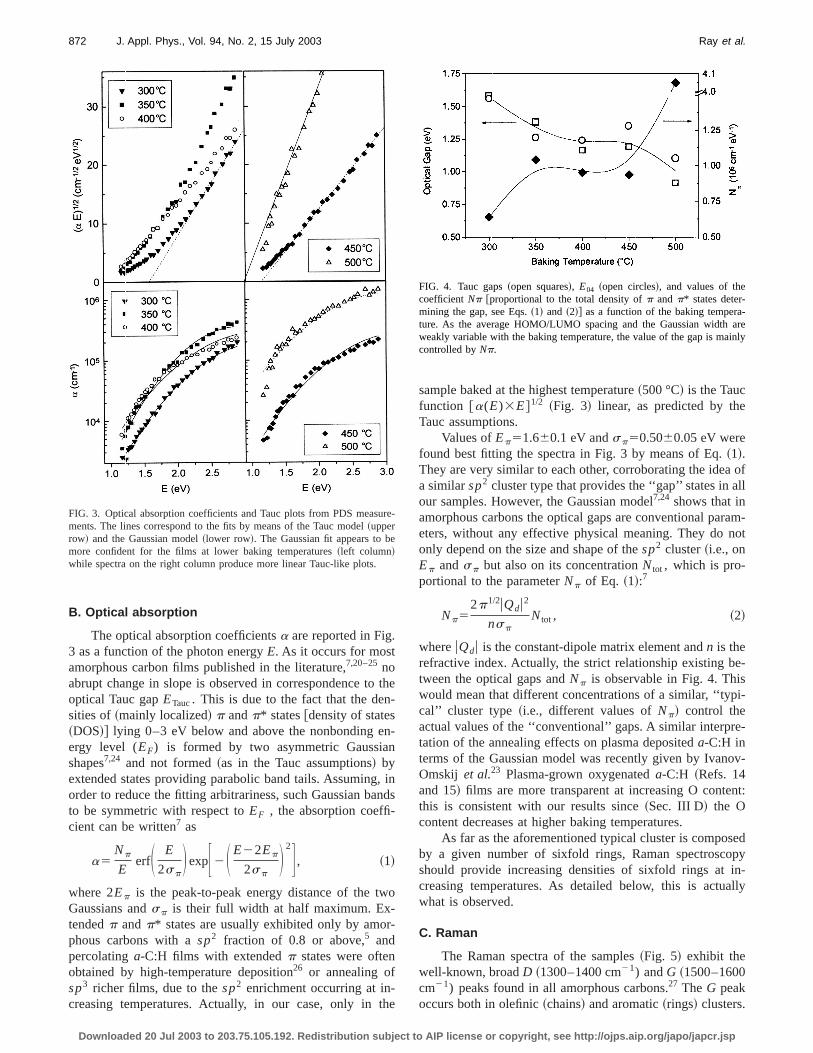
Values ofEp51.660.1 eV andsp50.5060.05 eV werefound best fitting the spectra in Fig. 3 by means of Eq.~1!.They are very similar to each other, corroborating the ideaa similarsp2 cluster type that provides the ‘‘gap’’ states in aour samples. However, the Gaussian model7,24 shows that inamorphous carbons the optical gaps are conventional paeters, without any effective physical meaning. They doonly depend on the size and shape of thesp2 cluster~i.e., onEp andsp but also on its concentrationNtot , which is pro-portional to the parameterNp of Eq. ~1!:7
Np52p1/2uQdu2
nspNtot , ~2!
whereuQdu is the constant-dipole matrix element andn is therefractive index. Actually, the strict relationship existing btween the optical gaps andNp is observable in Fig. 4. Thiswould mean that different concentrations of a similar, ‘‘typcal’’ cluster type ~i.e., different values ofNp! control theactual values of the ‘‘conventional’’ gaps. A similar interprtation of the annealing effects on plasma depositeda-C:H interms of the Gaussian model was recently given by IvanOmskij et al.23 Plasma-grown oxygenateda-C:H ~Refs. 14and 15! films are more transparent at increasing O contethis is consistent with our results since~Sec. III D! the Ocontent decreases at higher baking temperatures.
As far as the aforementioned typical cluster is compoby a given number of sixfold rings, Raman spectroscoshould provide increasing densities of sixfold rings atcreasing temperatures. As detailed below, this is actuwhat is observed.
C. Raman
The Raman spectra of the samples~Fig. 5! exhibit thewell-known, broadD ~1300–1400 cm21) andG ~1500–1600cm21) peaks found in all amorphous carbons.27 The G peakoccurs both in olefinic~chains! and aromatic~rings! clusters.
e-
FIG. 4. Tauc gaps~open squares!, E04 ~open circles!, and values of thecoefficientNp @proportional to the total density ofp and p* states deter-mining the gap, see Eqs.~1! and ~2!# as a function of the baking temperature. As the average HOMO/LUMO spacing and the Gaussian widthweakly variable with the baking temperature, the value of the gap is macontrolled byNp.
IP license or copyright, see http://ojps.aip.org/japo/japcr.jsp
c
ur
s
o
ae
n
d
aa
b
e-
is
t of
to
be-ofas-nd
ra-esis
t:
ro-ton
ren-
nt
r-e
th
–e.c
873J. Appl. Phys., Vol. 94, No. 2, 15 July 2003 Ray et al.
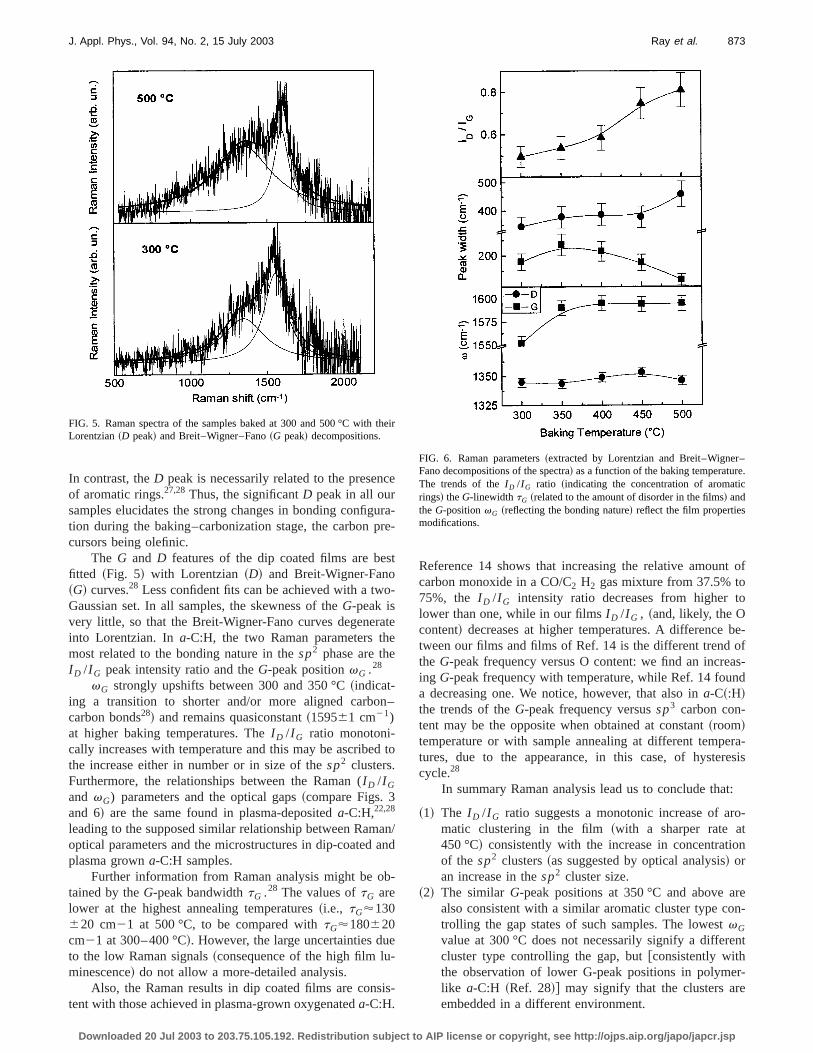
In contrast, theD peak is necessarily related to the presenof aromatic rings.27,28Thus, the significantD peak in all oursamples elucidates the strong changes in bonding configtion during the baking–carbonization stage, the carbon pcursors being olefinic.
The G and D features of the dip coated films are befitted ~Fig. 5! with Lorentzian ~D! and Breit-Wigner-Fano~G! curves.28 Less confident fits can be achieved with a twGaussian set. In all samples, the skewness of theG-peak isvery little, so that the Breit-Wigner-Fano curves degenerinto Lorentzian. Ina-C:H, the two Raman parameters thmost related to the bonding nature in thesp2 phase are theI D /I G peak intensity ratio and theG-peak positionvG .28
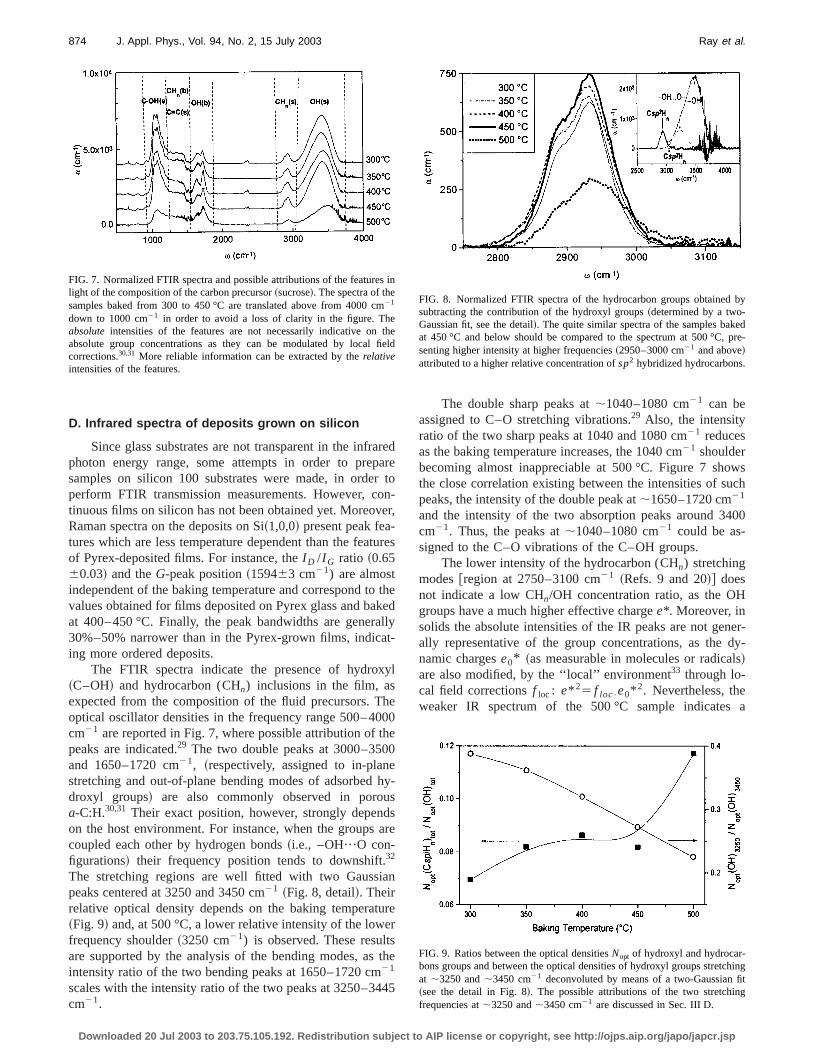
vG strongly upshifts between 300 and 350 °C~indicat-ing a transition to shorter and/or more aligned carbocarbon bonds28! and remains quasiconstant~159561 cm21)at higher baking temperatures. TheI D /I G ratio monotoni-cally increases with temperature and this may be ascribethe increase either in number or in size of thesp2 clusters.Furthermore, the relationships between the Raman (I D /I G
and vG) parameters and the optical gaps~compare Figs. 3and 6! are the same found in plasma-depositeda-C:H,22,28
leading to the supposed similar relationship between Ramoptical parameters and the microstructures in dip-coatedplasma growna-C:H samples.
Further information from Raman analysis might be otained by theG-peak bandwidthtG .28 The values oftG arelower at the highest annealing temperatures~i.e., tG'130620 cm21 at 500 °C, to be compared withtG'180620cm21 at 300–400 °C!. However, the large uncertainties duto the low Raman signals~consequence of the high film luminescence! do not allow a more-detailed analysis.
Also, the Raman results in dip coated films are constent with those achieved in plasma-grown oxygenateda-C:H.
FIG. 5. Raman spectra of the samples baked at 300 and 500 °C withLorentzian~D peak! and Breit–Wigner–Fano~G peak! decompositions.
Downloaded 20 Jul 2003 to 203.75.105.192. Redistribution subject to A
e
ra-e-
t
-
te
–
to
n/nd
-
-
Reference 14 shows that increasing the relative amouncarbon monoxide in a CO/C2 H2 gas mixture from 37.5% to75%, the I D /I G intensity ratio decreases from higherlower than one, while in our filmsI D /I G , ~and, likely, the Ocontent! decreases at higher temperatures. A differencetween our films and films of Ref. 14 is the different trendthe G-peak frequency versus O content: we find an increing G-peak frequency with temperature, while Ref. 14 foua decreasing one. We notice, however, that also ina-C~:H!the trends of theG-peak frequency versussp3 carbon con-tent may be the opposite when obtained at constant~room!temperature or with sample annealing at different tempetures, due to the appearance, in this case, of hystercycle.28
In summary Raman analysis lead us to conclude tha
~1! The I D /I G ratio suggests a monotonic increase of amatic clustering in the film~with a sharper rate a450 °C! consistently with the increase in concentratiof the sp2 clusters~as suggested by optical analysis! oran increase in thesp2 cluster size.
~2! The similar G-peak positions at 350 °C and above aalso consistent with a similar aromatic cluster type cotrolling the gap states of such samples. The lowestvG
value at 300 °C does not necessarily signify a differecluster type controlling the gap, but@consistently withthe observation of lower G-peak positions in polymelike a-C:H ~Ref. 28!# may signify that the clusters arembedded in a different environment.
eir
FIG. 6. Raman parameters~extracted by Lorentzian and Breit–WignerFano decompositions of the spectra! as a function of the baking temperaturThe trends of theI D /I G ratio ~indicating the concentration of aromatirings! theG-linewidth tG ~related to the amount of disorder in the films! andthe G-positionvG ~reflecting the bonding nature! reflect the film propertiesmodifications.
IP license or copyright, see http://ojps.aip.org/japo/japcr.jsp
araro
ve-tu
tk
alat
xy
h00he0eh
usdsa
ian
tuerts
t
44
wsuch
400
ner-dy-ls
a
s
methfie
by
edpre-
hingfitg
874 J. Appl. Phys., Vol. 94, No. 2, 15 July 2003 Ray et al.
D. Infrared spectra of deposits grown on silicon
Since glass substrates are not transparent in the infrphoton energy range, some attempts in order to prepsamples on silicon 100 substrates were made, in ordeperform FTIR transmission measurements. However, ctinuous films on silicon has not been obtained yet. MoreoRaman spectra on the deposits on Si~1,0,0! present peak features which are less temperature dependent than the feaof Pyrex-deposited films. For instance, theI D /I G ratio ~0.6560.03! and theG-peak position~159463 cm21) are almostindependent of the baking temperature and correspond tovalues obtained for films deposited on Pyrex glass and baat 400–450 °C. Finally, the peak bandwidths are gener30%–50% narrower than in the Pyrex-grown films, indicing more ordered deposits.
The FTIR spectra indicate the presence of hydro~C–OH! and hydrocarbon (CHn) inclusions in the film, asexpected from the composition of the fluid precursors. Toptical oscillator densities in the frequency range 500–4cm21 are reported in Fig. 7, where possible attribution of tpeaks are indicated.29 The two double peaks at 3000–350and 1650–1720 cm21, ~respectively, assigned to in-planstretching and out-of-plane bending modes of adsorbeddroxyl groups! are also commonly observed in poroa-C:H.30,31 Their exact position, however, strongly depenon the host environment. For instance, when the groupscoupled each other by hydrogen bonds~i.e., –OH•••O con-figurations! their frequency position tends to downshift.32
The stretching regions are well fitted with two Gausspeaks centered at 3250 and 3450 cm21 ~Fig. 8, detail!. Theirrelative optical density depends on the baking tempera~Fig. 9! and, at 500 °C, a lower relative intensity of the lowfrequency shoulder~3250 cm21) is observed. These resulare supported by the analysis of the bending modes, asintensity ratio of the two bending peaks at 1650–1720 cm21
scales with the intensity ratio of the two peaks at 3250–3cm21.
FIG. 7. Normalized FTIR spectra and possible attributions of the featurelight of the composition of the carbon precursor~sucrose!. The spectra of thesamples baked from 300 to 450 °C are translated above from 4000 c21
down to 1000 cm21 in order to avoid a loss of clarity in the figure. Thabsolute intensities of the features are not necessarily indicative onabsolute group concentrations as they can be modulated by localcorrections.30,31 More reliable information can be extracted by therelativeintensities of the features.
Downloaded 20 Jul 2003 to 203.75.105.192. Redistribution subject to A
edreton-r,
res
heedly-
l
e0
y-
re
re
he
5
The double sharp peaks at;1040–1080 cm21 can beassigned to C–O stretching vibrations.29 Also, the intensityratio of the two sharp peaks at 1040 and 1080 cm21 reducesas the baking temperature increases, the 1040 cm21 shoulderbecoming almost inappreciable at 500 °C. Figure 7 shothe close correlation existing between the intensities of speaks, the intensity of the double peak at;1650–1720 cm21
and the intensity of the two absorption peaks around 3cm21. Thus, the peaks at;1040–1080 cm21 could be as-signed to the C–O vibrations of the C–OH groups.
The lower intensity of the hydrocarbon (CHn) stretchingmodes@region at 2750–3100 cm21 ~Refs. 9 and 20!# doesnot indicate a low CHn/OH concentration ratio, as the OHgroups have a much higher effective chargee*. Moreover, insolids the absolute intensities of the IR peaks are not geally representative of the group concentrations, as thenamic chargese0* ~as measurable in molecules or radica!are also modified, by the ‘‘local’’ environment33 through lo-cal field correctionsf loc : e* 25 f loc•e0* 2. Nevertheless, theweaker IR spectrum of the 500 °C sample indicates
in
eld
FIG. 8. Normalized FTIR spectra of the hydrocarbon groups obtainedsubtracting the contribution of the hydroxyl groups~determined by a two-Gaussian fit, see the detail!. The quite similar spectra of the samples bakat 450 °C and below should be compared to the spectrum at 500 °C,senting higher intensity at higher frequencies~2950–3000 cm21 and above!attributed to a higher relative concentration ofsp2 hybridized hydrocarbons.
FIG. 9. Ratios between the optical densitiesNopt of hydroxyl and hydrocar-bons groups and between the optical densities of hydroxyl groups stretcat ;3250 and;3450 cm21 deconvoluted by means of a two-Gaussian~see the detail in Fig. 8!. The possible attributions of the two stretchinfrequencies at;3250 and;3450 cm21 are discussed in Sec. III D.
IP license or copyright, see http://ojps.aip.org/japo/japcr.jsp
io
upo
sa°Cn
i-f
du
he
00a
nd
x
inio
ckar
ctpo
n
th
he
ou
h
-
y-
esse
sn
ag-
ysiveof, inerhese
at
gps
en-
ino
875J. Appl. Phys., Vol. 94, No. 2, 15 July 2003 Ray et al.
lower concentration of OH groups.34 Furthermore, assumingCHn and C–OH groups to be placed in the same film reg~i.e., they ‘‘feel’’ the samef loc), the ratio of the two opticaldensities allows us to qualitatively monitor the relative groconcentrations. The relative abundance of the hydrocarbwith respect to the~more volatile! hydroxyl groups increasewith the baking temperature: this does not mean an increof CHn groups in absolute intensity. For instance, at 500the hydrocarbon spectrum undergoes a strong modificatioshape~Fig. 8! and the region above 3000 cm21 is moreimportant. Accordingly to a similar effect occurring at simlar temperatures ina-C:H,20,21 we may suppose that part othesp3 hydrocarbons tend to convert intosp2 hydrocarbons.This effect cannot be related to an increase of local fieldto an increase of the refractive index. In fact, an increasen, «1 and f loc would have produced a simple increase of twhole IR absorption spectrum (CHn , C–OH groups, etc.! bya given proportionality factor, as almost occurring from 3to 450 °C. At 500 °C the sharp drop of the IR spectrum2800–3000 cm21 is then due to a release of both OH aCHn groups, accompanying thesp3 to sp2 conversion of thehydrocarbons. Higher relative amounts ofsp2 hybridized hy-drocarbons at lower Tauc gaps and higher refractive indewere also noticed in Ref. 21.
We notice that the behavior of the hydroxyl groupsour films can be understood in terms of the surface reactof such groups on an amorphous carbon background:16 hy-droxyl groups are stable up to a threshold energy~in agree-ment with their desorption at higher temperatures! and havea sticking coefficient that strongly depends on the baground~in agreement with some differences of the film chacteristics on the substrate type!.
In summary, although they cannot be compared direto films grown on Pyrex at the same temperature, the deits on Si 100 provide the following information:
~1! Samples contain hydroxyl and hydrocarbon inclusio~justifying their labeling asa-C:H:OH!.
~2! A release of hydrocarbon and hydroxyl groups athighest baking temperature~500 °C! occurs. This changecorrelates well with the more Tauc-like character of toptical absorption spectrum at 500 °C~Sec. III B!. Therelease of H and O indeed provides a more continunetwork and a delocalization ofp electrons.
~3! The hydroxyl-related vibrations present two peaks. Thigher frequency group~stretching at;3445 cm21,bending at;1720 cm21) presents a higher relative intensity at higher baking temperatures~Fig. 8!. The twopeaks could arise either from bonding to differently hbridized (Csp3–OH and Csp2–OH) carbon sites or tohydroxyl groups, respectively, uncoupled~C–OH! andcoupled by hydrogen bonds~C–OH•••O! or even toC–~OH!n configurations at differentn values.
E. Electron-spin resonance
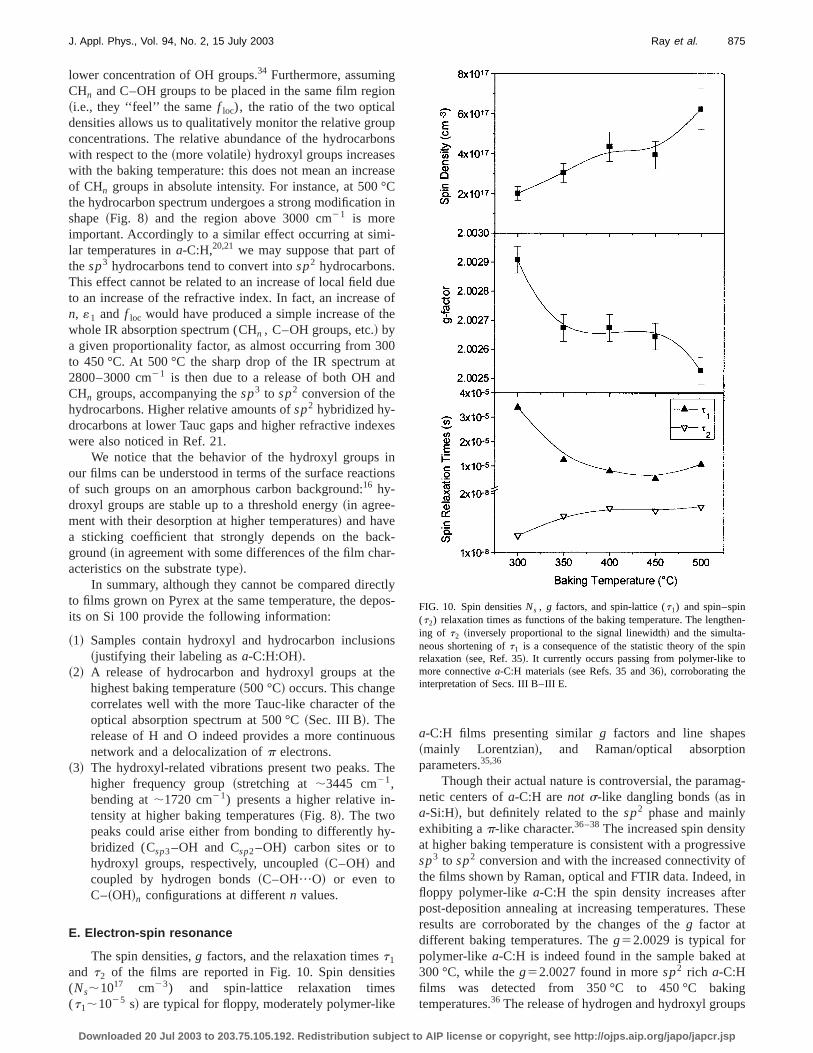
The spin densities,g factors, and the relaxation timest1
and t2 of the films are reported in Fig. 10. Spin densiti(Ns;1017 cm23) and spin-lattice relaxation time(t1;1025 s! are typical for floppy, moderately polymer-lik
Downloaded 20 Jul 2003 to 203.75.105.192. Redistribution subject to A
n
ns
se
in
eof
t
es
ns
--
lys-
s
e
s
e
a-C:H films presenting similarg factors and line shape~mainly Lorentzian!, and Raman/optical absorptioparameters.35,36
Though their actual nature is controversial, the paramnetic centers ofa-C:H arenot s-like dangling bonds~as ina-Si:H!, but definitely related to thesp2 phase and mainlyexhibiting ap-like character.36–38The increased spin densitat higher baking temperature is consistent with a progressp3 to sp2 conversion and with the increased connectivitythe films shown by Raman, optical and FTIR data. Indeedfloppy polymer-likea-C:H the spin density increases aftpost-deposition annealing at increasing temperatures. Tresults are corroborated by the changes of theg factor atdifferent baking temperatures. Theg52.0029 is typical forpolymer-like a-C:H is indeed found in the sample baked300 °C, while theg52.0027 found in moresp2 rich a-C:Hfilms was detected from 350 °C to 450 °C bakintemperatures.36 The release of hydrogen and hydroxyl grou
FIG. 10. Spin densitiesNs , g factors, and spin-lattice (t1) and spin–spin(t2) relaxation times as functions of the baking temperature. The lengthing of t2 ~inversely proportional to the signal linewidth! and the simulta-neous shortening oft1 is a consequence of the statistic theory of the sprelaxation~see, Ref. 35!. It currently occurs passing from polymer-like tmore connectivea-C:H materials~see Refs. 35 and 36!, corroborating theinterpretation of Secs. III B–III E.
IP license or copyright, see http://ojps.aip.org/japo/japcr.jsp
e
of
onele
c
oreey-
hee-
su
axrs
pletn
py,us.act
he O
12,re,
thinby
s
e
he
isar-
ve,,st
,
re
ra
hlyn.
876 J. Appl. Phys., Vol. 94, No. 2, 15 July 2003 Ray et al.
~Sec. III D! from the film baked at 500 °C may explain thfurther decrease ofg, as the obtainedg value ~2.0025! isclose to the value~2.0024! of nonhydrogenatedsp2 a-C.36
A difference between the ESR signals of oura-C:H:OHfilms and the more usual, polymer-like,a-C:H films is in thelinewidth. The latter exhibits room-temperature linewidths10 G or more,35,36 to be compared with the linewidths o3.8–4.0 G of our samples and a higher value~5.1 G! only forthe sample baked at 300 °C. The large linewidthspolymer-likea-C:H films are due to an unresolved hyperfistructure generated by the interaction of the unpaired etrons with ~probably sp2 hybridized! hydrocarbons, asshown by the dramatic narrowing of the linewidth by replaing hydrogen with deuterium.22 However, the FTIR spectraand the composition of the precursors suggest that the flpiness of our samples is more probably related to the pence of C–OH groups than CHn groups. In such a case, thinteraction of the unpaired electron will be mainly with oxgen centers that~being at 99.963%16O nuclei! do not pro-vide hyperfine splitting. Another possible explanation of tnarrower linewidths is the higher delocalization of the ‘‘dfect’’ states with respect to polymer-likea-C:H: the motionaland/or exchange short-range spin–spin interactions aresequently higher, narrowing the lines.37
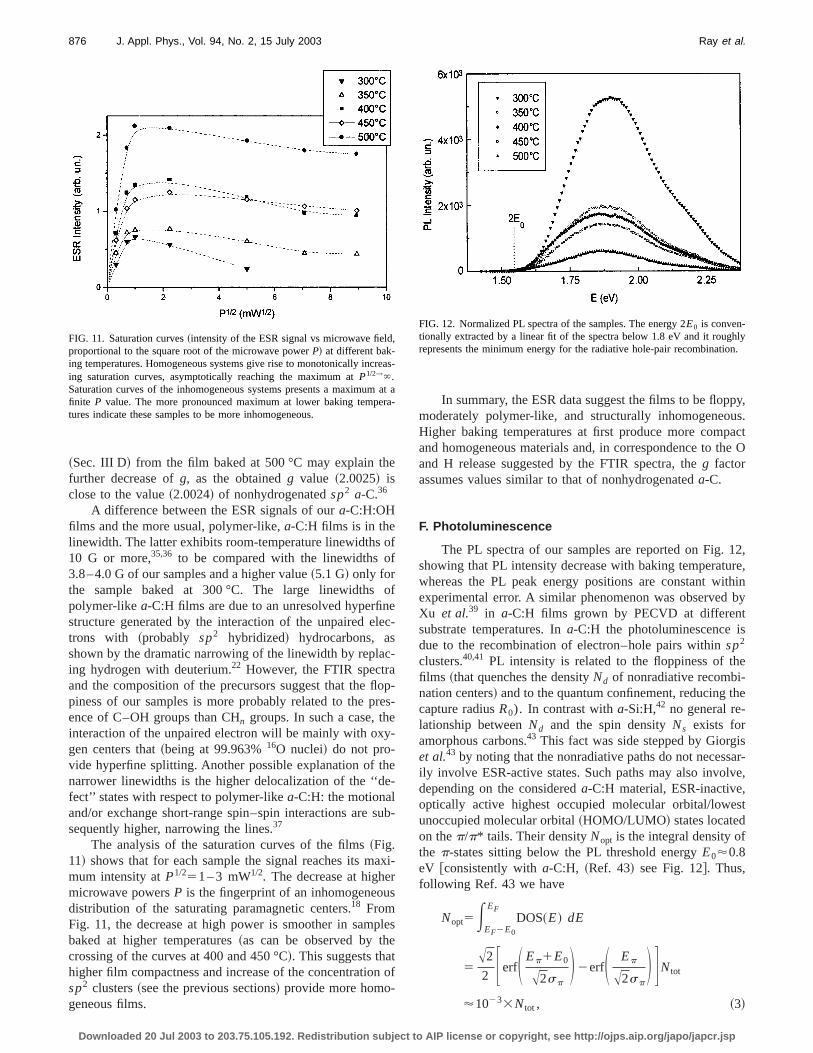
The analysis of the saturation curves of the films~Fig.11! shows that for each sample the signal reaches its mmum intensity atP1/251 – 3 mW1/2. The decrease at highemicrowave powersP is the fingerprint of an inhomogeneoudistribution of the saturating paramagnetic centers.18 FromFig. 11, the decrease at high power is smoother in sambaked at higher temperatures~as can be observed by thcrossing of the curves at 400 and 450 °C!. This suggests thahigher film compactness and increase of the concentratiosp2 clusters~see the previous sections! provide more homo-geneous films.
FIG. 11. Saturation curves~intensity of the ESR signal vs microwave fieldproportional to the square root of the microwave powerP! at different bak-ing temperatures. Homogeneous systems give rise to monotonically incing saturation curves, asymptotically reaching the maximum atP1/2→`.Saturation curves of the inhomogeneous systems presents a maximumfinite P value. The more pronounced maximum at lower baking tempetures indicate these samples to be more inhomogeneous.
Downloaded 20 Jul 2003 to 203.75.105.192. Redistribution subject to A
f
f
c-
-
p-s-
b-
i-
es
of
In summary, the ESR data suggest the films to be flopmoderately polymer-like, and structurally inhomogeneoHigher baking temperatures at first produce more compand homogeneous materials and, in correspondence to tand H release suggested by the FTIR spectra, theg factorassumes values similar to that of nonhydrogenateda-C.
F. Photoluminescence
The PL spectra of our samples are reported on Fig.showing that PL intensity decrease with baking temperatuwhereas the PL peak energy positions are constant wiexperimental error. A similar phenomenon was observedXu et al.39 in a-C:H films grown by PECVD at differentsubstrate temperatures. Ina-C:H the photoluminescence idue to the recombination of electron–hole pairs withinsp2
clusters.40,41 PL intensity is related to the floppiness of thfilms ~that quenches the densityNd of nonradiative recombi-nation centers! and to the quantum confinement, reducing tcapture radiusR0). In contrast witha-Si:H,42 no general re-lationship betweenNd and the spin densityNs exists foramorphous carbons.43 This fact was side stepped by Giorget al.43 by noting that the nonradiative paths do not necessily involve ESR-active states. Such paths may also involdepending on the considereda-C:H material, ESR-inactiveoptically active highest occupied molecular orbital/loweunoccupied molecular orbital~HOMO/LUMO! states locatedon thep/p* tails. Their densityNopt is the integral density ofthe p-states sitting below the PL threshold energyE0'0.8eV @consistently witha-C:H, ~Ref. 43! see Fig. 12#. Thus,following Ref. 43 we have
Nopt5EEF2E0
EFDOS~E! dE
5A2
2 FerfS Ep1E0
A2spD 2erfS Ep
A2spD GNtot
'10233Ntot , ~3!
as-
at a-
FIG. 12. Normalized PL spectra of the samples. The energy 2E0 is conven-tionally extracted by a linear fit of the spectra below 1.8 eV and it rougrepresents the minimum energy for the radiative hole-pair recombinatio
IP license or copyright, see http://ojps.aip.org/japo/japcr.jsp
te
e
aemop
ue
odtinovasth
ndOd
nd
on
. B
um
ric,
J.
pl.
-
on,
er,lat.
C.e, J.
i-
-
-
A.
lids
it.
ing
f
pl.
ds
me
877J. Appl. Phys., Vol. 94, No. 2, 15 July 2003 Ray et al.
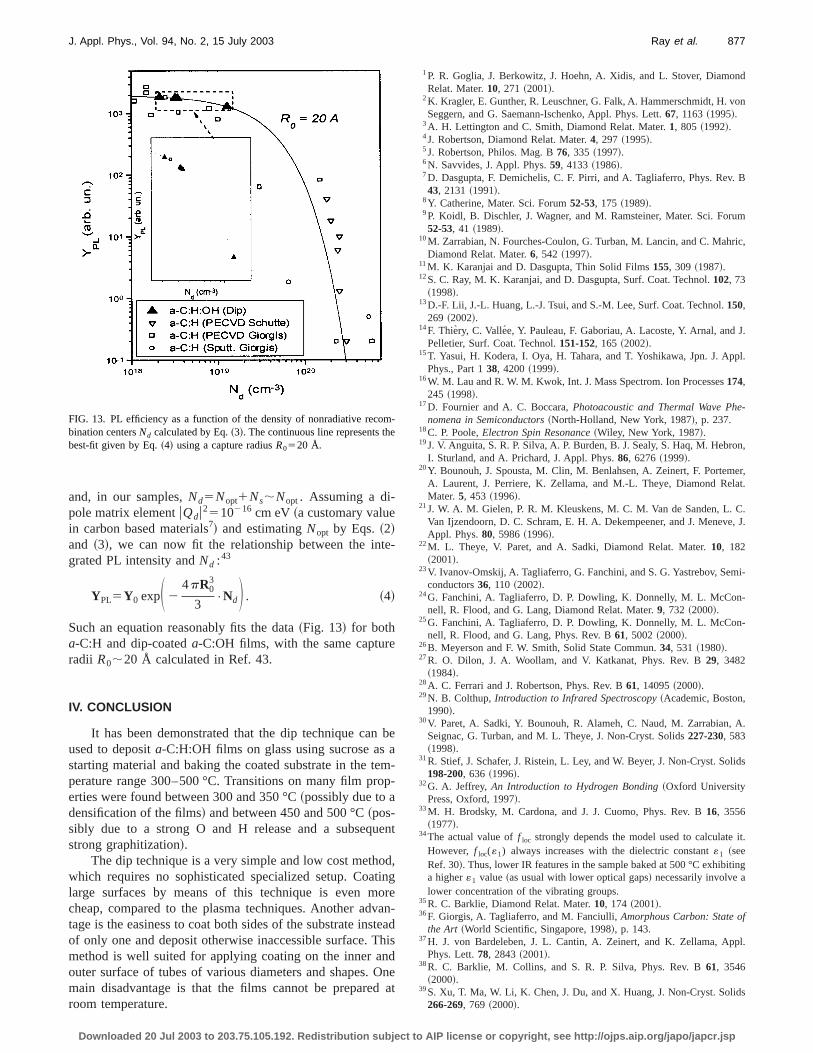
and, in our samples,Nd5Nopt1Ns;Nopt. Assuming a di-pole matrix elementuQdu2510216 cm eV~a customary valuein carbon based materials7! and estimatingNopt by Eqs.~2!and ~3!, we can now fit the relationship between the ingrated PL intensity andNd :43
YPL5Y0 expS 24pR0
3
3•NdD . ~4!
Such an equation reasonably fits the data~Fig. 13! for botha-C:H and dip-coateda-C:OH films, with the same capturradii R0;20 Å calculated in Ref. 43.
IV. CONCLUSION
It has been demonstrated that the dip technique canused to deposita-C:H:OH films on glass using sucrose asstarting material and baking the coated substrate in the tperature range 300–500 °C. Transitions on many film prerties were found between 300 and 350 °C~possibly due to adensification of the films! and between 450 and 500 °C~pos-sibly due to a strong O and H release and a subseqstrong graphitization!.
The dip technique is a very simple and low cost methwhich requires no sophisticated specialized setup. Coalarge surfaces by means of this technique is even mcheap, compared to the plasma techniques. Another adtage is the easiness to coat both sides of the substrate inof only one and deposit otherwise inaccessible surface. Tmethod is well suited for applying coating on the inner aouter surface of tubes of various diameters and shapes.main disadvantage is that the films cannot be prepareroom temperature.
FIG. 13. PL efficiency as a function of the density of nonradiative recobination centersNd calculated by Eq.~3!. The continuous line represents thbest-fit given by Eq.~4! using a capture radiusR0520 Å.
Downloaded 20 Jul 2003 to 203.75.105.192. Redistribution subject to A
-
be
--
nt
,g
ren-
eadis
neat
1P. R. Goglia, J. Berkowitz, J. Hoehn, A. Xidis, and L. Stover, DiamoRelat. Mater.10, 271 ~2001!.
2K. Kragler, E. Gunther, R. Leuschner, G. Falk, A. Hammerschmidt, H. vSeggern, and G. Saemann-Ischenko, Appl. Phys. Lett.67, 1163~1995!.
3A. H. Lettington and C. Smith, Diamond Relat. Mater.1, 805 ~1992!.4J. Robertson, Diamond Relat. Mater.4, 297 ~1995!.5J. Robertson, Philos. Mag. B76, 335 ~1997!.6N. Savvides, J. Appl. Phys.59, 4133~1986!.7D. Dasgupta, F. Demichelis, C. F. Pirri, and A. Tagliaferro, Phys. Rev43, 2131~1991!.
8Y. Catherine, Mater. Sci. Forum52-53, 175 ~1989!.9P. Koidl, B. Dischler, J. Wagner, and M. Ramsteiner, Mater. Sci. For52-53, 41 ~1989!.
10M. Zarrabian, N. Fourches-Coulon, G. Turban, M. Lancin, and C. MahDiamond Relat. Mater.6, 542 ~1997!.
11M. K. Karanjai and D. Dasgupta, Thin Solid Films155, 309 ~1987!.12S. C. Ray, M. K. Karanjai, and D. Dasgupta, Surf. Coat. Technol.102, 73
~1998!.13D.-F. Lii, J.-L. Huang, L.-J. Tsui, and S.-M. Lee, Surf. Coat. Technol.150,
269 ~2002!.14F. Thiery, C. Vallee, Y. Pauleau, F. Gaboriau, A. Lacoste, Y. Arnal, and
Pelletier, Surf. Coat. Technol.151-152, 165 ~2002!.15T. Yasui, H. Kodera, I. Oya, H. Tahara, and T. Yoshikawa, Jpn. J. Ap
Phys., Part 138, 4200~1999!.16W. M. Lau and R. W. M. Kwok, Int. J. Mass Spectrom. Ion Processes174,
245 ~1998!.17D. Fournier and A. C. Boccara,Photoacoustic and Thermal Wave Phe
nomena in Semiconductors~North-Holland, New York, 1987!, p. 237.18C. P. Poole,Electron Spin Resonance~Wiley, New York, 1987!.19J. V. Anguita, S. R. P. Silva, A. P. Burden, B. J. Sealy, S. Haq, M. Hebr
I. Sturland, and A. Prichard, J. Appl. Phys.86, 6276~1999!.20Y. Bounouh, J. Spousta, M. Clin, M. Benlahsen, A. Zeinert, F. Portem
A. Laurent, J. Perriere, K. Zellama, and M.-L. Theye, Diamond ReMater.5, 453 ~1996!.
21J. W. A. M. Gielen, P. R. M. Kleuskens, M. C. M. Van de Sanden, L.Van Ijzendoorn, D. C. Schram, E. H. A. Dekempeener, and J. MenevAppl. Phys.80, 5986~1996!.
22M. L. Theye, V. Paret, and A. Sadki, Diamond Relat. Mater.10, 182~2001!.
23V. Ivanov-Omskij, A. Tagliaferro, G. Fanchini, and S. G. Yastrebov, Semconductors36, 110 ~2002!.
24G. Fanchini, A. Tagliaferro, D. P. Dowling, K. Donnelly, M. L. McConnell, R. Flood, and G. Lang, Diamond Relat. Mater.9, 732 ~2000!.
25G. Fanchini, A. Tagliaferro, D. P. Dowling, K. Donnelly, M. L. McConnell, R. Flood, and G. Lang, Phys. Rev. B61, 5002~2000!.
26B. Meyerson and F. W. Smith, Solid State Commun.34, 531 ~1980!.27R. O. Dilon, J. A. Woollam, and V. Katkanat, Phys. Rev. B29, 3482
~1984!.28A. C. Ferrari and J. Robertson, Phys. Rev. B61, 14095~2000!.29N. B. Colthup,Introduction to Infrared Spectroscopy~Academic, Boston,
1990!.30V. Paret, A. Sadki, Y. Bounouh, R. Alameh, C. Naud, M. Zarrabian,
Seignac, G. Turban, and M. L. Theye, J. Non-Cryst. Solids227-230, 583~1998!.
31R. Stief, J. Schafer, J. Ristein, L. Ley, and W. Beyer, J. Non-Cryst. So198-200, 636 ~1996!.
32G. A. Jeffrey,An Introduction to Hydrogen Bonding~Oxford UniversityPress, Oxford, 1997!.
33M. H. Brodsky, M. Cardona, and J. J. Cuomo, Phys. Rev. B16, 3556~1977!.
34The actual value off loc strongly depends the model used to calculateHowever, f loc(«1) always increases with the dielectric constant«1 ~seeRef. 30!. Thus, lower IR features in the sample baked at 500 °C exhibita higher«1 value~as usual with lower optical gaps! necessarily involve alower concentration of the vibrating groups.
35R. C. Barklie, Diamond Relat. Mater.10, 174 ~2001!.36F. Giorgis, A. Tagliaferro, and M. Fanciulli,Amorphous Carbon: State o
the Art ~World Scientific, Singapore, 1998!, p. 143.37H. J. von Bardeleben, J. L. Cantin, A. Zeinert, and K. Zellama, Ap
Phys. Lett.78, 2843~2001!.38R. C. Barklie, M. Collins, and S. R. P. Silva, Phys. Rev. B61, 3546
~2000!.39S. Xu, T. Ma, W. Li, K. Chen, J. Du, and X. Huang, J. Non-Cryst. Soli
266-269, 769 ~2000!.
-
IP license or copyright, see http://ojps.aip.org/japo/japcr.jsp
wa
ev.
l.
878 J. Appl. Phys., Vol. 94, No. 2, 15 July 2003 Ray et al.
40F. Demichelis, S. Schreiter, and A. Tagliaferro, Phys. Rev. B51, 2143~1995!.
41S. R. P. Silva, J. Robertson, Rusli, G. A. J. Amaratunga, and J. SchPhilos. Mag. B74, 369 ~1996!.
Downloaded 20 Jul 2003 to 203.75.105.192. Redistribution subject to A
n,
42T. Heitz, C. Godet, J. E. Bouree, B. Drevillon, and J. P. Conde, Phys. RB 60, 6045~1999!.
43F. Giorgis, F. Giuliani, C. F. Pirri, A. Tagliaferro, and E. Tresso, AppPhys. Lett.75, 2520~1998!.
IP license or copyright, see http://ojps.aip.org/japo/japcr.jsp