
Investigation on the structure, electrical conductivity and ethanol gas sensitive properties of...
6
44 International Journal of Nanomaterials and Biostructures 2012; 2(3) 44-49 ISSN 2277-3851 Original Article Investigation on the structure, electrical conductivity and ethanol gas sensitive properties of Ce-doped SnO 2 nanoparticles sensors M. E. M. Hassouna 2 , A. M. El-Sayed 1, *, F. M. Ismail 1 , M. H. Khder 2 , A. A. Farghali 2 , and S. M. Yakout 1 1 Inorganic Chemistry Department, National Research Centre, Tahrir Street, Dokki, 12622 Cairo, Egypt 2 Department of Chemistry, Faculty of Science, Beni-Sueif University, Egypt *Correspondence author e-mail address: [email protected] Received 11 July 2012; accepted 28 July 2012 Abstract Nanoparticles tin oxide gas sensors having the chemical formula SnO 2 + x wt% CeO 2 (x = 0, 2, 4 and 6) have been synthesized by chemical precipitation method and sintered at 400, 600 and 800 o C. The composition and the morphology of the prepared samples are investigated and characterized by using XRD, IR, SEM and TEM techniques. XRD and IR results confirmed the formation of SnO 2 tetragonal rutile and CeO 2 cubic structures. The SEM and TEM investigations revealed that the average particle size of SnO 2 increased with increasing the sintering temperature and decreased with CeO 2 additions. The electrical conductivity was found to increase with sintering temperature and CeO 2 additions. The obtained gas sensing properties data explained that the sensor having 2 wt % CeO 2 and sintered at 400◦C has the highest sensitivity, rapid response time and short recovery time to ethanol gas among the prepared sensors. The influence of sintering temperature and CeO 2 content on the structure, electrical conductivity and ethanol gas sensing of SnO 2 sensors is discussed. © 2011 Universal Research Publications. All rights reserved Key words: SnO 2 nanoparticles, Ce-doping, gas sensor, ethanol gas. 1. Introduction In recent years, the nano-structured semiconductor metal oxides have been widely studied as possible candidates for using in the gas sensors applications [1]. Ethanol vapour is one of the most popular gases in industry and our daily life [2]. The detection and quantification of ethanol gas concentrations have wide applications in different fields such as monitoring of fermentation, medical processes, food industries, foodstuffs conservering and breathe analyzer of drivers to reduce the number of roads accidents caused by excessive alcohol consumption [3-6]. Nanostructured tin oxide (SnO 2 ) has been studied for gas- sensing applications and is deemed to be one of the most promising materials to generate high-performance gas- sensing devices for ethanol gas detection [7]. The advantages of the SnO 2 sensor are the high sensitivity, low weight and cost. The working principle of the semiconductor tin oxide sensors for ethanol gas detection is based on the changes in the electrical resistance produced by the interaction of the ethanol gas with the chemisorbed oxygen species (O − or O 2− ) on the surface of the sensor [4, 6]. The reaction of ethanol gas with the pre-adsorbed surface oxygen species is accompanied with the liberation of electrons to the conduction band of the tin oxide material which leads to the change in the electrical resistance. The gas sensing properties of the tin oxide can be improved by decreasing its particles size and consequently increasing the surface area which provides more surface active sites for adsorption and interaction of gases [8]. The modification of surface and bulk properties of tin oxide through doping is an effective way to improve its gas sensing properties. Many researches have attempted to enhance the gas sensing properties of tin oxide towards ethanol gas through using some additives such as Pt, Pd, Au, TiO 2 , CdO, Fe 2 O 3 and La 2 O 3 [9-15]. Rare earth oxides additions are well known to display a high surface basicity, fast oxygen ion mobility and interesting catalytic properties which are very important in gas sensing [16]. The present study aims to prepare SnO 2 nanoparticles and study the effect of sintering temperature and CeO 2 doping concentrations on the structural, electrical conductivity and gas sensing properties of the prepared SnO 2 nanoparticles toward ethanol gas. 2. Experimental Tin oxide nanoparticles were prepared by chemical precipitation method using tin tetrachloride (99.7 %) and diluted NH 4 OH as starting materials. An aqueous solution of tin tetrachloride 0.2 mol/L was prepared in distilled water. Diluted NH 4 OH solution was added dropwise to the Available online at http://www.urpjournals.com International Journal of Nanomaterials and Biostructures Universal Research Publications. All rights reserved
Transcript of Investigation on the structure, electrical conductivity and ethanol gas sensitive properties of...
44 International Journal of Nanomaterials and Biostructures 2012; 2(3) 44-49
ISSN 2277-3851
Original Article
Investigation on the structure, electrical conductivity and ethanol gas sensitive
properties of Ce-doped SnO2 nanoparticles sensors
M. E. M. Hassouna 2, A. M. El-Sayed
1, *, F. M. Ismail
1, M. H. Khder
2, A. A. Farghali
2, and S. M. Yakout
1
1 Inorganic Chemistry Department, National Research Centre, Tahrir Street, Dokki, 12622 Cairo, Egypt 2 Department of Chemistry, Faculty of Science, Beni-Sueif University, Egypt
*Correspondence author e-mail address: [email protected]
Received 11 July 2012; accepted 28 July 2012
Abstract Nanoparticles tin oxide gas sensors having the chemical formula SnO2 + x wt% CeO2 (x = 0, 2, 4 and 6) have been
synthesized by chemical precipitation method and sintered at 400, 600 and 800 oC. The composition and the morphology
of the prepared samples are investigated and characterized by using XRD, IR, SEM and TEM techniques. XRD and IR
results confirmed the formation of SnO2 tetragonal rutile and CeO2 cubic structures. The SEM and TEM investigations revealed that the average particle size of SnO2 increased with increasing the sintering temperature and decreased with CeO2
additions. The electrical conductivity was found to increase with sintering temperature and CeO2 additions. The obtained
gas sensing properties data explained that the sensor having 2 wt % CeO2 and sintered at 400◦C has the highest sensitivity,
rapid response time and short recovery time to ethanol gas among the prepared sensors. The influence of sintering
temperature and CeO2 content on the structure, electrical conductivity and ethanol gas sensing of SnO2 sensors is
discussed.
© 2011 Universal Research Publications. All rights reserved
Key words: SnO2 nanoparticles, Ce-doping, gas sensor, ethanol gas.
1. Introduction In recent years, the nano-structured semiconductor metal
oxides have been widely studied as possible candidates for
using in the gas sensors applications [1]. Ethanol vapour is
one of the most popular gases in industry and our daily life
[2]. The detection and quantification of ethanol gas
concentrations have wide applications in different fields
such as monitoring of fermentation, medical processes,
food industries, foodstuffs conservering and breathe analyzer of drivers to reduce the number of roads accidents
caused by excessive alcohol consumption [3-6].
Nanostructured tin oxide (SnO2) has been studied for gas-
sensing applications and is deemed to be one of the most
promising materials to generate high-performance gas-
sensing devices for ethanol gas detection [7]. The
advantages of the SnO2 sensor are the high sensitivity, low
weight and cost. The working principle of the
semiconductor tin oxide sensors for ethanol gas detection is
based on the changes in the electrical resistance produced
by the interaction of the ethanol gas with the chemisorbed
oxygen species (O− or O2−) on the surface of the sensor [4, 6]. The reaction of ethanol gas with the pre-adsorbed
surface oxygen species is accompanied with the liberation
of electrons to the conduction band of the tin oxide material
which leads to the change in the electrical resistance. The
gas sensing properties of the tin oxide can be improved by
decreasing its particles size and consequently increasing the
surface area which provides more surface active sites for
adsorption and interaction of gases [8]. The modification of
surface and bulk properties of tin oxide through doping is
an effective way to improve its gas sensing properties.
Many researches have attempted to enhance the gas sensing
properties of tin oxide towards ethanol gas through using some additives such as Pt, Pd, Au, TiO2, CdO, Fe2O3 and
La2O3 [9-15]. Rare earth oxides additions are well known
to display a high surface basicity, fast oxygen ion mobility
and interesting catalytic properties which are very
important in gas sensing [16]. The present study aims to
prepare SnO2 nanoparticles and study the effect of sintering
temperature and CeO2 doping concentrations on the
structural, electrical conductivity and gas sensing properties
of the prepared SnO2 nanoparticles toward ethanol gas.
2. Experimental
Tin oxide nanoparticles were prepared by chemical
precipitation method using tin tetrachloride (99.7 %) and diluted NH4OH as starting materials. An aqueous solution
of tin tetrachloride 0.2 mol/L was prepared in distilled
water. Diluted NH4OH solution was added dropwise to the
Available online at http://www.urpjournals.com
International Journal of Nanomaterials and Biostructures
Universal Research Publications. All rights reserved
45 International Journal of Nanomaterials and Biostructures 2012; 2(3) 44-49
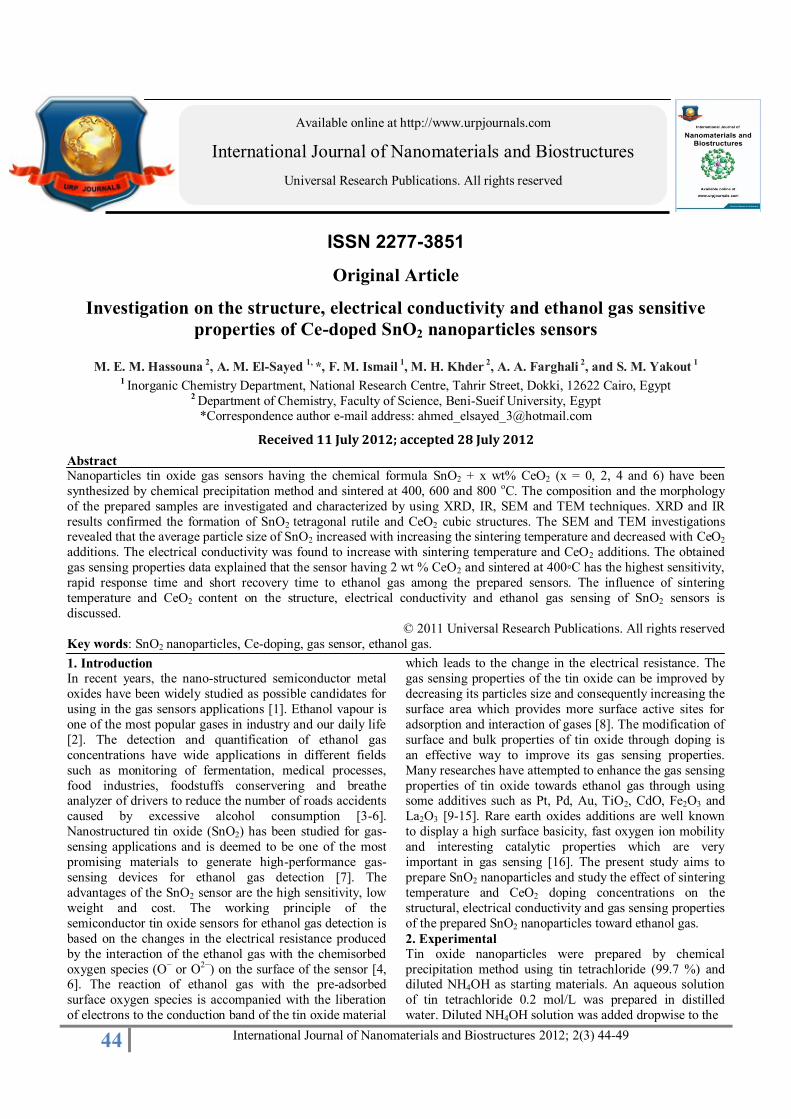
Fig. 1: X-ray diffraction patterns of the prepared SnO2 + x
wt% CeO2 samples sintered at (a): 400 oC and (b): 800 oC.
prepared tin tetrachloride solution with continuous stirring
until the pH reached 9, whereupon white gelable precipitate
of Sn(OH)4 was obtained. The precipitate was filtered and
washed thoroughly until free of chloride by testing the
filtrate with silver nitrate solution. The obtained precipitate
was dried in air and ground to a fine powder followed by
calcination at 400 oC for 4 hours then left to cool in
atmospheric air to room temperature. Proper amounts of
CeO2 were added to the prepared SnO2 powders with ratio
of 0, 2, 4 and 6 wt % and then ground in an agate mortar to
get homogeneous and good mixing mixtures. The resulting mixtures were used as a functional material to fabricate
sensor pellets of 12 mm in diameter and 2 mm thick,
followed by sintering at 400, 600 and 800 oC for 2 hours.
The prepared samples were investigated using X-ray
powder diffraction (XRD) by X-ray diffractometer (model-
Bruker AXS D8 advance) with copper radiation, infrared
spectra (IR) by Nexus 670 FTIR spectrophotometer
(Nicolet, USA). Scanning electron microscope (SEM) by
SEM JEOL models, JXA-480A Electron Probe Micro
analyzer. Transmission electron microscope (TEM) by
JEOL JEM-1230 operating at 120 KV attached to CCD camera. a. c. electrical conductivity as well as ethanol gas
sensing properties of the different sensor samples were
measured in the temperature range from 30 up to 410 oC
using LCR meter (Hitester, model Hioki 3532, made in
Japan) at frequency of 1 KHz and applied 5 V. The sample
chamber is a closed glass cell contains the sensor sample
surrounded by electrical cylindrical ceramic furnace with
controlled temperature device. The desired ethanol gas
concentrations were obtained by injection a known volume
of ethanol vapor using a micro-syringe through air tight
rubber port into the glass chamber. The sensitivity (S) of
the sensor samples were measured and calculated as the ratio of the electrical resistance in air atmosphere (Rair) to
that in air containing ethanol gas (Rgas) in the temperature
range from 30 up to 410 oC by using the following relation
[13]:
S = Rair / Rgas (1)
3. Results and discussion
3.1. Characterization
The X-ray diffraction investigation carried out on the
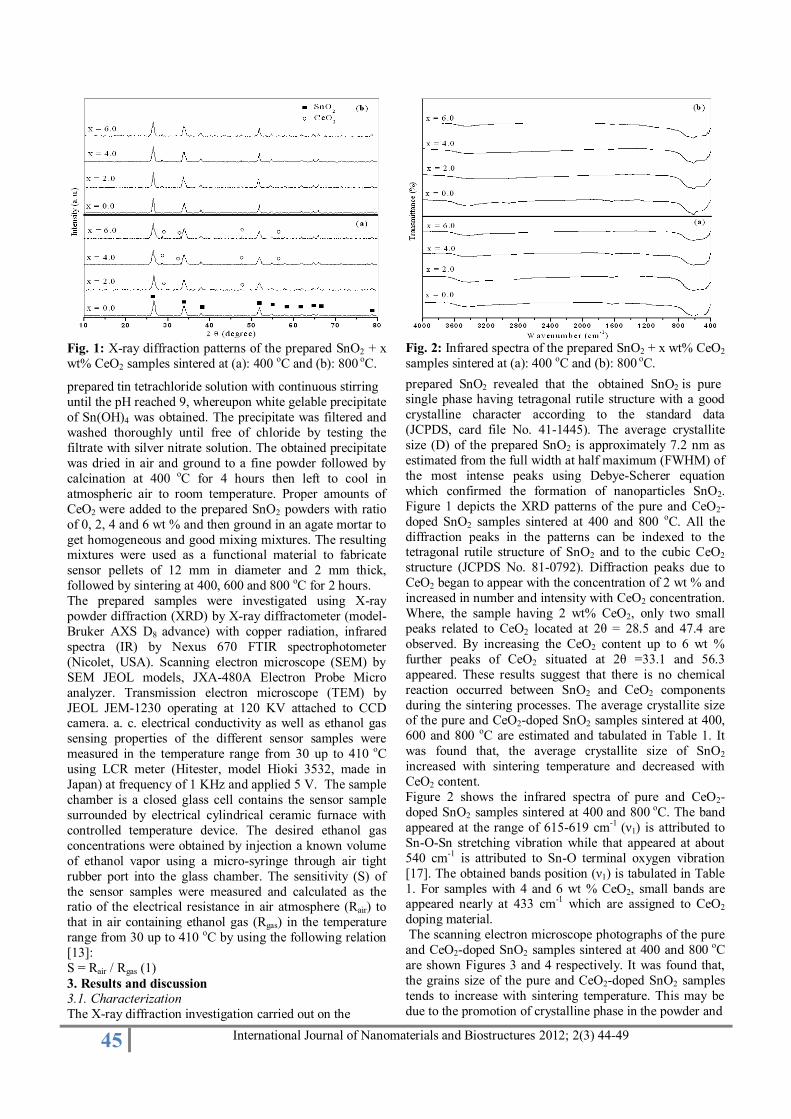
Fig. 2: Infrared spectra of the prepared SnO2 + x wt% CeO2
samples sintered at (a): 400 oC and (b): 800 oC.
prepared SnO2 revealed that the obtained SnO2 is pure single phase having tetragonal rutile structure with a good
crystalline character according to the standard data
(JCPDS, card file No. 41-1445). The average crystallite
size (D) of the prepared SnO2 is approximately 7.2 nm as
estimated from the full width at half maximum (FWHM) of
the most intense peaks using Debye-Scherer equation
which confirmed the formation of nanoparticles SnO2.
Figure 1 depicts the XRD patterns of the pure and CeO2-
doped SnO2 samples sintered at 400 and 800 oC. All the
diffraction peaks in the patterns can be indexed to the tetragonal rutile structure of SnO2 and to the cubic CeO2
structure (JCPDS No. 81-0792). Diffraction peaks due to
CeO2 began to appear with the concentration of 2 wt % and
increased in number and intensity with CeO2 concentration.
Where, the sample having 2 wt% CeO2, only two small
peaks related to CeO2 located at 2θ = 28.5 and 47.4 are
observed. By increasing the CeO2 content up to 6 wt %
further peaks of CeO2 situated at 2θ =33.1 and 56.3
appeared. These results suggest that there is no chemical
reaction occurred between SnO2 and CeO2 components
during the sintering processes. The average crystallite size of the pure and CeO2-doped SnO2 samples sintered at 400,
600 and 800 oC are estimated and tabulated in Table 1. It
was found that, the average crystallite size of SnO2
increased with sintering temperature and decreased with
CeO2 content.
Figure 2 shows the infrared spectra of pure and CeO2-
doped SnO2 samples sintered at 400 and 800 oC. The band
appeared at the range of 615-619 cm-1 (ν1) is attributed to
Sn-O-Sn stretching vibration while that appeared at about
540 cm-1 is attributed to Sn-O terminal oxygen vibration
[17]. The obtained bands position (ν1) is tabulated in Table
1. For samples with 4 and 6 wt % CeO2, small bands are appeared nearly at 433 cm-1 which are assigned to CeO2
doping material.
The scanning electron microscope photographs of the pure
and CeO2-doped SnO2 samples sintered at 400 and 800 oC
are shown Figures 3 and 4 respectively. It was found that,
the grains size of the pure and CeO2-doped SnO2 samples
tends to increase with sintering temperature. This may be
due to the promotion of crystalline phase in the powder and
46 International Journal of Nanomaterials and Biostructures 2012; 2(3) 44-49
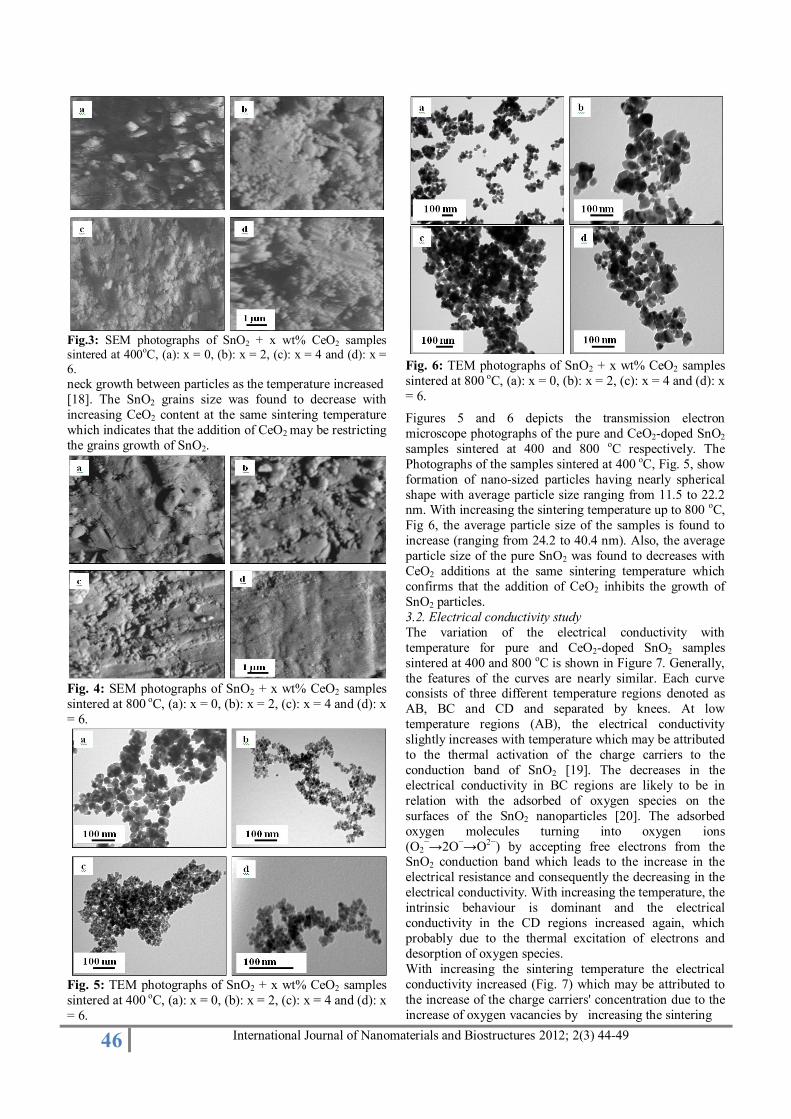
Fig.3: SEM photographs of SnO2 + x wt% CeO2 samples sintered at 400
oC, (a): x = 0, (b): x = 2, (c): x = 4 and (d): x =
6.
neck growth between particles as the temperature increased
[18]. The SnO2 grains size was found to decrease with
increasing CeO2 content at the same sintering temperature
which indicates that the addition of CeO2 may be restricting
the grains growth of SnO2.
Fig. 4: SEM photographs of SnO2 + x wt% CeO2 samples
sintered at 800 oC, (a): x = 0, (b): x = 2, (c): x = 4 and (d): x
= 6.
Fig. 5: TEM photographs of SnO2 + x wt% CeO2 samples
sintered at 400 oC, (a): x = 0, (b): x = 2, (c): x = 4 and (d): x
= 6.
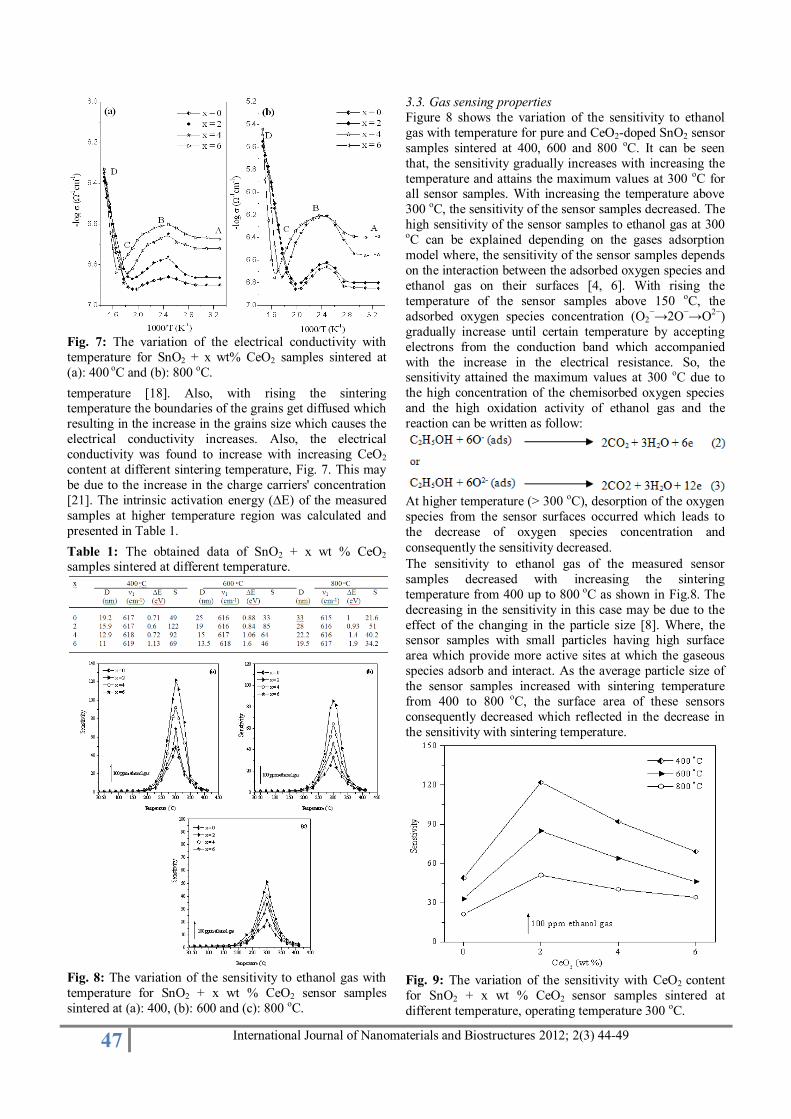
Fig. 6: TEM photographs of SnO2 + x wt% CeO2 samples
sintered at 800 oC, (a): x = 0, (b): x = 2, (c): x = 4 and (d): x
= 6.
Figures 5 and 6 depicts the transmission electron
microscope photographs of the pure and CeO2-doped SnO2
samples sintered at 400 and 800 oC respectively. The
Photographs of the samples sintered at 400 oC, Fig. 5, show
formation of nano-sized particles having nearly spherical
shape with average particle size ranging from 11.5 to 22.2 nm. With increasing the sintering temperature up to 800 oC,
Fig 6, the average particle size of the samples is found to
increase (ranging from 24.2 to 40.4 nm). Also, the average
particle size of the pure SnO2 was found to decreases with
CeO2 additions at the same sintering temperature which
confirms that the addition of CeO2 inhibits the growth of
SnO2 particles.
3.2. Electrical conductivity study
The variation of the electrical conductivity with
temperature for pure and CeO2-doped SnO2 samples
sintered at 400 and 800 oC is shown in Figure 7. Generally,
the features of the curves are nearly similar. Each curve consists of three different temperature regions denoted as
AB, BC and CD and separated by knees. At low
temperature regions (AB), the electrical conductivity
slightly increases with temperature which may be attributed
to the thermal activation of the charge carriers to the
conduction band of SnO2 [19]. The decreases in the
electrical conductivity in BC regions are likely to be in
relation with the adsorbed of oxygen species on the
surfaces of the SnO2 nanoparticles [20]. The adsorbed
oxygen molecules turning into oxygen ions
(O2−→2O−→O2−) by accepting free electrons from the
SnO2 conduction band which leads to the increase in the
electrical resistance and consequently the decreasing in the
electrical conductivity. With increasing the temperature, the
intrinsic behaviour is dominant and the electrical
conductivity in the CD regions increased again, which
probably due to the thermal excitation of electrons and
desorption of oxygen species.
With increasing the sintering temperature the electrical
conductivity increased (Fig. 7) which may be attributed to
the increase of the charge carriers' concentration due to the
increase of oxygen vacancies by increasing the sintering
47 International Journal of Nanomaterials and Biostructures 2012; 2(3) 44-49
Fig. 7: The variation of the electrical conductivity with
temperature for SnO2 + x wt% CeO2 samples sintered at
(a): 400 oC and (b): 800 oC.
temperature [18]. Also, with rising the sintering temperature the boundaries of the grains get diffused which
resulting in the increase in the grains size which causes the
electrical conductivity increases. Also, the electrical
conductivity was found to increase with increasing CeO2
content at different sintering temperature, Fig. 7. This may
be due to the increase in the charge carriers' concentration
[21]. The intrinsic activation energy (∆E) of the measured
samples at higher temperature region was calculated and
presented in Table 1.
Table 1: The obtained data of SnO2 + x wt % CeO2 samples sintered at different temperature.
Fig. 8: The variation of the sensitivity to ethanol gas with
temperature for SnO2 + x wt % CeO2 sensor samples
sintered at (a): 400, (b): 600 and (c): 800 oC.
3.3. Gas sensing properties
Figure 8 shows the variation of the sensitivity to ethanol
gas with temperature for pure and CeO2-doped SnO2 sensor
samples sintered at 400, 600 and 800 oC. It can be seen
that, the sensitivity gradually increases with increasing the
temperature and attains the maximum values at 300 oC for all sensor samples. With increasing the temperature above
300 oC, the sensitivity of the sensor samples decreased. The
high sensitivity of the sensor samples to ethanol gas at 300 oC can be explained depending on the gases adsorption
model where, the sensitivity of the sensor samples depends
on the interaction between the adsorbed oxygen species and
ethanol gas on their surfaces [4, 6]. With rising the
temperature of the sensor samples above 150 oC, the
adsorbed oxygen species concentration (O2−→2O−→O2−)
gradually increase until certain temperature by accepting
electrons from the conduction band which accompanied
with the increase in the electrical resistance. So, the sensitivity attained the maximum values at 300 oC due to
the high concentration of the chemisorbed oxygen species
and the high oxidation activity of ethanol gas and the
reaction can be written as follow:
At higher temperature (> 300 oC), desorption of the oxygen
species from the sensor surfaces occurred which leads to
the decrease of oxygen species concentration and
consequently the sensitivity decreased.
The sensitivity to ethanol gas of the measured sensor
samples decreased with increasing the sintering
temperature from 400 up to 800 oC as shown in Fig.8. The
decreasing in the sensitivity in this case may be due to the
effect of the changing in the particle size [8]. Where, the sensor samples with small particles having high surface
area which provide more active sites at which the gaseous
species adsorb and interact. As the average particle size of
the sensor samples increased with sintering temperature
from 400 to 800 oC, the surface area of these sensors
consequently decreased which reflected in the decrease in
the sensitivity with sintering temperature.
Fig. 9: The variation of the sensitivity with CeO2 content
for SnO2 + x wt % CeO2 sensor samples sintered at
different temperature, operating temperature 300 oC.
48 International Journal of Nanomaterials and Biostructures 2012; 2(3) 44-49
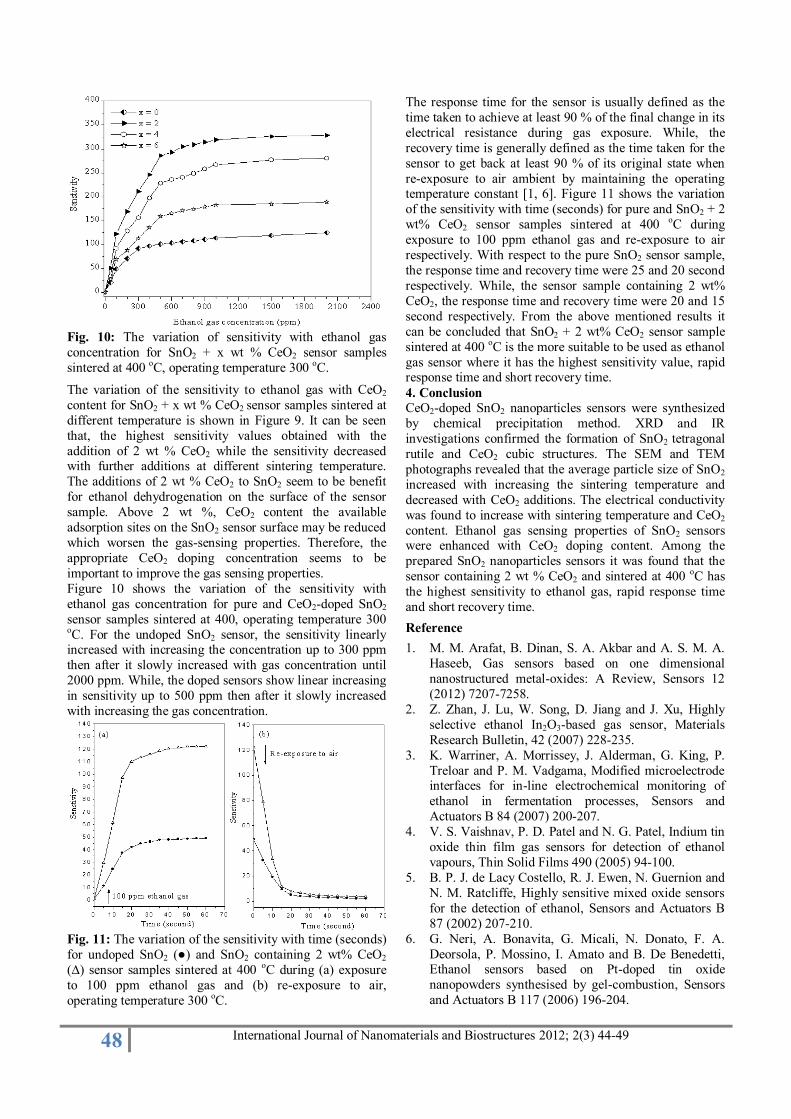
Fig. 10: The variation of sensitivity with ethanol gas
concentration for SnO2 + x wt % CeO2 sensor samples
sintered at 400 oC, operating temperature 300 oC.
The variation of the sensitivity to ethanol gas with CeO2
content for SnO2 + x wt % CeO2 sensor samples sintered at
different temperature is shown in Figure 9. It can be seen
that, the highest sensitivity values obtained with the
addition of 2 wt % CeO2 while the sensitivity decreased with further additions at different sintering temperature.
The additions of 2 wt % CeO2 to SnO2 seem to be benefit
for ethanol dehydrogenation on the surface of the sensor
sample. Above 2 wt %, CeO2 content the available
adsorption sites on the SnO2 sensor surface may be reduced
which worsen the gas-sensing properties. Therefore, the
appropriate CeO2 doping concentration seems to be
important to improve the gas sensing properties.
Figure 10 shows the variation of the sensitivity with
ethanol gas concentration for pure and CeO2-doped SnO2
sensor samples sintered at 400, operating temperature 300 oC. For the undoped SnO2 sensor, the sensitivity linearly increased with increasing the concentration up to 300 ppm
then after it slowly increased with gas concentration until
2000 ppm. While, the doped sensors show linear increasing
in sensitivity up to 500 ppm then after it slowly increased
with increasing the gas concentration.
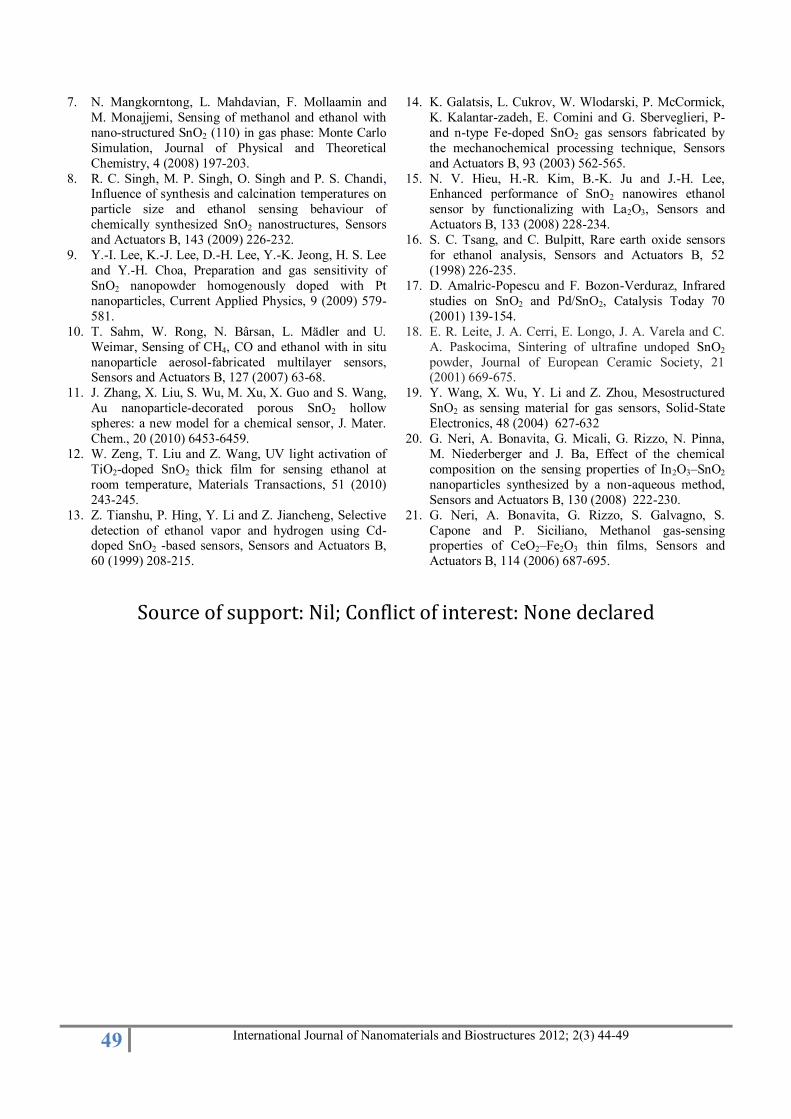
Fig. 11: The variation of the sensitivity with time (seconds)
for undoped SnO2 (●) and SnO2 containing 2 wt% CeO2
(∆) sensor samples sintered at 400 oC during (a) exposure
to 100 ppm ethanol gas and (b) re-exposure to air,
operating temperature 300 oC.
The response time for the sensor is usually defined as the
time taken to achieve at least 90 % of the final change in its
electrical resistance during gas exposure. While, the
recovery time is generally defined as the time taken for the
sensor to get back at least 90 % of its original state when
re-exposure to air ambient by maintaining the operating temperature constant [1, 6]. Figure 11 shows the variation
of the sensitivity with time (seconds) for pure and SnO2 + 2
wt% CeO2 sensor samples sintered at 400 oC during
exposure to 100 ppm ethanol gas and re-exposure to air
respectively. With respect to the pure SnO2 sensor sample,
the response time and recovery time were 25 and 20 second
respectively. While, the sensor sample containing 2 wt%
CeO2, the response time and recovery time were 20 and 15
second respectively. From the above mentioned results it
can be concluded that SnO2 + 2 wt% CeO2 sensor sample
sintered at 400 oC is the more suitable to be used as ethanol
gas sensor where it has the highest sensitivity value, rapid response time and short recovery time.
4. Conclusion CeO2-doped SnO2 nanoparticles sensors were synthesized
by chemical precipitation method. XRD and IR
investigations confirmed the formation of SnO2 tetragonal
rutile and CeO2 cubic structures. The SEM and TEM
photographs revealed that the average particle size of SnO2
increased with increasing the sintering temperature and
decreased with CeO2 additions. The electrical conductivity
was found to increase with sintering temperature and CeO2
content. Ethanol gas sensing properties of SnO2 sensors were enhanced with CeO2 doping content. Among the
prepared SnO2 nanoparticles sensors it was found that the
sensor containing 2 wt % CeO2 and sintered at 400 oC has
the highest sensitivity to ethanol gas, rapid response time
and short recovery time.
Reference
1. M. M. Arafat, B. Dinan, S. A. Akbar and A. S. M. A.
Haseeb, Gas sensors based on one dimensional
nanostructured metal-oxides: A Review, Sensors 12
(2012) 7207-7258.
2. Z. Zhan, J. Lu, W. Song, D. Jiang and J. Xu, Highly
selective ethanol In2O3-based gas sensor, Materials
Research Bulletin, 42 (2007) 228-235.
3. K. Warriner, A. Morrissey, J. Alderman, G. King, P.
Treloar and P. M. Vadgama, Modified microelectrode interfaces for in-line electrochemical monitoring of
ethanol in fermentation processes, Sensors and
Actuators B 84 (2007) 200-207.
4. V. S. Vaishnav, P. D. Patel and N. G. Patel, Indium tin
oxide thin film gas sensors for detection of ethanol
vapours, Thin Solid Films 490 (2005) 94-100.
5. B. P. J. de Lacy Costello, R. J. Ewen, N. Guernion and
N. M. Ratcliffe, Highly sensitive mixed oxide sensors
for the detection of ethanol, Sensors and Actuators B
87 (2002) 207-210.
6. G. Neri, A. Bonavita, G. Micali, N. Donato, F. A.
Deorsola, P. Mossino, I. Amato and B. De Benedetti, Ethanol sensors based on Pt-doped tin oxide
nanopowders synthesised by gel-combustion, Sensors
and Actuators B 117 (2006) 196-204.
49 International Journal of Nanomaterials and Biostructures 2012; 2(3) 44-49
7. N. Mangkorntong, L. Mahdavian, F. Mollaamin
and
M. Monajjemi, Sensing of methanol and ethanol with
nano-structured SnO2 (110) in gas phase: Monte Carlo
Simulation, Journal of Physical and Theoretical
Chemistry, 4 (2008) 197-203.
8. R. C. Singh, M. P. Singh, O. Singh and P. S. Chandi, Influence of synthesis and calcination temperatures on
particle size and ethanol sensing behaviour of
chemically synthesized SnO2 nanostructures, Sensors
and Actuators B, 143 (2009) 226-232.
9. Y.-I. Lee, K.-J. Lee, D.-H. Lee, Y.-K. Jeong, H. S. Lee
and Y.-H. Choa, Preparation and gas sensitivity of
SnO2 nanopowder homogenously doped with Pt
nanoparticles, Current Applied Physics, 9 (2009) 579-
581.
10. T. Sahm, W. Rong, N. Bârsan, L. Mädler and U.
Weimar, Sensing of CH4, CO and ethanol with in situ
nanoparticle aerosol-fabricated multilayer sensors, Sensors and Actuators B, 127 (2007) 63-68.
11. J. Zhang, X. Liu, S. Wu, M. Xu, X. Guo and S. Wang,
Au nanoparticle-decorated porous SnO2 hollow
spheres: a new model for a chemical sensor, J. Mater.
Chem., 20 (2010) 6453-6459.
12. W. Zeng, T. Liu and Z. Wang, UV light activation of
TiO2-doped SnO2 thick film for sensing ethanol at
room temperature, Materials Transactions, 51 (2010)
243-245.
13. Z. Tianshu, P. Hing, Y. Li and Z. Jiancheng, Selective
detection of ethanol vapor and hydrogen using Cd-doped SnO2 -based sensors, Sensors and Actuators B,
60 (1999) 208-215.
14. K. Galatsis, L. Cukrov, W. Wlodarski, P. McCormick,
K. Kalantar-zadeh, E. Comini and G. Sberveglieri, P-
and n-type Fe-doped SnO2 gas sensors fabricated by
the mechanochemical processing technique, Sensors
and Actuators B, 93 (2003) 562-565.
15. N. V. Hieu, H.-R. Kim, B.-K. Ju and J.-H. Lee, Enhanced performance of SnO2 nanowires ethanol
sensor by functionalizing with La2O3, Sensors and
Actuators B, 133 (2008) 228-234.
16. S. C. Tsang, and C. Bulpitt, Rare earth oxide sensors
for ethanol analysis, Sensors and Actuators B, 52
(1998) 226-235.
17. D. Amalric-Popescu and F. Bozon-Verduraz, Infrared
studies on SnO2 and Pd/SnO2, Catalysis Today 70
(2001) 139-154.
18. E. R. Leite, J. A. Cerri, E. Longo, J. A. Varela and C.
A. Paskocima, Sintering of ultrafine undoped SnO2
powder, Journal of European Ceramic Society, 21 (2001) 669-675.
19. Y. Wang, X. Wu, Y. Li and Z. Zhou, Mesostructured
SnO2 as sensing material for gas sensors, Solid-State
Electronics, 48 (2004) 627-632
20. G. Neri, A. Bonavita, G. Micali, G. Rizzo, N. Pinna,
M. Niederberger and J. Ba, Effect of the chemical
composition on the sensing properties of In2O3–SnO2
nanoparticles synthesized by a non-aqueous method,
Sensors and Actuators B, 130 (2008) 222-230.
21. G. Neri, A. Bonavita, G. Rizzo, S. Galvagno, S.
Capone and P. Siciliano, Methanol gas-sensing properties of CeO2–Fe2O3 thin films, Sensors and
Actuators B, 114 (2006) 687-695.
Source of support: Nil; Conflict of interest: None declared